fdic survey of banks’ efforts to serve the unbanked and ... and underbanked households. the fdic...
TRANSCRIPT

2011 FDIC National Survey of Unbanked and Underbanked Households
September 2012
Federal Deposit Insurance Corporation
2011 FDIC NatIoNal Survey oF uNbaNkeD aND uNDerbaNkeD HouSeHolDS • September 2012 2
Members of the FDIC Unbanked/Underbanked Survey Study GroupDivision of Depositor and Consumer Protection: Susan Burhouse, Sarah Campbell, Timothy Critchfield, Keith Ernst,
Ryan Goodstein, Yazmin Osaki, Luke Reynolds, and Sherrie RhineDivision of Insurance and Research: David Chapman, Eric Robbins, and Katherine SamolykLegal Division: Leneta Gregorie
Lead AuthorsSusan Burhouse and Yazmin Osaki
Lead Statistical Analysts and AdvisorsSarah Campbell, David Chapman, and Ryan Goodstein
Contributors: Michael Bachman, Karyen Chu, Peggi Gill, Anirudh Sarna, Francis Solomon, David Spanburg, Masseh Tahiry, and
Kathy Zeidler
2011 FDIC NatIoNal Survey oF uNbaNkeD aND uNDerbaNkeD HouSeHolDS • September 2012 3
Table of ContentsI. Executive Summary .............................................................................................................................................. 4
II. Background and Objectives .................................................................................................................................. 8A. Background .................................................................................................................................................. 8B. What’s New in the 2011 Survey ...................................................................................................................... 9
III. Banking Status of US Households ........................................................................................................................ 10A. Top Level Results ...........................................................................................................................................10B. Unbanked and Underbanked Rates by Region and State ................................................................................. 11
IV. Banking Status and Account Type Ownership by Demographic Groups ................................................................ 14A. Which Groups Have Higher Proportions of Unbanked Households? ..................................................................14B. Which Groups Have Higher Proportions of Underbanked Households? .............................................................17C. Bank Account Type by Demographic Group ....................................................................................................19
V. Who Are the Unbanked, Underbanked, and Fully Banked? ................................................................................... 21A. Demographic Composition of Households by Banking Status ............................................................................21B. Unbanked Households’ Banking History and Reasons For Not Having a Bank Account ......................................25
VI. Household Use of Alternative Financial Services ................................................................................................... 29A. Overall Use of AFS ......................................................................................................................................29B. AFS Use Among Unbanked and Underbanked Households ..............................................................................29C. Bank Account Ownership and AFS Use ..........................................................................................................35D. Reasons Households Use AFS ........................................................................................................................37E. Descriptions of AFS Users ..............................................................................................................................38
VII. Future Banking Plans of Unbanked Households ................................................................................................... 43A. Likelihood of Opening an Account by Household Characteristics ......................................................................43B. Reasons for Opening a Bank Account ........................................................................................................... 44
VIII. Implications ...................................................................................................................................................... 46
Appendix A — National Tables ................................................................................................................................ 49
Appendix B — Focus on Select Demographic Groups ............................................................................................... 107
Appendix C — State Tables .................................................................................................................................... 125
Appendix D — MSA Tables .................................................................................................................................... 131
Appendix E — FDIC Technical Notes....................................................................................................................... 140
Appendix F — Revisions to the FDIC National Survey of Unbanked and Underbanked Households ............................. 145
Appendix G — Survey Instrument ........................................................................................................................... 147
Appendix H - Detailed State Tables ................................................................................................. Published Separately
Appendix I - Detailed MSA Tables .................................................................................................. Published Separately

2011 FDIC NatIoNal Survey oF uNbaNkeD aND uNDerbaNkeD HouSeHolDS • September 2012 4
I. Executive Summary
The FDIC is committed to ensuring that all Americans have access to safe, secure, and affordable banking services. Public confidence in the banking system derives in part from how effectively banks serve the needs of the nation’s diverse population. To assess the inclusiveness of the banking system, and in response to a statutory mandate, the FDIC conducts biennial surveys of house-holds to estimate the proportion of households that do not fully participate in the banking system.1 This report pres-ents the results of the 2011 FDIC National Survey of Unbanked and Underbanked Households.
The FDIC partnered with the US Census Bureau to conduct this survey in June 2011, collecting responses from nearly 45,000 households. The FDIC used survey responses to categorize households’ banking status as unbanked, underbanked, or fully banked. Unbanked households are those that lack any kind of deposit account at an insured depository institution. Underbanked house-holds hold a bank account, but also rely on alternative financial services (AFS) providers.2 Fully banked house-holds are those that have a bank account of any kind and have not recently relied on any of the AFS included in the survey.3
Key Findings
More than one in four households (28.3 percent) are either unbanked or underbanked, conducting some or all of their financial transactions outside of the mainstream banking system. Many of these households rely on AFS
1 Section 7 of the Federal Deposit Insurance Reform Conforming Amend-ments Act of 2005 (Pub. L. 109–173) calls for the FDIC to conduct ongoing surveys, “on efforts by insured depository institutions to bring those indi-viduals and families who have rarely, if ever, held a checking account, a savings account or other type of transaction or check cashing account at an insured depository institution [‘unbanked’] into the conventional finance system.” Section 7 further instructs the FDIC to consider several factors when conducting the surveys, including estimating the size and worth of the unbanked market in the United States and identifying the primary issues that prevent unbanked individuals from establishing conventional accounts.2 For the purposes of this report, households are identified as “unbanked” if they answered “no” to the question, “Do you or does anyone in your household currently have a checking or savings account?” Underbanked households are defined as those households that have a checking and/or a savings account and had used non-bank money orders, non-bank check cashing services, non-bank remittances, payday loans, rent-to-own services, pawn shops, or refund anticipation loans (RALs) in the past 12 months. 3 Fully banked households may have used AFS more than a year ago or may currently use types of AFS not included in this survey. Based on the banking status classification used in this report, fully banked households are the most engaged in the financial mainstream. However, there are still opportunities to improve the quality and sustainability of banking relation-ships for some of the fully banked households (e.g., expanding the use of savings accounts or bank credit products).
providers, while others use cash or other financial arrangements.
• 8.2 percent of US households are unbanked. This represents 1 in 12 households in the nation, or nearly 10 million in total. Approximately 17 million adults live in unbanked households.4
• The proportion of unbanked households increased slightly since the first survey. The estimated 0.6 percentage point increase represents an additional 821,000 unbanked households.5
• 20.1 percent of US households are underbanked. This represents one in five households, or 24 million households with 51 million adults.6 The 2011 underbanked rate in 2011 is higher than the 2009 rate of 18.2 percent, although the proportions are not directly comparable because of differences in the two surveys.7
• 29.3 percent of households do not have a savings account, while about 10 percent do not have a checking account. About two-thirds of households have both checking and savings accounts.
• One-quarter of households have used at least one AFS product in the last year, and almost one in ten households have used two or more types of AFS products. In all, 12 percent of households used AFS products in the last 30 days, including four in ten unbanked and underbanked households.
4 In addition, unbanked adults may also reside in other households. This is a lower-bound estimate of the number of unbanked adults in the United States because it is based on the assumption that all adults residing in a “banked” household are banked. A banked household may contain one or more unbanked adults; these unbanked adults residing in banked house-holds are not included in the 17.6 million adults number cited in this report. Adults are defined as persons aged 16 and older.5 All reported differences resulting from direct comparisons described in the text are statistically significant at the 10 percent level unless other-wise noted.6 This is an upper-bound estimate of the total number of underbanked adults in the United States because it is based on the assumption that all adults residing in an underbanked household are underbanked. However, an underbanked household may contain one or more adults who are not underbanked.7 Revisions made to the 2011 survey instrument led to changes in the definition of an underbanked household. Specifically, the inclusion of questions regarding households’ use of non-bank remittances in 2011 and changes to the questions regarding the time frames during which house-holds used AFS make it impossible to directly compare underbanked esti-mates across years.
2011 FDIC NatIoNal Survey oF uNbaNkeD aND uNDerbaNkeD HouSeHolDS • September 2012 5
Unbanked and Underbanked Households
Unbanked and underbanked households are not homoge-neous populations. On the contrary, these groups have diverse demographic characteristics, past banking experi-ences, reasons for not holding an account, and future banking plans.
The highest unbanked and underbanked rates are found among non-Asian minorities, lower-income households, younger households, and unemployed households.8 Close to half of all households in these groups are unbanked or underbanked compared to slightly more than one-quarter of all households. Relative to 2009, the estimated unbanked rates in 2011 are essentially unchanged for most groups.9
8 The demographic characteristics of a household, such as race, age, education, and employment, are taken to be those of the owner or renter of the home (i.e., “householder”), unless the characteristic is one defined at the household level, such as income or household type. For conve-nience, some abbreviated language will be used to refer to the demo-graphic characteristics of households. For example, the term “black household” refers to a household for which the householder has been identified as black. Note that other members of a household could have different characteristics from those of the householder. For instance, an unemployed household is defined as a household whose householder is unemployed, but other household members could be employed and earn-ing income. The income measures included in this report reflect the income earned by all household members and not only the householder. 9 Reported differences between groups described in the text do not account for other geographic or demographic factors that may also contribute to the disparities.
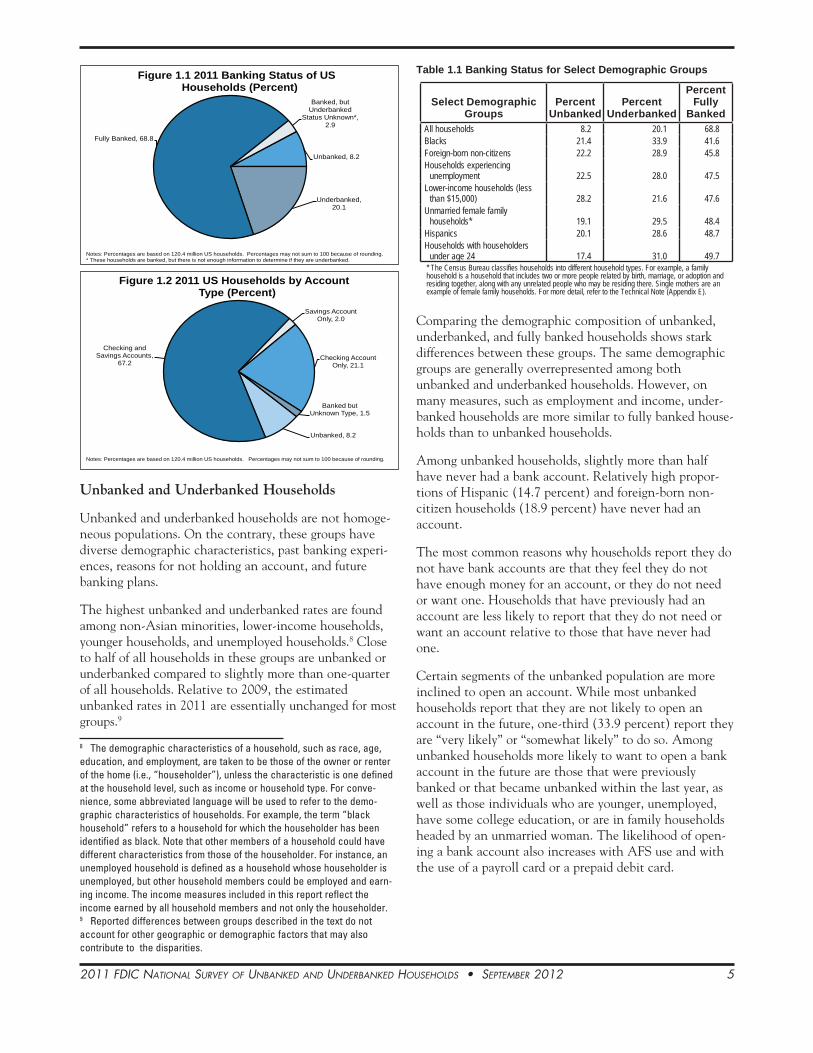
Unbanked, 8.2
Underbanked, 20.1
Fully Banked, 68.8
Banked, but Underbanked
Status Unknown*, 2.9
Figure 1.1 2011 Banking Status of US Households (Percent)
Notes: Percentages are based on 120.4 million US households. Percentages may not sum to 100 because of rounding. * These households are banked, but there is not enough information to determine if they are underbanked.
Unbanked, 8.2
Checking and Savings Accounts,
67.2
Savings Account Only, 2.0
Checking Account Only, 21.1
Banked but Unknown Type, 1.5
Figure 1.2 2011 US Households by Account Type (Percent)
Notes: Percentages are based on 120.4 million US households. Percentages may not sum to 100 because of rounding.
Table 1.1 Banking Status for Select Demographic Groups
Select Demographic Groups
Percent Unbanked
Percent Underbanked
Percent Fully
BankedAll households 8.2 20.1 68.8Blacks 21.4 33.9 41.6Foreign-born non-citizens 22.2 28.9 45.8Households experiencing
unemployment 22.5 28.0 47.5Lower-income households (less
than $15,000) 28.2 21.6 47.6Unmarried female family
households* 19.1 29.5 48.4Hispanics 20.1 28.6 48.7Households with householders
under age 24 17.4 31.0 49.7* The Census Bureau classifies households into different household types. For example, a family household is a household that includes two or more people related by birth, marriage, or adoption and residing together, along with any unrelated people who may be residing there. Single mothers are an example of female family households. For more detail, refer to the Technical Note (Appendix E).
Comparing the demographic composition of unbanked, underbanked, and fully banked households shows stark differences between these groups. The same demographic groups are generally overrepresented among both unbanked and underbanked households. However, on many measures, such as employment and income, under-banked households are more similar to fully banked house-holds than to unbanked households.
Among unbanked households, slightly more than half have never had a bank account. Relatively high propor-tions of Hispanic (14.7 percent) and foreign-born non-citizen households (18.9 percent) have never had an account.
The most common reasons why households report they do not have bank accounts are that they feel they do not have enough money for an account, or they do not need or want one. Households that have previously had an account are less likely to report that they do not need or want an account relative to those that have never had one.
Certain segments of the unbanked population are more inclined to open an account. While most unbanked households report that they are not likely to open an account in the future, one-third (33.9 percent) report they are “very likely” or “somewhat likely” to do so. Among unbanked households more likely to want to open a bank account in the future are those that were previously banked or that became unbanked within the last year, as well as those individuals who are younger, unemployed, have some college education, or are in family households headed by an unmarried woman. The likelihood of open-ing a bank account also increases with AFS use and with the use of a payroll card or a prepaid debit card.

2011 FDIC NatIoNal Survey oF uNbaNkeD aND uNDerbaNkeD HouSeHolDS • September 2012 6
Use of Alternative Financial Services and Prepaid Debit Cards
About 25 percent of households, including all under-banked households and 64.9 percent of unbanked house-holds, have used AFS in the last year. The use of both transaction and credit AFS became more widespread between 2009 and 2011, with higher proportions of house-holds reporting having used either product.
AFS transaction products (i.e., non-bank money orders, non-bank check cashing, and non-bank remittances) are considerably more widely used than AFS credit products (i.e., payday loans, pawn shops, rent-to-own stores, and refund anticipation loans). In the last year, 23.3 percent of households used transaction AFS and 6.0 percent used AFS credit products.
The relationship between household banking status and AFS use is complex. A non-trivial share of unbanked households (29.5 percent) do not use any of the AFS providers asked about in the survey, suggesting they rely primarily on cash. However, overall, unbanked households are more active AFS users than underbanked households. Unbanked households are more likely to use multiple products and to have used AFS, particularly transaction products, more recently and more frequently than under-banked households. The use of AFS credit products does not differ markedly between unbanked and underbanked households, except for payday lending, which typically requires a bank account, making it more prevalent among the underbanked.
Unbanked and underbanked households value the conve-nience of transaction AFS and perceive AFS credit to be easier to obtain than bank credit. The most common reason households use transaction AFS is convenience, while the main reason households use AFS credit products is because they are easier or faster to obtain than bank credit. The main reason many unbanked households use AFS providers for transaction services is because they do not have a bank account. Among underbanked house-holds, the ability to get money faster and the perceived lower cost of non-bank money orders were also common reasons for using AFS providers.
Although not considered AFS in this survey, prepaid debit cards continue to be more widely used among the unbanked and underbanked than among fully banked households. With one in ten households reporting use of a prepaid debit card, overall use of the product appears to be relatively stable from 2009. However, the proportion of unbanked households that have used a prepaid debit card climbed from 12.2 percent to 17.8 percent in 2011, with no significant change among the underbanked.
Implications
The survey results presented in this report suggest four lessons for policymakers, financial institutions, and other stakeholders working to improve access to financial services.
1. Understanding the characteristics of different segments of the unbanked and underbanked populations might increase the efficacy of economic inclusion strate-gies. Different subgroups among unbanked and under-banked households have different characteristics and varying levels of demand for banking services. Under-standing these differences could lead to the development of products and strategies that more effectively engage these households. For example, economic inclusion strate-gies that target unbanked Hispanic households might consider that this group includes two distinct segments with starkly different financial services behavior. One substantial segment (29.6 percent) of this group does not use any financial services from bank or non-bank provid-ers, while another uses AFS more actively than any other ethnic or racial group: 51.8 percent of unbanked Hispan-ics used AFS in the last 30 days, including almost a quar-ter (22.5 percent) who used two or more AFS in that period. In contrast, among other unbanked segments, only about 43 percent of white or black households used AFS in the last 30 days and about 14 percent used two or more in that time frame.
In many cases, underbanked households, and particularly unbanked households, face challenging economic circum-stances, such as unemployment. Understanding these families’ varying situations could help drive collaborative efforts between financial institutions and public and private entities that serve other needs of this population (e.g., employment or social services agencies).
2. Having a bank account does not guarantee long-term participation in the banking system. Households can and do cycle in and out the banking system over time. For example, nearly half of unbanked households had an account in the past, and nearly half (48.2 percent) of these report that they are likely to join the banking system again in the future. Also, almost a quarter of fully banked households have used AFS in the past and could have been considered underbanked at that time. Economic inclusion efforts require not only banking the unbanked, but also retaining and better engaging current bank customers to prevent them from becoming unbanked or underbanked. The offering of low-cost deposit accounts with transparent fee structures could play an important role in this effort.
3. Households with banking experience appear to have more positive perceptions of having an account and rely less on AFS. Unbanked households that previously had a

2011 FDIC NatIoNal Survey oF uNbaNkeD aND uNDerbaNkeD HouSeHolDS • September 2012 7
relationship with a financial institution are more likely to see value in having a bank account than unbanked house-holds without this relationship. Previously banked house-holds are more likely to want to open an account in the future and less likely to say that the main reason they are unbanked is because they “do not want or need an account.”
In addition, survey results show that households that have an account, particularly a checking account, tend to use transaction AFS less actively than those that do not have a checking account. On average, unbanked households are more active transaction AFS users than the underbanked. Even among underbanked households, those that only have a savings account are more active transaction AFS users than underbanked households that have a checking account.
4. Financial institutions interested in pursuing the market opportunity that AFS users present might need to more clearly demonstrate the value in having a bank account to AFS users who perceive non-bank financial services to be more convenient, faster, less expensive, or to present lower barriers to qualification. For example, banks might find it useful to promote mobile technology to increase convenience, thereby addressing the most commonly reported reason households use non-bank check cashers. In addition, for the notable share of unbanked and underbanked consumers who cited speed as a reason for using non-bank check cashing, efforts toward expediting the availability of deposited funds might make deposit accounts more appealing. Making affordable small-dollar loans available with streamlined but solid under-writing could help attract consumers who currently rely on credit AFS.

2011 FDIC NatIoNal Survey oF uNbaNkeD aND uNDerbaNkeD HouSeHolDS • September 2012 8
II. Background and Objectives
A. Background
Access to an account at a federally insured institution provides households with the opportunity to conduct basic financial transactions, save for emergency and long-term security needs, and access credit on fair and affordable terms. Participation in the banking system also protects households from theft and reduces their vulnerability to discriminatory or predatory lending practices. Despite these benefits, many people, particularly low-to-moderate income households, do not access mainstream financial products such as bank accounts and low-cost loans. Other households have access to a bank account, but neverthe-less rely on non-bank financial services providers for many reasons. These households may incur higher costs for transaction and credit products and services, be more vulnerable to loss or struggle to build credit histories and achieve financial security. In addition, households that use non-bank financial services providers do not receive the full range of consumer protections available through the banking system.
The FDIC is committed to expanding economic inclusion in the financial mainstream by ensuring that all Ameri-cans have access to safe, secure, and affordable banking services. As part of this effort, the FDIC is working to fill the research and data gap regarding household participa-tion in mainstream banking and the use of non-bank financial services. Every two years, the FDIC conducts the National Survey of Unbanked and Underbanked House-holds (household survey). This survey estimates the proportions of households that do not participate in the banking system (unbanked households) and that have a relationship with a federally insured institution but also rely on alternative financial services (AFS) providers (underbanked households). The FDIC also conducts the Survey of Banks’ Efforts to Serve the Unbanked and Underbanked (bank survey) to identify the products, services, and outreach strategies banks use to serve unbanked and underbanked households.
The household and bank surveys are key components of the FDIC’s efforts to comply with the Federal Deposit Insurance Reform Conforming Amendments Act of 2005 (Pub. L. 109–173), which calls for the FDIC to conduct ongoing surveys, “on efforts by insured depository institu-tions to bring those individuals and families who have rarely, if ever, held a checking account, a savings account or other type of transaction or check cashing account at an insured depository institution (‘unbanked’) into the conventional finance system.” The law further instructs the FDIC to consider several factors when conducting the
surveys, including estimating the size and worth of the unbanked market in the United States and identifying the primary issues that prevent unbanked individuals from establishing conventional accounts.
The FDIC conducts the household survey in partnership with the US Census Bureau. The FDIC sponsors a special supplement on unbanked and underbanked households that is administered in conjunction with Census Bureau’s Current Population Survey (CPS).
The first household survey was conducted in January 2009, and the results were released to the public in December 2009. The release of the 2009 survey repre-sented the first time consistent and comparable data on unbanked and underbanked households were available at the national, state, and large metropolitan statistical area (MSA) levels. Teamed with the rich demographic and geographic data available through the CPS, the survey provides a wealth of information regarding household banking status and banking decisions.
This report presents the results of the second FDIC National Survey of Unbanked and Underbanked House-holds, which was conducted in June 2011. The household survey collects data on the proportions of US households that are unbanked and underbanked, their demographic characteristics, and their reasons for not participating fully in the financial mainstream. The Census Bureau surveyed approximately 54,000 households, and about 44,900 (84 percent) participated in the FDIC-sponsored supplement survey (see FDIC Technical Note in Appendix D for addi-tional details). All numerical results that appear in this report, such as the total number of unbanked households (or the percentage of all households that are unbanked), are population estimates rather than direct measurements. For brevity of presentation, qualifying text such as “an estimated” is generally not used.
The results of this survey complement other FDIC efforts and initiatives to increase sustainable and safe access to the financial mainstream.10 Shortly after the release of this report, the Census Bureau will make the data collected in the survey publicly available. Additional information related to the survey effort and results are presented at www.economicinclusion.gov. The FDIC encourages researchers, policymakers, consumer and community groups, and financial institutions to use the publicly avail-able data to improve understanding of the issues and chal-lenges underserved households perceive when deciding how and where to conduct financial transactions. The information provided in this report, as well as future anal-ysis produced with the publicly available data, will
10 Information about other economic inclusion efforts undertaken by the FDIC, including the Survey of Banks’ Effort to Serve the Unbanked and Underbanked, can be found at www.economicinclusion.gov.
2011 FDIC NatIoNal Survey oF uNbaNkeD aND uNDerbaNkeD HouSeHolDS • September 2012 9
contribute to efforts to create sustainable banking oppor-tunities for a broad set of consumers.
B. What’s New in the 2011 Survey
Revisions to the 2009 Estimates
The 2009 survey results presented in this report are revised, but are not materially different from the estimates published in the December 2009 report. To be consistent with the 2011 survey, the revised 2009 estimates reflect a change in how survey respondents are defined. In the 2009 report, any household whose respondent reported whether the household had a checking or a savings account was considered a survey respondent. In 2011, a respondent must also have reported that he or she is involved in the household’s finances in order to be consid-ered a survey respondent.
The change in the definition of survey respondent affects a small proportion of the 2009 respondents (1.5 percent of households) who reported that they did not participate in their household finances, or did not report their level of involvement with their household finances. In the 2009 survey, these households were classified as missing/unknown when calculating all estimates, other than the estimate of unbanked households. In the revised 2009 esti-mates, these households are considered non-respondents, and sample weights are adjusted accordingly. The effect of this revision did not change the general findings presented in the 2009 report.
Revisions to the 2011 Survey Instrument
The 2011 survey instrument is similar to the 2009 survey. However, a few important changes were made to cover a broader array of non-bank financial services, and to improve and streamline data collection. Most notably, the 2011 survey added non-bank remittances as AFS covered in the survey and revised questions related to the time-frames during which households used AFS. The revisions to the 2011 survey also streamlined the questions about the reasons households do not have a bank account. Finally, the 2011 survey collected information regarding the types of accounts held by each member of a house-hold. The changes in the survey instrument allowed for a revised definition of an underbanked household to be used in 2011; details about this new definition can be found on Box 2 on page 18, and a detailed summary of all of the revisions to the instrument is provided in Appendix F.
Differences between the surveys make it difficult or impos-sible to compare certain 2009 and 2011 estimates. Specifi-cally, estimates of underbanked households, the reasons households are unbanked, the reasons unbanked house-holds would open an account in the future, the timeframes during which households used AFS, and the reasons
households use AFS are not directly comparable across years. However, estimates of unbanked households, previ-ous banking history of unbanked households, the likeli-hood that unbanked households will open an account in the future, and the proportions of households that have ever used the specific AFS included in 2009 are compa-rable across years.

2011 FDIC NatIoNal Survey oF uNbaNkeD aND uNDerbaNkeD HouSeHolDS • September 2012 10
III. Banking Status of US Households
The 2011 survey results show that 8.2 percent of US households are unbanked, up from 7.6 percent in 2009. An additional 20.1 percent of US house-holds are underbanked. Consistent with 2009, groups that are more likely to be unbanked and underbanked include non-Asian minorities, foreign-born non-citizens, unmarried families, less educated households, younger households, unemployed house-holds, non-homeowners, and lower-income households.
A. Top Level Results
In 2011, an estimated 8.2 percent of households in the United States did not have a bank account (i.e., they were “unbanked”). This proportion represents approximately 9.9 million households. About 17.1 million adults (7.3 percent of all adults) and 9 million children under age 15 (13.6 percent of all children) reside in these unbanked households. For the purposes of this report, households are identified as “unbanked” if they answered “no” to the question, “Do you or does anyone in your household currently have a checking or savings account?” (see Figure 3.1).
Another 20.1 percent of US households (or 24 million households) are “underbanked,” meaning that they have a bank account but also rely on alternative financial services (AFS). Altogether, an estimated 51 million adults (21.7 percent of adults) and 16.6 million children (25.1 percent of children) reside in underbanked households11 (see Table 3.1 and Box 1). Another 2.9 percent of households are banked, but information about their use of AFS is insufficient to determine whether they are underbanked. Underbanked households are defined as those households that have a checking or savings account or both, and had
11 See footnotes 4 and 6 about person-level counts.
Unbanked, 8.2
Underbanked, 20.1
Fully Banked, 68.8
Banked, but Underbanked
Status Unknown*, 2.9
Figure 3.1 2011 Banking Status of US Households (Percent)
Notes: Percentages are based on 120.4 million US households. Percentages may not sum to 100 because of rounding. * These households are banked, but there is not enough information to determine if they are underbanked.
used non-bank money orders, non-bank check cashing services, non-bank remittances, payday loans, rent-to-own services, pawn shops, or refund anticipation loans (RALs) in the last 12 months.
Overall, at least 28.3 percent of US households are either unbanked or underbanked and may benefit from becoming more engaged in the financial mainstream (see Table 3.1). Opportunities exist for banks to provide accounts to those households that currently do not have one and to provide financial products and services that alternative financial services providers currently supply.
Relative to 2009, the proportion of US households that are unbanked has increased. In 2009, 7.6 percent of households were unbanked compared with 8.2 percent in 2011.12 The estimated 0.6 percentage point increase in the national unbanked rate represents more than 821,000 additional unbanked households.13
Table 3.1 Banking Status of US Households 2009-2011
Banking Status
2009 2011Households Households
(Millions) Percent
(Millions) Percent
All US Households 119.0 100.0 120.4 100.0 Unbanked 9.1 7.6 9.9 8.2 Underbanked* 21.7 18.2 24.2 20.1 Fully Banked* 84.9 71.4 82.8 68.8 Underbanked Status Unknown* 3.3 2.8 3.5 2.9 *Estimates not directly comparable across years.
In 2009, 18.2 percent of households (21.7 million) were underbanked. Due to changes in the definition of an underbanked household in 2011, the 2009 estimate and
12 This comparison reflects revised 2009 estimates, based on a new defi-nition of survey respondent used in 2011, that differ from those published in the 2009 report. See Background (page 9) for more information.13 Of the increase of 821,000 unbanked households, approximately 108,000 additional households can be attributed to population growth between 2009 and 2011, and the remaining 712,000 can be explained by the increase in unbanked rate.
Box 1 – 2011 Person-Level Estimates
In 2011, about 17.1 million adults (7.3 percent of adults) resided in unbanked households and 51 million (21.7 percent of adults) in underbanked households. It is also possible to calculate the propor-tion of adults in the United States who do not have a bank account, regardless of the banking status of their household. The proportion of US adults that do not have a bank account is 20.5 percent. However, this report focuses on household-level rather than person-level estimates since one account can help meet the financial needs of more than one person in a household.

2011 FDIC NatIoNal Survey oF uNbaNkeD aND uNDerbaNkeD HouSeHolDS • September 2012 11
the 2011 estimate of 20.1 percent are not directly compa-rable (see Box 2 on page 18). However, among banked households, AFS use (excluding RALs and remittances) has increased.14
Types of Bank Accounts
For the first time, the 2011 survey questionnaire asked about the specific types of bank accounts—checking and savings—held by each household member. The large majority of US households (at least 88.5 percent) have a checking account (meaning that at least one person in the household has a checking account). Savings accounts are less prevalent than checking accounts. Only 69.2 percent of households have a savings account, meaning almost one-third of US households do not.
Most households that have a savings account also have a checking account; more than two-thirds of households (67.2 percent) have both a savings and a checking account, while only 2.0 percent of households have a savings account but not a checking account. It is more common for households to have a checking account and not a savings account: more than one in five households (21.1 percent) have a checking account only (see Figure 3.2).
Among underbanked households that, by definition, have at least one type of bank account, almost all (93.9 percent) have a checking account. Underbanked house-holds are less likely to have a savings account (67.8 percent) than fully banked households (78.4 percent). Underbanked households are also less likely to have both
14 The proportion of households with bank accounts that used AFS (excluding RALs and remittances) in the last year increased by 0.9 percentage points between 2009 and 2011. RAL and remittance use are excluded from this comparison because the data collected on these AFS products are not comparable between surveys. The AFS included in this comparison are: nonbank check cashing, non-bank money orders, payday lenders, pawn shops, and rent-to-own stores. Since the 2011 survey asked about the timing for using the AFS somewhat differently from the 2009 survey, these estimates are still not strictly comparable, even after excluding RALs and remittances from the calculations.
Unbanked, 8.2
Checking and Savings Accounts,
67.2
Savings Account Only, 2.0
Checking Account Only, 21.1
Banked but Unknown Type, 1.5
Figure 3.2 2011 US Households by Account Type (Percent)
Notes: Percentages are based on 120.4 million US households. Percentages may not sum to 100 because of rounding.
types of accounts (62.5 percent) compared with fully banked households (77.1 percent). In addition, almost one in three (31.2 percent) underbanked households have only a checking account but not a savings account, compared with 20.7 percent of fully banked households.
B. Unbanked and Underbanked Rates by Region and State
Between 2009 and 2011, there were statistically signifi-cant increases in the proportion of unbanked households in three states, and no state experienced a significant decrease. The proportion of banked households that used AFS (excluding RALs and remittances) increased in eight states and decreased in two. The South continues to have the highest proportions of unbanked and underbanked households.
Unbanked rates vary geographically. The South has the highest incidence of unbanked households at 10.0 percent. This region is home to 37.3 percent of US households, but 45.5 percent of all unbanked households in the country reside there.15 The Midwest and Northeast have the lowest unbanked rates, at 7.1 percent. Notably, the Midwest, which had the lowest unbanked rate in 2009 at 6.1 percent, experienced the largest increase in the proportion of unbanked households (see Figure 3.3).
Figure 3.4A illustrates that state-level household unbanked rates vary widely, from 1.9 percent in New Hampshire to 15.1 percent in Mississippi. Between 2009 and 2011, the proportion of households that are unbanked
15 The US Census Bureau classifies the United States into four regions. The Northeast region comprises Connecticut, Maine, Massachusetts, New Hampshire, New Jersey, New York, Pennsylvania, Rhode Island, and Vermont; the Midwest region comprises Illinois, Indiana, Iowa, Kansas, Michigan, Minnesota, Missouri, Nebraska, North Dakota, Ohio, South Dakota, and Wisconsin; the South region comprises Alabama, Arkansas, Delaware, District of Columbia, Florida, Georgia, Kentucky, Louisiana, Maryland, Mississippi, North Carolina, Oklahoma, South Carolina, Tennes-see, Texas, Virginia, and West Virginia; the West region is composed of Alaska, Arizona, California, Colorado, Hawaii, Idaho, Montana, Nevada, New Mexico, Oregon, Utah, Washington, and Wyoming.
72.0 72.064.1
70.9
17.9 17.723.2
19.0
7.1 7.1 10.0 7.2
3.1 3.1 2.7 2.9
0
10
20
30
40
50
60
70
80
90
100
Northeast Midwest South West
Perc
enta
ge o
f Hou
seho
lds
Figure 3.3 2011 US Households Banking Status by Census Region
Fully Banked Underbanked Unbanked Banked but Underbanked Status Unknown
2011 FDIC NatIoNal Survey oF uNbaNkeD aND uNDerbaNkeD HouSeHolDS • September 2012 12
increased by a statistically significant amount in three states: West Virginia (3.4 percentage points), Wyoming (2.3 percentage points), and Minnesota (1.6 percentage points). Unbanked rates also appear to have increased considerably in other states, such as Arizona (4.0 percent-age points), Louisiana (3.0 percentage points), Arkansas (2.1 percentage points), Ohio (1.9 percentage points), and Virginia (1.8 percentage points), but the changes were not statistically significant. The proportion of unbanked households appears to have declined in several states, although the decreases were not statistically significant: Kentucky (2.1 percentage points), Alabama (1.7 percent-age points), and Oregon (1.6 percentage points) (see Appendix Table C-3).
Similar to unbanked rates, household underbanked rates vary by geographic region (see Figure 3.4B). The South, which has the highest proportion of unbanked households, also has the highest proportion of underbanked house-holds (23.2 percent), followed by the West (19.0 percent), the Northeast (17.9 percent), and Midwest (17.7 percent). Of all underbanked households in the United States, 43.1 percent live in the South, while just one in five (21.0 percent) live in the West.
Underbanked rates also vary considerably by state, ranging from 12.5 percent in New Hampshire to 31.2 percent in Nevada (see Figure 3.4B and Appendix Table C-4). As previously noted, 2011 and 2009 underbanked estimates are not comparable because of changes in the survey.16 However, AFS use (excluding RALs and remittances) among banked households increased. Specifically, the proportion of households that used AFS in the last 12 months increased in eight states: Alabama, Nevada, Arkansas, Georgia, New Jersey, South Dakota, Vermont, and Rhode Island, and decreased in Alaska and in the District of Columbia.17
16 See Box 2 on page 18.17 This analysis is based on the measure of AFS use that excludes use of non-bank remittances and RALs, as discussed in footnote 14.

2011 FDIC NatIoNal Survey oF uNbaNkeD aND uNDerbaNkeD HouSeHolDS • September 2012 13
Figure 3.4A Unbanked Rates by State
Figure 3.4B Underbanked Rates by State

2011 FDIC NatIoNal Survey oF uNbaNkeD aND uNDerbaNkeD HouSeHolDS • September 2012 14
IV. Banking Status and Account Type Ownership by Demographic Groups
Some of the highest unbanked rates are found among non-Asian minority households, lower income households, households headed by younger householders, and households experiencing unem-ployment. These groups are also some of the demo-graphic groups with the highest concentrations of underbanked households. The types of bank accounts households own also vary with household-ers’ demographic characteristics. While over two-thirds (67.2 percent) of US households have both checking and savings accounts, the proportion of households with both types of accounts is much lower among non-Asian minorities, lower-income households and less educated households. Under-banked households are less likely than fully banked households to have both savings and checking accounts.
A. Which Groups Have Higher Proportions of Unbanked Households?
The proportion of unbanked households varies by demo-graphic characteristics (see Table 4.1).18 Unbanked rates are higher among non-Asian minority households than other racial and ethnic groups. Black (21.4 percent), Hispanic (20.1 percent), and American Indian (14.5 percent) households have the largest proportions of unbanked households. In contrast, much smaller propor-tions of white and Asian households (4.0 percent and 2.7 percent, respectively) are unbanked (see Figure 4.1). Unbanked households are also disproportionately repre-sented among foreign-born non-citizens (22.2 percent) and households where Spanish is the only language spoken (36.9 percent).
18 See footnote 8.
7.6
21.519.2
15.3
9.0
3.3 3.5
8.2
21.420.1
14.5
6.24.0
2.7
2011 National Estimate: 8.2%
0
5
10
15
20
25
30
All Black Hispanic AmericanIndian/Alaskan
Hawaiian/PacificIslander
White Asian
Perc
enta
ge o
f Hou
seho
lds
Figure 4.1 Unbanked Households by Race and Ethnicity
2009 2011
Unbanked rates generally decrease with increasing age and income. Among the youngest households (those with householders under age 24), 17.4 percent are unbanked. The proportion of unbanked households is lower, at 12.7 percent, for households between age 25 and age 34, and it continues to decline across older age categories. Unbanked rates also decline sharply with income. Almost three in ten households (28.2 percent) with annual income below $15,000 do not have a bank account, while about one in ten households (11.7 percent) with income between $15,000 and $30,000 are unbanked. Still, almost half (47.6 percent) of households with income below $15,000 are fully banked (see Figures 4.2 and 4.3).

2011 FDIC NatIoNal Survey oF uNbaNkeD aND uNDerbaNkeD HouSeHolDS • September 2012 15
Table 4.1. 2011 Household Banking Status by Demographic Characteristics
Household Characteristic
All Households Unbanked
Has a Bank Account
Underbanked Fully Banked
Banked but Underbanked
Status UnknownNumber (1000s)
Pct of Col
Number (1000s)
Pct of Row
Number (1000s)
Pct of Row
Number (1000s)
Pct of Row
Number (1000s)
Pct of Row
All Households 120,408 100.0 9,875 8.2 24,199 20.1 82,830 68.8 3,504 2.9Household Type
Family household 78,826 65.5 5,905 7.5 16,931 21.5 53,797 68.2 2,194 2.8Female householder, no husband present 15,575 12.9 2,971 19.1 4,598 29.5 7,544 48.4 462 3.0Male householder, no wife present 5,661 4.7 807 14.3 1,662 29.4 3,006 53.1 186 3.3Married couple 57,591 47.8 2,127 3.7 10,671 18.5 43,247 75.1 1,545 2.7
Non-family household 41,479 34.4 3,960 9.5 7,239 17.5 28,978 69.9 1,303 3.1Female householder 21,688 18.0 1,702 7.8 3,359 15.5 15,868 73.2 760 3.5Male householder 19,791 16.4 2,258 11.4 3,880 19.6 13,110 66.2 543 2.7
Other 102 0.1 11 10.9 29 28.6 55 53.5 7 7.0Race/Ethnicity
Black 16,046 13.3 3,430 21.4 5,441 33.9 6,672 41.6 503 3.1Hispanic non-Black 13,710 11.4 2,762 20.1 3,927 28.6 6,677 48.7 344 2.5Asian 4,985 4.1 134 2.7 825 16.6 3,844 77.1 182 3.6American Indian/Alaskan 1,389 1.2 202 14.5 372 26.8 765 55.1 50 3.6Hawaiian/Pacific Islander 267 0.2 17 6.2 81 30.2 168 62.9 2 0.7White non-Black non-Hispanic 83,988 69.8 3,330 4.0 13,551 16.1 64,690 77.0 2,417 2.9Other non-Black non-Hispanic 23 - NA NA NA NA NA NA NA NA
Spanish Only Language SpokenSpanish is not the only language spoken 117,940 98.0 8,965 7.6 23,496 19.9 82,018 69.5 3,462 2.9Spanish is the only language spoken 2,467 2.0 910 36.9 703 28.5 812 32.9 41 1.7
NativityUS-born 104,143 86.5 7,673 7.4 20,038 19.2 73,435 70.5 2,998 2.9Foreign-born citizen 8,380 7.0 453 5.4 1,880 22.4 5,783 69.0 264 3.2Foreign-born non-citizen 7,885 6.5 1,750 22.2 2,282 28.9 3,612 45.8 241 3.1
Age Group15 to 24 years 6,299 5.2 1,094 17.4 1,955 31.0 3,129 49.7 121 1.925 to 34 years 20,374 16.9 2,587 12.7 4,993 24.5 12,286 60.3 509 2.535 to 44 years 21,414 17.8 1,994 9.3 4,918 23.0 13,996 65.4 506 2.445 to 54 years 24,658 20.5 2,002 8.1 5,336 21.6 16,553 67.1 766 3.155 to 64 years 22,036 18.3 1,202 5.5 4,064 18.4 16,132 73.2 638 2.965 years or more 25,625 21.3 997 3.9 2,933 11.4 20,733 80.9 963 3.8
EducationNo high school degree 14,321 11.9 3,696 25.8 3,505 24.5 6,677 46.6 443 3.1High school degree 34,462 28.6 3,764 10.9 7,638 22.2 21,969 63.7 1,090 3.2Some college 34,010 28.2 2,002 5.9 7,676 22.6 23,388 68.8 944 2.8College degree 37,615 31.2 413 1.1 5,380 14.3 30,796 81.9 1,026 2.7
Employment StatusEmployed 72,580 60.3 3,818 5.3 15,515 21.4 51,294 70.7 1,953 2.7Unemployed 6,779 5.6 1,525 22.5 1,899 28.0 3,218 47.5 137 2.0Not in labor force 41,049 34.1 4,532 11.0 6,786 16.5 28,318 69.0 1,414 3.4
Household IncomeLess than $15,000 19,541 16.2 5,510 28.2 4,225 21.6 9,299 47.6 507 2.6Between $15,000 and $30,000 22,073 18.3 2,581 11.7 5,628 25.5 13,134 59.5 730 3.3Between $30,000 and $50,000 24,787 20.6 1,221 4.9 5,787 23.3 17,015 68.6 764 3.1Between $50,000 and $75,000 21,975 18.3 431 2.0 4,142 18.9 16,757 76.3 644 2.9At Least $75,000 32,032 26.6 132 0.4 4,418 13.8 26,624 83.1 857 2.7
HomeownershipHomeowner 79,144 65.7 2,238 2.8 12,590 15.9 61,833 78.1 2,483 3.1Non-homeowner 41,264 34.3 7,637 18.5 11,610 28.1 20,996 50.9 1,021 2.5
Geographic RegionNortheast 21,784 18.1 1,537 7.1 3,908 17.9 15,675 72.0 664 3.0Midwest 26,900 22.3 1,920 7.1 4,772 17.7 19,379 72.0 828 3.1South 44,920 37.3 4,493 10.0 10,429 23.2 28,772 64.1 1,226 2.7West 26,804 22.3 1,925 7.2 5,090 19.0 19,005 70.9 784 2.9
Metropolitan StatusMetropolitan Area 100,311 83.3 8,029 8.0 20,066 20.0 69,203 69.0 3,014 3.0
Inside principal city 33,636 27.9 4,066 12.1 7,485 22.3 21,111 62.8 974 2.9Not Inside principal city 49,548 41.2 2,754 5.6 9,214 18.6 36,057 72.8 1,523 3.1Not Identified 17,127 14.2 1,209 7.1 3,367 19.7 12,034 70.3 516 3.0
Not in metropolitan area 19,193 15.9 1,764 9.2 3,857 20.1 13,096 68.2 477 2.5Not Identified 903 0.8 83 9.2 276 30.6 531 58.8 13 1.5
Notes:NA = Not available because the sample size was too small to make an accurate estimate.- = For this table cell, there were so few sample respondents (in some cases zero) reporting that the estimated universe proportion was rounded to 0.0 percent. It is estimated that the true value is only slightly greater than zero.Figures do not always reconcile to totals because of rounding.

2011 FDIC NatIoNal Survey oF uNbaNkeD aND uNDerbaNkeD HouSeHolDS • September 2012 16
Unmarried family households are more likely to be unbanked than other types of family groups: 17.8 percent of unmarried family households do not have an account.19 Notably, almost one in five unmarried female family households (19.1 percent) do not have a bank account compared to 14.3 percent of unmarried male family house-holds and 3.7 percent of married families (see Figure 4.4).
19 The Census Bureau classifies households into different household types. For example, a family household is a household that includes two or more people related by birth, marriage, or adoption and residing together, along with any unrelated people who may be residing there. Single moth-ers are an example of female family households. For more detail, refer to the Technical Note (Appendix E).
7.6
15.7
11.78.9
7.5
4.83.5
8.2
17.4
12.7
8.1
5.53.9
8.9 2011 National Estimate: 8.2%
0
5
10
15
20
25
30
AllHouseholds
Age 15-24 Age 25-34 Age 35-44 Age 45-54 Age 55-64 Age 65+
Perc
enta
ge o
f Hou
seho
lds
Figure 4.2 Unbanked Households by Age
2009 2011
7.6
27.0
13.0
4.11.5 0.3
8.2
29.6
11.4
4.51.4 0.2
2011 National Estimate: 8.2%
0
5
10
15
20
25
30
35
All Households Less than $15K $15K-$30K $30K -$50K $50K -$75K At least $75K
Perc
enta
ge o
f H
ouse
hold
s
Figure 4.3 Unbanked Households by Income
2009 2011
Notes: In 2009, close to 15 percent of households did not have income data and were categorized as missing income. In 2011 the US Census Bureau imputed income to households with missing income information. For year to year comparisons, households with imputed income in 2011 are categorized as missing income. Missing income is not shown in chart.
7.6
19.5
14.8
6.610.7
3.5
8.2
19.1
14.3
7.8
11.4
3.7
2011 National Estimate: 8.2%
0
5
10
15
20
25
30
AllHouseholds
UnmarriedFemale Family
Unmarried MaleFamily
IndividualFemale
Household
Individual MaleHousehold
MarriedCouples
Perc
enta
ge o
f Hou
seho
lds
Figure 4.4 Unbanked Householdsby Household Type
2009 2011
Unbanked households are also disproportionately repre-sented among less educated households (25.8 percent of those with a householder without a high school degree), unemployed households (22.5 percent), and non-home-owners (18.5 percent) (see Figures 4.5 and 4.6).
Generally, the demographic groups with higher concentra-tions of unbanked households were the same in both 2009 and 2011, and in many cases unbanked rates were essen-tially unchanged. However, for some groups, the increase in the proportion of unbanked households was statistically significant. The largest increases between 2009 and 2011 occurred among households that typically have high unbanked rates, such as unemployed households (from 19.1 percent to 22.5 percent), those not in the labor force (from 9.7 percent to 11.0 percent), and households with annual income below $15,000 (from 27.0 percent to 29.6 percent).20 However, unbanked rates also increased among white households (0.7 percentage points) and US-born households (0.7 percentage points), while no statistically significant changes in unbanked rates were found among minorities or foreign-born households. Unbanked rates
20 In 2009, close to 15 percent of households did not have income data and were categorized as missing income. In 2011, the US Census Bureau imputed income to households with missing income information. For year-to-year comparison purposes, households with imputed income in 2011 are categorized as missing income.
7.6
24.4
9.6
4.9
1.2
8.2
25.8
10.9
5.9
1.1
2011 National Estimate: 8.2%
0
5
10
15
20
25
30
AllHouseholds
No High SchoolDegree
High SchoolDegree
Some College College Degree
Perc
enta
ge o
f Hou
seho
lds
Figure 4.5 Unbanked Households by Education
2009 2011
7.6
19.1
9.7
5.5
8.2
22.5
11.0
5.3
2011 National Estimate: 8.2%
0
5
10
15
20
25
30
AllHouseholds
Unemployed Not in Labor Force Employed
Perc
enta
ge o
f Hou
seho
lds
Figure 4.6 Unbanked Householdsby Employment Status
2009 2011
2011 FDIC NatIoNal Survey oF uNbaNkeD aND uNDerbaNkeD HouSeHolDS • September 2012 17
decreased only among one demographic group: households with income between $15,000 and $30,000 (1.6 percent-age points).
This report generally presents univariate analysis. Other potential factors that may be playing a role are not accounted for when reporting differences in estimates across segments of the population. However, it is interest-ing to note that in many cases, estimated differences persist even after controlling for other potential contribut-ing factors. For example, even among the lowest income group (households with income less than $15,000), black and Hispanic households have much higher unbanked rates than Asian and white households: 46.2 percent of low-income black households and 41.5 percent of low-income Hispanic households are unbanked, compared with 11.0 percent of low-income Asian households and 17.5 percent of low-income white households.
B. Which Groups Have Higher Proportions of Underbanked Households?
Patterns observed among underbanked households are fairly similar to those observed for unbanked households; in many cases, the same demographic groups that are disproportionately unbanked are also disproportionately underbanked.
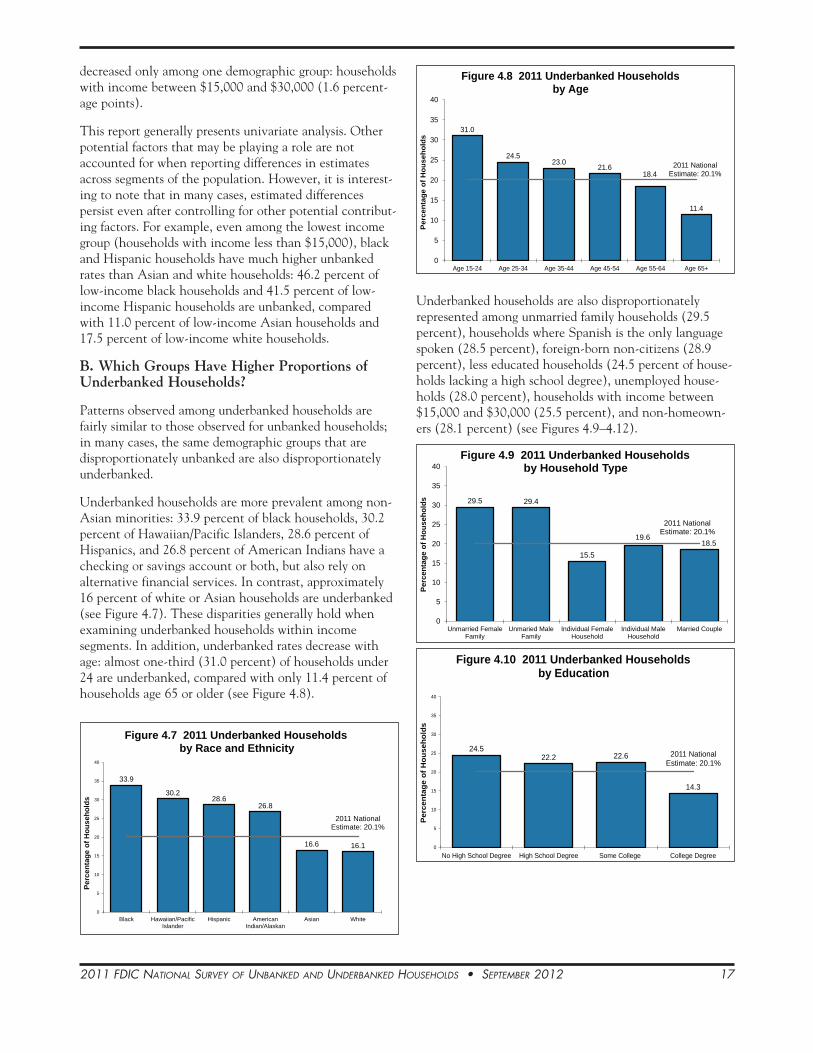
Underbanked households are more prevalent among non-Asian minorities: 33.9 percent of black households, 30.2 percent of Hawaiian/Pacific Islanders, 28.6 percent of Hispanics, and 26.8 percent of American Indians have a checking or savings account or both, but also rely on alternative financial services. In contrast, approximately 16 percent of white or Asian households are underbanked (see Figure 4.7). These disparities generally hold when examining underbanked households within income segments. In addition, underbanked rates decrease with age: almost one-third (31.0 percent) of households under 24 are underbanked, compared with only 11.4 percent of households age 65 or older (see Figure 4.8).
33.9
30.228.6
26.8
16.6 16.1
2011 National Estimate: 20.1%
0
5
10
15
20
25
30
35
40
Black Hawaiian/PacificIslander
Hispanic AmericanIndian/Alaskan
Asian White
Perc
enta
ge o
f Hou
seho
lds
Figure 4.7 2011 Underbanked Householdsby Race and Ethnicity
Underbanked households are also disproportionately represented among unmarried family households (29.5 percent), households where Spanish is the only language spoken (28.5 percent), foreign-born non-citizens (28.9 percent), less educated households (24.5 percent of house-holds lacking a high school degree), unemployed house-holds (28.0 percent), households with income between $15,000 and $30,000 (25.5 percent), and non-homeown-ers (28.1 percent) (see Figures 4.9–4.12).
31.0
24.523.0
21.618.4
11.4
2011 National Estimate: 20.1%
0
5
10
15
20
25
30
35
40
Age 15-24 Age 25-34 Age 35-44 Age 45-54 Age 55-64 Age 65+
Perc
enta
ge o
f Hou
seho
lds
Figure 4.8 2011 Underbanked Householdsby Age
29.5 29.4
15.5
19.618.5
2011 National Estimate: 20.1%
0
5
10
15
20
25
30
35
40
Unmarried FemaleFamily
Unmaried MaleFamily
Individual FemaleHousehold
Individual MaleHousehold
Married Couple
Perc
enta
ge o
f Hou
seho
lds
Figure 4.9 2011 Underbanked Householdsby Household Type
24.522.2 22.6
14.3
2011 National Estimate: 20.1%
0
5
10
15
20
25
30
35
40
No High School Degree High School Degree Some College College Degree
Per
cent
age
of H
ouse
hold
s
Figure 4.10 2011 Underbanked Householdsby Education

2011 FDIC NatIoNal Survey oF uNbaNkeD aND uNDerbaNkeD HouSeHolDS • September 2012 18
28.0
21.4
16.5
2011 National Estimate: 20.1%
0
5
10
15
20
25
30
35
40
Unemployed Employed Not in Labor Force
Perc
enta
ge o
f Hou
seho
lds
Figure 4.11 2011 Underbanked Householdsby Employment Status
21.6
25.523.3
18.9
13.8
2011 National Estimate: 20.1%
0
5
10
15
20
25
30
35
40
Less than $15K $15K-$30K $30K -$50K $50K -$75K At least $75K
Perc
enta
ge o
f Hou
seho
lds
Figure 4.12 2011 Underbanked Householdsby Income
Box 2 – Revised Underbanked Definition and Year-to-Year Comparisons
The definition of an underbanked household was revised for the 2011 report, so the 2011 underbanked estimates are not directly comparable with the 2009 estimates. In the 2011 report, underbanked households are defined as those who used non-bank check cashing, non-bank money orders, non-bank remittances, payday lending, pawn shops, rent-to-own agreements, or refund anticipation loans (RALs) at least once in the last year. This differs from the underbanked definition used in the 2009 report in several ways. The 2009 definition of underbanked households did not include non-bank remittance use, as this information was not collected in the 2009 survey. The 2009 survey also considered households that used RALs in the previous five years to be underbanked, while the 2011 definition includes only those households that used RALs in the last year. Finally, the 2011 report defines underbanked house-holds as those that used one of the AFS credit products or transaction services “in the last 12 months,” while in 2009 households were considered to be underbanked if they used AFS “once or twice a year” or “at least a few times a year.”
Including the use of non-bank remittances in the 2011 definition of underbanked households increased the overall proportion of underbanked households by 1.5 percentage points (see Table 4.2).
Table 4.2 Effect of Including Remittances on the Proportion of Underbanked Households
Household Type
Contribution to Underbanked EstimateUnderbanked Percentage Remittances Other AFS
All households 20.1 1.5 18.5Black 33.9 2.2 31.7Hispanic 28.6 5.3 23.4Asian 16.6 6.4 10.2American Indian/Alaskan 26.8 0.0 26.8Hawaiian/Pacific Islander 30.2 6.3 23.9White 16.1 0.5 15.6US Citizen 19.2 0.5 18.7Foreign-born naturalized citizen 22.4 7.6 14.9Foreign-born non-citizen 28.9 8.6 20.4Spanish is not the only language spoken 19.9 1.4 18.5Spanish is only language spoken 28.5 9.5 19.0
The effect of including remittances in the estimate of underbanked households varies greatly among demographic groups and has the largest effect on Hispanic and Asian minorities, foreign-born households, and households where Spanish is the only language spoken. For Hispanics and Asians, the proportion of underbanked households increases by 5.3 percentage points and 6.4 percentage points, respectively, when non-bank remittances are included. In contrast, the underbanked rates increase by 0.5 percentage points for whites and 2.2 percentage points for blacks. For foreign-born non-citizen households, the underbanked estimate increased by 8.6 percentage points to 28.9 percent; for foreign-born citizen households, the underbanked rate increased by 7.6 percentage points to 22.4 percent. Among households where only Spanish is spoken, the proportion of underbanked households rose by 9.5 percentage points, to 28.5 percent, when remittances are included.
2011 FDIC NatIoNal Survey oF uNbaNkeD aND uNDerbaNkeD HouSeHolDS • September 2012 19
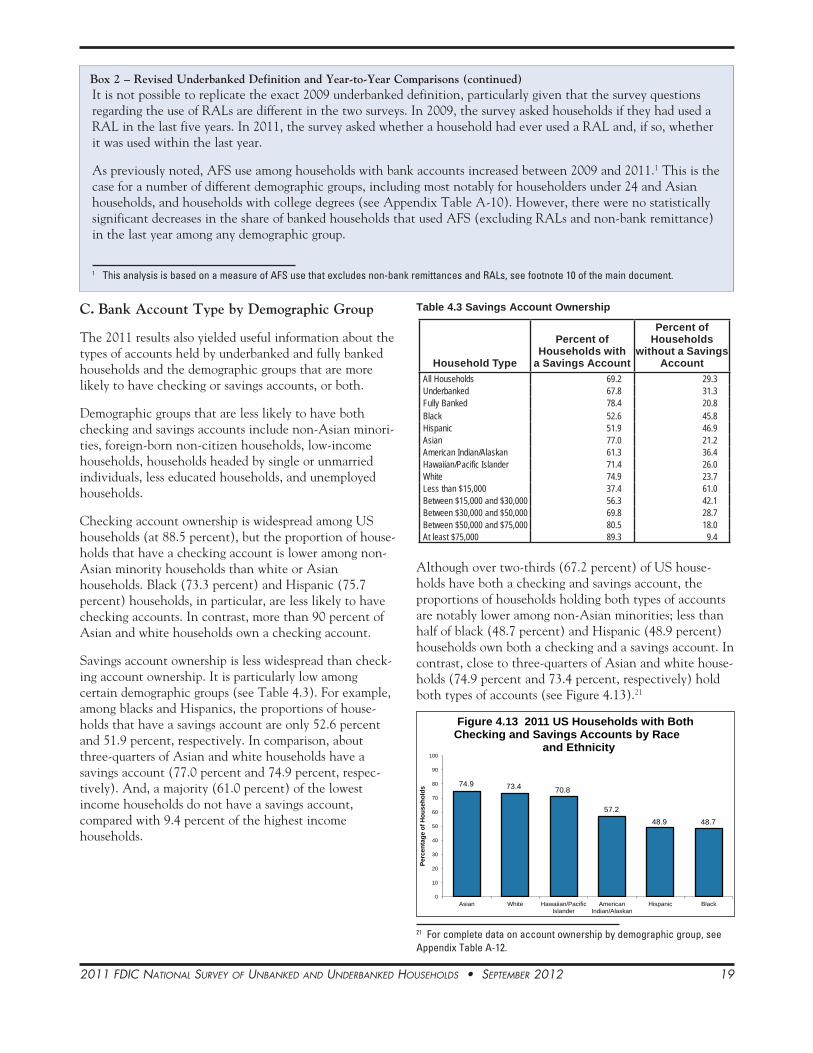
C. Bank Account Type by Demographic Group
The 2011 results also yielded useful information about the types of accounts held by underbanked and fully banked households and the demographic groups that are more likely to have checking or savings accounts, or both.
Demographic groups that are less likely to have both checking and savings accounts include non-Asian minori-ties, foreign-born non-citizen households, low-income households, households headed by single or unmarried individuals, less educated households, and unemployed households.
Checking account ownership is widespread among US households (at 88.5 percent), but the proportion of house-holds that have a checking account is lower among non-Asian minority households than white or Asian households. Black (73.3 percent) and Hispanic (75.7 percent) households, in particular, are less likely to have checking accounts. In contrast, more than 90 percent of Asian and white households own a checking account.
Savings account ownership is less widespread than check-ing account ownership. It is particularly low among certain demographic groups (see Table 4.3). For example, among blacks and Hispanics, the proportions of house-holds that have a savings account are only 52.6 percent and 51.9 percent, respectively. In comparison, about three-quarters of Asian and white households have a savings account (77.0 percent and 74.9 percent, respec-tively). And, a majority (61.0 percent) of the lowest income households do not have a savings account, compared with 9.4 percent of the highest income households.
Table 4.3 Savings Account Ownership
Household Type
Percent of Households with
a Savings Account
Percent of Households
without a Savings Account
All Households 69.2 29.3Underbanked 67.8 31.3Fully Banked 78.4 20.8Black 52.6 45.8Hispanic 51.9 46.9Asian 77.0 21.2American Indian/Alaskan 61.3 36.4Hawaiian/Pacific Islander 71.4 26.0White 74.9 23.7Less than $15,000 37.4 61.0Between $15,000 and $30,000 56.3 42.1Between $30,000 and $50,000 69.8 28.7Between $50,000 and $75,000 80.5 18.0At least $75,000 89.3 9.4
Although over two-thirds (67.2 percent) of US house-holds have both a checking and savings account, the proportions of households holding both types of accounts are notably lower among non-Asian minorities; less than half of black (48.7 percent) and Hispanic (48.9 percent) households own both a checking and a savings account. In contrast, close to three-quarters of Asian and white house-holds (74.9 percent and 73.4 percent, respectively) hold both types of accounts (see Figure 4.13).21
21 For complete data on account ownership by demographic group, see Appendix Table A-12.
74.9 73.4 70.8
57.248.9 48.7
0
10
20
30
40
50
60
70
80
90
100
Asian White Hawaiian/PacificIslander
AmericanIndian/Alaskan
Hispanic Black
Perc
enta
ge o
f Hou
seho
lds
Figure 4.13 2011 US Households with Both Checking and Savings Accounts by Race
and Ethnicity
It is not possible to replicate the exact 2009 underbanked definition, particularly given that the survey questions regarding the use of RALs are different in the two surveys. In 2009, the survey asked households if they had used a RAL in the last five years. In 2011, the survey asked whether a household had ever used a RAL and, if so, whether it was used within the last year.
As previously noted, AFS use among households with bank accounts increased between 2009 and 2011.1 This is the case for a number of different demographic groups, including most notably for householders under 24 and Asian households, and households with college degrees (see Appendix Table A-10). However, there were no statistically significant decreases in the share of banked households that used AFS (excluding RALs and non-bank remittance) in the last year among any demographic group.
1 This analysis is based on a measure of AFS use that excludes non-bank remittances and RALs, see footnote 10 of the main document.
Box 2 – Revised Underbanked Definition and Year-to-Year Comparisons (continued)

2011 FDIC NatIoNal Survey oF uNbaNkeD aND uNDerbaNkeD HouSeHolDS • September 2012 20
Households with higher incomes were also more likely to have both types of bank accounts. Among households in the highest income group (incomes above $75,000), 88.8 percent have both checking and savings accounts, compared with a third (32.9 percent) of households with incomes below $15,000 and 53.0 percent of households with income between $15,000 and $30,000. The propor-tion of households that have checking and savings accounts also increases markedly as education levels increase. More than 84 percent of households with a college degree own both types of accounts, compared with 34.9 percent of households without a high school degree (see Figures 4.14 and 4.15).
The likelihood of holding both a savings and a checking account does not appear to vary as much with household-ers’ age as it does with their education and income levels. About two-thirds of households in each age group between 25 and 65 have both checking and savings accounts. Only among households with the youngest (age 15 to 24) householders is the proportion of households with both checking and savings accounts somewhat lower, at 55.3 percent (see Figure 4.16).
32.9
53.0
68.0
79.6
88.8
0
10
20
30
40
50
60
70
80
90
100
Less than $15K $15K-$30K $30K -$50K $50K -$75K At least $75K
Perc
enta
ge o
f Hou
seho
lds
Figure 4.14 US Households with Both Checking and Savings Accounts by Income
34.9
58.2
70.8
84.5
0
10
20
30
40
50
60
70
80
90
100
No High School Degree High School Degree Some College College Degree
Perc
enta
ge o
f Hou
seho
lds
Figure 4.15 2011 US Households with Both Checking and Savings Accounts by Education
In general, underbanked households are less likely than fully banked households to have both savings and check-ing accounts: 62.5 percent of underbanked households compared with 77.1 percent of fully banked households. Yet notable disparities exist among different demographic groups. For example, more than three-quarters of under-banked Asian households (76.8 percent) and nearly two-thirds of underbanked white households (65.1 percent) have both checking and savings accounts, compare with 58.8 percent of underbanked black households. The posi-tive correlation between income and checking and savings account ownership is also evident among underbanked households; the proportion of such households owning both types of accounts ranges from 38.3 percent for house-holds with annual income under $15,000 to 85.9 percent for households with income of $75,000 or more.
55.3
64.6 67.3 68.9 70.4 67.7
0
10
20
30
40
50
60
70
80
90
100
15 to 24 years 25 to 34 years 35 to 44 years 45 to 54 years 55 to 64 years 65 years ormore
Perc
enta
ge o
f Hou
seho
lds
Figure 4.16 2011 US Households with Both Checking and Savings Accounts by Age

2011 FDIC NatIoNal Survey oF uNbaNkeD aND uNDerbaNkeD HouSeHolDS • September 2012 21
V. Who Are the Unbanked, Underbanked, and Fully Banked?
The demographic groups that are overrepresented among unbanked households are generally also over-represented among underbanked households, but to a lesser degree. On many measures, underbanked households are more similar to fully banked house-holds than to unbanked households.
A. Demographic Composition of Households by Banking Status
Household banking status can be viewed as a continuum from unbanked households to underbanked households to fully banked households. The unbanked housholds, at one end of the spectrum, have no affiliation to mainstream banking; underbanked households, in the middle, have bank accounts but also use AFS; and fully banked house-holds that have not used AFS in the past year are at the opposite end. Comparing the demographic composition of each banking status group reveals that certain demo-graphic groups are highly overrepresented among unbanked households and somewhat overrepresented among underbanked households.
It is interesting to compare the characteristics of these three banking status groups because in many cases, the differences between the demographic composition of unbanked households and underbanked households are much larger than the differences between underbanked households and fully banked households. Understanding the differences and similarities between the different groups could help inform efforts to better engage unbanked and underbanked households, and can also help identify the challenges in establishing and strengthening mainstream banking relationships with these consumers.
Race and Ethnicity (see Figure 5.1)
The share of non-Asian minorities in each banking status group declines considerably as its engagement in the mainstream banking system increases. In particular, black and Hispanic households are overrepresented among the unbanked and the underbanked. Almost one-third (62.7 percent) of all unbanked households are black or Hispanic, as are 38.7 percent of underbanked households. In contrast, fewer than one in five (16.2 percent) fully banked households are black or Hispanic. Black house-holds make up more than one-third (34.7 percent) of unbanked households, 22.5 percent of underbanked households, and 8.1 percent of fully banked households. Similarly, Hispanic households comprise 28.0 percent of all unbanked households, 16.2 percent of underbanked
households, and only 8.1 percent of fully banked house-holds. White households follow an opposite trend, accounting for a third (33.7 percent) of unbanked and a majority (56.0 percent) of underbanked households, as well as more than three-fourths (78.1 percent) of fully banked households.
Figure 5.1 2011 Distribution of Households by Banking Status - Race and Ethnicity (Percent)
Black, 34.7
White, 33.7
Hispanic, 28.0 American Indian/Alaskan,
2.0
Asian, 1.4
Hawaiian/Pacific Islander, 0.2
Unbanked
Note: Percentages are based on 9.9 million unbanked households. Percentages may not sum to 100 because of rounding.
Black, 22.5
White, 56.0
Hispanic, 16.2American
Indian/Alaskan, 1.5
Asian, 3.4
Hawaiian/Pacific Islander, 0.3
Underbanked
Note: Percentages are based on 24.2 million underbanked households. Percentages may not sum to 100 because of rounding.
Black, 8.1
White, 78.1
Hispanic, 8.1 American Indian/Alaskan,
0.9
Asian, 4.6
Hawaiian/Pacific Islander, 0.2
Fully Banked
Note: Percentages are based on 82.8 million fully banked households. Percentages may not sum to 100 because of rounding.
2011 FDIC NatIoNal Survey oF uNbaNkeD aND uNDerbaNkeD HouSeHolDS • September 2012 22
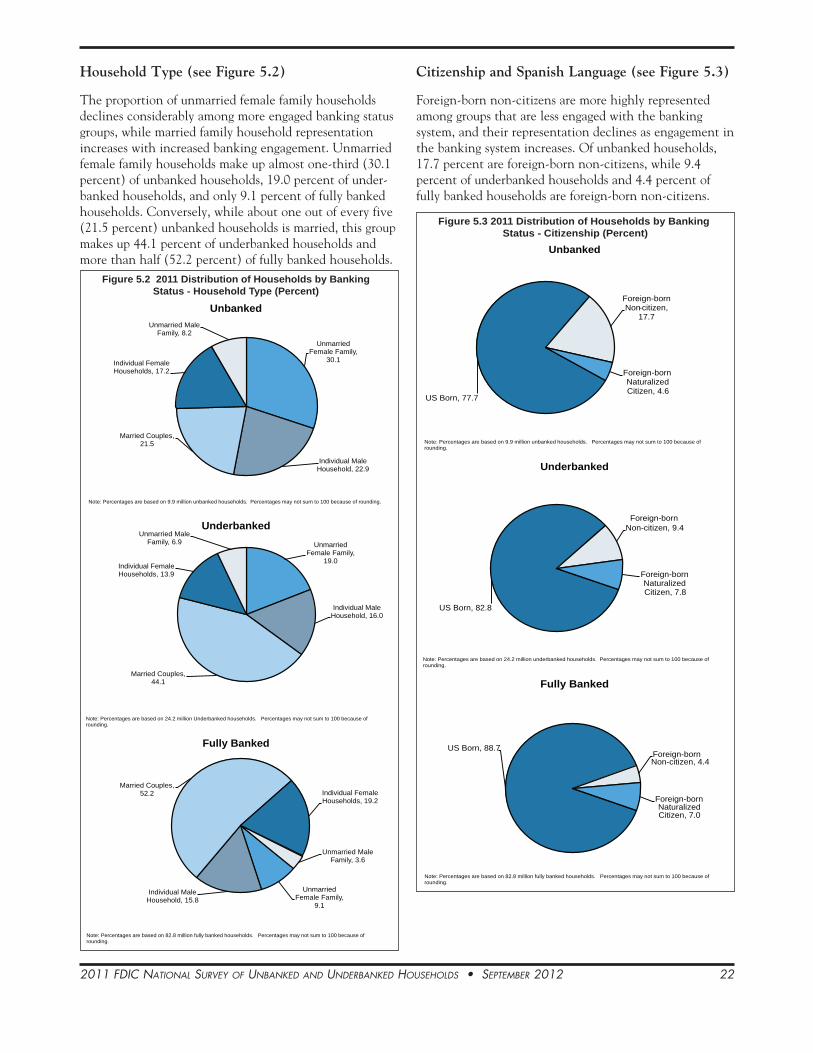
Household Type (see Figure 5.2)
The proportion of unmarried female family households declines considerably among more engaged banking status groups, while married family household representation increases with increased banking engagement. Unmarried female family households make up almost one-third (30.1 percent) of unbanked households, 19.0 percent of under-banked households, and only 9.1 percent of fully banked households. Conversely, while about one out of every five (21.5 percent) unbanked households is married, this group makes up 44.1 percent of underbanked households and more than half (52.2 percent) of fully banked households.
Unmarried Female Family,
30.1
Individual Male Household, 22.9
Married Couples, 21.5
Individual Female Households, 17.2
Unmarried Male Family, 8.2
Unbanked
Note: Percentages are based on 9.9 million unbanked households. Percentages may not sum to 100 because of rounding.
Unmarried Female Family,
19.0
Individual Male Household, 16.0
Married Couples, 44.1
Individual Female Households, 13.9
Unmarried Male Family, 6.9
Underbanked
Note: Percentages are based on 24.2 million Underbanked households. Percentages may not sum to 100 because of rounding.
Unmarried Female Family,
9.1
Individual Male Household, 15.8
Married Couples, 52.2 Individual Female
Households, 19.2
Unmarried Male Family, 3.6
Fully Banked
Note: Percentages are based on 82.8 million fully banked households. Percentages may not sum to 100 because of rounding.
Figure 5.2 2011 Distribution of Households by BankingStatus - Household Type (Percent)
Citizenship and Spanish Language (see Figure 5.3)
Foreign-born non-citizens are more highly represented among groups that are less engaged with the banking system, and their representation declines as engagement in the banking system increases. Of unbanked households, 17.7 percent are foreign-born non-citizens, while 9.4 percent of underbanked households and 4.4 percent of fully banked households are foreign-born non-citizens.
US Born, 77.7
Foreign-born Non-citizen,
17.7
Foreign-born Naturalized Citizen, 4.6
Unbanked
Note: Percentages are based on 9.9 million unbanked households. Percentages may not sum to 100 because of rounding.
US Born, 82.8
Foreign-bornNon-citizen, 9.4
Foreign-bornNaturalized Citizen, 7.8
Underbanked
Note: Percentages are based on 24.2 million underbanked households. Percentages may not sum to 100 because of rounding.
US Born, 88.7Foreign-bornNon-citizen, 4.4
Foreign-bornNaturalized Citizen, 7.0
Fully Banked
Note: Percentages are based on 82.8 million fully banked households. Percentages may not sum to 100 because of rounding.
Figure 5.3 2011 Distribution of Households by Banking Status - Citizenship (Percent)

2011 FDIC NatIoNal Survey oF uNbaNkeD aND uNDerbaNkeD HouSeHolDS • September 2012 23
Although households that speak only Spanish make up a small portion of the overall US population (2.0 percent), this group represents about 9.2 percent of unbanked households, less than 3 percent of underbanked house-holds, and 1.0 percent of fully banked households.
Age (see Figure 5.4)
The median age of the householder increases as their engagement in the banking system increases. The median age of unbanked householders is between 35 and 44, while the median age for both underbanked and fully banked households is between 45 to 54. Among unbanked house-holds, 37.3 percent of householders are under 35 years old, compared to 28.7 percent of underbanked householders and 18.6 percent of fully banked households. Household-ers between 15 and 24 years old comprise 11.1 percent of unbanked households, 8.1 percent of underbanked house-holds, and 3.8 percent of fully banked households.
Education (see Figure 5.5)
Higher levels of education are associated with higher levels of banking engagement. More than three-quarters (75.5 percent) of unbanked households do not have any education beyond a high school degree, compared with 46.1 percent of underbanked and 34.6 percent of fully banked households. Households with no high school degree comprise more than one-third (37.4 percent) of unbanked households, 14.5 percent of underbanked households, and about 8.1 percent of fully banked house-holds. The opposite trend is true for households with a college education. Households with a college degree repre-sent 4.2 percent of unbanked households, 22.2 percent of underbanked households, and 37.2 percent of fully banked households.
Employment Status (see Figure 5.6)
Compared with other banking status groups, much higher proportions of unbanked households are not in the labor force (45.9 percent) or are unemployed (15.4 percent). Unemployment levels decline considerably for under-banked households and fully banked households, to 7.8 percent and 3.9 percent, respectively. Among under-banked and fully banked households, the proportion of employed households is similar (64.1 percent and 61.9 percent, respectively) and substantially higher than among unbanked households (38.7 percent). About 28.0 percent of underbanked households and more than one-third (34.2 percent) of fully banked households are not in the labor force.
Household Income (see Figure 5.7)
The vast majority (81.9 percent) of unbanked households earn an annual income below $30,000. More than half
(55.8 percent) earn incomes below $15,000. Among underbanked households, 40.8 percent earn below $30,000 a year, including 17.5 percent who earn less than $15,000. In contrast, 27.1 percent of fully banked households earn below $30,000 (including 11.2 percent who earn below $15,000). Households in which the primary family member makes more than $75,000 in annual income comprise only 1.3 percent of unbanked households, 18.3 percent of underbanked households, and almost a third (32.1 percent) of fully banked households. The annual median income earned by unbanked households is under $15,000, and is between $30,000 and $50,000 for banked households (including the underbanked and fully banked).
Age 15-24, 11.1
Age 25-34, 26.2
Age 35-44, 20.2
Age 45-54, 20.3
Age 55-64, 12.2
Age 65+, 10.1
Unbanked
Note: Percentages are based on 9.9 million unbanked households. Percentages may not sum to 100 because of rounding.
Age 15-24, 8.1
Age 25-34, 20.6
Age 35-44, 20.3Age 45-54, 22.1
Age 55-64, 16.8
Age 65+, 12.1
Underbanked
Note: Percentages are based on 24.2 million underbanked households. Percentages may not sum to 100 because of rounding.
Age 15-24, 3.8
Age 25-34, 14.8
Age 35-44, 16.9
Age 45-54, 20.0
Age 55-64, 19.5
Age 65+, 25.0
Fully Banked
Note: Percentages are based on 82.8 million fully banked households. Percentages may not sum to 100 because of rounding.
Figure 5.4 2011 Distribution of Households by Banking Status - Age (Percent)
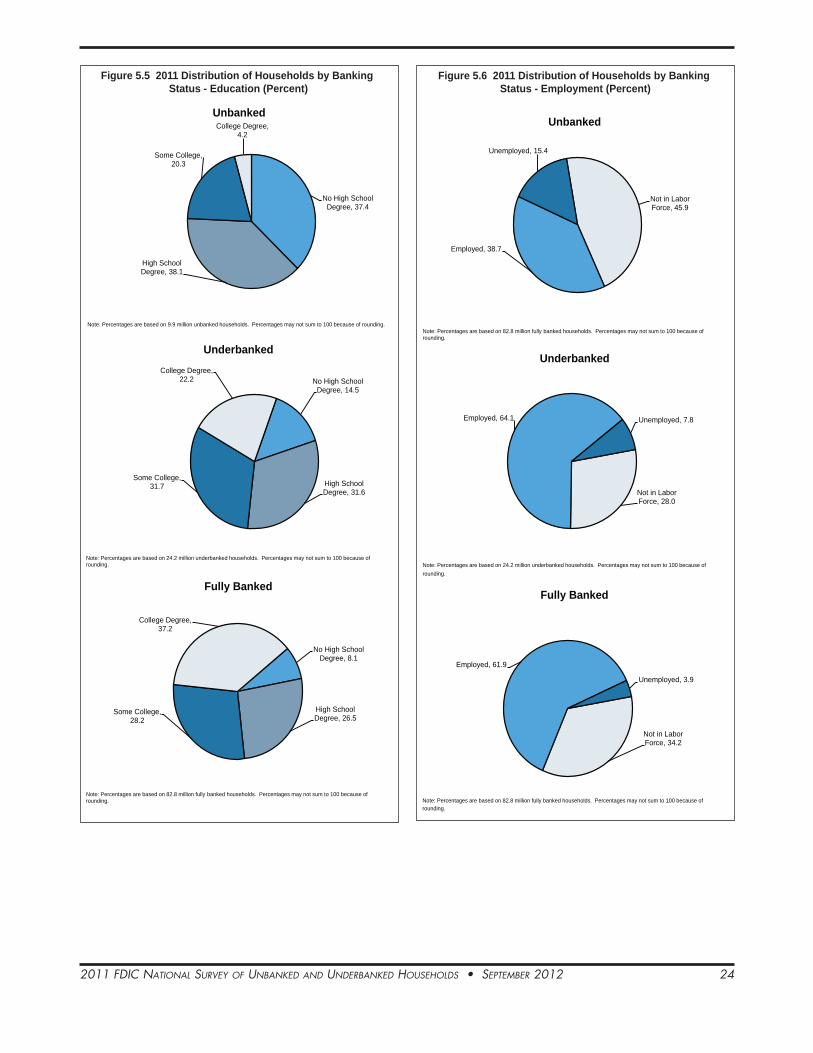
2011 FDIC NatIoNal Survey oF uNbaNkeD aND uNDerbaNkeD HouSeHolDS • September 2012 24
No High School Degree, 37.4
High School Degree, 38.1
Some College, 20.3
College Degree, 4.2
Unbanked
Note: Percentages are based on 9.9 million unbanked households. Percentages may not sum to 100 because of rounding.
No High School Degree, 14.5
High School Degree, 31.6
Some College, 31.7
College Degree, 22.2
Underbanked
Note: Percentages are based on 24.2 million underbanked households. Percentages may not sum to 100 because of rounding.
No High School Degree, 8.1
High School Degree, 26.5
Some College, 28.2
College Degree, 37.2
Fully Banked
Note: Percentages are based on 82.8 million fully banked households. Percentages may not sum to 100 because of rounding.
Figure 5.5 2011 Distribution of Households by Banking Status - Education (Percent)
Not in Labor Force, 45.9
Employed, 38.7
Unemployed, 15.4
Unbanked
Note: Percentages are based on 82.8 million fully banked households. Percentages may not sum to 100 because of rounding.
Not in Labor Force, 28.0
Employed, 64.1 Unemployed, 7.8
Underbanked
Note: Percentages are based on 24.2 million underbanked households. Percentages may not sum to 100 because of rounding.
Not in Labor Force, 34.2
Employed, 61.9
Unemployed, 3.9
Fully Banked
Note: Percentages are based on 82.8 million fully banked households. Percentages may not sum to 100 because of rounding.
Figure 5.6 2011 Distribution of Households by Banking Status - Employment (Percent)

2011 FDIC NatIoNal Survey oF uNbaNkeD aND uNDerbaNkeD HouSeHolDS • September 2012 25
Homeownership Status
Although nearly two-thirds (65.7 percent) of all US households are homeowners, homeowners account for fewer than one-quarter (22.7 percent) of unbanked house-holds, more than half (52.0 percent) of underbanked households, and over three-fourths (74.7 percent) of fully banked households. Non-homeowners represent 77.3
Less than $15K, 55.8
$15K-$30K, 26.1
$30K -$50K, 12.4
$50K -$75K, 4.4At least $75K, 1.3
Unbanked
Note: Percentages are based on 9.9 million unbanked households. Percentages may not sum to 100 because of rounding.
Less than $15K, 17.5
$15K-$30K, 23.3
$30K -$50K, 23.9
$50K -$75K, 17.1
At least $75K, 18.3
Underbanked
Note: Percentages are based on 24.2 million underbanked households. Percentages may not sum to 100 because of rounding.
Less than $15K, 11.2
$15K-$30K, 15.9
$30K -$50K, 20.5$50K -$75K, 20.2
At least $75K, 32.1
Fully Banked
Note: Percentages are based on 82.8 million fully banked households. Percentages may not sum to 100 because of rounding.
Figure 5.7 2011 Distribution of Households by Banking Status - Income (Percent)
percent, 48.0 percent, and 25.3 percent of households that are unbanked, underbanked, and fully banked, respectively.
Geographic Area
Larger proportions of unbanked households are located in urban areas than other banking status groups. The largest share of unbanked households (41.2 percent) are concen-trated in urban areas, while only 30.9 percent of under-banked and a quarter (25.5 percent) of fully banked households live in urban areas.22 In contrast, the largest shares of households with bank accounts (underbanked and fully banked households) reside in suburban areas (38.1 percent and 43.5 percent, respectively).
B. Unbanked Households’ Banking History and Reasons For Not Having a Bank Account
Slightly more than half of all unbanked households have never had a bank account, while slightly less than half have had an account at some point in the past. Certain demographic groups, including Hispanics and foreign-born non-citizens, are among the most likely to have never had an account. The most common reasons households do not have bank accounts are that they feel they do not have enough money for an account or they do not need or want an account, but households that have previously had an account are less likely to report that they do not need or want one.
Banking History of Unbanked Households (see Figure 5.8)
About 3.7 percent of households are unbanked, but have had an account in the past. These households account for 44.7 percent of unbanked households. About 4.4 percent of all households in the United States (or the remaining 53.4 percent of unbanked households) have never had a bank account. These estimates vary considerably across demographic groups. For example, almost 15 percent of Hispanic households in the United States, almost one in five (18.9 percent) foreign-born non-citizen households, and almost a third of households that speak only Spanish have never had a bank account.
As a share of all US households, the proportion that have never had an account increased by 0.7 percentage points from 3.7 percent in 2009 to 4.4 percent in 2011. However, the estimated share of households that previously held an account was basically unchanged (3.7 percent in 2011, down from 3.8 percent in 2009, a statistically insignificant difference).
22 In this report, “urban” refers to areas inside a principal city within a metropolitan area; “suburban” refers to areas in a metropolitan area, but that are not inside a principal city; and “rural” refers to areas outside a metropolitan area.
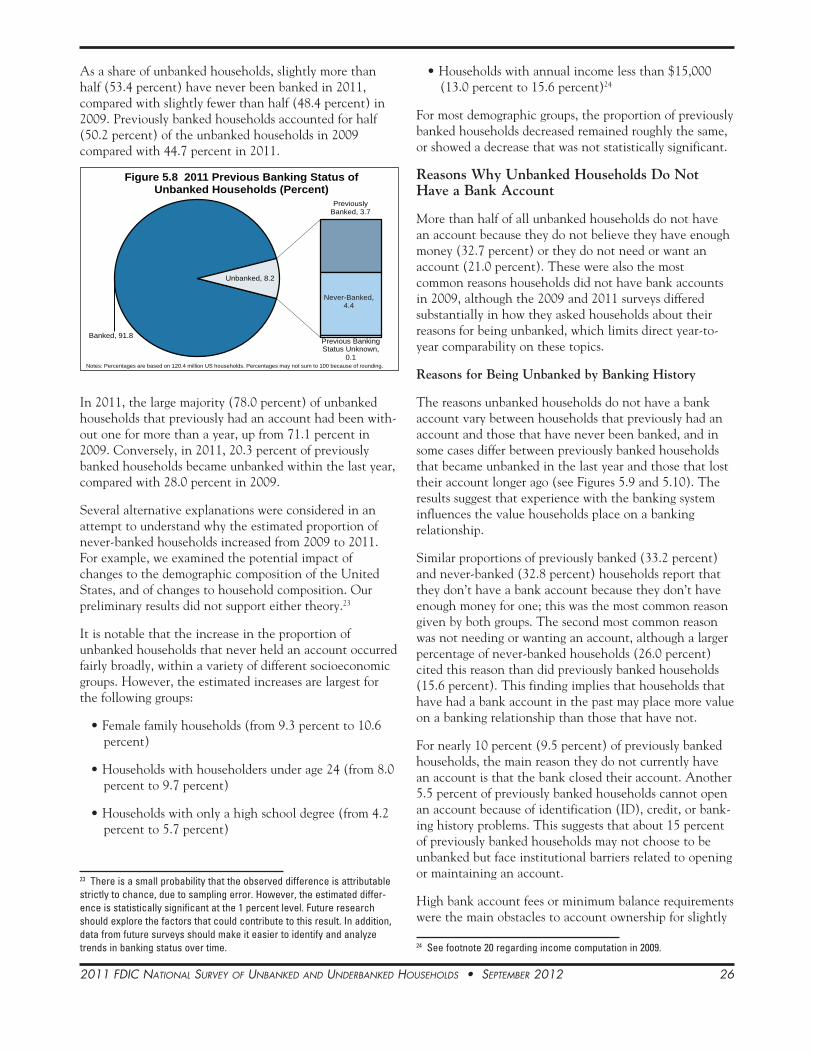
2011 FDIC NatIoNal Survey oF uNbaNkeD aND uNDerbaNkeD HouSeHolDS • September 2012 26
As a share of unbanked households, slightly more than half (53.4 percent) have never been banked in 2011, compared with slightly fewer than half (48.4 percent) in 2009. Previously banked households accounted for half (50.2 percent) of the unbanked households in 2009 compared with 44.7 percent in 2011.
In 2011, the large majority (78.0 percent) of unbanked households that previously had an account had been with-out one for more than a year, up from 71.1 percent in 2009. Conversely, in 2011, 20.3 percent of previously banked households became unbanked within the last year, compared with 28.0 percent in 2009.
Several alternative explanations were considered in an attempt to understand why the estimated proportion of never-banked households increased from 2009 to 2011. For example, we examined the potential impact of changes to the demographic composition of the United States, and of changes to household composition. Our preliminary results did not support either theory.23
It is notable that the increase in the proportion of unbanked households that never held an account occurred fairly broadly, within a variety of different socioeconomic groups. However, the estimated increases are largest for the following groups:
• Female family households (from 9.3 percent to 10.6 percent)
• Households with householders under age 24 (from 8.0 percent to 9.7 percent)
• Households with only a high school degree (from 4.2 percent to 5.7 percent)
23 There is a small probability that the observed difference is attributable strictly to chance, due to sampling error. However, the estimated differ-ence is statistically significant at the 1 percent level. Future research should explore the factors that could contribute to this result. In addition, data from future surveys should make it easier to identify and analyze trends in banking status over time.
Banked, 91.8
Previously Banked, 3.7
Never-Banked, 4.4
Previous Banking Status Unknown,
0.1
Unbanked, 8.2
Figure 5.8 2011 Previous Banking Status of Unbanked Households (Percent)
Notes: Percentages are based on 120.4 million US households. Percentages may not sum to 100 because of rounding.
• Households with annual income less than $15,000 (13.0 percent to 15.6 percent)24
For most demographic groups, the proportion of previously banked households decreased remained roughly the same, or showed a decrease that was not statistically significant.
Reasons Why Unbanked Households Do Not Have a Bank Account
More than half of all unbanked households do not have an account because they do not believe they have enough money (32.7 percent) or they do not need or want an account (21.0 percent). These were also the most common reasons households did not have bank accounts in 2009, although the 2009 and 2011 surveys differed substantially in how they asked households about their reasons for being unbanked, which limits direct year-to-year comparability on these topics.
Reasons for Being Unbanked by Banking History
The reasons unbanked households do not have a bank account vary between households that previously had an account and those that have never been banked, and in some cases differ between previously banked households that became unbanked in the last year and those that lost their account longer ago (see Figures 5.9 and 5.10). The results suggest that experience with the banking system influences the value households place on a banking relationship.
Similar proportions of previously banked (33.2 percent) and never-banked (32.8 percent) households report that they don’t have a bank account because they don’t have enough money for one; this was the most common reason given by both groups. The second most common reason was not needing or wanting an account, although a larger percentage of never-banked households (26.0 percent) cited this reason than did previously banked households (15.6 percent). This finding implies that households that have had a bank account in the past may place more value on a banking relationship than those that have not.
For nearly 10 percent (9.5 percent) of previously banked households, the main reason they do not currently have an account is that the bank closed their account. Another 5.5 percent of previously banked households cannot open an account because of identification (ID), credit, or bank-ing history problems. This suggests that about 15 percent of previously banked households may not choose to be unbanked but face institutional barriers related to opening or maintaining an account.
High bank account fees or minimum balance requirements were the main obstacles to account ownership for slightly
24 See footnote 20 regarding income computation in 2009.
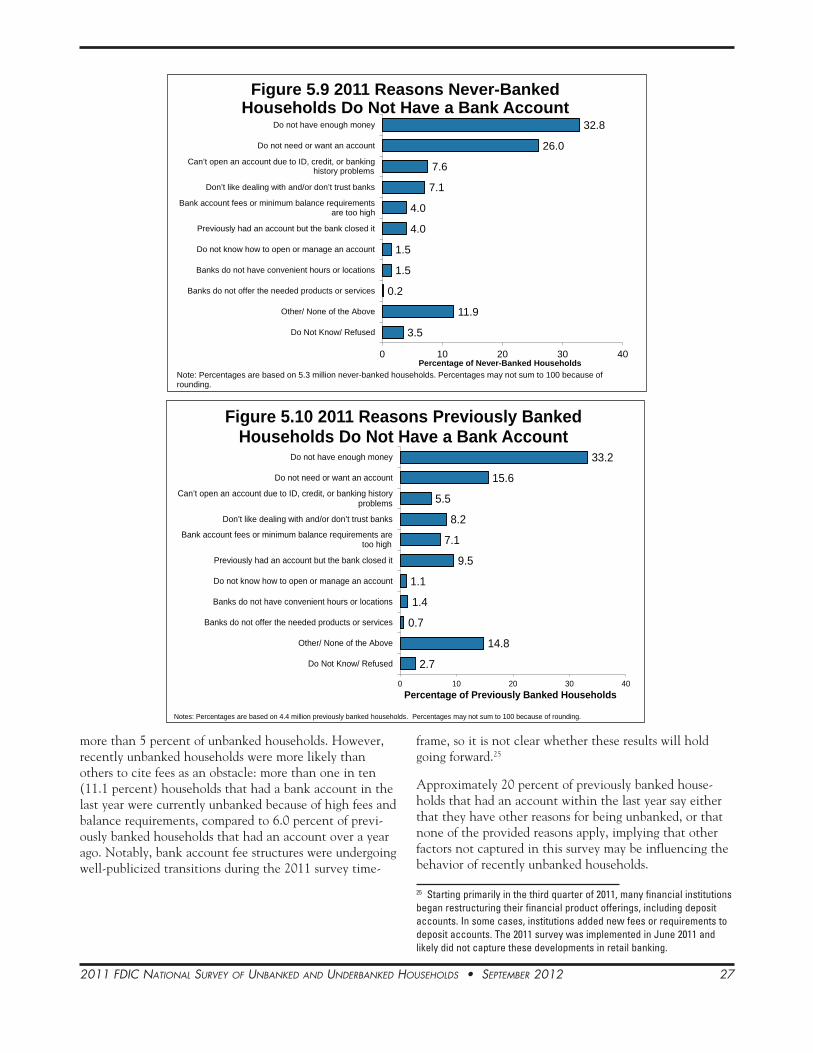
2011 FDIC NatIoNal Survey oF uNbaNkeD aND uNDerbaNkeD HouSeHolDS • September 2012 27
more than 5 percent of unbanked households. However, recently unbanked households were more likely than others to cite fees as an obstacle: more than one in ten (11.1 percent) households that had a bank account in the last year were currently unbanked because of high fees and balance requirements, compared to 6.0 percent of previ-ously banked households that had an account over a year ago. Notably, bank account fee structures were undergoing well-publicized transitions during the 2011 survey time-
frame, so it is not clear whether these results will hold going forward.25
Approximately 20 percent of previously banked house-holds that had an account within the last year say either that they have other reasons for being unbanked, or that none of the provided reasons apply, implying that other factors not captured in this survey may be influencing the behavior of recently unbanked households.
25 Starting primarily in the third quarter of 2011, many financial institutions began restructuring their financial product offerings, including deposit accounts. In some cases, institutions added new fees or requirements to deposit accounts. The 2011 survey was implemented in June 2011 and likely did not capture these developments in retail banking.
2.7
14.8
0.7
1.4
1.1
9.5
7.1
8.2
5.5
15.6
33.2
0 10 20 30 40
Do Not Know/ Refused
Other/ None of the Above
Banks do not offer the needed products or services
Banks do not have convenient hours or locations
Do not know how to open or manage an account
Previously had an account but the bank closed it
Bank account fees or minimum balance requirements aretoo high
Don’t like dealing with and/or don’t trust banks
Can’t open an account due to ID, credit, or banking history problems
Do not need or want an account
Do not have enough money
Percentage of Previously Banked Households
Figure 5.10 2011 Reasons Previously Banked Households Do Not Have a Bank Account
Notes: Percentages are based on 4.4 million previously banked households. Percentages may not sum to 100 because of rounding.
3.5
11.9
0.2
1.5
1.5
4.0
4.0
7.1
7.6
26.0
32.8
0 10 20 30 40
Do Not Know/ Refused
Other/ None of the Above
Banks do not offer the needed products or services
Banks do not have convenient hours or locations
Do not know how to open or manage an account
Previously had an account but the bank closed it
Bank account fees or minimum balance requirementsare too high
Don’t like dealing with and/or don’t trust banks
Can’t open an account due to ID, credit, or banking history problems
Do not need or want an account
Do not have enough money
Percentage of Never-Banked Households
Figure 5.9 2011 Reasons Never-Banked Households Do Not Have a Bank Account
Note: Percentages are based on 5.3 million never-banked households. Percentages may not sum to 100 because of rounding.

2011 FDIC NatIoNal Survey oF uNbaNkeD aND uNDerbaNkeD HouSeHolDS • September 2012 28
A relatively small share of unbanked households (7.5 percent) cited their dislike or lack of trust in banks as the main reason they were unbanked. Similar proportions of previously banked and never-banked households mentioned trust as the main reason for not having an account.
Reasons for Being Unbanked and Household Characteristics
Many reasons for being unbanked appear to be relatively consistent among demographic groups. Not having enough money and not needing or wanting an account are the top reasons for not having a bank account across all demographic groups.
Some differences exist, though. Hispanic households appear more likely than any other demographic group to cite ID, credit, or banking history problems as the main obstacles to account ownership. Fewer than 5 percent of unbanked black households and unbanked white house-holds do not have an account because of these require-ments (4.8 percent of each group), compared with 11.2 percent of Hispanic households.
In addition, unbanked foreign-born non-citizen house-holds and unbanked households where Spanish is the only language spoken seem particularly challenged by ID, credit, or banking history requirements; for more than 15 percent of unbanked foreign-born non-citizen households and 18.5 percent of households that speak only Spanish, these account opening requirements are the main reason they do not have an account.
Consistent with expectations, the tendency of unbanked households to report that they do not have enough money for an account declines with rising educational achieve-ment, falling from 36.1 percent among unbanked house-holds without a high school degree to 26.3 percent among college-educated unbanked households. However, similar proportions of households across all education groups say they do not need or want an account. As income increases, unbanked households seem less likely to not have an account because they do not have enough money.
Not having enough money for an account seems to be a particularly important obstacle to account ownership for unemployed households; for slightly fewer than half (46.5 percent) of unbanked unemployed households, lack of money is the main reason they do not have an account (compared with 27.2 percent of unbanked employed households and 32.9 percent of those not in the labor force). This, and the fact that only 12 percent of unbanked unemployed households do not have an account because they do not need or want one, implies that unbanked unemployed households might be more open to establishing banking relationships in the future.
Finally, the reasons why households choose not to have a bank account vary depending on where they live. More than 37 percent of unbanked households in the Northeast feel they do not have enough money for an account, compared with 33.5 percent in the South and roughly 30 percent in the Midwest and West.
Detailed Reasons for Being Unbanked
Among the 5.4 percent of unbanked household that choose not to have an account because of high fees or balance requirements, the most common reason for being unbanked is high service charges (40.6 percent), followed by high minimum balance requirements (31.6 percent). Unexpected fees, such as overdraft charges, were the least common reason (24.5 percent) cited. However, this measurement does not include the 6.4 percent of unbanked households that had their account closed by the bank, almost half (45.8 percent) of which had their account closed because of overdrafts or bounced checks.
Among the 6.6 percent of unbanked households that do not have an account because of ID, credit, or banking history problems, the most common reason for not having an account is lack of ID (37.8 percent). A larger share of households that never had an account have challenges with ID or credit or banking history (58.2 percent, data not shown in tables) than those that previously had an account (5.2 percent, data not shown in tables).
Among the small group of unbanked households that find banks “too inconvenient” (1.4 percent), inconvenient hours are more of an obstacle than inconvenient locations (55.9 percent compared with 39.4 percent).
About 7.5 percent of unbanked households do not have an account because they do not like dealing with or do not trust banks. Among these household, 59.4 percent do not trust banks and another 20.4 percent do not feel welcome or comfortable at banks, while only 3.7 percent said language barriers were a challenge (14.8 percent had “other” reasons).
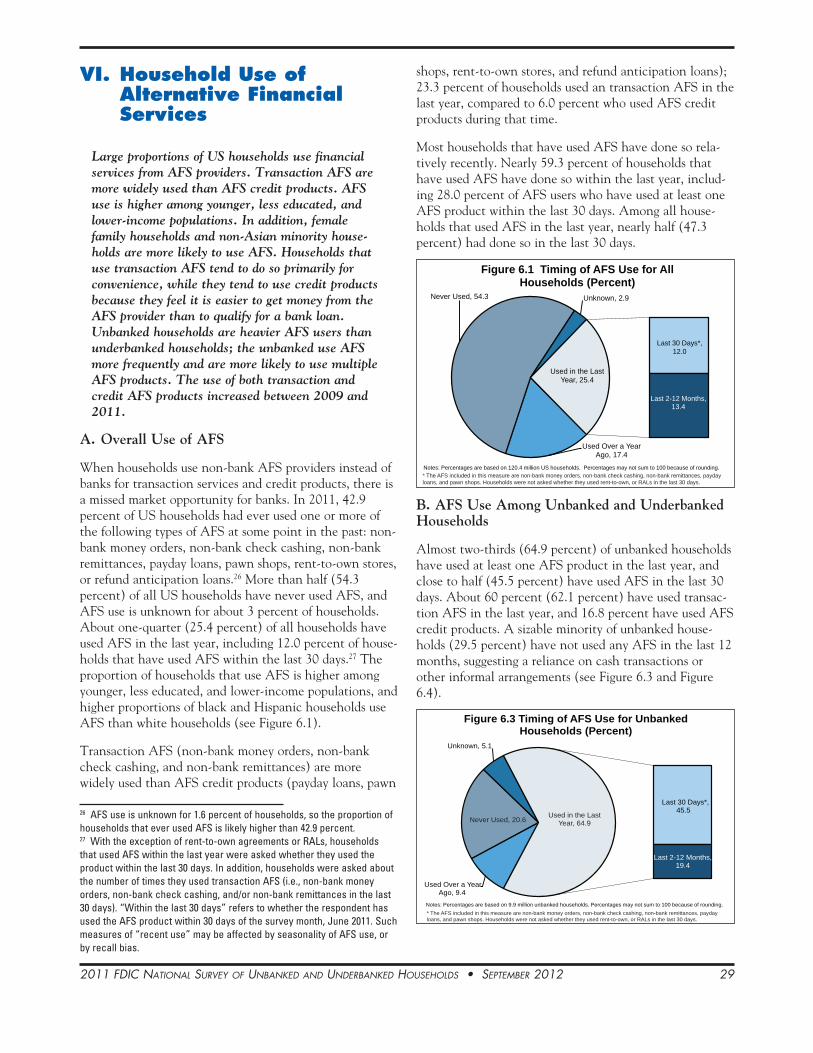
2011 FDIC NatIoNal Survey oF uNbaNkeD aND uNDerbaNkeD HouSeHolDS • September 2012 29
VI. Household Use of Alternative Financial Services
Large proportions of US households use financial services from AFS providers. Transaction AFS are more widely used than AFS credit products. AFS use is higher among younger, less educated, and lower-income populations. In addition, female family households and non-Asian minority house-holds are more likely to use AFS. Households that use transaction AFS tend to do so primarily for convenience, while they tend to use credit products because they feel it is easier to get money from the AFS provider than to qualify for a bank loan. Unbanked households are heavier AFS users than underbanked households; the unbanked use AFS more frequently and are more likely to use multiple AFS products. The use of both transaction and credit AFS products increased between 2009 and 2011.
A. Overall Use of AFS
When households use non-bank AFS providers instead of banks for transaction services and credit products, there is a missed market opportunity for banks. In 2011, 42.9 percent of US households had ever used one or more of the following types of AFS at some point in the past: non-bank money orders, non-bank check cashing, non-bank remittances, payday loans, pawn shops, rent-to-own stores, or refund anticipation loans.26 More than half (54.3 percent) of all US households have never used AFS, and AFS use is unknown for about 3 percent of households. About one-quarter (25.4 percent) of all households have used AFS in the last year, including 12.0 percent of house-holds that have used AFS within the last 30 days.27 The proportion of households that use AFS is higher among younger, less educated, and lower-income populations, and higher proportions of black and Hispanic households use AFS than white households (see Figure 6.1).
Transaction AFS (non-bank money orders, non-bank check cashing, and non-bank remittances) are more widely used than AFS credit products (payday loans, pawn
26 AFS use is unknown for 1.6 percent of households, so the proportion of households that ever used AFS is likely higher than 42.9 percent.27 With the exception of rent-to-own agreements or RALs, households that used AFS within the last year were asked whether they used the product within the last 30 days. In addition, households were asked about the number of times they used transaction AFS (i.e., non-bank money orders, non-bank check cashing, and/or non-bank remittances in the last 30 days). “Within the last 30 days” refers to whether the respondent has used the AFS product within 30 days of the survey month, June 2011. Such measures of “recent use” may be affected by seasonality of AFS use, or by recall bias.
shops, rent-to-own stores, and refund anticipation loans); 23.3 percent of households used an transaction AFS in the last year, compared to 6.0 percent who used AFS credit products during that time.
Most households that have used AFS have done so rela-tively recently. Nearly 59.3 percent of households that have used AFS have done so within the last year, includ-ing 28.0 percent of AFS users who have used at least one AFS product within the last 30 days. Among all house-holds that used AFS in the last year, nearly half (47.3 percent) had done so in the last 30 days.
B. AFS Use Among Unbanked and Underbanked Households
Almost two-thirds (64.9 percent) of unbanked households have used at least one AFS product in the last year, and close to half (45.5 percent) have used AFS in the last 30 days. About 60 percent (62.1 percent) have used transac-tion AFS in the last year, and 16.8 percent have used AFS credit products. A sizable minority of unbanked house-holds (29.5 percent) have not used any AFS in the last 12 months, suggesting a reliance on cash transactions or other informal arrangements (see Figure 6.3 and Figure 6.4).
Last 30 Days*,12.0
Last 2-12 Months, 13.4
Used Over a Year Ago, 17.4
Never Used, 54.3 Unknown, 2.9
Used in the Last Year, 25.4
Figure 6.1 Timing of AFS Use for All Households (Percent)
Notes: Percentages are based on 120.4 million US households. Percentages may not sum to 100 because of rounding. * The AFS included in this measure are non-bank money orders, non-bank check cashing, non-bank remittances, payday loans, and pawn shops. Households were not asked whether they used rent-to-own, or RALs in the last 30 days.
Last 30 Days*, 45.5
Last 2-12 Months, 19.4
Used Over a Year Ago, 9.4
Never Used, 20.6
Unknown, 5.1
Used in the Last Year, 64.9
Figure 6.3 Timing of AFS Use for Unbanked Households (Percent)
Notes: Percentages are based on 9.9 million unbanked households. Percentages may not sum to 100 because of rounding.* The AFS included in this measure are non-bank money orders, non-bank check cashing, non-bank remittances, payday loans, and pawn shops. Households were not asked whether they used rent-to-own, or RALs in the last 30 days.
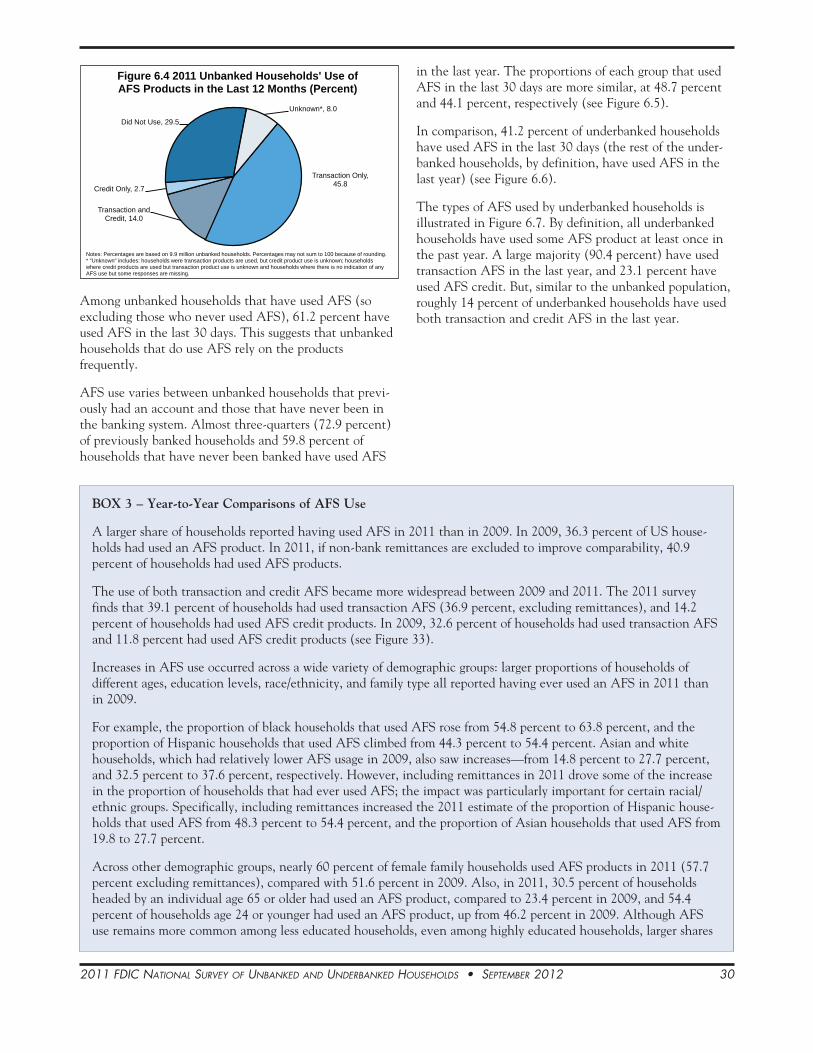
2011 FDIC NatIoNal Survey oF uNbaNkeD aND uNDerbaNkeD HouSeHolDS • September 2012 30
Among unbanked households that have used AFS (so excluding those who never used AFS), 61.2 percent have used AFS in the last 30 days. This suggests that unbanked households that do use AFS rely on the products frequently.
AFS use varies between unbanked households that previ-ously had an account and those that have never been in the banking system. Almost three-quarters (72.9 percent) of previously banked households and 59.8 percent of households that have never been banked have used AFS
Transaction Only, 45.8
Transaction and Credit, 14.0
Credit Only, 2.7
Did Not Use, 29.5
Unknown*, 8.0
Figure 6.4 2011 Unbanked Households' Use of AFS Products in the Last 12 Months (Percent)
Notes: Percentages are based on 9.9 million unbanked households. Percentages may not sum to 100 because of rounding.* "Unknown" includes: households were transaction products are used, but credit product use is unknown; households where credit products are used but transaction product use is unknown and households where there is no indication of any AFS use but some responses are missing.
in the last year. The proportions of each group that used AFS in the last 30 days are more similar, at 48.7 percent and 44.1 percent, respectively (see Figure 6.5).
In comparison, 41.2 percent of underbanked households have used AFS in the last 30 days (the rest of the under-banked households, by definition, have used AFS in the last year) (see Figure 6.6).
The types of AFS used by underbanked households is illustrated in Figure 6.7. By definition, all underbanked households have used some AFS product at least once in the past year. A large majority (90.4 percent) have used transaction AFS in the last year, and 23.1 percent have used AFS credit. But, similar to the unbanked population, roughly 14 percent of underbanked households have used both transaction and credit AFS in the last year.
BOX 3 – Year-to-Year Comparisons of AFS Use
A larger share of households reported having used AFS in 2011 than in 2009. In 2009, 36.3 percent of US house-holds had used an AFS product. In 2011, if non-bank remittances are excluded to improve comparability, 40.9 percent of households had used AFS products.
The use of both transaction and credit AFS became more widespread between 2009 and 2011. The 2011 survey finds that 39.1 percent of households had used transaction AFS (36.9 percent, excluding remittances), and 14.2 percent of households had used AFS credit products. In 2009, 32.6 percent of households had used transaction AFS and 11.8 percent had used AFS credit products (see Figure 33).
Increases in AFS use occurred across a wide variety of demographic groups: larger proportions of households of different ages, education levels, race/ethnicity, and family type all reported having ever used an AFS in 2011 than in 2009.
For example, the proportion of black households that used AFS rose from 54.8 percent to 63.8 percent, and the proportion of Hispanic households that used AFS climbed from 44.3 percent to 54.4 percent. Asian and white households, which had relatively lower AFS usage in 2009, also saw increases—from 14.8 percent to 27.7 percent, and 32.5 percent to 37.6 percent, respectively. However, including remittances in 2011 drove some of the increase in the proportion of households that had ever used AFS; the impact was particularly important for certain racial/ethnic groups. Specifically, including remittances increased the 2011 estimate of the proportion of Hispanic house-holds that used AFS from 48.3 percent to 54.4 percent, and the proportion of Asian households that used AFS from 19.8 to 27.7 percent.
Across other demographic groups, nearly 60 percent of female family households used AFS products in 2011 (57.7 percent excluding remittances), compared with 51.6 percent in 2009. Also, in 2011, 30.5 percent of households headed by an individual age 65 or older had used an AFS product, compared to 23.4 percent in 2009, and 54.4 percent of households age 24 or younger had used an AFS product, up from 46.2 percent in 2009. Although AFS use remains more common among less educated households, even among highly educated households, larger shares

2011 FDIC NatIoNal Survey oF uNbaNkeD aND uNDerbaNkeD HouSeHolDS • September 2012 31
Unbanked households that use transaction AFS do so more frequently than underbanked households. More than 40 percent (41.4 percent) of unbanked households that have used transaction AFS in the last 30 days have used these services three or more times in that timeframe, compared with 19.3 percent of underbanked households. Over half of underbanked households (55.3 percent) that have used transaction AFS in the last 30 days have done so only once, compared with 30.2 percent of unbanked households.
Transaction Only, 75.7
Transaction and Credit, 13.5
Credit Only, 9.4
Use AFS but AFS Type is
Unknown*, 1.4
Figure 6.7 2011 Underbanked Households' Use of AFS Products in the Last 12 Months
(Percent)
Notes: Percentages are based on 24.2 million underbanked households. Percentages may not sum to 100 because of rounding.* "Unknown" includes households where transaction products are used but credit product use is unknown and households where credit products are used but transaction product use is unknown.
48.7
72.9
44.1
59.9
0
10
20
30
40
50
60
70
80
90
100
Used 1 or More AFS in the Last 30 Days* Used 1 or More AFS in the Last Year
Perc
enta
ge o
f Unb
anke
d Ho
useh
olds
Figure 6.5 Timing of AFS Use by Previous Banking Status
Previously Banked Never-Banked
Notes: Percentages are based on 53 million never-banked households and 4.4 million previously banked households.* The AFS included in this measure are non-bank money orders, non-bank check cashing, non-bank remittances, payday loans, and pawn shops. Households were not asked whether they used rent-to-own, or RALs in the last 30 days.
In Last 30 Days*, 41.2
In Last 2-12 Months, 58.8
Figure 6.6 Timing of AFS Use for Underbanked Households (Percent)
Notes: Percentages are based on 24.2 million underbanked households. Percentages may not sum to 100 because of rounding.* The AFS included in this measure are non-bank money orders, non-bank check cashing, non-bank remittances, payday loans, and pawn shops. Households were not asked whether they used rent-to-own, or RALs in the last 30 days.
reported having used AFS in 2011. Almost one-third (32.6 percent) of households with a college degree used AFS in 2011, up from 26.1 percent in 2009 (see Figure 6.2).
11.8
32.6
36.3
14.2
39.1
42.9
0 5 10 15 20 25 30 35 40 45 50
Ever Used CreditAFS
Ever UsedTransaction AFS*
Ever Used AFS*
Percentage of Households
Figure 6.2 Households That Have Ever Used AFS
20112009
* The 2011 survey added non-bank remittances as AFS covered in the survey, and revised questions related to the time frames during which households used AFS. The 2011 and 2009 estimates and therefore not directly comparable.
BOX 3 – Year-to-Year Comparisons of AFS Use (continued)

2011 FDIC NatIoNal Survey oF uNbaNkeD aND uNDerbaNkeD HouSeHolDS • September 2012 32
Use of Multiple AFS Products
The use of two or more types of AFS products may signal an unmet demand for mainstream financial services. Over-all, fewer than one in ten US households (8.4 percent) have used two or more types of AFS products in the last year. Unbanked households are more likely to use multiple types of AFS products than underbanked households. Specifically, 35.5 percent of unbanked households have used two or more types of AFS products in the last year, and 11.8 percent have used three or more, compared with 26.9 percent and 6.9 percent of underbanked households, respectively. This seems to be due to unbanked house-holds’ heavier reliance on transaction products: the share of unbanked households that used two or more transaction services in the last year, at 29.9 percent, is nearly twice as high as the share of underbanked households that have used two or more transaction services in the last year (16.6 percent) (see Table 6.1).
Table 6.1 AFS Use in the Last 12 Months
Unbanked Households
Underbanked Households
Used two or more transaction products 29.9 16.6Used two or more credit products 3.1 4.3Used two or more AFS products in the last
12 months 35.5 26.9
In contrast, neither unbanked nor underbanked house-holds tend to use multiple AFS credit products; just 3.1 percent of unbanked households and 4.3 percent of under-banked households have used more than one type of AFS credit product in the last year.
Looking at multiple AFS users confirms that previously banked households rely more heavily on AFS products than those who have never had an account. The propor-tion of previously banked households that have used two or more types of AFS in the last year is higher (40.1 percent) than the proportion of never-banked households that have done so (32.6 percent).
Unbanked households are also more likely than under-banked households to have used multiple AFS products within the last 30 days: 16.2 percent of unbanked house-holds and 6.2 percent of underbanked households have used two or more types of AFS products within the last 30 days.
Specific Transaction AFS Products
Figures 6.8 to 6.10 illustrate the use of AFS transaction products over the past 12 months, by household banking status. The most commonly used product is the non-bank money order. Nearly one in five (18.3 percent) US house-holds have used a non-bank money order in the last year. The use of non-bank money orders is more common among underbanked households than unbanked house-
holds; 49.1 percent of unbanked and 71.2 percent of underbanked households have used a non-bank money order in the last year (see Figures 6.8 and 6.9).
Non-bank check cashing is used less commonly than money orders. Fewer than one in ten (7.7 percent) house-holds have used check cashing in the last year. In contrast to non-bank money orders, the use of non-bank check cashing is more prevalent among unbanked households: more than one-third (38.0 percent) of unbanked house-holds, compared with 22.8 percent of underbanked house-holds, used non-bank check cashing within the last year. Interestingly, unbanked households’ use of non-bank check cashing increased notably between 2009 and 2011: 39.2 percent of unbanked households had ever used non-bank check cashing in 2009, compared with 47.3 percent in 2011 (see Figures 6.8 and 6.9).
Nearly one-third (32.1 percent) of unbanked households used a non-bank money order in the last 30 days, and one in four (25.0 percent) unbanked households used a non-bank check-cashing service in the last 30 days. In compar-ison, underbanked households used transaction AFS less recently: 28.0 percent used non-bank money orders within the last 30 days, and only 8.9 percent used non-bank check cashers in the last 30 days.
Similar patterns hold when only households that have used a particular service are considered. Among under-banked households that used non-bank money orders, more than one-third (35.3 percent) did so within the 30 days prior to the survey. More than one-quarter (28.4 percent) of underbanked check-cashing customers had used the service within the last month. Nevertheless, unbanked users have relied on AFS even more recently. Among unbanked households that have used non-bank money orders or non-bank check cashing, more than half (54.5 percent and 52.8 percent, respectively) had used the services within the past 30 days.
While some households that used non-bank money orders in the last 30 days purchased them at the post office, this was only true for 22.8 percent of unbanked and 30.6 percent of underbanked households.
Questions about remittance use were asked for the first time in the 2011 survey; 3.7 percent of all US households, including 9.2 percent of unbanked and 14.4 percent of underbanked households, used a non-bank remittance in the last year. Only 3.9 percent of unbanked households and 5.7 percent of underbanked households used a non-bank remittance in the last 30 days. Among households that use remittances about one in three (31.5 percent of unbanked households and 31.4 percent of underbanked households) had done so within the last 30 days. Overall, 5.9 percent of all households, including 12.4 percent of unbanked households and 18.1 percent of underbanked

2011 FDIC NatIoNal Survey oF uNbaNkeD aND uNDerbaNkeD HouSeHolDS • September 2012 33
households, had ever used a non-bank remittance (see Figure 6.10).
Specific Credit AFS Products
The use of AFS credit products is less common than the use of transaction AFS. In the last year, 1.7 percent of US households have used payday lending, 2.9 percent have used pawn shops, 1.5 percent have used rent-to-own and 1.2 percent have used RALs. Looking at those that have
ever used these products, 4.7 percent have used payday lending, 7.4 percent have pawned items at pawn shops to get cash, 4.7 percent have used rent-to-own agreements, and 3.7 percent have used RALs. The use of AFS credit products has increased somewhat from 2009, when 3.6 percent of households had used payday lending, 5.8 had ever sold items at pawn shops, 3.9 percent had used rent-to-own agreements, and 3.0 percent had used RALs (in the previous five years).
1.6
3.4
5.1
9.2
10.5
38.0
49.1
5.7
5.3
6.7
3.1
10.0
9.2
9.7
86.6
84.7
81.6
81.9
72.9
48.1
35.6
6.0
6.6
6.6
5.8
6.6
4.7
5.6
0 20 40 60 80 100
Payday Loan
Refund Anticipation Loan
Rent-to-Own
Remittance
Pawn Shop
Non-Bank Check Cashing
Non-Bank Money Order
Percentage of Unbanked Households
Figure 6.8 2011 Specific AFS Products Used by Unbanked Households in the Last 12 Months
Used in the Last 12 Months Used More Than 12 Months Ago Never used Unknown*
Notes: Percentages are based on 9.9 million unbanked households. Percentages may not sum to 100 because of rounding.* Includes households whose specific AFS use is unknown and those who used specific AFS but the timing is unknown.
Box 4 – Underbanked Households and Money Orders
The FDIC definition of an underbanked household considers the use of non-bank money orders because when households obtain this product outside of the banking system, there is a missed market opportunity for banks. Almost half (48.1 percent) of all underbanked households did not use any alternative financial services other than non-bank money orders in the last year. Of these households, about one-third (34.5 percent) have used a money order in the last 30 days. Of these, more than two-thirds have used a money order only once in the last 30 days.
In contrast, unbanked households tend to use non-bank money orders with other types of AFS, and when money orders are the only AFS used, they are used more heavily relative to underbanked households that use this product alone. One-quarter (25.1 percent) of unbanked households that have used AFS used non-bank money orders and no other AFS products within the last year. Among these unbanked households that have used only a money order in the last year, more than 60 percent (60.9 percent) had done so in the last 30 days.
In some ways, underbanked households that have used money orders along with other AFS products in the last year are similar to underbanked households that have used only money orders. For example, these two groups of under-banked households have similar income distributions; 42.2 percent of underbanked households that have used money orders and other AFS products have incomes below $30,000, as do 39.1 percent of underbanked households that have used money orders exclusively in the last year.
However, the composition of the two groups is different. Specifically, family households, Hispanic households, younger households, and less educated households comprise larger shares of the group of underbanked households that have used money orders and other AFS products, while white households and native-born households account for larger shares of the group of underbanked households that have used only money orders in the last year.

2011 FDIC NatIoNal Survey oF uNbaNkeD aND uNDerbaNkeD HouSeHolDS • September 2012 34
In contrast to transaction services, the use of pawn shops, rent-to-own agreements, and RALs does not differ mark-edly between unbanked and underbanked households, and both unbanked and underbanked users of these products did so within similar timeframes. In the last year, 10.5 percent of unbanked and 10.2 percent of underbanked households have used pawn shops, 5.1 percent of unbanked and 5.4 percent of underbanked households have used rent-to-own, and 3.4 percent of unbanked and 4.6 percent of underbanked households have used RALs. Payday loans were used by 7.9 percent of underbanked and 1.6 percent of unbanked households within the last year. The low use among unbanked households is likely due to the fact that a bank account is often necessary for a customer to obtain a payday loan28 (see Figures 6.11 and 6.12).
28 Although the estimate of payday loan use by unbanked households is greater than zero, this is due in part to households that have previously had an account.
49.1
38.0
9.2
71.2
22.814.4
0
10
20
30
40
50
60
70
80
90
100
Non-Bank Money Order Non-Bank Check Cashing Non-Bank Remittance
Perc
enta
ge o
f Hou
seho
lds
Figure 6.10 2011 Households Using Transaction Products in the Last 12 Months
by Banking Status
Unbanked Underbanked
Note: Percentages are based on 9.9 million unbanked households and 24.2 million underbanked households.
Among all US households, AFS credit products tend not to have been used very recently; for example, 0.7 percent of households, including 0.5 percent of unbanked and 3.2 percent of underbanked households, have used payday lending in the last 30 days. However, among households that have ever used payday lending, 36.7 percent had done so within the last year, including 14.5 percent that had done so within the last 30 days.
Among households that have used rent-to-own agree-ments, 43.1 percent of unbanked households and 41.7 percent of underbanked households had done so within the last year. Usage patterns are similar for unbanked and underbanked RAL users; 38.7 percent of unbanked house-holds and 43.7 percent of underbanked households that have used a RAL had done so within the last year.
Also, 2.7 percent of both unbanked and underbanked households have pawned items at a pawn shop within the last 30 days, and 10.5 percent of unbanked households and
10.5
1.7
5.13.4
10.37.9
5.4 4.6
0
5
10
15
20
25
30
35
Pawn Shop Payday Loan Rent-to-Own Refund AnticipationLoan
Per
cen
tag
e o
f H
ou
seh
old
s
Figure 6.11 2011 Households Using Credit Products in the Last 12 Months
by Banking Status
Unbanked Underbanked
Note: Percentages are based on 9.9 million unbanked households and 24.2 million underbanked hosueholds.
4.6
5.4
7.9
10.2
14.4
22.8
71.2
5.9
7.6
6.7
9.2
3.6
8.5
8.1
88.6
86.3
84.6
79.7
81.5
68.2
20.2
0.8
0.7
0.8
0.8
0.5
0.5
0.4
0 10 20 30 40 50 60 70 80 90 100
Refund Anticipation Loan
Rent-to-Own
Payday Loan
Pawn Shop
Remittance
Non-Bank Check Cashing
Non-Bank Money Order
Percentage of Underbanked Households
Figure 6.9 2011 Specific AFS Products Used by Underbanked Households in the Last 12 Months
Used in the Last 12 Months Used More Than 12 Months Ago Never Used Unknown*
Notes: Percentages are based on 24.2 million underbanked households. Percentages may not sum to 100 because of rounding. * Includes households whose specific AFS use is unknown and those who used specific AFS but the timing is unknown.

2011 FDIC NatIoNal Survey oF uNbaNkeD aND uNDerbaNkeD HouSeHolDS • September 2012 35
Box 5 – Payroll and Prepaid Cards (see Figures 6.13 and 6.14)
General purpose reloadable prepaid cards (prepaid cards) and payroll cards were not among the financial services considered when defining underbanked households.1 However, to the extent that consumers use prepaid and payroll cards issued by non-banks providers, there is a missed market opportunity for banks. In fact, almost half (49.2 percent) of unbanked households that have used a prepaid card report being likely to open an account in the future. This survey does not distinguish between cards provided by banks and those provided by non-banks. Nonetheless, it is interesting to analyze consumer use of these products.
One in ten (10.1 percent) households has used a general purpose reloadable prepaid card. Prepaid card use is higher among households that do not have a checking account than those that have a checking account (16.5 percent versus 9.3 percent). Prepaid card use does not differ with savings account ownership.
Prepaid card use among all households seems to be relatively stable from 2009, when 9.9 percent of households had used a prepaid card. However, the proportion of unbanked households that have used a prepaid card climbed from 12.2 percent to 17.8 percent in 2011. The share of underbanked households that reported ever using a prepaid card went from 16.4 percent in 2009 to 17.4 percent in 2011(not statistically significant). The proportion of households that are fully banked which have used a prepaid card decreased slightly from 8.1 percent in 2009 to 7.3 percent in 2011.
Among all households, 3.2 percent currently receive wages on a payroll card, compared with 3.0 percent in 2009. Payroll cards are more prevalent among unbanked and underbanked households, where they are used by 5.5 percent and 5.3 percent of households, respectively.
More than one in three prepaid card users (34.7 percent) are underbanked and 14.5 percent are unbanked. Simi-larly, among payroll card users, 32.8 percent are underbanked and 14.1 percent are unbanked.
1 General purpose reloadable prepaid cards are debit cards that are loaded with funds and branded with a payment network logo. Funds can be added to the cards as needed, and they can be used where the payment network brand is accepted. Payroll cards are cards into which employers deposit salary payments instead of providing checks or cash to employees.
10.2 percent of underbanked households have pawned items within the last year. Among users, 13.1 percent of unbanked households and 13.7 percent of underbanked households pawned items at pawn shops within the last 30 days.
C. Bank Account Ownership and AFS Use
Among banked households (both underbanked and fully banked households), AFS use varies with the types of
32.1
25.0
3.9
0.52.7
28.0
8.95.7
3.2 2.7
0
5
10
15
20
25
30
35
Non-BankMoney Order
Non-Bank CheckCashing
Non-BankRemittance
Payday Loan Pawn Shop
Per
cent
age
of H
ouse
hold
s
Figure 6.12 2011 Households Using AFS Products in the Last 30 Days
by Banking Status
Unbanked Underbanked
Note: Percentages are based on 9.9 million unbanked households and 24.2 million underbanked households.
bank accounts owned. Households that have both check-ing and savings accounts have relied on AFS less recently than those that have just one type of account. AFS prod-ucts were used in the last year by one-fifth (18.7 percent) of households that have both checking and savings accounts. Among households with a checking account but not a savings account, 29.7 percent used AFS in the last year, including 13.0 percent that used AFS in the last 30 days. Households that have a savings account but not a checking account relied on AFS more recently than those that have a checking account; more than half (54.5 percent) of households that have a savings account but not a checking account used AFS in the last year, includ-ing 36.2 percent that used AFS in the last 30 days (see Figure 6.15).
As expected, households that do not have a checking account rely more heavily on transaction AFS than those with checking accounts. More than half (59.6 percent) of all households that do not have a checking account used transaction AFS in the last year, compared with 19.3 percent of households with a checking account. Notably, this means that one in five households with a checking account still rely on AFS provider for transaction services.
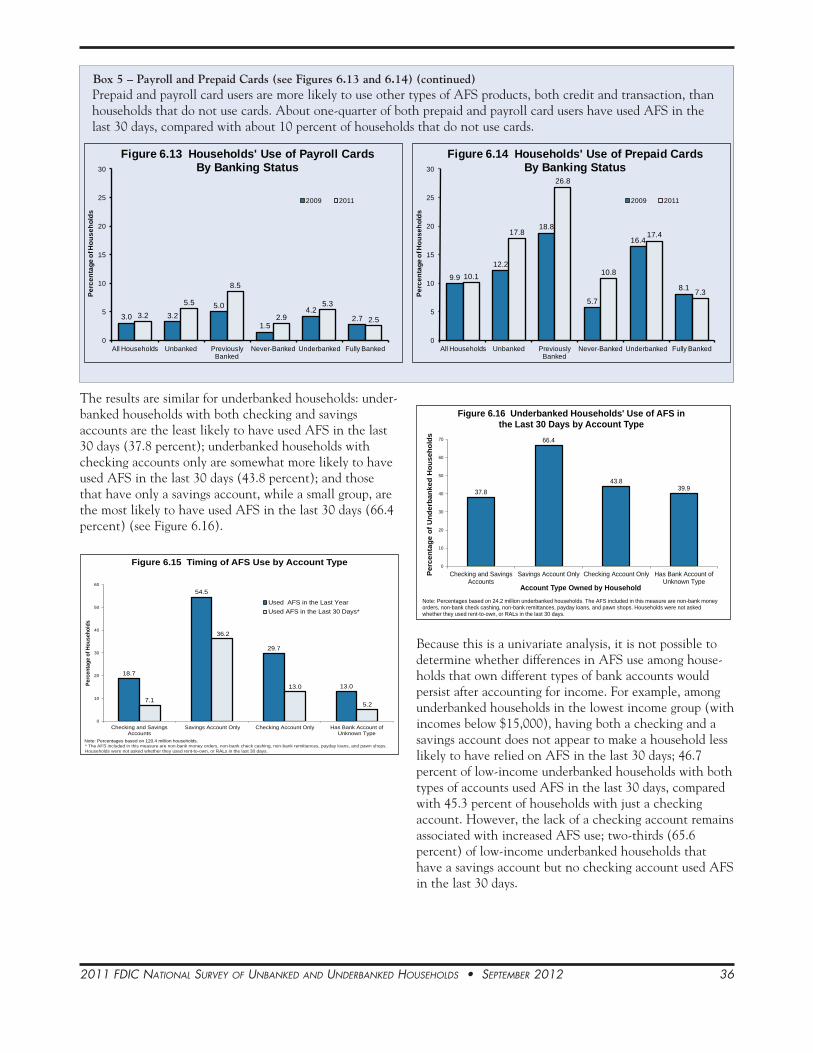
2011 FDIC NatIoNal Survey oF uNbaNkeD aND uNDerbaNkeD HouSeHolDS • September 2012 36
The results are similar for underbanked households: under-banked households with both checking and savings accounts are the least likely to have used AFS in the last 30 days (37.8 percent); underbanked households with checking accounts only are somewhat more likely to have used AFS in the last 30 days (43.8 percent); and those that have only a savings account, while a small group, are the most likely to have used AFS in the last 30 days (66.4 percent) (see Figure 6.16).
18.7
54.5
29.7
13.0
7.1
36.2
13.0
5.2
0
10
20
30
40
50
60
Checking and SavingsAccounts
Savings Account Only Checking Account Only Has Bank Account ofUnknown Type
Perc
enta
ge o
f Hou
seho
lds
Figure 6.15 Timing of AFS Use by Account Type
Used AFS in the Last YearUsed AFS in the Last 30 Days*
Note: Percentages based on 120.4 million households.* The AFS included in this measure are non-bank money orders, non-bank check cashing, non-bank remittances, payday loans, and pawn shops. Households were not asked whether they used rent-to-own, or RALs in the last 30 days.
Because this is a univariate analysis, it is not possible to determine whether differences in AFS use among house-holds that own different types of bank accounts would persist after accounting for income. For example, among underbanked households in the lowest income group (with incomes below $15,000), having both a checking and a savings account does not appear to make a household less likely to have relied on AFS in the last 30 days; 46.7 percent of low-income underbanked households with both types of accounts used AFS in the last 30 days, compared with 45.3 percent of households with just a checking account. However, the lack of a checking account remains associated with increased AFS use; two-thirds (65.6 percent) of low-income underbanked households that have a savings account but no checking account used AFS in the last 30 days.
37.8
66.4
43.839.9
0
10
20
30
40
50
60
70
Checking and SavingsAccounts
Savings Account Only Checking Account Only Has Bank Account ofUnknown Type
Perc
enta
ge o
f Und
erba
nked
Hou
seho
lds
Account Type Owned by Household
Figure 6.16 Underbanked Households' Use of AFS in the Last 30 Days by Account Type
Note: Percentages based on 24.2 million underbanked households. The AFS included in this measure are non-bank money orders, non-bank check cashing, non-bank remittances, payday loans, and pawn shops. Households were not asked whether they used rent-to-own, or RALs in the last 30 days.
Prepaid and payroll card users are more likely to use other types of AFS products, both credit and transaction, than households that do not use cards. About one-quarter of both prepaid and payroll card users have used AFS in the last 30 days, compared with about 10 percent of households that do not use cards.
3.0 3.25.0
1.5
4.22.73.2
5.5
8.5
2.9
5.3
2.5
0
5
10
15
20
25
30
All Households Unbanked Previously Banked
Never-Banked Underbanked Fully Banked
Perc
enta
ge o
f Hou
seho
lds
Figure 6.13 Households' Use of Payroll Cards By Banking Status
2009 2011
9.9
12.2
18.8
5.7
16.4
8.110.1
17.8
26.8
10.8
17.4
7.3
0
5
10
15
20
25
30
All Households Unbanked Previously Banked
Never-Banked Underbanked Fully Banked
Perc
enta
ge o
f Hou
seho
lds
Figure 6.14 Households' Use of Prepaid Cards By Banking Status
2009 2011
Box 5 – Payroll and Prepaid Cards (see Figures 6.13 and 6.14) (continued)
2011 FDIC NatIoNal Survey oF uNbaNkeD aND uNDerbaNkeD HouSeHolDS • September 2012 37
(18.4 percent), while the second most common reason for using non-bank money orders is that “a bank charges more” (28.0 percent) (see Figure 6.17).
Among unbanked households, the most commonly cited reason for using non-bank check cashing was the fact that the household does not have a bank account (38.9 percent); convenience was the next most common reason (28.7 percent). These were also the most common reasons for unbanked households’ use of non-bank money orders, although the order was reversed: the most common reason for using non-bank money orders was convenience (39.1 percent), and the second most common reason was that the household does not have a bank account (27.3 percent) (see Figure 6.18).
Convenience and speed were also the most common reasons why households use non-bank remittances: 32.5 percent of all households that used remittances did so for increased convenience over banks, 23.5 percent thought the AFS provider would get the money to its recipient faster, and 11.0 percent perceive that banks charge more to send money abroad. Convenience was cited most often by underbanked households and fully banked households. Again, the fact that unbanked households do not have a banking relationship is a common reason why these households use AFS providers for remittances (29.5 percent) (see Figure 6.19).
Reasons Households Use AFS Credit Products
Households that have patronized payday lenders or pawn-shops most commonly do so because it is easier to get payday loans or to get money from a pawn shop than to qualify for a bank loan. This was cited as the main reason by about 40 percent of both payday loan and pawn shop users.
Convenience is not cited as commonly as a reason for AFS credit product use as it is for AFS transaction use; roughly 10 percent of payday loan and pawn shop users do so primarily for convenience. Again, these results are simi-lar to those from the 2009 survey (see Figures 6.20 and 6.21).
Notably, a relatively large proportion of households that use AFS credit, about one in five, do so because they perceive that banks do not provide small-dollar loans; 17.5 percent of households that used pawn shops and 20.0 percent of households that used payday loans did so primarily because they thought they could not get small-dollar loans from a bank.
The 2011 survey asked households that had used credit AFS in the last year to report the main reason they needed the funds. Results show that more households that used AFS credit did so to pay for basic living expenses
Specific Types of AFS and Bank Account Ownership
As was the case with AFS use generally, use of specific AFS products varies depending on the type of bank account held by a household. These differences are more pronounced between households with or without checking accounts than between households with or without savings accounts They are also more pronounced for trans-action AFS than for credit AFS.
Households with both checking and savings accounts are the least likely to have used any individual AFS product in the last year or the last 30 days. Again, this is most notable for transaction services. For example, 13.3 percent of banked households with both types of accounts used a non-bank money order in the last year, compared with 20.8 percent of those who only have a checking account and 44.8 percent of those with only a savings account. Further, 4.1 percent of households with both a checking and savings account used non-bank check cashing in the last year, compared with 7.3 percent of those with just a checking account and 11.7 percent of those with a savings account only.
The association between having both types of bank accounts and being less likely to have used AFS in the last 30 days is more pronounced within higher income groups than lower income groups. Among the lowest income underbanked households, those with both savings and checking accounts are no less likely, and sometimes slightly more likely, than those with just one type of account to use individual AFS products.
Within higher income groups, however, AFS use varies by account ownership, especially for credit products. For example, among the highest income underbanked house-holds, the share of households with only checking accounts that used a payday loan in the last year was 9.2 percent (data not shown in tables), nearly twice the share of households with both checking and savings accounts that used payday lending in the last year (4.7 percent, data not shown in tables).
D. Reasons Households Use AFS
Reasons Households Use Transaction AFS
Among households that have used transaction AFS, the most commonly cited reason for using non-banks instead of banks was convenience, given by 45.2 percent of all households that used non-bank check cashing and 56.0 percent of all households that used non-bank money orders. These results are similar to those reported in 2009. Convenience was the most common reason given by both underbanked and fully banked households. Among under-banked households, the second most common reason for using non-bank check cashing is “to get money faster”

2011 FDIC NatIoNal Survey oF uNbaNkeD aND uNDerbaNkeD HouSeHolDS • September 2012 38
than in 2009, suggesting a rise in financial distress. Nearly half (45.5 percent) of all households that had used some form of AFS credit product in the last 12 months did so to pay for basic living expenses, up from 34.5 percent in 2009, and 17.5 percent of households that used AFS credit products indicated a need to make up for lost income. One in ten households (11.3 percent) that used AFS credit did so to pay for a specific house repair, car repair, or appliance purchase. Unbanked households are more likely than underbanked households to turn to AFS providers to pay for living expenses; the proportions are 53.6 percent and 43.0 percent, respectively (see Figure 6.22).
E. Descriptions of AFS Users
Previous sections of this report discussed how groups with different banking status and demographic traits use AFS products. This section explores subsets of households that rely more heavily on AFS. It confirms the finding that unbanked households are heavier AFS users than under-banked households. In many cases, the same consumer segments that are overrepresented among unbanked and underbanked households are also overrepresented among heavy AFS users.
In the survey, “recent” AFS users are as those who have used AFS credit or transaction product in the past 30
1.9
4.2
1.6
2.5
2.4
1.9
6.6
38.9
11.3
28.7
1.1
9.6
0.9
1.0
1.6
2.1
3.4
10.1
18.4
51.8
0 20 40 60
Don't Know/ Refused
Other
The place to cash checks asks for fewer IDs
Do not trust banks
Banks don't cash checks
Feel more comfortable than at a bank
Bank charges more to cash checks
Don't have a bank account
To get money faster
The place is more convenient
Percentage of Households That Have Ever Used Non-Bank Check Cashing
Figure 6.17 2011 Primary Reason Households Have Ever Used Non-Bank Check Cashing
Underbanked Unbanked
Notes: Percentages based on 4.6 million unbanked households and 7.6 million underbanked households that have ever used non-bank check cashing. Percentages may not sum to 100 because of rounding.
0.9
5.2
2.3
27.3
3.8
2.0
19.4
39.1
0.9
9.3
0.4
1.7
2.5
2.5
28.0
54.7
0 20 40 60
Don't Know/ Refused
Other
Do not trust banks
Don't have a bank account
The place feels more comfortable than a bank
Banks do not sell money orders
Banks charge more for money orders
The place to purchase money orders is moreconvenient
Percentage of Households That Have Ever Used Non-Bank Money Orders
Figure 6.18 2011 Primary Reason Households Have Ever Used Non-Bank Money Order
Underbanked Unbanked
Notes: Percentages based on 5.8 million unbanked households and 19.2 million underbanked households that have ever used non-bank money orders. Percentages may not sum to 100 because of rounding.

2011 FDIC NatIoNal Survey oF uNbaNkeD aND uNDerbaNkeD HouSeHolDS • September 2012 39
Among households that have used transaction AFS in the last 30 days, more than one-quarter (26.5 percent) have done so three or more times; however, usage differs between unbanked and underbanked households. Among underbanked households that have used transaction AFS in the last 30 days, 19.3 percent have done so three or more times, compared with 41.4 percent of unbanked households.
Correlations exist between recent AFS use and the use of multiple AFS products. Almost half (47.6 percent) of households that have used AFS in the last 30 days have used multiple AFS products in the last year.
Generally, the reasons households use specific AFS prod-ucts does not vary with the timeframe in which the AFS were used, but underbanked households that use money orders more frequently are more likely to do so because they feel that money orders are more expensive at banks. One-third of underbanked households that used money orders in the last 30 days did so because they feel banks charge more for money orders; this compares with 26.1 percent of underbanked households that used money orders in the last year but not in the last 30 days, and 21.0 percent of underbanked households that used money orders in the more distant past (data not shown in tables).
Households That Use Multiple AFS
As previously reported, less than one in ten (8.4 percent) US households have used multiple (two or more) types of AFS products within the last year; these households are among the heaviest AFS users. Among households that have used two or more types of AFS products in the last year, about one-third are unbanked and two-thirds are
days. Recent AFS use could signal a greater unmet demand for mainstream financial services than is present among households that have not used AFS as recently. In addition, households that have used more than one type of AFS product in the last year likely have higher levels of demand for transaction services or credit products that are not being met by banks. Understanding the characteristics of these groups of comparatively heavy AFS users could help identify market opportunities for financial institutions.
Households That Have Used AFS in the Last 30 Days
More than one in ten (12.0 percent) US households have used AFS in the last 30 days. The demographic groups that tend be overrepresented among the unbanked and underbanked also tend to be overrepresented among recent AFS users. Notably, this group has relatively high levels of bank account ownership, especially checking account ownership. Among households that have used AFS in the last 30 days, almost one-third (31.0 percent) are unbanked, but almost two-thirds of this group (62.6 percent) have a checking account. Savings accounts are less prevalent; only 39.5 percent of recent users have both checking and savings accounts.
Within underbanked households, our findings show differ-ences between households that have used AFS in the last 30 days and those that have used AFS in the last year, but not in the last 30 days. Black and Hispanic households, less educated households, lower-income households, and non-homeowners are more heavily represented among the underbanked households that have used AFS most recently.
1.7
2.9
2.7
29.5
8.4
3.7
6.9
19.2
25.0
1.3
10.5
0.7
1.8
5.1
9.4
13.0
25.0
33.2
0 10 20 30 40 50 60
Don't Know/ Refused
Other
Do not trust banks
Don’t have a bank account
The place to give or send money feels morecomfortable than a bank
Banks don’t send money abroad
A bank charges more to send money abroad
The money gets there faster
The place to give or send money has moreconvenient hours or location
Percentage of Households That Have Ever Used Non-Bank Remittances
Figure 6.19 2011 Primary Reason Households Have Ever Used Non-Bank Remitances
Underbanked Unbanked
Notes: Percentages based on 1.2 million unbanked households and 4.4 million underbanked households that have ever used non-bank remittances. Percentages may not sum to 100 because of rounding.

2011 FDIC NatIoNal Survey oF uNbaNkeD aND uNDerbaNkeD HouSeHolDS • September 2012 40
1.9
6.5
4.1
0.6
9.8
25.2
17.6
34.2
1.9
7.4
0.3
1.7
13.0
13.6
19.7
42.3
0 10 20 30 40 50 60
Don't know/ Refused
Other
Do not trust banks
Payday loan service feels morecomfortable than a bank
The payday loan place is moreconvenient
Don't qualify for bank loan
Banks don't make small-dollarloans
Easier to get a payday loan than toqualify for a bank loan
Percentage of Households That Have Ever Used Payday Loans
Figure 6.20 2011 Primary Reason Households Have Ever Used Payday Loans
Underbanked Unbanked
Notes: Percentages based on 0.7 million unbanked households and 3.5 million underbanked households that have ever used payday loans. Percentages may not sum to 100 because of rounding.
0.3
4.1
2.2
3.1
10.1
12.8
26.8
40.6
1.0
9.3
2.4
0.6
10.0
19.2
15.6
41.8
0 10 20 30 40 50 60
Don't know/ Refused
Other
More comfortable at a pawn shop thanat a bank
Do not trust banks
The pawn shop is more convenient
Banks don't have small loans
Don't qualify for a bank loan
Easier to get money from pawn shopthan qualify for bank loan
Percentage of Households That Have Ever Used a Pawn Shop
Figure 6.21 2011 Primary Reason Households Have Ever Used Pawn Shops
Underbanked Unbanked
Notes: Percentages based on 2.0 million unbanked households and 4.7 million underbanked households that have ever used pawn shops. Percentages may not sum to 100 because of rounding.
underbanked (35.0 percent and 65.0 percent, respectively).
Households that used two or more types of AFS in the last year are less likely than other households to have check-ing and savings accounts: 60.5 percent of households that used two or more types of AFS in the last year have checking accounts, and 37.9 percent have both checking and savings accounts. However, these results are largely driven by the fact that unbanked households tend to use multiple AFS products (see Figure 6.26). Underbanked households that have used two or more types of AFS in the last year are almost as likely as those that have used just one type of the AFS in the last year to have checking and savings accounts.
Unbanked Household, 35.0
Checking and Savings
Accounts, 37.9
Savings Account Only, 4.1
Checking Account Only, 22.6
Has Bank Account of
Unknown Type, 0.4
Figure 6.26 2011 Distribution of Households That Used Two or More AFS in the Last Year
by Account Type (Percent)
Notes: Percentages are based on 10.3 million households that used 2 or more AFS in the last 12 months. Percentages may not sum to 100 because of rounding.

2011 FDIC NatIoNal Survey oF uNbaNkeD aND uNDerbaNkeD HouSeHolDS • September 2012 41
Married Couple Family,
35.3
Unmarried Female Family,
26.8
Unmarried Male Family,
9.4
Individual Female
Household, 10.9
Individual Male Household,
17.7
Figure 6.28 2011 Distribution of Households That Used Two or More AFS in the Last Year
by Household Type (Percent)
Notes: Percentages are based on 10.3 million households that used 2 or more AFS in the last 12 months. Percentages may not sum to 100 because of rounding.
Less than 35,38.9
Age 35-44,22.8
Age 45-54,20.9
Age 55-64,11.7
Age 65+,5.7
Figure 6.29 2011 Distribution of Households Using Two or More AFS in the Last Year
by Age (Percent)
Notes: Percentages are based on 10.3 million households that have used 2 or more AFS in the last 12 months. Percentages may not sum to 100 because of rounding.
Certain demographic groups are overrepresented among households that have used multiple AFS within the last year. The patterns seen among multiple AFS users are similar to those seen among the most recent AFS users, and among underbanked households in general, with black and Hispanic households, non-citizen households, younger households, less educated households, and lower income households comprising larger shares. It is notable that, among unbanked households in particular, family households make up a larger share of households that use multiple AFS than households that do not use AFS, implying a particularly strong need for transaction and credit products and services among unbanked families (see Figures 6.27-6.29).
Black,29.7
Hispanic,24.3
Asian,1.9
American Indian/ Alaskan,
1.8
Hawaiian/ Pacific Islander,
0.3
White Non-Hispanic,
42.0
Figure 6.27 2011 Distribution of Households That Used Two or More AFS in the Last Year
by Race and Ethnicity (Percent)
Notes: Percentages are based on 10.3 million households that have used 2 or more AFS in the last 12 months. Percentages may not sum to 100 because of rounding.
3.4
7.5
0.1
0.9
1.6
4.3
9.5
19.1
53.6
4.3
13.8
0.6
2.5
2.2
4.7
11.8
17.1
43.0
0 10 20 30 40 50 60
Don't know/ Refused
Other
For legal expenses
For medical, dental or deathexpenses
For school or childcareexpenses
For special gifts or luxuries
For house or car repairs or tobuy an appliance
To make up for job loss ordecrease in income
For basic living expenses
Percentage of Households That Have Ever Used AFS Credit
Figure 6.22 2011 Primary Reason Households Need Funds from AFS Credit Products
Underbanked Unbanked
Notes: Percentages based on 1.6 million unbanked households and 5.6 million underbanked households that have ever used credit AFS. Percentages may not sum to 100 because of rounding.

2011 FDIC NatIoNal Survey oF uNbaNkeD aND uNDerbaNkeD HouSeHolDS • September 2012 42
and payroll cards are seen among both unbanked and underbanked households.
The use of prepaid cards is correlated with the use of multiple AFS products. One in four households (25.4 percent) that have used multiple AFS products in the last year also have used a prepaid card, compared with fewer than one in ten households (8.9 percent) that are not multiple AFS users. The use of multiple AFS products is also associated with the use of payroll cards. The share of households that have used multiple AFS products in the last year and receive wages on payroll cards, at 7.6 percent, is more than twice as large as the share of house-holds that have not used multiple AFS products and receive wages on payroll cards (2.5 percent). The correla-tions between multiple AFS use and the use of prepaid
Box 6 – Characteristics of Households That Have Used AFS in the Last 30 Days (see Figures 6.23-6.25)
• 14.5 percent are foreign non-citizen households.
• One-quarter (25.2 percent) are unmarried female families.
• One-quarter (24.7 percent) are headed by a householder that has not graduated from high school.
• Almost one-third (30.2 percent) have incomes below $15,000.
• 44.4 percent live in the South.
• 29.1 percent are black and 23.5 percent are Hispanic.
Black29.1
Hispanic23.5
Asian2.0
American Indian/ Alaskan
1.9
Hawaiian/ Pacific Islander
0.3
White Non-Hispanic
43.1
Figure 6.23 2011 Distribution of Households Using AFS in the Last 30 Days by Race and
Ethnicity (Percent)
Notes: Percentages are based on 14.5 million households that used AFS in the last 30 days. Percentages may not sum to 100 because of rounding.
Married Couple Family, 36.1Unmarried
Female Family, 25.2
Unmarried Male Family, 8.1
Unmarried Female, 13.3
Unmarried Male, 17.2
Other, 0.1
Figure 6.24 2011 Distribution of Households Using AFS in the Last 30 Days by Household
Type (Percent)
Notes: Percentages are based on 14.5 million households that used AFS in the last 30 days. Percentages may not sum to 100 because of rounding.
Less than 35, 33.3
Age 35-44, 21.4
Age 45-54, 21.3
Age 55-64, 14.3
Age 65 or Older, 9.7
Figure 6.25 2011 Distribution of Households Using AFS in the Last 30 Days by Age
(Percent)
Notes: Percentages are based on 14.5 million households that used AFS in the last 30 days. Percentages may not sum to 100 because of rounding.
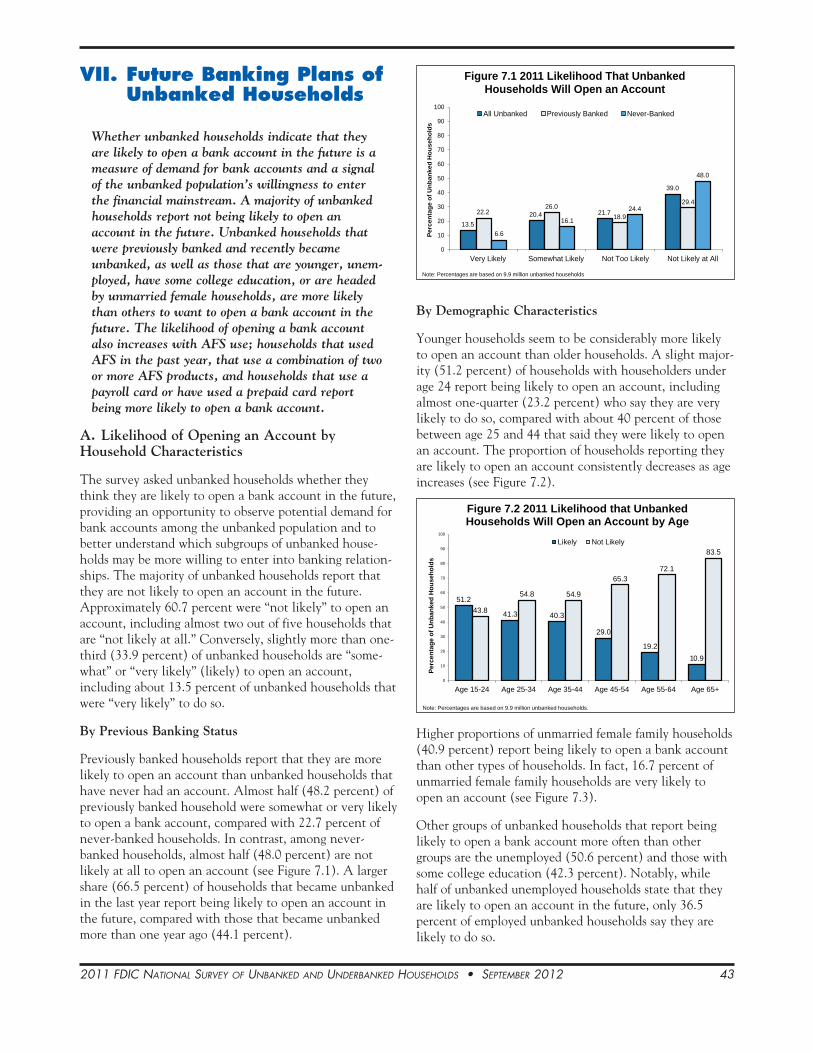
2011 FDIC NatIoNal Survey oF uNbaNkeD aND uNDerbaNkeD HouSeHolDS • September 2012 43
By Demographic Characteristics
Younger households seem to be considerably more likely to open an account than older households. A slight major-ity (51.2 percent) of households with householders under age 24 report being likely to open an account, including almost one-quarter (23.2 percent) who say they are very likely to do so, compared with about 40 percent of those between age 25 and 44 that said they were likely to open an account. The proportion of households reporting they are likely to open an account consistently decreases as age increases (see Figure 7.2).
Higher proportions of unmarried female family households (40.9 percent) report being likely to open a bank account than other types of households. In fact, 16.7 percent of unmarried female family households are very likely to open an account (see Figure 7.3).
Other groups of unbanked households that report being likely to open a bank account more often than other groups are the unemployed (50.6 percent) and those with some college education (42.3 percent). Notably, while half of unbanked unemployed households state that they are likely to open an account in the future, only 36.5 percent of employed unbanked households say they are likely to do so.
13.520.4 21.7
39.0
22.226.0
18.9
29.4
6.6
16.1
24.4
48.0
0
10
20
30
40
50
60
70
80
90
100
Very Likely Somewhat Likely Not Too Likely Not Likely at All
Perc
enta
ge o
f Unb
anke
d H
ouse
hold
s
Figure 7.1 2011 Likelihood That Unbanked Households Will Open an Account
All Unbanked Previously Banked Never-Banked
Note: Percentages are based on 9.9 million unbanked households
51.2
41.3 40.3
29.0
19.210.9
43.8
54.8 54.9
65.372.1
83.5
0
10
20
30
40
50
60
70
80
90
100
Age 15-24 Age 25-34 Age 35-44 Age 45-54 Age 55-64 Age 65+
Perc
enta
ge o
f Unb
anke
d H
ouse
hold
s
Figure 7.2 2011 Likelihood that Unbanked Households Will Open an Account by Age
Likely Not Likely
Note: Percentages are based on 9.9 million unbanked households.
VII. Future Banking Plans ofUnbanked Households
Whether unbanked households indicate that they are likely to open a bank account in the future is a measure of demand for bank accounts and a signal of the unbanked population’s willingness to enter the financial mainstream. A majority of unbanked households report not being likely to open an account in the future. Unbanked households that were previously banked and recently became unbanked, as well as those that are younger, unem-ployed, have some college education, or are headed by unmarried female households, are more likely than others to want to open a bank account in the future. The likelihood of opening a bank account also increases with AFS use; households that used AFS in the past year, that use a combination of two or more AFS products, and households that use a payroll card or have used a prepaid card report being more likely to open a bank account.
A. Likelihood of Opening an Account by Household Characteristics
The survey asked unbanked households whether they think they are likely to open a bank account in the future, providing an opportunity to observe potential demand for bank accounts among the unbanked population and to better understand which subgroups of unbanked house-holds may be more willing to enter into banking relation-ships. The majority of unbanked households report that they are not likely to open an account in the future. Approximately 60.7 percent were “not likely” to open an account, including almost two out of five households that are “not likely at all.” Conversely, slightly more than one-third (33.9 percent) of unbanked households are “some-what” or “very likely” (likely) to open an account, including about 13.5 percent of unbanked households that were “very likely” to do so.
By Previous Banking Status
Previously banked households report that they are more likely to open an account than unbanked households that have never had an account. Almost half (48.2 percent) of previously banked household were somewhat or very likely to open a bank account, compared with 22.7 percent of never-banked households. In contrast, among never-banked households, almost half (48.0 percent) are not likely at all to open an account (see Figure 7.1). A larger share (66.5 percent) of households that became unbanked in the last year report being likely to open an account in the future, compared with those that became unbanked more than one year ago (44.1 percent).

2011 FDIC NatIoNal Survey oF uNbaNkeD aND uNDerbaNkeD HouSeHolDS • September 2012 44
By Use of Payroll and Prepaid Cards
The use of payroll and general purpose reloadable prepaid cards is also positively correlated with the likelihood of opening a bank account. A higher proportion (50.4 percent) of households that currently receive income through a payroll card state that they are more likely to open a bank account in the future than households that do not currently use a payroll card (34.3 percent). In addi-tion, larger shares (49.2 percent) of unbanked households that have used a prepaid card report being likely to open an account than unbanked households that have never used a prepaid card (32.0 percent).
B. Reasons for Opening a Bank Account
In addition to examining whether unbanked households have an interest in opening an account in the future, the survey asked those households that are somewhat or very likely to open an account why they would want to do so. The main reasons unbanked households are interested in opening an account are “to write checks and pay bills” (29.7 percent), “to put money in a safe place” (27.4 percent), and “to save money for the future” (23.8 percent), although responses vary among subgroups.
By Banking Status
Households that have previously had an account and those that have never been banked have similar reasons for wanting to open an account (among those that are likely to do so). One difference is that among never-banked households, the ability to write checks and pay bills is a top reason for wanting to open an account, noted by 30.8 percent of households, but the desire to secure the money is equally important (31 percent) (see Figure 7.5).
By Demographic Characteristic
Compared with other racial and ethnic groups, a higher proportion of white unbanked households are likely to open a bank account because they want the ability to write checks and pay bills (35.0 percent), while black unbanked households cite the three top reasons with equal frequencies (28 percent). Hispanics prioritize the desire to put money in a safe place (31.7 percent), and somewhat smaller shares say they want an account to write checks and pay bills (24.7 percent). Among unbanked households that are likely to open an account, foreign-born citizen households (45.4 percent) and households that only speak Spanish (35.0 percent) were particularly motivated by the desire to secure their money.
Understanding the demographic characteristics of house-holds that are likely to open an account along with their reasons for wanting to do so can help tailor the outreach and product offerings used to bring these consumers into
Conversely, among other groups of unbanked households, relatively large shares were not likely (“not very likely” or “not likely at all”) to open an account in the future. These include non-family households (64.6 percent), particularly unbanked female individuals (67.2 percent), households with householders age 55 or older (over 75 percent), less educated households (more than two-thirds (67.3 percent) of households with no high school degree), and those not in the labor force (68.9 percent).
By Use of AFS
AFS use, particularly the use of credit AFS, is positively correlated with the likelihood of opening a bank account in the future. Among households that have used AFS in the past, 38.9 percent report being likely to open a bank account in the future, compared with only 21.4 percent of households that have never used AFS. More specifically, households that have used AFS in the last year are more likely (39.4 percent) to open a bank account in the future than those that have never used AFS or have not used any in the last year (26.1 percent). In particular, more than half (50.9 percent) of the households that used credit AFS within the last 12 months are likely to open a bank account (see Figure 7.4).
40.9 37.932.1 32.0
24.7
54.8 56.763.5 62.6
67.2
0
10
20
30
40
50
60
70
80
90
100
Unmarried FemaleFamily
Unmarried MaleFamily
Married Couple Individual MaleHousehold
Individual FemaleHousehold
Perc
enta
ge o
f Unb
anke
d H
ouse
hold
s
Figure 7.3 2011 Likelihood that Unbanked Households Will Open an Account by
Household TypeLikely Not Likely
Note: Percentages are based on 9.9 million unbanked households.
39.4
50.9
39.3
26.132.2
27.2
0
10
20
30
40
50
60
70
80
90
100
Any AFS Credit AFS Transaction AFSPerc
enta
ge o
f Hou
seho
lds
Like
ly to
Ope
n an
Acc
ount
Figure 7.4 2011 Households Likely to Open an Account by Type of AFS Used in the Last
12 MonthsUsed AFS in the Last 12 Months Did Not Use AFS in the Last 12 Months
Note: Percentages are based on 9.9 million unbanked households

2011 FDIC NatIoNal Survey oF uNbaNkeD aND uNDerbaNkeD HouSeHolDS • September 2012 45
the financial mainstream. For instance, outreach to consumers who want to open an account to secure their money might emphasize the safety and protections of the banking system. On the other hand, consumers who value an account to facilitate “writing checks and paying bills” might benefit from product offerings that involve transac-tion accounts with bill-paying features.
1.3
7.0
0.3
4.2
10.0
22.6
25.7
28.8
1.6
3.7
0.6
1.6
4.4
26.2
31.0
30.8
0 10 20 30 40 50 60
Unknown
Other
To send money to family and friends
To be able to apply for a loan or mortgage
To take advantage of direct deposit of paychecks
To save money for the future
To secure your money
To write checks and pay bills
Percentage of Unbanked Households
Figure 7.5 2011 Reasons Unbanked HouseholdsWant to Open an Account
Never-Banked
Previously Banked
Note: Percentages are based on 5.3 million never-banked and 4.4 million previously-banked households.

2011 FDIC NatIoNal Survey oF uNbaNkeD aND uNDerbaNkeD HouSeHolDS • September 2012 46
among population segments that comprise the unbanked and underbanked. Understanding these differences could lead to the development of products and strategies that more effectively engage these households. For example, economic inclusion strategies that target unbanked Hispanic households might consider that this group includes two distinct segments with starkly different finan-cial services behavior. One substantial segment (29.6 percent) of this group does not use any financial services from bank or non-bank providers, while another consumes AFS more actively than any other ethnic or racial group: 51.8 percent of unbanked Hispanics used AFS in the last 30 days, including almost a quarter (22.5 percent) who used two or more AFS in that period. In contrast, among other unbanked segments, only about 43 percent of white or black households used AFS in the last 30 days and about 14 percent used two or more in that timeframe. Results provided in Appendix B can shed light on the characteristics and AFS use of specific unbanked and underbanked groups.
Economic inclusion strategies that aim to reduce Hispanic households’ reliance on AFS might consider their strong need for multiple transaction products that are used to make payments, transfer money to others, and cash checks to access funds. Strategies should also consider addressing additional challenges that these households might face, including ID, credit history, banking history, and possibly language barrier issues, which might preclude them from fully engaging in the mainstream.
A different strategy might be more effective for economic inclusion efforts designed to engage female family house-holds. These efforts might consider that higher shares of these unbanked households are likely to open an account relative to other types of households. The racial and ethnic composition of female family households also might be useful to consider when designing strategies to reach this segment. Female family households that are unbanked are predominantly black (44.9 percent) and Hispanic (25.1 percent), while those that are underbanked are predominantly white (44.0 percent) and black (35 percent). Female family households’ relatively heavy use of credit AFS might suggest the need to provide affordable credit products to this population. In addition, the high proportion of children living in unbanked and under-banked households headed by unmarried females (54.8 percent of children living in unbanked households and 30.0 percent of children living in underbanked house-holds) might suggest that these households have financial transaction and credit needs associated with caring for children or other dependents, which in turn could lead to greater demand for financial services.
Similarly, economic inclusion efforts that target younger unbanked or underbanked households might take into
VIII. Implications
The results presented in this report suggest that opportuni-ties exist for insured depositories to expand financial services to unbanked and underbanked populations. Many households conduct financial transactions outside of the banking system either through AFS providers, cash, or other informal financial arrangements. These households may benefit from establishing or strengthening their rela-tionships with mainstream financial institutions.
The survey results presented in this report suggest four lessons for policymakers, financial institutions, and other stakeholders working to improve access to mainstream financial services:
1. Understanding the characteristics of different segments of the unbanked and underbanked populations might increase the efficacy of economic inclusion strategies. Different subgroups among unbanked and underbanked households have distinct characteristics and vary-ing levels of demand for banking services. In certain cases, especially among the unbanked, challenging economic circumstances might require collaborative efforts between financial institutions and other public or private entities that serve other needs of this population (e.g., employment or human services agencies).
2. Having a bank account does not guarantee long-term engagement in the banking system. Under-standing how and why households come into and leave banking relationships could lead to solu-tions that promote more durable relationships, especially for younger households just entering the financial mainstream.
3. Households with banking experience appear to have more positive perceptions of having an account and rely less on alternative financial services.
4. Financial institutions interested in pursuing the market opportunity that AFS users represent might need to more clearly demonstrate the value in having a bank account to AFS users who perceive non-bank financial services to be more convenient, faster, less expensive, or to present lower barriers to qualification.
A. Understanding Characteristics of Different Unbanked and Underbanked Segments
It is useful to understand the varying demographic charac-teristics, banking behaviors, and AFS usage patterns
2011 FDIC NatIoNal Survey oF uNbaNkeD aND uNDerbaNkeD HouSeHolDS • September 2012 47
with the youngest householders also account for the larg-est share of unbanked households that are likely to open an account in the future. At the same time, the youngest householders, especially the underbanked, use AFS more actively than older householders. If early banking engage-ment affects the likelihood of establishing long-lasting banking relationships, it might be of particular interest to focus economic inclusion efforts toward children and young adults. These efforts could include broader financial education efforts for young adults, in addition to K-12 financial education, to encourage younger consumers to choose the right banking product, manage it appropriately, and establish a long-lasting banking relationship.
A large proportion of children under age 15 live in unbanked and underbanked households. Future research could explore the extent to which household banking status can influence that of future generations. If a rela-tionship is found, it might be important for policymakers and other stakeholders to focus on demographic segments that not only account for large shares of unbanked and underbanked households, but also house a sizeable propor-tion of children. Female family households, for example, account for large portions of unbanked (30 percent) and underbanked (19 percent) households and are home to almost two out of five children (38.7 percent) that live in these underserved households. Understanding the inter-generational effects of household banking status could inform and potentially improve the outcomes of programs such as childrens’ savings accounts.
C. Banking Experience, Banking Perceptions and Financial Behaviors
The survey results suggest that currently banked house-holds and unbanked households that previously had an account are more likely to perceive value in having a bank account, and rely less on alternative financial services. For example, unbanked households that previously had a rela-tionship with a financial institution are more inclined to open an account in the future, and less likely to say that the main reason they are unbanked is because they do not “want or need an account.” While these descriptive results should be interpreted with caution, they imply that bank-ing experience is important.
Further, the timing of households’ most recent experience with banks appears to be relevant. Unbanked households that had a relationship with a bank within the last year are more likely to report an intention to open a bank account than households that became unbanked more than a year ago or those that were never-banked.
In addition, survey results show that households that have an account, particularly a checking account, tend to use transaction AFS less actively than those that do not have a checking account. On average, unbanked households are
account that these groups are considerably more likely to report an inclination to open an account in the future than older unbanked households, and that they rely more heavily on AFS. In many cases, segments that could further inform targeted economic inclusion efforts overlap. For example, among younger unbanked and underbanked households, female family households comprise a dispro-portionately high share.
Large segments of the unbanked and underbanked popula-tions face challenging economic circumstances, such as unemployment, which seems to suggest that economic inclusion policies and programs that work with other programs that address income, employment, or other segment-specific needs of unbanked populations (e.g., programs involving government transfers, job placement programs) might be effective.
B. Long-Term Banking Engagement
The survey results demonstrate that household banking status is not static and that having a bank account does not guarantee long-term engagement in the banking system. On the contrary, the results suggest that a notable share of households cycle in and out the banking system over time. Nearly half of unbanked households had an account in the past, and nearly half (48.2 percent) of these are likely to join the banking system again in the future. Also, almost one quarter of fully banked house-holds have used AFS in the past and would have been considered underbanked at that time. Economic inclusion efforts require not only bringing the unbanked into the financial mainstream, but also retaining and better engag-ing current bank customers to prevent them from becom-ing unbanked or underbanked. Low-cost banking products with transparent fee structures could play an important role in this effort.
Banking status changes can occur across different popula-tion segments. For example, in 2011 the proportion of unbanked households increased among some demographic groups that typically have among the lowest unbanked rates, such as US-born households and white households. In contrast, the rates did not change significantly among those more likely to be unbanked, such as foreign-born and non-Asian minority households.
More work is necessary to develop a deeper understanding of the factors that contribute to long-term banking engagement and use of non-bank providers. Nevertheless, targeting appropriate efforts at young households, in particular, might help these households develop long-last-ing banking relationships.
The 2011 survey results show that relative to older house-holders, the youngest householders (under age 25) have the highest unbanked and underbanked rates. Households

2011 FDIC NatIoNal Survey oF uNbaNkeD aND uNDerbaNkeD HouSeHolDS • September 2012 48
ences this dynamic, such as the role of early banking engagement and the intergenerational effects of household banking status; and (5) work collaboratively with financial institutions, community partners, and governments to address the diverse needs of the unbanked and under-banked and facilitate safe and sustainable banking relationships.
more active transaction AFS users than the underbanked. Even among underbanked households, those that only have a savings account are more active transaction AFS users than underbanked households that have a checking account.
While savings accounts may provide asset-building oppor-tunities, holding one does not appear to affect AFS use. For example, while a savings account could provide resources that enable households to draw on their savings instead of using AFS credit, relatively small differences in AFS credit use is observed between those with a savings account and those without one, even within similar income groupings. This does not suggest that savings account access is unimportant, but does suggest that access to a savings account in and of itself might be a limited strategy for addressing the households’ comprehensive financial needs.
D. Aligning Bank Products With Consumer Preferences
Financial institutions interested in taking advantage of the market opportunity that unbanked and underbanked households represent might need to more clearly demon-strate the long-term value of having a bank account to AFS users who perceive non-bank financial services to be more convenient, faster, less expensive, or easier to qualify for. For example, banks could use mobile technology to increase convenience, which was the most commonly reported reason for using transaction AFS. Mobile tech-nologies could also improve the quality of banking experi-ences and alter how unbanked and underbanked consumers view the choice between bank and non-bank providers. Finally, for the notable share of unbanked and underbanked consumers that cite speed as a reason for using non-bank check cashing, providing options for expe-dited availability of deposited funds, while managing risks appropriately, might make deposit accounts more appealing.
E. Conclusion
Financial institutions, community organizations, policy-makers, and other stakeholders face a number of chal-lenges in advancing economic inclusion. The results of the 2011 survey highlight the need to (1) continue invest-ing in economic inclusion efforts, especially for younger generations that rely heavily on AFS; (2) deploy banking products and services that are convenient and meet the needs of unbanked and underbanked households that are currently being met by AFS providers; (3) continue to understand the characteristics of the different segments that comprise the unbanked and underbanked populations and tailor economic inclusion strategies accordingly; (4) continue to research and understand the dynamic nature of household banking status and the factors that influ-

2011 FDIC NatIoNal Survey oF uNbaNkeD aND uNDerbaNkeD HouSeHolDS • September 2012 49
Appendix A — National Tables
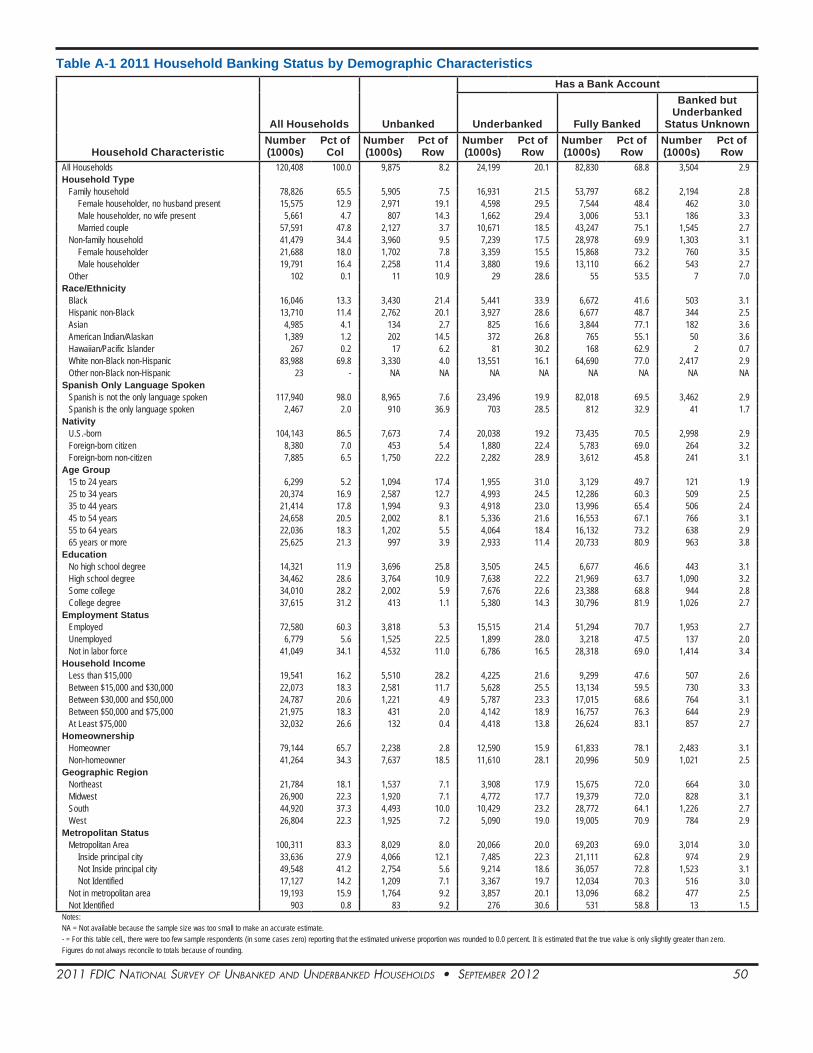
2011 FDIC NatIoNal Survey oF uNbaNkeD aND uNDerbaNkeD HouSeHolDS • September 2012 50
Table A-1 2011 Household Banking Status by Demographic Characteristics
Household Characteristic
All Households Unbanked
Has a Bank Account
Underbanked Fully Banked
Banked but Underbanked
Status UnknownNumber (1000s)
Pct of Col
Number (1000s)
Pct of Row
Number (1000s)
Pct of Row
Number (1000s)
Pct of Row
Number (1000s)
Pct of Row
All Households 120,408 100.0 9,875 8.2 24,199 20.1 82,830 68.8 3,504 2.9Household Type
Family household 78,826 65.5 5,905 7.5 16,931 21.5 53,797 68.2 2,194 2.8Female householder, no husband present 15,575 12.9 2,971 19.1 4,598 29.5 7,544 48.4 462 3.0Male householder, no wife present 5,661 4.7 807 14.3 1,662 29.4 3,006 53.1 186 3.3Married couple 57,591 47.8 2,127 3.7 10,671 18.5 43,247 75.1 1,545 2.7
Non-family household 41,479 34.4 3,960 9.5 7,239 17.5 28,978 69.9 1,303 3.1Female householder 21,688 18.0 1,702 7.8 3,359 15.5 15,868 73.2 760 3.5Male householder 19,791 16.4 2,258 11.4 3,880 19.6 13,110 66.2 543 2.7
Other 102 0.1 11 10.9 29 28.6 55 53.5 7 7.0Race/Ethnicity
Black 16,046 13.3 3,430 21.4 5,441 33.9 6,672 41.6 503 3.1Hispanic non-Black 13,710 11.4 2,762 20.1 3,927 28.6 6,677 48.7 344 2.5Asian 4,985 4.1 134 2.7 825 16.6 3,844 77.1 182 3.6American Indian/Alaskan 1,389 1.2 202 14.5 372 26.8 765 55.1 50 3.6Hawaiian/Pacific Islander 267 0.2 17 6.2 81 30.2 168 62.9 2 0.7White non-Black non-Hispanic 83,988 69.8 3,330 4.0 13,551 16.1 64,690 77.0 2,417 2.9Other non-Black non-Hispanic 23 - NA NA NA NA NA NA NA NA
Spanish Only Language SpokenSpanish is not the only language spoken 117,940 98.0 8,965 7.6 23,496 19.9 82,018 69.5 3,462 2.9Spanish is the only language spoken 2,467 2.0 910 36.9 703 28.5 812 32.9 41 1.7
NativityU.S.-born 104,143 86.5 7,673 7.4 20,038 19.2 73,435 70.5 2,998 2.9Foreign-born citizen 8,380 7.0 453 5.4 1,880 22.4 5,783 69.0 264 3.2Foreign-born non-citizen 7,885 6.5 1,750 22.2 2,282 28.9 3,612 45.8 241 3.1
Age Group15 to 24 years 6,299 5.2 1,094 17.4 1,955 31.0 3,129 49.7 121 1.925 to 34 years 20,374 16.9 2,587 12.7 4,993 24.5 12,286 60.3 509 2.535 to 44 years 21,414 17.8 1,994 9.3 4,918 23.0 13,996 65.4 506 2.445 to 54 years 24,658 20.5 2,002 8.1 5,336 21.6 16,553 67.1 766 3.155 to 64 years 22,036 18.3 1,202 5.5 4,064 18.4 16,132 73.2 638 2.965 years or more 25,625 21.3 997 3.9 2,933 11.4 20,733 80.9 963 3.8
EducationNo high school degree 14,321 11.9 3,696 25.8 3,505 24.5 6,677 46.6 443 3.1High school degree 34,462 28.6 3,764 10.9 7,638 22.2 21,969 63.7 1,090 3.2Some college 34,010 28.2 2,002 5.9 7,676 22.6 23,388 68.8 944 2.8College degree 37,615 31.2 413 1.1 5,380 14.3 30,796 81.9 1,026 2.7
Employment StatusEmployed 72,580 60.3 3,818 5.3 15,515 21.4 51,294 70.7 1,953 2.7Unemployed 6,779 5.6 1,525 22.5 1,899 28.0 3,218 47.5 137 2.0Not in labor force 41,049 34.1 4,532 11.0 6,786 16.5 28,318 69.0 1,414 3.4
Household IncomeLess than $15,000 19,541 16.2 5,510 28.2 4,225 21.6 9,299 47.6 507 2.6Between $15,000 and $30,000 22,073 18.3 2,581 11.7 5,628 25.5 13,134 59.5 730 3.3Between $30,000 and $50,000 24,787 20.6 1,221 4.9 5,787 23.3 17,015 68.6 764 3.1Between $50,000 and $75,000 21,975 18.3 431 2.0 4,142 18.9 16,757 76.3 644 2.9At Least $75,000 32,032 26.6 132 0.4 4,418 13.8 26,624 83.1 857 2.7
HomeownershipHomeowner 79,144 65.7 2,238 2.8 12,590 15.9 61,833 78.1 2,483 3.1Non-homeowner 41,264 34.3 7,637 18.5 11,610 28.1 20,996 50.9 1,021 2.5
Geographic RegionNortheast 21,784 18.1 1,537 7.1 3,908 17.9 15,675 72.0 664 3.0Midwest 26,900 22.3 1,920 7.1 4,772 17.7 19,379 72.0 828 3.1South 44,920 37.3 4,493 10.0 10,429 23.2 28,772 64.1 1,226 2.7West 26,804 22.3 1,925 7.2 5,090 19.0 19,005 70.9 784 2.9
Metropolitan StatusMetropolitan Area 100,311 83.3 8,029 8.0 20,066 20.0 69,203 69.0 3,014 3.0
Inside principal city 33,636 27.9 4,066 12.1 7,485 22.3 21,111 62.8 974 2.9Not Inside principal city 49,548 41.2 2,754 5.6 9,214 18.6 36,057 72.8 1,523 3.1Not Identified 17,127 14.2 1,209 7.1 3,367 19.7 12,034 70.3 516 3.0
Not in metropolitan area 19,193 15.9 1,764 9.2 3,857 20.1 13,096 68.2 477 2.5Not Identified 903 0.8 83 9.2 276 30.6 531 58.8 13 1.5
Notes:NA = Not available because the sample size was too small to make an accurate estimate.- = For this table cell,, there were too few sample respondents (in some cases zero) reporting that the estimated universe proportion was rounded to 0.0 percent. It is estimated that the true value is only slightly greater than zero.Figures do not always reconcile to totals because of rounding.
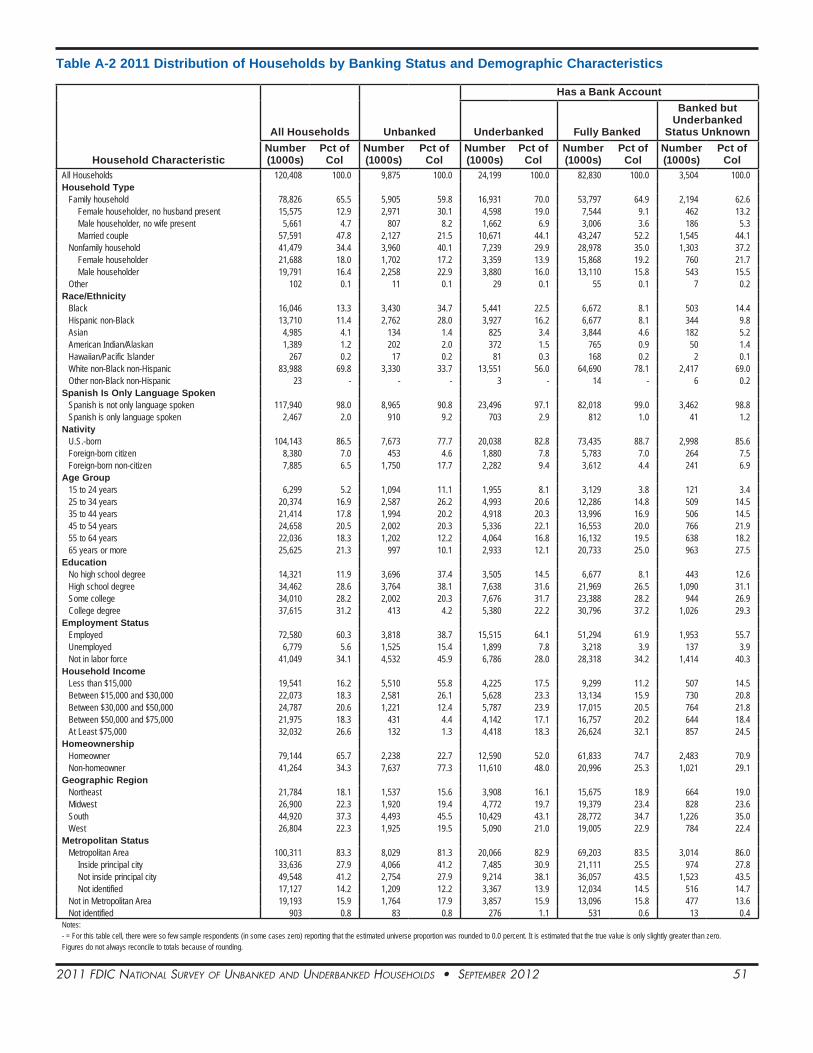
2011 FDIC NatIoNal Survey oF uNbaNkeD aND uNDerbaNkeD HouSeHolDS • September 2012 51
Table A-2 2011 Distribution of Households by Banking Status and Demographic Characteristics
Household Characteristic
All Households Unbanked
Has a Bank Account
Underbanked Fully Banked
Banked but Underbanked
Status UnknownNumber (1000s)
Pct of Col
Number (1000s)
Pct of Col
Number (1000s)
Pct of Col
Number (1000s)
Pct of Col
Number (1000s)
Pct of Col
All Households 120,408 100.0 9,875 100.0 24,199 100.0 82,830 100.0 3,504 100.0Household Type
Family household 78,826 65.5 5,905 59.8 16,931 70.0 53,797 64.9 2,194 62.6Female householder, no husband present 15,575 12.9 2,971 30.1 4,598 19.0 7,544 9.1 462 13.2Male householder, no wife present 5,661 4.7 807 8.2 1,662 6.9 3,006 3.6 186 5.3Married couple 57,591 47.8 2,127 21.5 10,671 44.1 43,247 52.2 1,545 44.1
Nonfamily household 41,479 34.4 3,960 40.1 7,239 29.9 28,978 35.0 1,303 37.2Female householder 21,688 18.0 1,702 17.2 3,359 13.9 15,868 19.2 760 21.7Male householder 19,791 16.4 2,258 22.9 3,880 16.0 13,110 15.8 543 15.5
Other 102 0.1 11 0.1 29 0.1 55 0.1 7 0.2Race/Ethnicity
Black 16,046 13.3 3,430 34.7 5,441 22.5 6,672 8.1 503 14.4Hispanic non-Black 13,710 11.4 2,762 28.0 3,927 16.2 6,677 8.1 344 9.8Asian 4,985 4.1 134 1.4 825 3.4 3,844 4.6 182 5.2American Indian/Alaskan 1,389 1.2 202 2.0 372 1.5 765 0.9 50 1.4Hawaiian/Pacific Islander 267 0.2 17 0.2 81 0.3 168 0.2 2 0.1White non-Black non-Hispanic 83,988 69.8 3,330 33.7 13,551 56.0 64,690 78.1 2,417 69.0Other non-Black non-Hispanic 23 - - - 3 - 14 - 6 0.2
Spanish Is Only Language SpokenSpanish is not only language spoken 117,940 98.0 8,965 90.8 23,496 97.1 82,018 99.0 3,462 98.8Spanish is only language spoken 2,467 2.0 910 9.2 703 2.9 812 1.0 41 1.2
NativityU.S.-born 104,143 86.5 7,673 77.7 20,038 82.8 73,435 88.7 2,998 85.6Foreign-born citizen 8,380 7.0 453 4.6 1,880 7.8 5,783 7.0 264 7.5Foreign-born non-citizen 7,885 6.5 1,750 17.7 2,282 9.4 3,612 4.4 241 6.9
Age Group15 to 24 years 6,299 5.2 1,094 11.1 1,955 8.1 3,129 3.8 121 3.425 to 34 years 20,374 16.9 2,587 26.2 4,993 20.6 12,286 14.8 509 14.535 to 44 years 21,414 17.8 1,994 20.2 4,918 20.3 13,996 16.9 506 14.545 to 54 years 24,658 20.5 2,002 20.3 5,336 22.1 16,553 20.0 766 21.955 to 64 years 22,036 18.3 1,202 12.2 4,064 16.8 16,132 19.5 638 18.265 years or more 25,625 21.3 997 10.1 2,933 12.1 20,733 25.0 963 27.5
EducationNo high school degree 14,321 11.9 3,696 37.4 3,505 14.5 6,677 8.1 443 12.6High school degree 34,462 28.6 3,764 38.1 7,638 31.6 21,969 26.5 1,090 31.1Some college 34,010 28.2 2,002 20.3 7,676 31.7 23,388 28.2 944 26.9College degree 37,615 31.2 413 4.2 5,380 22.2 30,796 37.2 1,026 29.3
Employment StatusEmployed 72,580 60.3 3,818 38.7 15,515 64.1 51,294 61.9 1,953 55.7Unemployed 6,779 5.6 1,525 15.4 1,899 7.8 3,218 3.9 137 3.9Not in labor force 41,049 34.1 4,532 45.9 6,786 28.0 28,318 34.2 1,414 40.3
Household IncomeLess than $15,000 19,541 16.2 5,510 55.8 4,225 17.5 9,299 11.2 507 14.5Between $15,000 and $30,000 22,073 18.3 2,581 26.1 5,628 23.3 13,134 15.9 730 20.8Between $30,000 and $50,000 24,787 20.6 1,221 12.4 5,787 23.9 17,015 20.5 764 21.8Between $50,000 and $75,000 21,975 18.3 431 4.4 4,142 17.1 16,757 20.2 644 18.4At Least $75,000 32,032 26.6 132 1.3 4,418 18.3 26,624 32.1 857 24.5
HomeownershipHomeowner 79,144 65.7 2,238 22.7 12,590 52.0 61,833 74.7 2,483 70.9Non-homeowner 41,264 34.3 7,637 77.3 11,610 48.0 20,996 25.3 1,021 29.1
Geographic RegionNortheast 21,784 18.1 1,537 15.6 3,908 16.1 15,675 18.9 664 19.0Midwest 26,900 22.3 1,920 19.4 4,772 19.7 19,379 23.4 828 23.6South 44,920 37.3 4,493 45.5 10,429 43.1 28,772 34.7 1,226 35.0West 26,804 22.3 1,925 19.5 5,090 21.0 19,005 22.9 784 22.4
Metropolitan StatusMetropolitan Area 100,311 83.3 8,029 81.3 20,066 82.9 69,203 83.5 3,014 86.0
Inside principal city 33,636 27.9 4,066 41.2 7,485 30.9 21,111 25.5 974 27.8Not inside principal city 49,548 41.2 2,754 27.9 9,214 38.1 36,057 43.5 1,523 43.5Not identified 17,127 14.2 1,209 12.2 3,367 13.9 12,034 14.5 516 14.7
Not in Metropolitan Area 19,193 15.9 1,764 17.9 3,857 15.9 13,096 15.8 477 13.6Not identified 903 0.8 83 0.8 276 1.1 531 0.6 13 0.4
Notes:- = For this table cell, there were so few sample respondents (in some cases zero) reporting that the estimated universe proportion was rounded to 0.0 percent. It is estimated that the true value is only slightly greater than zero.Figures do not always reconcile to totals because of rounding.

2011 FDIC NatIoNal Survey oF uNbaNkeD aND uNDerbaNkeD HouSeHolDS • September 2012 52
Table A-3 2011 Unbanked and Underbanked Households by Race and Income
Household Income and Race/Ethnicity
All Households
Banking Status
Unbanked Underbanked Fully-BankedUnderbanked Status
Unknown
Number (1000s)
Pct of Row
Number (1000s) Pct of Row
Number (1000s)
Pct of Row
Number (1000s) Pct of Row
Number (1000s) Pct of Row
All Households 120,408 100.0 9,875 8.2 24,199 20.1 82,830 68.8 3,504 2.9Income Less than $15,000
Black 4,726 100.0 2,185 46.2 1,246 26.4 1,219 25.8 76 1.6Hispanic non-Black 2,822 100.0 1,170 41.5 581 20.6 1,019 36.1 52 1.9Asian 606 100.0 67 11.0 63 10.4 453 74.8 23 3.8American Indian/Alaskan 373 100.0 152 40.7 94 25.1 120 32.1 8 2.1Hawaiian/Pacific Islander 58 100.0 15 26.3 23 40.0 19 33.7 - -White non-Black non-Hispanic 10,956 100.0 1,921 17.5 2,218 20.2 6,468 59.0 348 3.2Total 19,541 100.0 5,510 28.2 4,225 21.6 9,299 47.6 507 2.6
Between $15,000 and $30,000Black 3,529 100.0 756 21.4 1,404 39.8 1,244 35.2 126 3.6Hispanic non-Black 3,353 100.0 959 28.6 1,023 30.5 1,313 39.1 58 1.7Asian 706 100.0 44 6.3 116 16.4 515 72.9 31 4.4American Indian/Alaskan 296 100.0 34 11.6 77 26.0 172 58.3 12 4.0Hawaiian/Pacific Islander 25 100.0 NA NA NA NA NA NA NA NAWhite non-Black non-Hispanic 14,157 100.0 786 5.5 2,995 21.2 9,880 69.8 497 3.5Other non-Black non-Hispanic 6 100.0 NA NA NA NA NA NA NA NATotal 22,073 100.0 2,581 11.7 5,628 25.5 13,134 59.5 730 3.3
Between $30,000 and $50,000Black 3,378 100.0 336 9.9 1,259 37.3 1,649 48.8 134 4.0Hispanic non-Black 3,321 100.0 444 13.4 1,181 35.5 1,589 47.8 108 3.3Asian 869 100.0 18 2.0 214 24.6 591 68.0 47 5.4American Indian/Alaskan 284 100.0 11 3.9 98 34.7 166 58.5 8 2.9Hawaiian/Pacific Islander 43 100.0 NA NA NA NA NA NA NA NAWhite non-Black non-Hispanic 16,886 100.0 413 2.4 3,014 17.8 12,993 76.9 467 2.8Other non-Black non-Hispanic 6 100.0 NA NA NA NA NA NA NA NATotal 24,787 100.0 1,221 4.9 5,787 23.3 17,015 68.6 764 3.1
Between $50,000 and $75,000Black 2,064 100.0 119 5.8 746 36.1 1,134 54.9 65 3.2Hispanic non-Black 2,162 100.0 142 6.6 692 32.0 1,237 57.2 91 4.2Asian 945 100.0 5 0.5 140 14.8 762 80.6 39 4.1American Indian/Alaskan 215 100.0 4 2.0 46 21.6 148 68.9 16 7.5Hawaiian/Pacific Islander 61 100.0 - - 6 10.1 53 86.9 2 3.0White non-Black non-Hispanic 16,523 100.0 161 1.0 2,511 15.2 13,420 81.2 432 2.6Other non-Black non-Hispanic 5 100.0 NA NA NA NA NA NA NA NATotal 21,975 100.0 431 2.0 4,142 18.9 16,757 76.3 644 2.9
At Least $75,000Black 2,348 100.0 35 1.5 785 33.4 1,426 60.7 102 4.3Hispanic non-Black 2,053 100.0 47 2.3 450 21.9 1,521 74.1 34 1.7Asian 1,858 100.0 1 0.1 292 15.7 1,523 82.0 41 2.2American Indian/Alaskan 222 100.0 - - 57 25.5 159 71.7 6 2.7Hawaiian/Pacific Islander 81 100.0 - - 20 24.8 61 75.2 - -White non-Black non-Hispanic 25,465 100.0 49 0.2 2,813 11.0 21,929 86.1 674 2.6Other non-Black non-Hispanic 5 100.0 NA NA NA NA NA NA NA NATotal 32,032 100.0 132 0.4 4,418 13.8 26,624 83.1 857 2.7
Notes:NA = Not available because the sample size was too small to make an accurate estimate.- = For this table cell, there were so few sample respondents (in some cases zero) reporting that the estimated universe proportion was rounded to 0.0 percent. It is estimated that the true value is only slightly greater than zero.Figures do not always reconcile to totals because of rounding.
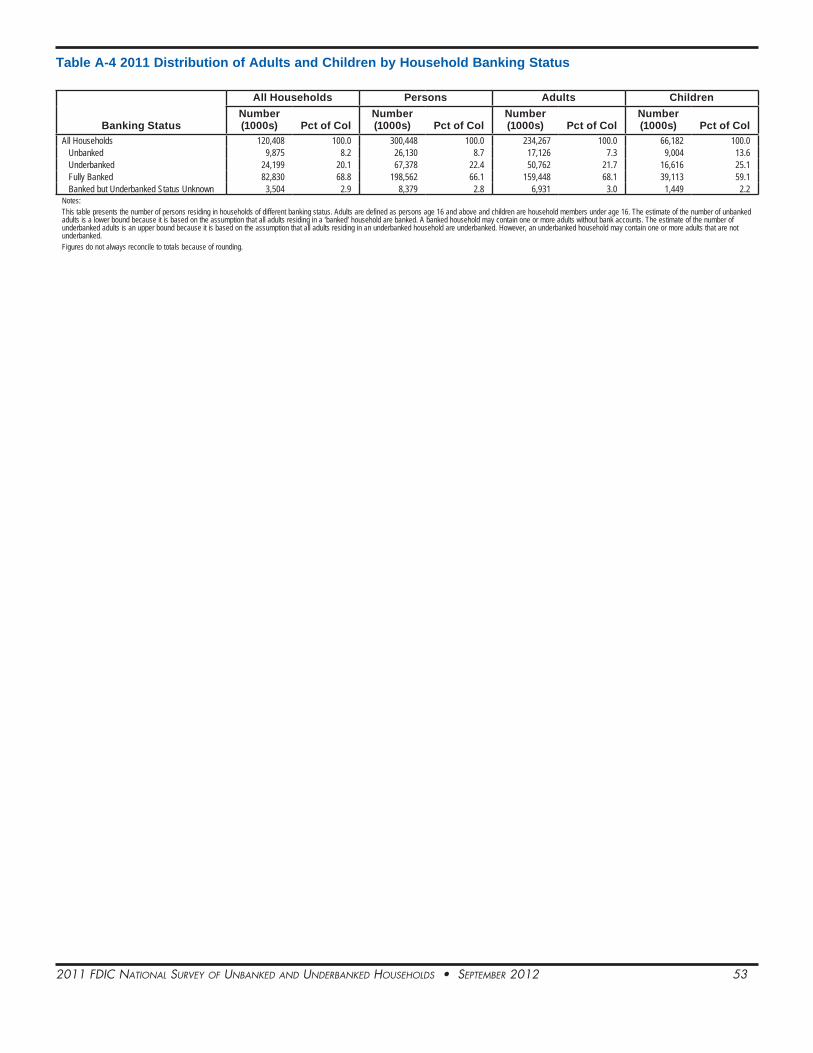
2011 FDIC NatIoNal Survey oF uNbaNkeD aND uNDerbaNkeD HouSeHolDS • September 2012 53
Table A-4 2011 Distribution of Adults and Children by Household Banking Status
Banking Status
All Households Persons Adults ChildrenNumber (1000s) Pct of Col
Number (1000s) Pct of Col
Number (1000s) Pct of Col
Number (1000s) Pct of Col
All Households 120,408 100.0 300,448 100.0 234,267 100.0 66,182 100.0Unbanked 9,875 8.2 26,130 8.7 17,126 7.3 9,004 13.6Underbanked 24,199 20.1 67,378 22.4 50,762 21.7 16,616 25.1Fully Banked 82,830 68.8 198,562 66.1 159,448 68.1 39,113 59.1Banked but Underbanked Status Unknown 3,504 2.9 8,379 2.8 6,931 3.0 1,449 2.2
Notes:This table presents the number of persons residing in households of different banking status. Adults are defined as persons age 16 and above and children are household members under age 16. The estimate of the number of unbanked adults is a lower bound because it is based on the assumption that all adults residing in a ‘banked’ household are banked. A banked household may contain one or more adults without bank accounts. The estimate of the number of underbanked adults is an upper bound because it is based on the assumption that all adults residing in an underbanked household are underbanked. However, an underbanked household may contain one or more adults that are not underbanked.Figures do not always reconcile to totals because of rounding.

2011 FDIC NatIoNal Survey oF uNbaNkeD aND uNDerbaNkeD HouSeHolDS • September 2012 54
Table A-5 2011 Distribution of Persons by Household Banking Status and Demographic Characteristics
Household Characteristic
All Households All Persons
Persons in Household by Household Banking Status
Unbanked Underbanked Fully Banked
Banked but Underbanked Status
Unknown
Number (1000s) Pct of Col
Number (1000s) Pct of Col
Number (1000s) Pct of Col
Number (1000s) Pct of Col
Number (1000s) Pct of Col
Number (1000s) Pct of Col
All Households 120,408 100.0 300,448 100.0 26,130 100.0 67,378 100.0 198,562 100.0 8,379 100.0Household Type
Family household 78,826 65.5 249,190 82.9 21,260 81.4 57,572 85.4 163,569 82.4 6,789 81.0Female householder, no husband present 15,575 12.9 48,079 16.0 10,291 39.4 14,606 21.7 21,745 11.0 1,438 17.2Male householder, no wife present 5,661 4.7 17,598 5.9 2,656 10.2 5,549 8.2 8,857 4.5 537 6.4Married couple 57,591 47.8 183,513 61.1 8,314 31.8 37,418 55.5 132,967 67.0 4,815 57.5
Nonfamily household 41,479 34.4 51,027 17.0 4,846 18.5 9,730 14.4 34,869 17.6 1,583 18.9Female householder 21,688 18.0 25,370 8.4 1,993 7.6 4,305 6.4 18,193 9.2 880 10.5Male householder 19,791 16.4 25,658 8.5 2,853 10.9 5,426 8.1 16,676 8.4 703 8.4
Other 102 0.1 231 0.1 24 0.1 75 0.1 124 0.1 7 0.1Race/Ethnicity
Black 16,046 13.3 39,258 13.1 8,200 31.4 14,325 21.3 15,515 7.8 1,218 14.5Hispanic non-Black 13,710 11.4 43,911 14.6 9,265 35.5 13,524 20.1 20,149 10.1 974 11.6Asian 4,985 4.1 14,450 4.8 278 1.1 2,560 3.8 11,071 5.6 540 6.4American Indian/Alaskan 1,389 1.2 3,474 1.2 481 1.8 1,056 1.6 1,815 0.9 122 1.4Hawaiian/Pacific Islander 267 0.2 798 0.3 62 0.2 303 0.4 430 0.2 4 0.0White non-Black non-Hispanic 83,988 69.8 198,500 66.1 7,844 30.0 35,596 52.8 149,543 75.3 5,516 65.8Other non-Black non-Hispanic 23 - 59 - NA NA NA NA NA NA NA NA
Spanish is Only Language SpokenSpanish is not only language spoken 117,940 98.0 291,932 97.2 22,849 87.4 64,794 96.2 196,056 98.7 8,233 98.3Spanish is only language spoken 2,467 2.0 8,516 2.8 3,281 12.6 2,584 3.8 2,506 1.3 146 1.7
NativityU.S.-born 104,143 86.5 250,809 83.5 18,824 72.0 53,470 79.4 171,575 86.4 6,940 82.8Foreign-born citizen 8,380 7.0 23,880 7.9 1,250 4.8 5,960 8.8 15,963 8.0 707 8.4Foreign-born non-citizen 7,885 6.5 25,760 8.6 6,056 23.2 7,948 11.8 11,024 5.6 732 8.7
Age Group15 to 24 years 6,300 5.2 15,900 5.3 3,039 11.6 5,081 7.5 7,476 3.8 304 3.625 to 34 years 20,374 16.9 57,787 19.2 8,434 32.3 15,275 22.7 32,563 16.4 1,516 18.135 to 44 years 21,414 17.8 69,834 23.2 6,347 24.3 16,532 24.5 45,402 22.9 1,553 18.545 to 54 years 24,658 20.5 66,748 22.2 4,690 18.0 14,873 22.1 45,208 22.8 1,977 23.655 to 64 years 22,036 18.3 45,963 15.3 2,046 7.8 9,431 14.0 33,126 16.7 1,360 16.265 years or more 25,625 21.3 44,216 14.7 1,574 6.0 6,186 9.2 34,786 17.5 1,670 19.9
EducationNo high school degree 14,321 11.9 38,409 12.8 10,566 40.4 11,050 16.4 15,817 8.0 977 11.7High school degree 34,462 28.6 84,497 28.1 9,752 37.3 21,417 31.8 50,754 25.6 2,574 30.7Some college 34,010 28.2 84,513 28.1 4,994 19.1 21,052 31.2 56,107 28.3 2,361 28.2College degree 37,615 31.2 93,029 31.0 818 3.1 13,860 20.6 75,884 38.2 2,468 29.4
Employment StatusEmployed 72,580 60.3 192,165 64.0 10,664 40.8 43,631 64.8 132,814 66.9 5,056 60.3Unemployed 6,779 5.6 18,545 6.2 4,354 16.7 5,606 8.3 8,221 4.1 363 4.3Not in labor force 41,049 34.1 89,739 29.9 11,112 42.5 18,141 26.9 57,526 29.0 2,961 35.3
Household IncomeLess than $15,000 19,541 16.2 39,457 13.1 13,318 51.0 9,387 13.9 15,868 8.0 885 10.6Between $15,000 and $30,000 22,073 18.3 49,499 16.5 7,328 28.0 14,583 21.6 26,026 13.1 1,562 18.6Between $30,000 and $50,000 24,787 20.6 60,221 20.0 3,803 14.6 16,918 25.1 37,695 19.0 1,806 21.5Between $50,000 and $75,000 21,975 18.3 57,601 19.2 1,298 5.0 12,474 18.5 42,164 21.2 1,665 19.9At Least $75,000 32,032 26.6 93,671 31.2 384 1.5 14,016 20.8 76,809 38.7 2,462 29.4
HomeownershipHomeowner 79,144 65.7 203,080 67.6 5,816 22.3 36,968 54.9 154,252 77.7 6,044 72.1Non-homeowner 41,264 34.3 97,368 32.4 20,314 77.7 30,410 45.1 44,309 22.3 2,335 27.9
Geographic RegionNortheast 21,784 18.1 53,551 17.8 3,757 14.4 10,580 15.7 37,556 18.9 1,658 19.8Midwest 26,900 22.3 65,583 21.8 4,604 17.6 12,881 19.1 46,110 23.2 1,988 23.7South 44,920 37.3 111,140 37.0 12,035 46.1 28,678 42.6 67,617 34.1 2,810 33.5West 26,804 22.3 70,175 23.4 5,735 21.9 15,239 22.6 47,278 23.8 1,923 22.9
Metropolitan StatusMetropolitan Area 100,311 83.3 252,167 83.9 21,366 81.8 56,263 83.5 167,336 84.3 7,201 85.9
Inside principal city 33,636 27.9 81,517 27.1 10,602 40.6 20,324 30.2 48,457 24.4 2,134 25.5Not inside principal city 49,548 41.2 128,429 42.7 7,557 28.9 26,611 39.5 90,443 45.5 3,818 45.6Not identified 17,127 14.2 42,222 14.1 3,208 12.3 9,328 13.8 28,436 14.3 1,250 14.9
Not in Metropolitan Area 19,193 15.9 45,949 15.3 4,525 17.3 10,356 15.4 29,925 15.1 1,144 13.7Not Identified 903 0.8 2,332 0.8 239 0.9 759 1.1 1,300 0.7 34 0.4
Notes:This table presents the number of persons residing in households categorized by household banking status.NA = Not available because the sample size was too small to make an accurate estimate.Figures do not always reconcile to totals because of rounding.- = For this table cell, there were so few sample respondents (in some cases zero) reporting that the estimated universe proportion was rounded to 0.0 percent. It is estimated that the true value is only slightly greater than zero.

2011 FDIC NatIoNal Survey oF uNbaNkeD aND uNDerbaNkeD HouSeHolDS • September 2012 55
Table A-6 2011 Distribution of Adults by Household Banking Status and Demographic Characteristics
Household Characteristic
All Households All Adults
Adults in Household by Household Banking Status
Unbanked Underbanked Fully Banked
Banked but Underbanked Status
Unknown
Number (1000s) Pct of Col
Number (1000s) Pct of Col
Number (1000s) Pct of Col
Number (1000s) Pct of Col
Number (1000s) Pct of Col
Number (1000s) Pct of Col
All Households 120,408 100.0 234,267 100.0 17,126 100.0 50,762 100.0 159,448 100.0 6,931 100.0Household Type
Family household 78,826 65.5 183,688 78.4 12,436 72.6 41,189 81.1 124,712 78.2 5,351 77.2Female householder, no husband present 15,575 12.9 31,810 13.6 5,357 31.3 9,614 18.9 15,749 9.9 1,091 15.7Male householder, no wife present 5,661 4.7 13,117 5.6 1,827 10.7 4,074 8.0 6,806 4.3 410 5.9Married couple 57,591 47.8 138,761 59.2 5,252 30.7 27,501 54.2 102,158 64.1 3,850 55.5
Nonfamily household 41,479 34.4 50,370 21.5 4,666 27.2 9,504 18.7 34,627 21.7 1,573 22.7Female householder 21,688 18.0 25,228 10.8 1,935 11.3 4,272 8.4 18,147 11.4 874 12.6Male householder 19,791 16.4 25,141 10.7 2,731 15.9 5,231 10.3 16,480 10.3 699 10.1
Other 102 0.1 209 0.1 24 0.1 69 0.1 109 0.1 7 0.1Race/Ethnicity
Black 16,046 13.3 29,107 12.4 5,448 31.8 10,509 20.7 12,143 7.6 1,007 14.5Hispanic non-Black 13,710 11.4 30,874 13.2 5,779 33.7 9,528 18.8 14,817 9.3 750 10.8Asian 4,985 4.1 11,230 4.8 215 1.3 2,014 4.0 8,569 5.4 432 6.2American Indian/Alaskan 1,389 1.2 2,685 1.1 317 1.8 820 1.6 1,441 0.9 108 1.6Hawaiian/Pacific Islander 267 0.2 568 0.2 28 0.2 208 0.4 329 0.2 3 0.0White non-Black non-Hispanic 83,988 69.8 159,759 68.2 5,339 31.2 27,676 54.5 122,119 76.6 4,624 66.7Other non-Black non-Hispanic 23 - NA NA NA NA NA NA NA NA NA NA
Spanish Is Only Language SpokenSpanish is not only language spoken 117,940 98.0 228,399 97.5 15,011 87.6 49,018 96.6 157,561 98.8 6,810 98.3Spanish is only language spoken 2,467 2.0 5,868 2.5 2,116 12.4 1,744 3.4 1,887 1.2 121 1.7
NativityU.S.-born 104,143 86.5 197,668 84.4 12,439 72.6 40,719 80.2 138,714 87.0 5,795 83.6Foreign-born citizen 8,380 7.0 18,791 8.0 859 5.0 4,650 9.2 12,703 8.0 580 8.4Foreign-born non-citizen 7,885 6.5 17,808 7.6 3,828 22.4 5,392 10.6 8,032 5.0 556 8.0
Age Group15 to 24 years 6,300 5.2 12,482 5.3 1,933 11.3 3,920 7.7 6,361 4.0 268 3.925 to 34 years 20,374 16.9 36,743 15.7 4,310 25.2 9,357 18.4 22,053 13.8 1,023 14.835 to 44 years 21,414 17.8 43,868 18.7 3,894 22.7 10,759 21.2 28,180 17.7 1,034 14.945 to 54 years 24,658 20.5 54,943 23.5 3,664 21.4 12,381 24.4 37,200 23.3 1,698 24.555 to 64 years 22,036 18.3 43,206 18.4 1,853 10.8 8,566 16.9 31,495 19.8 1,292 18.665 years or more 25,625 21.3 43,025 18.4 1,472 8.6 5,779 11.4 34,160 21.4 1,615 23.3
EducationNo high school degree 14,321 11.9 28,538 12.2 6,928 40.5 8,008 15.8 12,780 8.0 823 11.9High school degree 34,462 28.6 67,161 28.7 6,401 37.4 16,204 31.9 42,391 26.6 2,164 31.2Some college 34,010 28.2 66,173 28.2 3,175 18.5 15,748 31.0 45,328 28.4 1,922 27.7College degree 37,615 31.2 72,394 30.9 622 3.6 10,801 21.3 58,949 37.0 2,021 29.2
Employment StatusEmployed 72,580 60.3 146,277 62.4 6,981 40.8 32,606 64.2 102,681 64.4 4,009 57.8Unemployed 6,779 5.6 13,338 5.7 2,626 15.3 4,094 8.1 6,333 4.0 285 4.1Not in labor force 41,049 34.1 74,652 31.9 7,520 43.9 14,061 27.7 50,434 31.6 2,637 38.0
Household IncomeLess than $15,000 19,541 16.2 29,848 12.7 8,580 50.1 6,945 13.7 13,538 8.5 785 11.3Between $15,000 and $30,000 22,073 18.3 38,647 16.5 4,796 28.0 10,653 21.0 21,898 13.7 1,300 18.8Between $30,000 and $50,000 24,787 20.6 47,555 20.3 2,534 14.8 12,545 24.7 30,987 19.4 1,490 21.5Between $50,000 and $75,000 21,975 18.3 45,607 19.5 933 5.4 9,507 18.7 33,770 21.2 1,397 20.2At Least $75,000 32,032 26.6 72,609 31.0 284 1.7 11,111 21.9 59,256 37.2 1,959 28.3
HomeownershipHomeowner 79,144 65.7 162,503 69.4 4,220 24.6 28,787 56.7 124,382 78.0 5,114 73.8Non-homeowner 41,264 34.3 71,764 30.6 12,907 75.4 21,975 43.3 35,066 22.0 1,817 26.2
Geographic RegionNortheast 21,784 18.1 43,080 18.4 2,646 15.4 8,407 16.6 30,643 19.2 1,385 20.0Midwest 26,900 22.3 51,071 21.8 3,050 17.8 9,758 19.2 36,650 23.0 1,613 23.3South 44,920 37.3 85,837 36.6 7,756 45.3 21,321 42.0 54,415 34.1 2,346 33.9West 26,804 22.3 54,278 23.2 3,674 21.5 11,276 22.2 37,741 23.7 1,586 22.9
Metropolitan StatusMetropolitan Area 100,311 83.3 196,468 83.9 14,060 82.1 42,388 83.5 134,032 84.1 5,989 86.4
Inside principal city 33,636 27.9 63,591 27.1 7,089 41.4 15,333 30.2 39,381 24.7 1,789 25.8Not inside principal city 49,548 41.2 100,076 42.7 4,931 28.8 20,173 39.7 71,803 45.0 3,169 45.7Not identified 17,127 14.2 32,800 14.0 2,039 11.9 6,883 13.6 22,848 14.3 1,031 14.9
Not in Metropolitan Area 19,193 15.9 36,041 15.4 2,925 17.1 7,797 15.4 24,400 15.3 919 13.3Not Identified 903 0.8 1,758 0.8 142 0.8 576 1.1 1,017 0.6 23 0.3
Notes:Adults are defined as persons age 16 and above.This table presents the number of adults residing in households categorized by household banking status.NA = Not available because the sample size was too small to make an accurate estimate.Figures do not always reconcile to totals because of the rounding.- = For this table cell, there were so few sample respondents (in some cases zero) reporting that the estimated universe proportion was rounded to 0.0 percent. It is estimated that the true value is only slightly greater than zero.

2011 FDIC NatIoNal Survey oF uNbaNkeD aND uNDerbaNkeD HouSeHolDS • September 2012 56
Table A-7 2011 Distribution of Children by Household Banking Status and Demographic Characteristics
Household Characteristic
All Households All Children
Children in Household by Household Banking Status
Unbanked Underbanked Fully Banked
Banked but Underbanked Status
Unknown
Number (1000s) Pct of Col
Number (1000s) Pct of Col
Number (1000s) Pct of Col
Number (1000s) Pct of Col
Number (1000s) Pct of Col
Number (1000s) Pct of Col
All Households 120,408 100.0 66,182 100.0 9,004 100.0 16,616 100.0 39,113 100.0 1,449 100.0Household Type
Family household 78,826 65.5 65,502 99.0 8,824 98.0 16,383 98.6 38,856 99.3 1,439 99.3Female householder, no husband present 15,575 12.9 16,269 24.6 4,934 54.8 4,992 30.0 5,996 15.3 347 23.9Male householder, no wife present 5,661 4.7 4,482 6.8 829 9.2 1,475 8.9 2,052 5.2 126 8.7Married couple 57,591 47.8 44,752 67.6 3,061 34.0 9,916 59.7 30,809 78.8 966 66.6
Nonfamily household 41,479 34.4 658 1.0 180 2.0 227 1.4 241 0.6 10 0.7Female householder 21,688 18.0 141 0.2 58 0.6 32 0.2 46 0.1 5 0.4Male householder 19,791 16.4 516 0.8 122 1.4 195 1.2 196 0.5 5 0.3
Other 102 0.1 22 - - - 6 - 16 - - -Race/Ethnicity
Black 16,046 13.3 10,151 15.3 2,752 30.6 3,816 23.0 3,372 8.6 211 14.6Hispanic non-Black 13,710 11.4 13,037 19.7 3,486 38.7 3,996 24.0 5,332 13.6 224 15.4Asian 4,985 4.1 3,219 4.9 63 0.7 546 3.3 2,503 6.4 108 7.5American Indian/Alaskan 1,389 1.2 788 1.2 164 1.8 236 1.4 374 1.0 13 0.9Hawaiian/Pacific Islander 267 0.2 230 0.3 34 0.4 94 0.6 101 0.3 1 0.1White non-Black non-Hispanic 83,988 69.8 38,741 58.5 2,505 27.8 7,920 47.7 27,424 70.1 892 61.6Other non-Black non-Hispanic 23 - NA NA NA NA NA NA NA NA NA NA
Spanish Is Only Language SpokenSpanish is not only language spoken 117,940 98.0 63,533 96.0 7,838 87.1 15,776 94.9 38,495 98.4 1,424 98.3Spanish is only language spoken 2,467 2.0 2,649 4.0 1,165 12.9 840 5.1 618 1.6 25 1.7
NativityU.S.-born 104,143 86.5 53,141 80.3 6,385 70.9 12,750 76.7 32,861 84.0 1,145 79.1Foreign-born citizen 8,380 7.0 5,089 7.7 392 4.3 1,309 7.9 3,260 8.3 128 8.8Foreign-born non-citizen 7,885 6.5 7,952 12.0 2,227 24.7 2,556 15.4 2,992 7.7 176 12.1
Age Group15 to 24 years 6,300 5.2 3,418 5.2 1,106 12.3 1,162 7.0 1,115 2.9 36 2.525 to 34 years 20,374 16.9 21,044 31.8 4,124 45.8 5,918 35.6 10,511 26.9 492 34.035 to 44 years 21,414 17.8 25,966 39.2 2,453 27.2 5,773 34.7 17,222 44.0 518 35.845 to 54 years 24,658 20.5 11,805 17.8 1,026 11.4 2,492 15.0 8,008 20.5 279 19.355 to 64 years 22,036 18.3 2,757 4.2 193 2.1 865 5.2 1,631 4.2 69 4.765 years or more 25,625 21.3 1,190 1.8 102 1.1 407 2.5 626 1.6 55 3.8
EducationNo high school degree 14,321 11.9 9,871 14.9 3,638 40.4 3,042 18.3 3,037 7.8 154 10.6High school degree 34,462 28.6 17,336 26.2 3,351 37.2 5,213 31.4 8,363 21.4 410 28.3Some college 34,010 28.2 18,340 27.7 1,819 20.2 5,303 31.9 10,779 27.6 439 30.3College degree 37,615 31.2 20,635 31.2 196 2.2 3,058 18.4 16,935 43.3 446 30.8
Employment StatusEmployed 72,580 60.3 45,888 69.3 3,683 40.9 11,024 66.3 30,133 77.0 1,047 72.3Unemployed 6,779 5.6 5,206 7.9 1,728 19.2 1,512 9.1 1,889 4.8 77 5.3Not in labor force 41,049 34.1 15,087 22.8 3,592 39.9 4,080 24.6 7,091 18.1 324 22.4
Household IncomeLess than $15,000 19,541 16.2 9,608 14.5 4,738 52.6 2,441 14.7 2,330 6.0 100 6.9Between $15,000 and $30,000 22,073 18.3 10,852 16.4 2,532 28.1 3,930 23.7 4,128 10.6 262 18.1Between $30,000 and $50,000 24,787 20.6 12,666 19.1 1,269 14.1 4,373 26.3 6,708 17.2 316 21.8Between $50,000 and $75,000 21,975 18.3 11,995 18.1 365 4.1 2,967 17.9 8,394 21.5 269 18.5At Least $75,000 32,032 26.6 21,061 31.8 100 1.1 2,905 17.5 17,553 44.9 503 34.7
HomeownershipHomeowner 79,144 65.7 40,577 61.3 1,596 17.7 8,181 49.2 29,870 76.4 930 64.2Non-homeowner 41,264 34.3 25,604 38.7 7,408 82.3 8,435 50.8 9,243 23.6 519 35.8
Geographic RegionNortheast 21,784 18.1 10,471 15.8 1,111 12.3 2,173 13.1 6,914 17.7 273 18.9Midwest 26,900 22.3 14,512 21.9 1,553 17.2 3,123 18.8 9,461 24.2 375 25.9South 44,920 37.3 25,303 38.2 4,279 47.5 7,357 44.3 13,203 33.8 464 32.0West 26,804 22.3 15,897 24.0 2,060 22.9 3,963 23.9 9,537 24.4 336 23.2
Metropolitan StatusMetropolitan Area 100,311 83.3 55,700 84.2 7,307 81.2 13,876 83.5 33,305 85.1 1,213 83.7
Inside principal city 33,636 27.9 17,926 27.1 3,513 39.0 4,991 30.0 9,077 23.2 345 23.8Not inside principal city 49,548 41.2 28,353 42.8 2,625 29.2 6,439 38.7 18,640 47.7 649 44.8Not identified 17,127 14.2 9,421 14.2 1,168 13.0 2,446 14.7 5,588 14.3 219 15.1
Not in Metropolitan Area 19,193 15.9 9,909 15.0 1,600 17.8 2,558 15.4 5,525 14.1 225 15.5Not Identified 903 0.8 574 0.9 97 1.1 182 1.1 283 0.7 11 0.7
Notes:Children are persons in the household under age 16.This table presents the number of children residing in households categorized by household banking status.NA = Not available because the sample size was too small to make an accurate estimate.- = For this table cell, there were so few sample respondents (in some cases zero) reporting that the estimated universe proportion was rounded to 0.0 percent. It is estimated that the true value is only slightly greater than zero.Figures do not always reconcile to totals because of rounding.

2011 FDIC NatIoNal Survey oF uNbaNkeD aND uNDerbaNkeD HouSeHolDS • September 2012 57
Table A-8 2009 Household Banking Status by Demographic Characteristics
Household Characteristic
All Households Unbanked
Has a Bank Account
Underbanked Fully Banked
Banked but Underbanked
Status UnknownNumber (1000s)
Pct of Row
Number (1000s)
Pct of Row
Number (1000s)
Pct of Row
Number (1000s)
Pct of Row
Number (1000s)
Pct of Row
All Households 119,001 100.0 9,054 7.6 21,693 18.2 84,917 71.4 3,336 2.8Household Type
Family household 78,743 100.0 5,609 7.1 14,823 18.8 56,276 71.5 2,035 2.6Female householder, no husband present 13,975 100.0 2,730 19.5 3,997 28.6 6,848 49.0 399 2.9Male householder, no wife present 5,433 100.0 804 14.8 1,502 27.6 2,941 54.1 186 3.4Married couple 59,336 100.0 2,074 3.5 9,325 15.7 46,487 78.3 1,450 2.4
Nonfamily household 40,126 100.0 3,416 8.5 6,841 17.0 28,573 71.2 1,297 3.2Female householder 21,147 100.0 1,391 6.6 3,121 14.8 15,945 75.4 689 3.3Male householder 18,979 100.0 2,024 10.7 3,720 19.6 12,627 66.5 608 3.2
Other 131 100.0 30 22.6 29 22.0 68 52.1 4 3.3Race and Ethnicity of Householder
Black 15,541 100.0 3,338 21.5 4,999 32.2 6,775 43.6 429 2.8Hispanic non-Black 13,241 100.0 2,543 19.2 3,269 24.7 7,035 53.1 395 3.0Asian 4,790 100.0 166 3.5 357 7.5 4,037 84.3 229 4.8American Indian/Alaskan 1,378 100.0 211 15.3 401 29.1 736 53.4 30 2.2Hawaiian/Pacific Islander 259 100.0 23 9.0 49 18.8 180 69.3 8 2.9White non-Black non-Hispanic 83,785 100.0 2,767 3.3 12,618 15.1 66,154 79.0 2,246 2.7Other non-Black non-Hispanic 6 100.0 NA NA NA NA NA NA NA NA
Spanish Is Only Language SpokenSpanish is not only language spoken 116,479 100.0 8,158 7.0 21,160 18.2 83,885 72.0 3,276 2.8Spanish is only language spoken 2,522 100.0 896 35.5 533 21.1 1,032 40.9 60 2.4
NativityU.S.-born 103,091 100.0 6,877 6.7 19,110 18.5 74,357 72.1 2,747 2.7Foreign-born citizen 7,828 100.0 427 5.5 1,086 13.9 5,970 76.3 345 4.4Foreign-born non-citizen 8,081 100.0 1,749 21.6 1,498 18.5 4,590 56.8 244 3.0
Age Group15 to 24 years 6,596 100.0 1,036 15.7 1,693 25.7 3,628 55.0 239 3.625 to 34 years 19,702 100.0 2,310 11.7 4,545 23.1 12,272 62.3 575 2.935 to 44 years 22,590 100.0 2,003 8.9 4,773 21.1 15,230 67.4 585 2.645 to 54 years 24,863 100.0 1,857 7.5 4,860 19.5 17,543 70.6 603 2.455 to 64 years 20,273 100.0 971 4.8 3,226 15.9 15,505 76.5 571 2.865 years or more 24,977 100.0 876 3.5 2,597 10.4 20,740 83.0 764 3.1
EducationNo high school degree 15,006 100.0 3,659 24.4 3,430 22.9 7,457 49.7 460 3.1High school degree 34,654 100.0 3,341 9.6 7,304 21.1 23,025 66.4 984 2.8Some college 33,312 100.0 1,618 4.9 7,201 21.6 23,507 70.6 985 3.0College degree 36,029 100.0 435 1.2 3,759 10.4 30,929 85.8 907 2.5
Employment StatusEmployed 73,155 100.0 3,992 5.5 14,042 19.2 53,083 72.6 2,038 2.8Unemployed 6,642 100.0 1,267 19.1 1,790 26.9 3,432 51.7 153 2.3Not in labor force 39,203 100.0 3,795 9.7 5,861 15.0 28,402 72.4 1,146 2.9
Household IncomeLess than $15,000 15,689 100.0 4,240 27.0 3,532 22.5 7,618 48.6 299 1.9Between $15,000 and $30,000 17,443 100.0 2,259 13.0 4,222 24.2 10,616 60.9 346 2.0Between $30,000 and $50,000 21,512 100.0 883 4.1 5,239 24.4 14,819 68.9 571 2.7Between $50,000 and $75,000 18,988 100.0 279 1.5 3,468 18.3 14,854 78.2 387 2.0At Least $75,000 27,881 100.0 73 0.3 3,198 11.5 24,080 86.4 530 1.9Unknown 17,488 100.0 1,320 7.5 2,034 11.6 12,930 73.9 1,204 6.9
HomeownershipHomeowner 80,388 100.0 2,093 2.6 11,403 14.2 64,677 80.5 2,215 2.8Non-homeowner 38,613 100.0 6,961 18.0 10,291 26.7 20,240 52.4 1,121 2.9
Geographic RegionNortheast 21,689 100.0 1,500 6.9 3,552 16.4 15,917 73.4 720 3.3Midwest 26,601 100.0 1,615 6.1 4,579 17.2 19,797 74.4 609 2.3South 44,081 100.0 4,144 9.4 9,159 20.8 29,590 67.1 1,188 2.7West 26,630 100.0 1,795 6.7 4,403 16.5 19,614 73.7 819 3.1
Metropolitan StatusMetropolitan Area 99,183 100.0 7,364 7.4 17,619 17.8 71,322 71.9 2,877 2.9Inside principal city 33,450 100.0 3,775 11.3 6,512 19.5 22,034 65.9 1,129 3.4Not inside principal city 48,536 100.0 2,527 5.2 7,739 15.9 36,964 76.2 1,305 2.7Not identified 17,196 100.0 1,062 6.2 3,368 19.6 12,324 71.7 443 2.6Not in metropolitan area 18,978 100.0 1,631 8.6 3,876 20.4 13,035 68.7 435 2.3Not identified 840 100.0 59 7.0 198 23.5 560 66.6 24 2.9
Notes:NA = Not available because the sample size was too small to make an accurate estimate.Figures do not always reconcile to totals because of rounding.2009 data revised September 2012. Refer to 2009 and 2011 FDIC National Survey of Unbanked and Underbanked Households and Technical Notes for terms, definitions, and methodological discussion.

2011 FDIC NatIoNal Survey oF uNbaNkeD aND uNDerbaNkeD HouSeHolDS • September 2012 58
Table A-9 Unbanked Rates by Year and Demographic Characteristics
Household Characteristic
Year
Estimated Difference
2009 2011All
Households UnbankedAll
Households UnbankedNumber (1000s)
Number (1000s) Pct of Row
Number (1000s)
Number (1000s) Pct of Row
All Households 119,001 9,054 7.6 120,408 9,875 8.2 0.6 *Household Type
Family household 78,743 5,609 7.1 78,826 5,905 7.5 0.4Female householder, no husband present 13,975 2,730 19.5 15,575 2,971 19.1 -0.5Male householder, no wife present 5,433 804 14.8 5,661 807 14.3 -0.6Married couple 59,336 2,074 3.5 57,591 2,127 3.7 0.2
Nonfamily household 40,126 3,416 8.5 41,479 3,960 9.5 1.0 *Female householder 21,147 1,391 6.6 21,688 1,702 7.8 1.3 *Male householder 18,979 2,024 10.7 19,791 2,258 11.4 0.7
Other 131 30 22.6 102 11 10.9 -11.7Race/Ethnicity
Black 15,541 3,338 21.5 16,046 3,430 21.4 -0.1Hispanic non-Black 13,241 2,543 19.2 13,710 2,762 20.1 0.9Asian 4,790 166 3.5 4,985 135 2.7 -0.8American Indian/Alaskan 1,378 211 15.3 1,389 202 14.5 -0.8Hawaiian/Pacific Islander 259 23 9.0 267 17 6.2 -2.7White non-Black non-Hispanic 83,785 2,767 3.3 83,988 3,330 4.0 0.7 *Other non-Black non-Hispanic 6 NA NA NA NA NA NA
Spanish Is Only Language SpokenSpanish is not only language spoken 116,479 8,158 7.0 117,940 8,965 7.6 0.6 *Spanish is only language spoken 2,522 896 35.5 2,467 911 36.9 1.4
NativityU.S.-born 103,091 6,878 6.7 104,143 7,673 7.4 0.7 *Foreign-born citizen 7,829 428 5.5 8,380 453 5.4 -0.1Foreign-born non-citizen 8,081 1,749 21.6 7,885 1,750 22.2 0.6
Age Group15 to 24 years 6,596 1,036 15.7 6,300 1,094 17.4 1.725 to 34 years 19,702 2,310 11.7 20,374 2,587 12.7 1.035 to 44 years 22,590 2,003 8.9 21,414 1,994 9.3 0.445 to 54 years 24,863 1,857 7.5 24,658 2,002 8.1 0.655 to 64 years 20,274 971 4.8 22,036 1,202 5.5 0.765 years or more 24,977 876 3.5 25,625 997 3.9 0.4
EducationNo high school degree 15,006 3,659 24.4 14,321 3,696 25.8 1.4High school degree 34,654 3,342 9.6 34,462 3,764 10.9 1.3 *Some college 33,312 1,618 4.9 34,010 2,002 5.9 1.0 *College degree 36,029 435 1.2 37,615 413 1.1 -0.1
Employment StatusEmployed 73,155 3,992 5.5 72,580 3,818 5.3 -0.2Unemployed 6,642 1,267 19.1 6,779 1,525 22.5 3.4 *Not in labor force 39,203 3,795 9.7 41,049 4,532 11.0 1.4 *
Household IncomeLess than $15,000 15,689 4,240 27.0 16,699 4,950 29.6 2.6 *Between $15,000 and $30,000 17,443 2,259 13.0 18,599 2,117 11.4 -1.6 *Between $30,000 and $50,000 21,512 883 4.1 20,984 945 4.5 0.4Between $50,000 and $75,000 18,988 279 1.5 18,773 256 1.4 -0.1At Least $75,000 27,881 73 0.3 27,770 60 0.2 -0.0Unknown 17,488 1,320 7.5 17,583 1,548 8.8 1.3 *
HomeownershipHomeowner 80,388 2,093 2.6 79,144 2,238 2.8 0.2Non-homeowner 38,613 6,961 18.0 41,264 7,637 18.5 0.5
Geographic RegionNortheast 21,689 1,500 6.9 21,784 1,537 7.1 0.1Midwest 26,601 1,615 6.1 26,900 1,920 7.1 1.1South 44,081 4,144 9.4 44,920 4,493 10.0 0.6West 26,630 1,795 6.7 26,804 1,925 7.2 0.4
Notes:* Indicates differences that are statistically significant at the 10% level.NA = Not available because the sample size was too small to make an accurate estimate.Figures do not always reconcile to totals because of rounding.2009 data revised September 2012. Refer to 2009 and 2011 FDIC National Survey of Unbanked and Underbanked Households and Technical Notes for terms, definitions, and methodological discussion.

2011 FDIC NatIoNal Survey oF uNbaNkeD aND uNDerbaNkeD HouSeHolDS • September 2012 59
Table A-10 Banked Households That Used AFS in the Last Year by Year and Demographic Characteristics
Household Characteristic
Year
Estimated Difference
2009 2011All
Households Banked AFS UsersaAll
Households Banked AFS Usersa
Number (1000s)
Number (1000s) Pct of Row
Number (1000s)
Number (1000s) Pct of Row
All Households 119,001 20,759 17.4 120,408 22,031 18.3 0.9 *Household Type
Family household 78,743 14,102 17.9 78,826 15,244 19.3 1.4Female householder, no husband present 13,975 3,786 27.1 15,575 4,337 27.8 0.8Male householder, no wife present 5,433 1,435 26.4 5,661 1,524 26.9 0.5Married couple 59,336 8,882 15.0 57,591 9,383 16.3 1.3 *
Nonfamily household 40,126 6,629 16.5 41,479 6,758 16.3 -0.2Female householder 21,147 3,051 14.4 21,688 3,152 14.5 0.1Male householder 18,979 3,577 18.8 19,791 3,606 18.2 -0.6
Other 131 29 22.0 102 29 28.6 6.6Race/Ethnicity
Black 15,541 4,861 31.3 16,046 5,041 31.4 0.1Hispanic non-Black 13,241 3,140 23.7 13,710 3,152 23.0 -0.7Asian 4,790 335 7.0 4,985 502 10.1 3.1 *American Indian/Alaskan 1,378 388 28.2 1,389 369 26.6 -1.6Hawaiian/Pacific Islander 259 47 18.2 267 63 23.5 5.3White non-Black non-Hispanic 83,785 11,987 14.3 83,988 12,901 15.4 1.1 *Other non-Black non-Hispanic 6 NA NA NA NA NA NA
Spanish Is Only Language SpokenSpanish is not only language spoken 116,479 20,235 17.4 117,940 21,562 18.3 0.9 *Spanish is only language spoken 2,522 524 20.8 2,467 469 19.0 -1.8
NativityU.S.-born 103,091 18,246 17.7 104,143 19,201 18.4 0.7 *Foreign-born citizen 7,829 1,055 13.5 8,380 1,240 14.8 1.3Foreign-born non-citizen 8,081 1,458 18.0 7,885 1,590 20.2 2.1
Age Group15 to 24 years 6,596 1,619 24.5 6,300 1,869 29.7 5.1 *25 to 34 years 19,702 4,250 21.6 20,374 4,520 22.2 0.635 to 44 years 22,590 4,490 19.9 21,414 4,317 20.2 0.345 to 54 years 24,863 4,662 18.8 24,658 4,838 19.6 0.955 to 64 years 20,274 3,173 15.7 22,036 3,744 17.0 1.3 *65 years or more 24,977 2,566 10.3 25,625 2,743 10.7 0.4
EducationNo high school degree 15,006 3,318 22.1 14,321 3,131 21.9 -0.3High school degree 34,654 6,935 20.0 34,462 7,061 20.5 0.5Some college 33,312 6,870 20.6 34,010 7,163 21.1 0.4College degree 36,029 3,636 10.1 37,615 4,677 12.4 2.3 *
Employment StatusEmployed 73,155 13,362 18.3 72,580 13,854 19.1 0.8 *Unemployed 6,642 1,688 25.4 6,779 1,794 26.5 1.0Not in labor force 39,203 5,710 14.6 41,049 6,383 15.5 1.0 *
Household IncomeLess than $15,000 15,689 3,464 22.1 16,699 3,706 22.2 0.1Between $15,000 and $30,000 17,443 4,027 23.1 18,599 4,692 25.2 2.1 *Between $30,000 and $50,000 21,512 4,968 23.1 20,984 4,687 22.3 -0.8Between $50,000 and $75,000 18,988 3,314 17.5 18,773 3,309 17.6 0.2At Least $75,000 27,881 3,034 10.9 27,770 3,449 12.4 1.5 *Unknown 17,488 1,952 11.2 17,583 2,188 12.4 1.3 *
HomeownershipHomeowner 80,388 10,913 13.6 79,144 11,381 14.4 0.8 *Non-homeowner 38,613 9,847 25.5 41,264 10,650 25.8 0.3
Geographic RegionNortheast 21,689 3,387 15.6 21,784 3,498 16.1 0.4Midwest 26,601 4,367 16.4 26,900 4,464 16.6 0.2South 44,081 8,778 19.9 44,920 9,670 21.5 1.6 *West 26,630 4,228 15.9 26,804 4,399 16.4 0.5
Notes:a For comparability purposes, the estimates include households that have an account, but used non-bank check cashing, non-bank money orders, payday loans, rent-to-own, and pawn shops in the last year. The estimates exclude non-bank remittances and refund anticipation loans because the 2009 survey did not ask about non-bank remittances and asked about the use of refund anticipation loans in the last five years as opposed to the last year.* Indicates differences that are statistically significant at the 10% level.NA = Not available because the sample size was too small to make an accurate estimate.Figures do not always reconcile to totals because of rounding.2009 data revised September 2012. Refer to 2009 and 2011 FDIC National Survey of Unbanked and Underbanked Households and Technical Notes for terms, definitions, and methodological discussion.

2011 FDIC NatIoNal Survey oF uNbaNkeD aND uNDerbaNkeD HouSeHolDS • September 2012 60
Table A-11 2011 Household Bank Account Type by Banking Status
Bank Account Type
All Households Unbanked
Has a Bank Account
Underbanked Fully Banked
Banked but Underbanked
Status UnknownNumber (1000s)
Pct of Col
Number (1000s)
Pct of Col
Number (1000s)
Pct of Col
Number (1000s)
Pct of Col
Number (1000s)
Pct of Col
All Households 120,408 100.0 9,875 100.0 24,199 100.0 82,830 100.0 3,504 100.0Unbanked 9,875 8.2 9,875 100.0 0 0.0 0 0.0 0 0.0Checking and savings accounts 80,924 67.2 0 0.0 15,113 62.5 63,839 77.1 1,972 56.3Savings account only 2,379 2.0 0 0.0 1,297 5.4 1,053 1.3 29 0.8Checking account only 25,378 21.1 0 0.0 7,548 31.2 17,164 20.7 666 19.0Banked, but account type unknown 1,851 1.5 0 0.0 240 1.0 774 0.9 836 23.9
Memo Items:Has checking account 106,509 88.5 0 0.0 22,723 93.9 81,134 98.0 2,652 75.7Has savings account 83,331 69.2 0 0.0 16,418 67.8 64,911 78.4 2,001 57.1
Notes:Figures do not always reconcile to totals because of rounding.
Table A-12 2011 Household Bank Account Type by Demographic Characteristics
Household Characteristic
All Households
Bank Account Type Memo Items
Unbanked Households
Checking and Savings Accounts
Savings Account Only
Checking Account Only
Banked, but Account Type
UnknownHas Checking
AccountHas Savings
Account
Number (1000s)
Pct of Col
Number (1000s)
Pct of Row
Number (1000s)
Pct of Row
Number (1000s)
Pct of Row
Number (1000s)
Pct of Row
Number (1000s)
Pct of Row
Number (1000s)
Pct of Row
Number (1000s)
Pct of Row
All Households 120,408 100.0 9,875 8.2 80,924 67.2 2,379 2.0 25,378 21.1 1,851 1.5 106,509 88.5 83,331 69.2Household Type
Family household 78,826 65.5 5,905 7.5 55,729 70.7 1,371 1.7 14,648 18.6 1,174 1.5 70,537 89.5 57,118 72.5Female house-
holder, no husband present 15,575 12.9 2,971 19.1 7,899 50.7 462 3.0 3,960 25.4 283 1.8 11,917 76.5 8,367 53.7
Male householder, no wife present 5,661 4.7 807 14.3 3,108 54.9 178 3.1 1,460 25.8 109 1.9 4,599 81.2 3,289 58.1
Married couple 57,591 47.8 2,127 3.7 44,722 77.7 732 1.3 9,228 16.0 782 1.4 54,020 93.8 45,462 78.9Non-family household 41,479 34.4 3,960 9.5 25,139 60.6 1,004 2.4 10,710 25.8 667 1.6 35,895 86.5 26,152 63.0
Female householder 21,688 18.0 1,702 7.8 13,471 62.1 436 2.0 5,667 26.1 412 1.9 19,155 88.3 13,915 64.2
Male householder 19,791 16.4 2,258 11.4 11,667 59.0 568 2.9 5,043 25.5 255 1.3 16,740 84.6 12,237 61.8Other 102 0.1 11 10.9 56 55.3 4 3.9 21 20.1 10 9.8 77 75.5 60 59.2
Race/EthnicityBlack 16,046 13.3 3,430 21.4 7,821 48.7 621 3.9 3,916 24.4 257 1.6 11,767 73.3 8,442 52.6Hispanic non-Black 13,710 11.4 2,762 20.1 6,700 48.9 414 3.0 3,653 26.6 181 1.3 10,379 75.7 7,118 51.9Asian 4,985 4.1 134 2.7 3,733 74.9 105 2.1 921 18.5 92 1.8 4,660 93.5 3,839 77.0American Indian/
Alaskan 1,389 1.2 202 14.5 795 57.2 55 4.0 304 21.9 33 2.4 1,099 79.1 851 61.3Hawaiian/Pacific
Islander 267 0.2 17 6.2 189 70.8 2 0.6 52 19.5 8 2.8 241 90.3 191 71.4White non-Black
non-Hispanic 83,988 69.8 3,330 4.0 61,673 73.4 1,183 1.4 16,521 19.7 1,280 1.5 78,340 93.3 62,877 74.9Other non-Black
non-Hispanic 23 - NA NA NA NA NA NA NA NA NA NA NA NA NA NASpanish only language spokenSpanish is not the only
language spoken 117,940 98.0 8,965 7.6 80,191 68.0 2,316 2.0 24,648 20.9 1,820 1.5 105,033 89.1 82,535 70.0Spanish is only
language spoken 2,467 2.0 910 36.9 733 29.7 63 2.6 730 29.6 30 1.2 1,475 59.8 796 32.3Nativity
U.S.-born 104,143 86.5 7,673 7.4 71,556 68.7 1,982 1.9 21,325 20.5 1,607 1.5 93,056 89.4 73,565 70.6Foreign-born citizen 8,380 7.0 453 5.4 5,633 67.2 184 2.2 1,956 23.3 154 1.8 7,609 90.8 5,817 69.4Foreign-born
non-citizen 7,885 6.5 1,750 22.2 3,735 47.4 214 2.7 2,097 26.6 89 1.1 5,843 74.1 3,949 50.1Age Group
15 to 24 years 6,299 5.2 1,094 17.4 3,483 55.3 131 2.1 1,487 23.6 105 1.7 4,988 79.2 3,617 57.425 to 34 years 20,374 16.9 2,587 12.7 13,168 64.6 360 1.8 4,016 19.7 243 1.2 17,222 84.5 13,533 66.435 to 44 years 21,414 17.8 1,994 9.3 14,415 67.3 418 2.0 4,308 20.1 279 1.3 18,751 87.6 14,836 69.3

2011 FDIC NatIoNal Survey oF uNbaNkeD aND uNDerbaNkeD HouSeHolDS • September 2012 61
Table A-12 2011 Household Bank Account Type by Demographic Characteristics (continued)
Household Characteristic
All Households
Bank Account Type Memo Items
Unbanked Households
Checking and Savings Accounts
Savings Account Only
Checking Account Only
Banked, but Account Type
UnknownHas Checking
AccountHas Savings
Account
Number (1000s)
Pct of Col
Number (1000s)
Pct of Row
Number (1000s)
Pct of Row
Number (1000s)
Pct of Row
Number (1000s)
Pct of Row
Number (1000s)
Pct of Row
Number (1000s)
Pct of Row
Number (1000s)
Pct of Row
45 to 54 years 24,658 20.5 2,002 8.1 16,994 68.9 474 1.9 4,850 19.7 338 1.4 21,875 88.7 17,476 70.955 to 64 years 22,036 18.3 1,202 5.5 15,510 70.4 459 2.1 4,526 20.5 340 1.5 20,078 91.1 15,970 72.565 years or more 25,625 21.3 997 3.9 17,354 67.7 538 2.1 6,191 24.2 545 2.1 23,594 92.1 17,899 69.8
EducationNo high school degree 14,321 11.9 3,696 25.8 4,992 34.9 709 5.0 4,706 32.9 218 1.5 9,719 67.9 5,710 39.9High school degree 34,462 28.6 3,764 10.9 20,068 58.2 898 2.6 9,145 26.5 586 1.7 29,274 84.9 20,971 60.9Some college 34,010 28.2 2,002 5.9 24,073 70.8 520 1.5 6,895 20.3 520 1.5 31,025 91.2 24,599 72.3College degree 37,615 31.2 413 1.1 31,791 84.5 252 0.7 4,632 12.3 526 1.4 36,490 97.0 32,051 85.2
Employment StatusEmployed 72,580 60.3 3,818 5.3 53,454 73.6 1,136 1.6 13,233 18.2 940 1.3 66,798 92.0 54,606 75.2Unemployed 6,779 5.6 1,525 22.5 3,269 48.2 196 2.9 1,676 24.7 113 1.7 4,961 73.2 3,465 51.1Not in labor force 41,049 34.1 4,532 11.0 24,201 59.0 1,048 2.6 10,470 25.5 798 1.9 34,749 84.7 25,260 61.5
Household IncomeLess than $15,000 19,541 16.2 5,510 28.2 6,424 32.9 863 4.4 6,415 32.8 329 1.7 12,884 65.9 7,301 37.4Between $15,000 and
$30,000 22,073 18.3 2,581 11.7 11,700 53.0 717 3.2 6,707 30.4 369 1.7 18,433 83.5 12,418 56.3Between $30,000 and
$50,000 24,787 20.6 1,221 4.9 16,861 68.0 431 1.7 5,877 23.7 397 1.6 22,781 91.9 17,297 69.8Between $50,000 and
$75,000 21,975 18.3 431 2.0 17,486 79.6 213 1.0 3,521 16.0 323 1.5 21,041 95.7 17,700 80.5At Least $75,000 32,032 26.6 132 0.4 28,453 88.8 155 0.5 2,859 8.9 433 1.4 31,369 97.9 28,614 89.3
HomeownershipHomeowner 79,144 65.7 2,238 2.8 60,521 76.5 1,055 1.3 14,071 17.8 1,259 1.6 74,710 94.4 61,592 77.8Non-homeowner 41,264 34.3 7,637 18.5 20,402 49.4 1,325 3.2 11,308 27.4 592 1.4 31,799 77.1 21,738 52.7
Geographic RegionNortheast 21,784 18.1 1,537 7.1 15,468 71.0 441 2.0 4,028 18.5 309 1.4 19,553 89.8 15,910 73.0Midwest 26,900 22.3 1,920 7.1 18,477 68.7 653 2.4 5,440 20.2 410 1.5 23,953 89.0 19,136 71.1South 44,920 37.3 4,493 10.0 27,478 61.2 846 1.9 11,351 25.3 751 1.7 38,905 86.6 28,337 63.1West 26,804 22.3 1,925 7.2 19,500 72.7 439 1.6 4,559 17.0 381 1.4 24,098 89.9 19,948 74.4
Metropolitan StatusMetropolitan Area 100,311 83.3 8,029 8.0 68,955 68.7 1,827 1.8 19,936 19.9 1,564 1.6 89,066 88.8 70,797 70.6
Inside Principal City 33,636 27.9 4,066 12.1 21,551 64.1 794 2.4 6,736 20.0 489 1.5 28,357 84.3 22,359 66.5Not Inside Principal
City 49,548 41.2 2,754 5.6 35,737 72.1 659 1.3 9,574 19.3 823 1.7 45,376 91.6 36,398 73.5Not Identified 17,127 14.2 1,209 7.1 11,667 68.1 374 2.2 3,626 21.2 252 1.5 15,334 89.5 12,040 70.3
Not in Metropolitan Area 19,193 15.9 1,764 9.2 11,444 59.6 526 2.7 5,174 27.0 285 1.5 16,649 86.7 11,983 62.4
Not Identified 903 0.8 83 9.2 525 58.1 26 2.9 268 29.7 2 0.2 793 87.8 551 61.0Notes:NA = Not available because the sample size was too small to make an accurate estimate.Figures do not always reconcile to totals because of rounding.- = For this table cell, there were so few sample respondents (in some cases zero) reporting that the estimated universe proportion was rounded to 0.0 percent. It is estimated that the true value is only slightly greater than zero.

2011 FDIC NatIoNal Survey oF uNbaNkeD aND uNDerbaNkeD HouSeHolDS • September 2012 62
Table A-13 2011 Household Bank Account Type by Demographic Characteristics: Underbanked Households
Household Characteristic
All Underbanked Households
Bank Account Type Memo Items
Checking and Savings Accounts Savings Account Only Checking Account Only
Banked, but Account Type Unknown Has Checking Account Has Savings Account
Number (1000s)
Pct of Row
Number (1000s)
Pct of Row
Number (1000s)
Pct of Row
Number (1000s)
Pct of Row
Number (1000s)
Pct of Row
Number (1000s)
Pct of Row
Number (1000s)
Pct of Row
All Underbanked Households 24,199 100.0 15,113 62.5 1,297 5.4 7,548 31.2 240 1.0 22,723 93.9 16,418 67.8Household Type
Family household 16,931 100.0 10,935 64.6 772 4.6 5,060 29.9 164 1.0 16,043 94.8 11,715 69.2Female householder, no
husband present 4,598 100.0 2,490 54.2 292 6.4 1,752 38.1 64 1.4 4,261 92.7 2,788 60.6Male householder, no wife
present 1,662 100.0 985 59.3 126 7.6 537 32.3 13 0.8 1,524 91.7 1,111 66.9Married couple 10,671 100.0 7,461 69.9 353 3.3 2,770 26.0 87 0.8 10,257 96.1 7,815 73.2
Nonfamily household 7,239 100.0 4,167 57.6 522 7.2 2,482 34.3 68 0.9 6,663 92.0 4,689 64.8Female householder 3,359 100.0 1,913 57.0 190 5.7 1,216 36.2 40 1.2 3,129 93.2 2,103 62.6Male householder 3,880 100.0 2,254 58.1 332 8.5 1,266 32.6 29 0.7 3,534 91.1 2,586 66.6
Other 29 100.0 NA NA NA NA NA NA NA NA NA NA NA NARace/Ethnicity
Black 5,441 100.0 3,198 58.8 410 7.5 1,756 32.3 76 1.4 4,983 91.6 3,609 66.3Hispanic non-Black 3,927 100.0 2,174 55.4 220 5.6 1,502 38.2 31 0.8 3,688 93.9 2,398 61.1Asian 825 100.0 634 76.8 21 2.6 168 20.3 2 0.3 802 97.2 655 79.4American Indian/Alaskan 372 100.0 218 58.5 38 10.2 115 30.9 1 0.4 333 89.4 257 69.1Hawaiian/Pacific Islander 81 100.0 66 82.2 1 1.6 12 15.1 1 1.1 79 97.3 68 83.7White non-Black non-Hispanic 13,551 100.0 8,820 65.1 607 4.5 3,995 29.5 128 0.9 12,836 94.7 9,429 69.6Other non-Black non-Hispanic 3 100.0 NA NA NA NA NA NA NA NA NA NA NA NA
Spanish Is Only Language SpokenSpanish is not only language
spoken 23,496 100.0 14,816 63.1 1,251 5.3 7,199 30.6 230 1.0 22,072 93.9 16,074 68.4Spanish is only language spoken 703 100.0 298 42.3 47 6.6 349 49.6 10 1.4 651 92.5 344 48.9
NativityU.S.-born 20,038 100.0 12,606 62.9 1,117 5.6 6,116 30.5 198 1.0 18,772 93.7 13,730 68.5Foreign-born citizen 1,880 100.0 1,299 69.1 59 3.2 496 26.4 26 1.4 1,800 95.7 1,358 72.3Foreign-born non-citizen 2,282 100.0 1,208 52.9 122 5.3 936 41.0 16 0.7 2,151 94.3 1,330 58.3
Age Group15 to 24 years 1,955 100.0 1,229 62.9 87 4.4 614 31.4 25 1.3 1,851 94.7 1,316 67.325 to 34 years 4,993 100.0 3,207 64.2 212 4.2 1,541 30.9 33 0.7 4,757 95.3 3,419 68.535 to 44 years 4,918 100.0 2,974 60.5 241 4.9 1,661 33.8 41 0.8 4,648 94.5 3,217 65.445 to 54 years 5,336 100.0 3,484 65.3 278 5.2 1,522 28.5 52 1.0 5,013 93.9 3,762 70.555 to 64 years 4,064 100.0 2,495 61.4 258 6.4 1,283 31.6 28 0.7 3,787 93.2 2,755 67.865 years or more 2,933 100.0 1,724 58.8 222 7.6 926 31.6 61 2.1 2,668 91.0 1,950 66.5
EducationNo high school degree 3,505 100.0 1,495 42.7 370 10.6 1,599 45.6 41 1.2 3,105 88.6 1,870 53.3High school degree 7,638 100.0 4,102 53.7 532 7.0 2,924 38.3 80 1.0 7,045 92.2 4,634 60.7Some college 7,676 100.0 5,159 67.2 296 3.9 2,152 28.0 70 0.9 7,333 95.5 5,456 71.1College degree 5,380 100.0 4,357 81.0 100 1.9 873 16.2 50 0.9 5,240 97.4 4,458 82.9
Employment StatusEmployed 15,515 100.0 10,473 67.5 645 4.2 4,279 27.6 117 0.8 14,779 95.3 11,122 71.7Unemployed 1,899 100.0 1,060 55.8 135 7.1 685 36.1 18 1.0 1,749 92.1 1,195 63.0Not in labor force 6,786 100.0 3,580 52.8 517 7.6 2,584 38.1 105 1.5 6,194 91.3 4,101 60.4
Household IncomeLess than $15,000 4,225 100.0 1,620 38.3 491 11.6 2,046 48.4 68 1.6 3,692 87.4 2,117 50.1Between $15,000 and $30,000 5,628 100.0 2,856 50.8 437 7.8 2,287 40.6 47 0.8 5,155 91.6 3,293 58.5Between $30,000 and $50,000 5,787 100.0 3,688 63.7 233 4.0 1,816 31.4 50 0.9 5,516 95.3 3,921 67.8Between $50,000 and $75,000 4,142 100.0 3,154 76.1 96 2.3 855 20.6 37 0.9 4,015 96.9 3,250 78.5At Least $75,000 4,418 100.0 3,795 85.9 40 0.9 545 12.3 37 0.8 4,345 98.3 3,837 86.9
HomeownershipHomeowner 12,590 100.0 8,803 69.9 497 3.9 3,176 25.2 114 0.9 12,001 95.3 9,305 73.9Non-homeowner 11,610 100.0 6,311 54.4 801 6.9 4,372 37.7 126 1.1 10,722 92.4 7,113 61.3
Geographic RegionNortheast 3,908 100.0 2,641 67.6 215 5.5 1,029 26.3 23 0.6 3,676 94.1 2,856 73.1Midwest 4,772 100.0 2,840 59.5 371 7.8 1,500 31.4 61 1.3 4,354 91.2 3,214 67.3South 10,429 100.0 6,045 58.0 487 4.7 3,781 36.3 116 1.1 9,863 94.6 6,532 62.6West 5,090 100.0 3,586 70.5 226 4.4 1,238 24.3 40 0.8 4,830 94.9 3,816 75.0
Metropolitan StatusMetropolitan Area 20,066 100.0 12,933 64.5 943 4.7 5,976 29.8 214 1.1 18,963 94.5 13,882 69.2
Inside principal city 7,485 100.0 4,688 62.6 476 6.4 2,237 29.9 83 1.1 6,944 92.8 5,169 69.1Not inside principal city 9,214 100.0 6,110 66.3 277 3.0 2,720 29.5 107 1.2 8,850 96.0 6,388 69.3Not identified 3,367 100.0 2,135 63.4 190 5.7 1,018 30.2 23 0.7 3,169 94.1 2,325 69.1
Not in Metropolitan Area 3,857 100.0 2,035 52.8 337 8.7 1,459 37.8 26 0.7 3,501 90.8 2,374 61.5Not identified 276 100.0 145 52.6 17 6.3 113 41.1 - - 259 93.7 163 58.9
Notes:NA = Not available because the sample size was too small to make an accurate estimate. - = For this table cell, there were so few sample respondents (in some cases zero) reporting that the estimated universe proportion was rounded to 0.0 percent. It is estimated that the true value is only slightly greater than zero.Figures do not always reconcile to totals because of rounding.
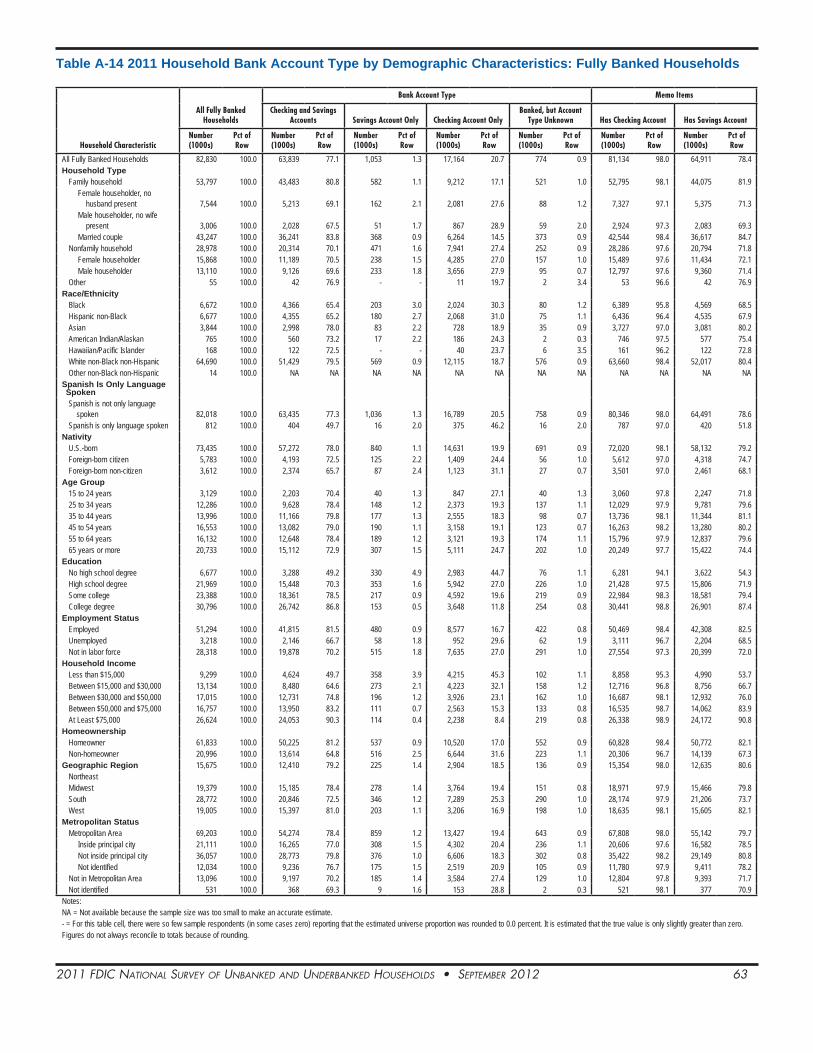
2011 FDIC NatIoNal Survey oF uNbaNkeD aND uNDerbaNkeD HouSeHolDS • September 2012 63
Table A-14 2011 Household Bank Account Type by Demographic Characteristics: Fully Banked Households
Household Characteristic
All Fully Banked Households
Bank Account Type Memo Items
Checking and Savings Accounts Savings Account Only Checking Account Only
Banked, but Account Type Unknown Has Checking Account Has Savings Account
Number (1000s)
Pct of Row
Number (1000s)
Pct of Row
Number (1000s)
Pct of Row
Number (1000s)
Pct of Row
Number (1000s)
Pct of Row
Number (1000s)
Pct of Row
Number (1000s)
Pct of Row
All Fully Banked Households 82,830 100.0 63,839 77.1 1,053 1.3 17,164 20.7 774 0.9 81,134 98.0 64,911 78.4Household Type
Family household 53,797 100.0 43,483 80.8 582 1.1 9,212 17.1 521 1.0 52,795 98.1 44,075 81.9Female householder, no
husband present 7,544 100.0 5,213 69.1 162 2.1 2,081 27.6 88 1.2 7,327 97.1 5,375 71.3Male householder, no wife
present 3,006 100.0 2,028 67.5 51 1.7 867 28.9 59 2.0 2,924 97.3 2,083 69.3Married couple 43,247 100.0 36,241 83.8 368 0.9 6,264 14.5 373 0.9 42,544 98.4 36,617 84.7
Nonfamily household 28,978 100.0 20,314 70.1 471 1.6 7,941 27.4 252 0.9 28,286 97.6 20,794 71.8Female householder 15,868 100.0 11,189 70.5 238 1.5 4,285 27.0 157 1.0 15,489 97.6 11,434 72.1Male householder 13,110 100.0 9,126 69.6 233 1.8 3,656 27.9 95 0.7 12,797 97.6 9,360 71.4
Other 55 100.0 42 76.9 - - 11 19.7 2 3.4 53 96.6 42 76.9Race/Ethnicity
Black 6,672 100.0 4,366 65.4 203 3.0 2,024 30.3 80 1.2 6,389 95.8 4,569 68.5Hispanic non-Black 6,677 100.0 4,355 65.2 180 2.7 2,068 31.0 75 1.1 6,436 96.4 4,535 67.9Asian 3,844 100.0 2,998 78.0 83 2.2 728 18.9 35 0.9 3,727 97.0 3,081 80.2American Indian/Alaskan 765 100.0 560 73.2 17 2.2 186 24.3 2 0.3 746 97.5 577 75.4Hawaiian/Pacific Islander 168 100.0 122 72.5 - - 40 23.7 6 3.5 161 96.2 122 72.8White non-Black non-Hispanic 64,690 100.0 51,429 79.5 569 0.9 12,115 18.7 576 0.9 63,660 98.4 52,017 80.4Other non-Black non-Hispanic 14 100.0 NA NA NA NA NA NA NA NA NA NA NA NA
Spanish Is Only Language SpokenSpanish is not only language
spoken 82,018 100.0 63,435 77.3 1,036 1.3 16,789 20.5 758 0.9 80,346 98.0 64,491 78.6Spanish is only language spoken 812 100.0 404 49.7 16 2.0 375 46.2 16 2.0 787 97.0 420 51.8
NativityU.S.-born 73,435 100.0 57,272 78.0 840 1.1 14,631 19.9 691 0.9 72,020 98.1 58,132 79.2Foreign-born citizen 5,783 100.0 4,193 72.5 125 2.2 1,409 24.4 56 1.0 5,612 97.0 4,318 74.7Foreign-born non-citizen 3,612 100.0 2,374 65.7 87 2.4 1,123 31.1 27 0.7 3,501 97.0 2,461 68.1
Age Group15 to 24 years 3,129 100.0 2,203 70.4 40 1.3 847 27.1 40 1.3 3,060 97.8 2,247 71.825 to 34 years 12,286 100.0 9,628 78.4 148 1.2 2,373 19.3 137 1.1 12,029 97.9 9,781 79.635 to 44 years 13,996 100.0 11,166 79.8 177 1.3 2,555 18.3 98 0.7 13,736 98.1 11,344 81.145 to 54 years 16,553 100.0 13,082 79.0 190 1.1 3,158 19.1 123 0.7 16,263 98.2 13,280 80.255 to 64 years 16,132 100.0 12,648 78.4 189 1.2 3,121 19.3 174 1.1 15,796 97.9 12,837 79.665 years or more 20,733 100.0 15,112 72.9 307 1.5 5,111 24.7 202 1.0 20,249 97.7 15,422 74.4
EducationNo high school degree 6,677 100.0 3,288 49.2 330 4.9 2,983 44.7 76 1.1 6,281 94.1 3,622 54.3High school degree 21,969 100.0 15,448 70.3 353 1.6 5,942 27.0 226 1.0 21,428 97.5 15,806 71.9Some college 23,388 100.0 18,361 78.5 217 0.9 4,592 19.6 219 0.9 22,984 98.3 18,581 79.4College degree 30,796 100.0 26,742 86.8 153 0.5 3,648 11.8 254 0.8 30,441 98.8 26,901 87.4
Employment StatusEmployed 51,294 100.0 41,815 81.5 480 0.9 8,577 16.7 422 0.8 50,469 98.4 42,308 82.5Unemployed 3,218 100.0 2,146 66.7 58 1.8 952 29.6 62 1.9 3,111 96.7 2,204 68.5Not in labor force 28,318 100.0 19,878 70.2 515 1.8 7,635 27.0 291 1.0 27,554 97.3 20,399 72.0
Household IncomeLess than $15,000 9,299 100.0 4,624 49.7 358 3.9 4,215 45.3 102 1.1 8,858 95.3 4,990 53.7Between $15,000 and $30,000 13,134 100.0 8,480 64.6 273 2.1 4,223 32.1 158 1.2 12,716 96.8 8,756 66.7Between $30,000 and $50,000 17,015 100.0 12,731 74.8 196 1.2 3,926 23.1 162 1.0 16,687 98.1 12,932 76.0Between $50,000 and $75,000 16,757 100.0 13,950 83.2 111 0.7 2,563 15.3 133 0.8 16,535 98.7 14,062 83.9At Least $75,000 26,624 100.0 24,053 90.3 114 0.4 2,238 8.4 219 0.8 26,338 98.9 24,172 90.8
HomeownershipHomeowner 61,833 100.0 50,225 81.2 537 0.9 10,520 17.0 552 0.9 60,828 98.4 50,772 82.1Non-homeowner 20,996 100.0 13,614 64.8 516 2.5 6,644 31.6 223 1.1 20,306 96.7 14,139 67.3
Geographic Region 15,675 100.0 12,410 79.2 225 1.4 2,904 18.5 136 0.9 15,354 98.0 12,635 80.6NortheastMidwest 19,379 100.0 15,185 78.4 278 1.4 3,764 19.4 151 0.8 18,971 97.9 15,466 79.8South 28,772 100.0 20,846 72.5 346 1.2 7,289 25.3 290 1.0 28,174 97.9 21,206 73.7West 19,005 100.0 15,397 81.0 203 1.1 3,206 16.9 198 1.0 18,635 98.1 15,605 82.1
Metropolitan StatusMetropolitan Area 69,203 100.0 54,274 78.4 859 1.2 13,427 19.4 643 0.9 67,808 98.0 55,142 79.7
Inside principal city 21,111 100.0 16,265 77.0 308 1.5 4,302 20.4 236 1.1 20,606 97.6 16,582 78.5Not inside principal city 36,057 100.0 28,773 79.8 376 1.0 6,606 18.3 302 0.8 35,422 98.2 29,149 80.8Not identified 12,034 100.0 9,236 76.7 175 1.5 2,519 20.9 105 0.9 11,780 97.9 9,411 78.2
Not in Metropolitan Area 13,096 100.0 9,197 70.2 185 1.4 3,584 27.4 129 1.0 12,804 97.8 9,393 71.7Not identified 531 100.0 368 69.3 9 1.6 153 28.8 2 0.3 521 98.1 377 70.9
Notes:NA = Not available because the sample size was too small to make an accurate estimate. - = For this table cell, there were so few sample respondents (in some cases zero) reporting that the estimated universe proportion was rounded to 0.0 percent. It is estimated that the true value is only slightly greater than zero.Figures do not always reconcile to totals because of rounding.

2011 FDIC NatIoNal Survey oF uNbaNkeD aND uNDerbaNkeD HouSeHolDS • September 2012 64
Table A-15 2011 Unbanked Households’ Previous Banking Status by Demographic Characteristics: All Households
Household Characteristic
All HouseholdsAll Unbanked Households
Unbanked StatusPreviously
Banked Never-Banked UnknownNumber (1000s)
Pct of Row
Number (1000s)
Pct of Row
Number (1000s)
Pct of Row
Number (1000s)
Pct of Row
Number (1000s)
Pct of Row
All Households 120,408 100.0 9,875 8.2 4,411 3.7 5,269 4.4 110,728 92.0Household Type
Family household 78,826 100.0 5,905 7.5 2,392 3.0 3,399 4.3 73,036 92.7Female householder, no husband present 15,575 100.0 2,971 19.1 1,275 8.2 1,658 10.6 12,641 81.2Male householder, no wife present 5,661 100.0 807 14.3 298 5.3 471 8.3 4,892 86.4Married couple 57,591 100.0 2,127 3.7 819 1.4 1,269 2.2 55,502 96.4
Non-family household 41,479 100.0 3,960 9.5 2,013 4.9 1,865 4.5 37,601 90.7Female householder 21,688 100.0 1,702 7.8 860 4.0 798 3.7 20,031 92.4Male householder 19,791 100.0 2,258 11.4 1,153 5.8 1,068 5.4 17,571 88.8
Other 102 100.0 11 10.9 6 5.4 6 5.4 91 89.1Race/Ethnicity
Black 16,046 100.0 3,430 21.4 1,588 9.9 1,768 11.0 12,690 79.1Hispanic non-Black 13,710 100.0 2,762 20.1 714 5.2 2,011 14.7 10,986 80.1Asian 4,985 100.0 134 2.7 33 0.7 101 2.0 4,851 97.3American Indian/Alaskan 1,389 100.0 202 14.5 83 5.9 119 8.6 1,187 85.5Hawaiian/Pacific Islander 267 100.0 17 6.2 6 2.1 9 3.5 252 94.3White non-Black non-Hispanic 83,988 100.0 3,330 4.0 1,988 2.4 1,261 1.5 80,739 96.1Other non-Black non-Hispanic 23 100.0 NA NA NA NA NA NA NA NA
Spanish Is Only Language SpokenSpanish is not only language spoken 117,940 100.0 8,965 7.6 4,302 3.6 4,480 3.8 109,159 92.6Spanish is only language spoken 2,467 100.0 910 36.9 109 4.4 790 32.0 1,569 63.6
NativityU.S.-born 104,143 100.0 7,673 7.4 4,038 3.9 3,476 3.3 96,630 92.8Foreign-born citizen 8,380 100.0 453 5.4 134 1.6 305 3.6 7,941 94.8Foreign-born non-citizen 7,885 100.0 1,750 22.2 239 3.0 1,489 18.9 6,157 78.1
Age Group15 to 24 years 6,299 100.0 1,094 17.4 473 7.5 609 9.7 5,217 82.825 to 34 years 20,374 100.0 2,587 12.7 1,185 5.8 1,377 6.8 17,813 87.435 to 44 years 21,414 100.0 1,994 9.3 832 3.9 1,129 5.3 19,453 90.845 to 54 years 24,658 100.0 2,002 8.1 866 3.5 1,072 4.3 22,720 92.155 to 64 years 22,036 100.0 1,202 5.5 584 2.6 581 2.6 20,871 94.765 years or more 25,625 100.0 997 3.9 471 1.8 501 2.0 24,654 96.2
EducationNo high school degree 14,321 100.0 3,696 25.8 1,346 9.4 2,278 15.9 10,698 74.7High school degree 34,462 100.0 3,764 10.9 1,730 5.0 1,949 5.7 30,782 89.3Some college 34,010 100.0 2,002 5.9 1,153 3.4 820 2.4 32,037 94.2College degree 37,615 100.0 413 1.1 181 0.5 223 0.6 37,211 98.9
Employment StatusEmployed 72,580 100.0 3,818 5.3 1,628 2.2 2,121 2.9 68,831 94.8Unemployed 6,779 100.0 1,525 22.5 822 12.1 669 9.9 5,288 78.0Not in labor force 41,049 100.0 4,532 11.0 1,961 4.8 2,479 6.0 36,609 89.2
Household IncomeLess than $15,000 19,541 100.0 5,510 28.2 2,504 12.8 2,926 15.0 14,111 72.2Between $15,000 and $30,000 22,073 100.0 2,581 11.7 1,161 5.3 1,334 6.0 19,577 88.7Between $30,000 and $50,000 24,787 100.0 1,221 4.9 481 1.9 717 2.9 23,589 95.2Between $50,000 and $75,000 21,975 100.0 431 2.0 202 0.9 222 1.0 21,552 98.1At Least $75,000 32,032 100.0 132 0.4 62 0.2 70 0.2 31,899 99.6
HomeownershipHomeowner 79,144 100.0 2,238 2.8 1,075 1.4 1,105 1.4 76,964 97.2Non-homeowner 41,264 100.0 7,637 18.5 3,336 8.1 4,164 10.1 33,764 81.8
Geographic RegionNortheast 21,784 100.0 1,537 7.1 611 2.8 895 4.1 20,279 93.1Midwest 26,900 100.0 1,920 7.1 1,003 3.7 877 3.3 25,019 93.0South 44,920 100.0 4,493 10.0 1,968 4.4 2,439 5.4 40,513 90.2West 26,804 100.0 1,925 7.2 829 3.1 1,059 3.9 24,917 93.0
Metropolitan StatusMetropolitan Area 100,311 100.0 8,029 8.0 3,492 3.5 4,373 4.4 92,446 92.2
Inside principal city 33,636 100.0 4,066 12.1 1,607 4.8 2,382 7.1 29,647 88.1Not inside principal city 49,548 100.0 2,754 5.6 1,253 2.5 1,439 2.9 46,856 94.6Not identified 17,127 100.0 1,209 7.1 632 3.7 552 3.2 15,943 93.1
Not in Metropolitan Area 19,193 100.0 1,764 9.2 892 4.6 840 4.4 17,462 91.0Not identified 903 100.0 83 9.2 27 3.0 56 6.2 820 90.8
Notes:NA = Not available because the sample size was too small to make an accurate estimate. Figures do not always reconcile to totals because of rounding.

2011 FDIC NatIoNal Survey oF uNbaNkeD aND uNDerbaNkeD HouSeHolDS • September 2012 65
Table A-16 2011 Unbanked Households’ Previous Banking Status by Demographic Characteristics: All Unbanked Households
Household Characteristic
All Unbanked Households
Unbanked StatusPreviously Banked Never-Banked Unknown
Number (1000s)
Pct of Row
Number (1000s)
Pct of Row
Number (1000s)
Pct of Row
Number (1000s)
Pct of Row
All Unbanked Households 9,875 100.0 4,411 44.7 5,269 53.4 196 2.0Household Type
Family household 5,905 100.0 2,392 40.5 3,399 57.6 114 1.9Female householder, no husband present 2,971 100.0 1,275 42.9 1,658 55.8 37 1.2Male householder, no wife present 807 100.0 298 36.9 471 58.4 38 4.7Married couple 2,127 100.0 819 38.5 1,269 59.7 39 1.8
Nonfamily household 3,960 100.0 2,013 50.8 1,865 47.1 82 2.1Female householder 1,702 100.0 860 50.5 798 46.9 44 2.6Male householder 2,258 100.0 1,153 51.1 1,068 47.3 37 1.7
Other 11 100.0 NA NA NA NA NA NARace/Ethnicity
Black 3,430 100.0 1,588 46.3 1,768 51.5 75 2.2Hispanic non-Black 2,762 100.0 714 25.8 2,011 72.8 37 1.4Asian 134 100.0 33 24.2 101 75.3 1 0.5American Indian/Alaskan 202 100.0 83 40.9 119 59.1 - -Hawaiian/Pacific Islander 17 100.0 NA NA NA NA NA NAWhite non-Black non-Hispanic 3,330 100.0 1,988 59.7 1,261 37.9 81 2.4
Spanish Is Only Language SpokenSpanish is not only language spoken 8,965 100.0 4,302 48.0 4,480 50.0 184 2.0Spanish is only language spoken 910 100.0 109 12.0 790 86.7 12 1.3
NativityU.S.-born 7,673 100.0 4,038 52.6 3,476 45.3 159 2.1Foreign-born citizen 453 100.0 134 29.6 305 67.4 14 3.0Foreign-born non-citizen 1,750 100.0 239 13.6 1,489 85.1 22 1.3
Age Group15 to 24 years 1,094 100.0 473 43.2 609 55.7 12 1.125 to 34 years 2,587 100.0 1,185 45.8 1,377 53.2 25 1.035 to 44 years 1,994 100.0 832 41.7 1,129 56.6 33 1.645 to 54 years 2,002 100.0 866 43.2 1,072 53.5 64 3.255 to 64 years 1,202 100.0 584 48.6 581 48.4 37 3.165 years or more 997 100.0 471 47.2 501 50.2 25 2.5
EducationNo high school degree 3,696 100.0 1,346 36.4 2,278 61.6 73 2.0High school degree 3,764 100.0 1,731 46.0 1,949 51.8 85 2.2Some college 2,002 100.0 1,153 57.6 820 40.9 29 1.4College degree 413 100.0 181 43.9 223 53.9 9 2.3
Employment StatusEmployed 3,818 100.0 1,628 42.6 2,121 55.6 69 1.8Unemployed 1,525 100.0 822 53.9 669 43.9 34 2.2Not in labor force 4,532 100.0 1,961 43.3 2,479 54.7 92 2.0
Household IncomeLess than $15,000 5,510 100.0 2,504 45.4 2,926 53.1 80 1.5Between $15,000 and $30,000 2,581 100.0 1,161 45.0 1,334 51.7 85 3.3Between $30,000 and $50,000 1,221 100.0 481 39.4 717 58.7 23 1.9Between $50,000 and $75,000 431 100.0 202 46.8 222 51.5 8 1.8At Least $75,000 132 100.0 62 47.1 70 52.9 - -
HomeownershipHomeowner 2,238 100.0 1,075 48.0 1,105 49.4 58 2.6Non-homeowner 7,637 100.0 3,336 43.7 4,164 54.5 137 1.8
Geographic RegionNortheast 1,537 100.0 611 39.7 895 58.2 32 2.1Midwest 1,920 100.0 1,004 52.3 877 45.7 40 2.1South 4,493 100.0 1,968 43.8 2,439 54.3 86 1.9West 1,925 100.0 829 43.0 1,059 55.0 38 2.0
Metropolitan StatusMetropolitan Area 8,029 100.0 3,492 43.5 4,373 54.5 163 2.0
Inside principal city 4,066 100.0 1,607 39.5 2,383 58.6 77 1.9Not inside principal city 2,754 100.0 1,253 45.5 1,439 52.3 62 2.2Not identified 1,209 100.0 632 52.3 552 45.6 25 2.1
Not in Metropolitan Area 1,764 100.0 892 50.6 840 47.6 32 1.8Not Identified 83 100.0 27 32.4 56 67.6 - -
Notes:NA = Not available because the sample size was too small to make an accurate estimate.- = For this table cell, there were so few sample respondents (in some cases zero) reporting that the estimated universe proportion was rounded to 0.0 percent. It is estimated that the true value is only slightly greater than zero.Figures do not always reconcile to totals because of rounding.

2011 FDIC NatIoNal Survey oF uNbaNkeD aND uNDerbaNkeD HouSeHolDS • September 2012 66
Table A-17 Unbanked Households’ Previous Banking Status by Year: All Households
Household Characteristic
All Households Previously Banked Never BankedPrevious Banking Status Unknown
Number (1000s) Pct of Row Estimated Difference
Pct of Row Estimated Difference
Pct of Row
2009 2011 2009 2011 2009 2011 2009 2011All Households 119,001 120,408 3.8 3.7 -0.2 3.7 4.4 0.7 * 92.5 92.0Household Type
Family household 78,743 78,826 3.5 3.0 -0.4 * 3.5 4.3 0.8 * 93.0 92.7Female householder, no husband present 13,975 15,575 9.9 8.2 -1.7 9.3 10.6 1.4 * 80.8 81.2Male householder, no wife present 5,433 5,661 6.7 5.3 -1.5 7.8 8.3 0.5 85.5 86.4Married couple 59,336 57,591 1.7 1.4 -0.3 * 1.8 2.2 0.4 * 96.5 96.4
Nonfamily household 40,126 41,479 4.4 4.9 0.4 4.0 4.5 0.5 * 91.6 90.7Female householder 21,147 21,688 3.8 4.0 0.2 2.7 3.7 1.0 * 93.5 92.4Male householder 18,979 19,791 5.2 5.8 0.7 5.4 5.4 0.0 89.4 88.8
Other 131 102 13.7 5.4 -8.3 8.9 5.4 -3.4 77.4 89.1Race/Ethnicity
Black 15,541 16,046 11.2 9.9 -1.3 * 9.8 11.0 1.2 * 79.0 79.1Hispanic non-Black 13,241 13,710 5.8 5.2 -0.6 13.2 14.7 1.5 * 81.0 80.1Asian 4,790 4,985 1.1 0.7 -0.5 2.4 2.0 -0.3 96.5 97.3American Indian/Alaskan 1,378 1,389 7.7 5.9 -1.8 7.0 8.6 1.6 85.3 85.5Hawaiian/Pacific Islander 259 267 6.2 2.1 -4.1 2.4 3.5 1.2 91.4 94.3White non-Black non-Hispanic 83,785 83,988 2.2 2.4 0.2 1.1 1.5 0.4 * 96.7 96.1Other non-Black non-Hispanic 6 NA NA NA NA NA NA NA NA NA
Spanish Is Only Language SpokenSpanish is not only language spoken 116,479 117,940 3.8 3.6 -0.1 3.1 3.8 0.7 * 93.1 92.6Spanish is only language spoken 2,522 2,467 5.5 4.4 -1.0 29.9 32.0 2.1 64.7 63.6
NativityU.S.-born 103,091 104,143 3.9 3.9 -0.0 2.7 3.3 0.6 * 93.4 92.8Foreign-born citizen 7,829 8,380 2.1 1.6 -0.5 3.1 3.6 0.5 94.7 94.8Foreign-born non-citizen 8,081 7,885 4.5 3.0 -1.5 16.9 18.9 2.0 78.6 78.1
Age Group15 to 24 years 6,596 6,300 7.7 7.5 -0.2 8.0 9.7 1.7 * 84.3 82.825 to 34 years 19,702 20,374 5.8 5.8 -0.0 5.7 6.8 1.1 * 88.5 87.435 to 44 years 22,590 21,414 4.6 3.9 -0.7 4.2 5.3 1.1 * 91.2 90.845 to 54 years 24,863 24,658 3.8 3.5 -0.3 3.5 4.3 0.8 * 92.7 92.155 to 64 years 20,274 22,036 2.5 2.6 0.1 2.2 2.6 0.4 95.2 94.765 years or more 24,977 25,625 1.6 1.8 0.2 1.8 2.0 0.1 96.6 96.2
EducationNo high school degree 15,006 14,321 9.1 9.4 0.3 15.1 15.9 0.8 75.8 74.7High school degree 34,654 34,462 5.2 5.0 -0.2 4.2 5.7 1.5 * 90.6 89.3Some college 33,312 34,010 3.4 3.4 -0.0 1.4 2.4 1.0 * 95.2 94.2College degree 36,029 37,615 0.6 0.5 -0.1 0.6 0.6 0.0 98.8 98.9
Employment StatusEmployed 73,155 72,580 2.8 2.2 -0.6 * 2.5 2.9 0.4 * 94.6 94.8Unemployed 6,642 6,779 10.4 12.1 1.7 8.4 9.9 1.4 81.2 78.0Not in labor force 39,203 41,049 4.6 4.8 0.2 5.0 6.0 1.0 * 90.4 89.2
Household IncomeLess than $15,000 15,689 16,699 13.9 13.7 -0.2 13.0 15.6 2.6 * 73.1 70.7Between $15,000 and $30,000 17,443 18,599 6.6 5.5 -1.2 6.1 5.7 -0.4 87.3 88.9Between $30,000 and $50,000 21,512 20,984 2.2 1.8 -0.4 1.9 2.6 0.8 * 95.9 95.5Between $50,000 and $75,000 18,988 18,773 1.0 0.7 -0.3 0.5 0.7 0.2 98.5 98.7At Least $75,000 27,881 27,770 0.1 0.1 0.0 0.2 0.1 -0.1 99.7 99.8Unknown 17,488 17,583 2.9 3.2 0.2 4.3 5.1 0.8 * 92.8 91.7
HomeownershipHomeowner 80,388 79,144 1.4 1.4 -0.0 1.1 1.4 0.3 * 97.5 97.2Non-homeowner 38,613 41,264 8.8 8.1 -0.8 9.0 10.1 1.1 * 82.2 81.8
Geographic RegionNortheast 21,689 21,784 3.3 2.8 -0.5 3.5 4.1 0.6 93.2 93.1Midwest 26,601 26,900 3.6 3.7 0.1 2.4 3.3 0.9 * 94.0 93.0South 44,081 44,920 4.5 4.4 -0.1 4.7 5.4 0.7 * 90.7 90.2West 26,630 26,804 3.2 3.1 -0.1 3.4 3.9 0.5 93.3 93.0
* Indicates differences that are statistically significant at the 10% level.NA = Not available because the sample size was too small to make an accurate estimate.Figures do not always reconcile to totals because of rounding.2009 data revised September 2012. Refer to 2009 and 2011 FDIC National Survey of Unbanked and Underbanked Households and Technical Notes for terms, definitions, and methodological discussion.

2011 FDIC NatIoNal Survey oF uNbaNkeD aND uNDerbaNkeD HouSeHolDS • September 2012 67
Table A-18 2011 Timeframe in Which Previously Banked Households Became Unbanked by Demographic Characteristics
Household Characteristic
All Previously Unbanked Households
Had Bank Account in Last YearWithin the last year More than 1 year ago Unknown
Number (1000s)
Pct of Row
Number (1000s)
Pct of Row
Number (1000s)
Pct of Row
Number (1000s)
Pct of Row
All Previously Banked Households 4,411 100.0 896 20.3 3,439 78.0 76 1.7Household Type
Family household 2,392 100.0 557 23.3 1,785 74.6 50 2.1Female householder, no husband present 1,275 100.0 274 21.5 982 77.0 20 1.5Male householder, no wife present 298 100.0 90 30.1 197 66.3 11 3.6Married couple 819 100.0 194 23.6 606 74.0 20 2.4
Nonfamily household 2,013 100.0 338 16.8 1,649 81.9 26 1.3Female householder 860 100.0 131 15.3 712 82.7 17 2.0Male householder 1,153 100.0 207 18.0 937 81.3 9 0.8
Other 6 100.0 NA NA NA NA NA NARace/Ethnicity
Black 1,588 100.0 349 22.0 1,193 75.2 46 2.9Hispanic non-Black 714 100.0 165 23.1 538 75.3 11 1.5Asian 33 100.0 NA NA NA NA NA NAAmerican Indian/Alaskan 83 100.0 18 21.7 65 78.3 - -Hawaiian/Pacific Islander 6 100.0 NA NA NA NA NA NAWhite non-Black non-Hispanic 1,988 100.0 364 18.3 1,605 80.7 19 1.0
Spanish Is Only Language SpokenSpanish is not only language spoken 4,302 100.0 870 20.2 3,355 78.0 76 1.8Spanish is only language spoken 109 100.0 25 23.2 84 76.8 - -
NativityU.S.-born 4,038 100.0 812 20.1 3,154 78.1 72 1.8Foreign-born citizen 134 100.0 27 20.0 107 79.6 1 0.4Foreign-born non-citizen 239 100.0 57 24.0 178 74.7 3 1.3
Age Group15 to 24 years 473 100.0 169 35.7 303 63.9 2 0.425 to 34 years 1,185 100.0 269 22.7 897 75.7 19 1.635 to 44 years 832 100.0 171 20.6 650 78.1 11 1.345 to 54 years 866 100.0 194 22.4 658 76.0 14 1.655 to 64 years 584 100.0 63 10.8 498 85.3 22 3.865 years or more 471 100.0 29 6.1 434 92.1 9 1.8
EducationNo high school degree 1,346 100.0 239 17.8 1,091 81.1 15 1.1High school degree 1,731 100.0 317 18.3 1,383 79.9 31 1.8Some college 1,153 100.0 287 24.9 837 72.6 28 2.5College degree 181 100.0 52 28.9 128 70.5 1 0.6
Employment StatusEmployed 1,628 100.0 350 21.5 1,249 76.7 29 1.8Unemployed 822 100.0 225 27.3 588 71.5 9 1.1Not in labor force 1,961 100.0 321 16.4 1,602 81.7 38 1.9
Household IncomeLess than $15,000 2,504 100.0 473 18.9 2,014 80.4 17 0.7Between $15,000 and $30,000 1,161 100.0 264 22.7 872 75.1 26 2.2Between $30,000 and $50,000 481 100.0 103 21.5 355 73.8 23 4.7Between $50,000 and $75,000 202 100.0 40 20.0 153 75.7 9 4.3At Least $75,000 62 100.0 NA NA NA NA NA NA
HomeownershipHomeowner 1,075 100.0 210 19.6 838 78.0 26 2.4Non-homeowner 3,336 100.0 685 20.5 2,601 78.0 50 1.5
Geographic RegionNortheast 611 100.0 107 17.4 498 81.5 6 1.0Midwest 1,004 100.0 207 20.7 769 76.7 27 2.7South 1,968 100.0 392 19.9 1,538 78.2 37 1.9West 829 100.0 190 22.9 634 76.5 6 0.7
Metropolitan StatusMetropolitan Area 3,492 100.0 750 21.5 2,672 76.5 70 2.0
Inside principal city 1,607 100.0 331 20.6 1,234 76.8 42 2.6Not inside principal city 1,253 100.0 245 19.5 990 79.0 18 1.4Not identified 632 100.0 174 27.6 448 70.9 10 1.5
Not in Metropolitan Area 892 100.0 139 15.6 747 83.7 6 0.7Not Identified 27 100.0 NA NA NA NA NA NA
Notes:NA = Not available because the sample size was too small to make an accurate estimate.- = For this table cell, there were so few sample respondents (in some cases zero) reporting that the estimated universe proportion was rounded to 0.0 percent. It is estimated that the true value is only slightly greater than zero.Figures do not always reconcile to totals because of rounding.

2011 FDIC NatIoNal Survey oF uNbaNkeD aND uNDerbaNkeD HouSeHolDS • September 2012 68
Table A-19 Timeframe in Which Previously Banked Household Became Unbanked by Year
Household Characteristic
All Previously Banked Households
(1000s)
Last Time Household Had a Bank Account
Within the Last Year Over a Year Ago Unknown
Pct of Row Estimated Difference
Pct of Row Estimated Difference
Pct of Row
2009 2011 2009 2011 2009 2011 2009 2011All Previously Banked Households 4,543 4,411 28.0 20.3 -7.7 * 71.1 78.0 6.9 * 0.8 1.7Household Type
Family household 2,744 2,392 32.5 23.3 -9.2 * 66.6 74.6 8.0 * 0.9 2.1Female householder, no husband present 1,385 1,275 31.7 21.5 -10.2 * 67.5 77.0 9.5 * 0.8 1.5Male householder, no wife present 366 298 29.4 30.1 0.7 69.0 66.3 -2.7 1.6 3.6Married couple 993 819 34.7 23.6 -11.1 * 64.4 74.0 9.6 * 0.9 2.4
Nonfamily household 1,781 2,013 21.2 16.8 -4.4 * 78.1 81.9 3.8 0.7 1.3Female householder 802 860 19.3 15.3 -4.0 79.7 82.7 3.0 1.0 2.0Male householder 980 1,153 22.8 18.0 -4.9 76.7 81.3 4.6 0.4 0.8
Other 18 6 NA NA NA NA NA NA NA NARace/Ethnicity
Black 1,746 1,588 24.7 22.0 -2.7 74.0 75.2 1.2 1.3 2.9Hispanic non-Black 775 714 37.9 23.1 -14.7 * 61.1 75.3 14.3 * 1.0 1.5Asian 53 33 26.7 0.0 -26.7 * 73.3 100.0 26.7 * - -American Indian/Alaskan 106 83 39.0 21.7 -17.2 61.0 78.3 17.2 - -Hawaiian/Pacific Islander 16 6 NA NA NA NA NA NA NA NAWhite non-Black non-Hispanic 1,847 1,988 26.6 18.3 -8.3 * 73.1 80.7 7.7 * 0.3 1.0Other non-Black non-Hispanic 0 - NA NA NA NA NA NA NA NA
Spanish Is Only Language SpokenSpanish is not only language spoken 4,405 4,302 27.9 20.2 -7.6 * 71.4 78.0 6.6 * 0.8 1.8Spanish is only language spoken 138 109 33.9 23.2 -10.6 63.3 76.8 13.4 2.8 0.0
NativityU.S.-born 4,010 4,038 26.6 20.1 -6.5 * 72.6 78.1 5.5 * 0.7 1.8Foreign-born citizen 168 134 49.3 20.0 -29.4 * 48.1 79.6 31.5 * 2.5 0.4Foreign-born non-citizen 365 239 33.9 24.0 -9.9 65.0 74.7 9.7 1.1 1.3
Age Group15 to 24 years 509 473 43.9 35.7 -8.2 54.1 63.9 9.8 2.0 0.425 to 34 years 1,152 1,185 33.8 22.7 -11.1 * 65.6 75.7 10.1 * 0.6 1.635 to 44 years 1,028 832 28.1 20.6 -7.5 * 71.5 78.1 6.7 * 0.4 1.345 to 54 years 945 866 24.3 22.4 -1.9 74.8 76.0 1.2 0.9 1.655 to 64 years 512 584 19.0 10.8 -8.2 * 81.0 85.3 4.3 0.0 3.865 years or more 398 471 11.4 6.1 -5.3 86.5 92.1 5.6 2.1 1.8
EducationNo high school degree 1,372 1,346 24.0 17.8 -6.2 * 75.0 81.1 6.1 * 1.0 1.1High school degree 1,819 1,731 29.7 18.3 -11.4 * 69.0 79.9 10.9 * 1.3 1.8Some college 1,136 1,153 30.5 24.9 -5.6 69.5 72.6 3.1 0.0 2.5College degree 216 181 27.1 28.9 1.8 72.9 70.5 -2.4 0.0 0.6
Employment StatusEmployed 2,064 1,628 29.4 21.5 -7.9 * 70.1 76.7 6.6 * 0.5 1.8Unemployed 690 822 36.5 27.3 -9.1 * 63.5 71.5 8.0 * 0.0 1.1Not in labor force 1,789 1,961 23.3 16.4 -6.9 * 75.2 81.7 6.5 * 1.5 1.9
Household IncomeLess than $15,000 2,178 2,291 25.4 19.0 -6.4 * 73.9 80.6 6.6 * 0.7 0.4Between $15,000 and $30,000 1,157 1,018 30.8 21.9 -9.0 * 68.8 76.4 7.6 * 0.4 1.8Between $30,000 and $50,000 476 383 33.8 25.0 -8.8 65.4 72.2 6.8 0.8 2.9Between $50,000 and $75,000 188 124 40.9 21.1 -19.8 * 59.1 75.6 16.5 0.0 3.2At Least $75,000 30 37 NA NA NA NA NA NA NA NAUnknown 514 558 22.0 19.1 -2.9 75.1 75.2 0.0 2.9 5.7
HomeownershipHomeowner 1,127 1,075 26.6 19.6 -7.1 * 72.3 78.0 5.7 1.1 2.4Non-homeowner 3,416 3,336 28.5 20.5 -8.0 * 70.7 78.0 7.2 * 0.8 1.5
Geographic RegionNortheast 721 611 23.9 17.4 -6.5 75.4 81.5 6.1 0.6 1.0Midwest 964 1,004 27.4 20.7 -6.8 71.2 76.7 5.4 1.3 2.7South 1,996 1,968 28.8 19.9 -8.9 70.6 78.2 7.6 0.6 1.9West 861 829 30.4 22.9 -7.5 68.6 76.5 7.8 0.9 0.7
Notes:* Indicates differences that are statistically significant at the 10% level.NA = Not available because the sample size was too small to make an accurate estimate.- = For this table cell, there were so few sample respondents (in some cases zero) reporting that the estimated universe proportion was rounded to 0.0 percent. It is estimated that the true value is only slightly greater than zero. (if applicable)Figures do not always reconcile to totals because of rounding.2009 data revised September 2012. Refer to 2009 and 2011 FDIC National Survey of Unbanked and Underbanked Households and Technical Notes for terms, definitions, and methodological discussion.
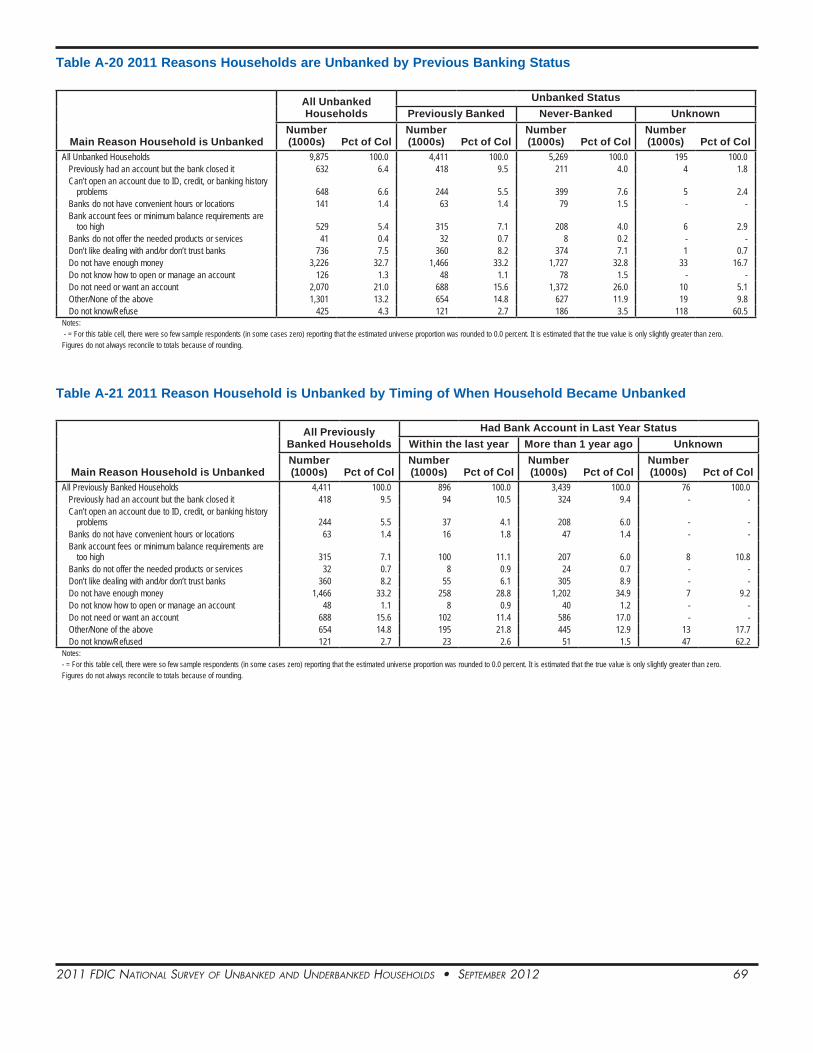
2011 FDIC NatIoNal Survey oF uNbaNkeD aND uNDerbaNkeD HouSeHolDS • September 2012 69
Table A-20 2011 Reasons Households are Unbanked by Previous Banking Status
Main Reason Household is Unbanked
All Unbanked Households
Unbanked StatusPreviously Banked Never-Banked Unknown
Number (1000s) Pct of Col
Number (1000s) Pct of Col
Number (1000s) Pct of Col
Number (1000s) Pct of Col
All Unbanked Households 9,875 100.0 4,411 100.0 5,269 100.0 195 100.0Previously had an account but the bank closed it 632 6.4 418 9.5 211 4.0 4 1.8Can’t open an account due to ID, credit, or banking history
problems 648 6.6 244 5.5 399 7.6 5 2.4Banks do not have convenient hours or locations 141 1.4 63 1.4 79 1.5 - -Bank account fees or minimum balance requirements are
too high 529 5.4 315 7.1 208 4.0 6 2.9Banks do not offer the needed products or services 41 0.4 32 0.7 8 0.2 - -Don’t like dealing with and/or don’t trust banks 736 7.5 360 8.2 374 7.1 1 0.7Do not have enough money 3,226 32.7 1,466 33.2 1,727 32.8 33 16.7Do not know how to open or manage an account 126 1.3 48 1.1 78 1.5 - -Do not need or want an account 2,070 21.0 688 15.6 1,372 26.0 10 5.1Other/None of the above 1,301 13.2 654 14.8 627 11.9 19 9.8Do not know/Refuse 425 4.3 121 2.7 186 3.5 118 60.5
Notes: - = For this table cell, there were so few sample respondents (in some cases zero) reporting that the estimated universe proportion was rounded to 0.0 percent. It is estimated that the true value is only slightly greater than zero.Figures do not always reconcile to totals because of rounding.
Table A-21 2011 Reason Household is Unbanked by Timing of When Household Became Unbanked
Main Reason Household is Unbanked
All Previously Banked Households
Had Bank Account in Last Year StatusWithin the last year More than 1 year ago Unknown
Number (1000s) Pct of Col
Number (1000s) Pct of Col
Number (1000s) Pct of Col
Number (1000s) Pct of Col
All Previously Banked Households 4,411 100.0 896 100.0 3,439 100.0 76 100.0Previously had an account but the bank closed it 418 9.5 94 10.5 324 9.4 - -Can’t open an account due to ID, credit, or banking history
problems 244 5.5 37 4.1 208 6.0 - -Banks do not have convenient hours or locations 63 1.4 16 1.8 47 1.4 - -Bank account fees or minimum balance requirements are
too high 315 7.1 100 11.1 207 6.0 8 10.8Banks do not offer the needed products or services 32 0.7 8 0.9 24 0.7 - -Don’t like dealing with and/or don’t trust banks 360 8.2 55 6.1 305 8.9 - -Do not have enough money 1,466 33.2 258 28.8 1,202 34.9 7 9.2Do not know how to open or manage an account 48 1.1 8 0.9 40 1.2 - -Do not need or want an account 688 15.6 102 11.4 586 17.0 - -Other/None of the above 654 14.8 195 21.8 445 12.9 13 17.7Do not know/Refused 121 2.7 23 2.6 51 1.5 47 62.2
Notes:- = For this table cell, there were so few sample respondents (in some cases zero) reporting that the estimated universe proportion was rounded to 0.0 percent. It is estimated that the true value is only slightly greater than zero.Figures do not always reconcile to totals because of rounding.

2011 FDIC NatIoNal Survey oF uNbaNkeD aND uNDerbaNkeD HouSeHolDS • September 2012 70
Table A-22 2011 Reason Household is Unbanked by Race/Ethnicity
Main Reason Household is Unbanked
All Unbanked
Race/Ethnicity
BlackHispanic
non-BlackWhite non-Black
non-HispanicOther non-Black
non-HispanicNumber (1000s)
Pct of Col
Number (1000s)
Pct of Col
Number (1000s)
Pct of Col
Number (1000s)
Pct of Col
Number (1000s)
Pct of Col
All Unbanked Households 9,875 100.0 3,430 100.0 2,762 100.0 3,330 100.0 353 100.0Previously had an account but the bank closed it 632 6.4 261 7.6 102 3.7 246 7.4 23 6.4Can’t open an account due to ID, credit, or banking
history problems 648 6.6 165 4.8 310 11.2 159 4.8 14 4.0Banks do not have convenient hours or locations 141 1.4 40 1.2 48 1.8 46 1.4 7 2.0Bank account fees or minimum balance requirements
are too high 529 5.4 202 5.9 134 4.8 187 5.6 6 1.7Banks do not offer the needed products or services 41 0.4 9 0.3 12 0.4 20 0.6 - -Don’t like dealing with and/or don’t trust banks 736 7.5 205 6.0 203 7.3 304 9.1 24 6.7Do not have enough money 3,226 32.7 1,230 35.9 902 32.7 971 29.2 123 34.9Do not know how to open or manage an account 126 1.3 40 1.2 36 1.3 49 1.5 2 0.5Do not need or want an account 2,070 21.0 707 20.6 610 22.1 675 20.3 79 22.3Other/None of the above 1,301 13.2 406 11.8 306 11.1 524 15.7 65 18.5Do not know/Refused 425 4.3 165 4.8 100 3.6 149 4.5 11 3.0
Notes:- = For this table cell, there were so few sample respondents (in some cases zero) reporting that the estimated universe proportion was rounded to 0.0 percent. It is estimated that the true value is only slightly greater than zero.Figures do not always reconcile to totals because of rounding.
Table A-23 2011 Reason Household is Unbanked by Nativity and Spanish Language Usage
Main Reason Household is Unbanked
All Unbanked
Nativity Spanish is Only Language Spoken
U.S.-born Foreign-born citizenForeign-born non-citizen
Spanish is not only language spoken
Spanish is only language spoken
Number (1000s)
Pct of Col
Number (1000s)
Pct of Col
Number (1000s)
Pct of Col
Number (1000s)
Pct of Col
Number (1000s)
Pct of Col
Number (1000s)
Pct of Col
All Unbanked Households 9,875 100.0 7,673 100.0 453 100.0 1,750 100.0 8,965 100.0 910 100.0Previously had an account but the bank closed it 632 6.4 549 7.2 25 5.4 59 3.3 602 6.7 30 3.3Can’t open an account due to ID, credit, or bank-
ing history problems 648 6.6 367 4.8 10 2.2 271 15.5 479 5.3 169 18.5Banks do not have convenient hours or locations 141 1.4 109 1.4 3 0.8 28 1.6 136 1.5 5 0.6Bank account fees or minimum balance require-
ments are too high 529 5.4 444 5.8 12 2.7 73 4.2 498 5.6 31 3.4Banks do not offer the needed products or
services 41 0.4 36 0.5 - - 4 0.2 37 0.4 4 0.4Don’t like dealing with and/or don’t trust banks 736 7.5 597 7.8 24 5.3 115 6.6 671 7.5 65 7.1Do not have enough money 3,226 32.7 2,529 33.0 153 33.9 544 31.1 2,945 32.8 282 30.9Do not know how to open or manage an account 126 1.3 83 1.1 3 0.8 39 2.2 111 1.2 15 1.7Do not need or want an account 2,070 21.0 1,550 20.2 103 22.8 417 23.8 1,864 20.8 207 22.7Other/None of the above 1,301 13.2 1,064 13.9 86 18.9 151 8.6 1,215 13.5 86 9.4Do not know/Refused 425 4.3 343 4.5 33 7.3 49 2.8 407 4.5 18 1.9
Notes:- = For this table cell, there were so few sample respondents (in some cases zero) reporting that the estimated universe proportion was rounded to 0.0 percent. It is estimated that the true value is only slightly greater than zero.Figures do not always reconcile to totals because of rounding.

2011 FDIC NatIoNal Survey oF uNbaNkeD aND uNDerbaNkeD HouSeHolDS • September 2012 71
Table A-24 2011 Reason Household is Unbanked by Education
Main Reason Household is Unbanked
All Unbanked
EducationNo high school
degreeHigh school
degree Some college College degreeNumber (1000s)
Pct of Col
Number (1000s)
Pct of Col
Number (1000s)
Pct of Col
Number (1000s)
Pct of Col
Number (1000s)
Pct of Col
All Unbanked Households 9,875 100.0 3,696 100.0 3,764 100.0 2,002 100.0 413 100.0Previously had an account but the bank closed it 632 6.4 162 4.4 293 7.8 158 7.9 19 4.6Can’t open an account due to ID, credit, or banking
history problems 648 6.6 284 7.7 257 6.8 87 4.4 19 4.6Banks do not have convenient hours or locations 141 1.4 51 1.4 57 1.5 28 1.4 5 1.2Bank account fees or minimum balance requirements
are too high 529 5.4 141 3.8 199 5.3 171 8.6 17 4.2Banks do not offer the needed products or services 41 0.4 3 0.1 22 0.6 12 0.6 4 0.9Don’t like dealing with and/or don’t trust banks 736 7.5 280 7.6 272 7.2 154 7.7 29 7.1Do not have enough money 3,226 32.7 1,334 36.1 1,188 31.6 595 29.7 109 26.3Do not know how to open or manage an account 126 1.3 40 1.1 48 1.3 22 1.1 16 4.0Do not need or want an account 2,070 21.0 801 21.7 791 21.0 386 19.3 92 22.2Other/None of the above 1,301 13.2 471 12.7 463 12.3 306 15.3 61 14.7Do not know/Refused 425 4.3 128 3.5 174 4.6 81 4.0 42 10.2
Notes:Figures do not always reconcile to totals because of rounding.
Table A-25 2011 Reason Household is Unbanked by Household Income
Main Reason Household is Unbanked
All Unbanked
Household Income
Less than $15,000Between $15,000
and $30,000Between $30,000
and $50,000Between $50,000
and $75,000 At Least $75,000
Number (1000s)
Pct of Col
Number (1000s)
Pct of Col
Number (1000s)
Pct of Col
Number (1000s) Pct of Col
Number (1000s)
Pct of Col
Number (1000s)
Pct of Col
All Unbanked Households 9,875 100.0 5,510 100.0 2,581 100.0 1,221 100.0 431 100.0 132 100.0Previously had an account but the bank closed it 632 6.4 387 7.0 155 6.0 65 5.3 23 5.3 2 1.8Can’t open an account due to ID, credit, or bank-
ing history problems 648 6.6 306 5.6 171 6.6 114 9.3 49 11.3 8 5.8Banks do not have convenient hours or locations 141 1.4 57 1.0 54 2.1 21 1.7 - - 8 6.2Bank account fees or minimum balance require-
ments are too high 529 5.4 219 4.0 180 7.0 98 8.0 28 6.6 4 3.0Banks do not offer the needed products or
services 41 0.4 27 1 4 - 7 1 4 1 - -Don’t like dealing with and/or don’t trust banks 736 7.5 343 6.2 229 8.9 139 11.4 24 5.7 1 0.6Do not have enough money 3,226 32.7 2,119 38.5 714 27.7 281 23.0 77 17.9 35 26.3Do not know how to open or manage an account 126 1.3 63 1.1 28 1.1 21 1.7 9 2.0 5 4.1Do not need or want an account 2,070 21.0 1,105 20.1 584 22.6 249 20.4 103 23.9 29 22.1Other/None of the above 1,301 13.2 716 13.0 325 12.6 158 12.9 68 15.7 35 26.4Do not know/Refused 425 4.3 169 3.1 137 5.3 68 5.6 46 10.7 5 3.8
Notes:- = For this table cell, there were so few sample respondents (in some cases zero) reporting that the estimated universe proportion was rounded to 0.0 percent. It is estimated that the true value is only slightly greater than zero.Figures do not always reconcile to totals because of rounding.
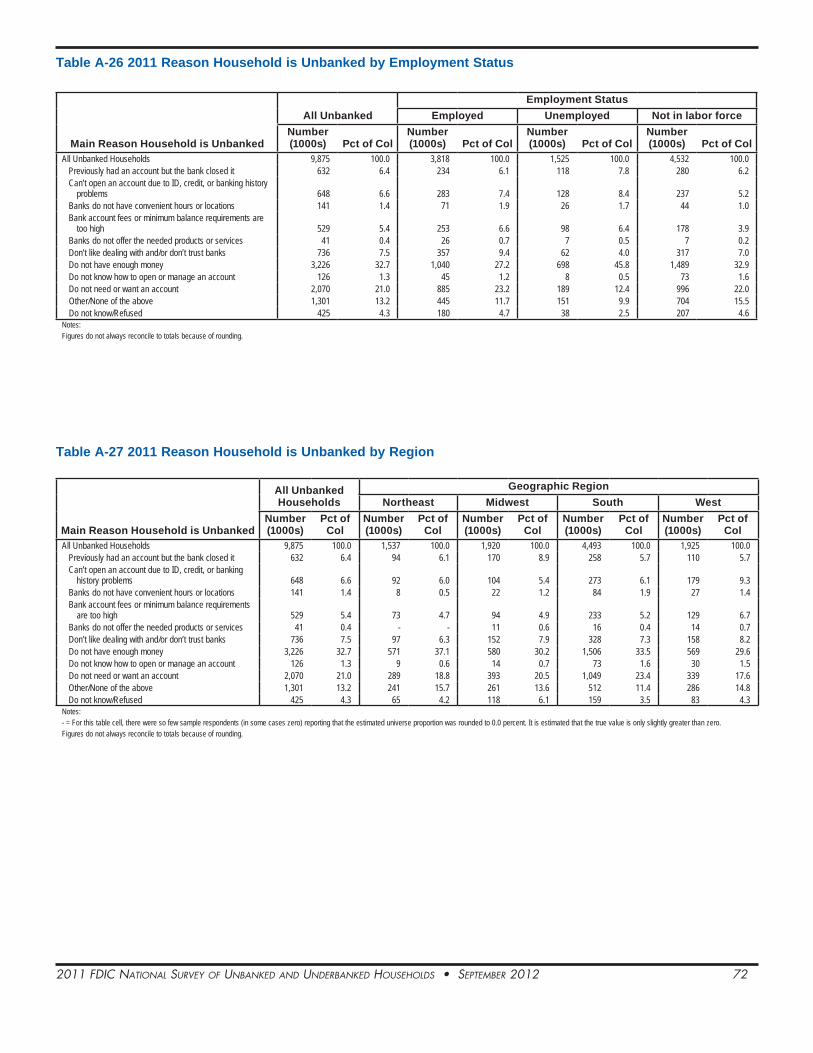
2011 FDIC NatIoNal Survey oF uNbaNkeD aND uNDerbaNkeD HouSeHolDS • September 2012 72
Table A-26 2011 Reason Household is Unbanked by Employment Status
Main Reason Household is Unbanked
All UnbankedEmployment Status
Employed Unemployed Not in labor forceNumber (1000s) Pct of Col
Number (1000s) Pct of Col
Number (1000s) Pct of Col
Number (1000s) Pct of Col
All Unbanked Households 9,875 100.0 3,818 100.0 1,525 100.0 4,532 100.0Previously had an account but the bank closed it 632 6.4 234 6.1 118 7.8 280 6.2Can’t open an account due to ID, credit, or banking history
problems 648 6.6 283 7.4 128 8.4 237 5.2Banks do not have convenient hours or locations 141 1.4 71 1.9 26 1.7 44 1.0Bank account fees or minimum balance requirements are
too high 529 5.4 253 6.6 98 6.4 178 3.9Banks do not offer the needed products or services 41 0.4 26 0.7 7 0.5 7 0.2Don’t like dealing with and/or don’t trust banks 736 7.5 357 9.4 62 4.0 317 7.0Do not have enough money 3,226 32.7 1,040 27.2 698 45.8 1,489 32.9Do not know how to open or manage an account 126 1.3 45 1.2 8 0.5 73 1.6Do not need or want an account 2,070 21.0 885 23.2 189 12.4 996 22.0Other/None of the above 1,301 13.2 445 11.7 151 9.9 704 15.5Do not know/Refused 425 4.3 180 4.7 38 2.5 207 4.6
Notes:Figures do not always reconcile to totals because of rounding.
Table A-27 2011 Reason Household is Unbanked by Region
Main Reason Household is Unbanked
All Unbanked Households
Geographic RegionNortheast Midwest South West
Number (1000s)
Pct of Col
Number (1000s)
Pct of Col
Number (1000s)
Pct of Col
Number (1000s)
Pct of Col
Number (1000s)
Pct of Col
All Unbanked Households 9,875 100.0 1,537 100.0 1,920 100.0 4,493 100.0 1,925 100.0Previously had an account but the bank closed it 632 6.4 94 6.1 170 8.9 258 5.7 110 5.7Can’t open an account due to ID, credit, or banking
history problems 648 6.6 92 6.0 104 5.4 273 6.1 179 9.3Banks do not have convenient hours or locations 141 1.4 8 0.5 22 1.2 84 1.9 27 1.4Bank account fees or minimum balance requirements
are too high 529 5.4 73 4.7 94 4.9 233 5.2 129 6.7Banks do not offer the needed products or services 41 0.4 - - 11 0.6 16 0.4 14 0.7Don’t like dealing with and/or don’t trust banks 736 7.5 97 6.3 152 7.9 328 7.3 158 8.2Do not have enough money 3,226 32.7 571 37.1 580 30.2 1,506 33.5 569 29.6Do not know how to open or manage an account 126 1.3 9 0.6 14 0.7 73 1.6 30 1.5Do not need or want an account 2,070 21.0 289 18.8 393 20.5 1,049 23.4 339 17.6Other/None of the above 1,301 13.2 241 15.7 261 13.6 512 11.4 286 14.8Do not know/Refused 425 4.3 65 4.2 118 6.1 159 3.5 83 4.3
Notes:- = For this table cell, there were so few sample respondents (in some cases zero) reporting that the estimated universe proportion was rounded to 0.0 percent. It is estimated that the true value is only slightly greater than zero.Figures do not always reconcile to totals because of rounding.

2011 FDIC NatIoNal Survey oF uNbaNkeD aND uNDerbaNkeD HouSeHolDS • September 2012 73
Table A-28 2011 Follow-Up Reasons Households are Unbanked
Follow Up Reasons Households are Unbanked
Unbanked HouseholdsNumber (1000s) Pct of Col
Bank Closed Account Due to Overdrafts or Bounced ChecksYes 290 45.8No 324 51.2Do not Know/Refused 19 2.9Total 632 100.0
Household Can’t Open an Account Do not have the required identification to open an account 245 37.8Bad credit history 184 28.4Past banking history problems 176 27.2Other reason 26 4.1Do not Know/Refused 16 2.5Total 648 100.0
Banks are InconvenientBank has inconvenient hours 79 55.9Bank has inconvenient locations 56 39.4Other reason 3 2.1Do not Know/Refused 4 2.6Total 141 100.0
High Fees or Balance RequirementsServices charges are too high 215 40.6Unexpected fees, such as overdraft charges 130 24.5Minimum balances are too high 167 31.6Other reason 17 3.1Do not Know/Refused 1 0.1Total 529 100.0
Main Service Needed Not Offered by BanksBanks do not offer wire transfer (remittance) services NA NAIt takes too long to get funds from deposited checks NA NACannot borrow money needed from banks NA NADo not Know/Refused NA NATotal 41 100.0
Household Does Not Trust Banks or Like Dealing with BanksThere are language barriers at banks 28 3.7Do not trust banks 437 59.4Banks do not feel comfortable or welcoming 150 20.4Other reason 109 14.8Do not Know/Refused 12 1.6Total 736 100.0
Notes:Totals are based on households that reported the specified main reason for not having an account. Households that reported that the main reason for not having is that they “Do not have enough money”, or “Do not know how to open or manage an account”, or “Do not need or want an account” were not asked additional follow up reasons.NA = Not available because the sample size was too small to make an accurate estimate.Figures do not always reconcile to totals because of rounding.
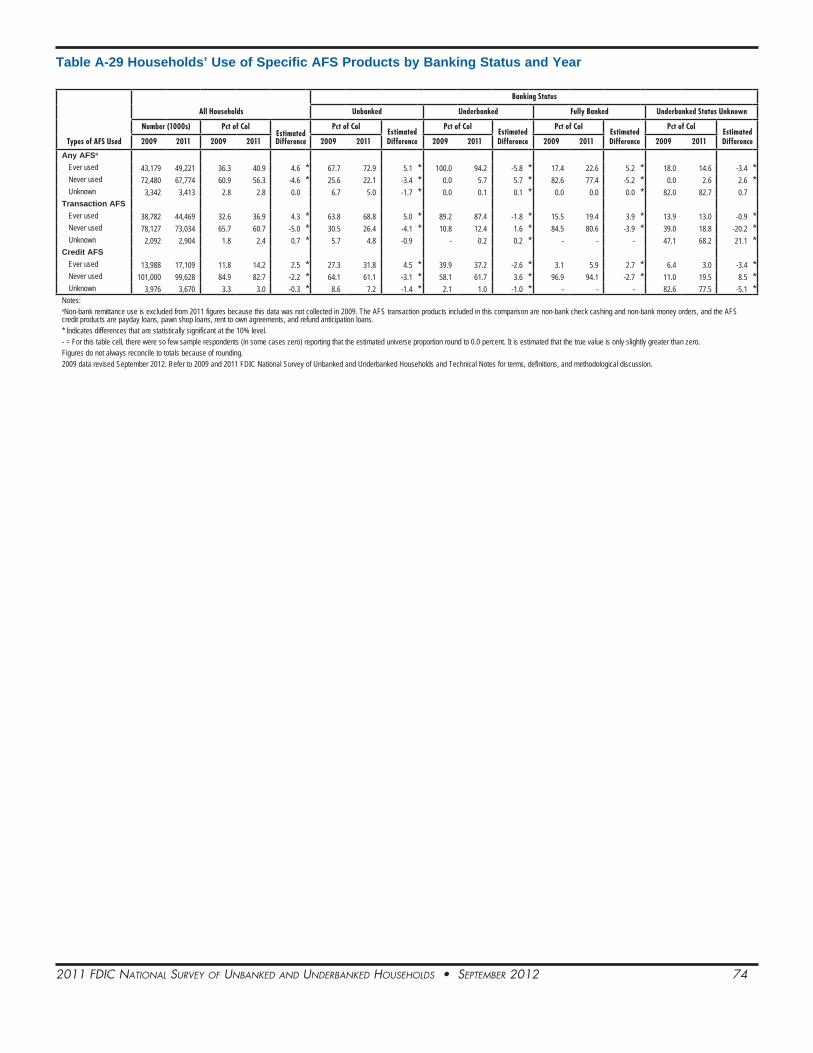
2011 FDIC NatIoNal Survey oF uNbaNkeD aND uNDerbaNkeD HouSeHolDS • September 2012 74
Table A-29 Households’ Use of Specific AFS Products by Banking Status and Year
Types of AFS Used
All Households
Banking Status
Unbanked Underbanked Fully Banked Underbanked Status Unknown
Number (1000s) Pct of ColEstimated Difference
Pct of ColEstimated Difference
Pct of ColEstimated Difference
Pct of ColEstimated Difference
Pct of ColEstimated Difference2009 2011 2009 2011 2009 2011 2009 2011 2009 2011 2009 2011
Any AFSa
Ever used 43,179 49,221 36.3 40.9 4.6 * 67.7 72.9 5.1 * 100.0 94.2 -5.8 * 17.4 22.6 5.2 * 18.0 14.6 -3.4 *Never used 72,480 67,774 60.9 56.3 -4.6 * 25.6 22.1 -3.4 * 0.0 5.7 5.7 * 82.6 77.4 -5.2 * 0.0 2.6 2.6 *Unknown 3,342 3,413 2.8 2.8 0.0 6.7 5.0 -1.7 * 0.0 0.1 0.1 * 0.0 0.0 0.0 * 82.0 82.7 0.7
Transaction AFSEver used 38,782 44,469 32.6 36.9 4.3 * 63.8 68.8 5.0 * 89.2 87.4 -1.8 * 15.5 19.4 3.9 * 13.9 13.0 -0.9 *Never used 78,127 73,034 65.7 60.7 -5.0 * 30.5 26.4 -4.1 * 10.8 12.4 1.6 * 84.5 80.6 -3.9 * 39.0 18.8 -20.2 *Unknown 2,092 2,904 1.8 2.4 0.7 * 5.7 4.8 -0.9 - 0.2 0.2 * - - - 47.1 68.2 21.1 *
Credit AFSEver used 13,988 17,109 11.8 14.2 2.5 * 27.3 31.8 4.5 * 39.9 37.2 -2.6 * 3.1 5.9 2.7 * 6.4 3.0 -3.4 *Never used 101,000 99,628 84.9 82.7 -2.2 * 64.1 61.1 -3.1 * 58.1 61.7 3.6 * 96.9 94.1 -2.7 * 11.0 19.5 8.5 *Unknown 3,976 3,670 3.3 3.0 -0.3 * 8.6 7.2 -1.4 * 2.1 1.0 -1.0 * - - - 82.6 77.5 -5.1 *
Notes:aNon-bank remittance use is excluded from 2011 figures because this data was not collected in 2009. The AFS transaction products included in this comparison are non-bank check cashing and non-bank money orders, and the AFS credit products are payday loans, pawn shop loans, rent to own agreements, and refund anticipation loans.* Indicates differences that are statistically significant at the 10% level.- = For this table cell, there were so few sample respondents (in some cases zero) reporting that the estimated universe proportion round to 0.0 percent. It is estimated that the true value is only slightly greater than zero.Figures do not always reconcile to totals because of rounding.2009 data revised September 2012. Refer to 2009 and 2011 FDIC National Survey of Unbanked and Underbanked Households and Technical Notes for terms, definitions, and methodological discussion.

2011 FDIC NatIoNal Survey oF uNbaNkeD aND uNDerbaNkeD HouSeHolDS • September 2012 75
Table A-30 2011 Households’ Use of AFS by Demographic Characteristics
Household Characteristic
All Households
Any AFS Transaction Products Credit Products
Has Ever Used Has Never Used Unknown Has Ever Used Has Never Used Unknown Has Ever Used Has Never Used Unknown
Number (1000s)
Pct of Row
Number (1000s)
Pct of Row
Number (1000s)
Pct of Row
Number (1000s)
Pct of Row
Number (1000s)
Pct of Row
Number (1000s)
Pct of Row
Number (1000s)
Pct of Row
Number (1000s)
Pct of Row
Number (1000s)
Pct of Row
Number (1000s)
Pct of Row
All Households 120,408 100.0 51,611 42.9 65,335 54.3 3,461 2.9 47,109 39.1 70,198 58.3 3,101 2.6 17,109 14.2 99,628 82.7 3,670 3.0Banking Status
Unbanked 9,875 100.0 7,338 74.3 2,036 20.6 501 5.1 6,968 70.6 2,422 24.5 485 4.9 3,138 31.8 6,030 61.1 707 7.2Underbanked 24,199 100.0 24,199 100.0 0 0.0 0 0.0 22,711 93.9 1,458 6.0 30 0.1 9,011 37.2 14,940 61.7 248 1.0Fully Banked 82,830 100.0 19,531 23.6 63,299 76.4 0 0.0 16,945 20.5 65,885 79.5 0 0.0 4,855 5.9 77,975 94.1 0 0.0Banked but Under-
banked Status Unknown 3,504 100.0 543 15.5 0 0.0 2,961 84.5 485 13.8 432 12.3 2,586 73.8 105 3.0 683 19.5 2,716 77.5
Household TypeFamily household 78,826 100.0 34,509 43.8 42,255 53.6 2,062 2.6 31,399 39.8 45,583 57.8 1,845 2.3 11,742 14.9 64,855 82.3 2,229 2.8
Female householder, no husband present 15,575 100.0 9,221 59.2 5,898 37.9 456 2.9 8,287 53.2 6,859 44.0 428 2.7 4,108 26.4 10,876 69.8 591 3.8
Male householder, no wife present 5,661 100.0 3,109 54.9 2,346 41.4 206 3.6 2,816 49.8 2,668 47.1 176 3.1 1,260 22.3 4,162 73.5 239 4.2
Married couple 57,591 100.0 22,179 38.5 34,011 59.1 1,400 2.4 20,295 35.2 36,056 62.6 1,240 2.2 6,374 11.1 49,817 86.5 1,400 2.4Nonfamily household 41,479 100.0 17,042 41.1 23,042 55.6 1,395 3.4 15,657 37.7 24,572 59.2 1,251 3.0 5,352 12.9 34,691 83.6 1,436 3.5
Female householder 21,688 100.0 8,082 37.3 12,803 59.0 803 3.7 7,453 34.4 13,517 62.3 718 3.3 2,364 10.9 18,552 85.5 772 3.6Male householder 19,791 100.0 8,960 45.3 10,239 51.7 591 3.0 8,203 41.5 11,055 55.9 533 2.7 2,988 15.1 16,139 81.5 664 3.4
Other 102 100.0 60 58.7 37 36.7 5 4.6 54 52.7 44 42.7 5 4.6 16 15.2 82 80.2 5 4.6Race and Ethnicity of HouseholderBlack 16,046 100.0 10,242 63.8 5,170 32.2 633 3.9 9,471 59.0 6,012 37.5 563 3.5 4,251 26.5 11,030 68.7 765 4.8Hispanic non-Black 13,710 100.0 7,461 54.4 5,880 42.9 369 2.7 6,911 50.4 6,463 47.1 337 2.5 2,159 15.7 11,038 80.5 513 3.7Asian 4,985 100.0 1,381 27.7 3,439 69.0 165 3.3 1,346 27.0 3,490 70.0 149 3.0 173 3.5 4,640 93.1 173 3.5American Indian/
Alaskan 1,389 100.0 793 57.1 553 39.8 44 3.2 692 49.8 659 47.4 38 2.7 359 25.9 975 70.2 55 3.9Hawaiian/Pacific
Islander 267 100.0 138 51.9 126 47.0 3 1.1 121 45.2 143 53.7 3 1.1 58 21.6 201 75.1 9 3.3White non-Black
non-Hispanic 83,988 100.0 31,580 37.6 50,167 59.7 2,241 2.7 28,554 34.0 53,430 63.6 2,004 2.4 10,103 12.0 71,735 85.4 2,150 2.6Other non-Black
non-Hispanic 23 100.0 NA NA NA NA NA NA NA NA NA NA NA NA NA NA NA NA NA NASpanish is Only Language SpokenSpanish is not only
language spoken 117,940 100.0 50,083 42.5 64,470 54.7 3,388 2.9 45,635 38.7 69,276 58.7 3,030 2.6 16,852 14.3 97,525 82.7 3,563 3.0Spanish is only
language spoken 2,467 100.0 1,528 61.9 865 35.1 74 3.0 1,474 59.7 922 37.4 71 2.9 257 10.4 2,103 85.2 108 4.4Nativity
U.S-born 104,143 100.0 44,416 42.6 56,819 54.6 2,908 2.8 40,200 38.6 61,334 58.9 2,609 2.5 15,938 15.3 85,189 81.8 3,016 2.9Foreign-born citizen 8,380 100.0 3,000 35.8 5,124 61.1 256 3.1 2,882 34.4 5,257 62.7 241 2.9 462 5.5 7,657 91.4 261 3.1Foreign-born non-citizen 7,885 100.0 4,195 53.2 3,392 43.0 298 3.8 4,027 51.1 3,607 45.7 251 3.2 709 9.0 6,781 86.0 394 5.0
Age Group15 to 24 years 6,299 100.0 3,429 54.4 2,717 43.1 154 2.4 3,167 50.3 2,998 47.6 134 2.1 1,223 19.4 4,895 77.7 181 2.925 to 34 years 20,374 100.0 10,276 50.4 9,588 47.1 510 2.5 9,316 45.7 10,585 52.0 473 2.3 4,084 20.0 15,705 77.1 585 2.935 to 44 years 21,414 100.0 10,190 47.6 10,714 50.0 511 2.4 9,147 42.7 11,802 55.1 465 2.2 3,994 18.7 16,821 78.6 599 2.845 to 54 years 24,658 100.0 10,887 44.2 12,973 52.6 798 3.2 9,901 40.2 14,040 56.9 717 2.9 3,823 15.5 19,991 81.1 844 3.455 to 64 years 22,036 100.0 9,015 40.9 12,398 56.3 623 2.8 8,315 37.7 13,168 59.8 554 2.5 2,538 11.5 18,865 85.6 633 2.965 years or more 25,625 100.0 7,815 30.5 16,946 66.1 865 3.4 7,264 28.3 17,604 68.7 757 3.0 1,447 5.6 23,351 91.1 828 3.2
EducationNo high school degree 14,321 100.0 7,854 54.8 5,951 41.6 515 3.6 7,250 50.6 6,597 46.1 474 3.3 2,666 18.6 11,013 76.9 642 4.5High school degree 34,462 100.0 15,851 46.0 17,458 50.7 1,152 3.3 14,288 41.5 19,147 55.6 1,027 3.0 6,060 17.6 27,155 78.8 1,246 3.6Some college 34,010 100.0 15,655 46.0 17,508 51.5 846 2.5 14,010 41.2 19,265 56.6 735 2.2 6,041 17.8 27,072 79.6 897 2.6College degree 37,615 100.0 12,251 32.6 24,417 64.9 947 2.5 11,561 30.7 25,189 67.0 865 2.3 2,342 6.2 34,388 91.4 885 2.4
Employment StatusEmployed 72,580 100.0 31,124 42.9 39,618 54.6 1,839 2.5 28,391 39.1 42,502 58.6 1,688 2.3 9,936 13.7 60,699 83.6 1,945 2.7Unemployed 6,779 100.0 4,004 59.1 2,608 38.5 167 2.5 3,583 52.9 3,044 44.9 151 2.2 1,951 28.8 4,624 68.2 204 3.0Not in labor force 41,049 100.0 16,484 40.2 23,109 56.3 1,456 3.5 15,136 36.9 24,652 60.1 1,261 3.1 5,223 12.7 34,305 83.6 1,521 3.7
Household IncomeLess than $15,000 19,541 100.0 10,745 55.0 8,139 41.6 657 3.4 9,801 50.2 9,141 46.8 599 3.1 4,461 22.8 14,273 73.0 807 4.1Between $15,000 and
$30,000 22,073 100.0 11,016 49.9 10,248 46.4 808 3.7 9,931 45.0 11,423 51.8 719 3.3 4,417 20.0 16,789 76.1 867 3.9Between $30,000 and
$50,000 24,787 100.0 11,157 45.0 12,948 52.2 683 2.8 9,979 40.3 14,216 57.4 592 2.4 3,848 15.5 20,203 81.5 737 3.0Between $50,000 and
$75,000 21,975 100.0 8,532 38.8 12,891 58.7 552 2.5 7,832 35.6 13,644 62.1 499 2.3 2,485 11.3 18,898 86.0 592 2.7At Least $75,000 32,032 100.0 10,161 31.7 21,110 65.9 761 2.4 9,566 29.9 21,774 68.0 692 2.2 1,898 5.9 29,466 92.0 668 2.1
HomeownershipHomeowner 79,144 100.0 28,318 35.8 48,548 61.3 2,278 2.9 25,924 32.8 51,222 64.7 1,998 2.5 7,382 9.3 69,565 87.9 2,197 2.8Non-homeowner 41,264 100.0 23,293 56.4 16,787 40.7 1,183 2.9 21,185 51.3 18,976 46.0 1,103 2.7 9,727 23.6 30,063 72.9 1,473 3.6

2011 FDIC NatIoNal Survey oF uNbaNkeD aND uNDerbaNkeD HouSeHolDS • September 2012 76
Table A-30 2011 Households’ Use of AFS by Demographic Characteristics (continued)
Household Characteristic
All Households
Any AFS Transaction Products Credit Products
Has Ever Used Has Never Used Unknown Has Ever Used Has Never Used Unknown Has Ever Used Has Never Used Unknown
Number (1000s)
Pct of Row
Number (1000s)
Pct of Row
Number (1000s)
Pct of Row
Number (1000s)
Pct of Row
Number (1000s)
Pct of Row
Number (1000s)
Pct of Row
Number (1000s)
Pct of Row
Number (1000s)
Pct of Row
Number (1000s)
Pct of Row
Number (1000s)
Pct of Row
Geographic RegionNortheast 21,784 100.0 8,653 39.7 12,494 57.4 637 2.9 8,201 37.6 13,016 59.7 568 2.6 2,035 9.3 19,109 87.7 641 2.9Midwest 26,900 100.0 10,740 39.9 15,340 57.0 820 3.0 9,623 35.8 16,568 61.6 709 2.6 3,727 13.9 22,340 83.0 833 3.1South 44,920 100.0 21,202 47.2 22,446 50.0 1,271 2.8 19,280 42.9 24,470 54.5 1,170 2.6 7,563 16.8 35,974 80.1 1,382 3.1West 26,804 100.0 11,016 41.1 15,055 56.2 734 2.7 10,006 37.3 16,144 60.2 654 2.4 3,785 14.1 22,206 82.8 814 3.0
Metropolitan StatusMetropolitan Area 100,311 100.0 42,350 42.2 54,983 54.8 2,978 3.0 38,733 38.6 58,893 58.7 2,685 2.7 13,833 13.8 83,284 83.0 3,193 3.2
Inside principal city 33,636 100.0 15,540 46.2 17,040 50.7 1,056 3.1 14,330 42.6 18,345 54.5 960 2.9 5,191 15.4 27,235 81.0 1,210 3.6Not inside principal
city 49,548 100.0 19,478 39.3 28,602 57.7 1,467 3.0 17,888 36.1 30,349 61.3 1,310 2.6 5,808 11.7 42,228 85.2 1,512 3.1Not identified 17,127 100.0 7,332 42.8 9,341 54.5 454 2.7 6,514 38.0 10,198 59.5 414 2.4 2,834 16.5 13,822 80.7 471 2.8
Not in metropolitan area 19,193 100.0 8,789 45.8 9,938 51.8 466 2.4 7,946 41.4 10,851 56.5 396 2.1 3,084 16.1 15,649 81.5 460 2.4Not Identified 903 100.0 473 52.3 413 45.8 17 1.9 430 47.6 454 50.2 19 2.1 191 21.2 694 76.9 17 1.9
Notes:AFS transaction products are non-bank check cashing, non-bank money orders and non-bank remittances. AFS credit products are payday loans, pawn shop loans, rent-to-own agreements and refund anticipation loans. NA = Not available because the sample size was too small to make an accurate estimate.Figures do not always reconcile to totals because of the rounding.

2011 FDIC NatIoNal Survey oF uNbaNkeD aND uNDerbaNkeD HouSeHolDS • September 2012 77
Table A-31 Households’ Use of AFS by Demographic Characteristics and Year
Household Characteristic
All Households Ever Used AFSa Never Used AFS AFS Use Unknown
Number (1000s) Pct of RowEstimated Difference
Pct of RowEstimated Difference
Pct of RowEstimated Difference2009 2011 2009 2011 2009 2011 2009 2011
All Households 119,001 120,408 36.3 40.9 4.6* 60.9 56.3 -4.6* 2.8 2.8 0.0Household Type
Family household 78,743 78,826 36.3 41.5 5.2* 61.2 55.9 -5.3* 2.4 2.6 0.2Female householder, no
husband present 13,975 15,575 51.6 57.7 6.1* 45.1 39.3 -5.8* 3.2 3.0 -0.3Male householder, no wife
present 5,433 5,661 46.8 52.0 5.1* 49.4 44.6 -4.8* 3.8 3.4 -0.4Married couple 59,336 57,591 31.8 36.1 4.3* 66.1 61.5 -4.6* 2.1 2.4 0.3*
Nonfamily household 40,126 41,479 36.2 39.6 3.5* 60.3 57.1 -3.2* 3.5 3.3 -0.2Female householder 21,147 21,688 31.8 36.0 4.2* 64.8 60.4 -4.4* 3.5 3.6 0.2Male householder 18,979 19,791 41.0 43.6 2.6* 55.4 53.5 -1.9* 3.6 2.9 -0.7*
Other 131 102 36.0 58.1 22.0* 60.5 37.3 -23.2* 3.4 4.6 1.2Race/Ethnicity
Black 15,541 16,046 54.8 61.7 7.0* 41.3 34.3 -7.0* 3.9 4.0 0.1Hispanic non-Black 13,241 13,710 44.3 48.3 4.0* 51.8 49.0 -2.8* 3.9 2.7 -1.2*Asian 4,790 4,985 14.8 19.8 4.9* 80.1 77.0 -3.2* 5.1 3.3 -1.8*American Indian/Alaskan 1,378 1,389 54.6 55.8 1.2 43.6 41.1 -2.6 1.8 3.2 1.4Hawaiian/Pacific Islander 259 267 33.0 39.7 6.7 62.9 59.2 -3.7 4.1 1.1 -3.0White non-Black non-Hispanic 83,785 83,988 32.5 36.7 4.2* 65.2 60.7 -4.5* 2.3 2.6 0.3*Other non-Black non-Hispanic 6 23 NA NA NA NA NA NA NA NA NA
Spanish is Only Language SpokenSpanish is not only language
spoken 116,479 117,940 36.1 40.7 4.6* 61.1 56.5 -4.6* 2.8 2.8 0.1Spanish is only language
spoken 2,522 2,467 45.1 50.8 5.7* 50.2 46.5 -3.7 4.7 2.7 -2.0*Nativity
U.S-born 103,091 104,143 37.3 41.8 4.5* 60.1 55.4 -4.7* 2.6 2.8 0.2 Foreign-born citizen 7,829 8,380 22.3 27.1 4.8* 73.2 70.0 -3.1* 4.6 2.9 -1.6*Foreign-born non-citizen 8,081 7,885 36.6 43.0 6.4* 59.1 53.2 -5.9* 4.2 3.8 -0.5
Age Group 15 to 24 years 6,596 6,300 46.2 52.8 6.6* 49.6 44.8 -4.7* 4.3 2.4 -1.8*25 to 34 years 19,702 20,374 44.6 48.1 3.5* 52.6 49.4 -3.2* 2.8 2.5 -0.435 to 44 years 22,590 21,414 40.2 44.7 4.5* 57.1 52.9 -4.1* 2.7 2.4 -0.345 to 54 years 24,863 24,658 38.4 42.0 3.6* 59.2 54.8 -4.4* 2.4 3.2 0.7*55 to 64 years 20,274 22,036 33.9 39.3 5.4* 63.7 57.9 -5.8* 2.4 2.8 0.465 years or more 24,977 25,625 23.4 29.3 5.8* 73.4 67.4 -6.0* 3.2 3.3 0.1
EducationNo high school degree 15,006 14,321 45.5 51.9 6.4* 50.4 44.5 -5.9* 4.2 3.6 -0.5High school degree 34,654 34,462 39.6 44.3 4.7* 57.5 52.3 -5.2* 2.9 3.3 0.4*Some college 33,312 34,010 39.7 44.5 4.8* 57.6 53.0 -4.6* 2.7 2.5 -0.2College degree 36,029 37,615 26.1 30.3 4.1* 71.6 67.3 -4.3* 2.3 2.4 0.1
Employment StatusEmployed 73,155 72,580 37.2 40.4 3.3* 60.2 57.1 -3.2* 2.6 2.5 -0.1Unemployed 6,642 6,779 50.9 57.6 6.7* 46.1 40.0 -6.1* 3.0 2.4 -0.6Not in labor force 39,203 41,049 32.2 38.9 6.7* 64.7 57.6 -7.1* 3.1 3.5 0.4
Household IncomeLess than $15,000 15,689 16,699 49.2 56.8 7.6* 47.9 40.7 -7.2* 2.9 2.5 -0.4Between $15,000 and $30,000 17,443 18,599 45.5 50.4 4.9* 52.4 47.0 -5.4* 2.1 2.6 0.6*Between $30,000 and $50,000 21,512 20,984 41.0 44.4 3.4* 56.7 53.6 -3.1* 2.3 2.0 -0.3Between $50,000 and $75,000 18,988 18,773 35.5 37.7 2.2* 62.9 60.5 -2.4* 1.6 1.8 0.2At Least $75,000 27,881 27,770 26.7 30.1 3.4* 71.6 68.3 -3.3* 1.7 1.6 -0.1Unknown 17,488 17,583 25.9 32.0 6.1* 66.9 60.6 -6.3* 7.2 7.4 0.2
HomeownershipHomeowner 80,388 79,144 29.8 34.0 4.2* 67.7 63.1 -4.6* 2.4 2.8 0.4*Non-homeowner 38,613 41,264 49.7 54.0 4.3* 46.7 43.2 -3.6* 3.6 2.8 -0.7*
Geographic RegionNortheast 21,689 21,784 34.3 37.6 3.3* 62.2 59.5 -2.7* 3.5 2.9 -0.6*Midwest 26,601 26,900 34.6 38.7 4.0* 63.1 58.3 -4.8* 2.2 3.0 0.8*South 44,081 44,920 39.9 45.5 5.6* 57.4 51.7 -5.7* 2.7 2.8 0.1West 26,630 26,804 33.5 38.0 4.5* 63.5 59.3 -4.1* 3.1 2.7 -0.4
Notes:aNon-bank remittance use is excluded from 2011 figures because this data was not collected in 2009. The AFS included in this comparison are non-bank check cashing, non-bank money orders, payday loans, pawn shop loans, rent-to-own agreements and refund anticipation loans.* Indicates differences that are statistically significant at the 10% level.NA = Not available because the sample size was too small to make an accurate estimate.Figures do not always reconcile to totals because of rounding.2009 data revised September 2012. Refer to 2009 and 2011 FDIC National Survey of Unbanked and Underbanked Households and Technical Notes for terms, definitions, and methodological discussion.
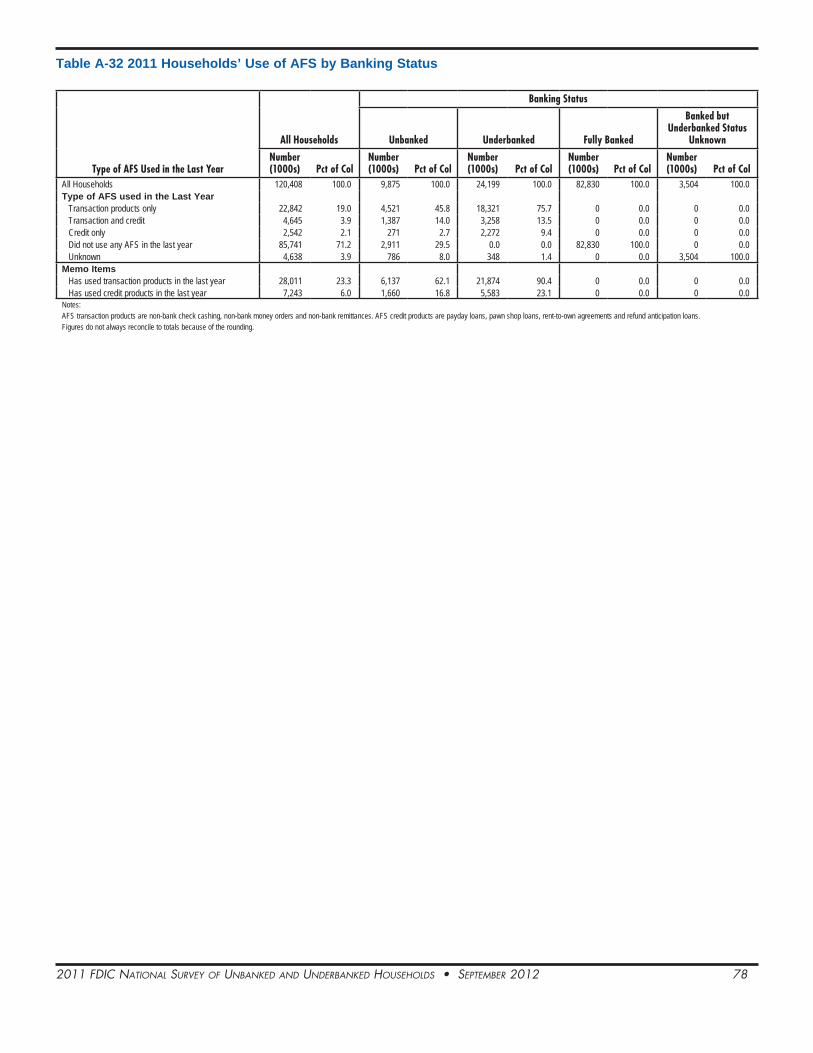
2011 FDIC NatIoNal Survey oF uNbaNkeD aND uNDerbaNkeD HouSeHolDS • September 2012 78
Table A-32 2011 Households’ Use of AFS by Banking Status
Type of AFS Used in the Last Year
All Households
Banking Status
Unbanked Underbanked Fully Banked
Banked but Underbanked Status
Unknown
Number (1000s) Pct of Col
Number (1000s) Pct of Col
Number (1000s) Pct of Col
Number (1000s) Pct of Col
Number (1000s) Pct of Col
All Households 120,408 100.0 9,875 100.0 24,199 100.0 82,830 100.0 3,504 100.0Type of AFS used in the Last Year
Transaction products only 22,842 19.0 4,521 45.8 18,321 75.7 0 0.0 0 0.0Transaction and credit 4,645 3.9 1,387 14.0 3,258 13.5 0 0.0 0 0.0Credit only 2,542 2.1 271 2.7 2,272 9.4 0 0.0 0 0.0Did not use any AFS in the last year 85,741 71.2 2,911 29.5 0.0 0.0 82,830 100.0 0 0.0Unknown 4,638 3.9 786 8.0 348 1.4 0 0.0 3,504 100.0
Memo ItemsHas used transaction products in the last year 28,011 23.3 6,137 62.1 21,874 90.4 0 0.0 0 0.0Has used credit products in the last year 7,243 6.0 1,660 16.8 5,583 23.1 0 0.0 0 0.0
Notes:AFS transaction products are non-bank check cashing, non-bank money orders and non-bank remittances. AFS credit products are payday loans, pawn shop loans, rent-to-own agreements and refund anticipation loans. Figures do not always reconcile to totals because of the rounding.
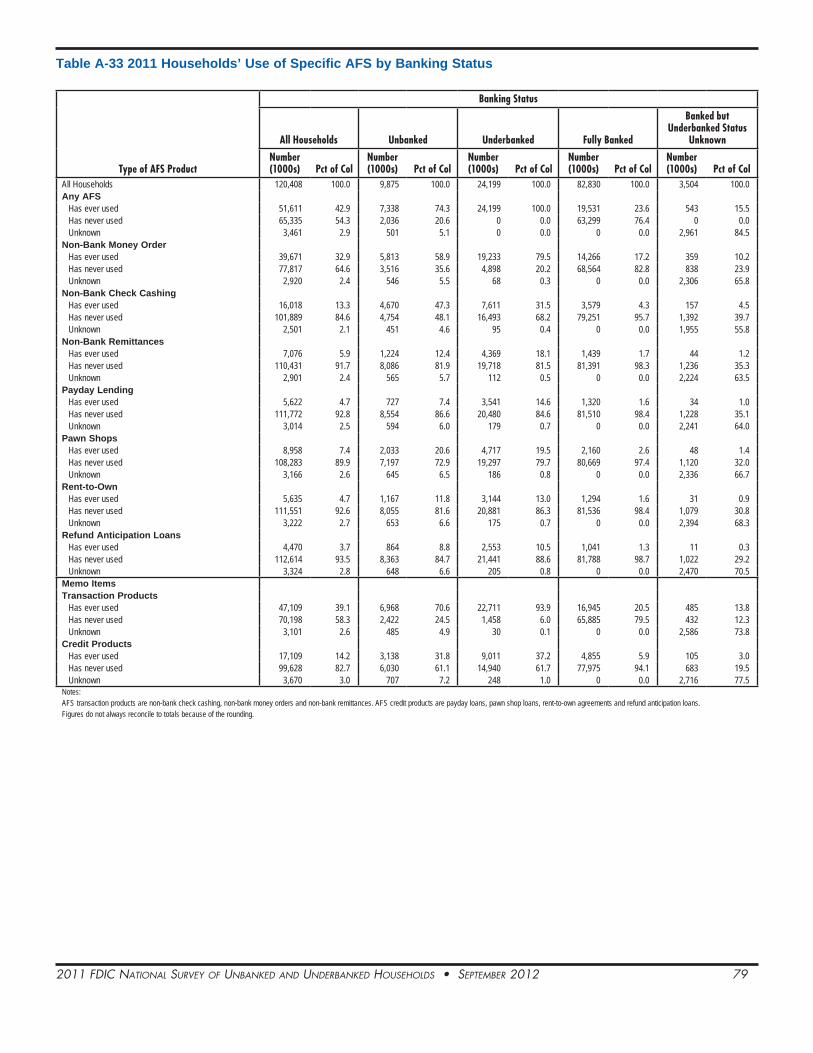
2011 FDIC NatIoNal Survey oF uNbaNkeD aND uNDerbaNkeD HouSeHolDS • September 2012 79
Table A-33 2011 Households’ Use of Specific AFS by Banking Status
Type of AFS Product
Banking Status
All Households Unbanked Underbanked Fully Banked
Banked but Underbanked Status
Unknown
Number (1000s) Pct of Col
Number (1000s) Pct of Col
Number (1000s) Pct of Col
Number (1000s) Pct of Col
Number (1000s) Pct of Col
All Households 120,408 100.0 9,875 100.0 24,199 100.0 82,830 100.0 3,504 100.0Any AFS
Has ever used 51,611 42.9 7,338 74.3 24,199 100.0 19,531 23.6 543 15.5Has never used 65,335 54.3 2,036 20.6 0 0.0 63,299 76.4 0 0.0Unknown 3,461 2.9 501 5.1 0 0.0 0 0.0 2,961 84.5
Non-Bank Money OrderHas ever used 39,671 32.9 5,813 58.9 19,233 79.5 14,266 17.2 359 10.2Has never used 77,817 64.6 3,516 35.6 4,898 20.2 68,564 82.8 838 23.9Unknown 2,920 2.4 546 5.5 68 0.3 0 0.0 2,306 65.8
Non-Bank Check CashingHas ever used 16,018 13.3 4,670 47.3 7,611 31.5 3,579 4.3 157 4.5Has never used 101,889 84.6 4,754 48.1 16,493 68.2 79,251 95.7 1,392 39.7Unknown 2,501 2.1 451 4.6 95 0.4 0 0.0 1,955 55.8
Non-Bank RemittancesHas ever used 7,076 5.9 1,224 12.4 4,369 18.1 1,439 1.7 44 1.2Has never used 110,431 91.7 8,086 81.9 19,718 81.5 81,391 98.3 1,236 35.3Unknown 2,901 2.4 565 5.7 112 0.5 0 0.0 2,224 63.5
Payday LendingHas ever used 5,622 4.7 727 7.4 3,541 14.6 1,320 1.6 34 1.0Has never used 111,772 92.8 8,554 86.6 20,480 84.6 81,510 98.4 1,228 35.1Unknown 3,014 2.5 594 6.0 179 0.7 0 0.0 2,241 64.0
Pawn ShopsHas ever used 8,958 7.4 2,033 20.6 4,717 19.5 2,160 2.6 48 1.4Has never used 108,283 89.9 7,197 72.9 19,297 79.7 80,669 97.4 1,120 32.0Unknown 3,166 2.6 645 6.5 186 0.8 0 0.0 2,336 66.7
Rent-to-OwnHas ever used 5,635 4.7 1,167 11.8 3,144 13.0 1,294 1.6 31 0.9Has never used 111,551 92.6 8,055 81.6 20,881 86.3 81,536 98.4 1,079 30.8Unknown 3,222 2.7 653 6.6 175 0.7 0 0.0 2,394 68.3
Refund Anticipation LoansHas ever used 4,470 3.7 864 8.8 2,553 10.5 1,041 1.3 11 0.3Has never used 112,614 93.5 8,363 84.7 21,441 88.6 81,788 98.7 1,022 29.2Unknown 3,324 2.8 648 6.6 205 0.8 0 0.0 2,470 70.5
Memo ItemsTransaction Products
Has ever used 47,109 39.1 6,968 70.6 22,711 93.9 16,945 20.5 485 13.8Has never used 70,198 58.3 2,422 24.5 1,458 6.0 65,885 79.5 432 12.3Unknown 3,101 2.6 485 4.9 30 0.1 0 0.0 2,586 73.8
Credit ProductsHas ever used 17,109 14.2 3,138 31.8 9,011 37.2 4,855 5.9 105 3.0Has never used 99,628 82.7 6,030 61.1 14,940 61.7 77,975 94.1 683 19.5Unknown 3,670 3.0 707 7.2 248 1.0 0 0.0 2,716 77.5
Notes:AFS transaction products are non-bank check cashing, non-bank money orders and non-bank remittances. AFS credit products are payday loans, pawn shop loans, rent-to-own agreements and refund anticipation loans. Figures do not always reconcile to totals because of the rounding.
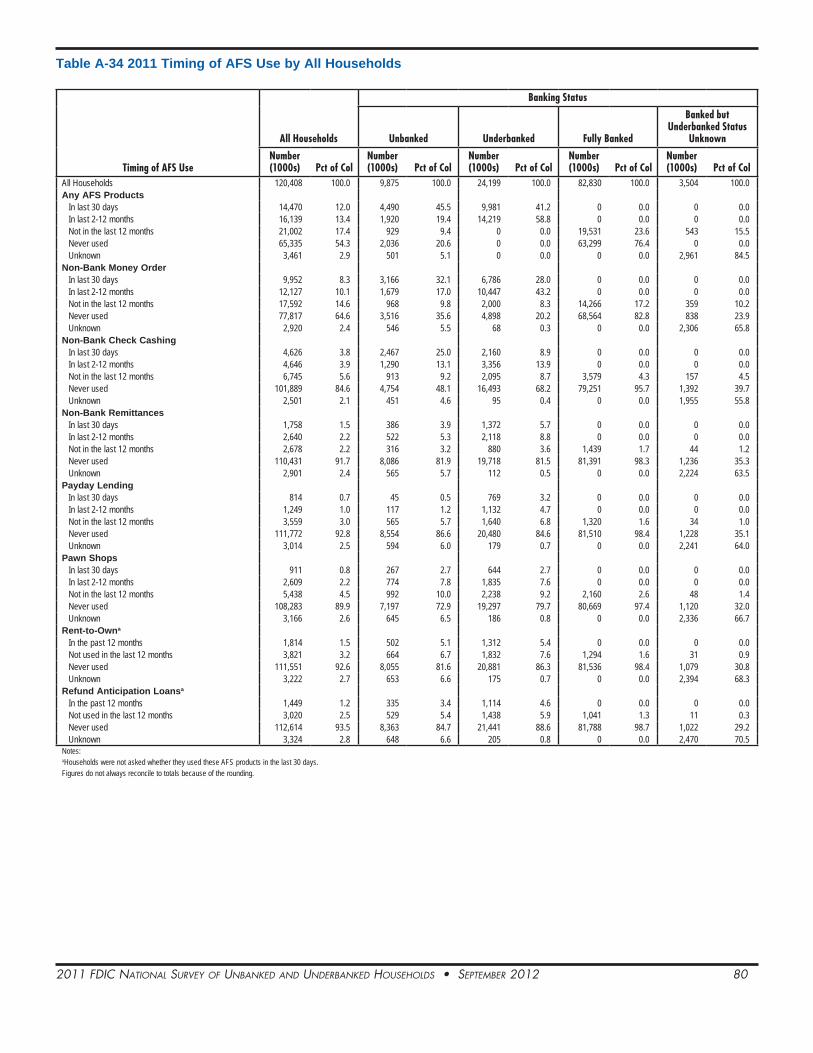
2011 FDIC NatIoNal Survey oF uNbaNkeD aND uNDerbaNkeD HouSeHolDS • September 2012 80
Table A-34 2011 Timing of AFS Use by All Households
Timing of AFS Use
All Households
Banking Status
Unbanked Underbanked Fully Banked
Banked but Underbanked Status
Unknown
Number (1000s) Pct of Col
Number (1000s) Pct of Col
Number (1000s) Pct of Col
Number (1000s) Pct of Col
Number (1000s) Pct of Col
All Households 120,408 100.0 9,875 100.0 24,199 100.0 82,830 100.0 3,504 100.0Any AFS Products
In last 30 days 14,470 12.0 4,490 45.5 9,981 41.2 0 0.0 0 0.0In last 2-12 months 16,139 13.4 1,920 19.4 14,219 58.8 0 0.0 0 0.0Not in the last 12 months 21,002 17.4 929 9.4 0 0.0 19,531 23.6 543 15.5Never used 65,335 54.3 2,036 20.6 0 0.0 63,299 76.4 0 0.0Unknown 3,461 2.9 501 5.1 0 0.0 0 0.0 2,961 84.5
Non-Bank Money OrderIn last 30 days 9,952 8.3 3,166 32.1 6,786 28.0 0 0.0 0 0.0In last 2-12 months 12,127 10.1 1,679 17.0 10,447 43.2 0 0.0 0 0.0Not in the last 12 months 17,592 14.6 968 9.8 2,000 8.3 14,266 17.2 359 10.2Never used 77,817 64.6 3,516 35.6 4,898 20.2 68,564 82.8 838 23.9Unknown 2,920 2.4 546 5.5 68 0.3 0 0.0 2,306 65.8
Non-Bank Check CashingIn last 30 days 4,626 3.8 2,467 25.0 2,160 8.9 0 0.0 0 0.0In last 2-12 months 4,646 3.9 1,290 13.1 3,356 13.9 0 0.0 0 0.0Not in the last 12 months 6,745 5.6 913 9.2 2,095 8.7 3,579 4.3 157 4.5Never used 101,889 84.6 4,754 48.1 16,493 68.2 79,251 95.7 1,392 39.7Unknown 2,501 2.1 451 4.6 95 0.4 0 0.0 1,955 55.8
Non-Bank RemittancesIn last 30 days 1,758 1.5 386 3.9 1,372 5.7 0 0.0 0 0.0In last 2-12 months 2,640 2.2 522 5.3 2,118 8.8 0 0.0 0 0.0Not in the last 12 months 2,678 2.2 316 3.2 880 3.6 1,439 1.7 44 1.2Never used 110,431 91.7 8,086 81.9 19,718 81.5 81,391 98.3 1,236 35.3Unknown 2,901 2.4 565 5.7 112 0.5 0 0.0 2,224 63.5
Payday LendingIn last 30 days 814 0.7 45 0.5 769 3.2 0 0.0 0 0.0In last 2-12 months 1,249 1.0 117 1.2 1,132 4.7 0 0.0 0 0.0Not in the last 12 months 3,559 3.0 565 5.7 1,640 6.8 1,320 1.6 34 1.0Never used 111,772 92.8 8,554 86.6 20,480 84.6 81,510 98.4 1,228 35.1Unknown 3,014 2.5 594 6.0 179 0.7 0 0.0 2,241 64.0
Pawn ShopsIn last 30 days 911 0.8 267 2.7 644 2.7 0 0.0 0 0.0In last 2-12 months 2,609 2.2 774 7.8 1,835 7.6 0 0.0 0 0.0Not in the last 12 months 5,438 4.5 992 10.0 2,238 9.2 2,160 2.6 48 1.4Never used 108,283 89.9 7,197 72.9 19,297 79.7 80,669 97.4 1,120 32.0Unknown 3,166 2.6 645 6.5 186 0.8 0 0.0 2,336 66.7
Rent-to-Owna
In the past 12 months 1,814 1.5 502 5.1 1,312 5.4 0 0.0 0 0.0Not used in the last 12 months 3,821 3.2 664 6.7 1,832 7.6 1,294 1.6 31 0.9Never used 111,551 92.6 8,055 81.6 20,881 86.3 81,536 98.4 1,079 30.8Unknown 3,222 2.7 653 6.6 175 0.7 0 0.0 2,394 68.3
Refund Anticipation Loansa
In the past 12 months 1,449 1.2 335 3.4 1,114 4.6 0 0.0 0 0.0Not used in the last 12 months 3,020 2.5 529 5.4 1,438 5.9 1,041 1.3 11 0.3Never used 112,614 93.5 8,363 84.7 21,441 88.6 81,788 98.7 1,022 29.2Unknown 3,324 2.8 648 6.6 205 0.8 0 0.0 2,470 70.5
Notes:aHouseholds were not asked whether they used these AFS products in the last 30 days. Figures do not always reconcile to totals because of the rounding.

2011 FDIC NatIoNal Survey oF uNbaNkeD aND uNDerbaNkeD HouSeHolDS • September 2012 81
Table A-35 2009 Timing of AFS Use by All Households
Frequency of AFS Use
All Households
Banking Status
Unbanked Underbanked Fully Banked
Banked but Underbanked Status
Unknown
Number (1000s) Pct of Col
Number (1000s) Pct of Col
Number (1000s) Pct of Col
Number (1000s) Pct of Col
Number (1000s) Pct of Col
All Households 119,001 100.0 9,054 100.0 21,693 100.0 84,917 100.0 3,336 100.0Non-Bank Money Order
At least a few times per year 13,053 11.0 4,034 44.6 9,019 41.6 0 0.0 0 0.0Once or twice a year 7,854 6.6 610 6.7 7,243 33.4 0 0.0 0 0.0Almost never 13,925 11.7 345 3.8 1,329 6.1 11,933 14.1 317 9.5Never used 81,954 68.9 3,508 38.8 4,067 18.8 72,984 85.9 1,394 41.8Unknown 2,215 1.9 556 6.1 35 0.2 0 0.0 1,624 48.7
Non-Bank Check CashingAt least a few times per year 5,824 4.9 2,722 30.1 3,103 14.3 0 0.0 0 0.0Once or twice a year 2,432 2.0 410 4.5 2,022 9.3 0 0.0 0 0.0Almost never 4,115 3.5 390 4.3 1,374 6.3 2,281 2.7 71 2.1Never used 104,848 88.1 5,001 55.2 15,165 69.9 82,636 97.3 2,046 61.3Unknown 1,781 1.5 531 5.9 30 0.1 0 0.0 1,219 36.5
Payday Lending At least a few times per year 1,502 1.3 198 2.2 1,304 6.0 0 0.0 0 0.0Once or twice a year 2,399 2.0 352 3.9 2,047 9.4 0 0.0 0 0.0Almost never 42 - NA NA NA NA NA NA NA NA Never used 111,832 94.0 7,772 85.8 17,865 82.4 84,911 100.0 1,285 38.5Unknown 3,226 2.7 719 7.9 456 2.1 0 0.0 2,051 61.5
Pawn ShopsAt least a few times per year 704 0.6 274 3.0 430 2.0 0 0.0 0 0.0Once or twice a year 1,554 1.3 436 4.8 1,119 5.2 0 0.0 0 0.0Almost never 4,614 3.9 613 6.8 1,863 8.6 2,079 2.4 58 1.7Never used 109,149 91.7 7,060 78.0 17,921 82.6 82,838 97.6 1,329 39.8Unknown 2,980 2.5 671 7.4 361 1.7 0 0.0 1,949 58.4
Rent-to-OwnAt least a few times per year 519 0.4 185 2.0 334 1.5 0 0.0 0 0.0Once or twice a year 1,675 1.4 431 4.8 1,244 5.7 0 0.0 0 0.0Almost never 2,445 2.1 485 5.4 1,244 5.7 677 0.8 39 1.2Never used 111,640 93.8 7,287 80.5 18,676 86.1 84,240 99.2 1,437 43.1Unknown 2,723 2.3 666 7.4 196 0.9 0 0.0 1,860 55.8
Refund Anticipation LoansIn the last five years 3,573 3.0 719 7.9 2,854 13.2 0 0.0 0 0.0Never used 112,371 94.4 7,694 85.0 18,555 85.5 84,917 100.0 1,204 36.1Unknown 3,057 2.6 640 7.1 284 1.3 0 0.0 2,132 63.9
Notes:NA = Not available because the sample size was too small to make an accurate estimate. - = For this table cell, there were so few sample respondents (in some cases zero) reporting that the estimated universe proportion round to 0.0 percent. It is estimated that the true value is only slightly greater than zero. Figures do not always reconcile to totals because of rounding.2009 data revised September 2012. Refer to 2009 and 2011 FDIC National Survey of Unbanked and Underbanked Households and Technical Notes for terms, definitions, and methodological discussion.

2011 FDIC NatIoNal Survey oF uNbaNkeD aND uNDerbaNkeD HouSeHolDS • September 2012 82
Table A-36 2011 Timing of AFS Use by Banked Households
Timing of AFS Use
All Banked Households
Banking Status
Underbanked Fully BankedBanked but Underbanked
Status UnknownNumber (1000s) Pct of Col
Number (1000s) Pct of Col
Number (1000s) Pct of Col
Number (1000s) Pct of Col
All Banked Households 110,532 100.0 24,199 100.0 82,830 100.0 3,504 100.0Any AFS Products
In last 30 days 9,981 9.0 9,981 41.2 0 0.0 0 0.0In last 2-12 months 14,219 12.9 14,219 58.8 0 0.0 0 0.0Not in the last 12 months 20,074 18.2 0 0.0 19,531 23.6 543 15.5Never used 63,299 57.3 0 0.0 63,299 76.4 0 0.0Unknown 2,961 2.7 0 0.0 0 0.0 2,961 84.5
Non-Bank Money OrderIn last 30 days 6,786 6.1 6,786 28.0 0 0.0 0 0.0In last 2-12 months 10,447 9.5 10,447 43.2 0 0.0 0 0.0Not in the last 12 months 16,624 15.0 2,000 8.3 14,266 17.2 359 10.2Never used 74,300 67.2 4,898 20.2 68,564 82.8 838 23.9Unknown 2,374 2.1 68 0.3 0 0.0 2,306 65.8
Non-Bank Check CashingIn last 30 days 2,160 2.0 2,160 8.9 0 0.0 0 0.0In last 2-12 months 3,356 3.0 3,356 13.9 0 0.0 0 0.0Not in the last 12 months 5,831 5.3 2,095 8.7 3,579 4.3 157 4.5Never used 97,135 87.9 16,493 68.2 79,251 95.7 1,392 39.7Unknown 2,050 1.9 95 0.4 0 0.0 1,955 55.8
Non-Bank RemittancesIn last 30 days 1,372 1.2 1,372 5.7 0 0.0 0 0.0In last 2-12 months 2,118 1.9 2,118 8.8 0 0.0 0 0.0Not in the last 12 months 2,362 2.1 880 3.6 1,439 1.7 44 1.2Never used 102,345 92.6 19,718 81.5 81,391 98.3 1,236 35.3Unknown 2,336 2.1 112 0.5 0 0.0 2,224 63.5
Payday LendingIn last 30 days 769 0.7 769 3.2 0 0.0 0 0.0In last 2-12 months 1,132 1.0 1,132 4.7 0 0.0 0 0.0Not in the last 12 months 2,994 2.7 1,640 6.8 1,320 1.6 34 1.0Never used 103,218 93.4 20,480 84.6 81,510 98.4 1,228 35.1Unknown 2,420 2.2 179 0.7 0 0.0 2,241 64.0
Pawn ShopsIn last 30 days 644 0.6 644 2.7 0 0.0 0 0.0In last 2-12 months 1,835 1.7 1,835 7.6 0 0.0 0 0.0Not in the last 12 months 4,447 4.0 2,238 9.2 2,160 2.6 48 1.4Never used 101,086 91.5 19,297 79.7 80,669 97.4 1,120 32.0Unknown 2,521 2.3 186 0.8 0 0.0 2,336 66.7
Rent-to-Owna
In the past 12 months 1,312 1.2 1,312 5.4 0 0.0 0 0.0Not used in the last 12 months 3,157 2.9 1,832 7.6 1,294 1.6 31 0.9Never used 103,496 93.6 20,881 86.3 81,536 98.4 1,079 30.8Unknown 2,568 2.3 175 0.7 0 0.0 2,394 68.3
Refund Anticipation Loansa
In the past 12 months 1,114 1.0 1,114 4.6 0 0.0 0 0.0Not used in the last 12 months 2,491 2.3 1,438 5.9 1,041 1.3 11 0.3Never used 104,251 94.3 21,441 88.6 81,788 98.7 1,022 29.2Unknown 2,676 2.4 205 0.8 0 0.0 2,470 70.5
Notes:aHouseholds were not asked whether they used these AFS products in the last 30 days. Figures do not always reconcile to totals because of the rounding.

2011 FDIC NatIoNal Survey oF uNbaNkeD aND uNDerbaNkeD HouSeHolDS • September 2012 83
Table A-37 2011 Timing of AFS Use by Unbanked Households
Timing of AFS Use
All Unbanked Households
Unbanked StatusPreviously Banked Never-Banked Unknown
Number (1000s) Pct of Col
Number (1000s) Pct of Col
Number (1000s) Pct of Col
Number (1000s) Pct of Col
All Unbanked Households 9,875 100.0 4,411 100.0 5,269 100.0 195 100.0Any AFS Products
In last 30 days 4,490 45.5 2,149 48.7 2,322 44.1 19 9.5In last 2-12 months 1,920 19.4 1,066 24.2 830 15.8 25 12.6Not in the last 12 months 929 9.4 495 11.2 410 7.8 24 12.5Never used 2,036 20.6 568 12.9 1,454 27.6 14 7.4Unknown 501 5.1 133 3.0 254 4.8 113 58.1
Non-Bank Money OrderIn last 30 days 3,166 32.1 1,572 35.6 1,582 30.0 12 5.9In last 2-12 months 1,679 17.0 951 21.6 707 13.4 21 10.7Not in the last 12 months 968 9.8 572 13.0 382 7.2 14 7.1Never used 3,516 35.6 1,147 26.0 2,331 44.2 39 19.7Unknown 546 5.5 169 3.8 267 5.1 111 56.6
Non-Bank Check CashingIn last 30 days 2,467 25.0 1,110 25.2 1,345 25.5 11 5.7In last 2-12 months 1,290 13.1 696 15.8 571 10.8 23 11.7Not in the last 12 months 913 9.2 543 12.3 361 6.8 10 5.2Never used 4,754 48.1 1,948 44.2 2,769 52.6 37 18.7Unknown 451 4.6 113 2.6 223 4.2 115 58.7
Non-Bank RemittancesIn last 30 days 386 3.9 74 1.7 312 5.9 - -In last 2-12 months 522 5.3 147 3.3 369 7.0 6 3.0Not in the last 12 months 316 3.2 149 3.4 165 3.1 3 1.5Never used 8,086 81.9 3,874 87.8 4,144 78.7 67 34.4Unknown 565 5.7 167 3.8 278 5.3 119 61.1
Payday LendingIn last 30 days 45 0.5 37 0.8 9 0.2 - -In last 2-12 months 117 1.2 69 1.6 48 0.9 - -Not in the last 12 months 565 5.7 443 10.0 114 2.2 8 4.0Never used 8,554 86.6 3,684 83.5 4,795 91.0 75 38.3Unknown 594 6.0 178 4.0 303 5.8 113 57.7
Pawn ShopsIn last 30 days 267 2.7 160 3.6 107 2.0 - -In last 2-12 months 774 7.8 492 11.2 278 5.3 4 1.9Not in the last 12 months 992 10.0 701 15.9 286 5.4 5 2.5Never used 7,197 72.9 2,861 64.9 4,274 81.1 62 31.7Unknown 645 6.5 197 4.5 323 6.1 125 63.8
Rent-to-Owna
In the past 12 months 502 5.1 316 7.2 183 3.5 4 1.9Not used in the last 12 months 664 6.7 452 10.3 212 4.0 - -Never used 8,055 81.6 3,430 77.8 4,565 86.6 60 30.8Unknown 653 6.6 213 4.8 309 5.9 131 67.2
Refund Anticipation Loansa
In the past 12 months 335 3.4 221 5.0 109 2.1 4 2.2Not used in the last 12 months 529 5.4 376 8.5 147 2.8 7 3.4Never used 8,363 84.7 3,606 81.8 4,704 89.3 52 26.8Unknown 648 6.6 207 4.7 309 5.9 132 67.6
Notes:aHouseholds were not asked whether they used these AFS products in the last 30 days. - = For this table cell, there were so few sample respondents (in some cases zero) reporting that the estimated universe proportion round to 0.0 percent. It is estimated that the true value is only slightly greater than zero. Figures do not always reconcile to totals because of the rounding.

2011 FDIC NatIoNal Survey oF uNbaNkeD aND uNDerbaNkeD HouSeHolDS • September 2012 84
Table A-38 2011 Timing of AFS Use by Households That Have Ever Used AFS
Timing of AFS Use
All Households that Used AFS
Banking Status
Unbanked Underbanked Fully Banked
Banked but Underbanked Status
Unknown
Number (1000s) Pct of Col
Number (1000s) Pct of Col
Number (1000s) Pct of Col
Number (1000s) Pct of Col
Number (1000s) Pct of Col
Any AFSIn last 30 days 14,470 28.0 4,490 61.2 9,981 41.2 0 0.0 0 0.0In last 2-12 months 16,139 31.3 1,920 26.2 14,219 58.8 0 0.0 0 0.0Not in the last 12 months 21,002 40.7 929 12.7 0 0.0 19,531 100.0 543 100.0Total 51,611 100.0 7,338 100.0 24,199 100.0 19,531 100.0 543 100.0
Non-Bank Money OrderIn last 30 days 9,952 25.1 3,166 54.5 6,786 35.3 0 0.0 0 0.0In last 2-12 months 12,127 30.6 1,679 28.9 10,447 54.3 0 0.0 0 0.0Not in the last 12 months 17,592 44.3 968 16.6 2,000 10.4 14,266 100.0 359 100.0Total 39,671 100.0 5,813 100.0 19,233 100.0 14,266 100.0 359 100.0
Non-Bank Check CashingIn last 30 days 4,626 28.9 2,467 52.8 2,160 28.4 0 0.0 NA NAIn last 2-12 months 4,646 29.0 1,290 27.6 3,356 44.1 0 0.0 NA NANot in the last 12 months 6,745 42.1 913 19.6 2,095 27.5 3,579 100.0 NA NATotal 16,018 100.0 4,670 100.0 7,611 100.0 3,579 100.0 157 100.0
Non-Bank RemittancesIn last 30 days 1,758 24.8 386 31.5 1,372 31.4 0 0.0 NA NAIn last 2-12 months 2,640 37.3 522 42.6 2,118 48.5 0 0.0 NA NANot in the last 12 months 2,678 37.9 316 25.8 880 20.1 1,439 100.0 NA NATotal 7,076 100.0 1,224 100.0 4,369 100.0 1,439 100.0 44 100.0
Payday LendingIn last 30 days 814 14.5 45 6.2 769 21.7 0 0.0 NA NAIn last 2-12 months 1,249 22.2 117 16.1 1,132 32.0 0 0.0 NA NANot in the last 12 months 3,559 63.3 565 77.7 1,640 46.3 1,320 100.0 NA NATotal 5,622 100.0 727 100.0 3,541 100.0 1,320 100.0 34 100.0
Pawn ShopsIn last 30 days 911 10.2 267 13.1 644 13.7 0 0.0 NA NAIn last 2-12 months 2,609 29.1 774 38.1 1,835 38.9 0 0.0 NA NANot in the last 12 months 5,438 60.7 992 48.8 2,238 47.5 2,160 100.0 NA NATotal 8,958 100.0 2,033 100.0 4,717 100.0 2,160 100.0 48 100.0
Rent-to-Owna
1,814 32.2 502 43.1 1,312 41.7In the past 12 months 0 0.0 NA NANot in the last 12 months 3,821 67.8 664 56.9 1,832 58.3 1,294 100.0 NA NATotal 5,635 100.0 1,167 100.0 3,144 100.0 1,294 100.0 31 100.0
Refund Anticipation Loansa
In the past 12 months 1,449 32.4 335 38.7 1,114 43.7 0 0.0 NA NANot in the last 12 months 3,020 67.6 529 61.3 1,438 56.3 1,041 100.0 NA NATotal 4,470 100.0 864 100.0 2,553 100.0 1,041 100.0 11 100.0
Notes:aHouseholds were not asked whether they used these AFS products in the last 30 days. NA = Not available because the sample size was too small to make an accurate estimate.Figures do not always reconcile to totals because of the rounding.

2011 FDIC NatIoNal Survey oF uNbaNkeD aND uNDerbaNkeD HouSeHolDS • September 2012 85
Table A-39 2011 Households’ Use of Specific AFS by Bank Account Type
Timing of AFS Use
All Households
Bank Account Type Memo Items
Unbanked Households
Checking and Savings Accounts
Savings Account Only
Checking Account Only
Banked, but Account Type
UnknownHas Checking
AccountHas Savings
Account
Number (1000s)
Pct of Col
Number (1000s)
Pct of Col
Number (1000s)
Pct of Col
Number (1000s)
Pct of Col
Number (1000s)
Pct of Col
Number (1000s)
Pct of Col
Number (1000s)
Pct of Col
Number (1000s)
Pct of Col
All Households 120,408 100.0 9,875 100.0 80,924 100.0 2,379 100.0 25,378 100.0 1,851 100.0 106,509 100.0 83,331 100.0Any AFS
In last 30 days 14,470 12.0 4,490 45.5 5,720 7.1 862 36.2 3,303 13.0 96 5.2 9,057 8.5 6,583 7.9In last 2-12 months 16,139 13.4 1,920 19.4 9,394 11.6 435 18.3 4,245 16.7 144 7.8 13,666 12.8 9,835 11.8Not in the last 12 months 21,002 17.4 929 9.4 14,944 18.5 281 11.8 4,680 18.4 169 9.1 19,643 18.4 15,232 18.3Never used 65,335 54.3 2,036 20.6 49,272 60.9 782 32.9 12,610 49.7 634 34.3 61,995 58.2 50,068 60.1Unknown 3,461 2.9 501 5.1 1,594 2.0 19 0.8 541 2.1 807 43.6 2,148 2.0 1,613 1.9
Non-Bank Money OrderIn last 30 days 9,952 8.3 3,166 32.1 3,699 4.6 755 31.7 2,274 9.0 57 3.1 6,006 5.6 4,456 5.3In last 2-12 months 12,127 10.1 1,679 17.0 7,029 8.7 311 13.1 2,998 11.8 110 5.9 10,044 9.4 7,345 8.8Not in the last 12 months 17,592 14.6 968 9.8 12,423 15.4 263 11.0 3,783 14.9 156 8.4 16,224 15.2 12,692 15.2Never used 77,817 64.6 3,516 35.6 56,513 69.8 1,039 43.7 15,928 62.8 820 44.3 72,566 68.1 57,566 69.1Unknown 2,920 2.4 546 5.5 1,260 1.6 11 0.5 395 1.6 708 38.2 1,668 1.6 1,272 1.5
Non-Bank Check CashingIn last 30 days 4,626 3.8 2,467 25.0 1,327 1.6 138 5.8 669 2.6 26 1.4 1,998 1.9 1,465 1.8In last 2-12 months 4,646 3.9 1,290 13.1 2,004 2.5 140 5.9 1,189 4.7 23 1.2 3,198 3.0 2,146 2.6Not in the last 12 months 6,745 5.6 913 9.2 3,891 4.8 190 8.0 1,715 6.8 35 1.9 5,614 5.3 4,081 4.9Never used 101,889 84.6 4,754 48.1 72,701 89.8 1,905 80.1 21,472 84.6 1,056 57.1 94,352 88.6 74,632 89.6Unknown 2,501 2.1 451 4.6 1,000 1.2 7 0.3 332 1.3 710 38.4 1,346 1.3 1,007 1.2
Non-Bank RemittancesIn last 30 days 1,758 1.5 386 3.9 838 1.0 71 3.0 448 1.8 14 0.8 1,286 1.2 909 1.1In last 2-12 months 2,640 2.2 522 5.3 1,550 1.9 33 1.4 504 2.0 30 1.6 2,062 1.9 1,583 1.9Not in the last 12 months 2,678 2.2 316 3.2 1,708 2.1 68 2.9 557 2.2 30 1.6 2,276 2.1 1,776 2.1Never used 110,431 91.7 8,086 81.9 75,620 93.4 2,189 92.0 23,475 92.5 1,061 57.3 99,269 93.2 77,837 93.4Unknown 2,901 2.4 565 5.7 1,208 1.5 17 0.7 394 1.6 716 38.7 1,615 1.5 1,225 1.5
Payday LendingIn last 30 days 814 0.7 45 0.5 463 0.6 17 0.7 285 1.1 4 0.2 748 0.7 480 0.6In last 2-12 months 1,249 1.0 117 1.2 729 0.9 25 1.1 372 1.5 6 0.3 1,101 1.0 754 0.9Not in the last 12 months 3,559 3.0 565 5.7 1,974 2.4 123 5.2 881 3.5 17 0.9 2,864 2.7 2,097 2.5Never used 111,772 92.8 8,554 86.6 76,590 94.6 2,190 92.1 23,338 92.0 1,099 59.4 100,111 94.0 78,808 94.6Unknown 3,014 2.5 594 6.0 1,168 1.4 24 1.0 502 2.0 725 39.2 1,684 1.6 1,192 1.4
Pawn ShopsIn last 30 days 911 0.8 267 2.7 357 0.4 30 1.3 256 1.0 2 0.1 612 0.6 386 0.5In last 2-12 months 2,609 2.2 774 7.8 943 1.2 137 5.8 736 2.9 19 1.0 1,685 1.6 1,082 1.3Not in the last 12 months 5,438 4.5 992 10.0 2,652 3.3 203 8.5 1,551 6.1 41 2.2 4,212 4.0 2,854 3.4Never used 108,283 89.9 7,197 72.9 75,682 93.5 1,982 83.3 22,362 88.1 1,060 57.3 98,220 92.2 77,690 93.2Unknown 3,166 2.6 645 6.5 1,291 1.6 28 1.2 474 1.9 728 39.3 1,779 1.7 1,319 1.6
Rent-to-Owna
In the past 12 months 1,814 1.5 502 5.1 712 0.9 119 5.0 466 1.8 14 0.7 1,179 1.1 832 1.0Not used in the last 12
months 3,821 3.2 664 6.7 1,862 2.3 177 7.4 1,090 4.3 27 1.5 2,966 2.8 2,046 2.5Never used 111,551 92.6 8,055 81.6 77,045 95.2 2,056 86.4 23,323 91.9 1,072 57.9 100,547 94.4 79,122 94.9Unknown 3,222 2.7 653 6.6 1,304 1.6 27 1.1 499 2.0 738 39.9 1,816 1.7 1,331 1.6
Refund Anticipation Loansa
In the past 12 months 1,449 1.2 335 3.4 598 0.7 66 2.8 444 1.7 7 0.4 1,046 1.0 666 0.8Not used in the last 12
months 3,020 2.5 529 5.4 1,515 1.9 156 6.6 796 3.1 24 1.3 2,311 2.2 1,675 2.0Never used 112,614 93.5 8,363 84.7 77,438 95.7 2,134 89.7 23,626 93.1 1,053 56.9 101,252 95.1 79,594 95.5Unknown 3,324 2.8 648 6.6 1,373 1.7 24 1.0 513 2.0 767 41.4 1,899 1.8 1,396 1.7
Memo ItemsHas ever used transaction
products 47,109 39.1 6,968 70.6 27,433 33.9 1,464 61.5 10,881 42.9 363 19.6 38,391 36.0 28,911 34.7Has ever used credit
products 17,109 14.2 3,138 31.8 8,418 10.4 689 28.9 4,757 18.7 107 5.8 13,201 12.4 9,113 10.9Notes:AFS transaction products are non-bank check cashing, non-bank money orders and non-bank remittances. AFS credit products are payday loans, pawn shop loans, rent-to-own agreements and refund anticipation loans. aHouseholds were not asked whether they used these AFS products in the last 30 days. Figures do not always reconcile to totals because of the rounding.

2011 FDIC NatIoNal Survey oF uNbaNkeD aND uNDerbaNkeD HouSeHolDS • September 2012 86
Table A-40 2011 Underbanked Households’ Use of Specific AFS by Bank Account Type
Timing of AFS Use
All Underbanked Households
Bank Account Type Memo Items
Checking and Savings Accounts Savings Account Only Checking Account Only
Banked, but Account Type Unknown Has Checking Account Has Savings Account
Number (1000s) Pct of Col
Number (1000s) Pct of Col
Number (1000s) Pct of Col
Number (1000s) Pct of Col
Number (1000s) Pct of Col
Number (1000s) Pct of Col
Number (1000s) Pct of Col
All Underbanked Households 24,199 100.0 15,113 100.0 1,297 100.0 7,548 100.0 240 100.0 22,723 100.0 16,418 100.0Any AFS
In last 30 days 9,981 41.2 5,720 37.8 862 66.4 3,303 43.8 96 39.9 9,057 39.9 6,583 40.1In last 2-12 months 14,219 58.8 9,394 62.2 435 33.6 4,245 56.2 144 60.1 13,666 60.1 9,835 59.9Non-Bank Money OrderIn last 30 days 6,786 28.0 3,699 24.5 755 58.2 2,274 30.1 57 23.9 6,006 26.4 4,456 27.1In last 2-12 months 10,447 43.2 7,029 46.5 311 23.9 2,998 39.7 110 45.8 10,044 44.2 7,345 44.7Not in the last 12 months 2,000 8.3 1,289 8.5 86 6.6 598 7.9 28 11.5 1,890 8.3 1,374 8.4Never used 4,898 20.2 3,057 20.2 141 10.9 1,655 21.9 45 18.9 4,719 20.8 3,198 19.5Unknown 68 0.3 40 0.3 5 0.3 24 0.3 - - 63 0.3 44 0.3
Non-Bank Check CashingIn last 30 days 2,160 8.9 1,327 8.8 138 10.6 669 8.9 26 10.7 1,998 8.8 1,465 8.9In last 2-12 months 3,356 13.9 2,004 13.3 140 10.8 1,189 15.8 23 9.6 3,198 14.1 2,146 13.1Not in the last 12 months 2,095 8.7 1,266 8.4 123 9.5 699 9.3 8 3.3 1,967 8.7 1,389 8.5Never used 16,493 68.2 10,476 69.3 897 69.1 4,954 65.6 166 69.3 15,482 68.1 11,378 69.3Unknown 95 0.4 41 0.3 - - 37 0.5 17 7.1 78 0.3 41 0.3
Non-Bank RemittancesIn last 30 days 1,372 5.7 838 5.5 71 5.5 448 5.9 14 5.9 1,286 5.7 909 5.5In last 2-12 months 2,118 8.8 1,550 10.3 33 2.6 504 6.7 30 12.5 2,062 9.1 1,583 9.6Not in the last 12 months 880 3.6 548 3.6 52 4.0 267 3.5 13 5.3 823 3.6 600 3.7Never used 19,718 81.5 12,120 80.2 1,139 87.8 6,291 83.3 169 70.3 18,456 81.2 13,266 80.8Unknown 112 0.5 57 0.4 2 0.1 38 0.5 15 6.1 96 0.4 59 0.4
Payday LendingIn last 30 days 769 3.2 463 3.1 17 1.3 285 3.8 4 1.5 748 3.3 480 2.9In last 2-12 months 1,132 4.7 729 4.8 25 1.9 372 4.9 6 2.6 1,101 4.8 754 4.6Not in the last 12 months 1,640 6.8 991 6.6 89 6.9 546 7.2 13 5.5 1,547 6.8 1,081 6.6Never used 20,480 84.6 12,850 85.0 1,164 89.7 6,273 83.1 193 80.3 19,175 84.4 14,022 85.4Unknown 179 0.7 80 0.5 2 0.1 72 1.0 24 10.2 152 0.7 82 0.5
Pawn ShopsIn last 30 days 644 2.7 357 2.4 30 2.3 256 3.4 2 0.8 612 2.7 386 2.4In last 2-12 months 1,835 7.6 943 6.2 137 10.6 736 9.7 19 8.0 1,685 7.4 1,082 6.6Not in the last 12 months 2,238 9.2 1,198 7.9 155 11.9 868 11.5 17 7.2 2,073 9.1 1,353 8.2Never used 19,297 79.7 12,513 82.8 968 74.6 5,636 74.7 180 74.9 18,197 80.1 13,487 82.1Unknown 186 0.8 103 0.7 7 0.5 53 0.7 22 9.1 157 0.7 111 0.7
Rent-to-Owna
In the past 12 months 1,312 5.4 712 4.7 119 9.2 466 6.2 14 5.7 1,179 5.2 832 5.1Not used in the last 12
months 1,832 7.6 1,004 6.6 142 10.9 674 8.9 12 5.1 1,689 7.4 1,148 7.0Never used 20,881 86.3 13,310 88.1 1,030 79.4 6,345 84.1 196 81.8 19,705 86.7 14,345 87.4Unknown 175 0.7 87 0.6 7 0.5 63 0.8 18 7.4 150 0.7 94 0.6
Refund Anticipation Loansa
In the past 12 months 1,114 4.6 598 4.0 66 5.1 444 5.9 7 3.0 1,046 4.6 666 4.1Not used in the last 12
months 1,438 5.9 799 5.3 131 10.1 497 6.6 12 5.1 1,295 5.7 929 5.7Never used 21,441 88.6 13,611 90.1 1,100 84.8 6,541 86.7 190 78.9 20,209 88.9 14,716 89.6Unknown 205 0.8 106 0.7 1 0.1 67 0.9 31 13.0 173 0.8 107 0.7
Memo ItemsHas ever used transaction
products 22,711 93.9 14,276 94.5 1,237 95.4 6,982 92.5 216 89.9 21,317 93.8 15,521 94.5Has ever used credit products 9,011 37.2 5,047 33.4 578 44.5 3,319 44.0 68 28.4 8,388 36.9 5,626 34.3
Notes:AFS transaction products are non-bank check cashing, non-bank money orders and non-bank remittances. AFS credit products are payday loans, pawn shop loans, rent-to-own agreements and refund anticipation loans. aHouseholds were not asked whether they used these AFS products in the last 30 days. - = For this table cell, there were so few sample respondents (in some cases zero) reporting that the estimated universe proportion round to 0.0 percent. It is estimated that the true value is only slightly greater than zero. Figures do not always reconcile to totals because of the rounding.
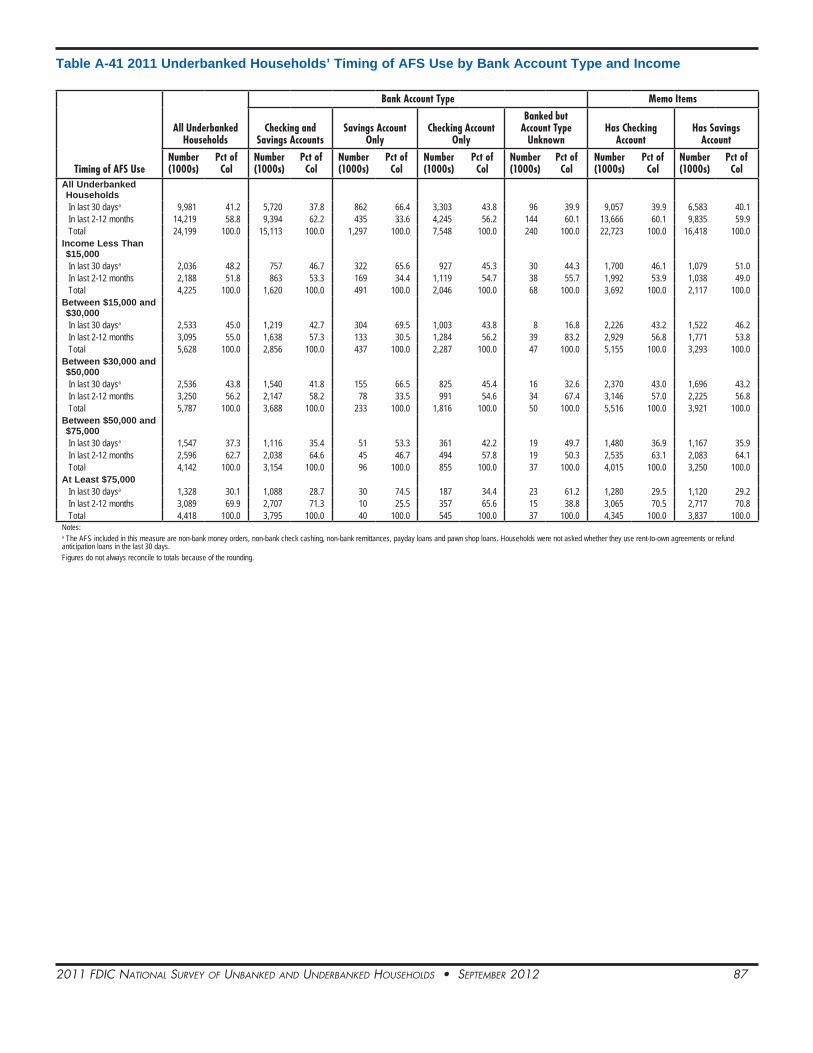
2011 FDIC NatIoNal Survey oF uNbaNkeD aND uNDerbaNkeD HouSeHolDS • September 2012 87
Table A-41 2011 Underbanked Households’ Timing of AFS Use by Bank Account Type and Income
Timing of AFS Use
All Underbanked Households
Bank Account Type Memo Items
Checking and Savings Accounts
Savings Account Only
Checking Account Only
Banked but Account Type
UnknownHas Checking
AccountHas Savings
Account
Number (1000s)
Pct of Col
Number (1000s)
Pct of Col
Number (1000s)
Pct of Col
Number (1000s)
Pct of Col
Number (1000s)
Pct of Col
Number (1000s)
Pct of Col
Number (1000s)
Pct of Col
All Underbanked HouseholdsIn last 30 daysa 9,981 41.2 5,720 37.8 862 66.4 3,303 43.8 96 39.9 9,057 39.9 6,583 40.1In last 2-12 months 14,219 58.8 9,394 62.2 435 33.6 4,245 56.2 144 60.1 13,666 60.1 9,835 59.9Total 24,199 100.0 15,113 100.0 1,297 100.0 7,548 100.0 240 100.0 22,723 100.0 16,418 100.0
Income Less Than $15,000In last 30 daysa 2,036 48.2 757 46.7 322 65.6 927 45.3 30 44.3 1,700 46.1 1,079 51.0In last 2-12 months 2,188 51.8 863 53.3 169 34.4 1,119 54.7 38 55.7 1,992 53.9 1,038 49.0Total 4,225 100.0 1,620 100.0 491 100.0 2,046 100.0 68 100.0 3,692 100.0 2,117 100.0
Between $15,000 and $30,000In last 30 daysa 2,533 45.0 1,219 42.7 304 69.5 1,003 43.8 8 16.8 2,226 43.2 1,522 46.2In last 2-12 months 3,095 55.0 1,638 57.3 133 30.5 1,284 56.2 39 83.2 2,929 56.8 1,771 53.8Total 5,628 100.0 2,856 100.0 437 100.0 2,287 100.0 47 100.0 5,155 100.0 3,293 100.0
Between $30,000 and $50,000In last 30 daysa 2,536 43.8 1,540 41.8 155 66.5 825 45.4 16 32.6 2,370 43.0 1,696 43.2In last 2-12 months 3,250 56.2 2,147 58.2 78 33.5 991 54.6 34 67.4 3,146 57.0 2,225 56.8Total 5,787 100.0 3,688 100.0 233 100.0 1,816 100.0 50 100.0 5,516 100.0 3,921 100.0
Between $50,000 and $75,000In last 30 daysa 1,547 37.3 1,116 35.4 51 53.3 361 42.2 19 49.7 1,480 36.9 1,167 35.9In last 2-12 months 2,596 62.7 2,038 64.6 45 46.7 494 57.8 19 50.3 2,535 63.1 2,083 64.1Total 4,142 100.0 3,154 100.0 96 100.0 855 100.0 37 100.0 4,015 100.0 3,250 100.0
At Least $75,000In last 30 daysa 1,328 30.1 1,088 28.7 30 74.5 187 34.4 23 61.2 1,280 29.5 1,120 29.2In last 2-12 months 3,089 69.9 2,707 71.3 10 25.5 357 65.6 15 38.8 3,065 70.5 2,717 70.8Total 4,418 100.0 3,795 100.0 40 100.0 545 100.0 37 100.0 4,345 100.0 3,837 100.0
Notes:a The AFS included in this measure are non-bank money orders, non-bank check cashing, non-bank remittances, payday loans and pawn shop loans. Households were not asked whether they use rent-to-own agreements or refund anticipation loans in the last 30 days. Figures do not always reconcile to totals because of the rounding.
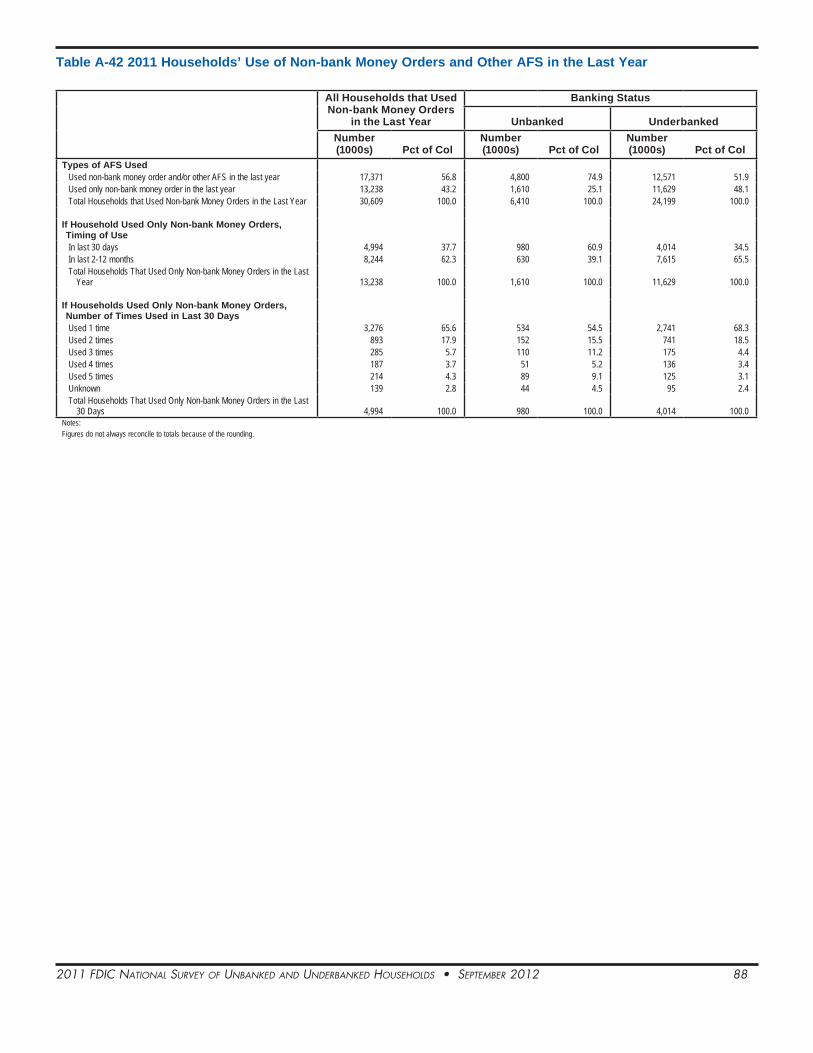
2011 FDIC NatIoNal Survey oF uNbaNkeD aND uNDerbaNkeD HouSeHolDS • September 2012 88
Table A-42 2011 Households’ Use of Non-bank Money Orders and Other AFS in the Last Year
All Households that Used Non-bank Money Orders
in the Last Year
Banking Status
Unbanked UnderbankedNumber (1000s) Pct of Col
Number (1000s) Pct of Col
Number (1000s) Pct of Col
Types of AFS UsedUsed non-bank money order and/or other AFS in the last year 17,371 56.8 4,800 74.9 12,571 51.9 Used only non-bank money order in the last year 13,238 43.2 1,610 25.1 11,629 48.1 Total Households that Used Non-bank Money Orders in the Last Year 30,609 100.0 6,410 100.0 24,199 100.0
If Household Used Only Non-bank Money Orders, Timing of UseIn last 30 days 4,994 37.7 980 60.9 4,014 34.5In last 2-12 months 8,244 62.3 630 39.1 7,615 65.5Total Households That Used Only Non-bank Money Orders in the Last
Year 13,238 100.0 1,610 100.0 11,629 100.0
If Households Used Only Non-bank Money Orders, Number of Times Used in Last 30 DaysUsed 1 time 3,276 65.6 534 54.5 2,741 68.3Used 2 times 893 17.9 152 15.5 741 18.5Used 3 times 285 5.7 110 11.2 175 4.4Used 4 times 187 3.7 51 5.2 136 3.4Used 5 times 214 4.3 89 9.1 125 3.1Unknown 139 2.8 44 4.5 95 2.4Total Households That Used Only Non-bank Money Orders in the Last
30 Days 4,994 100.0 980 100.0 4,014 100.0Notes:Figures do not always reconcile to totals because of the rounding.
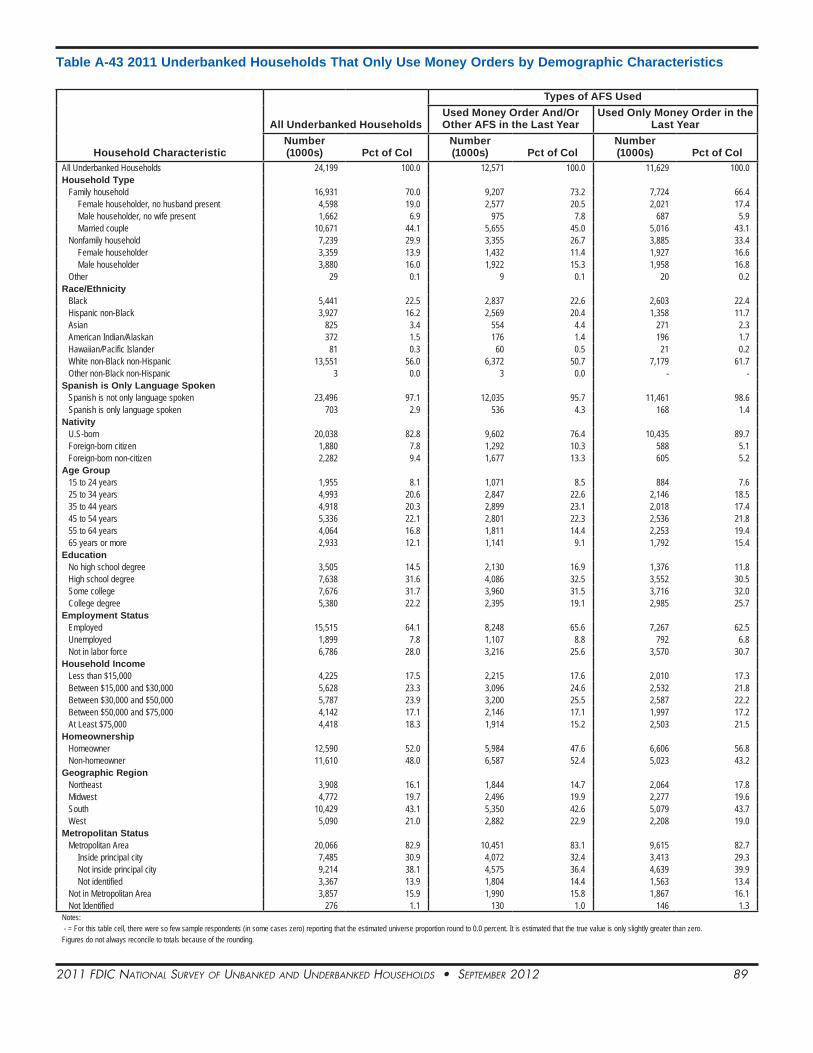
2011 FDIC NatIoNal Survey oF uNbaNkeD aND uNDerbaNkeD HouSeHolDS • September 2012 89
Table A-43 2011 Underbanked Households That Only Use Money Orders by Demographic Characteristics
Household Characteristic
All Underbanked Households
Types of AFS UsedUsed Money Order And/Or Other AFS in the Last Year
Used Only Money Order in the Last Year
Number (1000s) Pct of Col
Number (1000s) Pct of Col
Number (1000s) Pct of Col
All Underbanked Households 24,199 100.0 12,571 100.0 11,629 100.0Household Type
Family household 16,931 70.0 9,207 73.2 7,724 66.4Female householder, no husband present 4,598 19.0 2,577 20.5 2,021 17.4Male householder, no wife present 1,662 6.9 975 7.8 687 5.9Married couple 10,671 44.1 5,655 45.0 5,016 43.1
Nonfamily household 7,239 29.9 3,355 26.7 3,885 33.4Female householder 3,359 13.9 1,432 11.4 1,927 16.6Male householder 3,880 16.0 1,922 15.3 1,958 16.8
Other 29 0.1 9 0.1 20 0.2Race/Ethnicity
Black 5,441 22.5 2,837 22.6 2,603 22.4Hispanic non-Black 3,927 16.2 2,569 20.4 1,358 11.7Asian 825 3.4 554 4.4 271 2.3American Indian/Alaskan 372 1.5 176 1.4 196 1.7Hawaiian/Pacific Islander 81 0.3 60 0.5 21 0.2White non-Black non-Hispanic 13,551 56.0 6,372 50.7 7,179 61.7Other non-Black non-Hispanic 3 0.0 3 0.0 - -
Spanish is Only Language SpokenSpanish is not only language spoken 23,496 97.1 12,035 95.7 11,461 98.6Spanish is only language spoken 703 2.9 536 4.3 168 1.4
NativityU.S-born 20,038 82.8 9,602 76.4 10,435 89.7Foreign-born citizen 1,880 7.8 1,292 10.3 588 5.1Foreign-born non-citizen 2,282 9.4 1,677 13.3 605 5.2
Age Group15 to 24 years 1,955 8.1 1,071 8.5 884 7.625 to 34 years 4,993 20.6 2,847 22.6 2,146 18.535 to 44 years 4,918 20.3 2,899 23.1 2,018 17.445 to 54 years 5,336 22.1 2,801 22.3 2,536 21.855 to 64 years 4,064 16.8 1,811 14.4 2,253 19.465 years or more 2,933 12.1 1,141 9.1 1,792 15.4
EducationNo high school degree 3,505 14.5 2,130 16.9 1,376 11.8High school degree 7,638 31.6 4,086 32.5 3,552 30.5Some college 7,676 31.7 3,960 31.5 3,716 32.0College degree 5,380 22.2 2,395 19.1 2,985 25.7
Employment StatusEmployed 15,515 64.1 8,248 65.6 7,267 62.5Unemployed 1,899 7.8 1,107 8.8 792 6.8Not in labor force 6,786 28.0 3,216 25.6 3,570 30.7
Household IncomeLess than $15,000 4,225 17.5 2,215 17.6 2,010 17.3Between $15,000 and $30,000 5,628 23.3 3,096 24.6 2,532 21.8Between $30,000 and $50,000 5,787 23.9 3,200 25.5 2,587 22.2Between $50,000 and $75,000 4,142 17.1 2,146 17.1 1,997 17.2At Least $75,000 4,418 18.3 1,914 15.2 2,503 21.5
HomeownershipHomeowner 12,590 52.0 5,984 47.6 6,606 56.8Non-homeowner 11,610 48.0 6,587 52.4 5,023 43.2
Geographic RegionNortheast 3,908 16.1 1,844 14.7 2,064 17.8Midwest 4,772 19.7 2,496 19.9 2,277 19.6South 10,429 43.1 5,350 42.6 5,079 43.7West 5,090 21.0 2,882 22.9 2,208 19.0
Metropolitan StatusMetropolitan Area 20,066 82.9 10,451 83.1 9,615 82.7
Inside principal city 7,485 30.9 4,072 32.4 3,413 29.3Not inside principal city 9,214 38.1 4,575 36.4 4,639 39.9Not identified 3,367 13.9 1,804 14.4 1,563 13.4
Not in Metropolitan Area 3,857 15.9 1,990 15.8 1,867 16.1Not Identified 276 1.1 130 1.0 146 1.3
Notes: - = For this table cell, there were so few sample respondents (in some cases zero) reporting that the estimated universe proportion round to 0.0 percent. It is estimated that the true value is only slightly greater than zero. Figures do not always reconcile to totals because of the rounding.

2011 FDIC NatIoNal Survey oF uNbaNkeD aND uNDerbaNkeD HouSeHolDS • September 2012 90
Table A-44 2011 Households That Used Money Orders in the Last 30 Days: Number of Times Used and Where Purchased
All Households That Used Non-bank Money Orders in
the Last 30 Days
Banking Status
Unbanked UnderbankedNumber (1000s) Pct of Col
Number (1000s) Pct of Col
Number (1000s) Pct of Col
Number of Times Non-Bank Money Orders Used in the Last 30 DaysUsed 1 time 5,872 59.0 1,527 48.2 4,345 64.0Used 2 times 2,061 20.7 677 21.4 1,384 20.4Used 3 times 766 7.7 384 12.1 382 5.6Used 4 times 490 4.9 199 6.3 291 4.3Used 5 times 440 4.4 228 7.2 212 3.1Unknown 324 3.3 151 4.8 173 2.5Total Households That Used Money Orders in the Last
30 Days 9,952 100.0 3,166 100.0 6,786 100.0Where Non-Bank Money Orders Were Purchased in the Last 30 DaysPurchased at post office 2,799 28.1 722 22.8 2,077 30.6Did not purchase at post office 7,110 71.4 2,424 76.5 4,687 69.1Unknown 43 0.4 20 0.6 23 0.3Total Households That Used Money Orders in the Last
30 Days 9,952 100.0 3,166 100.0 6,786 100.0Notes:Figures do not always reconcile to totals because of the rounding.
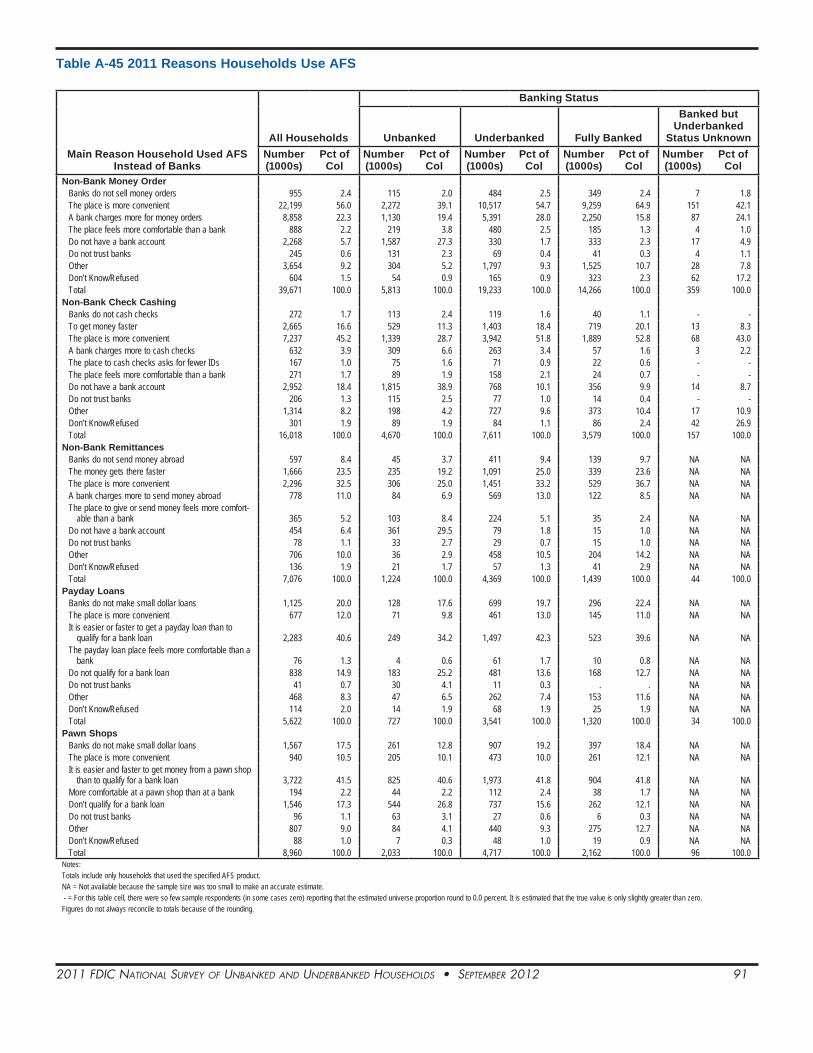
2011 FDIC NatIoNal Survey oF uNbaNkeD aND uNDerbaNkeD HouSeHolDS • September 2012 91
Table A-45 2011 Reasons Households Use AFS
Main Reason Household Used AFS Instead of Banks
All Households
Banking Status
Unbanked Underbanked Fully Banked
Banked but Underbanked
Status UnknownNumber (1000s)
Pct of Col
Number (1000s)
Pct of Col
Number (1000s)
Pct of Col
Number (1000s)
Pct of Col
Number (1000s)
Pct of Col
Non-Bank Money OrderBanks do not sell money orders 955 2.4 115 2.0 484 2.5 349 2.4 7 1.8The place is more convenient 22,199 56.0 2,272 39.1 10,517 54.7 9,259 64.9 151 42.1A bank charges more for money orders 8,858 22.3 1,130 19.4 5,391 28.0 2,250 15.8 87 24.1The place feels more comfortable than a bank 888 2.2 219 3.8 480 2.5 185 1.3 4 1.0Do not have a bank account 2,268 5.7 1,587 27.3 330 1.7 333 2.3 17 4.9Do not trust banks 245 0.6 131 2.3 69 0.4 41 0.3 4 1.1Other 3,654 9.2 304 5.2 1,797 9.3 1,525 10.7 28 7.8Don’t Know/Refused 604 1.5 54 0.9 165 0.9 323 2.3 62 17.2Total 39,671 100.0 5,813 100.0 19,233 100.0 14,266 100.0 359 100.0
Non-Bank Check CashingBanks do not cash checks 272 1.7 113 2.4 119 1.6 40 1.1 - -To get money faster 2,665 16.6 529 11.3 1,403 18.4 719 20.1 13 8.3The place is more convenient 7,237 45.2 1,339 28.7 3,942 51.8 1,889 52.8 68 43.0A bank charges more to cash checks 632 3.9 309 6.6 263 3.4 57 1.6 3 2.2The place to cash checks asks for fewer IDs 167 1.0 75 1.6 71 0.9 22 0.6 - -The place feels more comfortable than a bank 271 1.7 89 1.9 158 2.1 24 0.7 - -Do not have a bank account 2,952 18.4 1,815 38.9 768 10.1 356 9.9 14 8.7Do not trust banks 206 1.3 115 2.5 77 1.0 14 0.4 - -Other 1,314 8.2 198 4.2 727 9.6 373 10.4 17 10.9Don’t Know/Refused 301 1.9 89 1.9 84 1.1 86 2.4 42 26.9Total 16,018 100.0 4,670 100.0 7,611 100.0 3,579 100.0 157 100.0
Non-Bank RemittancesBanks do not send money abroad 597 8.4 45 3.7 411 9.4 139 9.7 NA NAThe money gets there faster 1,666 23.5 235 19.2 1,091 25.0 339 23.6 NA NAThe place is more convenient 2,296 32.5 306 25.0 1,451 33.2 529 36.7 NA NAA bank charges more to send money abroad 778 11.0 84 6.9 569 13.0 122 8.5 NA NAThe place to give or send money feels more comfort-
able than a bank 365 5.2 103 8.4 224 5.1 35 2.4 NA NADo not have a bank account 454 6.4 361 29.5 79 1.8 15 1.0 NA NADo not trust banks 78 1.1 33 2.7 29 0.7 15 1.0 NA NAOther 706 10.0 36 2.9 458 10.5 204 14.2 NA NADon’t Know/Refused 136 1.9 21 1.7 57 1.3 41 2.9 NA NATotal 7,076 100.0 1,224 100.0 4,369 100.0 1,439 100.0 44 100.0
Payday LoansBanks do not make small dollar loans 1,125 20.0 128 17.6 699 19.7 296 22.4 NA NAThe place is more convenient 677 12.0 71 9.8 461 13.0 145 11.0 NA NAIt is easier or faster to get a payday loan than to
qualify for a bank loan 2,283 40.6 249 34.2 1,497 42.3 523 39.6 NA NAThe payday loan place feels more comfortable than a
bank 76 1.3 4 0.6 61 1.7 10 0.8 NA NADo not qualify for a bank loan 838 14.9 183 25.2 481 13.6 168 12.7 NA NADo not trust banks 41 0.7 30 4.1 11 0.3 . . NA NAOther 468 8.3 47 6.5 262 7.4 153 11.6 NA NADon’t Know/Refused 114 2.0 14 1.9 68 1.9 25 1.9 NA NATotal 5,622 100.0 727 100.0 3,541 100.0 1,320 100.0 34 100.0
Pawn ShopsBanks do not make small dollar loans 1,567 17.5 261 12.8 907 19.2 397 18.4 NA NAThe place is more convenient 940 10.5 205 10.1 473 10.0 261 12.1 NA NAIt is easier and faster to get money from a pawn shop
than to qualify for a bank loan 3,722 41.5 825 40.6 1,973 41.8 904 41.8 NA NAMore comfortable at a pawn shop than at a bank 194 2.2 44 2.2 112 2.4 38 1.7 NA NADon’t qualify for a bank loan 1,546 17.3 544 26.8 737 15.6 262 12.1 NA NADo not trust banks 96 1.1 63 3.1 27 0.6 6 0.3 NA NAOther 807 9.0 84 4.1 440 9.3 275 12.7 NA NADon’t Know/Refused 88 1.0 7 0.3 48 1.0 19 0.9 NA NATotal 8,960 100.0 2,033 100.0 4,717 100.0 2,162 100.0 96 100.0
Notes: Totals include only households that used the specified AFS product.NA = Not available because the sample size was too small to make an accurate estimate. - = For this table cell, there were so few sample respondents (in some cases zero) reporting that the estimated universe proportion round to 0.0 percent. It is estimated that the true value is only slightly greater than zero.Figures do not always reconcile to totals because of the rounding.

2011 FDIC NatIoNal Survey oF uNbaNkeD aND uNDerbaNkeD HouSeHolDS • September 2012 92
Table A-46 2011 Reasons Households Need Funds From AFS Credit Products
Table A-47 2011 Household Use of Multiple AFS Products
Main Reason Household Used AFS Credit
All Households that Used AFS Credit in the Last Year
Banking StatusUnbanked Underbanked
Number (1000s) Pct of Col
Number (1000s) Pct of Col
Number (1000s) Pct of Col
To make up for job loss or decrease in income 1,269 17.5 317 19.1 953 17.1For basic living expenses 3,292 45.5 889 53.6 2,403 43.0For house or car repairs or to buy an appliance 818 11.3 157 9.5 661 11.8For medical, dental or death expenses 153 2.1 16 0.9 137 2.5For school or childcare expenses 152 2.1 27 1.6 126 2.2For special gifts or luxuries 332 4.6 72 4.3 260 4.7For legal expenses 38 0.5 2 0.1 36 0.6Other 893 12.3 124 7.5 769 13.8Don’t Know/Refused 296 4.1 56 3.4 240 4.3Total 7,243 100.0 1,660 100.0 5,583 100.0
Notes: Totals include only households that used an AFS credit product within the last 12 months.Figures do not always reconcile to totals because of the rounding.
Use of Multiple AFS Products
All Households
Banking Status
Unbanked Underbanked Fully Banked
Banked but Underbanked
Status UnknownNumber (1000s)
Pct of Col
Number (1000s)
Pct of Col
Number (1000s)
Pct of Col
Number (1000s)
Pct of Col
Number (1000s)
Pct of Col
All Households 120,408 100.0 9,875 100.0 24,199 100.0 82,830 100.0 3,504 100.0Number of Specific AFS Products Used in the Last YearUsed 0 AFS 85,741 71.2 2,911 29.5 0 0.0 82,830 100.0 0 0.0Used 1 AFS 19,796 16.4 2,610 26.4 17,186 71.0 0 0.0 0 0.0Used 2 AFS 7,173 6.0 2,339 23.7 4,834 20.0 0 0.0 0 0.0Used 3 or more AFS 2,840 2.4 1,166 11.8 1,674 6.9 0 0.0 0 0.0Unknown 4,858 4.0 849 8.6 505 2.1 0 0.0 3,504 100.0
Number of Specific AFS Products Used in the Last 30 Daysa
Used 0 AFS 101,650 84.4 4,729 47.9 13,878 57.3 82,830 100.0 214 6.1Used 1 AFS 10,984 9.1 2,708 27.4 8,276 34.2 0 0.0 0 0.0Used 2 AFS 2,723 2.3 1,411 14.3 1,311 5.4 0 0.0 0 0.0Used 3 or more AFS 383 0.3 189 1.9 194 0.8 0 0.0 0 0.0Unknown 4,669 3.9 838 8.5 541 2.2 0 0.0 3,290 93.9
Notes:a The AFS included in this measure are non-bank money orders, non-bank check cashing, non-bank remittances, payday loans and pawn shop loans. Households were not asked whether they use rent-to-own agreements or refund anticipation loans in the last 30 day - = For this table cell, there were so few sample respondents (in some cases zero) reporting that the estimated universe proportion round to 0.0 percent. It is estimated that the true value is only slightly greater than zero. Figures do not always reconcile to totals because of the rounding.
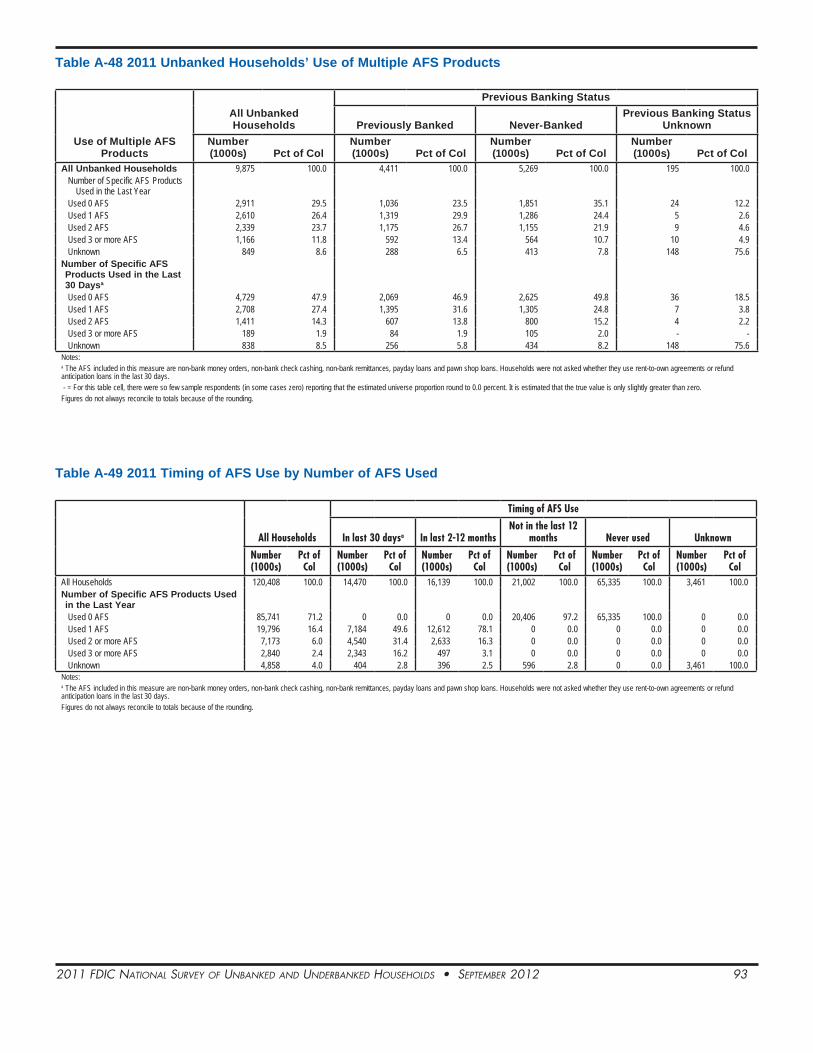
2011 FDIC NatIoNal Survey oF uNbaNkeD aND uNDerbaNkeD HouSeHolDS • September 2012 93
Table A-48 2011 Unbanked Households’ Use of Multiple AFS Products
Use of Multiple AFS Products
All Unbanked Households
Previous Banking Status
Previously Banked Never-BankedPrevious Banking Status
UnknownNumber (1000s) Pct of Col
Number (1000s) Pct of Col
Number (1000s) Pct of Col
Number (1000s) Pct of Col
All Unbanked Households 9,875 100.0 4,411 100.0 5,269 100.0 195 100.0Number of Specific AFS Products
Used in the Last YearUsed 0 AFS 2,911 29.5 1,036 23.5 1,851 35.1 24 12.2Used 1 AFS 2,610 26.4 1,319 29.9 1,286 24.4 5 2.6Used 2 AFS 2,339 23.7 1,175 26.7 1,155 21.9 9 4.6Used 3 or more AFS 1,166 11.8 592 13.4 564 10.7 10 4.9Unknown 849 8.6 288 6.5 413 7.8 148 75.6
Number of Specific AFS Products Used in the Last 30 Daysa
Used 0 AFS 4,729 47.9 2,069 46.9 2,625 49.8 36 18.5Used 1 AFS 2,708 27.4 1,395 31.6 1,305 24.8 7 3.8Used 2 AFS 1,411 14.3 607 13.8 800 15.2 4 2.2Used 3 or more AFS 189 1.9 84 1.9 105 2.0 - -Unknown 838 8.5 256 5.8 434 8.2 148 75.6
Notes:a The AFS included in this measure are non-bank money orders, non-bank check cashing, non-bank remittances, payday loans and pawn shop loans. Households were not asked whether they use rent-to-own agreements or refund anticipation loans in the last 30 days. - = For this table cell, there were so few sample respondents (in some cases zero) reporting that the estimated universe proportion round to 0.0 percent. It is estimated that the true value is only slightly greater than zero. Figures do not always reconcile to totals because of the rounding.
Table A-49 2011 Timing of AFS Use by Number of AFS Used
All Households
Timing of AFS Use
In last 30 daysa In last 2-12 monthsNot in the last 12
months Never used Unknown
Number (1000s)
Pct of Col
Number (1000s)
Pct of Col
Number (1000s)
Pct of Col
Number (1000s)
Pct of Col
Number (1000s)
Pct of Col
Number (1000s)
Pct of Col
All Households 120,408 100.0 14,470 100.0 16,139 100.0 21,002 100.0 65,335 100.0 3,461 100.0Number of Specific AFS Products Used in the Last YearUsed 0 AFS 85,741 71.2 0 0.0 0 0.0 20,406 97.2 65,335 100.0 0 0.0Used 1 AFS 19,796 16.4 7,184 49.6 12,612 78.1 0 0.0 0 0.0 0 0.0Used 2 or more AFS 7,173 6.0 4,540 31.4 2,633 16.3 0 0.0 0 0.0 0 0.0Used 3 or more AFS 2,840 2.4 2,343 16.2 497 3.1 0 0.0 0 0.0 0 0.0Unknown 4,858 4.0 404 2.8 396 2.5 596 2.8 0 0.0 3,461 100.0
Notes:a The AFS included in this measure are non-bank money orders, non-bank check cashing, non-bank remittances, payday loans and pawn shop loans. Households were not asked whether they use rent-to-own agreements or refund anticipation loans in the last 30 days. Figures do not always reconcile to totals because of the rounding.

2011 FDIC NatIoNal Survey oF uNbaNkeD aND uNDerbaNkeD HouSeHolDS • September 2012 94
Table A-50 2011 Timing of AFS Use by Demographic Characteristics
Household Characteristic
All Households
Timing of AFS Use
In last 30 daysa In last 2-12 monthsNot in the last 12
months Never used Unknown
Number (1000s)
Pct of Col
Number (1000s)
Pct of Col
Number (1000s)
Pct of Col
Number (1000s)
Pct of Col
Number (1000s)
Pct of Col
Number (1000s)
Pct of Col
All Households 120,408 100.0 14,470 100.0 16,139 100.0 21,002 100.0 65,335 100.0 3,461 100.0Banking Status
Unbanked 9,875 8.2 4,490 31.0 1,920 11.9 929 4.4 2,036 3.1 501 14.5Underbanked 24,199 20.1 9,981 69.0 14,219 88.1 0 0.0 0 0.0 0 0.0Fully banked 82,830 68.8 0 0.0 0 0.0 19,531 93.0 63,299 96.9 0 0.0Banked but underbanked status unknown 3,504 2.9 0 0.0 0 0.0 543 2.6 0 0.0 2,961 85.5
Bank Account TypeUnbanked households 9,875 8.2 4,490 31.0 1,920 11.9 929 4.4 2,036 3.1 501 14.5Checking and savings accounts 80,924 67.2 5,720 39.5 9,394 58.2 14,944 71.2 49,272 75.4 1,594 46.0Savings account only 2,379 2.0 862 6.0 435 2.7 281 1.3 782 1.2 19 0.6Checking account only 25,378 21.1 3,303 22.8 4,245 26.3 4,680 22.3 12,610 19.3 541 15.6Banked, but account type unknown 1,851 1.5 96 0.7 144 0.9 169 0.8 634 1.0 807 23.3
Household TypeFamily household 78,826 65.5 10,040 69.4 11,091 68.7 13,377 63.7 42,255 64.7 2,062 59.6
Female householder, no husband present 15,575 12.9 3,643 25.2 3,075 19.1 2,502 11.9 5,898 9.0 456 13.2Male householder, no wife present 5,661 4.7 1,167 8.1 1,075 6.7 867 4.1 2,346 3.6 206 5.9
Married couple 57,591 47.8 5,231 36.1 6,941 43.0 10,008 47.7 34,011 52.1 1,400 40.5Nonfamily household 41,479 34.4 4,422 30.6 5,026 31.1 7,594 36.2 23,042 35.3 1,395 40.3
Female householder 21,688 18.0 1,929 13.3 2,269 14.1 3,884 18.5 12,803 19.6 803 23.2Male householder 19,791 16.4 2,493 17.2 2,757 17.1 3,710 17.7 10,239 15.7 591 17.1
Other 102 0.1 8 0.1 22 0.1 31 0.1 37 0.1 5 0.1Race and Ethnicity of Householder
Black 16,046 13.3 4,217 29.1 3,425 21.2 2,600 12.4 5,170 7.9 633 18.3Hispanic non-Black 13,710 11.4 3,406 23.5 2,367 14.7 1,689 8.0 5,880 9.0 369 10.7Asian 4,985 4.1 289 2.0 577 3.6 515 2.5 3,439 5.3 165 4.8American Indian/Alaskan 1,389 1.2 276 1.9 241 1.5 276 1.3 553 0.8 44 1.3Hawaiian/Pacific Islander 267 0.2 41 0.3 52 0.3 45 0.2 126 0.2 3 0.1White non-Black non-Hispanic 83,988 69.8 6,242 43.1 9,474 58.7 15,864 75.5 50,167 76.8 2,241 64.7Other non-Black non-Hispanic 23 - NA NA NA NA NA NA NA NA NA NA
Spanish is Only Language SpokenSpanish is not only language spoken 117,940 98.0 13,566 93.8 15,743 97.5 20,774 98.9 64,470 98.7 3,388 97.9Spanish is only language spoken 2,467 2.0 904 6.2 396 2.5 228 1.1 865 1.3 74 2.1
NativityU.S-born 104,143 86.5 11,461 79.2 13,626 84.4 19,329 92.0 56,819 87.0 2,908 84.0Foreign-born citizen 8,380 7.0 912 6.3 1,174 7.3 915 4.4 5,124 7.8 256 7.4Foreign-born non-citizen 7,885 6.5 2,097 14.5 1,339 8.3 758 3.6 3,392 5.2 298 8.6
Age Group15 to 24 years 6,299 5.2 1,415 9.8 1,276 7.9 738 3.5 2,717 4.2 154 4.425 to 34 years 20,374 16.9 3,404 23.5 3,480 21.6 3,392 16.2 9,588 14.7 510 14.735 to 44 years 21,414 17.8 3,093 21.4 3,278 20.3 3,818 18.2 10,714 16.4 511 14.845 to 54 years 24,658 20.5 3,080 21.3 3,523 21.8 4,284 20.4 12,973 19.9 798 23.155 to 64 years 22,036 18.3 2,075 14.3 2,693 16.7 4,247 20.2 12,398 19.0 623 18.065 years or more 25,625 21.3 1,402 9.7 1,890 11.7 4,522 21.5 16,946 25.9 865 25.0
EducationNo high school degree 14,321 11.9 3,567 24.7 2,251 13.9 2,036 9.7 5,951 9.1 515 14.9High school degree 34,462 28.6 4,950 34.2 5,202 32.2 5,699 27.1 17,458 26.7 1,152 33.3Some college 34,010 28.2 4,114 28.4 4,965 30.8 6,576 31.3 17,508 26.8 846 24.5College degree 37,615 31.2 1,838 12.7 3,721 23.1 6,692 31.9 24,417 37.4 947 27.4
Employment StatusEmployed 72,580 60.3 8,330 57.6 9,913 61.4 12,881 61.3 39,618 60.6 1,839 53.1Unemployed 6,779 5.6 1,460 10.1 1,532 9.5 1,011 4.8 2,608 4.0 167 4.8Not in labor force 41,049 34.1 4,680 32.3 4,694 29.1 7,110 33.9 23,109 35.4 1,456 42.1
Household IncomeLess than $15,000 19,541 16.2 4,377 30.2 3,396 21.0 2,973 14.2 8,139 12.5 657 19.0Between $15,000 and $30,000 22,073 18.3 3,793 26.2 3,545 22.0 3,678 17.5 10,248 15.7 808 23.4Between $30,000 and $50,000 24,787 20.6 3,148 21.8 3,424 21.2 4,585 21.8 12,948 19.8 683 19.7Between $50,000 and $75,000 21,975 18.3 1,771 12.2 2,666 16.5 4,095 19.5 12,891 19.7 552 16.0At Least $75,000 32,032 26.6 1,382 9.6 3,108 19.3 5,671 27.0 21,110 32.3 761 22.0
HomeownershipHomeowner 79,144 65.7 5,269 36.4 8,634 53.5 14,415 68.6 48,548 74.3 2,278 65.8Non-homeowner 41,264 34.3 9,201 63.6 7,505 46.5 6,588 31.4 16,787 25.7 1,183 34.2
Geographic RegionNortheast 21,784 18.1 2,150 14.9 2,709 16.8 3,794 18.1 12,494 19.1 637 18.4Midwest 26,900 22.3 2,705 18.7 3,286 20.4 4,750 22.6 15,340 23.5 820 23.7

2011 FDIC NatIoNal Survey oF uNbaNkeD aND uNDerbaNkeD HouSeHolDS • September 2012 95
Table A-50 2011 Timing of AFS Use by Demographic Characteristics (continued)
Household Characteristic
All Households
Timing of AFS Use
In last 30 daysa In last 2-12 monthsNot in the last 12
months Never used Unknown
Number (1000s)
Pct of Col
Number (1000s)
Pct of Col
Number (1000s)
Pct of Col
Number (1000s)
Pct of Col
Number (1000s)
Pct of Col
Number (1000s)
Pct of Col
South 44,920 37.3 6,425 44.4 6,979 43.2 7,798 37.1 22,446 34.4 1,271 36.7West 26,804 22.3 3,190 22.0 3,165 19.6 4,660 22.2 15,055 23.0 734 21.2
Metropolitan StatusMetropolitan Area 100,311 83.3 12,040 83.2 13,244 82.1 17,066 81.3 54,983 84.2 2,978 86.0
Inside principal city 33,636 27.9 5,278 36.5 4,836 30.0 5,426 25.8 17,040 26.1 1,056 30.5Not inside principal city 49,548 41.2 4,899 33.9 6,160 38.2 8,419 40.1 28,602 43.8 1,467 42.4Not identified 17,127 14.2 1,863 12.9 2,248 13.9 3,221 15.3 9,341 14.3 454 13.1
Not in Metropolitan Area 19,193 15.9 2,270 15.7 2,727 16.9 3,792 18.1 9,938 15.2 466 13.5Not Identified 903 0.8 161 1.1 168 1.0 144 0.7 413 0.6 17 0.5
Notes:a The AFS included in this measure are non-bank money orders, non-bank check cashing, non-bank remittances, payday loans and pawn shop loans. Households were not asked whether they use rent-to-own agreements or refund anticipation loans in the last 30 days. - = For this table cell, there were so few sample respondents (in some cases zero) reporting that the estimated universe proportion round to 0.0 percent. It is estimated that the true value is only slightly greater than zero.Figures do not always reconcile to totals because of the rounding.NA = Not available because the sample size was too small to make an accurate estimate.
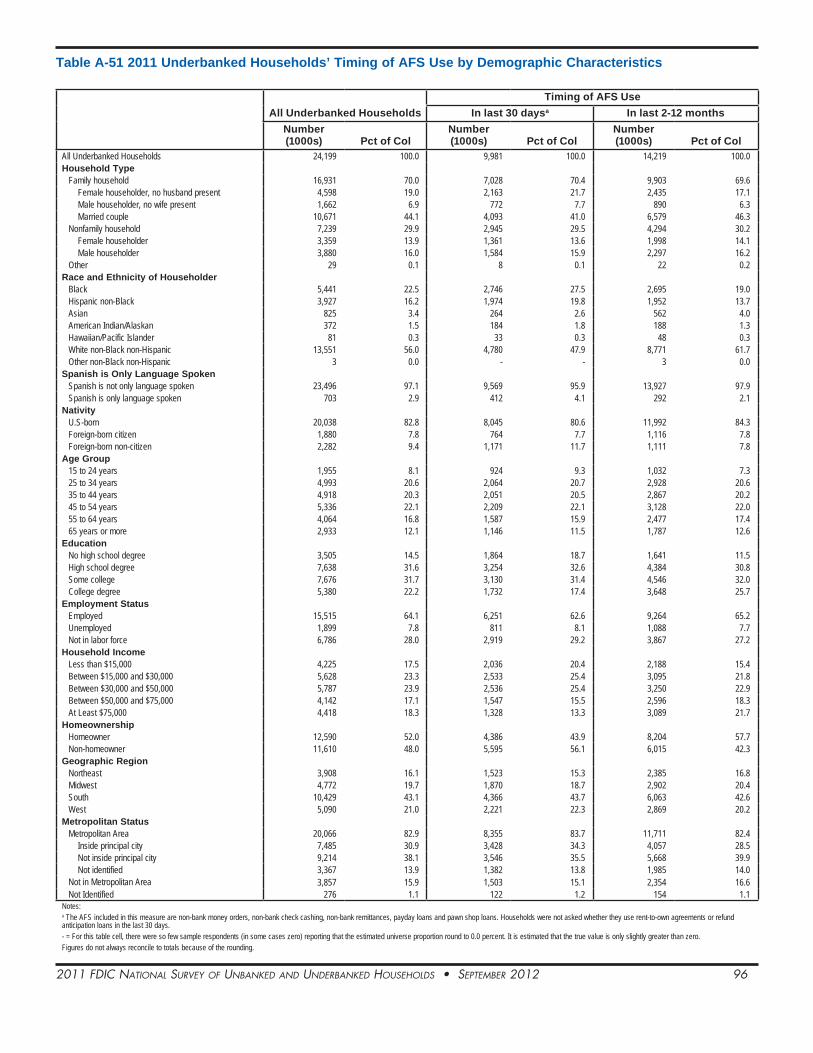
2011 FDIC NatIoNal Survey oF uNbaNkeD aND uNDerbaNkeD HouSeHolDS • September 2012 96
Table A-51 2011 Underbanked Households’ Timing of AFS Use by Demographic Characteristics
All Underbanked HouseholdsTiming of AFS Use
In last 30 daysa In last 2-12 monthsNumber (1000s) Pct of Col
Number (1000s) Pct of Col
Number (1000s) Pct of Col
All Underbanked Households 24,199 100.0 9,981 100.0 14,219 100.0Household Type
Family household 16,931 70.0 7,028 70.4 9,903 69.6Female householder, no husband present 4,598 19.0 2,163 21.7 2,435 17.1Male householder, no wife present 1,662 6.9 772 7.7 890 6.3Married couple 10,671 44.1 4,093 41.0 6,579 46.3
Nonfamily household 7,239 29.9 2,945 29.5 4,294 30.2Female householder 3,359 13.9 1,361 13.6 1,998 14.1Male householder 3,880 16.0 1,584 15.9 2,297 16.2
Other 29 0.1 8 0.1 22 0.2Race and Ethnicity of Householder
Black 5,441 22.5 2,746 27.5 2,695 19.0Hispanic non-Black 3,927 16.2 1,974 19.8 1,952 13.7Asian 825 3.4 264 2.6 562 4.0American Indian/Alaskan 372 1.5 184 1.8 188 1.3Hawaiian/Pacific Islander 81 0.3 33 0.3 48 0.3White non-Black non-Hispanic 13,551 56.0 4,780 47.9 8,771 61.7Other non-Black non-Hispanic 3 0.0 - - 3 0.0
Spanish is Only Language SpokenSpanish is not only language spoken 23,496 97.1 9,569 95.9 13,927 97.9Spanish is only language spoken 703 2.9 412 4.1 292 2.1
NativityU.S-born 20,038 82.8 8,045 80.6 11,992 84.3Foreign-born citizen 1,880 7.8 764 7.7 1,116 7.8Foreign-born non-citizen 2,282 9.4 1,171 11.7 1,111 7.8
Age Group15 to 24 years 1,955 8.1 924 9.3 1,032 7.325 to 34 years 4,993 20.6 2,064 20.7 2,928 20.635 to 44 years 4,918 20.3 2,051 20.5 2,867 20.245 to 54 years 5,336 22.1 2,209 22.1 3,128 22.055 to 64 years 4,064 16.8 1,587 15.9 2,477 17.465 years or more 2,933 12.1 1,146 11.5 1,787 12.6
EducationNo high school degree 3,505 14.5 1,864 18.7 1,641 11.5High school degree 7,638 31.6 3,254 32.6 4,384 30.8Some college 7,676 31.7 3,130 31.4 4,546 32.0College degree 5,380 22.2 1,732 17.4 3,648 25.7
Employment StatusEmployed 15,515 64.1 6,251 62.6 9,264 65.2Unemployed 1,899 7.8 811 8.1 1,088 7.7Not in labor force 6,786 28.0 2,919 29.2 3,867 27.2
Household IncomeLess than $15,000 4,225 17.5 2,036 20.4 2,188 15.4Between $15,000 and $30,000 5,628 23.3 2,533 25.4 3,095 21.8Between $30,000 and $50,000 5,787 23.9 2,536 25.4 3,250 22.9Between $50,000 and $75,000 4,142 17.1 1,547 15.5 2,596 18.3At Least $75,000 4,418 18.3 1,328 13.3 3,089 21.7
HomeownershipHomeowner 12,590 52.0 4,386 43.9 8,204 57.7Non-homeowner 11,610 48.0 5,595 56.1 6,015 42.3
Geographic RegionNortheast 3,908 16.1 1,523 15.3 2,385 16.8Midwest 4,772 19.7 1,870 18.7 2,902 20.4South 10,429 43.1 4,366 43.7 6,063 42.6West 5,090 21.0 2,221 22.3 2,869 20.2
Metropolitan StatusMetropolitan Area 20,066 82.9 8,355 83.7 11,711 82.4
Inside principal city 7,485 30.9 3,428 34.3 4,057 28.5Not inside principal city 9,214 38.1 3,546 35.5 5,668 39.9Not identified 3,367 13.9 1,382 13.8 1,985 14.0
Not in Metropolitan Area 3,857 15.9 1,503 15.1 2,354 16.6Not Identified 276 1.1 122 1.2 154 1.1
Notes:a The AFS included in this measure are non-bank money orders, non-bank check cashing, non-bank remittances, payday loans and pawn shop loans. Households were not asked whether they use rent-to-own agreements or refund anticipation loans in the last 30 days. - = For this table cell, there were so few sample respondents (in some cases zero) reporting that the estimated universe proportion round to 0.0 percent. It is estimated that the true value is only slightly greater than zero.Figures do not always reconcile to totals because of the rounding.

2011 FDIC NatIoNal Survey oF uNbaNkeD aND uNDerbaNkeD HouSeHolDS • September 2012 97
Table A-52 2011 Number of Times Households Used Transaction AFS in the Last 30 Days
Number of Times Transaction AFS Used
All Households That Used Transaction AFS in the Last
30 Days
Banking Status
Unbanked UnderbankedNumber (1000s) Pct of Col
Number (1000s) Pct of Col
Number (1000s) Pct of Col
All Households that Used Transaction AFS in the Last 30 Days 13,504 100.0 4,392 100.0 9,112 100.0Used 1 time 6,367 47.1 1,327 30.2 5,040 55.3Used 2 times 3,101 23.0 1,032 23.5 2,069 22.7Used 3 or more times 3,575 26.5 1,817 41.4 1,758 19.3Unknown 462 3.4 216 4.9 246 2.7Notes:Figures are based on the number of times households used non-bank money orders, non-bank check cashing, and/or non-bank remittances in the last 30 days. Households were not asked the number of times they used payday loans, pawn shops, rent-to-own or RALs in the last 30 days. Figures do not always reconcile to totals because of the rounding.

2011 FDIC NatIoNal Survey oF uNbaNkeD aND uNDerbaNkeD HouSeHolDS • September 2012 98
Table A-53 2011 Households’ Use of Multiple AFS in the Last Year by Demographic Characteristics
Household Characteristic
All Households
Number of Specific AFS Products Used in the Last Year
Used 0 AFS Used 1 AFSUsed 2 or More
AFS UnknownNumber (1000s)
Pct of Col
Number (1000s)
Pct of Col
Number (1000s)
Pct of Col
Number (1000s)
Pct of Col
Number (1000s)
Pct of Col
All Households 120,408 100.0 85,741 100.0 19,796 100.0 10,013 100.0 4,858 100.0Banking Status
Unbanked 9,875 8.2 2,911 3.4 2,610 13.2 3,505 35.0 849 17.5Underbanked 24,199 20.1 0 0.0 17,186 86.8 6,508 65.0 505 10.4Fully banked 82,830 68.8 82,830 96.6 0 0.0 0 0.0 0 0.0Banked but underbanked status unknown 3,504 2.9 0 0.0 0 0.0 0 0.0 3,504 72.1
Bank Account TypeUnbanked Households 9,875 8.2 2,911 3.4 2,610 13.2 3,505 35.0 849 17.5Checking and savings accounts 80,924 67.2 63,839 74.5 11,051 55.8 3,798 37.9 2,236 46.0Savings account only 2,379 2.0 1,053 1.2 878 4.4 408 4.1 41 0.8Checking account only 25,378 21.1 17,164 20.0 5,099 25.8 2,262 22.6 854 17.6Banked, but account type unknown 1,851 1.5 774 0.9 157 0.8 41 0.4 878 18.1
Household TypeFamily household 78,826 65.5 55,251 64.4 13,381 67.6 7,152 71.4 3,043 62.6
Female householder, no husband present 15,575 12.9 8,293 9.7 3,794 19.2 2,682 26.8 805 16.6Male householder, no wife present 5,661 4.7 3,188 3.7 1,226 6.2 940 9.4 307 6.3Married couple 57,591 47.8 43,769 51.0 8,361 42.2 3,530 35.3 1,931 39.7
Nonfamily household 41,479 34.4 30,425 35.5 6,387 32.3 2,860 28.6 1,808 37.2Female householder 21,688 18.0 16,576 19.3 3,001 15.2 1,090 10.9 1,021 21.0Male householder 19,791 16.4 13,849 16.2 3,386 17.1 1,770 17.7 787 16.2
Other 102 0.1 66 0.1 28 0.1 1 - 7 0.1Race and Ethnicity of Householder
Black 16,046 13.3 7,643 8.9 4,451 22.5 2,973 29.7 980 20.2Hispanic non-Black 13,710 11.4 7,496 8.7 3,141 15.9 2,435 24.3 638 13.1Asian 4,985 4.1 3,929 4.6 645 3.3 189 1.9 223 4.6American Indian/Alaskan 1,389 1.2 818 1.0 328 1.7 178 1.8 65 1.3Hawaiian/Pacific Islander 267 0.2 171 0.2 54 0.3 31 0.3 11 0.2White non-Black non-Hispanic 83,988 69.8 65,671 76.6 11,177 56.5 4,205 42.0 2,935 60.4Other non-Black non-Hispanic 23 0.0 14 - - - 3 - 6 0.1
Spanish is Only Language SpokenSpanish is not only language spoken 117,940 98.0 84,665 98.7 19,166 96.8 9,394 93.8 4,715 97.1Spanish is only language spoken 2,467 2.0 1,076 1.3 629 3.2 619 6.2 143 2.9
NativityU.S-born 104,143 86.5 75,620 88.2 16,619 84.0 7,872 78.6 4,032 83.0Foreign-born citizen 8,380 7.0 6,000 7.0 1,400 7.1 619 6.2 361 7.4Foreign-born non-citizen 7,885 6.5 4,121 4.8 1,776 9.0 1,522 15.2 465 9.6
Age Group15 to 24 years 6,299 5.2 3,446 4.0 1,543 7.8 1,074 10.7 236 4.925 to 34 years 20,374 16.9 12,880 15.0 3,908 19.7 2,819 28.2 768 15.835 to 44 years 21,414 17.8 14,452 16.9 3,933 19.9 2,288 22.8 741 15.345 to 54 years 24,658 20.5 17,161 20.0 4,317 21.8 2,089 20.9 1,091 22.555 to 64 years 22,036 18.3 16,523 19.3 3,468 17.5 1,176 11.7 870 17.965 years or more 25,625 21.3 21,280 24.8 2,627 13.3 567 5.7 1,151 23.7
EducationNo high school degree 14,321 11.9 7,885 9.2 3,170 16.0 2,439 24.4 827 17.0High school degree 34,462 28.6 22,983 26.8 6,289 31.8 3,581 35.8 1,608 33.1Some college 34,010 28.2 23,885 27.9 5,949 30.1 2,936 29.3 1,239 25.5College degree 37,615 31.2 30,988 36.1 4,387 22.2 1,057 10.6 1,184 24.4
Employment StatusEmployed 72,580 60.3 52,181 60.9 11,984 60.5 5,846 58.4 2,569 52.9Unemployed 6,779 5.6 3,601 4.2 1,675 8.5 1,253 12.5 250 5.1Not in labor force 41,049 34.1 29,959 34.9 6,137 31.0 2,914 29.1 2,039 42.0
Household IncomeLess than $15,000 19,541 16.2 11,006 12.8 4,439 22.4 3,087 30.8 1,009 20.8Between $15,000 and $30,000 22,073 18.3 13,818 16.1 4,371 22.1 2,765 27.6 1,120 23.0Between $30,000 and $50,000 24,787 20.6 17,386 20.3 4,187 21.2 2,211 22.1 1,003 20.7Between $50,000 and $75,000 21,975 18.3 16,862 19.7 3,178 16.1 1,168 11.7 767 15.8At Least $75,000 32,032 26.6 26,669 31.1 3,621 18.3 783 7.8 958 19.7
HomeownershipHomeowner 79,144 65.7 62,597 73.0 10,341 52.2 3,254 32.5 2,952 60.8Non-homeowner 41,264 34.3 23,144 27.0 9,454 47.8 6,759 67.5 1,906 39.2
Geographic RegionNortheast 21,784 18.1 16,191 18.9 3,308 16.7 1,406 14.0 880 18.1Midwest 26,900 22.3 19,939 23.3 3,982 20.1 1,863 18.6 1,116 23.0
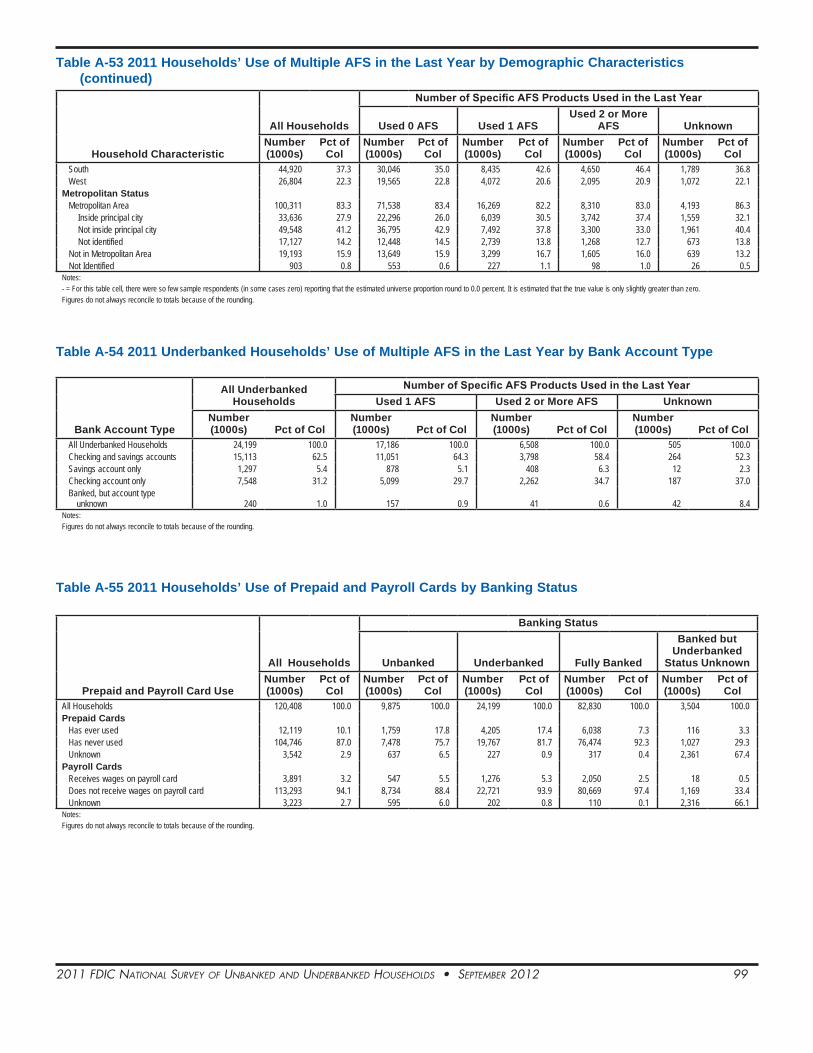
2011 FDIC NatIoNal Survey oF uNbaNkeD aND uNDerbaNkeD HouSeHolDS • September 2012 99
Table A-53 2011 Households’ Use of Multiple AFS in the Last Year by Demographic Characteristics (continued)
Household Characteristic
All Households
Number of Specific AFS Products Used in the Last Year
Used 0 AFS Used 1 AFSUsed 2 or More
AFS UnknownNumber (1000s)
Pct of Col
Number (1000s)
Pct of Col
Number (1000s)
Pct of Col
Number (1000s)
Pct of Col
Number (1000s)
Pct of Col
South 44,920 37.3 30,046 35.0 8,435 42.6 4,650 46.4 1,789 36.8West 26,804 22.3 19,565 22.8 4,072 20.6 2,095 20.9 1,072 22.1
Metropolitan StatusMetropolitan Area 100,311 83.3 71,538 83.4 16,269 82.2 8,310 83.0 4,193 86.3
Inside principal city 33,636 27.9 22,296 26.0 6,039 30.5 3,742 37.4 1,559 32.1Not inside principal city 49,548 41.2 36,795 42.9 7,492 37.8 3,300 33.0 1,961 40.4Not identified 17,127 14.2 12,448 14.5 2,739 13.8 1,268 12.7 673 13.8
Not in Metropolitan Area 19,193 15.9 13,649 15.9 3,299 16.7 1,605 16.0 639 13.2Not Identified 903 0.8 553 0.6 227 1.1 98 1.0 26 0.5
Notes:- = For this table cell, there were so few sample respondents (in some cases zero) reporting that the estimated universe proportion round to 0.0 percent. It is estimated that the true value is only slightly greater than zero.Figures do not always reconcile to totals because of the rounding.
Table A-54 2011 Underbanked Households’ Use of Multiple AFS in the Last Year by Bank Account Type
Bank Account Type
All Underbanked Households
Number of Specific AFS Products Used in the Last YearUsed 1 AFS Used 2 or More AFS Unknown
Number (1000s) Pct of Col
Number (1000s) Pct of Col
Number (1000s) Pct of Col
Number (1000s) Pct of Col
All Underbanked Households 24,199 100.0 17,186 100.0 6,508 100.0 505 100.0Checking and savings accounts 15,113 62.5 11,051 64.3 3,798 58.4 264 52.3Savings account only 1,297 5.4 878 5.1 408 6.3 12 2.3Checking account only 7,548 31.2 5,099 29.7 2,262 34.7 187 37.0Banked, but account type
unknown 240 1.0 157 0.9 41 0.6 42 8.4Notes:Figures do not always reconcile to totals because of the rounding.
Table A-55 2011 Households’ Use of Prepaid and Payroll Cards by Banking Status
Prepaid and Payroll Card Use
All Households
Banking Status
Unbanked Underbanked Fully Banked
Banked but Underbanked
Status UnknownNumber (1000s)
Pct of Col
Number (1000s)
Pct of Col
Number (1000s)
Pct of Col
Number (1000s)
Pct of Col
Number (1000s)
Pct of Col
All Households 120,408 100.0 9,875 100.0 24,199 100.0 82,830 100.0 3,504 100.0Prepaid Cards
Has ever used 12,119 10.1 1,759 17.8 4,205 17.4 6,038 7.3 116 3.3Has never used 104,746 87.0 7,478 75.7 19,767 81.7 76,474 92.3 1,027 29.3Unknown 3,542 2.9 637 6.5 227 0.9 317 0.4 2,361 67.4
Payroll CardsReceives wages on payroll card 3,891 3.2 547 5.5 1,276 5.3 2,050 2.5 18 0.5Does not receive wages on payroll card 113,293 94.1 8,734 88.4 22,721 93.9 80,669 97.4 1,169 33.4Unknown 3,223 2.7 595 6.0 202 0.8 110 0.1 2,316 66.1
Notes:Figures do not always reconcile to totals because of the rounding.

2011 FDIC NatIoNal Survey oF uNbaNkeD aND uNDerbaNkeD HouSeHolDS • September 2012 100
Table A-56 2011 Unbanked Households’ Use of Prepaid and Payroll Cards by Banking Status
Prepaid and Payroll Card Use
All Unbanked Households
Unbanked Status
Previously Banked Never-BankedPrevious Banking Status
UnknownNumber (1000s) Pct of Col
Number (1000s) Pct of Col
Number (1000s) Pct of Col
Number (1000s) Pct of Col
All Unbanked Households 9,875 100.0 4,411 100.0 5,269 100.0 195 100.0Prepaid Cards
Has ever used 1,759 17.8 1,182 26.8 568 10.8 9 4.6Has never used 7,478 75.7 3,007 68.2 4,404 83.6 67 34.5Unknown 637 6.5 221 5.0 297 5.6 119 60.9
Payroll CardsReceives wages on payroll card 547 5.5 377 8.5 155 2.9 15 7.7Does not receive wages on payroll
card 8,734 88.4 3,837 87.0 4,830 91.7 67 34.2Unknown 595 6.0 196 4.5 285 5.4 114 58.1
Notes:Figures do not always reconcile to totals because of the rounding.
Table A-57 Households’ Use of Prepaid and Payroll Cards by Year
Prepaid and Payroll Card Use
All Households
Banking Status
Unbanked Underbanked Fully Banked Underbanked Status Unknown
Number (1000s) Pct of ColEstimated Difference
Pct of ColEstimated Difference
Pct of ColEstimated Difference
Pct of ColEstimated Difference
Pct of ColEstimated Difference2009 2011 2009 2011 2009 2011 2009 2011 2009 2011 2009 2011
Prepaid CardsHas ever used 11,781 12,119 9.9 10.1 0.2 12.2 17.8 5.6* 16.4 17.4 1.0 8.1 7.3 -0.8* 6.8 3.3 -3.5*Has never used 105,000 105,000 87.9 87.0 -0.9* 81.3 75.7 -5.6* 82.8 81.7 -1.2* 91.5 92.3 0.8* 47.2 29.3 -17.9*Unknown 2,600 3,542 2.2 2.9 0.8* 6.5 6.5 -0.0 0.7 0.9 0.2 0.4 0.4 0.0 45.9 67.4 21.5*
Payroll CardsReceives wages
on payroll card 3,588 3,891 3.0 3.2 0.2 3.2 5.5 2.3* 4.2 5.3 1.0* 2.7 2.5 -0.3 1.6 0.5 -1.1*Does not receive
wages on payroll card 113,000 113,000 95.0 94.1 -0.9* 90.1 88.4 -1.7* 95.3 93.9 -1.4* 97.1 97.4 0.3 51.9 33.4 -18.5
Unknown 2,405 3,223 2.0 2.7 0.7* 6.7 6.0 -0.6 0.5 0.8 0.4* 0.2 0.1 -0.0 46.5 66.1 19.6*Notes:* Indicates differences that are statistically significant at the 10% level.Figures do not always reconcile to totals because of rounding.2009 data revised September 2012. Refer to 2009 and 2011 FDIC National Survey of Unbanked and Underbanked Households and Technical Notes for terms, definitions, and methodological discussion.
Table A-58 Unbanked Households’ Use of Prepaid and Payroll Cards by Year
Prepaid and Payroll Card Use
All Unbanked Households
Unbanked Status
Previously Banked Never-Banked Previous Banking Status Unknown
Number (1000s) Pct of Col Estimated Difference
Pct of Col Estimated Difference
Pct of Col Estimated Difference2009 2011 2009 2011 2009 2011 2009 2011
Prepaid CardsHas ever used 1,104 1,759 18.8 26.8 8.0 * 5.7 10.8 5.1 * - 4.6 4.6Has never used 7,364 7,478 77.7 68.2 -9.6 * 86.0 83.6 -2.4 * 48.5 34.5 -14.0Unknown 586 637 3.5 5.0 1.5 * 8.3 5.6 -2.6 * 51.5 60.9 9.4
Payroll CardsReceives wages on payroll
card 290 547 5.0 8.5 3.6 * 1.5 2.9 1.5 * - 7.7 7.7 *Does not receive wages on
payroll card 8,162 8,734 91.5 87.0 -4.5 * 90.0 91.7 1.6 * 45.1 34.2 -10.9Unknown 602 595 3.5 4.5 0.9 8.5 5.4 -3.1 * 54.9 58.1 3.2
Notes:* Indicates differences that are statistically significant at the 10% level. - = For this table cell, there were so few sample respondents (in some cases zero) reporting that the estimated universe proportion round to 0.0 percent. It is estimated that the true value is only slightly greater than zero. Figures do not always reconcile to totals because of rounding.2009 data revised September 2012. Refer to 2009 and 2011 FDIC National Survey of Unbanked and Underbanked Households and Technical Notes for terms, definitions, and methodological discussion.

2011 FDIC NatIoNal Survey oF uNbaNkeD aND uNDerbaNkeD HouSeHolDS • September 2012 101
Table A-59 2011 Households’ Use of Prepaid and Payroll Cards by Bank Account Type
Prepaid and Payroll Card Use
All Households
Bank Account Type Memo Items
UnbankedChecking and
Savings AccountsSavings Account
OnlyChecking
Account Only
Banked, but Account Type
UnknownHas Checking
AccountHas Savings
Account
Number (1000s)
Pct of Col
Number (1000s)
Pct of Col
Number (1000s)
Pct of Col
Number (1000s)
Pct of Col
Number (1000s)
Pct of Col
Number (1000s)
Pct of Col
Number (1000s)
Pct of Col
Number (1000s)
Pct of Col
All Households 120,408 100.0 9,875 100.0 80,924 100.0 2,379 100.0 25,378 100.0 1,851 100.0 106,509 100.0 83,331 100.0Prepaid Cards
Has ever used 12,119 10.1 1,759 17.8 7,752 9.6 392 16.5 2,139 8.4 77 4.1 9,909 9.3 8,146 9.8Has never used 104,746 87.0 7,478 75.7 71,594 88.5 1,947 81.8 22,705 89.5 1,021 55.2 94,470 88.7 73,567 88.3Unknown 3,542 2.9 637 6.5 1,577 1.9 40 1.7 534 2.1 753 40.7 2,130 2.0 1,617 1.9
Payroll CardsReceives wages on
payroll card 3,891 3.2 547 5.5 2,295 2.8 121 5.1 895 3.5 34 1.8 3,192 3.0 2,416 2.9Does not receive
wages on payroll card 113,293 94.1 8,734 88.4 77,257 95.5 2,235 93.9 23,993 94.5 1,075 58.1 101,440 95.2 79,520 95.4
Unknown 3,223 2.7 595 6.0 1,371 1.7 24 1.0 491 1.9 742 40.1 1,876 1.8 1,395 1.7Notes:Figures do not always reconcile to totals because of the rounding.
Table A-60 2011 Households’ Use of Prepaid and Payroll Cards by AFS Use
Prepaid and Payroll Card Use
All Households
Timing of AFS Use Memo Items
In last 30 daysaIn last 2-12
monthsNot in the last
12 months Never used UnknownHas Ever Used
TransactionHas Ever Used
Credit
Number (1000s)
Pct of Row
Number (1000s)
Pct of Row
Number (1000s)
Pct of Row
Number (1000s)
Pct of Row
Number (1000s)
Pct of Row
Number (1000s)
Pct of Row
Number (1000s)
Pct of Row
Number (1000s)
Pct of Row
All Households 120,408 100.0 14,470 12.0 16,139 13.4 21,002 17.4 65,335 54.3 3,461 2.9 47,109 39.1 17,109 14.2Prepaid Cards
Has ever used 12,119 100.0 3,133 25.9 2,594 21.4 2,344 19.3 3,971 32.8 77 0.6 7,461 61.6 3,880 32.0Has never used 104,746 100.0 11,129 10.6 13,376 12.8 18,383 17.5 61,095 58.3 764 0.7 39,050 37.3 13,099 12.5Unknown 3,542 100.0 208 5.9 169 4.8 276 7.8 269 7.6 2,621 74.0 599 16.9 130 3.7
Payroll CardsReceives wages on
payroll card 3,891 100.0 921 23.7 795 20.4 534 13.7 1,618 41.6 23 0.6 2,029 52.2 1,164 29.9Does not receive
wages on payroll card 113,293 100.0 13,372 11.8 15,161 13.4 20,252 17.9 63,628 56.2 881 0.8 44,534 39.3 15,863 14.0
Unknown 3,223 100.0 178 5.5 183 5.7 215 6.7 89 2.8 2,558 79.4 546 17.0 83 2.6Notes:a The AFS included in this measure are non-bank money orders, non-bank check cashing, non-bank remittances, payday loans and pawn shop loans. Households were not asked whether they use rent-to-own agreements or refund anticipation loans in the last 30 days. AFS transaction products are non-bank check cashing, non-bank money orders and non-bank remittances. AFS credit products are payday loans, pawn shop loans, rent-to-own agreements and refund anticipation loans. Figures do not always reconcile to totals because of the rounding.
Table A-61 2011 Households That Used Multiple AFS in the Last Year by Prepaid and Payroll Card Use
Prepaid and Payroll Card Use
All Households
Number of Specific AFS Products Used in the Last Year
Used 0 AFS Used 1 AFSUsed 2 or More
AFS UnknownNumber (1000s)
Pct of Col
Number (1000s)
Pct of Col
Number (1000s)
Pct of Col
Number (1000s)
Pct of Col
Number (1000s)
Pct of Col
All Households 120,408 100.0 85,741 100.0 19,796 100.0 10,013 100.0 4,858 100.0Prepaid Cards
Has ever used 12,119 10.1 6,276 7.3 3,086 15.6 2,548 25.4 208 4.3Has never used 104,746 87.0 79,114 92.3 16,645 84.1 7,447 74.4 1,540 31.7Unknown 3,542 2.9 351 0.4 64 0.3 18 0.2 3,110 64.0
Payroll CardsReceives wages on payroll card 3,891 3.2 2,147 2.5 933 4.7 761 7.6 50 1.0Does not receive wages on payroll card 113,293 94.1 83,478 97.4 18,822 95.1 9,238 92.3 1,756 36.1Unknown 3,223 2.7 116 0.1 41 0.2 15 0.1 3,052 62.8
Notes:Figures do not always reconcile to totals because of the rounding.

2011 FDIC NatIoNal Survey oF uNbaNkeD aND uNDerbaNkeD HouSeHolDS • September 2012 102
Table A-62 2011 Likelihood of Unbanked Households Opening an Account
Likelihood of Opening Future Account
All Unbanked Households
Unbanked StatusPreviously Banked Never-Banked Unknown
Number (1000s) Pct of Col
Number (1000s) Pct of Col
Number (1000s) Pct of Col
Number (1000s) Pct of Col
All Unbanked Households 9,875 100.0 4,411 100.0 5,269 100.0 195 100.0Very likely 1,337 13.5 977 22.2 350 6.6 9 4.7Somewhat likely 2,014 20.4 1,147 26.0 846 16.1 20 10.4Not too likely 2,148 21.7 833 18.9 1,287 24.4 29 14.6Not likely at all 3,851 39.0 1,295 29.4 2,531 48.0 25 12.9Unknown 526 5.3 159 3.6 255 4.8 112 57.4
Notes:Figures do not always reconcile to totals because of the rounding.

2011 FDIC NatIoNal Survey oF uNbaNkeD aND uNDerbaNkeD HouSeHolDS • September 2012 103
Table A-63 2011 Likelihood of Unbanked Households Opening an Account
Household Characteristic
All Unbanked Households
Likelihood of Opening an Account
Very likely Somewhat likely Not too likely Not likely at all Unknown
Number (1000s)
Pct of Row
Number (1000s)
Pct of Row
Number (1000s)
Pct of Row
Number (1000s)
Pct of Row
Number (1000s)
Pct of Row
Number (1000s)
Pct of Row
All Unbanked Households 9,875 100.0 1,337 13.5 2,014 20.4 2,148 21.7 3,851 39.0 526 5.3Previous Banking Status
Previously banked 4,411 100.0 977 22.2 1,147 26.0 833 18.9 1,295 29.4 159 3.6Never-banked 5,269 100.0 350 6.6 846 16.1 1,287 24.4 2,531 48.0 255 4.8Unknown 196 100.0 9 4.7 20 10.4 29 14.6 25 12.9 112 57.4
Last Time Household Had a Bank AccountWithin the last year 896 100.0 370 41.3 226 25.2 136 15.2 124 13.8 41 4.5Over a year ago 3,439 100.0 599 17.4 918 26.7 693 20.2 1,163 33.8 66 1.9Unknown 5,541 100.0 368 6.6 870 15.7 1,319 23.8 2,564 46.3 419 7.6
Household TypeFamily household 5,905 100.0 891 15.1 1,311 22.2 1,436 24.3 1,999 33.8 268 4.5
Female householder, no husband present 2,971 100.0 495 16.7 718 24.2 691 23.3 935 31.5 132 4.4Male householder, no wife present 807 100.0 120 14.8 186 23.1 163 20.2 295 36.5 43 5.3Married couple 2,127 100.0 277 13.0 407 19.1 582 27.4 769 36.1 93 4.4
Nonfamily household 3,960 100.0 446 11.3 698 17.6 711 18.0 1,847 46.6 258 6.5Female householder 1,702 100.0 157 9.2 263 15.4 276 16.2 868 51.0 138 8.1Male householder 2,258 100.0 288 12.8 435 19.3 435 19.3 979 43.3 120 5.3
Other 11 100.0 NA NA NA NA NA NA NA NA NA NARace/Ethnicity
Black 3,430 100.0 514 15.0 731 21.3 750 21.9 1,208 35.2 227 6.6Hispanic non-Black 2,762 100.0 268 9.7 548 19.9 718 26.0 1,116 40.4 113 4.1White non-Black non-Hispanic 3,330 100.0 518 15.6 676 20.3 589 17.7 1,371 41.2 176 5.3Other non-Black non-Hispanic 353 100.0 36 10.3 59 16.6 91 25.8 156 44.3 11 3.0
Spanish is Only Language SpokenSpanish is not only language spoken 8,965 100.0 1,291 14.4 1,868 20.8 1,864 20.8 3,453 38.5 491 5.5Spanish is only language spoken 911 100.0 46 5.1 146 16.1 284 31.2 399 43.8 35 3.9
NativityU.S-born 7,673 100.0 1,147 15.0 1,605 20.9 1,566 20.4 2,954 38.5 401 5.2Foreign-born citizen 453 100.0 63 13.9 70 15.3 88 19.3 185 40.9 48 10.6Foreign-born non-citizen 1,750 100.0 127 7.2 339 19.4 495 28.3 712 40.7 77 4.4
Age Group15 to 24 years 1,094 100.0 254 23.2 306 28.0 229 20.9 251 22.9 55 5.025 to 34 years 2,587 100.0 431 16.7 635 24.6 575 22.2 844 32.6 102 3.935 to 44 years 1,994 100.0 308 15.5 495 24.8 448 22.5 645 32.4 98 4.945 to 54 years 2,002 100.0 244 12.2 337 16.8 499 24.9 808 40.4 114 5.755 to 64 years 1,202 100.0 77 6.4 154 12.8 220 18.3 647 53.8 103 8.665 years or more 997 100.0 22 2.2 87 8.7 178 17.8 655 65.7 54 5.5
EducationNo high school degree 3,696 100.0 384 10.4 652 17.7 856 23.2 1,629 44.1 174 4.7High school degree 3,764 100.0 542 14.4 800 21.3 799 21.2 1,397 37.1 227 6.0Some college 2,002 100.0 363 18.1 485 24.2 395 19.7 665 33.2 94 4.7College degree 413 100.0 47 11.4 77 18.5 98 23.6 160 38.8 32 7.6
Employment StatusEmployed 3,818 100.0 532 13.9 862 22.6 947 24.8 1,267 33.2 210 5.5Unemployed 1,525 100.0 351 23.0 421 27.6 324 21.2 340 22.3 89 5.8Not in labor force 4,532 100.0 454 10.0 730 16.1 878 19.4 2,244 49.5 227 5.0
Household IncomeLess than $15,000 5,510 100.0 774 14.1 1,160 21.1 1,120 20.3 2,235 40.6 221 4.0Between $15,000 and $30,000 2,581 100.0 330 12.8 540 20.9 595 23.0 938 36.3 178 6.9Between $30,000 and $50,000 1,221 100.0 143 11.7 220 18.0 326 26.7 459 37.6 74 6.0Between $50,000 and $75,000 431 100.0 65 15.2 66 15.2 84 19.5 170 39.5 45 10.5At Least $75,000 132 100.0 24 18.1 29 21.6 23 17.3 49 36.8 8 6.2
HomeownershipHomeowner 2,238 100.0 260 11.6 346 15.5 463 20.7 1,001 44.7 168 7.5Non-homeowner 7,637 100.0 1,076 14.1 1,668 21.8 1,685 22.1 2,850 37.3 358 4.7
Notes:NA = Not available because the sample size was too small to make an accurate estimate.Figures do not always reconcile to totals because of the rounding.

2011 FDIC NatIoNal Survey oF uNbaNkeD aND uNDerbaNkeD HouSeHolDS • September 2012 104
Table A-65 2011 Likelihood of Unbanked Households Opening an Account by AFS Use
Table A-64 Likelihood of Unbanked Households Opening an Account by Year
Likelihood of Opening an Account
2009 2011Estimated Difference
Number (1000s) Pct of Col
Number (1000s) Pct of Col
All UnbankedVery Likely 1,388 15.3 1,337 13.5 -1.8 *Somewhat Likely 1,745 19.3 2,014 20.4 1.1Not too Likely 1,785 19.7 2,148 21.7 2.0Not Likely At All 3,608 39.9 3,851 39.0 -0.9Unknown 528 5.8 526 5.3 -0.5Total 9,054 100.0 9,875 100.0
Previously BankedVery Likely 1,167 25.7 977 22.2 -3.5 *Somewhat Likely 1,045 23.0 1,147 26.0 3.0 *Not too Likely 836 18.4 833 18.9 0.5Not Likely At All 1,339 29.5 1,295 29.4 -0.1Unknown 157 3.5 159 3.6 0.1Total 4,543 100.0 4,411 100.0
Never-BankedVery Likely 209 4.8 350 6.6 1.9 *Somewhat Likely 678 15.5 846 16.1 0.6Not too Likely 941 21.5 1,287 24.4 3.0 *Not Likely At All 2,263 51.6 2,531 48.0 -3.6 *Unknown 294 6.7 255 4.8 -1.9 *Total 4,385 100.0 5,269 100.0
Notes:* Indicates differences that are statistically significant at the 10% level.The 2009 estimates include 519 previously banked households that were in the process of opening a bank account and were not asked the question about likelihood of opening an account. These households were included in the 2009 estimates in the ‘very likely’ category to allow for a more accurate comparison with 2011 estimates. Figures do not always reconcile to totals because of rounding.2009 data revised September 2012. Refer to 2009 and 2011 FDIC National Survey of Unbanked and Underbanked Households and Technical Notes for terms, definitions, and methodological discussion.
AFS Use
All Unbanked Households
Likelihood of Opening an Account
Very or Somewhat likelyNot Too Likely or Not
Likely At All UnknownNumber (1000s) Pct of Row
Number (1000s) Pct of Row
Number (1000s) Pct of Row
Number (1000s) Pct of Row
All Unbanked Households 9,875 100.0 3,350 33.9 5,999 60.7 526 5.3Ever Used AFS
Has ever used 7,338 100.0 2,856 38.9 4,318 58.8 165 2.2Has never used 2,036 100.0 436 21.4 1,530 75.1 70 3.4Unknown 501 100.0 59 11.7 151 30.2 291 58.1
Used at Least 1 AFS in the Last Year Used AFS in the last year 6,410 100.0 2,524 39.4 3,749 58.5 137 2.1Did not use AFS last year 2,911 100.0 759 26.1 2,062 70.8 90 3.1Unknown 554 100.0 67 12.1 188 33.9 299 54.0
Used Transaction AFS in the Last yeara
Used AFS in the last year 6,137 100.0 2,413 39.3 3,589 58.5 134 2.2Did not use AFS last year 3,220 100.0 875 27.2 2,247 69.8 98 3.0Unknown 518 100.0 62 12.0 162 31.3 294 56.7
Used Credit AFS in the Last yearb
Used AFS in the last year 1,660 100.0 844 50.9 797 48.0 19 1.2Did not use AFS last year 7,473 100.0 2,407 32.2 4,877 65.3 189 2.5Unknown 743 100.0 100 13.4 326 43.8 318 42.7
Notes:a AFS transaction products are non-bank check cashing, non-bank money orders and non-bank remittances. b AFS credit products are payday loans, pawn shop loans, rent-to-own agreements and refund anticipation loans. Figures do not always reconcile to totals because of the rounding.
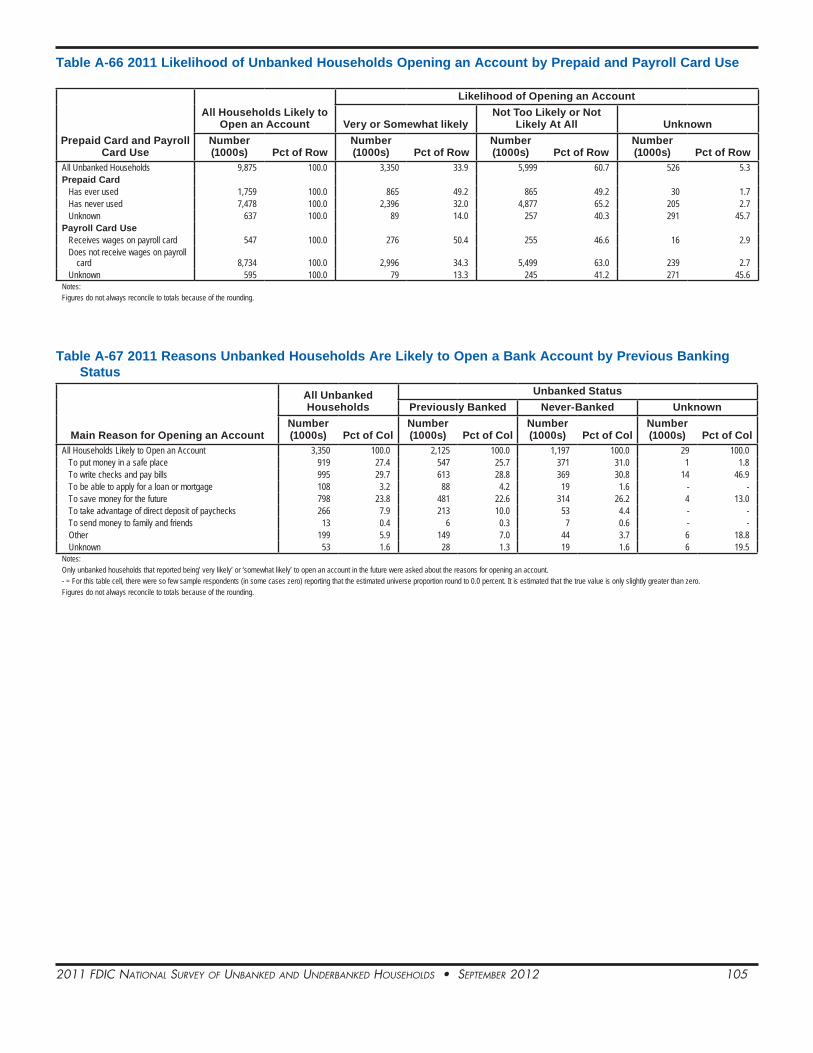
2011 FDIC NatIoNal Survey oF uNbaNkeD aND uNDerbaNkeD HouSeHolDS • September 2012 105
Table A-66 2011 Likelihood of Unbanked Households Opening an Account by Prepaid and Payroll Card Use
Table A-67 2011 Reasons Unbanked Households Are Likely to Open a Bank Account by Previous Banking Status
Prepaid Card and Payroll Card Use
All Households Likely to Open an Account
Likelihood of Opening an Account
Very or Somewhat likelyNot Too Likely or Not
Likely At All UnknownNumber (1000s) Pct of Row
Number (1000s) Pct of Row
Number (1000s) Pct of Row
Number (1000s) Pct of Row
All Unbanked Households 9,875 100.0 3,350 33.9 5,999 60.7 526 5.3Prepaid Card
Has ever used 1,759 100.0 865 49.2 865 49.2 30 1.7Has never used 7,478 100.0 2,396 32.0 4,877 65.2 205 2.7Unknown 637 100.0 89 14.0 257 40.3 291 45.7
Payroll Card UseReceives wages on payroll card 547 100.0 276 50.4 255 46.6 16 2.9Does not receive wages on payroll
card 8,734 100.0 2,996 34.3 5,499 63.0 239 2.7Unknown 595 100.0 79 13.3 245 41.2 271 45.6
Notes:Figures do not always reconcile to totals because of the rounding.
Main Reason for Opening an Account
All Unbanked Households
Unbanked StatusPreviously Banked Never-Banked Unknown
Number (1000s) Pct of Col
Number (1000s) Pct of Col
Number (1000s) Pct of Col
Number (1000s) Pct of Col
All Households Likely to Open an Account 3,350 100.0 2,125 100.0 1,197 100.0 29 100.0To put money in a safe place 919 27.4 547 25.7 371 31.0 1 1.8To write checks and pay bills 995 29.7 613 28.8 369 30.8 14 46.9To be able to apply for a loan or mortgage 108 3.2 88 4.2 19 1.6 - -To save money for the future 798 23.8 481 22.6 314 26.2 4 13.0To take advantage of direct deposit of paychecks 266 7.9 213 10.0 53 4.4 - -To send money to family and friends 13 0.4 6 0.3 7 0.6 - -Other 199 5.9 149 7.0 44 3.7 6 18.8Unknown 53 1.6 28 1.3 19 1.6 6 19.5
Notes:Only unbanked households that reported being’ very likely’ or ‘somewhat likely’ to open an account in the future were asked about the reasons for opening an account.- = For this table cell, there were so few sample respondents (in some cases zero) reporting that the estimated universe proportion round to 0.0 percent. It is estimated that the true value is only slightly greater than zero.Figures do not always reconcile to totals because of the rounding.

2011 FDIC NatIoNal Survey oF uNbaNkeD aND uNDerbaNkeD HouSeHolDS • September 2012 106
Table A-68 2011 Reasons Unbanked Households Are Likely to Open a Bank Account by Demographic Characteristics
Household Characteristic
All Households Likely to Open an Account
Main Reason for Opening an Account
To Put Money In a Safe Place
To Write Checks and Pay Bills
To Be Able to Apply For a Loan or Mortgage
To Save Money For the Future
To Take Advantage of Direct Deposit of
PaychecksTo Send Money to Family and Friends Other/Unknown
Number (1000s)
Pct of Row
Number (1000s)
Pct of Row
Number (1000s)
Pct of Row
Number (1000s)
Pct of Row
Number (1000s)
Pct of Row
Number (1000s)
Pct of Row
Number (1000s)
Pct of Row
Number (1000s)
Pct of Row
All Households Likely to Open an Account 3,350 100.0 919 27.4 995 29.7 108 3.2 798 23.8 266 7.9 13 0.4 252 7.5
Household TypeFamily household 2,202 100.0 607 27.6 653 29.7 63 2.8 568 25.8 150 6.8 6 0.3 155 7.1
Female householder, no husband present 1,213 100.0 331 27.3 370 30.5 18 1.5 311 25.6 88 7.2 4 0.3 91 7.5
Male householder, no wife present 306 100.0 68 22.3 87 28.4 19 6.2 89 29.2 12 3.8 2 0.7 29 9.5
Married couple 683 100.0 207 30.4 196 28.7 26 3.7 168 24.5 51 7.5 - - 35 5.1Nonfamily household 1,143 100.0 312 27.3 342 29.9 45 4.0 226 19.7 115 10.1 7 0.6 96 8.4Other 5 100.0 NA NA NA NA NA NA NA NA NA NA NA NA NA NA
Race/EthnicityBlack 1,245 100.0 349 28.0 348 27.9 41 3.3 354 28.4 65 5.2 4 0.3 85 6.8Hispanic non-Black 816 100.0 259 31.7 201 24.7 28 3.4 239 29.3 31 3.8 4 0.5 54 6.6White non-Black
non-Hispanic 1,194 100.0 285 23.9 417 35.0 35 2.9 194 16.3 161 13.5 2 0.2 100 8.4Other non-Black
non-Hispanic 95 100.0 26 27.5 29 30.3 4 4.1 11 11.6 8 8.8 4 3.9 13 13.8Spanish is Only Language SpokenSpanish is not only
language spoken 3,158 100.0 852 27.0 957 30.3 95 3.0 730 23.1 264 8.4 13 0.4 248 7.8Spanish is only language
spoken 192 100.0 67 35.0 39 20.1 13 6.8 68 35.4 1 0.6 - - 4 2.1Nativity
U.S-born 2,753 100.0 703 25.5 856 31.1 92 3.4 619 22.5 250 9.1 6 0.2 227 8.3Foreign-born citizen 132 100.0 60 45.4 33 25.3 - - 29 22.2 7 5.3 - - 3 1.9Foreign-born non-citizen 466 100.0 156 33.5 106 22.8 15 3.3 150 32.2 9 1.9 7 1.6 22 4.7
Age Group15 to 24 years 560 100.0 174 31.1 142 25.4 18 3.2 125 22.4 64 11.5 4 0.7 32 5.825 to 34 years 1,066 100.0 289 27.1 330 31.0 38 3.6 265 24.9 61 5.7 4 0.3 79 7.435 to 44 years 803 100.0 190 23.6 240 29.9 35 4.4 231 28.7 48 5.9 2 0.3 58 7.245 to 54 years 581 100.0 175 30.2 171 29.4 12 2.1 123 21.2 51 8.8 4 0.6 45 7.755 to 64 years 231 100.0 67 29.0 77 33.5 4 1.6 36 15.4 29 12.3 - - 19 8.265 years or more 110 100.0 24 21.6 35 32.0 - - 19 16.9 14 12.4 - - 19 17.1
EducationNo high school degree 1,036 100.0 340 32.8 267 25.8 25 2.4 257 24.8 71 6.8 6 0.6 71 6.9High school degree 1,342 100.0 309 23.0 417 31.1 40 3.0 346 25.8 113 8.4 4 0.3 112 8.5Some college 848 100.0 246 29.0 261 30.8 38 4.5 166 19.5 76 9.0 - - 61 7.1College degree 124 100.0 24 19.6 50 40.1 4 3.6 30 24.2 6 4.5 4 3 6 5.1
Household IncomeLess than $15,000 1,934 100.0 562 29.1 533 27.6 46 2.4 481 24.8 173 8.9 7 0.4 133 6.9Between $15,000 and
$30,000 870 100.0 222 25.5 263 30.2 45 5.2 193 22.2 55 6.3 6 0.7 86 9.9Between $30,000 and
$50,000 363 100.0 83 23.0 135 37.3 12 3.4 78 21.6 32 8.9 - - 22 5.9Between $50,000 and
$75,000 131 100.0 32 24.4 45 34.4 - - 37 28.5 6 4.3 - - 11 8.4At Least $75,000 53 100.0 NA NA NA NA NA NA NA NA NA NA NA NA NA NA
Notes:Only unbanked households that reported being’ very likely’ or ‘somewhat likely’ to open an account in the future were asked about the reasons for opening an account.NA = Not available because the sample size was too small to make an accurate estimate.- = For this table cell, there were so few sample respondents (in some cases zero) reporting that the estimated universe proportion round to 0.0 percent. It is estimated that the true value is only slightly greater than zero.Figures do not always reconcile to totals because of the rounding.

2011 FDIC NatIoNal Survey oF uNbaNkeD aND uNDerbaNkeD HouSeHolDS • September 2012 107
Appendix B — Focus on Select Demographic Groups
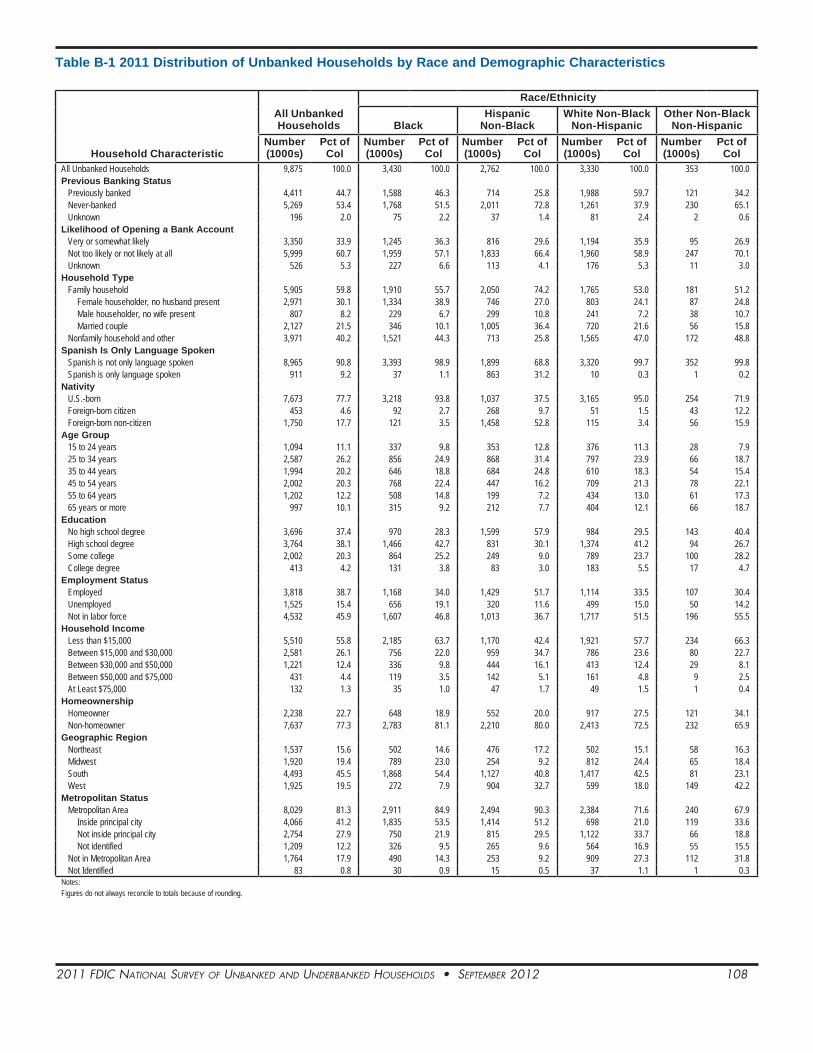
2011 FDIC NatIoNal Survey oF uNbaNkeD aND uNDerbaNkeD HouSeHolDS • September 2012 108
Table B-1 2011 Distribution of Unbanked Households by Race and Demographic Characteristics
Household Characteristic
All Unbanked Households
Race/Ethnicity
BlackHispanic
Non-BlackWhite Non-Black
Non-HispanicOther Non-Black
Non-HispanicNumber (1000s)
Pct of Col
Number (1000s)
Pct of Col
Number (1000s)
Pct of Col
Number (1000s)
Pct of Col
Number (1000s)
Pct of Col
All Unbanked Households 9,875 100.0 3,430 100.0 2,762 100.0 3,330 100.0 353 100.0Previous Banking Status
Previously banked 4,411 44.7 1,588 46.3 714 25.8 1,988 59.7 121 34.2Never-banked 5,269 53.4 1,768 51.5 2,011 72.8 1,261 37.9 230 65.1Unknown 196 2.0 75 2.2 37 1.4 81 2.4 2 0.6
Likelihood of Opening a Bank AccountVery or somewhat likely 3,350 33.9 1,245 36.3 816 29.6 1,194 35.9 95 26.9Not too likely or not likely at all 5,999 60.7 1,959 57.1 1,833 66.4 1,960 58.9 247 70.1Unknown 526 5.3 227 6.6 113 4.1 176 5.3 11 3.0
Household TypeFamily household 5,905 59.8 1,910 55.7 2,050 74.2 1,765 53.0 181 51.2
Female householder, no husband present 2,971 30.1 1,334 38.9 746 27.0 803 24.1 87 24.8Male householder, no wife present 807 8.2 229 6.7 299 10.8 241 7.2 38 10.7Married couple 2,127 21.5 346 10.1 1,005 36.4 720 21.6 56 15.8
Nonfamily household and other 3,971 40.2 1,521 44.3 713 25.8 1,565 47.0 172 48.8Spanish Is Only Language Spoken
Spanish is not only language spoken 8,965 90.8 3,393 98.9 1,899 68.8 3,320 99.7 352 99.8Spanish is only language spoken 911 9.2 37 1.1 863 31.2 10 0.3 1 0.2
NativityU.S.-born 7,673 77.7 3,218 93.8 1,037 37.5 3,165 95.0 254 71.9Foreign-born citizen 453 4.6 92 2.7 268 9.7 51 1.5 43 12.2Foreign-born non-citizen 1,750 17.7 121 3.5 1,458 52.8 115 3.4 56 15.9
Age Group15 to 24 years 1,094 11.1 337 9.8 353 12.8 376 11.3 28 7.925 to 34 years 2,587 26.2 856 24.9 868 31.4 797 23.9 66 18.735 to 44 years 1,994 20.2 646 18.8 684 24.8 610 18.3 54 15.445 to 54 years 2,002 20.3 768 22.4 447 16.2 709 21.3 78 22.155 to 64 years 1,202 12.2 508 14.8 199 7.2 434 13.0 61 17.365 years or more 997 10.1 315 9.2 212 7.7 404 12.1 66 18.7
EducationNo high school degree 3,696 37.4 970 28.3 1,599 57.9 984 29.5 143 40.4High school degree 3,764 38.1 1,466 42.7 831 30.1 1,374 41.2 94 26.7Some college 2,002 20.3 864 25.2 249 9.0 789 23.7 100 28.2College degree 413 4.2 131 3.8 83 3.0 183 5.5 17 4.7
Employment StatusEmployed 3,818 38.7 1,168 34.0 1,429 51.7 1,114 33.5 107 30.4Unemployed 1,525 15.4 656 19.1 320 11.6 499 15.0 50 14.2Not in labor force 4,532 45.9 1,607 46.8 1,013 36.7 1,717 51.5 196 55.5
Household IncomeLess than $15,000 5,510 55.8 2,185 63.7 1,170 42.4 1,921 57.7 234 66.3Between $15,000 and $30,000 2,581 26.1 756 22.0 959 34.7 786 23.6 80 22.7Between $30,000 and $50,000 1,221 12.4 336 9.8 444 16.1 413 12.4 29 8.1Between $50,000 and $75,000 431 4.4 119 3.5 142 5.1 161 4.8 9 2.5At Least $75,000 132 1.3 35 1.0 47 1.7 49 1.5 1 0.4
HomeownershipHomeowner 2,238 22.7 648 18.9 552 20.0 917 27.5 121 34.1Non-homeowner 7,637 77.3 2,783 81.1 2,210 80.0 2,413 72.5 232 65.9
Geographic RegionNortheast 1,537 15.6 502 14.6 476 17.2 502 15.1 58 16.3Midwest 1,920 19.4 789 23.0 254 9.2 812 24.4 65 18.4South 4,493 45.5 1,868 54.4 1,127 40.8 1,417 42.5 81 23.1West 1,925 19.5 272 7.9 904 32.7 599 18.0 149 42.2
Metropolitan StatusMetropolitan Area 8,029 81.3 2,911 84.9 2,494 90.3 2,384 71.6 240 67.9
Inside principal city 4,066 41.2 1,835 53.5 1,414 51.2 698 21.0 119 33.6Not inside principal city 2,754 27.9 750 21.9 815 29.5 1,122 33.7 66 18.8Not identified 1,209 12.2 326 9.5 265 9.6 564 16.9 55 15.5
Not in Metropolitan Area 1,764 17.9 490 14.3 253 9.2 909 27.3 112 31.8Not Identified 83 0.8 30 0.9 15 0.5 37 1.1 1 0.3
Notes:Figures do not always reconcile to totals because of rounding.

2011 FDIC NatIoNal Survey oF uNbaNkeD aND uNDerbaNkeD HouSeHolDS • September 2012 109
Table B-2 2011 Unbanked Households’ Use of AFS by Race
AFS Use
All Unbanked Households
Race/Ethnicity
BlackHispanic
Non-BlackWhite Non-Black
Non-HispanicOther Non-Black
Non-HispanicNumber (1000s)
Pct of Col
Number (1000s)
Pct of Col
Number (1000s)
Pct of Col
Number (1000s)
Pct of Col
Number (1000s)
Pct of Col
Used Any AFSIn last 30 daysa 4,490 45.5 1,472 42.9 1,432 51.8 1,462 43.9 125 35.4In last 2-12 months 1,920 19.4 730 21.3 415 15.0 703 21.1 73 20.5Not in the last 12 months 929 9.4 357 10.4 184 6.7 361 10.8 26 7.5Never used 2,036 20.6 639 18.6 636 23.0 646 19.4 115 32.5Unknown 501 5.1 233 6.8 95 3.5 158 4.7 15 4.1Total 9,875 100.0 3,430 100.0 2,762 100.0 3,330 100.0 353 100.0
Used Transaction AFS in the Last yearb
Used AFS in the last year 6,137 62.1 2,100 61.2 1,792 64.9 2,053 61.6 192 54.3Did not use AFS last year 3,220 32.6 1,087 31.7 872 31.6 1,115 33.5 147 41.5Unknown 518 5.2 244 7.1 98 3.5 162 4.9 15 4.1Total 9,875 100.0 3,430 100.0 2,762 100.0 3,330 100.0 353 100.0
Used Credit AFS in the Last yearc
Used AFS in the last year 1,660 16.8 542 15.8 309 11.2 757 22.7 52 14.7Did not use AFS last year 7,473 75.7 2,579 75.2 2,277 82.5 2,339 70.2 278 78.7Unknown 743 7.5 310 9.0 176 6.4 234 7.0 24 6.7Total 9,875 100.0 3,430 100.0 2,762 100.0 3,330 100.0 353 100.0
Number of Specific AFS Products Used in the Last YearUsed 0 AFS 2,911 29.5 971 28.3 818 29.6 981 29.5 141 39.9Used 1 AFS 2,610 26.4 981 28.6 654 23.7 892 26.8 83 23.5Used 2 or more AFS 3,505 35.5 1,117 32.6 1,091 39.5 1,191 35.8 106 29.9Unknown 849 8.6 362 10.5 198 7.2 266 8.0 24 6.7Total 9,875 100.0 3,430 100.0 2,762 100.0 3,330 100.0 353 100.0
Number of Specific AFS Products Used in the Last 30 Daysa
Used 1 AFS 2,708 60.3 910 61.9 735 51.4 981 67.1 81 65.0Used 2 or more AFS 1,600 35.6 508 34.5 621 43.4 434 29.7 37 29.9Unknown 181 4.0 53 3.6 75 5.3 47 3.2 6 5.1Total Households That Used AFS In the Last 30 Days 4,490 100.0 1,472 100.0 1,432 100.0 1,462 100.0 125 100.0
Number of Times Transaction AFS Used in the Last 30 Daysb
Used 1 time 1,327 30.2 458 31.9 389 27.6 446 31.1 35 29.7Used 2 times 1,032 23.5 353 24.6 319 22.7 335 23.4 25 21.0Used 3 or more times 1,817 41.4 556 38.8 612 43.4 597 41.7 52 44.3Unknown 216 4.9 67 4.7 89 6.3 55 3.8 6 4.9Total Households That Used Transaction AFS In the
Last 30 Days4,392 100.0 1,433 100.0 1,409 100.0 1,433 100.0 117 100.0
Notes:a The AFS included in this measure are non-bank money orders, non-bank check cashing, non-bank remittances, payday loans and pawn shop loans. Households were not asked whether they use rent-to-own agreements or refund anticipation loans in the last 30 days.b AFS transaction products are non-bank check cashing, non-bank money orders and non-bank remittances.c AFS credit products are payday loans, pawn shop loans, rent-to-own agreements and refund anticipation loans.Figures do not always reconcile to totals because of rounding.

2011 FDIC NatIoNal Survey oF uNbaNkeD aND uNDerbaNkeD HouSeHolDS • September 2012 110
Table B-3 2011 Distribution of Underbanked Households by Race and Demographic Characteristics
Household Characteristic
All Underbanked Households
Race/Ethnicity
BlackHispanic
Non-BlackWhite Non-Black
Non-HispanicOther Non-Black
Non-HispanicNumber (1000s)
Pct of Col
Number (1000s)
Pct of Col
Number (1000s)
Pct of Col
Number (1000s)
Pct of Col
Number (1000s)
Pct of Col
All Underbanked Households 24,199 100.0 5,441 100.0 3,927 100.0 13,551 100.0 1,281 100.0Bank Account Type
Checking and savings accounts 15,113 62.5 3,199 58.8 2,174 55.4 8,820 65.1 921 71.9Savings account only 1,298 5.4 410 7.5 220 5.6 607 4.5 60 4.7Checking account only 7,548 31.2 1,756 32.3 1,502 38.2 3,995 29.5 295 23.0Banked, but account type unknown 240 1.0 76 1.4 31 0.8 128 0.9 5 0.4
Household TypeFamily household 16,931 70.0 3,691 67.8 3,183 81.1 9,109 67.2 948 74.0
Female householder, no husband present 4,598 19.0 1,628 29.9 797 20.3 2,021 14.9 151 11.8Male householder, no wife present 1,662 6.9 379 7.0 368 9.4 810 6.0 105 8.2Married couple 10,671 44.1 1,684 30.9 2,018 51.4 6,278 46.3 692 54.0
Nonfamily household and other 7,268 30.0 1,750 32.2 744 18.9 4,442 32.8 333 26.0Spanish Is Only Language Spoken
Spanish is not only language spoken 23,496 97.1 5,409 99.4 3,280 83.5 13,531 99.9 1,276 99.6Spanish is only language spoken 704 2.9 32 0.6 647 16.5 20 0.1 5 0.4
NativityU.S.-born 20,038 82.8 4,644 85.4 1,839 46.8 12,965 95.7 589 46.0Foreign-born citizen 1,880 7.8 478 8.8 728 18.5 326 2.4 348 27.2Foreign-born non-citizen 2,282 9.4 318 5.9 1,360 34.6 260 1.9 344 26.8
Age Group15 to 24 years 1,955 8.1 447 8.2 342 8.7 1,055 7.8 111 8.725 to 34 years 4,993 20.6 1,110 20.4 958 24.4 2,611 19.3 314 24.535 to 44 years 4,918 20.3 1,225 22.5 1,029 26.2 2,371 17.5 293 22.845 to 54 years 5,336 22.1 1,143 21.0 803 20.5 3,133 23.1 257 20.055 to 64 years 4,064 16.8 854 15.7 549 14.0 2,474 18.3 188 14.765 years or more 2,933 12.1 662 12.2 246 6.3 1,906 14.1 119 9.3
EducationNo high school degree 3,505 14.5 675 12.4 1,338 34.1 1,364 10.1 128 10.0High school degree 7,638 31.6 1,692 31.1 1,125 28.6 4,531 33.4 290 22.7Some college 7,676 31.7 1,882 34.6 925 23.6 4,528 33.4 342 26.7College degree 5,380 22.2 1,192 21.9 539 13.7 3,128 23.1 521 40.7
Employment StatusEmployed 15,515 64.1 3,433 63.1 2,655 67.6 8,526 62.9 901 70.3Unemployed 1,899 7.8 547 10.1 324 8.2 931 6.9 97 7.6Not in labor force 6,786 28.0 1,461 26.8 948 24.1 4,094 30.2 283 22.1
Household IncomeLess than $15,000 4,225 17.5 1,246 22.9 581 14.8 2,218 16.4 180 14.0Between $15,000 and $30,000 5,628 23.3 1,404 25.8 1,023 26.1 2,995 22.1 206 16.1Between $30,000 and $50,000 5,787 23.9 1,259 23.1 1,181 30.1 3,014 22.2 333 26.0Between $50,000 and $75,000 4,143 17.1 746 13.7 692 17.6 2,511 18.5 193 15.1At Least $75,000 4,418 18.3 785 14.4 450 11.5 2,813 20.8 369 28.8
HomeownershipHomeowner 12,590 52.0 2,311 42.5 1,831 46.6 7,866 58.0 582 45.4Non-homeowner 11,610 48.0 3,129 57.5 2,096 53.4 5,685 42.0 699 54.6
Geographic RegionNortheast 3,908 16.1 948 17.4 494 12.6 2,242 16.5 223 17.4Midwest 4,772 19.7 853 15.7 311 7.9 3,439 25.4 169 13.2South 10,429 43.1 3,105 57.1 1,703 43.4 5,284 39.0 338 26.4West 5,090 21.0 535 9.8 1,419 36.1 2,585 19.1 551 43.1
Metropolitan StatusMetropolitan Area 20,066 82.9 4,890 89.9 3,626 92.3 10,457 77.2 1,093 85.3
Inside principal city 7,485 30.9 2,490 45.8 1,820 46.3 2,705 20.0 470 36.7Not inside principal city 9,214 38.1 1,835 33.7 1,453 37.0 5,438 40.1 489 38.2Not identified 3,367 13.9 565 10.4 354 9.0 2,314 17.1 135 10.5
Not in Metropolitan Area 3,857 15.9 502 9.2 285 7.2 2,890 21.3 181 14.1Not Identified 276 1.1 50 0.9 16 0.4 203 1.5 7 0.5
Notes:Figures do not always reconcile to totals because of rounding.
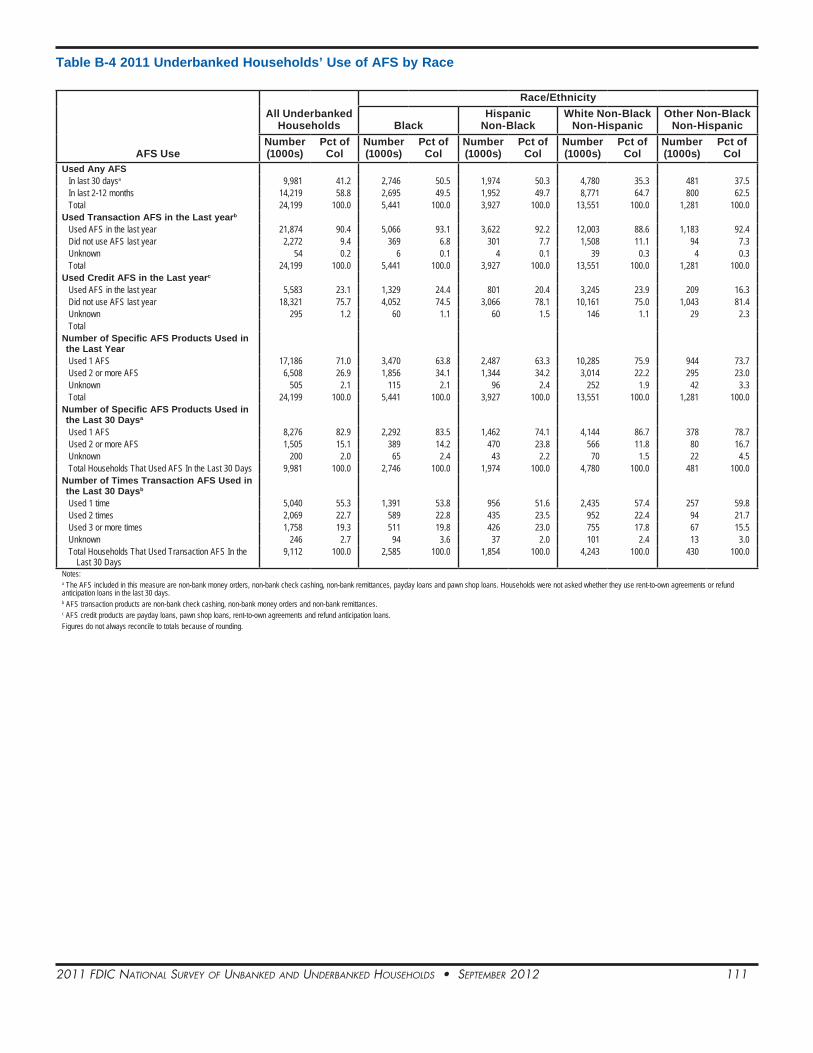
2011 FDIC NatIoNal Survey oF uNbaNkeD aND uNDerbaNkeD HouSeHolDS • September 2012 111
Table B-4 2011 Underbanked Households’ Use of AFS by Race
AFS Use
All Underbanked Households
Race/Ethnicity
BlackHispanic
Non-BlackWhite Non-Black
Non-HispanicOther Non-Black
Non-HispanicNumber (1000s)
Pct of Col
Number (1000s)
Pct of Col
Number (1000s)
Pct of Col
Number (1000s)
Pct of Col
Number (1000s)
Pct of Col
Used Any AFSIn last 30 daysa 9,981 41.2 2,746 50.5 1,974 50.3 4,780 35.3 481 37.5In last 2-12 months 14,219 58.8 2,695 49.5 1,952 49.7 8,771 64.7 800 62.5Total 24,199 100.0 5,441 100.0 3,927 100.0 13,551 100.0 1,281 100.0
Used Transaction AFS in the Last yearb
Used AFS in the last year 21,874 90.4 5,066 93.1 3,622 92.2 12,003 88.6 1,183 92.4Did not use AFS last year 2,272 9.4 369 6.8 301 7.7 1,508 11.1 94 7.3Unknown 54 0.2 6 0.1 4 0.1 39 0.3 4 0.3Total 24,199 100.0 5,441 100.0 3,927 100.0 13,551 100.0 1,281 100.0
Used Credit AFS in the Last yearc
Used AFS in the last year 5,583 23.1 1,329 24.4 801 20.4 3,245 23.9 209 16.3Did not use AFS last year 18,321 75.7 4,052 74.5 3,066 78.1 10,161 75.0 1,043 81.4Unknown 295 1.2 60 1.1 60 1.5 146 1.1 29 2.3Total
Number of Specific AFS Products Used in the Last YearUsed 1 AFS 17,186 71.0 3,470 63.8 2,487 63.3 10,285 75.9 944 73.7Used 2 or more AFS 6,508 26.9 1,856 34.1 1,344 34.2 3,014 22.2 295 23.0Unknown 505 2.1 115 2.1 96 2.4 252 1.9 42 3.3Total 24,199 100.0 5,441 100.0 3,927 100.0 13,551 100.0 1,281 100.0
Number of Specific AFS Products Used in the Last 30 Daysa
Used 1 AFS 8,276 82.9 2,292 83.5 1,462 74.1 4,144 86.7 378 78.7Used 2 or more AFS 1,505 15.1 389 14.2 470 23.8 566 11.8 80 16.7Unknown 200 2.0 65 2.4 43 2.2 70 1.5 22 4.5Total Households That Used AFS In the Last 30 Days 9,981 100.0 2,746 100.0 1,974 100.0 4,780 100.0 481 100.0
Number of Times Transaction AFS Used in the Last 30 Daysb
Used 1 time 5,040 55.3 1,391 53.8 956 51.6 2,435 57.4 257 59.8Used 2 times 2,069 22.7 589 22.8 435 23.5 952 22.4 94 21.7Used 3 or more times 1,758 19.3 511 19.8 426 23.0 755 17.8 67 15.5Unknown 246 2.7 94 3.6 37 2.0 101 2.4 13 3.0Total Households That Used Transaction AFS In the
Last 30 Days9,112 100.0 2,585 100.0 1,854 100.0 4,243 100.0 430 100.0
Notes:a The AFS included in this measure are non-bank money orders, non-bank check cashing, non-bank remittances, payday loans and pawn shop loans. Households were not asked whether they use rent-to-own agreements or refund anticipation loans in the last 30 days. b AFS transaction products are non-bank check cashing, non-bank money orders and non-bank remittances. c AFS credit products are payday loans, pawn shop loans, rent-to-own agreements and refund anticipation loans. Figures do not always reconcile to totals because of rounding.

2011 FDIC NatIoNal Survey oF uNbaNkeD aND uNDerbaNkeD HouSeHolDS • September 2012 112
Table B-5 2011 Distribution of Unbanked Households by Income and Demographic Characteristics
Household Characteristic
All Unbanked Households
Household Income
Less than $15,000Between $15,000
and $30,000Between $30,000
and $50,000Between $50,000
and $75,000 At Least $75,000
Number (1000s)
Pct of Col
Number (1000s)
Pct of Col
Number (1000s)
Pct of Col
Number (1000s)
Pct of Col
Number (1000s)
Pct of Col
Number (1000s)
Pct of Col
All Unbanked Households 9,875 100.0 5,510 100.0 2,581 100.0 1,221 100.0 431 100.0 132 100.0Previous Banking Status
Previously banked 4,411 44.7 2,504 45.4 1,161 45.0 481 39.4 202 46.8 62 47.1Never-banked 5,269 53.4 2,926 53.1 1,334 51.7 717 58.7 222 51.5 70 52.9Unknown 196 2.0 80 1.5 85 3.3 23 1.9 8 1.8 - -
Likelihood of Opening a Bank AccountVery or somewhat likely 3,350 33.9 1,934 35.1 870 33.7 363 29.7 131 30.4 53 39.7Not too likely or not likely at all 5,999 60.7 3,355 60.9 1,533 59.4 785 64.3 255 59.1 72 54.1Unknown 526 5.3 221 4.0 178 6.9 74 6.0 45 10.5 8 6.2
Household TypeFamily household 5,905 59.8 3,057 55.5 1,626 63.0 828 67.8 305 70.7 89 66.9
Female householder, no husband present 2,971 30.1 1,899 34.5 695 26.9 239 19.6 116 26.9 22 16.5Male householder, no wife present 807 8.2 380 6.9 234 9.1 134 11.0 51 11.9 7 5.4Married couple 2,127 21.5 778 14.1 698 27.0 455 37.2 137 31.8 60 45.0
Nonfamily household and other 3,971 40.2 2,453 44.5 955 37.0 393 32.2 126 29.3 44 33.1Race/Ethnicity
Black 3,430 34.7 2,185 39.7 756 29.3 336 27.5 119 27.6 35 26.5Hispanic non-Black 2,762 28.0 1,170 21.2 959 37.2 444 36.3 142 33.0 47 35.7White non-Black non-Hispanic 3,330 33.7 1,921 34.9 786 30.4 413 33.8 161 37.4 49 36.8Other non-Black non-Hispanic 353 3.6 234 4.2 80 3.1 29 2.3 9 2.0 1 1.0
Spanish Is Only Language SpokenSpanish is not only language spoken 8,965 90.8 5,142 93.3 2,264 87.7 1,058 86.6 386 89.6 114 86.4Spanish is only language spoken 911 9.2 368 6.7 316 12.3 163 13.4 45 10.4 18 13.6
NativityU.S.-born 7,673 77.7 4,570 82.9 1,837 71.2 847 69.4 326 75.6 93 70.2Foreign-born citizen 453 4.6 212 3.8 154 6.0 61 5.0 20 4.7 6 4.4Foreign-born non-citizen 1,750 17.7 729 13.2 590 22.9 313 25.6 85 19.7 34 25.3
Age Group15 to 24 years 1,094 11.1 670 12.2 302 11.7 80 6.5 39 9.0 5 3.525 to 34 years 2,587 26.2 1,365 24.8 737 28.5 348 28.5 97 22.4 40 30.235 to 44 years 1,994 20.2 1,010 18.3 603 23.4 248 20.3 99 23.0 33 25.145 to 54 years 2,002 20.3 1,110 20.1 479 18.5 283 23.2 108 25.0 23 17.155 to 64 years 1,202 12.2 777 14.1 219 8.5 140 11.4 44 10.3 23 17.165 years or more 997 10.1 579 10.5 242 9.4 122 10.0 44 10.3 9 6.9
EducationNo high school degree 3,696 37.4 2,183 39.6 969 37.6 399 32.7 110 25.4 35 26.8High school degree 3,764 38.1 2,147 39.0 970 37.6 471 38.5 139 32.1 38 29.0Some college 2,002 20.3 1,051 19.1 529 20.5 264 21.6 126 29.3 32 23.8College degree 413 4.2 130 2.4 113 4.4 87 7.1 57 13.1 27 20.4
Employment StatusEmployed 3,818 38.7 1,427 25.9 1,313 50.9 722 59.1 268 62.2 88 66.6Unemployed 1,525 15.4 1,028 18.7 331 12.8 116 9.5 32 7.5 17 12.6Not in labor force 4,532 45.9 3,055 55.4 937 36.3 383 31.3 131 30.3 27 20.7
HomeownershipHomeowner 2,238 22.7 1,016 18.4 627 24.3 371 30.4 169 39.1 56 42.1Non-homeowner 7,637 77.3 4,495 81.6 1,954 75.7 850 69.6 262 60.9 77 57.9
Geographic RegionNortheast 1,537 15.6 821 14.9 426 16.5 193 15.8 67 15.6 31 23.4Midwest 1,920 19.4 1,178 21.4 436 16.9 212 17.3 80 18.5 15 11.1South 4,493 45.5 2,603 47.2 1,135 44.0 526 43.1 162 37.6 66 50.1West 1,925 19.5 909 16.5 584 22.6 290 23.8 122 28.2 20 15.4
Metropolitan StatusMetropolitan Area 8,029 81.3 4,312 78.3 2,191 84.9 1,031 84.4 385 89.3 110 83.4
Inside principal city 4,066 41.2 2,289 41.5 1,078 41.8 492 40.3 172 39.8 35 26.6Not inside principal city 2,754 27.9 1,324 24.0 778 30.1 435 35.6 164 38.0 54 40.5Not identified 1,209 12.2 699 12.7 335 13.0 104 8.5 49 11.5 22 16.3
Not in Metropolitan Area 1,764 17.9 1,168 21.2 358 13.9 175 14.4 44 10.2 18 13.6Not Identified 83 0.8 30 0.5 32 1.2 15 1.2 2 0.5 4 3.0
Notes: - = For this table cell, there were too few sample respondents (in some cases zero) reporting that the estimated universe proportion was rounded to 0.0 percent. It is estimated that the true value is only slightly greater than zero. Figures do not always reconcile to totals because of rounding.

2011 FDIC NatIoNal Survey oF uNbaNkeD aND uNDerbaNkeD HouSeHolDS • September 2012 113
Table B-6 2011 Unbanked Households’ Use of AFS by Income
AFS Use
All Unbanked Households
Household Income
Less than $15,000Between $15,000
and $30,000Between $30,000
and $50,000Between $50,000
and $75,000 At Least $75,000
Number (1000s)
Pct of Col
Number (1000s)
Pct of Col
Number (1000s)
Pct of Col
Number (1000s)
Pct of Col
Number (1000s)
Pct of Col
Number (1000s)
Pct of Col
Used Any AFSIn last 30 daysa 4,490 45.5 2,340 42.5 1,260 48.8 611 50.1 224 52.1 54 40.8In last 2-12 months 1,920 19.4 1,208 21.9 450 17.5 174 14.2 70 16.3 18 13.7Not in the last 12 months 929 9.4 543 9.9 241 9.3 98 8.0 40 9.3 6 4.9Never used 2,036 20.6 1,193 21.7 455 17.6 277 22.7 72 16.7 39 29.2Unknown 501 5.1 226 4.1 174 6.8 61 5.0 24 5.6 15 11.4Total 9,875 100.0 5,510 100.0 2,581 100.0 1,221 100.0 431 100.0 132 100.0
Used Transaction AFS in the Last yearb
Used AFS in the last year 6,137 62.1 3,372 61.2 1,656 64.2 755 61.8 286 66.3 68 51.6Did not use AFS last year 3,220 32.6 1,908 34.6 746 28.9 401 32.9 117 27.0 49 37.0Unknown 518 5.2 230 4.2 179 7.0 65 5.3 29 6.7 15 11.4Total 9,875 100.0 5,510 100.0 2,581 100.0 1,221 100.0 431 100.0 132 100.0
Used Credit AFS in the Last yearc
Used AFS in the last year 1,660 16.8 917 16.6 462 17.9 185 15.1 73 16.9 23 17.3Did not use AFS last year 7,473 75.7 4,236 76.9 1,888 73.2 944 77.3 310 71.9 94 71.3Unknown 743 7.5 357 6.5 230 8.9 93 7.6 48 11.2 15 11.4Total 9,875 100.0 5,510 100.0 2,581 100.0 1,221 100.0 431 100.0 132 100.0
Number of Specific AFS Products Used in the Last YearUsed 0 AFS 2,911 29.5 1,707 31.0 684 26.5 371 30.4 105 24.3 45 34.1Used 1 AFS 2,610 26.4 1,607 29.2 628 24.3 241 19.7 108 24.9 27 20.2Used 2 or more AFS 3,505 35.5 1,783 32.4 1,014 39.3 503 41.2 161 37.2 46 34.4Unknown 849 8.6 414 7.5 256 9.9 107 8.7 58 13.5 15 11.4Total 9,875 100.0 5,510 100.0 2,581 100.0 1,221 100.0 431 100.0 132 100.0
Number of Specific AFS Products Used in the Last 30 Daysa
Used 1 AFS 2,708 60.3 1,544 66.0 717 56.9 308 50.5 101 45.0 38 70.9Used 2 or more AFS 1,600 35.6 700 29.9 518 41.1 266 43.6 100 44.7 16 29.1Unknown 181 4.0 96 4.1 26 2.0 37 6.0 23 10.2 - -Total Households That Used AFS In the Last 30
Days4,490 100.0 2,340 100.0 1,260 100.0 611 100.1 224 100.0 54 100.0
Number of Times Transaction AFS Used in the Last 30 Daysb
Used 1 time 1,327 30.2 836 36.8 316 25.4 125 20.7 37 16.8 13 25.1Used 2 times 1,032 23.5 528 23.2 330 26.5 116 19.2 52 23.7 7 13.2Used 3 or more times 1,817 41.4 793 34.9 559 44.9 336 55.7 109 49.1 19 38.7Unknown 216 4.9 115 5.1 40 3.2 26 4.3 23 10.4 12 23.0Total Households That Used Transaction AFS In
the Last 30 Days4,392 100.0 2,272 100.0 1,245 100.0 603 100.0 221 100.0 50 100.0
Notes:a The AFS included in this measure are non-bank money orders, non-bank check cashing, non-bank remittances, payday loans and pawn shop loans. Households were not asked whether they use rent-to-own agreements or refund anticipation loans in the last 30 days. b AFS transaction products are non-bank check cashing, non-bank money orders and non-bank remittances. c AFS credit products are payday loans, pawn shop loans, rent-to-own agreements and refund anticipation loans. - = For this table cell, there were too few sample respondents (in some cases zero) reporting that the estimated universe proportion was rounded to 0.0 percent. It is estimated that the true value is only slightly greater than zero. Figures do not always reconcile to totals because of rounding.
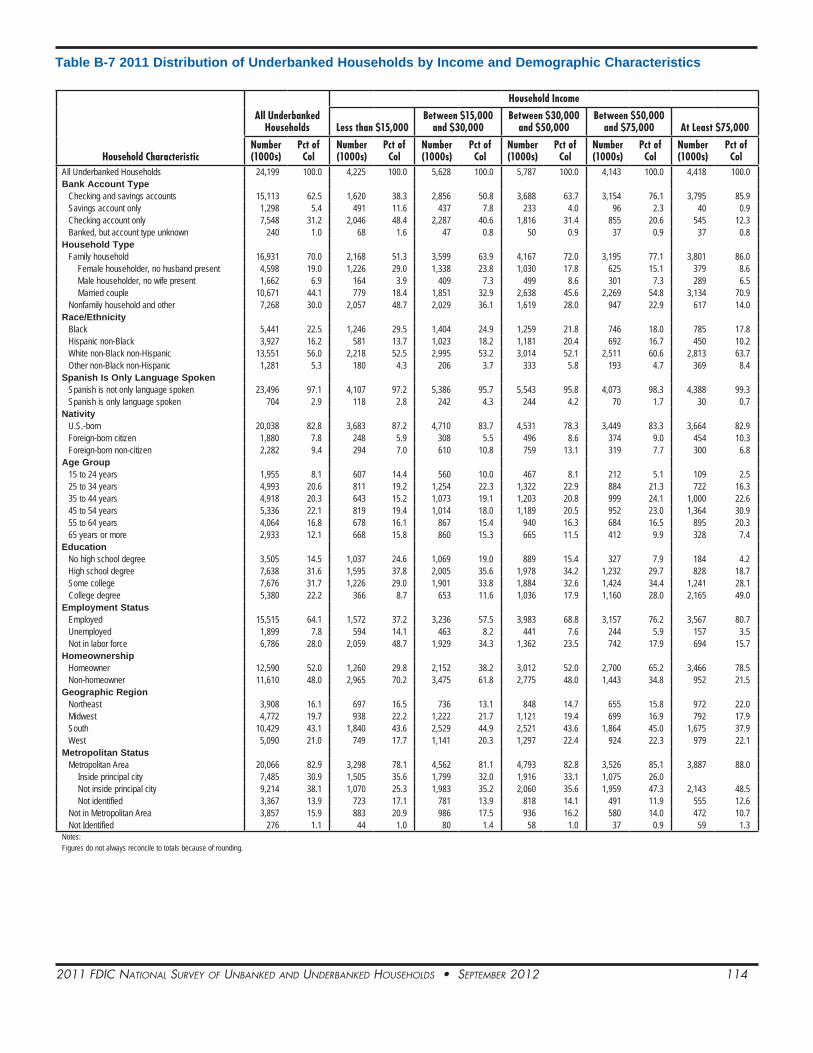
2011 FDIC NatIoNal Survey oF uNbaNkeD aND uNDerbaNkeD HouSeHolDS • September 2012 114
Table B-7 2011 Distribution of Underbanked Households by Income and Demographic Characteristics
Household Characteristic
All Underbanked Households
Household Income
Less than $15,000Between $15,000
and $30,000Between $30,000
and $50,000Between $50,000
and $75,000 At Least $75,000
Number (1000s)
Pct of Col
Number (1000s)
Pct of Col
Number (1000s)
Pct of Col
Number (1000s)
Pct of Col
Number (1000s)
Pct of Col
Number (1000s)
Pct of Col
All Underbanked Households 24,199 100.0 4,225 100.0 5,628 100.0 5,787 100.0 4,143 100.0 4,418 100.0Bank Account Type
Checking and savings accounts 15,113 62.5 1,620 38.3 2,856 50.8 3,688 63.7 3,154 76.1 3,795 85.9Savings account only 1,298 5.4 491 11.6 437 7.8 233 4.0 96 2.3 40 0.9Checking account only 7,548 31.2 2,046 48.4 2,287 40.6 1,816 31.4 855 20.6 545 12.3Banked, but account type unknown 240 1.0 68 1.6 47 0.8 50 0.9 37 0.9 37 0.8
Household TypeFamily household 16,931 70.0 2,168 51.3 3,599 63.9 4,167 72.0 3,195 77.1 3,801 86.0
Female householder, no husband present 4,598 19.0 1,226 29.0 1,338 23.8 1,030 17.8 625 15.1 379 8.6Male householder, no wife present 1,662 6.9 164 3.9 409 7.3 499 8.6 301 7.3 289 6.5Married couple 10,671 44.1 779 18.4 1,851 32.9 2,638 45.6 2,269 54.8 3,134 70.9
Nonfamily household and other 7,268 30.0 2,057 48.7 2,029 36.1 1,619 28.0 947 22.9 617 14.0Race/Ethnicity
Black 5,441 22.5 1,246 29.5 1,404 24.9 1,259 21.8 746 18.0 785 17.8Hispanic non-Black 3,927 16.2 581 13.7 1,023 18.2 1,181 20.4 692 16.7 450 10.2White non-Black non-Hispanic 13,551 56.0 2,218 52.5 2,995 53.2 3,014 52.1 2,511 60.6 2,813 63.7Other non-Black non-Hispanic 1,281 5.3 180 4.3 206 3.7 333 5.8 193 4.7 369 8.4
Spanish Is Only Language SpokenSpanish is not only language spoken 23,496 97.1 4,107 97.2 5,386 95.7 5,543 95.8 4,073 98.3 4,388 99.3Spanish is only language spoken 704 2.9 118 2.8 242 4.3 244 4.2 70 1.7 30 0.7
NativityU.S.-born 20,038 82.8 3,683 87.2 4,710 83.7 4,531 78.3 3,449 83.3 3,664 82.9Foreign-born citizen 1,880 7.8 248 5.9 308 5.5 496 8.6 374 9.0 454 10.3Foreign-born non-citizen 2,282 9.4 294 7.0 610 10.8 759 13.1 319 7.7 300 6.8
Age Group15 to 24 years 1,955 8.1 607 14.4 560 10.0 467 8.1 212 5.1 109 2.525 to 34 years 4,993 20.6 811 19.2 1,254 22.3 1,322 22.9 884 21.3 722 16.335 to 44 years 4,918 20.3 643 15.2 1,073 19.1 1,203 20.8 999 24.1 1,000 22.645 to 54 years 5,336 22.1 819 19.4 1,014 18.0 1,189 20.5 952 23.0 1,364 30.955 to 64 years 4,064 16.8 678 16.1 867 15.4 940 16.3 684 16.5 895 20.365 years or more 2,933 12.1 668 15.8 860 15.3 665 11.5 412 9.9 328 7.4
EducationNo high school degree 3,505 14.5 1,037 24.6 1,069 19.0 889 15.4 327 7.9 184 4.2High school degree 7,638 31.6 1,595 37.8 2,005 35.6 1,978 34.2 1,232 29.7 828 18.7Some college 7,676 31.7 1,226 29.0 1,901 33.8 1,884 32.6 1,424 34.4 1,241 28.1College degree 5,380 22.2 366 8.7 653 11.6 1,036 17.9 1,160 28.0 2,165 49.0
Employment StatusEmployed 15,515 64.1 1,572 37.2 3,236 57.5 3,983 68.8 3,157 76.2 3,567 80.7Unemployed 1,899 7.8 594 14.1 463 8.2 441 7.6 244 5.9 157 3.5Not in labor force 6,786 28.0 2,059 48.7 1,929 34.3 1,362 23.5 742 17.9 694 15.7
HomeownershipHomeowner 12,590 52.0 1,260 29.8 2,152 38.2 3,012 52.0 2,700 65.2 3,466 78.5Non-homeowner 11,610 48.0 2,965 70.2 3,475 61.8 2,775 48.0 1,443 34.8 952 21.5
Geographic RegionNortheast 3,908 16.1 697 16.5 736 13.1 848 14.7 655 15.8 972 22.0Midwest 4,772 19.7 938 22.2 1,222 21.7 1,121 19.4 699 16.9 792 17.9South 10,429 43.1 1,840 43.6 2,529 44.9 2,521 43.6 1,864 45.0 1,675 37.9West 5,090 21.0 749 17.7 1,141 20.3 1,297 22.4 924 22.3 979 22.1
Metropolitan StatusMetropolitan Area 20,066 82.9 3,298 78.1 4,562 81.1 4,793 82.8 3,526 85.1 3,887 88.0
Inside principal city 7,485 30.9 1,505 35.6 1,799 32.0 1,916 33.1 1,075 26.0Not inside principal city 9,214 38.1 1,070 25.3 1,983 35.2 2,060 35.6 1,959 47.3 2,143 48.5Not identified 3,367 13.9 723 17.1 781 13.9 818 14.1 491 11.9 555 12.6
Not in Metropolitan Area 3,857 15.9 883 20.9 986 17.5 936 16.2 580 14.0 472 10.7Not Identified 276 1.1 44 1.0 80 1.4 58 1.0 37 0.9 59 1.3
Notes:Figures do not always reconcile to totals because of rounding.

2011 FDIC NatIoNal Survey oF uNbaNkeD aND uNDerbaNkeD HouSeHolDS • September 2012 115
Table B-8 2011 Underbanked Households’ Use of AFS by Income
AFS Use
All Underbanked Households
Household Income
Less than $15,000Between $15,000
and $30,000Between $30,000
and $50,000Between $50,000
and $75,000 At Least $75,000
Number (1000s)
Pct of Col
Number (1000s)
Pct of Col
Number (1000s)
Pct of Col
Number (1000s)
Pct of Col
Number (1000s)
Pct of Col
Number (1000s)
Pct of Col
Used Any AFSIn last 30 daysa 9,981 41.2 2,036 48.2 2,533 45.0 2,537 43.8 1,547 37.3 1,328 30.1In last 2-12 months 14,219 58.8 2,188 51.8 3,095 55.0 3,250 56.2 2,596 62.7 3,090 69.9Total 24,199 100.0 4,225 100.0 5,628 100.0 5,787 100.0 4,143 100.0 4,418 100.0
Used Transaction AFS in the Last yearb
Used AFS in the last year 21,874 90.4 3,701 87.6 5,025 89.3 5,223 90.3 3,778 91.2 4,147 93.9Did not use AFS last year 2,272 9.4 503 11.9 589 10.5 553 9.6 362 8.7 264 6.0Unknown 54 0.2 21 0.5 14 0.2 11 0.2 2 0.1 6 0.1Total 24,199 100.0 4,225 100.0 5,628 100.0 5,787 100.0 4,143 100.0 4,418 100.0
Used Credit AFS in the Last yearc
Used AFS in the last year 5,583 23.1 1,240 29.4 1,548 27.5 1,405 24.3 890 21.5 500 11.3Did not use AFS last year 18,321 75.7 2,938 69.5 4,007 71.2 4,302 74.3 3,210 77.5 3,864 87.5Unknown 295 1.2 46 1.1 72 1.3 80 1.4 43 1.0 54 1.2Total 24,199 100.0 4,225 100.0 5,628 100.0 5,787 100.0 4,143 100.0 4,418 100.0
Number of Specific AFS Products Used in the Last YearUsed 1 AFS 17,186 71.0 2,832 67.0 3,743 66.5 3,946 68.2 3,070 74.1 3,594 81.4Used 2 or more AFS 6,508 26.9 1,304 30.9 1,751 31.1 1,708 29.5 1,007 24.3 738 16.7Unknown 505 2.1 88 2.1 134 2.4 133 2.3 65 1.6 86 1.9Total 24,199 100.0 4,225 100.0 5,628 100.0 5,787 100.0 4,143 100.0 4,418 100.0
Number of Specific AFS Products Used in the Last 30 Daysa
Used 1 AFS 8,276 82.9 1,707 83.8 2,030 80.2 2,070 81.6 1,313 84.9 1,155 87.0Used 2 or more AFS 1,505 15.1 296 14.5 439 17.3 412 16.3 214 13.8 144 10.9Unknown 200 2.0 34 1.6 63 2.5 54 2.1 20 1.3 29 2.2Total Households That Used AFS In the Last 30
Days9,981 100.0 2,036 100.0 2,533 100.0 2,537 100.0 1,547 100.0 1,328 100.0
Number of Times Transaction AFS Used in the Last 30 Daysb
Used 1 time 5,040 55.3 1,091 59.3 1,196 51.5 1,215 53.4 806 57.0 732 58.2Used 2 times 2,069 22.7 353 19.2 548 23.6 550 24.2 317 22.4 301 23.9Used 3 or more times 1,758 19.3 349 19.0 511 22.0 462 20.3 251 17.7 185 14.7Unknown 246 2.7 47 2.5 69 3.0 50 2.2 41 2.9 39 3.1Total Households That Used Transaction AFS In
the Last 30 Days9,112 100.0 1,839 100.0 2,324 100.1 2,277 100.0 1,416 100.0 1,258 100.0
Notes:a The AFS included in this measure are non-bank money orders, non-bank check cashing, non-bank remittances, payday loans and pawn shop loans. Households were not asked whether they use rent-to-own agreements or refund anticipation loans in the last 30 days. b AFS transaction products are non-bank check cashing, non-bank money orders and non-bank remittances. c AFS credit products are payday loans, pawn shop loans, rent-to-own agreements and refund anticipation loans. Figures do not always reconcile to totals because of rounding.

2011 FDIC NatIoNal Survey oF uNbaNkeD aND uNDerbaNkeD HouSeHolDS • September 2012 116
Table B-9 2011 Distribution of Unbanked Households by Household Type and Demographic Characteristics
Household Characteristic
All Unbanked Households
Household Type
Married CoupleFemale Householder, No Husband Present
Male Householder, No Wife Present
Nonfamily Household and Other
Number (1000s) Pct of Col
Number (1000s) Pct of Col
Number (1000s) Pct of Col
Number (1000s) Pct of Col
Number (1000s) Pct of Col
All Unbanked Households 9,875 100.0 2,127 100.0 2,971 100.0 807 100.0 3,971 100.0Previous Banking Status
Previously banked 4,411 44.7 819 38.5 1,275 42.9 298 36.9 2,018 50.8Never-banked 5,269 53.4 1,269 59.7 1,658 55.8 471 58.4 1,871 47.1Unknown 196 2.0 39 1.8 37 1.2 38 4.7 82 2.1
Likelihood of Opening a Bank AccountVery or somewhat likely 3,350 33.9 683 32.1 1,213 40.8 306 37.9 1,149 28.9Not too likely or not likely at all 5,999 60.7 1,351 63.5 1,626 54.7 458 56.7 2,564 64.6Unknown 526 5.3 93 4.4 132 4.4 43 5.3 258 6.5
Race/EthnicityBlack 3,430 34.7 346 16.3 1,334 44.9 229 28.4 1,521 38.3Hispanic non-Black 2,762 28.0 1,005 47.2 746 25.1 299 37.0 713 17.9White non-Black non-Hispanic 3,330 33.7 720 33.9 803 27.0 241 29.9 1,565 39.4Other non-Black non-Hispanic 353 3.6 56 2.6 87 2.9 38 4.7 172 4.3
Spanish is Only Language SpokenSpanish is not only language spoken 8,965 90.8 1,728 81.2 2,782 93.7 720 89.2 3,735 94.1Spanish is only language spoken 911 9.2 399 18.8 189 6.3 87 10.8 236 5.9
NativityU.S.-born 7,673 77.7 1,205 56.6 2,502 84.2 603 74.7 3,364 84.7Foreign-born citizen 453 4.6 161 7.6 102 3.4 20 2.5 170 4.3Foreign-born non-citizen 1,750 17.7 761 35.8 367 12.4 184 22.8 437 11.0
Age Group15 to 24 years 1,094 11.1 139 6.5 444 15.0 139 17.2 371 9.425 to 34 years 2,587 26.2 616 28.9 1,042 35.1 232 28.7 697 17.535 to 44 years 1,994 20.2 575 27.0 666 22.4 214 26.5 539 13.645 to 54 years 2,002 20.3 417 19.6 553 18.6 131 16.2 902 22.755 to 64 years 1,202 12.2 207 9.7 143 4.8 63 7.7 789 19.965 years or more 997 10.1 173 8.1 123 4.1 28 3.5 673 16.9
EducationNo high school degree 3,696 37.4 993 46.7 1,046 35.2 332 41.1 1,325 33.4High school degree 3,764 38.1 758 35.6 1,123 37.8 322 39.9 1,562 39.3Some college 2,002 20.3 303 14.3 736 24.8 118 14.7 844 21.3College degree 413 4.2 73 3.4 66 2.2 35 4.3 239 6.0
Employment StatusEmployed 3,818 38.7 935 43.9 1,080 36.4 398 49.4 1,405 35.4Unemployed 1,525 15.4 271 12.7 558 18.8 185 22.9 512 12.9Not in labor force 4,532 45.9 922 43.3 1,333 44.9 224 27.8 2,053 51.7
Household IncomeLess than $15,000 5,510 55.8 778 36.6 1,899 63.9 380 47.1 2,453 61.8Between $15,000 and $30,000 2,581 26.1 698 32.8 695 23.4 234 29.0 955 24.0Between $30,000 and $50,000 1,221 12.4 455 21.4 239 8.1 134 16.6 393 9.9Between $50,000 and $75,000 431 4.4 137 6.4 116 3.9 51 6.4 126 3.2At Least $75,000 132 1.3 60 2.8 22 0.7 7 0.9 44 1.1
HomeownershipHomeowner 2,238 22.7 645 30.3 497 16.7 240 29.7 857 21.6Non-homeowner 7,637 77.3 1,482 69.7 2,474 83.3 567 70.3 3,114 78.4
Geographic RegionNortheast 1,537 15.6 288 13.5 460 15.5 99 12.2 692 17.4Midwest 1,920 19.4 296 13.9 573 19.3 170 21.0 883 22.2South 4,493 45.5 1,016 47.8 1,421 47.8 345 42.8 1,711 43.1West 1,925 19.5 528 24.8 518 17.4 194 24.0 685 17.3
Metropolitan StatusMetropolitan Area 8,029 81.3 1,726 81.1 2,346 79.0 676 83.8 3,282 82.6
Inside principal city 4,066 41.2 803 37.8 1,250 42.1 340 42.1 1,673 42.1Not inside principal city 2,754 27.9 676 31.8 774 26.1 248 30.7 1,055 26.6Not identified 1,209 12.2 246 11.6 321 10.8 88 10.9 554 14.0
Not in Metropolitan Area 1,764 17.9 383 18.0 594 20.0 127 15.7 661 16.7Not Identified 83 0.8 19 0.9 31 1.1 5 0.6 28 0.7
Notes:Figures do not always reconcile to totals because of rounding.

2011 FDIC NatIoNal Survey oF uNbaNkeD aND uNDerbaNkeD HouSeHolDS • September 2012 117
Table B-10 2011 Unbanked Households’ Use of AFS by Household Type
AFS Use
All Unbanked Households
Household Type
Married CoupleFemale Householder, No Husband Present
Male Householder, No Wife Present
Nonfamily Household and Other
Number (1000s) Pct of Col
Number (1000s) Pct of Col
Number (1000s) Pct of Col
Number (1000s) Pct of Col
Number (1000s) Pct of Col
Used Any AFSIn last 30 daysa 4,490 45.5 1,138 53.5 1,480 49.8 395 48.9 1,477 37.2In last 2-12 months 1,920 19.4 363 17.0 641 21.6 186 23.0 732 18.4Not in the last 12 months 929 9.4 169 7.9 285 9.6 55 6.8 420 10.6Never used 2,036 20.6 369 17.4 476 16.0 127 15.7 1,064 26.8Unknown 501 5.1 89 4.2 90 3.0 44 5.5 278 7.0Total 9,875 100.0 2,127 100.0 2,971 100.0 807 100.0 3,971 100.0
Used Transaction AFS in the Last yearb
Used AFS in the last year 6,137 62.1 1,449 68.1 1,995 67.2 570 70.6 2,124 53.5Did not use AFS last year 3,220 32.6 575 27.1 878 29.5 193 23.9 1,574 39.6Unknown 518 5.2 103 4.8 98 3.3 44 5.5 273 6.9Total 9,875 100.0 2,127 100.0 2,971 100.0 807 100.0 3,971 100.0
Used Credit AFS in the Last yearc
Used AFS in the last year 1,660 16.8 384 18.1 615 20.7 177 22.0 484 12.2Did not use AFS last year 7,473 75.7 1,578 74.2 2,203 74.2 566 70.1 3,126 78.7Unknown 743 7.5 164 7.7 153 5.1 64 7.9 362 9.1Total 9,875 100.0 2,127 100.0 2,971 100.0 807 100.0 3,971 100.0
Number of Specific AFS Products Used in the Last YearUsed 0 AFS 2,911 29.5 522 24.5 749 25.2 182 22.6 1,458 36.7Used 1 AFS 2,610 26.4 494 23.2 942 31.7 174 21.5 1,000 25.2Used 2 or more AFS 3,505 35.5 931 43.8 1,091 36.7 367 45.4 1,117 28.1Unknown 849 8.6 180 8.5 189 6.4 84 10.5 395 10.0Total 9,875 100.0 2,127 100.0 2,971 100.0 807 100.0 3,971 100.0
Number of Specific AFS Products Used in the Last 30 Daysa
Used 1 AFS 2,708 60.3 581 51.1 948 64.1 192 48.7 986 66.8Used 2 or more AFS 1,600 35.6 500 43.9 476 32.1 180 45.6 445 30.1Unknown 181 4.0 57 5.0 56 3.8 22 5.7 46 3.1Total Households That Used AFS In the Last 30 Days 4,490 100.0 1,138 100.0 1,480 100.0 395 100.0 1,477 100.0
Number of Times Transaction AFS Used in the Last 30 Daysb
Used 1 time 1,327 30.2 289 25.8 445 30.7 65 16.7 529 36.8Used 2 times 1,032 23.5 221 19.7 411 28.4 91 23.3 310 21.6Used 3 or more times 1,817 41.4 552 49.4 531 36.7 209 53.8 524 36.5Unknown 216 4.9 57 5.1 61 4.2 24 6.2 74 5.1Total Households That Used Transaction AFS In the
Last 30 Days4,392 100.0 1,119 100.0 1,448 100.0 389 100.0 1,436 100.0
Notes:a The AFS included in this measure are non-bank money orders, non-bank check cashing, non-bank remittances, payday loans and pawn shop loans. Households were not asked whether they use rent-to-own agreements or refund anticipation loans in the last 30 days. b AFS transaction products are non-bank check cashing, non-bank money orders and non-bank remittances. c AFS credit products are payday loans, pawn shop loans, rent-to-own agreements and refund anticipation loans. Figures do not always reconcile to totals because of rounding.
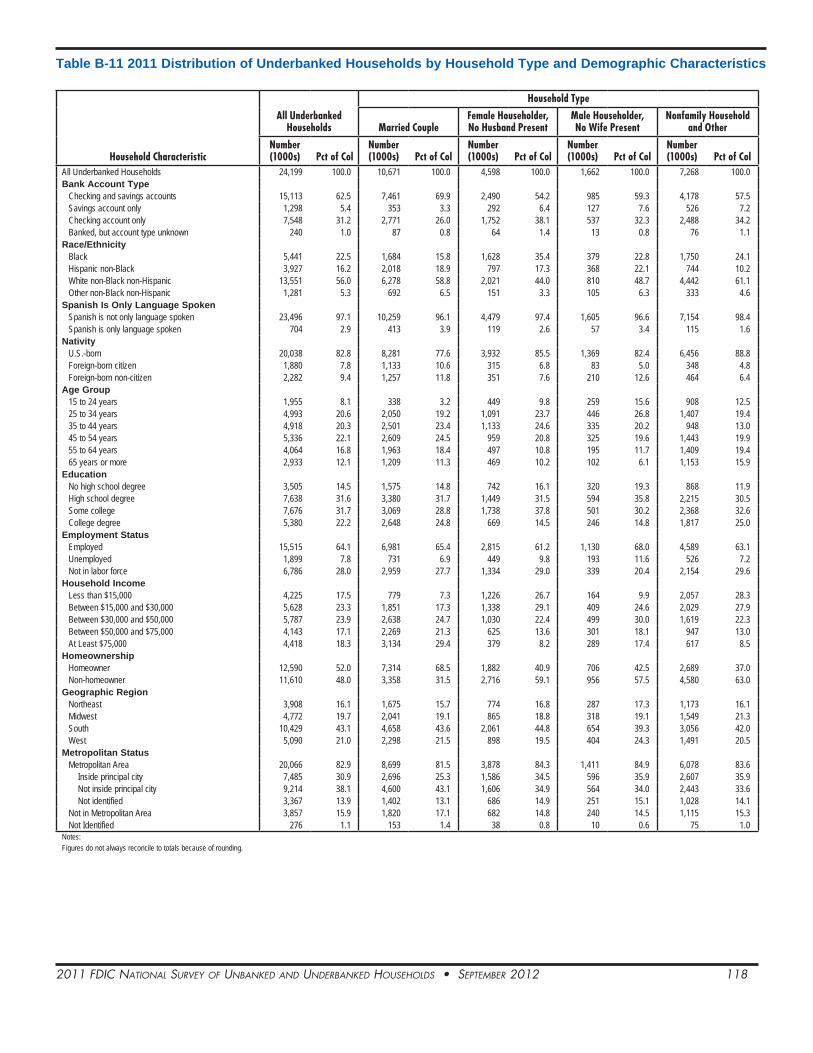
2011 FDIC NatIoNal Survey oF uNbaNkeD aND uNDerbaNkeD HouSeHolDS • September 2012 118
Table B-11 2011 Distribution of Underbanked Households by Household Type and Demographic Characteristics
Household Characteristic
All Underbanked Households
Household Type
Married CoupleFemale Householder, No Husband Present
Male Householder, No Wife Present
Nonfamily Household and Other
Number (1000s) Pct of Col
Number (1000s) Pct of Col
Number (1000s) Pct of Col
Number (1000s) Pct of Col
Number (1000s) Pct of Col
All Underbanked Households 24,199 100.0 10,671 100.0 4,598 100.0 1,662 100.0 7,268 100.0Bank Account Type
Checking and savings accounts 15,113 62.5 7,461 69.9 2,490 54.2 985 59.3 4,178 57.5Savings account only 1,298 5.4 353 3.3 292 6.4 127 7.6 526 7.2Checking account only 7,548 31.2 2,771 26.0 1,752 38.1 537 32.3 2,488 34.2Banked, but account type unknown 240 1.0 87 0.8 64 1.4 13 0.8 76 1.1
Race/EthnicityBlack 5,441 22.5 1,684 15.8 1,628 35.4 379 22.8 1,750 24.1Hispanic non-Black 3,927 16.2 2,018 18.9 797 17.3 368 22.1 744 10.2White non-Black non-Hispanic 13,551 56.0 6,278 58.8 2,021 44.0 810 48.7 4,442 61.1Other non-Black non-Hispanic 1,281 5.3 692 6.5 151 3.3 105 6.3 333 4.6
Spanish Is Only Language SpokenSpanish is not only language spoken 23,496 97.1 10,259 96.1 4,479 97.4 1,605 96.6 7,154 98.4Spanish is only language spoken 704 2.9 413 3.9 119 2.6 57 3.4 115 1.6
NativityU.S.-born 20,038 82.8 8,281 77.6 3,932 85.5 1,369 82.4 6,456 88.8Foreign-born citizen 1,880 7.8 1,133 10.6 315 6.8 83 5.0 348 4.8Foreign-born non-citizen 2,282 9.4 1,257 11.8 351 7.6 210 12.6 464 6.4
Age Group15 to 24 years 1,955 8.1 338 3.2 449 9.8 259 15.6 908 12.525 to 34 years 4,993 20.6 2,050 19.2 1,091 23.7 446 26.8 1,407 19.435 to 44 years 4,918 20.3 2,501 23.4 1,133 24.6 335 20.2 948 13.045 to 54 years 5,336 22.1 2,609 24.5 959 20.8 325 19.6 1,443 19.955 to 64 years 4,064 16.8 1,963 18.4 497 10.8 195 11.7 1,409 19.465 years or more 2,933 12.1 1,209 11.3 469 10.2 102 6.1 1,153 15.9
EducationNo high school degree 3,505 14.5 1,575 14.8 742 16.1 320 19.3 868 11.9High school degree 7,638 31.6 3,380 31.7 1,449 31.5 594 35.8 2,215 30.5Some college 7,676 31.7 3,069 28.8 1,738 37.8 501 30.2 2,368 32.6College degree 5,380 22.2 2,648 24.8 669 14.5 246 14.8 1,817 25.0
Employment StatusEmployed 15,515 64.1 6,981 65.4 2,815 61.2 1,130 68.0 4,589 63.1Unemployed 1,899 7.8 731 6.9 449 9.8 193 11.6 526 7.2Not in labor force 6,786 28.0 2,959 27.7 1,334 29.0 339 20.4 2,154 29.6
Household IncomeLess than $15,000 4,225 17.5 779 7.3 1,226 26.7 164 9.9 2,057 28.3Between $15,000 and $30,000 5,628 23.3 1,851 17.3 1,338 29.1 409 24.6 2,029 27.9Between $30,000 and $50,000 5,787 23.9 2,638 24.7 1,030 22.4 499 30.0 1,619 22.3Between $50,000 and $75,000 4,143 17.1 2,269 21.3 625 13.6 301 18.1 947 13.0At Least $75,000 4,418 18.3 3,134 29.4 379 8.2 289 17.4 617 8.5
HomeownershipHomeowner 12,590 52.0 7,314 68.5 1,882 40.9 706 42.5 2,689 37.0Non-homeowner 11,610 48.0 3,358 31.5 2,716 59.1 956 57.5 4,580 63.0
Geographic RegionNortheast 3,908 16.1 1,675 15.7 774 16.8 287 17.3 1,173 16.1Midwest 4,772 19.7 2,041 19.1 865 18.8 318 19.1 1,549 21.3South 10,429 43.1 4,658 43.6 2,061 44.8 654 39.3 3,056 42.0West 5,090 21.0 2,298 21.5 898 19.5 404 24.3 1,491 20.5
Metropolitan StatusMetropolitan Area 20,066 82.9 8,699 81.5 3,878 84.3 1,411 84.9 6,078 83.6
Inside principal city 7,485 30.9 2,696 25.3 1,586 34.5 596 35.9 2,607 35.9Not inside principal city 9,214 38.1 4,600 43.1 1,606 34.9 564 34.0 2,443 33.6Not identified 3,367 13.9 1,402 13.1 686 14.9 251 15.1 1,028 14.1
Not in Metropolitan Area 3,857 15.9 1,820 17.1 682 14.8 240 14.5 1,115 15.3Not Identified 276 1.1 153 1.4 38 0.8 10 0.6 75 1.0
Notes:Figures do not always reconcile to totals because of rounding.

2011 FDIC NatIoNal Survey oF uNbaNkeD aND uNDerbaNkeD HouSeHolDS • September 2012 119
AFS Use
All Underbanked Households
Household Type
Married CoupleFemale Householder, No Husband Present
Male Householder, No Wife Present
Nonfamily Household and Other
Number (1000s) Pct of Col
Number (1000s) Pct of Col
Number (1000s) Pct of Col
Number (1000s) Pct of Col
Number (1000s) Pct of Col
Used Any AFSIn last 30 daysa 9,981 41.2 4,093 38.4 2,163 47.1 772 46.5 2,952 40.6In last 2-12 months 14,219 58.8 6,579 61.6 2,435 52.9 890 53.5 4,316 59.4Total 24,199 100.0 10,671 100.0 4,598 100.0 1,662 100.0 7,268 100.0
Used Transaction AFS in the Last yearb
Used AFS in the last year 21,874 90.4 9,632 90.3 4,067 88.4 1,499 90.2 6,676 91.8Did not use AFS last year 2,272 9.4 1,017 9.5 514 11.2 159 9.5 583 8.0Unknown 54 0.2 23 0.2 18 0.4 4 0.2 10 0.1Total 24,199 100.0 10,671 100.0 4,598 100.0 1,662 100.0 7,268 100.0
Used Credit AFS in the Last yearc
Used AFS in the last year 5,583 23.1 2,191 20.5 1,418 30.8 497 29.9 1,477 20.3Did not use AFS last year 18,321 75.7 8,364 78.4 3,091 67.2 1,145 68.9 5,721 78.7Unknown 295 1.2 116 1.1 89 1.9 19 1.2 70 1.0Total 24,199 100.0 10,671 100.0 4,598 100.0 1,662 100.0 7,268 100.0
Number of Specific AFS Products Used in the Last YearUsed 1 AFS 17,186 71.0 7,867 73.7 2,853 62.0 1,052 63.3 5,414 74.5Used 2 or more AFS 6,508 26.9 2,599 24.4 1,592 34.6 574 34.5 1,744 24.0Unknown 505 2.1 205 1.9 154 3.3 36 2.2 110 1.5Total 24,199 100.0 10,671 100.0 4,598 100.0 1,662 100.0 7,268 100.0
Number of Specific AFS Products Used in the Last 30 Daysa
Used 1 AFS 8,276 82.9 3,367 82.3 1,755 81.1 610 79.0 2,544 86.2Used 2 or more AFS 1,505 15.1 639 15.6 353 16.3 150 19.4 363 12.3Unknown 200 2.0 87 2.1 55 2.5 13 1.7 45 1.5Total Households That Used AFS In the Last 30 Days 9,981 100.0 4,093 100.0 2,163 100.0 772 100.0 2,952 100.0
Number of Times Transaction AFS Used in the Last 30 Daysb
Used 1 time 5,040 55.3 2,003 53.9 1,107 56.1 338 48.1 1,592 58.6Used 2 times 2,069 22.7 858 23.1 409 20.7 186 26.5 616 22.7Used 3 or more times 1,758 19.3 756 20.3 401 20.3 162 23.1 439 16.2Unknown 246 2.7 102 2.7 59 3.0 17 2.4 68 2.5Total Households That Used Transaction AFS In the
Last 30 Days9,112 100.0 3,720 100.0 1,975 100.0 703 100.0 2,715 100.0
Notes:a The AFS included in this measure are non-bank money orders, non-bank check cashing, non-bank remittances, payday loans and pawn shop loans. Households were not asked whether they use rent-to-own agreements or refund anticipation loans in the last 30 days. b AFS transaction products are non-bank check cashing, non-bank money orders and non-bank remittances. c AFS credit products are payday loans, pawn shop loans, rent-to-own agreements and refund anticipation loans. Figures do not always reconcile to totals because of rounding.
Table B-12 2011 Underbanked Households’ Use of AFS by Household Type

2011 FDIC NatIoNal Survey oF uNbaNkeD aND uNDerbaNkeD HouSeHolDS • September 2012 120
Table B-13 2011 Distribution of Unbanked Households by Age and Demographic Characteristics
Household Characteristic
All Unbanked Households
Age Group
15 to 24 Years 25 to 34 Years 35 to 44 Years 45 to 54 Years 55 to 64 Years 65 Years or More
Number (1000s)
Pct of Col
Number (1000s)
Pct of Col
Number (1000s)
Pct of Col
Number (1000s)
Pct of Col
Number (1000s)
Pct of Col
Number (1000s)
Pct of Col
Number (1000s)
Pct of Col
All Unbanked Households 9,875 100.0 1,094 100.0 2,587 100.0 1,994 100.0 2,002 100.0 1,202 100.0 997 100.0Previous Banking StatusPreviously banked 4,411 44.7 473 43.2 1,185 45.8 832 41.7 866 43.2 584 48.6 471 47.2Never-banked 5,269 53.4 609 55.7 1,377 53.2 1,129 56.6 1,072 53.5 581 48.4 501 50.2Unknown 196 2.0 12 1.1 25 1.0 33 1.6 64 3.2 37 3.1 25 2.5
Likelihood of Open-ing a Bank AccountVery or somewhat likely 3,350 33.9 560 51.2 1,066 41.2 803 40.3 581 29.0 231 19.2 110 11.0Not too likely or not likely
at all5,999 60.7 479 43.8 1,419 54.9 1,094 54.8 1,307 65.3 868 72.2 833 83.6
Unknown 526 5.3 55 5.0 102 3.9 98 4.9 114 5.7 103 8.6 54 5.5Household Type
Family household 5,905 59.8 723 66.1 1,890 73.1 1,455 73.0 1,100 55.0 412 34.3 324 32.5Female householder,
no husband present2,971 30.1 444 40.6 1,042 40.3 666 33.4 553 27.6 143 11.9 123 12.4
Male householder, no wife present
807 8.2 139 12.7 232 9.0 214 10.7 131 6.5 63 5.2 28 2.8
Married couple 2,127 21.5 139 12.7 616 23.8 575 28.8 417 20.8 207 17.2 173 17.3Nonfamily household and
other3,971 40.2 371 33.9 697 26.9 539 27.0 902 45.0 789 65.7 673 67.5
Race/EthnicityBlack 3,430 34.7 337 30.8 856 33.1 646 32.4 768 38.4 508 42.3 315 31.6Hispanic non-Black 2,762 28.0 353 32.2 868 33.5 684 34.3 447 22.3 199 16.5 212 21.3White non-Black
non-Hispanic3,330 33.7 376 34.4 797 30.8 610 30.6 709 35.4 434 36.1 404 40.5
Other non-Black non-Hispanic
353 3.6 28 2.5 66 2.6 54 2.7 78 3.9 61 5.1 66 6.6
Spanish Is Only Language SpokenSpanish is not only
language spoken8,965 90.8 1,024 93.6 2,289 88.5 1,730 86.8 1,877 93.7 1,140 94.9 905 90.8
Spanish is only language spoken
911 9.2 70 6.4 298 11.5 264 13.2 125 6.3 61 5.1 92 9.2
NativityU.S.-born 7,673 77.7 908 82.9 1,904 73.6 1,378 69.1 1,668 83.3 1,049 87.3 766 76.8Foreign-born citizen 453 4.6 28 2.5 72 2.8 83 4.2 89 4.5 59 4.9 121 12.2Foreign-born non-citizen 1,750 17.7 159 14.5 610 23.6 533 26.7 245 12.2 93 7.8 110 11.0
EducationNo high school degree 3,696 37.4 388 35.5 824 31.9 733 36.8 757 37.8 475 39.5 518 52.0High school degree 3,764 38.1 472 43.1 1,084 41.9 770 38.6 757 37.8 437 36.4 244 24.5Some college 2,002 20.3 221 20.2 624 24.1 395 19.8 380 19.0 233 19.4 150 15.1College degree 413 4.2 13 1.2 55 2.1 95 4.8 109 5.4 57 4.7 84 8.5
Employment StatusEmployed 3,818 38.7 473 43.2 1,205 46.6 938 47.0 730 36.5 363 30.2 111 11.1Unemployed 1,525 15.4 225 20.6 510 19.7 351 17.6 313 15.7 116 9.7 9 0.9Not in labor force 4,532 45.9 396 36.2 872 33.7 705 35.4 959 47.9 723 60.1 877 88.0
Household IncomeLess than $15,000 5,510 55.8 670 61.2 1,365 52.8 1,010 50.6 1,110 55.4 777 64.6 579 58.1Between $15,000 and
$30,0002,581 26.1 302 27.6 737 28.5 603 30.3 479 23.9 219 18.2 242 24.3
Between $30,000 and $50,000
1,221 12.4 80 7.3 348 13.5 248 12.5 283 14.1 140 11.6 122 12.3
Between $50,000 and $75,000
431 4.4 39 3.5 97 3.7 99 5.0 108 5.4 44 3.7 44 4.5
At Least $75,000 132 1.3 5 0.4 40 1.5 33 1.7 23 1.1 23 1.9 9 0.9Homeownership
Homeowner 2,238 22.7 112 10.3 363 14.0 410 20.6 533 26.6 381 31.7 439 44.1Non-homeowner 7,637 77.3 982 89.7 2,224 86.0 1,584 79.4 1,469 73.4 821 68.3 558 55.9
Geographic RegionNortheast 1,537 15.6 119 10.9 331 12.8 316 15.8 319 15.9 225 18.8 227 22.8Midwest 1,920 19.4 298 27.2 445 17.2 371 18.6 407 20.3 245 20.4 156 15.6South 4,493 45.5 455 41.6 1,248 48.3 898 45.0 936 46.8 505 42.0 450 45.2West 1,925 19.5 222 20.3 563 21.8 410 20.5 340 17.0 227 18.9 164 16.4
Metropolitan StatusMetropolitan Area 8,029 81.3 882 80.6 2,082 80.5 1,670 83.8 1,669 83.4 953 79.3 773 77.5
Inside principal city 4,066 41.2 416 38.0 1,058 40.9 865 43.4 830 41.5 523 43.5 374 37.5
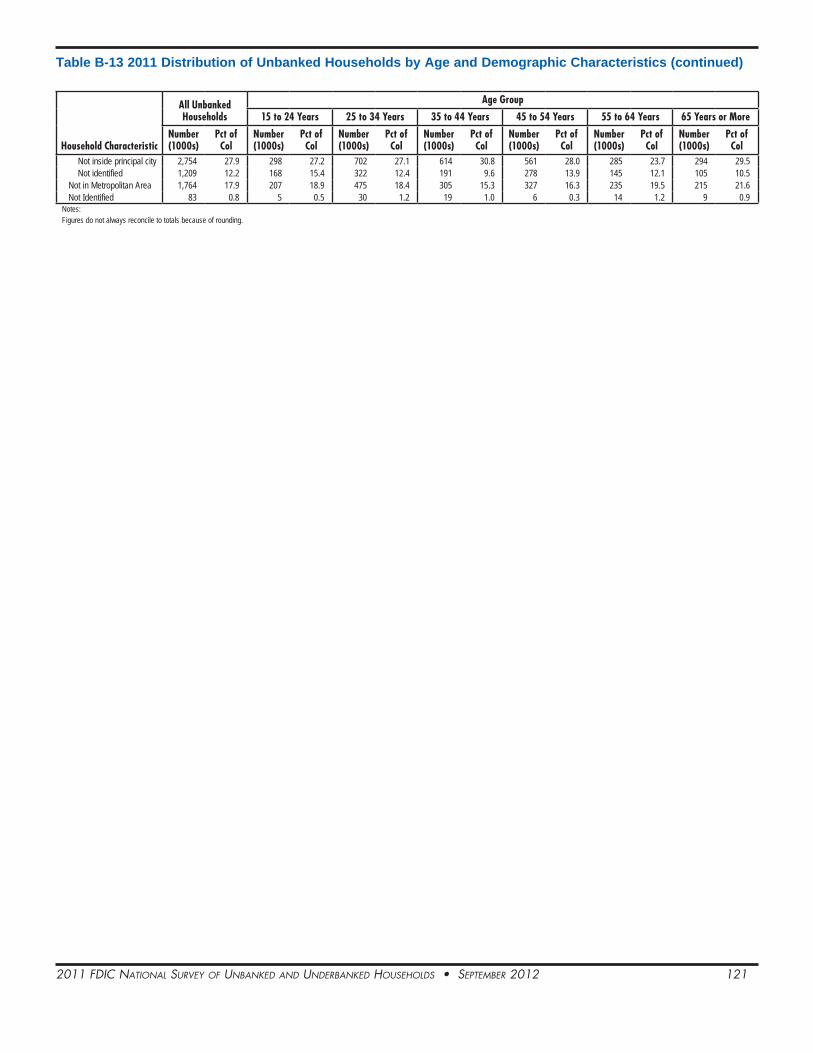
2011 FDIC NatIoNal Survey oF uNbaNkeD aND uNDerbaNkeD HouSeHolDS • September 2012 121
Table B-13 2011 Distribution of Unbanked Households by Age and Demographic Characteristics (continued)
Household Characteristic
All Unbanked Households
Age Group
15 to 24 Years 25 to 34 Years 35 to 44 Years 45 to 54 Years 55 to 64 Years 65 Years or More
Number (1000s)
Pct of Col
Number (1000s)
Pct of Col
Number (1000s)
Pct of Col
Number (1000s)
Pct of Col
Number (1000s)
Pct of Col
Number (1000s)
Pct of Col
Number (1000s)
Pct of Col
Not inside principal city 2,754 27.9 298 27.2 702 27.1 614 30.8 561 28.0 285 23.7 294 29.5Not identified 1,209 12.2 168 15.4 322 12.4 191 9.6 278 13.9 145 12.1 105 10.5
Not in Metropolitan Area 1,764 17.9 207 18.9 475 18.4 305 15.3 327 16.3 235 19.5 215 21.6Not Identified 83 0.8 5 0.5 30 1.2 19 1.0 6 0.3 14 1.2 9 0.9
Notes:Figures do not always reconcile to totals because of rounding.
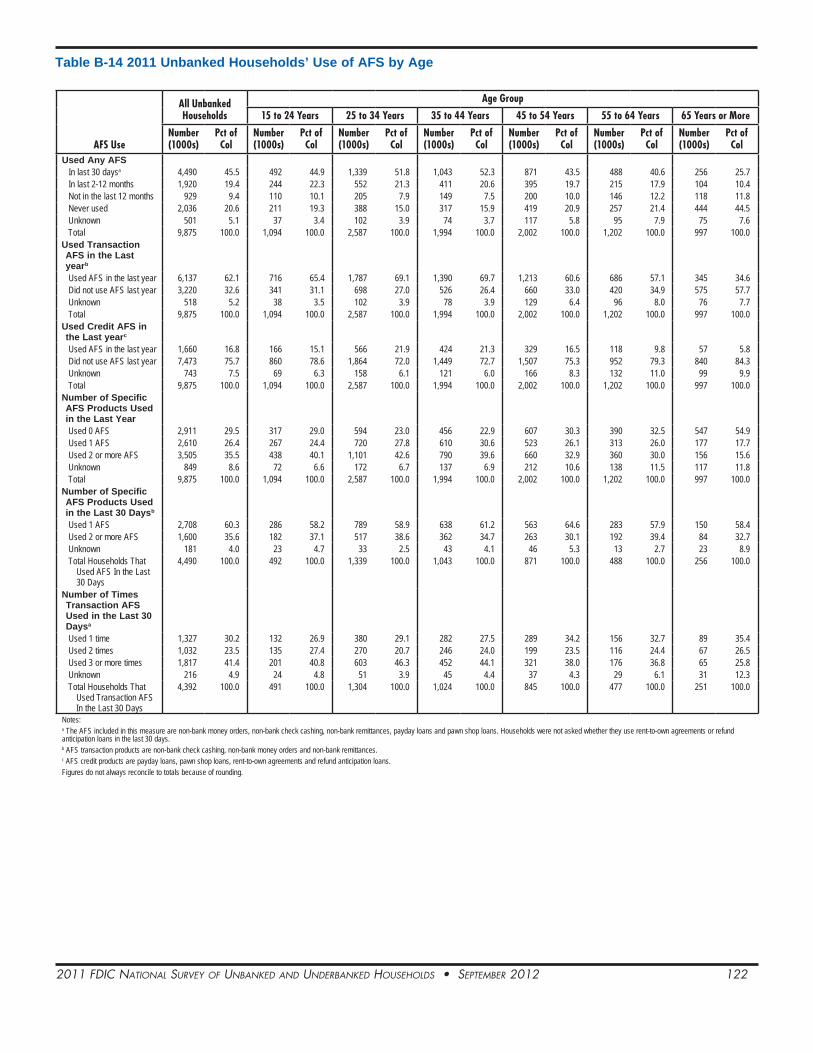
2011 FDIC NatIoNal Survey oF uNbaNkeD aND uNDerbaNkeD HouSeHolDS • September 2012 122
Table B-14 2011 Unbanked Households’ Use of AFS by Age
AFS Use
All Unbanked Households
Age Group
15 to 24 Years 25 to 34 Years 35 to 44 Years 45 to 54 Years 55 to 64 Years 65 Years or More
Number (1000s)
Pct of Col
Number (1000s)
Pct of Col
Number (1000s)
Pct of Col
Number (1000s)
Pct of Col
Number (1000s)
Pct of Col
Number (1000s)
Pct of Col
Number (1000s)
Pct of Col
Used Any AFSIn last 30 daysa 4,490 45.5 492 44.9 1,339 51.8 1,043 52.3 871 43.5 488 40.6 256 25.7In last 2-12 months 1,920 19.4 244 22.3 552 21.3 411 20.6 395 19.7 215 17.9 104 10.4Not in the last 12 months 929 9.4 110 10.1 205 7.9 149 7.5 200 10.0 146 12.2 118 11.8Never used 2,036 20.6 211 19.3 388 15.0 317 15.9 419 20.9 257 21.4 444 44.5Unknown 501 5.1 37 3.4 102 3.9 74 3.7 117 5.8 95 7.9 75 7.6Total 9,875 100.0 1,094 100.0 2,587 100.0 1,994 100.0 2,002 100.0 1,202 100.0 997 100.0
Used Transaction AFS in the Last yearb
Used AFS in the last year 6,137 62.1 716 65.4 1,787 69.1 1,390 69.7 1,213 60.6 686 57.1 345 34.6Did not use AFS last year 3,220 32.6 341 31.1 698 27.0 526 26.4 660 33.0 420 34.9 575 57.7Unknown 518 5.2 38 3.5 102 3.9 78 3.9 129 6.4 96 8.0 76 7.7Total 9,875 100.0 1,094 100.0 2,587 100.0 1,994 100.0 2,002 100.0 1,202 100.0 997 100.0
Used Credit AFS in the Last yearc
Used AFS in the last year 1,660 16.8 166 15.1 566 21.9 424 21.3 329 16.5 118 9.8 57 5.8Did not use AFS last year 7,473 75.7 860 78.6 1,864 72.0 1,449 72.7 1,507 75.3 952 79.3 840 84.3Unknown 743 7.5 69 6.3 158 6.1 121 6.0 166 8.3 132 11.0 99 9.9Total 9,875 100.0 1,094 100.0 2,587 100.0 1,994 100.0 2,002 100.0 1,202 100.0 997 100.0
Number of Specific AFS Products Used in the Last YearUsed 0 AFS 2,911 29.5 317 29.0 594 23.0 456 22.9 607 30.3 390 32.5 547 54.9Used 1 AFS 2,610 26.4 267 24.4 720 27.8 610 30.6 523 26.1 313 26.0 177 17.7Used 2 or more AFS 3,505 35.5 438 40.1 1,101 42.6 790 39.6 660 32.9 360 30.0 156 15.6Unknown 849 8.6 72 6.6 172 6.7 137 6.9 212 10.6 138 11.5 117 11.8Total 9,875 100.0 1,094 100.0 2,587 100.0 1,994 100.0 2,002 100.0 1,202 100.0 997 100.0
Number of Specific AFS Products Used in the Last 30 Daysb
Used 1 AFS 2,708 60.3 286 58.2 789 58.9 638 61.2 563 64.6 283 57.9 150 58.4Used 2 or more AFS 1,600 35.6 182 37.1 517 38.6 362 34.7 263 30.1 192 39.4 84 32.7Unknown 181 4.0 23 4.7 33 2.5 43 4.1 46 5.3 13 2.7 23 8.9Total Households That
Used AFS In the Last 30 Days
4,490 100.0 492 100.0 1,339 100.0 1,043 100.0 871 100.0 488 100.0 256 100.0
Number of Times Transaction AFS Used in the Last 30 Daysa
Used 1 time 1,327 30.2 132 26.9 380 29.1 282 27.5 289 34.2 156 32.7 89 35.4Used 2 times 1,032 23.5 135 27.4 270 20.7 246 24.0 199 23.5 116 24.4 67 26.5Used 3 or more times 1,817 41.4 201 40.8 603 46.3 452 44.1 321 38.0 176 36.8 65 25.8Unknown 216 4.9 24 4.8 51 3.9 45 4.4 37 4.3 29 6.1 31 12.3Total Households That
Used Transaction AFS In the Last 30 Days
4,392 100.0 491 100.0 1,304 100.0 1,024 100.0 845 100.0 477 100.0 251 100.0
Notes:a The AFS included in this measure are non-bank money orders, non-bank check cashing, non-bank remittances, payday loans and pawn shop loans. Households were not asked whether they use rent-to-own agreements or refund anticipation loans in the last 30 days. b AFS transaction products are non-bank check cashing, non-bank money orders and non-bank remittances. c AFS credit products are payday loans, pawn shop loans, rent-to-own agreements and refund anticipation loans. Figures do not always reconcile to totals because of rounding.
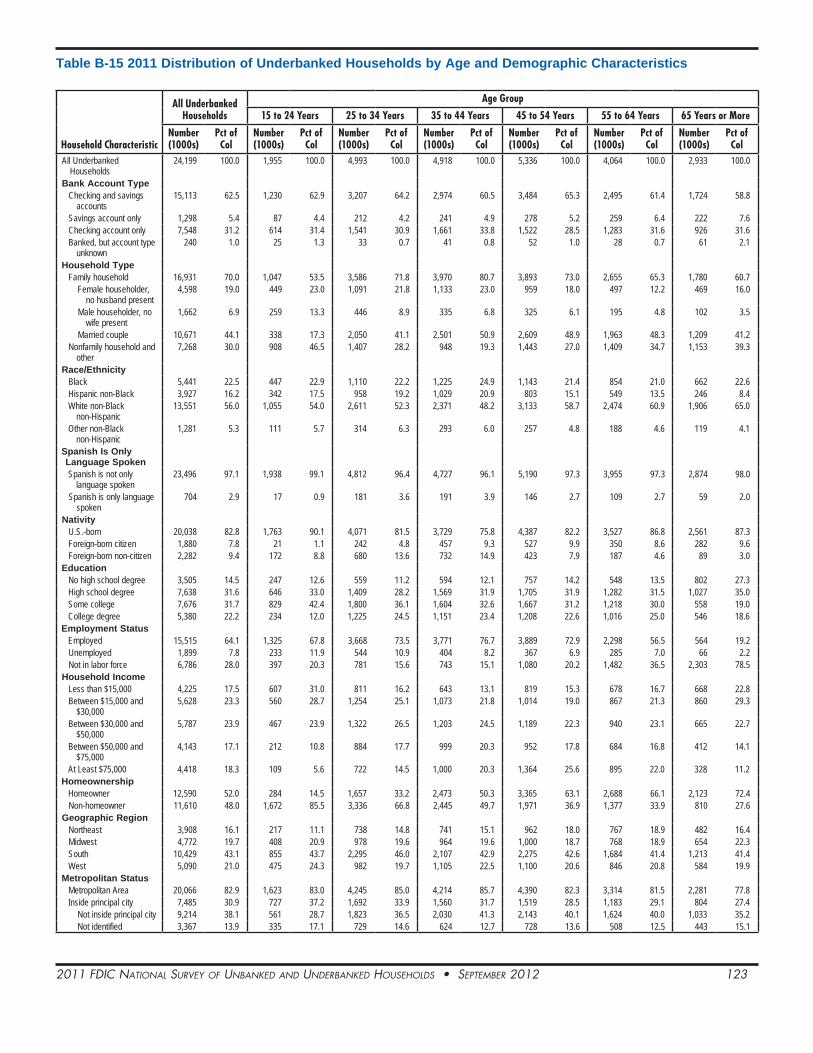
2011 FDIC NatIoNal Survey oF uNbaNkeD aND uNDerbaNkeD HouSeHolDS • September 2012 123
Table B-15 2011 Distribution of Underbanked Households by Age and Demographic Characteristics
Household Characteristic
All Underbanked Households
Age Group
15 to 24 Years 25 to 34 Years 35 to 44 Years 45 to 54 Years 55 to 64 Years 65 Years or More
Number (1000s)
Pct of Col
Number (1000s)
Pct of Col
Number (1000s)
Pct of Col
Number (1000s)
Pct of Col
Number (1000s)
Pct of Col
Number (1000s)
Pct of Col
Number (1000s)
Pct of Col
All Underbanked Households
24,199 100.0 1,955 100.0 4,993 100.0 4,918 100.0 5,336 100.0 4,064 100.0 2,933 100.0
Bank Account TypeChecking and savings
accounts15,113 62.5 1,230 62.9 3,207 64.2 2,974 60.5 3,484 65.3 2,495 61.4 1,724 58.8
Savings account only 1,298 5.4 87 4.4 212 4.2 241 4.9 278 5.2 259 6.4 222 7.6Checking account only 7,548 31.2 614 31.4 1,541 30.9 1,661 33.8 1,522 28.5 1,283 31.6 926 31.6Banked, but account type
unknown240 1.0 25 1.3 33 0.7 41 0.8 52 1.0 28 0.7 61 2.1
Household TypeFamily household 16,931 70.0 1,047 53.5 3,586 71.8 3,970 80.7 3,893 73.0 2,655 65.3 1,780 60.7
Female householder, no husband present
4,598 19.0 449 23.0 1,091 21.8 1,133 23.0 959 18.0 497 12.2 469 16.0
Male householder, no wife present
1,662 6.9 259 13.3 446 8.9 335 6.8 325 6.1 195 4.8 102 3.5
Married couple 10,671 44.1 338 17.3 2,050 41.1 2,501 50.9 2,609 48.9 1,963 48.3 1,209 41.2Nonfamily household and
other7,268 30.0 908 46.5 1,407 28.2 948 19.3 1,443 27.0 1,409 34.7 1,153 39.3
Race/EthnicityBlack 5,441 22.5 447 22.9 1,110 22.2 1,225 24.9 1,143 21.4 854 21.0 662 22.6Hispanic non-Black 3,927 16.2 342 17.5 958 19.2 1,029 20.9 803 15.1 549 13.5 246 8.4White non-Black
non-Hispanic13,551 56.0 1,055 54.0 2,611 52.3 2,371 48.2 3,133 58.7 2,474 60.9 1,906 65.0
Other non-Black non-Hispanic
1,281 5.3 111 5.7 314 6.3 293 6.0 257 4.8 188 4.6 119 4.1
Spanish Is Only Language SpokenSpanish is not only
language spoken23,496 97.1 1,938 99.1 4,812 96.4 4,727 96.1 5,190 97.3 3,955 97.3 2,874 98.0
Spanish is only language spoken
704 2.9 17 0.9 181 3.6 191 3.9 146 2.7 109 2.7 59 2.0
NativityU.S.-born 20,038 82.8 1,763 90.1 4,071 81.5 3,729 75.8 4,387 82.2 3,527 86.8 2,561 87.3Foreign-born citizen 1,880 7.8 21 1.1 242 4.8 457 9.3 527 9.9 350 8.6 282 9.6Foreign-born non-citizen 2,282 9.4 172 8.8 680 13.6 732 14.9 423 7.9 187 4.6 89 3.0
EducationNo high school degree 3,505 14.5 247 12.6 559 11.2 594 12.1 757 14.2 548 13.5 802 27.3High school degree 7,638 31.6 646 33.0 1,409 28.2 1,569 31.9 1,705 31.9 1,282 31.5 1,027 35.0Some college 7,676 31.7 829 42.4 1,800 36.1 1,604 32.6 1,667 31.2 1,218 30.0 558 19.0College degree 5,380 22.2 234 12.0 1,225 24.5 1,151 23.4 1,208 22.6 1,016 25.0 546 18.6
Employment StatusEmployed 15,515 64.1 1,325 67.8 3,668 73.5 3,771 76.7 3,889 72.9 2,298 56.5 564 19.2Unemployed 1,899 7.8 233 11.9 544 10.9 404 8.2 367 6.9 285 7.0 66 2.2Not in labor force 6,786 28.0 397 20.3 781 15.6 743 15.1 1,080 20.2 1,482 36.5 2,303 78.5
Household IncomeLess than $15,000 4,225 17.5 607 31.0 811 16.2 643 13.1 819 15.3 678 16.7 668 22.8Between $15,000 and
$30,0005,628 23.3 560 28.7 1,254 25.1 1,073 21.8 1,014 19.0 867 21.3 860 29.3
Between $30,000 and $50,000
5,787 23.9 467 23.9 1,322 26.5 1,203 24.5 1,189 22.3 940 23.1 665 22.7
Between $50,000 and $75,000
4,143 17.1 212 10.8 884 17.7 999 20.3 952 17.8 684 16.8 412 14.1
At Least $75,000 4,418 18.3 109 5.6 722 14.5 1,000 20.3 1,364 25.6 895 22.0 328 11.2Homeownership
Homeowner 12,590 52.0 284 14.5 1,657 33.2 2,473 50.3 3,365 63.1 2,688 66.1 2,123 72.4Non-homeowner 11,610 48.0 1,672 85.5 3,336 66.8 2,445 49.7 1,971 36.9 1,377 33.9 810 27.6
Geographic RegionNortheast 3,908 16.1 217 11.1 738 14.8 741 15.1 962 18.0 767 18.9 482 16.4Midwest 4,772 19.7 408 20.9 978 19.6 964 19.6 1,000 18.7 768 18.9 654 22.3South 10,429 43.1 855 43.7 2,295 46.0 2,107 42.9 2,275 42.6 1,684 41.4 1,213 41.4West 5,090 21.0 475 24.3 982 19.7 1,105 22.5 1,100 20.6 846 20.8 584 19.9
Metropolitan StatusMetropolitan Area 20,066 82.9 1,623 83.0 4,245 85.0 4,214 85.7 4,390 82.3 3,314 81.5 2,281 77.8Inside principal city 7,485 30.9 727 37.2 1,692 33.9 1,560 31.7 1,519 28.5 1,183 29.1 804 27.4
Not inside principal city 9,214 38.1 561 28.7 1,823 36.5 2,030 41.3 2,143 40.1 1,624 40.0 1,033 35.2Not identified 3,367 13.9 335 17.1 729 14.6 624 12.7 728 13.6 508 12.5 443 15.1

2011 FDIC NatIoNal Survey oF uNbaNkeD aND uNDerbaNkeD HouSeHolDS • September 2012 124
Household Characteristic
All Underbanked Households
Age Group
15 to 24 Years 25 to 34 Years 35 to 44 Years 45 to 54 Years 55 to 64 Years 65 Years or More
Number (1000s)
Pct of Col
Number (1000s)
Pct of Col
Number (1000s)
Pct of Col
Number (1000s)
Pct of Col
Number (1000s)
Pct of Col
Number (1000s)
Pct of Col
Number (1000s)
Pct of Col
Not in Metropolitan Area
3,857 15.9 321 16.4 689 13.8 635 12.9 891 16.7 700 17.2 622 21.2
Not Identified 276 1.1 11 0.6 59 1.2 69 1.4 56 1.0 50 1.2 30 1.0Notes:Figures do not always reconcile to totals because of rounding.
Table B-16 2011 Underbanked Households’ Use of AFS by Age
AFS Use
All Underbanked Households
Age Group
15 to 24 Years 25 to 34 Years 35 to 44 Years 45 to 54 Years 55 to 64 Years 65 Years or More
Number (1000s)
Pct of Col
Number (1000s)
Pct of Col
Number (1000s)
Pct of Col
Number (1000s)
Pct of Col
Number (1000s)
Pct of Col
Number (1000s)
Pct of Col
Number (1000s)
Pct of Col
Used Any AFSIn last 30 daysa 9,981 41.2 924 47.2 2,065 41.3 2,051 41.7 2,209 41.4 1,587 39.0 1,146 39.1In last 2-12 months 14,219 58.8 1,032 52.8 2,928 58.7 2,867 58.3 3,128 58.6 2,477 61.0 1,787 60.9Total 24,199 100.0 1,955 100.0 4,993 100.0 4,918 100.0 5,336 100.0 4,064 100.0 2,933 100.0
Used Transaction AFS in the Last yearb
Used AFS in the last year 21,874 90.4 1,798 92.0 4,443 89.0 4,342 88.3 4,804 90.0 3,730 91.8 2,757 94.0Did not use AFS last year 2,272 9.4 148 7.6 545 10.9 561 11.4 520 9.7 322 7.9 176 6.0Unknown 54 0.2 9 0.5 5 0.1 15 0.3 12 0.2 13 0.3 - -Total 24,199 100.0 1,955 100.0 4,993 100.0 4,918 100.0 5,336 100.0 4,064 100.0 2,933 100.0
Used Credit AFS in the Last yearc
Used AFS in the last year 5,583 23.1 559 28.6 1,412 28.3 1,378 28.0 1,145 21.5 704 17.3 385 13.1Did not use AFS last year 18,321 75.7 1,376 70.4 3,528 70.7 3,475 70.7 4,128 77.3 3,302 81.2 2,513 85.7Unknown 295 1.2 21 1.1 53 1.1 65 1.3 64 1.2 58 1.4 34 1.2Total 24,199 100.0 1,955 100.0 4,993 100.0 4,918 100.0 5,336 100.0 4,064 100.0 2,933 100.0
Number of Specific AFS Products Used in the Last YearUsed 1 AFS 17,186 71.0 1,276 65.2 3,188 63.9 3,323 67.6 3,794 71.1 3,155 77.6 2,450 83.6Used 2 or more AFS 6,508 26.9 636 32.5 1,718 34.4 1,498 30.5 1,430 26.8 816 20.1 411 14.0Unknown 505 2.1 44 2.2 87 1.7 97 2.0 113 2.1 94 2.3 71 2.4Total 24,199 100.0 1,955 100.0 4,993 100.0 4,918 100.0 5,336 100.0 4,064 100.0 2,933 100.0
Number of Specific AFS Products Used in the Last 30 Daysa
Used 1 AFS 8,276 82.9 746 80.8 1,654 80.1 1,678 81.8 1,824 82.6 1,369 86.3 1,004 87.6Used 2 or more AFS 1,505 15.1 166 18.0 396 19.2 315 15.4 356 16.1 156 9.8 117 10.2Unknown 200 2.0 12 1.3 14 0.7 58 2.8 29 1.3 62 3.9 25 2.2Total Households That
Used AFS In the Last 30 Days
9,981 100.0 924 100.0 2,065 100.0 2,051 100.0 2,209 100.0 1,587 100.0 1,146 100.0
Number of Times Transaction AFS Used in the Last 30 Daysb
Used 1 time 5,040 55.3 489 57.9 1,022 54.0 1,002 53.9 1,097 54.1 814 56.1 618 59.6Used 2 times 2,069 22.7 163 19.3 478 25.2 384 20.6 513 25.3 340 23.4 192 18.5Used 3 or more times 1,758 19.3 184 21.8 346 18.3 411 22.1 391 19.3 236 16.3 190 18.3Unknown 246 2.7 9 1.0 48 2.5 63 3.4 29 1.4 62 4.2 36 3.5Total Households That
Used Transaction AFS In the Last 30 Days
9,112 100.0 844 100.0 1,893 100.0 1,859 100.0 2,029 100.0 1,451 100.0 1,035 100.0
Notes:a The AFS included in this measure are non-bank money orders, non-bank check cashing, non-bank remittances, payday loans and pawn shop loans. Households were not asked whether they use rent-to-own agreements or refund anticipation loans in the last 30 days. b AFS transaction products are non-bank check cashing, non-bank money orders and non-bank remittances. c AFS credit products are payday loans, pawn shop loans, rent-to-own agreements and refund anticipation loans. - = For this table cell there were so few sample respondents (in some cases zero) reporting that the estimated universe proportion round to 0.0 percent. It is estimated that the true value is only slightly greater than zero. Figures do not always reconcile to totals because of rounding.
Table B-15 2011 Distribution of Underbanked Households by Age and Demographic Characteristics (continued)
2011 FDIC NatIoNal Survey oF uNbaNkeD aND uNDerbaNkeD HouSeHolDS • September 2012 125
Appendix C — State Tables

2011 FDIC NatIoNal Survey oF uNbaNkeD aND uNDerbaNkeD HouSeHolDS • September 2012 126
Table C-1 2011 Household Banking Status by State
Geography
All Households Unbanked
Has a Bank Account
Underbanked Fully Banked
Banked but Underbanked
Status UnknownNumber (1000s)
Pct of Row
Number (1000s)
Pct of Row
Number (1000s)
Pct of Row
Number (1000s)
Pct of Row
Number (1000s)
Pct of Row
All US Households 120,408 100.0 9,875 8.2 24,199 20.1 82,830 68.8 3,504 2.9Midwest 26,900 100.0 1,920 7.1 4,772 17.7 19,379 72.0 828 3.1
Illinois 4,956 100.0 374 7.6 879 17.7 3,546 71.6 156 3.2Indiana 2,560 100.0 201 7.8 489 19.1 1,817 71.0 53 2.1Iowa 1,244 100.0 54 4.4 215 17.2 932 74.9 43 3.5Kansas 1,136 100.0 81 7.1 223 19.7 814 71.6 18 1.6Michigan 3,969 100.0 307 7.7 685 17.3 2,824 71.2 153 3.9Minnesota 2,163 100.0 90 4.1 272 12.6 1,763 81.5 38 1.8Missouri 2,490 100.0 237 9.5 514 20.6 1,681 67.5 59 2.4Nebraska 734 100.0 27 3.7 130 17.8 559 76.2 17 2.3North Dakota 283 100.0 15 5.3 51 18.0 210 74.4 6 2.3Ohio 4,719 100.0 414 8.8 912 19.3 3,172 67.2 220 4.7South Dakota 329 100.0 15 4.4 72 22.0 236 71.6 6 1.9Wisconsin 2,316 100.0 105 4.5 329 14.2 1,823 78.7 58 2.5
Northeast 21,784 100.0 1,537 7.1 3,908 17.9 15,675 72.0 664 3.0Connecticut 1,365 100.0 73 5.3 208 15.2 1,056 77.3 28 2.1Maine 546 100.0 20 3.7 104 19.0 413 75.6 9 1.7Massachusetts 2,614 100.0 128 4.9 369 14.1 2,029 77.6 88 3.4New Hampshire 526 100.0 10 1.9 66 12.5 439 83.5 11 2.1New Jersey 3,202 100.0 212 6.6 621 19.4 2,297 71.7 73 2.3New York 7,677 100.0 740 9.6 1,487 19.4 5,159 67.2 291 3.8Pennsylvania 5,161 100.0 315 6.1 931 18.0 3,771 73.1 143 2.8Rhode Island 423 100.0 30 7.0 75 17.8 304 71.8 14 3.4Vermont 269 100.0 9 3.4 47 17.4 207 77.1 6 2.1
South 44,920 100.0 4,493 10.0 10,429 23.2 28,772 64.1 1,226 2.7Alabama 1,889 100.0 193 10.2 544 28.8 1,099 58.2 53 2.8Arkansas 1,142 100.0 141 12.3 321 28.1 658 57.6 22 1.9Delaware 346 100.0 23 6.7 54 15.5 262 75.9 7 1.9District of Columbia 281 100.0 31 10.9 63 22.3 180 63.9 8 2.9Florida 7,801 100.0 570 7.3 1,645 21.1 5,309 68.1 277 3.5Georgia 3,834 100.0 442 11.5 1,026 26.8 2,248 58.6 118 3.1Kentucky 1,819 100.0 179 9.9 391 21.5 1,225 67.3 24 1.3Louisiana 1,816 100.0 209 11.5 495 27.2 1,066 58.7 46 2.6Maryland 2,170 100.0 123 5.6 461 21.2 1,528 70.4 59 2.7Mississippi 1,143 100.0 173 15.1 269 23.6 696 60.9 6 0.5North Carolina 3,878 100.0 359 9.3 840 21.7 2,579 66.5 100 2.6Oklahoma 1,503 100.0 164 10.9 349 23.2 935 62.2 54 3.6South Carolina 1,787 100.0 166 9.3 369 20.6 1,219 68.2 34 1.9Tennessee 2,605 100.0 283 10.9 473 18.1 1,818 69.8 31 1.2Texas 9,136 100.0 1,167 12.8 2,481 27.2 5,309 58.1 180 2.0Virginia 3,008 100.0 199 6.6 503 16.7 2,138 71.1 168 5.6West Virginia 762 100.0 72 9.5 146 19.2 505 66.3 39 5.1
West 26,804 100.0 1,925 7.2 5,090 19.0 19,005 70.9 784 2.9Alaska 276 100.0 14 5.2 56 20.2 196 71.0 10 3.6Arizona 2,622 100.0 304 11.6 537 20.5 1,734 66.1 46 1.8California 13,191 100.0 1,030 7.8 2,374 18.0 9,355 70.9 432 3.3Colorado 1,974 100.0 107 5.4 317 16.1 1,510 76.5 40 2.0Hawaii 443 100.0 17 3.8 89 20.0 313 70.7 24 5.5Idaho 589 100.0 33 5.7 112 19.0 432 73.3 12 2.0Montana 426 100.0 21 4.8 93 22.0 303 71.2 9 2.0Nevada 1,035 100.0 77 7.5 323 31.2 600 58.0 35 3.3New Mexico 816 100.0 94 11.5 193 23.6 494 60.6 35 4.3Oregon 1,522 100.0 65 4.3 219 14.4 1,195 78.5 44 2.9Utah 926 100.0 26 2.8 195 21.0 694 74.9 12 1.2Washington 2,748 100.0 123 4.5 533 19.4 2,012 73.2 80 2.9Wyoming 236 100.0 14 5.8 50 21.1 167 70.6 6 2.6
Notes: Figures do not always reconcile to totals because of rounding.
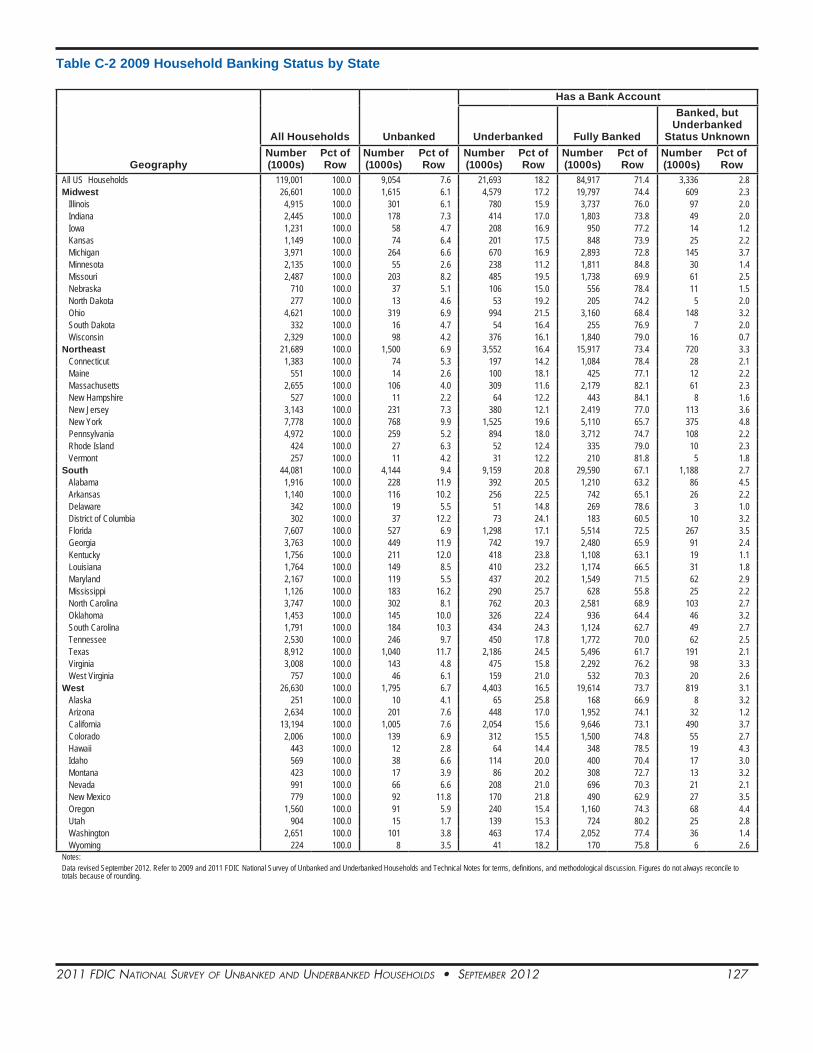
2011 FDIC NatIoNal Survey oF uNbaNkeD aND uNDerbaNkeD HouSeHolDS • September 2012 127
Table C-2 2009 Household Banking Status by State
Geography
All Households Unbanked
Has a Bank Account
Underbanked Fully Banked
Banked, but Underbanked
Status UnknownNumber (1000s)
Pct of Row
Number (1000s)
Pct of Row
Number (1000s)
Pct of Row
Number (1000s)
Pct of Row
Number (1000s)
Pct of Row
All US Households 119,001 100.0 9,054 7.6 21,693 18.2 84,917 71.4 3,336 2.8Midwest 26,601 100.0 1,615 6.1 4,579 17.2 19,797 74.4 609 2.3
Illinois 4,915 100.0 301 6.1 780 15.9 3,737 76.0 97 2.0Indiana 2,445 100.0 178 7.3 414 17.0 1,803 73.8 49 2.0Iowa 1,231 100.0 58 4.7 208 16.9 950 77.2 14 1.2Kansas 1,149 100.0 74 6.4 201 17.5 848 73.9 25 2.2Michigan 3,971 100.0 264 6.6 670 16.9 2,893 72.8 145 3.7Minnesota 2,135 100.0 55 2.6 238 11.2 1,811 84.8 30 1.4Missouri 2,487 100.0 203 8.2 485 19.5 1,738 69.9 61 2.5Nebraska 710 100.0 37 5.1 106 15.0 556 78.4 11 1.5North Dakota 277 100.0 13 4.6 53 19.2 205 74.2 5 2.0Ohio 4,621 100.0 319 6.9 994 21.5 3,160 68.4 148 3.2South Dakota 332 100.0 16 4.7 54 16.4 255 76.9 7 2.0Wisconsin 2,329 100.0 98 4.2 376 16.1 1,840 79.0 16 0.7
Northeast 21,689 100.0 1,500 6.9 3,552 16.4 15,917 73.4 720 3.3Connecticut 1,383 100.0 74 5.3 197 14.2 1,084 78.4 28 2.1Maine 551 100.0 14 2.6 100 18.1 425 77.1 12 2.2Massachusetts 2,655 100.0 106 4.0 309 11.6 2,179 82.1 61 2.3New Hampshire 527 100.0 11 2.2 64 12.2 443 84.1 8 1.6New Jersey 3,143 100.0 231 7.3 380 12.1 2,419 77.0 113 3.6New York 7,778 100.0 768 9.9 1,525 19.6 5,110 65.7 375 4.8Pennsylvania 4,972 100.0 259 5.2 894 18.0 3,712 74.7 108 2.2Rhode Island 424 100.0 27 6.3 52 12.4 335 79.0 10 2.3Vermont 257 100.0 11 4.2 31 12.2 210 81.8 5 1.8
South 44,081 100.0 4,144 9.4 9,159 20.8 29,590 67.1 1,188 2.7Alabama 1,916 100.0 228 11.9 392 20.5 1,210 63.2 86 4.5Arkansas 1,140 100.0 116 10.2 256 22.5 742 65.1 26 2.2Delaware 342 100.0 19 5.5 51 14.8 269 78.6 3 1.0District of Columbia 302 100.0 37 12.2 73 24.1 183 60.5 10 3.2Florida 7,607 100.0 527 6.9 1,298 17.1 5,514 72.5 267 3.5Georgia 3,763 100.0 449 11.9 742 19.7 2,480 65.9 91 2.4Kentucky 1,756 100.0 211 12.0 418 23.8 1,108 63.1 19 1.1Louisiana 1,764 100.0 149 8.5 410 23.2 1,174 66.5 31 1.8Maryland 2,167 100.0 119 5.5 437 20.2 1,549 71.5 62 2.9Mississippi 1,126 100.0 183 16.2 290 25.7 628 55.8 25 2.2North Carolina 3,747 100.0 302 8.1 762 20.3 2,581 68.9 103 2.7Oklahoma 1,453 100.0 145 10.0 326 22.4 936 64.4 46 3.2South Carolina 1,791 100.0 184 10.3 434 24.3 1,124 62.7 49 2.7Tennessee 2,530 100.0 246 9.7 450 17.8 1,772 70.0 62 2.5Texas 8,912 100.0 1,040 11.7 2,186 24.5 5,496 61.7 191 2.1Virginia 3,008 100.0 143 4.8 475 15.8 2,292 76.2 98 3.3West Virginia 757 100.0 46 6.1 159 21.0 532 70.3 20 2.6
West 26,630 100.0 1,795 6.7 4,403 16.5 19,614 73.7 819 3.1Alaska 251 100.0 10 4.1 65 25.8 168 66.9 8 3.2Arizona 2,634 100.0 201 7.6 448 17.0 1,952 74.1 32 1.2California 13,194 100.0 1,005 7.6 2,054 15.6 9,646 73.1 490 3.7Colorado 2,006 100.0 139 6.9 312 15.5 1,500 74.8 55 2.7Hawaii 443 100.0 12 2.8 64 14.4 348 78.5 19 4.3Idaho 569 100.0 38 6.6 114 20.0 400 70.4 17 3.0Montana 423 100.0 17 3.9 86 20.2 308 72.7 13 3.2Nevada 991 100.0 66 6.6 208 21.0 696 70.3 21 2.1New Mexico 779 100.0 92 11.8 170 21.8 490 62.9 27 3.5Oregon 1,560 100.0 91 5.9 240 15.4 1,160 74.3 68 4.4Utah 904 100.0 15 1.7 139 15.3 724 80.2 25 2.8Washington 2,651 100.0 101 3.8 463 17.4 2,052 77.4 36 1.4Wyoming 224 100.0 8 3.5 41 18.2 170 75.8 6 2.6
Notes: Data revised September 2012. Refer to 2009 and 2011 FDIC National Survey of Unbanked and Underbanked Households and Technical Notes for terms, definitions, and methodological discussion. Figures do not always reconcile to totals because of rounding.

2011 FDIC NatIoNal Survey oF uNbaNkeD aND uNDerbaNkeD HouSeHolDS • September 2012 128
Table C-3 Unbanked Status by Region and State and Year
Geography
Year
Estimated Difference
2009 2011Total
Households (1000s)
Unbanked Households
(1000s)Unbanked
(Pct.)
Total Households
(1000s)
Unbanked Households
(1000s)Unbanked
(Pct.)All US Households 119,003 9,054 7.6 120,408 9,875 8.2 0.6 *Midwest 26,601 1,615 6.1 26,900 1,920 7.1 1.1 *
Illinois 4,915 301 6.1 4,956 374 7.6 1.4Indiana 2,445 178 7.3 2,560 201 7.8 0.6Iowa 1,231 58 4.7 1,244 54 4.4 -0.4Kansas 1,149 74 6.4 1,136 81 7.1 0.7Michigan 3,971 264 6.6 3,969 307 7.7 1.1Minnesota 2,135 55 2.6 2,163 90 4.1 1.6 *Missouri 2,487 203 8.2 2,490 237 9.5 1.3Nebraska 710 37 5.1 734 27 3.7 -1.4North Dakota 277 13 4.6 283 15 5.3 0.7Ohio 4,621 319 6.9 4,719 414 8.8 1.9South Dakota 332 16 4.7 329 15 4.4 -0.3Wisconsin 2,329 98 4.2 2,316 105 4.5 0.3
Northeast 21,689 1,500 6.9 21,784 1,537 7.1 0.1Connecticut 1,383 74 5.3 1,365 73 5.3 0.0Maine 551 14 2.6 546 20 3.7 1.1Massachusetts 2,655 106 4.0 2,614 128 4.9 0.9New Hampshire 527 11 2.2 526 10 1.9 -0.3New Jersey 3,143 231 7.3 3,202 212 6.6 -0.7New York 7,778 768 9.9 7,677 740 9.6 -0.2Pennsylvania 4,972 259 5.2 5,161 315 6.1 0.9Rhode Island 424 27 6.3 423 30 7.0 0.7Vermont 257 11 4.2 269 9 3.4 -0.8
South 44,083 4,144 9.4 44,920 4,493 10.0 0.6Alabama 1,916 228 11.9 1,889 193 10.2 -1.7Arkansas 1,140 116 10.2 1,142 141 12.3 2.1Delaware 342 19 5.5 346 23 6.7 1.1District of Columbia 302 37 12.2 281 31 10.9 -1.4Florida 7,607 527 6.9 7,801 570 7.3 0.4Georgia 3,763 449 11.9 3,834 442 11.5 -0.4Kentucky 1,756 211 12.0 1,819 179 9.9 -2.1Louisiana 1,764 149 8.5 1,816 209 11.5 3.0Maryland 2,169 119 5.5 2,170 123 5.6 0.2Mississippi 1,126 183 16.2 1,143 173 15.1 -1.1North Carolina 3,747 302 8.1 3,878 359 9.3 1.2Oklahoma 1,453 145 10.0 1,503 164 10.9 0.9South Carolina 1,791 184 10.3 1,787 166 9.3 -1.0Tennessee 2,530 246 9.7 2,605 283 10.9 1.1Texas 8,912 1,040 11.7 9,136 1,167 12.8 1.1Virginia 3,008 143 4.8 3,008 199 6.6 1.9West Virginia 757 46 6.1 762 72 9.5 3.4 *
West 26,630 1,795 6.7 26,804 1,925 7.2 0.4Alaska 251 10 4.1 276 14 5.2 1.0Arizona 2,634 201 7.6 2,622 304 11.6 4.0California 13,194 1,005 7.6 13,191 1,030 7.8 0.2Colorado 2,006 139 6.9 1,974 107 5.4 -1.5Hawaii 443 12 2.8 443 17 3.8 1.0Idaho 569 38 6.6 589 33 5.7 -0.9Montana 423 17 3.9 426 21 4.8 0.9Nevada 991 66 6.6 1,035 77 7.5 0.8New Mexico 779 92 11.8 816 94 11.5 -0.3Oregon 1,560 91 5.9 1,522 65 4.3 -1.6Utah 904 15 1.7 926 26 2.8 1.1Washington 2,651 101 3.8 2,748 123 4.5 0.7Wyoming 224 8 3.5 236 14 5.8 2.3 *
Notes: Data revised September 2012. Refer to 2009 and 2011 FDIC National Survey of Unbanked and Underbanked Households and Technical Notes for terms, definitions, and methodological discussion. Figures do not always reconcile to totals because of rounding.* Indicates differences that are statistically significant at the 10% level.
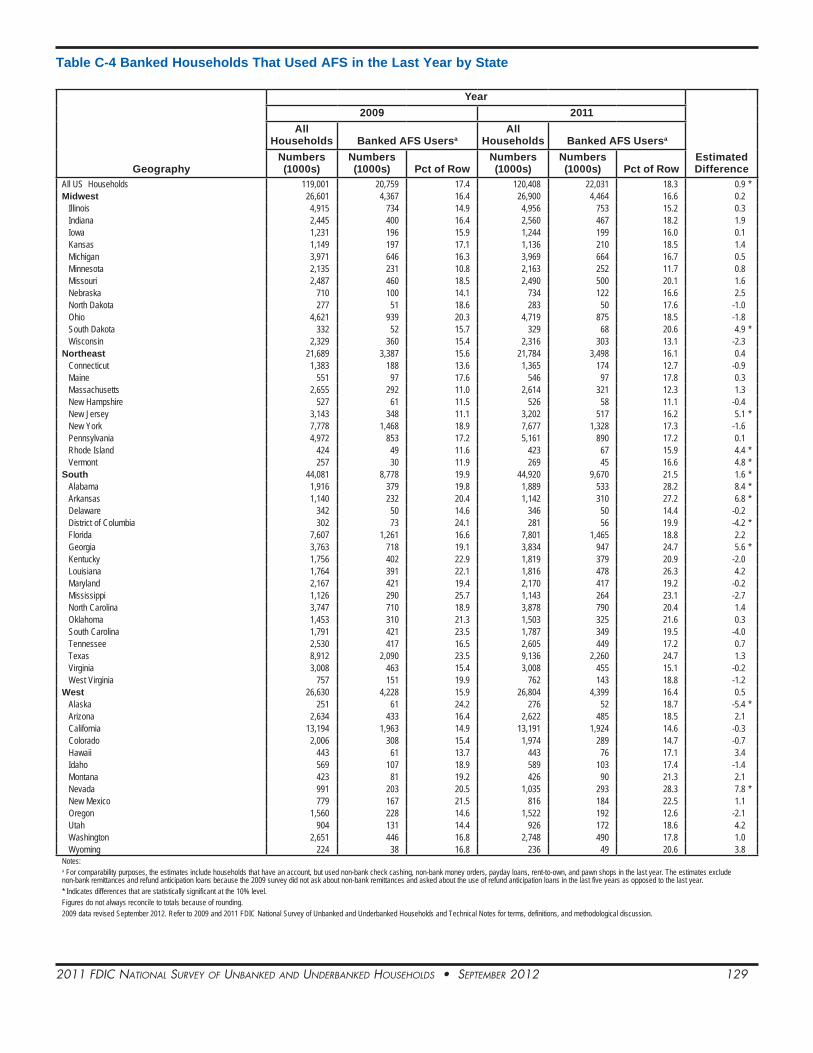
2011 FDIC NatIoNal Survey oF uNbaNkeD aND uNDerbaNkeD HouSeHolDS • September 2012 129
Table C-4 Banked Households That Used AFS in the Last Year by State
Geography
Year
Estimated Difference
2009 2011All
Households Banked AFS UsersaAll
Households Banked AFS Usersa
Numbers (1000s)
Numbers (1000s) Pct of Row
Numbers (1000s)
Numbers (1000s) Pct of Row
All US Households 119,001 20,759 17.4 120,408 22,031 18.3 0.9 *Midwest 26,601 4,367 16.4 26,900 4,464 16.6 0.2
Illinois 4,915 734 14.9 4,956 753 15.2 0.3Indiana 2,445 400 16.4 2,560 467 18.2 1.9Iowa 1,231 196 15.9 1,244 199 16.0 0.1Kansas 1,149 197 17.1 1,136 210 18.5 1.4Michigan 3,971 646 16.3 3,969 664 16.7 0.5Minnesota 2,135 231 10.8 2,163 252 11.7 0.8Missouri 2,487 460 18.5 2,490 500 20.1 1.6Nebraska 710 100 14.1 734 122 16.6 2.5North Dakota 277 51 18.6 283 50 17.6 -1.0Ohio 4,621 939 20.3 4,719 875 18.5 -1.8South Dakota 332 52 15.7 329 68 20.6 4.9 *Wisconsin 2,329 360 15.4 2,316 303 13.1 -2.3
Northeast 21,689 3,387 15.6 21,784 3,498 16.1 0.4Connecticut 1,383 188 13.6 1,365 174 12.7 -0.9Maine 551 97 17.6 546 97 17.8 0.3Massachusetts 2,655 292 11.0 2,614 321 12.3 1.3New Hampshire 527 61 11.5 526 58 11.1 -0.4New Jersey 3,143 348 11.1 3,202 517 16.2 5.1 *New York 7,778 1,468 18.9 7,677 1,328 17.3 -1.6Pennsylvania 4,972 853 17.2 5,161 890 17.2 0.1Rhode Island 424 49 11.6 423 67 15.9 4.4 *Vermont 257 30 11.9 269 45 16.6 4.8 *
South 44,081 8,778 19.9 44,920 9,670 21.5 1.6 *Alabama 1,916 379 19.8 1,889 533 28.2 8.4 *Arkansas 1,140 232 20.4 1,142 310 27.2 6.8 *Delaware 342 50 14.6 346 50 14.4 -0.2District of Columbia 302 73 24.1 281 56 19.9 -4.2 *Florida 7,607 1,261 16.6 7,801 1,465 18.8 2.2Georgia 3,763 718 19.1 3,834 947 24.7 5.6 *Kentucky 1,756 402 22.9 1,819 379 20.9 -2.0Louisiana 1,764 391 22.1 1,816 478 26.3 4.2Maryland 2,167 421 19.4 2,170 417 19.2 -0.2Mississippi 1,126 290 25.7 1,143 264 23.1 -2.7North Carolina 3,747 710 18.9 3,878 790 20.4 1.4Oklahoma 1,453 310 21.3 1,503 325 21.6 0.3South Carolina 1,791 421 23.5 1,787 349 19.5 -4.0Tennessee 2,530 417 16.5 2,605 449 17.2 0.7Texas 8,912 2,090 23.5 9,136 2,260 24.7 1.3Virginia 3,008 463 15.4 3,008 455 15.1 -0.2West Virginia 757 151 19.9 762 143 18.8 -1.2
West 26,630 4,228 15.9 26,804 4,399 16.4 0.5Alaska 251 61 24.2 276 52 18.7 -5.4 *Arizona 2,634 433 16.4 2,622 485 18.5 2.1California 13,194 1,963 14.9 13,191 1,924 14.6 -0.3Colorado 2,006 308 15.4 1,974 289 14.7 -0.7Hawaii 443 61 13.7 443 76 17.1 3.4Idaho 569 107 18.9 589 103 17.4 -1.4Montana 423 81 19.2 426 90 21.3 2.1Nevada 991 203 20.5 1,035 293 28.3 7.8 *New Mexico 779 167 21.5 816 184 22.5 1.1Oregon 1,560 228 14.6 1,522 192 12.6 -2.1Utah 904 131 14.4 926 172 18.6 4.2Washington 2,651 446 16.8 2,748 490 17.8 1.0Wyoming 224 38 16.8 236 49 20.6 3.8
Notes:a For comparability purposes, the estimates include households that have an account, but used non-bank check cashing, non-bank money orders, payday loans, rent-to-own, and pawn shops in the last year. The estimates exclude non-bank remittances and refund anticipation loans because the 2009 survey did not ask about non-bank remittances and asked about the use of refund anticipation loans in the last five years as opposed to the last year.* Indicates differences that are statistically significant at the 10% level.Figures do not always reconcile to totals because of rounding.2009 data revised September 2012. Refer to 2009 and 2011 FDIC National Survey of Unbanked and Underbanked Households and Technical Notes for terms, definitions, and methodological discussion.
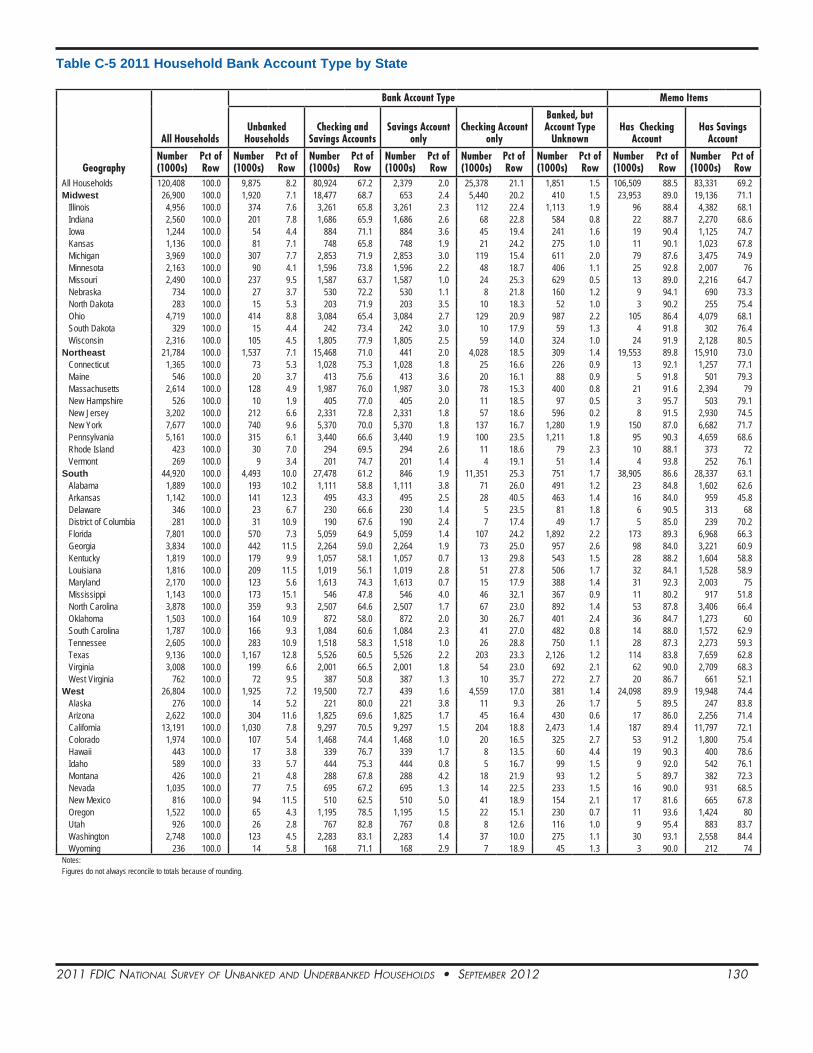
2011 FDIC NatIoNal Survey oF uNbaNkeD aND uNDerbaNkeD HouSeHolDS • September 2012 130
Table C-5 2011 Household Bank Account Type by State
Geography
All Households
Bank Account Type Memo Items
Unbanked Households
Checking and Savings Accounts
Savings Account only
Checking Account only
Banked, but Account Type
UnknownHas Checking
AccountHas Savings
Account
Number (1000s)
Pct of Row
Number (1000s)
Pct of Row
Number (1000s)
Pct of Row
Number (1000s)
Pct of Row
Number (1000s)
Pct of Row
Number (1000s)
Pct of Row
Number (1000s)
Pct of Row
Number (1000s)
Pct of Row
All Households 120,408 100.0 9,875 8.2 80,924 67.2 2,379 2.0 25,378 21.1 1,851 1.5 106,509 88.5 83,331 69.2Midwest 26,900 100.0 1,920 7.1 18,477 68.7 653 2.4 5,440 20.2 410 1.5 23,953 89.0 19,136 71.1
Illinois 4,956 100.0 374 7.6 3,261 65.8 3,261 2.3 112 22.4 1,113 1.9 96 88.4 4,382 68.1Indiana 2,560 100.0 201 7.8 1,686 65.9 1,686 2.6 68 22.8 584 0.8 22 88.7 2,270 68.6Iowa 1,244 100.0 54 4.4 884 71.1 884 3.6 45 19.4 241 1.6 19 90.4 1,125 74.7Kansas 1,136 100.0 81 7.1 748 65.8 748 1.9 21 24.2 275 1.0 11 90.1 1,023 67.8Michigan 3,969 100.0 307 7.7 2,853 71.9 2,853 3.0 119 15.4 611 2.0 79 87.6 3,475 74.9Minnesota 2,163 100.0 90 4.1 1,596 73.8 1,596 2.2 48 18.7 406 1.1 25 92.8 2,007 76Missouri 2,490 100.0 237 9.5 1,587 63.7 1,587 1.0 24 25.3 629 0.5 13 89.0 2,216 64.7Nebraska 734 100.0 27 3.7 530 72.2 530 1.1 8 21.8 160 1.2 9 94.1 690 73.3North Dakota 283 100.0 15 5.3 203 71.9 203 3.5 10 18.3 52 1.0 3 90.2 255 75.4Ohio 4,719 100.0 414 8.8 3,084 65.4 3,084 2.7 129 20.9 987 2.2 105 86.4 4,079 68.1South Dakota 329 100.0 15 4.4 242 73.4 242 3.0 10 17.9 59 1.3 4 91.8 302 76.4Wisconsin 2,316 100.0 105 4.5 1,805 77.9 1,805 2.5 59 14.0 324 1.0 24 91.9 2,128 80.5
Northeast 21,784 100.0 1,537 7.1 15,468 71.0 441 2.0 4,028 18.5 309 1.4 19,553 89.8 15,910 73.0Connecticut 1,365 100.0 73 5.3 1,028 75.3 1,028 1.8 25 16.6 226 0.9 13 92.1 1,257 77.1Maine 546 100.0 20 3.7 413 75.6 413 3.6 20 16.1 88 0.9 5 91.8 501 79.3Massachusetts 2,614 100.0 128 4.9 1,987 76.0 1,987 3.0 78 15.3 400 0.8 21 91.6 2,394 79New Hampshire 526 100.0 10 1.9 405 77.0 405 2.0 11 18.5 97 0.5 3 95.7 503 79.1New Jersey 3,202 100.0 212 6.6 2,331 72.8 2,331 1.8 57 18.6 596 0.2 8 91.5 2,930 74.5New York 7,677 100.0 740 9.6 5,370 70.0 5,370 1.8 137 16.7 1,280 1.9 150 87.0 6,682 71.7Pennsylvania 5,161 100.0 315 6.1 3,440 66.6 3,440 1.9 100 23.5 1,211 1.8 95 90.3 4,659 68.6Rhode Island 423 100.0 30 7.0 294 69.5 294 2.6 11 18.6 79 2.3 10 88.1 373 72Vermont 269 100.0 9 3.4 201 74.7 201 1.4 4 19.1 51 1.4 4 93.8 252 76.1
South 44,920 100.0 4,493 10.0 27,478 61.2 846 1.9 11,351 25.3 751 1.7 38,905 86.6 28,337 63.1Alabama 1,889 100.0 193 10.2 1,111 58.8 1,111 3.8 71 26.0 491 1.2 23 84.8 1,602 62.6Arkansas 1,142 100.0 141 12.3 495 43.3 495 2.5 28 40.5 463 1.4 16 84.0 959 45.8Delaware 346 100.0 23 6.7 230 66.6 230 1.4 5 23.5 81 1.8 6 90.5 313 68District of Columbia 281 100.0 31 10.9 190 67.6 190 2.4 7 17.4 49 1.7 5 85.0 239 70.2Florida 7,801 100.0 570 7.3 5,059 64.9 5,059 1.4 107 24.2 1,892 2.2 173 89.3 6,968 66.3Georgia 3,834 100.0 442 11.5 2,264 59.0 2,264 1.9 73 25.0 957 2.6 98 84.0 3,221 60.9Kentucky 1,819 100.0 179 9.9 1,057 58.1 1,057 0.7 13 29.8 543 1.5 28 88.2 1,604 58.8Louisiana 1,816 100.0 209 11.5 1,019 56.1 1,019 2.8 51 27.8 506 1.7 32 84.1 1,528 58.9Maryland 2,170 100.0 123 5.6 1,613 74.3 1,613 0.7 15 17.9 388 1.4 31 92.3 2,003 75Mississippi 1,143 100.0 173 15.1 546 47.8 546 4.0 46 32.1 367 0.9 11 80.2 917 51.8North Carolina 3,878 100.0 359 9.3 2,507 64.6 2,507 1.7 67 23.0 892 1.4 53 87.8 3,406 66.4Oklahoma 1,503 100.0 164 10.9 872 58.0 872 2.0 30 26.7 401 2.4 36 84.7 1,273 60South Carolina 1,787 100.0 166 9.3 1,084 60.6 1,084 2.3 41 27.0 482 0.8 14 88.0 1,572 62.9Tennessee 2,605 100.0 283 10.9 1,518 58.3 1,518 1.0 26 28.8 750 1.1 28 87.3 2,273 59.3Texas 9,136 100.0 1,167 12.8 5,526 60.5 5,526 2.2 203 23.3 2,126 1.2 114 83.8 7,659 62.8Virginia 3,008 100.0 199 6.6 2,001 66.5 2,001 1.8 54 23.0 692 2.1 62 90.0 2,709 68.3West Virginia 762 100.0 72 9.5 387 50.8 387 1.3 10 35.7 272 2.7 20 86.7 661 52.1
West 26,804 100.0 1,925 7.2 19,500 72.7 439 1.6 4,559 17.0 381 1.4 24,098 89.9 19,948 74.4Alaska 276 100.0 14 5.2 221 80.0 221 3.8 11 9.3 26 1.7 5 89.5 247 83.8Arizona 2,622 100.0 304 11.6 1,825 69.6 1,825 1.7 45 16.4 430 0.6 17 86.0 2,256 71.4California 13,191 100.0 1,030 7.8 9,297 70.5 9,297 1.5 204 18.8 2,473 1.4 187 89.4 11,797 72.1Colorado 1,974 100.0 107 5.4 1,468 74.4 1,468 1.0 20 16.5 325 2.7 53 91.2 1,800 75.4Hawaii 443 100.0 17 3.8 339 76.7 339 1.7 8 13.5 60 4.4 19 90.3 400 78.6Idaho 589 100.0 33 5.7 444 75.3 444 0.8 5 16.7 99 1.5 9 92.0 542 76.1Montana 426 100.0 21 4.8 288 67.8 288 4.2 18 21.9 93 1.2 5 89.7 382 72.3Nevada 1,035 100.0 77 7.5 695 67.2 695 1.3 14 22.5 233 1.5 16 90.0 931 68.5New Mexico 816 100.0 94 11.5 510 62.5 510 5.0 41 18.9 154 2.1 17 81.6 665 67.8Oregon 1,522 100.0 65 4.3 1,195 78.5 1,195 1.5 22 15.1 230 0.7 11 93.6 1,424 80Utah 926 100.0 26 2.8 767 82.8 767 0.8 8 12.6 116 1.0 9 95.4 883 83.7Washington 2,748 100.0 123 4.5 2,283 83.1 2,283 1.4 37 10.0 275 1.1 30 93.1 2,558 84.4Wyoming 236 100.0 14 5.8 168 71.1 168 2.9 7 18.9 45 1.3 3 90.0 212 74
Notes: Figures do not always reconcile to totals because of rounding.

2011 FDIC NatIoNal Survey oF uNbaNkeD aND uNDerbaNkeD HouSeHolDS • September 2012 131
Appendix D — MSA Tables

2011 FDIC NatIoNal Survey oF uNbaNkeD aND uNDerbaNkeD HouSeHolDS • September 2012 132
Table D-1 2011 Household Banking Status by MSA
Geography
All Households Unbanked
Has a Bank Account
Underbanked Fully Banked
Banked but Underbanked
Status UnknownNumber (1000s)
Pct of Row
Number (1000s)
Pct of Row
Number (1000s)
Pct of Row
Number (1000s)
Pct of Row
Number (1000s)
Pct of Row
All Households 120,408 100.0 9,875 8.2 24,199 20.1 82,830 68.8 3,504 2.9Albuquerque, NM 419 100.0 30 7.2 95 22.6 283 67.6 11 2.6Allentown-Bethlehem-Easton, PA-NJ 389 100.0 21 5.5 85 21.8 262 67.4 21 5.4Atlanta-Sandy Springs-Marietta, GA^ 2,108 100.0 205 9.7 541 25.7 1,290 61.2 71 3.4Austin-Round Rock, TX 605 100.0 62 10.2 124 20.4 409 67.6 10 1.7Baltimore-Towson, MD 1,021 100.0 77 7.5 222 21.8 706 69.2 16 1.5Bangor, ME 63 100.0 2 3.9 17 27.1 43 68.0 1 1.0Birmingham-Hoover, AL 423 100.0 51 12.1 140 33.0 221 52.3 11 2.6Boise City-Nampa, ID^ 227 100.0 7 2.9 38 16.7 177 77.9 6 2.5Boston-Cambridge-Quincy, MA-NH 1,843 100.0 77 4.2 271 14.7 1,467 79.6 27 1.5Bridgeport-Stamford-Norwalk, CT 337 100.0 5 1.6 45 13.2 283 84.0 4 1.2Buffalo-Niagara Falls, NY 462 100.0 40 8.6 46 10.0 368 79.8 8 1.7Burlington-South Burlington, VT 84 100.0 1 1.7 13 14.9 69 81.7 1 1.7Charlotte-Gastonia-Concord, NC-SC^ 742 100.0 66 8.9 206 27.8 458 61.7 12 1.7Chicago-Naperville-Joliet, IL-IN-WI^ 3,429 100.0 294 8.6 561 16.4 2,460 71.7 113 3.3Cincinnati-Middletown, OH-KY-IN^ 823 100.0 84 10.3 127 15.5 565 68.6 46 5.6Cleveland-Elyria-Mentor, OH 909 100.0 77 8.5 164 18.1 638 70.3 29 3.1Colorado Springs, CO 222 100.0 20 9.1 25 11.2 171 77.1 6 2.5Columbia, SC 294 100.0 22 7.4 48 16.4 224 76.3 - -Columbus, OH^ 718 100.0 58 8.1 182 25.3 454 63.2 24 3.3Dallas-Fort Worth-Arlington, TX^ 2,433 100.0 239 9.8 670 27.5 1,488 61.1 37 1.5Denver-Aurora, CO 974 100.0 51 5.2 175 18.0 730 75.0 18 1.8Des Moines, IA 228 100.0 16 7.0 53 23.2 156 68.6 3 1.3Detroit-Warren-Livonia, MI 1,762 100.0 188 10.7 343 19.4 1,161 65.9 70 4.0Fargo, ND-MN^ 80 100.0 4 5.2 15 18.4 60 75.2 1 1.3Hartford-West Hartford-East Hartford, CT 437 100.0 23 5.3 59 13.6 344 78.8 10 2.4Honolulu, HI 315 100.0 9 2.8 64 20.2 223 70.9 19 6.1Houston-Baytown-Sugar Land, TX 2,215 100.0 264 11.9 630 28.4 1,264 57.1 56 2.5Indianapolis, IN 729 100.0 62 8.5 125 17.1 537 73.7 5 0.7Jacksonville, FL 600 100.0 36 6.0 150 25.0 414 68.9 - -Kansas City, MO-KS^ 849 100.0 85 10.0 172 20.3 581 68.5 11 1.3Las Vegas-Paradise, NM 727 100.0 45 6.2 241 33.2 417 57.3 24 3.4Little Rock-North Little Rock, AR^ 330 100.0 26 7.8 91 27.8 202 61.2 11 3.3Los Angeles-Long Beach-Santa Ana, CA 4,353 100.0 421 9.7 811 18.6 3,015 69.3 106 2.4Louisville, KY-IN^ 571 100.0 48 8.4 131 23.0 389 68.2 2 0.4Madison, WI 254 100.0 3 1.0 34 13.5 217 85.5 - -Memphis, TN-MS-AR^ 567 100.0 63 11.1 93 16.4 393 69.4 18 3.1Miami-Fort Lauderdale-Miami Beach, FL 2,285 100.0 206 9.0 509 22.3 1,478 64.7 92 4.0Milwaukee-Waukesha-West Allis, WI 627 100.0 68 10.8 79 12.6 460 73.3 20 3.3Minneapolis-St Paul-Bloomington, MN-WI^ 1,350 100.0 70 5.2 140 10.4 1,109 82.1 30 2.3Nashville-Davidson-Murfreesboro, TN^ 603 100.0 57 9.5 86 14.2 452 75.0 8 1.3New Haven, CT 224 100.0 11 4.8 42 18.6 163 72.7 9 3.9New Orleans-Metairie-Kenner, LA 507 100.0 63 12.4 118 23.2 314 61.9 12 2.5New York-Northern New Jersey-Long Island,
NY-NJ-PA^7,191 100.0 700 9.7 1,409 19.6 4,894 68.1 188 2.6
Oklahoma City, OK 529 100.0 49 9.3 139 26.4 313 59.2 27 5.1Omaha-Council Bluffs, NE-IA 338 100.0 14 4.2 51 15.1 265 78.4 8 2.2Orlando, FL 791 100.0 59 7.4 186 23.5 497 62.9 49 6.2Philadelphia-Camden-Wilmington, PA-NJ-DE 2,359 100.0 183 7.8 377 16.0 1,715 72.7 84 3.6Phoenix-Mesa-Scottsdale, AZ 1,710 100.0 181 10.6 324 18.9 1,174 68.7 31 1.8Pittsburgh, PA 1,004 100.0 34 3.4 196 19.5 744 74.1 31 3.1Portland-South Portland, ME 146 100.0 6 4.0 19 12.8 118 80.8 4 2.5Portland-Vancouver-Beaverton, OR-WA^ 858 100.0 26 3.1 121 14.1 690 80.4 21 2.4Providence-Fall River-Warwick, MA-RI 523 100.0 40 7.6 86 16.5 383 73.1 14 2.7Raleigh-Cary, NC 470 100.0 12 2.6 73 15.5 372 79.3 13 2.7Reno-Sparks, NV 175 100.0 19 10.9 44 24.9 103 59.0 9 5.1Richmond, VA^ 522 100.0 31 6.0 113 21.6 345 66.2 33 6.3Riverside-San Bernardino, CA 1,384 100.0 176 12.7 309 22.3 874 63.1 25 1.8Rochester, NY 461 100.0 18 3.9 111 24.1 315 68.5 16 3.6Sacramento-Arden-Arcade Roseville, CA 827 100.0 44 5.4 175 21.2 607 73.5 - -Salt Lake City, UT^ 422 100.0 19 4.4 84 20.0 317 75.1 2 0.5San Antonio, TX 791 100.0 123 15.5 206 26.0 458 57.9 4 0.5San Diego-Carlsbad-San Marcos, CA 1,090 100.0 49 4.5 195 17.9 780 71.6 66 6.0San Francisco-Oakland-Fremont, CA 1,853 100.0 108 5.9 229 12.3 1,412 76.2 103 5.6

2011 FDIC NatIoNal Survey oF uNbaNkeD aND uNDerbaNkeD HouSeHolDS • September 2012 133
Table D-1 2011 Household Banking Status by MSA (continued)
Geography
All Households Unbanked
Has a Bank Account
Underbanked Fully Banked
Banked but Underbanked
Status UnknownNumber (1000s)
Pct of Row
Number (1000s)
Pct of Row
Number (1000s)
Pct of Row
Number (1000s)
Pct of Row
Number (1000s)
Pct of Row
San Jose-Sunnyvale-Santa Clara, CA 694 100.0 17 2.4 80 11.6 567 81.8 29 4.2Seattle-Tacoma-Bellevue, WA 1,464 100.0 59 4.0 254 17.4 1,116 76.2 35 2.4Sioux Falls, SD 102 100.0 5 5.2 21 21.1 73 72.2 2 1.5St. Louis, MO-IL^ 1,140 100.0 111 9.7 229 20.1 761 66.8 39 3.4Tampa-St. Petersburg-Clearwater, FL 1,298 100.0 77 6.0 283 21.8 899 69.2 39 3.0Tulsa, OK^ 430 100.0 50 11.7 82 19.1 292 67.9 5 1.3Virginia Beach-Norfolk-Newport News, VA-NC^ 626 100.0 36 5.8 189 30.2 366 58.4 35 5.5Washington-Arlington-Alexandria, DC-VA-MD-WV^ 2,148 100.0 100 4.6 362 16.9 1,572 73.2 115 5.3Wichita, KS 229 100.0 34 14.8 70 30.6 125 54.6 0 -
Notes: Figures do not always reconcile to totals because of rounding.- = For this table cell there were so few sample respondents (in some cases zero) reporting that the estimated universe proportion round to 0.0 percent. It is estimated that the true value is only slightly greater than zero.^ For the MSA results presented in this table, response data may not be included for a few of the smaller counties included in the official MSA definitions prepared by OMB.
Geography
All Households Unbanked
Has a Bank Account
Underbanked Fully Banked
Banked but Underbanked
Status UnknownNumber (1000s)
Pct of Row
Number (1000s)
Pct of Row
Number (1000s)
Pct of Row
Number (1000s)
Pct of Row
Number (1000s)
Pct of Row
All Households 119,001 100.0 9,054 7.6 21,693 18.2 84,917 71.4 3,336 2.8Albany-Schenectady-Troy, NY 373 100.0 24 6.4 82 22.1 247 66.2 20 5.3Albuquerque, NM 369 100.0 37 10.2 80 21.6 237 64.4 14 3.9Allentown-Bethlehem-Easton, PA-NJ 339 100.0 15 4.4 55 16.2 266 78.5 3 1.0Atlanta-Sandy Springs-Marietta, GA^ 2,122 100.0 185 8.7 418 19.7 1,457 68.6 62 2.9Austin-Round Rock, TX 675 100.0 37 5.5 147 21.8 491 72.7 - -Baltimore-Towson, MD 1,039 100.0 69 6.6 225 21.6 729 70.1 17 1.6Bangor, ME 64 100.0 2 3.3 16 24.7 43 67.8 3 4.1Birmingham-Hoover, AL 521 100.0 54 10.4 95 18.3 336 64.5 35 6.7Boise City-Nampa, ID^ 211 100.0 11 5.2 37 17.5 155 73.7 8 3.6Boston-Cambridge-Quincy, MA-NH 1,794 100.0 68 3.8 210 11.7 1,456 81.1 61 3.4Bridgeport-Stamford-Norwalk, CT 346 100.0 14 4.1 39 11.4 287 82.9 6 1.6Buffalo-Niagara Falls, NY 477 100.0 40 8.4 85 17.8 342 71.7 10 2.1Burlington-South Burlington, VT 74 100.0 3 3.9 9 11.7 61 82.7 1 1.7Charlotte-Gastonia-Concord, NC-SC^ 764 100.0 84 11.0 204 26.7 470 61.6 6 0.7Chicago-Naperville-Joliet, IL-IN-WI^ 3,355 100.0 245 7.3 470 14.0 2,565 76.5 75 2.2Cincinnati-Middletown, OH-KY-IN^ 812 100.0 99 12.2 183 22.5 504 62.0 27 3.3Cleveland-Elyria-Mentor, OH 862 100.0 54 6.3 123 14.3 661 76.7 23 2.6Colorado Springs, CO 238 100.0 16 6.7 29 12.4 171 72.0 21 8.9Columbia, SC 328 100.0 20 6.1 84 25.6 210 63.8 15 4.5Columbus, OH^ 731 100.0 44 6.1 181 24.8 487 66.7 18 2.4Dallas-Fort Worth-Arlington, TX^ 2,312 100.0 249 10.8 555 24.0 1,455 62.9 52 2.3Denver-Aurora, CO 1,021 100.0 92 9.1 137 13.4 779 76.3 12 1.2Des Moines, IA 208 100.0 17 8.4 38 18.4 148 71.3 4 1.8Detroit-Warren-Livonia, MI 1,737 100.0 169 9.7 315 18.1 1,205 69.4 48 2.7Fargo, ND-MN^ 64 100.0 2 3.5 15 23.8 45 71.1 1 1.6Grand Rapids-Wyoming, MI 381 100.0 18 4.7 51 13.4 291 76.4 21 5.6Hartford-West Hartford-East Hartford, CT 450 100.0 23 5.1 62 13.7 364 80.7 2 0.5Honolulu, HI 321 100.0 6 1.8 40 12.5 262 81.6 13 4.2Houston-Baytown-Sugar Land, TX 2,023 100.0 212 10.5 432 21.4 1,294 63.9 85 4.2Indianapolis, IN 705 100.0 71 10.1 89 12.6 514 72.9 30 4.3Jacksonville, FL 612 100.0 29 4.7 146 23.9 419 68.5 18 2.9Kansas City, MO-KS^ 811 100.0 72 8.9 153 18.9 567 69.9 18 2.3Las Vegas-Paradise, NM 752 100.0 51 6.8 150 20.0 536 71.3 14 1.9Little Rock-North Little Rock, AR^ 318 100.0 23 7.2 80 25.1 205 64.5 10 3.2Los Angeles-Long Beach-Santa Ana, CA 4,468 100.0 399 8.9 665 14.9 3,231 72.3 173 3.9Louisville, KY-IN^ 450 100.0 35 7.7 79 17.6 336 74.7 - -Madison, WI 268 100.0 6 2.3 25 9.2 235 87.7 2 0.8Memphis, TN-MS-AR^ 561 100.0 96 17.1 100 17.8 338 60.4 27 4.7Miami-Fort Lauderdale-Miami Beach, FL 2,225 100.0 194 8.7 296 13.3 1,633 73.4 101 4.6Milwaukee-Waukesha-West Allis, WI 653 100.0 63 9.7 82 12.5 508 77.8 - -Minneapolis-St Paul-Bloomington, MN-WI^ 1,300 100.0 35 2.7 117 9.0 1,128 86.8 19 1.5
Table D-2 2009 Household Banking Status by MSA
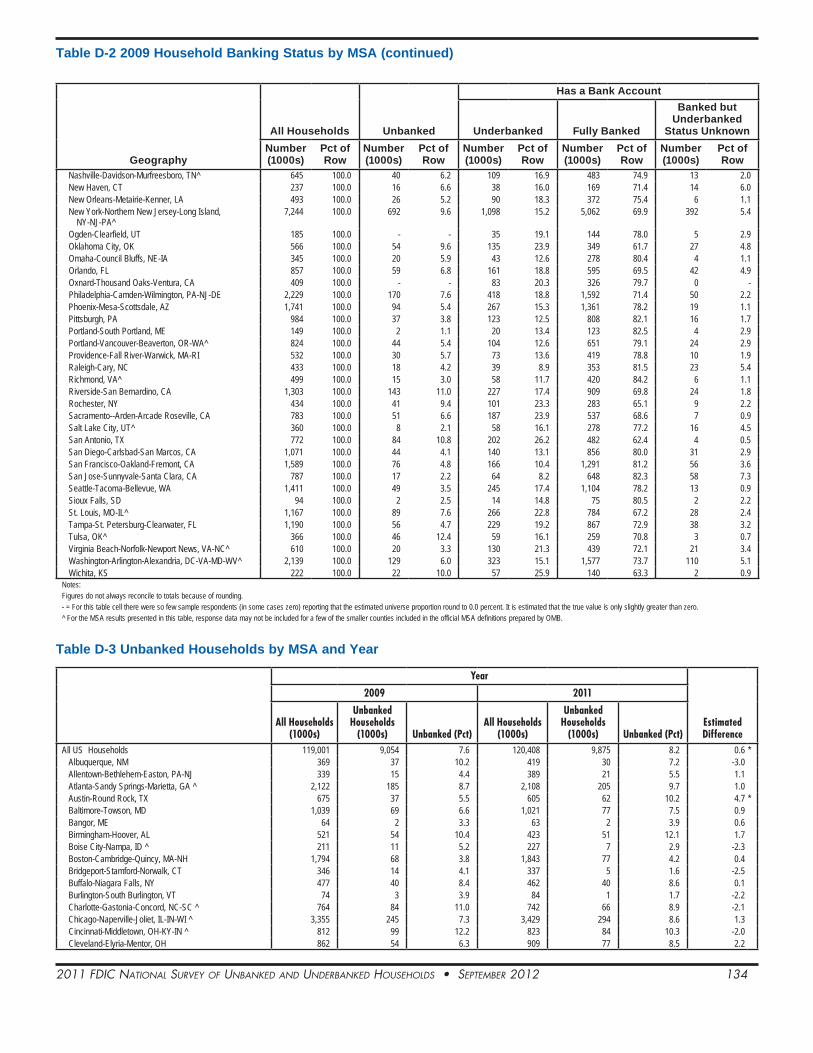
2011 FDIC NatIoNal Survey oF uNbaNkeD aND uNDerbaNkeD HouSeHolDS • September 2012 134
Table D-2 2009 Household Banking Status by MSA (continued)
Geography
All Households Unbanked
Has a Bank Account
Underbanked Fully Banked
Banked but Underbanked
Status UnknownNumber (1000s)
Pct of Row
Number (1000s)
Pct of Row
Number (1000s)
Pct of Row
Number (1000s)
Pct of Row
Number (1000s)
Pct of Row
Nashville-Davidson-Murfreesboro, TN^ 645 100.0 40 6.2 109 16.9 483 74.9 13 2.0New Haven, CT 237 100.0 16 6.6 38 16.0 169 71.4 14 6.0New Orleans-Metairie-Kenner, LA 493 100.0 26 5.2 90 18.3 372 75.4 6 1.1New York-Northern New Jersey-Long Island,
NY-NJ-PA^7,244 100.0 692 9.6 1,098 15.2 5,062 69.9 392 5.4
Ogden-Clearfield, UT 185 100.0 - - 35 19.1 144 78.0 5 2.9Oklahoma City, OK 566 100.0 54 9.6 135 23.9 349 61.7 27 4.8Omaha-Council Bluffs, NE-IA 345 100.0 20 5.9 43 12.6 278 80.4 4 1.1Orlando, FL 857 100.0 59 6.8 161 18.8 595 69.5 42 4.9Oxnard-Thousand Oaks-Ventura, CA 409 100.0 - - 83 20.3 326 79.7 0 -Philadelphia-Camden-Wilmington, PA-NJ-DE 2,229 100.0 170 7.6 418 18.8 1,592 71.4 50 2.2Phoenix-Mesa-Scottsdale, AZ 1,741 100.0 94 5.4 267 15.3 1,361 78.2 19 1.1Pittsburgh, PA 984 100.0 37 3.8 123 12.5 808 82.1 16 1.7Portland-South Portland, ME 149 100.0 2 1.1 20 13.4 123 82.5 4 2.9Portland-Vancouver-Beaverton, OR-WA^ 824 100.0 44 5.4 104 12.6 651 79.1 24 2.9Providence-Fall River-Warwick, MA-RI 532 100.0 30 5.7 73 13.6 419 78.8 10 1.9Raleigh-Cary, NC 433 100.0 18 4.2 39 8.9 353 81.5 23 5.4Richmond, VA^ 499 100.0 15 3.0 58 11.7 420 84.2 6 1.1Riverside-San Bernardino, CA 1,303 100.0 143 11.0 227 17.4 909 69.8 24 1.8Rochester, NY 434 100.0 41 9.4 101 23.3 283 65.1 9 2.2Sacramento--Arden-Arcade Roseville, CA 783 100.0 51 6.6 187 23.9 537 68.6 7 0.9Salt Lake City, UT^ 360 100.0 8 2.1 58 16.1 278 77.2 16 4.5San Antonio, TX 772 100.0 84 10.8 202 26.2 482 62.4 4 0.5San Diego-Carlsbad-San Marcos, CA 1,071 100.0 44 4.1 140 13.1 856 80.0 31 2.9San Francisco-Oakland-Fremont, CA 1,589 100.0 76 4.8 166 10.4 1,291 81.2 56 3.6San Jose-Sunnyvale-Santa Clara, CA 787 100.0 17 2.2 64 8.2 648 82.3 58 7.3Seattle-Tacoma-Bellevue, WA 1,411 100.0 49 3.5 245 17.4 1,104 78.2 13 0.9Sioux Falls, SD 94 100.0 2 2.5 14 14.8 75 80.5 2 2.2St. Louis, MO-IL^ 1,167 100.0 89 7.6 266 22.8 784 67.2 28 2.4Tampa-St. Petersburg-Clearwater, FL 1,190 100.0 56 4.7 229 19.2 867 72.9 38 3.2Tulsa, OK^ 366 100.0 46 12.4 59 16.1 259 70.8 3 0.7Virginia Beach-Norfolk-Newport News, VA-NC^ 610 100.0 20 3.3 130 21.3 439 72.1 21 3.4Washington-Arlington-Alexandria, DC-VA-MD-WV^ 2,139 100.0 129 6.0 323 15.1 1,577 73.7 110 5.1Wichita, KS 222 100.0 22 10.0 57 25.9 140 63.3 2 0.9
Notes: Figures do not always reconcile to totals because of rounding.- = For this table cell there were so few sample respondents (in some cases zero) reporting that the estimated universe proportion round to 0.0 percent. It is estimated that the true value is only slightly greater than zero.^ For the MSA results presented in this table, response data may not be included for a few of the smaller counties included in the official MSA definitions prepared by OMB.
Year
Estimated Difference
2009 2011
All Households (1000s)
Unbanked Households
(1000s) Unbanked (Pct)All Households
(1000s)
Unbanked Households
(1000s) Unbanked (Pct)All US Households 119,001 9,054 7.6 120,408 9,875 8.2 0.6 *
Albuquerque, NM 369 37 10.2 419 30 7.2 -3.0Allentown-Bethlehem-Easton, PA-NJ 339 15 4.4 389 21 5.5 1.1Atlanta-Sandy Springs-Marietta, GA ^ 2,122 185 8.7 2,108 205 9.7 1.0Austin-Round Rock, TX 675 37 5.5 605 62 10.2 4.7 *Baltimore-Towson, MD 1,039 69 6.6 1,021 77 7.5 0.9Bangor, ME 64 2 3.3 63 2 3.9 0.6Birmingham-Hoover, AL 521 54 10.4 423 51 12.1 1.7Boise City-Nampa, ID ^ 211 11 5.2 227 7 2.9 -2.3Boston-Cambridge-Quincy, MA-NH 1,794 68 3.8 1,843 77 4.2 0.4Bridgeport-Stamford-Norwalk, CT 346 14 4.1 337 5 1.6 -2.5Buffalo-Niagara Falls, NY 477 40 8.4 462 40 8.6 0.1Burlington-South Burlington, VT 74 3 3.9 84 1 1.7 -2.2Charlotte-Gastonia-Concord, NC-SC ^ 764 84 11.0 742 66 8.9 -2.1Chicago-Naperville-Joliet, IL-IN-WI ^ 3,355 245 7.3 3,429 294 8.6 1.3Cincinnati-Middletown, OH-KY-IN ^ 812 99 12.2 823 84 10.3 -2.0Cleveland-Elyria-Mentor, OH 862 54 6.3 909 77 8.5 2.2
Table D-3 Unbanked Households by MSA and Year

2011 FDIC NatIoNal Survey oF uNbaNkeD aND uNDerbaNkeD HouSeHolDS • September 2012 135
Table D-3 Unbanked Households by MSA and Year (continued)
Year
Estimated Difference
2009 2011
All Households (1000s)
Unbanked Households
(1000s) Unbanked (Pct)All Households
(1000s)
Unbanked Households
(1000s) Unbanked (Pct)Colorado Springs, CO 238 16 6.7 222 20 9.1 2.4Columbia, SC 328 20 6.1 294 22 7.4 1.3Columbus, OH ^ 731 44 6.1 718 58 8.1 2.0Dallas-Fort Worth-Arlington, TX ^ 2,312 249 10.8 2,433 239 9.8 -1.0Denver-Aurora, CO 1,021 92 9.1 974 51 5.2 -3.9 *Des Moines, IA 208 17 8.4 228 16 7.0 -1.4Detroit-Warren-Livonia, MI 1,737 169 9.7 1,762 188 10.7 1.0Fargo, ND-MN ^ 64 2 3.5 80 4 5.2 1.7Hartford-West Hartford-East Hartford, CT 450 23 5.1 437 23 5.3 0.2Honolulu, HI 321 6 1.8 315 9 2.8 1.0Houston-Baytown-Sugar Land, TX 2,023 212 10.5 2,215 264 11.9 1.4Indianapolis, IN 705 71 10.1 729 62 8.5 -1.6Jacksonville, FL 612 29 4.7 600 36 6.0 1.3Kansas City, MO-KS ^ 811 72 8.9 849 85 10.0 1.1Las Vegas-Paradise, NM 752 51 6.8 727 45 6.2 -0.7Little Rock-North Little Rock, AR ^ 318 23 7.2 330 26 7.8 0.6Los Angeles-Long Beach-Santa Ana, CA 4,468 399 8.9 4,353 421 9.7 0.7Louisville, KY-IN ^ 450 35 7.7 571 48 8.4 0.7Madison, WI 268 6 2.3 254 3 1.0 -1.3Memphis, TN-MS-AR ^ 561 96 17.1 567 63 11.1 -6.0Miami-Fort Lauderdale-Miami Beach, FL 2,225 194 8.7 2,285 206 9.0 0.3Milwaukee-Waukesha-West Allis, WI 653 63 9.7 627 68 10.8 1.1Minneapolis-St Paul-Bloomington, MN-WI ^ 1,300 35 2.7 1,350 70 5.2 2.5 *Nashville-Davidson-Murfreesboro, TN ^ 645 40 6.2 603 57 9.5 3.3New Haven, CT 237 16 6.6 224 11 4.8 -1.8New Orleans-Metairie-Kenner, LA 493 26 5.2 507 63 12.4 7.2 *New York-Northern New Jersey-Long Island, NY-NJ-PA ^ 7,244 692 9.6 7,191 700 9.7 0.2Oklahoma City, OK 566 54 9.6 529 49 9.3 -0.3Omaha-Council Bluffs, NE-IA 345 20 5.9 338 14 4.2 -1.7Orlando, FL 857 59 6.8 791 59 7.4 0.6Philadelphia-Camden-Wilmington, PA-NJ-DE 2,229 170 7.6 2,359 183 7.8 0.1Phoenix-Mesa-Scottsdale, AZ 1,741 94 5.4 1,710 181 10.6 5.2 *Pittsburgh, PA 984 37 3.8 1,004 34 3.4 -0.4Portland-South Portland, ME 149 2 1.1 146 6 4.0 2.9 *Portland-Vancouver-Beaverton, OR-WA ^ 824 44 5.4 858 26 3.1 -2.3Providence-Fall River-Warwick, MA-RI 532 30 5.7 523 40 7.6 2.0Raleigh-Cary, NC 433 18 4.2 470 12 2.6 -1.6Richmond, VA ^ 499 15 3.0 522 31 6.0 3.0Riverside-San Bernardino, CA 1,303 143 11.0 1,384 176 12.7 1.7Rochester, NY 434 41 9.4 461 18 3.9 -5.6 *Sacramento--Arden-Arcade Roseville, CA 783 51 6.6 827 44 5.4 -1.2Salt Lake City, UT ^ 360 8 2.1 422 19 4.4 2.3San Antonio, TX 772 84 10.8 791 123 15.5 4.7San Diego-Carlsbad-San Marcos, CA 1,071 44 4.1 1,090 49 4.5 0.4San Francisco-Oakland-Fremont, CA 1,589 76 4.8 1,853 108 5.9 1.1San Jose-Sunnyvale-Santa Clara, CA 787 17 2.2 694 17 2.4 0.3Seattle-Tacoma-Bellevue, WA 1,411 49 3.5 1,464 59 4.0 0.6Sioux Falls, SD 94 2 2.5 102 5 5.2 2.8St. Louis, MO-IL ^ 1,167 89 7.6 1,140 111 9.7 2.1Tampa-St. Petersburg-Clearwater, FL 1,190 56 4.7 1,298 77 6.0 1.2Tulsa, OK ^ 366 46 12.4 430 50 11.7 -0.7Virginia Beach-Norfolk-Newport News, VA-NC ^ 610 20 3.3 626 36 5.8 2.5Washington-Arlington-Alexandria, DC-VA-MD-WV ^ 2,139 129 6.0 2,148 100 4.6 -1.4Wichita, KS 222 22 10.0 229 34 14.8 4.9
Notes: 2009 data revised September 2012. Refer to 2009 and 2011 FDIC National Survey of Unbanked and Underbanked Households and Technical Notes for terms, definitions, and methodological discussion. Figures do not always reconcile to totals because of rounding.* Indicates differences that are statistically significant at the 10% level. 2009 estimates have been revised based on new weights provided by Census.^ For the MSA results presented in the tables of this report, response data may not be included for a few of the smaller counties included in the official MSA definitions prepared by OMB. The reasons for such exclusions are given in Appendix E of the full report, FDIC Technical Notes.

2011 FDIC NatIoNal Survey oF uNbaNkeD aND uNDerbaNkeD HouSeHolDS • September 2012 136
Table D-4 Banked Households That Used AFS in the Last Year by Year and MSA
Geography
Year
Estimated Difference
2009 2011
All Households Banked AFS Usersa All Households Banked AFS Usersa
Numbers (1000s)
Numbers (1000s) Pct of Row
Numbers (1000s)
Numbers (1000s) Pct of Row
All Households 119,001 20,759 17.4 120,408 22,031 18.3 0.9 *Albuquerque, NM 369 77 20.9 419 91 21.6 0.7Allentown-Bethlehem-Easton, PA-NJ 339 55 16.2 389 81 20.7 4.5Atlanta-Sandy Springs-Marietta, GA^ 2,122 403 19.0 2,108 486 23.1 4.1 *Austin-Round Rock, TX 675 147 21.8 605 113 18.6 -3.2Baltimore-Towson, MD 1,039 213 20.5 1,021 196 19.2 -1.4Bangor, ME 64 15 23.8 63 17 27.1 3.3Birmingham-Hoover, AL 521 87 16.7 423 137 32.3 15.7 *Boise City-Nampa, ID^ 211 37 17.5 227 36 15.7 -1.7Boston-Cambridge-Quincy, MA-NH 1,794 205 11.4 1,843 243 13.2 1.7Bridgeport-Stamford-Norwalk, CT 346 38 10.8 337 30 8.9 -1.9Buffalo-Niagara Falls, NY 477 81 16.9 462 46 10.0 -7.0 *Burlington-South Burlington, VT 74 9 11.7 85 11 13.3 1.6Charlotte-Gastonia-Concord, NC-SC^ 764 194 25.3 742 193 26.0 0.7Chicago-Naperville-Joliet, IL-IN-WI^ 3,355 447 13.3 3,429 454 13.2 -0.1Cincinnati-Middletown, OH-KY-IN^ 812 171 21.1 823 127 15.5 -5.6 *Cleveland-Elyria-Mentor, OH 862 123 14.3 909 160 17.6 3.3Colorado Springs, CO 238 30 12.4 222 25 11.2 -1.1Columbia, SC 329 81 24.5 294 45 15.3 -9.2 *Columbus, OH^ 731 173 23.7 718 174 24.2 0.5Dallas-Fort Worth-Arlington, TX^ 2,312 545 23.6 2,433 618 25.4 1.8Denver-Aurora, CO 1,021 133 13.0 974 159 16.3 3.2 *Des Moines, IA 208 38 18.4 228 44 19.3 0.9Detroit-Warren-Livonia, MI 1,737 309 17.8 1,762 334 18.9 1.2Fargo, ND-MN^ 64 14 22.4 80 14 17.8 -4.6Hartford-West Hartford-East Hartford, CT 450 60 13.4 437 55 12.7 -0.8Honolulu, HI 321 38 11.9 315 52 16.4 4.6 *Houston-Baytown-Sugar Land, TX 2,023 406 20.0 2,215 542 24.5 4.4 *Indianapolis, IN 705 86 12.2 729 121 16.6 4.5Jacksonville, FL 612 142 23.2 600 146 24.3 1.2Kansas City, MO-KS^ 811 149 18.3 849 169 19.9 1.6Las Vegas-Paradise, NM 752 150 20.0 727 224 30.8 10.9 *Little Rock-North Little Rock, AR^ 318 70 22.1 330 84 25.5 3.5Los Angeles-Long Beach-Santa Ana, CA 4,468 648 14.5 4,353 602 13.8 -0.7 *Louisville, KY-IN^ 450 77 17.1 571 120 21.0 3.9Madison, WI 268 25 9.2 254 27 10.6 1.3Memphis, TN-MS-AR^ 561 100 17.8 567 88 15.6 -2.2Miami-Fort Lauderdale-Miami Beach, FL 2,226 296 13.3 2,285 399 17.5 4.1 *Milwaukee-Waukesha-West Allis, WI 653 75 11.5 627 67 10.7 -0.8Minneapolis-St Paul-Bloomington, MN-WI^ 1,300 115 8.9 1,350 126 9.3 0.5Nashville-Davidson-Murfreesboro, TN^ 645 93 14.4 603 76 12.5 -1.8New Haven, CT 237 38 16.0 224 33 14.9 -1.2New Orleans-Metairie-Kenner, LA 493 79 15.9 507 112 22.1 6.2New York-Northern New Jersey-Long Island,
NY-NJ-PA^7,244 1,044 14.4 7,191 1,175 16.3 1.9 *
Oklahoma City, OK 566 133 23.4 529 132 24.9 1.5Omaha-Council Bluffs, NE-IA 346 39 11.3 338 45 13.3 1.9Orlando, FL 857 153 17.9 791 181 22.8 5.0Philadelphia-Camden-Wilmington, PA-NJ-DE 2,229 409 18.3 2,359 358 15.2 -3.2Phoenix-Mesa-Scottsdale, AZ 1,741 267 15.3 1,710 288 16.9 1.5Pittsburgh, PA 984 115 11.7 1,004 183 18.2 6.4 *Portland-South Portland, ME 149 20 13.4 146 18 12.4 -1.1Portland-Vancouver-Beaverton, OR-WA^ 824 98 11.9 858 103 12.0 0.2Providence-Fall River-Warwick, MA-RI 532 69 13.0 524 75 14.3 1.3Raleigh-Cary, NC 433 31 7.1 470 68 14.5 7.3Richmond, VA^ 499 53 10.5 522 92 17.6 7.1 *Riverside-San Bernardino, CA 1,303 215 16.5 1,384 269 19.5 3.0Rochester, NY 434 91 20.8 461 111 24.1 3.3Sacramento-Arden-Arcade Roseville, CA 783 174 22.3 827 159 19.3 -3.0Salt Lake City, UT^ 360 55 15.1 422 79 18.7 3.6San Antonio, TX 772 196 25.3 791 194 24.5 -0.9San Diego-Carlsbad-San Marcos, CA 1,071 133 12.4 1,090 159 14.6 2.2San Francisco-Oakland-Fremont, CA 1,589 159 10.0 1,853 169 9.1 -0.9San Jose-Sunnyvale-Santa Clara, CA 787 64 8.2 694 58 8.4 0.2

2011 FDIC NatIoNal Survey oF uNbaNkeD aND uNDerbaNkeD HouSeHolDS • September 2012 137
Geography
Year
Estimated Difference
2009 2011
All Households Banked AFS Usersa All Households Banked AFS Usersa
Numbers (1000s)
Numbers (1000s) Pct of Row
Numbers (1000s)
Numbers (1000s) Pct of Row
Seattle-Tacoma-Bellevue, WA 1,412 239 16.9 1,464 234 16.0 -0.9Sioux Falls, SD 94 13 13.4 102 20 19.3 5.9 *St. Louis, MO-IL^ 1,167 249 21.3 1,140 222 19.5 -1.8Tampa-St. Petersburg-Clearwater, FL 1,190 224 18.8 1,298 278 21.4 2.5Tulsa, OK^ 366 56 15.4 430 74 17.3 1.9Virginia Beach-Norfolk-Newport News, VA-NC^ 610 123 20.2 626 181 29.0 8.8 *Washington-Arlington-Alexandria, DC-VA-MD-WV^ 2,139 319 14.9 2,148 324 15.1 0.2Wichita, KS 222 57 25.9 229 70 30.6 4.7
Notes:a For comparability purposes, the estimates include households that have an account, but used non-bank check cashing, non-bank money orders, payday loans, rent-to-own, and pawn shops in the last year. The estimates exclude non-bank remittances and refund anticipation loans because the 2009 survey did not ask about non-bank remittances and asked about the use of refund anticipation loans in the last five years as opposed to the last year.* Indicates differences that are statistically significant at the 10% level.^ For the MSA results presented in the tables of this report, response data may not be included for a few of the smaller counties included in the official MSA definitions prepared by OMB. The reasons for such exclusions are given in Appendix E of the full report, FDIC Technical Notes.Data revised September 2012. Refer to 2009 and 2011 FDIC National Survey of Unbanked and Underbanked Households and Technical Notes for terms, definitions, and methodological discussion. Figures do not always reconcile to totals because of rounding.2009 data revised September 2012. Refer to 2009 and 2011 FDIC National Survey of Unbanked and Underbanked Households and Technical Notes for terms, definitions, and methodological discussion.
Table D-4 Banked Households That Used AFS in the Last Year by Year and MSA (continued)

2011 FDIC NatIoNal Survey oF uNbaNkeD aND uNDerbaNkeD HouSeHolDS • September 2012 138
Geography
All Households
Bank Account Type Memo Items
Unbanked Households
Checking and Savings Accounts
Savings Account Only
Checking Account Only
Banked, but Account Type
UnknownHas Checking
AccountHas Savings
Account
Number (1000s)
Pct of Row
Number (1000s)
Pct of Row
Number (1000s)
Pct of Row
Number (1000s)
Pct of Row
Number (1000s)
Pct of Row
Number (1000s)
Pct of Row
Number (1000s)
Pct of Row
Number (1000s)
Pct of Row
All Households 120,408 100.0 9,875 8.2 80,924 67.2 2,379 2.0 25,378 21.1 1,851 1.5 106,509 88.5 83,331 69.2Albuquerque, NM 419 100.0 30 7.2 308 73.6 24 5.8 47 11.3 9 2.1 357 85.2 333 79.4Allentown-Bethlehem-
Easton, PA-NJ389 100.0 21 5.5 297 76.4 3 0.8 47 12.2 20 5.1 344 88.6 300 77.2
Atlanta-Sandy Springs-Marietta, GA^
2,108 100.0 205 9.7 1,368 64.9 25 1.2 462 21.9 47 2.2 1,830 86.8 1,393 66.1
Austin-Round Rock, TX
605 100.0 62 10.2 443 73.2 19 3.1 73 12.1 8 1.3 516 85.4 465 76.9
Baltimore-Towson, MD
1,021 100.0 77 7.5 785 76.9 13 1.3 135 13.2 11 1.1 922 90.3 798 78.2
Bangor, ME 63 100.0 2 3.9 48 75.8 3 4.3 9 14.9 1 1.0 57 90.7 51 80.2Birmingham-Hoover,
AL423 100.0 51 12.1 242 57.2 9 2.0 114 26.9 7 1.7 356 84.1 251 59.2
Boise City-Nampa, ID^
227 100.0 7 2.9 167 73.6 1 0.5 47 20.5 6 2.5 214 94.1 168 74.1
Boston-Cambridge-Quincy, MA-NH
1,843 100.0 77 4.2 1,425 77.3 52 2.8 276 15.0 13 0.7 1,709 92.7 1,477 80.1
Bridgeport-Stamford-Norwalk, CT
337 100.0 5 1.6 276 82.0 7 2.0 44 13.2 4 1.2 321 95.2 283 84.1
Buffalo-Niagara Falls, NY
462 100.0 40 8.6 329 71.1 9 2.0 80 17.4 4 0.9 413 89.4 338 73.1
Burlington-South Burlington, VT
84 100.0 1 1.7 68 79.9 - - 13 15.7 2 2.2 81 95.6 68 80.4
Charlotte-Gastonia-Concord, NC-SC^
742 100.0 66 8.9 441 59.4 19 2.5 209 28.2 8 1.0 650 87.6 459 61.9
Chicago-Naperville-Joliet, IL-IN-WI^
3,429 100.0 294 8.6 2,247 65.5 48 1.4 759 22.1 81 2.4 3,006 87.7 2,295 66.9
Cincinnati-Middletown, OH-KY-IN^
823 100.0 84 10.3 476 57.8 23 2.8 203 24.6 37 4.5 679 82.5 499 60.6
Cleveland-Elyria-Mentor, OH
909 100.0 77 8.5 599 65.9 23 2.5 196 21.6 14 1.6 798 87.8 621 68.4
Colorado Springs, CO 222 100.0 20 9.1 169 76.3 2 1.1 26 11.5 4 1.9 199 89.8 172 77.4Columbia, SC 294 100.0 22 7.4 189 64.4 - - 83 28.2 - - 272 92.6 189 64.4Columbus, OH^ 718 100.0 58 8.1 512 71.4 3 0.5 132 18.4 12 1.6 645 89.8 516 71.8Dallas-Fort Worth-
Arlington, TX^2,433 100.0 239 9.8 1,625 66.8 37 1.5 510 21.0 23 0.9 2,135 87.7 1,661 68.3
Denver-Aurora, CO 974 100.0 51 5.2 737 75.7 9 0.9 135 13.8 43 4.4 874 89.7 745 76.5Des Moines, IA 228 100.0 16 7.0 159 69.6 9 3.9 41 17.8 4 1.6 200 87.5 168 73.6Detroit-Warren-Livo-
nia, MI1,762 100.0 188 10.7 1,231 69.9 32 1.8 280 15.9 32 1.8 1,514 85.9 1,263 71.7
Fargo, ND-MN^ 80 100.0 4 5.2 60 75.5 1 1.3 14 17.2 1 0.9 74 92.7 61 76.8Hartford-West Hart-
ford-East Hartford, CT
437 100.0 23 5.3 325 74.3 9 2.1 76 17.3 4 1.0 402 92.0 334 76.4
Honolulu, HI 315 100.0 9 2.8 251 79.8 2 0.8 36 11.3 17 5.3 287 91.3 254 80.8Houston-Baytown-
Sugar Land, TX2,215 100.0 264 11.9 1,346 60.8 43 1.9 523 23.6 39 1.8 1,869 84.4 1,389 62.7
Indianapolis, IN 729 100.0 62 8.5 478 65.6 8 1.1 181 24.8 - - 659 90.4 486 66.7Jacksonville, FL 600 100.0 36 6.0 499 83.1 10 1.7 47 7.8 9 1.4 545 90.9 509 84.8Kansas City, MO-KS^ 849 100.0 85 10.0 589 69.4 15 1.7 158 18.7 2 0.2 748 88.1 604 71.2Las Vegas-Paradise,
NM727 100.0 45 6.2 470 64.6 12 1.7 187 25.7 13 1.8 660 90.8 482 66.3
Little Rock-North Little Rock, AR^
330 100.0 26 7.8 139 42.1 7 2.2 151 46.0 6 1.8 292 88.7 146 44.4
Los Angeles-Long Beach-Santa Ana, CA
4,353 100.0 421 9.7 2,837 65.2 42 1.0 1,004 23.1 49 1.1 3,848 88.4 2,879 66.1
Louisville, KY-IN^ 571 100.0 48 8.4 356 62.4 - - 167 29.2 - - 522 91.6 356 62.4Madison, WI 254 100.0 3 1.0 214 84.2 - - 35 13.8 3 1.0 249 98.0 214 84.2Memphis, TN-MS-AR^ 567 100.0 63 11.1 309 54.4 13 2.3 172 30.2 11 1.9 480 84.7 322 56.7Miami-Fort Lauder-
dale-Miami Beach, FL
2,285 100.0 206 9.0 1,236 54.1 21 0.9 774 33.9 48 2.1 2,023 88.6 1,257 55.0
Milwaukee-Waukesha-West Allis, WI
627 100.0 68 10.8 447 71.3 3 0.6 100 15.9 9 1.5 546 87.1 450 71.8
Table D-5 2011 Household Bank Account Type by MSA

2011 FDIC NatIoNal Survey oF uNbaNkeD aND uNDerbaNkeD HouSeHolDS • September 2012 139
Geography
All Households
Bank Account Type Memo Items
Unbanked Households
Checking and Savings Accounts
Savings Account Only
Checking Account Only
Banked, but Account Type
UnknownHas Checking
AccountHas Savings
Account
Number (1000s)
Pct of Row
Number (1000s)
Pct of Row
Number (1000s)
Pct of Row
Number (1000s)
Pct of Row
Number (1000s)
Pct of Row
Number (1000s)
Pct of Row
Number (1000s)
Pct of Row
Number (1000s)
Pct of Row
Minneapolis-St Paul-Bloomington, MN-WI^
1,350 100.0 70 5.2 997 73.8 30 2.2 236 17.5 17 1.3 1,237 91.6 1,026 76.0
Nashville-Davidson-Murfreesboro, TN^
603 100.0 57 9.5 400 66.4 4 0.7 137 22.7 4 0.7 537 89.1 404 67.1
New Haven, CT 224 100.0 11 4.8 157 70.1 6 2.7 49 21.8 1 0.6 206 91.8 163 72.8New Orleans-Metairie-
Kenner, LA507 100.0 63 12.4 308 60.7 9 1.7 112 22.2 15 3.0 423 83.4 317 62.5
New York-Northern New Jersey-Long Island, NY-NJ-PA^
7,191 100.0 700 9.7 5,047 70.2 140 1.9 1,203 16.7 101 1.4 6,265 87.1 5,187 72.1
Oklahoma City, OK 529 100.0 49 9.3 330 62.4 10 2.0 118 22.3 21 4.0 448 84.7 340 64.4Omaha-Council Bluffs,
NE-IA338 100.0 14 4.2 257 76.2 2 0.5 59 17.6 5 1.5 317 93.8 259 76.8
Orlando, FL 791 100.0 59 7.4 561 70.9 9 1.1 117 14.8 45 5.8 678 85.7 569 72.0Philadelphia-Camden-
Wilmington, PA-NJ-DE
2,359 100.0 183 7.8 1,628 69.0 39 1.6 489 20.7 20 0.8 2,127 90.2 1,666 70.7
Phoenix-Mesa-Scotts-dale, AZ
1,710 100.0 181 10.6 1,255 73.4 21 1.2 240 14.0 13 0.8 1,495 87.4 1,276 74.6
Pittsburgh, PA 1,004 100.0 34 3.4 634 63.2 19 1.9 291 28.9 26 2.6 925 92.1 654 65.1Portland-South Port-
land, ME146 100.0 6 4.0 114 78.1 3 1.8 21 14.4 2 1.7 136 93.0 117 79.9
Portland-Vancouver-Beaverton, OR-WA^
858 100.0 26 3.1 691 80.6 4 0.5 136 15.8 - - 827 96.4 696 81.1
Providence-Fall River-Warwick, MA-RI
523 100.0 40 7.6 362 69.1 14 2.6 98 18.8 10 1.9 460 87.9 375 71.7
Raleigh-Cary, NC 470 100.0 12 2.6 336 71.6 7 1.5 105 22.4 9 1.9 445 94.8 343 73.1Reno-Sparks, NV 175 100.0 19 10.9 136 77.6 - - 17 9.9 3 1.6 153 87.5 136 77.6Richmond, VA^ 522 100.0 31 6.0 341 65.4 20 3.7 117 22.5 13 2.5 468 89.7 360 69.1Riverside-San
Bernardino, CA1,384 100.0 176 12.7 800 57.8 18 1.3 356 25.7 33 2.4 1,163 84.1 818 59.1
Rochester, NY 461 100.0 18 3.9 329 71.4 - - 102 22.1 12 2.6 439 95.3 329 71.4Sacramento-Arden-
Arcade Roseville, CA
827 100.0 44 5.4 623 75.4 7 0.9 139 16.9 13 1.5 771 93.2 631 76.3
Salt Lake City, UT^ 422 100.0 19 4.4 339 80.3 4 1.0 53 12.5 7 1.7 392 92.8 343 81.3San Antonio, TX 791 100.0 123 15.5 477 60.3 36 4.5 144 18.3 11 1.4 621 78.5 513 64.8San Diego-Carlsbad-
San Marcos, CA1,090 100.0 49 4.5 875 80.3 5 0.5 120 11.0 41 3.7 999 91.7 880 80.7
San Francisco-Oakland-Fremont, CA
1,853 100.0 108 5.9 1,430 77.2 39 2.1 256 13.8 20 1.1 1,685 91.0 1,468 79.3
San Jose-Sunnyvale-Santa Clara, CA
694 100.0 17 2.4 563 81.2 3 0.5 102 14.7 9 1.3 665 95.9 571 82.2
Seattle-Tacoma-Bellevue, WA
1,464 100.0 59 4.0 1,246 85.1 7 0.5 139 9.5 13 0.9 1,385 94.6 1,253 85.6
Sioux Falls, SD 102 100.0 5 5.2 78 76.8 2 1.7 16 16.0 - - 94 92.7 80 78.5St. Louis, MO-IL^ 1,140 100.0 111 9.7 763 66.9 14 1.3 242 21.2 10 0.9 1,005 88.1 777 68.2Tampa-St. Peters-
burg-Clearwater, FL1,298 100.0 77 6.0 925 71.2 13 1.0 265 20.4 18 1.4 1,190 91.7 942 72.6
Tulsa, OK^ 430 100.0 50 11.7 290 67.3 4 1.0 80 18.7 5 1.3 370 86.0 294 68.3Virginia Beach-
Norfolk-Newport News, VA-NC^
626 100.0 36 5.8 463 73.9 16 2.6 95 15.2 15 2.5 561 89.5 479 76.6
Washington-Arlington-Alexandria, DC-VA-MD-WV^
2,148 100.0 100 4.6 1,580 73.6 12 0.6 417 19.4 39 1.8 1,997 92.9 1,593 74.2
Wichita, KS 229 100.0 34 14.8 126 55.1 3 1.4 62 27.2 3 1.5 188 82.3 131 57.2Notes: Figures do not always reconcile to totals because of rounding.- = For this table cell there were so few sample respondents (in some cases zero) reporting that the estimated universe proportion round to 0.0 percent. It is estimated that the true value is only slightly greater than zero.^ For the MSA results presented in this table, response data may not be included for a few of the smaller counties included in the official MSA definitions prepared by OMB.
Table D-5 2011 Household Bank Account Type by MSA (continued)
2011 FDIC NatIoNal Survey oF uNbaNkeD aND uNDerbaNkeD HouSeHolDS • September 2012 140
Appendix E — FDIC Technical Notes
2011 FDIC NatIoNal Survey oF uNbaNkeD aND uNDerbaNkeD HouSeHolDS • September 2012 141
The data for this report were collected through a Federal Deposit Insurance Corporation (FDIC)-sponsored Unbanked/Underbanked Supplement to the Current Population Survey (CPS) for June 2011. The CPS is a monthly survey of about 54,000 interviewed households conducted by the US Census Bureau for the Bureau of Labor Statistics (BLS). The survey is based on a scientific sample that represents the US civilian, non-institutional-ized population, aged 15 or older.
The CPS is the primary source of information on the labor force characteristics of the US population, including employment, unemployment, and earnings statistics. The CPS results include a variety of demographic characteris-tics, such as age, sex, race, marital status, and educational attainment. Additional information about the CPS is provided in the Census Bureau’s Technical Paper 66, Design and Methodology of the CPS, available at http://www.census.gov/cps/.
The CPS is a state-based design in that separate samples are selected from each state, so that states serve as the primary sampling strata. The sample sizes for each state are set so that specific precision requirements for estimat-ing unemployment rates will be met.1 The sample design ensures that most of the households in a given state have the same probability of being selected, though in general, household selection probabilities will vary across states. Because the CPS design is state-based, most of the esti-mates for the Unbanked/Underbanked Supplement should be precise at the state level and for some sub-state areas (e.g., large metropolitan statistical areas [MSAs]).
Unbanked/Underbanked Supplement
The Unbanked/Underbanked Supplement was conducted in June 2011. This was the second time this survey had been conducted. The first Unbanked/Underbanked Supplement was conducted in January 2009. The primary purpose of the supplement is to estimate the percentage of US households that are “unbanked” and “underbanked” and to identify the reasons why. The supplement survey instrument used in 2011, attached as Appendix G, included approximately 40 questions designed to provide this information. The 2011 survey instrument is similar to the 2009 survey instrument that the FDIC developed with the expertise of a national consulting firm, which special-izes in public opinion research, as well as input from the Census Bureau’s Demographic Surveys Division and BLS. The 2009 survey instrument underwent four rounds of cognitive field pre-testing and was revised to address the
1 The precision targets that are the basis for the sample design of the CPS are provided on pp.3–1 in Chapter 3 of the US Census Bureau’s Technical Paper 66, available at http://www.census.gov/prod/2006pubs/tp-66.pdf.
feedback gathered from each round.2 The 2011 survey instrument underwent an expert review process by the US Census Bureau. For a detailed description of the revisions, see Appendix F (Revisions to the 2011 Survey Instru-ment). Because of changes in the questionnaire, direct comparisons between 2009 and 2011 estimates are limited and in some instances not possible.
Eligibility and Exclusions
All households that participated in the June 2011 CPS were eligible to participate in the Unbanked/Underbanked Supplement. However, only households whose respon-dents specified that they had some level of participation in their household finances and also responded “Yes” or “No” to whether someone in their household had a bank account (survey supplement Question 2, or Q2) were considered survey respondents.3 CPS household respon-dents who did not answer or answered “don’t know” to Q2, or who did not participate in their household finan-cial decisions (or refused to answer) were asked no further questions and were classified as nonrespondents for the supplement. This definition of supplement respondent is different from the one used in the 2009 FDIC Survey of Unbanked and Underbanked Households report. In 2009, a respondent was required only to answer “yes” or “no” to whether the households had an account in order to be considered a survey respondent. The revised 2009 esti-mates presented in this report use the 2011 definition of respondent so that the estimates are comparable to the 2011 results. It is worth noting that the revised 2009 esti-mates are not materially different from those in the 2009 report.
Demographic characteristics, such as race, age, education, and employment, associated with a respondent household for the supplement are those reported for the householder/reference person (i.e., a person who owns or rents the home, as designated by the respondent). These demo-graphic characteristics were used in preparing report esti-mates and tables.
2 The goal of each round was to determine respondents’ comprehension of each question, test the flow of the questions, find major recall difficul-ties, ascertain the sensitivity or inappropriateness of any questions, and gauge the operational feasibility of the supplement. No changes to the survey were recommended following the fourth round of testing.
3 Respondents involved in their household finances include respondents in households where adults have separate finances or in households where the respondent was the only adult in the household. For house-holds where adults share finances or have a mix of shared and separate finances, respondents were asked to specify how much they participated in their household financial decisions. Only those who reported having at least some level of participation were considered to be involved in their household finances.

2011 FDIC NatIoNal Survey oF uNbaNkeD aND uNDerbaNkeD HouSeHolDS • September 2012 142
The weights calculated by the Census Bureau for the CPS and the Unbanked/Underbanked Supplement respondents were adjusted to account for both nonresponse and under-coverage. These weight adjustments help correct any biases in estimates because of nonresponse and undercov-erage, so that results from the CPS are “representative” of the civilian, non-institutionalized US population, aged 15 and older.6
Analysis of Supplement Survey Results
Using supplement survey results, households were classi-fied as “unbanked” if they answered “no” to the question, “Do you or does anyone in your household currently have a checking or savings account?” Households answering “yes” to this question were classified as “underbanked” if they indicated that they had used at least one of the following alternative financial servicea: non-bank money orders, non-bank check-cashing services, non-bank remit-tances, payday loans, rent-to-own services, pawn shops, or refund anticipation loans, at least once in the last 12 months. Note that the 2011 definition of “underbanked” has been revised from the 2009 definition to include households that used non-bank remittances in the last year. The 2011 underbanked definition was also modified to include only households that used a refund anticipation loan in the last year, as opposed to in the last five years as defined in the 2009 report. Consequently, 2011 under-banked estimates are not directly comparable to 2009 esti-mates (see Box 2 on page 19).
The estimated proportion of US households that are unbanked was derived by dividing the sum of the weights of the household respondents who were identified as being unbanked by the sum of the weights of all household respondents. The same formula was used to estimate the proportion of US households that are underbanked. For estimated proportions of unbanked or underbanked house-holds for demographic subgroups, the same computational approach was used and applied to respondent households in the subgroup.
In addition to presenting estimated proportions, many of the tables in this report include estimated numbers of households (e.g., total households, unbanked households, or underbanked households). An estimated number of households for a given category (such as unbanked) is derived as the sum of the weights of the sample house-holds in that category. For example, for the entire supple-ment sample of about 44,905 respondent households, the sum of the household weights is 120,408,000, which
6 This adjustment is done by introducing three stages of ratio estimation that adjust weights to align with population control totals (independent population estimates for various demographic groups). The household weight is generally taken to be the weight of the householder/reference person.
Coverage and Response Rates
The target universe for the CPS is all civilian non-institu-tionalized persons (aged 15 or older) residing in the 50 states and the District of Columbia. To reach this universe, a list (sampling frame) of about 110 million households was developed from the Master Address File used for the 2000 Census, plus three additional frame sources (group quarters, area canvassing, and building permits).
For the June 2011 CPS, a statistical sample of approxi-mately 58,900 survey-eligible households was selected from the sampling frame. Of these, about 53,700 house-holds participated in the CPS, resulting in a 91.2 percent response rate. There were about 5,200 nonrespondent households. Most of these nonrespondents either refused to participate (59 percent of nonrespondents) or were not home at the time of the interview visit or call (23 percent). The remaining 18 percent consisted of house-holds where (a) the household respondent was temporarily absent, (b) the household could not be located, (c) language barriers prevented the interview, or (d) “other” reasons. Because of the availability of translators for many languages, only 0.5 percent of the nonrespondents (25 households) did not participate as a result of language barriers.
About 44,900 (84 percent) of the 53,700 households participating in the CPS also participated in the Unbanked/Underbanked Supplement.4 The supplement survey response rates vary by demographic groups, ranging from 79 percent to 86 percent.
Coverage ratios for the CPS are derived as a measure of the percentage of persons in the target universe (civilian non-institutionalized persons aged 15 or older in the United States) who are included in the sampling frame.5 The overall coverage ratio for the June 2011 CPS was 87 percent. The missing 13 percent consists of three groups: (1) persons residing in households not in the CPS sampling frame, (2) non-institutionalized persons not residing in households at the time the CPS was conducted, and (3) household residents not listed as household members for the CPS for various reasons. The coverage ratios varied across demographic groups. For example, the coverage ratio was 88 percent for whites, 81 percent for blacks, and 85 percent for Hispanics.
4 Taking into account the nonresponse to basic CPS questions, the over-all response rate for the Unbanked/Underbanked Supplement was 76 percent.5 The coverage ratio is the weighted number of persons in a demo-graphic group (after weights are adjusted to account for household nonresponse) divided by an independent count of persons in that demo-graphic group (obtained from the 2000 Census with updates based on the American Community Survey).
2011 FDIC NatIoNal Survey oF uNbaNkeD aND uNDerbaNkeD HouSeHolDS • September 2012 143
householder cannot be classified into any of the preceding groups.
Data analysts should exercise caution when comparing 2009 and 2011 estimates by income categories given that households with missing information were not treated the same way in both data sets. In the 2009 data set, about 15 percent of households had missing income information and were assigned to the “missing” income category. However, in the 2011 data set, the US Census Bureau imputed income data to households for which this infor-mation was missing. Except when making comparisons to 2009, the 2011 results use imputed income to classify household income. When comparing to 2009 results, 2011 respondent households with missing income are assigned to a “missing” income category.
The counties included in some of the MSAs selected for the CPS do not correspond exactly to the counties included for these MSAs in the official definitions prepared by the Office of Management and Budget (OMB) for two reasons.
First, in redesigning the CPS in a timely manner to incor-porate results from the 2000 Decennial Census, the Census Bureau had to project revised MSA definitions prior to the release of the official OMB definitions in 2003. Therefore, in some cases, the Census Bureau included one or two counties in an MSA for the CPS that were not subsequently included in the official definition of the MSA. In other cases, the Census Bureau excluded one or two counties that were subsequently included in the official definitions of an MSA. In the latter case, the data for the MSA in the CPS (and in the Unbanked/Under-banked Supplement) will not include any responses for one or two of the counties that are a part of the official definition of the MSA.7
Second, since the CPS is a state-based design, MSAs that include counties in more than one state are subdivided into their respective state components for sampling purposes. Therefore, for some multi-state MSAs, the coun-ties belonging to one or two of the states were not selected for the CPS sample, even though the counties making up the other portion of the MSA were selected. The larger portions are usually included in the CPS since they would be selected with certainty for their state sample because of their size (i.e., those larger portions would be “self-repre-senting”). In addition, for some multi-state MSAs, the part of the MSA contained in a given state is selected for the CPS sample but cannot be identified as belonging to the MSA (for confidentiality reasons) because it contains fewer than 100,000 people. In such cases, the respondents
7 In the former case, data for any counties that were not subsequently included in the official definition of an MSA are coded as non-metropolitan.
would be an estimate of all US households as of June 2011. However, the Housing and Vacancy Survey, another survey related to the CPS that uses household controls to produce household weights, provided an esti-mate of 112,464,000 as the number of households in June 2011. This difference (120,408,000 vs. 112,464,000) is because household weights prepared by Census for the CPS and for this supplement survey are generally taken to be the reference person weights and are not adjusted to align with household count controls. Household count controls were not used to adjust household weights because the CPS is a person survey rather than a house-hold survey; therefore, universe controls were used only in the preparation of person weights. As a result, the sum of household weights shown in our tables for a category tends to be higher than the actual household count for the category.
This report also contains a number of tables for which unbanked percentages and other household statistics are computed for subgroups defined by a particular economic or demographic characteristic. The household classifica-tion of an economic or demographic variable that is defined at the person level rather than the household level (e.g., race, education, or employment status) is based on the economic or demographic classification of the householder/reference person (i.e., a person who owns or rents the home).
The Census Bureau classifies households into different household types. For instance, a family household is a household that includes two or more people related by birth, marriage, or adoption and residing together, along with any unrelated people who may be residing there. Detailed definitions regarding household types can be found in the CPS Glossary available at http://www.census.gov/apsd/techdoc/cps/mar97/glossary.html.
Households are categorized into racial-ethnic classifica-tions as follows: If the householder is identified as black, the household is classified as “Black” regardless of whether the householder is identified as Hispanic or any other race. If the householder is not identified as black and is identified as Hispanic, the household is classified as “Hispanic Non-Black.” If the householder is identified as white and not any other race and non-Hispanic, then the household is classified as “White.” All remaining house-holds are classified as “Other.” However, in some national summary tables, the “Other” category is further disaggre-gated into “Asian” if the householder is identified as Asian, “American Indian/Alaskan” if the householder is identified as American Indian/Alaskan and not Asian, and “Hawaiian/Pacific Islander” if the householder is iden-tified as Hawaiian/Pacific Islander and not Asian or American Indian/Alaskan. In these tables, “Other” consists of the few remaining households in which the
2011 FDIC NatIoNal Survey oF uNbaNkeD aND uNDerbaNkeD HouSeHolDS • September 2012 144
in that state usually would be identified as belonging to a metropolitan area, but the specific MSA would not be identified.
Statistical Precision of Estimates
Standard errors were calculated for certain Unbanked/Underbanked Supplement Report estimates to indicate the precision of these estimates. For example, the standard error can be used to compute a 95 percent confidence interval for a survey estimate (this is generally computed as the estimate plus or minus two times the standard error). If the survey estimate of interest is a difference between estimates for different groups, the estimated stan-dard error of the difference can be used to determine whether the observed difference is “statistically signifi-cant.” Differences discussed in this report are significant at the 10 percent level of significance. That is, if there was no difference in the true universe values of the two sample estimates being compared, the probability of obtaining sample estimates having this observed difference or a larger difference would be no more than 10 percent, and could be considerably less.
The standard errors presented in the full report on the FDIC’s Unbanked/Underbanked Supplement were calcu-lated based on the variation of a survey estimate across a set of 160 sample replicates provided by the Census Bureau. Details of the calculation of standard errors based on sample replicates (and on the CPS methodology in general) are available from the Census Bureau.8
For an estimated difference between a universe quantity for the 2009 and 2011 Unbanked/Underbanked surveys (such as the difference between the number of unbanked households), the derivation of the standard error of such an estimated difference was based on the fact that esti-mates from the 2009 and 2011 surveys are independent. Therefore, the standard error of the estimated difference is the square root of the sum of the variances of the two separate estimates. Sample estimates of these variances, based on the use of the set of 160 replicates as described above, were used to estimate the standard error of a differ-ence of estimates between the two years. The significance of any observed difference between estimates from the two years is assessed based on the estimated standard error of the difference.
8 For a detailed description of the methodology used to calculate stan-dard errors using replicates, see US Census Bureau Technical Paper No. 66, Chapter 14, available at http://www.census.gov/prod/2006pubs/tp-66.pdf.
2011 FDIC NatIoNal Survey oF uNbaNkeD aND uNDerbaNkeD HouSeHolDS • September 2012 145
Appendix F — Revisions to the FDIC National Survey of Unbanked and Underbanked Households

2011 FDIC NatIoNal Survey oF uNbaNkeD aND uNDerbaNkeD HouSeHolDS • September 2012 146
The 2011 survey instrument is similar to the 2009 survey, however, there are important differences. Changes were made to improve the data collected about the reasons households do not have a bank account, include non-bank remittances, and provide more accuracy regarding the timeframes for the use of alternative financial services (AFS). Also, although the revised survey does not deviate in intent or content from the 2009 survey, changes were made to streamline the questionnaire based on lessons learned from the 2009 survey. Finally, the survey language was improved for clarity and consistency.
Because of differences in the 2009 and 2011 surveys, certain 2011 estimates, such as the proportion of under-banked households, the timeframes for AFS use, and the reasons for being unbanked, are not comparable to 2009 estimates.
Specific revisions to the 2011 survey are as follows:
A. Banking Status and Account Type (Q1–Q6)
• Questions were added to identify which members of the household have bank accounts (Q2a) and the types of accounts (Q2b).
• Questions were deleted regarding whether the house-hold is in the process of opening a bank account (2009 Survey Q5), who closed the account (2009 Survey Q6), and when the household is likely to open an account (2009 Survey Q13). Banking status ques-tions (Q2, Q2a, and Q2b) were moved and asked after the questions regarding the respondent’s partici-pation in the household’s finances (Q1, Q1a) to improve the flow of the questionnaire.
B. Reasons For Not Having a Bank Account (Q5–Q6f)
This series of questions was streamlined to first ask for one “main” reason why a household does not have an account. This question allowed respondents to choose from a broad range of reasons (Q5); subsequently, some respondents were asked for more detailed information regarding their reasons for being unbanked within the category selected (Q6a–Q6f).
In contrast, the 2009 survey split the questions about reasons for not having an account into two sets: reasons for closing an account (2009 Survey Q7a–Q10a) and reasons for not ever having an account (2009 Survey Q7b–Q10b). Within each set, reasons were grouped into three types: customer service (2009 Survey Q7), financial (2009 Survey Q8), and other reasons (2009 Survey Q9). Respondents were asked to check all reasons that applied within each type and were later asked to indicate the
main reason among all the reasons they selected in the previous questions.
The current version provides a clearer and more straight-forward approach to capturing the reasons for being unbanked.
C. Likelihood of Opening a Bank Account (Q7–Q8)
In the 2011 survey, households that reported being “very likely” or “somewhat likely” to open a bank account (Q7) were asked why they would open an account. However, in 2009, only households that reported being “very likely” to open an account in the future were asked why they would do so.
D. Use of Alternative Financial Services (AFS) (Q9–Q39)
• Questions regarding the use of AFS were revised to consistently capture the following information for AFS:
• Whether AFS have ever been used. This question was also asked in 2009.
• Whether AFS were used in the last 12 months. The 2009 survey asked how many times a year AFS were used.
• Whether the AFS were used in the last 30 days. This is a new question added for all AFS, except for refund anticipation loans and rent-to-own stores.
• The number of times that the AFS were used in the last 30 days. This is a new question added for all AFS, except for refund anticipation loans and rent-to-own stores.
• Reasons for using the AFS. Answer options were slightly revised for some AFS, and “Do not trust banks” was added as an option.
• Non-bank international remittances were added as additional AFS (Q20–Q24).
• A question on non-bank money orders was added to capture whether these were purchased in a post office in the last 30 days (Q18).

2011 FDIC NatIoNal Survey oF uNbaNkeD aND uNDerbaNkeD HouSeHolDS • September 2012 147
Appendix G — Survey Instrument

FDIC 6494/03 (11-10) Page
OMB No. 3064-0167 Expiration Date: 02/28/2014
FDIC Household Survey of the Unbanked and Underbanked
INTRODUCTION
Next, I’d like to ask you some questions about household finances.
1. Which of the following best describes your household’s finances? (Read Responses 1-3.)
The adults have shared finances (CONTINUE) The adults have some shared finances and some
separate finances (CONTINUE) The adults have separate finances even though we
share living space (SKIP TO Q2) I am the only adult in the household (Volunteered) (SKIP TO Q2) DK/Refused (CONTINUE)
1a. How much do you participate in making financial decisions for your household, a lot, some or not at all?
A lot (CONTINUE) Some (CONTINUE) Not at all (CONTINUE) DK/Refused (CONTINUE)
2. Do you or does anyone in your household currently have a checking or savings account? Yes (CONTINUE) No (SKIP TO Q3) DK/Refused (TERMINATE)
2a. Who is that? (Enter Line Number) 1-16 (CONTINUE) DK/Refused (SKIP TO Q9)
2b. What type or types of accounts do you and each of your household members have? (Ask this question for each adult (15 years of age and older) individual of the household)
Only checking accounts (SKIP TO Q9) Only savings accounts (SKIP TO Q9) Or both checking and savings accounts (SKIP TO Q9) Other (Volunteered) (SKIP TO Q9) DK/Refused
The remainder of the survey will not be administered to individuals who do not participate in household’s financial decision making. The survey will terminate here if the interviewee’s response to Q1a is “Not at all” or “DK/Refused.”
2011 FDIC NatIoNal Survey oF uNbaNkeD aND uNDerbaNkeD HouSeHolDS • September 2012 148
FDIC 6494/03 (11-10) Page 2
3. Have you or anyone in your household ever had a checking or savings account? Yes (CONTINUE) No (SKIP TO INTRO Q5) DK/Refused (SKIP TO INTRO Q5)
Q4 is asked to those households that were previously banked, but closed their deposit account with a bank.
4. When was the last time you or anyone in your household had a checking or savings account, was it – within the last year or more than 1 year ago?
Within the last year (CONTINUE) More than 1 year ago (CONTINUE) DK/Refused (CONTINUE)
Q5- Q6f apply to all unbanked households and relate to reasons why the household does not have an account.
5. What is the main reason why no one in your household has an account? (Read responses 1 to 10.Mark only one.). a. Previously had an account but the bank closed it (SKIP TO Q6a) b. Can’t open an account due to ID, credit, or banking history problems (SKIP TO Q6b) c. Banks do not have convenient hours or locations (SKIP TO Q6c) d. Bank account fees or minimum balance requirements are too high (SKIP TO Q6d) e. Banks do not offer the needed products or services (SKIP TO Q6e) f. Don’t like dealing with and/or don’t trust banks (SKIP TO Q6f) g. Do not have enough money (SKIP TO Q7) h. Do not know how to open or manage an account (SKIP TO Q7) i. Do not need or want an account (SKIP TO Q7) j. Was there some other reason? (Specify) (SKIP TO Q7) k. None of the preceding reasons (Volunteered) (SKIP TO Q7) l. DK/Refused
(Q6a- Q6f drill down on specific reasons for response to Q5)
(Only ask if response “a” in Q5 was selected) 6a. Did the bank close the account because of too many overdrafts or bounced checks? Yes (SKIP TO Q7) No (SKIP TO Q7) DK/Refused (SKIP TO Q7)
(Only ask if response “b” in Q5 was selected) 6b. What is the main reason you or others in your household can’t open an account? (Read responses 1 to 3. Mark only one.) Do not have the required identification to open an account (SKIP TO Q7) Bad credit history (SKIP TO Q7) Past banking history problems (SKIP TO Q7) Other reason (Volunteered) (SKIP TO Q7) DK/Refused (SKIP TO Q7)
2011 FDIC NatIoNal Survey oF uNbaNkeD aND uNDerbaNkeD HouSeHolDS • September 2012 149

FDIC 6494/03 (11-10) Page 5
(Only ask if response “c” in Q5 was selected) 6c. What is the main reason why banks are inconvenient? (Read responses 1 and 2. Mark only one.) Bank has inconvenient hours (SKIP TO Q7) Bank has inconvenient locations (SKIP TO Q7) Other reason (Volunteered) (SKIP TO Q7) DK/Refused (SKIP TO Q7)
(Only ask if response “d” in Q5 was selected) 6d. What fee or balance requirement is the main reason that you or others in your household do not have an account? (Read responses 1 to 3. Mark only one.) Services charges are too high (SKIP TO Q7) Unexpected fees, such as overdraft charges (SKIP TO Q7) Minimum balances are too high (SKIP TO Q7) Other reason (Volunteered) (SKIP TO Q7) DK/Refused (SKIP TO Q7)
(Only ask if response “e” in Q5 was selected) 6e. What is the main product or service needed but not offered by banks? (Read responses 1 to 4.Mark only one.) Banks do not offer check cashing services or money orders. (SKIP TO Q7) Banks do not offer wire transfer (remittance) services. (SKIP TO Q7) It takes too long to get funds from deposited checks (SKIP TO Q7) Cannot borrow money needed from banks (SKIP TO Q7) Other reason (Volunteered) (SKIP TO Q7) DK/Refused (SKIP TO Q7)
(Only ask if response “f” in Q5 was selected) 6f. Can you specify why you or others in your household do not like dealing with and/or don’t trust banks?(Read responses 1 to 3. Mark only one.) There are language barriers at banks (CONTINUE) Do not trust banks (CONTINUE) Do not feel welcome or comfortable at banks (CONTINUE) Other reason (Volunteered) (CONTINUE) DK/Refused (CONTINUE)
7. How likely is it that you or someone in your household will open a bank account in the future – very likely, somewhat likely, not too likely, or not likely at all?
Very likely (CONTINUE) Somewhat likely (CONTINUE) Not too likely (SKIP TO Q9) Not likely at all (SKIP TO Q9) DK/Refused (SKIP TO Q9)
8. What is the main reason why you or someone in your household would want to open a bank account? (Read responses 1 through 6. Mark only one.)
To put money in a safe place To be able to write checks and pay bills To be able to apply for a loan or mortgage To save money for the future
2011 FDIC NatIoNal Survey oF uNbaNkeD aND uNDerbaNkeD HouSeHolDS • September 2012 150

FDIC 6494/03 (11-10) 4
To take advantage of direct deposit of paychecks To send money to family and friends Other (Specify) DK/Refused
Q9- Q39 apply to all households, regardless of their banking status. The next series of questions asks if you or someone in your household has gone to places other than a bank for financial services. When I use the term bank, I am referring to banks, savings and loans, credit unions, and brokerage firms.
9. Have you or anyone in your household EVER gone to a place other than a bank to cash a check that was received from someone else? Yes (CONTINUE) No (SKIP TO Q14) DK/Refused (SKIP TO Q14)
10. In the past 12 months, did you or anyone in your household go to a place other than a bank to cash a check received from someone else? Yes (CONTINUE) No (SKIP TO Q13) DK/Refused (SKIP TO Q13)
11. Did you or anyone in your household do this in the past 30 days? Yes (CONTINUE) No (SKIP TO Q13) DK/Refused (SKIP TO Q13)
12. How many times did this happen in the past 30 days? About __________times in the past 30 days. DK/Refused
13. What was the main reason for going to a place other than a bank to cash a check received from someone else? (Read responses 1 through 8. Mark only one.) Banks don’t cash checks To get money faster The place to cash checks has more convenient hours or location A bank charges more to cash checks The place to cash checks asks for fewer IDs. The place to cash checks feels more comfortable than a bank Don’t have a bank account Do not trust banks Other (Specify) DK/Refused
14. Have you or anyone in your household EVER gone to a place other than a bank to purchase a money order? Yes (CONTINUE) No (SKIP TO Q20) DK/Refused (SKIP TO Q20)
2011 FDIC NatIoNal Survey oF uNbaNkeD aND uNDerbaNkeD HouSeHolDS • September 2012 151

FDIC 6494/03 (11-10) 5
15. In the past 12 months, did you or anyone in your household go to a place other than a bank to purchase a money order ? Yes (CONTINUE) No (SKIP TO Q19) DK/Refused (SKIP TO Q19)
16. Did you or anyone in your household do this in the past 30 days? Yes (CONTINUE) No (SKIP TO Q19) DK/Refused (SKIP TO Q19)
17. How many times did this happen in the past 30 days? About __________times in the past 30 days. DK/Refused
18. In the past 30 days, did you or anyone in your household purchase a money order in a Post Office? Yes (CONTINUE) No (CONTINUE) DK/Refused CONTINUE)
19. What was the main reason for going to a place other than a bank to purchase a money order? (Readresponses 1 through 6. Mark only one.) Banks do not sell money orders The place to purchase money orders has more convenient hours or location A bank charges more for money orders The place to purchase money orders feels more comfortable than a bank Don’t have a bank account Do not trust banks Other (Specify) DK/Refused
20. Have you or anyone in your household EVER gone to a place other than a bank to give or send money to relatives or friends living outside the U.S.? Please include all money for gifts or loans. Read if necessary: Friends are people you know personally (are acquainted with). Do NOT include money for charities or other organizations or groups.
Yes (CONTINUE) No (SKIP TO Q25) DK/Refused (SKIP TO Q25)
21. In the past 12 months, did you or anyone in your household go to a place other than a bank to give or send money to relatives or friends living outside the U.S.?
Yes (CONTINUE) No (SKIP TO Q24) DK/Refused (SKIP TO Q24)
2011 FDIC NatIoNal Survey oF uNbaNkeD aND uNDerbaNkeD HouSeHolDS • September 2012 152
FDIC 6494/03 (11-10) Page 8
22. Have you or anyone in your household done this in the past 30 days? Yes (CONTINUE) No (SKIP TO Q24) DK/Refused (SKIP TO Q24)
23. How many times did this happen in the past 30 days? About __________times in the past 30 days. DK/Refused
24. What was the main reason for going to a place other than a bank to give or send money to relatives or friends living outside the U.S? (Read responses 1 through 7. Mark only one.) Banks don’t send money abroad The money gets there faster The place to give or send money has more convenient hours or location A bank charges more to send money abroad The place to give or send money feels more comfortable than a bank Don’t have a bank account Do not trust banks Other (Specify) DK/Refused
25. Have you or anyone in your household EVER taken out a payday loan? Yes (CONTINUE) No (SKIP TO Q29) DK/Refused (SKIP TO Q29)
26. In the past 12 months, did you or anyone in your household have a payday loan? Yes (CONTINUE) No (SKIP TO Q28) DK/Refused (SKIP TO Q28)
27. Did you or anyone in your household have a payday loan in the past 30 days? Yes (CONTINUE) No (CONTINUE) DK/Refused (CONTINUE)
28. What was the main reason for using a payday lender rather than a bank? (Read responses 1 through 6. Mark only one.) Banks don’t make small dollar loans The place to get payday loans has more convenient hours or location It is easier or faster to get a payday loan than to qualify for a bank loan The place to get payday loans feels more comfortable than a bank Don’t qualify for a bank loan Do not trust banks Other (Specify) DK/Refused
29. Have you or anyone in your household EVER pawned an item at a pawn shop because cash was needed, and not just to sell an unwanted item? Yes (CONTINUE)
2011 FDIC NatIoNal Survey oF uNbaNkeD aND uNDerbaNkeD HouSeHolDS • September 2012 153

FDIC 6494/03 (11-10) 7
No (SKIP TO Q33) DK/Refused (SKIP TO Q33)
30. In the past 12 months, have you or anyone in your household pawned an item because cash was needed? Again, do not count selling unwanted items. Yes (CONTINUE) No (SKIP TO Q32) DK/Refused (SKIP TO Q32)
31. Have you or anyone in your household done this in the past 30 days? Yes (CONTINUE) No (CONTINUE) DK/Refused (CONTINUE)
32. What was the main reason for pawning an item rather than getting a loan from a bank? Again, do not count selling unwanted items. (Read responses 1 through 6. Mark only one.) Banks don’t make small dollar loans The pawn shop has more convenient hours or location It is easier and faster to get money from a pawn shop than to qualify for a bank loan The pawn shop feels more comfortable than a bank Don’t qualify for a bank loan Do not trust banks Other (Specify) DK/Refused
33. Have you or anyone in your household EVER taken out a tax refund anticipation loan? Yes No (SKIP TO Q35) DK/refused (SKIP TO Q35)
34. Have you or anyone in your household taken one out in the past 12 months? Yes (CONTINUE) No (CONTINUE) DK/refused (CONTINUE)
35. Have you or anyone in your household EVER rented or leased anything from a rent-to-own store because it couldn’t be financed any other way? Yes (CONTINUE) No (SKIP TO Q37) DK/refused (SKIP TO Q37)
36. In the past 12 months, did you or anyone in your household have a rent-to-own agreement? Yes (CONTINUE) No (CONTINUE) DK/Refused (CONTINUE)
Q37 is only asked if respondent indicated that they have used AFS credit services (pay day loans, pawn shop loans, tax refund anticipation loans, or rent- to-own credit agreements) within the last 12 months (Q26, Q29, Q33 or Q35)
2011 FDIC NatIoNal Survey oF uNbaNkeD aND uNDerbaNkeD HouSeHolDS • September 2012 154

FDIC 6494/03 (11-10) 8
37. Thinking about the past 12 months, what was the MAIN reason you or anyone in your household needed to get a payday loan, a tax refund anticipation loan, a rent-to–own credit agreement, or pawn an item? Was it:
(Read responses 1 through 7. Mark only one.) (Note to Interviewer: We want to know what they used the money for.)
To make up for job loss or decrease in income For basic living expenses For house or car repairs or to buy an appliance For medical, dental or death expenses For school or childcare expenses For special gifts or luxuries For legal expenses Other (Volunteered Specify:________________________________________) Offered multiple reasons – would not pick 1 main reason (Volunteered) DK/Refused
38. Do you or anyone in your household receive payment for wages by having the employer deposit the salary onto a payroll card instead of paying by cash, check, or direct deposit? Yes No DK/Refused
Now I have a question about pre-paid debit cards that may have logos such as MasterCard, VISA, Discover or American Express. These cards are not linked to a checking or savings account. You can keep adding money onto this card and use it to make purchases and pay bills anywhere credit cards are accepted or withdraw the cash from an ATM. I am not talking about phone cards, gift cards for a particular store or service or cards that you cannot add more funds onto.
39. Have you or anyone in your household EVER used pre-paid cards such as those I have described?
Yes No DK/Refuse
<END>
ESTIMATED REPORTING BURDEN
Public reporting burden for this collection of information is estimated to average 10 minutes per response. Send comments regarding this burden estimate or any other aspect of this collection of information, including suggestions for reducing this burden, to the Paper Reduction Act Clearance Officer, Legal Division, Federal Deposit Insurance Corporation, 550 17th Street, N.W., Washington, D.C. 20429; and to the Office of Management and Budget, Paperwork Reduction Project (3064-0072), Washington, D.C. 20503. An agency may not conduct or sponsor, and a person is not required to respond to, a collection of information unless it displays a currently valid OMB control number.
2011 FDIC NatIoNal Survey oF uNbaNkeD aND uNDerbaNkeD HouSeHolDS • September 2012 155