fccc/sbi/2012/31unfccc.int/resource/docs/2012/sbi/eng/31.pdf · emission estimates and to ensure...
TRANSCRIPT

GE.12-63483
Subsidiary Body for Implementation Thirty-seventh session Doha, 26 November to 1 December 2012
Item 3(b) of the provisional agenda National communications from Parties included in Annex I to the Convention Report on national greenhouse gas inventory data from Parties included in Annex I to the Convention for the period 1990–2010
National greenhouse gas inventory data for the period 1990–2010
Note by the secretariat*
Summary All 42 Parties included in Annex I to the Convention (Annex I Parties) submitted
their greenhouse gas (GHG) inventory common reporting format (CRF) tables and national inventory reports (NIRs) in 2012. By the deadline of 15 April, 41 sets of CRF tables and 36 NIRs had been received. From 1990 to 2010, total aggregate GHG emissions excluding emissions/removals from land use, land-use change and forestry (LULUCF) for all Annex I Parties decreased by 8.9 per cent, and total GHG emissions/removals including LULUCF decreased by 14.6 per cent. For Annex I Parties with economies in transition (Annex I EIT Parties), GHG emissions excluding and including LULUCF decreased by 39.2 per cent and 52.6 per cent, respectively. For Annex I non-EIT Parties, GHG emissions excluding and including LULUCF increased by 4.9 per cent and 4.1 per cent, respectively. Information in this document is based on national GHG inventory submissions received as at 22 October 2012. At the time of publication, the annual review process for GHG inventories from Annex I Parties was still ongoing, and therefore the data included in this document may not reflect the latest information provided by Parties. The latest inventory data are available on the UNFCCC website.
* This document was submitted after the due date in order to take into account the latest submissions
from Parties.
United Nations FCCC/SBI/2012/31
Distr.: General 16 November 2012 Original: English

FCCC/SBI/2012/31
2
Contents Paragraphs Page
I. Introduction ............................................................................................................. 1–4 3
A. Mandate .......................................................................................................... 1 3
B. Scope of the note ............................................................................................ 2–3 3
C. Possible action by the Subsidiary Body for Implementation and the Conference of the Parties ................................................................................ 4 3
II. Status of reporting ................................................................................................... 5–10 3
A. Timeliness and completeness of submissions ................................................. 5–7 3
B. Recalculations ................................................................................................ 8–10 4
III. Overview of emission trends and sources in Annex I Parties ................................. 11–27 7
A. Total aggregate greenhouse gas emissions ..................................................... 11–14 7
B. Greenhouse gas emissions by gas ................................................................... 15–17 10
C. Greenhouse gas emissions by sector............................................................... 18–24 10
D. Emissions data for individual Annex I Parties ................................................ 25–27 12
FCCC/SBI/2012/31
3
I. Introduction
A. Mandate
1. The Conference of the Parties (COP), by decisions 9/CP.2, 3/CP.5 and 18/CP.8, requested that Parties included in Annex I to the Convention (Annex I Parties) submit national inventory data on greenhouse gas (GHG) emissions by sources and removals by sinks by 15 April each year. Under the “Guidelines for the technical review of greenhouse gas inventories from Parties included in Annex I to the Convention” adopted by the COP in decision 19/CP.8, the secretariat is requested1 to prepare annually a report on GHG inventory data submitted by Annex I Parties for consideration by the COP and the Subsidiary Body for Implementation (SBI).
B. Scope of the note
2. This document shows the status of reporting of GHG inventories by Annex I Parties in 2012 (chapter II) and provides a summary of the latest available data on GHG emissions and removals for the period 1990–2010 (chapter III). Data are provided for carbon dioxide (CO2), methane (CH4) and nitrous oxide (N2O), and for hydrofluorocarbons (HFCs), perfluorocarbons (PFCs) and sulphur hexafluoride (SF6) taken together. Data are also provided for total2 aggregate3 GHG emissions, both including and excluding net GHG emissions/removals from land use, land-use change and forestry (LULUCF).
3. The information provided in this document is based on national GHG inventory submissions received from all 42 Annex I Parties as at 22 October 2012. At the time of publication, the annual review process was still ongoing, and therefore the data presented here may not reflect the latest information provided by Parties. The latest GHG inventory data are available on the UNFCCC website.4
C. Possible action by the Subsidiary Body for Implementation and the Conference of the Parties
4. The SBI may wish to take note of the information contained in this document and seek further guidance from the COP, as appropriate.
II. Status of reporting
A. Timeliness and completeness of submissions
5. In accordance with the UNFCCC reporting guidelines on annual inventories,5 Annex I Parties are required to submit annually a national inventory report (NIR) and common reporting format (CRF) tables containing data from the base year up to two years
1 FCCC/CP/2002/8, annex II, paragraphs 42 and 43. 2 The term ‘total’ implies that emissions from sectors of the common reporting format are summed; the
inclusion of land use, land-use change and forestry in the sum is indicated separately. 3 The term ‘aggregate’ implies that GHG emissions/removals are calculated as a weighted sum of CO2,
CH4, N2O, HFCs, PFCs and SF6 using the global warming potentials agreed under the Convention. 4 <http://unfccc.int/national_reports/annex_i_ghg_inventories/national_inventories_submissions/items/
6598.php>. 5 “Updated UNFCCC reporting guidelines on annual inventories following incorporation of the
provisions of decision 14/CP.11” (FCCC/SBSTA/2006/9).

FCCC/SBI/2012/31
4
prior to the year of submission. In 2012, all 42 Annex I Parties provided GHG data for all years from 19906 to 2010.
6. By the due date of 15 April, 41 sets of CRF tables and 36 NIRs were received, and, within six weeks of the deadline, all Parties had submitted their CRF tables and NIRs. The dates of the initial submissions of the CRF tables are shown in table 1.
Table 1 Greenhouse gas inventory submissions from Annex I Parties in 2012
Party CRF submission datea Party CRF submission datea
Australia 14 April 2012 Liechtenstein 13 April 2012
Austria 12 April 2012 Lithuania 13 April 2012
Belarus 14 April 2012 Luxembourg 5 April 2012
Belgium 15 April 2012 Malta 13 April 2012 Bulgaria 12 April 2012 Monaco 29 March 2012
Canada 11 April 2012 Netherlands 14 April 2012
Croatia 13 April 2012 New Zealand 12 April 2012
Czech Republic 15 April 2012 Norway 15 April 2012
Denmark 13 April 2012 Poland 13 April 2012
Estonia 13 April 2012 Portugal 13 April 2012
European Union 13 April 2012 Romania 21 March 2012
Finland 12 April 2012 Russian Federation 13 April 2012
France 4 April 2012 Slovakia 14 April 2012
Germany 13 April 2012 Slovenia 12 April 2012
Greece 11 April 2012 Spain 17 April 2012 Hungary 14 April 2012 Sweden 26 March 2012
Iceland 14 April 2012 Switzerland 12 April 2012
Ireland 13 April 2012 Turkey 14 April 2012
Italy 11 April 2012 Ukraine 13 April 2012
Japan 12 April 2012 United Kingdom 13 April 2012
Latvia 14 April 2012 United States 13 April 2012
Abbreviation: CRF = common reporting format. a Dates after the submission deadline of 15 April 2012 are shown in italics. The date of submission
of the national inventory report may be different.
7. After the initial submissions, nine Parties submitted revised versions of their CRF tables, and 12 Parties resubmitted their NIRs.
B. Recalculations
8. In accordance with the UNFCCC reporting guidelines on annual inventories, Parties should, when necessary, conduct recalculations in order to improve the quality of their emission estimates and to ensure the consistency of the time series.
9. In 2012, the recalculations resulting from changes in activity data, emission factors and methodologies used had a varied impact on the 1990 GHG emissions of 41 Parties
6 Unless otherwise specified, base year data are used instead of 1990 data. The Parties that may use a
base year other than 1990, as stipulated in decisions 9/CP.2 and 11/CP.4, also provided data for their respective base years. These Parties and their base years are Bulgaria (1988), Hungary (average of 1985–1987), Poland (1988), Romania (1989) and Slovenia (1986).

FCCC/SBI/2012/31
5
(table 2). For total aggregate GHG emissions excluding LULUCF, the change was less than 1 per cent for 32 Parties and more than 2 per cent for three Parties. For total aggregate GHG emissions including LULUCF, the change was less than 1 per cent for 18 Parties and more than 3 per cent for 14 Parties.
Table 2 Inventory recalculations by Annex I Parties in 2012
Party Impact on 1990 GHG emissions
excluding LULUCF (%) Impact on 1990 GHG emissions
including LULUCF (%)
Australia –0.11 10.70
Austria –0.01 5.75
Belarus Less than ±0.001a Less than ±0.001a
Belgium –0.12 0.10
Bulgaria 3.25 3.63
Canada –0.33 –0.38
Croatia 0.09 5.59
Czech Republic –0.06 –0.06
Denmark 0.84 2.55
Estonia –1.25 1.82
European Union –0.10 1.01
Finland –0.005 –1.23
France –0.69 3.11
Germany –0.14 0.14
Greece 0.42 0.39
Hungary 0.56 0.56
Iceland 2.53 3.76
Ireland 0.62 2.04
Italy 0.02 5.99
Japan 0.01 –0.03
Latvia –0.25 –7.71
Liechtenstein 0.47 0.49
Lithuania 0.57 –3.70
Luxembourg 0.05 0.05
Malta –1.43 –1.47
Monaco – –
Netherlands 0.01 0.15
New Zealand 1.16 –9.12
Norway 0.07 –0.21
Poland –0.06 –0.25
Portugal 1.10 6.17
Romania 1.80 1.97
Russian Federation –0.58 –0.57
Slovakia –3.20 –13.64
Slovenia –0.03 0.60

FCCC/SBI/2012/31
6
Party Impact on 1990 GHG emissions
excluding LULUCF (%) Impact on 1990 GHG emissions
including LULUCF (%)
Spain –0.12 –0.15
Sweden 0.37 13.42
Switzerland –0.12 –2.36
Turkey Less than ±0.001a –8.15
Ukraine –0.40 –0.41
United Kingdom –1.56 –1.55
United States –0.09 –0.51
Abbreviations: GHG = greenhouse gas, LULUCF = land use, land-use change and forestry. a Due to a technical error in some common reporting format (CRF) tables, there is a discrepancy
between the values presented in this table and the values presented in the relevant CRF tables.
10. Table 3 presents a comparison of the estimates of total aggregate GHG emissions in 1990 reported in document FCCC/SBI/2011/9, containing information based on Annex I Parties’ 2011 GHG inventory submissions, and those reported in the present document, based on Parties’ 2012 submissions.
Table 3 Comparison of 2012 and 2011 estimates of total aggregate greenhouse gas emissions from Annex I Parties in 1990
2011 2012 Explanation of the difference between 2012 and 2011 estimates
Total aggregate GHG emissions excluding LULUCF (thousands of Tg CO2 eq)
All Annex I Parties 19.04 19.00 Aggregate impacts of inventory recalculations by individual Annex I Parties
Annex I EIT Parties 5.97 5.95 Inventory recalculations, for example, in the Russian Federation, Slovakia and Ukraine
Annex I non-EIT Parties
13.07 13.05 Inventory recalculations, for example, in the United Kingdom and the United States
Total aggregate GHG emissions including LULUCF (thousands of Tg CO2 eq)
All Annex I Parties 17.67 17.70 Aggregate impacts of inventory recalculations by individual Annex I Parties
Annex I EIT Parties 5.85 5.83 Inventory recalculations, for example, in Lithuania, the Russian Federation and Slovakia
Annex I non-EIT Parties
11.82 11.87 Inventory recalculations, for example, in Australia, France and Italy
Abbreviations: EIT = economies in transition, GHG = greenhouse gas, LULUCF = land use, land-use change and forestry.
FCCC/SBI/2012/31
7
III. Overview of emission trends and sources in Annex I Parties
A. Total aggregate greenhouse gas emissions
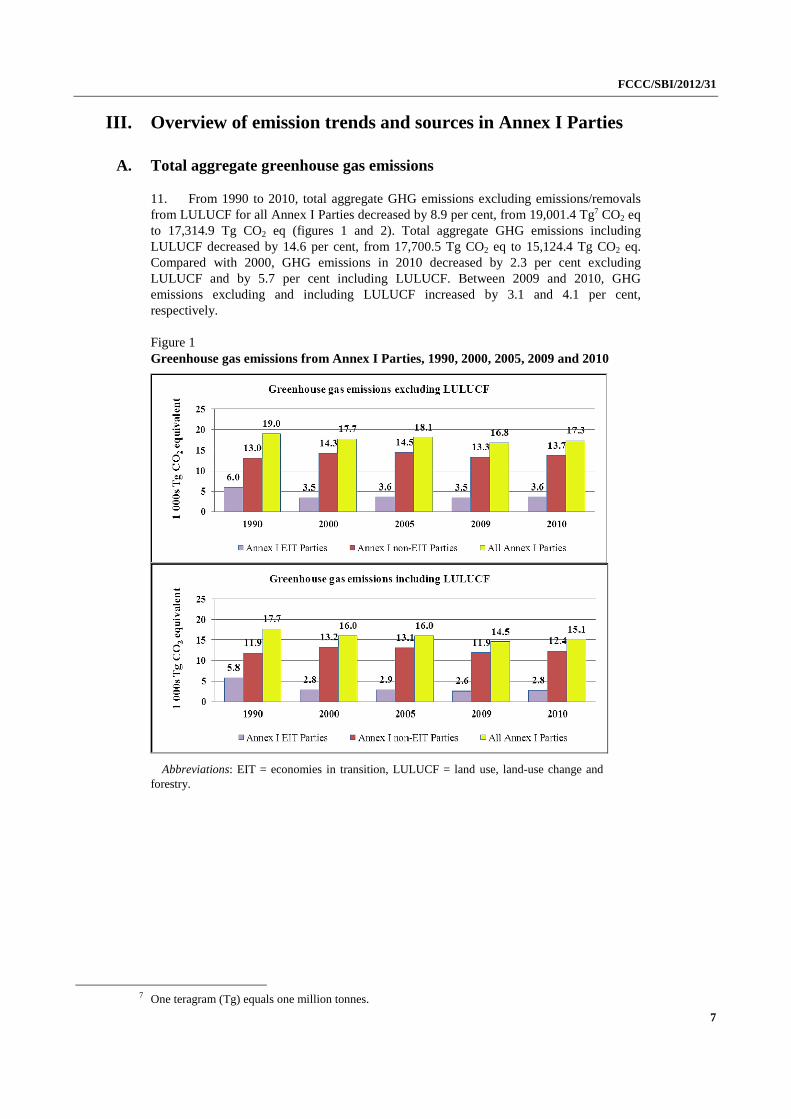
11. From 1990 to 2010, total aggregate GHG emissions excluding emissions/removals from LULUCF for all Annex I Parties decreased by 8.9 per cent, from 19,001.4 Tg7 CO2 eq to 17,314.9 Tg CO2 eq (figures 1 and 2). Total aggregate GHG emissions including LULUCF decreased by 14.6 per cent, from 17,700.5 Tg CO2 eq to 15,124.4 Tg CO2 eq. Compared with 2000, GHG emissions in 2010 decreased by 2.3 per cent excluding LULUCF and by 5.7 per cent including LULUCF. Between 2009 and 2010, GHG emissions excluding and including LULUCF increased by 3.1 and 4.1 per cent, respectively.
Figure 1 Greenhouse gas emissions from Annex I Parties, 1990, 2000, 2005, 2009 and 2010
Abbreviations: EIT = economies in transition, LULUCF = land use, land-use change and forestry.
7 One teragram (Tg) equals one million tonnes.

FCCC/SBI/2012/31
8
Figure 2 Changes in greenhouse gas emissions from Annex I Parties, 1990–2010
Abbreviations: EIT = economies in transition, LULUCF = land use, land-use change and forestry.
12. For Annex I Parties with economies in transition (Annex I EIT Parties), GHG emissions excluding and including LULUCF over the period 1990–2010 decreased by 39.2 per cent and 52.6 per cent, respectively. In the 2000–2010 period, GHG emissions excluding LULUCF from these Parties increased by 4.4 per cent, whereas GHG emissions including LULUCF decreased by 2.2 per cent. Between 2009 and 2010, emissions increased by 4.2 per cent (excluding LULUCF) and by 5.2 per cent (including LULUCF).
13. For Annex I non-EIT Parties, GHG emissions from 1990 to 2010 increased by 4.9 per cent excluding LULUCF and by 4.1 per cent including LULUCF. From 2000 to 2010, GHG emissions decreased by 3.9 per cent excluding LULUCF and by 6.4 per cent including LULUCF. Compared with 2009, GHG emissions in 2010 increased by 2.8 per cent excluding LULUCF and by 3.8 per cent including LULUCF.
14. The changes in total aggregate GHG emissions over the period 1990–2010 varied considerably among countries (figure 3). For emissions excluding LULUCF, Ukraine has the largest decrease (58.8 per cent) and Turkey has the greatest increase (114.9 per cent). For emissions including LULUCF, Latvia has the largest decrease (148.1 per cent) and again the greatest increase occurred in Turkey (147.5 per cent).

FCCC/SBI/2012/31
9
Figure 3 Changes in total aggregate emissions of individual Annex I Parties, 1990–2010
Abbreviations: GHG = greenhouse gas, LULUCF = land use, land-use change and forestry.
FCCC/SBI/2012/31
10
B. Greenhouse gas emissions by gas
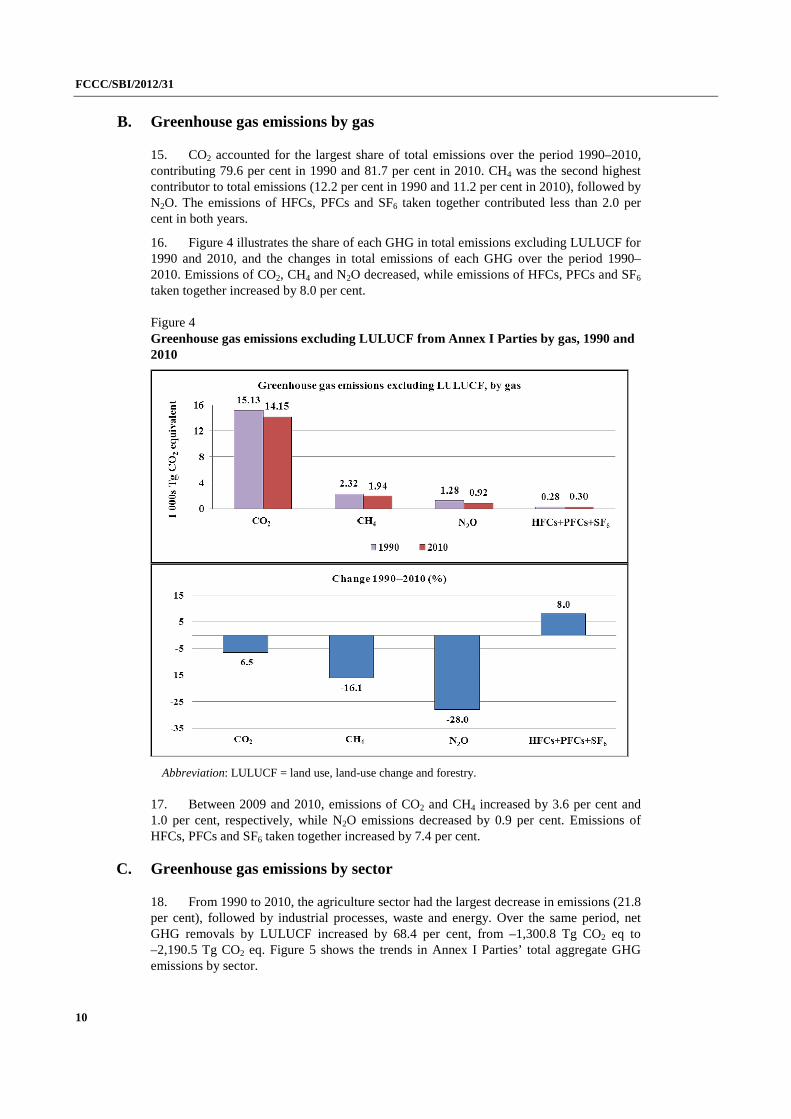
15. CO2 accounted for the largest share of total emissions over the period 1990–2010, contributing 79.6 per cent in 1990 and 81.7 per cent in 2010. CH4 was the second highest contributor to total emissions (12.2 per cent in 1990 and 11.2 per cent in 2010), followed by N2O. The emissions of HFCs, PFCs and SF6 taken together contributed less than 2.0 per cent in both years.
16. Figure 4 illustrates the share of each GHG in total emissions excluding LULUCF for 1990 and 2010, and the changes in total emissions of each GHG over the period 1990–2010. Emissions of CO2, CH4 and N2O decreased, while emissions of HFCs, PFCs and SF6 taken together increased by 8.0 per cent.
Figure 4 Greenhouse gas emissions excluding LULUCF from Annex I Parties by gas, 1990 and 2010
Abbreviation: LULUCF = land use, land-use change and forestry.
17. Between 2009 and 2010, emissions of CO2 and CH4 increased by 3.6 per cent and 1.0 per cent, respectively, while N2O emissions decreased by 0.9 per cent. Emissions of HFCs, PFCs and SF6 taken together increased by 7.4 per cent.
C. Greenhouse gas emissions by sector
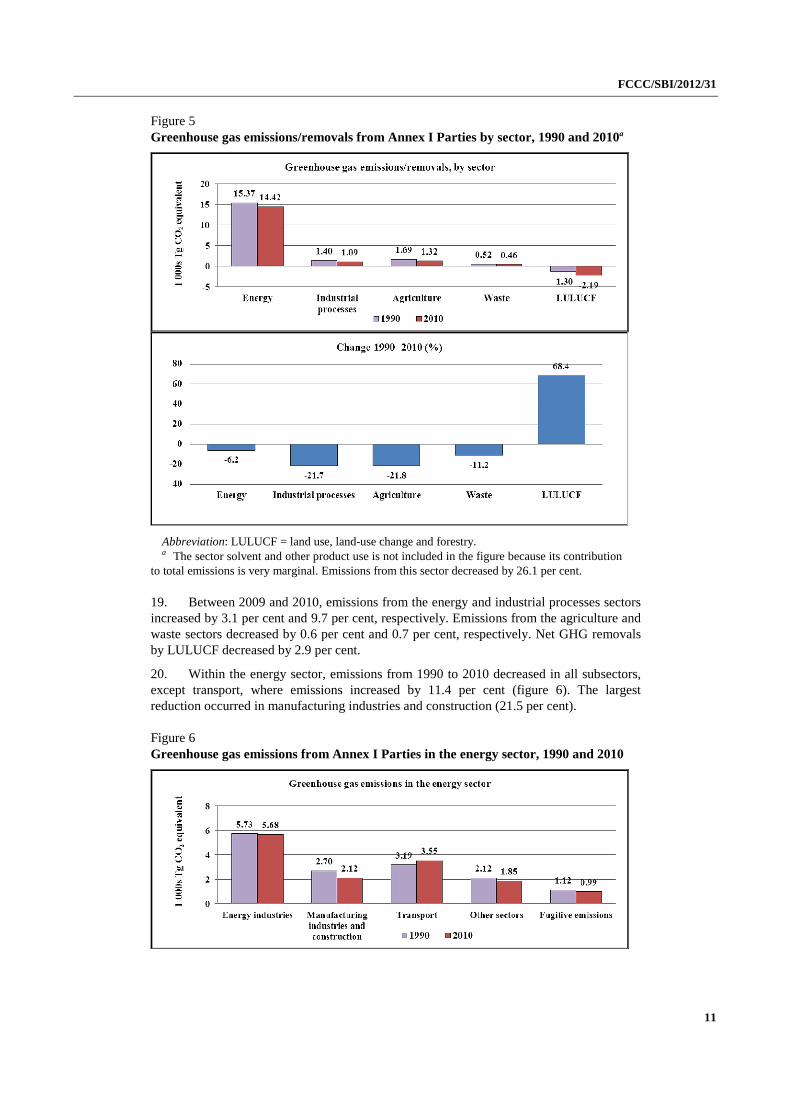
18. From 1990 to 2010, the agriculture sector had the largest decrease in emissions (21.8 per cent), followed by industrial processes, waste and energy. Over the same period, net GHG removals by LULUCF increased by 68.4 per cent, from –1,300.8 Tg CO2 eq to –2,190.5 Tg CO2 eq. Figure 5 shows the trends in Annex I Parties’ total aggregate GHG emissions by sector.
FCCC/SBI/2012/31
11
Figure 5 Greenhouse gas emissions/removals from Annex I Parties by sector, 1990 and 2010a
Abbreviation: LULUCF = land use, land-use change and forestry. a The sector solvent and other product use is not included in the figure because its contribution
to total emissions is very marginal. Emissions from this sector decreased by 26.1 per cent.
19. Between 2009 and 2010, emissions from the energy and industrial processes sectors increased by 3.1 per cent and 9.7 per cent, respectively. Emissions from the agriculture and waste sectors decreased by 0.6 per cent and 0.7 per cent, respectively. Net GHG removals by LULUCF decreased by 2.9 per cent.
20. Within the energy sector, emissions from 1990 to 2010 decreased in all subsectors, except transport, where emissions increased by 11.4 per cent (figure 6). The largest reduction occurred in manufacturing industries and construction (21.5 per cent).
Figure 6 Greenhouse gas emissions from Annex I Parties in the energy sector, 1990 and 2010

FCCC/SBI/2012/31
12
21. From 2009 to 2010, emissions from all activities within the energy sector increased, with emissions from manufacturing industries and construction having the largest increase (6.8 per cent).
22. Emissions from international bunkers increased over the period 1990–2010 (figure 7). GHG emissions increased by 63.6 per cent for aviation and by 7.8 per cent for marine transportation.
Figure 7 Greenhouse gas emissions from Annex I Parties from international bunker fuels, 1990 and 2010
23. Between 2009 and 2010, emissions from aviation increased by 2.5 per cent and emissions from marine transportation decreased by 3.1 per cent.
24. A comparison between the percentage changes in total aggregate emissions from 1990 to the latest available year reported in document FCCC/SBI/2011/9, based on Parties’ 2011 submissions, and those reported in the present document, based on Parties’ 2012 submissions, is presented in table 4. It also provides explanations for the differences in the estimates.
D. Emissions data for individual Annex I Parties
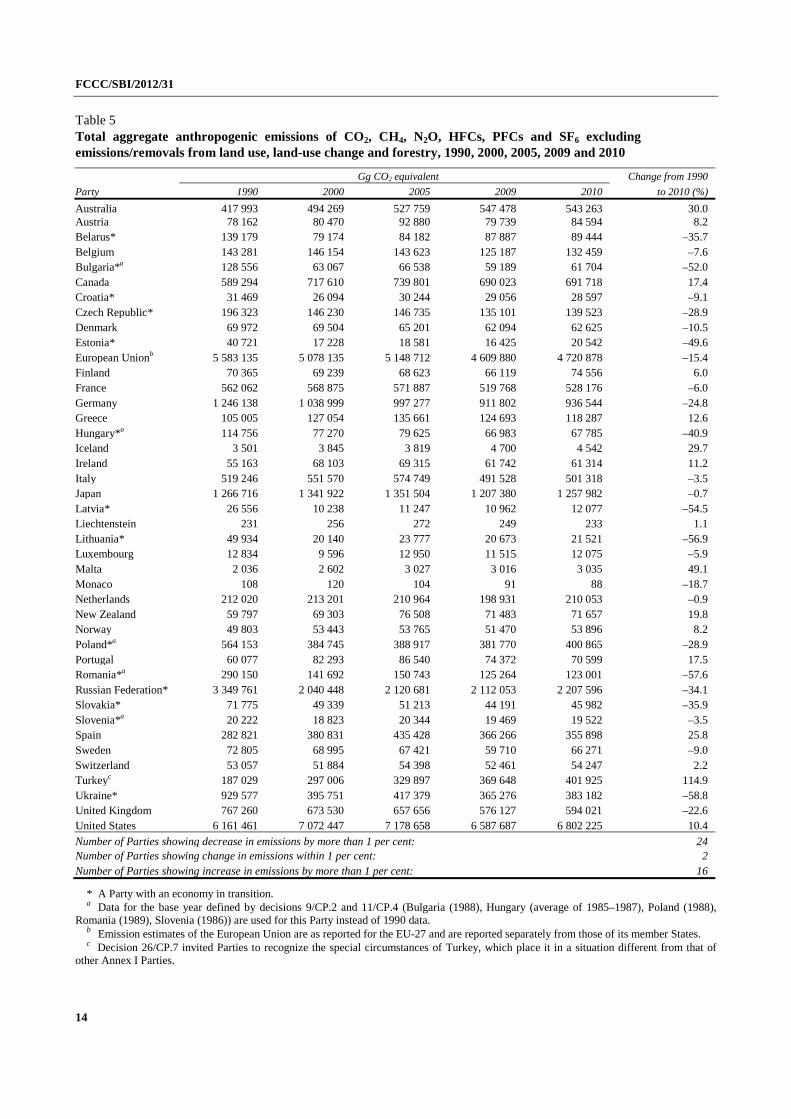
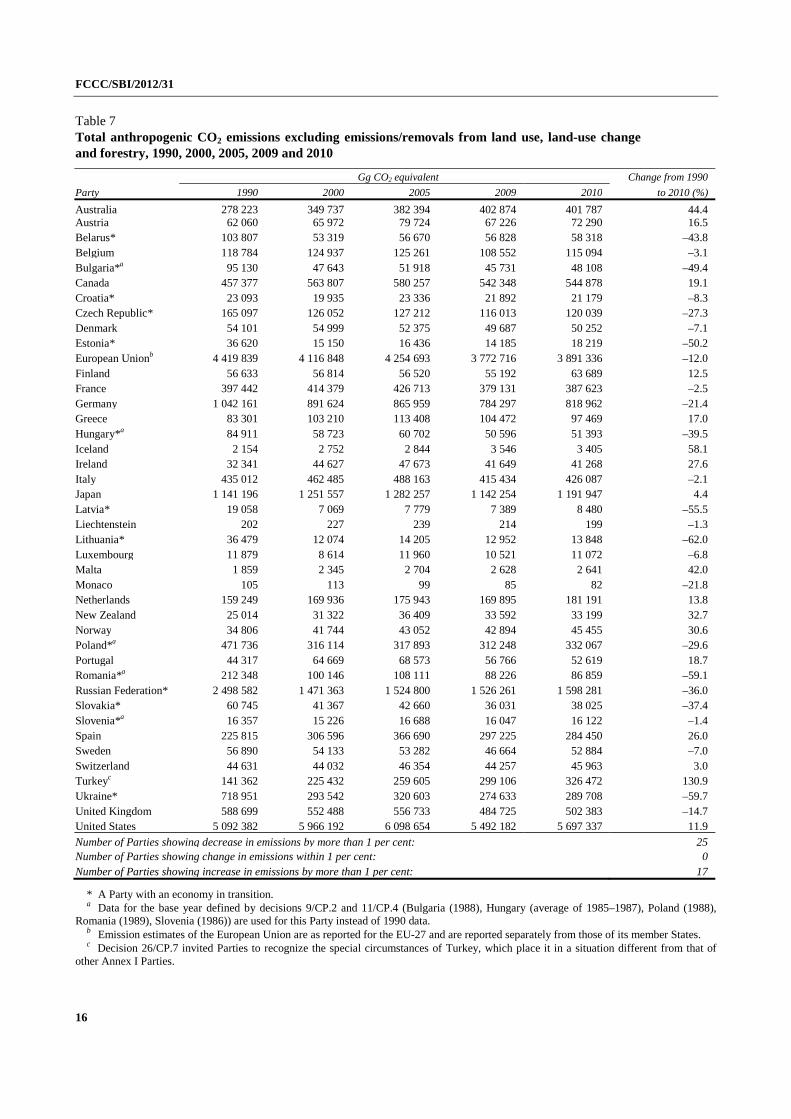
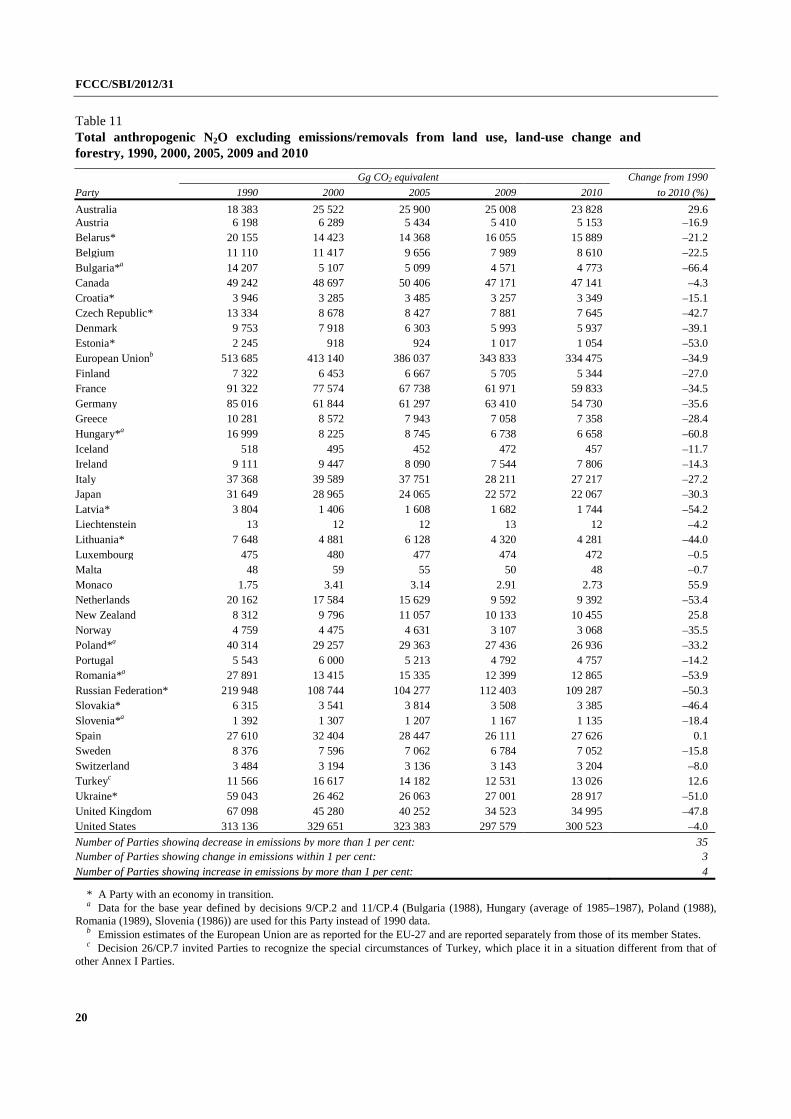
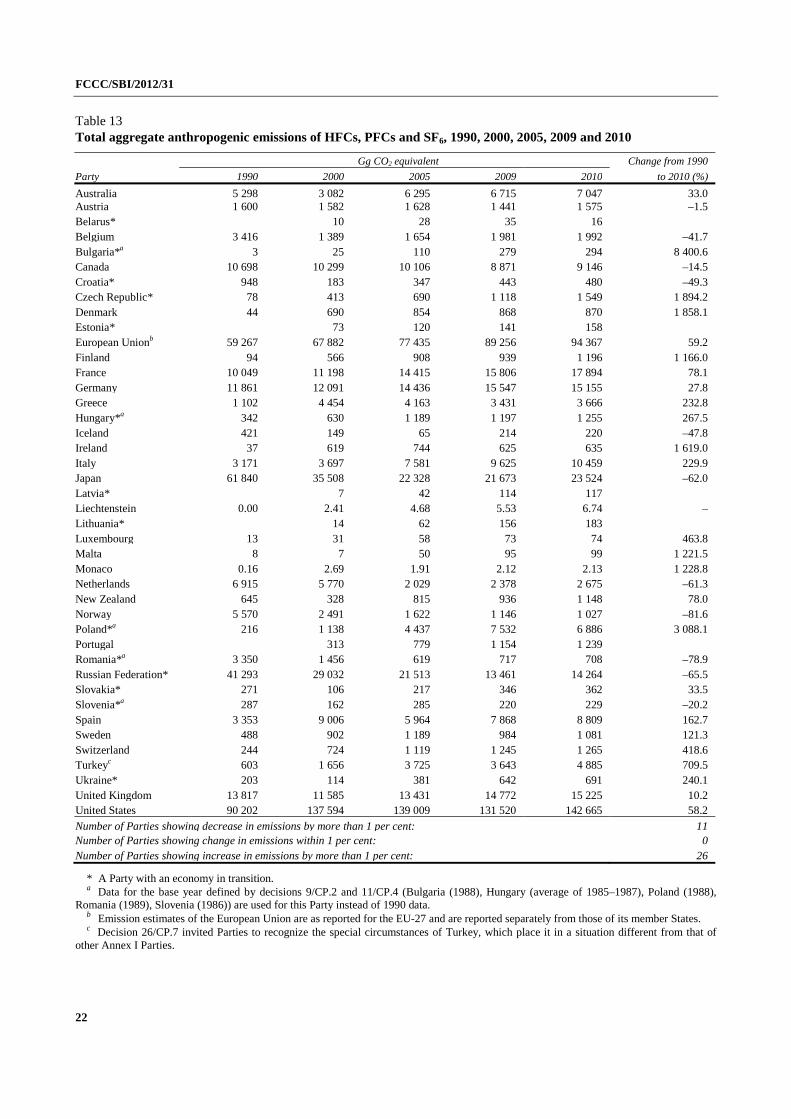
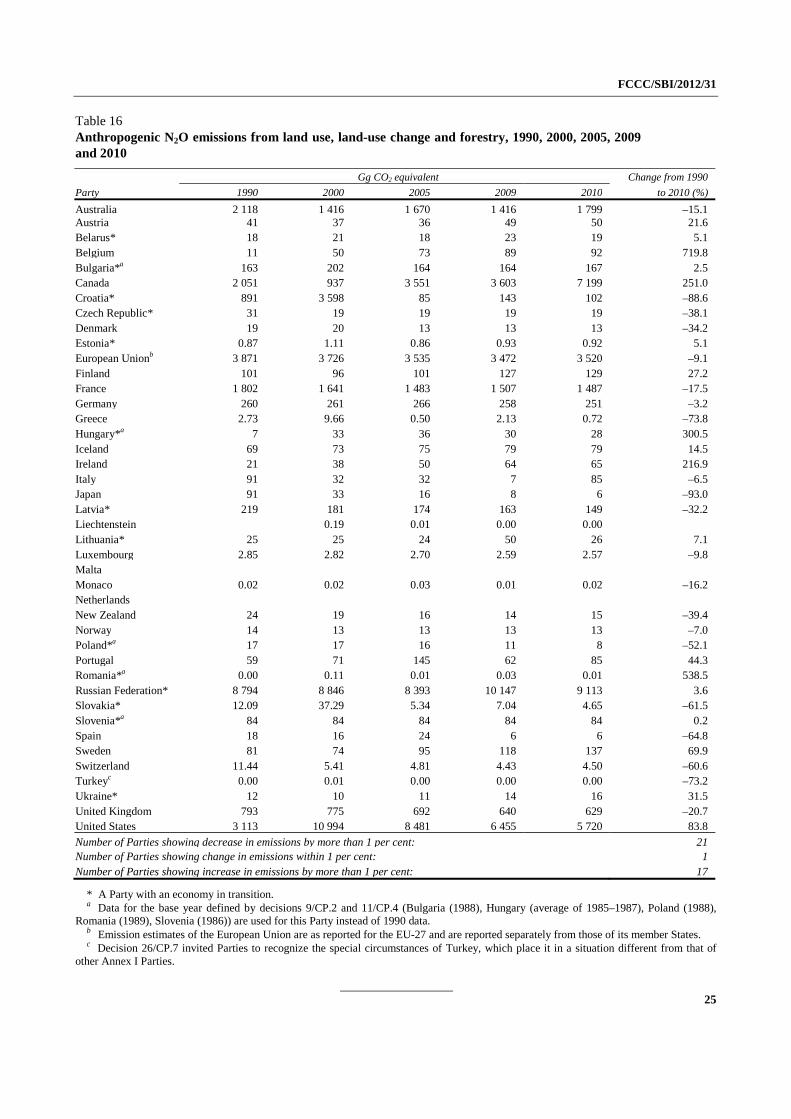
25. Tables 5–16 show detailed GHG data for individual Annex I Parties. Total aggregate GHG emissions excluding and including emissions/removals from LULUCF are provided in tables 5 and 6; emissions of CO2, CH4 and N2O (excluding and including emissions/removals from LULUCF) in tables 7–12; emissions of HFCs, PFCs and SF6 taken together in table 13; and emissions/removals from LULUCF in tables 14–16.
26. Blank cells in the tables denote that either data were not available or notation keys, such as “NO” (not occurring), “NE” (not estimated), “NA” (not applicable), “IE” (included

FCCC/SBI/2012/31
13
elsewhere) or “C” (confidential), were used to report emissions data. Negative values denote removals; positive values denote emissions.
27. The changes in emissions from 1990 to 2010 were calculated using the exact (not rounded) values and may differ from a ratio calculated with the rounded numbers provided in the tables. An en dash (–) signifies percentage changes exceeding 10,000 per cent.
Table 4 Comparison of 2012 and 2011 changes in total aggregate greenhouse gas emissions from Annex I Parties
2011 2012 Explanation of the difference between 2012 and 2011 estimates
Changes in total aggregate GHG emissions excluding LULUCF from 1990 to the latest available year (%)
All Annex I Parties –11.5 –8.9 Combined impact of changes for individual Annex I Parties
Annex I EIT Parties –41.4 –39.2 Increases in emissions of most Annex I EIT Parties between 2009 and 2010
Annex I non-EIT Parties
2.1 4.9 Increases in emissions between 2009 and 2010, for example, in Germany, Japan and the United States
Changes in total aggregate GHG emissions including LULUCF from 1990 to the latest available year (%)
All Annex I Parties –17.6 –14.6 Combined impact of changes for individual Annex I Parties
Annex I EIT Parties –54.4 –52.6 Increases in emissions of most Annex I EIT Parties between 2009 and 2010
Annex I non-EIT Parties
0.6 4.1 Increases in emissions between 2009 and 2010, for example, in Canada, Japan and the United States
Abbreviations: EIT = economies in transition, GHG = greenhouse gas, LULUCF = land use, land-use change and forestry.
FCCC/SBI/2012/31
14
Table 5 Total aggregate anthropogenic emissions of CO2, CH4, N2O, HFCs, PFCs and SF6 excluding emissions/removals from land use, land-use change and forestry, 1990, 2000, 2005, 2009 and 2010
Gg CO2 equivalent Change from 1990 Party 1990 2000 2005 2009 2010 to 2010 (%) Australia 417 993 494 269 527 759 547 478 543 263 30.0Austria 78 162 80 470 92 880 79 739 84 594 8.2Belarus* 139 179 79 174 84 182 87 887 89 444 –35.7Belgium 143 281 146 154 143 623 125 187 132 459 –7.6Bulgaria*a 128 556 63 067 66 538 59 189 61 704 –52.0Canada 589 294 717 610 739 801 690 023 691 718 17.4Croatia* 31 469 26 094 30 244 29 056 28 597 –9.1Czech Republic* 196 323 146 230 146 735 135 101 139 523 –28.9Denmark 69 972 69 504 65 201 62 094 62 625 –10.5Estonia* 40 721 17 228 18 581 16 425 20 542 –49.6European Unionb 5 583 135 5 078 135 5 148 712 4 609 880 4 720 878 –15.4Finland 70 365 69 239 68 623 66 119 74 556 6.0France 562 062 568 875 571 887 519 768 528 176 –6.0Germany 1 246 138 1 038 999 997 277 911 802 936 544 –24.8Greece 105 005 127 054 135 661 124 693 118 287 12.6Hungary*a 114 756 77 270 79 625 66 983 67 785 –40.9Iceland 3 501 3 845 3 819 4 700 4 542 29.7Ireland 55 163 68 103 69 315 61 742 61 314 11.2Italy 519 246 551 570 574 749 491 528 501 318 –3.5Japan 1 266 716 1 341 922 1 351 504 1 207 380 1 257 982 –0.7Latvia* 26 556 10 238 11 247 10 962 12 077 –54.5Liechtenstein 231 256 272 249 233 1.1Lithuania* 49 934 20 140 23 777 20 673 21 521 –56.9Luxembourg 12 834 9 596 12 950 11 515 12 075 –5.9Malta 2 036 2 602 3 027 3 016 3 035 49.1Monaco 108 120 104 91 88 –18.7Netherlands 212 020 213 201 210 964 198 931 210 053 –0.9New Zealand 59 797 69 303 76 508 71 483 71 657 19.8Norway 49 803 53 443 53 765 51 470 53 896 8.2Poland*a 564 153 384 745 388 917 381 770 400 865 –28.9Portugal 60 077 82 293 86 540 74 372 70 599 17.5Romania*a 290 150 141 692 150 743 125 264 123 001 –57.6Russian Federation* 3 349 761 2 040 448 2 120 681 2 112 053 2 207 596 –34.1Slovakia* 71 775 49 339 51 213 44 191 45 982 –35.9Slovenia*a 20 222 18 823 20 344 19 469 19 522 –3.5Spain 282 821 380 831 435 428 366 266 355 898 25.8Sweden 72 805 68 995 67 421 59 710 66 271 –9.0Switzerland 53 057 51 884 54 398 52 461 54 247 2.2Turkeyc 187 029 297 006 329 897 369 648 401 925 114.9Ukraine* 929 577 395 751 417 379 365 276 383 182 –58.8United Kingdom 767 260 673 530 657 656 576 127 594 021 –22.6United States 6 161 461 7 072 447 7 178 658 6 587 687 6 802 225 10.4
Number of Parties showing decrease in emissions by more than 1 per cent: 24Number of Parties showing change in emissions within 1 per cent: 2Number of Parties showing increase in emissions by more than 1 per cent: 16
* A Party with an economy in transition. a Data for the base year defined by decisions 9/CP.2 and 11/CP.4 (Bulgaria (1988), Hungary (average of 1985–1987), Poland (1988),
Romania (1989), Slovenia (1986)) are used for this Party instead of 1990 data. b Emission estimates of the European Union are as reported for the EU-27 and are reported separately from those of its member States. c Decision 26/CP.7 invited Parties to recognize the special circumstances of Turkey, which place it in a situation different from that of
other Annex I Parties.

FCCC/SBI/2012/31
15
Table 6 Total aggregate anthropogenic emissions of CO2, CH4, N2O, HFCs, PFCs and SF6 including emissions/removals from land use, land-use change and forestry, 1990, 2000, 2005, 2009 and 2010
Gg CO2 equivalent Change from 1990 Party 1990 2000 2005 2009 2010 to 2010 (%)Australia 511 034 554 167 534 005 593 298 581 219 13.7Austria 68 140 65 434 85 484 76 095 80 983 18.8Belarus* 110 605 48 271 57 972 57 843 59 265 –46.4Belgium 142 037 145 198 142 666 124 177 131 417 –7.5Bulgaria*a 114 379 54 200 57 460 50 373 53 073 –53.6Canada 521 808 655 502 793 336 677 936 763 682 46.4Croatia* 25 877 24 218 22 582 21 304 20 314 –21.5Czech Republic* 192 705 138 706 140 050 128 238 134 005 –30.5Denmark 74 395 75 398 69 838 61 218 60 455 –18.7Estonia* 31 372 21 361 9 490 9 298 16 784 –46.5European Unionb 5 297 109 4 780 386 4 848 362 4 268 118 4 409 255 –16.8Finland 54 647 49 160 40 011 30 027 52 474 –4.0France 542 673 544 367 531 688 483 615 495 952 –8.6Germany 1 218 439 1 012 473 1 013 075 929 024 953 827 –21.7Greece 102 464 124 223 132 770 121 879 115 645 12.9Hungary*a 112 585 76 880 75 212 63 667 64 413 –42.8Iceland 4 690 4 848 4 696 5 459 5 276 12.5Ireland 55 364 68 496 69 099 60 706 60 284 8.9Italy 484 761 508 504 521 174 435 583 444 787 –8.2Japan 1 196 640 1 254 183 1 260 787 1 135 523 1 184 803 –1.0Latvia* 10 544 –4 251 –6 121 –9 627 –5 070 –148.1Liechtenstein 222 252 266 243 227 2.1Lithuania* 43 643 12 557 20 990 9 746 9 807 –77.5Luxembourg 13 182 9 211 12 565 11 219 11 780 –10.6Malta 1 979 2 545 2 968 2 955 2 973 50.3Monaco 108 120 104 91 88 –18.7Netherlands 215 020 216 125 214 001 201 797 213 054 –0.9New Zealand 32 409 42 732 51 695 45 249 51 677 59.5Norway 41 126 34 373 23 875 24 485 20 951 –49.1Poland*a 552 445 366 503 352 328 339 797 357 985 –35.2Portugal 53 190 70 254 83 190 62 529 60 719 14.2Romania*a 268 709 112 544 122 745 97 000 97 219 –63.8Russian Federation* 3 429 827 1 575 702 1 577 722 1 460 346 1 555 159 –54.7Slovakia* 61 480 39 056 45 931 36 963 39 893 –35.1Slovenia*a 12 616 11 629 11 940 11 078 11 031 –12.6Spain 263 715 357 568 410 883 337 722 326 944 24.0Sweden 31 545 30 084 36 531 23 962 32 216 2.1Switzerland 49 210 52 137 52 539 51 362 53 367 8.4Turkeyc 130 576 234 827 271 626 295 996 323 201 147.5Ukraine* 859 840 344 911 378 938 347 008 345 226 –59.8United Kingdom 771 153 673 907 654 711 571 919 590 179 –23.5United States 5 293 369 6 424 130 6 118 282 5 545 717 5 747 137 8.6
Number of Parties showing decrease in emissions by more than 1 per cent: 25Number of Parties showing change in emissions within 1 per cent: 2Number of Parties showing increase in emissions by more than 1 per cent: 15
* A Party with an economy in transition. a Data for the base year defined by decisions 9/CP.2 and 11/CP.4 (Bulgaria (1988), Hungary (average of 1985–1987), Poland (1988),
Romania (1989), Slovenia (1986)) are used for this Party instead of 1990 data. b Emission estimates of the European Union are as reported for the EU-27 and are reported separately from those of its member States. c Decision 26/CP.7 invited Parties to recognize the special circumstances of Turkey, which place it in a situation different from that of
other Annex I Parties.
FCCC/SBI/2012/31
16
Table 7 Total anthropogenic CO2 emissions excluding emissions/removals from land use, land-use change and forestry, 1990, 2000, 2005, 2009 and 2010
Gg CO2 equivalent Change from 1990 Party 1990 2000 2005 2009 2010 to 2010 (%)Australia 278 223 349 737 382 394 402 874 401 787 44.4Austria 62 060 65 972 79 724 67 226 72 290 16.5Belarus* 103 807 53 319 56 670 56 828 58 318 –43.8Belgium 118 784 124 937 125 261 108 552 115 094 –3.1Bulgaria*a 95 130 47 643 51 918 45 731 48 108 –49.4Canada 457 377 563 807 580 257 542 348 544 878 19.1Croatia* 23 093 19 935 23 336 21 892 21 179 –8.3Czech Republic* 165 097 126 052 127 212 116 013 120 039 –27.3Denmark 54 101 54 999 52 375 49 687 50 252 –7.1Estonia* 36 620 15 150 16 436 14 185 18 219 –50.2European Unionb 4 419 839 4 116 848 4 254 693 3 772 716 3 891 336 –12.0Finland 56 633 56 814 56 520 55 192 63 689 12.5France 397 442 414 379 426 713 379 131 387 623 –2.5Germany 1 042 161 891 624 865 959 784 297 818 962 –21.4Greece 83 301 103 210 113 408 104 472 97 469 17.0Hungary*a 84 911 58 723 60 702 50 596 51 393 –39.5Iceland 2 154 2 752 2 844 3 546 3 405 58.1Ireland 32 341 44 627 47 673 41 649 41 268 27.6Italy 435 012 462 485 488 163 415 434 426 087 –2.1Japan 1 141 196 1 251 557 1 282 257 1 142 254 1 191 947 4.4Latvia* 19 058 7 069 7 779 7 389 8 480 –55.5Liechtenstein 202 227 239 214 199 –1.3Lithuania* 36 479 12 074 14 205 12 952 13 848 –62.0Luxembourg 11 879 8 614 11 960 10 521 11 072 –6.8Malta 1 859 2 345 2 704 2 628 2 641 42.0Monaco 105 113 99 85 82 –21.8Netherlands 159 249 169 936 175 943 169 895 181 191 13.8New Zealand 25 014 31 322 36 409 33 592 33 199 32.7Norway 34 806 41 744 43 052 42 894 45 455 30.6Poland*a 471 736 316 114 317 893 312 248 332 067 –29.6Portugal 44 317 64 669 68 573 56 766 52 619 18.7Romania*a 212 348 100 146 108 111 88 226 86 859 –59.1Russian Federation* 2 498 582 1 471 363 1 524 800 1 526 261 1 598 281 –36.0Slovakia* 60 745 41 367 42 660 36 031 38 025 –37.4Slovenia*a 16 357 15 226 16 688 16 047 16 122 –1.4Spain 225 815 306 596 366 690 297 225 284 450 26.0Sweden 56 890 54 133 53 282 46 664 52 884 –7.0Switzerland 44 631 44 032 46 354 44 257 45 963 3.0Turkeyc 141 362 225 432 259 605 299 106 326 472 130.9Ukraine* 718 951 293 542 320 603 274 633 289 708 –59.7United Kingdom 588 699 552 488 556 733 484 725 502 383 –14.7United States 5 092 382 5 966 192 6 098 654 5 492 182 5 697 337 11.9
Number of Parties showing decrease in emissions by more than 1 per cent: 25Number of Parties showing change in emissions within 1 per cent: 0Number of Parties showing increase in emissions by more than 1 per cent: 17
* A Party with an economy in transition. a Data for the base year defined by decisions 9/CP.2 and 11/CP.4 (Bulgaria (1988), Hungary (average of 1985–1987), Poland (1988),
Romania (1989), Slovenia (1986)) are used for this Party instead of 1990 data. b Emission estimates of the European Union are as reported for the EU-27 and are reported separately from those of its member States. c Decision 26/CP.7 invited Parties to recognize the special circumstances of Turkey, which place it in a situation different from that of
other Annex I Parties.

FCCC/SBI/2012/31
17
Table 8 Total anthropogenic CO2 emissions including emissions/removals from land use, land-use change and forestry, 1990, 2000, 2005, 2009 and 2010
Gg CO2 equivalent Change from 1990 Party 1990 2000 2005 2009 2010 to 2010 (%)Australia 364 316 405 419 382 905 444 209 434 349 19.2Austria 51 995 50 899 72 292 63 532 68 630 32.0Belarus* 75 207 22 387 30 438 26 752 28 116 –62.6Belgium 117 529 123 931 124 232 107 453 113 959 –3.0Bulgaria*a 80 788 38 402 42 672 36 743 39 290 –51.4Canada 384 524 499 252 624 521 520 853 598 045 55.5Croatia* 16 348 13 397 15 565 13 956 12 766 –21.9Czech Republic* 161 348 118 416 120 394 109 009 114 373 –29.1Denmark 58 505 60 873 56 998 48 798 48 070 –17.8Estonia* 27 270 19 279 7 344 7 057 14 460 –47.0European Unionb 4 125 722 3 810 019 3 945 674 3 422 996 3 571 558 –13.4Finland 40 775 36 597 27 764 18 924 41 429 1.6France 375 070 386 076 383 208 339 733 352 129 –6.1Germany 1 014 192 864 834 881 490 801 257 835 991 –17.6Greece 80 730 100 274 110 511 101 636 94 819 17.5Hungary*a 82 703 58 268 56 217 47 226 47 970 –42.0Iceland 3 271 3 674 3 638 4 218 4 051 23.8Ireland 32 519 44 979 47 405 40 548 40 165 23.5Italy 400 254 419 281 434 508 359 413 369 428 –7.7Japan 1 071 021 1 163 777 1 191 515 1 070 381 1 118 760 4.5Latvia* 2 808 –7 660 –9 798 –13 397 –8 856 –415.4Liechtenstein 193 223 233 208 193 –0.2Lithuania* 30 161 4 463 11 394 1 972 2 107 –93.0Luxembourg 12 224 8 226 11 571 10 221 10 774 –11.9Malta 1 802 2 287 2 645 2 568 2 579 43.1Monaco 105 113 99 85 82 –21.8Netherlands 162 249 172 860 178 980 172 761 184 193 13.5New Zealand –2 448 4 687 11 533 7 290 13 150 –637.2Norway 26 114 22 660 13 148 15 893 12 496 –52.1Poland*a 457 820 295 649 279 066 268 034 286 944 –37.3Portugal 37 158 52 377 64 566 44 788 42 471 14.3Romania*a 190 907 70 998 80 112 59 962 61 076 –68.0Russian Federation* 2 559 672 987 586 963 659 852 506 926 082 –63.8Slovakia* 50 424 31 036 37 350 28 775 31 909 –36.7Slovenia*a 8 667 7 945 8 197 7 570 7 546 –12.9Spain 206 519 283 157 341 885 268 613 255 430 23.7Sweden 15 548 15 144 22 292 10 795 18 690 20.2Switzerland 40 764 44 280 44 489 43 153 45 078 10.6Turkeyc 84 909 163 253 201 335 225 454 247 748 191.8Ukraine* 649 194 242 688 282 146 256 337 251 714 –61.2United Kingdom 591 781 552 063 553 075 479 853 497 883 –15.9United States 4 218 651 5 295 317 5 021 658 4 437 958 4 631 685 9.8
Number of Parties showing decrease in emissions by more than 1 per cent: 25Number of Parties showing change in emissions within 1 per cent: 1Number of Parties showing increase in emissions by more than 1 per cent: 16
* A Party with an economy in transition. a Data for the base year defined by decisions 9/CP.2 and 11/CP.4 (Bulgaria (1988), Hungary (average of 1985–1987), Poland (1988),
Romania (1989), Slovenia (1986)) are used for this Party instead of 1990 data. b Emission estimates of the European Union are as reported for the EU-27 and are reported separately from those of its member States. c Decision 26/CP.7 invited Parties to recognize the special circumstances of Turkey, which place it in a situation different from that of
other Annex I Parties.

FCCC/SBI/2012/31
18
Table 9 Total anthropogenic CH4 emissions excluding emissions/removals from land use, land-use change and forestry, 1990, 2000, 2005, 2009 and 2010
Gg CO2 equivalent Change from 1990 Party 1990 2000 2005 2009 2010 to 2010 (%)Australia 116 089 115 928 113 170 112 880 110 600 –4.7Austria 8 305 6 626 6 095 5 663 5 575 –32.9Belarus* 15 217 11 422 13 116 14 969 15 222 0.0Belgium 9 971 8 411 7 052 6 664 6 764 –32.2Bulgaria*a 19 216 10 293 9 412 8 609 8 529 –55.6Canada 71 976 94 806 99 032 91 633 90 553 25.8Croatia* 3 483 2 691 3 075 3 464 3 589 3.0Czech Republic* 17 815 11 087 10 406 10 089 10 290 –42.2Denmark 6 073 5 898 5 669 5 547 5 566 –8.3Estonia* 1 856 1 088 1 101 1 083 1 111 –40.2European Unionb 590 343 480 266 430 547 404 075 400 699 –32.1Finland 6 315 5 406 4 527 4 282 4 327 –31.5France 63 248 65 725 63 020 62 859 62 826 –0.7Germany 107 100 73 440 55 586 48 548 47 696 –55.5Greece 10 322 10 818 10 148 9 731 9 795 –5.1Hungary*a 12 504 9 693 8 990 8 453 8 479 –32.2Iceland 409 449 458 468 460 12.5Ireland 13 673 13 411 12 808 11 924 11 605 –15.1Italy 43 695 45 799 41 255 38 259 37 554 –14.1Japan 32 030 25 892 22 855 20 881 20 443 –36.2Latvia* 3 694 1 757 1 819 1 777 1 736 –53.0Liechtenstein 16 14 16 17 15 –6.4Lithuania* 5 807 3 171 3 382 3 245 3 209 –44.7Luxembourg 467 472 455 448 457 –2.2Malta 121 191 218 242 248 104.1Monaco 0.66 0.81 0.63 0.57 0.55 –16.3Netherlands 25 694 19 911 17 362 17 066 16 794 –34.6New Zealand 25 826 27 856 28 228 26 822 26 855 4.0Norway 4 667 4 733 4 460 4 324 4 346 –6.9Poland*a 51 887 38 236 37 224 34 553 34 976 –32.6Portugal 10 217 11 311 11 975 11 660 11 984 17.3Romania*a 46 561 26 675 26 679 23 921 22 569 –51.5Russian Federation* 589 938 431 308 470 091 459 928 485 764 –17.7Slovakia* 4 444 4 324 4 521 4 306 4 210 –5.3Slovenia*a 2 187 2 127 2 165 2 035 2 036 –6.9Spain 26 043 32 824 34 328 35 062 35 012 34.4Sweden 7 050 6 365 5 887 5 278 5 255 –25.5Switzerland 4 699 3 934 3 790 3 816 3 816 –18.8Turkeyc 33 498 53 300 52 384 54 368 57 542 71.8Ukraine* 151 379 75 633 70 332 62 999 63 865 –57.8United Kingdom 97 646 64 178 47 240 42 107 41 418 –57.6United States 665 741 639 010 617 612 666 406 661 699 –0.6
Number of Parties showing decrease in emissions by more than 1 per cent: 31Number of Parties showing change in emissions within 1 per cent: 3Number of Parties showing increase in emissions by more than 1 per cent: 8
* A Party with an economy in transition. a Data for the base year defined by decisions 9/CP.2 and 11/CP.4 (Bulgaria (1988), Hungary (average of 1985–1987), Poland (1988),
Romania (1989), Slovenia (1986)) are used for this Party instead of 1990 data. b Emission estimates of the European Union are as reported for the EU-27 and are reported separately from those of its member States. c Decision 26/CP.7 invited Parties to recognize the special circumstances of Turkey, which place it in a situation different from that of
other Annex I Parties.

FCCC/SBI/2012/31
19
Table 10 Total anthropogenic CH4 emissions including emissions/removals from land use, land-use change and forestry, 1990, 2000, 2005, 2009 and 2010
Gg CO2 equivalent Change from 1990 Party 1990 2000 2005 2009 2010 to 2010 (%)Australia 120 919 118 729 117 235 115 949 114 196 –5.6Austria 8 305 6 626 6 095 5 664 5 575 –32.9Belarus* 15 224 11 430 13 120 14 978 15 227 0.0Belgium 9 972 8 411 7 052 6 664 6 764 –32.2Bulgaria*a 19 218 10 464 9 416 8 616 8 548 –55.5Canada 75 293 96 316 104 752 97 438 102 151 35.7Croatia* 3 745 3 756 3 099 3 504 3 617 –3.4Czech Republic* 17 915 11 180 10 519 10 211 10 418 –41.8Denmark 6 073 5 898 5 669 5 547 5 566 –8.4Estonia* 1 856 1 090 1 101 1 083 1 111 –40.2European Unionb 594 563 485 620 435 681 408 562 405 335 –31.8Finland 6 354 5 448 4 571 4 331 4 377 –31.1France 64 430 67 878 64 844 64 597 64 608 0.3Germany 107 109 73 444 55 587 48 553 47 699 –55.5Greece 10 349 10 913 10 153 9 752 9 802 –5.3Hungary*a 12 535 9 724 9 026 8 476 8 502 –32.2Iceland 411 457 466 476 469 14.1Ireland 13 676 13 413 12 809 11 925 11 612 –15.1Italy 43 878 45 905 41 303 38 327 37 597 –14.3Japan 32 039 25 900 22 864 20 889 20 445 –36.2Latvia* 3 713 1 816 1 853 1 812 1 776 –52.2Liechtenstein 16 14 16 17 15 –6.4Lithuania* 5 810 3 174 3 383 3 248 3 210 –44.7Luxembourg 467 472 455 448 457 –2.2Malta 121 191 218 242 248 104.1Monaco 0.66 0.81 0.63 0.57 0.55 –16.3Netherlands 25 694 19 911 17 362 17 066 16 794 –34.6New Zealand 25 876 27 902 28 275 26 876 26 909 4.0Norway 4 669 4 734 4 461 4 327 4 347 –6.9Poland*a 54 077 40 443 39 446 36 784 37 210 –31.2Portugal 10 430 11 493 12 487 11 734 12 167 16.7Romania*a 46 561 26 675 26 679 23 921 22 569 –51.5Russian Federation* 600 121 441 492 479 880 471 829 496 414 –17.3Slovakia* 4 458 4 336 4 544 4 327 4 233 –5.0Slovenia*a 2 187 2 129 2 168 2 037 2 037 –6.9Spain 26 216 32 985 34 564 35 124 35 073 33.8Sweden 7 052 6 368 5 892 5 281 5 255 –25.5Switzerland 4 707 3 935 3 790 3 816 3 816 –18.9Turkeyc 33 498 53 300 52 384 54 368 57 542 71.8Ukraine* 151 387 75 637 70 337 63 014 63 888 –57.8United Kingdom 97 664 64 205 47 261 42 131 41 447 –57.6United States 668 267 650 575 625 752 672 205 666 543 –0.3
Number of Parties showing decrease in emissions by more than 1 per cent: 32Number of Parties showing change in emissions within 1 per cent: 3Number of Parties showing increase in emissions by more than 1 per cent: 7
* A Party with an economy in transition. a Data for the base year defined by decisions 9/CP.2 and 11/CP.4 (Bulgaria (1988), Hungary (average of 1985–1987), Poland (1988),
Romania (1989), Slovenia (1986)) are used for this Party instead of 1990 data. b Emission estimates of the European Union are as reported for the EU-27 and are reported separately from those of its member States. c Decision 26/CP.7 invited Parties to recognize the special circumstances of Turkey, which place it in a situation different from that of
other Annex I Parties.
FCCC/SBI/2012/31
20
Table 11 Total anthropogenic N2O excluding emissions/removals from land use, land-use change and forestry, 1990, 2000, 2005, 2009 and 2010
Gg CO2 equivalent Change from 1990 Party 1990 2000 2005 2009 2010 to 2010 (%)Australia 18 383 25 522 25 900 25 008 23 828 29.6Austria 6 198 6 289 5 434 5 410 5 153 –16.9Belarus* 20 155 14 423 14 368 16 055 15 889 –21.2Belgium 11 110 11 417 9 656 7 989 8 610 –22.5Bulgaria*a 14 207 5 107 5 099 4 571 4 773 –66.4Canada 49 242 48 697 50 406 47 171 47 141 –4.3Croatia* 3 946 3 285 3 485 3 257 3 349 –15.1Czech Republic* 13 334 8 678 8 427 7 881 7 645 –42.7Denmark 9 753 7 918 6 303 5 993 5 937 –39.1Estonia* 2 245 918 924 1 017 1 054 –53.0European Unionb 513 685 413 140 386 037 343 833 334 475 –34.9Finland 7 322 6 453 6 667 5 705 5 344 –27.0France 91 322 77 574 67 738 61 971 59 833 –34.5Germany 85 016 61 844 61 297 63 410 54 730 –35.6Greece 10 281 8 572 7 943 7 058 7 358 –28.4Hungary*a 16 999 8 225 8 745 6 738 6 658 –60.8Iceland 518 495 452 472 457 –11.7Ireland 9 111 9 447 8 090 7 544 7 806 –14.3Italy 37 368 39 589 37 751 28 211 27 217 –27.2Japan 31 649 28 965 24 065 22 572 22 067 –30.3Latvia* 3 804 1 406 1 608 1 682 1 744 –54.2Liechtenstein 13 12 12 13 12 –4.2Lithuania* 7 648 4 881 6 128 4 320 4 281 –44.0Luxembourg 475 480 477 474 472 –0.5Malta 48 59 55 50 48 –0.7Monaco 1.75 3.41 3.14 2.91 2.73 55.9Netherlands 20 162 17 584 15 629 9 592 9 392 –53.4New Zealand 8 312 9 796 11 057 10 133 10 455 25.8Norway 4 759 4 475 4 631 3 107 3 068 –35.5Poland*a 40 314 29 257 29 363 27 436 26 936 –33.2Portugal 5 543 6 000 5 213 4 792 4 757 –14.2Romania*a 27 891 13 415 15 335 12 399 12 865 –53.9Russian Federation* 219 948 108 744 104 277 112 403 109 287 –50.3Slovakia* 6 315 3 541 3 814 3 508 3 385 –46.4Slovenia*a 1 392 1 307 1 207 1 167 1 135 –18.4Spain 27 610 32 404 28 447 26 111 27 626 0.1Sweden 8 376 7 596 7 062 6 784 7 052 –15.8Switzerland 3 484 3 194 3 136 3 143 3 204 –8.0Turkeyc 11 566 16 617 14 182 12 531 13 026 12.6Ukraine* 59 043 26 462 26 063 27 001 28 917 –51.0United Kingdom 67 098 45 280 40 252 34 523 34 995 –47.8United States 313 136 329 651 323 383 297 579 300 523 –4.0
Number of Parties showing decrease in emissions by more than 1 per cent: 35Number of Parties showing change in emissions within 1 per cent: 3Number of Parties showing increase in emissions by more than 1 per cent: 4
* A Party with an economy in transition. a Data for the base year defined by decisions 9/CP.2 and 11/CP.4 (Bulgaria (1988), Hungary (average of 1985–1987), Poland (1988),
Romania (1989), Slovenia (1986)) are used for this Party instead of 1990 data. b Emission estimates of the European Union are as reported for the EU-27 and are reported separately from those of its member States. c Decision 26/CP.7 invited Parties to recognize the special circumstances of Turkey, which place it in a situation different from that of
other Annex I Parties.

FCCC/SBI/2012/31
21
Table 12 Total anthropogenic N2O emissions including emissions/removals from land use, land-use change and forestry, 1990, 2000, 2005, 2009 and 2010
Gg CO2 equivalent Change from 1990 Party 1990 2000 2005 2009 2010 to 2010 (%)Australia 20 501 26 938 27 570 26 425 25 627 25.0Austria 6 239 6 326 5 470 5 458 5 203 –16.6Belarus* 20 173 14 444 14 385 16 079 15 907 –21.1Belgium 11 121 11 468 9 729 8 078 8 702 –21.8Bulgaria*a 14 370 5 309 5 262 4 735 4 940 –65.6Canada 51 293 49 634 53 957 50 774 54 340 5.9Croatia* 4 837 6 883 3 571 3 400 3 450 –28.7Czech Republic* 13 365 8 697 8 446 7 899 7 665 –42.6Denmark 9 773 7 937 6 316 6 005 5 950 –39.1Estonia* 2 246 919 925 1 018 1 055 –53.0European Unionb 517 557 416 866 389 572 347 305 337 995 –34.7Finland 7 423 6 549 6 768 5 832 5 473 –26.3France 93 124 79 215 69 221 63 478 61 320 –34.2Germany 85 276 62 105 61 563 63 667 54 982 –35.5Greece 10 284 8 581 7 943 7 060 7 358 –28.4Hungary*a 17 006 8 258 8 781 6 768 6 686 –60.7Iceland 587 568 527 551 536 –8.6Ireland 9 132 9 485 8 140 7 608 7 872 –13.8Italy 37 459 39 621 37 782 28 218 27 302 –27.1Japan 31 740 28 997 24 081 22 580 22 074 –30.5Latvia* 4 023 1 586 1 782 1 845 1 892 –53.0Liechtenstein 13 12 12 13 12 –4.2Lithuania* 7 672 4 906 6 151 4 370 4 307 –43.9Luxembourg 478 482 480 476 475 –0.5Malta 48 59 55 50 48 –0.7Monaco 1.77 3.44 3.17 2.93 2.75 55.0Netherlands 20 162 17 584 15 629 9 592 9 392 –53.4New Zealand 8 336 9 815 11 073 10 147 10 469 25.6Norway 4 773 4 488 4 643 3 120 3 081 –35.5Poland*a 40 332 29 274 29 379 27 447 26 945 –33.2Portugal 5 602 6 071 5 358 4 854 4 842 –13.6Romania*a 27 891 13 416 15 335 12 399 12 865 –53.9Russian Federation* 228 742 117 590 112 671 122 550 118 400 –48.2Slovakia* 6 327 3 579 3 820 3 515 3 389 –46.4Slovenia*a 1 476 1 392 1 291 1 252 1 219 –17.4Spain 27 627 32 420 28 471 26 118 27 633 0.0Sweden 8 457 7 670 7 158 6 902 7 190 –15.0Switzerland 3 495 3 200 3 140 3 148 3 209 –8.2Turkeyc 11 566 16 617 14 182 12 531 13 026 12.6Ukraine* 59 055 26 473 26 074 27 015 28 933 –51.0United Kingdom 67 890 46 054 40 944 35 163 35 624 –47.5United States 316 249 340 645 331 864 304 034 306 243 –3.2
Number of Parties showing decrease in emissions by more than 1 per cent: 34Number of Parties showing change in emissions within 1 per cent: 3Number of Parties showing increase in emissions by more than 1 per cent: 5
* A Party with an economy in transition. a Data for the base year defined by decisions 9/CP.2 and 11/CP.4 (Bulgaria (1988), Hungary (average of 1985–1987), Poland (1988),
Romania (1989), Slovenia (1986)) are used for this Party instead of 1990 data. b Emission estimates of the European Union are as reported for the EU-27 and are reported separately from those of its member States. c Decision 26/CP.7 invited Parties to recognize the special circumstances of Turkey, which place it in a situation different from that of
other Annex I Parties.
FCCC/SBI/2012/31
22
Table 13 Total aggregate anthropogenic emissions of HFCs, PFCs and SF6, 1990, 2000, 2005, 2009 and 2010
Gg CO2 equivalent Change from 1990 Party 1990 2000 2005 2009 2010 to 2010 (%)Australia 5 298 3 082 6 295 6 715 7 047 33.0Austria 1 600 1 582 1 628 1 441 1 575 –1.5Belarus* 10 28 35 16 Belgium 3 416 1 389 1 654 1 981 1 992 –41.7Bulgaria*a 3 25 110 279 294 8 400.6Canada 10 698 10 299 10 106 8 871 9 146 –14.5Croatia* 948 183 347 443 480 –49.3Czech Republic* 78 413 690 1 118 1 549 1 894.2Denmark 44 690 854 868 870 1 858.1Estonia* 73 120 141 158 European Unionb 59 267 67 882 77 435 89 256 94 367 59.2Finland 94 566 908 939 1 196 1 166.0France 10 049 11 198 14 415 15 806 17 894 78.1Germany 11 861 12 091 14 436 15 547 15 155 27.8Greece 1 102 4 454 4 163 3 431 3 666 232.8Hungary*a 342 630 1 189 1 197 1 255 267.5Iceland 421 149 65 214 220 –47.8Ireland 37 619 744 625 635 1 619.0Italy 3 171 3 697 7 581 9 625 10 459 229.9Japan 61 840 35 508 22 328 21 673 23 524 –62.0Latvia* 7 42 114 117 Liechtenstein 0.00 2.41 4.68 5.53 6.74 –Lithuania* 14 62 156 183 Luxembourg 13 31 58 73 74 463.8Malta 8 7 50 95 99 1 221.5Monaco 0.16 2.69 1.91 2.12 2.13 1 228.8Netherlands 6 915 5 770 2 029 2 378 2 675 –61.3New Zealand 645 328 815 936 1 148 78.0Norway 5 570 2 491 1 622 1 146 1 027 –81.6Poland*a 216 1 138 4 437 7 532 6 886 3 088.1Portugal 313 779 1 154 1 239 Romania*a 3 350 1 456 619 717 708 –78.9Russian Federation* 41 293 29 032 21 513 13 461 14 264 –65.5Slovakia* 271 106 217 346 362 33.5Slovenia*a 287 162 285 220 229 –20.2Spain 3 353 9 006 5 964 7 868 8 809 162.7Sweden 488 902 1 189 984 1 081 121.3Switzerland 244 724 1 119 1 245 1 265 418.6Turkeyc 603 1 656 3 725 3 643 4 885 709.5Ukraine* 203 114 381 642 691 240.1United Kingdom 13 817 11 585 13 431 14 772 15 225 10.2United States 90 202 137 594 139 009 131 520 142 665 58.2
Number of Parties showing decrease in emissions by more than 1 per cent: 11Number of Parties showing change in emissions within 1 per cent: 0Number of Parties showing increase in emissions by more than 1 per cent: 26
* A Party with an economy in transition. a Data for the base year defined by decisions 9/CP.2 and 11/CP.4 (Bulgaria (1988), Hungary (average of 1985–1987), Poland (1988),
Romania (1989), Slovenia (1986)) are used for this Party instead of 1990 data. b Emission estimates of the European Union are as reported for the EU-27 and are reported separately from those of its member States. c Decision 26/CP.7 invited Parties to recognize the special circumstances of Turkey, which place it in a situation different from that of
other Annex I Parties.

FCCC/SBI/2012/31
23
Table 14 Net anthropogenic CO2 emissions and removals from land use, land-use change and forestry, 1990, 2000, 2005, 2009 and 2010
Gg CO2 equivalent Change from 1990 Party 1990 2000 2005 2009 2010 to 2010 (%)Australia 86 093 55 682 511 41 335 32 561 –62.2Austria –10 064 –15 073 –7 431 –3 694 –3 661 –63.6Belarus* –28 599 –30 932 –26 231 –30 076 –30 203 5.6Belgium –1 255 –1 006 –1 029 –1 099 –1 134 –9.6Bulgaria*a –14 342 –9 241 –9 246 –8 987 –8 818 –38.5Canada –72 853 –64 555 44 264 –21 495 53 167 –173.0Croatia* –6 746 –6 538 –7 772 –7 936 –8 413 24.7Czech Republic* –3 749 –7 636 –6 817 –7 003 –5 666 51.1Denmark 4 403 5 874 4 624 –889 –2 182 –149.6Estonia* –9 350 4 129 –9 092 –7 128 –3 759 –59.8European Unionb –294 117 –306 830 –309 018 –349 721 –319 779 8.7Finland –15 859 –20 217 –28 756 –36 268 –22 260 40.4France –22 372 –28 303 –43 505 –39 398 –35 494 58.6Germany –27 968 –26 791 15 531 16 959 17 028 –160.9Greece –2 571 –2 936 –2 897 –2 837 –2 650 3.1Hungary*a –2 209 –455 –4 485 –3 370 –3 423 55.0Iceland 1 118 922 794 672 647 –42.2Ireland 178 351 –268 –1 101 –1 103 –719.1Italy –34 758 –43 204 –53 655 –56 022 –56 659 63.0Japan –70 175 –87 780 –90 742 –71 873 –73 188 4.3Latvia* –16 250 –14 729 –17 576 –20 786 –17 336 6.7Liechtenstein –8.22 –3.43 –6.06 –6.02 –6.00 –26.9Lithuania* –6 318 –7 611 –2 811 –10 980 –11 742 85.8Luxembourg 345 –388 –388 –299 –298 –186.4Malta –57 –58 –59 –61 –62 8.1Monaco –0.03 –0.04 –0.04 –0.04 –0.04 14.0Netherlands 3 000 2 924 3 037 2 865 3 001 0.0New Zealand –27 462 –26 635 –24 876 –26 302 –20 049 –27.0Norway –8 692 –19 084 –29 904 –27 001 –32 959 279.2Poland*a –13 916 –20 465 –38 827 –44 214 –45 123 224.3Portugal –7 159 –12 292 –4 007 –11 978 –10 148 41.7Romania*a –21 441 –29 148 –27 998 –28 264 –25 782 20.2Russian Federation* 61 090 –483 776 –561 141 –673 755 –672 200 –1 200.3Slovakia* –10 322 –10 332 –5 309 –7 256 –6 116 –40.7Slovenia*a –7 690 –7 281 –8 491 –8 477 –8 576 11.5Spain –19 296 –23 440 –24 805 –28 612 –29 020 50.4Sweden –41 342 –38 989 –30 990 –35 868 –34 193 –17.3Switzerland –3 867 248 –1 865 –1 104 –885 –77.1Turkeyc –56 454 –62 179 –58 271 –73 652 –78 724 39.4Ukraine* –69 757 –50 854 –38 456 –18 297 –37 994 –45.5United Kingdom 3 082 –425 –3 658 –4 872 –4 500 –246.0United States –873 730 –670 875 –1 076 997 –1 054 225 –1 065 652 22.0
Number of Parties showing decrease in emissions by more than 1 per cent: 19Number of Parties showing change in emissions within 1 per cent: 1Number of Parties showing increase in emissions by more than 1 per cent: 22
* A Party with an economy in transition. a Data for the base year defined by decisions 9/CP.2 and 11/CP.4 (Bulgaria (1988), Hungary (average of 1985–1987), Poland (1988),
Romania (1989), Slovenia (1986)) are used for this Party instead of 1990 data. b Emission estimates of the European Union are as reported for the EU-27 and are reported separately from those of its member States. c Decision 26/CP.7 invited Parties to recognize the special circumstances of Turkey, which place it in a situation different from that of
other Annex I Parties.

FCCC/SBI/2012/31
24
Table 15 Anthropogenic CH4 emissions from land use, land-use change and forestry, 1990, 2000, 2005, 2009 and 2010
Gg CO2 equivalent Change from 1990 Party 1990 2000 2005 2009 2010 to 2010 (%)Australia 4 830 2 800 4 065 3 069 3 596 –25.5Austria 0.58 0.12 0.09 0.16 0.14 –75.5Belarus* 7.08 8.16 3.77 9.31 4.82 –32.0Belgium 0.29 0.00 0.00 Bulgaria*a 1.36 170.98 4.27 6.70 19.28 1 313.3Canada 3 317 1 510 5 720 5 806 11 598 249.7Croatia* 262 1 065 24 40 28 –89.5Czech Republic* 100 92 113 121 128 28.2Denmark 0.55 0.00 0.02 0.01 0.01 –97.7Estonia* 0.34 1.61 0.25 0.13 0.07 –79.3European Unionb 4 221 5 354 5 133 4 487 4 636 9.8Finland 39 42 44 49 50 26.9France 1 182 2 154 1 824 1 738 1 782 50.8Germany 9.08 3.42 1.10 4.62 3.20 –64.8Greece 27 95 5 21 7 –73.8Hungary*a 31 31 36 23 23 –25.2Iceland 1.60 7.80 7.80 8.33 8.33 420.7Ireland 2.69 2.31 1.39 1.07 7.02 160.4Italy 183 106 48 69 43 –76.3Japan 8.51 7.78 9.18 8.61 2.12 –75.1Latvia* 19 59 35 34 40 108.7Liechtenstein Lithuania* 2.23 2.77 0.83 2.95 1.03 –53.7Luxembourg Malta Monaco Netherlands New Zealand 49 46 47 54 54 8.8Norway 1.77 0.33 0.65 2.51 1.45 –17.9Poland*a 2 190 2 207 2 222 2 231 2 234 2.0Portugal 213 182 511 74 183 –14.3Romania*a 0.00 0.08 0.00 0.02 0.00 367.0Russian Federation* 10 183 10 184 9 789 11 901 10 650 4.6Slovakia* 14 12 22 21 23 62.6Slovenia*a 2.06 2.61 2.19 0.99 Spain 173 160 236 62 61 –64.8Sweden 1.72 2.95 4.99 2.63 0.71 –58.7Switzerland 8.19 0.27 0.35 0.31 0.19 –97.7Turkeyc 0.04 0.07 0.00 0.02 0.01 –73.7Ukraine* 8.39 3.44 5.25 15.13 23.25 177.2United Kingdom 18 27 21 24 29 56.3United States 2 526 11 565 8 140 5 799 4 844 91.7
Number of Parties showing decrease in emissions by more than 1 per cent: 18Number of Parties showing change in emissions within 1 per cent: 0Number of Parties showing increase in emissions by more than 1 per cent: 17
* A Party with an economy in transition. a Data for the base year defined by decisions 9/CP.2 and 11/CP.4 (Bulgaria (1988), Hungary (average of 1985–1987), Poland (1988),
Romania (1989), Slovenia (1986)) are used for this Party instead of 1990 data. b Emission estimates of the European Union are as reported for the EU-27 and are reported separately from those of its member States. c Decision 26/CP.7 invited Parties to recognize the special circumstances of Turkey, which place it in a situation different from that of
other Annex I Parties.
FCCC/SBI/2012/31
25
Table 16 Anthropogenic N2O emissions from land use, land-use change and forestry, 1990, 2000, 2005, 2009 and 2010
Gg CO2 equivalent Change from 1990 Party 1990 2000 2005 2009 2010 to 2010 (%)Australia 2 118 1 416 1 670 1 416 1 799 –15.1Austria 41 37 36 49 50 21.6Belarus* 18 21 18 23 19 5.1Belgium 11 50 73 89 92 719.8Bulgaria*a 163 202 164 164 167 2.5Canada 2 051 937 3 551 3 603 7 199 251.0Croatia* 891 3 598 85 143 102 –88.6Czech Republic* 31 19 19 19 19 –38.1Denmark 19 20 13 13 13 –34.2Estonia* 0.87 1.11 0.86 0.93 0.92 5.1European Unionb 3 871 3 726 3 535 3 472 3 520 –9.1Finland 101 96 101 127 129 27.2France 1 802 1 641 1 483 1 507 1 487 –17.5Germany 260 261 266 258 251 –3.2Greece 2.73 9.66 0.50 2.13 0.72 –73.8Hungary*a 7 33 36 30 28 300.5Iceland 69 73 75 79 79 14.5Ireland 21 38 50 64 65 216.9Italy 91 32 32 7 85 –6.5Japan 91 33 16 8 6 –93.0Latvia* 219 181 174 163 149 –32.2Liechtenstein 0.19 0.01 0.00 0.00 Lithuania* 25 25 24 50 26 7.1Luxembourg 2.85 2.82 2.70 2.59 2.57 –9.8Malta Monaco 0.02 0.02 0.03 0.01 0.02 –16.2Netherlands New Zealand 24 19 16 14 15 –39.4Norway 14 13 13 13 13 –7.0Poland*a 17 17 16 11 8 –52.1Portugal 59 71 145 62 85 44.3Romania*a 0.00 0.11 0.01 0.03 0.01 538.5Russian Federation* 8 794 8 846 8 393 10 147 9 113 3.6Slovakia* 12.09 37.29 5.34 7.04 4.65 –61.5Slovenia*a 84 84 84 84 84 0.2Spain 18 16 24 6 6 –64.8Sweden 81 74 95 118 137 69.9Switzerland 11.44 5.41 4.81 4.43 4.50 –60.6Turkeyc 0.00 0.01 0.00 0.00 0.00 –73.2Ukraine* 12 10 11 14 16 31.5United Kingdom 793 775 692 640 629 –20.7United States 3 113 10 994 8 481 6 455 5 720 83.8
Number of Parties showing decrease in emissions by more than 1 per cent: 21Number of Parties showing change in emissions within 1 per cent: 1Number of Parties showing increase in emissions by more than 1 per cent: 17
* A Party with an economy in transition. a Data for the base year defined by decisions 9/CP.2 and 11/CP.4 (Bulgaria (1988), Hungary (average of 1985–1987), Poland (1988),
Romania (1989), Slovenia (1986)) are used for this Party instead of 1990 data. b Emission estimates of the European Union are as reported for the EU-27 and are reported separately from those of its member States. c Decision 26/CP.7 invited Parties to recognize the special circumstances of Turkey, which place it in a situation different from that of
other Annex I Parties.