fault seal analysis: a method to reduce uncertainty in … · 2017-11-23 · fault seal analysis 2...
TRANSCRIPT
Reliance Corporate Park, Building No.-11 g Floor, B-Wing, Ghansoli, Navi Mumbai – 400701, India. *[email protected]
P-330
Fault Seal Analysis: A method to reduce uncertainty in
Hydrocarbon Exploration. Case study: Northern part of Cambay basin
Tusar Ranjan Sahoo *, Sankar Nayak, Shaktimatta Senapati, Yogendra N Singh
Petroleum Business (E&P), Reliance Industries Limited, India
Summary
Evaluating fault seal risk is an important factor in hydrocarbon exploration and production. This uncertainty in faults is
analyzed and fault categorization is made based on wall rock juxtapositions, membrane seal caused due to fault rock
deformation process and reactivation. However, wall rock juxtapositions and membrane seals are studied in detail with the help
of Triangle juxtaposition diagram. Shale Gouge Ratio (SGR) is the parameter which explains about the membrane seal. SGR is
calculated using the algorithm given by Yielding et al., (1997).
Fault seal analysis is carried out at reservoir top, Kalol Formation (Middle Eocene) in the Northern part of Cambay basin.
Faults are identified and its architecture, throw, heave and orientation are analyzed based on 2D seismic data. Here most of the
faults are NW-SE trending except few NE-SW cross-trends. Faults are studied taking VShale curve of the drilled wells in the
study area. Pseudo wells are created for this analysis and its lithology is prognosticated based on continuity of reflectors in
seismic data and available nearby well information. Taking reference from earlier workers a generalized classification of faults
is made based on SGR. Finally a communication map is prepared at the reservoir top to explain the fluid connectivity along the
faults.
Introduction Play types in most of the fault bounded structural traps are associated with faults. These faults may be sealing or conduit to fluid flow. Most of the seal analysis involves construction of fault plane displacement, juxtaposition maps and fault membrane seal. Membrane seal (clay smear) is recognized as the dominant sealing mechanism
along faults in clastic sediments (Doughty, 2003). Clay smears caused primarily by abrasion and secondarily by shearing of the host wall rocks (Lindsay et al., 1993). To minimize fault risk associated in hydrocarbon exploration and production, here an attempt has been made to classify faults mainly based on juxtaposition and clay smear (Shale Gouge Ratio) analysis.
Geological setting, tectonics and petroleum system of
study area
Cambay basin is a rift sag tertiary basin in the western part of India. Current study area falls in Patan tectonic block. Many authors (Bhandari and Choudhary, 1975; Biswas et al., 1994; Kundu and Wani, 1992) have described the geology, tectonics and stratigraphy of this basin in a great
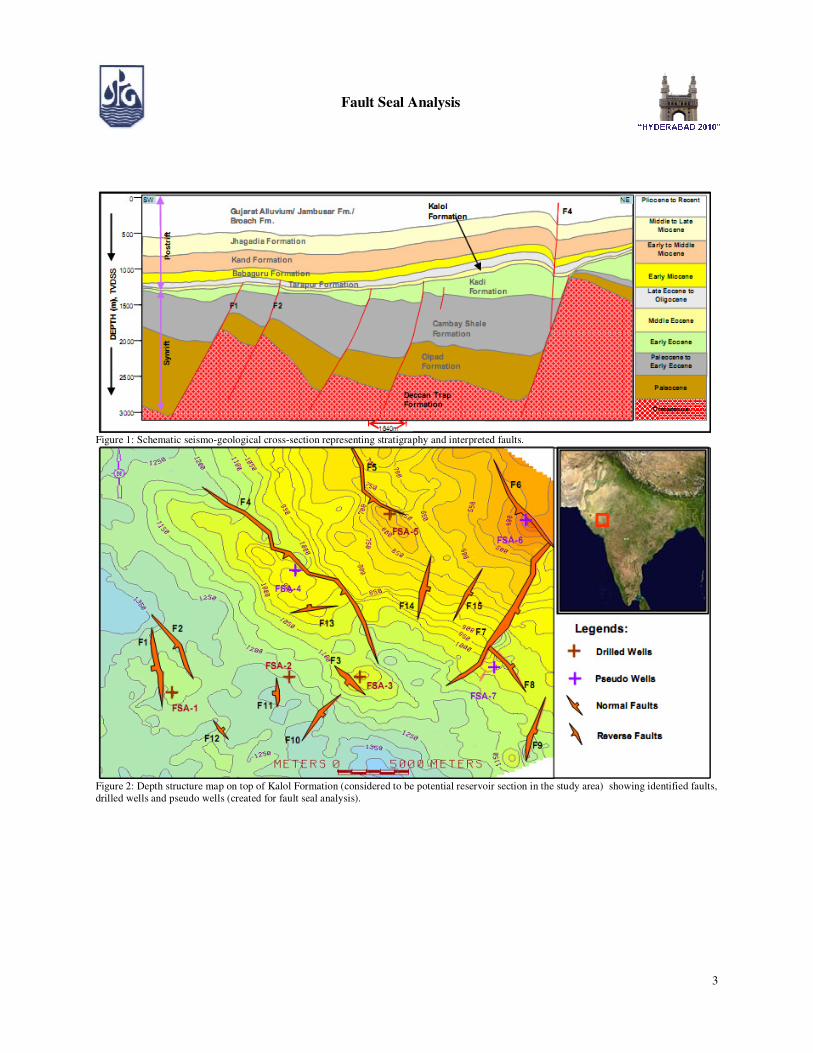
detail. A schematic geological cross section along one SWNE trending 2D line is shown in Figure 1. Three stages of basin evolution are recognized; 1) Paleocene – Early Eocene rift stage (synrift, period of extension), 2) Middle Eocene – Early Miocene postrift (thermal subsidence) stage, 3) Middle Miocene and younger stage of postrift structural inversion – period of compression.
Detailed integrated analysis of all the geo-scientific data has been attempted to understand the petroleum system model of this region based on 2D seismic data. Petroleum

Fault Seal Analysis
2
system analysis shows that in this study area, primarily Older Cambay Shale and claystones in Olpad Formation are the main source rocks which can generate hydrocarbon. Postrift Kalol Formation, synrift Kadi Formation and sandstones/siltstones in Olpad Formation are considered to
be the main reservoir units in this part of the basin. Tarapur Shale is the regional seal for the postrift reservoir units. Intraformational shales/claystones in Kalol and Olpad Formation can act as good top seal for reservoir units in Kalol and Olpad Formation respectively. Source rock maturation model shows that timing of peak migration may be after Late Miocene in this part of the basin. Postrift inverted fault closures at Middle to Late Eocene level and
synrift fault closures at Paleocene and Early Eocene level are major play types identified in the study area. Only fault seal analysis of postrift inverted fault closures are discussed in this paper. A depth structure map on top of Kalol Formation showing drilled and pseudo wells is shown in Figure 2.
Methodology
Fault seal analysis involves three main studies. i) Juxtaposition ii) Fault zone deformation process iii) Reactivation (Jones and Hillis, 2003). Juxtaposition tells us about the lithological juxtapositions of Foot wall and Hanging wall along the fault. There are various methods to show juxtaposition diagrams. Triangle
diagram is one of the methods which show a quick interpretation of these fault juxtapositions at different throws. Analyzing these juxtaposition diagrams we will be able to identify whether the fault seal is due to lithological juxtapositions or due to the fault rock itself. Fault zone deformation process involves fault zone diagenesis, clay smear (shale gouge), grain sliding and cataclasis (Kaldi, 2008). This is very important because
sometimes sand on sand juxtaposition can result fault seal due to clay smear, cataclasis and diagenesis. Clay smear
(shale gouge) indicates that more is the shale to sand ratio more clay will be incorporated in fault zone. There are certain predictive algorithms for estimation of fault seal potential. Shale Gouge Ratio (SGR) is one of them. Shale Gouge Ratio (SGR) is the percentage shale or clay material
that has slipped past a point on the fault. Outcrop studies show that while predicting clay smear one has to consider certain controlling factors like clay bed thickness, number of clay beds present and fault throw (Kaldi, 2008). Thicker source clay bed produces more clay smears. Shear type smears decreases in thickness with distance from clay source layer. Abrasion smears are eroded with greater fault throw. Multiple clay source beds can combine to produce
more continuous clay smear. Yielding et al., (1997), has given methods for calculation of SGR in reservoir with discrete shale/clay beds and for shaly sand reservoir with discrete shale beds. SGR can be analyzed using Triangle juxtaposition diagrams in Trap Tester software (Badleys, 2005). For reservoir with discrete shale/clay beds SGR is
calculated as follows (Yielding et al., 1997).
For shaly sand reservoir with discrete shale beds, SGR is calculated as follows (Yielding et al., 1997).
Where, Vcl = Clay or Shale volume fraction, ∆z = Thickness of each reservoir lithology Reactivation is an important factor while predicting fault
seal potential. Here in-situ stress field and fault geometry has to be analyzed to know the likelihood of reactivation of mapped faults and associated seal breach. However, in this paper reactivation risk is not studied in detail.
Fault Seal Analysis
3
Figure 1: Schematic seismo-geological cross-section representing stratigraphy and interpreted faults.
Figure 2: Depth structure map on top of Kalol Formation (considered to be potential reservoir section in the study area) showing identified faults,
drilled wells and pseudo wells (created for fault seal analysis).
Fault Seal Analysis
4
Triangular Plot A fault-seal 'Triangle-type diagram' has more recently been developed by Knipe (1997) as a 'juxtaposition diagram'. Triangle juxtaposition diagram provides a quick-look standalone 1D fault seal analysis tool using the well curves
(Badleys, 2005). The various triangular and parallelogram areas represent the variety of bed juxtapositions on the fault surface. Juxtapositions that correspond to sand-sand contact are color-coded according to their fault-seal potential (Shale Gouge Ratio). The diagram in this simple form provides a way of assessing juxtaposition and faultseal potential at various fault throws, for a given input stratigraphy. The model assumes that the fault throw is
constant vertically down the fault, and that the stratigraphy is layer-cake. However faults having different throws at different stratigraphic intervals can be analyzed in 3D fault seal analysis in Trap Tester.
Observation and Interpretation
Faults and Horizons are mapped in the study area and
based on this interpretation few of the leads/prospects have been identified in the post rift sequence (Figure 2). As most of these play types are fault closures it is very important to assess the fault seal risk involved in it. There are four drilled wells in this area. VShale curves of these wells are taken for determination of SGR. For Fault seal analysis few pseudo wells are created and its lithology is prognosticated based on continuity of reflectors in the available 2D
seismic data and drilled well information. Seal analysis of each faults are studied carefully but faults which are associated with leads/prospects identified in Kalol Formation are explained in this paper. Most of the faults at top of Kalol Formation are generated during Upper Cretaceous and continued till Early Eocene. Then subsequently these faults get reactivated during Middle Miocene in the study area.
SGR is calculated and analyzed in Triangle juxtaposition diagram. Fault commonly contains a sheared mélange where the fault offset is greater than the bed thickness. So SGR is mainly studied in the interval where fault throw is greater than the bed thickness. For simpler calculation purpose fault zones are taken as single fault. Taking reference from Yielding et al., (1997), a generalized classification of faults is made based on SGR values.
SGR<20% (or a ratio of < 0.2) are typically associated with cataclastic fault gouge and sealing of the fault is considered
as unlikely. Higher values of Shale Gouge Ratio correlate with greater fault seal potential. SGR 0.2-0.4 v/v (20%40%) is associated with phyllosilicate framework and some clay smear fault rocks. Here fault is taken as poor seal and will be retarding to fluid flow. For SGR 0.4-0.6 v/v
(40%60%) fault is considered to be moderate seal. It will be associated mainly with clay smears. For SGR > 0.6 v/v (60%) is taken as a likely sealed fault.
Fault F1 and F2
Fault F1 and F2 are located in the SW part of the study area. Fault F1 is a normal fault and F2 is a reverse fault at
top of Kalol Formation. Timing of the fault F1 is Upper Cretaceous to Eocene. Timing of fault F2 is Upper Cretaceous to Oligocene and structural inversion is started during Middle Eocene to Oligocene due to compressional stress. Strike of these faults are trending NW-SE having maximum throw about 30m at reservoir (Kalol Formation) top. One well FSA-1 is drilled close to these faults. So information from this well has been incorporated for fault
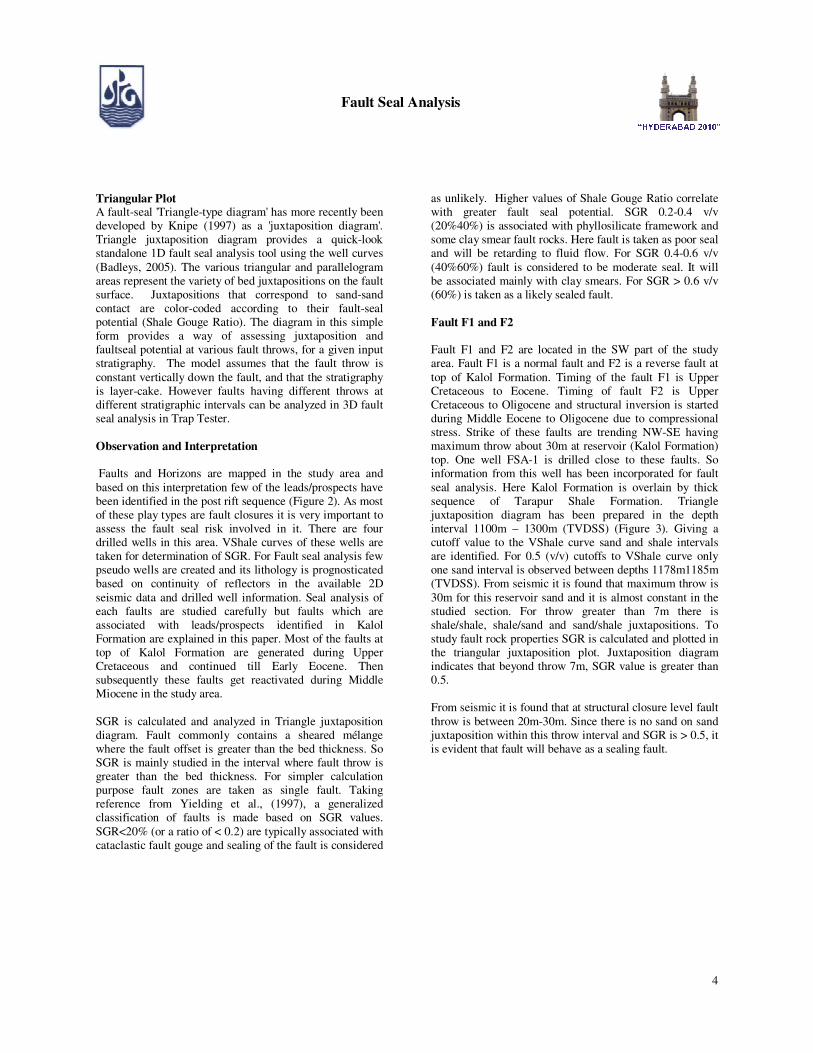
seal analysis. Here Kalol Formation is overlain by thick sequence of Tarapur Shale Formation. Triangle juxtaposition diagram has been prepared in the depth interval 1100m – 1300m (TVDSS) (Figure 3). Giving a cutoff value to the VShale curve sand and shale intervals are identified. For 0.5 (v/v) cutoffs to VShale curve only one sand interval is observed between depths 1178m1185m (TVDSS). From seismic it is found that maximum throw is
30m for this reservoir sand and it is almost constant in the studied section. For throw greater than 7m there is shale/shale, shale/sand and sand/shale juxtapositions. To study fault rock properties SGR is calculated and plotted in the triangular juxtaposition plot. Juxtaposition diagram indicates that beyond throw 7m, SGR value is greater than 0.5. From seismic it is found that at structural closure level fault
throw is between 20m-30m. Since there is no sand on sand juxtaposition within this throw interval and SGR is > 0.5, it is evident that fault will behave as a sealing fault.
Fault Seal Analysis
5
Figure 3: Triangle Juxtaposition diagram showing lithological
juxtapositions and SGR for well FSA-1
Fault F3
Fault F3 is situated in the central part of the study area. It is
a normal fault having orientation in NW-SE direction and maximum throw is about 50m at top of Kalol Formation. Timing of the fault is Middle Eocene to Recent. Well FSA3 is drilled near to this fault. Due to unavailability of GR log, Shale beds are determined based on lithological descriptions of well cuttings and other available log data. Here Kalol Formation is sand dominated and overlain by Tarapur Shale Formation. In this well few sand intervals along with shales are reported in Tarapur Formation.
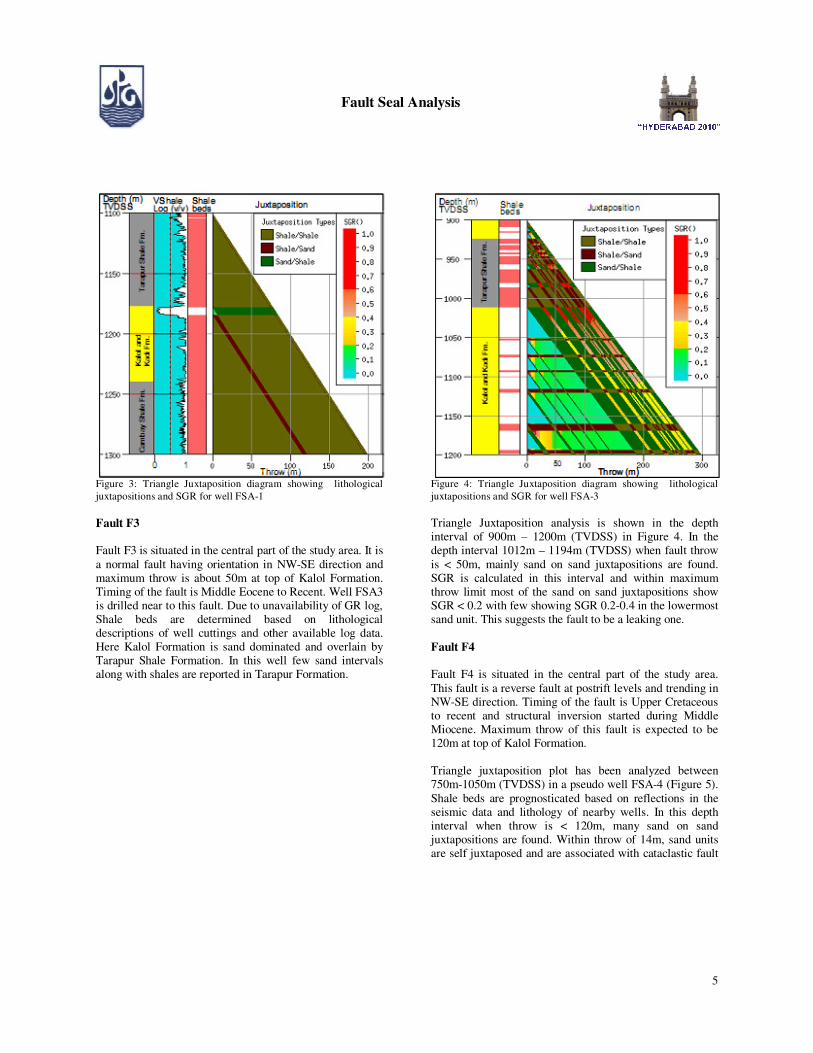
Figure 4: Triangle Juxtaposition diagram showing lithological
juxtapositions and SGR for well FSA-3
Triangle Juxtaposition analysis is shown in the depth interval of 900m – 1200m (TVDSS) in Figure 4. In the depth interval 1012m – 1194m (TVDSS) when fault throw
is < 50m, mainly sand on sand juxtapositions are found. SGR is calculated in this interval and within maximum throw limit most of the sand on sand juxtapositions show SGR < 0.2 with few showing SGR 0.2-0.4 in the lowermost sand unit. This suggests the fault to be a leaking one.
Fault F4
Fault F4 is situated in the central part of the study area.
This fault is a reverse fault at postrift levels and trending in NW-SE direction. Timing of the fault is Upper Cretaceous to recent and structural inversion started during Middle Miocene. Maximum throw of this fault is expected to be 120m at top of Kalol Formation. Triangle juxtaposition plot has been analyzed between 750m-1050m (TVDSS) in a pseudo well FSA-4 (Figure 5).
Shale beds are prognosticated based on reflections in the seismic data and lithology of nearby wells. In this depth interval when throw is < 120m, many sand on sand juxtapositions are found. Within throw of 14m, sand units are self juxtaposed and are associated with cataclastic fault

Fault Seal Analysis
6
gouge. In the throw interval of 14-28m, sands within depths 870m-883m, 946m-962m and 1005m-1015m (TVDSS), show SGR < 0.3. So these zones may act as poor seal. Within throw 50m-100m most of the sand on sand juxtapositions show SGR value between 0.4-0.6. So these
reservoir juxtapositions may act as moderate seal. Here at structural closure level it is important to study the fault orientation since in the central part of the fault, orientation is not perpendicular to the regional stress direction. There the throw varies from 40m-100m and many minor scale faults are seen near to it. This may be due to wider damage zone. So here though SGR is within
0.4-0.6 sealing property of the fault may be reduced.
Fault F5
This fault is situated in the northern part of the study area. This is a reverse fault at Kalol level having orientation in NNW-SSE direction. Timing of the fault is Upper Cretaceous to recent and structural inversion is started
during Middle Miocene. Here the structure is a three way dip inverted fault closure. Maximum throw is found to be 120m at top of Kalol Formation. A well FSA-5 is drilled in the fault closure to evaluate the hydrocarbon prospectivity of the area. Triangle juxtaposition is prepared in the depth interval 540740m (TVDSS) taking well information and VShale
curve of well FSA-5 (Figure 6). Shale and sand intervals are identified giving a cutoff as 0.3 to VShale curve. In the depth interval 608-620m (TVDSS), Juxtaposition diagram shows that when throw is < 25m SGR is < 0.3. So it may lead to cross fault migration. When throw is > 25m, in most of the sand on sand juxtapositions SGR is calculated to be > 0.3. This may act as moderate seal.
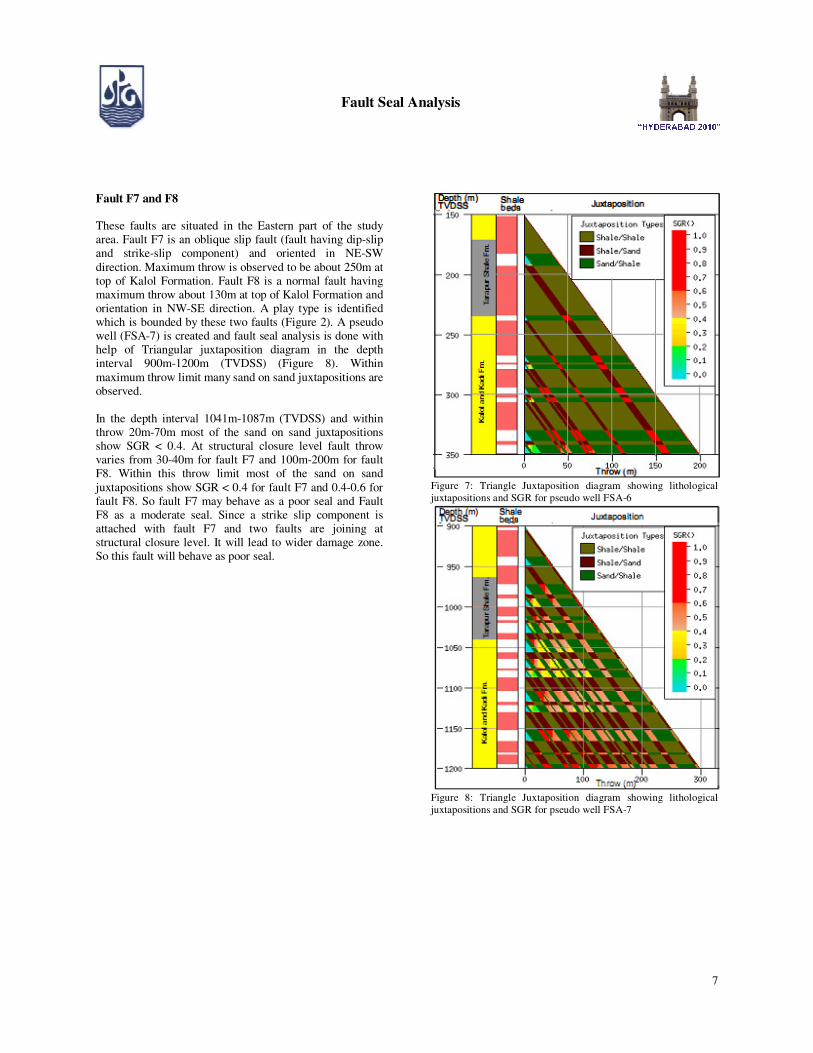
Fault F6 This fault is situated in the north-east part of the study area. This is a reverse fault at Kalol Formation having orientation in NW-SE direction. Here the structure is a two way dip inverted fault closure. The fault is related to structural inversion and timing of the fault Upper Cretaceous to Recent. Maximum throw is found to be 120m at top of Kalol Formation. Triangle juxtaposition diagram
is prepared in the pseudo well FSA-6 in the depth interval of 150-350m (TVDSS) (Figure 7). When throw is > 25m,
most of the sand on sand juxtapositions show SGR value >0.5. So it indicates a sealing fault.
Figure 5: Triangle Juxtaposition diagram showing lithological
juxtapositions and SGR for pseudo well FSA-4
Figure 6: Triangle Juxtaposition diagram showing lithological
juxtapositions and SGR for well FSA-5
Fault Seal Analysis
7
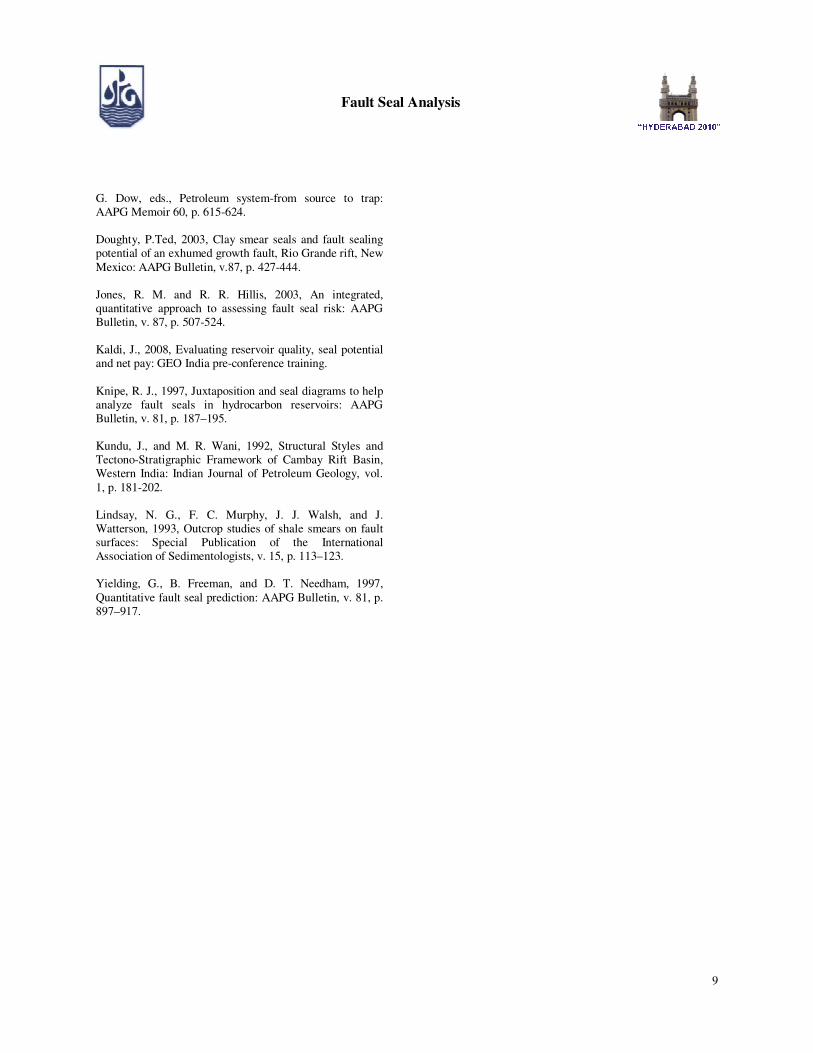
Fault F7 and F8
These faults are situated in the Eastern part of the study area. Fault F7 is an oblique slip fault (fault having dip-slip and strike-slip component) and oriented in NE-SW
direction. Maximum throw is observed to be about 250m at top of Kalol Formation. Fault F8 is a normal fault having maximum throw about 130m at top of Kalol Formation and orientation in NW-SE direction. A play type is identified which is bounded by these two faults (Figure 2). A pseudo well (FSA-7) is created and fault seal analysis is done with help of Triangular juxtaposition diagram in the depth interval 900m-1200m (TVDSS) (Figure 8). Within
maximum throw limit many sand on sand juxtapositions are observed. In the depth interval 1041m-1087m (TVDSS) and within throw 20m-70m most of the sand on sand juxtapositions show SGR < 0.4. At structural closure level fault throw varies from 30-40m for fault F7 and 100m-200m for fault F8. Within this throw limit most of the sand on sand
juxtapositions show SGR < 0.4 for fault F7 and 0.4-0.6 for fault F8. So fault F7 may behave as a poor seal and Fault F8 as a moderate seal. Since a strike slip component is attached with fault F7 and two faults are joining at structural closure level. It will lead to wider damage zone. So this fault will behave as poor seal.
Figure 7: Triangle Juxtaposition diagram showing lithological
juxtapositions and SGR for pseudo well FSA-6
Figure 8: Triangle Juxtaposition diagram showing lithological
juxtapositions and SGR for pseudo well FSA-7

Fault Seal Analysis
8
Figure 9: Fault communication map showing sealing property of different parts of faults at reservoir top (Kalol Formation Top)
Conclusion
Faults are mapped and its throw, heave and orientation are determined from the seismic data. Wall rock juxtapositions and SGR are analyzed in Triangle juxtaposition diagram.
Fault categorization is made based on wall rock juxtapositions, SGR and reactivation. All the faults are studied in detail and finally a fault communication map is prepared at reservoir top (Figure 9). Here different parts of the faults are differentiated based on its sealing property. Broadly faults are classified as sealing unlikely, poor seal, moderate seal and likely sealed fault. Form communication map and juxtaposition diagram it is clear that fault F4 and
F7 are not perfect seal near the identified leads. Faults F1, F2, F5, and F6 may behave as a moderate to a likely sealed fault. Fault F3 may behave as a tranmissive fault where sealing is unlikely.
Acknowledgements
The authors would like to express their gratitude to Reliance Industries Limited for supporting the publication of this work.
References
Allan, U. S., 1989, Model for hydrocarbon migration and entrapment within faulted structures: AAPG Bulletin, v. 73, p. 803–811. Badleys, 2005: Reference manual, Trap Tester, p. 4.1-4.12. Bhandari, L. L., and L. R. Chowdhary, 1975, Stratigraphic analysis of Kadi and Kalol Formations: AAPG Bulletin, v.
59, p. 856-871. Biswas, S. K., M. K. Rangaraju, J. Thomas, and S. K. Bhattacharya, 1994, Cambay-Hazad (!) petroleum system in the south Cambay basin, India, in L. B. Magoon and W.
Fault Seal Analysis
9
G. Dow, eds., Petroleum system-from source to trap: AAPG Memoir 60, p. 615-624. Doughty, P.Ted, 2003, Clay smear seals and fault sealing potential of an exhumed growth fault, Rio Grande rift, New
Mexico: AAPG Bulletin, v.87, p. 427-444. Jones, R. M. and R. R. Hillis, 2003, An integrated, quantitative approach to assessing fault seal risk: AAPG Bulletin, v. 87, p. 507-524. Kaldi, J., 2008, Evaluating reservoir quality, seal potential and net pay: GEO India pre-conference training.
Knipe, R. J., 1997, Juxtaposition and seal diagrams to help analyze fault seals in hydrocarbon reservoirs: AAPG Bulletin, v. 81, p. 187–195. Kundu, J., and M. R. Wani, 1992, Structural Styles and Tectono-Stratigraphic Framework of Cambay Rift Basin, Western India: Indian Journal of Petroleum Geology, vol.
1, p. 181-202. Lindsay, N. G., F. C. Murphy, J. J. Walsh, and J. Watterson, 1993, Outcrop studies of shale smears on fault surfaces: Special Publication of the International Association of Sedimentologists, v. 15, p. 113–123. Yielding, G., B. Freeman, and D. T. Needham, 1997,
Quantitative fault seal prediction: AAPG Bulletin, v. 81, p. 897–917.