fatigue damage estimation along vessel ’ s voyages chalmers university of technology wengang mao...
Post on 21-Dec-2015
219 views
TRANSCRIPT

Fatigue damage estimation along vessel’s voyages
Chalmers University of Technology
Wengang Mao Igor Rychlik
04/18/23 Smögen Workshop (2008-08) 2
Outline
Background and motivation
Fatigue model in terms of Hs
Application of the fatigue model
Conclusions
04/18/23 Smögen Workshop (2008-08) 3
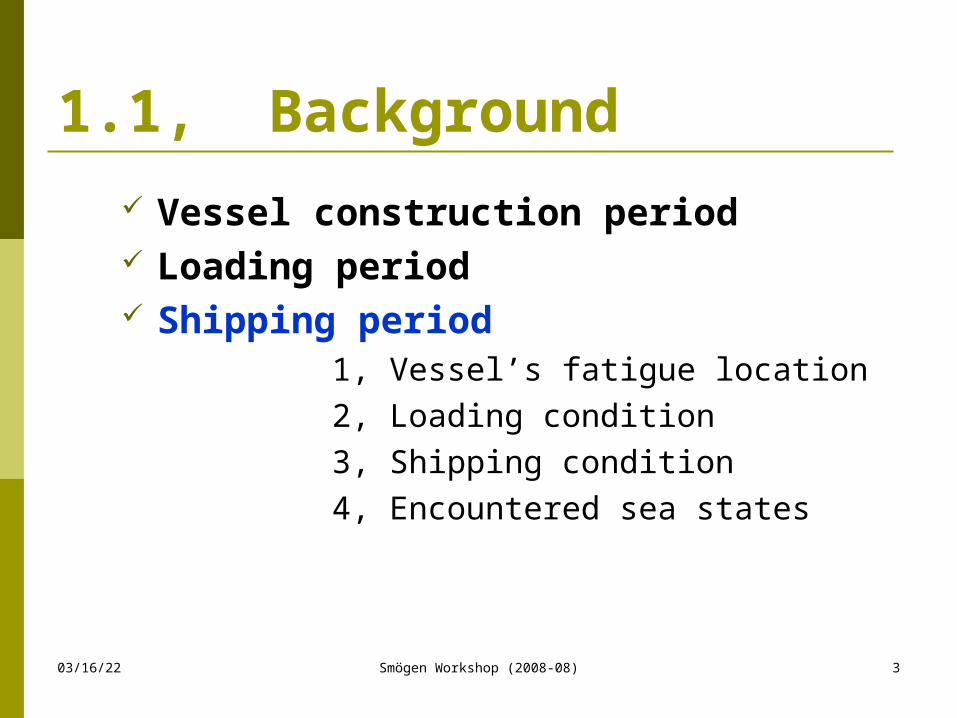
1.1, Background Vessel construction period Loading period Shipping period 1, Vessel’s fatigue location 2, Loading condition 3, Shipping condition 4, Encountered sea states
04/18/23 Smögen Workshop (2008-08) 4
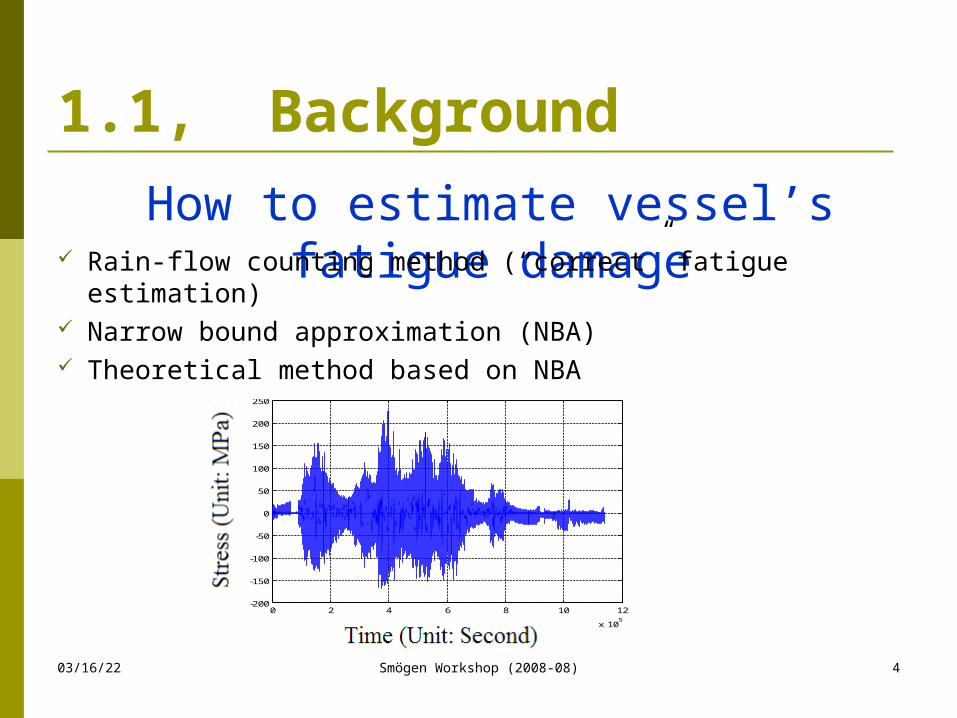
How to estimate vessel’s fatigue damage
1.1, Background
Rain-flow counting method (“correct” fatigue estimation) Narrow bound approximation (NBA) Theoretical method based on NBA
0 2 4 6 8 10 12
x 105
-200
-150
-100
-50
0
50
100
150
200
250
04/18/23 Smögen Workshop (2008-08) 5
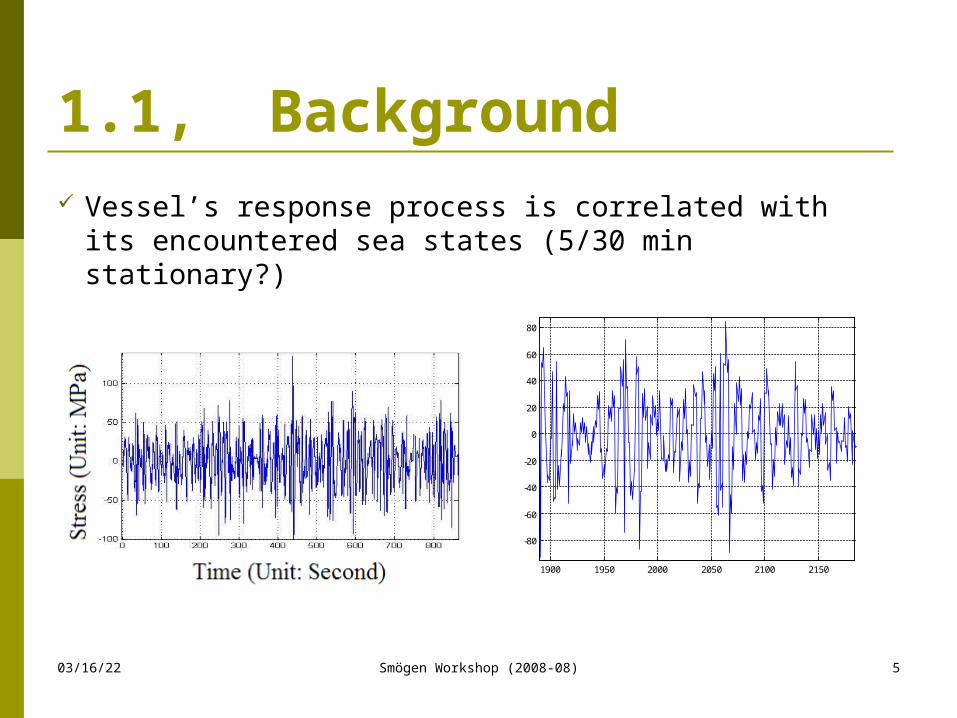
1.1, Background Vessel’s response process is correlated with its
encountered sea states (5/30 min stationary?)
1900 1950 2000 2050 2100 2150
-80
-60
-40
-20
0
20
40
60
80
04/18/23 Smögen Workshop (2008-08) 6
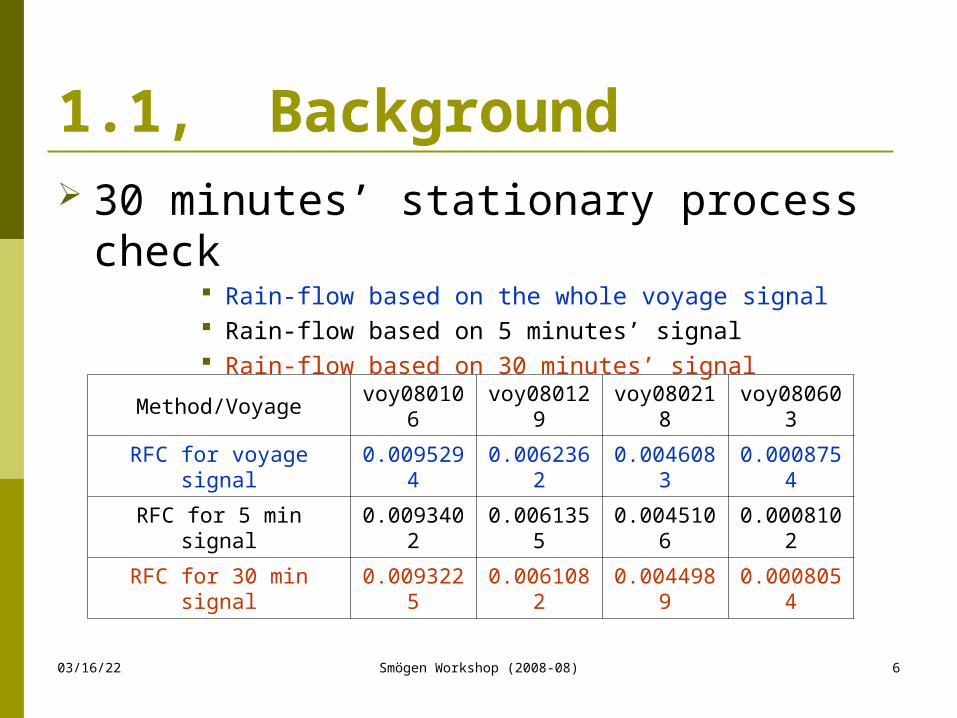
30 minutes’ stationary process check Rain-flow based on the whole voyage signal Rain-flow based on 5 minutes’ signal Rain-flow based on 30 minutes’ signal
1.1, Background
Method/Voyagevoy08010
6voy08012
9voy08021
8voy08060
3
RFC for voyage signal0.009529
40.006236
20.004608
30.000875
4
RFC for 5 min signal0.009340
20.006135
50.004510
60.000810
2
RFC for 30 min signal0.009322
50.006108
20.004498
90.000805
4
04/18/23 Smögen Workshop (2008-08) 7
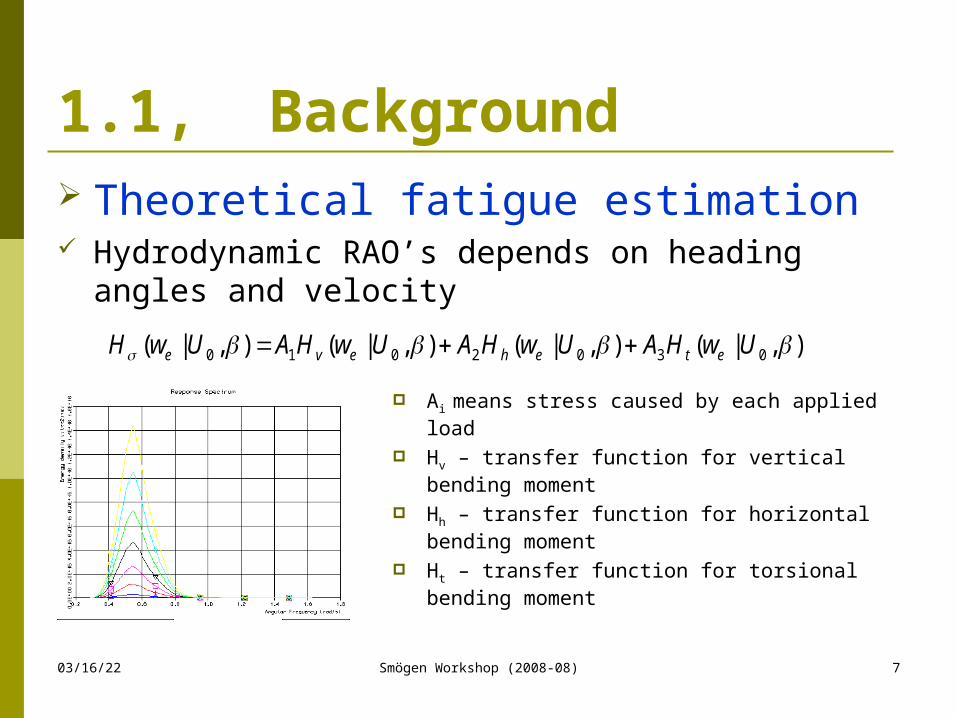
1.1, Background Theoretical fatigue estimation Hydrodynamic RAO’s depends on heading angles
and velocity
),|(),|(),|(),|( 0302010 UwHAUwHAUwHAUwH eteheve
Ai means stress caused by each applied load
Hv – transfer function for vertical bending moment
Hh – transfer function for horizontal bending moment
Ht – transfer function for torsional bending moment
04/18/23 Smögen Workshop (2008-08) 8
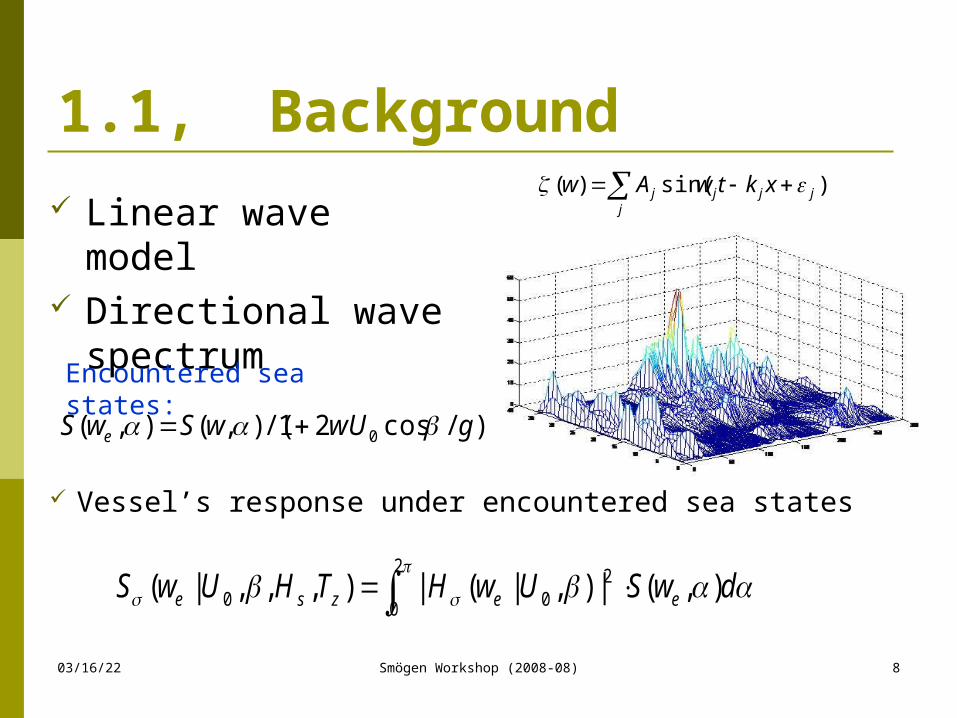
1.1, Background
Linear wave model Directional wave
spectrum
j
jjjj xktwAw )sin()(
)/cos21/(),(),( 0 gwUwSwS e
Encountered sea states:
Vessel’s response under encountered sea states
2
0
200 ),(|),|(|),,,|( dwSUwHTHUwS eezse
04/18/23 Smögen Workshop (2008-08) 9
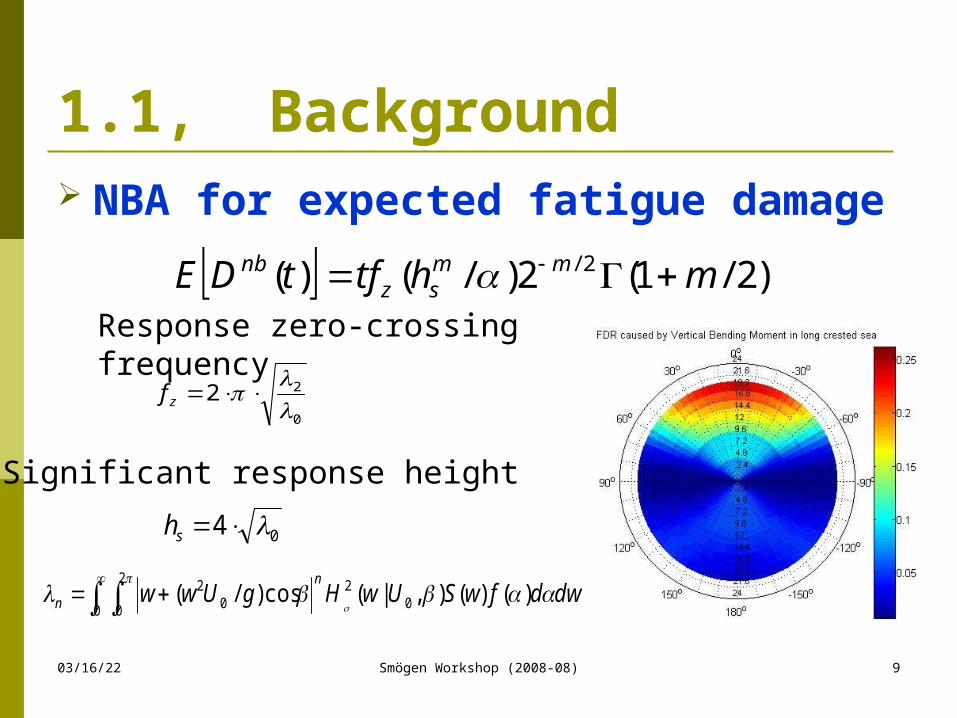
0
22 zf
04 sh
NBA for expected fatigue damage
)2/1(2)/()( 2/ mhtftDE mmsz
nb
0
2
0 02
02 )()(),|(cos)/(
dwdfwSUwHgUww
n
n
Response zero-crossing frequency
Significant response height
1.1, Background

04/18/23 Smögen Workshop (2008-08) 10
Measurement signal process X(t)
zf
)0(0 XV )0(2 XV
)0(44 0 XVhs
Process zero-crossing frequency
1.1, Background
Method based on the measured signal can be taken as the right fatigue criteria
04/18/23 Smögen Workshop (2008-08) 11
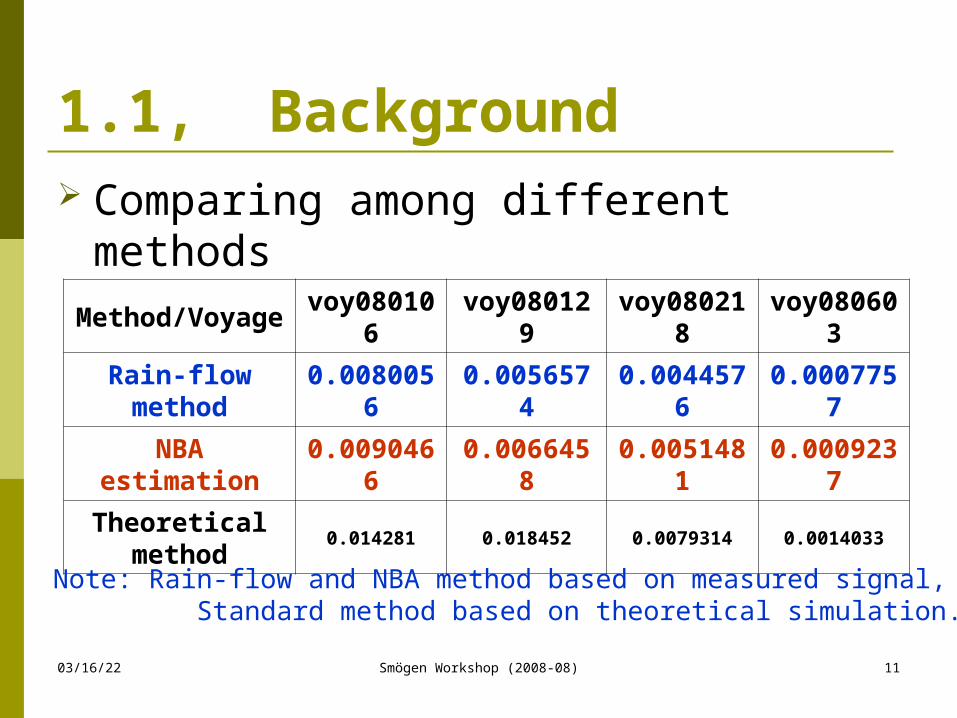
Comparing among different methods
1.1, Background
Method/Voyage
voy080106
voy080129
voy080218
voy080603
Rain-flow method
0.0080056
0.0056574
0.0044576
0.0007757
NBA estimation
0.0090466
0.0066458
0.0051481
0.0009237
Theoretical method
0.014281 0.018452 0.0079314 0.0014033
Note: Rain-flow and NBA method based on measured signal, Standard method based on theoretical simulation.
04/18/23 Smögen Workshop (2008-08) 12
1.2, Motivation—fatigue model of Hs
Drawbacks of the two typical methods 1, Measured signal is seldom available 2, Theoretical RAO’s need more precision 3, RAO’s (FEM & Hydrodynamic software
simulation)
Main motivation 1, Compare different influence factors 2, Simply fatigue model (precise) only in terms
of Hs 3, Check model’s validity
04/18/23 Smögen Workshop (2008-08) 13
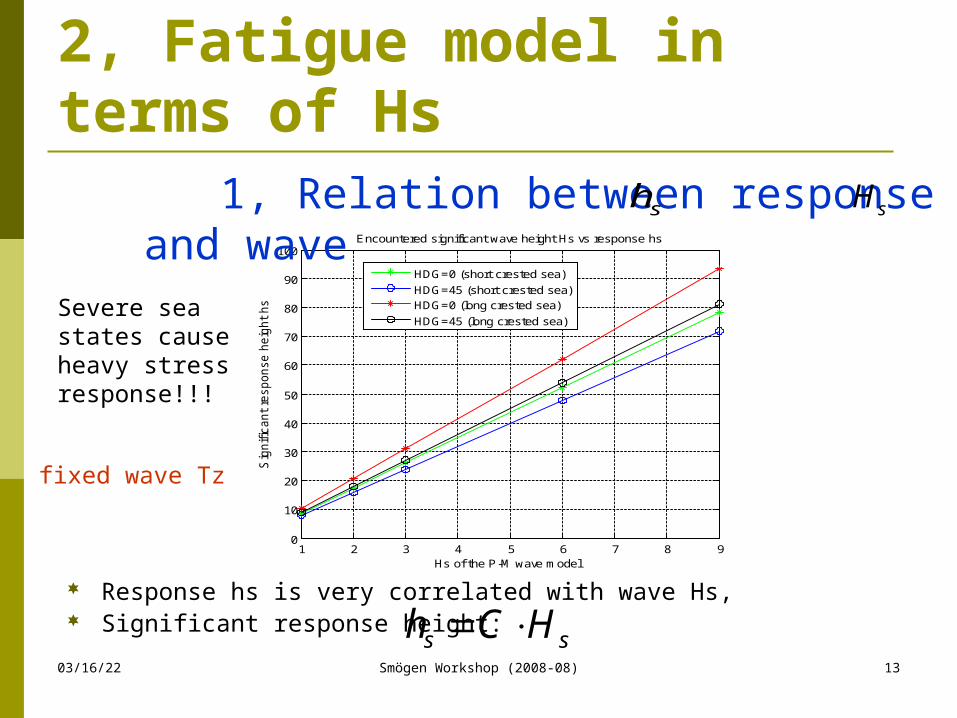
2, Fatigue model in terms of Hs
Response hs is very correlated with wave Hs, Significant response height:
1 2 3 4 5 6 7 8 90
10
20
30
40
50
60
70
80
90
100
Hs of the P-M wave model
Sig
nific
ant
response h
eig
ht
hs
Encountered significant wave height Hs vs response hs
HDG=0 (short crested sea)
HDG=45 (short crested sea)HDG=0 (long crested sea)
HDG=45 (long crested sea)
ss HCh
1, Relation between response and wave
sh sH
fixed wave Tz
Severe sea states cause heavy stress response!!!

04/18/23 Smögen Workshop (2008-08) 14
2, Fatigue model in terms of Hs
Constant C f rom Sesam by di ff erent Tz(PM short crested model )
0. 000
5. 000
10. 000
15. 000
20. 000
25. 000
30. 000
HDG=0 HDG=22. 5 HDG=45 HDG=90 HDG=180
Shi ppi ng headi ng angl es
Cons
tant
coe
ffici
ent
Tz=4sTz=5sTz=6sTz=7sTz=8sTz=9sTz=10sTz=11sTz=12s
Mean C and Wei ghted C f rom Sesam by short P-Mcrested sea
0. 0005. 000
10. 00015. 00020. 00025. 00030. 000
Shi ppi ng headi ng angl es
Cons
tant
coe
ffici
ent
Mean CWei ghted C
Fixed wave Hs, its associate Tz from 4s to 12s has distribution f(t)
Weighted arithmetic average C:
Mean C:
n
iii tfCC
1
)(
n
inCiC
1

04/18/23 Smögen Workshop (2008-08) 15
2, Fatigue model in terms of Hs
Significant response height hs observed vs from model
Voyage name voy080106 voy080129 voy080218 voy080603
Constant C 18.4177 17.1639 20.1642 17.3098
1, Constant C works quite well for
the
model in left figure.
2, Constant C for these voyages
around 19
3, C from measurement agrees
well with
theoretical value
04/18/23 Smögen Workshop (2008-08) 16
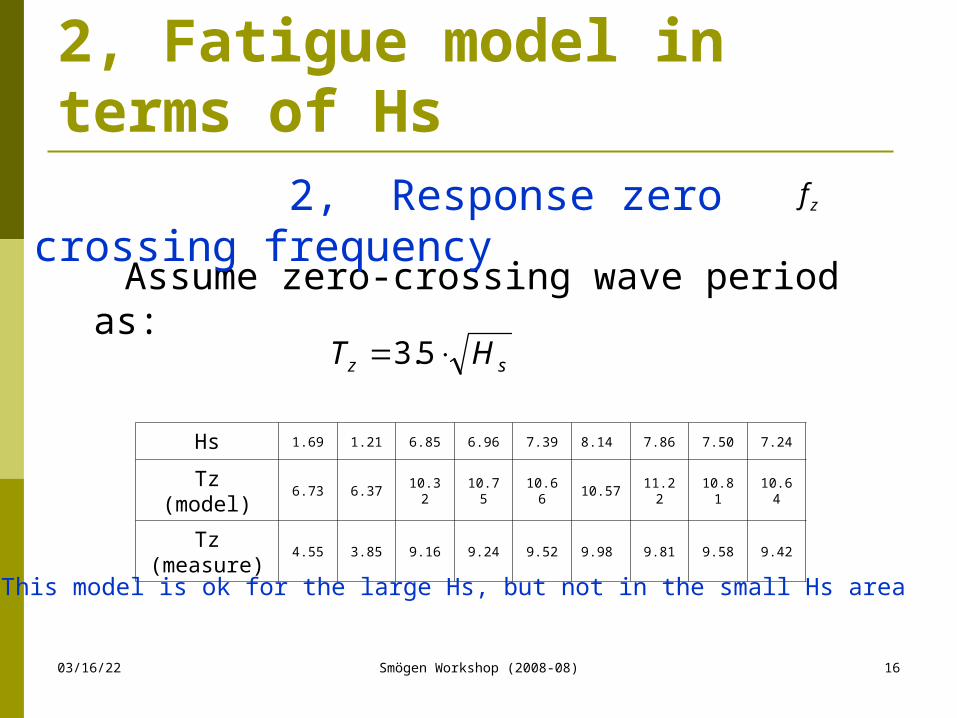
2, Fatigue model in terms of Hs
Assume zero-crossing wave period as:
sz HT 5.3
Hs 1.69 1.21 6.85 6.96 7.39 8.14 7.86 7.50 7.24
Tz (model) 6.73 6.37 10.32 10.75 10.66 10.57 11.22 10.81 10.64
Tz (measure)
4.55 3.85 9.16 9.24 9.52 9.98 9.81 9.58 9.42
This model is ok for the large Hs, but not in the small Hs area
2, Response zero crossing frequency
zf

04/18/23 Smögen Workshop (2008-08) 17
2, Fatigue model in terms of Hs Ship’s response frequency should be
corresponding to its encountered wave frequency
Encountered wave frequency is also related with shipping velocity and heading angles
Note: Here the frequency should be encountered wave frequency
20
81.9
cos21
zzz
T
U
Tf
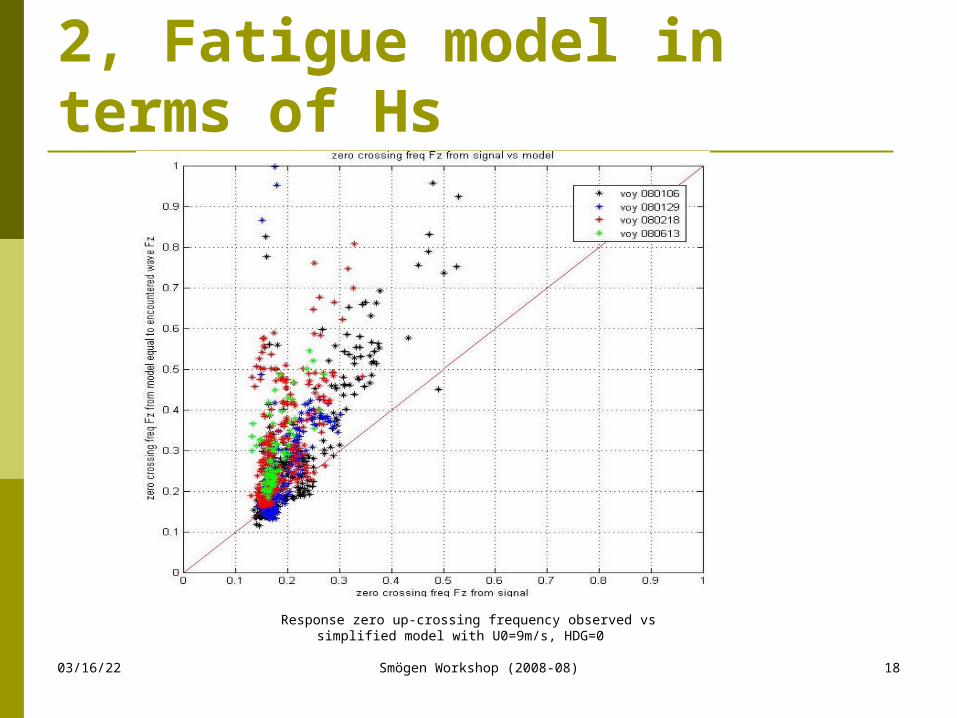
04/18/23 Smögen Workshop (2008-08) 18
Response zero up-crossing frequency observed vs simplified model with U0=9m/s, HDG=0
2, Fatigue model in terms of Hs

04/18/23 Smögen Workshop (2008-08) 19
3, Application of the fatigue model
5 voyages from Europe to Canada
2 voyages from Canada to Europe
4 special voyages (strange relation between encountered sea states and response)
Voyages between Atlantic ocean travelling in different seasons
80oW 60oW 40oW 20oW 0o
12oN
24oN
36oN
48oN
60oN
The whole measurement positions for all the voyages

04/18/23 Smögen Workshop (2008-08) 20
Fatigue damage distribution along voy080106 from different estimation approaches
3, Application of the fatigue model
0 500 1000 1500 2000 2500 30000
50
100
150FDR distribution of voyage080106
voyage time of 5 minutes interval
Fat
igue
dam
age
rate
(F
DR
) fo
r ea
ch 5
min
utes
Rain-flow based on signal of 5 min
Narrow bound based on signal of 5min
Rain-flow based on signal of 30 min
Narrow bound based on signal of 30 min
Narrow bound based on wave Hs & signal Fz of 30 min
Narrow bound based on wave Hs of 30 min
FDR by transfer of DNV and measured wave

04/18/23 Smögen Workshop (2008-08) 21
3, Application of the fatigue model
Fatigue damage distribution of voyages from different estimation approaches
04/18/23 Smögen Workshop (2008-08) 22
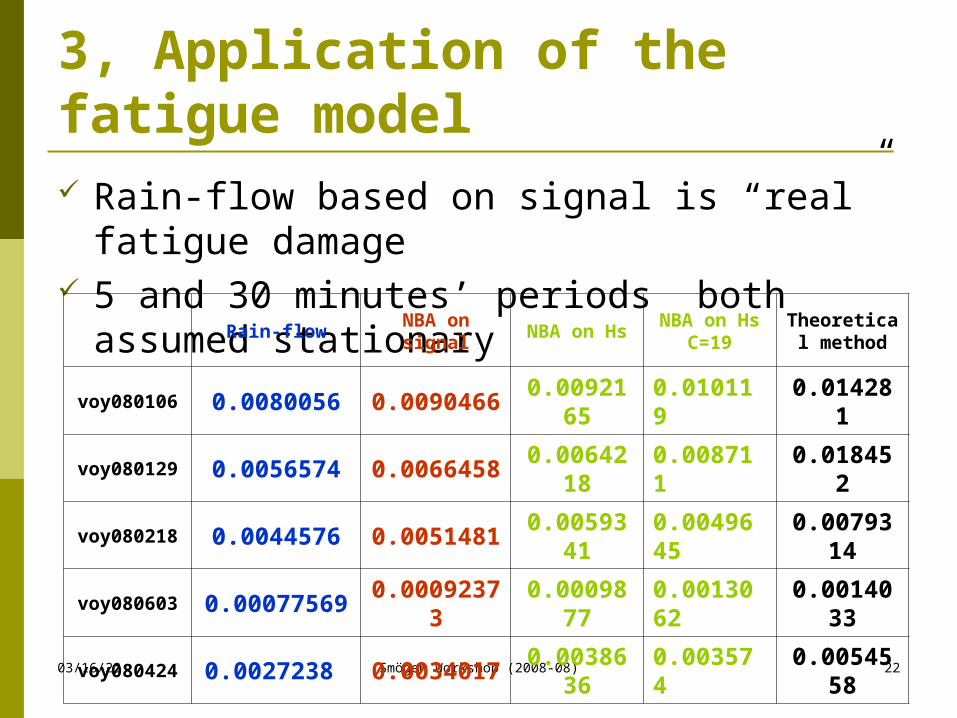
Rain-flow based on signal is “real” fatigue damage
5 and 30 minutes’ periods both assumed stationary
3, Application of the fatigue model
Rain-flow NBA on signal NBA on HsNBA on Hs
C=19Theoretical
method
voy080106 0.0080056 0.0090466 0.0092165 0.010119 0.014281
voy080129 0.0056574 0.0066458 0.0064218 0.008711 0.018452
voy080218 0.0044576 0.0051481 0.0059341 0.0049645 0.0079314
voy080603 0.00077569 0.00092373 0.0009877 0.0013062 0.0014033
voy080424 0.0027238 0.0034017 0.0038636 0.003574 0.0054558
04/18/23 Smögen Workshop (2008-08) 23
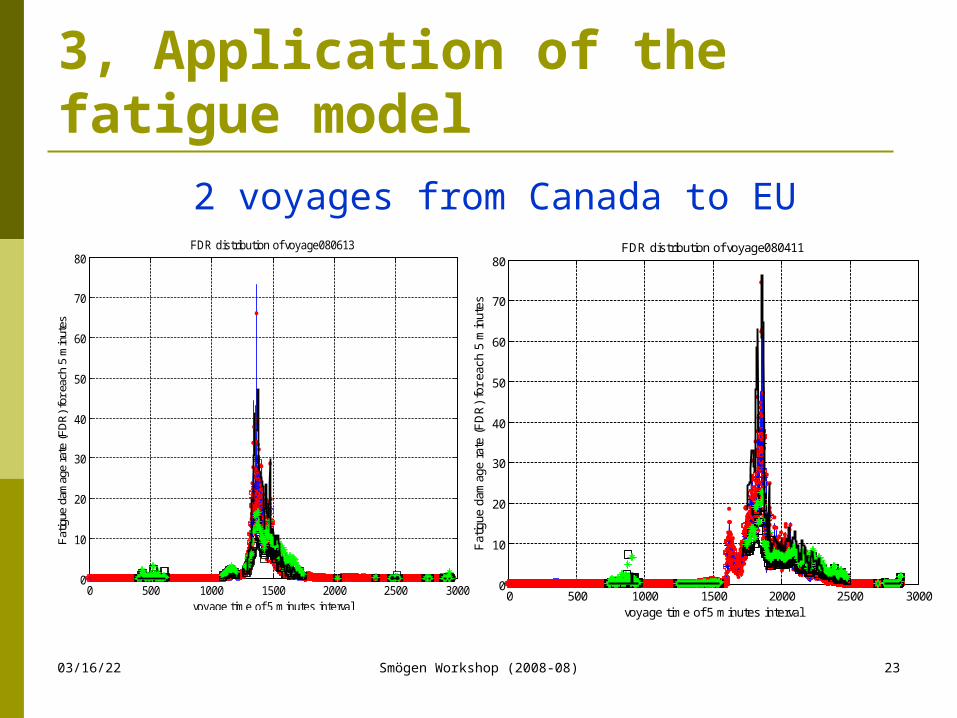
2 voyages from Canada to EU
3, Application of the fatigue model
0 500 1000 1500 2000 2500 30000
10
20
30
40
50
60
70
80FDR distribution of voyage080613
voyage time of 5 minutes interval
Fatig
ue d
amag
e ra
te (F
DR
) for
eac
h 5
min
utes
0 500 1000 1500 2000 2500 30000
10
20
30
40
50
60
70
80FDR distribution of voyage080411
voyage time of 5 minutes interval
Fat
igue
dam
age
rate
(F
DR
) fo
r ea
ch 5
min
utes

04/18/23 Smögen Workshop (2008-08) 24
Constant C and Fatigue damage accumulation
3, Application of the fatigue model
Voyage name voy080613 voy080411
Constant C 19.0415 19.0201
Rain-flowNBA on signal
NBA on Hs
Theoretical method
voy080613
0.0014449 0.0015205 0.0017229 0.0023782
voy080411
0.0024546 0.0026607 0.002717 0.0043745
04/18/23 Smögen Workshop (2008-08) 25
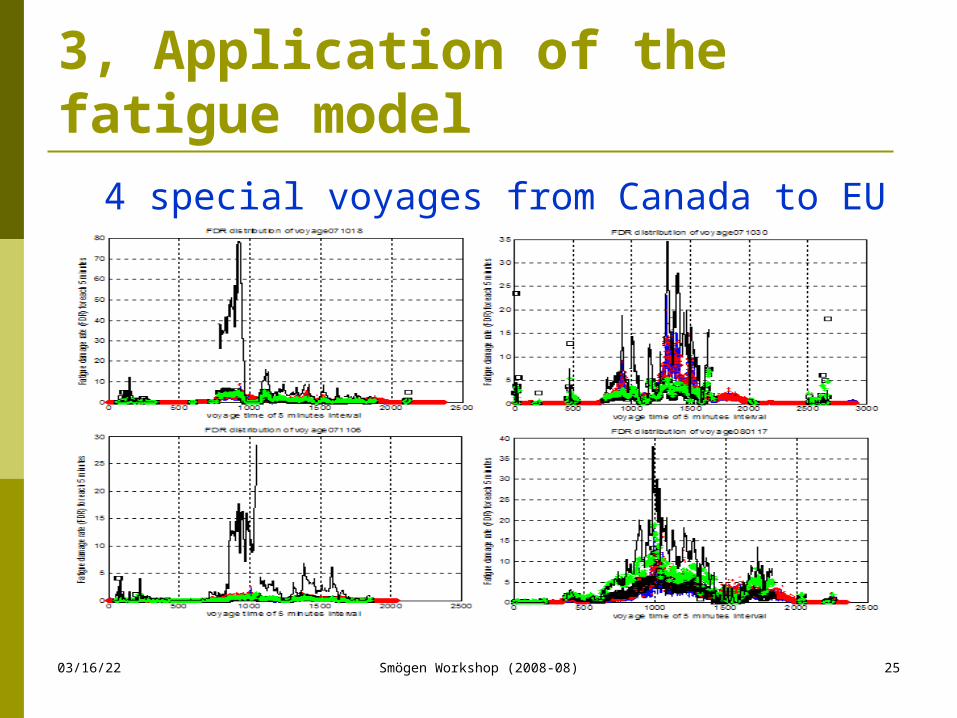
4 special voyages from Canada to EU
3, Application of the fatigue model
04/18/23 Smögen Workshop (2008-08) 26
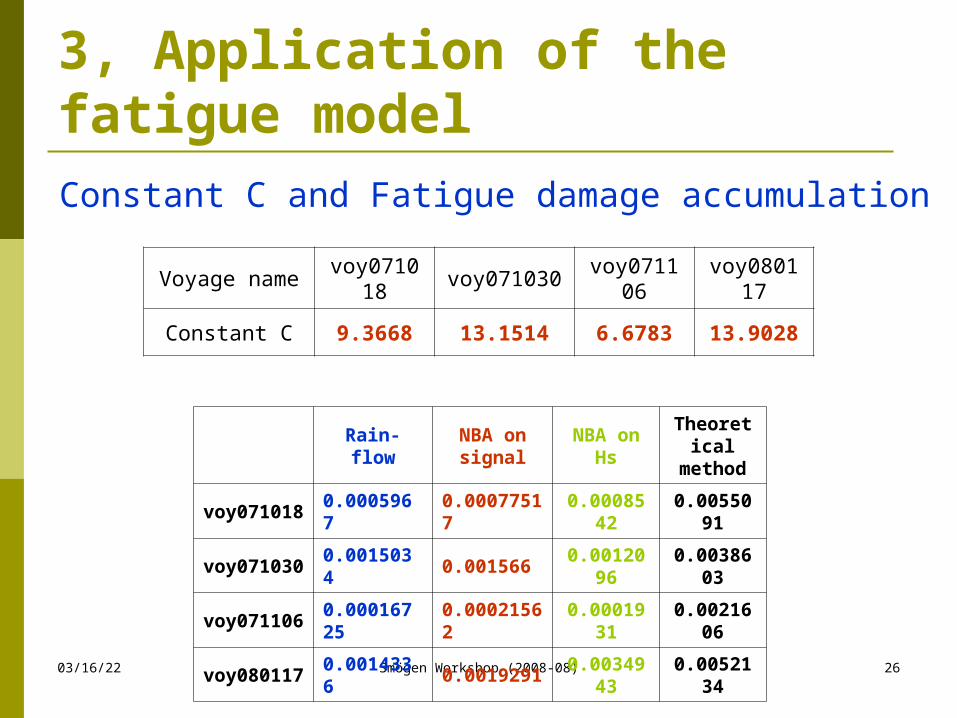
Constant C and Fatigue damage accumulation
3, Application of the fatigue model
Voyage name voy071018 voy071030 voy071106 voy080117
Constant C 9.3668 13.1514 6.6783 13.9028
Rain-flowNBA on signal
NBA on Hs
Theoretical method
voy071018 0.0005967 0.00077517 0.0008542 0.0055091
voy071030 0.0015034 0.001566 0.0012096 0.0038603
voy071106 0.00016725 0.00021562 0.0001931 0.0021606
voy080117 0.0014336 0.0019291 0.0034943 0.0052134
04/18/23 Smögen Workshop (2008-08) 27
4, Conclusions1. Our fatigue estimation model works quite well, and its
precision is much better than the theoretical method
2. For the fatigue estimation location of above vessel, the constant C keeps about 19
3. There are a lot of uncertainties in the model (hs, fz)…
4. Comparing to the other parameters, wave Hs is the most important factor of fatigue damage …(further work)
5. Need to check wave spectrum measurement by satellite wave model…
6. Put this model in shipping routing application…