fatigue crack damage detection using subharmonic · pdf filefatigue crack damage detection...
TRANSCRIPT

Fatigue crack damage detection using subharmonic component with nonlinearboundary conditionWeiliang Wu, Yanfeng Shen, Wenzhong Qu, Li Xiao, and Victor Giurgiutiu Citation: AIP Conference Proceedings 1650, 1609 (2015); doi: 10.1063/1.4914781 View online: http://dx.doi.org/10.1063/1.4914781 View Table of Contents: http://scitation.aip.org/content/aip/proceeding/aipcp/1650?ver=pdfcov Published by the AIP Publishing Articles you may be interested in Noncontact fatigue crack detection using nonlinear wave modulation spectroscopy J. Acoust. Soc. Am. 134, 4105 (2013); 10.1121/1.4831065 Nonlinear ultrasonic measurements with EMATs for detecting pre-cracking fatigue damage AIP Conf. Proc. 1430, 299 (2012); 10.1063/1.4716243 MONITORING GROWTH OF CLOSED FATIGUE CRACK USING SUBHARMONIC PHASED ARRAY AIP Conf. Proc. 1211, 903 (2010); 10.1063/1.3362519 FATIGUE CRACK DETECTION USING DIGITAL IMAGE CORRELATION AIP Conf. Proc. 1096, 689 (2009); 10.1063/1.3114323 Fatigue Crack Closure Analysis Using Nonlinear Ultrasound AIP Conf. Proc. 700, 1256 (2004); 10.1063/1.1711761
This article is copyrighted as indicated in the article. Reuse of AIP content is subject to the terms at: http://scitation.aip.org/termsconditions. Downloaded to IP:
68.43.178.133 On: Tue, 07 Apr 2015 02:17:44
Fatigue Crack Damage Detection Using Subharmonic Component with Nonlinear Boundary Condition
Weiliang Wu1,a, Yanfeng Shen2,b,Wenzhong Qu1,c, Li Xiao1,d , Victor Giurgiutiu2,e
1 Department of Engineering Mechanics, Wuhan University, Wuhan, Hubei, China2 Department of Mechanical Engineering, University of South Carolina, Columbia, South Carolina, United States
a) [email protected]) [email protected]
c) [email protected]) [email protected]
Abstract. In recent years, researchers have focused on structural health monitoring (SHM) and damage detectiontechniques using nonlinear vibration and nonlinear ultrasonic methods. Fatigue cracks may exhibit contact acoustic nonlinearity (CAN) with distinctive features such as superharmonics and subharmonics in the power spectrum of the sensing signals. However, challenges have been noticed in the practical applications of the harmonic methods. For instance, superharmonics can also be generated by the piezoelectric transducers and the electronic equipment; super/subharmonics may also stem from the nonlinear boundary conditions such as structural fixtures and joints. It is hard to tell whether the nonlinear features come from the structural damage or the intrinsic nonlinear boundary conditions. The objective of this paper is to demonstrate the application of nonlinear ultrasonic subharmonic method for detecting fatigue cracks withnonlinear boundary conditions. The fatigue crack was qualitatively modeled as a single-degree-of-freedom (SDOF) system with non-classical hysteretic nonlinear interface forces at both sides of the crack surfaces. The threshold of subharmonic generation was studied, and the influence of crack interface parameters on the subharmonic resonance condition was investigated. The different threshold behaviors between the nonlinear boundary condition and the fatigue crack was found, which can be used to distinguish the source of nonlinear subharmonic features. To evaluate the proposed method, experiments of an aluminum plate with a fatigue crack were conducted to quantitatively verify the subharmonic resonancerange. Two surface-bonded piezoelectric transducers were used to generate and receive ultrasonic wave signals. The fatigue damage was characterized in terms of a subharmonic damage index. The experimental results demonstrated that the subharmonic component of the sensing signal can be used to detect the fatigue crack and further distinguish it from inherent nonlinear boundary conditions.
INTRODUCTION
Monitoring, locating, and evaluating the severity of fatigue cracks promptly is not only important for the structure security and the prevention of serious failure, but also provides decisions supportive for the maintenance of the structure. Recently, nonlinear vibration and nonlinear ultrasound methods are drawing increasing interest in structural health monitoring (SHM) and nondestructive evaluation (NDE). These nonlinear techniques, specifically the harmonic generation methods, are sensitive to closed-contact defects, micro-cracks, and early stage fatigue. However, challenges have been noticed in the practical applications of the harmonic methods. For instance, superharmonics can also be generated by the piezoelectric transducers and the electronic equipment. These harmonics increase the background noise and deteriorate the S/N ratio [1, 2]. The presence of nonlinearity introduced by amplifiers and transducers during the measurement makes it difficult to detect the defect-induced nonlinearity such as the fatigue cracks. Another challenge is that harmonics may also stem from the contact boundary conditions such as structural fixtures and joints.It is hard to tell whether the harmonics come from the structural damage or the intrinsic nonlinear boundary conditions.Aymerich et al. [3] demonstrated the importance of the effect of boundary conditions when nonlinear acoustics is used for impact damage detection. Polimeno and Meo [4] investigated the effect of a clamping boundary on Nonlinear
41st Annual Review of Progress in Quantitative Nondestructive EvaluationAIP Conf. Proc. 1650, 1609-1615 (2015); doi: 10.1063/1.4914781
© 2015 AIP Publishing LLC 978-0-7354-1292-7/$30.00
1609 This article is copyrighted as indicated in the article. Reuse of AIP content is subject to the terms at: http://scitation.aip.org/termsconditions. Downloaded to IP:
68.43.178.133 On: Tue, 07 Apr 2015 02:17:44
Elastic Wave Spectroscopy (NEWS) nondestructive technique. To date, few researches on distinguishing the defect-induced nonlinearities from boundary nonlinearities have been reported. Several studies focused on subharmonics for damage detection. Unlike superharmonics, subharmonics cannot be introduced by electronic equipment and their generation requires specific excitation conditions, which makes them more reliable for damage detection [5-8].Because of these features, subharmonic generation method can get rid of the nonlinear effects of measurement equipment. Subharmonics generally exhibit a threshold behavior, where they can only occur when certain conditions on the input (amplitude and frequency) are satisfied. The specific excitation conditions make it possible to distinguish the source of the nonlinearity.
This paper aims to demonstrate the application of nonlinear ultrasonic subharmonic method for detecting fatigue cracks with nonlinear boundary conditions. For the threshold phenomenon of subharmonic, the excitation conditions such as excitation amplitude and excitation frequency were first investigated by developing a SDOF qualitative model. Then experiments of an aluminum plate with a fatigue crack were conducted to quantitatively verify the subharmonic resonance range and the different threshold behaviors between the nonlinear boundary condition and the fatigue crack.The results demonstrated that the subharmonic methods have the potential to detect damage with nonlinear boundary conditions.
QUALITATIVE MODEL OF FATIGUE CRACK
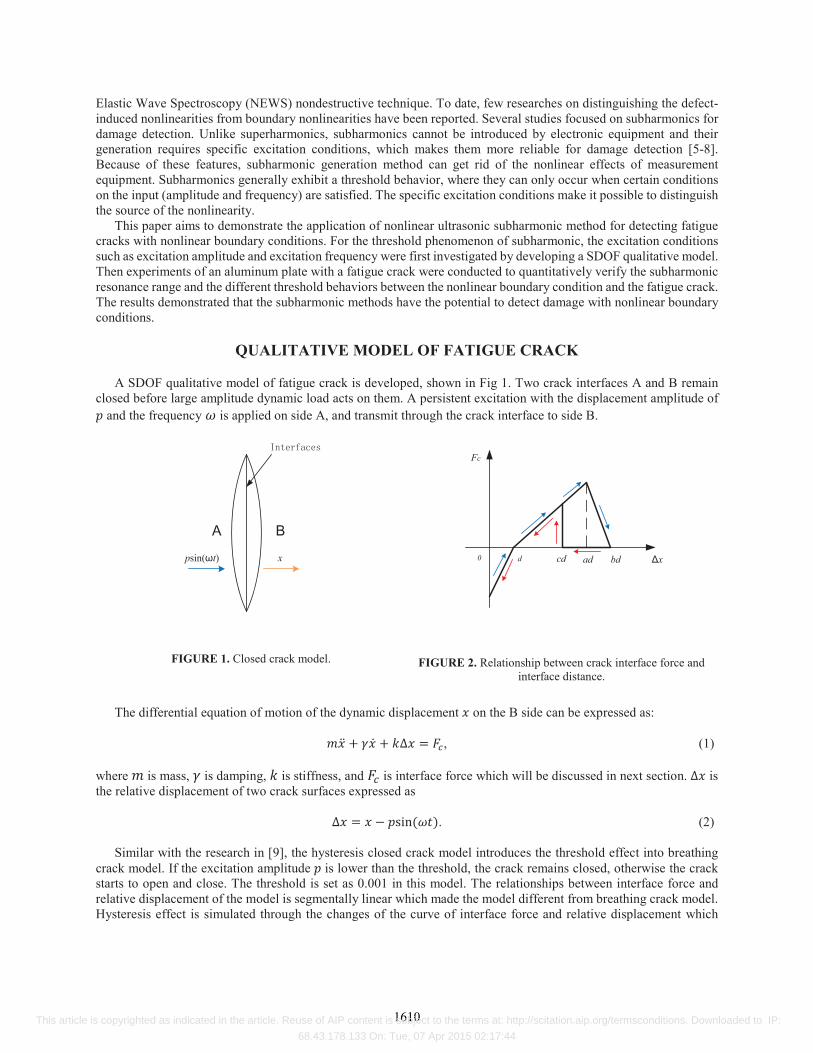
A SDOF qualitative model of fatigue crack is developed, shown in Fig 1. Two crack interfaces A and B remain closed before large amplitude dynamic load acts on them. A persistent excitation with the displacement amplitude of
and the frequency is applied on side A, and transmit through the crack interface to side B.
psin( t) x
Fc
x0 d cd ad bd
FIGURE 1. Closed crack model. FIGURE 2. Relationship between crack interface force and interface distance.
The differential equation of motion of the dynamic displacement on the B side can be expressed as:+ + = , (1)
where is mass, is damping, is stiffness, and is interface force which will be discussed in next section. isthe relative displacement of two crack surfaces expressed as= sin( ). (2)
Similar with the research in [9], the hysteresis closed crack model introduces the threshold effect into breathing crack model. If the excitation amplitude is lower than the threshold, the crack remains closed, otherwise the crack starts to open and close. The threshold is set as 0.001 in this model. The relationships between interface force and relative displacement of the model is segmentally linear which made the model different from breathing crack model. Hysteresis effect is simulated through the changes of the curve of interface force and relative displacement which
1610 This article is copyrighted as indicated in the article. Reuse of AIP content is subject to the terms at: http://scitation.aip.org/termsconditions. Downloaded to IP:
68.43.178.133 On: Tue, 07 Apr 2015 02:17:44
turned to be a closed curve as it is shown in Fig 2. The x-axis is relative displacement and the y-axis is interface force .
(1)When side B moves away from side A in Fig 1, the interfaces force changes as blue arrow shown in Fig 2and is expressed as
= < < 0 > ,(3)
where , are displacement segment coefficients. is the equilibrium position, where the interface force becomes 0.is the fatigue crack interfacial roughness. When , the interface force effectively behaves as a
compressional force and decreases with the increment of relative displacement. The crack stiffness in this stage is .When < , performs as tensional force and increases with the decrease of relative displacement. The interface tension is maximum when relative displacement reaches ad. The crack stiffness in this stage is .When < , performs as tensional force but decrease with the increment of relative displacement. The crack stiffness in this stage is . When > , the crack is completely open and becomes 0.
(2) When the side B moves towards side A, the interface force changes as the red arrow in Fig 2 and can beexpressed as
= < 0 < , (4)
where c is a displacement segment coefficient. When < , stays 0. When < , behaves as atensional force and decreases with the decrease of . The crack stiffness is . When , becomes compressional force and increase with the decrease of . The crack stiffness is . As shown in Fig 2, the process of the crack opening and closing from to is different, which simulated hysteresis characteristics of a closed crack.
Parameters used in this model are = 1, = 0.05, = 1, = 1 × 10 , = 0.6 × 10 , = , =4, = 5, = 3, = 1 × 10 , = 10 . MATLAB is used to calculate the closed crack model with the sampling frequency of 10 Hz and the computing time of 2000s. The natural frequency is found to be 0.2Hz by applying a sweep frequency excitation on the model. It should be noted that this model is only a reduced order qualitative approach to investigate the subharmonic generation threshold behavior of the closed fatigue crack.
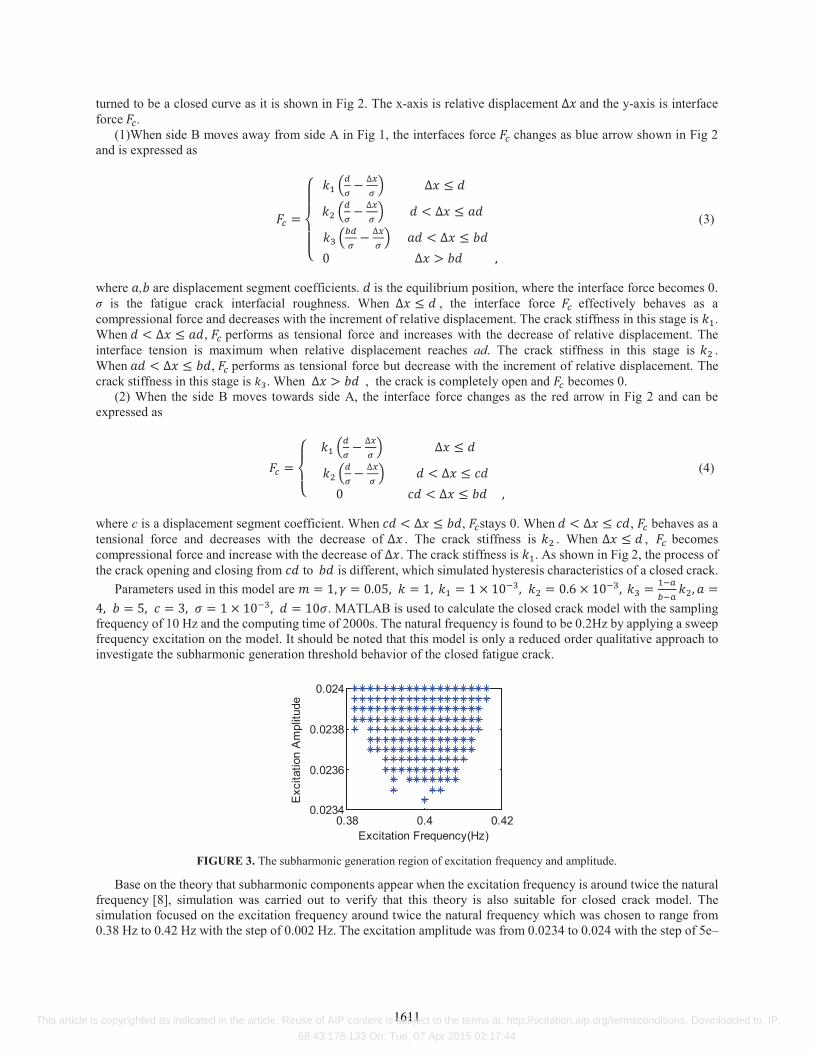
FIGURE 3. The subharmonic generation region of excitation frequency and amplitude.
Base on the theory that subharmonic components appear when the excitation frequency is around twice the natural frequency [8], simulation was carried out to verify that this theory is also suitable for closed crack model. The simulation focused on the excitation frequency around twice the natural frequency which was chosen to range from 0.38 Hz to 0.42 Hz with the step of 0.002 Hz. The excitation amplitude was from 0.0234 to 0.024 with the step of 5e–
0.38 0.4 0.420.0234
0.0236
0.0238
0.024
Excitation Frequency(Hz)
Exc
itatio
n A
mpl
itude
1611 This article is copyrighted as indicated in the article. Reuse of AIP content is subject to the terms at: http://scitation.aip.org/termsconditions. Downloaded to IP:
68.43.178.133 On: Tue, 07 Apr 2015 02:17:44
5. The roughness of the crack model was set as 1 × 10 , and the equilibrium position was 10 , the region of the conditions which can produce subharmonic is shown in Fig 3. Similar with the result in [7], it shows a V-shapedregion which can produce subharmonic. It means that the threshold of excitation amplitude reaches its minimum when the excitation frequency is around twice the natural frequency. Higher excitation amplitude is required to generate subharmonics while the excitation frequency is away from twice the natural frequency.
EXPERIMENTAL STUDY
To investigate the different threshold behaviors between the nonlinear boundary condition and the fatigue crack, which can be used to distinguish the source of nonlinear subharmonic features, experiments on an aluminum plate with a fatigue crack were conducted to quantitatively verify the subharmonic resonance range.
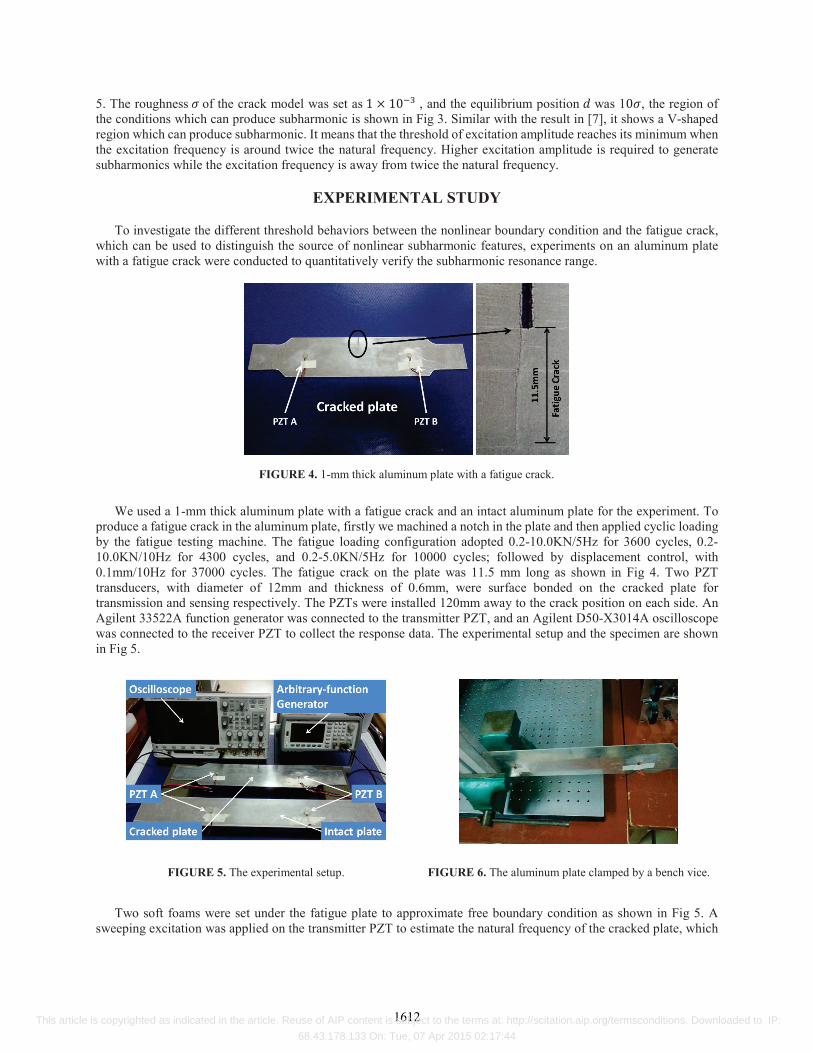
FIGURE 4. 1-mm thick aluminum plate with a fatigue crack.
We used a 1-mm thick aluminum plate with a fatigue crack and an intact aluminum plate for the experiment. To produce a fatigue crack in the aluminum plate, firstly we machined a notch in the plate and then applied cyclic loading by the fatigue testing machine. The fatigue loading configuration adopted 0.2-10.0KN/5Hz for 3600 cycles, 0.2-10.0KN/10Hz for 4300 cycles, and 0.2-5.0KN/5Hz for 10000 cycles; followed by displacement control, with 0.1mm/10Hz for 37000 cycles. The fatigue crack on the plate was 11.5 mm long as shown in Fig 4. Two PZTtransducers, with diameter of 12mm and thickness of 0.6mm, were surface bonded on the cracked plate for transmission and sensing respectively. The PZTs were installed 120mm away to the crack position on each side. AnAgilent 33522A function generator was connected to the transmitter PZT, and an Agilent D50-X3014A oscilloscope was connected to the receiver PZT to collect the response data. The experimental setup and the specimen are shown in Fig 5.
FIGURE 5. The experimental setup. FIGURE 6. The aluminum plate clamped by a bench vice.
Two soft foams were set under the fatigue plate to approximate free boundary condition as shown in Fig 5. Asweeping excitation was applied on the transmitter PZT to estimate the natural frequency of the cracked plate, which
1612 This article is copyrighted as indicated in the article. Reuse of AIP content is subject to the terms at: http://scitation.aip.org/termsconditions. Downloaded to IP:
68.43.178.133 On: Tue, 07 Apr 2015 02:17:44
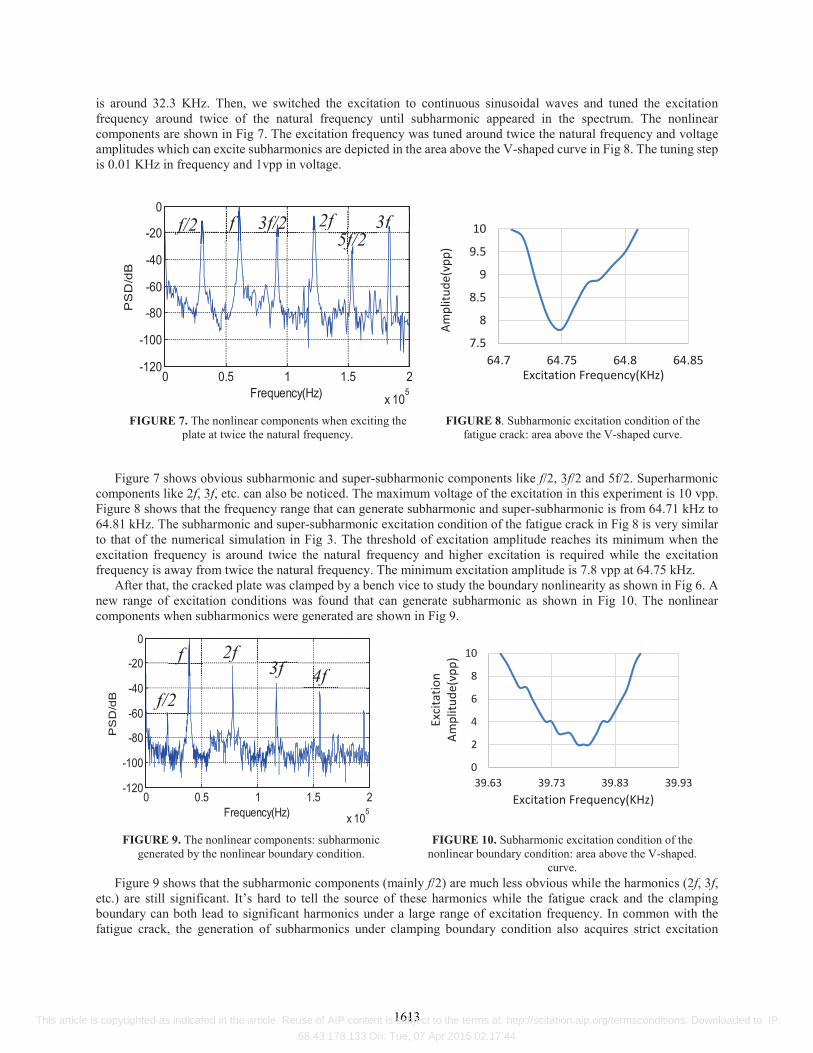
is around 32.3 KHz. Then, we switched the excitation to continuous sinusoidal waves and tuned the excitation frequency around twice of the natural frequency until subharmonic appeared in the spectrum. The nonlinear components are shown in Fig 7. The excitation frequency was tuned around twice the natural frequency and voltageamplitudes which can excite subharmonics are depicted in the area above the V-shaped curve in Fig 8. The tuning step is 0.01 KHz in frequency and 1vpp in voltage.
FIGURE 7. The nonlinear components when exciting the plate at twice the natural frequency.
FIGURE 8. Subharmonic excitation condition of the fatigue crack: area above the V-shaped curve.
Figure 7 shows obvious subharmonic and super-subharmonic components like f/2, 3f/2 and 5f/2. Superharmonic components like 2f, 3f, etc. can also be noticed. The maximum voltage of the excitation in this experiment is 10 vpp.Figure 8 shows that the frequency range that can generate subharmonic and super-subharmonic is from 64.71 kHz to 64.81 kHz. The subharmonic and super-subharmonic excitation condition of the fatigue crack in Fig 8 is very similar to that of the numerical simulation in Fig 3. The threshold of excitation amplitude reaches its minimum when the excitation frequency is around twice the natural frequency and higher excitation is required while the excitation frequency is away from twice the natural frequency. The minimum excitation amplitude is 7.8 vpp at 64.75 kHz.
After that, the cracked plate was clamped by a bench vice to study the boundary nonlinearity as shown in Fig 6. A new range of excitation conditions was found that can generate subharmonic as shown in Fig 10. The nonlinear components when subharmonics were generated are shown in Fig 9.
FIGURE 9. The nonlinear components: subharmonic generated by the nonlinear boundary condition.
FIGURE 10. Subharmonic excitation condition of the nonlinear boundary condition: area above the V-shaped.
curve.Figure 9 shows that the subharmonic components (mainly f/2) are much less obvious while the harmonics (2f, 3f,
etc.) are still significant. It’s hard to tell the source of these harmonics while the fatigue crack and the clamping boundary can both lead to significant harmonics under a large range of excitation frequency. In common with the fatigue crack, the generation of subharmonics under clamping boundary condition also acquires strict excitation
7.5
8
8.5
9
9.5
10
64.7 64.75 64.8 64.85
Ampl
itude
(vpp
)
Excitation Frequency(KHz)
0
2
4
6
8
10
39.63 39.73 39.83 39.93
Exci
tatio
nAm
plitu
de(v
pp)
Excitation Frequency(KHz)
0 0.5 1 1.5 2
x 105
-120
-100
-80
-60
-40
-20
0
Frequency(Hz)
PS
D/d
B
f/2 f 3f/2 2ff5f/2
3f
0 0.5 1 1.5 2
x 105
-120
-100
-80
-60
-40
-20
0
Frequency(Hz)
PS
D/d
B f/2
f 2f3f 4f
1613 This article is copyrighted as indicated in the article. Reuse of AIP content is subject to the terms at: http://scitation.aip.org/termsconditions. Downloaded to IP:
68.43.178.133 On: Tue, 07 Apr 2015 02:17:44
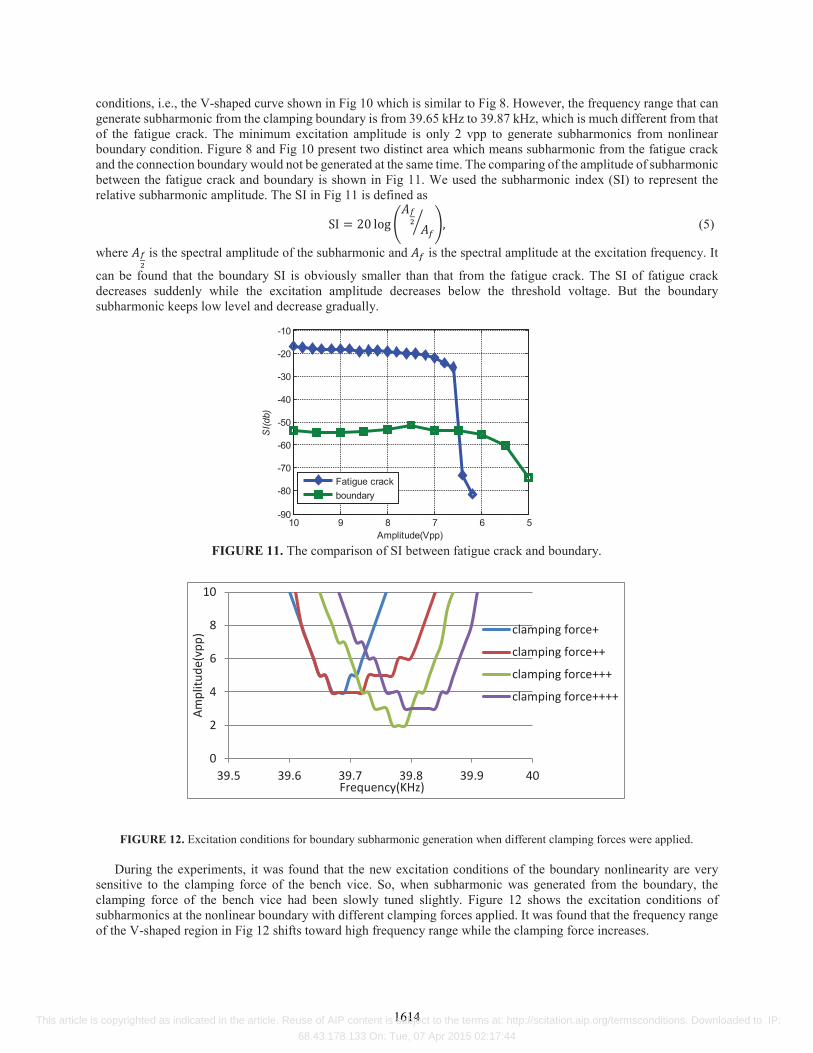
conditions, i.e., the V-shaped curve shown in Fig 10 which is similar to Fig 8. However, the frequency range that can generate subharmonic from the clamping boundary is from 39.65 kHz to 39.87 kHz, which is much different from that of the fatigue crack. The minimum excitation amplitude is only 2 vpp to generate subharmonics from nonlinear boundary condition. Figure 8 and Fig 10 present two distinct area which means subharmonic from the fatigue crack and the connection boundary would not be generated at the same time. The comparing of the amplitude of subharmonic between the fatigue crack and boundary is shown in Fig 11. We used the subharmonic index (SI) to represent the relative subharmonic amplitude. The SI in Fig 11 is defined asSI = 20 log , (5)
where is the spectral amplitude of the subharmonic and is the spectral amplitude at the excitation frequency. It
can be found that the boundary SI is obviously smaller than that from the fatigue crack. The SI of fatigue crack decreases suddenly while the excitation amplitude decreases below the threshold voltage. But the boundary subharmonic keeps low level and decrease gradually.
FIGURE 11. The comparison of SI between fatigue crack and boundary.
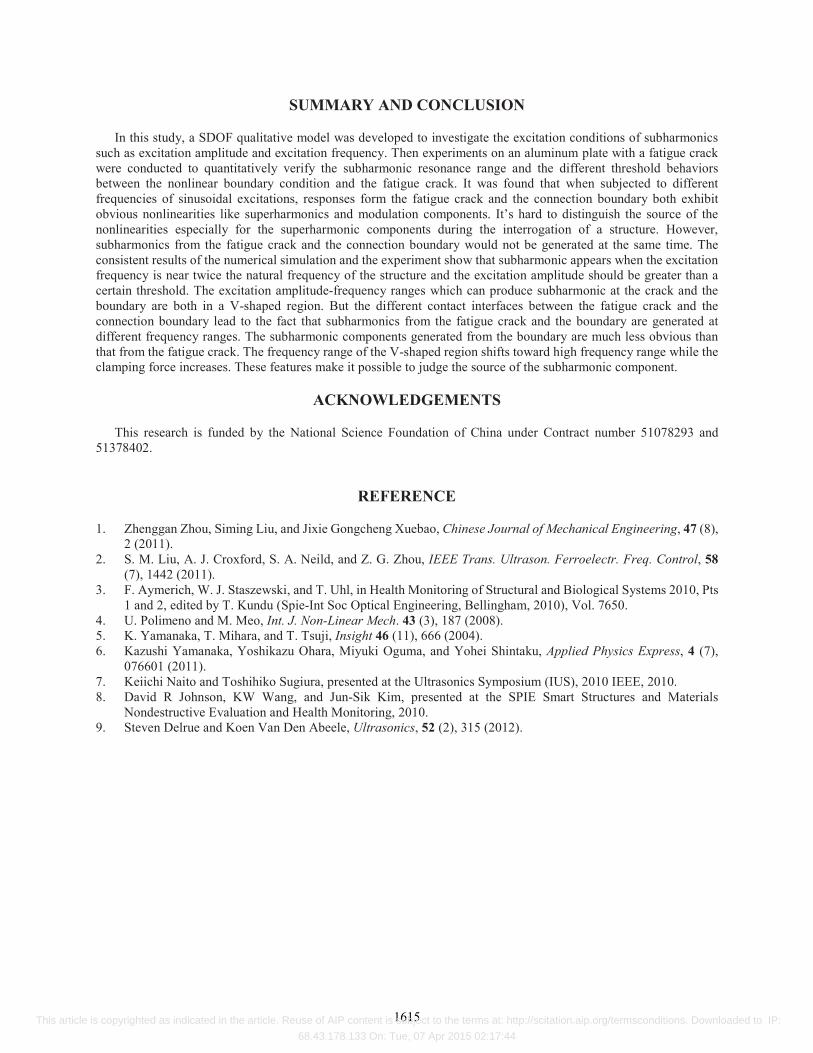
FIGURE 12. Excitation conditions for boundary subharmonic generation when different clamping forces were applied.
During the experiments, it was found that the new excitation conditions of the boundary nonlinearity are very sensitive to the clamping force of the bench vice. So, when subharmonic was generated from the boundary, the clamping force of the bench vice had been slowly tuned slightly. Figure 12 shows the excitation conditions of subharmonics at the nonlinear boundary with different clamping forces applied. It was found that the frequency range of the V-shaped region in Fig 12 shifts toward high frequency range while the clamping force increases.
5678910-90
-80
-70
-60
-50
-40
-30
-20
-10
Amplitude(Vpp)
SI(db)
Fatigue crackboundary
0
2
4
6
8
10
39.5 39.6 39.7 39.8 39.9 40
Ampl
itude
(vpp
)
Frequency(KHz)
clamping force+
clamping force++
clamping force+++
clamping force++++
1614 This article is copyrighted as indicated in the article. Reuse of AIP content is subject to the terms at: http://scitation.aip.org/termsconditions. Downloaded to IP:
68.43.178.133 On: Tue, 07 Apr 2015 02:17:44
SUMMARY AND CONCLUSION
In this study, a SDOF qualitative model was developed to investigate the excitation conditions of subharmonics such as excitation amplitude and excitation frequency. Then experiments on an aluminum plate with a fatigue crack were conducted to quantitatively verify the subharmonic resonance range and the different threshold behaviors between the nonlinear boundary condition and the fatigue crack. It was found that when subjected to different frequencies of sinusoidal excitations, responses form the fatigue crack and the connection boundary both exhibit obvious nonlinearities like superharmonics and modulation components. It’s hard to distinguish the source of the nonlinearities especially for the superharmonic components during the interrogation of a structure. However, subharmonics from the fatigue crack and the connection boundary would not be generated at the same time. The consistent results of the numerical simulation and the experiment show that subharmonic appears when the excitation frequency is near twice the natural frequency of the structure and the excitation amplitude should be greater than a certain threshold. The excitation amplitude-frequency ranges which can produce subharmonic at the crack and the boundary are both in a V-shaped region. But the different contact interfaces between the fatigue crack and the connection boundary lead to the fact that subharmonics from the fatigue crack and the boundary are generated at different frequency ranges. The subharmonic components generated from the boundary are much less obvious than that from the fatigue crack. The frequency range of the V-shaped region shifts toward high frequency range while the clamping force increases. These features make it possible to judge the source of the subharmonic component.
ACKNOWLEDGEMENTS
This research is funded by the National Science Foundation of China under Contract number 51078293 and 51378402.
REFERENCE
1. Zhenggan Zhou, Siming Liu, and Jixie Gongcheng Xuebao, Chinese Journal of Mechanical Engineering, 47 (8), 2 (2011).
2. S. M. Liu, A. J. Croxford, S. A. Neild, and Z. G. Zhou, IEEE Trans. Ultrason. Ferroelectr. Freq. Control, 58(7), 1442 (2011).
3. F. Aymerich, W. J. Staszewski, and T. Uhl, in Health Monitoring of Structural and Biological Systems 2010, Pts 1 and 2, edited by T. Kundu (Spie-Int Soc Optical Engineering, Bellingham, 2010), Vol. 7650.
4. U. Polimeno and M. Meo, Int. J. Non-Linear Mech. 43 (3), 187 (2008).5. K. Yamanaka, T. Mihara, and T. Tsuji, Insight 46 (11), 666 (2004).6. Kazushi Yamanaka, Yoshikazu Ohara, Miyuki Oguma, and Yohei Shintaku, Applied Physics Express, 4 (7),
076601 (2011).7. Keiichi Naito and Toshihiko Sugiura, presented at the Ultrasonics Symposium (IUS), 2010 IEEE, 2010.8. David R Johnson, KW Wang, and Jun-Sik Kim, presented at the SPIE Smart Structures and Materials
Nondestructive Evaluation and Health Monitoring, 2010.9. Steven Delrue and Koen Van Den Abeele, Ultrasonics, 52 (2), 315 (2012).
1615 This article is copyrighted as indicated in the article. Reuse of AIP content is subject to the terms at: http://scitation.aip.org/termsconditions. Downloaded to IP:
68.43.178.133 On: Tue, 07 Apr 2015 02:17:44