fate mapping reveals the age structure of the peripheral t
TRANSCRIPT
Fate mapping reveals the age structure of theperipheral T cell compartmentArnold Reynaldia, Norah L. Smithb, Timothy E. Schlubc, Cybelle Tabilasb, Vanessa Venturia, Brian D. Ruddb,1,and Miles P. Davenporta,1
aKirby Institute for Infection and Immunity, University of New South Wales, Sydney, NSW 2052, Australia; bDepartment of Microbiology and Immunology,Cornell University, Ithaca, NY 14853; and cSydney School of Public Health, Sydney University, Sydney, NSW 2006, Australia
Edited by Rafi Ahmed, Emory University, Atlanta, GA, and approved January 18, 2019 (received for review July 12, 2018)
Accumulating evidence indicates that the immune system does notdevelop in a linear fashion, but rather as distinct developmentallayers formed from sequential waves of hematopoietic stem cells,each giving rise to unique populations of immune cells at differentstages of development. Although recent studies have indicatedthat conventional CD8+ T cells produced in early life persist intoadulthood and exhibit distinct roles during infection, the develop-mental architecture of the peripheral T cell compartment remainsundefined. In this study, we used a mouse model to permanentlylabel CD8+ T cells produced during distinct windows of develop-ment and traced their history to generate fate maps of CD8+ T cellsproduced during different stages of life. We then used mathemat-ical modeling to understand the age structure of the CD8+ T cellcompartment across the lifespan. Interestingly, we found that sur-vival rate of CD8+ T cells depends on both the age and develop-mental origin of the cells. Recently produced cells show an initialrapid decay rate, which slows with age of the animal at which thecells were produced. For cells produced at any age, the rate ofdecay also slows with the age of the cell. We derive a functionto describe this and predict the “age distribution” of the CD8+
T cell pool for animals of any given age. These data provide aquantitative framework for understanding the ontogeny of theCD8+ T cell compartment and help to contextualize age-relatedchanges in the CD8+ T cell response to infection.
CD8+ T cells | ontogeny | T cell homeostasis | mathematical modeling |immunology
Immune protection against a wide array of intracellular path-ogens requires the generation and maintenance of large
numbers of CD8+ T cells that arise from hematopoietic stemcells (HSCs). During immune ontogeny, the thymus is colonizedby successive waves of HSCs. The first major wave of HSCs isderived from the fetal liver, and colonization of the thymus oc-curs around midgestation (approximately embryonic day 13, inmice) (1). These fetal HSCs give rise to fetal and neonatal CD8+
T cells, which have an inherent propensity to rapidly proliferateand quickly become terminally differentiated after antigenicstimulation (2). The second wave of HSCs originates from thebone marrow. These cells seed the thymus just before birth(approximately embryonic day 20) and produce adult CD8+
T cells (1, 3). The adult lineage of CD8+ T cells respond lessvigorously in the early phases of infection compared with fetal-derived CD8+ T cells but have an enhanced ability to transitioninto the long-lived memory pool (2). We recently discovered thatfetal-derived CD8+ T cells persist into adulthood as a distinctdevelopmental layer and maintain their unique functionalproperties (4). Importantly, these fetal-derived CD8+ T cells arethe first to respond to infection and become effector cells,whereas the cells produced later in life respond more slowly butare more efficient at forming memory cells. This leads to theimportant and unanswered question of how many fetal- andadult-derived cells are present in healthy animals at variousstages of life.
Understanding how the entire CD8+ T cell compartment isconstructed and maintained requires an accurate estimate of thelifespan of T cells produced at different stages of life. Experi-mental studies have used a variety of techniques, includingstudies of the proportion of replicating or dying cells (usingstaining for markers such as Ki67, annexin V, or TUNEL), orlabeling of dividing cells using BrdU or deuterated water orglucose (5–7). Modeling of this data has then been used topredict average cell turnover and survival rates. For example, theaverage lifespan of naïve CD8+ T cells in mice is predicted to be∼11 wk (8), whereas naïve CD8+ T cells in humans have beenestimated to persist for ∼5 to 10 y (9). However, a limitation ofthis approach is that the survival rate is inferred rather thanmeasured directly. Alternative approaches have used adoptivetransfer or studies of cell numbers under different manipulations(such as thymectomy or busulfan treatment) to infer cell survival(8, 10–12). These studies have often assumed a homogenouspopulation of cells, although recent studies have hinted at ad-aptation or selection of cells over time (12).We have recently developed an experimental method to per-
manently label, or “timestamp,“ CD8+ T cells during thymicdevelopment. This utilizes a CD4 promoter-driven, tamoxifen-inducible cre (CD4cre-ERT2) (4, 13) to switch on expression ofred fluorescent protein (RFP) in CD8+ T cells. Since CD8+
T cells only express CD4 briefly during the double-positive stageof T cell development in the thymus, this approach can be usedto selectively label CD8+ T cells undergoing thymic development
Significance
The development of the peripheral T cell pool is typically de-scribed based on the maturation and survival of cells in theperiphery, assuming all cells are created equal and have similarlifespans. We have developed a mouse model in which we can“timestamp” CD8+ T cells produced at different ages and tracktheir survival. We find that cells produced early in life persistand contribute to the adult pool. However, the dynamics of cellsurvival are dependent on the age at which they are produced,leading to a shifting population of cells with age. We proposethat heterogeneity in the developmental origins of cells con-tributes to the phenotypic heterogeneity of individual cellsobserved in adult animals.
Author contributions: A.R., N.L.S., T.E.S., C.T., V.V., B.D.R., and M.P.D. designed research;N.L.S., C.T., B.D.R., and M.P.D. performed research; N.L.S., C.T., B.D.R., and M.P.D. contrib-uted new reagents/analytic tools; A.R., T.E.S., V.V., and M.P.D. analyzed data; and A.R.,N.L.S., T.E.S., C.T., V.V., B.D.R., and M.P.D. wrote the paper.
The authors declare no conflict of interest.
This article is a PNAS Direct Submission.
Published under the PNAS license.1To whom correspondence may be addressed. Email: [email protected] or [email protected].
This article contains supporting information online at www.pnas.org/lookup/suppl/doi:10.1073/pnas.1811634116/-/DCSupplemental.
Published online February 14, 2019.
3974–3981 | PNAS | March 5, 2019 | vol. 116 | no. 10 www.pnas.org/cgi/doi/10.1073/pnas.1811634116
Dow
nloa
ded
by g
uest
on
Dec
embe
r 1,
202
1
during a brief window of tamoxifen administration. Moreover,once switched on this RFP expression is permanent, and thus thesurvival of a cohort of cells produced during a brief window canbe tracked for the life of the animal. The studies of timestampedcells have found that the diversity in cell phenotype and behaviorduring infection is due to the recruitment of cells with differentdevelopmental origins into the response (2, 4, 14). For example,cells produced in the neonatal period show faster responsivenessto infection but poor memory formation compared with cellsproduced later in life. These cells also persist into adulthood,maintaining their neonatal phenotype due to a unique epigeneticlandscape and transcription profile (4). These phenotypic dif-ferences among cells produced at different ages suggest that cellsurvival may also be dependent on the age at which cells wereproduced. Understanding the phenotype of cells produced atdifferent ages and their subsequent survival in the periphery mayprovide insights into immune responsiveness in later life.In this study, the timestamp mice were used to directly analyze
the survival of cells produced at different ages over time, withminimal manipulation of the animal. We applied a mathematicalmodeling approach to the data to obtain a comprehensive pic-ture of how the developmental layers in the CD8+ T cell com-partment change over the life of the animal. Our study revealedthat subsets of cells produced early in life persist across thelifespan. Consistent with previous reports (10, 12), we found thatcells showed increased survival the longer they persisted in the
periphery. However, our data also revealed that the de-velopmental origin of the cells (the age at which they wereproduced from the thymus) played an important role in thesurvival of CD8+ T cells. Our modeling demonstrates that thesurvival of CD8+ T cells in the periphery can be predicted from acombination of age of cell production plus time since cell pro-duction, producing a shifting landscape of cell age and originover time.
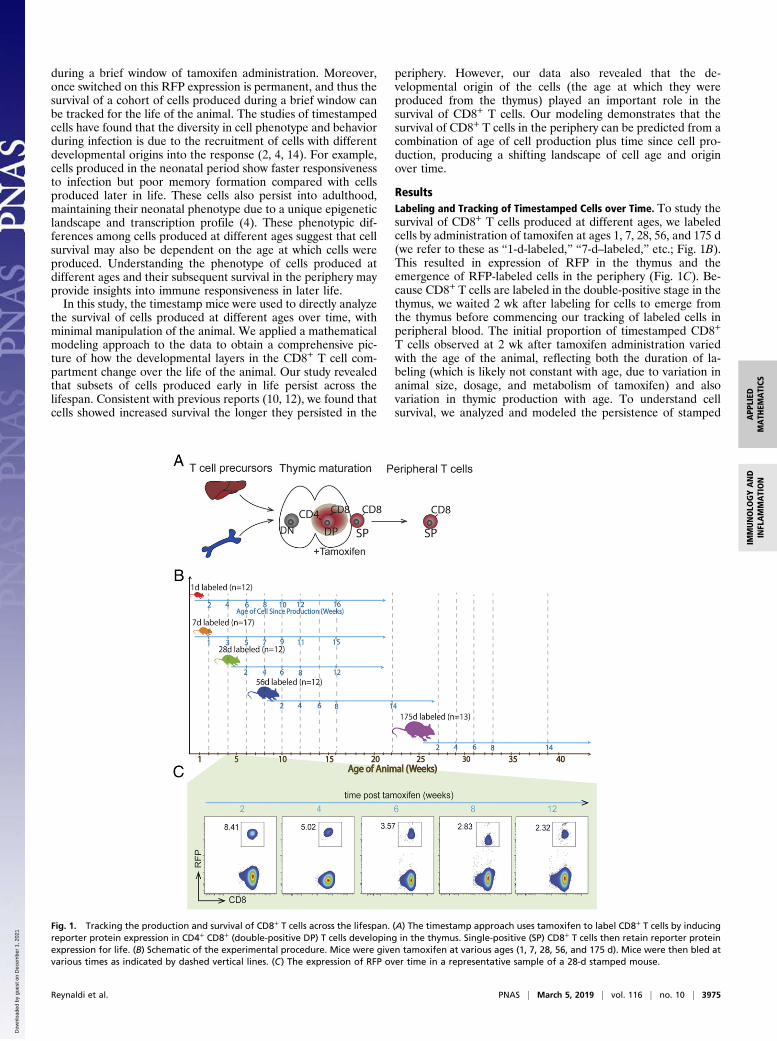
ResultsLabeling and Tracking of Timestamped Cells over Time. To study thesurvival of CD8+ T cells produced at different ages, we labeledcells by administration of tamoxifen at ages 1, 7, 28, 56, and 175 d(we refer to these as “1-d-labeled,” “7-d–labeled,” etc.; Fig. 1B).This resulted in expression of RFP in the thymus and theemergence of RFP-labeled cells in the periphery (Fig. 1C). Be-cause CD8+ T cells are labeled in the double-positive stage in thethymus, we waited 2 wk after labeling for cells to emerge fromthe thymus before commencing our tracking of labeled cells inperipheral blood. The initial proportion of timestamped CD8+
T cells observed at 2 wk after tamoxifen administration variedwith the age of the animal, reflecting both the duration of la-beling (which is likely not constant with age, due to variation inanimal size, dosage, and metabolism of tamoxifen) and alsovariation in thymic production with age. To understand cellsurvival, we analyzed and modeled the persistence of stamped
Fig. 1. Tracking the production and survival of CD8+ T cells across the lifespan. (A) The timestamp approach uses tamoxifen to label CD8+ T cells by inducingreporter protein expression in CD4+ CD8+ (double-positive DP) T cells developing in the thymus. Single-positive (SP) CD8+ T cells then retain reporter proteinexpression for life. (B) Schematic of the experimental procedure. Mice were given tamoxifen at various ages (1, 7, 28, 56, and 175 d). Mice were then bled atvarious times as indicated by dashed vertical lines. (C) The expression of RFP over time in a representative sample of a 28-d stamped mouse.
Reynaldi et al. PNAS | March 5, 2019 | vol. 116 | no. 10 | 3975
APP
LIED
MATH
EMATICS
IMMUNOLO
GYAND
INFLAMMATION
Dow
nloa
ded
by g
uest
on
Dec
embe
r 1,
202
1

CD8+ T cells in the periphery for 12 to 16 wk after labeling atdifferent ages.For animals labeled with tamoxifen on day 1 of life (1-d-
labeled) we tracked the proportion of labeled cells in peripheralblood from 2 wk of life onward. The persistence of cells presentsthe balance of cell replication and death, since the label is notdiluted by cell division. Cells labeled at 1 d of life declined rapidlysoon after labeling, and then their decay slows over time, sug-gesting that they are approaching a plateau beyond 100 d (red linein SI Appendix, Fig. S1C), consistent with the recent observationthat cells from young animals seemed “resistant” to replacementafter bone marrow transplantation (11, 15). However, this steepdecrease in the proportion of cells produced early in life may be atleast in part because of the degree of expansion in the total lym-phocyte population during this early period of life (SI Appendix,Fig. S1A). Thus, even if the stamped cells were at a constantnumber, the fraction of total CD8+ T cells would still decrease withtime. To correct for this dilutional effect, we account for changes intotal CD8+ T cells with age. Similarly, the “plateau” or reduceddecay of cells at older ages may be in part because of cells reachingthe background level of RFP expression (due to “leakiness” of thetimestamp label), and thus we also correct for the background levelof RFP expression at different ages.
Correcting for Increasing CD8+ T Cell Number. The change in totalCD8+ T cell number with age was estimated from analysis ofpooled spleen and lymph node cells of mice at ages 14, 28, 56, and245 d. Using a logistic function (SI Appendix, Eq. S2) we obtaineda function for the total CD8+ T cell number with age of the host(SI Appendix, Fig. S1A). As these mice were not treated withtamoxifen, we also checked the background levels of RFP in theCD8+ T cell population in the absence of treatment (∼0.1% ofCD8+ T cells). A smooth logistic function was used to fit the rawbackground of RFP expression (SI Appendix, Fig. S1B). Usingthese functions for total CD8+ T cell number and backgroundstaining we can then correct for these factors (SI Appendix, Eqs. S3and S4), to analyze labeled cell numbers over time.
Dynamics of Timestamped CD8+ T Cells with Age. The total numberof stamped cells over time was estimated after correcting for thetotal number of CD8+ T cells and the small amount of back-ground RFP staining (Fig. 2A). This revealed an age-dependentvariation in the initial number of stamped cells observed 2 wkafter labeling, as well as the subsequent kinetics of survival ofthese cells. Fig. 2A shows the corrected number of cells producedat different ages. Cells labeled on the first day of life (red line)are lost rapidly soon after production, but this rate of loss slowsover time to leave a fairly stable population by 100 d. Cells pro-
duced later in life appear to have a slightly slower initial rate ofdecline, but this rate also slows over time. To directly investigatewhether cellular age affects cell survival, we plot the fraction oflabeled cells remaining (as proportion of the peak number)against time since cellular production (Fig. 2B). From this it canbe seen that cells produced later in life tend to have a slower initialdecline in number. However, regardless of age of production, therate of loss of cells seems to slow with time since production.
Modeling the Survival of CD8+ T Cells Produced at Different Ages. Tounderstand the dynamics of survival of cells produced at differ-ent ages, we fitted the data with a variety of mathematicalmodels of increasing complexity (SI Appendix, Dynamics of La-beled Cells). The simplest of these models describes cell declinethat is at a constant exponential rate regardless of the age of theanimal, and time since production of the cell (model 1). Themodels then increase with complexity so that different hypoth-eses relating cell loss rates to the age of the animal, and/or thetime since production of the cell can be incrementally tested andcompared (SI Appendix, Table S1) using the Akaike informationcriterion (AIC).Comparison of these models suggests that cell survival changes
with both the age of the animal at which the cells were producedand the time since production of the cells. The model with thebest fit is one where cells that were timestamped at different ageshave different initial rates of decay, and this rate of decay slowswith time since production (the slowing of decay rate being thesame regardless of age of the animal) (SI Appendix, Table S1,model 5). Furthermore, a model with an equivalently good fitdescribes a process whereby the initial rate of decay reducesexponentially as a function of age of the animal, rather thanfitting individual initial decay rates as in model 5. Although thismodel has very marginally poorer fit (AIC difference of 0.114 tomodel 5; SI Appendix, Table S1), it has two practical benefits inthat it is a simpler model with fewer parameters and also de-scribes the way in which initial decay rates decrease as a con-tinuous function of animal age—allowing predictions for agesnot sampled in this study. Models 7 and 8 also had similar (butworse) fits to models 5 and 9 and describe initial cellular deathrates to be dependent on the age of the animal, and those decayrates reduce with time (as a function of age of the animal ratherthan time since production of the cell).The model with best interpretation and equivalently best fit
(model 9) corresponds to CD8+ T cells produced at birth havingan initial half-life of ∼14.3 d (95% CI = 10.2 to 22 d). The initialrate of decay for recently produced cells decreases as a functionof the age of the host at the time of cell production, halving every∼150 d (Fig. 3B; 95% CI = 72 to 220 d). For cells produced at
Fig. 2. Dynamics of timestamped CD8+ T cells with age. (A) Corrected cell numbers of stamped CD8+ T cells based on the percentage of labeled cells in blood.Dashed lines depict trajectories of individual animals (n = 12–17 per group), while the solid lines represent the arithmetic mean trajectory for each age group.(B) Survival of CD8+ T cells based on time since production. The fraction of the maximum labeled CD8+ T cells that persist at different times after tamoxifenadministration (error bars represent SD from each group). The rate of decay of labeled CD8+ T cells is not constant with age but rather it is decreasing with theage at stamping.
3976 | www.pnas.org/cgi/doi/10.1073/pnas.1811634116 Reynaldi et al.
Dow
nloa
ded
by g
uest
on
Dec
embe
r 1,
202
1
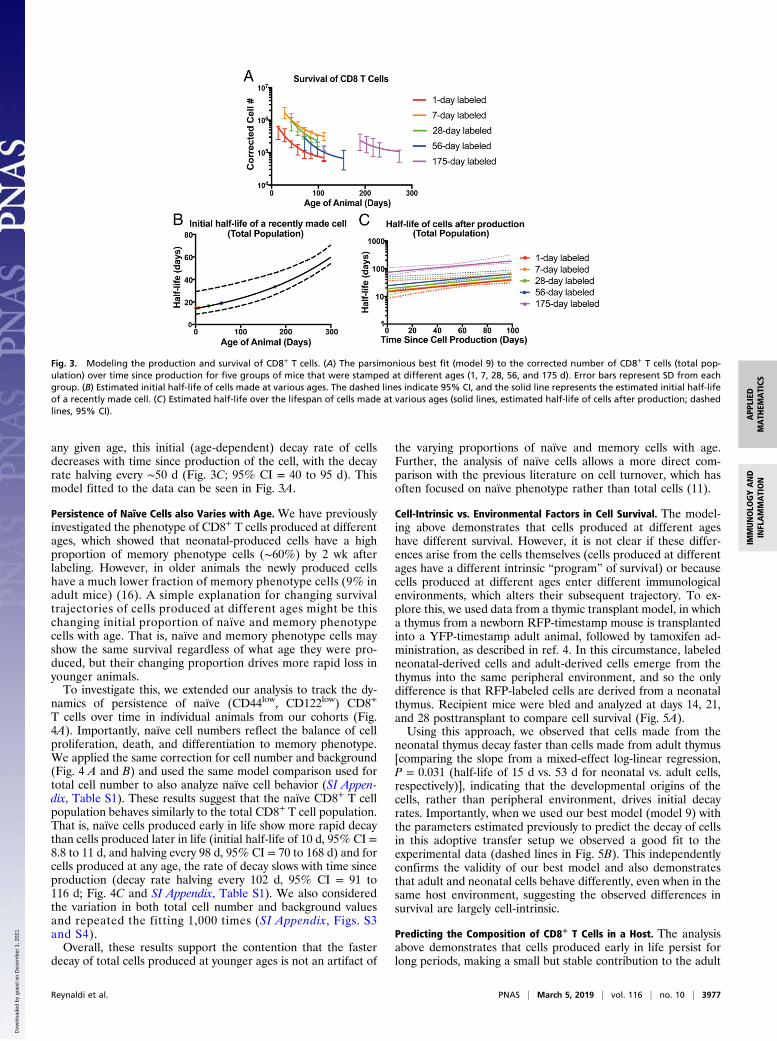
any given age, this initial (age-dependent) decay rate of cellsdecreases with time since production of the cell, with the decayrate halving every ∼50 d (Fig. 3C; 95% CI = 40 to 95 d). Thismodel fitted to the data can be seen in Fig. 3A.
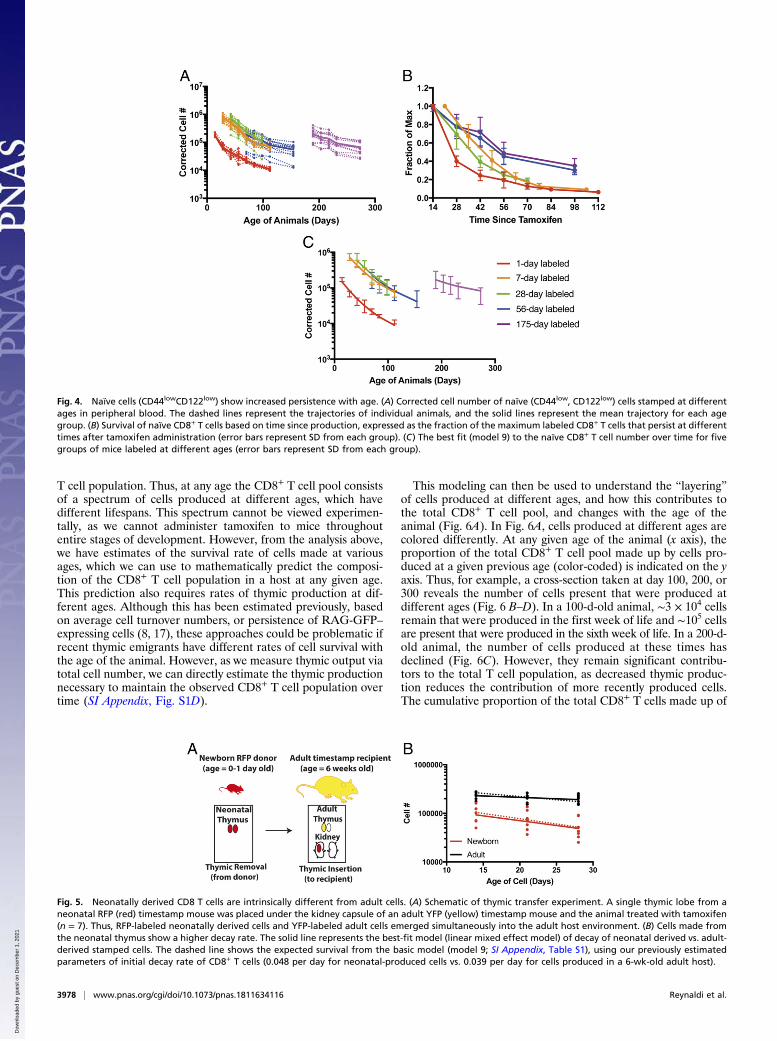
Persistence of Naïve Cells also Varies with Age. We have previouslyinvestigated the phenotype of CD8+ T cells produced at differentages, which showed that neonatal-produced cells have a highproportion of memory phenotype cells (∼60%) by 2 wk afterlabeling. However, in older animals the newly produced cellshave a much lower fraction of memory phenotype cells (9% inadult mice) (16). A simple explanation for changing survivaltrajectories of cells produced at different ages might be thischanging initial proportion of naïve and memory phenotypecells with age. That is, naïve and memory phenotype cells mayshow the same survival regardless of what age they were pro-duced, but their changing proportion drives more rapid loss inyounger animals.To investigate this, we extended our analysis to track the dy-
namics of persistence of naïve (CD44low, CD122low) CD8+
T cells over time in individual animals from our cohorts (Fig.4A). Importantly, naïve cell numbers reflect the balance of cellproliferation, death, and differentiation to memory phenotype.We applied the same correction for cell number and background(Fig. 4 A and B) and used the same model comparison used fortotal cell number to also analyze naïve cell behavior (SI Appen-dix, Table S1). These results suggest that the naïve CD8+ T cellpopulation behaves similarly to the total CD8+ T cell population.That is, naïve cells produced early in life show more rapid decaythan cells produced later in life (initial half-life of 10 d, 95% CI =8.8 to 11 d, and halving every 98 d, 95% CI = 70 to 168 d) and forcells produced at any age, the rate of decay slows with time sinceproduction (decay rate halving every 102 d, 95% CI = 91 to116 d; Fig. 4C and SI Appendix, Table S1). We also consideredthe variation in both total cell number and background valuesand repeated the fitting 1,000 times (SI Appendix, Figs. S3and S4).Overall, these results support the contention that the faster
decay of total cells produced at younger ages is not an artifact of
the varying proportions of naïve and memory cells with age.Further, the analysis of naïve cells allows a more direct com-parison with the previous literature on cell turnover, which hasoften focused on naïve phenotype rather than total cells (11).
Cell-Intrinsic vs. Environmental Factors in Cell Survival. The model-ing above demonstrates that cells produced at different ageshave different survival. However, it is not clear if these differ-ences arise from the cells themselves (cells produced at differentages have a different intrinsic “program” of survival) or becausecells produced at different ages enter different immunologicalenvironments, which alters their subsequent trajectory. To ex-plore this, we used data from a thymic transplant model, in whicha thymus from a newborn RFP-timestamp mouse is transplantedinto a YFP-timestamp adult animal, followed by tamoxifen ad-ministration, as described in ref. 4. In this circumstance, labeledneonatal-derived cells and adult-derived cells emerge from thethymus into the same peripheral environment, and so the onlydifference is that RFP-labeled cells are derived from a neonatalthymus. Recipient mice were bled and analyzed at days 14, 21,and 28 posttransplant to compare cell survival (Fig. 5A).Using this approach, we observed that cells made from the
neonatal thymus decay faster than cells made from adult thymus[comparing the slope from a mixed-effect log-linear regression,P = 0.031 (half-life of 15 d vs. 53 d for neonatal vs. adult cells,respectively)], indicating that the developmental origins of thecells, rather than peripheral environment, drives initial decayrates. Importantly, when we used our best model (model 9) withthe parameters estimated previously to predict the decay of cellsin this adoptive transfer setup we observed a good fit to theexperimental data (dashed lines in Fig. 5B). This independentlyconfirms the validity of our best model and also demonstratesthat adult and neonatal cells behave differently, even when in thesame host environment, suggesting the observed differences insurvival are largely cell-intrinsic.
Predicting the Composition of CD8+ T Cells in a Host. The analysisabove demonstrates that cells produced early in life persist forlong periods, making a small but stable contribution to the adult
Fig. 3. Modeling the production and survival of CD8+ T cells. (A) The parsimonious best fit (model 9) to the corrected number of CD8+ T cells (total pop-ulation) over time since production for five groups of mice that were stamped at different ages (1, 7, 28, 56, and 175 d). Error bars represent SD from eachgroup. (B) Estimated initial half-life of cells made at various ages. The dashed lines indicate 95% CI, and the solid line represents the estimated initial half-lifeof a recently made cell. (C) Estimated half-life over the lifespan of cells made at various ages (solid lines, estimated half-life of cells after production; dashedlines, 95% CI).
Reynaldi et al. PNAS | March 5, 2019 | vol. 116 | no. 10 | 3977
APP
LIED
MATH
EMATICS
IMMUNOLO
GYAND
INFLAMMATION
Dow
nloa
ded
by g
uest
on
Dec
embe
r 1,
202
1
T cell population. Thus, at any age the CD8+ T cell pool consistsof a spectrum of cells produced at different ages, which havedifferent lifespans. This spectrum cannot be viewed experimen-tally, as we cannot administer tamoxifen to mice throughoutentire stages of development. However, from the analysis above,we have estimates of the survival rate of cells made at variousages, which we can use to mathematically predict the composi-tion of the CD8+ T cell population in a host at any given age.This prediction also requires rates of thymic production at dif-ferent ages. Although this has been estimated previously, basedon average cell turnover numbers, or persistence of RAG-GFP–expressing cells (8, 17), these approaches could be problematic ifrecent thymic emigrants have different rates of cell survival withthe age of the animal. However, as we measure thymic output viatotal cell number, we can directly estimate the thymic productionnecessary to maintain the observed CD8+ T cell population overtime (SI Appendix, Fig. S1D).
This modeling can then be used to understand the “layering”of cells produced at different ages, and how this contributes tothe total CD8+ T cell pool, and changes with the age of theanimal (Fig. 6A). In Fig. 6A, cells produced at different ages arecolored differently. At any given age of the animal (x axis), theproportion of the total CD8+ T cell pool made up by cells pro-duced at a given previous age (color-coded) is indicated on the yaxis. Thus, for example, a cross-section taken at day 100, 200, or300 reveals the number of cells present that were produced atdifferent ages (Fig. 6 B–D). In a 100-d-old animal, ∼3 × 10⁴ cellsremain that were produced in the first week of life and ∼105 cellsare present that were produced in the sixth week of life. In a 200-d-old animal, the number of cells produced at these times hasdeclined (Fig. 6C). However, they remain significant contribu-tors to the total T cell population, as decreased thymic produc-tion reduces the contribution of more recently produced cells.The cumulative proportion of the total CD8+ T cells made up of
Fig. 5. Neonatally derived CD8 T cells are intrinsically different from adult cells. (A) Schematic of thymic transfer experiment. A single thymic lobe from aneonatal RFP (red) timestamp mouse was placed under the kidney capsule of an adult YFP (yellow) timestamp mouse and the animal treated with tamoxifen(n = 7). Thus, RFP-labeled neonatally derived cells and YFP-labeled adult cells emerged simultaneously into the adult host environment. (B) Cells made fromthe neonatal thymus show a higher decay rate. The solid line represents the best-fit model (linear mixed effect model) of decay of neonatal derived vs. adult-derived stamped cells. The dashed line shows the expected survival from the basic model (model 9; SI Appendix, Table S1), using our previously estimatedparameters of initial decay rate of CD8+ T cells (0.048 per day for neonatal-produced cells vs. 0.039 per day for cells produced in a 6-wk-old adult host).
Fig. 4. Naïve cells (CD44lowCD122low) show increased persistence with age. (A) Corrected cell number of naïve (CD44low, CD122low) cells stamped at differentages in peripheral blood. The dashed lines represent the trajectories of individual animals, and the solid lines represent the mean trajectory for each agegroup. (B) Survival of naïve CD8+ T cells based on time since production, expressed as the fraction of the maximum labeled CD8+ T cells that persist at differenttimes after tamoxifen administration (error bars represent SD from each group). (C) The best fit (model 9) to the naïve CD8+ T cell number over time for fivegroups of mice labeled at different ages (error bars represent SD from each group).
3978 | www.pnas.org/cgi/doi/10.1073/pnas.1811634116 Reynaldi et al.
Dow
nloa
ded
by g
uest
on
Dec
embe
r 1,
202
1
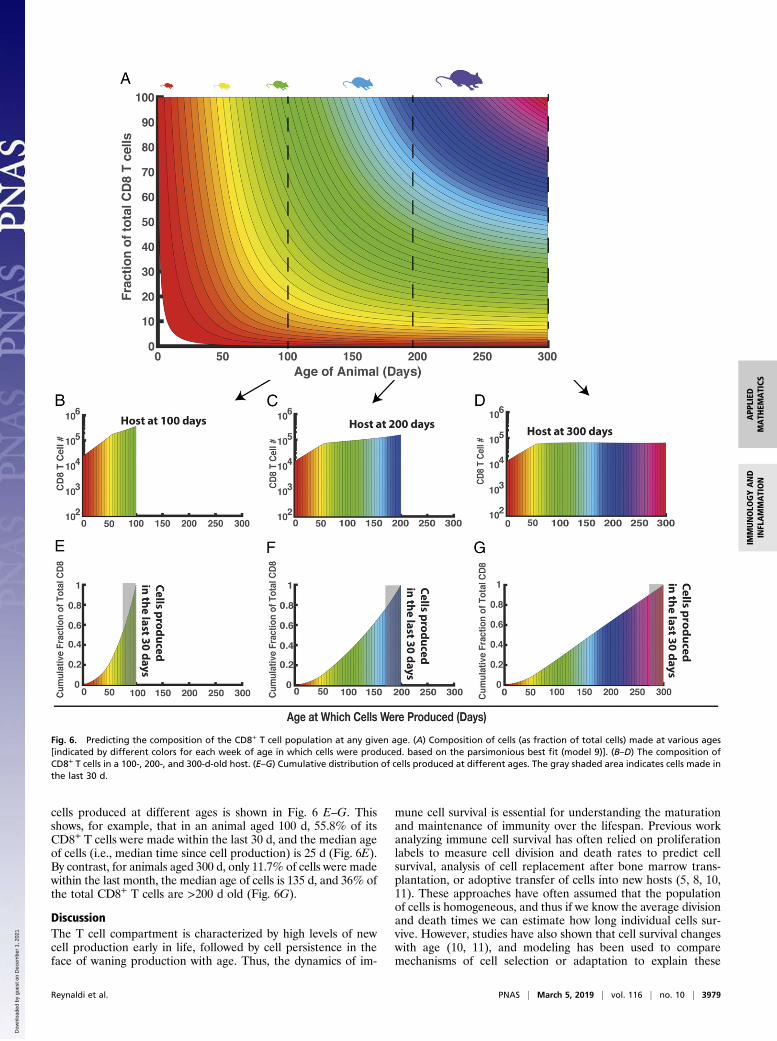
cells produced at different ages is shown in Fig. 6 E–G. Thisshows, for example, that in an animal aged 100 d, 55.8% of itsCD8+ T cells were made within the last 30 d, and the median ageof cells (i.e., median time since cell production) is 25 d (Fig. 6E).By contrast, for animals aged 300 d, only 11.7% of cells were madewithin the last month, the median age of cells is 135 d, and 36% ofthe total CD8+ T cells are >200 d old (Fig. 6G).
DiscussionThe T cell compartment is characterized by high levels of newcell production early in life, followed by cell persistence in theface of waning production with age. Thus, the dynamics of im-
mune cell survival is essential for understanding the maturationand maintenance of immunity over the lifespan. Previous workanalyzing immune cell survival has often relied on proliferationlabels to measure cell division and death rates to predict cellsurvival, analysis of cell replacement after bone marrow trans-plantation, or adoptive transfer of cells into new hosts (5, 8, 10,11). These approaches have often assumed that the populationof cells is homogeneous, and thus if we know the average divisionand death times we can estimate how long individual cells sur-vive. However, studies have also shown that cell survival changeswith age (10, 11), and modeling has been used to comparemechanisms of cell selection or adaptation to explain these
Fig. 6. Predicting the composition of the CD8+ T cell population at any given age. (A) Composition of cells (as fraction of total cells) made at various ages[indicated by different colors for each week of age in which cells were produced. based on the parsimonious best fit (model 9)]. (B–D) The composition ofCD8+ T cells in a 100-, 200-, and 300-d-old host. (E–G) Cumulative distribution of cells produced at different ages. The gray shaded area indicates cells made inthe last 30 d.
Reynaldi et al. PNAS | March 5, 2019 | vol. 116 | no. 10 | 3979
APP
LIED
MATH
EMATICS
IMMUNOLO
GYAND
INFLAMMATION
Dow
nloa
ded
by g
uest
on
Dec
embe
r 1,
202
1
changes over time (12). However, these models assume thatrecent thymic emigrants behave the same with age, and thatchanges in phenotype occur in the periphery.Our timestamp approach allows us to directly track the sur-
vival of cohorts of cells produced at different ages. That is,whereas labeling studies typically infer clonal survival from thebalance of birth and death rates, our approach follows a cohortof individual cells, labeled at a given time. Importantly, since thelabel is not diluted by cell division, we measure the net effect ofcell division and death (or differentiation, in the case of naïvecells). This labeling approach demonstrates that far from a linearpathway of development and death (11), the CD8+ T cell poolexhibits an age-dependent heterogeneity in survival of cells,leading to a shifting palette of cells of different ages vying tocontribute to the mature T cell pool. Cells made very early in lifeexhibit a rapid early rate of decline, but this rapid loss of cellsslows down with the time since production of the cell such thatsome of these cells produced early in life persist into the adultT cell pool. In contrast, cells produced later in life show a slowerinitial rate of decay immediately after thymic production, but thisdecay also decreases with the time since production. At any givenage, recently produced cells show a higher rate of decay thancells produced earlier in life, consistent with the recent obser-vation of a pool of long-lived cells formed in the host before 6 to8 wk of age (11) and previous work suggesting increased CD4+
T cell longevity with age (10). The net result of these findings isthat with time the composition of cellular ages of the CD8+
T cell population becomes more diverse while maintaining cel-lular representation from all ages at some level. Coupled withthe phenotypic heterogeneity of cells produced at different times(4, 14), this paints a picture of a dynamic and changing T cellpopulation that is difficult to capture with cross-sectional labelingapproaches.One caveat of this work is that we followed the neonatal cell
population up to 16 wk of age and used modeling to extrapolatefrom this time to later ages. Previous work using a TCR-δ drivenmarker to study CD4 T cells has shown that CD4 T cells labeledin young animals are detectable at 1.5 y of age (18). There havealso been adoptive transfer studies, whereby 10% of the donorcells are detected in the recipient 1 y later (19). However, thesestudies involve a different cell type (CD4+ T cells), and theirsurvival was not analyzed in detail. It would be interesting tostudy the persistence, phenotype, and role of neonatal T cells inadvanced age, and future work should focus on this.Any approach to modeling T cell persistence requires choices
on the modeling framework to be used to capture the experi-mentally observed behavior. In our case, we compared a series ofexponential models of cell survival. However, alternative frame-works such as a gamma or log-normal distribution of cell lifetimesare likely also possible and could also capture the behavior of cellloss slowing with age. It may also be possible to compare mech-anisms of cell persistence such as cellular adaptation or selection(10, 12). To facilitate alternative explorations of the data, we haveincluded the dataset in Datasets S1–S3.Heterogeneity in individual CD8+ T cell behavior following
stimulation has been previously demonstrated in vivo, with in-dividual cells leading to widely different numbers and pheno-types of their progeny (20, 21). The prevailing notion in the fieldis that it is impossible to predict how individual cells will respond,because it assumes that all naïve CD8+ T cells have the samepotential to become either a short-lived effector or long-termmemory cells and that cell fate decisions arise from stochasticevents that occur during priming (20, 21). However, our recentdata demonstrating that individual CD8+ T cells are, in fact,programmed differently raises the possibility that we may be ableto predict cell behavior based on their developmental origins.Moreover, the immune system as a whole may exhibit differentinfection outcomes based on the ratio of fetal- and adult-derived
cells that are present in the starting population. The results inthis report suggest that many age-related differences in the im-mune responses to infection may relate to changes in the de-velopmental architecture of the peripheral T cell compartment.Our findings provide insight into individual variations ob-
served in immune system responses by demonstrating how theCD8+ T cell composition is governed by the cumulative lifehistory of an individual, rather than only immediate history asmight be the case in a more linear development system (4). Thus,replacement of cells after depletion by bone marrow trans-plantation, chemotherapy, or HIV infection in later life likelycannot recapitulate the full diversity of phenotypes that wouldhave arisen during ontogeny in the unaffected host. Similarly, thecells that persist after thymectomy may follow “rules” differentfrom those of cells that would otherwise have been made later inlife. A more comprehensive understanding of the influence ofgenetic and environmental factors on the layered development ofT cells would provide much greater predictive power of howindividuals respond to infection and is a promising avenue offuture research.
MethodsMice. Ai9 and floxed-STOP eYFP mice were purchased from The JacksonLaboratory. The CD4cre-ERT2 mice, commercially available from Jackson,were provided by Fotini Gounari, The University of Chicago, Chicago (13).Male and female mice were used in experiments and were maintained un-der specific pathogen-free conditions at Cornell University College of Vet-erinary Medicine, accredited by the American Association of Accreditation ofLaboratory Animal Care. The experiments in this study were performed instrict accordance with the recommendations in the Guide for the Care andUse of Laboratory Animals of the National Institutes of Health (22). Theprotocols were approved by the Institutional Animal Care and Use Com-mittee at Cornell University.
Timestamp Mouse Model. We crossed Ai9 RFP or floxed-STOP yellow fluo-rescence protein (eYFP) reporter mice to CD4cre-ERT2 mice in large timed-mating cohorts. At birth, litters were divided into groups for marking atdifferent ages. We administered tamoxifen by oral gavage to induce RFPexpression. To mark the cells of newborns, 2.5 mg tamoxifen was adminis-tered to dams by oral gavage on days 0 and 1 (2.5 mg per mouse two to threetimes in a 24-h period) and pups received tamoxifen through lactation. Tomark 7-d-old mice, animals were given 0.25 mg (single dose). To mark the28-d group, 1 to 2 mg tamoxifen (one to two doses in a 24-h period) wasadministered. For the 56-d and 175-d groups, we gave daily injections of5mg tamoxifen to mark cells (three doses in a 72-h period). Administration oftamoxifen results in the excision of a stop codon upstream of the reporterfluorescent protein in cells expressing CD4, including CD4+ CD8+ (DP) thy-mocytes. Cells expressing CD4 at the time of tamoxifen exposure are per-manently “marked” by the fluorescent protein (Fig. 1A). A separate cohortof mice was maintained without tamoxifen treatment, to ascertain thebackground (noninduced) level of RFP expression with age, as well as toestimate total CD8+ T cell numbers by analysis of cell numbers in the spleenand pooled lymph nodes (cervical, mesenteric, and inguinal).
Collection of Blood Samples and Flow Cytometry. Serial blood samples werecollected from timestamp cohorts by retroorbital bleed. Two rounds ofhypotonic lysis were performed to lyse red blood cells and cells werelabeled with fluorescent antibodies CD8-e450 (clone: 53-6.7) and CD4-A700(clone: GK-1.5) (Thermo Fisher) using the IC fixation buffer set from ThermoFisher according to the manufacturer’s instructions. Samples were runon a LSR II flow cytometer (BD Biosciences) and analyzed using FlowJosoftware (TreeStar).
Thymic Transplantation Procedure. Thymic transplants were performed usingthe protocol described in ref. 23. Briefly, thymi were isolated from 0- to 1-d-old RFP timestamp reporter mice. Thymi were then separated into individuallobes and one lobe was inserted under the kidney capsule of recipientfloxed-STOP eYFP timestamp reporter mice that were 6 wk old. To simul-taneously mark CD8+ T cells being produced in the newborn and adultthymi, 5 mg of tamoxifen was given by oral gavage on days 0 to 2 (threetotal). At days 14, 21, and 28 postsurgery, recipients were bled and the
3980 | www.pnas.org/cgi/doi/10.1073/pnas.1811634116 Reynaldi et al.
Dow
nloa
ded
by g
uest
on
Dec
embe
r 1,
202
1
phenotype of marked cells was assessed by flow cytometry as describedabove (Fig. 5A).
Estimating Cell Number over Time. Our experimental procedure involvessampling blood and measuring the proportion of labeled cells over time. Toestimate the total labeled cells remaining in the animal, we need to correctfor both increases in total cell number with age (leading to dilution of labeledcells; SI Appendix, Fig. S1A) as well as the background level of RFP expression(which also increases with age; SI Appendix, Fig. S1B).
Modeling the Survival of Labeled CD8+ T Cells. The survival of labeled cells(bulk and naïve phenotype) was modeled using a series of mathematicalmodels (SI Appendix, Dynamics of Labeled Cells). The models were fittedwith the nonlinear mixed effect model R (version 3.3.3) function nlme inlibrary nlme (version 3.1-122), Nonlinear mixed models are a longitudinaldata analysis method that models the trajectory of individuals animals overtime while allowing for variation across animals in the initial corrected cell
number to model the variation in individual animals. The fit was weightedusing varPower and we assumed a diagonal variance-covariance matrix forthe random effect using the pdDiag option in R. To find the 95% CI, we usethe R function intervals in library nlme.
Furthermore, to check if our parameters and ranking of models is robust tovariation in total cell number and background staining between animals, werepeated our analysis with 1,000 bootstraps of the control mice, picking asingle mouse value at each time point, randomly leaving one time point out,and repeating our model fitting and comparison for each newly sampleddataset (SI Appendix, Figs. S2–S4)
ACKNOWLEDGMENTS. This work was supported by National Institutes ofHealth Awards R01AI105265 (to B.D.R. and M.P.D.) and R01AI110613 (toB.D.R.) from the National Institute of Allergy and Infectious Disease. M.P.D.is a National Health and Medical Research Council (Australia) Senior ResearchFellow (1080001). V.V. is a National Health and Medical Research CouncilCareer Development Fellow (1067590).
1. Jotereau F, Heuze F, Salomon-Vie V, Gascan H (1987) Cell kinetics in the fetal mousethymus: Precursor cell input, proliferation, and emigration. J Immunol 138:1026–1030.
2. Wang J, et al. (2016) Fetal and adult progenitors give rise to unique populations ofCD8+ T cells. Blood 128:3073–3082.
3. Foss DL, Donskoy E, Goldschneider I (2001) The importation of hematogenous precursorsby the thymus is a gated phenomenon in normal adult mice. J Exp Med 193:365–374.
4. Smith NL, et al. (2018) Developmental origin governs CD8+ T cell fate decisions duringinfection. Cell 174:117–130.e14.
5. Ribeiro RM, Mohri H, Ho DD, Perelson AS (2002) In vivo dynamics of T cell activation,proliferation, and death in HIV-1 infection: Why are CD4+ but not CD8+ T cells de-pleted? Proc Natl Acad Sci USA 99:15572–15577.
6. De Boer RJ, Mohri H, Ho DD, Perelson AS (2003) Turnover rates of B cells, T cells, andNK cells in simian immunodeficiency virus-infected and uninfected rhesus macaques.J Immunol 170:2479–2487.
7. Ahmed R, et al. (2015) Reconciling estimates of cell proliferation from stable isotopelabeling experiments. PLOS Comput Biol 11:e1004355.
8. den Braber I, et al. (2012) Maintenance of peripheral naive T cells is sustained bythymus output in mice but not humans. Immunity 36:288–297.
9. Vrisekoop N, et al. (2008) Sparse production but preferential incorporation of recentlyproduced naive T cells in the human peripheral pool. Proc Natl Acad Sci USA 105:6115–6120.
10. Tsukamoto H, et al. (2009) Age-associated increase in lifespan of naive CD4 T cellscontributes to T-cell homeostasis but facilitates development of functional defects.Proc Natl Acad Sci USA 106:18333–18338.
11. Hogan T, Gossel G, Yates AJ, Seddon B (2015) Temporal fate mapping reveals age-linkedheterogeneity in naive T lymphocytes in mice. Proc Natl Acad Sci USA 112:E6917–E6926.
12. Rane S, Hogan T, Seddon B, Yates AJ (2018) Age is not just a number: Naive T cells
increase their ability to persist in the circulation over time. PLoS Biol 16:e2003949.13. Aghajani K, Keerthivasan S, Yu Y, Gounari F (2012) Generation of CD4CreER(T2)
transgenic mice to study development of peripheral CD4-T-cells. Genesis 50:908–913.14. Smith NL, et al. (2014) Rapid proliferation and differentiation impairs the develop-
ment of memory CD8+ T cells in early life. J Immunol 193:177–184.15. Gossel G, Hogan T, Cownden D, Seddon B, Yates AJ (2017) Memory CD4 T cell subsets
are kinetically heterogeneous and replenished from naive T cells at high levels. eLife
6:e23013.16. Smith NL, et al. (2018) Developmental origin governs CD8(+) T cell fate decisions
during infection. Cell 174:117–130.e14.17. Hale JS, Boursalian TE, Turk GL, Fink PJ (2006) Thymic output in aged mice. Proc Natl
Acad Sci USA 103:8447–8452.18. Zhang B, et al. (2016) Glimpse of natural selection of long-lived T-cell clones in healthy
life. Proc Natl Acad Sci USA 113:9858–9863.19. Hataye J, Moon JJ, Khoruts A, Reilly C, Jenkins MK (2006) Naive and memory CD4+
T cell survival controlled by clonal abundance. Science 312:114–116.20. Stemberger C, et al. (2007) A single naive CD8+ T cell precursor can develop into
diverse effector and memory subsets. Immunity 27:985–997.21. Plumlee CR, Sheridan BS, Cicek BB, Lefrançois L (2013) Environmental cues dictate the
fate of individual CD8+ T cells responding to infection. Immunity 39:347–356.22. National Research Council (2011) Guide for the Care and Use of Laboratory Animals
(National Academies Press, Washington, DC), 8th Ed.23. Morillon YM, 2nd, Manzoor F, Wang B, Tisch R (2015) Isolation and transplantation of
different aged murine thymic grafts. J Vis Exp, e52709.
Reynaldi et al. PNAS | March 5, 2019 | vol. 116 | no. 10 | 3981
APP
LIED
MATH
EMATICS
IMMUNOLO
GYAND
INFLAMMATION
Dow
nloa
ded
by g
uest
on
Dec
embe
r 1,
202
1