faster but shorter versus longer but slower patent ... · 1 faster but shorter versus longer but...
TRANSCRIPT

1
Faster but Shorter versus Longer but Slower Patent protection- Which
do Firms Prefer?
Job Market Paper
Siwei Cao*
* Dep. of Agricultural and Resource Economics, U.C. Berkeley. [email protected]
Abstract
In addition to invention patents, the Chinese Patent Office provides utility models patents that have 10 year protection and do not involve substantive examination and hence are granted much faster. Using a dataset of successful U.S. patents originating from China, we find 19% of the patents, largely in fields of Electronic & Electrical and Mechanics featuring fast technology and product turnover, have utility model priorities in China. These patents are on average filed and granted faster, and are less likely to have continuations at the US Patent Office (USPTO), relative to those with Chinese invention patent priorities. They also tend to be less frequently renewed both China and the United States. The results suggest that applicants differ in their preference over speed and length of patent protection, that some who values speed of protection more than duration opt to protect valuable inventions with utility models.
JEL code: O34, O38
Keywords: patent protection, invention patent, utility model, speed, length
Acknowledgement: We thank helpful comments and suggestions from Lee Branstetter, Stuart Graham, Nancy
Gallini, Bronwyn Hall, Keun Lee, Sadao Nagaoka, Mark Schankerman and participants in the UC Berkeley-Peking
University Conference on “Evolution of Chinese and its implications for research and innovation” in Beijing, China
(May 2011), the Workshop on Innovation and Patent Harmonization at Boston University School of Law
(September, 2011), the fourth Asia Pacific Innovation Conference held at Seoul, South Korea (October, 2012), the
seminar at the US Patent and Trademark Office (USPTO) headquarter in Alexander, VA (December, 2012). The
research is supported by USPTO and the Chinese National Science Foundation (grant No: 12BJL041). All errors
remain our own.

2
1. Introduction
In the United States, patent policy is designed to promote innovation, encourage development of new technologies and increase the fund of human knowledge. Previous literatures have pointed out that firms use their patents to achieve vast different business purposes1(Cohen et al 2000; Hall and Ziedonis, 2001; Gans et al., 2007; Graham et al., 2009). In order to achieve a patent, applicants need to submit their innovations to the United States Patent and Trademark Office (USPTO) and their application will go through an examination process of novelty, non-obviousness and utility. Patent application is thus examined in a timely manner and the effective delay of patent grant could be several years from the initially application date2. Moreover, patents are generally protected only for a fixed period of time. Delay of patent grant and inflexibility of protection period are therefore likely to curtail the efficacy of patent towards achieving firms’ diverse goals, limiting the usage of patent as a means to protect IP3, reducing the speed of technology propagation and lowering social welfare.
Case studies and anecdote evidences suggest patent applicants vary in their preferences
over speed of patent protection. Firms seeking patents with purposes such as attracting
investment, meeting a venture capital fund’s milestone or building up firm and product
reputation might want to secure patent right as soon as possible. Gans et al. 2007 found
for startups, patent allowance significantly increases the hazard rate for securing
licensing contracts. On the other hand, firms have used “deferred examination” in
European countries to delay patent issuance (Hall Harhoff 2012). Hegde et al. 2009 has
found in the United States, patent applicants strategically file continuing patent
applications to delay patent prosecution process. One of the reasons behind such
behavior is to accumulate thickets of patents for “defensive” purposes or improve
bargaining position in patent cross-licensing negotiations. With respect to preferences
over length of patent protection, it is well known that in industries featuring fast
technology progress and short product cycles (such as electronics and information),
patents have relative short value horizons.4 Patents in industries such as Chemical and
Pharmaceuticals are often renewed for full term. In fact the Hatch-Waxman Act offers
1 See Section 2 for a more detailed description.
2 The total pendency in USPTO ranges from 29.7 to 47.7 months.
(http://www.uspto.gov/patents/stats/patentpendency.jsp) 3 Cohen et al. 2000 points out that among a range of mechanisms used to protect profits accrued to invention,
patent is viewed as the least effective. Moreover, secrecy and lead time tend to be emphasized the most. 4 For instance, Jeff Bezos, the founder of Amazon.com and owner of the “one-click” patent, proposes that
“business method and software patents should have a much shorter lifespan… (of) 3 to 5 years” of patent protection (http://oreilly.com/news/amazon_patents.html).

3
drug patents with an additional 30 months of patent protection, reflecting applicant’s
desire for longer patent protection.
Acknowledging the existence of private benefit associated with patent, it is natural to
think that depending on the market environment in which the firm operates and the
diverse purposes of utilizing the patent right, firm might prefer a patent policy that
provides flexible means of protecting intellectual properties. This paper provides a first
empirical look at firms’ varying needs (or taste) for patent protection. We focus on two
fundamental attributes: how fast the applicant wants her patent application to be
granted (“need for speed”) and how long the applicant wants to maintain her patent5
(“need for length”) after grant. The preference over these attributes is directly related
to a patent’s expected private value distribution over time as well as the cost structure
of maintaining the patent. Since costs of maintenance generally increase over time6,
applicants pursuing patent grant and maintaining patent face a crucial dynamic tradeoff:
while early patent grant gives applicant the exclusive right to gain access to the private
value of the patent early, it also incurs a greater maintenance cost at any given period
while the patent is active. In addition, the extent to which patent be kept active will
depend on how fast the patent’s private value depreciates. We therefore acknowledge
that preferences for speed and length of patent protection are key considerations for
patent applicants.
To explore applicants’ heterogeneous preferences over speed and length of patent
protection, we study a set of United States product patents of which, before applicants
file their U.S. patent application, they have also sought for patent protection in China for
the same innovation. China offers two kinds of patent protection for product
innovations. The invention patent (IPat), generally with a long pending period due to
substantive examination, is protected for 20 years7. The utility model patent (UMs) is
granted quickly after application due to no examination and is protected for 10 years.
Since the innovations are “technologically sound” (they have been granted U.S. patent),
choosing UMs over IPats in China clearly sends out a signal of applicant’s preference for
5 In order to keep patent active, patent renewal fees must be submitted at certain dates. Hence the longer the
patent is renewed, the more cost it incurs. Here we emphasize the “length” of patent protection counting from the patent’s issue date, not from the patent’s application date. This setting is consistent with the renewal structure of patent. In major patent offices in the world, the renew fees are determined by the patent age, which in turn is counted from the patent issue date to present. 6 US renewal structure, Chinese renewal structure, see below…
7 The Chinese invention patents is often considered as the counterpart of the U.S. utility patent. Grant of invention
patents requires substantial examination of novelty, non-obviousness and utility.

4
flexibility in patent protection8: by selecting UM instead of IPat, applicant must believe
the expected benefit of having patent in the initial periods outweighs the loss of having
to giving up the patent early. Though the entire preference structure for patent
protection is unobservable to us, we provide empirical evidence for the existence of
“need for speed” and “need for length” preferences by associating variations of choice
between IPats and UMs in China and variations of applicants’ behaviors of hastening/
delay of their U.S. patent grant as well as variations in maintaining patents in both
countries, for the same innovation. We then separate out the two preferences by
comparing the results of the above analysis in different technology fields. Moreover, we
explore in particular, whether “need for speed” concern depends on inventor and
patent patentee’s nationality.
Nineteen percent of our sample contains U.S. patent that was originally filed for UM
protection in China (Henceforth, UM priority). Most of the UMs are in technology fields
such as Electric&Electronics, Mechanics that feature fast technology progress and short
product cycles. Moreover, U.S. Patents with Chinese UM priority are generally filed
faster and granted quicker than those with Chinese IPat priority suggesting applicants’
need for speedy patent grant in U.S. They are also less likely to be maintained at SIPO
and at USPTO, after grant, suggesting need for long protection is not crucial. These
results are robust to controlling for technology field fixed effects. Empirical analysis
focusing on technology fields with long R&D and product cycle (e.g. Chemicals and
Pharmaceuticals) demonstrates that choosing UMs is associated with behaviors that
reveal applicants’ need for speedy patent grant, but there is no substantial difference of
“need for length” preference compared to patents protected with IPats. Interestingly, a
portion of Chinese UMs (one third of all Chinese UMs of the sample) were delayed until
“the last minute” (last month of the grace period) before they were filed in the United
States9. Yet after U.S. application started, applicants still displayed stronger need for
speedy grant of their U.S. patent compared to average applicants of Chinese IPats. The
filing behaviors pre and post U.S. application, of this particular group, seems to display
an inconsistency of “need for speed” preference. Interviews with lawyers suggest
applicants generally utilize the grace period to assess the commercial viability of her
innovation in U.S, formalize and translate her patent application. Based on this
assumption, our empirical analysis supports the hypothesis that delay of filing depends
8 Here we assume applicant’s preference for patent protection for the same innovation is globally identical, i.e. if
she wants to have fast/slow patent grant in China, she would also like to have fast/slow patent grant in U.S. And if she wants to keep the Chinese patent for long/short, she would also want to keep the U.S. patent for long/short. 9 After filing patent application in one country, applicant generally has 12 months to decide whether to file in
another country or file at WIPO. We define “wait until last minute” when the applicant wait until the last month (the 12
th month after the Chinese filing date) to file her application to U.S.

5
on applicants’ experience with the U.S. market environment. Thus, delaying filing until
the “last minute” does not reflect applicant’s desire to delay patent application but
rather applicant’s inexperience in deciding whether to file her innovation in the United
States or not.
Our study contributes to the broad literature on the optimal design of patent systems
(see, e.g. Gallini 2002; Scotchmer 2004). The results reveal the heterogeneity of
applicants’ preference for attributes of protection for invention, lending empirical
support for the trend of major patent offices towards offering more options such as
faster examination for applicants willing to pay a higher cost and shorter protection for
those who do not highly value long patent life. USPTO recently launched “three-track
examination”10 which aims to “provide a comprehensive, flexible application processing
model… offering different processing options that are more responsive to the real-world
needs of … applicants.”11 Our study offers early insights on the likely response of
inventors with the “three-track” system at USPTO, pointing to an interesting research
agenda in the future when the data are accumulated sufficiently at USPTO.12
Our paper also makes two interesting contributions to the literature on patent
evaluation. First, it provides a novel perspective on using patent renewals as one of the
most widely used indicators of patent private value (See Lanjouw, Pakes and Putnam
2008; Schankerman and Pakes 1984; Pakes 1986; Bessen 2008). In our sample, patents
with Chinese UM priorities are less likely to be maintained at USPTO and SIPO, not
necessarily because they are less valuable (they are sufficiently valuable to justify the
substantial expense of filing overseas at USPTO); rather, they are abandoned sooner
because the value they bring to patent owners is more heavily weighted toward the
early effective patent years. That is the invention’s value horizon beyond which
expected returns are insufficient to justify maintenance fees is relatively short. Second,
it contributes to a growing research line that explores differences in patent systems and
10
The program allows applicants, willing to pay additional special fees ($4,950 for large entities and $2,550 for small entities) to request for prioritized examination that guarantees a final decision within twelve months of the filing date (Track 1). Applicants can also request a delayed examination for up to 30 months (Track 3), or the standard examination (Track 2). 11
Quote from David Kappos, the Under Secretary of Commerce for Intellectual Property and Direct of USPTO during 2009-2012. 12
Patent offices in many other countries including the EPO also offer “accelerated” or “deferred” examination options. However, it should be noted that unlike the choice of UMs vs. IPats in our study, these “accelerate” or “deferred” examination options do not involve a tradeoff between speed and length of patent protection. When an applicant chooses an accelerated (deferred) examination, the patent would be granted faster (slower) and the protection length would be longer (shorter) since the effective patent term would start from the filing date.

6
applicant/patentee behavior regarding equivalent inventions in these patent systems, to
gain better understanding of firms’ different evaluation of various patent attributes.13
Section 2 introduces the research design and a simple model based on which we derive
our empirical hypotheses. Section 3 describes our data. Section 4 presents our empirical
results. Section 5 examines the robustness of results by analyzing an interesting case.
Section 6 concludes.
2. Research Design and Model
2.1 Applicant’s filing procedure: from China to U.S.
Unlike the United States, but like many other countries in the world14, China offers two
types of patent protection for industrial product innovations, namely the invention
patent (IPat) and the utility model patent (UM), respectively. Allowance of IPats
requires a substantive examination of utility, novelty and non-obviousness, and entails a
statutory patent protection of 20 years. Grant of UMs entails only payment of (a lower)
filing fee and confirmation that the application complies with the filing requirements; if
both requirements are satisfied, grant is quick and almost certain. An applicant can
simultaneously file “dual applications,” for both an IPat and a UM, for the same
invention at SIPO. If both are granted, she has to choose one patent protection and
abandon the other immediately15.
Table 1 presents a detailed comparison between IPat and UM at SIPO. According to the
patentability standards, filing for UM does not require substantial examination of
novelty or non-obviousness. Innovations protected with UMs are thus often viewed as
“petty inventions” that fall short of the standard for IPats. UMs are likely to cause
negative reputation effect and reduce probability of securing licensing contract, limiting
technology partnership.
However, UM offers an advantage that might be important to patent applicants: a
relatively short grant lag of an average 12 months, as opposed to an average of 36
months for IPat. Another minor advantage of UM compared to IPat is that it is cheaper
13
See, for example, Graham et al. 2009; Lei and Wright 2012; Harhoff 2011. 14
Patent offices in many other countries also provide some form of UM protection, including developed countries such as Germany, Denmark, Greece, Spain, France, Ireland, Italy, Netherlands, Austria, Portugal, Finland, Japan, South Korea etc. (Suthersanen, 2006; Moga, 2012) 15
Article 30 the Chinese Patent Law 2009. Two applications in a “dual application,” for an IPat and for a UM, respectively, did not even need to be filed at SIPO on the same date, until the 3
rd amendment to the Chinese
Patent Law in 2008. However, most of dual applications in our sample were filed on the same dates.

7
in terms of application, attorney and maintenance fees. Furthermore, applicants, if
concerned about the validity of their UMs, can ex post obtain substantive examination
reports from SIPO to affirm their validity16. In summary, a Chinese patent applicant
would prefer filing UM to filing IPat if one or several of the following reasons occur:
(i) She wants to have a fast patent grant. (“need for speed” preference)
(ii) She does not expect long patent protection (over 10 years) to be crucial
(“need for length” preference)
(iii) Her innovation is not eligible to file IPat. (“petty innovations”)
(iv) Cost consideration.
Because the purpose of this study is to examine patent applicant’s heterogeneous
preference for patent protection, we need the choice of UM to reflect applicant’s
concerns about speed and length of patent instead of eligibility or cost. We overcome
this difficulty by constructing a dataset that consist of United States patents with
Chinese priority17. USPTO offers one major means of patent protection, the utility
patent,18 which requires substantive examination and provides a statutory patent life of
20 years. Innovations covered by Chinese UMs and are granted U.S. patent are hence
eligible to file IPat. Further, the costs are less likely to be relevant for this sample as the
differences in the fees between filing for IPat and UM are relatively small given that the
applicants in our data spent much more to apply for patents at USPTO. We can thus say
that conditioning on the innovation been granted U.S. patent, if applicants opt to select
UM at SIPO, it is very likely that the speed of patent protection is important and the
length of patent protection is not crucial.
After filing at SIPO, there is a grace period to decide whether to file the same innovation
at USPTO19. Interviews with patent attorneys suggest applicants generally utilize this
period of time to assess the commercial viability of their innovation, formalize and
16
Lawyers from various law firms located in Beijing advise us that in infringement suits, UMs are not necessarily more likely to be invalidated and Chinese damages for infringing UMs could be very high. See Chint Vs. Schneider Electronic http://www.law360.com/articles/37050/ip-enforcement-in-china-chint-v-schneider-electric 17
Ideally, we should not restrict our sample to including only U.S. patents that were filed in China first. However, due to the strong adversity towards UMs by foreigners (as they were educated by lawyers not to file for UM), less than 0.01% of Chinese patent filing by foreign entities choose to file for UM. 18
USPTO also allows design patents and plant patents for ornamental design and asexually produced plant variety, respectively. These two types of patent protection also exist at SIPO. 19
To file a foreign patent application at USPTO, applicant can either file directly at USPTO or file at WIPO (World Intellectual Property Office) and designate U.S. as a destination country. For the former route, she has a grace period of 12 months; for the latter, she can generally wait for up to 30 months before the patent application enters the national stage. In our data, we have 15% of patent applications that are filed through the PCT route. In our empirical analysis, we control for the PCT dummy.

8
translate her patent application20. The patent prosecution process at USPTO ranges
between 29 months to 48 months21. Backlog and communication delays are the two
most important components of grant lag (Popp et al. 2004). During the patent
prosecution process, applicants have the option to file continuation applications. The
continuation procedure offers applicants a new round of examination to revise claims
submitted in the initial application or to pursue rejected claims with new information
and evidence. While retaining patent term to start from the filing date of the initial
application, filing continuation introduces a significant delay in patent grant (Hegde et al.
2009).
From the filing procedure described above, we generalize several partial indicators for
“need for speed” preference for patent protection:
(i) Filing lag: time difference between the Chinese filing date and the first U.S. filing
date;
(ii) File at Last minute: dummy equals to 1 if the applicant files her U.S. patent
application in the last month of the grace period22;
(iii) Continuation: dummy equals to 1 if applicant files continuation application;
(iv) Continuation lag: time difference between the first U.S. filing date and the filing
date of the last continuation application;
(v) Grant lag: time difference between the last U.S. filing date and the U.S. patent
issue date.
If applicants prefer to have fast U.S. patent grant, we expect she will file in U.S. sooner,
be less likely to file in the “last minute”, less likely to file continuation applications,
conditional on filing continuation, file it sooner and pursue for shorter grant lag. As
mentioned before, patent applicants use the grace period partially to determine
whether it will be profitable to file the patent in United States. If they have decided to
file and there is still time left during the grace period, they might then strategically
choose to delay their patent application if they do not value fast patent application
(hence fast patent grant) to be crucial. However, filing late may also be due to
applicant’s inexperience with the U.S. market environment or the USPTO patent
prosecution process. Therefore, the variables Filing lag and File at Last minute only
20
One lawyer responded that their firm charges 220rmb ($36 )/100 English word and the translation generally takes 2-4 weeks. This amounts to $1,000-$1,800 of translation fee per application given a patent application generally has 3000-5000 English words. 21
See footnote 2 for references. 22
We have used several cutoffs in our empirical analysis, including last ten days, last five days or last day. The results are qualitatively consistent.

9
partially reflect applicant’s “need for speed” preference. We will explore this issue later.
Similarly, a big portion of Grant lag is the significant delay in queuing time. We control
for patent filing year fixed effect to mitigate this bias. We use the patent maintenance
data at SIPO and USPTO to reflect patent owner’s “need for length” preference.
2.2 Model
Based on previous empirical literatures and case studies (Pakes Shankerman 1986;
Lanjouw Schankerman 1994; Hegde et al. 2009; Hall and Harhoff 2012), we present a
simple model that demonstrates applicant’s diverse preferences over speed and length
of patent protection. For illustrative purposes, we make a strong assumption: the time
distributions of the private value of patents in China and U.S. protecting the same
invention are broadly consistent, i.e. the shape and length of the Chinese and U.S.
patents’ value horizons share the same features. To give an example, suppose the
Chinese patent has high private value in initial periods but a relatively short value
horizon, we assume the U.S. patent has the same features. This assumption captures a
global characteristic of differences in how industries innovate: in industries such as
Chemical and Pharmaceuticals, the entire period of R&D is often very long so the patent
has long value horizon whereas in Electronics, semiconductor industries, patent has
relatively short value horizon. In practice, there is by no means to assume that patent
values in different market environments are equal. Asides from heterogeneity in
technology, patent value also depends on the overall R&D strength, the protection
effort from patent office, the richness of complementary assets etc, characteristics that
are different from country to country. Fortunately, both China and the United States
adopt similar patentability standard in terms of “novelty”23, so the relative distance of
technology progress described in patents between the two countries will not be too
large.
Starting from the application date, we assume the per-period value of a patent is a
function of time t :
0),,;( tktv
The parameters ,k describe the shape and scale of the distribution. We assume that
only patent owners can enjoy the value of patent and applicants has the flexibility to
hasten/delay her patent grant. The cost of maintaining a patent per period is a constant
23
Both China and U.S. adopt the “relative novelty” standard and admits a grace period of 12 months. See Chinese patent law Art 22 for a detailed description. Also see U.S. patentability requirement at http://www.uspto.gov/web/offices/pac/mpep/s2133.html

10
proportional function of time counted from the issue period24:
),0(,0()),( ' Ttrtr where T is the maximum statutory term for a patent. Let
LG tt , denote the optimal period of patent grant and the optimal last period that the
patent will be maintained. Then, in an ideal world with perfect efficiency of patent
examination, patent applicant chooses the optimal ** , LG tt to maximize:
dtettrdtektvMax rt
t
t
G
t
t
rt
tt
L
G
L
G
LG
)(),;(,
..ts ),0(,_
Ttt LG
Taking First order conditions w.r.t. LG tt , and assuming there is an interior solution gives:
)1()0(),;()(*
**GL ttr
G er
rktv
(1)
)(),;( ***
GLL ttrktv (2)
The 2nd F.O.C. indicates the optimal period to stop maintaining a patent is the period
when the renewal fee is about to exceed the value of patent, in that particular period.
We also see that the last period of renewing cost depends on the total length of
renewing periods ( **
GL tt ), not on the particular period when the patent is issued or
abandoned ( *
Gt , *
Lt ).
The 1st F.O.C. shows that the optimal period to have patent grant is the period in which
the patent value equals the initial period renewal cost plus the burden of increase in
renewal per period due to having patent granted one period earlier. Since renewal cost
is an increasing function of time starting at the issue date, moving patent grant one
period earlier will not only induce more periods to pay but also more to pay per period.
In other words, the optimal period for patent grant is not the period when the patent
value equals the initial renewal cost, but a period with patent value big enough to justify
the disproportional increase of renewing burden.
Let IPatUM TT , denote the maximum statutory life of UM and IPat. Assume due to
substantial examination, the minimum grant lag of filing IPat is T . Thus ),0(_
UMG Tt if
the applicant chooses to file UM but ),( IPatG TTt if the applicant chooses to file IPat.
Let )1(v , )2(v denote the sum of maximized discounted value from choosing UM and
24
Generally, the per period renew cost is an increasing function of time with positive 2nd
derivative. Here we assume constant proportion for simplicity.

11
IPat and the per period maintenance cost functions are )(),( 21 trtr that satisfies
)()( 12 trtr (IPat is more expensive in terms of renew):
,)(),;()1(0
1,
dtettrdtektvMaxv rt
tt
G
t
t
rt
tt
GLL
G
LG
..ts ),0(,_
UMLG Ttt (choosing UM)
dtettrdtektvMaxvGLL
G
LG
tt
rt
G
t
t
rt
tt
0
2,
)(),;()2( ..ts ),(,_
IPatLG TTtt (choosing IPat)
Applicant’s maximization problem becomes:
)(}2,1{
cvMaxC
Let 2211 ,;, LGLG TTTT denote the solution of LG tt , that maximizes )1(v and )2(v .
So applicant will always prefer UM instead of IPat iff:
2
2
1
1
2
1
2
1
)()]([),;(),;( 2
2
1
1
L
G
L
G
L
L
G
G
T
T
rt
G
T
T
rt
G
T
T
rt
T
T
rt dteTtrdteTtrdtektvdtektv (3)
The 1st integral is the discounted sum of patent value accumulated through ],[ 21
GG TT , the
additional periods “in the front” when the invention is protected under UM instead of
IPat. Similarly, the 2nd integral represents the discounted sum of patent value
accumulated through the additional periods ],[ 21
LL TT “in the back” when the invention is
protected under IPat as opposed to UM. The RHS represents the differences in the
renewal costs between IPat and UM.
The intuition is that applicants opt to choose UM if and on if the benefit of
accumulating patent value in early periods outweighs the loss of having to give up the
patent early as well as excessive renewal burden.
Let 2211 ,;, LGLG tttt denote the unconstrained solution of LG tt , that maximizes )1(v and )2(v .
Depending on whether UML Tt 1 , TtG 2 and UML Tt 2 (we subsumed uninteresting cases
derived from extremely high/low patent value. As they do not reflect applicant’s
heterogeneous preference for speed and length of patent protection), we have 8
different situations to compare. Excluding two impossible situations and summarizing
similar cases, we get:

12
(1) TtG 2 , UML Tt 1 and UML Tt 2 .
UML Tt 1 means the optimal period to stop renewing a patent is longer than UMT
when applicant files for UM. UM is not able to satisfy applicant’s “need for length”
preference. UML Tt 2 indicates the patent has long value horizon so filing IPat has
the advantage of capturing more value “in the back.” TtG 2 means that when
applicant chooses IPat, patent value in initial periods is not high enough to justify
early patent grant. In this case, applicant will prefer IPat iff:
UM
G
L
G
G
G
L
UM
T
T
rt
G
T
T
rt
T
T
rt
T
T
rt dteTtrdteTtrdtektvdtektv1
2
2
2
1
2
)]([)(),;(),;( 1
12
Since the patent value in early period is low, the 2nd term is unlikely to be larger than
the 1st. So under the case that patent has long value horizon and value in early
periods is low, it is very likely for applicants to choose IPat.
(2) TtG 2 , UML Tt 2 .
UML Tt 2 indicates the patent has short value horizon. TtG 2 means the patent value
in initial period is low. The applicant is opt to choose UM Iff:
2
2
1
1
2
1
2
1
)()]([),;(),;( 2
2
1
1
L
G
L
G
L
L
G
G
T
T
rt
G
T
T
rt
G
T
T
rt
T
T
rt dteTtrdteTtrdtektvdtektv
Because )()( 12 trtr and UML Tt 2 , we have 12
LL TT . In this case, the optimal period
to stop renewing patent is less than UMT even when filing for IPat. The total period
of renewal for UM is longer than that for IPat because the renewal cost for UM is
lower. The 2nd term in the above inequality is thus negative and the RHS is negative
too. So in this case, applicant will always prefer UM.
(3) TtG 2 , UML Tt 2 .
Similar to the above case, TtG 2 indicates the optimal grant date for applicant when
filing for IPat is smaller than the minimum grant lag for IPat. IPat thus fails to satisfy
applicant’s “need for speed” preference. Combined with the argument about short
value horizon in case (2), applicant will always prefer UM.
(4) TtG 2 , UML Tt 1 and UML Tt 2 .
In this case, though IPat gives the advantage of longer protection periods, UM is also
attractive because the early period patent value is high. Applicant will prefer UM iff

13
2
1
2
1
)()]([),;(),;( 2
2
1
1
LUM
G
L
UMG
T
T
rt
G
T
T
rt
G
t
T
rt
T
t
rt dteTtrdteTtrdtektvdtektv
or the benefit of benefit of accumulating patent value in initial periods (since the early
period value is high) outweighs the patent value in the additional periods beyond the
maximum term of UM but provided by IPat.
Summarizing the above 4 cases, we have:
Long patent value horizon Short patent value horizon
High initial value IPat/UM UM
Low initial value IPat UM
Patent applicant’s preference for speed and length of patent grant is associated with the
initial value as well as the length of value horizon of the patent value. Substituting this
into the above matrix, we have:
“need for length”
“need for speed”
Need for long protection
period
Long protection is not crucial
fast grant is curcial IPat/UM UM
Fast grant is not crucial IPat UM
From the above model, we generalize our empirical predictions as follow:
(i) Compared to applicants that opt for IPat at SIPO, applicants that chose UM at
SIPO is more likely to hasten their patent grant at USPTO;
(ii) Compared to applicants that opt for IPat at SIPO, applicants that chose UM at
SIPO are less likely to renew their Chinese and U.S. patent after grant.
(iii) In technology fields that feature long R&D and product cycles, patent’s expected
value horizon should be long. Compared to applicants that opt for IPat at SIPO,
applicants that chose UM at SIPO is more likely to hasten their patent grant at
USPTO;
(iv) In technology fields that feature long R&D and product cycles, patent’s expected
value horizon should be long. There should be no difference in terms of renewal
behavior between applicants that opt for IPat and UM at SIPO.

14
Hypothesis (i) is derived from comparing the top and bottom rows of the above 2-by-2
matrix. If our theory is not rejected, this feature should be reflected by our data and is
especially salient if we can somehow restrict our sample to including only patents with
long value horizon (comparing the bottom row with the top row for the left column).
Hypothesis (iii) tries to test the above claim by restricting our sample to technology
fields with long R&D and product cycles, as average length of patent value horizon is
expected to be long in these technologies. Hypothesis (ii) is motivated by comparing the
left with the right column of the 2-by-2 matrix. Another interesting motivation for
having hypotheses (iii) and (iv) is that we would like to separate the preference for
“need for speed” and “need for length.” That is, we expect applicant’s behavior of
choosing IPat (UM) cannot be entirely determined just by one of these preferences, but
there is a tradeoff between “need for speed” and “need for length.” As shown in case (4)
of our model. Comparing (iii) (iv) with (i) (ii). We see choosing UM over IPat reflects that
the concern for “need for speed” is dominating the concern for “need for length.”
3. Data description and summary statistics
To address our hypotheses, we use a sample of successful U.S. utility patents of which
applicants has previously sought for patent protection in China for the same invention.
Since the first Chinese patent law was put into practice in 1985, we search the USPTO
patent database from 1985 to 2010 and collect all patents with Chinese priority. We
then use the priority number associated with each U.S. patent to match with the
Chinese patent database (1985-2010) and to extract relevant information of the Chinese
patents.
For the analysis of this paper, we restricted the sample to U.S. patents whose Chinese
priority application date ranges from Jan 1st 1993 to Dec 31st 2008. Since the
establishment of SIPO in 1984, three major amendments to the Chinese patent law
were carried out in 1992, 2000 and 2008. In 1992, the statutory life term for IPat and
UM were extended from 15 years to 20 years and 5 years to 10 years, both counted
from the filing date. In addition, UM owners can no longer petition for 2 years of
protection beyond the maximum term. The 2000 revision eliminated the provisions
under the old law that prevented state-owned enterprises from trading their patents in
technology markets. It also introduced new provisions that make it more rewarding for
enterprise employees to innovate. In 2008, SIPO relaxed the prerequisite of domestic
filing for any domestically produced invention to file abroad; the amendment was put

15
into practice in 2009. Between Jan 1st 2003 and Dec 31st 2008, there is no change in
length and scope of patent terms, enforcement and restrictions in foreign filing.
One of the major differences between IPat and UM is that only product inventions can
be protected by UM. We manually identify process inventions by reading the title and
abstract of each patent in the sample. 441 U.S. patents on process innovations are
excluded25. We also exclude “dual applications” of simultaneous applications for IPat
and UM as the numbers are too few to provide statistically interesting results. To
identify “dual applications,” we search the entire Chinese UM patent dataset and look
for IPat applications that have similar abstract and identical patentees and inventors26.
77 “dual-applications” are excluded. Finally, our dataset include 3450 U.S. patents with
Chinese priority.
Table 2 presents summary statistics for patent attributes, “need for speed” and “need
for length” preferences indicators. On average, U.S. patents with Chinese priorities have
13 claims, 3 inventors, span across 3 U.S. patent classifications, cite 11 patents and are
cited by 1 patent. 40% of the patents filed have involved either foreign patentee or
foreign inventor. 19% of the U.S. patents in our sample involve a Chinese UM. The U.S.
grant lag and the Chinese grant lag are extremely similar both in terms of mean and
standard deviation; on average, the grant lags in both countries are slightly less than 3
years. There is an average gap of 8 months between the Chinese filing date and the first
U.S. filing date (continuation filings are counted as separate filing dates in U.S.). 1.98%
of the sample has a filing lag more than 12 months and 40% of the data were filed in the
last month of grace period. Only 7% of the U.S. patents have continuation applications
and the average delay in filing continuation is about 2 months. 90% of U.S. patents with
Chinese priority are renewed after 3.5 years and 72% are renewed after 7.5 years. To
the contrary, Chinese patents protecting the same inventions are renewed slightly
longer; 95% of Chinese patents are renewed after 4 years and 82% are renewed after 8
years27.
Table 3 displays the distribution of patents in different technology fields as defined in
Hall, Jaffe and Trajtenberg (1999). The percentages of Chinese UMs in the sample vary
across different technologies. In Electric&Electronics, Mechanicals and Others, where
25
Our empirical results largely hold if we do not exclude those patents. 26
The titles for an IPat and a UM in a dual application are often not identical. The title for the UM usually starts with “a product that ..,” while the title for the IPat starts with “a method and product that …” 27
Although the application, attorney fees for Chinese patent is only about 10% of that for U.S. patent, the Chinese renew cost is on average higher than the U.S. renew cost. Using the Chinese and U.S. renewal structure, a simple calculation indicates that for a patent that is renewed for 20 years in China, the patentee pays $ 581 dollars per year while for a patent that is renewed for 20 years in U.S, the owner pays only $441 dollars per year (Using the U.S. renew cost structure for large entities before Mar 19
th 2013).

16
technology progress is fast and products has relatively short cycle, one third to one half
of the Chinese applications were filed for UM, whereas few are seen in technologies
such as Chemicals, Computer&Communication and Drugs&Medical.
Figure 1 displays the percentage of U.S. patents with UM priority from 1993-2008 and
compares the distribution of UM patents in different technology fields. There is a
significant increase in the use of UMs starting from 1995 for the three technology fields
Electric&Electronics, Mechanicals and Others. The trend reaches a peak around 1997
and gradually decreases yet remains at a relatively high percentage level (approximately
40 percent) until 2005 before it falls sharply. To the contrary, in technology fields
Chemicals, Computer&Communication and Drugs&Medical, there is virtually no
existence of UM before 1998. In the next year, UM is picked up and since then, it has
become more and more popular. The patterns are interesting but hard to generalize
because of a right-truncation problem of the data.
One of the concerns about UM is that it serves as a “cheap ticket” to arrive at the USPTO.
Why not just file a UM then quickly abandon it since it’s cheap and the Chinese patent
law requires you to do so in the first place? To address this issue, we examine the
annual abandon rates for Chinese patent applications in this sample. In figure 2, the
“hook-shaped” curve represents the annual amount of Chinese patent applications (the
amount was divided by 1000 to match amplitudes of other curves). Starting from 1993
(17 applications), the Chinese patent filing increases gradually before it takes off in 2000
(140 applications). The trend reaches a maximum in 2005 (648 applications) then drops
quickly due to a right-truncation problem. We find in the initial periods there is a
relative high percentage of both IPats and UMs being abandoned. However, due to the
small numbers of applications in the first few years, the total abandon rates are 0.9% for
IPat and 0.3% for UM, suggesting the “cheap ticket” motivation might not be a serious
concern.
Table 4 compares “need for speed” and “need for length” indicators between U.S.
patents with Chinese IPat and UM priorities. Chinese UM applicants have significantly
shorter filing lags between the SIPO filing date and the first USPTO filing date, are less
likely to file in the “last minute,” less likely to file continuations and when they file, file
them earlier. The differences in U.S. patent renewal decisions indicate that U.S. patents
with UM priorities have shorter value horizons; In U.S, they are less likely to be
maintained by patentees at the end of 3.5, 7.5 and 11.5 year, respectively, after
issuance. Compared to the U.S. renewal, the differences in Chinese renew decisions
illustrate a consistent yet more continuous change of maintenance behaviors. Although
the percentage of renewed UM and renewed IPat are significantly different at the 2nd

17
and 3rd year after patent grant, the difference is small and there are more than 98% of
UMs being renewed by the end of 3rd year. However, after the 5th year of issuance,
there is a dramatic drop in the percentage of UMs that are being renewed. The U.S. and
Chinese renewal data supports the idea of heterogeneity in length of value horizon and
applicant’s diversity in “need for length” preference. Figure 2-4 display the survival
function estimates for filing lags, Chinese and U.S. patent renewal, between U.S.
patents with IPat and UM priorities.
4. Empirical strategy and results
4.1 Patent quality comparison: IPat vs. UM
The key assumption of our model is that applicant has the flexibility to choose between
IPat and UM; not because her invention is not eligible to file for IPat. We thus select the
“technologically sound” Chinese patents by including those that have also been granted
U.S. patents. To further check whether this assumption holds for our dataset, we
compare the technological quality between U.S. patents with Chinese UM priorities and
those with Chinese IPat priorities. We look at: number of claims (Lanjouw and
Shankerman 2004), number of patent classifications28, number of cited and citing
patents (Trajtenberg 1990, Hall et all. 1999, Lanjouw and Shankerman 2004, Harhoff et
al. 2003) and whether the patent has foreign patentee or inventor. More specifically, for
patent i in technology field j with U.S. filing year t , we estimate the following equation:
ijttjiijt vuUMY *10
In this estimating equation, ijtY represents the five patent quality indicators described
above. The key regressor is iUM , a dummy variable that is equal to one if the applicant
files for UM in China. The equation is estimated using fixed effects at technology )( ju
and U.S. filing year tv level. So the effect is estimated from variation within technology
fields over time. The technology field fixed effect is particularly important because it
controls for structural features of technology that may both make filing for UM more
attractive and induce systematic changes in the technology quality indicators.
As shown in Table 5, the results from OLS regressions do not indicate significant
differences between these two groups, except that patents with UM priorities have
28
Lerner (1994) uses number of international patent classifications (IPCs). We use the number of U.S. patent classifications (USPCs).

18
significantly more foreign patentees or inventors. The results lend support to the
assumption that Chinese UMs in the sample are likely to qualify for IPats protection at
SIPO.
4.2 Prediction (i)
We now test the 4 predictions derived from our model. Prediction (i) of the model
states that applicants filed for UM at SIPO is more likely to hasten their patent grant at
USPTO. This prediction motivates an estimating equation of the form:
ijttjiiijt vuXUMY ** 210
ijtY represents one of “need for speed” indicators for U.S. patent i in technology field
j with USPTO filing year t . The “need for speed” indicators include continuous
variables filing lags, continuation lags and grant lags and dummy variables filing in “last
minute” and continuation. We employ OLS if the outcome variable is continuous and
Logit if the outcome is a dummy. The iX are control variables including number of
claims, number of inventors, number of U.S. patent classifications, number of cited
references and number of citing patents. The key variable of interest iUM is an indicator
for whether the US patent i has a Chinese UM priority. For each “need for speed”
indicator ijtY , we always estimate the equation using year fixed effect tv . However, it is
interesting to compare the results obtained from using technology fixed effect ju with
the results from not using technology fixed effect ju . One reason is that if both are
statistically significant and have same signs, the results are robust to controlling for
technology fixed effect. A more important reason is that if the coefficient estimates are
significantly different, we can understand that how much of the difference of “need for
speed” preferences from applicants that opt for IPat compared to applicants that opt
for UM can be attributed to inter-technology variation and how much can be attributed
to within-technology variation. So we estimate both.
In Table 6, Panel A reports the OLS coefficient estimates of iUM when the dependent
variables are continuous. As shown in column 1, applicants that opt for UM in China
generally file their U.S. patents 32 days earlier than applicants that opt for IPat, the
coefficient is significant at 1% level. The difference reflects variations across technology
fields as well as variations within technology fields. When controlling for technology
fixed effects, the coefficient drops to 15 days, a 50% decrease in absolute term but still
significant at 1% level. In columns 3-6, regression results for continuation lag and grant
lag are reported. UM users on average, file U.S. continuation patent applications 40 days

19
earlier and their U.S. patents are granted 62 days ahead. Panel B repots Logit coefficient
estimates when ijtY are dummies for filing “last minute” and filing continuations. Setting
the other RHS variables at mean level, we find UM users are, on average, 8.6% and 14.5%
less likely to file in the last month of the grace period, with and without technology fixed
effect, respectively. In terms of choosing to file for continuation, the differences are 10%
and 7%. This is consistent with prediction (i).
4.3 Prediction (ii)
To test prediction (ii) that applicant filed for UM at SIPO is less likely to renew their
patent at SIPO and USPTO, we estimate a similar equation of form:
ijttjiiijt vuXUMY ** 210
In this equation, ijtY represents the “need for length” indicators for patent protection
that include dummy variables of whether the patentee maintains her patent at USPTO
after 3.5 years, 7.5 years and 11.5 years of issuance as well as whether she maintains
patent at SIPO after 2nd-9th year of issuance. For each regression, if ijtY is the renewal
decision at thm year, we restrict our sample to include patents that are at least m years
old. In addition, to understand more precisely of how the renewal behaviors change
over time, we test whether thm year renewal is significantly different between IPat and
UM patentees conditional on they have renewed their patents in the last period.
Table 7 presents the conditional renewal regression estimates. For Chinese renewal
decisions from year 3 to year 5, the coefficients on iUM are close to zero and not
statistically significantly different from zero. Starting from the 6th year after issuance,
the coefficient estimates for renewal decisions become statistically significantly less
than 0 (except the 8th year renewal). The propensities to keep renewing patent are 6.7%
to 36.4% less for patentees with UM compared to patentees with IPat, controlling for
technology fixed effect (evaluating the other independent variables at mean level). The
gaps between the renewal propensities are larger as patents become older. For U.S.
renewal decisions, the coefficients at 3.5 year renewal is statistically significant; the
differences in probability of renewal between U.S. patents with Chinese IPat and UM
priorities are 10% and 15% with or without controlling for technology fields. Since after
renewing the patent at the 3.5 year mark, the patent will be effective for year 3.5 to
year 7.5, the differences of U.S. renewal decisions at 3.5 year is broadly consistent with
the differences of Chinese renewal decisions for year 6-8. Conditional on renewing at
3.5 year and 7.5 year in U.S, the propensities to keep renewing patents with IPat and
UM priorities are indifferent at 7.5 and 11.5 year. In China, to the contrary, conditional

20
on renewing at the 8th year, there is an even bigger portion of UM that are dropped out
in the 9th year. This discrepancy in the tail distribution of renewal decisions between
Chinese patents and U.S. patents protecting the same innovation might be explained by
the differences in statutory patent life between U.S. patents and Chinese UM. Since the
UM is only protected for 10 years, and at the 9th year the renewal fee reaches its
maximum, it might not be worthwhile to submit the renew fee while having 1 additional
year of protection; in U.S, however, submitting renewal fee at 7.5 and 11.5 year will
extend the patent life for 4 and 8.5 years respectively. It is therefore less likely for
patentees to drop out their patents.
4.4 Prediction (iii) and prediction (iv)
Predictions (iii) and (iv) state that in technology fields that have long R&D and product
cycles, the patent’s expected value horizon should be long. Hence, UM has the
advantage to satisfy applicant’s “need for speed” preference while it may not be
attractive in terms of protection length. To test these predictions, we divide our sample
into two groups. The first group consists of technologies that feature long R&D and
product cycles: Chemicals, Computer&Communications and Drugs&Medicals. The
second group includes Electrical&Electronics, Mechanicals and Others, in which
technology moves fast and new products have relatively short market cycle. We then
conduct the same analysis with respect to the comparisons of “need for speed” and
“need for length” indicators between IPat and UM patentees in these two sub-samples
and compare the results.
Table 8 and 9 reports the results for “need for speed” indicators. In technology fields
Chemicals, Computer&Communications and Drugs&Medicals, U.S. patents with UM
priorities are filed faster, with shorter continuation filing lag and shorter grant lags, less
likely to file continuation and less likely to file in the last months. In technology fields
Electrical&Electronics, Mechanicals and Others, the results are broadly similar except
that the magnitudes of the point estimates are smaller. In table 9, there is no difference
in terms of filing lag and filing in “last minute” between UM priority patents and IPat
priority patents. As mentioned in section 2, these two indicators only partially reflect
the “need for speed” preference. In summary, both in long product cycle technology
fields and short product cycle technology fields, applicant filed for UM at SIPO is more
likely to hasten their patent grant at USPTO.
Table 10 and 11 present the results for “need for length” indicators. We find
significantly different renewal behaviors between IPat and UM patentees in long
product cycle technology fields as compared to the renewal behaviors in short product
technology fields both in China and U.S. In Chemicals, Computer&Communications and

21
Drugs&Medicals, the difference in renewal behaviors between IPat and UM patentees is
statistically insignificant from zero. While in Electrical&Electronics, Mechanicals and
Others, UM patentees tend to renew their Chinese and U.S. patents less often than IPat
patentees.
In summary, even in long R&D and product cycle technology fields, UM might still be
attractive to patent applicants because of the advantage of fast patent grant. To the
contrary, in short R&D and product cycle technology fields, UM is the optimal choice
when applicant prefer speedy patent grant while the patent’s value horizon is not too
long. The two sets of results are consistent with prediction (iii) and (iv). We find “need
for speed” and “need for length” are separate concerns that patent applicants must
consider carefully before choosing which type of patent protection to file.
5. Robustness Check
Interviews with patent attorneys suggest applicants generally utilize this period of time
to assess the commercial viability of their innovation, formalize and translate her patent
application. If this is indeed the case, we suspect that patent applicants that have some
sort of “foreign cooperation” might thus require less time to make up the decision and
prepare their U.S. filing. For each patent, we define a dummy variable “foreign
cooperation” if the patent has at least one non-Chinese patentee or non-Chinese
inventor. By this definition, the patents that have no “foreign cooperation” are those
that are filed by Chinese firms with Chinese inventors only. To test this hypothesis, we
estimate the following empirical equation:
ijttjiiiijt vuXUMForeignY *** 3210
In this equation, ijtY is either filing lag or filing in “last minute.” The Dummies iForeign
and iUM are defined previously. Our null hypothesis is 0: 10 H .
Table 12 presents the result. The coefficient estimates of 1 is statistically significantly
less than zero, supporting our hypothesis.
In our data, one third of U.S. patents with UM priority is delayed until the “last minute”
before filing in U.S. If the hypothesis is true and filing UM reflects applicant’s desire for
speedy patent grant, then after the U.S. patent filing starts, the applicant should hasten
her patent prosecution process more than the applicants with IPat priority. Table 13
presents the results. The results are consistent with our predictions.

22
6. Conclusion
Patent right provides a legal right to exclude others from using the same technology. In
industries where the R&D and product cycle is long, patent applicants would like their
patent rights to be long enough to secure revenue. In industries where pace of
technology is fast and current products are quickly replaced by new, more advanced
products, patent applicants would like to secure their patent right as soon as possible.
The importance of the speed of patent prosecution and the length of patent term may
vary across different technologies and patentees’ diverse purposes of how to utilize the
patent right.
This paper provides a first empirical look at patent applicant’s heterogeneous
preferences over the prosecution speed (“need for speed”) and the protection life
(“need for length”) of patent protection. By conducting quantitative analysis using a set
of successful U.S. patents with Chinese priorities from 1993-2008, we provide strong
empirical evidence of the existence of both “need for speed” and “need for length”
preferences. China provides two types of patent protection. The invention patent (IPat)
is the counterpart of the U.S. utility patent; the utility model patent (UM) does not
require substantive examination and is protected for 10 years. We find applicants opt
for the appropriate type of protection that best suit their diverse preferences of “need
for speed” and “need for length.” More specifically, those that value prosecution speed
over patent protection duration will opt to choose UM.
Our paper shed empirical lights on the literature of the optimal design of patent system.
Although we provide evidences that suggest a flexible patent protection regime would
better suit the diverse needs for patent applicants. There remain several questions to be
answered. What is the overall social welfare implication if the patent system provides
flexible patent protection? Under what conditions will the benefit outweigh the cost? In
our empirical analysis, we find for the same invention, the Chinese renewal behaviors
are broadly consistent with the U.S. renewal behaviors, but not precisely. A natural
question to ask is to what extent is an average U.S. patent over-renewed, or not
renewed enough? Offering a more frequent renewal schedule definitely introduces
more cost. Yet on the other hand, renewing only 2 to 3 times in a patent’s life time
might as well induce too many over-protected patents or firms’ incapability of fully
utilizing the patent system. Then the question is what is the optimal numbers of renewal
that a patent office should require? This study underlines the importance of continuing
theoretical and empirical research on the design of a more flexible regime aimed on
fully extend firms’ capability of utilizing the patent system.

23

24
References
Bessen, J., “The Value of US Patent by Owner and Patent Characteristics,” Research Policy,
37(2008), 932-945.
Cohen W.M., Nelson R.R., Walsh J.P., “Protecting their intellectual assets: appropriability
conditions and why U.S. manufacturing firms patent (or not).” Working Paper No. W7552, NBER,
February 2000.
Gallini N., Scotchmer S., Jaffe A., Lerner J., “Intellectual Property: When is it the Best Incentive
System?” Innovation Policy and the Economy, MIT Press 2002.
Gans, J., D.H.Hsu and Stern S, “The impact of uncertain intellectual property rights on the
market for ideas: evidence from patent grant delays,” NBER Working Paper No. 13234.
Graham S.J.H., Hall B.H., Harhoff D. and Mowery D.C., “Post-issue Patent `Quality Control’: A
Comparative Study of U.S. Patent Re-examinations and European Patent Oppositions. In the
Patent System in the Knowledge-based Economy, ed. WM Cohen, SA Merrill. Washington, DC:
National Academies Press, 74-119, 2003.
Graham S.J.H., Merges R.P., Samuelson P., Sichelman, T.M., “High Technology Entrepreneurs
and the Patent System: Results of the 2008 Berkeley Patent Survey” Berkeley Technology Law
Journal, Vol. 24 No. 4, pp. 255-327, June 2009.
Hall B.H., Harhoff D., “Recent research on the economics of patents” NBER Working Paper No.
17773 January 2012.
Hall, B.H., Jaffe, A. and Trajtenberg, M., “Market Value and Patent Citations: A First Look” NBER
Working Paper NO. 7741, June 2000.
Hall B.H., Ziedonis R.H, “The patent paradox revisited: an empirical study of patenting in the U.S. semiconductor industry, 1979-1995.” The RAND Journal of Economics, Vol 32, No.1, Spring 2001, pp. 101-128. Harhoff D., “Deferred Patent Examination,” manuscript 2011. Harhoff D., Scherer F.M., Vopel K, “Citations, family size, opposition and the value of patent rights.” Research Policy, 32(2003) 1343-1363. Lanjouw, J.O., Pakes A. and Putnam, J., “How to Count Patents and Value Intellecutal Property:
The uses of patent renewal and application data,” Journal of Industrial Economics 46 405-32,
1998.

25
Lei, Z. and Wright B.D., “Why weak patents? Examiner ignorance or pro-applicant procedural
rules?” manuscript, 2012.
Lanjouw J.O., Schankerman M., “Patent quality and research productivity: measuring
innovation with multiple indicators.” The Economic Journal, 114 (2004 April), 441-465.
Lerner J., “The importance of patent scope: an empirical analysis.” The Rand Journal of
Economics, Vol. 25, No. 2 (SUMmer 1994), pp. 319-333.
Moga T.T., “China’s Utility Model Patent System: Innovation Driver or Deterrent.” US Chamber
of Commerce Report.
Pakes A. “Patent as Options: Some estimates of the value of holding Eurpopean patent stocks.” Econometrica 54, 755-84, 1986. Popp D., Juhl T., and Johnson D.K.N, “Time in Purgatory: Determinants of the Grant Lag for US Patent Applications.” NBER Working Paper No. W9518, February 2003.
Schankerman M., and Pakes A., “Estimates of the Value of Patent Rights in European Countries
during the Post-1950 Period.” The Economic Journal 96, pp. 1052-76, 1986.
Scotchmer S., “The Political Economy of Intellectual Property Treaties” Journal of Law,
Economics and Organizations 20:415-437, 2004.
Suthersanen U., “Utility models and innovation in developing countries.” International Centre
for Trade and Sustainable Development (ICTSD), 2006.
Trajtenberg M., “A penny for your quotes: patent citations and the value of innovations.” The
RAND Journal of Economics, Vol. 21, No. 1 (Spring, 1990), pp. 172-187.

26
Table1. Invention Patents (IPats) vs. Utility Models (Ums) in China
Invention Patents Utility Models
Definition Any new technical solution or improvement relating to a product or a process.
Any new technical solution or improvement relating to the shape, the structure or their combination of a product.
Subject Matter Process and product innovations Product innovations
Patentability Substantial examination of novelty, non-obviousness and utility.
No substantial examination of novelty, inventiveness.
Grant Lag Average 36 months Within 12 months
Term 20 years 10 years
Cost (YMB)
Application fee
Examination fee
Attorney fee
950 2,500 4,000-10,000
500 N/A; 2,400 for post-grant substantive examination 2,500-6,000
Maintenance fees (YMB) (annual renewals starting
from grant date)
900, 1st-3rd years; 1200, 4th-6th years; 2000, 7th-9th years; 4000, 10th-12th years; 6000, 13th-15th years; 8000, 16th-20th years.
600, 1st-3rd years; 900, 4th-5th years; 1200, 6th-8th years; 2000, 9th-10th years.
Note: Mean grant lags for IPats and UMs are estimated, using SIPO patent dataset which contains all Chinese patents with filing dates between 1985 and 2008. The cost of patent application and renewal are obtained from SIPO website at www.sipo.gov.cn. For estimation of attorney fees, we interviewed several lawyers from different law firms located in Beijing, China, and asked for the attorney fees they charge for IPats and UMs. In general, law firms charge the same rate regardless of the locations of their clients (applicants).

27
Table2. Sample Statistics
U.S. utility patents with Chinese priority
3450 observations, U.S. filing date 1993-2010
Variable Name Mean S.D. Min Max
Panel A: Patent attributes UM priority (D) 0.19 0.39 0 1
No. of claims 13.23 6.91 1 88
No. of inventors 2.77 1.44 1 5
No. of uspc 3.23 2.99 1 28
No. of cited patents 10.73 11.07 0 190
No. of citing patents 1.15 3.19 0 59
Chinese grant lag (2036 obv. granted) 1016.59 509.66 216 2995
Have foreign patentee or inventor 0.41 0.49 0 1
Panel B: “need for speed” preference indicators
filing lag (days) 258.66 135.34 0 916
filing in last month (D) 0.39 0.48 0 1
continuation (D) 0.07 0.26 0 1
continuation lag (days) 57.61 194.03 0 2307
grant lag (days) 1061.31 481.33 144 3617
Panel C: “need for length” preference indicators
U.S. renewal dummies
Renew at 3.5 year after issue 0.89 0.31 0 1
Renew at 7.5 year after issue 0.72 0.44 0 1
Renew at 11.5 years after issue 0.52 0.50 0 1
Chinese renewal dummies
Renew at 2nd
year after issue 0.98 0.10 0 1
Renew at 3rd
year after issue 0.97 0.15 0 1
Renew at 4th
year after issue 0.95 0.21 0 1
Renew at 5th
year after issue 0.91 0.28 0 1
Renew at 6th
year after issue 0.85 0.35 0 1
Renew at 7th
year after issue 0.97 0.15 0 1
Renew at 8th
year after issue 0.82 0.38 0 1
Renew at 9th
year after issue 0.77 0.41 0 1
Note: the notation (D) means the variable is a dummy.

28
Table3. Distribution of Invention Patents vs. Utility Models, by Technology Fields
IPat UM
Chemicals 419 13
Computers& Communications 705 43
Drugs& Medical 207 8
Electrical& Electronic 1004 337
Mechanical 234 98
Others 227 155
Total 2796 654
Note: the six technology fields are defined as in Hall, Jaffe and Trajtenberg (1999), based on US patent
classifications.

29
Table4. Comparison of “need for speed” and “need for length” preferences between IPat and UM
UMs
(mean) IPats
(mean) Difference (UM-IPat)
(A) “need for speed” preference indicators
Filing lag 238.445 263.398 -24.953***
Filing in last month 0.305 0.419 -0.113***
Continuation 0.024 0.085 -0.061***
Continuation lag 19.183 66.608 -47.425***
Grant lag 965.512 1083.722 -118.210***
(B) U.S. “need for length” preference indicators
Maintain4 0.826 0.918 -0.092***
Maintain8 0.562 0.763 -0.198***
Maintain12 0.42 0.53 -0.10
(C) Chinese “need for length” preference indicators
Maintain2 0.982 0.993 -0.0109**
Maintain3 0.957 0.980 -0.022***
Maintain4 0.935 0.952 -0.017
Maintain5 0.904 0.910 -0.006
Maintain6 0.783 0.881 -0.097***
Maintain7 0.666 0.856 -0.189***
Maintain8 0.622 0.857 -0.235***
Maintain9 0.484 0.836 -0.352***
Note: Units of Filing lag, continuation lag and grant lag are days; Continuation, Filing in last month and all
the maintenance variables are dummies. * Significant at 10%; ** significant at 5%; *** significant at 1%.

30
Table5. Attributes of US patents: Chinese UM priorities vs. Chinese IPat priorities (OLS)
Number of Claims
Have foreign patentee/inventor
Number of USPC
Number of cited references
Number of citing patents
UM -0.69 0.08 -0.17 0.96 0.44
[0.48] [0.02]*** [0.13] [0.57] [0.26]
R
2 0.02 0.03 0.10 0.03 0.23
N 3450 3450 3450 3450 3450
Filing year dummies Yes Yes Yes Yes Yes
Technology
dummies Yes Yes Yes Yes Yes
Note: Robust Standard errors clustered at technology level, are in bracket.
* Significant at 10%; ** significant at 5%; *** significant at 1%. Specifications in the Table are
ijttjiijt vuUMY *10 , where ijtY is one of the patent quality indicators for U.S. patent
i in technology field j (HJT 6) with a USPTO filing year t . The key variable iUM is an indicator for
whether US patent i has a Chinese UM priority.

31
Table6. “Need for speed” preferences comparison:
US Patents with Chinese UM priorities vs. with Chinese IPat priorities
[1] [2] [3] [4] [5] [6]
Panel A (OLS)
Filing Lag Filing Lag Continuation Lag Continuation Lag Grant Lag Grant Lag
UM -32.475 -15.038 -55.189 -40.63 -133.775 -62.082
[4.972]*** [5.099]*** [6.64]*** [6.912]*** [17.080]*** [17.306]**
R2 0.19 0.21 0.07 0.09 0.32 0.08
N 3450 3450 3450 3450 3450 3450
Panel B (Logit)
“Last minute” filing “Last minute” filing Continuation Continuation
UM -0.612 -0.362 -1.580 -1.103
[0.104]*** [0.101]*** [0.276]*** [0.290]***
Pseudo-R2 0.17 0.15 0.12 0.17 L-Likelihood -1986.003 -1962.067 -792.153 -749.675
N 3450 3450 3450 3450
Filing year dummies Yes Yes Yes Yes Yes Yes
Technology
dummies No Yes No Yes No Yes
Marginal effects
UM 0.143 0.086 0.074 0.106
Note: Robust Standard errors, clustered at firm level, are in bracket. * Significant at 10%; ** significant at 5%; *** significant at 1%.

32
Table7. “Need for length” preferences comparison:
Conditional renewal behaviors between UM and IPat patentees
[1] [2] [3] [4] [5] [6]
CN Renewal Maintain2 Maintain2 Maintain3 Maintain3 Maintain4 Maintain4
UM -1.201 -0.994 -0.895 -0.264 -0.072 -0.241
[0.393]*** [0.415]** [0.549] [0.608] [0.507] [0.675]
R2 0.11 0.16 0.05 0.08 0.07 0.07
L-Likelihood -104.028 -98.434 -88.613 -81.434 -99.908 -99.289
N 1710 1710 993 747 1075 1075
Maintain5 Maintain5 Maintain6 Maintain6 Maintain7 Maintain7
UM 0.513 0.046 -1.657 -1.247 -3.438 -2.674
[0.445] [0.469] [0.446]*** [0.522]*** [0.834]*** [0.707]***
R2 0.07 0.118 0.172 0.20 0.32 0.35
L-Likelihood -113.429 -106.868 -80.601 -77.28 -29.588 -25.768
N 795 795 464 464 299 299
Maintain8 Maintain8 Maintain9 Maintain9 Maintain10 Maintain10
UM -1.663
-3.94 -4.522
[1.518]
[1.37]*** [1.664]***
R2 0.35
0.33 0.39 L-LIkelihood -5.859
-19.115 -17.315
N 69
85 83
US Renewal Maintain4 Maintain4 Maintain8 Maintain8 Maintain12 Maintain12
UM -1.31 -0.944 -0.186 0.227 -0.937 0.757
[0.221]*** [0.241]*** [0.692] [0.778] [1.852] [2.053]
R2 0.12 0.14 0.13 0.16 0.18 0.30
L-LIkelihood -397.153 -386.075 -78.627 -75.567 -18.252 -13.293
N 1303 1303 276 276 40 30
Filing year dummies Yes Yes Yes Yes Yes Yes
Technology dummies No Yes No Yes No Yes
Note: Robust Standard errors, clustered at firm level, are in bracket. * Significant at 10%; ** significant at 5%; *** significant at 1%. For the Chinese renewal regressions, the filing years are the Chinese filing years; for the U.S. renewal regressions, the filing years are the U.S. filing years.

33
Table8. “Need for speed” preferences comparison:
US Patents with Chinese UM priorities vs. with Chinese IPat priorities in Chemicals, C&C and
Drugs&Medical.
[1] [2] [3] [4] [5] [6]
Panel A (OLS)
Filing Lag Filing Lag Continuation Lag Continuation Lag Grant Lag Grant Lag
UM -66.554 -66.42 -80.720 -80.347 -127.423 -125.541
[13.972]*** [14.061]*** [19.251]*** [19.778]*** [62.113]*** [61.021]**
R2 0.03 0.03 0.09 0.09 0.33 0.35
N 1394 1394 1392 1392 1392 1392
Panel B (Complementary Log-Log)
“Last minute” filing “Last minute” filing Continuation Continuation
UM -0.840 -0.843 -1.324 -1.353
[0.239]*** [0.240]*** [0.584]** [0.597]**
Pseudo-R2 L-Likelihood -902.148 -889.08 -495.739 -484.962
N 1393 1393 1393 1393
Filing year dummies Yes Yes Yes Yes Yes Yes
Technology
dummies No Yes No Yes No Yes
Note: Robust Standard errors, clustered at firm level, are in bracket. * Significant at 10%; ** significant at 5%; *** significant at 1%.

34
Table9. “Need for speed” preferences comparison:
US Patents with Chinese UM priorities vs. with Chinese IPat priorities in E&E, Mechanical and Others.
[1] [2] [3] [4] [5] [6]
Panel A (OLS)
Filing Lag Filing Lag Continuation Lag Continuation Lag Grant Lag Grant Lag
UM 1.149 1.492 -17.67 -17.384 -41.33 -48.391
[5.866] [5.877] [6.911]** [6.951]** [17.253]** [17.179]***
R2 0.11 0.11 0.04 0.05 0.28 0.29
N 2055 2055 2050 2050 2055 2055
Panel B (Logit)
“Last minute” filing “Last minute” filing Continuation Continuation
UM -0.031 -0.011 -0.711 -0.753
[0.123] [0.124] [0.343]** [0.346]**
Pseudo-R2 0.10 0.11 0.06 0.06 L-Likelihood -1097.20 -1095.69 -272.77 -271.97
N 2054 2054 2034 2034
Filing year dummies Yes Yes Yes Yes Yes Yes
Technology
dummies No Yes No Yes No Yes
Note: Robust Standard errors, clustered at firm level, are in bracket. * Significant at 10%; ** significant at 5%; *** significant at 1%.

35
Table10. “Need for length” preferences comparison:
Conditional renewal behaviors between UM and IPat patentees in E&E, Mechanical and Others.
[1] [2] [3] [4] [5] [6]
CN Renewal Maintain2 Maintain2 Maintain3 Maintain3 Maintain4 Maintain4
UM -0.009 -0.010 0.002 -0.004 0.014 0.013
[0.007] [0.007] [0.002] [0.010] [0.011] [0.012]
R2 0.02 0.03 0.09 0.02 0.04 0.04
N 1129 1129 942 849 622 622
Maintain5 Maintain5 Maintain6 Maintain6 Maintain7 Maintain7
UM 0.001 0.001 -0.096 -0.088 -0.098 -0.097
[0.02] [0.02] [0.036]*** [0.035]** [0.044]** [0.045]**
R2 0.14 0.14 0.13 0.16 0.22 0.24
N 462 462 269 269 169 169
Maintain8 Maintain8 Maintain9 Maintain9 Maintain10 Maintain10
UM 0.028 0.025 -0.359 -0.370
[0.028] [0.026] [0.137]** [0.135]***
R2 0.16 0.17 0.46 0.47
N 101 101 49 49
US Renewal Maintain4 Maintain4 Maintain8 Maintain8 Maintain12 Maintain12
UM -0.095 -0.092 0.045 0.039
[0.024]*** [0.025]*** [0.059] [0.057]
R2 0.13 0.13 0.11 0.12
N 756 756 113 113
Filing year dummies Yes Yes Yes Yes Yes Yes
Technology dummies No Yes No Yes No Yes
Note: Due to the limitation in the number of observations, our estimations are based on linear probability model. Robust Standard errors, clustered at firm level, are in bracket. * Significant at 10%; ** significant at 5%; *** significant at 1%. For the Chinese renewal regressions, the filing years are the Chinese filing years; for the U.S. renewal regressions, the filing years are the U.S. filing years.

36
Table11. “Need for length” preferences comparison:
Conditional renewal behaviors between UM and IPat patentees in Chemicals, C&C and
Drugs&Medical.
[1] [2] [3] [4] [5] [6]
CN Renewal Maintain2 Maintain2 Maintain3 Maintain3 Maintain4 Maintain4
UM 0.002 0.002 0.002 0.002 -0.011 -0.012
[0.001] [0.001] [0.002] [0.002] [0.030] [0.030]
R2 0.06 0.06 0.09 0.08 0.04 0.05
N 907 907 942 742 589 589
Maintain5 Maintain5 Maintain6 Maintain6 Maintain7 Maintain7
UM 0.021 0.019 0.005 0.004 0.002 0.003
[0.009]** [0.009]** [0.010] [0.012] [0.003] [0.005]
R2 0.04 0.04 0.05 0.05 0.04 0.04
N 478 478 355 355 250 250
Maintain8 Maintain8 Maintain9 Maintain9 Maintain10 Maintain10
UM -0.167 -0.162 -0.230 -0.220
[0.149] [0.142] [0.222] [0.225]
R2 0.20 0.22 0.27 0.28
N 136 136 68 68
US Renewal Maintain4 Maintain4 Maintain8 Maintain8 Maintain12 Maintain12
UM -0.047 -0.047 -0.016 -0.051
[0.051] [0.051] [0.037] [0.045]
R2 0.06 0.07 0.14 0.16
N 606 606 177 177
Filing year dummies Yes Yes Yes Yes Yes Yes
Technology dummies No Yes No Yes No Yes
Note: Due to the limitation in the number of observations, our estimations are based on linear probability model. Robust Standard errors, clustered at firm level, are in bracket. * Significant at 10%; ** significant at 5%; *** significant at 1%. For the Chinese renewal regressions, the filing years are the Chinese filing years; for the U.S. renewal regressions, the filing years are the U.S. filing years.

37
Table12. Comparing filing lags and propensity of filing in last month between indigenous Chinese
inventors and Chinese inventors with foreign cooperation
[1] [2] [3] [4]
Filing Lag Filing Lag “Last minute” filing “Last minute” filing
Foriegn -81.952 -72.962 -0.998 -0.920
[7.684]*** [7.854]*** [0.096]*** [0.097]***
UM -72.454 -52.499 -0.433 -0.256
[8.627]*** [8.904]*** [0.107]*** [0.114]***
R2 0.27 0.29 0.16 0.17
N 3450 3450 3450 3450
Filing year dummies Yes Yes Yes Yes Yes Yes
Technology
dummies No Yes No Yes No Yes
Note: Robust Standard errors, clustered at firm level, are in bracket. * Significant at 10%; ** significant at 5%; *** significant at 1%.

38
Table13. Is “need for speed” preference consistent prior vs. post U.S. application date? Examining
filing behaviors of U.S. patents with UM priority that are delayed until “last minute” before filing
[1] [2] [3] [4] [5] [6]
Continuation Continuation Continuation lag Continuation lag Grant lag Grant lag
UM filed in last month -1.656 -1.144 -69.465 -52.181 -246.850 -159.972
[0.441]*** [0.453]** [12.737]*** [13.277]*** [29.510]*** [30.233]***
R2 0.11 0.16 0.06 0.09 0.34 0.39
L-Likelihood -746.619 -703.112
N 2989 2989 2989 2989 2989 2989
Filing year dummies Yes Yes Yes Yes Yes Yes
Technology
dummies No Yes No Yes No Yes
Note: Robust Standard errors, clustered at firm level, are in bracket. * Significant at 10%; ** significant at 5%; *** significant at 1%.

39
Figure1. % of U.S. patent with UM priority through the period 1993-2008
Note: there are 6 technology fields Chemical, Computer and Communication, Drugs and
Medical, Electrical and Electronics, Mechanical, Others as defined in Hall, Jaffe and Trajtenberg
(1999). The x-axis represents Chinese filing year.
0.2
.4.6
1990 1995 2000 2005 2010U.S. filing year
% of UM
% of UM in Chemical, C&C, Drugs&Medical
% of UM in E&E, Mechanical, Others

40
Figure2. Abandon rate of Chinese patent applications (the same inventions have been
granted U.S. patent) through the period 1993-2008
Note: The total number of patent applications is 3450. The drop in applications after 2005 (648
applications) is due to right-truncation. The x-axis represents Chinese filing year.
0.2
.4.6
.8
1990 1995 2000 2005 2010Chinese_filing_year
% of abandonned Chinese patent applications
% of abandonned Chinese IP applications
% of abandonned Chinese UM applications
total number of Chinese patent applications divided by 1000
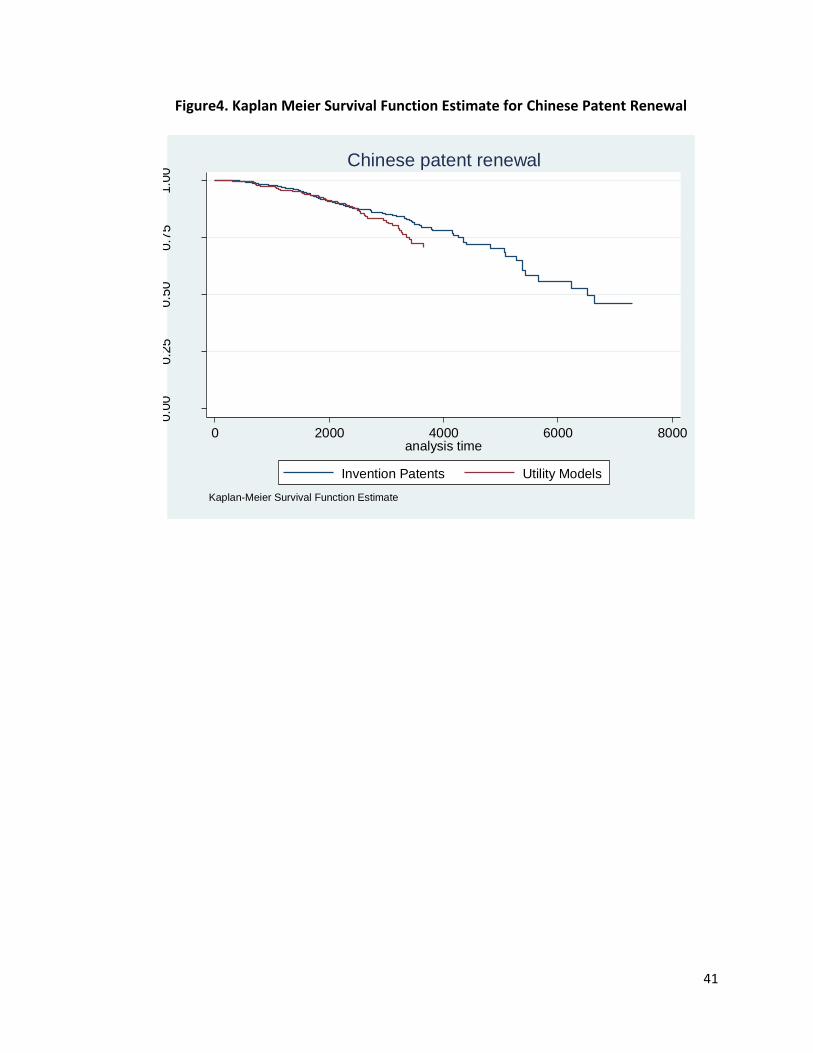
41
Figure4. Kaplan Meier Survival Function Estimate for Chinese Patent Renewal
0.0
00.2
50.5
00.7
51.0
0
0 2000 4000 6000 8000analysis time
Invention Patents Utility Models
Kaplan-Meier Survival Function Estimate
Chinese patent renewal

42
Figure5. Kaplan Meier Survival Function Estimate for U.S. Patent Renewal
0.0
00.2
50.5
00.7
51.0
0
0 2000 4000 6000 8000analysis time
Invention Patents Utility Models
Kaplan-Meier Survival Function Estimate
U.S. patent renewal

43
Figure6. Kaplan Meier Survival Function Estimate for Filing lag
0.0
00.2
50.5
00.7
51.0
0
0 200 400 600 800 1000analysis time
Invention Patents Utility Models
Kaplan-Meier Survival Function Estimate
Filing lag