farming-related livelihoods … livelihoods rehabilitation strategy for the disaster-affected areas...
TRANSCRIPT

FARMING-RELATED LIVELIHOODS
REHABILITATION STRATEGY
FOR THE DISASTER-AFFECTED AREAS OF
YOGYAKARTA AND CENTRAL JAVA PROVINCES
Eighteen-month strategy to restore and improve the farming-related livelihood activities of the earthquake- and eruption-
affected populations in Yogyakarta and Central Java Provinces
GOVERNMENT OF THE REPUBLIC OF INDONESIA MINISTRIES OF AGRICULTURE, MARINE AFFAIRS AND FISHERIES
AND FORESTRY
Supported by: Food and Agriculture Organization of the United Nations Jakarta, January 2007

ii
Foreword
An earthquake of 6.3 Richter scale that struck parts of Yogyakarta and Central Java provinces on May 27, 2006 impacted the livelihoods of thousands of people and depleted most of their livelihood assets.
Many people lost their family and relatives, and had to sell off their belongings in order to survive and physical facilities destructed. Agriculture is one of the livelihood sectors that suffered heavily. Further, it impacted farmers the most as
they depend on farming activities as the main resource of their livelihoods. Following the situation, the Ministry of Agriculture (MoA) requested the Food and Agriculture Organization of the United Nations (UN-FAO) to provide emergency assistance to carry out needs and damage assessment, support the most-affected farming families with agriculture inputs and prepare an eighteen month farming-related
livelihood rehabilitation and recovery strategy in the earthquake-affected areas in the two provinces. Following the request UN-FAO established a sub-office in Yogyakarta in June 2006 immediately and mobilized a team to develop the Agriculture Sector Plan in the UN Emergency Response Plan 2006 to seek international assistance and carry out a needs and damage assessment. This assessment was
complemented by a Rapid Livelihoods Assessment (RLA) and a more recent follow-up study. Based on these studies, FAO has supported the Government of Indonesia in developing a rehabilitation and recovery strategy to support the livelihoods of the farming families in the earthquake-affected areas.
This 18-month rehabilitation strategy, founded on the sustainable livelihoods approach and principles, is designed to address farming in an integrated manner as suited to a densely populated area with very small land holding size. The strategy has been developed in a participatory manner involving close collaboration with relevant government institutions and a wide range of other key stakeholders. A series
of consultations were held with the earthquake-affected farmers, women groups, academic institutions, local and international non-governmental organizations, and other humanitarian agencies both informally and in the form of a series of workshops in Yogyakarta, Semarang and Jakarta.
The rehabilitation strategy covers several cross-cutting issues across the region, and presents three main objectives:
1. Rehabilitation and improvement of farm production system
2. Rehabilitation and development of agri-business and income diversification 3. Support to the community and government-led institutions and policies to promote recovery,
rehabilitation and development
Keeping in view the utmost importance of agriculture in the livelihoods of thousands of farming families
in the earthquake-affected areas of Yogyakarta and Central Java provinces, it is our expectation that this strategy will be implemented in an integrated and effective way through generous support from the government, international community, the private sector, and other relevant institutions.
I would like to express my sincere appreciation to those involved in the development of this strategy for their untiring efforts and energy. My sincere thanks go to the district and provincial level authorities and institutions of Yogyakarta and Central Java provinces, UNFAO, non-governmental organizations, and the farming families to whom this strategy is dedicated to.
Jakarta, January 25, 2007 Director General of Food Crops Chairman of National Agriculture Disaster Committee
Ir.Sutarto Alimuso,MM

iii
Executive Summary This document represents the 18-month farming-related livelihood rehabilitation strategy developed jointly by the Ministries of Agriculture, Marine Affairs and Fisheries and Forestry in both Yogyakarta and Central Java provinces with the support from FAO in response to the recent disasters (earthquake and volcanic eruption) in these provinces. Farming-related livelihoods were badly affected, particularly amongst the most vulnerable socio-economic groups, and the effects are being felt across the wider rural economy. Unless farming activities are reinstated, this wider impact will worsen, and at the same time those most hit by the disasters will have little if any opportunity to regain their livelihoods. The strategy lays out the ways in which farming-related livelihoods of all those affected by the disasters can be both restored and further developed. The Government of Indonesia considers this to be a vital activity, especially as, to date, little technical or financial support has been forthcoming for rehabilitation of this sector. Farming is the primary livelihood activity of the majority of the rural poor, and in particular the landless, women and the aged. Rehabilitation of this sector will positively impact on the wider economy across the affected areas through providing employment, reducing dependency, rehabilitating farm related home-based industries and agri-businesses and boosting the value chain sectors linked to these (the market, services, transport etc). The principles and approach of sustainable livelihoods underlie this strategy, providing a means both to address farming in an integrated manner (as is suited to a densely populated area with very small land holdings) and to enable collaboration between and within the Government, I/NGOs, private sector and civil society bodies at all levels. The proposed strategy will promote gender mainstreaming to ensure that needs and priorities of men, women, elderly, youth and disabled people are adequately addressed. The strategy document briefly reviews the policy, institutional, socio-cultural, economic and agro-ecological context prior to the earthquake. It then provides a detailed but concise damage assessment and describes the planned rehabilitation interventions. Annexes include more detailed information on sustainable livelihoods, damage assessment, agro-ecological zones, budgets, and monitoring and evaluation checklists and indicators. The earthquake affected agricultural related home-based industries as well as on-farm production as there was extensive damage to people’s homes (up to 80% destruction in places) with concurrent damage to business facilities, stores and equipment therein. Indeed the extreme extent of damage to housing has had many negative impacts. As people were pre-occupied with re-building they no longer had time or resources to farm; traders no longer came to buy farm outputs as they too were re-building their homes. One hundred irrigation units were destroyed resulting in 5,000 hectares of agricultural land no longer receiving a water supply. Approximately IDR 25 billion (equivalent to $2,777,000) was lost in terms of crop yields after the earthquake and another IDR 50 billion ($5,500,000) will potentially be lost in 2007 if the irrigation facilities are not rehabilitated. Government and private-sector stores and processing units were damaged as well as home based enterprises, so there was less incentive for traders to buy farm products. More than 13,750 head of livestock were killed and 2,210 livestock shelters were destroyed. Total loss due to livestock death (poultry, large and small ruminants) was

iv
IDR 1.8 billion ($198,000) for Yogyakarta and IDR 967 million ($106,000) in Central Java. In Yogyakarta province, total loss due to livestock shelter damage was calculated to be around IDR 7 billion ($770,000), while in Central Java, it was IDR 4.5 billion ($495,000). The earthquake also caused potential further impacts on the livestock sector. These losses amount to around IDR 9.2 billion ($1,011,000) in Yogyakarta and IDR3.8 billion ($418,000) in Central Java for a period of six months. Livestock that were not killed or injured when their shelters collapsed were in many cases sold prematurely to cover re-building and daily living costs. The landless, who usually work as laborers or sharecroppers, were unable to get work. Aquaculture was impacted on both due to direct damage to fish ponds and due to drying up of ponds fed by damaged canals. Concrete lined fish ponds belonging to about 2,000 fish-farmers were seriously damaged. The fish stock in these ponds, with a total estimated value of IDR 15 billion ($1,648,000) were lost, or died either immediately or later due to stress. Many building facilities such as nurseries, fish auction sites, laboratories, fishery offices and extension services were badly damaged in Yogyakarta and in Central Java. The total loss due to physical damage in the Fishery sector was approximately IDR 2.0 billion ($220,000) in Central Java, while in Yogyakarta Province it was IDR l4 billion ($1,538,000). All types of forest (production, protected and community) were damaged as were terraces. The Forestry service estimates that 110 farmer groups were earthquake victims. It is estimated that farmer group management of about 3,386 ha production forest has either ceased or is severely restrained due to group members having reduced financial capital since the earthquake. Several kinds of processing units of estate commodity and Non Timber Forest product established in Yogyakarta province were damaged, 263 units in total were affected, with a financial loss predicted around IDR 521,980,000 ($54,000). Government infrastructure in general (agriculture, livestock, fisheries, forestry, extension buildings, stores, vehicles, processing units etc.) was extensively damaged as were private sector rice mills and agricultural stores and community markets. Two of the five agro-ecological zones in the area were affected worst – the irrigated, densely populated rural lowlands, and more remote, hilly dry lands. Beneficiary groups that were affected include the landless, sharecroppers, tenant farmers and land owner/operators. The goal of the strategy is to ensure that the farming-related livelihoods of all those affected by the 2006 disasters in Yogyakarta and Central Java provinces are rehabilitated, and, further, “built back better” in that they are both more sustainable and have greater resilience in the face of future potential disasters. The strategy has three objectives: (1) To rehabilitate farm production systems. This involves a range of sectoral activities, but, more critically, a number of cross-sectoral activities most suited to the restoration and improvement of integrated farming systems such as rice-fish-livestock, crop-livestock-forest and other combinations; (2) To rehabilitate and promote agri-business and income diversification; and (3) To support community and government led institutions and policies in promoting recovery, rehabilitation and development. Activities related to this third objective are fundamental to the successful implementation of the first two objectives and thus will be addressed in combination with objectives (1) and (2). Timelines for each activity are indicated in annexes. Within this third objective, there are three main components: (1) Institutional strengthening through capacity building and provision of appropriate instruments to

v
support institutional productive activities.based on mutual partnerships between the community and government, and other partners; (2), Strengthening and skills development amongst extension services through training on associated cross-cutting and technical topics relevant to staff, farmers groups and their member’s needs; and (3), Strengthening management information systems through re-activation of extension centres in order to raise community awareness regarding current and future multi-hazard risk management and to empower male, female and youth farmer groups’ economic activities. The document outlines a range of activities related to this third objective that will be undertaken alongside farm production, agri-business and income diversification rehabilitation and promotion with an aim to having better longer-term impacts on the overall livelihoods system of the population. The final part of the document outlines general implementation arrangements including how the Government, I/NGOs, the UN (for example FAO), the private sector and civil society partnerships and cooperation will operate, and how collaboration, communication and cooperation between different government Ministries and levels (provincial, district) will be enhanced. Mechanisms for monitoring and evaluation, and risks and constraints analysis are also covered at the end of the document.

vi
Table of Contents
Chapter 1. Introduction and Background ....................................... 1 1.1 The Earthquake and Merapi Eruption................................................................. 1 1.2 Policy and institutional context pre-earthquake.................................................. 3 1.3 Socio-cultural and economic context pre-earthquake......................................... 5 1.4 Agro-ecological Zones (AEZs)............................................................................ 6
Chapter 2. Assessment of damage to agriculture, fisheries and
forestry sectors ....................................................................... 9
2.1 Overview of damages .......................................................................................... 9 2.2 Methodology ...................................................................................................... 10 2.3 Food crops and horticulture ............................................................................... 11 2.4 Livestock............................................................................................................ 12 2.5 Fisheries/aquaculture ......................................................................................... 14 2.6 Forestry and estate crops.................................................................................... 15 2.7 Agricultural related home based industry .......................................................... 16 2.8 Implications of the disaster for peoples’ livelihoods in terms of changes in
livelihood assets ................................................................................................. 18
Chapter 3. Interventions for rehabilitation ................................... 21
3.1 Introduction........................................................................................................ 21 3.2 The Sustainable Livelihoods Framework and Guiding Principles for the
Rehabilitation Context ....................................................................................... 21 3.3 Goal, Objectives and Outputs, and how these relate to the guiding principles.. 23 3.4 Beneficiary groups and their needs.................................................................... 25 3.5 Activities related to Objective 1: The rehabilitation and improvement of
farm production systems. ................................................................................... 27 3.6 Activities related to Objective 2: The rehabilitation and development of agri-
business and income diversification .................................................................. 30 3.7 Activities related to Objective 3: Support to community and government led
institutions and policies to promote recovery, rehabilitation and development 33 3.8 Implementation arrangements............................................................................ 36 3.9 Risks and constraints.......................................................................................... 39 3.10 Monitoring and Evaluation ................................................................................ 40

vii
Annexes
Annex 1. Maps of Earthquake affected areas of Yogyakarta and Central Java............... 41 Annex 2. Vision, Mission and SWOT analysis of Agriculture Development .................. 43 Annex 3. The Characteristics of agro-ecological zones................................................... 45 Annex 4. Sustainable Livelihoods (pentagon) asset analysis according to AEZ.............. 47 Annex 5. Sustainable Livelihood Approach and Guiding Principles ............................... 49 Annex 6. Checklist of Key analytical questions to plan and implement Gender-
sensitive interventions.................................................................................... 53 Annex 7. Implementation Matrixes .................................................................................. 59 Annex 8. An example of integrated farming system activity ........................................... 63 Annex 9: Potentially useful topics in which government staff, and subsequently
farmer organisations, may benefit from capacity building and/or skills training in. .............................................................................................................................. 64
Annex 10: Comparative advantages of different implementing partners ......................... 65 Annex 11: Possible performance indicators for measuring the progress against the
target sets under the livelihood rehabilitation strategy under the three main objectives .................................................................................................................. 67
List of Tables
Table 1: Profile of Yogyakarta and Central Java province................................................. 5 Table 2: Brief Description of the Agro-Ecological Zones (AEZs) ..................................... 7 Table 3: Damage in the livestock sub-sector .................................................................... 13 Table 4: Damage and loss of fish ponds ........................................................................... 14 Table 5: Damage to estate crops (IDR) in Yogyakarta..................................................... 16
List of Figures and Boxes
Box 1: Integrated Livestock keeping for biogas and manure production........................... 4 Box 2: Integrated livestock keeping for processing of red sugar........................................ 4 Figure 1: Agro-ecological zones. ........................................................................................ 7 Box 3: Case study 1: Mr A. and Ms. R. ............................................................................ 20 Box 4: Case study 2: Mrs S............................................................................................... 20 Box 5: Guiding principle: linking the micro to the macro................................................ 24 Box 6: Guiding principles: Involve active participation of all stakeholders at various
levels through working in partnership ...................................................................... 25 Box 7: Guiding principle: Market-led rehabilitation ........................................................ 25 Figure 2: Schematic diagram of implementation arrangement ......................................... 39

viii
Acronyms
AEZs Agro-ecological Zones APBD-P Anggaran Pendapatan dan Belanja Daerah-Perubahan (Regional Budget of Income
and Expenses-Change) APBN Anggaran Pendapatan dan Belanja Nasional (National Budget of Income and
Expenses) ASG Agriculture Sector Group
BAKORNAS-
PB
Badan Koordinasi Nasional- Penanggulangan Bencana (Government of Indonesia National Coordinating Board for the Management of Disasters)
BAPPEDA Badan Perencanaan dan Pembangunan Daerah (Regional Bureau of Development and Planning)
BAPPENAS Badan Perencanaan dan Pembangunan Nasional (National Bureau of Development and Planning)
BPD Bank Pembangunan Daerah (Regional Development Bank) BPP Balai Penyuluh Pertanian (Agriculture Extension Office) BPTP Balai Pengkajian Teknologi Pertanian (Agriculture Technology Research Institute) DIY Daerah Istimewa Yogyakarta (Special Region of Yogyakarta) DM Dry Matter DPM-LUEP Dana Penguatan Modal melalui Lembaga Usaha Ekonomi Produktif (Institution for
Strengthening Capital Fund through Productive Economy) FAO Food and Agriculture Organization of the United Nations
GDP Gross Domestic Products
IASC Inter Agency Standing Committee
IDR Indonesian Rupiah
IFRC International Federation of Red Cross and Red Crescent I/NGOs International/Non Government Organizations
KADIN Kamar Dagang dan Industri (Industrial and Trade Chambers) LAKIP Laporan Akuntabilitas Kinerja Instansi Pemerintah (Report on Accountability and
Performance of Government Institutions) MoA Ministry of Agriculture
NTB Nusa Tenggara Barat
NTFP Non-Timber Forest Products
PMUK Penguatan Modal Usaha Kelompok (Strengthening Group Business’s Capital) RLA Rapid Livelihood Assessment SL Sustainable Livelihood
SLF Sustainable Livelihood Framework
SP3 Skim Pelayanan Pembiayaan Pertanian (Farming Financing Service Scheme) SPFS Special Program for Food Security
SWOT Strengthens, Weakness, Opportunities and Threats
TIC Technical Implementation Committee UN United Nations
UNDP United Nations Development Programme
UNOCHA United Nations Office for Coordination of Humanitarian Affairs UPT Unit Pelaksana Teknis (Technical Service Unit) VCO Virgin Coconut Oil
,
1
Chapter 1. Introduction and Background
1.1 The Earthquake and Merapi Eruption
On May 27th, an earthquake measuring 6.3 on the Richter Scale hit Yogyakarta and
Central Java Provinces. The epicentre was located approximately 37 km south of Yogyakarta. The most affected districts were Bantul of Yogyakarta and Klaten of Central Java, though other districts, such as Sleman, Gunungkidul and Kulonprogo of Yogyakarta, and Boyolali and Sukoharjo of Central Java, were also affected. As of the 7th
June 2006, approximately 6,000 people had been recorded dead and about 37,000 were injured. A total of 235,000 houses in Yogyakarta were confirmed to have been damaged as of 9th November 2006, while nearly 26,000 houses of Klaten District in Central Java had been completely destroyed. Maps of the affected areas are available in Annex 1 indicating numbers and locations of deaths and injuries. Merapi mountain (2968m), the most active volcano in Indonesia, erupted in May 2006, causing huge damage to the land and enclaves of the 30,000 peoples who live around the top and slopes of the volcano. Merapi mountain takes up parts of three districts in Central Java (Magelang, Klaten and Boyolali) and Sleman District in Yogyakarta Province. Active lava flows began in early May and on May 13th Indonesian authorities raised the alert status to the highest level, ordering the immediate evacuation of all residents on the mountain. There were several large eruptions, with flows of lava and hot cloud, from mid
June to mid July. These had an environmental impact on 10 sub districts (7 in Central Java, 3 in Yogyakarta) and more than 20 villages. 2 people died, 20,212 people (16,377 in central Java, 3,835 in Yogyakarta) were internally displaced. 1,500 ha protected forest was burned and damaged. The eruption damaged food and estate crops, horticulture, livestock and livestock feed, and negatively impacted water resources and water installations. Hundreds of hectares under horticultural cultivation were damaged leading to financial loss amongst farmers. Government and private-sector stores and processing units were also damaged as well as home-based enterprises, so there was less incentive for traders to buy farm products. National and international responses were rapid as a possible emergency situation was already anticipated in relation to the Merapi volcano eruption. The Government of Indonesia National Coordinating Board for the Management of Disaster (BAKORNAS
PB) along with provincial and district authorities took the lead in coordinating the disaster response. NGOs and the UN also responded rapidly, with the UN Inter Agency Standing Committee (IASC) applying the cluster approach in which each UN agency is a lead agency for one or more key response areas. A UN Emergency Response Plan was
drawn up for the first six months and sectors which received the greatest percentage of required funds were emergency shelter and water and sanitation. However, much of the required funding for all sectors could not be mobilized. Now, six months on, OCHA has handed over to the Government to conclude the transition to the recovery phase and establish new coordination arrangements under UNDP. Several clusters (water and sanitation, protection, and education) have closed, with ongoing needs being coordinated
2
by the relevant government bodies. Others including health, shelter, livelihoods and
related agriculture working group, continue to be coordinated through partnerships between UN lead agencies and their government counterparts. Compared to other sectors (shelter, education, health, etc), the agriculture sector received
less attention during the immediate recovery period. Having a limited budget, the Government focused more on the renovation of shelter and food aid as the first priority than renovating agricultural infrastructure. Few donors involved in the recovery program post-earthquake focused on the agricultural sector. FAO was the fist agency to assess the damage and needs in this sector followed by immediate provision of seed and fertilizer to more than 10 000 farming families through a Technical Cooperation Project (TCP) and the Special Programme for Food Secuirty (SPFS). The IFRC (International Federation of Red Cross)1 and four local NGOs also contributed to post-disaster agricultural recovery. At the request of the Government of Indonesia, FAO has assisted Yogyakarta and Central Java provinces in the development of this farming-related livelihood rehabilitation strategy through a sustainable livelihoods approach. During the recovery period, Yogyakarta government had been allocated IDR 174.756
billion (USD19.2 million). This budget came from efficiency and change of local budget (APBD-P). From that budget, IDR 3,275,000,000 (USD 359,890)2 was allocated to the agriculture sector and used to rehabilitate irrigation canals. The Agriculture department itself spent IDR 7 billion (USD 769,230) on fertilizer, seed, support to organic farming and procurement of livestock. In Central Java, the government distributed the following agriculture inputs: 540,575 kg paddy seed; 55 tonnes corn seeds; 5.8 tonnes soybean seeds; 543 tonnes NPK fertilizers; 5 tonnes groundnut seeds; 1 ton pesticide (Applaud 10 WP); 10 and 15.5 tonnes beef cattle and goat concentrate feed respectively; and 3
packages of veterinary aid3. FAO itself already distributed seed and fertilizers, to the total value of USD 255,010.98. In 2007, the Agriculture Department of Yogyakarta Province proposed to allocate IDR 57 billion for the rehabilitation of agriculture sector, however, the local authority only
agreed to support around IDR 17 billion, so the gap is IDR 40 billion (USD 4.39 million). The IDR 17 billion is being allocated to rehabilitate three main areas, namely: unemployment, poverty and poor rural areas. In Central Java Province, however, for 2007 the local authority agreed to support IDR 75,450,000 (USD 8,291) to renovate one unit of
irrigation canal, subsidize organic and NPK fertilizers, 3,000 fruits seeds, 2 packages of crop field seeds and 10,000 improved grass seeds, from the total IDR 43.436 billion (USD 4/773 million) needed to rehabilitate agriculture sector from the earthquake, so there is a gap around IDR 43.361 billion (USD 4.76 million) to be filled in by donors or other organizations.
1 OCHA 2 BAPPEDA DIY, Respond on the livelihood sources in Yogyakarta Province for May – December 2006 3 Secondary data from Agriculture and Food Security Department-Central Java, 2006

3
1.2 Policy and institutional context pre-earthquake
The Government of Indonesia has implemented a decentralization process through two constitutional amendments, one in 1999 and the second in 2004. Decentralization came into effect in 2004, giving district level governments as wide an autonomy as possible on district management. Districts have been given the responsibility to pursue clean and
authoritative government, free from collusion, corruption and nepotism. Central and provincial government meanwhile acts as the facilitator, motivator, and catalyst of district level plans and activities. At the same time as implementing decentralization, the Government of Indonesia placed more emphasis on the active participation of the private
sector and civil society in planning, organizing, control, as well as financing development. Under Indonesia’s decentralization policy based on two constitutional amendments of 1999 and 2004, the central government has authority to formulate standards, policies, and norms of development programmes. The district government follows these up by creating implementation guidelines (Petunjuk Pelaksanaan, JUKLAK). The district government conducts all development programs which are necessary for their own district’s needs with the support of central and provincial government facilities. At provincial and district levels, BAPPEDA is responsible for planning coordination of the activities of different sectors, with the former holding regular meetings to this end. BAPPEDA reports the outcomes of these regular meetings to BAPPENAS at national level, and every sector passes on the information to their sub-offices for implementing
programs. At district level BAPPEDA is responsible for communicating with the head of the district (Bupati), other government institutions and district level legislative bodies. All planned programs are referred to constitutional amendment No. 25, 2005 about National Development Planning. This policy regulates the Long-Term Development Planning of Government (20 – 25 years); the Medium-Term Development Planning of Government (5 years); as well as the Government Work Planning (1 year). The policy includes program and activity’s vision, mission, policies, and strategy.
Policies that the Agriculture Department are actively pursuing include poverty alleviation; decreasing the unemployment rate through expanding job opportunities in the farming sector; giving special attention to relatively remote rural areas e.g. Kulon Progo and Gunung Kidul, and anticipating some strategic issues such as gender, and zoonocist
disease growth such as anthrax and avian flu. In addition, it is recognized that one of the farming problems is movement out of farming to other sectors (particularly by the youth) due to difficulty in generating sufficient profit from agriculture. The majority of farmers have only a small piece of land, moreover many farmers are landless. In order to address
this problem, the Agriculture department is promoting the production of prospective high value commodities such as onions; working towards added value for farmers by promoting agribusinesses, diversification, and agricultural product processing; promoting integrated farming systems; and providing capacity building for farmers to assist their move from subsistence to commercial farming. Examples of integrated farming systems

4
Another type of added value pilot project is integrated livestock keeping for red sugar producers. The agriculture office in Kulonprogo District introduces the soft credit for livestock and bio-digesters to the red sugar producer. They provide credit of 5 cattle and one unit bio-digester to the red-sugar producer. Beneficiaries obtain biogas through the bio-digester and utilize it as the bio-fuel for processing the red sugar. Instead of wood, biogas could be used as fuel in sugar processing. The beneficiaries could also produce manure as side
product of bio-digester and sell it to the other users; or could obtain the added value from alternative bio-fuel, selling manure, and selling livestock.
and improved added value from the agriculture sector that have been realized by the
government (Agriculture Department, Yogyakarta) are presented below:
Box 1: Integrated Livestock keeping for biogas and manure production
Box 2: Integrated livestock keeping for processing of red sugar
With regard to the rehabilitation of farming related livelihood activities, the Government of Indonesia (in particular, the Agriculture Department) is responsible for any policy related to cooperatives and micro-finance. The Agriculture Department is pursuing the following programmes:
1. DPM LUEP (The Strengthening Capital Fund through Productive Economy Work Institution) In this program, the Government provides funds in order to supplement the purchase price of farmers’ unhulled paddy/rice as the unhulled paddy price is lower than government’s purchase price, mainly at harvest time.
2. PMUK (Strengthening Group Business’s Capital). In this program, the government provides some funding directly to farmer groups’ bank accounts. The amount transferred depends on the proposals submitted by the farmer groups, both women and men. Groups are assisted while preparing these proposals by
Extension Workers, NGOs, and Universities. The funds are provided as a revolving fund. Once the fund is transferred to a farmer group’s bank account, the group itself manages the revolving system through a micro-finance institution they have formed themselves.
The Provincial Agriculture Office of Yogyakarta introduced integrated livestock keeping pilot projects to 50 farmer and young farmer groups in Bantul and Gunungkidul Districts in December 2006. The two main goals of the projects are to obtain some integrated added value by selling livestock manure and using biogas for cooking, and to replenish the degraded soil fertility by using the manure. Soft credit is provided in kind and cash to the farmer groups as beneficiaries for purchasing livestock and bio-digesters. Through the bio-digester, the beneficiaries produce biogas from the dung for their daily cooking or other purposes and use sludge for manure. To obtain added value, they introduce 10 kg packaging of manure. The beneficiaries sell the manure to other farmers groups as a new agribusiness. Since the bio-digester is a new technology, they encourage young farmer groups having better education levels to handle this processing technology.

5
3. The Farming Division of the Directorate General of Food Crops in the Ministry of
Agriculture has a section that handles farming financing named Pusat Pembiayaan Pertanian (the Farming Financing Centre), it provides a Farming Financing
Service Scheme (SP3). This program is a collaborative program between five government banks (Bank Mandiri, Bank Syariah Mandiri, BPD, NTB, and BPD
Jatim) as executor banks. The special advantage of this program is the interest rate which is 2-3% lower than commercial interest rate for credit. In addition, there is no charge for provision and administrative costs and there is flexibility in payment method, based on farmers capabilities. This scheme is mainly directed to provision of investment and working capital for agricultural micro-businesses
The vision and SWOT analysis of the Yogyakarta Agriculture Department is available in Annex 2 and this strategy has been developed with that in mind.
1.3 Socio-cultural and economic context pre-earthquake
Yogyakarta and its neighboring province of Central Java share a similar culture. In both, the Javanese ethnic group makes up the majority of the population. Islam is the dominant religion. The households typically consist of parents and two children. Sometimes, grandparents may live in the same house. Male headed households are dominant – the existence of female-headed households is due to either divorce or to the death of the
husband The population density in Yogyakarta Province is around 1,018.04 per km2 with a growth rate of less than 1%, while in Central Java, it was 959 per km2 and 0.9% respectively. Table 1 below provides basic information about the two provinces.
Table 1: Profile of Yogyakarta and Central Java province4
Items Yogyakarta province Central Java province
1. Land area 3,133.15 km2 32,799.71 km2
2. Population per year of 2005 3,181,200 33,.064,400
3. Regional GDP per year of 2004 Rp 21,848,682.1 million Rp. 175,584,778.8 million
4. Inflation rate per year of 2005 14.98% 15.97% Being densely populated rural areas, the amount of land available per household is very low as compared to farming households in Sumatra, with most households having access to less than 0.5 ha of agricultural land5. Consequently, many households in the two provinces, if they have the resources, pursue a diversity of livelihood activities including agriculture, services (restaurants, sales of snacks, transport etc.), trading, agri-business, and manufacturing (for instance leather, ceramics, wood carvings and furniture, silver work etc.) in small and medium term enterprises. Nevertheless, the majority (47.2%)6 of people depend largely on agriculture for their livelihood.
4 Biro Pusat statistic, 2006 5 Badan Perencanaan Daerah DIY, 2006 6 LAKIP APBN DIY 2005

6
Despite the diversity of livelihood activities, poverty levels are high, standing, in 2004, at
19% in Yogyakarta and 21% in Central Java7. Rural poverty is higher than urban, being recorded (in the same year across the two provinces) at 25%8. Unemployment is also high, being approximately 30% in Yogyakarta Province and 6.14% in Central Java. These two factors are connected: rapid urban growth has instigated rural to urban
migration, with the relatively unskilled and un-educated being least able to respond to new employment opportunities and thus remaining in the rural areas. These are primarily women, the landless, and the older farmers. Out-migration from agriculture is such that over the last 10 ten years, the number of people working in agriculture (especially in food and horticultural production) in Yogyakarta Province has decreased by around 9.32%9 whilst the numbers in other employment such as labor, industry, services and casual work, have increased. Urban growth in both provinces has involved changes in land use, with property and business development taking up increasing areas of fertile arable land. In Central Java province, which is becoming an industrial centre, change in land use from agriculture land to industry and housing complexes is around 2-3% annually, while in Yogyakarta province it is 0.4% per year. These rapid changes impact particularly on the most vulnerable. These include women, the aged, and those with limited skills and education who rely either completely, or to a very large extent, on farming for their
livelihoods. Reduced availability of land and employment impacts negatively on the livelihoods of such stakeholders and further increases their vulnerability. Despite the above, since last century people of Yogyakarta, in particular, have been known for their high social capital, which exhibits itself in the abundance of active farmers and other user groups, cooperatives and associations, and in the still strong tradition of communal self help known as such as gotong royong.10
1.4 Agro-ecological Zones (AEZs)
The Earthquake affected area represents different agro-ecological zones11, each with more or less similar environments and livelihood strategies (see Figure 1 below). A common feature between AEZs is that farm sizes in general are small, with farming representing the primary, but not sole, source of income (see Annex 3 for a detailed
description of each AEZ). Across the AEZs, however, the sources of livelihoods within farming are diversified as follows:
7 Biro Pusat statistik, 2006 8 Regional Development and Poverty Reduction Program in Yogyakarta Special Region”, Bambang S.Priyohadi –DIY
regional secretary, 2004 9 LAKIP APBN DIY, 2005 10 Working together within and by the community themselves in order to achieve a common interest. 11 A number of different sources were used to identify AEZs for the RLA (see map in Annex D). These sources were as follows: AEZ map from the Agriculture Technology Research Institute (Balai Pengkajian Teknologi Pertanian - BPTP);Poverty map (UN) ;Relief, topography, altitude maps.

7
Table 2: Brief Description of the Agro-Ecological Zones (AEZs)
AEZs Specific Features
AEZ1
represents upland forest, with seasonal crops of upland rice, maize, and tree crops such as wood, bamboo, coffee, coconut, cacao, traditional medicines, fruit, and under covers such as yams, ginger and various rizhoma crops.
AEZ2 Irrigated lowland agriculture, on basically flat lands with mostly fertile clay textured soils. Paddy rice is the dominant crop, but with a multiple cropping
pattern in three growing seasons.
AEZ3 Basically rain fed and upland areas with infertile soils. Cropping is characterized by rainfed farming mainly on terraces.
AEZ4 This zone is on the lower slopes of Mt Merapi, with well-irrigated agriculture. Paddy rice is a dominant crop.
AEZ5 The forest highlands constitute the upper slopes of Mt Merapi, with horticulture and high altitude vegetables are common.
Figure 1: Agro-ecological zones.
Yogyakarta
Bantul
Kulon Progo
Gunung Kidul
Merapi volcano
Klaten
Boyolali Magelang
Sleman
8
Due to the climatic and topographic features, all AEZs are regularly exposed to dry
spells, and sometimes drought periods during the dry season, while AEZ 4 and 5 also face large scale erosion and landslides in the rainy season. Across all AEZs landless men and women are the most vulnerable. The AEZs most seriously damaged by the earthquake are located in AEZ 2, while the most vulnerable and poor socio-economic
groups overall are concentrated in AEZ 3.

9
Chapter 2. Assessment of damage to agriculture, fisheries and forestry sectors
2.1 Overview of damages
The disaster caused very serious damage to houses and public facilities in the very densely populated areas. 81% of peoples’ homes were totally or severely damaged in the two provinces of Yogyakarta and Central Java, indicating the huge impact the earthquake
had on peoples’ lives. However, since the agriculture land and the standing crops suffered less directly visible damages, it was presumed that the agriculture sector was not seriously affected leading to less national and international attention. However, it has to be noted that damage in the agriculture sector should not be interpreted as having a single or simple impact. Rather there are multiple negative damages and impacts on not only the crops but also the people’s livelihoods and their institutions. The affected farmers could fall into a poverty trap with such multiple effects. In cases where they are rebuilding the houses with their own capital, they have no remaining capital to re-start their on- and off-
farm productive activities so as to cover their living costs. Based on the FAO Special Programme for Food Security (SPFS) damage assessment, an estimated 200,000 farmer households were left with little or no capital to purchase farm inputs (i.e. seeds, fertilizer and tools) to resume their farming livelihoods.
Damage to physical infrastructure, like irrigation canals, pumps, rice mills, fish ponds, tools and equipment, etc. could be easily observed. Certainly these production facilities are key elements for the resumption of the affected farmers’ livelihoods. Besides the damages to facilities related to on-farm activities, agriculture-based home industry was also largely affected as many residential houses were collapsed. With no resources left either on or off farm to generate an income, these farming households are particularly
vulnerable.
Regarding the agriculture sector, the most seriously earthquake damaged areas are
AEZ2A, AEZ2B, and AEZ3, whilst the Merapi eruption caused agriculture sectors damage in AEZ4 and AEZ5. In the food crops sub-sector, the affected farm households either harvested their crops late or they had to leave the crops in the fields since they had to focus on house reconstruction. The standing food crops and vegetables losses were significant (from 50 to 100 percent), especially vegetables in AEZ4.
The farmers also sold off their livestock to cover their other living expenses, school fees or even rebuilding their houses. The livestock prices decreased up to 50% compared to the normal price as so many sales took place at the same time.
The earthquake seriously damaged concrete and permanent fish ponds both in Bantul and Klaten districts. The irrigation canal damages in the affected areas also increased social conflict on water use between the farmers who practiced aquaculture and those who did
not.
In the forestry sector, Protected Forest in AEZ4 was severely damaged whilst there was
also some degree of terrace destruction that caused reduction of food crops area in the community forests of AEZ3.

10
Input and output market facilities in some areas were totally destroyed leading to more
difficulties for the farming households in accessing agricultural inputs and selling their products. The damage to markets affected trading, especially for local women traders in selling their agriculture and home industry products for their daily income due to lack of a permanent place for trading.
The roles of community groups, including farmers groups, are very crucial in the affected
areas in many aspects of their life. After the earthquake, people remained traumatized and the activity of community groups has been negatively disrupted by this situation. Besides the people and their institutions, the activities of government staff with their clients, including community or farmer groups, have been limited due to the destruction of their offices and damage to other support service infrastructures.
2.2 Methodology
The farming-related livelihood rehabilitation strategy was planned and developed mainly on the basis of the results of damage assessments done by several institutions, such as Government of Indonesia, FAO and the Institutes of Higher Education during the period
shortly after the earthquake. The main damage assessment approach of the government was related to agriculture, food crops, livestock, fisheries, forestry, and agriculture institutions. Agriculture sector damage information was collected and reported by the field extension agents to the district agriculture office. The district offices then submitted their reports to the provincial agricultural offices, which published the final official figures.
The SPFS conducted the first damage assessment for FAO in the middle of June 2006. They focused to a larger extent on gathering quantitative data on damages on physical assets, such as destroyed irrigation facilities and canals, number of dead livestock and poultry, number of damaged animal shelters, destroyed fish ponds and so on. This
damage assessment was done in 233 affected villages of 41 sub-districts and nine districts of Yogyakarta and Central Java provinces together with some field extension agents of these areas.
In order to develop the rehabilitation strategy of the agriculture sector and farming livelihoods using the Sustainable Livelihood Approach (SLA)12, a Rapid Livelihood Assessment (RLA) was carried out by Agriculture Sector Group members13 with FAO as
the lead agency in late July – early August. The overall purpose of this assessment was to assess the qualitative effects of the earthquake and Merapi eruption on the households. The broad methodology and sequence of events was as follows: (1) identification of AEZs; (2) identification of sample villages within AEZs; (3) development, fine-tuning
and field testing of the checklist that was prepared by the FAO team together with the government and agriculture sector group; (4) identification of team members and logistics; (5) implementation of survey through Focus Groups Discussion and semi-structured interviews with two types of individual households, i.e., well-off and poor households in each location, and (6) collection and analysis of data. This RLA covered 35 villages of 35 sub-districts of Bantul, Sleman, Klaten, Boyolali and Magelang Districts.
12 Further referred to in section 3.1 and 3.2 and Annex 5 13 I/NGOs working in agriculture rehabilitation in the affected areas

11
To achieve a more comprehensive understanding of, and up date on, the situation post-
disaster, the FAO National Team returned to the same locations in November 2006 to conduct a follow-up study. This involved both qualitative Focus Group Discussions, and the use of a questionnaire with four different affected groups: (i) farm owners and operators; (ii) sharecroppers, (iii) land renters, and (iv) the landless or laborers. In each
village, one representative from each of the four above-mentioned categories was interviewed. A series of case studies of the most vulnerable households in both the earthquake and Merapi eruption affected areas was also undertaken during the RLA in August, and in December when those affected families by the earthquake were re-visited. Some of these case studies were compiled and presented in different workshops in Yogyakarta and Jakarta to relevant stakeholders. The RLA, follow-up study and accompanying case studies are available in the FAO report14.
2.3 Food crops and horticulture
The usual cropping system followed by farmers involves growing paddy as a staple food for as long as possible and growing field crops for the second crop. Some also grow vegetables or industrial crops (e.g. tobacco, sugar cane) and others pursue agri-business. Section 1.4 provides details on the nature of cropping in the various AEZs in the affected areas.
The affected lowland areas in Yogyakarta and Central Java, are mostly (70%) under irrigation whether it be classed as technical, semi-technical or simple. The areas have a 200 – 300 % Cropping Index (i.e. 2-3 growing seasons in a year), consisting of sequential cropping paddy –paddy – paddy or paddy – paddy – field crops with some
areas having just two seasons of paddy-field crops only. The infrastructure of the Agriculture Service of the Government of Indonesia in the two provinces suffered major damages during the earthquake. This has severely affected the
Government’s ability to adequately cover the needs of the affected population. Agriculture and extension offices, laboratories, seed processing units and vehicles were severely damaged, with a total value of IDR 4l billions ($4,505,500) in Yogyakarta.
The earthquake also destroyed nearly all the related government facilities, and agricultural tools including hoes, sickles, threshers, water pumps, hand-sprayers and hand- tractors. In addition, small agricultural related businesses like rice-mills and agricultural stores were also badly damaged, further worsening the farmers’ situation. Damage to the irrigation system resulted in poor irrigation water supply for the dry season, which, in 2006, was exceptionally prolonged. Moreover potential flooding is likely to negatively influence agriculture lands during the subsequent rainy season. During the six months after the earthquake, lack of irrigation to the 5,000ha where canals
14 An assessment of people’s livelihoods in Yogyakarta and Central Java Provinces pre- and post-disaster, (FAO, January 2007)

12
were damaged led to crop failure. As a direct consequence, there were no job
opportunities for the field-laborers (landless men and women) leading to the loss of IDR l5 billion ($1,648,000) potential income. The other stakeholders affected by the earthquake are the middlemen who normally buy
the crops from the fields and sell to the market. Because nothing could be harvested from the 5,000 ha area, the middlemen who were not busy rebuilding their own homes had either to go to other regions to continue their business or seek other works. Those who were rebuilding were forced to re-direct the funds they would normally have used for trading. Livelihood analysis (see Annex 4 for details) revealed that farmers not only lost their assets, but were also badly traumatized by the disaster and its after effects. Farmer groups ceased their activities and even had no idea concerning recovery of their farming activities or sourcing the necessary capital to pursue rehabilitation of their cropping activities.
2.4 Livestock
Livestock keeping is closely linked with poor people in rural areas where they allow for the conversion of low-quality resources such as rice straw to high quality protein, frequently associated with crop production, mainly because of its buffer function for crop
failure and crop surpluses and as a provider of manure, they are a key livelihood source for landless farmers. The numbers of livestock owned by farmers are usually small, namely 3-5 head of small ruminants and 1-3 head of cattle per family. In recent years, farmers have tended to keep their livestock under full confinement systems, i.e., they keep livestock all day in the shelters. Sometimes if there is time available, livestock are
allowed to graze for 2-4 hours a day in communal grazing areas, such as football fields, roadsides or fallow lands. Farmers manage poultry (broiler and layer) and quail in intensive systems with 5,000-10,000 poultry per farm and it is supported by well built and equipped poultry housing. On the other hand, native chickens are kept in much
smaller numbers, with usually around twenty head per farmer, with simple housing supported by a small resting/exercise area. The earthquake damaged livestock infrastructure, such as poultry, cattle and small ruminants’ shelters both in Yogyakarta and Central Java Provinces, and caused potential further impacts on the livestock sector in terms of the failure of egg production and loss of body weight in young cattle, goats and sheep due to stress, as shown in Table 3.

13
Table 3: Damage in the livestock sub-sector
Yogyakarta Central Java
Types of damages Unit Loss (IDR) Unit Loss (IDR)
Housing damages (unit):
Poultry 51 1,508,000,000 130 519,850,000
Ruminants 2159 5,329,900,000 2219 3,833,200,000
Livestock dead (head):
Poultry 17,000 25,000,000 171,575 844,130,000
Ruminants 351 1,810,500,000 36 122,950,000
Potential loss:
Egg and meat productions 221,680,000 1,053,660,000
Calves and kid/lambs crop 9,000,000,000 2,760,000,000
Feed resources:
- Rice straw (ton DM) 11,440 5,187
- Groundnut straw (ton DM) 9,360 4,244
- Corn straw (ton DM) 8,320 3,772
Source: SPFS 2006.
Based on the AEZ classification outlined in section 1.4, farmers who lost most of their physical livestock assets (such as shelter) lived in AEZs 2a and 3, where loss was as high as 78% (see Annex 4). Land owners and those renting land suffered the highest loss, (at least 80%), while loss of physical assets amongst the landless and share croppers was
around 68.3% and 59.2% respectively. The highest losses of physical assets were experienced by poultry farmers (either chicken, quail or duck farmers), where loss was almost 100%.15
Apart from shelter, livestock infrastructures/buildings owned by government were also
disrupted. At least 40 livestock facilities infrastructures were damaged with a total loss worth IDR 15 billion ($1,650,000). They included livestock and poultry slaughter houses, animal health stations, an artificial insemination unit, and the BPP (Agriculture Extension Office) for animal husbandry and poultry shop.
Livestock plays a vital role as security assets to help people overcome and rebuild their live after earthquake. Since animal shelter was damaged and farmers urgently needed cash after the disaster, many farmers had to sell their animals, as presented in Annex 4.
Landless farmers were the most vulnerable group; on average 78% of landless farmers sold their livestock and the number of livestock being sold was 43% from the total population. The highest rate of livestock sales was in AEZ2a where around 39% of livestock were sold (see Annex 4).
15 RLA survey FAO-ASG, 2006

14
2.5 Fisheries/aquaculture
There are two kinds of fishing activities done by farmers in Yogyakarta, namely neutral (fresh) water fish culture (97.5 %) and the rest with salty water near the coastal areas. The fresh water culture is mostly under pond-culture (83.80%) with the remaining under paddy-fish culture (l4.9%), and cage-culture and floating net. In terms of production,
pond-culture contributes to 92.l % of the overall production. In Klaten district (Central Java), there is no coastal area, all fish culture is under fresh water culture and mostly under the pond-culture.
Concrete lined fish ponds belonging to about 2,000 fish-farmers were seriously damaged (Table 4). The fish stock in these ponds, with a total estimated value of IDR 13 billion (USD 1,445,000) were lost or died either immediately or later due to stress and less care. Further ponds were affected due to drying up of their water supplies from irrigation canals that were damaged or destroyed by the earthquake. Consequently the established markets and fish bidding systems in the fish production centers also collapsed after the earthquake and the middlemen moved away to other fish production centers, not just because of damage to the fish auction houses but also because there were no fish left to trade.
Table 4: Damage and loss of fish ponds
Provinces/Districts Numbers of ponds
damage
Total Loss (thousand IDR)
Yogyakarta:
Bantul Kota Yogya Kulon Progo Sleman Gunungkidul Central Java: Klaten
1083 50 122 190 45 500
8,336,000 490,000 650,000 1,300,000 1,050,000
901,000
Total 1,980 12,727,000 Source: Dept. of Fishery, Yogyakarta and Central-Java, Klaten, 2006.
Unfortunately, the water supply was not just for ponds, but also for the paddy fields. This meant that the fish-farmers lost two opportunities, one for fish culture and the other for
rice growing in the fields as water supply was vital to both activities. Statistically, the loss of fish production due to the earthquake has not significantly impacted on the total production in the provinces, nevertheless it has caused over 2,000 farmers to lose their assets.
Many building facilities such as nurseries, fish auction sites, laboratories, fishery offices
and extension services were badly damaged in Yogyakarta and in Central Java .The total loss due to physical damages in the fisheries sector was approximately IDR 2.0 billion

15
(USD 220,000) in Central Java, while in Yogyakarta it was about IDR l4 billion (USD
1,538,000).16
2.6 Forestry and estate crops
2.6.1. Forest and estate damage caused by the Earthquake
Forestry activities in the earthquake affected area included Production Forest and Community Forest. Production Forest involves collaboration between the Forest Department and farmer groups – the former producing timber and the latter practicing intercropping within the Production Forest. Community forest is the growing of trees on
private land by farmers, often through agro-forestry practices, rather than woodlots.
Production Forest in Yogyakarta is located in Gunung Kidul district (12.208,48 ha) and in Bantul District (1.041,2 ha). This forest area is managed by more than 150 Forest
Farmer Groups. The Forestry service estimates that, of these, 110 farmer groups are earthquake victims. It is estimated that farmer group management of about 3,386.4 ha production forest has either ceased or severely restrained for two capital reasons. First, some group members were giving priority to repairing or rebuilding their homes, so they have not been able to contribute their time as much as before to the forestry related activities. Second, most of them are now lacking the capital to purchase inputs for intercropping production. The Production Forest in Bantul district lies in Imogiri sub district – an area greatly affected by the earthquake – so almost all of the farmer group members around that area are victims. In addition, farmers in Production Forest land in the southern part of Gunung Kidul were similarly affected by the earthquake. With regard to Community Forest, the earthquake completely destroyed a small area in Sleman District around Sengir and Prambanan and there was some degree of terrace
destruction in community forests in Girimulyo, Panggang and Gunung Kidul districts. In addition to initial damage, community members, in AEZ2 particularly, have in some cases had to cut coconut trees and bamboo prematurely to use for building temporary shelter, which caused over cutting of forests (higher than usual) and thereby impacting
negatively on both the forest itself and future productive activities. Several kinds of processing unit of estate commodity and Non Timber Forest product (NTFP) established in Yogyakarta province were damaged as presented in Table 5. As a consequence of this damage, several processing units stopped functioning. In relation to
this, at the time of the earthquake, tobacco (an estate crop) was ready to harvest. Unfortunately, even where farmers had time to harvest their tobacco, they could not sell it because the traders did not buy their tobacco as a) the processing units were damaged and b) the traders themselves were in some cases traumatized and needed to focus on rebuilding their own homes damaged by the earthquake. Consequently, the tobacco price
16 Marine and Fishery Department, Central Java Province Progress Report 2006 & Marine and Fishery Department Yogyakarta Progress Report 2006

16
became very low, and some farmers in Central Java just abandoned their tobacco in the
fields as they were not very confident of fetching good prices.
Table 5: Damage to estate crops (IDR) in Yogyakarta
No. Component Amount District Price/unit (IDR)
Total (IDR)
1 Tobaccos Oven 21 Bantul (14) Sleman (7)
15,000,000 315,000,000
2 Tobacco processing unit 7 Sleman NA NA
2 Tobacco Stove 21 Bantul (14) Sleman (7)
5,000 105,000
3 VCO processing unit 15 Bantul 7,500,000 112,500,000
4 Natadecoco processing unit 2 Bantul 5,000,000 10,000,000
5 Coconut husk processing unit 2 Bantul 10,000,000 20,000,000
6 NTFP processing unit 5 Bantul 5,000,000 25,000,000
7 Kacip 125 Bantul 75000 9,375,000
8 Cacao processing unit 3 G Kidul 10,000,000 30,000,000
Total 521,980,000
Source: Forestry and Crops Department, Yogyakarta Province, 2006
2.6.2. Forest damage caused by Merapi Eruption
Merapi mountain (2968m), the most active volcano in Indonesia, erupted during May-June 2006, spraying out lava and ash. It caused huge damage to the land and enclaves of
30,000 people who lived in more than 20 villages on the top and slopes. Several protected forest areas were damaged and burnt. In Yogyakarta province the forest burnt by Merapi eruption was about 150 ha17. In Central Java, about 1,246 hectares from a total of 2,307 ha protected forest was burnt in Klaten and Boyolali.18 In Community Forests the
communities normally grow the tree species that produce wood or fruits in combination with some field crops, non timber forest products (NTFPs) and cattle feed. Approximately 130 ha19 community forest in Sleman District, Yogyakarta was burnt by ash. This damage could have further potential negative impacts on the environment, including the hydrological system around/under forest areas, and could precipitate drought (in the dry season), and cause extensive erosion and/or landslides (in the rainy season).
2.7 Agricultural related home based industry
In Java, small and medium enterprises have historically been main players in domestic economic activities, in particular as large providers of employment opportunities and
17 Forest and estate service of Yogyakarta province, PIKIRAN RAKYAT (daily) reported in june 22, 2006: more than 600 ha forest burned in Sleman, Yogyakarta. 18 SUARA MERDEKA, Saturday, 17th June 2006. value loss predicted about Rp. 6 billion. 19 Forestry service of Sleman District, Yogyakarta

17
hence generating a primary or secondary source of income for many households,
especially the rural poor.20 Agriculture related home based industries are usually operated by women either as primary or secondary income resources for family. In general, most of these women have
low education levels (primary school), limited skills and minimal information on, and access to, resources such as credit and the market. Though most banks nowadays emphasize the development of small and medium enterprises, agricultural-related home based industry is not yet given high priority as most farmers are seen as having little capital and inadequate collateral. Furthermore their prospective business units are seen as too small in term of income, working capital and number of workers (less than 10 persons). They are often seen as a high-risk category by most banks. Some of the products of agricultural related home industry are banana chips, tomato sauce, fried red onion, tempe (soybean), crackers of various kinds (cassava, animal skins,, peanut, chicken wings, etc.), roasted and fried fish and meat, and food for sale on the street and in restaurants. Home based food processing and packaging is not as complicated as the industrial food industry, as it does not require high technology and
machinery. Consequently, processed agriculture-related products are usually packaged in plastic or brown paper which is not attractive to most consumers. Moreover, as the majority of farmers cannot allocate additional budget for marketing and promotion, majority of the consumers are not much aware of the existence of these products in the market. Hence, the local farmers experience a relatively small proportion of the market share. Furthermore, the processed food is sold in local/traditional markets at low prices compared to similar foods being sold in supermarkets.
The proportion of agriculture related enterprises in Yogyakarta province is 22% whilst in Central Java it is approximately 13.2%,21 with other enterprises including handicraft, wood carving, silver smithy and ceramics. The earthquake damaged 2,076 of these home based industries and small enterprises – including agriculture home based industry, which employed 23,029 people with total loss of IDR 83,232,927,000 ($9,145,000). All of these
damaged small and medium enterprises were located in the affected area, particularly in Bantul, Kulonprogo, Gunung Kidul, Sleman districts and Yogyakarta itself.22 In addition to people’s homes, the earthquake also damaged equipment, machinery and
stores. Due to these damages the affected households lost their income from their agriculture-based home industry. Any funds they had were invested to rebuild their houses and ensure a daily food supply for their families. Hence, it was difficult for them to buy raw materials or repair their equipment to restart their home business.
20 The Likely Economic Impact from Yogyakarta and Central java Earthquake, Tulus Tambunan, KADIN Indonesia – Jetro, 2006 21 Daftar Kerusakan dan Perkiraan Nilai Rehabilitasi Industri Skala kecil dan Menengah per 8 Juni 2006, Bappenas 22 Earthquake and its implication to SME, Department of Trade and Industry – Yogya, July 2006

18
2.8 Implications of the disaster for peoples’ livelihoods in terms of
changes in livelihood assets
There are three types of farmer group with different memberships and main activities in the affected areas. Farmer groups consisting of male household heads focus on crop production management as their main activity. Women farmer groups focus on post-
harvest and food processing activities as well as on and off farm activities as their main occupation. Meanwhile, young farmer groups are the focus of training provided by the extension services due to their educational status and active involvement in marketing activities. Based on the FAO Rapid Livelihood Assessment23, the small land ownership,
limited access to market and finance institutions, weak bargaining position, reduced access to information, and limited human resources capability were the main problems faced by farmer groups and their members. For handling these problems, each type of farmer group (i.e. men, women and the youth) have characteristics and needs that need to be accommodated equally to improve their capacity and strengthen their roles in rehabilitation. The application of livelihood analysis24 within the damage assessment has helped reveal how the disasters have impacted on the range of assets people had. In terms of human assets, the 27th May earthquake killed 5,782 people and injured 36,299 persons. More than 135,000 houses were damaged and 60,000 people were left homeless. Bantul in Yogyakarta province, and its surrounding hinterland, was most
extensively damaged by the earthquake and most significant numbers of deaths occurred in this region25. Children lost their parents, and women lost their husbands leading to an increased number of children becoming orphans and the women becoming widows. Many people in Central Java and Yogyakarta provinces were injured and were unable to return to work, especially as special facilities for the handicapped were lacking. Six months after the earthquake, many people still live in tents or other temporary shelters which are not designed to accommodate the different needs of women, children
and the aged. During the rainy season, children, women, and the elders in particular, now experience health problems such as coughs, influenza and fever. Regarding physical assets, within agriculture sector itself, the earthquake destroyed not only the livelihoods of thousands of people but also physical facilities like irrigation
canals, animal shelters, fish ponds, buildings, laboratories, farming tools and equipment. Further, it also impacted negatively on farmer groups and on labor supply for productive and marketing activities.
23 FAO, Yogyakarta, 2006 24 See Annex 5 25 Indonesia lowers earthquake death toll”, CNN, June 06/06
6 Action Plan of Post Earthquake & Eruption, Dinas Pertanian DIY sub sector food crops, horticulture and livestock, July 2006)
19
Considering financial assets, before the earthquake, the majority of those farming as a
primary occupation were categorized as the poorest group in Indonesia. Their circumstances became worse after the earthquake as they lost their main sources of food and income to support the family, in particular within AEZs 2 and 3. Most of these farmers had few assets or savings, which has made it more difficult for them to revive
their livelihoods without external support. A strong social asset – the long history of communal solidarity and self-help values known as gotong royong – in the affected areas has contributed to the acceleration of the recovery process of the affected people. Both victims and non-victims involve in voluntarily work particularly in re-building of damaged homes in the community. Women mainly work in logistic supply (i.e. preparing food for the workers) whilst men work on house rehabilitation. Natural assets were impacted on as is clear from sections 2.3 to 2.6 above. The earthquake affected water supplies for the household and for productive activities, particularly irrigated food crops and vegetable production. Crops, livestock, forests and fish stocks were lost or damaged as described above. The situation has been worsened by
the long dry season forcing farmers to seek alternative ways of work to feed their families. The following two cases indicate how the disaster impacted on the livelihoods of two households.

20
Box 3: Case study 1: Mr A. and Ms. R.
Mr A. (65 years old) and Ms. R. (55 years old) live in a quite isolated village, a bit far from the main road. Since it is not easily accessible, the village has not been well assisted by the Government and the NGOs.
The couple lives with two sons, two daughters-in-law and two grandchildren. Their house was severely damaged in the earthquake and afterwards demolished. Now they live in eight in a very temporary shelter, not suitable for the coming rainy season.
Mr A. is a sharecropper, cultivating the land of the village chief. In the rainy season he cultivates rice
and shares the harvest with the land owner. During the dry season he plants cassava, corn, and groundnut for the market. The harvest is usually quite scarce since there is a great lack of water in these months. His only source of solid income comes from the market (IDR 1,200 per kg of corn, IDR 2,000 per kg of groundnut). His sons are also labourers.
For the coming rainy season Mr A. has to buy rice seeds, making lots of sacrifices and selling the few chickens he has. The future is hard, and the family does not have any plan for recovery. If the Government does not help the family they will have to live through extremely hard times, but they believe they will survive somehow.
Six months later: After all this time, the family is still living in the same temporary shelter. After a night of rain, the floor was wet, like the furniture inside. Since the irrigation system recently repaired by the Government does not benefit Mr A.’s field, he is not cultivating anything there at the moment. The family survives thanks to a loan from relatives in Sumatra. They do not even know if they will plant rice in the rainy season, because they would prefer starting a little business selling fertilizers and pesticides.
Box 4: Case study 2: Mrs S.
Mrs S. is a widow and farmer. She lost the harvest because of the Merapi eruption in May and June 2006. Mrs. S. has got two daughters but she lives only with one of them and the brother-in-law, deaf-mute. The daughter is jobless and does help the mother in the field.
Mrs. S. is the owner of 300 m2, planting corn and cassava all over the year mainly for the family. She usually sells 5 kg of corn (IDR 1.750/kg) – 3 times per year, and 40 kg of cassava (IDR 500/kg) - once a year. She lost the harvest of the corn, and the cassava because of the Merapi ashes.
The government gave Rp. 300.000 as compensation and she used that money to buy coconut in the market and sell it in the street. Mrs. S. also feeds the neighbors’ cattle, to earn half of the income from the selling. She’s got 5 chickens and she’s planning to sell 1 or 2 of them to get money for the corn seeds. She surprisingly still has the energy to develop her activity and be constructive: she would like to save money to join the Women Farmer Group to buy chickens or cattle.

21
Chapter 3. Interventions for rehabilitation
3.1 Introduction
The Ministry of Agriculture (MoA), requested the Food and Agriculture Organization of the United Nations (FAO) to provide emergency assistance through assessing overall damages and needs in the agricultural sector and providing for immediate farmer needs with agricultural inputs in most-affected areas. The Government also requested FAO to assist in the development of an eighteen-month farming-related livelihood rehabilitation strategy. In order to carry out the works, FAO established a sub-office in Yogyakarta under the FAO Rehabilitation Support Coordination Unit in Indonesia in June 2006 and with other UN agencies contributed to the UN Emergency Response Plan for Yogyakarta in seeking international assistance for the earthquake-affected districts. Since then FAO has deployed a team of international and national staff to support the Government of Indonesia in strategy development and provision of emergency and recovery assistance.
In addition, as part of the UN Emergency Response Plan in Yogyakarta and Central Java, FAO was requested to establish and lead the Agriculture Sector Group (ASG) to facilitate coordination, information management and communication between the agencies active in the agriculture sector. The ASG is composed of a number of government line department staff (i.e., livestock, food crops, fisheries and horticulture), local and international non-governmental organizations (NGOs), higher education institutions, and UN agencies that are involved in or have expertise in farming-related livelihood rehabilitation. One of the main objectives of this group was to help develop the strategy for the rehabilitation of agriculture livelihoods for the most vulnerable households affected by the earthquake. These organizations played an active role on a regular basis in assisting in the design and implementation of livelihoods assessments and the formulation of concepts for this strategy.
As indicated in Chapter 2, damage assessment was conducted taking a sustainable livelihoods approach. This approach, and related guiding principles for post-disaster rehabilitation contexts, has consequently supported the development of the strategy as described in the following sections, which also outline the key components and guiding
principles of the sustainable livelihoods approach.
3.2 The Sustainable Livelihoods Framework and Guiding Principles for
the Rehabilitation Context
A livelihood is sustainable when it can cope with and recover from stresses and
shocks, maintain or enhance its capabilities and assets, and provide net benefits to other livelihoods locally and more widely, both now and in the future, while not
undermining the natural resource base (FAO).

22
In the formulation of this strategy it was agreed to adopt the Sustainable Livelihood
Framework (SLF), which is a tool for understanding how household livelihood systems interact with the outside environment – both the natural environment and the policy and institutional context. This framework puts people at the centre of development work and helps in understanding socio-economic, natural and policy
impacts from the human perspective, showing how different factors relate to one another and the linkages existing between micro and macro levels. It draws out the strengths of the poor and the complexity of poverty. There are five concepts for understanding the linkages within the sustainable livelihood framework, namely the Vulnerability Context; Livelihood Assets; Policies and Institutions; Livelihood Strategies; and Livelihood Outcomes. More information on these is available in Annex 5. A livelihoods perspective and the general principles defined in the Sustainable livelihood (SL) approach provide the overall umbrella of the rehabilitation strategy. The proposed strategy builds on these SL principles further specifying and adapting them to the Yogyakarta and Central Java post-disaster and rehabilitation context. The guiding principles, which are further elaborated in Annex 5, have informed this strategy in that it seeks to:
a) Take a cross-sectoral and cross-regional (district, province) approach b) Link rehabilitation and development (in terms of “building back better”) to the
reduction of poverty, vulnerability, and food insecurity c) Take a multi-hazard focus through giving special consideration to future
mechanisms for disaster management planning at government and community level
d) Consider issues of agro-ecological sustainability in the rehabilitation process
e) Give a leading role to local people and their organizations in the rehabilitation process
f) Consider gender issues in all aspects of rehabilitation g) Ensure that rehabilitation interventions are market-led, relating to market
demands and building on local entrepreneurial assets
h) Involve active participation of all stakeholders at various levels through working in partnership and linking the micro to the macro
The Sustainable Livelihood approach works in a holistic and integrated way to build on,
strengthen or increase access to community-based assets such as human resources (skills and knowledge), physical assets (tools, equipment, infrastructure such as roads, schools and health centers), social capital (formal and informal networks), financial assets (credit) and natural resources (fish, cattle, paddy field). Examples of Sustainable Livelihood practices within this 18-month strategy are:
a) Providing support to communities, local NGOs and government staff to enable them to develop their own capacities – in the form of information, knowledge, skill and resources – to participate more effectively in planning and management of farming based rehabilitation activities.

23
b) Promoting an enabling environment which takes the aspirations of poor
marginalized communities into consideration through enhanced communication and coordination amongst the multiple stakeholders involved such as farmer groups, locally-based NGOs, humanitarian agencies and government institutions.
c) Building capacities of farmers, both women and men, farmer groups, locally-
based NGOs and government staff – in particular the extension workers. d) With regard to gender, the strategy includes, in Annex 6, a checklist of key
analytical questions of use for all those in planning, implementing, monitoring and evaluating programmes and projects in support of strategy intervention, which will assist them in ensuring that all interventions are gender-sensitive.
The process and content of the strategy development, including the interventions for rehabilitation proposed in this chapter, have been informed by, and are grounded in, the SL approach and principles. In this way the interventions are very much people-centered allowing for farmer organizations to work as partners with the government, NGOs and the private sector in the rehabilitation process and giving communities’ choice and ownership over the most relevant rehabilitation interventions for them.
3.3 Goal, Objectives and Outputs, and how these relate to the guiding principles
3.3.1 Goal The goal of the strategy is:
to ensure that the farming-related livelihoods of all those affected by the 2006
disasters in Yogyakarta and Central Java provinces are rehabilitated, and, further, “built back better” in that they are both more sustainable and have
greater resilience in the face of future potential disasters.
3.3.2 Objectives
The strategy has three objectives.
(1) The rehabilitation of farm production systems (2) The rehabilitation and promotion of agri-business and income diversification (3) The provision of support to government and community level institutions and
policies to promote recovery, rehabilitation and development The first, rehabilitation of farm production systems, involves a range of sectoral activities, but, more critically, a number of cross-sectoral activities most suited to the
restoration and improvement of integrated farming systems such as rice-fish-livestock, crop-livestock-forest and other similar combinations. The second similarly involves both

24
sectoral and cross-sectoral activities. Both the first and second objectives require the
successful implementation of the third: the provision of support to government and community level institutions and policies to promote recovery, rehabilitation and development. Activities related to this objective are fundamental to the successful implementation of the first two objectives and thus objective three will be implemented
in conjunction with objectives (1) and (2). 3.3.3 Outputs
The output of the first objective will be that the agriculture sector (farm production system) functions at least normally and the farmers rely on integrated farming system to a greater extent than earlier. It will improve farmers’ income and livelihood related to farming systems.
The output of the second objective will be the gaining of more benefits from added value of agriculture products either through growing different, higher value crops or by adding value through agro-processing. Consequently, farmers will gain increased income from agricultural activities; better job opportunities, primarily for the women groups; and
improved welfare of farm households through both a larger range of possible incomes sources and a wider diversity of production of foodstuffs for consumption in the households. The output of the third objective will be strengthened institutions both at government and community levels and improved mutual partnerships among multi-stakeholders; improved capacity and capability of the government staff and key farmers leadership; availability of appropriate management information systems for group’s economic
activities, and better access of information, credit, and inputs for farmers placing them in a better bargaining position in the market place.
The three boxes below provide examples on how the objectives are informed by the guiding principles (Section 3.5 describes all the priority activities within each objective):
Box 5: Guiding principle: linking the micro to the macro
On micro-macro linkages, the rehabilitation strategy calls for supportive government policy to facilitate the best response to the needs of different community groups,
especially those of the most vulnerable groups. The government, with support from external specialists and other stakeholders will review and improve on, if need be, government policies regarding the most vulnerable. These policies could include those related to micro-finance, and the market. This action falls within Objective 3 – and in particular capacity building of government, strengthening farmer organizations in accessing information and in lobbying for policy change, and enhancing linkages between farmer organizations and the banking/micro-finance sector.

25
Box 6: Guiding principles: Involve active participation of all stakeholders at
various levels through working in partnership
On working in partnership, there is commonly a lack of communication and coordination between different stakeholders, such as government staff, local NGOs and farmers themselves involved in agriculture-based rehabilitation and development programs. In
order to synergize efforts and improve capacities among the multiple stakeholders involved, activities such as the following will be considered within Objective 3:
• Strengthening institutions both at government and community levels and enabling legal frameworks among multi-stakeholders through mutual partnerships
• Enhancing leadership of government staff and key farmers through training on associated cross-cutting and technical topics relevant to farmers groups and their member’s need.
• Establishing an effective management information system in order to raise community awareness regarding current and future multi-hazard risk management and to empower the groups’ economic activities
In implementing these interventions in the post-disaster context, institutional strengthening, capacity building and disseminating information activities will be integrated with interventions towards boosting current farmers’ (and their groups’) productive and economical activities. For example, the capacity building of women groups will be integrated with provision of appropriate tools for agribusiness.
Box 7: Guiding principle: Market-led rehabilitation
Farming communities experience lack of market knowledge and skills to develop alternative sources of income for their livelihoods. Various factors contribute to these
circumstances such as farmers’ low level of education, limited access to market information and demand, and less public attention given to developing the market for agriculture-based products. In order to strengthen farmers’ financial asset and improve their capacity on market and business development, a range of market-led activities are planned, particularly within objectives 2 and 3. These include product diversification, agri-business development and development of farmer business skills.
3.4 Beneficiary groups and their needs
In line with the vulnerability component of the SL approach, based on the results of the FAO Rapid Livelihood Assessment (RLA) referred to in section 2.2, there are four main groups of farmers which have been identified as potential beneficiary groups for the implementation of the rehabilitation strategy. These groups were identified based on their
access to agriculture land as the main input of crop production activities. The more limited access to the land is, the more vulnerable the groups are. Although there could be

26
anomalies and exceptions within the groups, these are nevertheless presented as groups in
an endeavor to provide an order from the lowest level to the highest level of access to the land. There are: (1) landless, (2) sharecroppers (with and without own land), (3) tenant farmers (who rent land); and (4) land owners (and operators). Characteristics of each group as identified in the RLA are as follows:
Landless They are the most vulnerable of the four groups. They are often illiterate or with very basic education, have an extended family, possess large numbers of children, experience limited access to information, have limited skills, have few if any income sources aside from farming, and tend to be in a very weak bargaining position. Sharecropper The sharecropper commonly has very limited level of education – perhaps up to elementary school, a large family, limited access to information, limited skills to market, and few income sources aside from farming.
Tenant farmer
Tenant farmers commonly enjoy higher levels of education and more diversified income resources than sharecroppers, as they often have another job besides farming, some are even employed in government or in the private sector. They also have good networks and access to information due to their level of education.
Land owner Landowners tend to enjoy a higher level of education and more diversified income resources as other groups and many have jobs in addition to farming, working either in
the government or the private sector. They also have good social networks and access to information as they are well educated and respected by the community.
In line with the people-centered nature of the sustainable livelihood approach, the strategy proposes different program interventions for each farmer category as each group
has specific needs regarding basic supporting provision and facilities. The landless will benefit from both direct provision of livestock and the increase of agricultural labor which will be generated by boosting agricultural activities through provision of inputs to the three other beneficiaries groups. The other three groups need rehabilitation of
irrigation facilities and provision of agriculture inputs and equipments to ensure their capacity and involvement in their on- and off- farm activities.
In addition to these groups, there are two other potential beneficiaries in terms of gender and age, namely women (farmers) groups and young farmers groups. Regarding the women (farmers) groups, they especially require support to their activities in home-based agro-processing industry, strong market access, and micro-finance. Meanwhile, the young farmer groups as potential beneficiaries require better access to mechanized farming and information technology in order to improve their connection with the land and retain a strong linkage with, and make a strong contribution to, agricultural production.

27
3.5 Activities related to Objective 1: The rehabilitation and improvement of farm production systems.
Since the framework of this rehabilitation strategy aims at assisting government to rehabilitate agriculture, forestry, fisheries and livestock over a period of 18 months, the program proposed in this strategy will be completed and implemented on 18 months basis. However, some programs require longer than 18 months. In this case, this rehabilitation strategy will initiate these programs and they will be continued by the government institutions. The tentative timeframe for the activities below is presented in the implementation matrixes presented in Annex 7.
In line with the guiding principle of taking a cross-sectoral and cross-regional approach,
activities related below concern not only activities within each sector (food crops and horticulture; livestock; fisheries; and forestry) but also, and perhaps more critically, across these sectors. As mentioned in the discussion on objectives above, activities listed here will be implemented in conjunction with those in Objective 3 (section 3.7). The specific activities, and ways in which they will be implemented, may vary according to location and beneficiary group type and needs. 3.5.1. Food crops and horticulture
a. The first priority will be the rehabilitation of irrigation facilities particularly
tertiary and quaternary canals, provision of water pumps and wells, and rehabilitation of local markets/stalls using padat karya26 as participatory action. It can be done by men and women, especially the landless and poor farmers, for
income generation during the critical period (before harvest time). b. The second priority is the provision of hand tractors and other small agricultural
tools and machinery to the farmer groups to facilitate their field activities and overcome any lack of labor due to rural-urban migration.
c. Provision of certified field crop seeds is the third priority, especially for small farmers presently being affected by the shortage of water due to earthquake damage to irrigation facilities. Growing of field crops either under monoculture or under intercropping will provide the raw materials for small home-based agro-industries, such as soybean for tempe or tofu, corn for animal feed, groundnuts for a range of end products, etc. These activities mostly involve women.
3.5.2. Livestock
a. First priority will be given to the rehabilitation of livestock shelters (communal and
individual) to enable healthy and safe livestock keeping. Where shelters were damaged, farmers are presently keeping their livestock under trees or in very simple shelters unsuitable for both the livestock and for the environment of
neighboring communities.
26 Group work in which participants earn a daily wage lower to the going daily labour rate.

28
b. The second priority involves provision of vaccination, disinfection and veterinary
aid to prevent rapid spread of disease under the post-earthquake inadequate livestock keeping conditions. Such provision, to be carried out through the government extension services, will be accompanied by awareness raising on the risks of spread of livestock diseases in order to motivate livestock farmers for
better livestock management. c. Third priority will be given to the provision of small livestock ruminants (breeds)
and feeds (concentrated) to the poor households (both men and women) for the post-earthquake rehabilitation of their livelihoods. Men and women will have the same opportunity to keep these small ruminants both under individual or communal shelters.
d. Lastly, mapping of the livestock production areas will be undertaken to establish and support government’s livestock production centers that provide support and advice concerning animal breeding, keeping and marketing to the farmers. Such centers are important in introducing and demonstrating new breeds and/or technology that will be of benefit to the farmers. All of these activities will focus on, and involve, active farmers groups rather than individual farmers to ensure good program coordination.
3.5.3. Fisheries
a. First priority will be the rehabilitation of the inland fisheries ponds damaged by
the earthquake. b. Second priority will be given to the rehabilitation of canals bringing water to the
ponds and provision of water pumps for required water supply to the fish ponds. The method used will be participatory through padat karya by directly employing
poorer farmers or the landless. In this way these vulnerable stakeholders can also generate some additional income during the critical three month period before the harvest time.
c. Third priority will be the provision of marketable fishing inputs, such as fish fries (from official hatcheries) and feeds so as to accelerate the re-activation of fish
culture.
3.5.4. Forestry and Estate Crops
a. First priority will be given to the rehabilitation of damaged forest land through replanting with appropriate plants, terrace rehabilitation, and appropriate water management in the Protected and Community Forests. Various combinations are possible. For Protected Forest planting can include bamboo, trees (for cattle feeds) or orchids all of which are of direct economic benefit to the farmers. Trees should have different types of canopies so as to give greater effect in preventing soil erosion. Erect-leaved plants (palms) will be combined with flat–leaved ones. This combination will protect the soil surface from the impact of heavy rain thereby reducing soil erosion and terrace damages. Construction of short dikes and dams for water conservation and harvesting through a labor intensive program (padat karya) will be promoted.

29
b. The second priority concerns improvement of the composition of forest and
critical land through growing of fancy/aromatic wood species (e.g., sandal wood, Santalum album in AEZ 3 of Yogyakarta Province) and various varieties of bamboo. Sandalwood has a higher price and shorter harvest period than common wood species and at the same time the leaf of sandalwood can be used as
livestock feed. c. The third priority is rehabilitating the damaged estate crops, such as coffee in the
Merapi Affected areas, where the crops was covered by thick volcanic dust. 3. Rehabilitation of damaged estate crops
Forestry programs require a longer period than 18 months to achieve the expected results. In this case the strategy provides an opportunity for the start-up of the program, which will be continued afterwards both by farmers groups and by government programs that will also involve its further development. During the initial period covered by this strategy emphasis will therefore be placed on facilitating strong linkages between government bodies and programs, and farmers (men, women, and youth) groups. 3.5.5. Cross-sectoral interventions promoting integrated farming systems.
As mentioned at the start of this section, cross-sectoral interventions are of considerable importance. There are many ways in which integrated farming systems are, and can be, implemented. The description below gives examples of interventions considered relevant to particular AEZs. Further examples of different integrated farming systems in different AEZs and amongst different beneficiary groups are given in Annex 8.
Under AEZs 2a and 2b
The following four activities are examples of those which are the most appropriate cross-sectoral interventions for AEZs 2a and 2b and which would be promoted during the eighteen-month rehabilitation period:
a. Combining paddy farming with aquaculture in irrigated areas
b. Making compost and bio-gas installation (organic fertilizer made from rice straw and livestock manure)
c. Providing technical and veterinary support to the livestock sector d. Preparing better quality cattle feeds consisting of processed rice-straw or corn-
stalks Many of these activities can be carried out by women as they are the most active in livestock sector.
Under AEZs 3a and 3b The following activities will be the most prominent and preferred cross-sectoral interventions for AEZs 3a and 3b:
a. Implementing intercropping of rice with corn, cassava and legumes for sequential cropping on terraces, while planting grasses and trees for fire-wood and fodder on the edge of the terraces (for terrace stabilization) and implementing rain-

30
harvest by making short dikes, digging hollows and shallow wells to minimize
surface erosion. The variety of cropping gives subsequent opportunities for women’s groups in conducting home industry with corn, cassava, soybean etc. as the raw materials for their activities
b. Providing support to the planting of a diversity of NTFPs and higher value trees in
the Production Forests (part of the government programme in which communities can farm in forest planted 2-3 years earlier). The NTPFs include crops, grasses (for cattle feed), and some spices such as ginger or curcuma. Improving the community forest composition with fancy wood species such as santalum album
to increase economic value of forest and also providing cattle feed. The variety of the above mentioned options gives subsequent opportunities for women groups in running home-based industry with corn, cassava, soybean etc. as the raw materials for their activities. Again the home-based industry is of particularly relevance to the women.
Under AEZs 4 and 5 a. Producing compost/organic fertilizer and bio-gas installation. Compost/organic
fertilizer will be made from rice straw and livestock manure. b. Implementing intercropping in community forest with NTFPs, and improving the
buffer zone of Protection Forest and National Park with fruit, bamboo or grasses as cattle feed.
3.6 Activities related to Objective 2: The rehabilitation and development of agri-business and income diversification
As for the first objective, Objective 2 also includes cross-sectoral as well as sectoral activities. As mentioned in 3.3.2, activities included in objective 2 will be implemented in conjunction with those under objective 3.
3.6.1. Food crops and horticulture agri-business and diversification activities
There are several activities, which will be conducted in the food crops and horticulture
sub-sectors as regards the development of agri-business and income diversification.
a. First priority will be the provision of assistance to small agriculture-related business affected by the earthquake, e.g. damaged rice-mills and agriculture stores.
b. Second priority will be the income generation through seed production and diversification of the cropping pattern. These interventions will help farmers to produce high quality (standardized and certified) seed as value added compared to
producing crops for consumption. Diversifying the crop pattern means farmers planting a range of crops in addition to paddy such as soybean, maize and groundnut.

31
c. Third priority will be the provision of support to organic production through
enhancing the existing collaboration between farmers, public sector and the private sector..
d. Fourth priority will be income diversification for farming households through processing of raw materials for value added agricultural products, in particular the
women groups. Apart from increasing farmers’ income, this activity will also help empower the women groups.
The intended outcomes of these activities will be increased added value from diversification of agricultural products, increased income gained by farmers from agricultural activities and better job opportunities, in particular for the women groups; and improved welfare of farming households through a wider range of possible income sources and a wider diversity of production of foodstuffs for consumption within the households.
3.6.2. Livestock agribusiness and diversification activities
Priority will be given to improve farmers’ income through diversification of livestock
products.
a. First, attention will be paid to fattening of beef cattle or sheep through farmers groups and processing and sale of livestock products and byproducts such as animal skin chips and crackers.
b. Assuming a conducive government policy on avian influenza and its control, the second priority will be to promote the native poultry to produce eggs and good quality chicks, and diversify chicken products, for example production of special
fried chicken and chicken wing crackers and production of salty (duck) eggs by women groups.
c. Other priority activities related to diversification of livestock products are milk processing from dairy cattle and female goats and promotion of dairy products, such as caramel, cheese and flavored milk. Milk processing, especially from goat
milk, would help farmers produce marketable products given the fact that goat milk is difficult to sell in the villages whereas goat milk products have good market value.
Through these activities farmers will be able to generate quick income that is vital for their day-to-day living and recovery from the earthquake. In addition, through diversification of livestock activities, a good source of income can be generated for the farmers including the women. The activities will also improve the welfare of farm households and lead to greater knowledge and expertise in agri-business based on livestock products. 3.6.3. Fisheries/aquaculture agribusiness and diversification activities
a. First priority will be to revive the bidding system while selling fish. Farmers presently do not have a good bargaining position when they sell their product,

32
leading to low prices and little if any reward for their hard efforts. By reviving the
auction system, farmers will receive better prices than the present situation. b. Second priority will be to focus on development of small enterprises based on the
processing and sale of fish and shrimps (e.g. dried, fried, in restaurants, etc.). The results of this activity will be enhanced by the simultaneous provision of
appropriate equipment for fish processing. This is a prospective lucrative activity, since demand for fish and shrimps has increased rapidly over the last few years. Incomes of the fish farmers will be improved.
c. Third priority will be the promotion of aquaculture for ornamental fish production for which demand has grown significantly in recent years. Diversification into such fish production will lead to greater income earning potential for farmers.
3.6.4. Forestry and estate crops diversification and agribusiness activities
a. First priority intervention will be the rehabilitation of the processing units for estate crops and Non Timber Forest Products (NTFP). This will help farmers to
recover industrial equipment and their activities damaged and disrupted by the earthquake.
b. Second priority will be to support the production of “half processed material” from NTFPs (e.g., ginger, curcuma, etc.) for the home-based industry targeting mainly the women. Apart from product diversification, this activity will give a better opportunity to women to increase their involvement in forest management and improve their household incomes.
c. Third priority will be the support to the bamboo handicraft/furniture industry. Necessary linkages between farmers producing bamboo and relevant private sector bodies such as handicraft and furniture manufacturers will be facilitated.
These interventions will be useful for the farmers who live near the forests and rely on home-based industries to get added value from the Non Timber Forest Products (NTFP).
This activity will help increase the income of the farmers including the women groups.
3.6.5. Cross Sectoral agribusiness and diversification activities
Cross-sectoral programmes help farmers to integrate their agriculture activities so as to maximize production from the limited land they own. Integrated farming systems can be applied in various combinations, such as livestock-fish-paddy field (AEZ 2A), livestock-forestry-food crop (AEZ 3 and 4), livestock-forestry (AEZ 5) and livestock-paddy field (AEZ 2A and 2B), as presented in Annex 8. Types of integration will strongly depend on
the agro-ecological zones, farmers’ practices, experiences and background. Support to several cross-sectoral agri-business activities is planned as follows:
a. Combination of community forest land with NTFPs related to prospective agri-business
b. Development of home-based industry with the raw materials produced by intercropping in Production Forest such as soybean for tofu and tempe production, cassava starch, etc.

33
c. Adding value to livestock waste by making compost/liquid manure and using feed
technology to increase the use of crop residues as livestock feed resources d. Establishment of cooperatives/production oriented groups (for instance to produce
and sell honey, orchids and other NTFPs in Protected Forest) e. Provision of equipment and materials for storage of farm products and processed
goods f. Provision of equipment and materials to make feed pellets (feed for fish and
poultry) g. Promotion of product standardization for quantity and quality control h. Development of eco-tourism (or agro-tourism) beyond that already existing (i.e.
the snake fruit plantation at Sleman and the ecotourism sites within the National Park surrounding Merapi Mountain), for instance tourism related to integrated ornamental farming systems in densely populated areas and the production of organic and fair trade goods through public-private partnerships.
Intended outcomes of these interventions would be improved quality and quantity of agriculture, livestock, fisheries and forestry, increased income gained by communities through product diversification, added value in chain management and establishment of
eco-/agro-tourism, and improved welfare of community households through diversified income sources.
3.7 Activities related to Objective 3: Support to community and government led institutions and policies to promote recovery, rehabilitation and development
The key objective of this strategy is the provision of support to government and
community level institutions and policies to promote recovery, rehabilitation and development. Consequently, activities related to objective 3 are fundamental to the successful implementation of the first two objectives and thus this objective will be implemented in conjunction with activities under Objectives 1 and 2. Most of these
activities can not be completed under 18 month framework (see Annex 7); they will therefore be continued either by government or by community organizations to ensure sustainability.
Community groups in the disaster affected areas, including farmers groups with their strong foundation in the local culture, have to play a central role in the rehabilitation and resumption of the livelihoods of the farming households. However, the disaster severely constrained the ability of farmers groups and their individual members to resume their normal on- and off-farm activities with any external support. The rehabilitation strategy thus calls for supportive government policy to facilitate the best response to the needs of the different community groups, especially the most vulnerable ones. The government, with support from external actors and other stakeholders will review and improve on, if need be, the policies as regards the most vulnerable. These policies could include those
related to micro-finance, and the market.

34
This objective involves three main interventions in order to promote the government and
community institutions’ roles in livelihood recovery, rehabilitation and development: .
a. First, strengthening farmer organizations through capacity building and provision of appropriate instruments
b. Second, strengthening extension services through training on associated cross-cutting and technical topics relevant to farmers groups and their member’s needs
c. And third, in order to raise community awareness regarding current and future multi-hazard risk management and to empower the groups’ economic activities, effective information flow needs to be managed under appropriate information management systems by reactivating extension centers
In order to implement these interventions in the post-earthquake context, strengthening the information systems related with Disaster Risk Management (DRM) and with current farmers (and their groups’) productive and economical activities will be a key activity. For example, the capacity building of youth groups will be integrated into the development of DRM, whilst assistance to women groups will integrate dissemination of micro-finance and market-related information with the provision of appropriate tools and
equipment for agribusiness. 3.7.1. Strengthening farmer organizations through capacity building and provision of
appropriate instruments.
The disaster has left many members of farmer (male, female and youth) groups traumatized, this in turn impacting on their productive activities. Since collective activities in farming in particular are said to contribute to the healing process27 for both
farmers and women groups, the groups will be reactivated through provision of collective training on relevant needs. For example, the women groups will be reactivated through training on food-processing and marketing and provision of appropriate post-harvesting tools that can be used to resume their business. The youth groups will be reactivated through training on mechanized farming and information technologies and through the
provision of appropriate equipment to support their activities and strengthen their linkage with agriculture, land and agribusiness. In order to improve the farmer groups’ capacity and to support their farming production systems and business (including food crops, livestock, fisheries and forestry), good market access, skills in networking and
collaboration, and coordination among stakeholders (e.g., private sector, government, and community groups) are also very crucial. The rehabilitation strategy will also facilitate farmers/community groups in improving their production quality and strengthening their market-oriented products in order to obtain higher production added value. Annex 9 includes a list of potentially useful topics in which farmer (and government) organizations may benefit from capacity building depending on the outcomes of needs assessment. 3.7.2 Strengthening extension services through training on a range of cross-cutting
and technical topics.
27 According to farmer representative and NGOs attending the strategy consultative workshop in Yogyakarta, November 2006

35
It has been observed that the extension workers focus mainly on providing and disseminating production technology information rather than developing organizational, market and business orientation of the farmer groups28. Therefore, government staff, especially extension workers, will receive training in a range of cross-cutting and
technical topics (see Annex 9), such as integrated farming systems, organic product, post-harvest handling technology, organization and enterprise development, market, finance, and business access. One of the cross-cutting topics to be addressed through the capacity building is enhancing the skills and capacity of government in promoting networking among the stakeholders. Capacity building through a range of approaches will be employed to ensure that strong networks, linkages and other appropriate collaborative arrangements are established so that farmer organizations (men, women and youth) can collaborate directly with government, NGO and private sector bodies, as well as establish networks amongst themselves.
3.7.3 Strengthening management information system through reactivation of extension
centers
In the post-earthquake context, one major problem faced by the three types of farmer groups is their limited capacity to access useful information related to enhancing their livelihoods. The range of information needed by these farmer groups covers not only production technology, market and finance information, but also disaster risk management. Re-activation of information and extension centers in selected communities with wider coverage of affected areas is recommended to facilitate those vulnerable groups to strengthen their access to information. These centers can also include a database of farmers’ organizations and other community groups, disaggregated by their
social characteristics and products for organization capacity building purposes. Special committees for managing information with specific tasks, such as market research, information campaigns, Disaster Risk Management (DRM), and training will be integrated as part of these information centers.
One of the important functions of these centers in the post-earthquake context is raising awareness and community mobilization preparedness regarding multi-hazard disasters. Capacity building of the DRM committee members will enable them to organize awareness events and disaster response multimedia campaigns (by disseminating related
campaign material), for instance on the occasion of international disaster day, and provide DRM training to different (women, men and youth) groups. The intention is that community groups be organized to collectively and effectively respond to any potential disaster through the provision of disaster management training and incentives to build public facilities to support their livelihoods, such as food, seed and fertilizer storage facilities at the village level.
28 Srategy consultative workshop, Yogyakarta, November 2006

36
3.8 Implementation arrangements
Recognizing the leading role of local people and their organizations is one of the mainstays of this strategy (see Annex 5). Rural households and communities play a central role in all phases of post-disaster rehabilitation and recovery of their affected livelihoods. Local culture, capacities and coping strategies existing at household and community levels (e.g. Gotong Royong) are of the key importance. In implementation, wherever technically feasible, local people’s preferred rehabilitation options and interests will be recognized, and active measures will be taken to ensure that communities, farmer groups and rural households take part in decision-making regarding rehabilitation measures. At the same time emphasis will be placed on linking the micro to the macro (Annex 5)
and ensuring that all stakeholders, at all levels, actively participate in planning and implementing humanitarian and development interventions and policies. The process will follow a “bottom-up” approach building on both already identified needs and the assets the communities have and further needs and priorities identified by the communities in the coming months. Being built on a livelihood approach, the strategy also depends strongly on a cross-sectoral approach (Annex 5), with cross-cutting initiatives being pursued at all levels of
proposed activities. This calls for strong participation amongst potential stakeholders. The government itself has created some special programmes and made changes to its budget plan in order to be able to cope with the effects of the earthquake disaster and help the people. However, it is acknowledged that the Government has to ensure that all regular and additional rehabilitation programmes proceed as planned.
Strategy implementation will thus require close collaboration between the government and a range of implementing partners. A diagrammatic representation of how various stakeholders may work together is provided in Figure 2. The strategy recognizes the
comparative advantages of these various implementing partners and envisages that drawing on such advantages will make a significant contribution to successful implementation. Partners include local NGOs, INGOs, FAO, other UN agencies, farmer organizations, donors, micro-finance institutes, private sector and institutes of higher education. The comparative advantages of each are outlined in Annex 10. Close coordination and collaboration between all the above implementing partners is critical. Problem identification, target beneficiaries mapping, information sharing, monitoring, and progress reporting,will be done properly in order to avoid repetition and duplication of field activities and programs and ensure equitable coverage are all crucial to successful implementation of the strategy. To ensure both good coordination and effective implementation of planned and
community-driven activities, the following implementation arrangements are envisaged.

37
3.8.1 Fund management
Funds for the rehabilitation will be managed by the implementing agencies. It is expected that the Government of Indonesia will allocate more resources to the implementation of the activities as prioritized in the strategy. The relevant provincial and district line
departments will manage the funds for the implementation of the priority activities as allocated by the central government. Funds available from external sources will be managed normally by the implementing agencies. I/NGOs will manage the project funds in close collaboration with the community and coordination body of government line departments. Similarly, UN agencies (including FAO) will manage the funds for the implementation of the priorities activities in close coordination and collaboration with the government counterparts. 3.8.2 Community-led rehabilitation plans
Though the strategy identifies a range of activities related to each of the three objectives, actual activities need to be tailored as per the needs of the beneficiary groups and the
AEZs. Appropriate allocations on the priority activities will be made based on the location, damages, needs, and number of beneficiaries and the community-led rehabilitation plans prepared by an implementing agencyies together with target beneficiaries in line with the strategy. A brief outline of the possible mechanism for the management of the community-led planning process is outlined in 3.8.3 though it must be noted that this will be finalized though collaboration between all implementing partners and in cooperation with donors once the government and implementing partners have secured funding.
3.8.3 Possible mechanism for management of community-led rehabilitation plans
Capacity building of farmer organizations Strategy implementation involves capacity building of farmer (men, women, and youth)
groups not only in technical skills but also cross-cutting issues. These will include provision of support in identification of priority needs for the specific location and beneficiary group and the drawing up by the community/farmer organization groups concerned of their own unique farming-related livelihood rehabilitation plans. The
Government envisages that all partners assisting in the implementation of this strategy will work towards supporting community organizations in this way
Technical Implementation Committee and Steering Committee establishment A “task force” or Technical Implementation Committee (TIC) in each of Yogyakarta and Central Java provinces will be established for the implementation of the activities as envisaged in the strategy. The TIC will be made up of representatives of the relevant technical UN agencies (including FAO), relevant technical line departments (agriculture, fisheries, forestry), BAPPEDA, and representatives of both the Agriculture Sector Group and the farmer organizations. Decision making meetings of the TIC aimed at approving proposals made by communities or farmer organizations would be held on a monthly or

38
bi-monthly basis. A steering committee will be appointed to analyze and recommend
supporting policy and to supervise and guide the technical implementation committee
Criteria for approval of community-led rehabilitation plans The scope and choice of activities to be implemented per village/community will be
based on a number of criteria to be determined by the TIC. Possible criteria are:
• Equality/justice between affected communities
• Technical soundness of proposed plans/activities
• Expected livelihood benefits
• The level of assistance already received
• Local capacities and resources for implementation of planned activities
• “Innovation” in terms of building back better of the activity
• Budget requirements for proposed activities in relation to beneficiary numbers and/or expected impact/pay off
Coordination The Technical Implementation Committee will agree upon which organization will take the prime responsibility for coordination of all stakeholders involved in the farming-related livelihood rehabilitation process. The selected body will also be responsible for establishing and maintaining a “Who does What and Where” matrix of all organizations involved in the process. This matrix will assist the technical implementation committee in avoiding duplication and overlapping of the activities.

39
Figure 2: Schematic diagram of implementation arrangement
Consultative/ Policy Level
Coordination level
(
Implementation Level
Implementing
Agencies (e.g., Govt.
Depts., FAO,
INGOs, etc.)
Supporting agencies ( Higher education, Private, etc.)
Govt, I/NGOs,
UN agencies
DISTRICT (Depts. of Agriculture, Livestock, Forestry, Fisheries, Estate Crops, Bappeda)
BAPPENAS, LINE MINISTRIES,
SETNEG
DONORS
PROVINCIAL (Depts. of Agriculture,
Livestock, Forestry, Fisheries, Estate Crops,
Industries and Trades, Bappeda),
VILLAGE HEAD TARGET
GROUP
UN Agencies (Shelter and Livelihoods)
40
3.9 Risks and constraints
Some of the risk and constraints that may lead to late or even no implementation of the strategy could be listed as follows: a. Lack of awareness amongst government and other stakeholders of the significance of
farming to the people living in the affected areas. This may contribute to b) below. b. Lack of supporting institutions and mechanisms, i.e. budget allocations and
availability of easily accessible credit. c. Insufficient coordination between and within different stakeholder groups
d. Lack of funds e. A risk of social conflict if implemented insensitively f. Possible future disasters
3.10 Monitoring and Evaluation
a. This rehabilitation strategy is strongly relying on a cross-sectoral approach with
cross-cutting issues and cross-regional principles in its implementation program. The
monitoring and evaluation (M&E) system, therefore, will be involving the M&E mechanism of various government line departments at both provincial and district levels.
b. BAPPEDA is responsible for an integrated development program planning which accommodates the departmental or sectoral rehabilitation programs. In response to this livelihood rehabilitation strategy, an inter-department M&E committee under BAPPEDA coordination is recommended. The committee will be made up of representatives of the Program and Planning Section of the relevant technical
departments. Good coordination under BAPPEDA is critical for timely and effective M&E processes.
c. The human resources of government staff having a strong background in the livelihood rehabilitation strategy with its holistic and people-centred approach are very limited. Therefore capacity building of the M&E committee members will be
provided. FAO or other institutions can provide technical assistance for the M&E training equipped with curriculum and developing M&E methodology and key indicators.
d. At community level, monitoring process should come up with quick and relevant
feedback on the implementation process and progress. The implementing agencies that work at the community level for both planning, implementation and coordinating process will provide regular monitoring report to the M&E committee.
Possible performance indicators for measuring the progress against the target sets under the livelihood rehabilitation strategy under the three main objectives are listed in Annex
10.

41
Annexes
Annex 1. Maps of Earthquake affected areas of Yogyakarta and Central Java
Map 1: Map of Central Java and Yogyakarta, showing districts within Central
Java.

42
Map 2: Map of Earthquake affected areas of Yogyakarta and Central Java indicating locations and numbers of dead and injured
Source: United Nation, 2006.

43
Annex 2. Vision, Mission and SWOT analysis of Agriculture Development
The Vision of the Agriculture development is Realization of powerful agriculture to
supply safely agriculture product and competitiveness. Achievement of the above vision will be seen from the strengthening of agriculture role as backbone for the Indonesia economic, due to agriculture being able to:
1. Supply job and business activity primarily for rural areas 2. Increase income through improvement of productivity and value added to reduce
poverty line. 3. Increase foreign exchange through increasing the competitiveness of products,
especially to pay off foreign debt. 4. Increase food security
5. Take the lead in the acceleration of national economic development 6. Support autonomous regional economic development
The mission of the Agriculture Department is as follows:
1. Achieve increasing management quality of professional staff, supported by appropriate infrastructure
2. Encourage food security increase, value added, and competitiveness of agriculture
product and farmers welfare through efficient and sustainable utilization of natural resources, supported by technology and environmental sustainability.
3. Encourage the capacity of technical service unit (UPT) in order to support the increased quality of role and function of institution/services (Dinas)
The analysis method used by Agriculture Department for strategic planning is SWOT (Strengths, Weakness, Opportunities and Threats). SWOT analysis requires external and internal inputs.
1. Internal environmental factors
a. Strengths:
- Good relation between government (Central, Province, District) - Rule and Law for agriculture is available - The availability of the staff to handle agriculture development - The availability of resources (human, budget, method, natural and artificial)
which support agriculture development - Agriculture infrastructures are available in a good condition - Availability of good agriculture institutions - The growth of superior agriculture commodities
- Availability of higher education (university) and research institute - Agriculture is a strong sector to cope with the crisis situation

44
b. Weaknesses
- Cross sector coordination has not been optimized yet - Low capability of society to conduct enterprise - Utilizing the internal input of agriculture has not been optimized yet - Weak access to local, national, regional and international markets
- Low networking between entrepreneurs - Low professionalism of services staff - Low management of services staffs - Documentation and archiving is not optimal yet - Application of e-government is not optimal - Results of research, knowledge and agriculture technology are not yet
optimally used - Competition on utilized land and water resources - Agriculture mostly depends on the season, so plantation and harvesting season
are almost at a similar time - Agriculture enterprises are not based on market opportunity
2. External environmental factors
a. Opportunities
- Opportunity for agriculture society to be actively involved - Opportunity for education and research institutes to actively play a role as
agriculture technology supplier - Increase regional and international cooperation - Possibilities to increase productivity through technology application - Opportunity to increase added value under farmers level
- Domestic market of agriculture is increased concomitant with population increase
b. Threats
- Global/International market of agriculture products make it difficult for
Indonesia agriculture product, especially Yogyakarta Province, to compete with world agriculture product
- From an economic scale point of view, small scale farmers in Yogyakarta do not have a good bargaining position as compared with large industrial scale
production which has capital and is technology intensive

45
Annex 3. The Characteristics of agro-ecological zones
The Earthquake affected area represents different agro-ecological zones29, each with more or less similar environments and livelihood strategies. A common feature between AEZs is that farm sizes in general are small, with farming representing the primary, but
not sole, source of income. Across the AEZs, however, the sources of livelihoods within farming are diversified as follows:
• AEZ1: represents upland forest, with seasonal crops of upland rice, maize, and tree crops such as wood, bamboo, coffee, coconut, cacao, traditional medicines, fruit, and under covers such as yams, ginger and various rizhoma crops. The typical seasonal cropping pattern is rainfed paddy-maize-groundnut/cassava. The integrated farming systems include small holdings of cattle, goats, poultry as well as family-based use of forests with medicinal plants under shade and home gardens where vegetables receive irrigation from wells as needed.
• AEZ 2: Irrigated lowland agriculture, on basically flat lands with mostly fertile clay textured soils. Paddy rice is the dominant crop, but with a multiple cropping
pattern in three growing seasons. Common cropping patterns based on three growing seasons are rice–rice-rice, or rice-rice-secondary crops/vegetables. Corn soy bean,ground nut are the main secondary crops, while chili, onion eggplant tomato and yard long bean are the preferred vegetables. Some farmers include also horticulture crops or melons. Cash crop production for urban markets gains
increasing year round importance around cities. The integrated farming systems include livestock sub-systems with goats, cattle and poultry as well as fish ponds. Home gardens are common. Many inhabitants are increasingly seeking employment opportunities in the closer cities.
• AEZ 3: Basically rain fed and upland areas with infertile soils. Cropping is
characterized by rainfed farming mainly on terraces; typical intercropping cropping patterns are upland rice+corn+cassava in the first season (March-October) and groundnut+corn+cassava or soyabean + cassava in the second growing season. Irrigation is not common. Small canals are used for drainage, water saving and erosion control during rainy seasons. This is the poorest area, with limited livelihood opportunities. The integrated farming systems include small holdings of cattle, goats, poultry and family-based use of forests with medicinal plants and home gardens irrigated from wells as needed.
• AEZ 4: This zone is on the lower slopes of Mt Merapi, with well-irrigated agriculture. Paddy rice is a dominant crop. Typical traditional growing patterns are paddy-vegetables-vegetables, but there is an increasing incidence of intensive horticulture (fruits) for urban markets or year-round vegetable production and tobacco. Integrated livestock systems as in all AEZs concentrate on cows, goats and poultry.
29 A number of different sources were used to identify AEZs for the RLA (see map in Fig. 1). These sources were as follows: AEZ map from the Agriculture Technology Research Institute (Balai Pengkajian Teknologi Pertanian - BPTP);Poverty map (UN) ;Relief, topography, altitude maps.

46
• AEZ 5: The forest highlands constitute the upper slopes of Mt Merapi, with horticulture and high altitude vegetables common, and where forestry, plantation crops, fire wood production and livestock provide livelihoods for many farmers. Livestock systems include cows (also dairy), goats, poultry. The tourist industry is also growing in importance.
Due to the climatic and topographic features, all AEZs are regularly exposed to dry spells, and sometimes drought periods during the dry season, while AEZ 4 and 5 face
also large scale erosion and landslides in the rainy season. Across all AEZs the landless men and women are the most vulnerable. The AEZs most seriously damaged by the earthquake are located in AEZ 2. The most vulnerable and poor socio-economic groups overall are concentrated in AEZ 3.

47
Annex 4. Sustainable Livelihoods (pentagon) asset analysis according to AEZ.
Agriculture
Note: the outer pentagon represents the human (H), natural (N), physical (P), Financial (F) and Social (S) asset situation for farmers before the disaster, whereas the inner pentagon indicates the extent to which the disaster negatively affected each asset.
S
H
N
PF
13%
61%
24% AEZ 2a
F P
N
H
S
62%
73%
23%
AEZ 2b
AEZ 3aF P
N
H
S
60% 73%
20%

48
Livestock
H H H S N S N S N
P F P F P F
A. Zone 2a B. Zone 2b C. Zone 3
H H
S N S N
P F P F
D. Zone 4 E. Zone 5
Percentage of farmers who sold livestock
Parameter Cattle Sheep Goats Chicken Quail Duck Total Farmers sold 47.0 100.0 56.7 40.6 50.0 66.7 60.2 Livestock sold 33.1 41.7 35.7 23.5 44.0 42.8 36.8 Livestock dead 0.0 25.0 5.0 49.8 73.0 47.0 33.3 Livestock birth 3.8 41.7 7.1 14.3 10.0 0 15.4
Reasons for selling livestock
Livestock Reason. %
Cattle Sheep Goats Chicken Quail Duck
Built house 31.3 0 5.3 7.7 0 50.0 Living cost 28.1 75.0 57.9 61.5 0 0 Feed shortage 18.8 25.0 31.6 7.7 0 50.0 Agric. capital 6.3 0 0.0 0 0 0 School fees 9.4 0 5.3 0 0 0 Business 0 0 0 15.4 0 0 Others 0 0 0 7.7 0 0 Total for earthquake reason 84.4 100.0 94.7 76.9 0 100.0

49
Annex 5. Sustainable Livelihood Approach and Guiding Principles
Five concepts are crucial for understanding the linkages within the Sustainable Livelihood framework:
1) Vulnerability context 2) Livelihood assets
3) Policies and institutions 4) Livelihood strategies 5) Livelihood outcomes.
The Vulnerability context refers to unpredictable events that can determine livelihoods and cause households to fall into poverty. Some of these factors are fast acting such as natural calamities (i.e. earthquakes or tsunamis) and others are slower acting (i.e. soil erosion), but both can undermine livelihoods. It is also important to distinguish between shocks originating outside the community, which affect all people in the same locality, and idiosyncratic shocks (i.e. illness or job loss) that principally affect only individual households. Households with many livelihood assets are generally more able to preserve their lives and property in the face of shocks than households with fewer assets. In the face of a disaster (e.g. drought or earthquake) many poor households are forced first to sell off their animals at low prices to buy grain to feed the facilities. When they lose their assets, households lose their means of livelihood. Resilience is the ability to withstand shocks.
Livelihood assets refer to the resource base of the community and of different categories of households. These assets are interlinked. Examples of different types of livelihood assets: 1) Human capital: household members, active labour, education, knowledge and skills 2) Physical capital: houses, livestock, equipment and irrigation pumps 3) Natural capital: access to land, forests, water, fishing, grazing, and wild products 4) Financial capital: savings/debt, income, credit and insurance 5) Social capital: kin networks, group membership, socio-political voice and influence.
Assets are represented in an asset pentagon that shows the amount and relative importance of each type of capital, which varies between communities and between wealthy and poor households within the same community.
Policies and institutions are an important set of man-made external factors that influence the range of livelihood options available to different categories of people; and they also influence access to assets and vulnerability to shocks. Institutions include formal membership organizations (i.e. cooperative and registered groups), informal
organizations (i.e. exchange labour groups or rotating savings groups), political institutions (i.e. Parliament and law), economic institutions (i.e. markets, private companies, bank and land rights) and socio-cultural institutions (i.e. marriage and inheritance). An enabling policy and institutional environment makes it easier for people to gain access to assets they need for their livelihoods.

50
Livelihood strategies are the “range and combination of activities and choices that people
make in order to achieve their livelihood goals” On the basis of personal goals, their resource base and their understanding of available options, different categories of households develop and pursue different livelihood strategies. Short-term strategies may be the ways of earning a living, coping with shocks and managing risk, and longer-term
aspirations for children’s future and old age. A livelihood system is the total combination of activities undertaken by a typical household to ensure a living. It includes the total pattern of labour allocation of household members between crops, livestock, off-farm work, non-farm business, and reproductive and community tasks of men and women. Livelihood outcomes are what household members achieve through their livelihood strategies, such as levels of food security, income security, asset accumulation and status in the community.
Guiding principles
A livelihoods perspective and the general principles defined in the Sustainable livelihood (SL) approach provide the overall umbrella of the rehabilitation strategy. The proposed strategy builds on these SL principles further specifying and adapting them to the Yogyakarta and Central Java post disaster and rehabilitation context.
1. Cross-sectoral and cross-regional perspectives Most of the hazard risks in Yogyakarta and Central Java Provinces directly affect farming30, including post harvest processing and industries. Disasters like the earthquake demonstrated that structures which serve cross-sectoral demands such as water/irrigation
channels, rural roads, physical service infrastructures etc may be destroyed. The proposed strategy, fully recognising existing government institutional structures and the need for sector specific interventions, gives in addition a strong emphasis on issues of cross sectoral nature and interest. A cross-sectoral perspective is recommended to minimize sector induced duplications of interventions (same interests of different sectoral agencies) and to reinforce linkages existing among sectors by promoting collaboration on those interventions which impact on other sectors or could be tackled in a cross-sectoral way. The cross-regional dimension will promote the interaction of different stakeholders between various districts and provinces.
2. Linking rehabilitation and development to reduce poverty, vulnerability and food insecurity A major lesson learned from recent disasters31 is the importance of integrating
rehabilitation into longer-term development through addressing rehabilitation and development in parallel so as to build back better. Only in this way is the sustainability of
30 Farming in this context includes production of food crops, vegetables and fruits, livestock production, fisheries, forestry and a range of combinations of these (for instance agro-forestry, and aqua-culture in fish ponds amongst the paddy fields)
31 Various documents on www.alnap.org

51
the rehabilitation process ensured. Further, recovery and reconstruction must look beyond
returning to the previous situation by addressing the root causes of vulnerability and promoting employment creation. Building the long-term livelihood asset base will increase food security and help reducing the overall vulnerability of the most marginalized groups, such as the poorer members, widows and orphans, so they are not
deprived of their rights and can participate in income-generating activities.
3. Multi-hazard focus with disaster management perspective Yogyakarta and Central Java Provinces are exposed to a number of hazard risks including earthquake, volcano eruption, drought, flash floods landslide and also Avian influenza. Multiple shocks may occur simultaneously (as in the case of the May earthquake and Mt Merapi eruption), or in sequence and often recurrently. Coping capacities of households and communities are limited. A rehabilitation strategy in a multi-hazard exposed region needs to consider how recurrent shocks of different nature may affect (i) the ability of local people to secure their basic needs and livelihood strategies, and (ii) the capacities of service providers (public and private) to assist in reducing vulnerabilities against potential future hazards. Special attention should therefore be given to strengthening integrated systems for national and local disaster management planning, including risk
assessment, contingency planning and capacity building at all levels to strengthen community resilience and local-level-risk-reduction capacities.
4. Agro-ecological sustainability Parts of the natural resource base of affected areas is environmentally fragile. Poor land and water management, as a result of unplanned or uncoordinated rehabilitation, could lead to rapid resource degradation. In this respect, it is imperative to formulate interventions which are in line with regulatory guidelines on land, forest and water use,
and the disposal of wastes and effluents. In case of widespread destruction, opportunity may arise to reinforce indigenous, or further disseminate new, technologies adapted to hazard risk exposure, including agro-ecologically sustainable land management practices, and appropriate varieties of trees, crops and livestock.
5. Leading role of local people and their organizations Rural households and communities play a central role in all phases of disaster management and planning their future livelihoods. Local culture, capacities and coping strategies existing at household and community levels (i.e. Gotong royong) are of key
importance. Wherever technically and economically feasible, local people’s preferred rehabilitation options should be recognized. For this, it is necessary to ensure that communities, farmer groups and rural households take part in decision-making of rehabilitation and reconstruction interventions, and demand accountability from those handling public resources.
6. Gender mainstreaming in rehabilitation Many failures in the outcomes of emergency and rehabilitation programmes are due to the assumption that large groups of people are homogeneous, rather than being made up of men, women, youth and various disadvantaged groups with different needs and interests. Interventions to save lives and secure livelihoods are more efficient and

52
effective when gender differences are properly understood and addressed in post-disaster
rehabilitation. Gender relationships are also important in shaping the livelihood diversification process. In this respect, gender analysis tools can help to clarify the specific and often different priorities, vulnerabilities, capabilities and coping strategies of women and men, boys and girls, so that they can be more adequately addressed in
response to the emergency situation. Gender mainstreaming involves ensuring that attention to gender equality is a central part of rehabilitation and development interventions so that both men and women can take part in the process and equally benefit from the planned activities. Special attention will be given to the empowerment of youth, trying to involve boys and girls in the foreseen productive and capacity building activities. 7. Market-led rehabilitation Input and output markets are of highest priority to ensure the flow of production and dissemination of goods; and are also important for extension services, micro-credit, land preparation, food processing, etc. Therefore, markets must play a key role in guiding existing and renewed productive patterns. The May earthquake had massively interrupted market interactions in the affected areas. It will be essential to ensure that
rehabilitation and reconstruction activities in the farming related sectors are built on (i) the existing natural physical and entrepreneurial assets of the affected areas as well as (ii) on market demands so that they are sustainable beyond the period that emergency assistance is being provided. This entails a close partnership between the public and private sectors for new agricultural investments to stimulate the local economy and generate new employment opportunities. Post Emergency interventions should identify market needs and stimulate existing markets (instead of setting up parallel structures which tend to collapse after external support ends)
8. Working in partnership and linking the micro to the macro The rehabilitation strategy will be implemented in close partnership with all stakeholders; and will reinforce the linkages and modes of interactions existing among the micro/field (communities, households and individuals), intermediate (institutions) and macro
(programmes and policies) levels. Changes induced by the earthquake at any level of production or service support system may cause or precipitate changes at other organizational/institutional levels. This principle will ensure that the interventions proposed will promote active participation of and coordination among different
stakeholders at various levels in planning and implementing humanitarian and development interventions and policies. It also implies the use of “bottom-up” approaches to identify development priorities and facilitate the creation and/or support of networks to encourage the exchange of views and experiences among all stakeholders.

53
Annex 6. Checklist of Key analytical questions to plan and implement Gender-
sensitive interventions32
Social impacts of emergencies o Has the disaster caused a change in gender relations?
o Has the disaster exacerbate gender differences? o What is the role of men, women, youth and elderly in disaster relief, reconstruction
and transformation? o Has the gender division of labour changed after the disaster?
o What is men’s and women’s ability to respond in an emergency situation? o What are the capacities of men, women, girls and boys to support the reconstruction? o What are the new priorities of men, women and youth after the disaster? o What are the opportunities to support women’s equitable participation in decision-
making? o Are the existing support structures different for men and women? o Have any lessons been documented from previous years relating to gender issues and
strategies in the context of the crisis?
Policy coordination
o Do government food and agriculture policies have different impacts on men and
women? o Do gender elements only consist of specific targeted initiatives or has a gender
perspective also been used throughout major initiatives? o Is it possible to ensure that women are not excluded, marginalized or displaced by
new programmes? o Are men and women equally active in the policy-making bodies, and setting targets? o Are both men and women, and specific target groups, consulted about new policies
and representative views projected from different levels? o Are women represented in key advocacy and interest groups (i.e. professional groups
and consumer groups)? o Are both men’s and women’s organizations represented in local community
committees? Are members of local committees regularly in touch with village level problems?
o Have the priorities of men, women, youth, elderly and disabled people been addressed? Are there major disagreements? If so, how can they be overcome?
o What level of organization has been consulted (national, district, village and households)?
32 The proposed Checklist is taken and adapted from the Passport to mainstreaming a gender perspective in
emergency programmes – Key analytical questionsfor designing gender-sensitive humanitarian
interventions, FAO Socio-economic and gender analysis (SEAGA) Programme; the SEAGA Guidelines for
Emergency and rehabilitation programmes; and the SEAGA Rural households and resources: a pocket
guide for extension workers.

54
Participatory needs assessment o What are the existing and available capacities in the community? Women’s? Men’s?
Children’s?
o What are the different problems identified by men and women? o Which problems result from the gender-based division of labour or from inequitable
access to resources? Which problems are shared by men and women? o Which problems result from discrimination of certain socio-economic groups? o Is there consensus/disagreement about the ranking of priority problems identified by
men and women? o Which key strategic areas must be addressed through specific programmes, actions
and services to assist women and men to increase household food security? o What support do women and men need to increase their capacities and skills? Will
both men and women benefit from new skills and resources introduced by the project?
o Is there a need for creation of community assets? If created, will women and men have equal access to them?
o Which proposed activities will directly benefit women? Men? Youth? Which will directly benefit the most disadvantaged groups in the community? Which will benefit most or all of the community?
o What are the gender implications for the resources needed in the community? Which are problematic or present conflicts of interest between different stakeholders?
o Does the project support men and women in assuming new responsibilities due to gender role changes?
o Will the project’s activities have any impact on the existing gender relations? What are the implications?
Situation of people affected
o Who are the people affected by the disaster? What are their characteristics (e.g.
sex, ethnicity, caste, minority groups, refugees, internally displaced persons?) o Number of people affected by the emergency disaggregated by sex?
o How many men and women were previously highly vulnerable? What has changed? Are they single female-headed households, unaccompanied children, orphans, disabled?
o Is food available, accessible and utilisable by men and women? o How many have lost their livelihood assets? Were losses short-term (e.g. single
season’s harvest) or long-term (e.g. permanent loss of land)? Have men and women suffered equally?
o What is the security situation of women and men, boys and girls? o Have both men and women been consulted in relief operations?

55
Livelihood Systems
o What are the main livelihood assets of men and women? o What is the level of agricultural land ownership and distribution, disaggregated by
sex, in the rural population? o Which activities are men’s responsibilities? Women’s responsibilities? o Who is responsible for what aspects of crop production? Women? Men?
Children? o How do the daily and seasonal activities of women compare to men? Are
women’s and men’s activities separate or do they overlap? o How do activity patterns and sources of income compare for men and women? o Do certain socio-economic groups or households have very highly vulnerable
livelihoods (e.g. dependent on only one kind of activity or resource)? o Do men and women both have access to valuable resources? o Who – husband or wife - controls family livelihood assets (e.g. food and
agricultural tools)? o Do men and women share decision-making?
o What are the coping mechanisms men and women have to maintain and prevent the loss of their livelihood assets?
o Are there children-headed households or other vulnerable or disadvantaged groups in the area? What, if any, coping strategies do they use?
o When payment for items is required, has the impact of various pricing decisions on female-headed households and other family structures been taken into consideration?
Assess possibilities for introducing alternative businesses
o What are the skills and interest of different household members? o What is the most appropriate type of enterprise with the greatest potential to help
the household and its individual members? o Is this type of enterprise feasible in terms of access to markets and time allocation
in relation to other responsibilities that provide the livelihood and food security of the household?
o What is needed to help men and women clients develop the essential business skills (e.g. literacy, bookkeeping, marketing, household budgeting, etc.)?
o How can extension workers assist in strengthening different household members’ skills and access to credit and other inputs or services?
o What information exists to help men and women link with farmers’ organizations
and cooperatives that specialize in production or marketing? o What is needed to facilitate the access to opportunities and services? o Who in the household has access to credit? Are there community-based micro-
credit schemes working in the area? Are there saving groups in or near the community?

56
Targeting of Beneficiaries
o Is the fact that all vulnerable groups usually made up of men, women, boys and girls recognized, and that their vulnerabilities may be influenced by gender?
o Are female-headed households recognized? How? o Are women listed as a vulnerable group irrespective of whether they are usually
the major breadwinner, household head, now displaced, < age 15? o Which gender-balanced selection criteria should be used? o Who is involved in household-level targeting? Beneficiaries? Village officials?
Partner NGOs? Ministry staff? Project staff? Community structures? What is the role of women members?
o What is the potential impact of the selected targeting method on household livelihoods and the existing gender balance?
Local Organization
o How can the local knowledge of men and women be used? o Who are the key informants within and outside the community? o Who can provide an understanding of the main needs of different socio-economic
groups? o How is the beneficiaries’ community organized? o Who are the local suppliers of goods and services? o What food security programmes and services are available? Do they target
women? o Are food security programmes and services integrated with other services (e.g.
markets and education)? o Are men and women both participating in activity identification and
implementation? o Which organizations work closely with community members? What are their
linkages with other levels of systems, such as government and private institutions?
o Which organizations do local men and women prefer as potential service providers and why?
o Do the preferences of women or minorities differ from those of the majority? o Have men and women developed informal networks or formal organizations that
could be supported? o What solidarity networks and community self-help capacities exist? Are there
groups exclusively for women or men? Which ones? Why? What is the focus of
these groups? o How do women and men assist each other? o Do men and women have equal access to food and agricultural programmes and
extension services? o What supportive measures or additional separate organizations are necessary?

57
Stakeholders analysis
o Which organizations and groups work with the community? Are they organized according to economic, social, environmental, other issues? What is the relative
importance of these organizations? o Which groups help household to overcome key constraints (e.g. related to land,
livestock, nutrition, domestic violence and lack of income)? o What services do they provide (e.g. information, training, projects, credit or other
kind of assistance)? o What groups are exclusively for women? For men? Youth? o Are certain groups excluded from some of the organizations? If so, which ones
and why? What are the implications of non-participation? o Are there groups that provide advice on HIV/AIDS prevention? o What are the linkages between local groups and outside institutions?
Participation o To what extent (presence, composition, function and capacity) do men and
women participate in decision-making in local committees or groups?
o Does a committee have a positive impact on women’s self esteem and respect from other villagers?
o Are women on committees able to express their views in conflicts with those of men?
o Are specific actions needed to increase women’s participation in food and agriculture programmes?
o Is there specific support to the organization of women to increase their involvement in negotiations and reconstruction?
o Will women be involved in the implementation at all levels? o Can village members of both sexes (such as committee members) attend training
workshops outside the village? o What are the implications of hosting meetings and training in a public place?
o In the view of villagers, does participation by women in distribution processes make them fairer?

58
Monitoring and Evaluation
o Does the monitoring and evaluation system incorporate participatory feedback from women and men?
o Does the reporting system generate information concerning men and women separately?
Outputs o What proportion of relief items reached the target group compared with the total
distributed? o What was the share of men and women needy in relation to the total number of
actual recipients? o Did men and women participate in inputs distribution? o How adequate were the resources actually received by men and women most in
need? o Did the beneficiaries encounter specific problems related to gender? Outcomes o In what way do men and women beneficiaries see their lives improving or
changing as a result of the relief intervention? o How has men and women’s situation improved?
o Was the operation designed properly to focus on the differential effect of the disaster on men and women?
o Were the different needs of men and women understood and met? o Could men’s and women’s different needs have been met more efficiently
following a different approach? o What kind of specific changes in livelihood and farming systems of the benefited
male and female-headed households occurred?

59
Annex 7. Implementation Matrixes
Objective 1: Rehabilitation of farm production systems
Time frame Activities
2007 2008 2009 2010 Remarks
33
Food crops and horticulture
Rehabilitation of irrigation, local
markets/stalls, water pump, wells X X Completed
Provision of hand tractors and other
small agricultural tools to farmer groups X X Completed
Provision of certified field crop seeds X X Completed Livestock
Renovation of livestock shelters X X Completed
Provision of vaccination, disinfection and veterinary
X X Completed
Provision to men and women of small animal (breeds) and feeds (concentrated) to the poorer
X X Ongoing
Mapping of the production areas of livestock
X X X X Ongoing
Fisheries
Rehabilitation of the inland fisheries ponds
X X Completed
Rehabilitation of canals bringing water
to the ponds and provision of water pumps
X X Completed
Provision of marketable fishing inputs
e.g. fries (from official hatcheries) and feeds
X X Completed
Forestry
Rehabilitation of damaged forest land X X Completed
Improving the composition of forest and critical land through the growing of
fancy/aromatic wood
X X Completed
Cross-sectoral
Combining paddy farming with aquaculture in irrigated areas.
X X Completed
Making compost and bio-gases
installation (organic fertilizer made from rice straw and livestock manure)
X X Completed
Providing the technical and veterinary
supports to the livestock sector X X
Ongoing
Making better quality cattle feeds, consisting of processed rice-straw or
corn-stalks
X X Completed
Intercropping of rice with corn, cassava and legumes for sequential cropping on
terraces
X X Completed
33 By completed it is meant that it is envisaged that this particular activity can be completed within the eighteen month duration of the strategy, though the activity is expected to continue afterwards through
government support and through the farmer groups themselves. Those activities referred to as “ongoing” are inherently longer term

60
Objective 2: Rehabilitation and Development of Agribusiness and Income Diversification
Time frame Activities
2007 2008 2009 2010 Remarks
Food crops and horticulture
Provision of assistance to small agriculture related business
X X Completed
Income generation through seed
production and diversifying cropping pattern
X X X X Ongoing
Provision of support to organic
production X X Completed
Income diversification through processing of raw materials
X X X X Ongoing
Livestock
Fattening beef cattle or sheep through farmers groups
X X Revolving fund managed by government
Keeping native chicken to produce eggs and day old chicks
X X Complete
Processing milk from dairy cattle
and milking goats X X
Revolving fund
managed by government Fisheries/aquaculture
Revive the bidding system X X X X Ongoing
Development of small enterprises based on the processing and sale
X X X X Ongoing
Aquaculture for ornamental fish X X X X Ongoing
Forestryand estate crops
Rehabilitation of processing units
for estate crops and non timber X X Completed
Support the production of “half processed material” from NTFP
X X Completed
Support to the bamboo handicraft/ furniture industry
X X X Will be continued by community
Cross-sectoral
Combination of community forest land with NTFPs related to prospective agri business
X X X X Will be continued by
community
Development of home industry based on raw material
X X X X Ongoing
Adding value to livestock waste y
making compost/liquid manure; X X Completed
Feed technology to increase the use of crop residues as feed
X X Completed
Establishment of cooperative/ production oriented groups
X X X X Ongoing
Provision of equipment and
materials for storage of farm products
X X X X Ongoing
Provision of equipment for feed
pelleting machine X X Ongoing

61
Promotion of product standardization for quantity and quality control
X X X X Ongoing
Development of eco tourism (or agro tourism)
X X X X Ongoing
Objective 3: Support community and government level institutions
Time frame Activities
2007 2008 2009 2010 Remarks
A. Strengthening Farmer Organizations Support/re-activate farmers and
Community Organization through trainings on seed certification, food processing and marketing
techniques
X X X X Ongoing
Support/ reactivate farmers and community organizations through
training in integrated farming systems and organic farming
X X X X Ongoing
Support and assist Women
Groups with food crops and livestock product processing instruments
X X Completed
Support/re-activate farmers and women groups through training on new market product
information
X X Completed
Support and assist Youth Groups through training on mechanized
farming and provision hand tractor
X X Completed
Support and assist Youth Groups
through training in information technology and market
information
X X Completed
Support farmer, women and youth groups through training in
business management
X Completed
Establish pro-poor banking facilities and facilitate farmers’
association access to micro-finance
X X X X Ongoing
Assist farmer, women and youth
groups in preparing business development proposals
X X Completed
B. Strengthening Extension Services through training
Capacity building for extension service agents (ESA) through training database, organizational
building, and business organization
X X X X Ongoing

62
Capacity building for ESA through training in integrated farming systems post harvest
handling technology, and enterprise development
X X Completed
Capacity building for ESA through training in institutional and business networking
X X Ongoing
Facilitate ESA in developing partnerships
X X X X Ongoing
C. Strengthening Management Information System through reactivation of extension services
Provision of information technology to the specific information and extension centers
(IEC)
X Ongoing
Capacity building for IEC staff
through training on DRM X X X X Ongoing
Support/Involve youth groups in DRM training and provide DRM
certification
X X X X Ongoing

63
Annex 8. An example of integrated farming system activity
Activities District Sub district AEZ Villages Target group
Klaten
Bayat, Cawas,
Jogonalan, Wedi, Prambanan
3 3 2a 2b 2a
Banyuripan, Jarum, Paseban, Beluk,
Krakitan, Krikilan, Tawangrejo, Titang, Gondangan, Pakisan, Bawak, Brangkal, Kadipolo, Cucukan, Geneng
Bantul
Jetis, Pandak, Bantul,
Kasihan
2a 2b 2a
2a
Trimulyo, Wijirejo, Trirenggo,
Palbapang, Ringinharjo Tonirmolo
Sleman Berbah 2a Tegaltirto
Keeping chicken-fish-paddy
Kulonprogo Lendah 2b Gulurejo
Women,
Landless, Renter Sharecropper
Klaten Wedi, Klaten Sltn
2b 2a
Sukorejo Ngalas
Bantul Bantul 2a Sabdodadi Keeping duck-
fish-paddy
Sleman Berbah 2a Tegaltirto
Women, Landless, Sharecropper
Sleman Cangkringan
Pakem
5
4
Hargorejo
Kinahrejo
Kulonprogo Girimulyo 3 Keeping dairy
livestock-forest
Boyolali Selo Sawit
4 4
Tlogolele Kemasan Cmp.
Farmers group,
landless
Bantul Dlingo Imogiri
3 3
Keeping
cattle/goat-forest Gunungkidul Patuk 3
Farmers group, women, Landless
Bantul
Banguntapan Bantul
Piyungan Sewon Pleret
2a 2a
2a 2a 2a
Banguntapan Potorono Palbapang
Trirenggo Sitimulyo
Srimartani Wonolelo Segoroyoso Pendowoharjo Timbulharjo
Sleman
Prambanan Berbah
2a 2a
Sumberharjo Madurejo Jogotirto
Tegaltirto Kulonprogo Lendah 2b Ngentakrejo
Gunungkidul Patuk 3 Ngoro-oro Terbah
Fattening cattle-paddy
Klaten Gantiwarno Cawas
2a 3
Karangturi Ngandong Bendungan
Nanggulan
Farmers group, Landless, Sharecropper
Renter

64
Annex 9: Potentially useful topics in which government staff, and subsequently
farmer organisations, may benefit from capacity building and/or skills training in.
Note: Capacity building activities will be organized on the basis of needs assessments of the target groups and will include the preparation of information and training materials, dissemination through the information centres, community level capacity building, training and/or extension. Community level provision to be tailored for, and accessible to, women and men, the youth and the elderly. Possible capacity and skills training & development topics include the following topics.
• Group leadership and organizational management
• Information management systems and computer literacy
• Community Database building process and its management
• Community based disaster risk management and related issues e.g. multi-hazard sensitiveness and agro-ecological sustainability
• Specific training related to objective 1 on various aspects of food crop & horticulture (including organic farming), livestock, fisheries, forestry (and non timber forest products in particular, with an aim to fill “niche” markets) and estate crop production
• Specific training for men and women’s groups to ensure provision of support for farm agri-business and income diversification rehabilitation (objective 2) including enterprise development; business planning, management and marketing; and food and feed storage. Specific training also in the processing and subsequent
storage of processed goods so as to add value (by improving the quality of the output and through taking advantage of fluctuations in market price), and to provide for food and feed contingencies and better nutrition due to more diversity in availability of food stuffs throughout the year, thus reducing vulnerability.
• How to access and manage microfinance services (savings and credit) and the revolving system of agricultural input provision already in place related to farming and agri-business needs (based on the educational level and knowledge of men and women)
• Self-esteem, team building, networking and other ways in which to motivate and/or revitalize farmer (and other user) male and female groups (particularly those still traumatised by recent disasters)
• Collection, analysis and dissemination of statistics disaggregated by sex
• Gender sensitisation of community organisations to ensure planning and
implementation of gender-sensitive rehabilitation activities
• Business management courses for men and women, including knowledge on cash flow, bookkeeping and numeracy
• Training on alternative activities for men and women, youth, elderly and disabled groups

65
Annex 10: Comparative advantages of different implementing partners
The Government (Ministries of Agriculture, Fisheries, .Forestry, BAPPEDA)
Having staff, technical expertise and institutional mechanisms in place, the Government has primary responsibility for rehabilitation. As the farming-related livelihood rehabilitation strategy is agreed upon and shared between several Ministries, the coordinating role of BAPPEDA becomes very important. Activities of all other stakeholders listed below are built on the Government mechanisms and strategy, and
relate to the existing Government infrastructure and mechanism.
Local NGOs
Local NGOs, alongside district government officials, can take the lead in community level activities as they, as organizations, are embedded in the local culture and at the same time have skills in participatory appraisal and community action planning. International NGOs
International NGOs have experience in working in “bottom-up” community led processes. When working in conjunction with local NGOs they can build the capacity of the latter (in project planning and management, reporting) etc and can provide technical and financial support. They can also raise international awareness of the farming-related livelihood needs of those affected by the disasters in Central Java and Yogyakarta
provinces. Farmer organizations Farmer (men, women, youth) organizations are crucial for the implementation of the
strategy. Planned activities will on the whole be conducted with these organizations rather than with individuals. Where activities involve planned programmes, farmer organizations help identify beneficiaries. Where activities are community led, farmer organizations will be the starting point for this process. Farmer organizations at district and provincial level can also assist in information campaigns and public awareness programmes. They can collect, formulate and then distribute important data or information to various community stakeholder groups and individuals by developing, or contributing to the production of media such as leaflets, simple bulletins, or radio broadcasts. FAO of the UN
The Food and Agriculture Organisation is the UN agency with the specialist process and technical expertise most relevant to a farming-related livelihood rehabilitation strategy.
FAO has assisted the Government in the preparation of this strategy and thus will be well placed to design, implement, monitor and evaluate rehabilitation programmes in collaboration with the Government. Furthermore, FAO, as the UN lead agency for the Agriculture Sector Group, can contribute to the coordination of the farming-related livelihood rehabilitation activities of different stakeholders, particularly local NGOs who are strong members of the Agriculture Sector Group. Indeed, in assisting in implementation of the strategy, FAO is likely to work alongside INGOs and local NGOs as implementing partners.

66
The private sector The private sector has very useful skills and expertise in entrepreneurship, agribusiness development and income diversification. Drawing on this sector’s practical experience will enhance the activities of other partners, including government, NGO and civil
society. At the same time the private sector has already provided (often in-kind) assistance for the rehabilitation process and in future also they may contribute in this way. Micro-finance institutions
Micro-finance institutions can contribute to disaster rehabilitation through developing, and/or making more available, micro credit scheme for those affected by the disaster to recover and then diversify their economic activities. Donor bodies
Donor bodies can assist in publicizing more widely the consequences of the disaster and what can be done to address these, and to source financial support for implementing new, or extending existing, rehabilitation programs. Further, they can provide specialized
technical assistance and resources Institutes of Higher Education
Institutes of Higher Education can play a strategic role in providing secondary data and information, and conducting research. Staff having relevant experience and specialist knowledge can contribute to both the curriculum development and materials for capacity building and training of both government staff and farmer groups of various kinds.
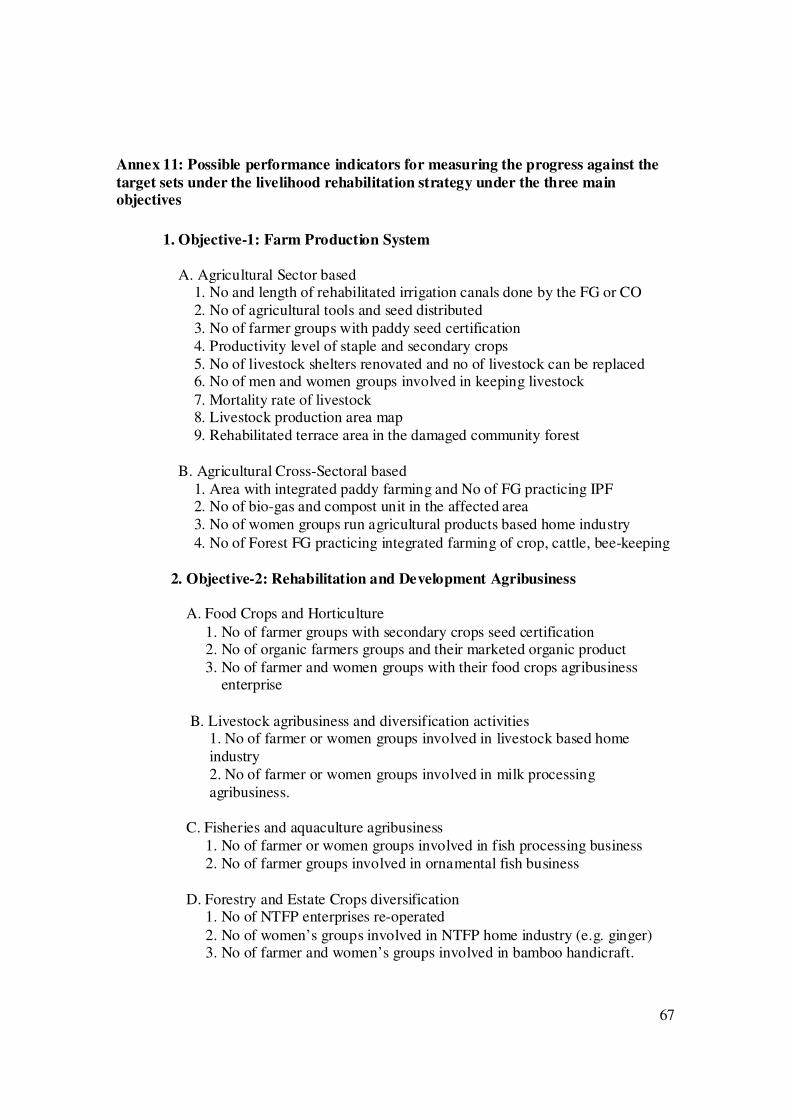
67
Annex 11: Possible performance indicators for measuring the progress against the
target sets under the livelihood rehabilitation strategy under the three main objectives
1. Objective-1: Farm Production System
A. Agricultural Sector based 1. No and length of rehabilitated irrigation canals done by the FG or CO 2. No of agricultural tools and seed distributed 3. No of farmer groups with paddy seed certification 4. Productivity level of staple and secondary crops 5. No of livestock shelters renovated and no of livestock can be replaced 6. No of men and women groups involved in keeping livestock
7. Mortality rate of livestock 8. Livestock production area map
9. Rehabilitated terrace area in the damaged community forest B. Agricultural Cross-Sectoral based 1. Area with integrated paddy farming and No of FG practicing IPF 2. No of bio-gas and compost unit in the affected area 3. No of women groups run agricultural products based home industry
4. No of Forest FG practicing integrated farming of crop, cattle, bee-keeping
2. Objective-2: Rehabilitation and Development Agribusiness
A. Food Crops and Horticulture
1. No of farmer groups with secondary crops seed certification 2. No of organic farmers groups and their marketed organic product 3. No of farmer and women groups with their food crops agribusiness
enterprise
B. Livestock agribusiness and diversification activities
1. No of farmer or women groups involved in livestock based home industry 2. No of farmer or women groups involved in milk processing agribusiness.
C. Fisheries and aquaculture agribusiness 1. No of farmer or women groups involved in fish processing business 2. No of farmer groups involved in ornamental fish business
D. Forestry and Estate Crops diversification 1. No of NTFP enterprises re-operated
2. No of women’s groups involved in NTFP home industry (e.g. ginger) 3. No of farmer and women’s groups involved in bamboo handicraft.

68
E. Cross Sectoral Agribusiness and Diversification Activities 1. No of women’s groups involved in cassava starch, tofu/ tempe production
2. No of farmer groups involved in manure or liquid manure business
3. No of new product storage units managed by community organisations 4. No of standardized agricultural products
3. Objective-3: Support to Community and Government led institutions A. Strengthening Farmer Organizations
1. No of farmer groups or community organizations that have participated in several trainings on farm production system (seed certification, food processing, marketing technique)
2. No of farmer groups or community organizations that have participated
in several trainings on integrated farming systems and organic farming 3. No of women’s groups that have participated in several trainings on food
or livestock products processing 4. No of farmer and women’s groups that have participated in training on
existing and alternative agribusiness which emphasize market product information (e.g. ornamental fish, fish processing, NTFP handicraft, liquid manure)
5. No of youth groups that have participated in training on new commodities, mechanized farming and information technology focusing on marketing.
6. No of farmer, women and youth groups that have participated in business management, including micro-credit access, book keeping and cash flow management
7. No of Business Development Proposals prepared by farmer, women and youth groups
B. Strengthening Extension Services through training
1. No of extension service agents (men and women) participated in training on database, organizational building, and business oriented organization.
2. No of extension service agents (men and women) participated in training on integrated farming systems, post-harvest handling technology, enterprise development.
3. No of extension service agents participated in training on business and institutional networking
C. Strengthening Management Information System through reactivation of
extension services 1. No of reactivated information and extension centers with IT 2. No. of GOI staff, community organisation members, especially youth
groups, participated in DRM
3. No of community organizations with a certified DRM-skill.