farmers' contribution to landscape services in the netherlands under different rural...
TRANSCRIPT

at SciVerse ScienceDirect
Journal of Environmental Management 111 (2012) 96e105
Contents lists available
Journal of Environmental Management
journal homepage: www.elsevier .com/locate/ jenvman
Farmers’ contribution to landscape services in the Netherlands under differentrural development scenarios
Catherine Pfeifer a,b,*,1, Marthijn P.W. Sonneveld b, Jetse J. Stoorvogel b
aAgricultural Economics and Rural Policy Group, Wageningen University, P.O. Box 47, 6700 AA Wageningen, The Netherlandsb Land Dynamics Group, Wageningen University, P.O. Box 47, 6700 AA Wageningen, The Netherlands
a r t i c l e i n f o
Article history:Received 23 September 2010Received in revised form7 June 2012Accepted 18 June 2012Available online
Keywords:Agricultural landscapesScenariosThe NetherlandsLandscape servicesSpatially explicit simulationRural development
* Corresponding author. Agricultural Economics anningen University, P.O. Box 47, 6700 AAWageningen, T317 482667; fax: þ31 (0) 317419000.
E-mail addresses: [email protected], pfeifer.cathe1 Current address: ILRI Campus, P.O. Box 5689, Add
11 617 22 13; fax: þ251 11 617 20 01.
0301-4797/$ e see front matter � 2012 Elsevier Ltd.http://dx.doi.org/10.1016/j.jenvman.2012.06.019
a b s t r a c t
Landscape services represent the benefits human populations derive, directly or indirectly, from (agro-)ecosystem functions at the landscape scale. Many of these services are the result of farmers’ decisionmaking to allocate resources to other activities than food production and therefore are the result of farmthe adoption of on-farm rural activities. With changing agricultural and rural policies, the futureprovision of landscape services to fulfill societal demands is not guaranteed. This study aims at mappingthe spatial distribution of the adoption of on-farm rural activities under different explorative scenarios.For a Dutch landscape, storylines at the landscape scale were developed by combining global storylines,resulting from the Global Environmental Outlook, with local storylines resulting from key informantinterviews. Subsequently these storylines were translated into quantitative scenarios that were imple-mented into a simulation procedure based on spatially explicit econometric models of farmer’s decisionmaking. Results show that further market liberalization leads to a decrease of landscape services in thestudy area. In our study, only increased cooperation between government, farmers and citizens appearsto result in a general increase of all landscape services across the entire landscape.
� 2012 Elsevier Ltd. All rights reserved.
1. Introduction
Landscape services represent the benefits human populationsderive, directly or indirectly, from (agro-)ecosystem functionsobserved at the landscape scale. Apart from food, these servicesinclude recreation, biodiversity and cultural heritage (Willemenet al., 2008; Hermann et al., 2011). Landscape services are thecombined result of biophysical landscape properties and humanactivities at the landscape scale. Consequently, their provision is co-defined by the spatial arrangement of human agricultural and non-agricultural activities with natural ecosystem functions. In agri-cultural landscape, many of these services are the result of thefarmer’s decision to allocate resources to the production of on-farmrural activities. These activities can be decoupled from agriculturesuch as bed and breakfasts, on-farm shops and educationalprograms for children (Meerburg et al., 2009) but can also becoupled with agriculture.
d Rural Policy Group, Wage-he Netherlands. Tel.: þ31 (0)
[email protected] (C. Pfeifer).is Ababa, Ethiopia. Tel.: þ251
All rights reserved.
In practice, trade-offs exist between different services (de Grootet al., 2010) and stakeholders have conflicting views how tomanageland (Simão et al., 2009). Some policies have already been effec-tuated that aim to maintain the provision of some landscapeservices. Agri-environmental schemes for example compensatefarmers for their labor and financial investments in supportingbiodiversity (Peerlings and Polman, 2004).
The on-going agricultural market liberalization and uncertaintyabout European common agricultural policies beyond the currentfinancial framework ending in 2013 results in a high level ofuncertainty for landscapes for dominated by agriculture (Ramos,2010), and it is unclear whether the future contribution offarmers to landscape services will be sufficient to ensure theprovision of landscape services demanded by society(Vandermeulen et al., 2009). Assessing changes of adoption of ruralactivities under different explorative scenarios allows to identifypossible short-comings that need to be addressed by policy makers(Van Ittersum et al., 1998; Van Vliet et al., 2010). Explorativescenarios include storylines that investigate different possiblefutures that are translated into quantitative plausible sets ofparameters (Peterson et al., 2003; Börjeson et al., 2006). Most of theexisting explorative scenarios for European rural areas are based onalready existing global storylines, such as for example the GlobalEnvironmental Outlook (GEO-4) (Valbuena et al., 2010) or European

C. Pfeifer et al. / Journal of Environmental Management 111 (2012) 96e105 97
common agricultural policy scenarios (Piorr et al., 2009). Thesestorylines do not consider relevant local development where otherdrivers may be dominant compared to the global scale (Kok andAlcamo, 2007). To develop consistent and relevant scenarios atlower scales (Gómez-Limón et al., 2009), such as the landscapescale, storylines should also take account for local and regionaldrivers of land use change.
The evaluation of landscape services does not only involve theirtype and quantity but also their spatial distribution. In order toevaluate farmers’ contribution to landscape services, it is thereforenecessary to assess farmers’ adoption of rural activities ina spatially explicit manner. Various methods exist to visualizefarmers’ decision-making at the landscape scale. These includespatially explicit agent based modeling (Dalgaard et al., 2009;Happe et al., 2006; Piorr et al., 2009; Valbuena et al., 2010), spatialmicro-simulations (Hynes et al., 2009) or spatially explicit econo-metric models (Stoorvogel et al., 2004). Most of these methodsfocus on agricultural production. Pfeifer (2011) developed a simu-lation procedure that visualizes farmer’s adoption of rural activitiesusing spatially explicit econometric models. This procedure allowsto predict the spatial distribution of farmer’s adoption of ruralactivities under different scenarios.
The objective of this paper is to develop consistent explorativerural scenarios at the landscape scale and to assess the spatialdistribution of farmer’s adoption of rural activities under thesevarious explorative scenarios. The methodology is applied toArkemheen-Eemland, a landscape dominated by agriculture, inthe Netherlands. Storylines at the landscape scale are developedby combining global GEO-4 storylines with local storylines.Subsequently these storylines are translated into quantitativescenarios and introduced into a spatially explicit simulationprocedure.
2. Study area
2.1. Land use and related landscape functions
The ArkemheeneEemland is an area of 125 km2 located in thecentre of the Netherlands (Fig. 1) and is part of the larger GelderseVallei region (Pfeifer et al., 2009). The area is dominated by peat
Fig. 1. The study area ArkemheeneEe
soils (45%), clay soils (25%) and sandy soils (15%) (Stiboka, 1969).Land use is dominated by grassland (85%) that is mainly used fordairy farming. Most of the current landscape characteristics andlandscape functions are closely connected to extensive agriculturalpractices. The landscape supports various landscape functionsincluding the habitat for meadow birds, cultural heritage, recrea-tion and education of citizens about culture (NLAE, 2007). Exceptfor Bunschoten, most of the built-up areas are found near theborders of the area. The city of Amersfoort is the largest close-byresidential area and has been expanding rapidly over the pastyears. As a consequence, pressure to transform agricultural landinto residential areas has increased. Additionally, the area isincreasingly regarded as a recreational area for residents in theregion (Anonymous, 2008).
2.2. Governance
The western part of the study area (Eemland) is part of theprovince of Utrecht, while the eastern part (Arkemheen) belongsto the province of Gelderland. The study area falls under differentnational and international regulations. Arkemheen and itssurroundings around the firth of the river Eem fall under the EUdirective for wild birds’ habitat protection (European Union,1979). The protected area in Eemland belongs to the DutchSociety for Nature Protection, while Arkemheen belongs to theState Forestry Service. These organizations own the land andlease it to farmers with restrictive conditions allowing toimplement a suitable management of habitat for meadow birds.Because of the particular importance for Dutch cultural heritage,ArkemheeneEemland became a National Landscape in 2004 inwhich key landscape qualities must be maintained. These qual-ities include the openness of the landscape, the historic parcel-lation pattern and the character of a peat landscape (SVGV,2006).
In order to enable bottom-up policies, a commission has beenestablished that involves representatives of governmental organi-zations, agricultural organizations, nature conservation organiza-tions and of the regional Waterboard (NLAE, 2007). Its objective isto facilitate projects that contribute to the maintenance anddevelopment of the area.
mland with major built up areas.

C. Pfeifer et al. / Journal of Environmental Management 111 (2012) 96e10598
3. Methods
3.1. Simulating spatial patterns of on-farm activities
Pfeifer (2011) developed a methodology that predicts spatialpatterns of adoption of on-farm activities like agri-environmentalschemes, recreation and short supply chains. The methodologymakes use of micro-econometric models describing the adoption ofthese rural activities on the basis of farm-level data and can roughlybe subdivided into four distinct modules. Thesemodules cover datacollection, assessment of the micro-economic model, actual simu-lation and visualization of spatial patterns of rural activities (Fig. 2).
Collected data was available in the GIAB database (Naeff, 2006).This national GIS database includes all officially registered farmersand contains farm household as well as farm production charac-teristics. The database is updated each year with annual agriculturalstatistics which are geo-referenced using postal codes.
The 2005 survey also includes data on rural activities. Thedataset from 2005 was therefore combined with a GIS databasewith zoning plans, topographic maps and hydrological data(module 1).
The next step is to estimate probit models of the adoption ofagri-environmental schemes, recreation, and short supply chains(module 2). The choice of explanatory variables is based on aneconomic model in which farm households maximize their utility(Ellis, 1993; Sadoulet and de Janvry, 1995) and includes farmhousehold characteristics, such as age or education, farm produc-tion characteristics such as livestock intensity, farm size oreconomic size. The probit results are given in the appendix. The useof the econometric model on the GIAB dataset covers all theobserved adoption of rural activities options without any classifi-cation into farm typologies (Pfeifer, 2011). Nonetheless, in order toincrease variability and introduce farmers’ decisions which are notyet observed in the study area (such as intensive livestockproduction), data from the larger Gelderse Vallei region was taken.This expands the possibilities to use the model for variousscenarios.
Within the simulation module (module 3), 3700 locations arerandomly selected corresponding to the actual number of farms inthe Gelderse Vallei in 2005. The base run in 2005 reproduces theactual spatial distribution of rural activities adopted by farmers. Foreach randomly selected location, farm characteristics and probitresiduals are simulated from the local normal distribution, derivedfrom focal statistics: the average and standard deviation arecomputed from the 10 nearest actual farmers. This approach allowsto simulate farms that are similar to the existing ones without
Fig. 2. The simulation procedure for farmer’s adoption of rural activities.
violating privacy of the farmers or stratifying them into typologies.Subsequently, probit models are used to predict the probability ofadoption for each on-farm activity for each randomly selected pointbased on the simulated data. The probit residual is simulated andexplicitly introduced into the prediction in order to take spatialcorrelation into account (Pfeifer, 2011). In the final step (module 4)the predicted probabilities are interpolated with an ordinary krig-ing procedure (Cressie, 1990) in order to visualize the spatialdistribution of rural activities. Note that the presented approachfocuses on the farmers’ contribution to landscape services only anddoes not take into account that some of the landscape services, forexample recreation, can be provided by other actors in the region.Moreover, it also ignores the fact that some landscape services areexternalities of agriculture.
3.2. Defining explorative scenarios for 2015
3.2.1. Global storylinesSpecific global storylines have been defined in the Global
Environmental Outlook (GEO-4: UNEP, 2007). These global story-lines have been downscaled to the European continental scale,giving a time consistent picture on how Europe looks like in 2015,2032 and 2050 (Kok et al., 2008). However, as these storylines lackinformation on dominant drivers at the landscape level, additionalinformation was acquired from literature in combination withsemi-structured interviews from local stakeholders.
A vision for the ArkemheeneEemland landscape had alreadybeen formulated after broad consultationwith stakeholders (NLAE,2007). This included information on synergies and conflicts in theprovision of landscape services. A new participatory process wastherefore not deemed necessary for this study. Instead, a selectednumber of semi-structured interviews were held with importantstakeholders to test whether these storylines were supported.
3.2.2. Semi-structured interviewsThe major stakeholders for the study areawere identified by the
commission for the National Landscape. Key informants (KI’s) wereidentified who represented the State Forestry Service, the Water-board, the Dutch Society for Nature Protection, the Landscape Fund,the province of Utrecht, the municipality of Bunschoten, real estatedevelopers, the Governmental Agency for Land and WaterManagement as well as citizens. As the econometric model is basedon a dataset that includes all the farmers in the area, farmers werenot interviewed.
Semi structured interviews yielded the perception and vision ofKI’s on the National Landscape ArkemheeneEemland. The inter-view consisted of two parts. The first was structured and aimed atcross checking hypotheses about the area identified throughgovernmental publications. It also contained questions about thenetwork of each key informant, allowing to identify additional keyinformant that where not mentioned by the commission. Thesecond part of the interview was semi-structured, allowing newissues to come in. In this part, the interviewed person was asked toname the most important landscape functions in the area as well astheir personal vision about the preferred use of the area. Theinterview was structured around functions identified in the visionof the National Landscape: nature, agriculture, recreation, culturalheritage, dwelling and water (NLAE, 2007). For each function,various present and future dimensions were addressed (Table 1).For each KI, the order of appearance of each function, as well as thenumber of arguments (points raised) and length of the discussionregarding the function was analyzed. The first mentioned functionwas classified as ‘very important’. The functionmentioned secondlywas given the same importance as the first one if the emphasiscould be considered equally important, i.e. similar amount of time

Table 1Landscape functions and their dimensions addressed during the semi-structuredpart of key informant interviews in the ArkemheeneEemland national landscape.
Landscape function Dimensions addressed
Agriculture Current agricultural systemsDrivers for changes in the agricultural systemsVisual impact of change in agricultural systems
Nature Definition and classification of nature areasPotential multifunctional use of nature areasEfficiency of current policy toolsSocietal willingness to pay for green services
Recreation Entrepreneurship in the areaCurrent and future role of recreation
Water Current and ideal water managementCultural heritage Importance of cultural heritage and local identityDwelling and
infrastructureCurrent and expected population dynamicsCurrent and expected economic evolutionof the area
C. Pfeifer et al. / Journal of Environmental Management 111 (2012) 96e105 99
or number of arguments. If not, this function was classified as‘important’. The following functions were classified as ‘important’ ifthe stakeholder raised a high number of arguments compared tothe other functions. If a function was mentioned but with a lownumber of arguments compared to the others, the function wasclassified as ‘less important’.
3.2.3. Down-scaling global storylinesThe semi-structured interviews resulted in KI storylines with
emphasis on different dimensions of landscape functions. Some KIstorylines could be combined resulting in a local storyline witha specific emphasis on one or two landscape functions. Each localstoryline could be linked to global storylines (GEO-4) resulting in 5storylines for this area:
I. Market first is a storyline in which markets are further glob-alized. In Europe there is growing demand for food resultingin intensification of agriculture towards 2015.
II. Security first is a storyline in which security overshadows allother values.
III. Policy first is a storyline in which environmental issues areaddressed globally, with stronger coordinated policies by2015 in Europe. Total amount of agricultural subsidies arereduced but farmers in less favored areas receive subsidies tomaintain cultural heritage and biodiversity.
IV. Sustainability first is a storyline where a general bottom-upchange towards sustainable behavior is observed and actorsat all levels and sectors will constructively work together. InEurope, agricultural subsidies are removed and replaced bypayments for environmental services. This storyline is basedon local development in the sense that behavioral changes
Table 2Key informant (KI) prioritization of landscape functions for the ArkemheeneEemland naprioritized functions in gray).
KI Dwelling &infrastructure
Nature/Water
1: State Forestry Service þ þþ2: Dutch Society for
Nature Protectionþ þþ
3: Municipality þ �4: Governmental Agency
for Land andWater Management
þ þþ
5: Landscape Fund þ þþ6: Waterboard þ þþ7: Real estate developer þþ þ8: Citizen of Amersfoort þ þþ9: Province þ þ
are driven from bottom-up local initiatives. But as pointed outby Kok and Alcamo (2007), the sustainability first storylinecould be a global development when strong global institu-tions coordinate local initiatives.
V. Global sustainability (V) is a storyline in which global insti-tutions set the environmental target, counting on strong localinitiatives and local communities to implement localsolutions.
The specific implications for the National Landscape of each ofthe 5 scenarios were evaluated using the information of the keyinformants.
3.2.4. Introducing storylines into the simulation procedureThe storylines must be quantified and translated into model
parameters to be used within the simulation procedure asscenarios. One way to quantify scenarios is the SAS (story andsimulation) approach that links qualitative and quantitativestorylines (Alcamo, 2008). It is an iterative procedure betweenexperts who quantify the storylines and stakeholders who adaptthe storyline based on the results presented. Such an approachstrongly relies on participatory activities. This approach washowever not feasible within the context of this study. Instead, othersources of information were used to quantify the storylines intoscenarios.
Two different types of changes can be modeled with the simu-lation procedure: uniform changes affecting the whole farm pop-ulation and spatially explicit changes affecting farmers in certainlocations only (Pfeifer, 2011). To quantify changes that affect all thefarmers uniformly, scenarios can be quantified on the basis ofobserved statistical trends, expert and KI knowledge, as well liter-ature in order to quantify credible changes. To quantify spatiallyexplicit changes, use was made of future zoning plans, policydocuments and KI knowledge.
4. Results
4.1. Classification of KI storylines
The semi-structured part of the interview allowed for theranking of landscape functions by considering the order in whichthe functions have been mentioned and the emphasis a givenfunction was giving by a KI (Table 2).
Firstly, all KIs mentioned dwelling and infrastructure asimportant function of the area mentioning the planned growth ofAmersfoort. Secondly, none of the stakeholders mentionedcultural heritage as a function but considered this more as a “rai-son d’être” of the area. Thirdly, stakeholders 1, 2, and 4 have
tional landscape (þþ priority, þ important, e less important, and 0 not mentioned;
Agriculture Recreation Culturalheritage
� � 0� � 0
þþ � 0þþ � 0
þþ þ 0
0 þþ 00 þþ 00 þþ 0
þ þ 0

Table 3Linkage between global and local storylines for the ArkemheeneEemland national landscape.
Local storyline Landscape functionprioritization
Assumption of the localstoryline
Global storyline
I Coping with internationalmarkets (KI 3)
Agriculture Trade liberalization Market first
II e e e Security firstIII Meadow birds above
all (KI 1,2)Nature/water Strong regulation Policy first
IV Towards a consumptivelandscape (KI 6, 7, 8)
Nature/water-Recreation Strong bottom-upcitizenefarmer relation
Sustainability first
V Cooperation for thebetter (KI 4, 5)
Agriculture-Nature/water Mental change forstrong cooperation
Global sustainability
C. Pfeifer et al. / Journal of Environmental Management 111 (2012) 96e105100
mentioned a high correlation between the nature and waterfunction in the area. Therefore, these two functions are takentogether. The various KI storylines differ mainly for three land-scape functions: recreation, agriculture and nature/water. Fourdifferent local storylines can therefore be identified depending onwhich of these 3 functions has been stressed: i. nature/water (KI 1and 2) ii. agriculture (KI 3) iii. agriculture and nature/water (KI 4and 5) and iv. recreation and nature/water function (KI 6, 7 and 8).KI 9 mentioned that all functions were equally important(Table 2).
4.2. Development of quantitative scenarios
The link between local storylines and GEO-4 storylines basedon landscape prioritization and major assumptions is shown inTable 3. Focus on agriculture corresponds to the storyline marketfirst (I) assuming trade liberalization. Focus on nature/waterfunction corresponds to the policy first (III) storyline assumingstrong regulation. Focus on the combination recreation and naturecorresponds to a sustainability first (IV) storyline based on theassumption of an increased bottom-up farmer citizen relationshipand finally the focus on the combination of agriculture andnature/water corresponds to a global sustainability (V) storylinebased on the assumption of a fundamental mental change, wheregovernmental organizations and farmers cooperate. The securityfirst (II) global storyline could not be linked to any of the localstorylines.
Table 4Translation of storylines into model parameters for the scenarios in the ArkemheeneEem
Scenario Baserun
Coping withinternationalmarkets
Farm household characteristicsFarm takeover 45% 45%Maximum educationParticipation in
environmental cooperatives�50%
Labor inputHouseholds with off farm income þ11%Number of heads of farms þ6%Farm production characteristicsLivestock intensity þ20%Land based size farms þ30%Farms with organic agriculture �70%Economic size of arable farm þ23%Economic size of fruit farm þ88%Economic size of grazing
animal farmþ60%
Economic size of mixed farm þ39%Site-specific characteristicsGroundwater levelNew eco-neighborhoodsExpansion of Amersfoort Yes
4.2.1. Base run for 2015A base run for 2015 was done, taking aging of the farm pop-
ulation into account. This is done by assuming that the averageage of heads of farm increases by 2.1 years over 10 years over thewhole farm population. This corresponds with the trendobserved between 1999 and 2005 in the Gelderse Vallei region.Life cycle analysis shows that the average age of the head of farmincreases with time but less than one would expect throughnatural aging of the farmer population. This implies that thefarmer population rejuvenates (older farmers leave and new,younger farmers are coming in). Following the trend between1999 and 2005, 45% of the head of farms will exit over the next10 years of which 70% are taken over by younger farmers. Tomodel the average increase over the distribution of the wholefarm population, the average age of head of farms of theselocations was increased by 10 years for a random selection of 55%of the farms. For all other farms the average age of the head offarm was decreased by 7.5 years assuming a take-over byyounger farms (computed as follows [2.1 years-55%*10 years]/45% ¼ �7.5 years) resulting in an increase of average age of headsof farm of 2.1 years over the whole farm population. Table 4shows how the base run 2015 has been translated into thesimulation procedure.
Table 4 also indicates the parameterization of the differentstorylines as translations into the simulation procedure. This will befurther explained below for all storylines, except for global story-line II.
land national landscape.
Meadowbirdsabove all
Consumingthelandscape
Cooperation forthe better
30% 60% 30%þ1
þ100% þ300%
�10%þ10%
�20% �10%
þ20% þ20%
�30% �10%
þ20 cmYes
Yes Yes Yes

Fig. 3. Possible extension of built-up and new developments (eco-neighborhoods) in the national landscape of ArkemheeneEemland.
C. Pfeifer et al. / Journal of Environmental Management 111 (2012) 96e105 101
4.2.1.1. (I) Coping with international markets. In this storyline,agricultural subsidies will be drastically reduced by 2015 in Europe.Becauseworld demand for dairy products grows due to the demandfrom developing countries (FAO, 2006; OECD-FAO, 2008), farmerswill intensify to stay competitive in the world market. Farmersgrow in terms of economic size and land size. For this scenario,aging of the farm population is modeled similarly to the base run.The probability of head of farms working off-farm increases by 12%which corresponds to the trend in the Gelderse Vallei between1999 and 2005 (GIAB). It is assumed that farmers give less
Fig. 4. Spatial distribution of the probability of adoption of rural activities in 2015 and chang
importance to environmental issues and don’t participate in envi-ronmental cooperatives. A decrease of 40% of the probability ofjoining an environmental cooperative has been assumed (trend inthe Gelderse Vallei between 2003 and 2005). Intensification offarming has been modeled with a 20% increase of livestock unitsper hectare and a 5 ha increase of farm land has been assumedbased on the national trend observed between 2005 and 2007(Martins, 2008). Due to this intensification, fewer farmers produceorganically certified products. This is modeled with a 70% decreaseof the probability to be organic and corresponds to the level of
es compared to the base run in 2005 in the national landscape of ArkemheeneEemland.

C. Pfeifer et al. / Journal of Environmental Management 111 (2012) 96e105102
organic production of 1999 in the Gelderse Vallei. The economicsizes of the farm have been extrapolated to 2015 based on thenational trend observed between 1990 and 2007 (LEI, 2008).Finally, like for the other scenarios (except the base run), the city ofAmersfoort has extended towards the limits of the National Land-scape as shown in Fig. 3 based on the zoning plans.
4.2.1.2. (III) Meadow birds above all. For this storyline, it is assumedthat the State Forestry Service and Dutch Society for NatureProtectionwill implement the optimal habitat for meadow birds byincreasing groundwater levels. Subsidies are made available by2015 for paying farmers to steward the landscape inArkemheeneEemland. Farmers farm extensively, mainly organi-cally, the economic size of dairy farming is reduced and manymembers of the household work off farm. Quantitatively, thisscenario foresees an increased probability of organic production by
Fig. 5. Changes of probabilities of adoption of rur
20%, corresponding to a slight increase compared to the stagnationof the number of organic farms in the Netherlands since 2003(Biologica, 2009). The annual average groundwater level is assumedto increase by 20 cm. Young farmers are more reluctant to takeoverfarms and only 30% of the farms are taken over compared to 45%observed between 1999 and 2005 in the Gelderse Vallei. Finally, weassume a decrease of economic value of cattle farming of 30%,corresponding to a plausible yet important loss compared the trendused in the previous scenario.
4.2.1.3. (IV) Towards a consumptive landscape. In this storyline, thelandscape is a consumption good. Due to the growth of the city ofAmersfoort that also brings more people in the area, the demandfor landscape services increases. Farmers become rural entrepre-neurs and provide on-farm shops, care or education services, on-farm cafés or bed and breakfast. Income from rural activities is
al activities respective to the base run 2015.
C. Pfeifer et al. / Journal of Environmental Management 111 (2012) 96e105 103
sufficient and no intensification takes place. Innovative and wellskilled young people takeover the farms. Translation into thesimulation model implies a higher rate (60%) of farms that aretaken over by 2015. More farmers are member of one or twoalready existing environmental cooperatives and work togetherwith the State Forestry Service and the Dutch Society NatureConservation, resulting in a doubling of the participation in envi-ronmental cooperative. Moreover, average number of head of farmincrease by 10% and the number of head of farms with main otherpreoccupation decrease by 10% in order to have sufficient on farmlabor for rural activities. Land size, economic size, probability fororganic agriculture and intensity are unchanged.
4.2.1.4. (V) Cooperation for the better. Cooperation for the better isa storyline with new forms of cooperation between government,farmer and citizens that leads to new forms of institutions allowingan increased funding for farmers to maintain the landscape. In thisframe, the prohibition for constructions within the National Land-scape is relaxed. On past industrial areas, and on locations wherefarmsteads are abandoned, new small eco-neighborhoods arecreated (2e10 houses) where a landscape tax is raised. These newfunds and governmental funds are given to a newly createdcommission for the preservation of meadow birds in which themajor stakeholders are represented. An optimal habitat formeadow birds can be created without changing groundwater levelas diversity in pastures is reached with a coordinated and diversi-fied use of fertilizer (mentioned by KI 4). Due to the high level ofsubsidies made available, more farmers decide to produce moreextensively and therefore the economic size and livestock intensityreduce by 10%. Organic production increases by 20% similarly to themeadow bird above all scenario, education by one unit on theeducation scale (each unit represents one achieved level ofeducation in the Dutch education system), as well as the probabilityto join an environmental cooperative in such a way that 90% of thefarmer participate (implying a 300% increase of the probability ofparticipation). Farm take-over is modeled similarly to the meadowbirds above all scenario. Finally the eco-neighborhoods have beenintroduced as mentioned by KI 5 as extensions of built-up area(Fig. 3).
4.3. Results of modeled scenarios
4.3.1. Base run in 2015Fig. 4 shows the spatial distribution of farmer’s adoption of rural
activities for the base run in 2015. This includes agri-environmentalschemes, recreation and short supply changes (upper part), as wellas the respective change between 2005 and 2015 due to ageing ofthe farmer population (lower part). It shows that in 2015 most ofArkemheeneEemland has a rather high take-up of agri-environmental schemes except for the boarder areas. Recreationtakes placemainly in the south of the study area, while short supplychains are important next to major agglomerations. The spatialdistribution of recreation and short supply chains is almostunchanged in 2015.
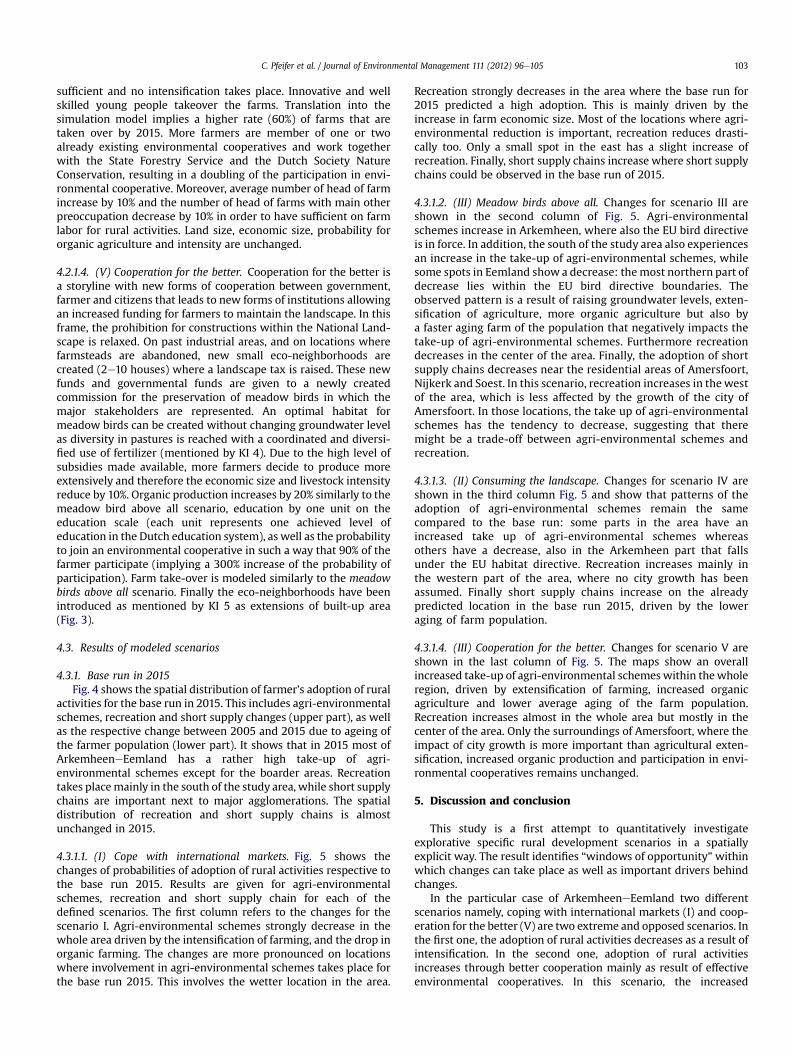
4.3.1.1. (I) Cope with international markets. Fig. 5 shows thechanges of probabilities of adoption of rural activities respective tothe base run 2015. Results are given for agri-environmentalschemes, recreation and short supply chain for each of thedefined scenarios. The first column refers to the changes for thescenario I. Agri-environmental schemes strongly decrease in thewhole area driven by the intensification of farming, and the drop inorganic farming. The changes are more pronounced on locationswhere involvement in agri-environmental schemes takes place forthe base run 2015. This involves the wetter location in the area.
Recreation strongly decreases in the area where the base run for2015 predicted a high adoption. This is mainly driven by theincrease in farm economic size. Most of the locations where agri-environmental reduction is important, recreation reduces drasti-cally too. Only a small spot in the east has a slight increase ofrecreation. Finally, short supply chains increase where short supplychains could be observed in the base run of 2015.
4.3.1.2. (III) Meadow birds above all. Changes for scenario III areshown in the second column of Fig. 5. Agri-environmentalschemes increase in Arkemheen, where also the EU bird directiveis in force. In addition, the south of the study area also experiencesan increase in the take-up of agri-environmental schemes, whilesome spots in Eemland show a decrease: themost northern part ofdecrease lies within the EU bird directive boundaries. Theobserved pattern is a result of raising groundwater levels, exten-sification of agriculture, more organic agriculture but also bya faster aging farm of the population that negatively impacts thetake-up of agri-environmental schemes. Furthermore recreationdecreases in the center of the area. Finally, the adoption of shortsupply chains decreases near the residential areas of Amersfoort,Nijkerk and Soest. In this scenario, recreation increases in thewestof the area, which is less affected by the growth of the city ofAmersfoort. In those locations, the take up of agri-environmentalschemes has the tendency to decrease, suggesting that theremight be a trade-off between agri-environmental schemes andrecreation.
4.3.1.3. (II) Consuming the landscape. Changes for scenario IV areshown in the third column Fig. 5 and show that patterns of theadoption of agri-environmental schemes remain the samecompared to the base run: some parts in the area have anincreased take up of agri-environmental schemes whereasothers have a decrease, also in the Arkemheen part that fallsunder the EU habitat directive. Recreation increases mainly inthe western part of the area, where no city growth has beenassumed. Finally short supply chains increase on the alreadypredicted location in the base run 2015, driven by the loweraging of farm population.
4.3.1.4. (III) Cooperation for the better. Changes for scenario V areshown in the last column of Fig. 5. The maps show an overallincreased take-up of agri-environmental schemeswithin thewholeregion, driven by extensification of farming, increased organicagriculture and lower average aging of the farm population.Recreation increases almost in the whole area but mostly in thecenter of the area. Only the surroundings of Amersfoort, where theimpact of city growth is more important than agricultural exten-sification, increased organic production and participation in envi-ronmental cooperatives remains unchanged.
5. Discussion and conclusion
This study is a first attempt to quantitatively investigateexplorative specific rural development scenarios in a spatiallyexplicit way. The result identifies “windows of opportunity” withinwhich changes can take place as well as important drivers behindchanges.
In the particular case of ArkemheeneEemland two differentscenarios namely, coping with international markets (I) and coop-eration for the better (V) are two extreme and opposed scenarios. Inthe first one, the adoption of rural activities decreases as a result ofintensification. In the second one, adoption of rural activitiesincreases through better cooperation mainly as result of effectiveenvironmental cooperatives. In this scenario, the increased

C. Pfeifer et al. / Journal of Environmental Management 111 (2012) 96e105104
participation allows the different stakeholders to identify winewinsituations and make use of synergies.
The two other scenarios, meadows birds above all (III) andconsuming the landscape (IV), give a more differentiated picture.For both scenarios the agri-environmental reduce in some partsof the EU habitat directive areas. This suggest that strong top-down approaches or self-organizing bottom-up approachesneither allow to reach a suitable habitat for meadow birds, whichonly can be reached with cooperation between the differentstakeholders. Indeed, evaluations of the agri-environmentalschemes in the Netherlands indicate that the uptake of agri-environmental schemes in 2000 and 2005 was not sufficient tocreate suitable habitat for meadow birds (Kleijn et al., 2001;Wiertz and Sanders, 2007) Short supply chains are only weaklyinfluenced by the different scenarios, with the exception of thecooperation scenario (V), where relaxing the existing construc-tion prohibition allows the creation of a new markets for localproducts.
Simulating and visualizing farmers’ decision making based onamicro-economic model raises a number of technical issues amongothers connected to the modeling of farmers’ heterogeneity. Pfeifer(2011) discusses the technical choices that are implicitly made byusing the simulation procedure applied in this study. Nonetheless,some main points need to be addressed in future applications ofthis procedure as presented in this study.
Firstly, the elaboration of the local storylines has been based onkey-informant interviews which were evaluated using resultsfrom the negotiation and learning processes that took place priorto this study. With the approach of this study, the identification ofpossible implausibility’s or inconsistencies within the parame-terization scenarios is limited. The translation of local storylinesinto model parameters was done here using statistical trends,expert knowledge and hypotheses. Nevertheless, the finalparameterization will be subject to discussion. We see our resultstherefore more as input into participatory processes (e.g.Westhoek et al., 2006; Alcamo, 2008; Pahl-Wostl, 2008) ratherthan as end-result.
Secondly, the simulation procedure makes use of a regressionto predict farmers’ adoption of rural services. This approach doesnot allow to assess fundamental behavioral change of farmers’decision making or feedbacks from a policy change cannotassessed. In depth studies of farmer’s decision making to adoptrural activities, as well as system modeling or agent basedapproaches would be needed to address this issue. Unlike otherEuropean landscapes, ArkemheeneEemland is already subject torestrictive rule to maintain the landscape qualities. Therefore,behavioral changes due to more restrictive policies might be lessof an issue.
This paper presents an approach to visualize adoption of ruralactivities under different rural development scenarios. As such, theprediction presented in this paper is illustrative, allowing toexplore and learn rather than to predict the future contribution oflandscape services supplied by farmers.
Acknowledgments
The authors thank Alterra for making the GIAB database avail-able, Maaike van Scheppingen for her support for the interviewsand the reviewers for their valuable comments that contributed toimprove this paper.
Appendix A. Supplementary material
Supplementary material related to this article can be foundonline at http://dx.doi.org/10.1016/j.jenvman.2012.06.019.
References
Alcamo, J., 2008. The SAS approach: combining qualitative and quantitativeknowledge in environmental scenarios. In: Developments in Integrated Envi-ronmental Assessment, pp. 123e150.
Anonymous, 2008. Recreëren langs de Laak. URL: http://www.nijkerk.eu/websites/common/download.asp?PropId¼2762.
Biologica, 2009. Bio-Monitor Jaarrapport 08.Börjeson, L., Höjer, M., Dreborg, K.-H., Ekvall, T., Finnveden, G., 2006. Scenario types
and techniques: towards a user’s guide. Futures 38, 723e739.Cressie, N., 1990. The origins of kriging. Mathematical Geology 22, 239e252.Dalgaard, T., Kjeldsen, C., Jørgensen, M.S., Hutchings, N., Mogensen, L.,
Sahrbacher, A., Damgaard, M., Happe, K., Piorr, A., 2009. Scaling from farm tolandscape. In: Rural Landscapes and Agricultural Policies in Europe,pp. 175e189.
de Groot, R.S., Alkemade, R., Braat, L., Hein, L., Willemen, L., 2010. Challenges inintegrating the concept of ecosystem services and values in landscape planning,management and decision making. Ecological Complexity 7, 260e272.
Ellis, F., 1993. Peasant Economics: Farm Households and Agrarian Development.Cambridge University Press, Cambridge.
European Union, 1979. EU Birds Directive (79/409/CEE).FAO, 2006. World Agriculture towards 2030/2050. Rome.Gómez-Limón, J.A., Gómez-Ramos, A., Sanchez Fernandez, G., 2009. Foresight
analysis of agricultural sector at regional level. Futures 41, 313e324.Happe, K., Kellermann, K., Balmann, A., 2006. Agent-based analysis of agricultural
policies: an illustration of the agricultural policy simulator AgriPoliS, its adap-tation and behavior. Art. 49. Ecology and Society 11.
Hermann, A., Schleifer, S., Wrbka, T., 2011. The concept of ecosystem servicesregarding landscape research: a review. Living Reviews in Landscape Research 5.
Hynes, S., Morrissey, K., O’donoghue, C., Clarke, G., 2009. Building a static farm levelspatial microsimulation model for rural development and agricultural policyanalysis in Ireland. International Journal of Agricultural Resources, Governanceand Ecology 8, 282e299.
Kleijn, D., Berendse, F., Smit, R., Gilissen, N., 2001. Agri-environment schemes do noteffectively protect biodiversity in Dutch agricultural landscapes. Nature 413,723e725.
Kok, K., Alcamo, J., 2007. Report Reviewing Existing Large-scale Scenarios andReasons for Selection of the Set Most Relevant to European Water Issues for theFast-track Process (No. 2.2).
Kok, K., van Vliet, M., Bärlund, I., Alcamo, J., 2008. First Draft of pan-EuropeanStorylines e Results from the First pan-European Stakeholder Workshop.
LEI, 2008. Landbouw-economisch Bericht 2008. Landbouw Economisch Institut,den Haag.
Martins, C., 2008. Farm Structure in the Netherlands.Meerburg, B.G., Korevaar, H., Haubenhofer, D.K., Blom-Zandstra, M., Van Keulen, H.,
2009. The changing role of agriculture in Dutch society. The Journal of Agri-cultural Science 147, 511e521.
Naeff, H.S., 2006. Geactualiseerde GIAB Nederland 2005. Alterra Wageningen,Wageningen.
NLAE, 2007. Nationaal Landschap Arkemheen-Eemland: Open en vital [WWWDocument]. URL: http://www.svgv.nl/arkemheen_eemland/documenten/Deelrapport%20kernkwaliteiten%20150606.pdf.
OECD-FAO, 2008. Agricultural Outlook 2008e2017.Pahl-Wostl, C., 2008. Participation in Building Environmental Scenarios.Peerlings, J., Polman, N., 2004. Wildlife and landscape services production in Dutch
dairy farming; jointness and transaction costs. European Review AgriculturalEconomics 31, 427e449.
Peterson, G.D., Cumming, G.S., Carpenter, S.R., 2003. Scenario planning: a tool forconservation in an uncertain world. The Journal of the Society for ConservationBiology 17, 358e366.
Pfeifer, C., 2011. Modeling Patterns of Farm Diversification in a Dutch Landscape(PhD thesis, Wageningen University, The Netherlands).
Pfeifer, C., Jongeneel, R.A., Sonneveld, M.P.W., Stoorvogel, J.J., 2009. Landscapeproperties as drivers for farm diversification: a Dutch case study. Land UsePolicy 26, 1106e1115.
Piorr, A., Ungaro, F., Ciancaglini, A., Happe, K., Sahrbacher, A., Sattler, C., Uthes, S.,Zander, P., 2009. Integrated assessment of future CAP policies: land usechanges, spatial patterns and targeting. Environmental Science & Policy 12,1122e1136.
Ramos, I.L., 2010. Exploratory landscape scenarios’in the formulation of landscapequality objectives’. Futures 42, 682e692.
Sadoulet, E., de Janvry, A., 1995. Quantitative Development Policy Analysis. HopkinsUniv. Press, Baltimore.
Simão, A., Densham, P.J., (Muki) Haklay, M., 2009. Web-based GIS for collabo-rative planning and public participation: an application to the strategicplanning of wind farm sites. Journal of Environmental Management 90,2027e2040.
Stiboka, 1969. Bodemkaart van Nederland schaal 1: 50.000: toelichting bij kaartblad31 West Utrecht.
Stoorvogel, J.J., Antle, J.M., Crissman, C.C., Bowen, W., 2004. The tradeoff analysismodel: integrated bio-physical and economic modeling of agriculturalproduction systems. Agricultural Systems 80, 43e66.
SVGV, 2006. Deelrapport Kernkwaliteiten. URL: http://www.svgv.nl/arkemheen_eemland/documenten/Deelrapport%20kernkwaliteiten%20150606.pdf.

C. Pfeifer et al. / Journal of Environmental Management 111 (2012) 96e105 105
UNEP, 2007. Global Enviroment Outlook 4: Environment for Development. UnitedNatons Environment Programme (UNEP), Nairobi.
Valbuena, D., Verburg, P.H., Bregt, A.K., Ligtenberg, A., 2010. An agent-basedapproach to model land-use change at a regional scale. Landscape Ecology25, 185e199.
Van Ittersum, M.K., Rabbinge, R., Van Latesteijn, H.C., 1998. Exploratory land usestudies and their role in strategic policy making. Agricultural Systems 58,309e330.
Van Vliet, M., Kok, K., Veldkamp, T., 2010. Linking stakeholders and modellers inscenario studies: the use of Fuzzy Cognitive Maps as a communication andlearning tool. Futures 42, 1e14.
Vandermeulen, V., Gellynck, X., Van Huylenbroeck, G., Van Orshoven, J., Bomans, K.,2009. Farmland for tomorrow in densely populated areas. Land Use Policy 26,859e868.
Westhoek, H.J., van den Berg, M., Bakkes, J.A., 2006. Scenario development toexplore the future of Europe’s rural areas. Agriculture, Ecosystems & Environ-ment 114, 7e20.
Wiertz, J., Sanders, M., 2007. Ecologische evaluatie regelingen voor natuurbeheer:Programma Beheer en Staatsbosbeheer 2000-2006 (No. 500410002). Milieu-enNatuurplanbureau, Bilthoven.
Willemen, L., Verburg, P.H., Hein, L., Van Mensvoort, M.E.F., 2008. Spatial charac-terization of landscape functions. Landscape and Urban Planning 88, 34e43.