farm input prices - ontario and us great lakes region ... · farm input prices - ontario and us...
TRANSCRIPT

Farm Input Prices - Ontario and US Great Lakes Region:
2007-2016 ____________________________________________________
Prepared By:
Delia Bucknell Lynn Marchand
Ken McEwan University of Guelph, Ridgetown Campus
December 2016

Acknowledgements The authors wish to thank Agriculture and Agri-Food Canada (AAFC) and Grain Farmers of Ontario for their financial support of this project. Thanks is also extended to the farm input suppliers that provided data, project enumerators that collected the data, Carolyn Lucio for data entry and others who may have assisted with this project.

Farm Input Prices – Ontario and US Great Lakes Region: 2007-2016
1
Table of Contents 1. Introduction- Farm Input Markets .......................................................................................... 2
1.1 Fuel ................................................................................................................................... 3
1.2 Fertilizer ............................................................................................................................ 4
1.3 Pesticides .......................................................................................................................... 4
2. Farm Input Expenditures in Ontario ........................................................................................ 5
3. Farm Input Expenditures in US Great Lakes Region ................................................................ 6
4. Farm Input Survey Analysis ..................................................................................................... 7
4.1 Fuel ................................................................................................................................... 7
4.2 Fertilizer ............................................................................................................................ 9
4.3 Pesticides ........................................................................................................................ 12
4.3.1 Herbicides ............................................................................................................... 12
4.3.2 Insecticides .............................................................................................................. 16
4.3.3 Fungicides and Growth Regulator .......................................................................... 17
5. Summary and Conclusion ...................................................................................................... 20

Farm Input Prices – Ontario and US Great Lakes Region: 2007-2016
2
1. Introduction- Farm Input Markets Energy is the most important input into agricultural production. Beyond solar energy, it is consumed in the direct form of petroleum (e.g. diesel, gasoline and propane) and indirectly via the energy-intensive inputs of fertilizers and pesticides. The petroleum market is global in scope as the entire world uses petroleum products and the price of the various streams of oil from around the world move together, with persistent differentials between the different grades (US-EIA, 2016a). Fertilizers and pesticides on the other hand have more localized markets due to differing needs in various environments. Different soil types and pests require differing application and management of these inputs.
Previous studies have explored reasons why there are price differences between Ontario and the Great Lakes States. Research by Carlson, Deal, McEwan, & Deen (1999) focused on pesticides however the overall reasons for price differential between two jurisdictions holds true for all of the farm inputs. These reasons that there may be differences include the following;
• market size and transaction costs (transportation, overheads etc.), • demand (producer management decisions, willingness to pay), • availability of substitute products, and • government policy (taxation, registration, patent length).
The Farm Input Monitoring Project Survey is a survey of farm supply stores in Ontario, Michigan, Ohio and Indiana. This survey provides direct data from which price comparisons can be made. Prices are collected for 45 farm inputs from 9 centres in Ontario, 3 in Michigan, 1 in Ohio and 1 in Indiana. In 2016 the survey was conducted 3 times - in May, June and October -and provides insight as to what is occurring with cash retail prices for key farm inputs such as bulk fuels, fertilizer and pesticides. Enumerators in each of the centres collect current pricing from a minimum of 3 retail outlets in their area using a pre-designed survey form.
The survey was started in 1993 and thus provides over two decades of data from which observations can be made. Previous reports and analysis have looked at the historical data (McEwan & Deen, 1997; Verhoijsen, 2011). From 1993 to the early 2000’s Ontario experienced price advantages for almost half of the products surveyed but by 2005 Ontario had a price advantage for only eleven of the 45 products and by 2010 this had dropped to just eight (Verhoijsen, 2011). The purpose of this report is to investigate the difference, if any, in prices between Ontario and neighbouring states in the US from 2007-2016. The States in this region are Ontario’s closest competitors and price differentials in farm inputs can impact the competitiveness of the farming sector. Data for some of the products has become limited, but of the 40 products investigated in detail in this document Ontario has a price advantage in only 6.

Farm Input Prices – Ontario and US Great Lakes Region: 2007-2016
3
Prior to exploring these price trends the following sections provide a brief outline of the input markets agricultural producers are working within.
1.1 Fuel The United States is the largest consumer of petroleum in the world consuming 19.53 million barrels per day in 2015. This equates to 21% of the world’s consumption (US-EIA, 2016c) and in comparison Canada consumed 2.41 million barrels per day, constituting 3% of global consumption. The shale revolution that occurred in the early 2000’s in the US significantly increased the production capacity within the US and in 2015 the US produced 16%, the largest share, of the world’s petroleum while Canada produced 5%. Lower oil prices that occurred during the latter half of 2014 and 2015 were expected to push out the more expensive production from shale oil in the US however that has not occurred and the US continues to produce significant quantities of oil.
The price of regular gasoline and diesel is largely determined by the price of crude oil in the global market and both Canada and the US are equally susceptible to these fluctuations. Global demand, supply, and inventories of crude oil along with financial markets, geopolitical and economic events all influence the price of crude oil (US-EIA, 2016a). Taxes/government policy at a more regional level have a significant influence on the price but do not influence the fluctuations. Local prices are also determined by the cost of transportation of the products to the marketplace and to some extent local demand and supply.
The Canadian and US propane market is an integrated market (National Energy Board, 2016b). Propane is one form of liquid petroleum gas (LPG) and the US is the largest producer and consumer of LPG in the world. Globally, agriculture is a small user of LPG using only 1% of the global consumption. Fifty-six percent of that agricultural consumption occurs in the US (WLPGA, 2015).
The price in the North American market has been quite volatile in recent years, with prices peaking in the winter of 2013/14 when much of the US and Canada was experiencing persistent cold weather from the “polar vortex”. Since then prices have dropped significantly, which has largely been driven by growth in propane production in the US supported by shale gas developments1. However seasonal demand or lack of, such as ideal harvest conditions has also contributed to the lower price of propane. Inventories of propane in both the US and Canada are currently at or above the five year average (National Energy Board, 2016a; US-EIA, 2016b) and with improvements in transportation capabilities exports from both countries have increased. Exports were up by 24% in 2015 in Canada and approximately 50% of propane production in the US is exported (National Energy Board, 2016b).
1 Propane is produced from the processing of natural gas.
Farm Input Prices – Ontario and US Great Lakes Region: 2007-2016
4
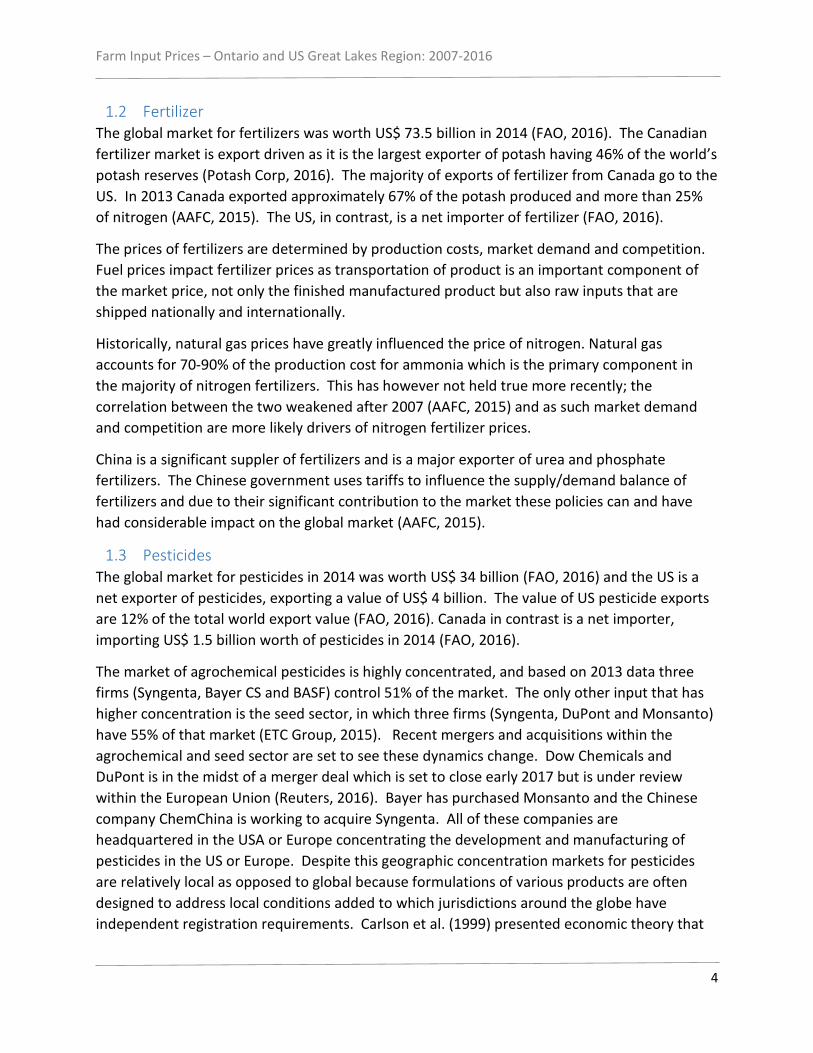
1.2 Fertilizer The global market for fertilizers was worth US$ 73.5 billion in 2014 (FAO, 2016). The Canadian fertilizer market is export driven as it is the largest exporter of potash having 46% of the world’s potash reserves (Potash Corp, 2016). The majority of exports of fertilizer from Canada go to the US. In 2013 Canada exported approximately 67% of the potash produced and more than 25% of nitrogen (AAFC, 2015). The US, in contrast, is a net importer of fertilizer (FAO, 2016).
The prices of fertilizers are determined by production costs, market demand and competition. Fuel prices impact fertilizer prices as transportation of product is an important component of the market price, not only the finished manufactured product but also raw inputs that are shipped nationally and internationally.
Historically, natural gas prices have greatly influenced the price of nitrogen. Natural gas accounts for 70-90% of the production cost for ammonia which is the primary component in the majority of nitrogen fertilizers. This has however not held true more recently; the correlation between the two weakened after 2007 (AAFC, 2015) and as such market demand and competition are more likely drivers of nitrogen fertilizer prices.
China is a significant suppler of fertilizers and is a major exporter of urea and phosphate fertilizers. The Chinese government uses tariffs to influence the supply/demand balance of fertilizers and due to their significant contribution to the market these policies can and have had considerable impact on the global market (AAFC, 2015).
1.3 Pesticides The global market for pesticides in 2014 was worth US$ 34 billion (FAO, 2016) and the US is a net exporter of pesticides, exporting a value of US$ 4 billion. The value of US pesticide exports are 12% of the total world export value (FAO, 2016). Canada in contrast is a net importer, importing US$ 1.5 billion worth of pesticides in 2014 (FAO, 2016).
The market of agrochemical pesticides is highly concentrated, and based on 2013 data three firms (Syngenta, Bayer CS and BASF) control 51% of the market. The only other input that has higher concentration is the seed sector, in which three firms (Syngenta, DuPont and Monsanto) have 55% of that market (ETC Group, 2015). Recent mergers and acquisitions within the agrochemical and seed sector are set to see these dynamics change. Dow Chemicals and DuPont is in the midst of a merger deal which is set to close early 2017 but is under review within the European Union (Reuters, 2016). Bayer has purchased Monsanto and the Chinese company ChemChina is working to acquire Syngenta. All of these companies are headquartered in the USA or Europe concentrating the development and manufacturing of pesticides in the US or Europe. Despite this geographic concentration markets for pesticides are relatively local as opposed to global because formulations of various products are often designed to address local conditions added to which jurisdictions around the globe have independent registration requirements. Carlson et al. (1999) presented economic theory that

Farm Input Prices – Ontario and US Great Lakes Region: 2007-2016
5
explains why price differentials exist (if they do) in pesticides. Prices can differ because of the following;
a) Differences in demand (farmers willingness to pay) for the pesticide b) Differences in transaction costs due to differences in the size of the market c) Differences in demand due to segmentation i.e. the availability of substitute
formulations d) Differences in patent and/or registration requirements.
(Carlson et al., 1999)
Interestingly history has seen each side of the Canada/US border have price advantages at different times. The Carlson et al (1999) study was initiated because farmers in the US Prairies were experiencing higher prices for pesticides than north of the border. Ontario also saw a price advantage during the 1993-1998 timeframe (Carlson et al., 1999). However, it was pointed out by Carlson et al (1999) that ten years prior to their study Canadian farmers were expressing similar concerns of price disadvantages.
2. Farm Input Expenditures in Ontario Through the Agriculture Taxation Data Program, Statistics Canada samples tax filer records. Using this data Statistics Canada reports average operating revenues and expenses by farm type (CANSIM Table 002-0044). The most recent data is for 2014; 2015 data will be released in March 2017.
This data indicates that in 2014 the average Ontario farm spent $38,642 on pesticides, fuel, fertilizers and lime. With 43,685 farms in Ontario approximately $1.68 billion was spent on these farm inputs. In 2014 this represented 22.7% of the total $7.4 billion in crop revenues. Of the $1.68 billion, $358 million was spent on pesticides, $514 million on fuel and $816 million on fertilizer and lime. Figure 1 illustrates these expenses and the portion of crop revenues required to pay for them from 2007-2014. There was a noticeable increase in fertilizer expenses in 2012 which caused a higher percentage of crop revenue to be used to pay for these inputs. The increase in fertilizer prices was driven by a tightening in the global fertilizer market due to higher crop prices that increased demand and drove up prices of fertilizer (AAFC, 2013).

Farm Input Prices – Ontario and US Great Lakes Region: 2007-2016
6
Figure 1: Ontario Input Expenses 2007-2014
Source: Statistics Canada. Table 002-0044 (accessed October 31st 2016) - Detailed average operating revenues and expenses of farms, by farm type, incorporated and unincorporated sectors, Canada and provinces, annual (dollars unless otherwise noted)
3. Farm Input Expenditures in US Great Lakes Region Data from USDA-NASS indicates that in 2014 in the Great Lakes region2 the total expenditure on agricultural chemicals, fuel, fertilizer, lime and soil conditioners was $US5.6 billion. Of this total $US1.31 billion was spent on chemicals, $US1.36 billion on fuel and $US 2.93 billion on fertilizer, lime and soil conditioners. USDA-NASS does not report absolute revenues but rather an income index thus calculating the percent of revenue that these expenses account for was not possible. Again in the US data the increase in price of fertilizer in 2012 is evident. Figure 2 illustrates the movement of expenses in the Great Lakes region from 2007-2015.
2 USDA-NASS quick stats. Survey data was used from Indiana and “Midwest other states” which includes Ohio and Michigan.
20
21
22
23
24
25
26
27
0200400600800
1,0001,2001,4001,6001,8002,000
2007 2008 2009 2010 2011 2012 2013 2014
Exp
ense
s as %
of C
rop
Reve
nues
$CA
D M
illio
ns
Fertilizer and lime expenses Pesticide expensesNet fuel expenses % of crop revenues

Farm Input Prices – Ontario and US Great Lakes Region: 2007-2016
7
Figure 2: Input Expenses for Michigan, Ohio and Indiana 2007-2015.
Source: USDA-NASS (2016) Quick Stats, https://quickstats.nass.usda.gov/
4. Farm Input Survey Analysis The farm input survey conducted by Ridgetown Campus provides a unique look at the prices producers pay within Ontario and neighbouring states around the Great Lakes. This section investigates what has occurred to fuel, fertilizer and pesticide prices during the last decade focusing on the specific products within these categories and comparing the prices in Ontario with those in the US Great Lakes region. All US prices have been converted to Canadian Dollars using the exchange rate from the Bank of Canada on the survey date. All measures of volume/mass/concentration of inputs have been converted to metric allowing for comparison of equivalent products. There are some instances where data has been suppressed due to confidentiality concerns.
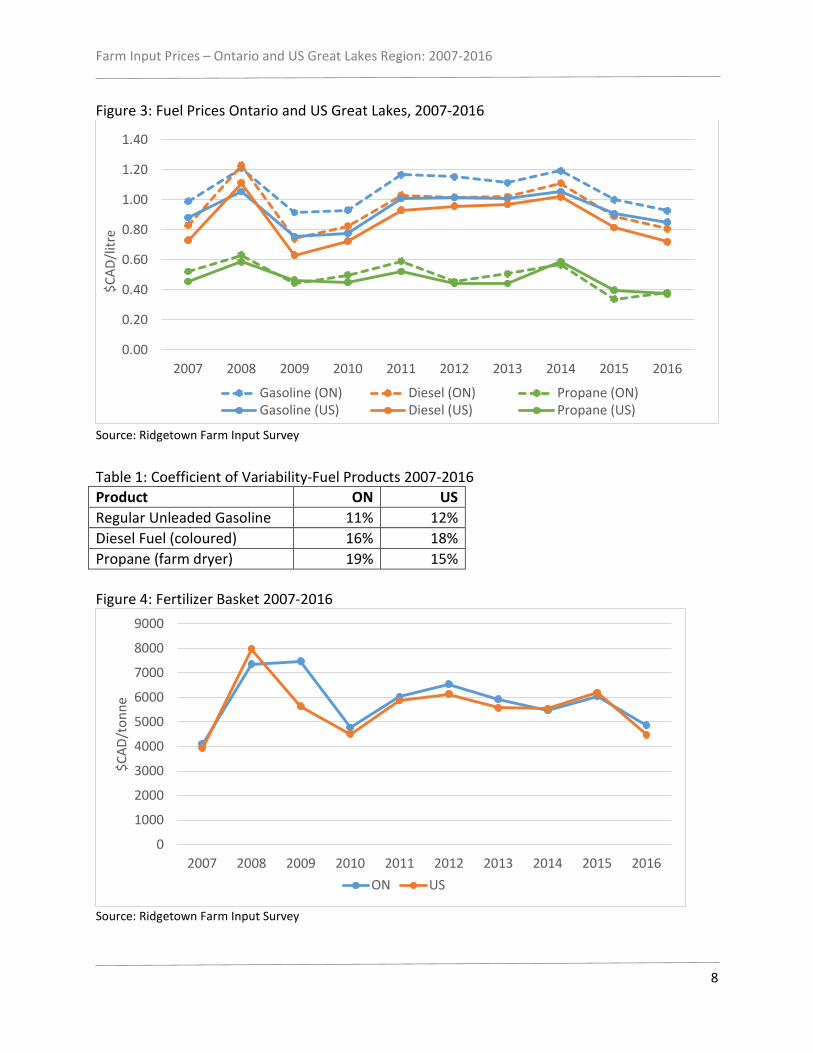
4.1 Fuel Fuel prices in Ontario have been consistently higher than those in the neighbouring Great Lakes region of the US for the past decade with three exceptions regarding propane in 2009, 2014 and 2015, when propane was lower in Ontario. On average over the past decade Ontario gasoline has been 14% higher, diesel fuel 11% higher and propane 4% higher than in the US Great Lakes region (Figure 3). Despite generally being more expensive the prices between the two jurisdictions showed very similar trends indicating that these products are highly influenced by the global market. Although within these very similar patterns of prices, US gasoline and diesel fuel were slightly more variable in prices over the decade than in Ontario whereas propane prices in Ontario varied more than in the US (Table 1).
0
1
2
3
4
5
6
7
2007 2008 2009 2010 2011 2012 2013 2014 2015
$U
S Bi
llion
s
Fertilizer Chemicals Fuel
Farm Input Prices – Ontario and US Great Lakes Region: 2007-2016
8
Figure 3: Fuel Prices Ontario and US Great Lakes, 2007-2016
Source: Ridgetown Farm Input Survey
Table 1: Coefficient of Variability-Fuel Products 2007-2016 Product ON US Regular Unleaded Gasoline 11% 12% Diesel Fuel (coloured) 16% 18% Propane (farm dryer) 19% 15% Figure 4: Fertilizer Basket 2007-2016
Source: Ridgetown Farm Input Survey
0.00
0.20
0.40
0.60
0.80
1.00
1.20
1.40
2007 2008 2009 2010 2011 2012 2013 2014 2015 2016
$CAD
/litr
e
Gasoline (ON) Diesel (ON) Propane (ON)Gasoline (US) Diesel (US) Propane (US)
0
1000
2000
3000
4000
5000
6000
7000
8000
9000
2007 2008 2009 2010 2011 2012 2013 2014 2015 2016
$CAD
/ton
ne
ON US

Farm Input Prices – Ontario and US Great Lakes Region: 2007-2016
9
4.2 Fertilizer There was a notable spike in fertilizer prices in 2008. It was more pronounced in the US than in Ontario (Figure 43) A press release from IFDC4 (2008) describes a “perfect storm” that caused prices of some fertilizers to increase by 4 to 5 times in the space of a year only to drop dramatically at the end of the year. This spike was largely driven by an imbalance of supply and demand. In 2008 there was significant demand for fertilizers from China and India and increasing demand in the United States, Brazil and Europe due to increased corn acreage for the production of biofuels.
Along with high demand, other aspects of the global economy influenced the price of fertilizers during this time. China imposed a tariff on fertilizer exports, the US dollar devalued and energy prices peaked. Natural gas, being essential in the production of nitrogen fertilizer, meant the increase in energy prices directly influenced the price of nitrogen fertilizer. The supply of phosphate rock was limited and the price of sulphur increased thus influencing the price of phosphate fertilizers (IFDC, 2008).
For the purposes of price analysis the suite of fertilizers have been divided into Nitrogen, Phosphate and Potash as per their primary constituents (Figures 5 - 8). A similar price pattern can be seen across all fertilizers with the spike in 2008 and a significant fall in 2009/10. The decline in Ontario tended to be less pronounced or immediate.
On average fertilizers were 4% more expensive in Ontario than in the US over the period 2007-2016.
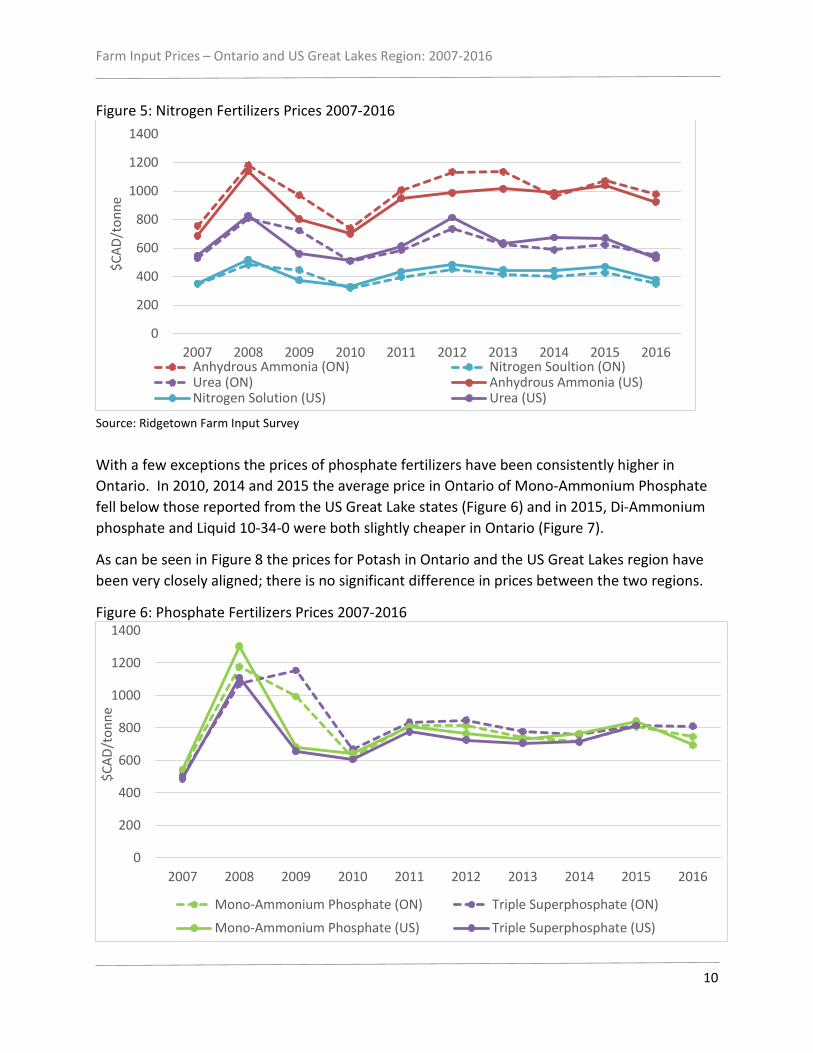
Of the nitrogen fertilizers that are monitored by the farm input survey Anhydrous Ammonia has generally been more expensive in Ontario compared with the US Great Lake states. Prices of all three of the nitrogen fertilizers did not drop as significantly in Ontario after the 2008 spike as they did in the US. The price for Urea and Nitrogen Solution however have come down below that of the US and have remained slightly less expensive in Ontario since 2010, although the average price of Urea did emerge as slightly more expensive in Ontario than in the US for 2016.
3 Basket is the sum of all fertilizer product prices for which the survey has consistent data. 4 International Fertilizer Development Centre
Farm Input Prices – Ontario and US Great Lakes Region: 2007-2016
10
Figure 5: Nitrogen Fertilizers Prices 2007-2016
Source: Ridgetown Farm Input Survey
With a few exceptions the prices of phosphate fertilizers have been consistently higher in Ontario. In 2010, 2014 and 2015 the average price in Ontario of Mono-Ammonium Phosphate fell below those reported from the US Great Lake states (Figure 6) and in 2015, Di-Ammonium phosphate and Liquid 10-34-0 were both slightly cheaper in Ontario (Figure 7).
As can be seen in Figure 8 the prices for Potash in Ontario and the US Great Lakes region have been very closely aligned; there is no significant difference in prices between the two regions.
Figure 6: Phosphate Fertilizers Prices 2007-2016
0
200
400
600
800
1000
1200
1400
2007 2008 2009 2010 2011 2012 2013 2014 2015 2016
$CAD
/ton
ne
Anhydrous Ammonia (ON) Nitrogen Soultion (ON)Urea (ON) Anhydrous Ammonia (US)Nitrogen Solution (US) Urea (US)
0
200
400
600
800
1000
1200
1400
2007 2008 2009 2010 2011 2012 2013 2014 2015 2016
$CAD
/ton
ne
Mono-Ammonium Phosphate (ON) Triple Superphosphate (ON)
Mono-Ammonium Phosphate (US) Triple Superphosphate (US)

Farm Input Prices – Ontario and US Great Lakes Region: 2007-2016
11
Source: Ridgetown Farm Input Survey
Figure 7: Phosphate Fertilizers Prices 2007-2016
Source: Ridgetown Farm Input Survey
Figure 8: Muriate of Potash Price 2007-2016
Source: Ridgetown Farm Input Survey
400
600
800
1000
1200
1400
2007 2008 2009 2010 2011 2012 2013 2014 2015 2016
$CAD
/ton
ne
Di-Ammonium Phosphate (ON) Liquid 10-34-0 (ON)
Di-Ammonium Phosphate (US) Liquid 10-34-0 (US)
200
400
600
800
1000
1200
1400
2007 2008 2009 2010 2011 2012 2013 2014 2015 2016
$CAD
/ton
ne
Muriate of Potash (ON) Muriate of Potash (US)

Farm Input Prices – Ontario and US Great Lakes Region: 2007-2016
12
4.3 Pesticides As can be seen in Figure 9 the cost of the basket of pesticides5 has been consistently higher in Ontario compared to the US Great Lake states. On average in Ontario, the basket of pesticides has seen Ontario prices that are 57% higher than those reported in the US Great Lakes region. This section explores the trends seen in specific products within the categories of herbicides, insecticides, fungicides and one growth regulator. All US prices have been converted to Canadian dollars based on the exchange rate on the survey day and also converted to Canadian units of measure. In the following section charts refer to $CAD only because some products are sold by weight and some by volume.
Figure 9: Pesticide Basket 2007-2016
Source: Ridgetown Farm Input Survey
4.3.1 Herbicides Herbicides is the largest group of pesticides monitored by the Farm Input survey. There are a total of 20 herbicides that have been tracked. Of the 20, Reglone is the only herbicide that is not compared in the following graphs as there have been no US prices recorded for the past six years. The data that is available indicated that the price/value in the US of this product declined by over 50% in 2010, $36.94/litre to $16.34/litre. In Ontario, however the price has remained buoyant for the past decade ranging from $31.96-$27.07 and averaging $29.64. Herbicides in Ontario have on average been 52% more expensive (Figure 10).
5 Basket is the sum of all pesticide product prices for which the survey has consistent data.
0
200
400
600
800
1000
1200
1400
1600
2007 2008 2009 2010 2011 2012 2013 2014 2015 2016
$CAD
ON US

Farm Input Prices – Ontario and US Great Lakes Region: 2007-2016
13
Figure 10: Herbicide Basket 2007-2016
Source: Ridgetown Farm Input Survey
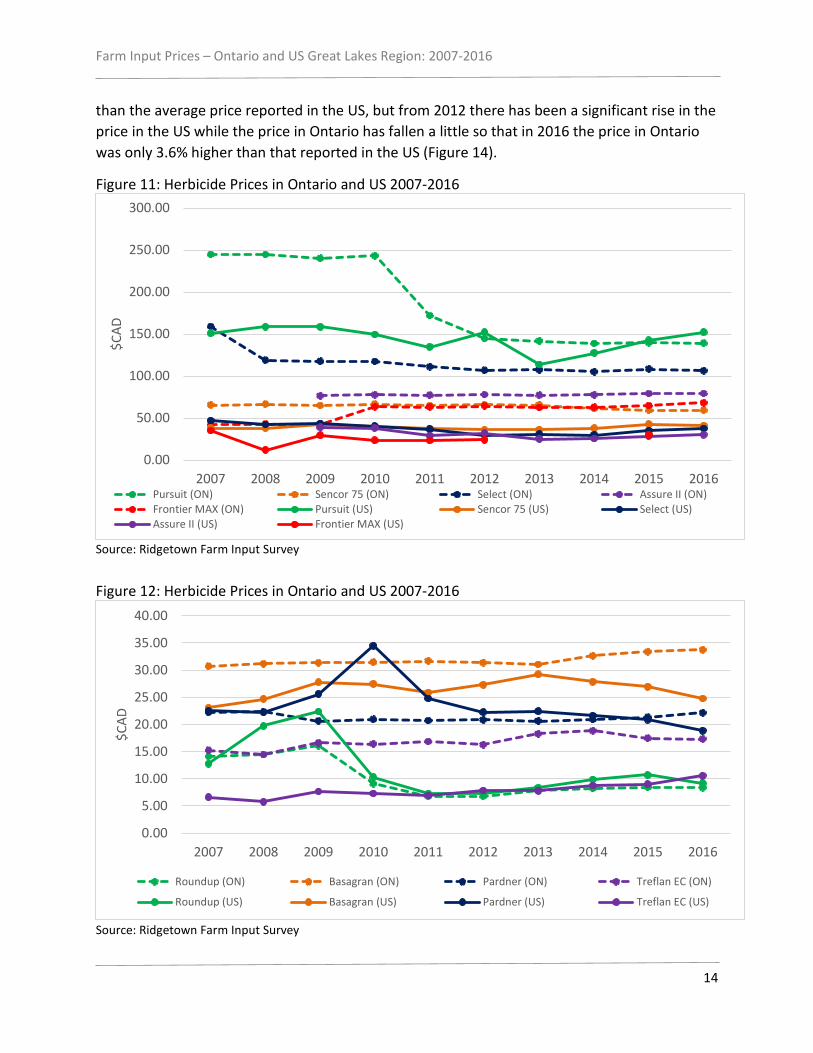
Figures 11-14 compare the prices of the suite of herbicides monitored in the Ridgetown farm input survey. Of the twenty herbicides five have been cheaper in Ontario and only one, Roundup6, has been consistently cheaper in Ontario since 2007 when it was $1.35 more expensive in Ontario. Although, Pardner, a Bayer product that controls glyphosate resistant volunteer plants, had tended to be cheaper in Ontario until recently when prices reported in 2015 and 2016 were higher in Ontario (Figure 12).
From 2007-2010 Pursuit herbicide from BASF saw prices reported in Ontario averaging 57% more than those reported in the US. In 2011 and 2012 the price in Ontario dropped and has since been relatively stable around $140/litre. Fluctuations in the US price resulted in lower prices for Pursuit reported in Ontario during 2012, 2015 and 2016 (Figure 11).
The prices reported for Prowl have been increasing in both Ontario and the US Great Lakes region however, the upward trajectory has been more pronounced in the US and hence in 2015 and 2016 this product was more expensive in the US than in Ontario (Figure 13).
Devrinol was cheaper in Ontario in 2007 and 2008 but in 2009 the price rose by 38% making the price 24% higher in Ontario than in the US. It remained higher in Ontario until recently. In 2015 and 2016 the price of Devrinol was again lower in Ontario.
There is another interesting trend that stands out. The price of Banvell II in the two jurisdictions has shown a trend of converging although there has been more variability in the prices reported in the US compared to Ontario. In 2012 the price in Ontario was 132% higher
6 Although labelled “Roundup” in Figure 12 this refers to Roundup WeatherMAX. Some labels have been shortened to increase the ease of reading the graphs. A list of the products monitored is provided in Table 2.
0
200
400
600
800
1000
2007 2008 2009 2010 2011 2012 2013 2014 2015 2016
$CAD
ON US
Farm Input Prices – Ontario and US Great Lakes Region: 2007-2016
14
than the average price reported in the US, but from 2012 there has been a significant rise in the price in the US while the price in Ontario has fallen a little so that in 2016 the price in Ontario was only 3.6% higher than that reported in the US (Figure 14).
Figure 11: Herbicide Prices in Ontario and US 2007-2016
Source: Ridgetown Farm Input Survey
Figure 12: Herbicide Prices in Ontario and US 2007-2016
Source: Ridgetown Farm Input Survey
0.00
50.00
100.00
150.00
200.00
250.00
300.00
2007 2008 2009 2010 2011 2012 2013 2014 2015 2016
$CAD
Pursuit (ON) Sencor 75 (ON) Select (ON) Assure II (ON)Frontier MAX (ON) Pursuit (US) Sencor 75 (US) Select (US)Assure II (US) Frontier MAX (US)
0.00
5.00
10.00
15.00
20.00
25.00
30.00
35.00
40.00
2007 2008 2009 2010 2011 2012 2013 2014 2015 2016
$CAD
Roundup (ON) Basagran (ON) Pardner (ON) Treflan EC (ON)
Roundup (US) Basagran (US) Pardner (US) Treflan EC (US)

Farm Input Prices – Ontario and US Great Lakes Region: 2007-2016
15
Figure 13: Herbicide Prices in Ontario and US 2007-2016
Source: Ridgetown Farm Input Survey
Figure 14: Herbicide Prices in Ontario and US 2007-2016
Source: Ridgetown Farm Input Survey
0.00
2.00
4.00
6.00
8.00
10.00
12.00
14.00
16.00
18.00
2007 2008 2009 2010 2011 2012 2013 2014 2015 2016
$CAD
2,4-D Amine (ON) Atrazine (ON) Accent 75 DF (ON) MCPA Amine (ON)2,4-D Amine US) Atrazine (US) Accent 75 DF (US) MCPA Amine (US)Prowl (ON) Prowl (US)
10.00
15.00
20.00
25.00
30.00
35.00
40.00
45.00
50.00
2007 2008 2009 2010 2011 2012 2013 2014 2015 2016
$CAD
Banvel II 480 (ON) Dual II Magnum (ON) Devrinol 50 DF (ON) Reflex (ON)
Banvel II 480 (US) Dual II Magnum (US) Devrinol 50 DF (US) Reflex (US)

Farm Input Prices – Ontario and US Great Lakes Region: 2007-2016
16
4.3.2 Insecticides The farm input survey has consistent data on 4 insecticides over the last decade; Matador, Malathion, Sevin and Force. Matador is sold under the label Warrior in the US and there was significant change in the price when the product was switched from Warrior to Warrior II in 2013. It declined by 48% in the US, while in Ontario the price rose by 2% (Figure 15). The basket of products represented in Figure 16 excludes Matador due to it being significantly more expensive and thus has a disproportional influence on the basket and the fact that there have been significant price changes in the US that skew the overall picture. In general the price of insecticides has continued to climb in Ontario and the US over the past decade, excluding Matador. The annual average increase in prices has been 5% in Ontario and 7% in the US (Figure 16). However prices are consistently lower in the US compared with Ontario barring one recent exception. The price of Force has been slightly less expensive in Ontario for the past two years, 2015 and 2016 (Figure 17). Figure 15: Matador Price 2007-2016
Source: Ridgetown Farm Input Survey
0
50
100
150
200
250
2007 2008 2009 2010 2011 2012 2013 2014 2015 2016
CAD$
ON US

Farm Input Prices – Ontario and US Great Lakes Region: 2007-2016
17
Figure 16: Insecticide Basket Price 2007-2016
Source: Ridgetown Farm Input Survey
Figure 17: Insecticide Prices in Ontario and US 2007-2016
Source: Ridgetown Farm Input Survey
4.3.3 Fungicides and Growth Regulator Ontario has recently reported a price advantage over the US in many of the fungicide products. One product in particular where Ontario has a price disadvantage, is Nova. In 2007 there was an 11% differential in price but this differential expanded in 2008 as the price fell in the US yet continued an upward trend in Ontario. The difference in 2016 was 52% (Figure 18). Captan is the other product that has maintained a significant differential between Ontario and the US. In the past decade it has on average been 57% more expensive in Ontario.
0
10
20
30
40
50
60
70
2007 2008 2009 2010 2011 2012 2013 2014 2015 2016
CAD$
ON US
0.00
5.00
10.00
15.00
20.00
25.00
30.00
2007 2008 2009 2010 2011 2012 2013 2014 2015 2016
$CAD
Malathion (ON) Sevin XLR+ (ON) Force 3G (ON)
Malathion (US) Sevin XLR+ (US) Force 3G (US)

Farm Input Prices – Ontario and US Great Lakes Region: 2007-2016
18
Figure 18: Price of Nova Fungicide 2007-2016
Source: Ridgetown Farm Input Survey
Bravo has also generally maintained a higher price in Ontario than in the US with an average annual differential of 27%. However, the price variation in the US has been substantially more than that seen in Ontario (Ontario CV = 11.5%, US CV= 26.6%) This is largely influenced by the significant decline in price during 2010 and 2011 then continual increases since. However, most recently Ontario had a price advantage over the US for this product.
Dithane and Gavel prices have on average been lower in Ontario than the US Great Lakes region during the past decade. The price of Dithane has been divergent. The Ontario price has trended down while the US has experienced more volatility and trended upwards. There was a large price adjustment in 2009 that saw the price jump 94% in the US and 48% in Ontario. This influenced the average annual increase for the decade that was 12% in the US and 4 % in Ontario.
The average annual difference between Ontario and US Great Lakes for Gavel has been –1.6% but the US price has seen substantially more variation (Ontario CV=8%, US CV = 20%).
0
50
100
150
200
250
300
2007 2008 2009 2010 2011 2012 2013 2014 2015 2016
CAD$
ON US

Farm Input Prices – Ontario and US Great Lakes Region: 2007-2016
19
Figure 19: Fungicide Prices in Ontario and US 2007-2016
Source: Ridgetown Farm Input Survey
One growth regulator, Ethrel, is monitored in the farm input survey, the price of which has seen very little variability over the last decade and has on average been 38% higher in Ontario than in the US Great Lakes region
Figure 20: Growth Regulator Prices in Ontario and US 2007-2016
Source: Ridgetown Farm Input Survey
0.00
5.00
10.00
15.00
20.00
25.00
30.00
35.00
2007 2008 2009 2010 2011 2012 2013 2014 2015 2016
Bravo (ON) Captan (ON) Dithane (ON) Gavel (ON)
Bravo (US) Captan (US) Dithane (US) Gavel (US)
0
5
10
15
20
25
2007 2008 2009 2010 2011 2012 2013 2014 2015 2016
CAD$
ON US
Farm Input Prices – Ontario and US Great Lakes Region: 2007-2016
20
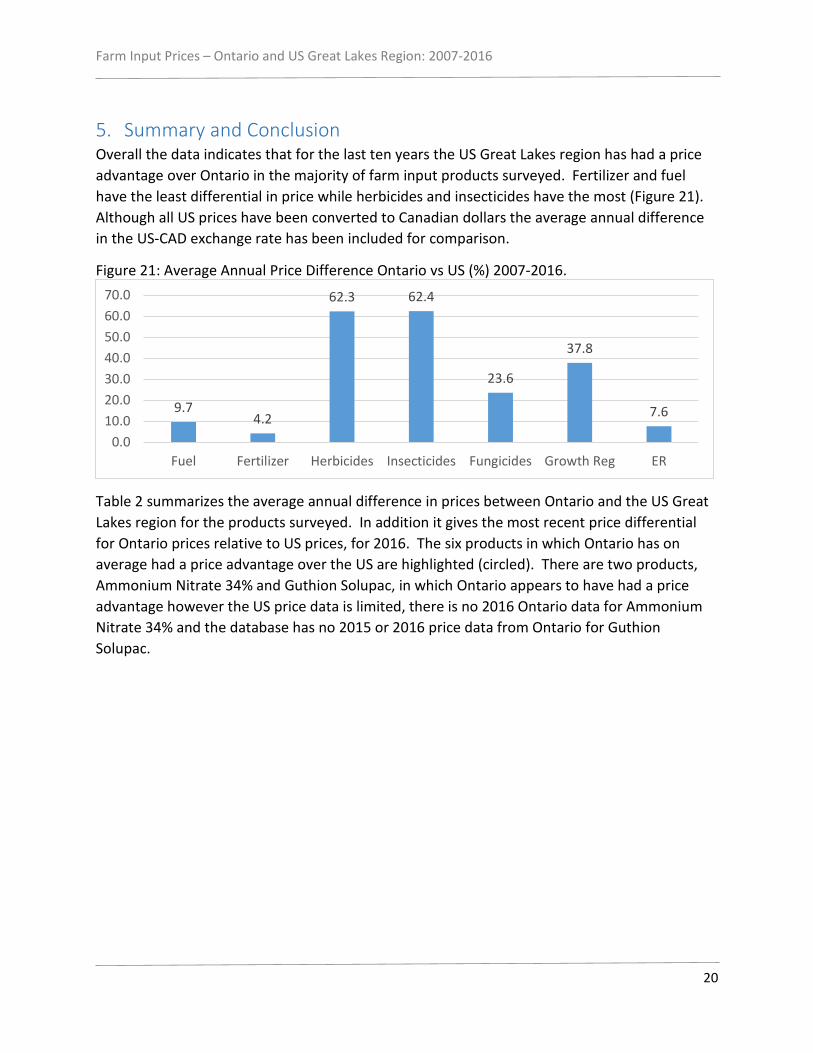
5. Summary and Conclusion Overall the data indicates that for the last ten years the US Great Lakes region has had a price advantage over Ontario in the majority of farm input products surveyed. Fertilizer and fuel have the least differential in price while herbicides and insecticides have the most (Figure 21). Although all US prices have been converted to Canadian dollars the average annual difference in the US-CAD exchange rate has been included for comparison.
Figure 21: Average Annual Price Difference Ontario vs US (%) 2007-2016.
Table 2 summarizes the average annual difference in prices between Ontario and the US Great Lakes region for the products surveyed. In addition it gives the most recent price differential for Ontario prices relative to US prices, for 2016. The six products in which Ontario has on average had a price advantage over the US are highlighted (circled). There are two products, Ammonium Nitrate 34% and Guthion Solupac, in which Ontario appears to have had a price advantage however the US price data is limited, there is no 2016 Ontario data for Ammonium Nitrate 34% and the database has no 2015 or 2016 price data from Ontario for Guthion Solupac.
9.7 4.2
62.3 62.4
23.6
37.8
7.6
0.010.020.030.040.050.060.070.0
Fuel Fertilizer Herbicides Insecticides Fungicides Growth Reg ER

Farm Input Prices – Ontario and US Great Lakes Region: 2007-2016
21
Table 1: Price Difference Ontario vs US Great Lakes Region (2007-2016)
ProductAverage Annual Difference
in Price (US Base)2016 Price Diff.
Regular Unleaded Gasoline 14.1 9.0Diesel Fuel (coloured) 10.7 12.0Propane (farm dryer) 4.2 1.8Anhydrous Ammonia 82-0-0 (no service) 7.9 5.9Urea 46% -0.9 4.5Nitrogen Solution (UAN) 28% -4.0 -7.6Ammonium Nitrate 34% -4.6 NAMono-Ammonium Phosphate 11-52-0 3.7 7.3Di-Ammonium Phosphate 18-46-0 9.0 18.5Triple Superphosphate 0-46-0 14.3 NAMuriate of Potash 60% 1.8 13.1Liquid 10-34-0 10.6 12.12,4-D Amine 600 (564 g/l EC) 59.6 70.2Atrazine 480 (480 g/l SU) 74.3 75.8Banvel II 480 (480 g/l SN) 76.5 3.6Accent 75 DF (75 DF) 58.5 73.6Dual II Magnum (915 g/l EC) 17.8 13.5Dual II Magnum (915 g/l EC) bulk 23.7 27.7Frontier MAX (720 g/L EC) 135.6 NAMCPA Amine 500 (500 g/l SN) 55.6 51.4Pursuit (240 g/l SN) 27.6 -8.6Reglone (240 g/l SN) 7.3 NARoundup Weather Max (540 g/l SN) -12.3 -9.1Sencor 75 DF (75% WG) 65.6 45.8Select (240 g/L EC) 214.2 185.2Basagran (480 g/l SN) 20.8 36.2Prowl (400 g/l EC) 11.4 -8.6Pardner (280 g/l EC) -7.4 17.5Treflan EC (480 g/l EC) 118.1 64.3Devrinol 50 DF (50% DF) 7.3 -9.1Assure II (96 g/L EC) 158.2 163.4Reflex (240 g/L EC) 94.3 168.8Furadan 480F (480 g/l F) 68.8 NAMalathion 500 EC (500 g/l EC) 100.3 82.6Sevin XLR+ (480 g/l LI) 29.0 21.5Force 3 G (3% G) 18.8 -1.9Guthion Solupac (50% WP) -1.8 NAMatador 120EC (120 g/L EC) 147.0 221.1Thiodan 4 EC (400 g/L EC) 74.6 NABravo (500 g/l SC) 27.5 -16.8Captan 80 W (80% DG) 56.8 74.7Dithane DG Rainshield (80% WP) -22.2 -43.8Nova 40 W (40% WP) 57.2 52.3Gavel 75DF -1.6 -22.0
Gro
wth
Re
g. Ethrel (240 g/l LI) 37.8 NA
Fuel
Fert
ilize
rHe
rbic
ides
Inse
ctic
ides
Fugi
cide
s
Farm Input Prices – Ontario and US Great Lakes Region: 2007-2016
23
In conclusion, during the time period 2007-2016 the majority of product prices surveyed showed Ontario at a price disadvantage compared to nearby Great Lake states. However, some products such as Nitrogen Solution, Urea, Roundup Weather Max, Dithane Rainshield, Pardner and Gavel were lower priced in Ontario.

Farm Input Prices – Ontario and US Great Lakes Region: 2007-2016
24
References:
AAFC. (2013). Canadian Farm Fuel and Fertilizer: Prices and Expenses. Market Outlook Report, 4(1). Retrieved from http://www.agr.gc.ca/resources/prod/doc/misb/mag-gam/mor-rmar/pdf/rmar_05_01_2013_eng.pdf
AAFC. (2015). Canadian farm fuel and fertilizer: prices and expenses. Market Outlook Report, 6(1), 1–10. Retrieved from http://www.agr.gc.ca/resources/prod/doc/misb/mag-gam/mor-rmar/pdf/rmar_06_01_2016_en.pdf
Carlson, G., Deal, J., McEwan, K., & Deen, B. (1999). Pesticide Price Differentials Between Canada and The US. United States Department of Agriculture, Economic Research Service and Agriculture and AgriFood Canada.
ETC Group. (2015). Breaking Bad: Big Ag Mega-Mergers in Play Dow + DuPont in the Pocket? Next DeMonsanto? ETC Group Communique 115. Retrieved from http://www.etcgroup.org/sites/www.etcgroup.org/files/files/etc_breakbad_final_dec_15_15_0.pdf
FAO. (2016). FAOSTAT: Food and Agriculture Data. Retrieved November 22, 2016, from http://www.fao.org/faostat/en/#home
IFDC. (2008). World fertilizer prices drop dramatically after soaring to all-time highs. Retrieved November 1, 2016, from https://www.eurekalert.org/pub_releases/2008-12/i-wfp121608.php
National Energy Board. (2016a). Liquefied Petroleum Gas (LPG) - Statistics. Retrieved November 23, 2016, from https://www.neb-one.gc.ca/nrg/sttstc/ntrlgslqds/stt/lqdptrlmgsr-eng.html
National Energy Board. (2016b). Propane Market Review : 2016 Update. Retrieved November 22, 2016, from http://www.neb-one.gc.ca/nrg/sttstc/ntrlgslqds/rprt/2016/2016prpn-eng.pdf
Potash Corp. (2016). Potash-Overview. Retrieved November 23, 2016, from http://www.potashcorp.com/overview/nutrients/potash/overview/world-potash-reserves
Reuters. (2016). The EU Has Halted Its Dow and DuPont Merger Review. Fortune Magazine, 6th Septem. Retrieved from http://fortune.com/2016/09/09/dow-chemical-dupont-merger/
Statisitics.Canada. (n.d.). CANSIM Table 002-0044 - Detailed average operating revenues and expenses of farms, by farm type, incorporated and unincorporated sectors, Canada and provinces, annual (dollars unless otherwise noted). Retrieved October 31, 2016, from http://www5.statcan.gc.ca/cansim/home-accueil?lang=eng
US-EIA. (2016a). Energy & Financial Markets: WHAT DRIVES CRUDE OIL PRICES? Retrieved November 21, 2016, from http://www.eia.gov/finance/markets/crudeoil/spot_prices.cfm
US-EIA. (2016b). Petroluem and Other Liquids: Total Stocks. Retrieved November 23, 2016, from https://www.eia.gov/dnav/pet/pet_stoc_wstk_dcu_nus_a.htm

Farm Input Prices – Ontario and US Great Lakes Region: 2007-2016
25
US-EIA. (2016c). World Petroleum and Other Liquids Consumption (Million Barrels per Day). Retrieved November 22, 2016, from http://www.eia.gov/forecasts/steo/tables/?tableNumber=30#
WLPGA. (2015). World LPG Association: Annual Report. Retrieved November 23, 2016, from http://www.wlpga.org/about-us/annual-reports/