fareshare footprint methodology report
TRANSCRIPT
FareShare Footprint Methodology Report The Carbon Trust
September 2021

Acknowledgments This report is produced by the Carbon Trust based on impartial analysis of primary and secondary sources,
including expert interviews.
The Carbon Trust would like to thank everyone that has contributed their time and expertise during the
preparation and completion of this report.
For the avoidance of doubt, this report expresses independent views of the authors.

Who We Are Established in 2001, the Carbon Trust works with businesses, governments and institutions around the
world, helping them contribute to, and benefit from, a more sustainable future through carbon reduction,
resource efficiency strategies, and commercialising low carbon businesses, systems and technologies.
The Carbon Trust:
• works with corporates and governments, helping them to align their strategies with climate science
and meet the goals of the Paris Agreement;
• provides expert advice and assurance, giving investors and financial institutions the confidence that
green finance will have genuinely green outcomes; and
• supports the development of low carbon technologies and solutions, building the foundations for
the energy system of the future.
Headquartered in London, the Carbon Trust has a global team of over 200 staff, representing over 30
nationalities, based across five continents.
The Carbon Trust’s mission is to accelerate the move to a sustainable,
low carbon economy. It is a world leading expert on carbon reduction
and clean technology. As a not-for-dividend group, it advises
governments and leading companies around the world, reinvesting
profits into its low carbon mission.

Authors
Name : Fergal Byrne
Title : Analyst
email : [email protected]
Name : Noortje Crabbendam
Title : Senior Analyst
email : [email protected]
Name : Tianqi Li
Title : Consultant
email : [email protected]

1
Contents
Acknowledgments ...................................................................................................... 2
Who We Are ................................................................................................................. 3
Authors ......................................................................................................................... 4
1. Introduction ................................................................................................................. 2
1.1 Scope & Boundary ........................................................................................... 3
1.2 Data quality assurance ......................................................................................... 4
2. Scope 1 & 2 and outsourced distribution emissions ............................................... 5
2.1 Data sources .................................................................................................... 5
2.2 Methodology for quantifying scope 1 , 2 & outsourced transportation and distribution emissions..................................................................................... 7
2.3 Assumptions .................................................................................................... 9
3. Embedded Environmental Impact of Redistributed Waste Food .......................... 10
3.1 Data sources .................................................................................................. 10
3.2 Methodology .................................................................................................. 11
4. Results ....................................................................................................................... 14
4.1 Scope 1: Fuel use .......................................................................................... 15
4.2 Scope 2: Purchased electricity ..................................................................... 15
4.3 Scope 3: Outsourced transport & distribution ............................................. 16
4.4 Environmental Impact Results ..................................................................... 17
4.5 FareShare Net Impact 2019/2020 .............................................................. 20
5. Summary and recommendations ............................................................................ 22
5.1 Annual Update Procedure ............................................................................. 22
5.2 Recommendations ........................................................................................ 22
Bibliography ...................................................................................................................... 24

2
1. Introduction FareShare encompasses a national network of charitable food redistributors within the UK, the
organisation takes good quality surplus food from across the food industry and get it to more than
10,500 frontline charities and community groups. FareShare would like to understand and
communicate the organisation’s positive environmental impacts generated by redistributing surplus
food that would otherwise be wasted. The Carbon Trust carried out an analysis quantifying these
environmental impacts as greenhouse gas emissions and embedded water consumption. This report
explains the methodological basis for the conducted analysis, and the result arrived.
The FareShare’s overall environmental impact is split into the organisation’s operational emissions, and
the impact of avoided food waste (as shown in Figure 1). These two categories were analysed
separately, and hence two models were created. The water consumption of FareShare’s own operations
was not calculated as it fell outside the scope of this analysis.
Figure 1 FareShare's environmental impact
FareShare’s operational emission is analysed as scope 1 and 2 emission, and outsourced distribution
and transportation emissions following the Greenhouse Gas Protocol Organisational Footprinting
Standard1, which overlooks both direct and indirect emission generated through the organisation’s own
facilities and vehicles, as well as purchased electricity, cooling, and heating as demonstrated in Figure
2. This category will be referred to as “FareShare’s Scope 1&2 Footprint and outsourced distribution
and transportation emissions” within the remainder of the report.
1 Greenhouse Gas Protocol, A Corporate Accounting and Reporting Standard, WBCSD, WRI
Fareshare's environmental impact
Fareshare's operational emission
GHG emissions
Avoided emission from food waste
GHG emissions
Embeded water consumtpion

3
Figure 2: Greenhouse gas protocol scopes
The GHG emissions associated with the food waste avoided was analysed following Category 1 of the
Greenhouse Gas Protocol on Corporate Value Chain (Scope 3) Accounting and Reporting Standard. The
embodied water was analysed following the Water Footprint Assessment Manual. The impact of
avoided food waste will be referred to as the “Embedded Environmental Impact of Redistributed Waste
Food”.
1.1 Scope & Boundary
Figure 3 below shows the simplified lifecycle of food enters and leaves FareShare’s network.
The embodied environmental impact of FareShare’s redistribution operations calculated each products
cradle-to-gate lifecycle along the first three segments; the gate boundary is defined as the moment they
enter FareShare’s network. This boundary also includes any upstream transport that may occur in the
food items’ life cycle.

4
Figure 3 FareShare Food Lifecycle
1.2 Data quality assurance
A data quality assessment consists of four data quality criteria were applied to ensure reliability of the
analysis. Table 1 summarises the results from data quality assessment.
For both the Scope 1&2 and environmental impact footprints, all data was provided by FareShare and
their direct suppliers. A sensitivity analysis was not carried out on the footprints due to the high-level
nature of the Scope 1&2 analysis. Assigning the food waste to the emission factors was checked
through to ensure the categorisation approach was correct for the study.
Table 1: Data Quality Assessment
Exercise Time
Specificity Completeness
of Data Data Source Auditability
Scope 1 & 2 footprint and outsourced
paid distribution
2019/2020, reasonably
recent
Majority of data correctly matched with
factors
Primary & secondary data
All data sources
documented
Food Waste Impact
2019/2020, majority of
data matched reporting
period
Majority of data correctly matched with
factors
Primary Data All data sources
documented
Charities and Orgnisations
Fareshare
• Regional Distribution Centres
• Charities
Distribution & retail
• Supermarkets
• Vendors
• Farms

5
2. Scope 1 & 2 and outsourced distribution emissions
2.1 Data sources
2.1.1 Activity data sources
The activity data supplied by FareShare was compiled from the following sources:
• Fuel use: invoices for vehicle fuel purchases, split by location
• Electricity usage: Invoices, split by location.
• Gas consumption: there was no gas consumption for FareShare.
• F-gas: no data on fugitive gas was provided by FareShare. Fareshare was unable to retrieve this
data
• Outsourced distribution and transport: summary of all invoices paid to transportation and
distribution suppliers
The breakdown of data received is listed in Table 2 below. The table also includes the approach taken
to calculate the emission. The different approaches will be discussed in the relevant sections.
FareShare data for the reporting period was provided by FareShare business units in the following files:
Table 2: Data Received Relating to Scope 1&2 and outsourced transportation and distribution
FareShare Business Unit
File Name Approach FareShare data
owner
Fuel use
Total Fuel use (all locations)
FS Fuel Summary (Excel Financial spend
Gavin Aldridge
Fuel use
All PDF invoices:
Invoices 8610, 1452
Invoice May'19 - E201187187, E2011367176, E2011315649, E2011253811,7176, 5649, 3811
Invoices:E2011481618, E2011430739, 1618, 739
Financial spend & litres used
Gavin Aldridge

6
Invoices: E2011613661, E2011562048, 2048, 3661
Invoice E2011674929, 4929
Invoice E2011789108, E2011731117, 9108, 1117
Invoices 4885, 9544, 8535
invoice 2770
invoice 1971, 6321, 5394
Electricity
East Anglia
£375.62 – 512922020453586 (PDF) 482294-£375.17 (PDF) 4917276300007_£772.65 (PDF) 4917276300009_£381.66(PDF) 4917276300009_£381.66 (Excel) SSE - 491727630-0008 Southern Electric -884.67 (PDF)
Average Units used Gavin Aldridge
Evelyn Court (Office 1& 2)
3057 (PDF)
FareShare electricity invoice_2773 (PDF)
FareShare electricity invoice_2971 (PDF)
FareShare electricity invoice_2971 (Excel)
Average Units used Gavin Aldridge
Merseyside
£3407.59- Invoice_995295116 (PDF)
711710727_£2419.02_141596537 (PDF)
Invoice 370644020 - £2031.58 - DD Payment (PDF)
Invoice_985373792 (PDF)
Merseyside Electricity Summary (Excel)
Average Units used
Gavin Aldridge
Southern Central
FARESHARE 1-14 (PDF) 010300805235 (PDF)
Average Units used & Financial spend
Gavin Aldridge
West Midlands Electricity Summary (Excel) Financial spend Gavin Aldridge
7
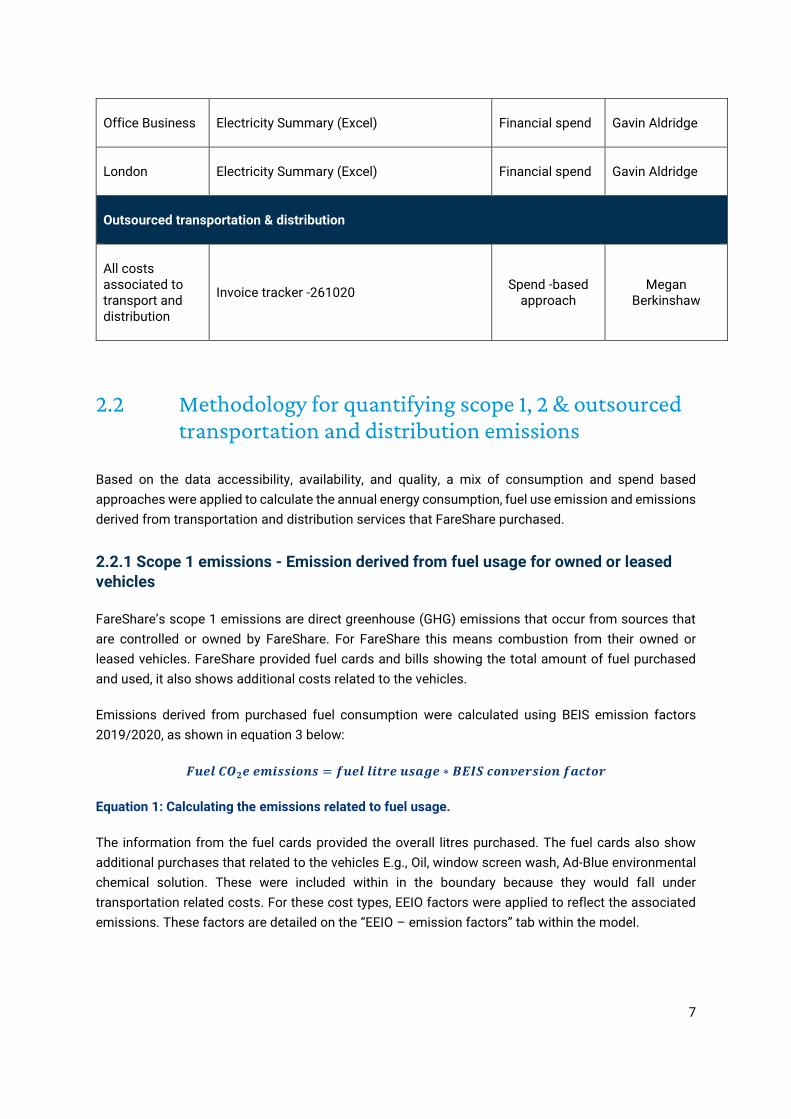
Office Business Electricity Summary (Excel) Financial spend Gavin Aldridge
London Electricity Summary (Excel) Financial spend Gavin Aldridge
Outsourced transportation & distribution
All costs associated to transport and distribution
Invoice tracker -261020 Spend -based
approach Megan
Berkinshaw
2.2 Methodology for quantifying scope 1, 2 & outsourced transportation and distribution emissions
Based on the data accessibility, availability, and quality, a mix of consumption and spend based
approaches were applied to calculate the annual energy consumption, fuel use emission and emissions
derived from transportation and distribution services that FareShare purchased.
2.2.1 Scope 1 emissions - Emission derived from fuel usage for owned or leased vehicles
FareShare’s scope 1 emissions are direct greenhouse (GHG) emissions that occur from sources that
are controlled or owned by FareShare. For FareShare this means combustion from their owned or
leased vehicles. FareShare provided fuel cards and bills showing the total amount of fuel purchased
and used, it also shows additional costs related to the vehicles.
Emissions derived from purchased fuel consumption were calculated using BEIS emission factors
2019/2020, as shown in equation 3 below:
𝑭𝒖𝒆𝒍 𝑪𝑶𝟐𝒆 𝒆𝒎𝒊𝒔𝒔𝒊𝒐𝒏𝒔 = 𝒇𝒖𝒆𝒍 𝒍𝒊𝒕𝒓𝒆 𝒖𝒔𝒂𝒈𝒆 ∗ 𝑩𝑬𝑰𝑺 𝒄𝒐𝒏𝒗𝒆𝒓𝒔𝒊𝒐𝒏 𝒇𝒂𝒄𝒕𝒐𝒓
Equation 1: Calculating the emissions related to fuel usage.
The information from the fuel cards provided the overall litres purchased. The fuel cards also show
additional purchases that related to the vehicles E.g., Oil, window screen wash, Ad-Blue environmental
chemical solution. These were included within in the boundary because they would fall under
transportation related costs. For these cost types, EEIO factors were applied to reflect the associated
emissions. These factors are detailed on the “EEIO – emission factors” tab within the model.

8
It was confirmed by FareShare that the invoices they provided show the total amount of fuel purchased
and used. Subsequently, BEIS conversion factors for 2019/2020 have been used to calculate the
upstream emissions of purchased fuel. These factors are detailed on the “BEIS – emission factors” tab
within the model. By applying the appropriate emissions factor, the footprint reflects an estimate for
the CO2e emissions associated with the vehicles that are leased and/or owned by FareShare. By using
full life cycle for fuels for scope 1 and outsourced transportation and distribution, the footprint is
compliant with a product carbon footprint methodology and therefore a fair comparison with the
product footprint approach for the collected food.
2.2.2 Scope 2 emissions - Emission derived from energy consumption
Scope 2 emissions are indirect GHG emissions associated with the purchase of electricity, heat or
steam. Fareshare’s only has purchased electricity within their scope 2. Electricity consumption is
calculated and cross-verified using usage based and spend base approaches. The different approaches
applied are differentiated in the model by colour.
Fareshare provided a set of invoices and as MS Excel sheet showing the total spend on electricity
purchased. For locations were kWh used were available an average kWh usage approached was used.
For the remaining locations, were only the total financial spend was available, a spend based approach
was used. Scope 2 emissions are indirect GHG emissions associated with the purchase of electricity,
heat or steam. FareShare’s only has purchased electricity within their scope 2. Electricity consumption
is calculated and cross-verified using usage based and spend base approaches. Fareshare provided a
set of invoices and as MS Excel sheet showing the total spend on electricity purchased. Based on these
types of data
kWh usage approach
For a kWh usage approach, electricity invoices were available and included information on kWh used.
Emissions were calculated based on kWh electricity consumed. Given that a full breakdown per month
per site was not available, the annual electricity consumption was estimated based on average daily
usage and subsequently extrapolated from available invoices to reflect a full year usage.
Subsequently, BEIS 2 conversion factors for 2019/2020 have been used to calculate upstream
emissions of purchased electricity. These factors are detailed on the “BEIS – emission factors” tab
within the model. Also, for electricity, a full life cycle emission factor was assessed for a fair comparison
with the product carbon footprint approach for the collected food.
2 BEIS emissions factors are used by UK and international organisations to report on 2019/2020 greenhouse gas
emissions. Source for the BEIS emission factors: https://www.gov.uk/government/publications/greenhouse-gas-
reporting-conversion-factors-2020
9
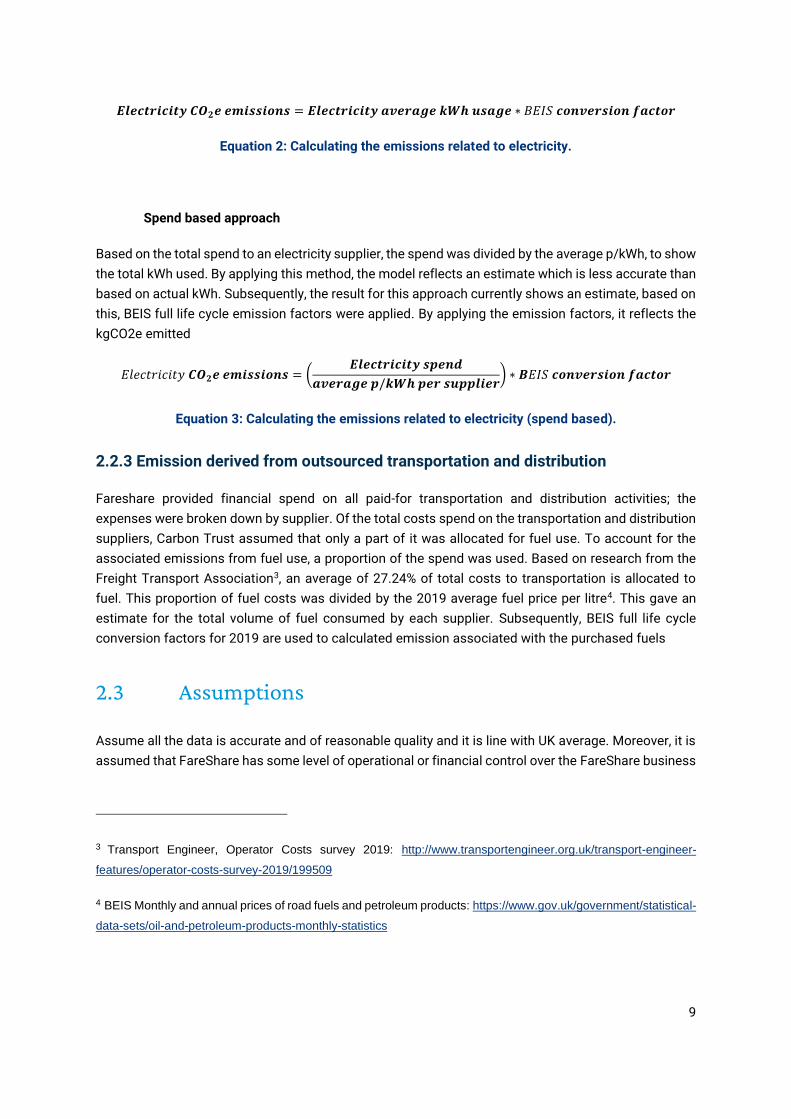
𝑬𝒍𝒆𝒄𝒕𝒓𝒊𝒄𝒊𝒕𝒚 𝑪𝑶𝟐𝒆 𝒆𝒎𝒊𝒔𝒔𝒊𝒐𝒏𝒔 = 𝑬𝒍𝒆𝒄𝒕𝒓𝒊𝒄𝒊𝒕𝒚 𝒂𝒗𝒆𝒓𝒂𝒈𝒆 𝒌𝑾𝒉 𝒖𝒔𝒂𝒈𝒆 ∗ 𝐵𝐸𝐼𝑆 𝒄𝒐𝒏𝒗𝒆𝒓𝒔𝒊𝒐𝒏 𝒇𝒂𝒄𝒕𝒐𝒓
Equation 2: Calculating the emissions related to electricity.
Spend based approach
Based on the total spend to an electricity supplier, the spend was divided by the average p/kWh, to show
the total kWh used. By applying this method, the model reflects an estimate which is less accurate than
based on actual kWh. Subsequently, the result for this approach currently shows an estimate, based on
this, BEIS full life cycle emission factors were applied. By applying the emission factors, it reflects the
kgCO2e emitted
𝐸𝑙𝑒𝑐𝑡𝑟𝑖𝑐𝑖𝑡𝑦 𝑪𝑶𝟐𝒆 𝒆𝒎𝒊𝒔𝒔𝒊𝒐𝒏𝒔 = (𝑬𝒍𝒆𝒄𝒕𝒓𝒊𝒄𝒊𝒕𝒚 𝒔𝒑𝒆𝒏𝒅
𝒂𝒗𝒆𝒓𝒂𝒈𝒆 𝒑/𝒌𝑾𝒉 𝒑𝒆𝒓 𝒔𝒖𝒑𝒑𝒍𝒊𝒆𝒓) ∗ 𝑩𝐸𝐼𝑆 𝒄𝒐𝒏𝒗𝒆𝒓𝒔𝒊𝒐𝒏 𝒇𝒂𝒄𝒕𝒐𝒓
Equation 3: Calculating the emissions related to electricity (spend based).
2.2.3 Emission derived from outsourced transportation and distribution
Fareshare provided financial spend on all paid-for transportation and distribution activities; the
expenses were broken down by supplier. Of the total costs spend on the transportation and distribution
suppliers, Carbon Trust assumed that only a part of it was allocated for fuel use. To account for the
associated emissions from fuel use, a proportion of the spend was used. Based on research from the
Freight Transport Association3, an average of 27.24% of total costs to transportation is allocated to
fuel. This proportion of fuel costs was divided by the 2019 average fuel price per litre4. This gave an
estimate for the total volume of fuel consumed by each supplier. Subsequently, BEIS full life cycle
conversion factors for 2019 are used to calculated emission associated with the purchased fuels
2.3 Assumptions
Assume all the data is accurate and of reasonable quality and it is line with UK average. Moreover, it is
assumed that FareShare has some level of operational or financial control over the FareShare business
3 Transport Engineer, Operator Costs survey 2019: http://www.transportengineer.org.uk/transport-engineer-
features/operator-costs-survey-2019/199509
4 BEIS Monthly and annual prices of road fuels and petroleum products: https://www.gov.uk/government/statistical-
data-sets/oil-and-petroleum-products-monthly-statistics

10
units (East Anglia, Depthford London Office, Merseyside, ‘Office’, ‘Office Business’, Southern Central
and West Midlands) that fall under the discussed boundary. As mentioned, assumptions were made
both for the average kWh approach as for the spend-based approach. Both reflect a location-based
emission approach rather than specific to the energy grid supplier or specific distribution supplier.
3. Embedded Environmental Impact of Redistributed Waste Food
For each food item that FareShare collects and prevents going to waste the embodied carbon and water
used in the process of cultivating, manufacturing and transporting those food items are also prevented
from going to waste. This is what constitutes the embedded environmental impact of FareShare as an
organisation and will form the positive portion of the net impact of FareShare’s operations.
The embedded environmental impact of redistributed waste food is measured in both a carbon and
water footprint. The emission factors of food items were taken from Carbon Trust databases,
developed with over 20 years of experience in carbon accounting. The water factors that convert the
food waste mass into embedded water in m3 is sourced from the Water Footprint Network. The
methodological approach is explained in the following sections.
3.1 Data sources
3.1.1 Activity data sources
The data files provided by FareShare that have been included within the environmental impact model
are related to food categorisation and the pallet weights of the individual categories that are distributed.
The food categorisation data included all the food items that FareShare have received and distributed
within its system throughout the reporting year. This file also includes the outcome of the food
categorisation that was undertaken by FareShare, assigning each food item to their own primary food
categories and the emission factors that will be used in the impact model. The data includes the radials
travelled by each food item within the FareShare network, these distances and their fuel usages were
included within the calculation of the scope 1&2 and outsourced transport model, which allowed for a
net impact in terms of carbon emissions to be calculated.

11
The data within the file for average pallet weights assigned the average mass of each pallet for each of
FareShare’s primary categories, the overall tonnage of avoided food was calculated to be 6,700 tonnes
within the reporting period. Of this mass 12% of the stock was not redistributed and accounted for as
waste, as detailed within the logistics invoices.
Total FareShare data for the reporting period was provided by FareShare in the following files:
Table 3: Data sources relating to the environmental impact.
Relating to File Name FareShare data owner
Food Categorisation Copy of Allocations and deliveries FY1920 CT emissions.xsl
Faruk Barabhuiya
Pallet Weight Average_Pallet_Weight.xsl Faruk Barabhuiya
3.1.2 Emissions data sources
Cradle-to-grave emission factors that incorporate upstream transport were used to calculate the
avoided emission of food items. These emission factors were sourced from Carbon Trust databases
compiled from a literature review5.based on the UK industrial average data.
The embedded water consumption of the food waste was calculated using water factors from research
undertaken by the Water Footprint Organisation and UNESCO-IHE6 7.
3.2 Methodology
3.2.1 Carbon Emissions
5 Sources included Ecoinvent 3.7.1, World Food Life Cycle Database, Agrifootprint database and academic journal
publications.
6 Mekonnen, M & Hoekstra, A: The Green, Blue and Grey Water Footprint of Farm Animals and Animal Products,
2010
7 Mekonnen, M & Hoekstra, A: The green, blue and grey water footprint of crops and derived crop products, 2011

12
Firstly, FareShare matched the categories of FareShare’s stock to the emission factors available in the
database based on the similarity of the food items to the emission factors; 92% of total pallets of the
stock within the reporting year were assigned to a food category with a suitable emission factor.
The data that was provided came in the form of product item, primary category, categorisation to the
CT emission factor and the number of pallets of each item. FareShare has previously analysed the
average pallet weight of each primary food category. The categorisation then resulted in food items
being summed together by FareShare primary category and CT emission factor. This allowed the
resulting number of pallets to be converted into a final mass using the FareShare average pallet
weights. This mass was then used in a simple formula to find the avoided emissions of food waste:
𝑪𝑶𝟐𝒆 𝑬𝒎𝒊𝒔𝒔𝒊𝒐𝒏𝒔 𝒐𝒇 𝑨𝒗𝒐𝒊𝒅𝒆𝒅 𝑭𝒐𝒐𝒅 𝑾𝒂𝒔𝒕𝒆 = 𝒂𝒄𝒕𝒊𝒗𝒊𝒕𝒚 𝒅𝒂𝒕𝒂 × 𝒆𝒎𝒊𝒔𝒔𝒊𝒐𝒏 𝒇𝒂𝒄𝒕𝒐𝒓
Equation 4: Emissions related to avoided food waste
The calculations followed the GHG Protocol Corporate Value Chain Standard Category 1 methodology.
The remaining 8% of the stock by number of pallets could not be specifically categorised to any
emission factor because of the nature of the food items, i.e., ‘Ambient Mixed Stock’. The proportion of
each primary food category within the categorised stock was calculated, and the remaining
uncategorised stock was assigned to each different food category. This 8% of stock was included in
the overall emission calculations, using equation 2 above.
Densities of food items found within the FAO/INFOODS Database 8 were used to in cases where food
mass needed to be converted to volumetric measures, to match the unit of emission factors (kgCo2e/l).
There is a 12% wastage of the overall tonnage of food that did not eventually become redistributed by
FareShare. In the base scenario this food would have gone to waste regardless with the same
embedded emissions, so this wastage was not modelled. However, there is an efficiency loss within
FareShare’s process because of the non-avoided food waste, from the transportation and storage of
these items.
3.2.2 Embedded Water
Due to the nature of water footprints and the research around water factors, the embedded water
footprint was calculated to a higher level than the carbon footprint. By mass, 60% of FareShare’s stock
was categorised to match existing water factors, which mainly consisted of meat, fruit, vegetables, and
other crops. Similarly, to the carbon footprint the number of each category’s pallets was converted to
mass which then was multiplied by a water factor to find the overall embedded water in m3.
8 The density values used can be found here: (Charrondiere, Haytowitz, & Stadlmayr, 2012)

13
The proportion of each food category within the categorised stock was calculated, this allowed for a
weighted average of the water factors used to be found. This water factor was then applied to the
remaining 60% of the stock that could not be assigned to a specific water factor. Meat was categorised
in a similar way with four water factors relating to meat but a significant number of pallets within the
‘Meat’ primary category that were ready meals and frozen food. The proportion of each meat category
was found by number of pallets and the remaining pallets were assigned to the categories based on
that proportion. Cured meat items were assigned to pork, and turkey was assigned to chicken.
Similar to the avoided carbon emissions the embedded water associated with the non-redistributed
food waste would have gone through the usual end of life destinations in the base scenario.
3.2.3 Assumptions/Expert opinions
The packaging End-of-Life (EoL) emissions did not require modelling as these emissions would be the
same regardless if FareShare redistributed the food items or not, so these emission factors were not
applied to the avoided carbon emission calculations.
For the food items data provided by FareShare, the following assumptions and decisions were made.
Firstly, that the average pallet weights for each primary category were representative of the real pallet
weights involved in FareShare’s network. Following the categorisation exercise completed by
FareShare, the mass of the remaining uncategorised stock was distributed amongst the categorised
stock by proportion to the total weight.
For the meat category within the water footprint, firstly, the water factor for pig and chicken are
considered to be the closed match for cure meat and turkey respectively. Secondly, the pallets that
contained ready meals and frozen food within the ‘Meat’ primary food category were allocated to the
other categorised water factors on a proportion basis.

14
4. Results
This section provides the results of FareShare’s environmental assessment for both the Scope1&2 and
outsourced transportation and distribution footprint and the environmental impact of the avoided food
waste.
Overall, FareShare’s own footprint shows that their Scope 3 emissions associated with paid for
transportation accounts for the vast majority of the CO2 produced by their own activities. If FareShare
wanted to reduce their own emissions to increase their net environmental impact further then their
Scope 3 would be the most appropriate section to decrease.
The results of FareShare’s overall Scope 1&2 and outsourced transportation and distribution footprint
was 1,510.46 tCO2e, with Scope 1 accounting for 5.91% and Scope 2 accounting for 7.39% and
outsourced distribution and transportation for 86.69% of the total footprint. This can be put simply as
the Scope 1 emissions are made up of the fuel consumption of FareShare’s owned fleet and the Scope
2 emissions was the electricity consumption of FareShare’s sites and the scope 3 category, outsourced
transportation and distribution, as other distribution that FareShare paid for. Comparing FareShare’s
own operation against the outsourced transportation and distribution, this is considered minor.
Figure 4: Overall Scope1&2 and outsourced transportation & distribution emissions (tCO2e)
6%7%
87%
Scope 1 & 2 outsourced tranportations and distribution
emissions (tCO2e)
Scope 1 (percentage of scope 1, 2 & 3)
Scope 2 (percentage of scope 1, 2 & 3)
Scope 3 (percentage of scope 1, 2 & 3)

15
4.1 Scope 1: Fuel use
Scope 1 fuel use accounts for 5.91% of the total footprint, resulting in 89.30 tCO2e. Figure 5
demonstrates the monthly breakdown of diesel fuel consumption.
However, it should be mentioned that this breakdown reflects an accounting breakdown rather than an
fuel usage breakdown per month. Therefore, it does not represent fuel usage for that month, rather
when accounting occurred It is however confirmed by FareShare that on an annual basis, fuel
consumption does match fuel usage.
Figure 5: Electricity carbon emission (tCO2e) breakdown by site location
4.2 Scope 2: Purchased electricity
The pie chart below details the proportion each site location accounted for within the Scope 2 footprint.
As can be seen, the site name ‘East Anglia’ and ‘Southern Central’ were the two locations with the
highest emissions, combined totalling 51.63 tCO2e, 46% of the Scope 2 footprint.
Figure 6: Electricity carbon emission (tCO2e) breakdown by site location
-
5,000.00
10,000.00
15,000.00
20,000.00
Fuel use emission by month - Diesel
Electricity emission by location
East Anglia
London
Merseyside
Office
Office Business
Southern Central
West Midlands
16
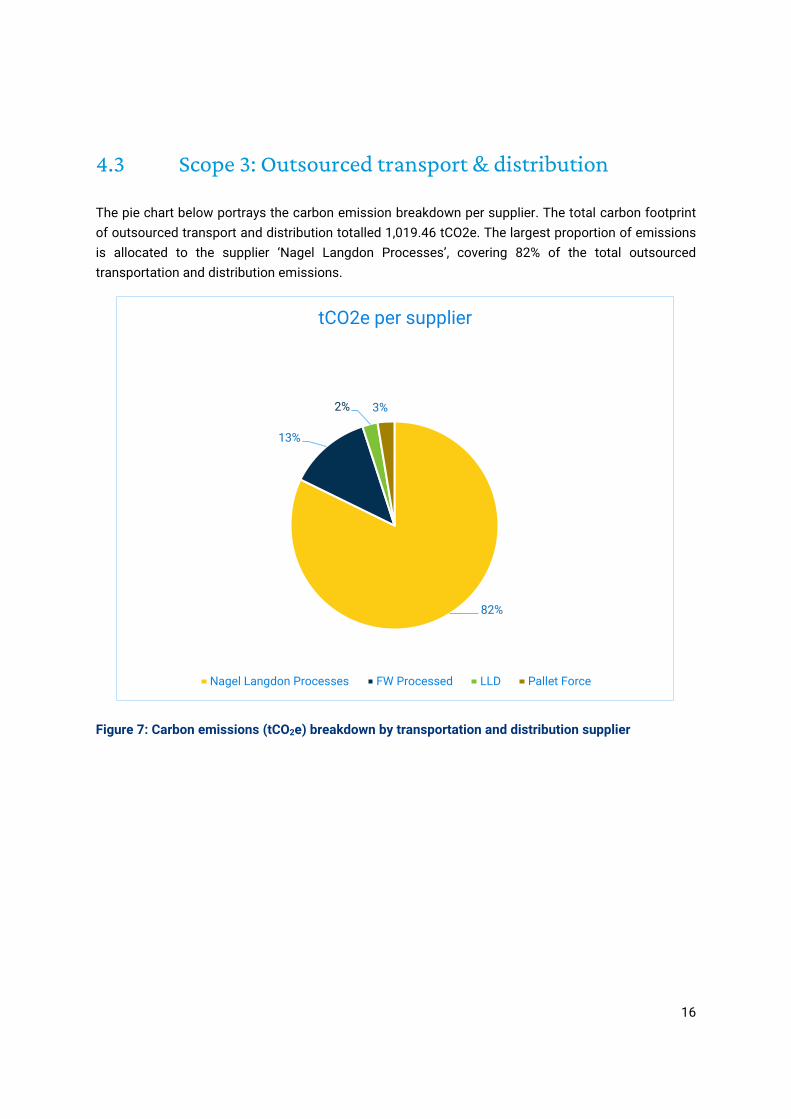
4.3 Scope 3: Outsourced transport & distribution
The pie chart below portrays the carbon emission breakdown per supplier. The total carbon footprint
of outsourced transport and distribution totalled 1,019.46 tCO2e. The largest proportion of emissions
is allocated to the supplier ‘Nagel Langdon Processes’, covering 82% of the total outsourced
transportation and distribution emissions.
Figure 7: Carbon emissions (tCO2e) breakdown by transportation and distribution supplier
82%
13%
2% 3%
tCO2e per supplier
Nagel Langdon Processes FW Processed LLD Pallet Force

17
4.4 Embedded Environmental Impact of Redistributed Waste Food Results
4.4.1 Carbon Footprint
The overall carbon footprint of the food waste avoided by FareShare totalled 10,698 tCO2e, which came
from 6,699 tonnes of food waste in total. The two largest food categories by emissions were Dairy and
Vegetables, accounting for 51.2% of the overall footprint. Alongside Dairy and Vegetables, only the
Ready Meals, Fruit and Meat categories made up more than 5% of the overall emissions.
Figure 8: Carbon emissions (tCO2e) breakdown by primary food category
Dairy
Vegetables
Ready Meals
Fruit
Meat
Savoury Snacks
Cooking Sauce
Dessert and Cake
Grains/Pasta/Pulses
Breakfast
Condiments
Mixed
Other
Bread
18
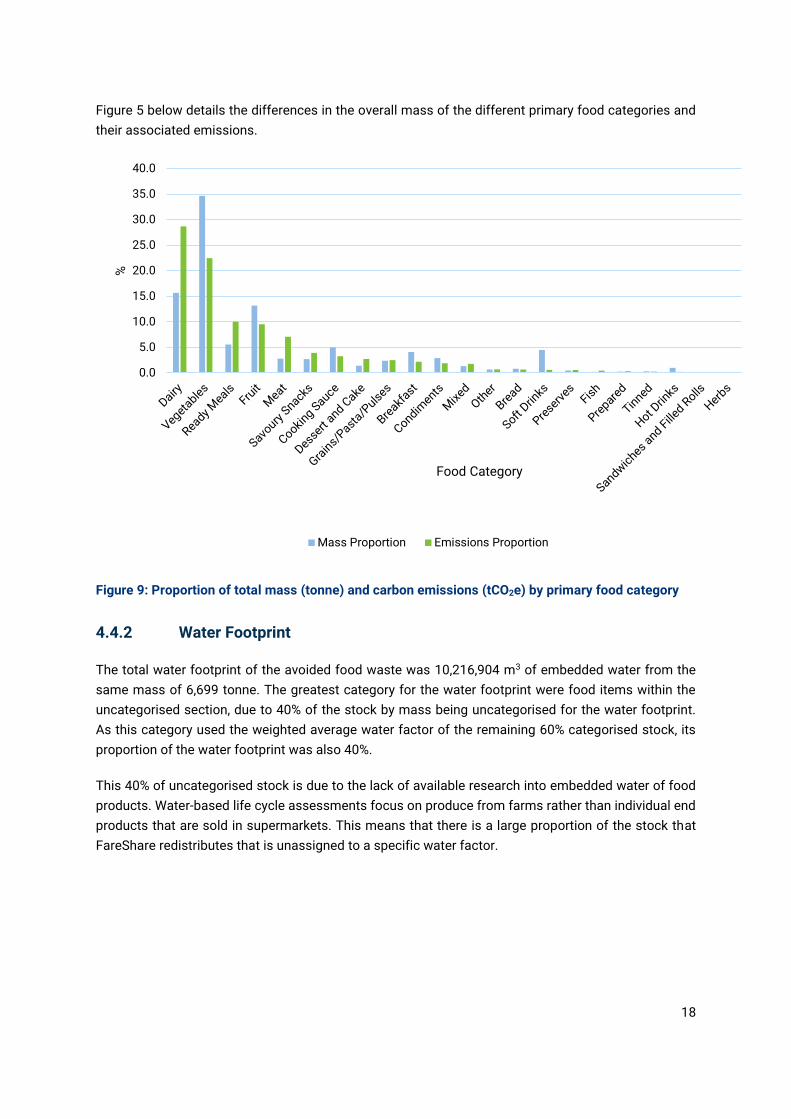
Figure 5 below details the differences in the overall mass of the different primary food categories and
their associated emissions.
Figure 9: Proportion of total mass (tonne) and carbon emissions (tCO2e) by primary food category
4.4.2 Water Footprint
The total water footprint of the avoided food waste was 10,216,904 m3 of embedded water from the
same mass of 6,699 tonne. The greatest category for the water footprint were food items within the
uncategorised section, due to 40% of the stock by mass being uncategorised for the water footprint.
As this category used the weighted average water factor of the remaining 60% categorised stock, its
proportion of the water footprint was also 40%.
This 40% of uncategorised stock is due to the lack of available research into embedded water of food
products. Water-based life cycle assessments focus on produce from farms rather than individual end
products that are sold in supermarkets. This means that there is a large proportion of the stock that
FareShare redistributes that is unassigned to a specific water factor.
0.0
5.0
10.0
15.0
20.0
25.0
30.0
35.0
40.0
%
Food Category
Mass Proportion Emissions Proportion

19
The largest categories that were assigned specific water factors were Dairy and Meat with water
footprints of 1,786,245 m3 and 1,691,855 m3 respectively, with only Fruit, Vegetables and Breakfast
having water footprints greater than 5% of the overall footprint.
Figure 10: Water footprint (m3) breakdown by primary food category
As can be seen in Figure 11, the differences in the proportion of overall mass and embedded water of
the different primary food categories are great. The water intensity for dairy and meat outweighs the
vegetables, even though vegetable products have the largest mass proportion, the embedded water
footprint is less than half of the diary’s footprint.
Uncategorised Dairy Meat
Fruit Vegetables Breakfast
Grains/Pasta/Pulses Eggs Herbs

20
Figure 11: Proportion of total mass (tonne) and embedded water (m3) by primary food category
4.5 FareShare Net Impact 2019/2020
The two exercises that have been conducted by Carbon Trust effectively show the emissions
associated with FareShare’s operations and the avoided emissions of the food waste. The net impact
of FareShare’s operations subtracts their own footprint which includes their utility usage and
transportation from the emissions associated with avoiding the food they redistribute.
The project found that FareShare had prevented approximately 6,699 tonnes of surplus food going to
waste, which helped contribute to the mitigation of an estimated 10,698 tonnes of carbon emissions
annually. Considering FareShare’s operational emission of 1,246.87 tCO2e in total, FareShare achieved
net impact of 9,450.13 GHG abatement in total for reporting year 2019/2020.
This is shown in figure 12 and 13 below.
0.0
5.0
10.0
15.0
20.0
25.0
30.0
35.0
40.0
45.0%
Food Category
Mass Proportion Emissions Proportion

21
1Figure 12: FareShare footprint (tCO2e) proportion to Carbon footprint (tCO2e) of food waste
avoided
Figure 13: The net emissions (tCO2e) of FareShare's operations, compared to their footprint and
avoided emissions (tCO2e) of the redistributed food waste
1,246.87 , 10%
10,697.00 , 90%
Footprint proportion (tCO2e)
Fareshare's footprint Carbon footprint of the food waste avoided

22
5. Summary and recommendations
This report has set out the methodology for assessing FareShare’s impact both of their own operation
emissions and avoided emissions and embedded water due to the re-distribution of food waste. It also
provides the net environmental impact of avoiding food waste and an analysis of those results. It details
the assumptions applied and decisions made by the Carbon Trust in the development of the two
models.
Below set outs the process required to update the models and recommendations for future
improvements.
5.1 Annual Update Procedure
Each year updated purchased electricity and spend data should be input into the model. The emission
factors applied should be reviewed and updated where applicable.
For both the carbon and water footprint the categorisation and the quantities have been taken from the
‘Allocations’ tab within the model. To update for a different reporting year, the categorisation should to
be reviewed to match the food items to the emission factors. By keeping the same column order,
FareShare will be able to fill this tab and an updated carbon water footprint will be reproduced.
5.2 Recommendations
FareShare’s own operation emissions
Firstly, it is recommended to report on CO2e emissions both on location-based and market-based
approach as the best practice, to provide more reliable calculation for carbon emission derived from
purchased electricity.
Secondly, fugitive gases (also known as F-gases) of FareShare’s operation is not included in the
analysis due to absence of data. These F-gases relate to refrigeration or air conditioning units and have
a very high global warming potential. Due to the nature of FareShare’s operations with regards to the
refrigeration of certain food items, the emissions associated with F-gasses could be sizeable.
Therefore, clear documentation of fugitive emissions would allow FareShare to gain clearer
understanding of the Scope 1&2 emissions.
Thirdly, for outsourced transportation and distribution that FareShare paid for it is recommended to
retrieve either distance data or fuel purchased data from the suppliers. This will provide more reliable
calculation associated with the distribution and assess if and how these emissions can be tackled. This
could potentially result into an overall reduction of FareShare’s net impact.

23
Embedded Environmental Impacts of Redistributed Waste Food
Firstly, it is recommended as part of FareShare’s own data collection within their databases that they
assign individual food items to the appropriate carbon emission factors to allow for a more automatic
process of calculating the embedded carbon emissions.
Secondly, the water footprint that has been calculated is a high-level embedded water consumption of
the food items that FareShare processes. Currently only the water that is used to grow or create a food
item is calculated with no consideration for water origins and scarcity how water scarce the region is.
This would allow for a more accurate result of the overall environmental impact of the avoided food
waste. However, there is still minimal research into this area and may not merit the resources required
to complete.
The water footprint that has been calculated is a high-level embedded water consumption of the food
items that FareShare processes. Currently only the water that is used to grow or create a food item is
calculated with no consideration for water origins and scarcity how water scarce the region is. This
would allow for a more accurate result of the overall environmental impact of the avoided food waste.
However, there is still minimal research into this area and may not merit the resources required.

24
Bibliography
Charrondiere, U. R., Haytowitz, D., & Stadlmayr, B. (2012). Density Database Version 2.0. Rome: FAO /
INFOODS Databases. Retrieved from http://www.fao.org/3/ap815e/ap815e.pdf
Mekonnen, M. M., & Hoekstra, A. Y. (2010). The Green, Blue and Grey Water Footprint of Farm Animals
and Animal Products. Delft, The Netherlands: UNESCO-IHE Institute for Water Education .
Mekonnen, M. M., & Hoekstra, A. Y. (2011). The green, blue and grey water footprint of crops and derived
crop products. Hydrology and Earth System Sciences, 1577-1600.
www.carbontrust.com
+44 (0) 20 7170 7000
Whilst reasonable steps have been taken to ensure that the information contained within this
publication is correct, the authors, the Carbon Trust, its agents, contractors and sub-contractors give
no warranty and make no representation as to its accuracy and accept no liability for any errors or
omissions. Any trademarks, service marks or logos used in this publication, and copyright in it, are the
property of the Carbon Trust. Nothing in this publication shall be construed as granting any licence or
right to use or reproduce any of the trademarks, service marks, logos, copyright or any proprietary
information in any way without the Carbon Trust’s prior written permission. The Carbon Trust enforces
infringements of its intellectual property rights to the full extent permitted by law.
The Carbon Trust is a company limited by guarantee and registered in England and Wales under
Company number 4190230 with its Registered Office at: 4th Floor, Dorset House, 27-45 Stamford Street,
London SE1 9NT.
© The Carbon Trust 2021. All rights reserved.
Published in the UK: 2021 the UK: 2