fao statistical pocketbook 2015 world food and agriculture
TRANSCRIPT

I4691E/1/05.15
ISBN 978-92-5-108802-9
9 7 8 9 2 5 1 0 8 8 0 2 9
FAO Statistical Pocketbook
2015
Food and Agriculture Organization of the United Nations, Rome, 2015

The designations employed and the presentation of material in this information product do not imply the expression of any opinion whatsoever on the part of the Food and Agriculture Organization of the United Nations (FAO) concerning the legal or development status of any country, territory, city or area or of its authorities, or concerning the delimitation of its frontiers or boundaries. The mention of specific companies or products of manufacturers, whether or not these have been patented, does not imply that these have been endorsed or recommended by FAO in preference to others of a similar nature that are not mentioned.
The views expressed in this information product are those of the author(s) and do not necessarily reflect the views or policies of FAO.
ISBN 978-92-5-108802-9
© FAO, 2015
FAO encourages the use, reproduction and dissemination of material in this information product. Except where otherwise indicated, material may be copied, downloaded and printed for private study, research and teaching purposes, or for use in non-commercial products or services, provided that appropriate acknowledgement of FAO as the source and copyright holder is given and that FAO’s endorsement of users’ views, products or services is not implied in any way.
All requests for translation and adaptation rights, and for resale and other commercial use rights should be made via www.fao.org/contact-us/licence-request or addressed to [email protected].
FAO information products are available on the FAO website (www.fao.org/publications) and can be purchased through [email protected].
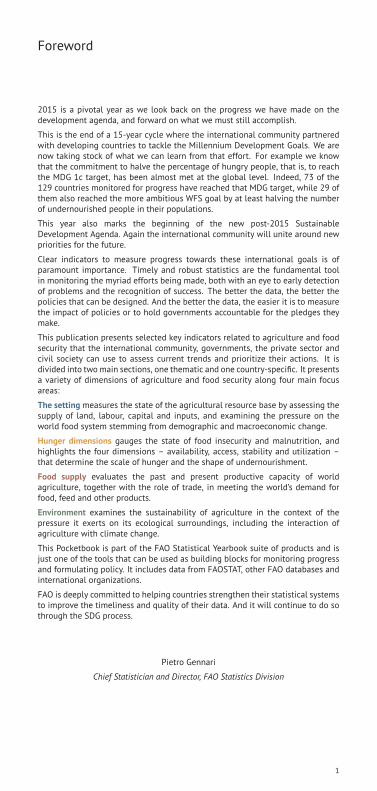
Foreword
2015 is a pivotal year as we look back on the progress we have made on thedevelopment agenda, and forward on what we must still accomplish.
This is the end of a 15-year cycle where the international community partneredwith developing countries to tackle the Millennium Development Goals. We arenow taking stock of what we can learn from that effort. For example we knowthat the commitment to halve the percentage of hungry people, that is, to reachthe MDG 1c target, has been almost met at the global level. Indeed, 73 of the129 countries monitored for progress have reached that MDG target, while 29 ofthem also reached the more ambitious WFS goal by at least halving the numberof undernourished people in their populations.
This year also marks the beginning of the new post-2015 SustainableDevelopment Agenda. Again the international community will unite around newpriorities for the future.
Clear indicators to measure progress towards these international goals is ofparamount importance. Timely and robust statistics are the fundamental toolin monitoring the myriad efforts being made, both with an eye to early detectionof problems and the recognition of success. The better the data, the better thepolicies that can be designed. And the better the data, the easier it is to measurethe impact of policies or to hold governments accountable for the pledges theymake.
This publication presents selected key indicators related to agriculture and foodsecurity that the international community, governments, the private sector andcivil society can use to assess current trends and prioritize their actions. It isdivided into twomain sections, one thematic and one country-specific. It presentsa variety of dimensions of agriculture and food security along four main focusareas:
The setting measures the state of the agricultural resource base by assessing thesupply of land, labour, capital and inputs, and examining the pressure on theworld food system stemming from demographic and macroeconomic change.
Hunger dimensions gauges the state of food insecurity and malnutrition, andhighlights the four dimensions – availability, access, stability and utilization –that determine the scale of hunger and the shape of undernourishment.
Food supply evaluates the past and present productive capacity of worldagriculture, together with the role of trade, in meeting the world’s demand forfood, feed and other products.
Environment examines the sustainability of agriculture in the context of thepressure it exerts on its ecological surroundings, including the interaction ofagriculture with climate change.
This Pocketbook is part of the FAO Statistical Yearbook suite of products and isjust one of the tools that can be used as building blocks for monitoring progressand formulating policy. It includes data from FAOSTAT, other FAO databases andinternational organizations.
FAO is deeply committed to helping countries strengthen their statistical systemsto improve the timeliness and quality of their data. And it will continue to do sothrough the SDG process.
Pietro Gennari
Chief Statistician and Director, FAO Statistics Division
1

2

Contents
Demographics 4Economy 6Labour 8Inputs 10Investment 12
Undernourishment 14Food availability 16Food access 18Economic and political stability 20Food utilization 22
Dietary energy supply 24Crop production 26Crops 28Livestock 30Fisheries 32Agricultural trade 34
Land 36Water 38Energy 40Forestry 42Climate change 44
Country Profiles 48
Part 1 : 223
Definitions 223
Notes 231
3

DemographicsA combination of declining mortality rates,prolonged life expectancy and youngerpopulations in regions with high fertilitycontributes to population growth in the world.While growth rates have been slowing sincethe late 1960s, the world’s population hasnevertheless doubled since then, to over 7billion people. Population growth is generallyhighest where income levels are low. This isespecially true in cities. Since 2008, there havebeen more people living in cities than in ruralareas.
CHART 1: World rural and urban population(1985 to 2016)
0
2
4
6
1990 2000 2010
bil
lio
n p
eo
ple
Urban population Rural population
Data after 2010 are projections.
CHART 2: Population, average annualgrowth (2004-2014)
Latvia
Lithuania
Republic ofMoldova
Bulgaria
Ukraine
Belarus
Georgia
Estonia
Croatia
Romania
Eritrea
Burundi
Uganda
Niger
Jordan
Bahrain
Kuwait
Oman
United ArabEmirates
Qatar
0 4 8
percent
Countries withhighest values
Countries withlowest values
CHART 3: Life expectancy at birth, countrieswith the highest and lowest values (2013)
Sierra Leone
Botswana
Swaziland
Lesotho
DR Congo
Central AfricanRepublic
Mozambique
Côte d'Ivoire
Chad
Angola
Luxembourg
France
Israel
Australia
Italy
Singapore
Spain
Switzerland
Iceland
Japan
50 60 70 80years
Countries withhighest values
Countries withlowest values
CHART 4: Total economically active population in Asia (2000 to 2014)
● ● ● ● ● ● ● ● ● ● ● ● ● ● ●
● ● ● ● ● ● ● ● ● ● ● ● ● ● ●
●●
●●
●●
●●
●●
●●
●●
●
● ● ● ● ● ● ● ● ● ● ● ● ● ● ●
● ● ● ● ● ● ● ● ● ● ● ● ● ● ●
0
250
500
750
1 000
2000 2005 2010 2015
mil
lio
n p
eo
ple
● ● ● ● ●Central Asia Eastern Asia South−Eastern Asia Southern Asia Western Asia
4

FIGURE 1: Rural population, share of total population (percent, 2014)
No
data
avail
ab
le
0 ~
< 1
6
16
~ <
32
32
~ <
47
47
~ <
64
64
~ 1
00
5

EconomyWhile some sectors have been hard hit,agriculture has demonstrated resilience duringthe recent economic downturn. Changes inthe wider economy, including growing globalintegration, affect the performance of theagriculture sector. Higher overall economicgrowth also raises consumers’ incomes andhence food demand. Changing interest ratesinfluence capital investments, land values andstorage levels, while inflation affects inputprices, revenues and credit costs. Fluctuationsin exchange rates have an important bearing oninternational competitiveness and trade flows.
CHART 5: Value added in agriculture,industry and services, share of GDP (2013)
0
25
50
75
100
Africa
Amer
icas
Asia
Euro
pe
Oce
ania
Wor
ld
perc
en
t
Agriculture Industry Services
CHART 6: Agriculture value added perworker, countries with the highest values
(2013)
New Zealand
Austria
Germany
Luxembourg
Singapore
Denmark
Lebanon
Spain
Sweden
Australia
Japan
Italy
Puerto Rico
Belgium
Netherlands
Finland
United Statesof America
Norway
Iceland
France
30 40 50 60 70constant 2000 thousand US$
CHART 7: Value added in agriculture,average annual growth (2003-2013)
Ireland
Bahamas
United ArabEmirates
Malta
Zimbabwe
Greece
Bulgaria
Samoa
Luxembourg
Namibia
Liberia
Algeria
Uzbekistan
Paraguay
Mongolia
Tajikistan
Puerto Rico
Ethiopia
Angola
Turkmenistan
0 10 20
percent
Countries withhighest values
Countries withlowest values
CHART 8: Value added in agriculture as share of GDP
0
5
10
15
2000 2005 2010
perc
en
t
Africa Asia Europe Latin Americaand the Caribbean Oceania
6

FIGURE 2: Value added in agriculture, share of GDP (percent, 2010 to 2013*)
No
data
avail
ab
le
0 ~
< 2
.3
2.3
~ <
5.5
5.5
~ <
10
10
~ <
22
22
~ 5
9.3
3
7

LabourA strong labour market is the foundation ofsustained well-being and economic growth,inclusion and social cohesion. Therefore accessto safe, productive and remunerated work isessential. Yet many workers, especially themost vulnerable, do not enter into formal wageemployment but are instead self-employed orparticipate in unpaid family work, such as inagriculture. This is especially the case withsubsistence farming. As a large share ofthe working poor are involved in agriculture,developments in this sector have a majorimpact on welfare.
CHART 9: Labour force participation rate bygender, ages 15+ (2013)
0
20
40
60
80
Africa
Amer
icas
Asia
Euro
pe
Oce
ania
Wor
ld
perc
en
t
Male Female
CHART 10: Female employment inagriculture, share of female employment
(percent, 2012)
Croatia
Macedonia
Serbia
Philippines
Ecuador
Bosnia andHerzegovina
Paraguay
Republic ofMoldova
West Bank andGaza Strip
Namibia
Romania
Indonesia
Sri Lanka
Turkey
Thailand
Azerbaijan
Viet Nam
Cambodia
India
Bhutan
20 40 60
percent
CHART 11: Male employment in agriculture,share of male employment (percent, 2012)
Panama
Serbia
Colombia
Jamaica
Romania
Namibia
Republic ofMoldova
Paraguay
Azerbaijan
Ecuador
El Salvador
Indonesia
Philippines
Thailand
Sri Lanka
India
Guatemala
Viet Nam
Bhutan
Cambodia
30 40 50
percent
CHART 12: Female employment in agriculture, share of female employment(2000-2014)
● ● ● ● ● ● ● ● ● ● ● ● ● ● ●
● ● ● ● ● ● ●● ● ● ● ● ● ● ●
● ● ● ● ● ● ● ● ● ● ● ● ● ● ●
●● ● ● ● ● ●
● ● ● ●● ●
●●
● ● ● ● ● ● ● ● ● ● ● ● ● ● ●
● ● ● ● ● ● ● ● ● ● ● ● ● ● ●20
40
60
2000 2005 2010 2015
percent
● ● ● ● ● ●Africa Americas Asia Europe Oceania World
8

FIGURE 3: Employment in agriculture, share of total employment (percent, 2007 to2012*)
No
data
avail
ab
le
0 ~
< 2
.7
2.7
~ <
5.9
5.9
~ <
16
16
~ <
32
32
~ 6
5.6
9

InputsAdequate access to inputs, including land,pesticides and fertilizers, is vital for agriculturalproduction and growth. Throughout Asia andin parts of Latin America, expanding seedand fertilizer use has been accompanied byinvestments in irrigation, rural roads, marketinginfrastructure and financial services, paving theway for dynamic commercial input markets. Inother regions, such as sub-Saharan Africa, theuptake of agricultural inputs is relatively lowbecause it is often cheaper to expand croplandto have higher production.
CHART 13: Fertilizer consumption innutrients per ha of arable land (2002 to
2012)
0
30
60
90
2002 2004 2006 2008 2010 2012kg/ha
Nitrogen Phosphate Potash
CHART 14: Nitrogen fertilizers consumptionin nutrients per ha of arable land (2012)
Bangladesh
Germany
Costa Rica
Uzbekistan
United Kingdom
Republic of Korea
Colombia
Chile
Malta
China
Luxembourg
Belgium
Trinidad andTobago
United ArabEmirates
Kuwait
Netherlands
Ireland
Egypt
Oman
New Zealand
200 300 400
kg/ha
CHART 15: Phosphate fertilizersconsumption in nutrients per ha of arable
land (2012)
Cyprus
Malaysia
Viet Nam
Brazil
Barbados
Iceland
Bangladesh
Chile
Ireland
China
Colombia
Jordan
Uruguay
Japan
Croatia
Egypt
Lebanon
Republic of Korea
Singapore
Saudi Arabia
50 100 150 200
kg/ha
CHART 16: Fertilizer consumption in nutrients per ha of arable land (2012)
0
50
100
150
Africa
Amer
icas
Asia
Euro
pe
Oce
ania
Wor
ld
kg
/ha
Nitrogen Phosphate Potash
10

FIGURE 4: Pesticides per ha of arable land (kg/ha, 2007 to 2012*)
No
data
avail
ab
le
0.0
00
22
22
~ <
0.2
4
0.2
4 ~
< 1
1 ~
< 2
.3
2.3
~ <
6.4
6.4
~ 2
6.0
7
11

InvestmentInvesting in agriculture is one of the mosteffective strategies for reducing poverty andhunger, and promoting sustainability. Theregions of the world where hunger and extremepoverty are most widespread today – SouthAsia and sub-Saharan Africa – have seen flator declining rates of investment per workerin agriculture over the past thirty years.Farmers tend to be the largest investors indeveloping country agriculture, and thereforetheir investment decisions are paramount forany strategy aimed at improving agriculturalinvestment.
CHART 17: Aid flows to agriculture, share oftotal aid (1995-2013)
●
●
●
●
● ●
●
●
●
●●
●
●
●●
●
●
●
●
●
●
●●
●● ●
●● ● ●
●
●
●●
●
●●
● 6
9
12
15
1995 2000 2005 2010
perc
en
t
● ● Agriculture, narrow Agriculture, broad
CHART 18: Total credit to agriculture, top20 countries in 2014 (2000 and 2012)
Czech Republic
Viet Nam
New Zealand
Mexico
Israel
Indonesia
United ArabEmirates
Belgium
Greece
Thailand
Turkey
Singapore
Canada
Australia
Russian Federation
India
France
Brazil
Germany
United Statesof America
0 2 4 6million US$
1999−2001 2010−12
CHART 19: Agri-Orientation Index, highestand lowest values (average 2008-2012)
Morocco
Central AfricanRepublic
Liberia
Lebanon
Burkina Faso
Indonesia
Nigeria
Tanzania
Kyrgyzstan
El Salvador
Botswana
Norway
Ireland
Slovakia
Mauritius
Malta
Czech Republic
Lithuania
Republic of Korea
Japan
0.0 0.5 1.0 1.5 2.0
index
Countries withhighest values
Countries withlowest values
CHART 20: Aid flows to agriculture, broad (1995-2013)
0
10 000
20 000
30 000
1995 2000 2005 2010
mil
lio
n c
on
stan
t U
S$
Bilateral Multilateral
12

FIGURE 5: Share of government expenditure on agriculture, share of total outlays(percent, 2008 to 2012*)
No
data
avail
ab
le
0 ~
< 0
.74
0.7
4 ~
< 1
.5
1.5
~ <
2.4
2.4
~ <
4.1
4.1
~ 1
1.1
8
13

UndernourishmentUndernourishment is a state, lasting for at leastone year, of inability to acquire enough food,defined as a level of food intake insufficientto meet dietary energy requirements. About793 million people – just over one in everynine people – in the world still lack sufficientfood for conducting an active and healthylife. Yet progress has been made, even in thepresence of significant population growth. Twohundred and eighteen million million fewerpeople suffer from undernourishment than 25years ago and 169 million fewer than a decadeago.
TABLE 1: Prevalence of undernourishment(percent)
1990-92 2014-16
World 18.6 10.8
Developed countries <5.0 <5.0
Developing countries 23.3 12.9
Africa 27.6 19.8
Asia 23.6 12.1
Latin America and theCaribbean
14.7 5.5
Oceania 15.7 14.2
CHART 21: Asian countries with the highestnumber of undernourished in 2014-16
Timor−Leste
Mongolia
Laos
Nepal
Cambodia
Sri Lanka
Thailand
Myanmar
Afghanistan
Viet Nam
Korea, Dem Rep
Philippines
Indonesia
Bangladesh
Pakistan
China
India
0 50 100 150 200 250
million people
1990−92 2014−16
CHART 22: African countries with thehighest number of undernourished in
2014-16
Central AfricanRepublic
Côte d'Ivoire
Burkina Faso
Cameroon
Rwanda
Malawi
Chad
Zimbabwe
Angola
Zambia
Madagascar
Uganda
Mozambique
Kenya
Tanzania
Nigeria
Ethiopia
0 10 20 30million people
1990−1992 2014−2016
CHART 23: Number of people undernourished
●
●
●●
●● ● ●●
● ●● ● ●●●●
●
●●
● ●●
●●
●● ●
●●
● ●●
●
●
● ● ●
●
●
● ●
●●
●
●
●●● ●
●
●●
●
●
●
●
●
●●
●
● ● ●
● ●
●● ●
●
●●
●●
●
● ● ● ●● ● ●● ●● ●●● ● ● ●●●● ●● ●●● ●0
200
400
600
1990−92 1999−2001 2004−06 2009−11 2014−16
mil
lio
n p
eo
ple
● ● ● ●Africa Asia Latin America and the Caribbean Oceania
14

FIGURE 6: Prevalence of undernourishment (percent, 2014-16)
No
data
avail
ab
le
0 ~
< 5
5 ~
< 1
5
15
~ <
25
25
~ <
35
35
~ 1
00
15
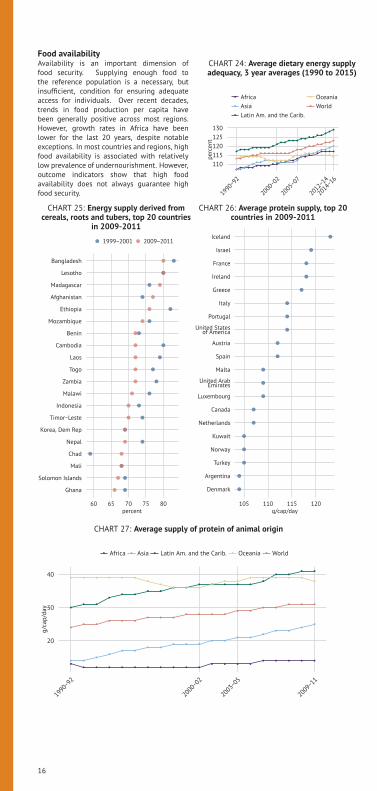
Food availabilityAvailability is an important dimension offood security. Supplying enough food tothe reference population is a necessary, butinsufficient, condition for ensuring adequateaccess for individuals. Over recent decades,trends in food production per capita havebeen generally positive across most regions.However, growth rates in Africa have beenlower for the last 20 years, despite notableexceptions. In most countries and regions, highfood availability is associated with relativelylow prevalence of undernourishment. However,outcome indicators show that high foodavailability does not always guarantee highfood security.
CHART 24: Average dietary energy supplyadequacy, 3 year averages (1990 to 2015)
●
●●
●
●
●
●
●
●
●
●●
● ●●
● ●●
●●● ●
●
●●
●
●
●
●
●●
● ●
●
●
●
●
●●
●
●●
●
●●
● ●●●
●
●
●●
●
●
● ●
●
●
●
●● ●
●
●
● ●
●
●
●
●
●●●
●
●
● ●
●
●
●
●
●
●●
●
● ●●
●●
● ● ●●
●●
●●
●
●●
● ●
● ●
●●
●●
●
●
● ●
●
●●●
●
●●
●●
●●
110
115
120
125
130
1990
−92
2000
−02
2005
−07
2012
−14
2014
−16
perc
en
t
●
●
●
●
●
Africa
Asia
Latin Am. and the Carib.
Oceania
World
CHART 25: Energy supply derived fromcereals, roots and tubers, top 20 countries
in 2009-2011
Ghana
Solomon Islands
Mali
Chad
Nepal
Korea, Dem Rep
Timor−Leste
Indonesia
Malawi
Zambia
Togo
Laos
Cambodia
Benin
Mozambique
Ethiopia
Afghanistan
Madagascar
Lesotho
Bangladesh
60 65 70 75 80
percent
1999−2001 2009−2011
CHART 26: Average protein supply, top 20countries in 2009-2011
Denmark
Argentina
Turkey
Norway
Kuwait
Netherlands
Canada
Luxembourg
United ArabEmirates
Malta
Spain
Austria
United Statesof America
Portugal
Italy
Greece
Ireland
France
Israel
Iceland
105 110 115 120
g/cap/day
CHART 27: Average supply of protein of animal origin
●
●
●
●
●
●
●
●
●
●
●
●
●
●
●
●
● ●
●
●
●●
●●
●
●
●
● ●
●
●●
●
●●
● ●● ●●
●
●
●
●
●
●
●
●
●
●
●
●
● ●
●
●
●●● ●
●
●
●
●
●
●
●
●
●
● ● ●
●
● ●
●
●
● ●
●
● ●
●
●
● ●
●
●
● ●
●
●
●
●
●
●
● ●● ●
20
30
40
1990
−92
2000
−02
2003
−05
2009
−11
g/c
ap
/day
● ● ● ● ●Africa Asia Latin Am. and the Carib. Oceania World
16

FIGURE 7: Average value of food production, constant 2004-2006 I$ per person (3year average, 2011-13)
No
data
avail
ab
le
0 ~
< 1
00
10
0 ~
< 1
50
15
0 ~
< 2
00
20
0 ~
< 3
00
30
0 ~
2 3
02
17

Food accessAn adequate supply of food does not in itselfguarantee household level food security. Accessto food is primarily determined by incomes,food prices and the ability of householdsand individuals to obtain access to socialsupport. Individuals’ access to food is alsoheavily influenced by social variables, includinggender positioning and power hierarchieswithin households. In addition to economicaffordability, physical access to food is alsofacilitated by adequate infrastructure, such asrailway lines and paved roads.
CHART 28: Depth of food decifit,kcal/capita/day (3 year averages)
●
●● ●
●
●
●
●
●
●●
● ●●
● ● ●
●
●● ●
●
●●
●●
●
●●
● ●
●
●
●
●
● ●
●
●●
●
●●
● ●●
●●
●
●●
●
●
● ●
●
●
●
● ● ●
●
●
● ●
●
●
●
●●●
●
●
● ●
●
●
●
●
●
●●
●
● ● ●
●
● ● ●●
●●
●●
●
●●
●●
● ●
●●
●
●●
●
● ●●
●●●
●●
●●● ●
50
100
150
200
1990
−92
2000
−02
2005
−07
2012
−14
2014
−16
kca
l/ca
p/d
ay
●
●
●
●
●
Africa
Asia
Latin Am. and the Carib.
Oceania
World
CHART 29: Domestic food price level index,top 20 countries in 2014 (2000 to 2014*)
Philippines
Sri Lanka
Burundi
Madagascar
Guatemala
Pakistan
Niger
Gambia
Egypt
Mali
Cambodia
Cameroon
Bangladesh
Benin
Burkina Faso
Senegal
Armenia
Nepal
Haiti
Mauritania
6 7 8 9 10
index
2000 2014
CHART 30: Prevalence ofundernourishment, highest 20 countries in
2014-16 (3 year averages)
Mozambique
Uganda
Yemen
Swaziland
Afghanistan
Timor−Leste
Congo
Rwanda
Liberia
Ethiopia
Tanzania
Madagascar
Tajikistan
Zimbabwe
Chad
Korea, Dem Rep
Namibia
Central AfricanRepublic
Zambia
Haiti
20 30 40 50 60
percent
1999−2001 2014−16
CHART 31: GDP per capita, PPP, constant 2011 international $
●
●
●
●
●
●
●
●
●
●
●
●●
●
●
●●
●
●
● ●
●
●
●●
●
●
● ●
●
●
●
●
● ●
●
●●●
●●
● ●● ●●
●
●
●
●
●
● ●
●
●
●
●
●●
●
●
●●
●
●
●●●
●
●
●●
●
●
●
●
●
●●
●
●●
●
●
●
●
●
●
●
● ●
●
●
●● ●●
●●●
●
● ●●● ● ●
●
●●● ●
●● ●
5 000
10 000
1990 1995 2000 2005 2010 2015
US$
● ● ● ● ●Africa Asia Latin Am. and the Carib. Oceania World
18

FIGURE 8: Road density, per 100 square km of land area (2007 to 2011*)
No
data
avail
ab
le
1.1
~ <
10
10
~ <
22
22
~ <
47
47
~ <
13
0
13
0 ~
3 8
50
19

Economic and political stabilityOver the last ten years, food and agriculturalmarkets have entered an unexpectedlyturbulent phase, characterized by large supplyshortfalls, price swings. Political and economicuncertainties, coupled with extreme weatherconditions, can have direct and adverse impactson food security. The poorer the household,the stronger the impact of external shocks, aspoor households spend a proportionally highershare of their incomes on food.
CHART 32: Per capita food productionvariability, constant 2004-2006 thousand
international $
●
●
● ●
●● ●
●
●
●●
●●●
● ●● ●
●
● ●●●
●● ●●
●
● ● ●
●
●
●●●
●
● ●●●
● ●
●
●
● ●●
● ●
●
●
●
●
●
●●
●
●
●
2.5
5.0
7.5
10.0
2002
2004
2006
2008
2010
2012
2014
ind
ex
●
●
●
●
●
Africa
Asia
Latin Am. and the Carib.
Oceania
World
CHART 33: Per capita food supply variability,top 20 countries in 2011, kcal/capita/day
Oman
Slovakia
Mauritius
Jordan
Iceland
Belarus
Colombia
Tanzania
Romania
Mauritania
Kazakhstan
Haiti
Barbados
Namibia
Maldives
Hungary
Georgia
Cuba
Venezuela
Gambia
50 100 150 200
kcal/cap/day
2000 2011
CHART 34: Domestic food price volatilityindex, top 20 countries in 2014
Greece
Norway
Mauritius
Burkina Faso
Armenia
Bolivia
Saint Lucia
Cyprus
Venezuela
Turkey
Iran(Islamic Republic of)
Pakistan
Togo
Iraq
Ghana
Bahrain
Congo
Gabon
Uganda
Benin
5 10 15 20 25
index
2000 2014
CHART 35: Value of food imports as a share of total merchandise exports (3 yearaverages)
0
5
10
15
Africa
Asia
Latin
Am
. and
the
Carib
.
Oce
ania
Wor
ld
perc
en
t
1999−2001 2009−2011
20

FIGURE 9: Political stability and absence of violence/terrorism, index (2013)
No
data
avail
ab
le
−2
.89
~ <
−1
.3
−1
.3 ~
< 0
0 ~
< 0
.4
0.4
~ <
1
1 ~
1.9
2
21

Food utilizationUtilization emphasizes the nutritional aspectsof food security. It is commonly understood asthe way the body makes the most of nutrientsfrom food. Sufficient energy and nutrient intakeincludes nutritious and safe diets, a cleanenvironment, access to health care, diversity ofa diet and intra-household distribution of food.Poor utilization within a population can imposeeconomic and social costs in countries at alleconomic levels.
TABLE 2: Countries with highest share ofchildren under 5 who are underweight,
percent
Year %
Timor-Leste 2009 45.3
Eritrea 2010 38.8
Niger 2012 37.9
Yemen 2011 35.5
Bangladesh 2013 31.9
CHART 36: Percentage of children under 5who are stunted, highest 20 countries
(2006 - 2014*)
Somalia
Tanzania
Pakistan
Mozambique
Bangladesh
Ethiopia
Rwanda
DR Congo
Benin
Nepal
Central AfricanRepublic
Zambia
Laos
India
Guatemala
Madagascar
Malawi
Niger
Timor−Leste
Burundi
45 50 55
percent
CHART 37: Percentage of children under 5affected by wasting, highest 20 countries
(2006 - 2014*)
Sao Tome andPrincipe
Syria
Mauritania
DR Congo
Côte d'Ivoire
Nepal
Central AfricanRepublic
Niger
Nigeria
Somalia
Sri Lanka
Indonesia
Pakistan
Bangladesh
Mali
Burkina Faso
India
Timor−Leste
Djibouti
South Sudan
10 15 20 25percent
CHART 38: Access to improved water source and sanitation facilities
●
●●
●
●
●●
●
●
●●
●●
●
●●
●
●
●●
●
●
●●
●●
60
70
80
90
2000 2005 2010
perc
en
t of
po
pu
lati
on
● ●Water source Sanitation facilities
22

FIGURE 10: Percentage of anaemia among children under 5, percent (2011)
No
data
avail
ab
le
6.3
~ <
24
24
~ <
31
31
~ <
38
38
~ <
56
56
~ 8
6.1
23

Dietary energy supplyThe dietary energy supply (DES) is the foodavailable for human consumption, expressedin kilocalories per person per day. At thecountry level, it is calculated as a measureof food available for human use after takingout all non-food utilization, including exports,industrial use, animal feed, seed, wastageand changes in stocks. In 1961 the averageglobal calorie availability was as low as 2 196kcal/cap/day; by 2011, it had reached 2 870kcal/cap/day, and was centered more around anarrow base of staple grains as well as meatand dairy products.
CHART 39: Share of dietary energy supply,kcal/capita/day (2009-2011)
Cereals(excl. beer)
Meat and offals
Milk(excl. butter)
Starchy roots
Sugar andsweetenersVeg. oils andanimal fats
CHART 40: Dietary energy supply, top 20countries in 2015
Jordan
South Africa
China
Kazakhstan
Oman
Iran(Islamic Republic of)
Saudi Arabia
Brazil
Kuwait
Lebanon
Algeria
Morocco
Ghana
United ArabEmirates
Republic of Korea
Tunisia
Cuba
Egypt
Argentina
Turkey
2 500 3 000 3 500
kcal/cap/day
2000 2015
CHART 41: Dietary energy supply, bottom20 countries in 2015
Central AfricanRepublic
Zambia
Haiti
Namibia
Madagascar
Afghanistan
Korea, Dem Rep
Congo
Tajikistan
Ethiopia
Timor−Leste
Tanzania
Zimbabwe
Kenya
Chad
Yemen
Swaziland
Rwanda
Uganda
Bolivia
1 800 2 000 2 200
kcal/cap/day
2000 2015
CHART 42: Dietary energy supply, kcal/cap/day
●
●
●
●
●
●
●●
●
●
●●
●
●
●
●
●
●
●
●
●
●
● ●
●
●
●
●●
●
●
●
●
●
●
●
●
●
●
●
●
●
●
●
●
●
●
●
●
●●
●
●● ●
●
●
●●
●
●
●
●
●
● ●●●
●
●
●
●
●●●● ●●●
●
2 400
2 600
2 800
3 000
2000 2005 2010 2015
kca
l/ca
p/d
ay
● ● ● ● ●Africa Asia Latin Am. and the Carib. Oceania World
24

FIGURE 11: Average dietary energy supply adequacy, percent (2014-2016)
No
data
avail
ab
le
87
~ <
11
0
11
0 ~
< 1
20
12
0 ~
< 1
30
13
0 ~
< 1
40
14
0 ~
16
1
25

Crop productionThe majority of people in developing countrieslive in rural areas, and most of them dependon agriculture for their livelihoods. Over thepast 50 years, growth in crop production hasbeen driven largely by higher yields per unit ofland, and crop intensification. Trends are notuniform across regions, however. Most of thegrowth in wheat and rice production in Asia andNorthern Africa has been from gains in yield,while expansion of harvested land has led toproduction growth of maize in Latin Americaand in sub-Saharan Africa.
TABLE 3: Fastest growing products based onquantities (average annual growth rate,
2000 to 2013)
%
Bambara beans 9.2
Walnuts, with shell 9.1
Pistachios 8.5
Vanilla 8.0
Garlic 7.7
CHART 43: Top 20 crop producing countriesin 2012 based on net per capita crop
production value
France
Denmark
Belarus
Lithuania
Spain
Guyana
Ukraine
Turkey
United Statesof America
Paraguay
Malaysia
Brazil
Thailand
Costa Rica
Belize
Canada
Greece
Uruguay
Argentina
Australia
200 300 400 500 600constant 2004−2006 international $
2000 2012
CHART 44: Top 20 food producing countriesin 2012 based on net food per capita
production value
Belgium
Belize
Ukraine
Costa Rica
Greece
Spain
Paraguay
France
Brazil
United Statesof America
Lithuania
Netherlands
Canada
Belarus
Argentina
Ireland
Australia
Uruguay
Denmark
New Zealand
500 1 000 1 500 2 000constant 2004−2006 international $
2000 2012
CHART 45: Average annual growth in cereals production (2000-13)
0.0
0.5
1.0
1.5
2.0
2.5
Wor
ld
perc
en
t
Production quantity Harvested area Yield
26

FIGURE 12: Crops, gross per capita production index (2004-06 = 100, 2013)
No
data
avail
ab
le
0.3
98
6 ~
< 6
3
63
~ <
11
0
11
0 ~
< 1
80
18
0 ~
< 2
70
27
0 ~
1 3
51
27
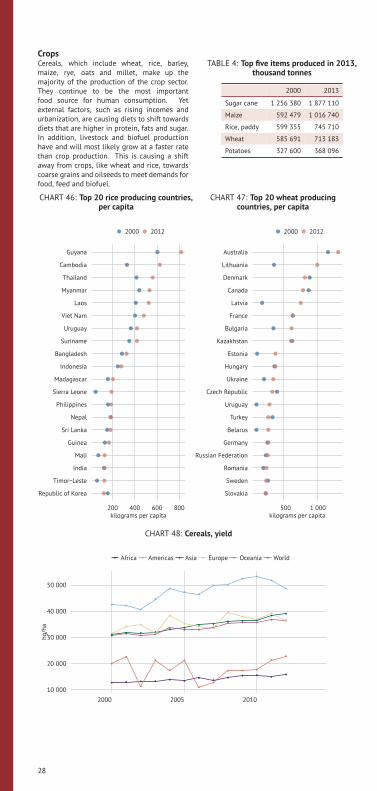
CropsCereals, which include wheat, rice, barley,maize, rye, oats and millet, make up themajority of the production of the crop sector.They continue to be the most importantfood source for human consumption. Yetexternal factors, such as rising incomes andurbanization, are causing diets to shift towardsdiets that are higher in protein, fats and sugar.In addition, livestock and biofuel productionhave and will most likely grow at a faster ratethan crop production. This is causing a shiftaway from crops, like wheat and rice, towardscoarse grains and oilseeds to meet demands forfood, feed and biofuel.
TABLE 4: Top five items produced in 2013,thousand tonnes
2000 2013
Sugar cane 1 256 380 1 877 110
Maize 592 479 1 016 740
Rice, paddy 599 355 745 710
Wheat 585 691 713 183
Potatoes 327 600 368 096
CHART 46: Top 20 rice producing countries,per capita
Republic of Korea
Timor−Leste
India
Mali
Guinea
Sri Lanka
Nepal
Philippines
Sierra Leone
Madagascar
Indonesia
Bangladesh
Suriname
Uruguay
Viet Nam
Laos
Myanmar
Thailand
Cambodia
Guyana
200 400 600 800
kilograms per capita
2000 2012
CHART 47: Top 20 wheat producingcountries, per capita
Slovakia
Sweden
Romania
Russian Federation
Germany
Belarus
Turkey
Uruguay
Czech Republic
Ukraine
Hungary
Estonia
Kazakhstan
Bulgaria
France
Latvia
Canada
Denmark
Lithuania
Australia
500 1 000
kilograms per capita
2000 2012
CHART 48: Cereals, yield
●●
● ●
●● ●
●
● ● ●● ●
● ● ● ●●
●
●●
●● ●
●●
● ●
●
●
●
●●
● ●
●●
●
●
●● ● ●
●●
● ●● ● ●
●●
●
●●
●
●
●
●●
●
●
●
●
●
●
●
●
●
●
●
●
●
● ● ●
●
●
10 000
20 000
30 000
40 000
50 000
2000 2005 2010
hg
/ha
● ● ● ● ● ●Africa Americas Asia Europe Oceania World
28

FIGURE 13: Cereal production, kilograms/cap (2013)
No
data
avail
ab
le
0 ~
< 2
4
24
~ <
11
0
11
0 ~
< 2
10
21
0 ~
< 5
00
50
0 ~
1 8
87
29
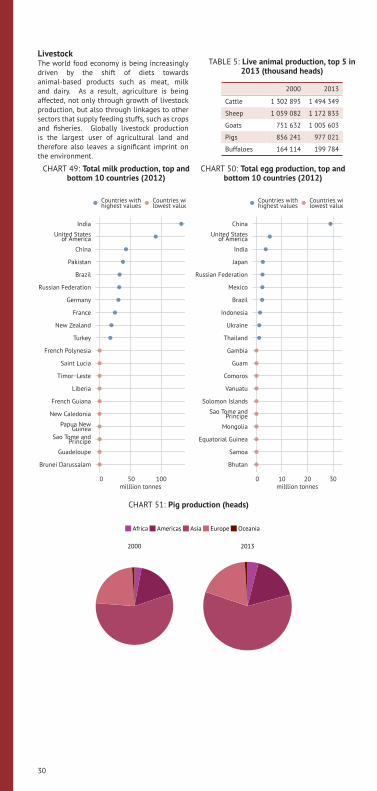
LivestockThe world food economy is being increasinglydriven by the shift of diets towardsanimal-based products such as meat, milkand dairy. As a result, agriculture is beingaffected, not only through growth of livestockproduction, but also through linkages to othersectors that supply feeding stuffs, such as cropsand fisheries. Globally livestock productionis the largest user of agricultural land andtherefore also leaves a significant imprint onthe environment.
TABLE 5: Live animal production, top 5 in2013 (thousand heads)
2000 2013
Cattle 1 302 895 1 494 349
Sheep 1 059 082 1 172 833
Goats 751 632 1 005 603
Pigs 856 241 977 021
Buffaloes 164 114 199 784
CHART 49: Total milk production, top andbottom 10 countries (2012)
Brunei Darussalam
Guadeloupe
Sao Tome andPrincipe
Papua NewGuinea
New Caledonia
French Guiana
Liberia
Timor−Leste
Saint Lucia
French Polynesia
Turkey
New Zealand
France
Germany
Russian Federation
Brazil
Pakistan
China
United Statesof America
India
0 50 100
milllion tonnes
Countries withhighest values
Countries withlowest values
CHART 50: Total egg production, top andbottom 10 countries (2012)
Bhutan
Samoa
Equatorial Guinea
Mongolia
Sao Tome andPrincipe
Solomon Islands
Vanuatu
Comoros
Guam
Gambia
Thailand
Ukraine
Indonesia
Brazil
Mexico
Russian Federation
Japan
India
United Statesof America
China
0 10 20 30
milllion tonnes
Countries withhighest values
Countries withlowest values
CHART 51: Pig production (heads)
2000 2013
Africa Americas Asia Europe Oceania
30

FIGURE 14: Cattle and buffaloes per ha of agricultural area, heads per ha (2012)
No
data
avail
ab
le
0 ~
< 0
.09
7
0.0
97
~ <
0.2
4
0.2
4 ~
< 0
.48
0.4
8 ~
< 0
.75
0.7
5 ~
3.3
33
31
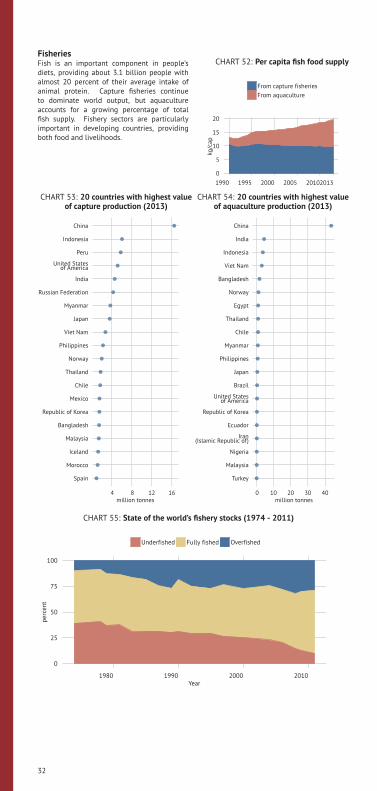
FisheriesFish is an important component in people’sdiets, providing about 3.1 billion people withalmost 20 percent of their average intake ofanimal protein. Capture fisheries continueto dominate world output, but aquacultureaccounts for a growing percentage of totalfish supply. Fishery sectors are particularlyimportant in developing countries, providingboth food and livelihoods.
CHART 52: Per capita fish food supply
0
5
10
15
20
1990 1995 2000 2005 20102013
kg
/cap
From capture fisheries
From aquaculture
CHART 53: 20 countries with highest valueof capture production (2013)
Spain
Morocco
Iceland
Malaysia
Bangladesh
Republic of Korea
Mexico
Chile
Thailand
Norway
Philippines
Viet Nam
Japan
Myanmar
Russian Federation
India
United Statesof America
Peru
Indonesia
China
4 8 12 16
million tonnes
CHART 54: 20 countries with highest valueof aquaculture production (2013)
Turkey
Malaysia
Nigeria
Iran(Islamic Republic of)
Ecuador
Republic of Korea
United Statesof America
Brazil
Japan
Philippines
Myanmar
Chile
Thailand
Egypt
Norway
Bangladesh
Viet Nam
Indonesia
India
China
0 10 20 30 40
million tonnes
CHART 55: State of the world’s fishery stocks (1974 - 2011)
0
25
50
75
100
1980 1990 2000 2010
Year
perc
en
t
Underfished Fully fished Overfished
32

FIGURE 15: Fish production index (2004-06=100, 2013)
No
data
avail
ab
le
11
.02
~ <
82
82
~ <
99
99
~ <
12
0
12
0 ~
< 1
50
15
0 ~
1 4
35
33

Agricultural tradeMost of the food consumed worldwide isgrown locally. Where there is not enoughlocal production to meet demand, trade hasbeen instrumental in filling the gap. Thescale of food and agricultural trade todayis unprecedented. In real terms, the valueof international flows has increased aroundfivefold over the past 50 years, reflecting globaltrends in the overall volume of trade. However,this expansion has been unevenly distributedacross regions. High-income countries havegenerally outpaced developing regions,although several of the latter have comparativeadvantages in food and agricultural production.
TABLE 6: Exports and Imports of food,million US$ (2012)
Export value Import Value
Europe 403 418
Asia 160 264
Americas 266 159
Africa 29 64
Oceania 45 14
CHART 56: Top food importing countriesin 2012
United ArabEmirates
Indonesia
Malaysia
Egypt
India
Republic of Korea
Saudi Arabia
Mexico
Spain
Canada
Belgium
Russian Federation
Italy
France
Netherlands
United Kingdom
Japan
Germany
United Statesof America
China
0 25 50 75 100billion US$
2000 2012
CHART 57: Top food exporting countries in2012
Ukraine
Mexico
Poland
New Zealand
Thailand
India
Malaysia
Indonesia
Australia
Italy
Argentina
Belgium
Spain
China
Canada
France
Germany
Netherlands
Brazil
United Statesof America
0 30 60 90billion US$
2000 2012
CHART 58: Cereal exports
● ● ● ● ● ● ● ● ● ● ● ● ●
●●
●●
●
●
●
●
●
●
●
●
●
●● ●
● ●● ●
●
●
●
●
●●
●●
●
● ●
●●
●
●
●●
●
●
● ● ●●
●
●●
●
● ●●
●
●
0
10
20
30
40
50
2000 2005 2010
bil
lio
n c
on
stan
t 2
00
5 U
S$
● ● ● ● ●Africa Americas Asia Europe Oceania
34

FIGURE 16: Import value index (2004-2006 = 100, 2011)
No
data
avail
ab
le
71
~ <
15
0
15
0 ~
< 1
80
18
0 ~
< 2
20
22
0 ~
< 2
70
27
0 ~
64
9
35

LandLand is necessary for sustainable agriculturaldevelopment, essential ecosystem functionsand food security. More than 1.5 billionhectares – about 12 percent of the world’s landarea – are used for crop production. Althoughlarge amounts of land are potentially suitablefor agriculture, much of it is covered by forests,protected for environmental reasons or are partof urban areas. Some 90 percent of agriculturalland is in Latin America and sub-Saharan Africa.At the other extreme, there is almost noneavailable for agricultural expansion in SouthernAsia, the Western Asia and Northern Africa.
CHART 59: Land area
0
25
50
75
100
Africa
Amer
icas
Asia
Euro
pe
Oce
ania
Wor
ld
perc
en
t
Agricultural Forest Other
CHART 60: Arable land per capita, top 20countries (2012)
Hungary
Bulgaria
Mali
Estonia
United Statesof America
Republic ofMoldova
Uruguay
Guyana
Sudan
Latvia
Belarus
Paraguay
Ukraine
Lithuania
Russian Federation
Niger
Argentina
Canada
Kazakhstan
Australia
0.5 1.0 1.5 2.0
ha/cap
CHART 61: Arable land per capita, bottom20 countries (2012)
Singapore
Bahrain
Djibouti
Kuwait
United ArabEmirates
Guam
Qatar
Maldives
French Polynesia
Brunei Darussalam
Oman
West Bank andGaza Strip
Puerto Rico
Saint Lucia
Trinidad andTobago
Malta
Bahamas
New Caledonia
Martinique
Jordan
0.00 0.01 0.02 0.03
ha/cap
CHART 62: Agricultural area
0
25
50
75
100
Africa
Amer
icas
Asia
Euro
pe
Oce
ania
Wor
ld
perc
en
t
Arable Permanent crops Permanent meadows and pastures
36

FIGURE 17: Cropland per capita, ha per cap (2012)
No
data
avail
ab
le
0.0
00
13
77
~ <
0.0
62
0.0
62
~ <
0.1
3
0.1
3 ~
< 0
.24
0.2
4 ~
< 0
.34
0.3
4 ~
4
37

WaterGlobal demand for water has risen sharplyover the last century. Total annual waterwithdrawal from agriculture, municipalitiesand industries rose from less than 580 km3
in 1900 to more than 3 900 km3 in 2010.Agriculture accounts for approximately 70percent of total freshwater withdrawal in theworld, mostly through irrigation. This hasbeen crucial for gains in food production sinceirrigation reduces drought risk and encouragescrop diversification, thus also enhancing ruralincomes. While irrigated agriculture representsabout 20 percent of the cultivated land, itcontributes to 40 percent of global foodproduction.
CHART 63: Countries with the lowestrenewable water resources per capita
0255075
100125
Mal
dive
s
Saud
i Ara
bia
Qat
ar
the
Uni
ted
Arab
Emira
tes
Kuwai
t
m3
yr
pers
on
2000 2010
CHART 64: Freshwater withdrawal byindustrial sector, share of total, highest 20
(1999 to 2013)
Sweden
Poland
Russian Federation
Romania
Macedonia
Bulgaria
France
Ukraine
Finland
Canada
Austria
Serbia
Slovenia
Hungary
Republic ofMoldova
Germany
Netherlands
Belgium
Lithuania
Estonia
60 70 80 90
percent
CHART 65: Freshwater withdrawal byagricultural sector, share of total, highest
20 (1999 to 2013)
Laos
Bolivia
Iran(Islamic Republic of)
Senegal
Kyrgyzstan
Ethiopia
Pakistan
Cambodia
Bhutan
Turkmenistan
Guyana
Eritrea
Viet Nam
Sudan
Swaziland
Madagascar
Mali
Nepal
Afghanistan
Somalia
91 93 95 97 99
percent
CHART 66: Countries with the highest renewable water resources per capita
0
200 000
400 000
600 000
Icel
and
Guyan
a
Cong
o
Surin
ame
Papu
a New
Gui
nea
Bhuta
n
Gabon
Cana
da
Solo
mon
Isla
nds
Nor
way
m3
yr
pers
on
2000 2010
38

FIGURE 18: Freshwater resources withdrawn by agriculture (percent, 1999-2013*)
No
data
avail
ab
le
0 ~
< 0
.28
0.2
8 ~
< 0
.92
0.9
2 ~
< 4
.6
4.6
~ <
22
22
~ 2
46
0
39

EnergyEnergy is an important input for the agri-foodchain and is used to power agriculturalmachinery, heat greenhouses, power irrigationsystems, but also to manufacture equipment,fertilizers, pesticides and other agro-chemicals.The amount of energy consumed by agricultureis increasing worldwide as mechanization,especially in developing countries, increases.At the same time agriculture produces energyin the form of bioenergy. Bioenergy productionincreased sharply over the last years tomeet the new demand for liquid biofuels fortransport (e.g., ethanol and biodiesel) and solidbiomass for power such as pellets or woodchips.
CHART 67: Global wood pellet production
●●
●●
●
●
●
●
●
●
●
●
●
5 000
10 000
15 000
20 000
2000 2005 2010
kto
nn
es
CHART 68: Total energy consumption inagriculture, top 20 countries (2012)
Indonesia
Spain
Italy
Republic of Korea
Argentina
Japan
Netherlands
Poland
Thailand
Mexico
France
Turkey
Canada
Iran(Islamic Republic of)
Egypt
Brazil
Russian Federation
India
United Statesof America
China
400 800 1 200 1 600
PJ
CHART 69: Bioenergy as a % of totalrenewable energy, selected countries (2012)
United ArabEmirates
Iraq
Jamaica
Turkey
Senegal
Kenya
Japan
Cambodia
Dominican Republic
Argentina
Brazil
China
Germany
Australia
Italy
Viet Nam
United Statesof America
Nicaragua
Indonesia
Algeria
0 25 50 75 100
percent
CHART 70: Biodiesel, biogas, biogasoline and other bio-oil consumption
● ● ● ●●
●
●
●
●
●
●
●
●
● ●● ● ● ● ●
● ●●
●●
●
● ●●
●
●
●
●
●
●
●
●
●●
● ● ● ● ● ● ● ● ● ● ● ● ● 0
500 000
1 000 000
1 500 000
2000 2005 2010
TJ
● ● ● ●Biodiesel Biogases Biogasoline Other liquid biofuels
40

FIGURE 19: Energy consumption for power irrigation, million kWh (2011)
No
data
avail
ab
le
0 ~
< 2
2 ~
< 2
9
29
~ <
17
0
17
0 ~
< 1
06
0
1 0
60
~ 9
6 8
55
41

ForestryForests make vital contributions to biodiversity.They also sustain a range of economic activitiesand act as a source of food, medicine and fuelfor more than a billion people. The latestestimate of the world’s total forest area ismore than 4 billion hectares, correspondingto about 30 percent of total land area. Buttoday forests face unprecedented pressures.Changes in land cover have caused themost pressing environmental issue in recentdecades. The impact of deforestation andland use intensification, especially on soildegradation, have been significant.
CHART 71: Production of selected forestproducts
● ●●
●●
●
●●
● ●● ● ●
●● ● ● ● ● ●
● ●
●● ● ●
●●
●●
●●
●● ●
●
●● ●
200
300
400
2000 2005 2010
mil
lio
n t
on
nes
●
●
●
Recovered paper
Wood pulp
Paper and paperboard
CHART 72: Top 20 exporters of forestproducts (2012)
Japan
New Zealand
Poland
Malaysia
Netherlands
Chile
Spain
Belgium
Italy
Austria
France
Brazil
Indonesia
Russian Federation
Finland
China
Sweden
Germany
Canada
United Statesof America
10 0
00
20 0
00
billion US$
CHART 73: Top 20 importers of forestproducts (2012)
Sweden
Saudi Arabia
Russian Federation
Austria
Turkey
Poland
Spain
Mexico
Canada
Republic of Korea
India
Belgium
Netherlands
France
Italy
United Kingdom
Japan
Germany
United Statesof America
China
10 0
00
20 0
00
30 0
00
billion US$
CHART 74: Forest characteristics (planted forest, primary forest, and other naturallyregenerated forest) (2010)
0
500
1 000
1 500
Africa
Amer
icas
Asia
Euro
pe
Oce
ania
mil
lio
n h
a
primary forest planted forest other naturally regenerated forest
42

FIGURE 20: Forest area as share of total land area, percent (2012)
No
data
avail
ab
le
0 ~
< 6
.8
6.8
~ <
22
22
~ <
37
37
~ <
52
52
~ 9
8.2
3
43

Climate changeThe severity and speed of climate changeis presenting an unprecedented challenge.Current global surface temperatures are nowabout 0.6 degrees Celsius higher than theaverage for the last century. This increase isconsistent with model predictions of the effectsof rising atmospheric concentrations of carbondioxide (CO2 ) and other GHGs, which are aresult of human activity. The poorest and mostfood-insecure regions around the globe are themost vulnerable. Already scarce land and waterresources will likely become even more scarce,and insufficient technical and financial meanswill make adaptation to a changing climate verydifficult.
CHART 75: Greenhouse gas emissions inagriculture
● ● ● ● ● ● ● ● ● ● ● ● ●
● ● ● ● ● ● ● ● ● ● ● ● ●
● ● ● ●●
●●
●●
● ● ●●
● ● ● ● ● ● ● ● ● ● ● ● ●
● ● ●● ● ● ● ● ● ● ●
● ●
500
1 000
1 500
2 000
2 500
2000 2005 2010
th
ou
san
d g
igag
ram
s C
O2eq
●
●
●
●
●Africa
Americas
Asia
Europe
Oceania
CHART 76: Greehouse gas emissions inagriculture, highest 20 countries in 2012
Colombia
Canada
Germany
Viet Nam
Nigeria
Myanmar
France
Thailand
Bangladesh
Mexico
Ethiopia
Russian Federation
Argentina
Pakistan
Indonesia
Australia
United Statesof America
Brazil
India
China
200 400 600 800
Mt CO2eq
2000 2012
CHART 77: Land use total emissions,highest 20 countries in 2012
Zimbabwe
Colombia
Angola
Argentina
Peru
Zambia
Paraguay
Ecuador
Myanmar
Papua NewGuinea
Bolivia
Tanzania
Cameroon
Venezuela
Canada
Malaysia
DR Congo
Nigeria
Brazil
Indonesia
0 400 800 1 200
Mt CO2eq
2000 2012
CHART 78: Emissions by subsectors in 2012
−2 000
0
2 000
4 000
th
ou
san
d g
igag
ram
s C
O2eq
All GHG agricultural sectors
Net forest conversion
Cultivation histoils and peat fires
Burning savanna
Forest
44

FIGURE 21: Total greenhouse gas emissions from agriculture, forestry and other landuse, gigagrams CO2 eq (2012)
No
data
avail
ab
le
−1
13
36
1 ~
< 3
.4
3.4
~ <
50
0
50
0 ~
< 6
94
0
6 9
40
~ <
33
70
0
33
70
0 ~
1 3
83
43
4
45


World
1990 2000 2014
The settingPopulation, total (mln) 5 320.8 6 127.7 7 243.8Population, rural (mln) 3 033 3 263.4 3 362.5Govt expenditure on ag (% total outlays)Area harvested (mln ha) 1 952 2 061 2 781Cropping intensity ratio 0.4 0.4Water resources (1 000 m3/person/year)Area equipped for irrigation (1 000 ha)Area irrigated (% area equipped for irrigation)Employment in agriculture (%) 35.3 38 30.7Employment in agriculture, female (%) 9.2 20.3 25.2Fertilizers, Nitrogen (kg of nutrients per ha) 64.9 85.8Fertilizers, Phosphate (kg of nutrients per ha) 25.9 33.2Fertilizers, Potash (kg nutrients per ha) 18.2 20.4Energy consump, power irrigation (mln kWh) 35 981 130 786 325 448Agr value added per worker (constant US$)Hunger dimensionsDietary energy supply (kcal/pc/day) 2 597 2 717 2 903Average dietary energy supply adequacy (%) 113 116 123Dietary en supp, cereals/roots/tubers (%) 58 55 52Prevalence of undernourishment (%) 18.6 15 10.8GDP per capita (US$, PPP) 8 832 10 241 13 915Domestic food price volatility (index) 3.6 7.8Cereal import dependency ratio (%) -0.4 -0.2 50.7Underweight, children under-5 (%)Improved water source (% pop) 78.5 83 88.7Food supplyFood production value, (2004-2006 mln I$) 1 294 508 1 618 814 2 246 912Agriculture, value added (% GDP) 4 4Food exports (mln US$) 215 425 276 704 945 572Food imports (mln US$) 237 329 294 271 966 964Production indices (2004-06=100)Net food 73 90 121Net crops 72 89 123Cereals 82 92 123Vegetable oils 51 77 141Roots and tubers 74 94 119Fruit and vegetables 58 86 127Sugar 86 93 132Livestock 76 92 115Milk 83 89 114Meat 74 91 118Fish 72 92 119Net trade (mln US$)Cereals -2 447 -4 525 -6 979Fruit and vegetables -9 430 -7 461 -5 811Meat -2 574 -682 5 056Dairy products -663 165 1 169Fish -3 882 -4 295 1 257EnvironmentForest area (%) 33 32 32Renewable water res withdrawn (% of total)Terrestrial protect areas (% total land area) 9 12 14Organic area (% total agricultural area) 1Water withdrawal by agriculture (% of total)Biofuel production (thousand kt of oil eq.) 3 987 18 110 381 064Wood pellet prod. (1 000 tonnes) 26 154Net GHG emissions from AFOLU (CO2 eq, Mt) 8 075 7 449 8 165
48

Africa
1990 2000 2014
The settingPopulation, total (mln) 630 808.3 1 138.2Population, rural (mln) 428 520.8 675.5Govt expenditure on ag (% total outlays)Area harvested (mln ha) 111 169 280Cropping intensity ratio 0.1 0.2Water resources (1 000 m3/person/year)Area equipped for irrigation (1 000 ha)Area irrigated (% area equipped for irrigation)Employment in agriculture (%) 30.9 24.5 27.6Employment in agriculture, female (%) 40.9 29.4 31.1Fertilizers, Nitrogen (kg of nutrients per ha) 14.1 13.8Fertilizers, Phosphate (kg of nutrients per ha) 4.7 5.9Fertilizers, Potash (kg nutrients per ha) 2.3 2.2Energy consump, power irrigation (mln kWh) 3 163 14 718 20 667Agr value added per worker (constant US$)Hunger dimensionsDietary energy supply (kcal/pc/day) 2 320 2 402 2 581Average dietary energy supply adequacy (%) 107 110 117Dietary en supp, cereals/roots/tubers (%) 66 65 63Prevalence of undernourishment (%) 27.6 25.7 19.8GDP per capita (US$, PPP) 3 315 3 421 4 575Domestic food price volatility (index) 5.7 6.3Cereal import dependency ratio (%) 25.9 28.1 42Underweight, children under-5 (%)Improved water source (% pop) 55.5 61.1 68.7Food supplyFood production value, (2004-2006 mln I$) 93 685 128 481 202 196Agriculture, value added (% GDP) 16 14Food exports (mln US$) 6 744 7 815 28 015Food imports (mln US$) 12 451 16 135 70 074Production indices (2004-06=100)Net food 60 82 129Net crops 59 82 127Cereals 66 79 131Vegetable oils 58 79 128Roots and tubers 50 80 133Fruit and vegetables 58 82 124Sugar 76 94 114Livestock 65 84 126Milk 59 77 125Meat 67 87 127Fish 65 90 119Net trade (mln US$)Cereals -4 973 -7 262 -28 752Fruit and vegetables 1 058 1 192 4 334Meat -454 -626 -4 517Dairy products -1 365 -1 269 -4 067Fish 590 1 752 225EnvironmentForest area (%) 25 24 22Renewable water res withdrawn (% of total)Terrestrial protect areas (% total land area) 9 10 14Organic area (% total agricultural area) 0Water withdrawal by agriculture (% of total)Biofuel production (thousand kt of oil eq.) 246 425 512Wood pellet prod. (1 000 tonnes) 95Net GHG emissions from AFOLU (CO2 eq, Mt) 1 751 1 817 1 865
49

Asia
1990 2000 2014
The settingPopulation, total (mln) 3 146.8 3 717.4 4 342.3Population, rural (mln) 2 142.5 2 325.5 2 293.3Govt expenditure on ag (% total outlays)Area harvested (mln ha) 873 996 1 348Cropping intensity ratio 0.7 0.6Water resources (1 000 m3/person/year)Area equipped for irrigation (1 000 ha)Area irrigated (% area equipped for irrigation)Employment in agriculture (%) 50.1 49.5 38.6Employment in agriculture, female (%) 9.7 26.1 44.2Fertilizers, Nitrogen (kg of nutrients per ha) 110.6 165.6Fertilizers, Phosphate (kg of nutrients per ha) 39.8 62.5Fertilizers, Potash (kg nutrients per ha) 20.2 28.4Energy consump, power irrigation (mln kWh) 7 614 38 316 82 411Agr value added per worker (constant US$)Hunger dimensionsDietary energy supply (kcal/pc/day) 2 398 2 573 2 813Average dietary energy supply adequacy (%) 107 112 120Dietary en supp, cereals/roots/tubers (%) 66 63 57Prevalence of undernourishment (%) 23.6 17.6 12.1GDP per capita (US$, PPP) 3 017 4 595 9 392Domestic food price volatility (index) 5.3 7Cereal import dependency ratio (%) 5.3 5.8 93.3Underweight, children under-5 (%)Improved water source (% pop) 90.8Food supplyFood production value, (2004-2006 mln I$) 508 899 757 934 1 134 641Agriculture, value added (% GDP) 7 10Food exports (mln US$) 26 095 40 997 181 141Food imports (mln US$) 55 240 84 465 325 015Production indices (2004-06=100)Net food 68 88 128Net crops 69 88 129Cereals 83 93 123Vegetable oils 46 75 143Roots and tubers 68 97 129Fruit and vegetables 42 81 140Sugar 82 102 134Livestock 64 85 126Milk 51 78 122Meat 51 87 128Fish 54 85 136Net trade (mln US$)Cereals -13 330 -12 967 -35 498Fruit and vegetables 979 -2 128 669Meat -5 691 -11 087 -27 384Dairy products -3 090 -4 559 -14 876Fish -4 395 -5 573 6 725EnvironmentForest area (%) 23 18 18Renewable water res withdrawn (% of total)Terrestrial protect areas (% total land area) 9 11 12Organic area (% total agricultural area) 0Water withdrawal by agriculture (% of total)Biofuel production (thousand kt of oil eq.) 928 1 520 30 089Wood pellet prod. (1 000 tonnes) 1 585Net GHG emissions from AFOLU (CO2 eq, Mt) 2 246 2 311 3 409
50

Latin America and the Caribbean
1990 2000 2014
The settingPopulation, total (mln) 445.2 526.3 623.4Population, rural (mln) 132.1 129.1 125Govt expenditure on ag (% total outlays)Area harvested (mln ha)Cropping intensity ratioWater resources (1 000 m3/person/year)Area equipped for irrigation (1 000 ha)Area irrigated (% area equipped for irrigation)Employment in agriculture (%) 19.5 14.2 15.8Employment in agriculture, female (%) 13.7 6.2 7.6Fertilizers, Nitrogen (kg of nutrients per ha)Fertilizers, Phosphate (kg of nutrients per ha)Fertilizers, Potash (kg nutrients per ha)Energy consump, power irrigation (mln kWh)Agr value added per worker (constant US$)Hunger dimensionsDietary energy supply (kcal/pc/day) 2 669 2 787 3 069Average dietary energy supply adequacy (%) 117 120 129Dietary en supp, cereals/roots/tubers (%) 42 41 40Prevalence of undernourishment (%) 14.7 12.1 5.5GDP per capita (US$, PPP) 9 837 10 976 13 915Domestic food price volatility (index) 3.5 5.1Cereal import dependency ratio (%) 13 12 49.7Underweight, children under-5 (%)Improved water source (% pop) 85.1 89.8 94Food supplyFood production value, (2004-2006 mln I$) 138 170 192 134 297 533Agriculture, value added (% GDP) 5 6Food exports (mln US$) 23 052 31 727 142 567Food imports (mln US$) 11 115 22 055 67 602Production indices (2004-06=100)Net food 60 83 129Net crops 64 83 131Cereals 62 88 139Vegetable oilsRoots and tubersFruit and vegetablesSugarLivestock 58 84 123MilkMeatFish 82 107 71Net trade (mln US$)Cereals -1 766 -3 293 1 077Fruit and vegetables 6 023 8 082 23 534Meat 1 119 899 14 206Dairy products -1 154 -1 303 -2 237Fish 2 311 4 644 9 889EnvironmentForest area (%) 52 50 47Renewable water res withdrawn (% of total)Terrestrial protect areas (% total land area) 9 14 21Organic area (% total agricultural area) 1Water withdrawal by agriculture (% of total)Biofuel production (thousand kt of oil eq.) 1 619 1 730 61 706Wood pellet prod. (1 000 tonnes) 122Net GHG emissions from AFOLU (CO2 eq, Mt) 2 462 2 415 2 335
51
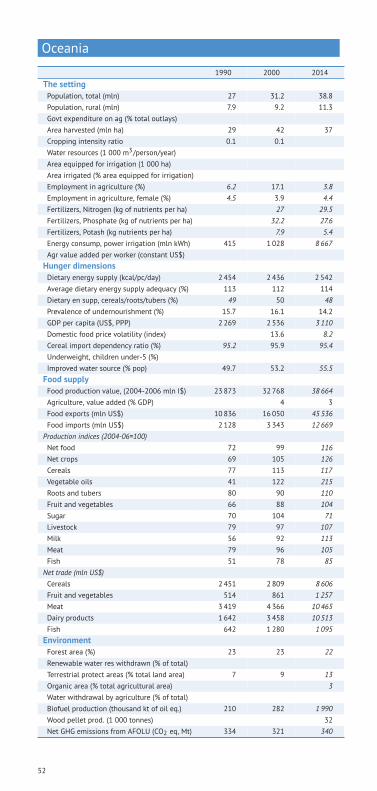
Oceania
1990 2000 2014
The settingPopulation, total (mln) 27 31.2 38.8Population, rural (mln) 7.9 9.2 11.3Govt expenditure on ag (% total outlays)Area harvested (mln ha) 29 42 37Cropping intensity ratio 0.1 0.1Water resources (1 000 m3/person/year)Area equipped for irrigation (1 000 ha)Area irrigated (% area equipped for irrigation)Employment in agriculture (%) 6.2 17.1 3.8Employment in agriculture, female (%) 4.5 3.9 4.4Fertilizers, Nitrogen (kg of nutrients per ha) 27 29.5Fertilizers, Phosphate (kg of nutrients per ha) 32.2 27.6Fertilizers, Potash (kg nutrients per ha) 7.9 5.4Energy consump, power irrigation (mln kWh) 415 1 028 8 667Agr value added per worker (constant US$)Hunger dimensionsDietary energy supply (kcal/pc/day) 2 454 2 436 2 542Average dietary energy supply adequacy (%) 113 112 114Dietary en supp, cereals/roots/tubers (%) 49 50 48Prevalence of undernourishment (%) 15.7 16.1 14.2GDP per capita (US$, PPP) 2 269 2 536 3 110Domestic food price volatility (index) 13.6 8.2Cereal import dependency ratio (%) 95.2 95.9 95.4Underweight, children under-5 (%)Improved water source (% pop) 49.7 53.2 55.5Food supplyFood production value, (2004-2006 mln I$) 23 873 32 768 38 664Agriculture, value added (% GDP) 4 3Food exports (mln US$) 10 836 16 050 45 536Food imports (mln US$) 2 128 3 343 12 669Production indices (2004-06=100)Net food 72 99 116Net crops 69 105 126Cereals 77 113 117Vegetable oils 41 122 215Roots and tubers 80 90 110Fruit and vegetables 66 88 104Sugar 70 104 71Livestock 79 97 107Milk 56 92 113Meat 79 96 105Fish 51 78 85Net trade (mln US$)Cereals 2 451 2 809 8 606Fruit and vegetables 514 861 1 257Meat 3 419 4 366 10 465Dairy products 1 642 3 458 10 513Fish 642 1 280 1 095EnvironmentForest area (%) 23 23 22Renewable water res withdrawn (% of total)Terrestrial protect areas (% total land area) 7 9 13Organic area (% total agricultural area) 3Water withdrawal by agriculture (% of total)Biofuel production (thousand kt of oil eq.) 210 282 1 990Wood pellet prod. (1 000 tonnes) 32Net GHG emissions from AFOLU (CO2 eq, Mt) 334 321 340
52

Afghanistan
1990 2000 2014
The settingPopulation, total (mln) 11.7 20.6 31.3Population, rural (mln) 9.6 16.4 23.6Govt expenditure on ag (% total outlays) 5.3 4.3Area harvested (mln ha) 3 2 7Cropping intensity ratio 0.1 0.1Water resources (1 000 m3/person/year) 6 3 2Area equipped for irrigation (1 000 ha) 3 208Area irrigated (% area equipped for irrigation) 59.1Employment in agriculture (%)Employment in agriculture, female (%)Fertilizers, Nitrogen (kg of nutrients per ha) 2.6 4.6Fertilizers, Phosphate (kg of nutrients per ha) 0.7 0Fertilizers, Potash (kg nutrients per ha) 0 0Energy consump, power irrigation (mln kWh) 275 275 275Agr value added per worker (constant US$) 424 396Hunger dimensionsDietary energy supply (kcal/pc/day) 2 072 1 792 2 087Average dietary energy supply adequacy (%) 102 89 99Dietary en supp, cereals/roots/tubers (%) 75 76 77Prevalence of undernourishment (%) 29.5 45.2 26.8GDP per capita (US$, PPP) 1 097 1 884Domestic food price volatility (index)Cereal import dependency ratio (%) 5.7 29.6 22.1Underweight, children under-5 (%) 44.9Improved water source (% pop) 4.9 22.1 64.2Food supplyFood production value, (2004-2006 mln I$) 1 959 2 423 3 393Agriculture, value added (% GDP) 38 24Food exports (mln US$) 95 37 161Food imports (mln US$) 170 158 1 081Production indices (2004-06=100)Net food 69 86 120Net crops 68 69 134Cereals 60 43 142Vegetable oils 87 87 95Roots and tubers 75 79 100Fruit and vegetables 81 93 120Sugar 94 65 180Livestock 71 105 104Milk 50 98 108Meat 84 109 101Fish 97 90 141Net trade (mln US$)Cereals -372Fruit and vegetables 89 31 -42MeatDairy products -63Fish 0EnvironmentForest area (%) 2 2 2Renewable water res withdrawn (% of total) 99Terrestrial protect areas (% total land area) 0 0 0Organic area (% total agricultural area) 0Water withdrawal by agriculture (% of total) 99Biofuel production (thousand kt of oil eq.)Wood pellet prod. (1 000 tonnes)Net GHG emissions from AFOLU (CO2 eq, Mt) 8 10 14
53

Albania
1990 2000 2014
The settingPopulation, total (mln) 3.4 3.3 3.2Population, rural (mln) 2.2 1.9 1.4Govt expenditure on ag (% total outlays)Area harvested (mln ha) 1 1 1Cropping intensity ratio 0.8 0.5Water resources (1 000 m3/person/year) 9 9 10Area equipped for irrigation (1 000 ha) 331Area irrigated (% area equipped for irrigation) 60.8Employment in agriculture (%) 71.8 41.5Employment in agriculture, female (%) 52.6Fertilizers, Nitrogen (kg of nutrients per ha) 64.3 55.9Fertilizers, Phosphate (kg of nutrients per ha) 34.7 35Fertilizers, Potash (kg nutrients per ha) 0 0Energy consump, power irrigation (mln kWh) 0 0 0Agr value added per worker (constant US$) 1 234 2 486 3 915Hunger dimensionsDietary energy supply (kcal/pc/day)Average dietary energy supply adequacy (%) 111 117 121Dietary en supp, cereals/roots/tubers (%) 58 51 41Prevalence of undernourishment (%) <5.0 <5.0 <5.0GDP per capita (US$, PPP) 4 350 5 305 9 961Domestic food price volatility (index) 10.8 10.4Cereal import dependency ratio (%) 45.5 45.6 40.6Underweight, children under-5 (%) 17 6.3Improved water source (% pop) 96.5 95.7Food supplyFood production value, (2004-2006 mln I$) 640 826 1 222Agriculture, value added (% GDP) 36 29 23Food exports (mln US$) 54 4 40Food imports (mln US$) 89 185 589Production indices (2004-06=100)Net food 67 86 128Net crops 84 86 149Cereals 182 112 131Vegetable oils 55 86 196Roots and tubers 34 94 119Fruit and vegetables 62 76 152Sugar 390 97 92Livestock 55 89 110Milk 48 88 107Meat 70 94 113Fish 222 54 110Net trade (mln US$)Cereals -30 -68 -203Fruit and vegetables 50 -41 -65Meat -6 -20 -69Dairy products -4 -21Fish 6 1 6EnvironmentForest area (%) 29 28 28Renewable water res withdrawn (% of total) 40Terrestrial protect areas (% total land area) 3 7 11Organic area (% total agricultural area) 0Water withdrawal by agriculture (% of total) 40Biofuel production (thousand kt of oil eq.)Wood pellet prod. (1 000 tonnes) 5Net GHG emissions from AFOLU (CO2 eq, Mt) 3 3 2
54

Algeria
1990 2000 2014
The settingPopulation, total (mln) 26.2 31.7 39.9Population, rural (mln) 12.6 12.4 9.8Govt expenditure on ag (% total outlays)Area harvested (mln ha) 2 3 5Cropping intensity ratio 0.1 0.1Water resources (1 000 m3/person/year) 0 0 0Area equipped for irrigation (1 000 ha) 570Area irrigated (% area equipped for irrigation) 79.6Employment in agriculture (%) 21.1 10.8Employment in agriculture, female (%) 11 3Fertilizers, Nitrogen (kg of nutrients per ha) 2.3 9.9Fertilizers, Phosphate (kg of nutrients per ha) 0.8 7.2Fertilizers, Potash (kg nutrients per ha) 2.9 4.6Energy consump, power irrigation (mln kWh) 96 96 96Agr value added per worker (constant US$) 2 036 2 025 3 719Hunger dimensionsDietary energy supply (kcal/pc/day) 2 785 2 847 3 332Average dietary energy supply adequacy (%) 129 124 144Dietary en supp, cereals/roots/tubers (%) 60 60 57Prevalence of undernourishment (%) 7.7 8.7 <5.0GDP per capita (US$, PPP) 10 113 9 886 12 893Domestic food price volatility (index) 13.9 9.5Cereal import dependency ratio (%) 76.1 79.7 67.6Underweight, children under-5 (%) 9.2 5.4 3.7Improved water source (% pop) 93.9 89.4 83.9Food supplyFood production value, (2004-2006 mln I$) 2 646 3 640 8 218Agriculture, value added (% GDP) 11 9 10Food exports (mln US$) 25 19 277Food imports (mln US$) 2 101 2 264 8 478Production indices (2004-06=100)Net food 51 70 158Net crops 41 57 167Cereals 35 20 128Vegetable oils 60 64 165Roots and tubers 34 57 240Fruit and vegetables 42 65 171SugarLivestock 70 90 145Milk 55 82 170Meat 74 98 127Fish 70 88 79Net trade (mln US$)Cereals -834 -1 086 -3 494Fruit and vegetables -154 -178 -897Meat -24 -35 -260Dairy products -495 -424 -1 263Fish -5 -8 -60EnvironmentForest area (%) 1 1 1Renewable water res withdrawn (% of total) 61Terrestrial protect areas (% total land area) 6 6 7Organic area (% total agricultural area) 0Water withdrawal by agriculture (% of total) 61Biofuel production (thousand kt of oil eq.)Wood pellet prod. (1 000 tonnes)Net GHG emissions from AFOLU (CO2 eq, Mt) 9 10 13
55
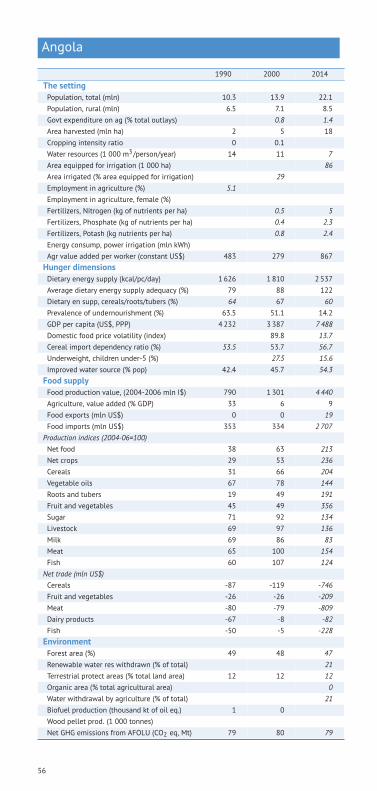
Angola
1990 2000 2014
The settingPopulation, total (mln) 10.3 13.9 22.1Population, rural (mln) 6.5 7.1 8.5Govt expenditure on ag (% total outlays) 0.8 1.4Area harvested (mln ha) 2 5 18Cropping intensity ratio 0 0.1Water resources (1 000 m3/person/year) 14 11 7Area equipped for irrigation (1 000 ha) 86Area irrigated (% area equipped for irrigation) 29Employment in agriculture (%) 5.1Employment in agriculture, female (%)Fertilizers, Nitrogen (kg of nutrients per ha) 0.5 5Fertilizers, Phosphate (kg of nutrients per ha) 0.4 2.3Fertilizers, Potash (kg nutrients per ha) 0.8 2.4Energy consump, power irrigation (mln kWh)Agr value added per worker (constant US$) 483 279 867Hunger dimensionsDietary energy supply (kcal/pc/day) 1 626 1 810 2 537Average dietary energy supply adequacy (%) 79 88 122Dietary en supp, cereals/roots/tubers (%) 64 67 60Prevalence of undernourishment (%) 63.5 51.1 14.2GDP per capita (US$, PPP) 4 232 3 387 7 488Domestic food price volatility (index) 89.8 13.7Cereal import dependency ratio (%) 53.5 53.7 56.7Underweight, children under-5 (%) 27.5 15.6Improved water source (% pop) 42.4 45.7 54.3Food supplyFood production value, (2004-2006 mln I$) 790 1 301 4 440Agriculture, value added (% GDP) 33 6 9Food exports (mln US$) 0 0 19Food imports (mln US$) 353 334 2 707Production indices (2004-06=100)Net food 38 63 213Net crops 29 53 236Cereals 31 66 204Vegetable oils 67 78 144Roots and tubers 19 49 191Fruit and vegetables 45 49 356Sugar 71 92 134Livestock 69 97 136Milk 69 86 83Meat 65 100 154Fish 60 107 124Net trade (mln US$)Cereals -87 -119 -746Fruit and vegetables -26 -26 -209Meat -80 -79 -809Dairy products -67 -8 -82Fish -50 -5 -228EnvironmentForest area (%) 49 48 47Renewable water res withdrawn (% of total) 21Terrestrial protect areas (% total land area) 12 12 12Organic area (% total agricultural area) 0Water withdrawal by agriculture (% of total) 21Biofuel production (thousand kt of oil eq.) 1 0Wood pellet prod. (1 000 tonnes)Net GHG emissions from AFOLU (CO2 eq, Mt) 79 80 79
56

Argentina
1990 2000 2014
The settingPopulation, total (mln) 32.6 36.9 41.8Population, rural (mln) 4.2 3.6 2.9Govt expenditure on ag (% total outlays)Area harvested (mln ha) 20 39 51Cropping intensity ratio 0.2 0.3Water resources (1 000 m3/person/year) 27 24 21Area equipped for irrigation (1 000 ha) 2 360Area irrigated (% area equipped for irrigation) 91.7Employment in agriculture (%) 0.4 0.7 0.6Employment in agriculture, female (%) 0.2 0.2 0.3Fertilizers, Nitrogen (kg of nutrients per ha) 25.8 24.8Fertilizers, Phosphate (kg of nutrients per ha) 14.7 13.1Fertilizers, Potash (kg nutrients per ha) 1.4 1Energy consump, power irrigation (mln kWh) 142 142 885Agr value added per worker (constant US$) 7 175 9 794 13 176Hunger dimensionsDietary energy supply (kcal/pc/day) 2 999 3 246 3 667Average dietary energy supply adequacy (%) 127 136 151Dietary en supp, cereals/roots/tubers (%) 34 34 36Prevalence of undernourishment (%) <5.0 <5.0 <5.0GDP per capita (US$, PPP)Domestic food price volatility (index)Cereal import dependency ratio (%) -96.7 -158.7 -168.5Underweight, children under-5 (%) 4.7 2.3Improved water source (% pop) 93.8 96.5 98.7Food supplyFood production value, (2004-2006 mln I$) 22 555 30 583 42 146Agriculture, value added (% GDP) 8 5 8Food exports (mln US$) 5 141 7 746 27 534Food imports (mln US$) 102 982 1 084Production indices (2004-06=100)Net food 63 86 118Net crops 54 82 126Cereals 56 107 142Vegetable oils 48 77 129Roots and tubers 82 111 105Fruit and vegetables 74 86 102Sugar 66 77 99Livestock 84 94 111Milk 66 107 124Meat 89 91 107Fish 55 91 86Net trade (mln US$)Cereals 1 450 2 548 10 586Fruit and vegetables 579 645 2 897Meat 867 604 1 830Dairy products 121 291 1 260Fish 310 722 1 164EnvironmentForest area (%) 13 12 11Renewable water res withdrawn (% of total) 74Terrestrial protect areas (% total land area) 5 6 7Organic area (% total agricultural area) 2Water withdrawal by agriculture (% of total) 74Biofuel production (thousand kt of oil eq.) 74 40 49 086Wood pellet prod. (1 000 tonnes) 9Net GHG emissions from AFOLU (CO2 eq, Mt) 186 178 174
57

Armenia
1990 2000 2014
The settingPopulation, total (mln) 3.4 3.1 3Population, rural (mln) 1.1 1.1 1.1Govt expenditure on ag (% total outlays) 6.3 4.3Area harvested (mln ha) 0 1Cropping intensity ratio 0.3Water resources (1 000 m3/person/year) 2 3 3Area equipped for irrigation (1 000 ha) 274Area irrigated (% area equipped for irrigation) 64.4Employment in agriculture (%) 46 38.9Employment in agriculture, female (%) 43.4 45.5Fertilizers, Nitrogen (kg of nutrients per ha) 23 32Fertilizers, Phosphate (kg of nutrients per ha) 0 0.9Fertilizers, Potash (kg nutrients per ha) 0 0.8Energy consump, power irrigation (mln kWh) 0 63Agr value added per worker (constant US$) 2 234 3 476 10 006Hunger dimensionsDietary energy supply (kcal/pc/day) 2 184 2 253 2 913Average dietary energy supply adequacy (%) 95 95 120Dietary en supp, cereals/roots/tubers (%) 65 62 43Prevalence of undernourishment (%) 27.3 21.4 5.8GDP per capita (US$, PPP) 3 736 2 919 7 527Domestic food price volatility (index) 8.5 10.6Cereal import dependency ratio (%) 62.1 56.7 55.7Underweight, children under-5 (%) 2.6 5.3Improved water source (% pop) 90.6 92.6 99.8Food supplyFood production value, (2004-2006 mln I$) 546 568 1 087Agriculture, value added (% GDP) 17 26 22Food exports (mln US$) 0 4 59Food imports (mln US$) 118 161 589Production indices (2004-06=100)Net food 65 68 129Net crops 58 58 132Cereals 81 63 161Vegetable oilsRoots and tubers 63 43 117Fruit and vegetables 54 59 129Sugar 6 6 488Livestock 72 80 124Milk 67 76 112Meat 84 86 142Fish 679 177 1 435Net trade (mln US$)Cereals -82 -182Fruit and vegetables -1 -3 -27Meat -23 -89Dairy products -10 -34Fish -4 14EnvironmentForest area (%) 12 11 9Renewable water res withdrawn (% of total) 66Terrestrial protect areas (% total land area) 7 7 8Organic area (% total agricultural area) 0Water withdrawal by agriculture (% of total) 66Biofuel production (thousand kt of oil eq.)Wood pellet prod. (1 000 tonnes) 0Net GHG emissions from AFOLU (CO2 eq, Mt) 2 2 2
58

Australia
1990 2000 2014
The settingPopulation, total (mln) 17.1 19.3 23.6Population, rural (mln) 2.5 2.5 2.4Govt expenditure on ag (% total outlays)Area harvested (mln ha) 24 38 36Cropping intensity ratio 0.1 0.1Water resources (1 000 m3/person/year) 29 26 21Area equipped for irrigation (1 000 ha) 2 550Area irrigated (% area equipped for irrigation)Employment in agriculture (%) 5.3 5 3.3Employment in agriculture, female (%) 3.8 3.5 2.2Fertilizers, Nitrogen (kg of nutrients per ha) 19.8 23.3Fertilizers, Phosphate (kg of nutrients per ha) 21.7 17.2Fertilizers, Potash (kg nutrients per ha) 4.7 4.2Energy consump, power irrigation (mln kWh) 113 284 1 379Agr value added per worker (constant US$) 26 995 41 209 52 701Hunger dimensionsDietary energy supply (kcal/pc/day)Average dietary energy supply adequacy (%) 126 122 133Dietary en supp, cereals/roots/tubers (%) 25 25 25Prevalence of undernourishment (%) <5.0 <5.0 <5.0GDP per capita (US$, PPP) 28 604 35 253 42 834Domestic food price volatility (index)Cereal import dependency ratio (%) -179.3 -151.4 -144.9Underweight, children under-5 (%) 0 0.2Improved water source (% pop) 100 100 100Food supplyFood production value, (2004-2006 mln I$) 15 583 21 996 25 035Agriculture, value added (% GDP) 5 3 3Food exports (mln US$) 7 094 10 726 27 285Food imports (mln US$) 1 039 1 959 8 036Production indices (2004-06=100)Net food 74 105 120Net crops 67 108 129Cereals 76 113 117Vegetable oils 28 146 293Roots and tubers 91 92 102Fruit and vegetables 61 83 95Sugar 65 102 73Livestock 86 104 106Milk 64 107 94Meat 79 100 112Fish 83 83 87Net trade (mln US$)Cereals 2 662 3 056 9 024Fruit and vegetables 98 384 162Meat 2 228 2 834 6 751Dairy products 478 1 407 1 584Fish 188 485 -615EnvironmentForest area (%) 20 20 19Renewable water res withdrawn (% of total) 66Terrestrial protect areas (% total land area) 7 9 13Organic area (% total agricultural area) 3Water withdrawal by agriculture (% of total) 66Biofuel production (thousand kt of oil eq.) 169 225 1 908Wood pellet prod. (1 000 tonnes) 2Net GHG emissions from AFOLU (CO2 eq, Mt) 186 210 227
59

Austria
1990 2000 2014
The settingPopulation, total (mln) 7.7 8 8.5Population, rural (mln) 2.6 2.7 2.7Govt expenditure on ag (% total outlays)Area harvested (mln ha) 5 5 5Cropping intensity ratio 1.5 1.4Water resources (1 000 m3/person/year) 10 10 9Area equipped for irrigation (1 000 ha) 117Area irrigated (% area equipped for irrigation) 37.1Employment in agriculture (%) 7.9 5.8 4.9Employment in agriculture, female (%) 9.4 6.1 4.5Fertilizers, Nitrogen (kg of nutrients per ha) 215.5 63.5Fertilizers, Phosphate (kg of nutrients per ha) 25.6 17Fertilizers, Potash (kg nutrients per ha) 54.6 23.2Energy consump, power irrigation (mln kWh) 0 4 4Agr value added per worker (constant US$) 13 450 19 849 37 805Hunger dimensionsDietary energy supply (kcal/pc/day)Average dietary energy supply adequacy (%) 140 150 151Dietary en supp, cereals/roots/tubers (%) 23 27 26Prevalence of undernourishment (%) <5.0 <5.0 <5.0GDP per capita (US$, PPP) 31 053 38 548 44 056Domestic food price volatility (index) 3.6 5.1Cereal import dependency ratio (%) -14.4 -8.9 6.3Underweight, children under-5 (%)Improved water source (% pop) 100 100 100Food supplyFood production value, (2004-2006 mln I$) 3 911 4 140 4 225Agriculture, value added (% GDP) 4 2 1Food exports (mln US$) 1 043 2 343 8 396Food imports (mln US$) 1 779 2 995 9 461Production indices (2004-06=100)Net food 94 100 102Net crops 90 94 96Cereals 95 92 96Vegetable oils 68 84 119Roots and tubers 108 98 85Fruit and vegetables 84 98 94Sugar 88 91 123Livestock 97 101 104Milk 107 107 109Meat 92 97 100Fish 132 118 129Net trade (mln US$)Cereals 54 -45 46Fruit and vegetables -717 -516 -1 349Meat 89 38 506Dairy products 81 167 511Fish -146 -151 -435EnvironmentForest area (%) 46 47 47Renewable water res withdrawn (% of total) 3Terrestrial protect areas (% total land area) 21 24 24Organic area (% total agricultural area) 17Water withdrawal by agriculture (% of total) 3Biofuel production (thousand kt of oil eq.) 30 2 476Wood pellet prod. (1 000 tonnes) 945Net GHG emissions from AFOLU (CO2 eq, Mt) -2 -6 11
60

Azerbaijan
1990 2000 2014
The settingPopulation, total (mln) 7.6 8.1 9.5Population, rural (mln) 3.6 3.9 4.3Govt expenditure on ag (% total outlays) 4.3 2.9Area harvested (mln ha) 1 3Cropping intensity ratio 0.3Water resources (1 000 m3/person/year) 5 4 4Area equipped for irrigation (1 000 ha) 1 428Area irrigated (% area equipped for irrigation) 95.3Employment in agriculture (%) 30.9 41 37.7Employment in agriculture, female (%) 46.1 43.9Fertilizers, Nitrogen (kg of nutrients per ha) 6.8 14.2Fertilizers, Phosphate (kg of nutrients per ha) 0.1 2.2Fertilizers, Potash (kg nutrients per ha) 0.7 1.6Energy consump, power irrigation (mln kWh) 0 366 1 464Agr value added per worker (constant US$) 850 885 1 434Hunger dimensionsDietary energy supply (kcal/pc/day) 2 318 2 380 3 046Average dietary energy supply adequacy (%) 103 102 127Dietary en supp, cereals/roots/tubers (%) 69 69 63Prevalence of undernourishment (%) 23.6 22.5 <5.0GDP per capita (US$, PPP) 8 513 4 459 16 593Domestic food price volatility (index)Cereal import dependency ratio (%) 42 33.1 37.7Underweight, children under-5 (%) 14 8.4Improved water source (% pop) 69.9 74 80.2Food supplyFood production value, (2004-2006 mln I$) 1 211 1 395 2 578Agriculture, value added (% GDP) 29 17 6Food exports (mln US$) 21 31 679Food imports (mln US$) 187 200 1 018Production indices (2004-06=100)Net food 66 76 140Net crops 78 72 120Cereals 55 73 138Vegetable oils 102 50 68Roots and tubers 16 47 97Fruit and vegetables 78 75 132Sugar 17 54 216Livestock 63 79 166Milk 63 82 145Meat 57 76 189Fish 526 239 14Net trade (mln US$)Cereals -116 -432Fruit and vegetables 13 14 206Meat -30 -24 -10Dairy products -8 -53Fish 2 -13EnvironmentForest area (%) 11 11 11Renewable water res withdrawn (% of total) 76Terrestrial protect areas (% total land area) 6 7 7Organic area (% total agricultural area) 0Water withdrawal by agriculture (% of total) 76Biofuel production (thousand kt of oil eq.)Wood pellet prod. (1 000 tonnes) 0Net GHG emissions from AFOLU (CO2 eq, Mt) 5 5 7
61
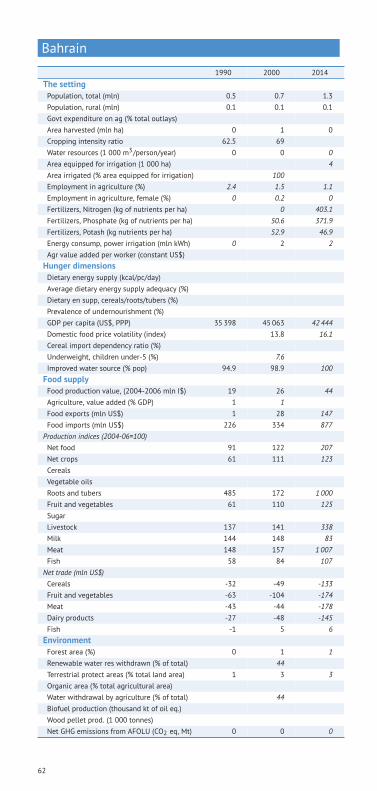
Bahrain
1990 2000 2014
The settingPopulation, total (mln) 0.5 0.7 1.3Population, rural (mln) 0.1 0.1 0.1Govt expenditure on ag (% total outlays)Area harvested (mln ha) 0 1 0Cropping intensity ratio 62.5 69Water resources (1 000 m3/person/year) 0 0 0Area equipped for irrigation (1 000 ha) 4Area irrigated (% area equipped for irrigation) 100Employment in agriculture (%) 2.4 1.5 1.1Employment in agriculture, female (%) 0 0.2 0Fertilizers, Nitrogen (kg of nutrients per ha) 0 403.1Fertilizers, Phosphate (kg of nutrients per ha) 50.6 371.9Fertilizers, Potash (kg nutrients per ha) 52.9 46.9Energy consump, power irrigation (mln kWh) 0 2 2Agr value added per worker (constant US$)Hunger dimensionsDietary energy supply (kcal/pc/day)Average dietary energy supply adequacy (%)Dietary en supp, cereals/roots/tubers (%)Prevalence of undernourishment (%)GDP per capita (US$, PPP) 35 398 45 063 42 444Domestic food price volatility (index) 13.8 16.1Cereal import dependency ratio (%)Underweight, children under-5 (%) 7.6Improved water source (% pop) 94.9 98.9 100Food supplyFood production value, (2004-2006 mln I$) 19 26 44Agriculture, value added (% GDP) 1 1Food exports (mln US$) 1 28 147Food imports (mln US$) 226 334 877Production indices (2004-06=100)Net food 91 122 207Net crops 61 111 123CerealsVegetable oilsRoots and tubers 485 172 1 000Fruit and vegetables 61 110 125SugarLivestock 137 141 338Milk 144 148 83Meat 148 157 1 007Fish 58 84 107Net trade (mln US$)Cereals -32 -49 -133Fruit and vegetables -63 -104 -174Meat -43 -44 -178Dairy products -27 -48 -145Fish -1 5 6EnvironmentForest area (%) 0 1 1Renewable water res withdrawn (% of total) 44Terrestrial protect areas (% total land area) 1 3 3Organic area (% total agricultural area)Water withdrawal by agriculture (% of total) 44Biofuel production (thousand kt of oil eq.)Wood pellet prod. (1 000 tonnes)Net GHG emissions from AFOLU (CO2 eq, Mt) 0 0 0
62

Bangladesh
1990 2000 2014
The settingPopulation, total (mln) 107.4 132.4 158.5Population, rural (mln) 86.1 101.2 111.2Govt expenditure on ag (% total outlays) 2.9 15.2Area harvested (mln ha) 28 40 55Cropping intensity ratio 2.7 4.2Water resources (1 000 m3/person/year) 11 9 8Area equipped for irrigation (1 000 ha) 5 300Area irrigated (% area equipped for irrigation) 88.3Employment in agriculture (%) 66.4 62.1 48.1Employment in agriculture, female (%) 84.9 76.9 68.1Fertilizers, Nitrogen (kg of nutrients per ha) 115.6 147.4Fertilizers, Phosphate (kg of nutrients per ha) 24.3 75.3Fertilizers, Potash (kg nutrients per ha) 20.3 56Energy consump, power irrigation (mln kWh) 0 0 0Agr value added per worker (constant US$) 267 347 602Hunger dimensionsDietary energy supply (kcal/pc/day) 2 113 2 285 2 486Average dietary energy supply adequacy (%) 99 104 108Dietary en supp, cereals/roots/tubers (%) 84 84 80Prevalence of undernourishment (%) 32.8 23.1 16.4GDP per capita (US$, PPP) 1 239 1 606 2 853Domestic food price volatility (index) 3.3 16.4Cereal import dependency ratio (%) 5.6 11.6 10.8Underweight, children under-5 (%) 61.5 42.3 31.9Improved water source (% pop) 68 76 84.8Food supplyFood production value, (2004-2006 mln I$) 10 276 14 307 21 639Agriculture, value added (% GDP) 33 24 16Food exports (mln US$) 15 13 71Food imports (mln US$) 627 1 320 4 712Production indices (2004-06=100)Net food 64 89 135Net crops 66 91 138Cereals 68 97 134Vegetable oils 122 97 133Roots and tubers 26 63 184Fruit and vegetables 49 56 157Sugar 119 111 73Livestock 57 82 131Milk 60 81 136Meat 62 86 120Fish 38 75 154Net trade (mln US$)Cereals -224 -375 -800Fruit and vegetables -88 -141 -619Meat 4 0 -3Dairy products -90 -85 -249Fish 167 339 442EnvironmentForest area (%) 11 11 11Renewable water res withdrawn (% of total) 88Terrestrial protect areas (% total land area) 1 5 5Organic area (% total agricultural area) 0Water withdrawal by agriculture (% of total) 88Biofuel production (thousand kt of oil eq.) 172 206 235Wood pellet prod. (1 000 tonnes)Net GHG emissions from AFOLU (CO2 eq, Mt) 91 97 106
63

Barbados
1990 2000 2014
The settingPopulation, total (mln) 0.3 0.3 0.3Population, rural (mln) 0.2 0.2 0.2Govt expenditure on ag (% total outlays) 2.4 1.7Area harvested (mln ha) 1 1 0Cropping intensity ratio 31.9 34.9Water resources (1 000 m3/person/year) 0 0 0Area equipped for irrigation (1 000 ha) 5Area irrigated (% area equipped for irrigation)Employment in agriculture (%) 6.3 3.7 2.8Employment in agriculture, female (%) 5.5 3.3 2.2Fertilizers, Nitrogen (kg of nutrients per ha) 48.1 103.5Fertilizers, Phosphate (kg of nutrients per ha) 29.8 60.9Fertilizers, Potash (kg nutrients per ha) 1.9 9.2Energy consump, power irrigation (mln kWh)Agr value added per worker (constant US$) 8 473 10 368 13 668Hunger dimensionsDietary energy supply (kcal/pc/day) 3 032 2 887 3 111Average dietary energy supply adequacy (%) 124 117 125Dietary en supp, cereals/roots/tubers (%) 34 33 32Prevalence of undernourishment (%) <5.0 <5.0 <5.0GDP per capita (US$, PPP) 13 025 14 714 15 299Domestic food price volatility (index) 8.2 5.6Cereal import dependency ratio (%) 97.8 100 100Underweight, children under-5 (%) 3.5Improved water source (% pop) 95.4 99.1 99.8Food supplyFood production value, (2004-2006 mln I$) 54 50 47Agriculture, value added (% GDP) 4 2 2Food exports (mln US$) 43 43 47Food imports (mln US$) 88 95 242Production indices (2004-06=100)Net food 110 102 97Net crops 131 129 84Cereals 886 116 131Vegetable oils 108 97 110Roots and tubers 254 142 38Fruit and vegetables 61 101 102Sugar 158 142 73Livestock 97 85 106Milk 231 129 101Meat 88 83 105Fish 143 151 142Net trade (mln US$)Cereals -18 -21 -42Fruit and vegetables -14 -22 -43Meat -18 -13 -26Dairy products -9 -10 -22Fish -6 -10 -25EnvironmentForest area (%) 19 19 19Renewable water res withdrawn (% of total) 54Terrestrial protect areas (% total land area) 0 0 0Organic area (% total agricultural area)Water withdrawal by agriculture (% of total) 54Biofuel production (thousand kt of oil eq.) 2 1 1Wood pellet prod. (1 000 tonnes)Net GHG emissions from AFOLU (CO2 eq, Mt) 0 0 0
64

Belarus
1990 2000 2014
The settingPopulation, total (mln) 10.2 10 9.3Population, rural (mln) 3.4 3 2.2Govt expenditure on ag (% total outlays) 10.2 9.8Area harvested (mln ha) 9 7Cropping intensity ratio 0.9Water resources (1 000 m3/person/year) 6 6 6Area equipped for irrigation (1 000 ha) 114Area irrigated (% area equipped for irrigation) 26.8Employment in agriculture (%) 21.6 21.2 10.5Employment in agriculture, female (%) 7.8Fertilizers, Nitrogen (kg of nutrients per ha) 55.7 100.9Fertilizers, Phosphate (kg of nutrients per ha) 15.6 40.1Fertilizers, Potash (kg nutrients per ha) 64.3 130.4Energy consump, power irrigation (mln kWh) 253 253 253Agr value added per worker (constant US$) 2 795 3 107 9 835Hunger dimensionsDietary energy supply (kcal/pc/day)Average dietary energy supply adequacy (%) 128 123 132Dietary en supp, cereals/roots/tubers (%) 48 46 38Prevalence of undernourishment (%) <5.0 <5.0 <5.0GDP per capita (US$, PPP) 8 084 7 300 17 055Domestic food price volatility (index) 9.8 6Cereal import dependency ratio (%) 23.2 26 1.4Underweight, children under-5 (%) 1.3Improved water source (% pop) 99.5 99.6 99.6Food supplyFood production value, (2004-2006 mln I$) 5 162 3 641 5 746Agriculture, value added (% GDP) 24 14 9Food exports (mln US$) 153 413 4 120Food imports (mln US$) 516 701 2 070Production indices (2004-06=100)Net food 113 80 126Net crops 102 76 96Cereals 110 68 130Vegetable oils 24 63 407Roots and tubers 124 90 64Fruit and vegetables 80 60 85Sugar 46 44 129Livestock 115 85 136Milk 100 81 119Meat 134 88 161Fish 294 109 213Net trade (mln US$)Cereals -257 -272 -136Fruit and vegetables -60 -42 -274Meat 46 2 957Dairy products 30 91 1 749Fish -4 -62 -172EnvironmentForest area (%) 39 41 43Renewable water res withdrawn (% of total) 19Terrestrial protect areas (% total land area) 7 7 8Organic area (% total agricultural area)Water withdrawal by agriculture (% of total) 19Biofuel production (thousand kt of oil eq.) 6 1 042Wood pellet prod. (1 000 tonnes) 1Net GHG emissions from AFOLU (CO2 eq, Mt) 14 8 -8
65

Belgium
1990 2000 2014
The settingPopulation, total (mln) 10.3 11.1Population, rural (mln) 0.3 0.3Govt expenditure on ag (% total outlays)Area harvested (mln ha) 6 4Cropping intensity ratio 4.4Water resources (1 000 m3/person/year) 2 2 2Area equipped for irrigation (1 000 ha) 23Area irrigated (% area equipped for irrigation) 24.3Employment in agriculture (%) 3.1 1.9 1.2Employment in agriculture, female (%) 1.9 1.2 0.7Fertilizers, Nitrogen (kg of nutrients per ha) 211.3 238Fertilizers, Phosphate (kg of nutrients per ha) 58.2 28.4Fertilizers, Potash (kg nutrients per ha) 44.3 28Energy consump, power irrigation (mln kWh)Agr value added per worker (constant US$) 40 464 68 736Hunger dimensionsDietary energy supply (kcal/pc/day)Average dietary energy supply adequacy (%) 149 151Dietary en supp, cereals/roots/tubers (%) 26 30Prevalence of undernourishment (%) <5.0 <5.0 <5.0GDP per capita (US$, PPP) 30 798 37 404 40 609Domestic food price volatility (index) 6.6 5.8Cereal import dependency ratio (%) 56.1 57Underweight, children under-5 (%)Improved water source (% pop) 100 100 100Food supplyFood production value, (2004-2006 mln I$) 5 994 5 683Agriculture, value added (% GDP) 1 1Food exports (mln US$) 13 240 31 389Food imports (mln US$) 10 245 26 957Production indices (2004-06=100)Net food 107 102Net crops 102 95Cereals 90 110Vegetable oils 76 189Roots and tubers 102 122Fruit and vegetables 99 102Sugar 103 74Livestock 110 106Milk 124 117Meat 106 103Fish 167 126 103Net trade (mln US$)Cereals 272 -1Fruit and vegetables 565 1 859Meat 1 337 2 586Dairy products -131 -46Fish -525 -559 -976EnvironmentForest area (%) 22 22Renewable water res withdrawn (% of total) 1Terrestrial protect areas (% total land area) 12 15 23Organic area (% total agricultural area) 4Water withdrawal by agriculture (% of total) 1Biofuel production (thousand kt of oil eq.) 4 8 506Wood pellet prod. (1 000 tonnes) 390Net GHG emissions from AFOLU (CO2 eq, Mt) 9 8
66

Belize
1990 2000 2014
The settingPopulation, total (mln) 0.2 0.2 0.3Population, rural (mln) 0.1 0.1 0.2Govt expenditure on ag (% total outlays)Area harvested (mln ha) 1 1 1Cropping intensity ratio 8.6 7.4Water resources (1 000 m3/person/year) 116 91 65Area equipped for irrigation (1 000 ha) 4Area irrigated (% area equipped for irrigation) 100Employment in agriculture (%) 24.2 27.5 19.5Employment in agriculture, female (%) 4.7 6.4 3.3Fertilizers, Nitrogen (kg of nutrients per ha) 295.6 49.2Fertilizers, Phosphate (kg of nutrients per ha) 66.3 55.2Fertilizers, Potash (kg nutrients per ha) 20.5 16.5Energy consump, power irrigation (mln kWh)Agr value added per worker (constant US$) 2 933 3 780 4 331Hunger dimensionsDietary energy supply (kcal/pc/day) 2 572 2 696 2 785Average dietary energy supply adequacy (%) 121 125 124Dietary en supp, cereals/roots/tubers (%) 38 40 40Prevalence of undernourishment (%) 9.7 6.5 6.2GDP per capita (US$, PPP) 5 166 7 215 8 215Domestic food price volatility (index) 27.9Cereal import dependency ratio (%) 35.5 29.7 11.1Underweight, children under-5 (%) 5.4 6.2Improved water source (% pop) 72.9 85.1 99.3Food supplyFood production value, (2004-2006 mln I$) 88 149 178Agriculture, value added (% GDP) 20 17 15Food exports (mln US$) 94 158 205Food imports (mln US$) 38 60 87Production indices (2004-06=100)Net food 51 85 102Net crops 51 91 103Cereals 53 89 208Vegetable oils 220 109 466Roots and tubers 84 197 102Fruit and vegetables 33 86 93Sugar 99 101 98Livestock 52 64 114Milk 36 40 144Meat 51 63 112Fish 2 26 31Net trade (mln US$)Cereals -7 -13 -18Fruit and vegetables 34 112 132Meat -4 -6 -7Dairy products -6 -14 -17Fish 5 29 28EnvironmentForest area (%) 70 65 60Renewable water res withdrawn (% of total) 68Terrestrial protect areas (% total land area) 26 35 37Organic area (% total agricultural area) 1Water withdrawal by agriculture (% of total) 68Biofuel production (thousand kt of oil eq.) 3 3 2Wood pellet prod. (1 000 tonnes)Net GHG emissions from AFOLU (CO2 eq, Mt) 5 5 5
67

Benin
1990 2000 2014
The settingPopulation, total (mln) 5 6.9 10.6Population, rural (mln) 3.3 4.3 5.6Govt expenditure on ag (% total outlays)Area harvested (mln ha) 2 4 7Cropping intensity ratio 0.9 1.3Water resources (1 000 m3/person/year) 5 4 3Area equipped for irrigation (1 000 ha) 23Area irrigated (% area equipped for irrigation) 74.7Employment in agriculture (%) 42.7Employment in agriculture, female (%) 32.7Fertilizers, Nitrogen (kg of nutrients per ha) 0.5 10.7Fertilizers, Phosphate (kg of nutrients per ha) 0.2 5.3Fertilizers, Potash (kg nutrients per ha) 0.2 3.5Energy consump, power irrigation (mln kWh) 0 14 14Agr value added per worker (constant US$) 640 865 1 278Hunger dimensionsDietary energy supply (kcal/pc/day) 2 158 2 262 2 798Average dietary energy supply adequacy (%) 102 106 127Dietary en supp, cereals/roots/tubers (%) 74 73 72Prevalence of undernourishment (%) 28.1 23.9 7.5GDP per capita (US$, PPP) 1 362 1 525 1 733Domestic food price volatility (index) 14.6 14Cereal import dependency ratio (%) 36.7 11.5 22.2Underweight, children under-5 (%) 21.5 20.2Improved water source (% pop) 57.1 66.1 76.1Food supplyFood production value, (2004-2006 mln I$) 695 1 218 2 185Agriculture, value added (% GDP) 35 35 36Food exports (mln US$) 17 40 373Food imports (mln US$) 92 106 1 612Production indices (2004-06=100)Net food 48 85 152Net crops 46 89 149Cereals 50 92 165Vegetable oils 51 95 123Roots and tubers 40 80 145Fruit and vegetables 60 83 168Sugar 48 92 91Livestock 70 83 129Milk 60 86 120Meat 70 82 128Fish 101 85 114Net trade (mln US$)Cereals -57 -23 -625Fruit and vegetables -4 5 94Meat -8 -35 -371Dairy products -6 -13 -30Fish -2 -7 -35EnvironmentForest area (%) 51 45 40Renewable water res withdrawn (% of total) 45Terrestrial protect areas (% total land area) 24 25 26Organic area (% total agricultural area) 0Water withdrawal by agriculture (% of total) 45Biofuel production (thousand kt of oil eq.) 0 0 0Wood pellet prod. (1 000 tonnes)Net GHG emissions from AFOLU (CO2 eq, Mt) 19 20 15
68

Bhutan
1990 2000 2014
The settingPopulation, total (mln) 0.5 0.6 0.8Population, rural (mln) 0.4 0.4 0.5Govt expenditure on ag (% total outlays) 11.3 11.6Area harvested (mln ha) 0 0 0Cropping intensity ratio 0.7 0.6Water resources (1 000 m3/person/year) 146 138 103Area equipped for irrigation (1 000 ha) 32Area irrigated (% area equipped for irrigation) 100Employment in agriculture (%) 79.8 62.2Employment in agriculture, female (%) 88.7 75.1Fertilizers, Nitrogen (kg of nutrients per ha) 7.1 9.2Fertilizers, Phosphate (kg of nutrients per ha) 1.6 3.6Fertilizers, Potash (kg nutrients per ha) 1.2 2.6Energy consump, power irrigation (mln kWh) 0 0 0Agr value added per worker (constant US$) 817 947 629Hunger dimensionsDietary energy supply (kcal/pc/day)Average dietary energy supply adequacy (%)Dietary en supp, cereals/roots/tubers (%)Prevalence of undernourishment (%)GDP per capita (US$, PPP) 2 332 3 596 7 167Domestic food price volatility (index) 6.8Cereal import dependency ratio (%)Underweight, children under-5 (%) 14.1 12.8Improved water source (% pop) 86.1 98.1Food supplyFood production value, (2004-2006 mln I$) 101 101 142Agriculture, value added (% GDP) 35 27 17Food exports (mln US$) 10 10 33Food imports (mln US$) 14 20 124Production indices (2004-06=100)Net food 69 69 97Net crops 62 61 97Cereals 73 62 99Vegetable oils 45 50 16Roots and tubers 65 55 83Fruit and vegetables 52 66 92Sugar 96 99 117Livestock 98 99 96Milk 85 96 89Meat 108 100 102Fish 259 157 104Net trade (mln US$)Cereals -8 -9 -39Fruit and vegetables 7 5 5Meat 0 -14Dairy products 0 -2 -18Fish -5EnvironmentForest area (%) 65 79 86Renewable water res withdrawn (% of total) 94Terrestrial protect areas (% total land area) 14 28 28Organic area (% total agricultural area) 1Water withdrawal by agriculture (% of total) 94Biofuel production (thousand kt of oil eq.)Wood pellet prod. (1 000 tonnes)Net GHG emissions from AFOLU (CO2 eq, Mt) -2 -6 -8
69

Bolivia
1990 2000 2014
The settingPopulation, total (mln) 6.8 8.5 10.8Population, rural (mln) 3 3.2 3.5Govt expenditure on ag (% total outlays)Area harvested (mln ha) 4 4 8Cropping intensity ratio 0.1 0.1Water resources (1 000 m3/person/year) 84 68 54Area equipped for irrigation (1 000 ha) 300Area irrigated (% area equipped for irrigation) 100Employment in agriculture (%) 1.2 36.8 32.1Employment in agriculture, female (%) 0.2 35.3 32.9Fertilizers, Nitrogen (kg of nutrients per ha) 1.8 6Fertilizers, Phosphate (kg of nutrients per ha) 1.5 2.7Fertilizers, Potash (kg nutrients per ha) 0.5 1.1Energy consump, power irrigation (mln kWh) 0 46Agr value added per worker (constant US$) 594 607 658Hunger dimensionsDietary energy supply (kcal/pc/day) 1 994 2 066 2 291Average dietary energy supply adequacy (%) 93 96 103Dietary en supp, cereals/roots/tubers (%) 52 51 52Prevalence of undernourishment (%) 38 34.6 15.9GDP per capita (US$, PPP) 3 740 4 330 5 934Domestic food price volatility (index) 14.6 9.1Cereal import dependency ratio (%) 21.6 27.8 18.7Underweight, children under-5 (%) 9.7 5.9 4.5Improved water source (% pop) 68.6 78.9 88.1Food supplyFood production value, (2004-2006 mln I$) 1 536 2 144 3 547Agriculture, value added (% GDP) 17 15 13Food exports (mln US$) 143 254 1 004Food imports (mln US$) 74 236 494Production indices (2004-06=100)Net food 59 82 136Net crops 54 85 133Cereals 50 77 136Vegetable oils 16 78 156Roots and tubers 94 96 127Fruit and vegetables 89 117 108Sugar 69 64 144Livestock 65 80 134Milk 48 82 177Meat 65 80 131Fish 110 97 122Net trade (mln US$)Cereals -33 -87 -116Fruit and vegetables 15 29 194Meat -1 -3 2Dairy products -5 -12 0Fish 0 -9 -16EnvironmentForest area (%) 58 55 52Renewable water res withdrawn (% of total) 92Terrestrial protect areas (% total land area) 9 19 21Organic area (% total agricultural area) 0Water withdrawal by agriculture (% of total) 92Biofuel production (thousand kt of oil eq.) 13 21 19Wood pellet prod. (1 000 tonnes)Net GHG emissions from AFOLU (CO2 eq, Mt) 99 99 115
70

Bosnia and Herzegovina
1990 2000 2014
The settingPopulation, total (mln) 3.9 3.8 3.8Population, rural (mln) 2.3 2.2 1.9Govt expenditure on ag (% total outlays)Area harvested (mln ha) 1 1Cropping intensity ratio 0.4Water resources (1 000 m3/person/year) 10 10 10Area equipped for irrigation (1 000 ha) 3Area irrigated (% area equipped for irrigation)Employment in agriculture (%) 20.5Employment in agriculture, female (%) 22.7Fertilizers, Nitrogen (kg of nutrients per ha) 10.6 79.8Fertilizers, Phosphate (kg of nutrients per ha) 3.5 9.7Fertilizers, Potash (kg nutrients per ha) 3.6 9.7Energy consump, power irrigation (mln kWh)Agr value added per worker (constant US$) 13 840Hunger dimensionsDietary energy supply (kcal/pc/day)Average dietary energy supply adequacy (%) 95 116 127Dietary en supp, cereals/roots/tubers (%) 66 60 50Prevalence of undernourishment (%) <5.0 <5.0 <5.0GDP per capita (US$, PPP) 6 158 9 387Domestic food price volatility (index) 6.3Cereal import dependency ratio (%) 8.7 29.3 34.8Underweight, children under-5 (%) 4.2 1.5Improved water source (% pop) 97.1 97.6 99.6Food supplyFood production value, (2004-2006 mln I$) 687 524 954Agriculture, value added (% GDP) 11 8Food exports (mln US$) 14 35 318Food imports (mln US$) 105 364 1 275Production indices (2004-06=100)Net food 84 64 117Net crops 71 60 111Cereals 70 67 89Vegetable oils 107 61 90Roots and tubers 74 64 85Fruit and vegetables 59 49 134Sugar 1 142 857 1 714 103Livestock 89 74 119Milk 67 84 106Meat 179 35 163Fish 0 3 44Net trade (mln US$)Cereals -14 -80 -261Fruit and vegetables -18 -24 -104Meat -20 -40 -113Dairy products -7 -34 -57Fish -5 -11 -26EnvironmentForest area (%) 43 43 43Renewable water res withdrawn (% of total) 0Terrestrial protect areas (% total land area) 1 1 1Organic area (% total agricultural area) 0Water withdrawal by agriculture (% of total) 0Biofuel production (thousand kt of oil eq.)Wood pellet prod. (1 000 tonnes) 200Net GHG emissions from AFOLU (CO2 eq, Mt) -9 -9 3
71

Botswana
1990 2000 2014
The settingPopulation, total (mln) 1.4 1.8 2Population, rural (mln) 0.8 0.8 0.7Govt expenditure on ag (% total outlays) 3.9 2.7Area harvested (mln ha) 0 0 0Cropping intensity ratio 0 0Water resources (1 000 m3/person/year) 9 7 6Area equipped for irrigation (1 000 ha) 2Area irrigated (% area equipped for irrigation) 100Employment in agriculture (%) 19.7 29.9Employment in agriculture, female (%) 17 24.3Fertilizers, Nitrogen (kg of nutrients per ha) 53Fertilizers, Phosphate (kg of nutrients per ha) 0.8Fertilizers, Potash (kg nutrients per ha) 0.5Energy consump, power irrigation (mln kWh) 3 3 3Agr value added per worker (constant US$) 888 621 734Hunger dimensionsDietary energy supply (kcal/pc/day) 2 214 2 117 2 343Average dietary energy supply adequacy (%) 100 92 100Dietary en supp, cereals/roots/tubers (%) 51 51 49Prevalence of undernourishment (%) 25.1 35.6 24.1GDP per capita (US$, PPP) 8 094 10 274 15 247Domestic food price volatility (index) 5.5 5.6Cereal import dependency ratio (%) 79.3 89.8 80.8Underweight, children under-5 (%) 10.7 11.2Improved water source (% pop) 91.9 94.8 96.8Food supplyFood production value, (2004-2006 mln I$) 218 201 293Agriculture, value added (% GDP) 5 3 2Food exports (mln US$) 71 99 106Food imports (mln US$) 167 308 564Production indices (2004-06=100)Net food 97 89 130Net crops 92 92 96Cereals 154 74 124Vegetable oils 23 88 170Roots and tubers 67 87 101Fruit and vegetables 94 89 131SugarLivestock 98 89 137Milk 108 116 113Meat 97 83 143FishNet trade (mln US$)Cereals -41 -88 -156Fruit and vegetables -31 -67 -115Meat 56 66 47Dairy products -26 -36 -60Fish -5 -11 -12EnvironmentForest area (%) 24 22 20Renewable water res withdrawn (% of total) 41Terrestrial protect areas (% total land area) 30 37 37Organic area (% total agricultural area)Water withdrawal by agriculture (% of total) 41Biofuel production (thousand kt of oil eq.)Wood pellet prod. (1 000 tonnes)Net GHG emissions from AFOLU (CO2 eq, Mt) 18 21 18
72

Brazil
1990 2000 2014
The settingPopulation, total (mln) 149.6 174.5 202Population, rural (mln) 39 32.8 29.4Govt expenditure on ag (% total outlays)Area harvested (mln ha) 263 328 739Cropping intensity ratio 1.1 1.3Water resources (1 000 m3/person/year) 58 50 43Area equipped for irrigation (1 000 ha) 5 400Area irrigated (% area equipped for irrigation) 96.8Employment in agriculture (%) 22.8 20.7 15.3Employment in agriculture, female (%) 13.3 16.1 11Fertilizers, Nitrogen (kg of nutrients per ha) 37.2 58.6Fertilizers, Phosphate (kg of nutrients per ha) 55.4 59.8Fertilizers, Potash (kg nutrients per ha) 59.7 63.4Energy consump, power irrigation (mln kWh) 44 2 565 6 034Agr value added per worker (constant US$) 1 712 2 464 5 470Hunger dimensionsDietary energy supply (kcal/pc/day) 2 756 2 879 3 302Average dietary energy supply adequacy (%) 118 122 135Dietary en supp, cereals/roots/tubers (%) 38 35 34Prevalence of undernourishment (%) 14.8 12.3 <5.0GDP per capita (US$, PPP) 9 997 11 015 14 555Domestic food price volatility (index) 6 6.2Cereal import dependency ratio (%) 16.4 15.3 -3Underweight, children under-5 (%) 3.7 2.2Improved water source (% pop) 88.5 93.5 97.5Food supplyFood production value, (2004-2006 mln I$) 52 671 78 722 140 046Agriculture, value added (% GDP) 8 6 6Food exports (mln US$) 4 690 8 031 59 994Food imports (mln US$) 1 797 3 373 8 276Production indices (2004-06=100)Net food 51 77 137Net crops 59 77 140Cereals 54 78 157Vegetable oils 41 65 157Roots and tubers 92 90 90Fruit and vegetables 74 92 108Sugar 60 75 175Livestock 45 78 128Milk 59 81 135Meat 41 76 125Fish 62 82 121Net trade (mln US$)Cereals -749 -1 586 3 439Fruit and vegetables 1 328 985 1 491Meat 316 1 795 14 937Dairy products -168 -374 -536Fish -55 -85 -1 036EnvironmentForest area (%) 69 65 62Renewable water res withdrawn (% of total) 60Terrestrial protect areas (% total land area) 7 14 26Organic area (% total agricultural area) 0Water withdrawal by agriculture (% of total) 60Biofuel production (thousand kt of oil eq.) 1 033 1 148 2 238Wood pellet prod. (1 000 tonnes) 62Net GHG emissions from AFOLU (CO2 eq, Mt) 1 345 1 387 1 255
73

Brunei Darussalam
1990 2000 2014
The settingPopulation, total (mln) 0.3 0.3 0.4Population, rural (mln) 0.1 0.1 0.1Govt expenditure on ag (% total outlays) 0.6 0.6Area harvested (mln ha) 0 0 0Cropping intensity ratio 18.8 19.8Water resources (1 000 m3/person/year) 33 26 20Area equipped for irrigation (1 000 ha) 1Area irrigated (% area equipped for irrigation) 63Employment in agriculture (%) 2 1.4Employment in agriculture, female (%) 1.6 0.3Fertilizers, Nitrogen (kg of nutrients per ha) 39 73.2Fertilizers, Phosphate (kg of nutrients per ha) 27.5 20Fertilizers, Potash (kg nutrients per ha) 35.5 20.2Energy consump, power irrigation (mln kWh) 0 0 0Agr value added per worker (constant US$) 21 093 64 178 83 868Hunger dimensionsDietary energy supply (kcal/pc/day) 2 781 2 828 3 090Average dietary energy supply adequacy (%) 122 122 130Dietary en supp, cereals/roots/tubers (%) 49 51 46Prevalence of undernourishment (%) <5.0 <5.0 <5.0GDP per capita (US$, PPP) 77 076 74 475 69 474Domestic food price volatility (index) 5.6 12Cereal import dependency ratio (%) 98.7 100 98.3Underweight, children under-5 (%)Improved water source (% pop)Food supplyFood production value, (2004-2006 mln I$) 8 25 50Agriculture, value added (% GDP) 1 1 1Food exports (mln US$) 7 0 2Food imports (mln US$) 113 136 327Production indices (2004-06=100)Net food 27 85 167Net crops 58 92 104Cereals 121 37 238Vegetable oils 40 57 87Roots and tubers 54 80 135Fruit and vegetables 54 95 97SugarLivestock 20 83 183Milk 41 123 69Meat 13 84 201Fish 83 91 169Net trade (mln US$)Cereals -29 -40 -127Fruit and vegetables -27 -23 -47Meat -12 -8 -33Dairy products -9 -14 -19Fish -7 -15 -40EnvironmentForest area (%) 78 75 71Renewable water res withdrawn (% of total)Terrestrial protect areas (% total land area) 37 44 44Organic area (% total agricultural area)Water withdrawal by agriculture (% of total)Biofuel production (thousand kt of oil eq.)Wood pellet prod. (1 000 tonnes)Net GHG emissions from AFOLU (CO2 eq, Mt) 2 2 2
74

Bulgaria
1990 2000 2014
The settingPopulation, total (mln) 8.8 8 7.2Population, rural (mln) 3 2.5 1.8Govt expenditure on ag (% total outlays) 3.6 0.6Area harvested (mln ha) 8 4 8Cropping intensity ratio 1.3 0.8Water resources (1 000 m3/person/year) 2 3 3Area equipped for irrigation (1 000 ha) 102Area irrigated (% area equipped for irrigation) 69.5Employment in agriculture (%) 18.5 13.1 6.4Employment in agriculture, female (%) 10.6 4.3Fertilizers, Nitrogen (kg of nutrients per ha) 95 95.8Fertilizers, Phosphate (kg of nutrients per ha) 51.4 20.9Fertilizers, Potash (kg nutrients per ha) 0.9 5.1Energy consump, power irrigation (mln kWh) 0 46Agr value added per worker (constant US$) 5 694 9 643 18 789Hunger dimensionsDietary energy supply (kcal/pc/day)Average dietary energy supply adequacy (%) 124 113 116Dietary en supp, cereals/roots/tubers (%) 42 42 43Prevalence of undernourishment (%) <5.0 <5.0 <5.0GDP per capita (US$, PPP) 9 333 9 075 15 695Domestic food price volatility (index) 12.6 9.1Cereal import dependency ratio (%) -3.2 -17.6 -92.2Underweight, children under-5 (%)Improved water source (% pop) 99.9 99.7 99.5Food supplyFood production value, (2004-2006 mln I$) 4 587 2 997 3 143Agriculture, value added (% GDP) 17 12 5Food exports (mln US$) 738 284 3 224Food imports (mln US$) 334 277 2 108Production indices (2004-06=100)Net food 176 115 120Net crops 150 87 129Cereals 131 68 136Vegetable oils 38 41 205Roots and tubers 90 79 35Fruit and vegetables 299 169 99Sugar 2 248 89 63Livestock 238 153 91Milk 161 111 85Meat 357 226 100Fish 569 123 217Net trade (mln US$)Cereals 39 16 1 095Fruit and vegetables 334 14 -87Meat 124 2 -296Dairy products 24 10 -79Fish 13 -4 -43EnvironmentForest area (%) 30 31 37Renewable water res withdrawn (% of total) 16Terrestrial protect areas (% total land area) 2 4 37Organic area (% total agricultural area) 1Water withdrawal by agriculture (% of total) 16Biofuel production (thousand kt of oil eq.) 1 516Wood pellet prod. (1 000 tonnes) 120Net GHG emissions from AFOLU (CO2 eq, Mt) 2 -6 -9
75

Burkina Faso
1990 2000 2014
The settingPopulation, total (mln) 8.8 11.6 17.4Population, rural (mln) 7.6 9.5 12.4Govt expenditure on ag (% total outlays)Area harvested (mln ha) 3 3 5Cropping intensity ratio 0.3 0.3Water resources (1 000 m3/person/year) 2 1 1Area equipped for irrigation (1 000 ha) 55Area irrigated (% area equipped for irrigation) 85Employment in agriculture (%) 85.1 84.8Employment in agriculture, female (%) 87.4 87.2Fertilizers, Nitrogen (kg of nutrients per ha) 5.2 4.7Fertilizers, Phosphate (kg of nutrients per ha) 2.6 3.1Fertilizers, Potash (kg nutrients per ha) 2.5 3.2Energy consump, power irrigation (mln kWh) 9 9 10Agr value added per worker (constant US$) 243 189 190Hunger dimensionsDietary energy supply (kcal/pc/day) 2 241 2 331 2 712Average dietary energy supply adequacy (%) 104 108 123Dietary en supp, cereals/roots/tubers (%) 65 66 65Prevalence of undernourishment (%) 26 26.6 20.7GDP per capita (US$, PPP) 848 1 080 1 630Domestic food price volatility (index) 19.3 14.6Cereal import dependency ratio (%) 7.5 10.1 9.8Underweight, children under-5 (%) 29.6 35.2 26.2Improved water source (% pop) 43.6 59.9 81.7Food supplyFood production value, (2004-2006 mln I$) 922 1 253 2 246Agriculture, value added (% GDP) 29 19 22Food exports (mln US$) 20 35 176Food imports (mln US$) 75 128 367Production indices (2004-06=100)Net food 51 69 124Net crops 45 60 142Cereals 44 68 143Vegetable oils 51 54 199Roots and tubers 73 102 223Fruit and vegetables 64 97 80Sugar 84 89 107Livestock 55 76 85Milk 58 77 123Meat 53 75 75Fish 76 92 224Net trade (mln US$)Cereals -43 -68 -207Fruit and vegetables -8 -12 34Meat -1 0 -1Dairy products -17 -13 -19Fish -6 -1 -10EnvironmentForest area (%) 25 23 20Renewable water res withdrawn (% of total) 51Terrestrial protect areas (% total land area) 14 14 15Organic area (% total agricultural area) 0Water withdrawal by agriculture (% of total) 51Biofuel production (thousand kt of oil eq.) 1 1 1Wood pellet prod. (1 000 tonnes)Net GHG emissions from AFOLU (CO2 eq, Mt) 24 26 31
76

Burundi
1990 2000 2014
The settingPopulation, total (mln) 5.6 6.7 10.5Population, rural (mln) 5.3 6.1 9.2Govt expenditure on ag (% total outlays)Area harvested (mln ha) 2 2 3Cropping intensity ratio 0.8 0.9Water resources (1 000 m3/person/year) 2 2 1Area equipped for irrigation (1 000 ha) 23Area irrigated (% area equipped for irrigation)Employment in agriculture (%) 92.2Employment in agriculture, female (%) 96.6Fertilizers, Nitrogen (kg of nutrients per ha) 0.3 2.7Fertilizers, Phosphate (kg of nutrients per ha) 0 2.4Fertilizers, Potash (kg nutrients per ha) 0 0.6Energy consump, power irrigation (mln kWh)Agr value added per worker (constant US$) 233 183 132Hunger dimensionsDietary energy supply (kcal/pc/day)Average dietary energy supply adequacy (%)Dietary en supp, cereals/roots/tubers (%)Prevalence of undernourishment (%)GDP per capita (US$, PPP) 1 050 723 747Domestic food price volatility (index) 51.9 11.1Cereal import dependency ratio (%) 18.9 14.3 30.3Underweight, children under-5 (%) 38.9 29.1Improved water source (% pop) 68.8 71.8 75.3Food supplyFood production value, (2004-2006 mln I$) 967 858 1 368Agriculture, value added (% GDP) 56 48 39Food exports (mln US$) 0 2 0Food imports (mln US$) 21 23 173Production indices (2004-06=100)Net food 102 91 145Net crops 89 86 129Cereals 90 84 80Vegetable oils 73 52 234Roots and tubers 96 95 230Fruit and vegetables 93 92 139Sugar 71 97 183Livestock 111 90 125Milk 168 106 229Meat 102 88 106Fish 129 129 100Net trade (mln US$)Cereals -11 -14 -84Fruit and vegetables 0 -2 -5Meat 0 0Dairy products -1 -3Fish 0 0 -2EnvironmentForest area (%) 11 8 7Renewable water res withdrawn (% of total) 77Terrestrial protect areas (% total land area) 4 5 5Organic area (% total agricultural area) 0Water withdrawal by agriculture (% of total) 77Biofuel production (thousand kt of oil eq.) 0 1 0Wood pellet prod. (1 000 tonnes)Net GHG emissions from AFOLU (CO2 eq, Mt) 10 7 6
77

Cabo Verde
1990 2000 2014
The settingPopulation, total (mln) 0.4 0.4 0.5Population, rural (mln) 0.2 0.2 0.2Govt expenditure on ag (% total outlays) 3.3Area harvested (mln ha) 0 0 0Cropping intensity ratio 7 4.2Water resources (1 000 m3/person/year) 1 1 1Area equipped for irrigation (1 000 ha) 4Area irrigated (% area equipped for irrigation) 65.5Employment in agriculture (%)Employment in agriculture, female (%)Fertilizers, Nitrogen (kg of nutrients per ha)Fertilizers, Phosphate (kg of nutrients per ha)Fertilizers, Potash (kg nutrients per ha)Energy consump, power irrigation (mln kWh) 0 0 0Agr value added per worker (constant US$) 1 025 2 708 4 410Hunger dimensionsDietary energy supply (kcal/pc/day) 2 384 2 344 2 845Average dietary energy supply adequacy (%) 110 105 118Dietary en supp, cereals/roots/tubers (%) 53 50 46Prevalence of undernourishment (%) 16.1 18.7 9.4GDP per capita (US$, PPP) 1 610 3 772 6 210Domestic food price volatility (index) 7.5Cereal import dependency ratio (%) 90.3 72.9 94Underweight, children under-5 (%) 11.8Improved water source (% pop) 80.4 82.7 89.3Food supplyFood production value, (2004-2006 mln I$) 24 41 39Agriculture, value added (% GDP) 14 13 8Food exports (mln US$) 2 0 0Food imports (mln US$) 35 56 184Production indices (2004-06=100)Net food 55 92 89Net crops 64 105 100Cereals 193 411 98Vegetable oils 156 97 129Roots and tubers 111 91 147Fruit and vegetables 43 93 94Sugar 68 94 104Livestock 51 84 77Milk 41 66 76Meat 56 87 72FishNet trade (mln US$)Cereals -11 -15 -50Fruit and vegetables -3 -9 -29Meat -1 -4 -26Dairy products -5 -8 -32Fish 2 1 40EnvironmentForest area (%) 14 20 21Renewable water res withdrawn (% of total) 91Terrestrial protect areas (% total land area) 2 2 2Organic area (% total agricultural area)Water withdrawal by agriculture (% of total) 91Biofuel production (thousand kt of oil eq.)Wood pellet prod. (1 000 tonnes)Net GHG emissions from AFOLU (CO2 eq, Mt) 0 0 0
78

Cambodia
1990 2000 2014
The settingPopulation, total (mln) 9.1 12.2 15.4Population, rural (mln) 7.6 10 12.2Govt expenditure on ag (% total outlays) 1.3 0.8Area harvested (mln ha) 3 4 10Cropping intensity ratio 0.6 0.9Water resources (1 000 m3/person/year) 53 39 31Area equipped for irrigation (1 000 ha) 354Area irrigated (% area equipped for irrigation) 89.7Employment in agriculture (%) 73.7 51Employment in agriculture, female (%) 74.9 52.8Fertilizers, Nitrogen (kg of nutrients per ha) 1.4 10.7Fertilizers, Phosphate (kg of nutrients per ha) 2.2 5Fertilizers, Potash (kg nutrients per ha) 0.2 0.9Energy consump, power irrigation (mln kWh) 0 0 0Agr value added per worker (constant US$) 349 375 514Hunger dimensionsDietary energy supply (kcal/pc/day) 1 996 2 114 2 508Average dietary energy supply adequacy (%) 99 99 113Dietary en supp, cereals/roots/tubers (%) 83 78 72Prevalence of undernourishment (%) 32.1 32 14.2GDP per capita (US$, PPP) 1 004 1 368 2 944Domestic food price volatility (index) 17.5 5.5Cereal import dependency ratio (%) 5.2 3.3 -1.4Underweight, children under-5 (%) 39.5 29Improved water source (% pop) 21.5 41.5 71.3Food supplyFood production value, (2004-2006 mln I$) 1 124 1 767 4 292Agriculture, value added (% GDP) 47 38 30Food exports (mln US$) 7 5 177Food imports (mln US$) 12 73 399Production indices (2004-06=100)Net food 47 74 181Net crops 47 72 200Cereals 45 73 179Vegetable oils 15 22 66Roots and tubers 10 19 734Fruit and vegetables 82 98 123Sugar 209 129 476Livestock 54 91 90Milk 80 94 108Meat 53 91 88Fish 27 72 175Net trade (mln US$)Cereals -7 -30 55Fruit and vegetables 0 -5 -2Meat 0 0 -2Dairy products 0 -6 -9Fish 0 32 38EnvironmentForest area (%) 73 65 56Renewable water res withdrawn (% of total) 94Terrestrial protect areas (% total land area) 0 23 26Organic area (% total agricultural area) 0Water withdrawal by agriculture (% of total) 94Biofuel production (thousand kt of oil eq.)Wood pellet prod. (1 000 tonnes)Net GHG emissions from AFOLU (CO2 eq, Mt) 41 43 42
79

Cameroon
1990 2000 2014
The settingPopulation, total (mln) 12.1 15.9 22.8Population, rural (mln) 7.3 8.7 10.5Govt expenditure on ag (% total outlays)Area harvested (mln ha) 3 4 7Cropping intensity ratio 0.3 0.4Water resources (1 000 m3/person/year) 23 18 13Area equipped for irrigation (1 000 ha) 29Area irrigated (% area equipped for irrigation)Employment in agriculture (%) 61.3 53.3Employment in agriculture, female (%) 64.7 58.1Fertilizers, Nitrogen (kg of nutrients per ha) 3.2 4.5Fertilizers, Phosphate (kg of nutrients per ha) 2 1.8Fertilizers, Potash (kg nutrients per ha) 2.9 3.8Energy consump, power irrigation (mln kWh) 0 13 13Agr value added per worker (constant US$) 540 760 1 264Hunger dimensionsDietary energy supply (kcal/pc/day) 2 055 2 133 2 625Average dietary energy supply adequacy (%) 95 97 118Dietary en supp, cereals/roots/tubers (%) 58 57 54Prevalence of undernourishment (%) 37.8 32.3 9.9GDP per capita (US$, PPP) 2 768 2 404 2 739Domestic food price volatility (index) 8.3 5.6Cereal import dependency ratio (%) 31.2 30.2 25.8Underweight, children under-5 (%) 18 17.8 15.1Improved water source (% pop) 51.3 61.7 74.1Food supplyFood production value, (2004-2006 mln I$) 1 874 2 548 5 279Agriculture, value added (% GDP) 25 22 23Food exports (mln US$) 259 172 602Food imports (mln US$) 212 215 934Production indices (2004-06=100)Net food 57 77 160Net crops 55 77 161Cereals 43 66 163Vegetable oils 61 69 141Roots and tubers 58 81 157Fruit and vegetables 50 73 182Sugar 108 100 89Livestock 73 86 124Milk 79 86 114Meat 72 86 126Fish 52 82 113Net trade (mln US$)Cereals -101 -106 -642Fruit and vegetables 25 46 65Meat -5 -14 -14Dairy products -17 -14 -54Fish -45 -27 -247EnvironmentForest area (%) 51 47 41Renewable water res withdrawn (% of total) 76Terrestrial protect areas (% total land area) 6 8 11Organic area (% total agricultural area) 0Water withdrawal by agriculture (% of total) 76Biofuel production (thousand kt of oil eq.) 2 3 7Wood pellet prod. (1 000 tonnes)Net GHG emissions from AFOLU (CO2 eq, Mt) 123 126 121
80

Canada
1990 2000 2014
The settingPopulation, total (mln) 27.7 30.7 35.5Population, rural (mln) 6.5 6.3 6.8Govt expenditure on ag (% total outlays) 3 0.6Area harvested (mln ha) 57 51 66Cropping intensity ratio 0.8 0.8Water resources (1 000 m3/person/year) 105 95 82Area equipped for irrigation (1 000 ha) 870Area irrigated (% area equipped for irrigation) 69.5Employment in agriculture (%) 4.1 3.3 2.4Employment in agriculture, female (%) 2.4 1.9 1.3Fertilizers, Nitrogen (kg of nutrients per ha) 36.2 51Fertilizers, Phosphate (kg of nutrients per ha) 15 15.8Fertilizers, Potash (kg nutrients per ha) 7.7 7.6Energy consump, power irrigation (mln kWh) 18 18 1 329Agr value added per worker (constant US$)Hunger dimensionsDietary energy supply (kcal/pc/day)Average dietary energy supply adequacy (%) 123 140 145Dietary en supp, cereals/roots/tubers (%) 26 28 28Prevalence of undernourishment (%) <5.0 <5.0 <5.0GDP per capita (US$, PPP) 31 118 37 259 41 899Domestic food price volatility (index) 5.3 5.9Cereal import dependency ratio (%) -104.3 -66.8 -81Underweight, children under-5 (%)Improved water source (% pop) 99.8 99.8 99.8Food supplyFood production value, (2004-2006 mln I$) 17 406 21 564 27 181Agriculture, value added (% GDP) 2Food exports (mln US$) 7 300 12 663 37 701Food imports (mln US$) 5 173 8 147 22 561Production indices (2004-06=100)Net food 74 92 115Net crops 82 96 142Cereals 114 101 136Vegetable oils 46 84 188Roots and tubers 60 92 96Fruit and vegetables 84 95 99Sugar 127 111 81Livestock 68 89 85Milk 101 103 106Meat 60 86 79Fish 132 88 80Net trade (mln US$)Cereals 3 318 2 977 7 473Fruit and vegetables -1 920 -1 405 -3 751Meat 184 1 617 1 565Dairy products 44 -66 -220Fish 1 649 1 430 1 541EnvironmentForest area (%) 34 34 34Renewable water res withdrawn (% of total) 5Terrestrial protect areas (% total land area) 5 7 9Organic area (% total agricultural area) 1Water withdrawal by agriculture (% of total) 5Biofuel production (thousand kt of oil eq.) 12 225Wood pellet prod. (1 000 tonnes) 1 900Net GHG emissions from AFOLU (CO2 eq, Mt) 162 69 200
81

Central African Republic
1990 2000 2014
The settingPopulation, total (mln) 2.9 3.6 4.7Population, rural (mln) 1.8 2.3 2.8Govt expenditure on ag (% total outlays)Area harvested (mln ha) 1 1 1Cropping intensity ratio 0.2 0.2Water resources (1 000 m3/person/year) 48 39 31Area equipped for irrigation (1 000 ha) 1Area irrigated (% area equipped for irrigation)Employment in agriculture (%)Employment in agriculture, female (%)Fertilizers, Nitrogen (kg of nutrients per ha)Fertilizers, Phosphate (kg of nutrients per ha)Fertilizers, Potash (kg nutrients per ha)Energy consump, power irrigation (mln kWh)Agr value added per worker (constant US$) 430 510 456Hunger dimensionsDietary energy supply (kcal/pc/day) 1 907 1 967 1 940Average dietary energy supply adequacy (%) 88 90 87Dietary en supp, cereals/roots/tubers (%) 57 56 56Prevalence of undernourishment (%) 47.3 44.1 47.7GDP per capita (US$, PPP) 780 701 584Domestic food price volatility (index)Cereal import dependency ratio (%) 29.3 20.8 21.4Underweight, children under-5 (%) 21.8 23.5Improved water source (% pop) 58.8 62.5 68.2Food supplyFood production value, (2004-2006 mln I$) 489 727 966Agriculture, value added (% GDP) 49 52 58Food exports (mln US$) 17 12 16Food imports (mln US$) 35 18 59Production indices (2004-06=100)Net food 62 91 121Net crops 77 100 122Cereals 38 72 119Vegetable oils 68 84 101Roots and tubers 74 103 127Fruit and vegetables 77 100 112Sugar 67 99 121Livestock 54 88 124Milk 70 95 123Meat 52 88 126Fish 52 60 120Net trade (mln US$)Cereals -12 -8 -23Fruit and vegetables -1 0 -1Meat -1 0 -1Dairy products -3 -1 -3Fish -2 0 -3EnvironmentForest area (%) 37 37 36Renewable water res withdrawn (% of total) 1Terrestrial protect areas (% total land area) 18 18 18Organic area (% total agricultural area)Water withdrawal by agriculture (% of total) 1Biofuel production (thousand kt of oil eq.)Wood pellet prod. (1 000 tonnes)Net GHG emissions from AFOLU (CO2 eq, Mt) 33 39 30
82

Chad
1990 2000 2014
The settingPopulation, total (mln) 6 8.3 13.2Population, rural (mln) 4.7 6.5 10.3Govt expenditure on ag (% total outlays)Area harvested (mln ha) 1 2 3Cropping intensity ratio 0 0Water resources (1 000 m3/person/year) 8 6 4Area equipped for irrigation (1 000 ha) 30Area irrigated (% area equipped for irrigation) 86.6Employment in agriculture (%) 83 83Employment in agriculture, female (%) 85.9 85.9Fertilizers, Nitrogen (kg of nutrients per ha)Fertilizers, Phosphate (kg of nutrients per ha)Fertilizers, Potash (kg nutrients per ha)Energy consump, power irrigation (mln kWh) 8 8 9Agr value added per worker (constant US$) 1 287Hunger dimensionsDietary energy supply (kcal/pc/day) 1 757 1 985 2 216Average dietary energy supply adequacy (%) 82 93 103Dietary en supp, cereals/roots/tubers (%) 66 58 68Prevalence of undernourishment (%) 59.1 40.1 34.4GDP per capita (US$, PPP) 1 111 998 2 022Domestic food price volatility (index) 15.4 11.7Cereal import dependency ratio (%) 7.1 4.9 7.7Underweight, children under-5 (%) 29.4 30.3Improved water source (% pop) 39.8 44.7 50.7Food supplyFood production value, (2004-2006 mln I$) 719 984 1 531Agriculture, value added (% GDP) 29 42 53Food exports (mln US$) 33 52 39Food imports (mln US$) 27 32 154Production indices (2004-06=100)Net food 56 77 120Net crops 51 72 116Cereals 35 54 159Vegetable oils 29 80 90Roots and tubers 94 77 134Fruit and vegetables 88 88 105Sugar 81 89 105Livestock 74 90 115Milk 64 90 114Meat 76 90 116FishNet trade (mln US$)Cereals -7 -8 -63Fruit and vegetables 0 0 -4Meat -2 0 -1Dairy products -2 -4 -5Fish 0 -1EnvironmentForest area (%) 10 10 9Renewable water res withdrawn (% of total) 76Terrestrial protect areas (% total land area) 10 10 17Organic area (% total agricultural area)Water withdrawal by agriculture (% of total) 76Biofuel production (thousand kt of oil eq.) 1 1 1Wood pellet prod. (1 000 tonnes)Net GHG emissions from AFOLU (CO2 eq, Mt) 33 39 36
83

Chile
1990 2000 2014
The settingPopulation, total (mln) 13.2 15.5 17.8Population, rural (mln) 2.2 2.2 1.8Govt expenditure on ag (% total outlays)Area harvested (mln ha) 3 4 4Cropping intensity ratio 0.2 0.3Water resources (1 000 m3/person/year) 70 60 52Area equipped for irrigation (1 000 ha) 1 110Area irrigated (% area equipped for irrigation) 98.6Employment in agriculture (%) 19.3 14.4 10.3Employment in agriculture, female (%) 5.9 4.6 5.1Fertilizers, Nitrogen (kg of nutrients per ha) 147.4 256.6Fertilizers, Phosphate (kg of nutrients per ha) 124.3 91.4Fertilizers, Potash (kg nutrients per ha) 58.5 10.4Energy consump, power irrigation (mln kWh) 0 667Agr value added per worker (constant US$) 3 224 4 429 6 638Hunger dimensionsDietary energy supply (kcal/pc/day) 2 627 2 834 3 083Average dietary energy supply adequacy (%) 112 119 127Dietary en supp, cereals/roots/tubers (%) 46 45 44Prevalence of undernourishment (%) 9 <5.0 <5.0GDP per capita (US$, PPP) 9 199 14 623 21 714Domestic food price volatility (index) 4 8.4Cereal import dependency ratio (%) 26.7 39.8 38.8Underweight, children under-5 (%) 0.6 0.5Improved water source (% pop) 90.4 94.8 98.8Food supplyFood production value, (2004-2006 mln I$) 4 179 5 980 8 424Agriculture, value added (% GDP) 9 6 3Food exports (mln US$) 1 014 1 996 8 004Food imports (mln US$) 232 946 4 022Production indices (2004-06=100)Net food 58 83 117Net crops 61 82 117Cereals 79 69 102Vegetable oils 108 89 335Roots and tubers 65 79 96Fruit and vegetables 55 83 119Sugar 99 131 80Livestock 56 83 117Milk 60 86 115Meat 52 81 115Fish 100 90 54Net trade (mln US$)Cereals 6 -170 -533Fruit and vegetables 875 1 441 5 326Meat 15 -87 -95Dairy products -18 -27 26Fish 858 1 746 3 911EnvironmentForest area (%) 21 21 22Renewable water res withdrawn (% of total) 83Terrestrial protect areas (% total land area) 16 17 19Organic area (% total agricultural area) 0Water withdrawal by agriculture (% of total) 83Biofuel production (thousand kt of oil eq.) 1 0 0Wood pellet prod. (1 000 tonnes) 10Net GHG emissions from AFOLU (CO2 eq, Mt) 14 -1 5
84
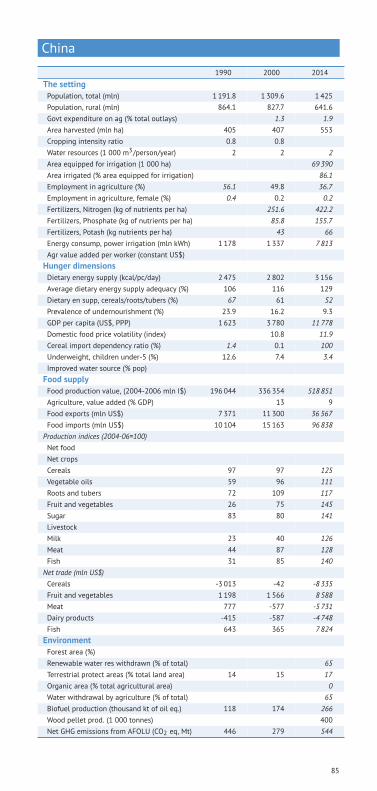
China
1990 2000 2014
The settingPopulation, total (mln) 1 191.8 1 309.6 1 425Population, rural (mln) 864.1 827.7 641.6Govt expenditure on ag (% total outlays) 1.3 1.9Area harvested (mln ha) 405 407 553Cropping intensity ratio 0.8 0.8Water resources (1 000 m3/person/year) 2 2 2Area equipped for irrigation (1 000 ha) 69 390Area irrigated (% area equipped for irrigation) 86.1Employment in agriculture (%) 56.1 49.8 36.7Employment in agriculture, female (%) 0.4 0.2 0.2Fertilizers, Nitrogen (kg of nutrients per ha) 251.6 422.2Fertilizers, Phosphate (kg of nutrients per ha) 85.8 155.7Fertilizers, Potash (kg nutrients per ha) 43 66Energy consump, power irrigation (mln kWh) 1 178 1 337 7 813Agr value added per worker (constant US$)Hunger dimensionsDietary energy supply (kcal/pc/day) 2 475 2 802 3 156Average dietary energy supply adequacy (%) 106 116 129Dietary en supp, cereals/roots/tubers (%) 67 61 52Prevalence of undernourishment (%) 23.9 16.2 9.3GDP per capita (US$, PPP) 1 623 3 780 11 778Domestic food price volatility (index) 10.8 11.9Cereal import dependency ratio (%) 1.4 0.1 100Underweight, children under-5 (%) 12.6 7.4 3.4Improved water source (% pop)Food supplyFood production value, (2004-2006 mln I$) 196 044 336 354 518 851Agriculture, value added (% GDP) 13 9Food exports (mln US$) 7 371 11 300 36 567Food imports (mln US$) 10 104 15 163 96 838Production indices (2004-06=100)Net foodNet cropsCereals 97 97 125Vegetable oils 59 96 111Roots and tubers 72 109 117Fruit and vegetables 26 75 145Sugar 83 80 141LivestockMilk 23 40 126Meat 44 87 128Fish 31 85 140Net trade (mln US$)Cereals -3 013 -42 -8 335Fruit and vegetables 1 198 1 566 8 588Meat 777 -577 -5 731Dairy products -415 -587 -4 748Fish 643 365 7 824EnvironmentForest area (%)Renewable water res withdrawn (% of total) 65Terrestrial protect areas (% total land area) 14 15 17Organic area (% total agricultural area) 0Water withdrawal by agriculture (% of total) 65Biofuel production (thousand kt of oil eq.) 118 174 266Wood pellet prod. (1 000 tonnes) 400Net GHG emissions from AFOLU (CO2 eq, Mt) 446 279 544
85

Colombia
1990 2000 2014
The settingPopulation, total (mln) 33.3 39.9 48.9Population, rural (mln) 10.6 11.1 11.7Govt expenditure on ag (% total outlays)Area harvested (mln ha) 28 34 35Cropping intensity ratio 0.6 0.8Water resources (1 000 m3/person/year) 71 59 49Area equipped for irrigation (1 000 ha) 1 090Area irrigated (% area equipped for irrigation) 36.2Employment in agriculture (%) 1.4 1.1 16.9Employment in agriculture, female (%) 0.6 0.5 6.9Fertilizers, Nitrogen (kg of nutrients per ha) 163.3 390.9Fertilizers, Phosphate (kg of nutrients per ha) 54.6 185.5Fertilizers, Potash (kg nutrients per ha) 106.9 167.8Energy consump, power irrigation (mln kWh) 94 94 94Agr value added per worker (constant US$) 3 654 2 721 3 982Hunger dimensionsDietary energy supply (kcal/pc/day) 2 589 2 786 2 848Average dietary energy supply adequacy (%) 115 122 122Dietary en supp, cereals/roots/tubers (%) 38 37 35Prevalence of undernourishment (%) 14.6 9.9 8.8GDP per capita (US$, PPP) 7 752 8 414 12 025Domestic food price volatility (index) 8.8 4.1Cereal import dependency ratio (%) 38 53.9 63.3Underweight, children under-5 (%) 4.9 3.4Improved water source (% pop) 88.4 89.9 91.2Food supplyFood production value, (2004-2006 mln I$) 8 177 10 216 13 623Agriculture, value added (% GDP) 17 9 7Food exports (mln US$) 598 1 063 2 717Food imports (mln US$) 261 944 4 360Production indices (2004-06=100)Net food 70 87 117Net crops 79 88 108Cereals 103 92 93Vegetable oils 44 78 139Roots and tubers 106 83 118Fruit and vegetables 54 89 121Sugar 71 87 89Livestock 69 86 120Milk 62 94 99Meat 75 82 130Fish 74 113 85Net trade (mln US$)Cereals -126 -358 -1 966Fruit and vegetables 315 383 395Meat 16 -29 -108Dairy products -3 0 -112Fish 74 116 -170EnvironmentForest area (%) 56 55 54Renewable water res withdrawn (% of total) 54Terrestrial protect areas (% total land area) 19 20 21Organic area (% total agricultural area) 0Water withdrawal by agriculture (% of total) 54Biofuel production (thousand kt of oil eq.) 67 60 9 285Wood pellet prod. (1 000 tonnes)Net GHG emissions from AFOLU (CO2 eq, Mt) 102 99 98
86

Comoros
1990 2000 2014
The settingPopulation, total (mln) 0.4 0.5 0.8Population, rural (mln) 0.3 0.4 0.5Govt expenditure on ag (% total outlays)Area harvested (mln ha) 0 0 0Cropping intensity ratio 0.9 1.1Water resources (1 000 m3/person/year) 3 2 2Area equipped for irrigation (1 000 ha) 0Area irrigated (% area equipped for irrigation)Employment in agriculture (%)Employment in agriculture, female (%)Fertilizers, Nitrogen (kg of nutrients per ha)Fertilizers, Phosphate (kg of nutrients per ha)Fertilizers, Potash (kg nutrients per ha)Energy consump, power irrigation (mln kWh)Agr value added per worker (constant US$) 747 771 817Hunger dimensionsDietary energy supply (kcal/pc/day)Average dietary energy supply adequacy (%)Dietary en supp, cereals/roots/tubers (%)Prevalence of undernourishment (%)GDP per capita (US$, PPP) 1 540 1 343 1 400Domestic food price volatility (index)Cereal import dependency ratio (%) 70.2 69 71.2Underweight, children under-5 (%) 16.2 25 16.9Improved water source (% pop) 87 92 95.1Food supplyFood production value, (2004-2006 mln I$) 51 61 72Agriculture, value added (% GDP) 41 49 35Food exports (mln US$) 11 6 27Food imports (mln US$) 16 13 81Production indices (2004-06=100)Net food 80 95 113Net crops 78 95 113Cereals 75 87 149Vegetable oils 73 84 110Roots and tubers 72 93 124Fruit and vegetables 75 93 101SugarLivestock 92 99 113Milk 89 101 117Meat 95 99 112FishNet trade (mln US$)Cereals -7 -38Fruit and vegetables -1 -1 -2Meat -8 -28Dairy products -2 -3Fish -1 0 -3EnvironmentForest area (%) 6 4 1Renewable water res withdrawn (% of total) 47Terrestrial protect areas (% total land area) 1 10Organic area (% total agricultural area) 2Water withdrawal by agriculture (% of total) 47Biofuel production (thousand kt of oil eq.)Wood pellet prod. (1 000 tonnes)Net GHG emissions from AFOLU (CO2 eq, Mt) 0 0 0
87

Congo
1990 2000 2014
The settingPopulation, total (mln) 2.4 3.1 4.6Population, rural (mln) 1.1 1.3 1.6Govt expenditure on ag (% total outlays)Area harvested (mln ha) 1 1 1Cropping intensity ratio 0.1 0.1Water resources (1 000 m3/person/year) 349 266 187Area equipped for irrigation (1 000 ha) 2Area irrigated (% area equipped for irrigation)Employment in agriculture (%) 35.4Employment in agriculture, female (%) 39.3Fertilizers, Nitrogen (kg of nutrients per ha) 0 6.1Fertilizers, Phosphate (kg of nutrients per ha) 0 0.7Fertilizers, Potash (kg nutrients per ha) 0 2.5Energy consump, power irrigation (mln kWh) 0 0 0Agr value added per worker (constant US$) 502 405 838Hunger dimensionsDietary energy supply (kcal/pc/day) 2 005 2 170 2 121Average dietary energy supply adequacy (%) 92 99 97Dietary en supp, cereals/roots/tubers (%) 60 61 61Prevalence of undernourishment (%) 43.2 35.9 30.5GDP per capita (US$, PPP) 5 264 4 623 5 680Domestic food price volatility (index) 18.5 11.4Cereal import dependency ratio (%) 94.8 95.2 92.9Underweight, children under-5 (%) 11.8Improved water source (% pop) 69.2 75.3Food supplyFood production value, (2004-2006 mln I$) 203 268 441Agriculture, value added (% GDP) 13 5 5Food exports (mln US$) 14 16 17Food imports (mln US$) 67 136 623Production indices (2004-06=100)Net food 63 83 136Net crops 66 86 127Cereals 25 45 137Vegetable oils 93 88 134Roots and tubers 71 83 126Fruit and vegetables 54 94 127Sugar 45 76 109Livestock 51 67 164Milk 83 87 112Meat 51 67 165Fish 85 81 129Net trade (mln US$)Cereals -35 -45 -248Fruit and vegetables -2 -14 -30Meat -13 -17 -204Dairy products -4 -17 -33Fish -19 -18 -52EnvironmentForest area (%) 67 66 66Renewable water res withdrawn (% of total) 9Terrestrial protect areas (% total land area) 5 9 30Organic area (% total agricultural area)Water withdrawal by agriculture (% of total) 9Biofuel production (thousand kt of oil eq.) 1 1 2Wood pellet prod. (1 000 tonnes)Net GHG emissions from AFOLU (CO2 eq, Mt) 12 12 12
88

Costa Rica
1990 2000 2014
The settingPopulation, total (mln) 3.1 3.9 4.9Population, rural (mln) 1.5 1.6 1.7Govt expenditure on ag (% total outlays)Area harvested (mln ha) 3 4 4Cropping intensity ratio 1.1 2.1Water resources (1 000 m3/person/year) 37 29 23Area equipped for irrigation (1 000 ha) 102Area irrigated (% area equipped for irrigation) 100Employment in agriculture (%) 25.9 20.4 13.4Employment in agriculture, female (%) 6.4 5.4 3.9Fertilizers, Nitrogen (kg of nutrients per ha) 310.4 349.2Fertilizers, Phosphate (kg of nutrients per ha) 150.6 90.4Fertilizers, Potash (kg nutrients per ha) 386.3 265.4Energy consump, power irrigation (mln kWh) 0 38 38Agr value added per worker (constant US$) 3 199 4 499 6 813Hunger dimensionsDietary energy supply (kcal/pc/day) 2 726 2 801 2 961Average dietary energy supply adequacy (%) 119 119 121Dietary en supp, cereals/roots/tubers (%) 34 35 34Prevalence of undernourishment (%) 5.2 5.2 <5.0GDP per capita (US$, PPP) 7 333 9 565 13 431Domestic food price volatility (index) 5.6 6.9Cereal import dependency ratio (%) 72.3 79.7 82.4Underweight, children under-5 (%) 2.5 4.5 1.1Improved water source (% pop) 93.1 95 96.6Food supplyFood production value, (2004-2006 mln I$) 1 406 2 077 2 941Agriculture, value added (% GDP) 12 9 6Food exports (mln US$) 527 1 223 3 080Food imports (mln US$) 139 382 1 306Production indices (2004-06=100)Net food 59 87 124Net crops 62 89 122Cereals 128 140 117Vegetable oils 42 77 169Roots and tubers 47 80 109Fruit and vegetables 53 84 126Sugar 61 89 114Livestock 71 91 123Milk 59 92 136Meat 78 92 116Fish 43 103 125Net trade (mln US$)Cereals -55 -116 -376Fruit and vegetables 398 874 1 776Meat 45 30 22Dairy products -5 5 74Fish 46 98 93EnvironmentForest area (%) 50 47 52Renewable water res withdrawn (% of total) 57Terrestrial protect areas (% total land area) 19 24 27Organic area (% total agricultural area) 0Water withdrawal by agriculture (% of total) 57Biofuel production (thousand kt of oil eq.) 6 10 16Wood pellet prod. (1 000 tonnes) 30Net GHG emissions from AFOLU (CO2 eq, Mt) 11 9 -4
89
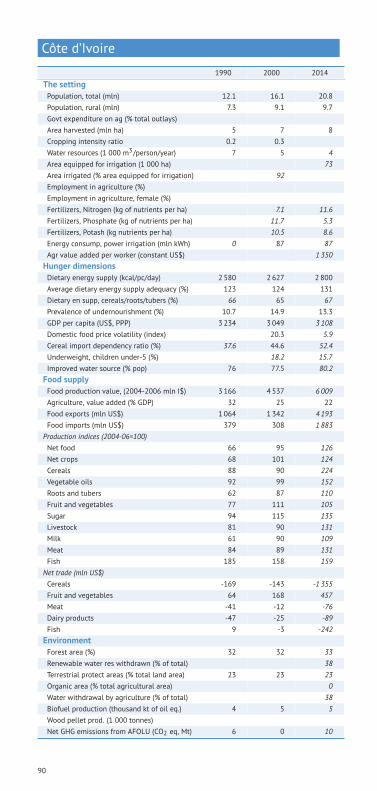
Côte d’Ivoire
1990 2000 2014
The settingPopulation, total (mln) 12.1 16.1 20.8Population, rural (mln) 7.3 9.1 9.7Govt expenditure on ag (% total outlays)Area harvested (mln ha) 5 7 8Cropping intensity ratio 0.2 0.3Water resources (1 000 m3/person/year) 7 5 4Area equipped for irrigation (1 000 ha) 73Area irrigated (% area equipped for irrigation) 92Employment in agriculture (%)Employment in agriculture, female (%)Fertilizers, Nitrogen (kg of nutrients per ha) 7.1 11.6Fertilizers, Phosphate (kg of nutrients per ha) 11.7 5.3Fertilizers, Potash (kg nutrients per ha) 10.5 8.6Energy consump, power irrigation (mln kWh) 0 87 87Agr value added per worker (constant US$) 1 350Hunger dimensionsDietary energy supply (kcal/pc/day) 2 580 2 627 2 800Average dietary energy supply adequacy (%) 123 124 131Dietary en supp, cereals/roots/tubers (%) 66 65 67Prevalence of undernourishment (%) 10.7 14.9 13.3GDP per capita (US$, PPP) 3 234 3 049 3 108Domestic food price volatility (index) 20.3 5.9Cereal import dependency ratio (%) 37.6 44.6 52.4Underweight, children under-5 (%) 18.2 15.7Improved water source (% pop) 76 77.5 80.2Food supplyFood production value, (2004-2006 mln I$) 3 166 4 537 6 009Agriculture, value added (% GDP) 32 25 22Food exports (mln US$) 1 064 1 342 4 193Food imports (mln US$) 379 308 1 883Production indices (2004-06=100)Net food 66 95 126Net crops 68 101 124Cereals 88 90 224Vegetable oils 92 99 152Roots and tubers 62 87 110Fruit and vegetables 77 111 105Sugar 94 115 135Livestock 81 90 131Milk 61 90 109Meat 84 89 131Fish 185 158 159Net trade (mln US$)Cereals -169 -143 -1 355Fruit and vegetables 64 168 457Meat -41 -12 -76Dairy products -47 -25 -89Fish 9 -3 -242EnvironmentForest area (%) 32 32 33Renewable water res withdrawn (% of total) 38Terrestrial protect areas (% total land area) 23 23 23Organic area (% total agricultural area) 0Water withdrawal by agriculture (% of total) 38Biofuel production (thousand kt of oil eq.) 4 5 5Wood pellet prod. (1 000 tonnes)Net GHG emissions from AFOLU (CO2 eq, Mt) 6 0 10
90

Croatia
1990 2000 2014
The settingPopulation, total (mln) 4.8 4.5 4.3Population, rural (mln) 2.2 2 1.8Govt expenditure on ag (% total outlays) 2.9 3.9Area harvested (mln ha) 3 3Cropping intensity ratio 2.4Water resources (1 000 m3/person/year) 22 24 25Area equipped for irrigation (1 000 ha) 24Area irrigated (% area equipped for irrigation)Employment in agriculture (%) 14.5 13.7Employment in agriculture, female (%) 15.3 13.6Fertilizers, Nitrogen (kg of nutrients per ha) 143.1 139Fertilizers, Phosphate (kg of nutrients per ha) 73.9 108.1Fertilizers, Potash (kg nutrients per ha) 75.9 53.8Energy consump, power irrigation (mln kWh) 0 1 3Agr value added per worker (constant US$) 10 494 23 815Hunger dimensionsDietary energy supply (kcal/pc/day)Average dietary energy supply adequacy (%) 93 105 121Dietary en supp, cereals/roots/tubers (%) 37 39 32Prevalence of undernourishment (%) <5.0 <5.0 <5.0GDP per capita (US$, PPP) 15 644 20 049Domestic food price volatility (index) 12.4 8.8Cereal import dependency ratio (%) -5.3 -0.7 -12.4Underweight, children under-5 (%) 0.5Improved water source (% pop) 98.4 98.5 98.6Food supplyFood production value, (2004-2006 mln I$) 1 157 1 060 1 082Agriculture, value added (% GDP) 6 4Food exports (mln US$) 296 224 1 104Food imports (mln US$) 306 456 1 819Production indices (2004-06=100)Net food 105 96 98Net crops 100 104 98Cereals 87 89 100Vegetable oils 49 63 137Roots and tubers 171 191 62Fruit and vegetables 140 143 99Sugar 39 35 77Livestock 97 77 92Milk 78 77 90Meat 123 74 96Fish 0 59 186Net trade (mln US$)Cereals 50 7 19Fruit and vegetables -52 -107 -291Meat -12 -32 -189Dairy products -23 -30 -75Fish 26 5 42EnvironmentForest area (%) 33 34 34Renewable water res withdrawn (% of total) 1Terrestrial protect areas (% total land area) 8 10 14Organic area (% total agricultural area) 2Water withdrawal by agriculture (% of total) 1Biofuel production (thousand kt of oil eq.) 0 2Wood pellet prod. (1 000 tonnes) 190Net GHG emissions from AFOLU (CO2 eq, Mt) -9 -9 -9
91

Cuba
1990 2000 2014
The settingPopulation, total (mln) 10.6 11.1 11.3Population, rural (mln) 2.8 2.7 2.8Govt expenditure on ag (% total outlays)Area harvested (mln ha) 82 36 14Cropping intensity ratio 12.1 5.6Water resources (1 000 m3/person/year) 4 3 3Area equipped for irrigation (1 000 ha) 870Area irrigated (% area equipped for irrigation) 84.8Employment in agriculture (%) 25.9 27.1 19.7Employment in agriculture, female (%) 14.2 8.8Fertilizers, Nitrogen (kg of nutrients per ha) 6.6 24Fertilizers, Phosphate (kg of nutrients per ha) 3.2 10.6Fertilizers, Potash (kg nutrients per ha) 6.6 15.6Energy consump, power irrigation (mln kWh) 0 916 916Agr value added per worker (constant US$) 4 223 3 032 4 634Hunger dimensionsDietary energy supply (kcal/pc/day) 2 719 3 002 3 533Average dietary energy supply adequacy (%) 113 124 143Dietary en supp, cereals/roots/tubers (%) 38 43 44Prevalence of undernourishment (%) 5.7 5.6 <5.0GDP per capita (US$, PPP) 13 532 11 154 18 796Domestic food price volatility (index)Cereal import dependency ratio (%) 82.7 71.7 75.5Underweight, children under-5 (%) 3.4Improved water source (% pop) 90.7 94Food supplyFood production value, (2004-2006 mln I$) 4 320 3 375 2 821Agriculture, value added (% GDP) 14 8 5Food exports (mln US$) 4 561 551 499Food imports (mln US$) 803 631 1 845Production indices (2004-06=100)Net food 158 123 103Net crops 134 112 90Cereals 82 113 145Vegetable oils 38 61 33Roots and tubers 28 65 101Fruit and vegetables 35 81 77Sugar 528 235 104Livestock 186 125 144Milk 241 144 138Meat 178 126 150Fish 341 184 94Net trade (mln US$)Cereals -295 -828Fruit and vegetables 94 15 -68Meat -111 -80 -379Dairy products -105 -87 -182Fish 65 44 34EnvironmentForest area (%) 19 23 28Renewable water res withdrawn (% of total) 65Terrestrial protect areas (% total land area) 4 4 12Organic area (% total agricultural area) 0Water withdrawal by agriculture (% of total) 65Biofuel production (thousand kt of oil eq.) 150 87 29Wood pellet prod. (1 000 tonnes)Net GHG emissions from AFOLU (CO2 eq, Mt) -2 -16 0
92

Cyprus
1990 2000 2014
The settingPopulation, total (mln) 0.8 0.9 1.2Population, rural (mln) 0.3 0.3 0.3Govt expenditure on ag (% total outlays)Area harvested (mln ha) 1 1 0Cropping intensity ratio 4.2 5.6Water resources (1 000 m3/person/year) 1 1 1Area equipped for irrigation (1 000 ha) 46Area irrigated (% area equipped for irrigation) 81.9Employment in agriculture (%) 13.5 5.2 2.9Employment in agriculture, female (%) 15.9 4.7 1.9Fertilizers, Nitrogen (kg of nutrients per ha) 85.6 116.9Fertilizers, Phosphate (kg of nutrients per ha) 58.5 59.3Fertilizers, Potash (kg nutrients per ha) 14.1 34.5Energy consump, power irrigation (mln kWh) 67 91 91Agr value added per worker (constant US$) 8 337 12 294 13 906Hunger dimensionsDietary energy supply (kcal/pc/day)Average dietary energy supply adequacy (%) 112 107 104Dietary en supp, cereals/roots/tubers (%) 30 28 28Prevalence of undernourishment (%) <5.0 <5.0 <5.0GDP per capita (US$, PPP) 22 199 27 893 27 394Domestic food price volatility (index) 17.1 13.3Cereal import dependency ratio (%) 73.1 86.4 89.4Underweight, children under-5 (%)Improved water source (% pop) 100 100 100Food supplyFood production value, (2004-2006 mln I$) 396 437 328Agriculture, value added (% GDP) 7 4 2Food exports (mln US$) 199 91 233Food imports (mln US$) 193 255 773Production indices (2004-06=100)Net food 98 108 81Net crops 136 111 68Cereals 142 54 101Vegetable oils 55 100 42Roots and tubers 137 85 81Fruit and vegetables 145 118 66SugarLivestock 70 104 90Milk 73 98 105Meat 67 106 84Fish 5 119 11Net trade (mln US$)Cereals -81 -108 -240Fruit and vegetables 150 28 -17Meat -15 -11 -86Dairy products -10 -8 7Fish -19 -24 -70EnvironmentForest area (%) 17 19 19Renewable water res withdrawn (% of total) 86Terrestrial protect areas (% total land area) 14 39 41Organic area (% total agricultural area) 3Water withdrawal by agriculture (% of total) 86Biofuel production (thousand kt of oil eq.) 0 162Wood pellet prod. (1 000 tonnes) 0Net GHG emissions from AFOLU (CO2 eq, Mt) 0 0 0
93

Czech Republic
1990 2000 2014
The settingPopulation, total (mln) 10.3 10.2 10.7Population, rural (mln) 2.6 2.7 2.9Govt expenditure on ag (% total outlays) 2.9 3.9Area harvested (mln ha) 6 8Cropping intensity ratio 1.5Water resources (1 000 m3/person/year) 1 1 1Area equipped for irrigation (1 000 ha) 32Area irrigated (% area equipped for irrigation) 51.7Employment in agriculture (%) 7.7 5.1 3.1Employment in agriculture, female (%) 6.3 3.7 1.9Fertilizers, Nitrogen (kg of nutrients per ha) 67.8 74.8Fertilizers, Phosphate (kg of nutrients per ha) 14.2 14Fertilizers, Potash (kg nutrients per ha) 9.6 17.1Energy consump, power irrigation (mln kWh) 0 31Agr value added per worker (constant US$) 4 724 5 709 7 841Hunger dimensionsDietary energy supply (kcal/pc/day)Average dietary energy supply adequacy (%) 118 122 131Dietary en supp, cereals/roots/tubers (%) 34 31 31Prevalence of undernourishment (%) <5.0 <5.0 <5.0GDP per capita (US$, PPP) 19 839 21 003 28 124Domestic food price volatility (index) 6.6 12.6Cereal import dependency ratio (%) -0.7 -12.7 -44Underweight, children under-5 (%) 0.9 2.1Improved water source (% pop) 99.8 99.8 99.8Food supplyFood production value, (2004-2006 mln I$) 4 817 3 748 3 476Agriculture, value added (% GDP) 5 3 3Food exports (mln US$) 738 821 5 473Food imports (mln US$) 621 1 040 6 240Production indices (2004-06=100)Net food 128 100 92Net crops 109 102 102Cereals 85 85 101Vegetable oils 39 88 140Roots and tubers 285 172 61Fruit and vegetables 199 185 78Sugar 127 83 110Livestock 132 102 85Milk 126 102 103Meat 139 101 74Fish 0 98 94Net trade (mln US$)Cereals 5 77 531Fruit and vegetables -133 -283 -1 028Meat 45 -18 -800Dairy products 184 108 214Fish -31 -48 -126EnvironmentForest area (%) 34 34 34Renewable water res withdrawn (% of total) 2Terrestrial protect areas (% total land area) 15 16 22Organic area (% total agricultural area) 11Water withdrawal by agriculture (% of total) 2Biofuel production (thousand kt of oil eq.) 162 1 817 5 382Wood pellet prod. (1 000 tonnes) 165Net GHG emissions from AFOLU (CO2 eq, Mt) 9 -6 -6
94

Democratic People’s Republic of Korea
1990 2000 2014
The settingPopulation, total (mln) 20.2 22.8 25Population, rural (mln) 8.4 9.3 9.8Govt expenditure on ag (% total outlays)Area harvested (mln ha) 6 4 5Cropping intensity ratio 2.5 1.5Water resources (1 000 m3/person/year) 4 3 3Area equipped for irrigation (1 000 ha) 1 460Area irrigated (% area equipped for irrigation)Employment in agriculture (%)Employment in agriculture, female (%)Fertilizers, Nitrogen (kg of nutrients per ha)Fertilizers, Phosphate (kg of nutrients per ha)Fertilizers, Potash (kg nutrients per ha)Energy consump, power irrigation (mln kWh) 0 0 0Agr value added per worker (constant US$)Hunger dimensionsDietary energy supply (kcal/pc/day) 2 319 2 118 2 108Average dietary energy supply adequacy (%) 99 90 88Dietary en supp, cereals/roots/tubers (%) 66 68 69Prevalence of undernourishment (%) 23.3 37.9 41.6GDP per capita (US$, PPP)Domestic food price volatility (index)Cereal import dependency ratio (%) 13.5 39.1 12.2Underweight, children under-5 (%) 24.7 15.2Improved water source (% pop) 100 99.7 98.1Food supplyFood production value, (2004-2006 mln I$) 3 232 2 961 3 651Agriculture, value added (% GDP)Food exports (mln US$) 31 21 18Food imports (mln US$) 174 428 510Production indices (2004-06=100)Net food 91 83 102Net crops 99 85 103Cereals 114 65 115Vegetable oils 129 101 99Roots and tubers 42 91 91Fruit and vegetables 101 94 97SugarLivestock 98 78 103Milk 80 81 89Meat 91 76 105Fish 198 104 104Net trade (mln US$)Cereals -85 -339 -346Fruit and vegetables 20 8 6Meat -8 -3 -3Dairy productsFish 65 74 14EnvironmentForest area (%) 68 58 45Renewable water res withdrawn (% of total) 76Terrestrial protect areas (% total land area) 2 2 2Organic area (% total agricultural area)Water withdrawal by agriculture (% of total) 76Biofuel production (thousand kt of oil eq.)Wood pellet prod. (1 000 tonnes)Net GHG emissions from AFOLU (CO2 eq, Mt) 21 18 19
95

Denmark
1990 2000 2014
The settingPopulation, total (mln) 5.1 5.3 5.6Population, rural (mln) 0.8 0.8 0.7Govt expenditure on ag (% total outlays)Area harvested (mln ha) 10 9 9Cropping intensity ratio 3.4 3.6Water resources (1 000 m3/person/year) 1 1 1Area equipped for irrigation (1 000 ha) 435Area irrigated (% area equipped for irrigation) 58.4Employment in agriculture (%) 5.5 3.3 2.6Employment in agriculture, female (%) 2.8 1.6 1.1Fertilizers, Nitrogen (kg of nutrients per ha) 96.3 72.9Fertilizers, Phosphate (kg of nutrients per ha) 7 13.8Fertilizers, Potash (kg nutrients per ha) 33.1 25.7Energy consump, power irrigation (mln kWh)Agr value added per worker (constant US$) 12 426 29 317 41 870Hunger dimensionsDietary energy supply (kcal/pc/day)Average dietary energy supply adequacy (%) 127 131 132Dietary en supp, cereals/roots/tubers (%) 28 29 29Prevalence of undernourishment (%) <5.0 <5.0 <5.0GDP per capita (US$, PPP) 33 256 41 693 42 483Domestic food price volatility (index) 5.6 5.5Cereal import dependency ratio (%) -26.9 -15.9 -13.7Underweight, children under-5 (%)Improved water source (% pop) 100 100 100Food supplyFood production value, (2004-2006 mln I$) 5 522 5 738 5 980Agriculture, value added (% GDP) 4 2 1Food exports (mln US$) 6 719 6 794 13 771Food imports (mln US$) 1 540 2 485 6 842Production indices (2004-06=100)Net food 95 98 103Net crops 116 103 104Cereals 103 104 99Vegetable oils 191 72 166Roots and tubers 97 109 105Fruit and vegetables 112 86 108Sugar 134 127 87Livestock 82 95 99Milk 103 103 111Meat 73 92 94Fish 152 158 70Net trade (mln US$)Cereals 686 448 477Fruit and vegetables -223 -454 -1 084Meat 3 082 2 809 3 840Dairy products 1 125 1 142 1 910Fish 1 049 949 1 029EnvironmentForest area (%) 10 11 13Renewable water res withdrawn (% of total) 36Terrestrial protect areas (% total land area) 12 18 18Organic area (% total agricultural area) 7Water withdrawal by agriculture (% of total) 36Biofuel production (thousand kt of oil eq.) 12 28 2 102Wood pellet prod. (1 000 tonnes) 92Net GHG emissions from AFOLU (CO2 eq, Mt) 13 11 11
96
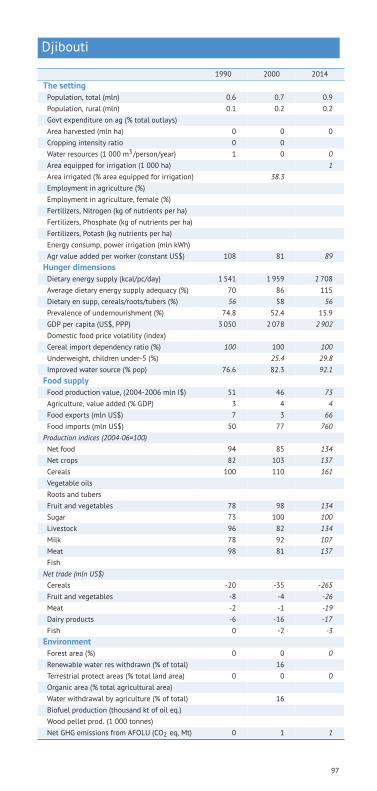
Djibouti
1990 2000 2014
The settingPopulation, total (mln) 0.6 0.7 0.9Population, rural (mln) 0.1 0.2 0.2Govt expenditure on ag (% total outlays)Area harvested (mln ha) 0 0 0Cropping intensity ratio 0 0Water resources (1 000 m3/person/year) 1 0 0Area equipped for irrigation (1 000 ha) 1Area irrigated (% area equipped for irrigation) 38.3Employment in agriculture (%)Employment in agriculture, female (%)Fertilizers, Nitrogen (kg of nutrients per ha)Fertilizers, Phosphate (kg of nutrients per ha)Fertilizers, Potash (kg nutrients per ha)Energy consump, power irrigation (mln kWh)Agr value added per worker (constant US$) 108 81 89Hunger dimensionsDietary energy supply (kcal/pc/day) 1 541 1 959 2 708Average dietary energy supply adequacy (%) 70 86 115Dietary en supp, cereals/roots/tubers (%) 56 58 56Prevalence of undernourishment (%) 74.8 52.4 15.9GDP per capita (US$, PPP) 3 050 2 078 2 902Domestic food price volatility (index)Cereal import dependency ratio (%) 100 100 100Underweight, children under-5 (%) 25.4 29.8Improved water source (% pop) 76.6 82.3 92.1Food supplyFood production value, (2004-2006 mln I$) 51 46 73Agriculture, value added (% GDP) 3 4 4Food exports (mln US$) 7 3 66Food imports (mln US$) 50 77 760Production indices (2004-06=100)Net food 94 85 134Net crops 82 103 137Cereals 100 110 161Vegetable oilsRoots and tubersFruit and vegetables 78 98 134Sugar 73 100 100Livestock 96 82 134Milk 78 92 107Meat 98 81 137FishNet trade (mln US$)Cereals -20 -35 -265Fruit and vegetables -8 -4 -26Meat -2 -1 -19Dairy products -6 -16 -17Fish 0 -2 -3EnvironmentForest area (%) 0 0 0Renewable water res withdrawn (% of total) 16Terrestrial protect areas (% total land area) 0 0 0Organic area (% total agricultural area)Water withdrawal by agriculture (% of total) 16Biofuel production (thousand kt of oil eq.)Wood pellet prod. (1 000 tonnes)Net GHG emissions from AFOLU (CO2 eq, Mt) 0 1 1
97

Dominican Republic
1990 2000 2014
The settingPopulation, total (mln) 7.2 8.7 10.5Population, rural (mln) 3.2 3.3 3Govt expenditure on ag (% total outlays)Area harvested (mln ha) 7 5 5Cropping intensity ratio 2.6 1.8Water resources (1 000 m3/person/year) 3 2 2Area equipped for irrigation (1 000 ha) 307Area irrigated (% area equipped for irrigation)Employment in agriculture (%) 16.9 15.9 14.5Employment in agriculture, female (%) 2.8 2.5 2.5Fertilizers, Nitrogen (kg of nutrients per ha) 49.6 63.1Fertilizers, Phosphate (kg of nutrients per ha) 0 18.8Fertilizers, Potash (kg nutrients per ha) 2.6 11.7Energy consump, power irrigation (mln kWh) 0 0 0Agr value added per worker (constant US$) 2 460 3 559 8 181Hunger dimensionsDietary energy supply (kcal/pc/day) 2 118 2 211 2 620Average dietary energy supply adequacy (%) 94 96 111Dietary en supp, cereals/roots/tubers (%) 34 32 32Prevalence of undernourishment (%) 34.3 30.7 12.3GDP per capita (US$, PPP) 5 284 7 963 11 796Domestic food price volatility (index) 8 4.5Cereal import dependency ratio (%) 71.8 75.8 73.9Underweight, children under-5 (%) 8.4 3.5 4Improved water source (% pop) 88.8 85.8 80.9Food supplyFood production value, (2004-2006 mln I$) 1 480 1 792 2 891Agriculture, value added (% GDP) 15 7 6Food exports (mln US$) 301 243 793Food imports (mln US$) 230 379 1 457Production indices (2004-06=100)Net food 69 84 136Net crops 82 88 148Cereals 69 90 128Vegetable oils 67 91 174Roots and tubers 80 103 118Fruit and vegetables 61 84 174Sugar 128 89 94Livestock 58 80 114Milk 77 94 148Meat 56 79 107FishNet trade (mln US$)Cereals -113 -143 -695Fruit and vegetables 29 65 220Meat 22 -10 -46Dairy products -32 -42 -77FishEnvironmentForest area (%) 41 41 41Renewable water res withdrawn (% of total) 80Terrestrial protect areas (% total land area) 20 22 19Organic area (% total agricultural area) 8Water withdrawal by agriculture (% of total) 80Biofuel production (thousand kt of oil eq.) 15 20 22Wood pellet prod. (1 000 tonnes)Net GHG emissions from AFOLU (CO2 eq, Mt) 9 5 8
98

DR Congo
1990 2000 2014
The settingPopulation, total (mln) 34.9 46.9 69.4Population, rural (mln) 25.2 33.2 44.4Govt expenditure on ag (% total outlays)Area harvested (mln ha) 20 17 18Cropping intensity ratio 0.8 0.7Water resources (1 000 m3/person/year) 37 27 19Area equipped for irrigation (1 000 ha) 11Area irrigated (% area equipped for irrigation) 76.2Employment in agriculture (%)Employment in agriculture, female (%)Fertilizers, Nitrogen (kg of nutrients per ha) 0.2 0.3Fertilizers, Phosphate (kg of nutrients per ha) 0.1 0.3Fertilizers, Potash (kg nutrients per ha) 0.1 0.3Energy consump, power irrigation (mln kWh) 0 0 0Agr value added per worker (constant US$) 265 226 227Hunger dimensionsDietary energy supply (kcal/pc/day)Average dietary energy supply adequacy (%)Dietary en supp, cereals/roots/tubers (%)Prevalence of undernourishment (%)GDP per capita (US$, PPP) 1 375 575 783Domestic food price volatility (index)Cereal import dependency ratio (%) 18.4 20.4 33.7Underweight, children under-5 (%) 33.6 23.4Improved water source (% pop) 43.2 44 46.5Food supplyFood production value, (2004-2006 mln I$) 4 247 3 686 4 236Agriculture, value added (% GDP) 31 32 21Food exports (mln US$) 8 4 32Food imports (mln US$) 221 193 950Production indices (2004-06=100)Net food 117 102 117Net crops 122 102 116Cereals 103 103 117Vegetable oils 117 97 146Roots and tubers 121 105 112Fruit and vegetables 126 97 116Sugar 111 110 131Livestock 99 101 121Milk 139 90 170Meat 99 101 121Fish 69 104 97Net trade (mln US$)Cereals -121 -74 -418Fruit and vegetables -11 -11 -63Meat -49 -50 -173Dairy products -16 -15 -49Fish -40 -26 -175EnvironmentForest area (%) 71 69 68Renewable water res withdrawn (% of total) 10Terrestrial protect areas (% total land area) 10 10 12Organic area (% total agricultural area) 0Water withdrawal by agriculture (% of total) 10Biofuel production (thousand kt of oil eq.) 2 2Wood pellet prod. (1 000 tonnes)Net GHG emissions from AFOLU (CO2 eq, Mt) 187 184 182
99
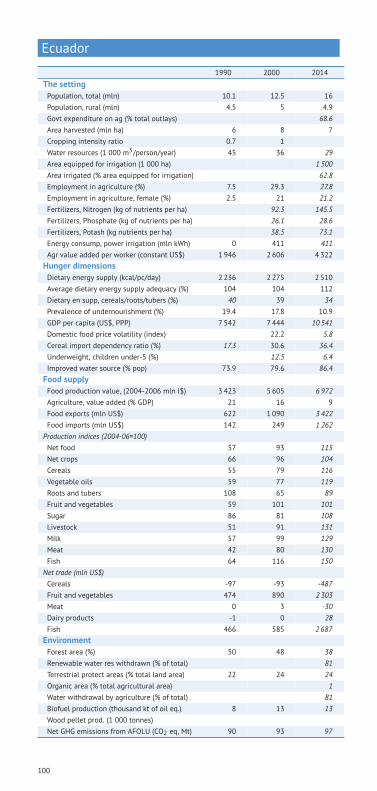
Ecuador
1990 2000 2014
The settingPopulation, total (mln) 10.1 12.5 16Population, rural (mln) 4.5 5 4.9Govt expenditure on ag (% total outlays) 68.6Area harvested (mln ha) 6 8 7Cropping intensity ratio 0.7 1Water resources (1 000 m3/person/year) 45 36 29Area equipped for irrigation (1 000 ha) 1 500Area irrigated (% area equipped for irrigation) 62.8Employment in agriculture (%) 7.5 29.3 27.8Employment in agriculture, female (%) 2.5 21 21.2Fertilizers, Nitrogen (kg of nutrients per ha) 92.3 145.5Fertilizers, Phosphate (kg of nutrients per ha) 26.1 28.6Fertilizers, Potash (kg nutrients per ha) 38.5 73.1Energy consump, power irrigation (mln kWh) 0 411 411Agr value added per worker (constant US$) 1 946 2 606 4 322Hunger dimensionsDietary energy supply (kcal/pc/day) 2 236 2 275 2 510Average dietary energy supply adequacy (%) 104 104 112Dietary en supp, cereals/roots/tubers (%) 40 39 34Prevalence of undernourishment (%) 19.4 17.8 10.9GDP per capita (US$, PPP) 7 542 7 444 10 541Domestic food price volatility (index) 22.2 5.8Cereal import dependency ratio (%) 17.3 30.6 36.4Underweight, children under-5 (%) 12.5 6.4Improved water source (% pop) 73.9 79.6 86.4Food supplyFood production value, (2004-2006 mln I$) 3 423 5 605 6 972Agriculture, value added (% GDP) 21 16 9Food exports (mln US$) 622 1 090 3 422Food imports (mln US$) 142 249 1 262Production indices (2004-06=100)Net food 57 93 115Net crops 66 96 104Cereals 55 79 116Vegetable oils 59 77 119Roots and tubers 108 65 89Fruit and vegetables 59 101 101Sugar 86 81 108Livestock 51 91 131Milk 57 99 129Meat 42 80 130Fish 64 116 150Net trade (mln US$)Cereals -97 -93 -487Fruit and vegetables 474 890 2 303Meat 0 3 -30Dairy products -1 0 28Fish 466 585 2 687EnvironmentForest area (%) 50 48 38Renewable water res withdrawn (% of total) 81Terrestrial protect areas (% total land area) 22 24 24Organic area (% total agricultural area) 1Water withdrawal by agriculture (% of total) 81Biofuel production (thousand kt of oil eq.) 8 13 13Wood pellet prod. (1 000 tonnes)Net GHG emissions from AFOLU (CO2 eq, Mt) 90 93 97
100

Egypt
1990 2000 2014
The settingPopulation, total (mln) 56.3 66.1 83.4Population, rural (mln) 31.8 37.8 46.7Govt expenditure on ag (% total outlays) 5.1 1.9Area harvested (mln ha) 13 20 24Cropping intensity ratio 4.9 6.1Water resources (1 000 m3/person/year) 1 1 1Area equipped for irrigation (1 000 ha) 3 650Area irrigated (% area equipped for irrigation) 100Employment in agriculture (%) 39 29.6 29.2Employment in agriculture, female (%) 52 39.4 43.3Fertilizers, Nitrogen (kg of nutrients per ha) 550 430.7Fertilizers, Phosphate (kg of nutrients per ha) 61.4 133.2Fertilizers, Potash (kg nutrients per ha) 16.3 11.5Energy consump, power irrigation (mln kWh) 165 482 948Agr value added per worker (constant US$) 1 210 1 677 2 562Hunger dimensionsDietary energy supply (kcal/pc/day) 3 176 3 378 3 550Average dietary energy supply adequacy (%) 143 148 152Dietary en supp, cereals/roots/tubers (%) 68 66 65Prevalence of undernourishment (%) <5.0 <5.0 <5.0GDP per capita (US$, PPP) 6 024 7 812 10 734Domestic food price volatility (index) 3.7 10.2Cereal import dependency ratio (%) 36 33.8 44.2Underweight, children under-5 (%) 8.2 4.3 6.8Improved water source (% pop) 92.9 96.1 99.3Food supplyFood production value, (2004-2006 mln I$) 9 850 15 585 21 720Agriculture, value added (% GDP) 19 17 14Food exports (mln US$) 201 309 3 523Food imports (mln US$) 2 501 2 737 13 416Production indices (2004-06=100)Net food 54 85 119Net crops 56 87 114Cereals 57 92 101Vegetable oils 40 84 108Roots and tubers 60 63 168Fruit and vegetables 52 84 119Sugar 57 93 141Livestock 51 82 131Milk 48 79 121Meat 51 83 136Fish 34 80 160Net trade (mln US$)Cereals -1 302 -1 175 -5 791Fruit and vegetables 55 -80 762Meat -192 -303 -1 154Dairy products -179 -174 -400Fish -68 -170 -764EnvironmentForest area (%) 0 0 0Renewable water res withdrawn (% of total) 86Terrestrial protect areas (% total land area) 0 4 11Organic area (% total agricultural area) 2Water withdrawal by agriculture (% of total) 86Biofuel production (thousand kt of oil eq.) 44 57 58Wood pellet prod. (1 000 tonnes) 20Net GHG emissions from AFOLU (CO2 eq, Mt) 18 24 29
101

El Salvador
1990 2000 2014
The settingPopulation, total (mln) 5.3 6 6.4Population, rural (mln) 2.7 2.4 2.2Govt expenditure on ag (% total outlays) 1 1.8Area harvested (mln ha) 3 5 7Cropping intensity ratio 2.1 3.4Water resources (1 000 m3/person/year) 5 4 4Area equipped for irrigation (1 000 ha) 45Area irrigated (% area equipped for irrigation) 74.8Employment in agriculture (%) 7.4 21.6 21Employment in agriculture, female (%) 2.7 3.8 5Fertilizers, Nitrogen (kg of nutrients per ha) 53.6 104.5Fertilizers, Phosphate (kg of nutrients per ha) 15.4 39.8Fertilizers, Potash (kg nutrients per ha) 9.2 28.2Energy consump, power irrigation (mln kWh) 11 11 11Agr value added per worker (constant US$) 2 133 2 382 3 489Hunger dimensionsDietary energy supply (kcal/pc/day) 2 375 2 527 2 575Average dietary energy supply adequacy (%) 111 116 114Dietary en supp, cereals/roots/tubers (%) 58 52 49Prevalence of undernourishment (%) 16.2 12.5 12.4GDP per capita (US$, PPP) 4 454 6 266 7 515Domestic food price volatility (index) 14.3 5.1Cereal import dependency ratio (%) 27.8 41.5 41.8Underweight, children under-5 (%) 7.2 6.1 6.6Improved water source (% pop) 74.8 83.6 90.1Food supplyFood production value, (2004-2006 mln I$) 635 804 950Agriculture, value added (% GDP) 17 10 11Food exports (mln US$) 60 244 679Food imports (mln US$) 127 584 1 297Production indices (2004-06=100)Net food 75 95 113Net crops 94 102 113Cereals 97 90 118Vegetable oils 180 129 123Roots and tubers 21 155 141Fruit and vegetables 86 83 105Sugar 61 106 147Livestock 62 90 107Milk 64 90 113Meat 58 91 104Fish 20 22 127Net trade (mln US$)Cereals -33 -118 -208Fruit and vegetables -14 -84 -107Meat 0 -38 -115Dairy products -20 -75 -135Fish 9 18 63EnvironmentForest area (%) 18 16 13Renewable water res withdrawn (% of total) 68Terrestrial protect areas (% total land area) 0 0 8Organic area (% total agricultural area) 0Water withdrawal by agriculture (% of total) 68Biofuel production (thousand kt of oil eq.) 6 9 22Wood pellet prod. (1 000 tonnes)Net GHG emissions from AFOLU (CO2 eq, Mt) 4 4 4
102

Eritrea
1990 2000 2014
The settingPopulation, total (mln) 3.3 3.9 6.5Population, rural (mln) 2.8 3.2 5.1Govt expenditure on ag (% total outlays)Area harvested (mln ha) 0 0Cropping intensity ratio 0Water resources (1 000 m3/person/year) 2 2 1Area equipped for irrigation (1 000 ha) 21Area irrigated (% area equipped for irrigation) 62.5 62.5Employment in agriculture (%)Employment in agriculture, female (%)Fertilizers, Nitrogen (kg of nutrients per ha) 1.1 1.2Fertilizers, Phosphate (kg of nutrients per ha) 0.2 0.1Fertilizers, Potash (kg nutrients per ha) 0.2 0.1Energy consump, power irrigation (mln kWh) 0 0 0Agr value added per worker (constant US$) 162 132 106Hunger dimensionsDietary energy supply (kcal/pc/day)Average dietary energy supply adequacy (%)Dietary en supp, cereals/roots/tubers (%)Prevalence of undernourishment (%)GDP per capita (US$, PPP) 1 175 1 446 1 157Domestic food price volatility (index)Cereal import dependency ratio (%) 52.2 51.3 50.7Underweight, children under-5 (%) 36.9 34.5 38.8Improved water source (% pop) 42.6 53.7 60.2Food supplyFood production value, (2004-2006 mln I$) 137 174 243Agriculture, value added (% GDP) 22 13 15Food exports (mln US$) 0 1 0Food imports (mln US$) 30 69 97Production indices (2004-06=100)Net food 63 79 111Net crops 61 69 94Cereals 30 43 103Vegetable oils 78 55 35Roots and tubers 113 123 60Fruit and vegetables 75 84 142SugarLivestock 64 87 123Milk 48 68 114Meat 69 97 129Fish 0 187 59Net trade (mln US$)Cereals -33 -51Fruit and vegetables -14 -4MeatDairy products -5 0Fish 2 0EnvironmentForest area (%) 16 16 15Renewable water res withdrawn (% of total)Terrestrial protect areas (% total land area) 5 5 5Organic area (% total agricultural area)Water withdrawal by agriculture (% of total)Biofuel production (thousand kt of oil eq.) 1 1Wood pellet prod. (1 000 tonnes)Net GHG emissions from AFOLU (CO2 eq, Mt) 3 5 5
103

Estonia
1990 2000 2014
The settingPopulation, total (mln) 1.5 1.4 1.3Population, rural (mln) 0.4 0.4 0.4Govt expenditure on ag (% total outlays)Area harvested (mln ha) 1 1Cropping intensity ratio 0.7Water resources (1 000 m3/person/year) 9 9 10Area equipped for irrigation (1 000 ha) 4Area irrigated (% area equipped for irrigation) 71.2Employment in agriculture (%) 21 7.1 4.7Employment in agriculture, female (%) 15.2 4.4 2.6Fertilizers, Nitrogen (kg of nutrients per ha) 42.7 53.1Fertilizers, Phosphate (kg of nutrients per ha) 11.3 10.9Fertilizers, Potash (kg nutrients per ha) 17.6 17Energy consump, power irrigation (mln kWh) 0 7 7Agr value added per worker (constant US$) 6 329 13 786Hunger dimensionsDietary energy supply (kcal/pc/day)Average dietary energy supply adequacy (%) 103 122 132Dietary en supp, cereals/roots/tubers (%) 41 36 37Prevalence of undernourishment (%) <5.0 <5.0 <5.0GDP per capita (US$, PPP) 14 875 25 254Domestic food price volatility (index) 3.4 9.2Cereal import dependency ratio (%) 17.6 25.6 -19.8Underweight, children under-5 (%)Improved water source (% pop) 99.2 99.1 99.1Food supplyFood production value, (2004-2006 mln I$) 559 391 589Agriculture, value added (% GDP) 5 4Food exports (mln US$) 119 199 977Food imports (mln US$) 91 340 959Production indices (2004-06=100)Net food 127 89 134Net crops 136 126 148Cereals 115 102 155Vegetable oils 3 49 221Roots and tubers 283 268 77Fruit and vegetables 189 137 104SugarLivestock 131 89 120Milk 120 94 115Meat 146 78 132Fish 377 124 77Net trade (mln US$)Cereals -8 -37 72Fruit and vegetables -2 -54 -170Meat 9 -24 -45Dairy products 49 28 149Fish 47 47 81EnvironmentForest area (%) 50 53 52Renewable water res withdrawn (% of total) 0Terrestrial protect areas (% total land area) 13 17 21Organic area (% total agricultural area) 15Water withdrawal by agriculture (% of total) 0Biofuel production (thousand kt of oil eq.) 9 8Wood pellet prod. (1 000 tonnes) 720Net GHG emissions from AFOLU (CO2 eq, Mt) 10 10 12
104

Ethiopia
1990 2000 2014
The settingPopulation, total (mln) 53.4 66 96.5Population, rural (mln) 46.2 56.3 79.3Govt expenditure on ag (% total outlays) 5 17.5Area harvested (mln ha) 8 23Cropping intensity ratio 0.3Water resources (1 000 m3/person/year) 2 2 1Area equipped for irrigation (1 000 ha) 290Area irrigated (% area equipped for irrigation)Employment in agriculture (%) 89.3 79.3Employment in agriculture, female (%) 74.8Fertilizers, Nitrogen (kg of nutrients per ha) 3.1 11.7Fertilizers, Phosphate (kg of nutrients per ha) 2.6 12Fertilizers, Potash (kg nutrients per ha) 0 0Energy consump, power irrigation (mln kWh) 0 15 15Agr value added per worker (constant US$) 180 166 278Hunger dimensionsDietary energy supply (kcal/pc/day) 1 508 1 782 2 192Average dietary energy supply adequacy (%) 71 83 99Dietary en supp, cereals/roots/tubers (%) 83 82 76Prevalence of undernourishment (%) 74.8 57.9 32GDP per capita (US$, PPP) 652 623 1 336Domestic food price volatility (index) 8.8 10.8Cereal import dependency ratio (%) 17.3 10.8 10.7Underweight, children under-5 (%) 43.3 42 29.2Improved water source (% pop) 13.2 29 51.5Food supplyFood production value, (2004-2006 mln I$) 3 599 4 856 10 294Agriculture, value added (% GDP) 52 48 42Food exports (mln US$) 10 66 1 264Food imports (mln US$) 120 296 1 393Production indices (2004-06=100)Net food 52 70 147Net crops 52 75 157Cereals 45 67 196Vegetable oils 31 33 161Roots and tubers 62 82 146Fruit and vegetables 43 67 142Sugar 65 83 105Livestock 53 64 130Milk 32 41 170Meat 63 74 112Fish 51 160 392Net trade (mln US$)Cereals -82 -227 -700Fruit and vegetables -3 0 435Meat 0 2 74Dairy products -3 -3 -10Fish 0 0 -2EnvironmentForest area (%) 15 14 12Renewable water res withdrawn (% of total) 94Terrestrial protect areas (% total land area) 18 18 18Organic area (% total agricultural area) 0Water withdrawal by agriculture (% of total) 94Biofuel production (thousand kt of oil eq.) 71 137Wood pellet prod. (1 000 tonnes)Net GHG emissions from AFOLU (CO2 eq, Mt) 62 82 115
105

Fiji
1990 2000 2014
The settingPopulation, total (mln) 0.7 0.8 0.9Population, rural (mln) 0.4 0.4 0.4Govt expenditure on ag (% total outlays) 0.8 1.2Area harvested (mln ha) 4 4 2Cropping intensity ratio 9.8 8.4Water resources (1 000 m3/person/year) 39 35 32Area equipped for irrigation (1 000 ha) 4Area irrigated (% area equipped for irrigation)Employment in agriculture (%)Employment in agriculture, female (%)Fertilizers, Nitrogen (kg of nutrients per ha) 18.7 24.4Fertilizers, Phosphate (kg of nutrients per ha) 0.3 0.5Fertilizers, Potash (kg nutrients per ha) 0.2 7.9Energy consump, power irrigation (mln kWh)Agr value added per worker (constant US$) 2 902 2 873 2 934Hunger dimensionsDietary energy supply (kcal/pc/day) 2 715 2 859 2 931Average dietary energy supply adequacy (%) 119 124 124Dietary en supp, cereals/roots/tubers (%) 47 48 48Prevalence of undernourishment (%) 6.6 <5.0 <5.0GDP per capita (US$, PPP) 5 694 6 444 7 502Domestic food price volatility (index) 13.6 8.2Cereal import dependency ratio (%) 88.6 93.6 93.1Underweight, children under-5 (%) 6.9 6.9Improved water source (% pop) 85.3 91.2 96.3Food supplyFood production value, (2004-2006 mln I$) 247 231 196Agriculture, value added (% GDP) 20 17 12Food exports (mln US$) 177 142 201Food imports (mln US$) 78 96 287Production indices (2004-06=100)Net food 108 101 86Net crops 116 105 76Cereals 188 94 38Vegetable oils 141 96 127Roots and tubers 30 56 126Fruit and vegetables 50 95 83Sugar 134 120 53Livestock 92 92 110Milk 106 102 112Meat 88 89 104Fish 68 90 91Net trade (mln US$)Cereals -22 -26 -42Fruit and vegetables -10 -8 -25Meat -11 -16 -29Dairy products -8 -9 -37Fish 17 26 173EnvironmentForest area (%) 52 54 56Renewable water res withdrawn (% of total) 59Terrestrial protect areas (% total land area) 1 2 4Organic area (% total agricultural area) 1Water withdrawal by agriculture (% of total) 59Biofuel production (thousand kt of oil eq.) 8 9 4Wood pellet prod. (1 000 tonnes)Net GHG emissions from AFOLU (CO2 eq, Mt) 1 1 0
106

Finland
1990 2000 2014
The settingPopulation, total (mln) 5 5.2 5.4Population, rural (mln) 1 0.9 0.9Govt expenditure on ag (% total outlays)Area harvested (mln ha) 4 4 4Cropping intensity ratio 1.8 1.8Water resources (1 000 m3/person/year) 22 21 20Area equipped for irrigation (1 000 ha) 69Area irrigated (% area equipped for irrigation) 21.9Employment in agriculture (%) 8.8 6 4.1Employment in agriculture, female (%) 6.7 3.9 2.3Fertilizers, Nitrogen (kg of nutrients per ha) 74 85.5Fertilizers, Phosphate (kg of nutrients per ha) 10 32.3Fertilizers, Potash (kg nutrients per ha) 34.3 70.8Energy consump, power irrigation (mln kWh) 0 132Agr value added per worker (constant US$) 22 008 33 255 71 465Hunger dimensionsDietary energy supply (kcal/pc/day)Average dietary energy supply adequacy (%) 124 124 131Dietary en supp, cereals/roots/tubers (%) 28 32 32Prevalence of undernourishment (%) <5.0 <5.0 <5.0GDP per capita (US$, PPP) 28 598 34 517 38 821Domestic food price volatility (index) 4.5 7.7Cereal import dependency ratio (%) -35.6 -8.3 -21.3Underweight, children under-5 (%)Improved water source (% pop) 100 100 100Food supplyFood production value, (2004-2006 mln I$) 2 116 1 924 1 876Agriculture, value added (% GDP) 6 3 3Food exports (mln US$) 547 613 1 485Food imports (mln US$) 851 1 156 3 483Production indices (2004-06=100)Net food 109 99 96Net crops 111 105 100Cereals 111 106 107Vegetable oils 107 65 73Roots and tubers 133 118 92Fruit and vegetables 87 104 116Sugar 106 98 45Livestock 107 95 98Milk 116 101 96Meat 97 89 99Fish 100 113 119Net trade (mln US$)Cereals 64 -96 -129Fruit and vegetables -441 -372 -974Meat 54 -22 -276Dairy products 175 168 178Fish -117 -99 -387EnvironmentForest area (%) 72 74 73Renewable water res withdrawn (% of total) 3Terrestrial protect areas (% total land area) 4 13 15Organic area (% total agricultural area) 9Water withdrawal by agriculture (% of total) 3Biofuel production (thousand kt of oil eq.) 16 72 7 773Wood pellet prod. (1 000 tonnes) 324Net GHG emissions from AFOLU (CO2 eq, Mt) -10 -19 12
107

France
1990 2000 2014
The settingPopulation, total (mln) 56.8 59.2 64.6Population, rural (mln) 14.7 13.7 8.2Govt expenditure on ag (% total outlays)Area harvested (mln ha) 55 66 68Cropping intensity ratio 1.8 2.2Water resources (1 000 m3/person/year) 4 4 3Area equipped for irrigation (1 000 ha) 2 600Area irrigated (% area equipped for irrigation) 57.2Employment in agriculture (%) 5.4 4.1 2.9Employment in agriculture, female (%) 4.5 2.9 1.8Fertilizers, Nitrogen (kg of nutrients per ha) 129.4 104.7Fertilizers, Phosphate (kg of nutrients per ha) 40.6 13.8Fertilizers, Potash (kg nutrients per ha) 53.3 18.4Energy consump, power irrigation (mln kWh) 98 4 829 4 875Agr value added per worker (constant US$) 23 375 42 551 84 574Hunger dimensionsDietary energy supply (kcal/pc/day)Average dietary energy supply adequacy (%) 141 145 141Dietary en supp, cereals/roots/tubers (%) 27 28 29Prevalence of undernourishment (%) <5.0 <5.0 <5.0GDP per capita (US$, PPP) 29 476 34 774 37 217Domestic food price volatility (index) 4.6 6.2Cereal import dependency ratio (%) -125.7 -100.2 -90.4Underweight, children under-5 (%)Improved water source (% pop) 100 100 100Food supplyFood production value, (2004-2006 mln I$) 38 720 40 321 38 188Agriculture, value added (% GDP) 2 2Food exports (mln US$) 23 576 21 950 46 001Food imports (mln US$) 15 148 15 627 37 016Production indices (2004-06=100)Net food 100 104 99Net crops 97 103 94Cereals 84 101 104Vegetable oils 80 94 104Roots and tubers 69 95 103Fruit and vegetables 114 109 80Sugar 104 102 110Livestock 100 105 100Milk 106 102 97Meat 97 107 102Fish 106 108 84Net trade (mln US$)Cereals 6 079 3 909 9 659Fruit and vegetables -2 297 -2 102 -5 751Meat -877 532 -1 270Dairy products 2 367 1 740 4 015Fish -1 878 -1 888 -4 281EnvironmentForest area (%) 27 28 29Renewable water res withdrawn (% of total) 12Terrestrial protect areas (% total land area) 11 17 25Organic area (% total agricultural area) 4Water withdrawal by agriculture (% of total) 12Biofuel production (thousand kt of oil eq.) 211 8 109 53 997Wood pellet prod. (1 000 tonnes) 1 200Net GHG emissions from AFOLU (CO2 eq, Mt) 77 52 44
108

Gabon
1990 2000 2014
The settingPopulation, total (mln) 0.9 1.2 1.7Population, rural (mln) 0.3 0.2 0.2Govt expenditure on ag (% total outlays)Area harvested (mln ha) 1 1 1Cropping intensity ratio 0.1 0.1Water resources (1 000 m3/person/year) 175 135 99Area equipped for irrigation (1 000 ha) 4Area irrigated (% area equipped for irrigation)Employment in agriculture (%) 41.6 41.6 24.2Employment in agriculture, female (%) 60.8 60.8 33.7Fertilizers, Nitrogen (kg of nutrients per ha) 0.6 6.8Fertilizers, Phosphate (kg of nutrients per ha) 0.4 4.8Fertilizers, Potash (kg nutrients per ha) 2.6 5.7Energy consump, power irrigation (mln kWh)Agr value added per worker (constant US$) 1 106 1 383 2 741Hunger dimensionsDietary energy supply (kcal/pc/day) 2 472 2 709 2 812Average dietary energy supply adequacy (%) 113 122 125Dietary en supp, cereals/roots/tubers (%) 46 49 51Prevalence of undernourishment (%) 11.7 <5.0 <5.0GDP per capita (US$, PPP) 19 147 17 438 18 646Domestic food price volatility (index) 5.9 22.3Cereal import dependency ratio (%) 78.2 85.2 81.9Underweight, children under-5 (%) 8.8 6.5Improved water source (% pop) 83.8 92.2Food supplyFood production value, (2004-2006 mln I$) 188 213 260Agriculture, value added (% GDP) 7 6 4Food exports (mln US$) 3 2 0Food imports (mln US$) 88 141 489Production indices (2004-06=100)Net food 87 99 121Net crops 76 98 123Cereals 70 80 138Vegetable oils 72 99 86Roots and tubers 78 98 127Fruit and vegetables 81 98 109Sugar 107 115 137Livestock 87 102 120Milk 43 83 108Meat 88 102 121Fish 46 110 76Net trade (mln US$)Cereals -33 -43 -137Fruit and vegetables -13 -12 -36Meat -46 -170Dairy products -17 -17 -44Fish -8 3 -41EnvironmentForest area (%) 85 85 85Renewable water res withdrawn (% of total) 29Terrestrial protect areas (% total land area) 5 6 20Organic area (% total agricultural area)Water withdrawal by agriculture (% of total) 29Biofuel production (thousand kt of oil eq.) 1 0 1Wood pellet prod. (1 000 tonnes)Net GHG emissions from AFOLU (CO2 eq, Mt) 1 1 1
109

Gambia
1990 2000 2014
The settingPopulation, total (mln) 0.9 1.2 1.9Population, rural (mln) 0.6 0.6 0.8Govt expenditure on ag (% total outlays)Area harvested (mln ha) 0 0 0Cropping intensity ratio 0.2 0.3Water resources (1 000 m3/person/year) 9 7 4Area equipped for irrigation (1 000 ha) 5Area irrigated (% area equipped for irrigation) 64.7Employment in agriculture (%) 64.7 64.7Employment in agriculture, female (%) 76.5 76.5Fertilizers, Nitrogen (kg of nutrients per ha) 5.6 2.6Fertilizers, Phosphate (kg of nutrients per ha) 2.1 2.2Fertilizers, Potash (kg nutrients per ha) 1.3 1.7Energy consump, power irrigation (mln kWh) 0 0 0Agr value added per worker (constant US$) 307 331 267Hunger dimensionsDietary energy supply (kcal/pc/day) 2 522 2 536 2 893Average dietary energy supply adequacy (%) 115 116 132Dietary en supp, cereals/roots/tubers (%) 57 55 63Prevalence of undernourishment (%) 13.3 14.1 5.3GDP per capita (US$, PPP) 1 517 1 564 1 608Domestic food price volatility (index) 3.7 4.3Cereal import dependency ratio (%) 51.5 39.5 43.6Underweight, children under-5 (%) 15.4 17.4Improved water source (% pop) 75.8 82.8 90.1Food supplyFood production value, (2004-2006 mln I$) 72 118 116Agriculture, value added (% GDP)Food exports (mln US$) 11 13 23Food imports (mln US$) 45 60 98Production indices (2004-06=100)Net food 60 99 97Net crops 57 101 97Cereals 44 85 114Vegetable oils 63 115 77Roots and tubers 66 79 121Fruit and vegetables 63 82 124SugarLivestock 76 85 99Milk 69 89 110Meat 77 84 97Fish 62 83 125Net trade (mln US$)Cereals -24 -58Fruit and vegetables -6 -5 -4Meat -2 -1 -2Dairy products -3 0Fish 4 3 1EnvironmentForest area (%) 44 46 48Renewable water res withdrawn (% of total) 43Terrestrial protect areas (% total land area) 2 4 5Organic area (% total agricultural area) 0Water withdrawal by agriculture (% of total) 43Biofuel production (thousand kt of oil eq.)Wood pellet prod. (1 000 tonnes)Net GHG emissions from AFOLU (CO2 eq, Mt) 1 1 1
110

Georgia
1990 2000 2014
The settingPopulation, total (mln) 5.3 4.7 4.3Population, rural (mln) 2.4 2.2 2Govt expenditure on ag (% total outlays) 2 0.5Area harvested (mln ha) 0 0Cropping intensity ratio 0.2Water resources (1 000 m3/person/year) 12 13 15Area equipped for irrigation (1 000 ha) 433Area irrigated (% area equipped for irrigation) 63Employment in agriculture (%) 52.1 53.4Employment in agriculture, female (%) 57.5 56.6Fertilizers, Nitrogen (kg of nutrients per ha) 13.9 33.6Fertilizers, Phosphate (kg of nutrients per ha) 0.5 9.4Fertilizers, Potash (kg nutrients per ha) 0 2Energy consump, power irrigation (mln kWh) 0 171 68Agr value added per worker (constant US$) 2 680 1 652 2 997Hunger dimensionsDietary energy supply (kcal/pc/day) 1 928 2 573 2 875Average dietary energy supply adequacy (%) 79 104 116Dietary en supp, cereals/roots/tubers (%) 64 61 58Prevalence of undernourishment (%) 56.5 14.8 7.4GDP per capita (US$, PPP) 8 018 3 269 6 930Domestic food price volatility (index)Cereal import dependency ratio (%) 57.9 58.4 68.6Underweight, children under-5 (%) 2.7 1.1Improved water source (% pop) 85 89.2 98.7Food supplyFood production value, (2004-2006 mln I$) 893 866 775Agriculture, value added (% GDP) 32 22 9Food exports (mln US$) 21 48 260Food imports (mln US$) 200 214 961Production indices (2004-06=100)Net food 100 97 87Net crops 135 100 100Cereals 71 71 90Vegetable oils 13 10 33Roots and tubers 97 81 106Fruit and vegetables 146 107 94SugarLivestock 74 95 74Milk 53 84 85Meat 97 108 56Fish 855 15 103Net trade (mln US$)Cereals -137 -145 -272Fruit and vegetables 6 19 13Meat -22 -12 -140Dairy products -3 8 -36Fish 0 -1 -39EnvironmentForest area (%) 40 40 39Renewable water res withdrawn (% of total) 58Terrestrial protect areas (% total land area) 3 4 4Organic area (% total agricultural area) 0Water withdrawal by agriculture (% of total) 58Biofuel production (thousand kt of oil eq.) 0 0Wood pellet prod. (1 000 tonnes)Net GHG emissions from AFOLU (CO2 eq, Mt) -1 -1 -1
111

Germany
1990 2000 2014
The settingPopulation, total (mln) 80.5 83.5 82.7Population, rural (mln) 21.6 22.5 21.2Govt expenditure on ag (% total outlays)Area harvested (mln ha) 38 45 48Cropping intensity ratio 2.1 2.7Water resources (1 000 m3/person/year) 2 2 2Area equipped for irrigation (1 000 ha) 650Area irrigated (% area equipped for irrigation) 45.5Employment in agriculture (%) 3.5 2.6 1.5Employment in agriculture, female (%) 3.4 2.1 1.1Fertilizers, Nitrogen (kg of nutrients per ha) 154.5 139.3Fertilizers, Phosphate (kg of nutrients per ha) 24 24Fertilizers, Potash (kg nutrients per ha) 41.1 35.6Energy consump, power irrigation (mln kWh) 2 4 974Agr value added per worker (constant US$) 19 540 21 233 39 490Hunger dimensionsDietary energy supply (kcal/pc/day)Average dietary energy supply adequacy (%) 131 131 139Dietary en supp, cereals/roots/tubers (%) 26 28 28Prevalence of undernourishment (%) <5.0 <5.0 <5.0GDP per capita (US$, PPP) 31 476 36 953 42 884Domestic food price volatility (index) 5.6 6.5Cereal import dependency ratio (%) -19.1 -24 -9.2Underweight, children under-5 (%) 1.1Improved water source (% pop) 100 100 100Food supplyFood production value, (2004-2006 mln I$) 34 013 32 193 33 635Agriculture, value added (% GDP) 1 1 1Food exports (mln US$) 14 211 16 288 54 646Food imports (mln US$) 26 636 23 074 63 113Production indices (2004-06=100)Net food 109 103 107Net crops 93 107 98Cereals 76 95 102Vegetable oils 41 70 110Roots and tubers 125 119 83Fruit and vegetables 129 148 94Sugar 125 114 94Livestock 115 99 110Milk 111 100 110Meat 118 96 111Fish 121 83 79Net trade (mln US$)Cereals -21 1 832 3 535Fruit and vegetables -9 355 -7 134 -13 940Meat -1 613 -1 497 3 092Dairy products 664 1 494 3 109Fish -1 234 -1 160 -2 549EnvironmentForest area (%) 31 32 32Renewable water res withdrawn (% of total) 0Terrestrial protect areas (% total land area) 35 42 48Organic area (% total agricultural area) 6Water withdrawal by agriculture (% of total) 0Biofuel production (thousand kt of oil eq.) 24 30 77 610Wood pellet prod. (1 000 tonnes) 2 078Net GHG emissions from AFOLU (CO2 eq, Mt) 28 -3 -19
112

Ghana
1990 2000 2014
The settingPopulation, total (mln) 14.6 18.8 26.4Population, rural (mln) 9.3 10.6 12.2Govt expenditure on ag (% total outlays) 1.5Area harvested (mln ha) 4 13 23Cropping intensity ratio 0.3 0.9Water resources (1 000 m3/person/year) 4 3 2Area equipped for irrigation (1 000 ha) 34Area irrigated (% area equipped for irrigation) 90.3Employment in agriculture (%) 62 55 41.5Employment in agriculture, female (%) 58.7 50.3 37.7Fertilizers, Nitrogen (kg of nutrients per ha) 2 9Fertilizers, Phosphate (kg of nutrients per ha) 0.7 15.1Fertilizers, Potash (kg nutrients per ha) 4.1 10.8Energy consump, power irrigation (mln kWh) 0 15 15Agr value added per worker (constant US$) 752Hunger dimensionsDietary energy supply (kcal/pc/day) 1 983 2 504 3 367Average dietary energy supply adequacy (%) 91 113 150Dietary en supp, cereals/roots/tubers (%) 70 69 66Prevalence of undernourishment (%) 47.3 17.5 <5.0GDP per capita (US$, PPP) 1 892 2 240 3 864Domestic food price volatility (index) 9.8 12.9Cereal import dependency ratio (%) 24.1 23.4 26.1Underweight, children under-5 (%) 25.1 18.8 13.4Improved water source (% pop) 54.4 70.8 87.2Food supplyFood production value, (2004-2006 mln I$) 1 941 4 121 7 581Agriculture, value added (% GDP) 45 39 21Food exports (mln US$) 403 507 2 514Food imports (mln US$) 156 274 1 396Production indices (2004-06=100)Net food 37 78 144Net crops 34 77 144Cereals 42 91 151Vegetable oils 51 71 98Roots and tubers 28 86 156Fruit and vegetables 41 79 152Sugar 79 100 107Livestock 78 92 136Milk 58 94 114Meat 82 93 135Fish 100 115 83Net trade (mln US$)Cereals -75 -120 -528Fruit and vegetables 3 21 96Meat -18 -253Dairy products -9 -24 -76Fish 10 -5 -214EnvironmentForest area (%) 33 27 21Renewable water res withdrawn (% of total) 66Terrestrial protect areas (% total land area) 15 15 15Organic area (% total agricultural area) 0Water withdrawal by agriculture (% of total) 66Biofuel production (thousand kt of oil eq.) 0 0Wood pellet prod. (1 000 tonnes)Net GHG emissions from AFOLU (CO2 eq, Mt) 43 46 40
113

Greece
1990 2000 2014
The settingPopulation, total (mln) 10.2 11 11.1Population, rural (mln) 4.2 4.4 4.2Govt expenditure on ag (% total outlays)Area harvested (mln ha) 4 5 5Cropping intensity ratio 0.5 0.6Water resources (1 000 m3/person/year) 7 6 6Area equipped for irrigation (1 000 ha) 1 555Area irrigated (% area equipped for irrigation) 82.3Employment in agriculture (%) 23.9 17.4 13Employment in agriculture, female (%) 30.3 19.6 12.9Fertilizers, Nitrogen (kg of nutrients per ha) 105 55.1Fertilizers, Phosphate (kg of nutrients per ha) 40.2 35.6Fertilizers, Potash (kg nutrients per ha) 16.9 10Energy consump, power irrigation (mln kWh)Agr value added per worker (constant US$) 12 580 13 670Hunger dimensionsDietary energy supply (kcal/pc/day)Average dietary energy supply adequacy (%) 142 143 134Dietary en supp, cereals/roots/tubers (%) 33 32 30Prevalence of undernourishment (%) <5.0 <5.0 <5.0GDP per capita (US$, PPP) 21 085 25 030 24 305Domestic food price volatility (index) 10.2 14Cereal import dependency ratio (%) -17.6 17.2 16.7Underweight, children under-5 (%)Improved water source (% pop) 96.2 98.9 99.8Food supplyFood production value, (2004-2006 mln I$) 6 393 7 850 6 481Agriculture, value added (% GDP) 6 4Food exports (mln US$) 1 823 1 647 4 293Food imports (mln US$) 2 278 2 268 5 644Production indices (2004-06=100)Net food 87 106 88Net crops 80 110 84Cereals 88 100 92Vegetable oils 44 105 87Roots and tubers 104 114 89Fruit and vegetables 102 112 89Sugar 122 134 15Livestock 100 93 91Milk 88 98 90Meat 109 88 91Fish 71 97 104Net trade (mln US$)Cereals -74 -211 -388Fruit and vegetables 938 733 1 480Meat -837 -654 -1 399Dairy products -433 -333 -471Fish -107 -48 152EnvironmentForest area (%) 26 28 31Renewable water res withdrawn (% of total) 89Terrestrial protect areas (% total land area) 9 22 35Organic area (% total agricultural area) 6Water withdrawal by agriculture (% of total) 89Biofuel production (thousand kt of oil eq.) 0 3 361Wood pellet prod. (1 000 tonnes) 0Net GHG emissions from AFOLU (CO2 eq, Mt) 11 8 6
114

Guatemala
1990 2000 2014
The settingPopulation, total (mln) 8.9 11.2 15.9Population, rural (mln) 5.2 6.1 7.8Govt expenditure on ag (% total outlays) 3.3 2.1Area harvested (mln ha) 10 17 26Cropping intensity ratio 2.2 3.7Water resources (1 000 m3/person/year) 14 11 8Area equipped for irrigation (1 000 ha) 338Area irrigated (% area equipped for irrigation) 100Employment in agriculture (%) 12.9 39.8 32.3Employment in agriculture, female (%) 3.2 18.8 12.6Fertilizers, Nitrogen (kg of nutrients per ha) 60.9 116.1Fertilizers, Phosphate (kg of nutrients per ha) 24.1 32.8Fertilizers, Potash (kg nutrients per ha) 6.6 9.7Energy consump, power irrigation (mln kWh) 0 0 246Agr value added per worker (constant US$) 1 477 1 945 2 009Hunger dimensionsDietary energy supply (kcal/pc/day) 2 318 2 174 2 449Average dietary energy supply adequacy (%) 113 106 116Dietary en supp, cereals/roots/tubers (%) 59 53 47Prevalence of undernourishment (%) 14.9 22.1 15.6GDP per capita (US$, PPP) 5 315 6 313 7 062Domestic food price volatility (index) 8 5.7Cereal import dependency ratio (%) 24.4 40 44.3Underweight, children under-5 (%) 19.6 13Improved water source (% pop) 81.4 87.4 93.8Food supplyFood production value, (2004-2006 mln I$) 1 615 2 327 4 330Agriculture, value added (% GDP) 14 11Food exports (mln US$) 388 833 3 101Food imports (mln US$) 145 485 1 749Production indices (2004-06=100)Net food 56 81 151Net crops 60 88 154Cereals 121 98 150Vegetable oils 26 62 327Roots and tubers 40 52 123Fruit and vegetables 46 84 169Sugar 52 89 142Livestock 60 73 121Milk 61 65 120Meat 67 86 120Fish 31 171 153Net trade (mln US$)Cereals -46 -74 -589Fruit and vegetables 102 288 1 003Meat 26 -27 -88Dairy products -20 -61 -162Fish 10 27 20EnvironmentForest area (%) 44 39 33Renewable water res withdrawn (% of total) 57Terrestrial protect areas (% total land area) 26 30 31Organic area (% total agricultural area) 0Water withdrawal by agriculture (% of total) 57Biofuel production (thousand kt of oil eq.) 24 42 109Wood pellet prod. (1 000 tonnes)Net GHG emissions from AFOLU (CO2 eq, Mt) 22 23 24
115

Guinea
1990 2000 2014
The settingPopulation, total (mln) 6 8.7 12Population, rural (mln) 4.3 6 7.6Govt expenditure on ag (% total outlays)Area harvested (mln ha) 1 2 3Cropping intensity ratio 0.1 0.1Water resources (1 000 m3/person/year) 38 26 19Area equipped for irrigation (1 000 ha) 95Area irrigated (% area equipped for irrigation) 100Employment in agriculture (%) 76Employment in agriculture, female (%) 78.8Fertilizers, Nitrogen (kg of nutrients per ha) 0.7 2.1Fertilizers, Phosphate (kg of nutrients per ha) 0.1 0.6Fertilizers, Potash (kg nutrients per ha) 0 0.7Energy consump, power irrigation (mln kWh) 0 4 1Agr value added per worker (constant US$) 150 165 215Hunger dimensionsDietary energy supply (kcal/pc/day) 2 434 2 346 2 619Average dietary energy supply adequacy (%) 113 108 118Dietary en supp, cereals/roots/tubers (%) 62 62 62Prevalence of undernourishment (%) 23.2 27.2 16.4GDP per capita (US$, PPP) 1 128 1 139 1 213Domestic food price volatility (index) 13.2 7.3Cereal import dependency ratio (%) 27.4 20.4 13.8Underweight, children under-5 (%) 29.1 16.3Improved water source (% pop) 52.4 62.7 74.8Food supplyFood production value, (2004-2006 mln I$) 956 1 346 1 988Agriculture, value added (% GDP) 24 22 20Food exports (mln US$) 18 17 58Food imports (mln US$) 104 123 490Production indices (2004-06=100)Net food 59 84 124Net crops 60 85 121Cereals 49 82 156Vegetable oils 51 85 97Roots and tubers 70 96 117Fruit and vegetables 72 84 102Sugar 80 96 107Livestock 43 78 132Milk 47 78 131Meat 43 79 132Fish 42 88 122Net trade (mln US$)Cereals -51 -56 -224Fruit and vegetables -3 -7 -19Meat -3 -22Dairy products -8 -41Fish -6 4 4EnvironmentForest area (%) 30 28 26Renewable water res withdrawn (% of total) 53Terrestrial protect areas (% total land area) 7 7 28Organic area (% total agricultural area)Water withdrawal by agriculture (% of total) 53Biofuel production (thousand kt of oil eq.) 1 1 1Wood pellet prod. (1 000 tonnes)Net GHG emissions from AFOLU (CO2 eq, Mt) 19 21 25
116
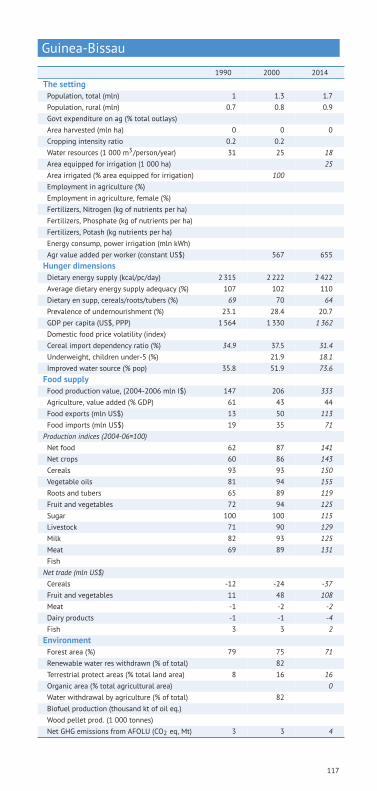
Guinea-Bissau
1990 2000 2014
The settingPopulation, total (mln) 1 1.3 1.7Population, rural (mln) 0.7 0.8 0.9Govt expenditure on ag (% total outlays)Area harvested (mln ha) 0 0 0Cropping intensity ratio 0.2 0.2Water resources (1 000 m3/person/year) 31 25 18Area equipped for irrigation (1 000 ha) 25Area irrigated (% area equipped for irrigation) 100Employment in agriculture (%)Employment in agriculture, female (%)Fertilizers, Nitrogen (kg of nutrients per ha)Fertilizers, Phosphate (kg of nutrients per ha)Fertilizers, Potash (kg nutrients per ha)Energy consump, power irrigation (mln kWh)Agr value added per worker (constant US$) 567 655Hunger dimensionsDietary energy supply (kcal/pc/day) 2 315 2 222 2 422Average dietary energy supply adequacy (%) 107 102 110Dietary en supp, cereals/roots/tubers (%) 69 70 64Prevalence of undernourishment (%) 23.1 28.4 20.7GDP per capita (US$, PPP) 1 564 1 330 1 362Domestic food price volatility (index)Cereal import dependency ratio (%) 34.9 37.5 31.4Underweight, children under-5 (%) 21.9 18.1Improved water source (% pop) 35.8 51.9 73.6Food supplyFood production value, (2004-2006 mln I$) 147 206 333Agriculture, value added (% GDP) 61 43 44Food exports (mln US$) 13 50 113Food imports (mln US$) 19 35 71Production indices (2004-06=100)Net food 62 87 141Net crops 60 86 143Cereals 93 93 150Vegetable oils 81 94 155Roots and tubers 65 89 119Fruit and vegetables 72 94 125Sugar 100 100 115Livestock 71 90 129Milk 82 93 125Meat 69 89 131FishNet trade (mln US$)Cereals -12 -24 -37Fruit and vegetables 11 48 108Meat -1 -2 -2Dairy products -1 -1 -4Fish 3 3 2EnvironmentForest area (%) 79 75 71Renewable water res withdrawn (% of total) 82Terrestrial protect areas (% total land area) 8 16 16Organic area (% total agricultural area) 0Water withdrawal by agriculture (% of total) 82Biofuel production (thousand kt of oil eq.)Wood pellet prod. (1 000 tonnes)Net GHG emissions from AFOLU (CO2 eq, Mt) 3 3 4
117

Guyana
1990 2000 2014
The settingPopulation, total (mln) 0.7 0.7 0.8Population, rural (mln) 0.5 0.5 0.6Govt expenditure on ag (% total outlays)Area harvested (mln ha) 3 3 2Cropping intensity ratio 1.6 1.6Water resources (1 000 m3/person/year) 374 364 339Area equipped for irrigation (1 000 ha) 143Area irrigated (% area equipped for irrigation) 89.2Employment in agriculture (%) 21.4Employment in agriculture, female (%) 7.1Fertilizers, Nitrogen (kg of nutrients per ha) 21.4 20.3Fertilizers, Phosphate (kg of nutrients per ha) 1.6 3.8Fertilizers, Potash (kg nutrients per ha) 0.1 1.4Energy consump, power irrigation (mln kWh) 0 0 0Agr value added per worker (constant US$) 2 525 4 504 5 035Hunger dimensionsDietary energy supply (kcal/pc/day) 2 380 2 722 2 772Average dietary energy supply adequacy (%) 103 118 118Dietary en supp, cereals/roots/tubers (%) 55 49 50Prevalence of undernourishment (%) 22.8 10.4 10.6GDP per capita (US$, PPP) 3 231 5 071 6 336Domestic food price volatility (index)Cereal import dependency ratio (%) -65.9 -74.1 -21.2Underweight, children under-5 (%) 16.1 11.9 11.1Improved water source (% pop) 77.1 86.2 97.6Food supplyFood production value, (2004-2006 mln I$) 156 308 410Agriculture, value added (% GDP) 38 31 18Food exports (mln US$) 97 171 387Food imports (mln US$) 32 65 202Production indices (2004-06=100)Net food 49 97 130Net crops 59 101 129Cereals 34 98 179Vegetable oils 53 111 90Roots and tubers 60 149 75Fruit and vegetables 85 191 137Sugar 83 84 76Livestock 37 68 126Milk 52 85 125Meat 30 61 126Fish 67 90 90Net trade (mln US$)Cereals 2 23 125Fruit and vegetables -3 -6 -17Meat -1 -8 -8Dairy products -3 -14 -41Fish 27 49 74EnvironmentForest area (%) 77 77 77Renewable water res withdrawn (% of total) 94Terrestrial protect areas (% total land area) 0 2 5Organic area (% total agricultural area) 0Water withdrawal by agriculture (% of total) 94Biofuel production (thousand kt of oil eq.) 3 7 7Wood pellet prod. (1 000 tonnes)Net GHG emissions from AFOLU (CO2 eq, Mt) 5 5 6
118

Haiti
1990 2000 2014
The settingPopulation, total (mln) 7.1 8.6 10.5Population, rural (mln) 5.1 5.5 4.5Govt expenditure on ag (% total outlays)Area harvested (mln ha) 2 1 2Cropping intensity ratio 0.9 0.6Water resources (1 000 m3/person/year) 2 2 1Area equipped for irrigation (1 000 ha) 97Area irrigated (% area equipped for irrigation) 82Employment in agriculture (%) 65.6 50.5Employment in agriculture, female (%) 49.6 37.3Fertilizers, Nitrogen (kg of nutrients per ha)Fertilizers, Phosphate (kg of nutrients per ha)Fertilizers, Potash (kg nutrients per ha)Energy consump, power irrigation (mln kWh) 0 0 0Agr value added per worker (constant US$)Hunger dimensionsDietary energy supply (kcal/pc/day) 1 742 1 937 2 015Average dietary energy supply adequacy (%) 80 87 87Dietary en supp, cereals/roots/tubers (%) 58 53 53Prevalence of undernourishment (%) 61.1 55.2 53.4GDP per capita (US$, PPP) 1 734 1 648Domestic food price volatility (index) 9.2 5.9Cereal import dependency ratio (%) 48.1 58 51.8Underweight, children under-5 (%) 23.7 13.9 11.6Improved water source (% pop) 60.8 60.9 62.4Food supplyFood production value, (2004-2006 mln I$) 852 887 1 092Agriculture, value added (% GDP)Food exports (mln US$) 12 16 18Food imports (mln US$) 187 301 911Production indices (2004-06=100)Net food 94 98 121Net crops 105 99 122Cereals 95 110 153Vegetable oils 134 92 98Roots and tubers 87 90 181Fruit and vegetables 107 106 90Sugar 142 76 113Livestock 60 93 107Milk 80 93 132Meat 56 92 104Fish 47 67 157Net trade (mln US$)Cereals -94 -123Fruit and vegetables -2 -9 -35Meat -4 -19 -103Dairy products -27 -76Fish -3 -2 -24EnvironmentForest area (%) 4 4 4Renewable water res withdrawn (% of total) 83Terrestrial protect areas (% total land area) 0 0 0Organic area (% total agricultural area) 0Water withdrawal by agriculture (% of total) 83Biofuel production (thousand kt of oil eq.) 4 3 0Wood pellet prod. (1 000 tonnes)Net GHG emissions from AFOLU (CO2 eq, Mt) 3 4 4
119

Honduras
1990 2000 2014
The settingPopulation, total (mln) 4.9 6.2 8.3Population, rural (mln) 2.9 3.4 3.8Govt expenditure on ag (% total outlays)Area harvested (mln ha) 3 4 6Cropping intensity ratio 0.9 1.4Water resources (1 000 m3/person/year) 19 15 11Area equipped for irrigation (1 000 ha) 90Area irrigated (% area equipped for irrigation) 92.9Employment in agriculture (%) 50.1 37.4 35.3Employment in agriculture, female (%) 5.8 8.7 9.4Fertilizers, Nitrogen (kg of nutrients per ha) 48.4 72.3Fertilizers, Phosphate (kg of nutrients per ha) 5.9 5Fertilizers, Potash (kg nutrients per ha) 0.6 5.9Energy consump, power irrigation (mln kWh) 0 0 0Agr value added per worker (constant US$) 1 222 1 434 2 647Hunger dimensionsDietary energy supply (kcal/pc/day) 2 303 2 406 2 726Average dietary energy supply adequacy (%) 110 114 122Dietary en supp, cereals/roots/tubers (%) 50 48 47Prevalence of undernourishment (%) 23 19 12.2GDP per capita (US$, PPP) 3 205 3 483 4 445Domestic food price volatility (index) 21.6 3.7Cereal import dependency ratio (%) 25.2 44.9 56.5Underweight, children under-5 (%) 15.8 12.5 7.1Improved water source (% pop) 72.8 80.8 89.6Food supplyFood production value, (2004-2006 mln I$) 984 1 054 1 755Agriculture, value added (% GDP) 22 16 14Food exports (mln US$) 456 226 923Food imports (mln US$) 83 323 1 083Production indices (2004-06=100)Net food 66 71 119Net crops 72 69 126Cereals 125 106 126Vegetable oils 35 43 189Roots and tubers 60 76 126Fruit and vegetables 81 53 114Sugar 52 72 110Livestock 52 78 110Milk 51 83 101Meat 51 73 114Fish 31 44 126Net trade (mln US$)Cereals -32 -113 -411Fruit and vegetables 399 136 263Meat 26 -21 -38Dairy products -10 -37 -41Fish 29 173 241EnvironmentForest area (%) 73 57 44Renewable water res withdrawn (% of total) 73Terrestrial protect areas (% total land area) 16 21 21Organic area (% total agricultural area) 1Water withdrawal by agriculture (% of total) 73Biofuel production (thousand kt of oil eq.) 5 8 23Wood pellet prod. (1 000 tonnes) 4Net GHG emissions from AFOLU (CO2 eq, Mt) 45 46 34
120

Hungary
1990 2000 2014
The settingPopulation, total (mln) 10.4 10.2 9.9Population, rural (mln) 3.5 3.6 2.9Govt expenditure on ag (% total outlays)Area harvested (mln ha) 13 10 14Cropping intensity ratio 1.9 1.7Water resources (1 000 m3/person/year) 10 10 10Area equipped for irrigation (1 000 ha) 172Area irrigated (% area equipped for irrigation) 62.2Employment in agriculture (%) 18.2 6.5 5.2Employment in agriculture, female (%) 15 3.6 2.9Fertilizers, Nitrogen (kg of nutrients per ha) 62.9 68.8Fertilizers, Phosphate (kg of nutrients per ha) 14.6 14.1Fertilizers, Potash (kg nutrients per ha) 18.1 14.2Energy consump, power irrigation (mln kWh) 5 7 235Agr value added per worker (constant US$) 6 603 11 505Hunger dimensionsDietary energy supply (kcal/pc/day)Average dietary energy supply adequacy (%) 132 122 109Dietary en supp, cereals/roots/tubers (%) 28 29 30Prevalence of undernourishment (%) <5.0 <5.0 <5.0GDP per capita (US$, PPP) 14 408 17 707 22 707Domestic food price volatility (index) 6.9 7Cereal import dependency ratio (%) -20.1 -28.4 -81.1Underweight, children under-5 (%)Improved water source (% pop) 95.7 99 100Food supplyFood production value, (2004-2006 mln I$) 7 118 5 334 5 189Agriculture, value added (% GDP) 6 4Food exports (mln US$) 1 991 1 820 7 988Food imports (mln US$) 312 522 3 590Production indices (2004-06=100)Net food 122 91 89Net crops 101 76 87Cereals 79 63 86Vegetable oils 57 46 134Roots and tubers 170 130 66Fruit and vegetables 135 104 84Sugar 150 62 30Livestock 169 121 88Milk 150 114 93Meat 181 128 86Fish 160 94 101Net trade (mln US$)Cereals 106 220 1 593Fruit and vegetables 374 216 288Meat 819 525 760Dairy products 85 37 -39Fish -37 -34 -60EnvironmentForest area (%) 20 21 23Renewable water res withdrawn (% of total) 6Terrestrial protect areas (% total land area) 6 7 23Organic area (% total agricultural area) 2Water withdrawal by agriculture (% of total) 6Biofuel production (thousand kt of oil eq.) 0 3 843Wood pellet prod. (1 000 tonnes) 4Net GHG emissions from AFOLU (CO2 eq, Mt) 16 11 10
121

Iceland
1990 2000 2014
The settingPopulation, total (mln) 0.3 0.3 0.3Population, rural (mln) 0 0 0Govt expenditure on ag (% total outlays)Area harvested (mln ha) 1 3 0Cropping intensity ratio 0.6 1.5Water resources (1 000 m3/person/year) 667 605 515Area equipped for irrigation (1 000 ha)Area irrigated (% area equipped for irrigation)Employment in agriculture (%) 9.2 8.3 5.5Employment in agriculture, female (%) 3.3 4.4 2.1Fertilizers, Nitrogen (kg of nutrients per ha) 80.2 77.8Fertilizers, Phosphate (kg of nutrients per ha) 26.3 58Fertilizers, Potash (kg nutrients per ha) 16.4 40.7Energy consump, power irrigation (mln kWh)Agr value added per worker (constant US$) 60 555 74 231Hunger dimensionsDietary energy supply (kcal/pc/day)Average dietary energy supply adequacy (%) 124 125 131Dietary en supp, cereals/roots/tubers (%) 26 24 23Prevalence of undernourishment (%) <5.0 <5.0 <5.0GDP per capita (US$, PPP) 28 658 33 590 40 789Domestic food price volatility (index) 6.1 4.6Cereal import dependency ratio (%)Underweight, children under-5 (%)Improved water source (% pop) 100 100 100Food supplyFood production value, (2004-2006 mln I$) 83 91 110Agriculture, value added (% GDP) 8 7Food exports (mln US$) 13 11 50Food imports (mln US$) 95 122 292Production indices (2004-06=100)Net food 86 95 114Net crops 41 77 79CerealsVegetable oilsRoots and tubers 55 72 44Fruit and vegetables 24 84 120SugarLivestock 89 96 115Milk 100 92 109Meat 80 98 120Fish 95 125 87Net trade (mln US$)Cereals -25 -36 -80Fruit and vegetables -33 -38 -96Meat 10 4 20Dairy products 0 -1 5Fish 1 223 1 162 2 093EnvironmentForest area (%) 0 0 0Renewable water res withdrawn (% of total) 42Terrestrial protect areas (% total land area) 10 10 20Organic area (% total agricultural area) 1Water withdrawal by agriculture (% of total) 42Biofuel production (thousand kt of oil eq.) 0Wood pellet prod. (1 000 tonnes) 0Net GHG emissions from AFOLU (CO2 eq, Mt) 1 0 0
122

India
1990 2000 2014
The settingPopulation, total (mln) 868.9 1 042.3 1 267.4Population, rural (mln) 646.9 753.9 857.1Govt expenditure on ag (% total outlays) 4.1 6.5Area harvested (mln ha) 226 299 341Cropping intensity ratio 1.2 1.7Water resources (1 000 m3/person/year) 2 2 2Area equipped for irrigation (1 000 ha) 66 700Area irrigated (% area equipped for irrigation) 93.9Employment in agriculture (%) 59.9 47.2Employment in agriculture, female (%) 74.8 59.8Fertilizers, Nitrogen (kg of nutrients per ha) 69.3 107.9Fertilizers, Phosphate (kg of nutrients per ha) 25.9 43.1Fertilizers, Potash (kg nutrients per ha) 10 12.7Energy consump, power irrigation (mln kWh) 2 1 859 4 881Agr value added per worker (constant US$) 459 528 689Hunger dimensionsDietary energy supply (kcal/pc/day) 2 279 2 370 2 469Average dietary energy supply adequacy (%) 105 107 108Dietary en supp, cereals/roots/tubers (%) 66 63 59Prevalence of undernourishment (%) 23.7 17 15.2GDP per capita (US$, PPP) 1 777 2 548 5 244Domestic food price volatility (index) 3.9 6.4Cereal import dependency ratio (%) -0.2 -1.4 -3.1Underweight, children under-5 (%) 50.7 44.4 43.5Improved water source (% pop) 70.3 80.6 92.6Food supplyFood production value, (2004-2006 mln I$) 119 804 156 265 236 540Agriculture, value added (% GDP) 29 23 17Food exports (mln US$) 1 013 2 826 20 835Food imports (mln US$) 758 2 062 16 523Production indices (2004-06=100)Net food 70 92 139Net crops 73 92 142Cereals 82 98 123Vegetable oils 78 81 134Roots and tubers 55 88 152Fruit and vegetables 61 89 163Sugar 90 119 136Livestock 61 85 135Milk 56 83 141Meat 77 90 117Fish 57 85 139Net trade (mln US$)Cereals 191 803 9 154Fruit and vegetables -34 434 -1 551Meat 79 325 3 145Dairy products -1 12 56Fish 467 1 402 3 326EnvironmentForest area (%) 22 22 23Renewable water res withdrawn (% of total) 90Terrestrial protect areas (% total land area) 5 5 5Organic area (% total agricultural area) 0Water withdrawal by agriculture (% of total) 90Biofuel production (thousand kt of oil eq.) 304 510 2 505Wood pellet prod. (1 000 tonnes)Net GHG emissions from AFOLU (CO2 eq, Mt) 476 505 532
123

Indonesia
1990 2000 2014
The settingPopulation, total (mln) 178.6 208.9 252.8Population, rural (mln) 124 121.2 118.8Govt expenditure on ag (% total outlays) 3 0.9Area harvested (mln ha) 52 62 120Cropping intensity ratio 1.2 1.3Water resources (1 000 m3/person/year) 11 10 8Area equipped for irrigation (1 000 ha) 6 722Area irrigated (% area equipped for irrigation)Employment in agriculture (%) 55.9 45.3 35.1Employment in agriculture, female (%) 56.3 46.7 34.5Fertilizers, Nitrogen (kg of nutrients per ha) 94.6 125.4Fertilizers, Phosphate (kg of nutrients per ha) 23.5 29Fertilizers, Potash (kg nutrients per ha) 13 40.4Energy consump, power irrigation (mln kWh) 0 0 0Agr value added per worker (constant US$) 613 662 1 079Hunger dimensionsDietary energy supply (kcal/pc/day) 2 370 2 442 2 776Average dietary energy supply adequacy (%) 107 108 121Dietary en supp, cereals/roots/tubers (%) 72 72 70Prevalence of undernourishment (%) 19.7 17.2 7.6GDP per capita (US$, PPP) 4 295 5 552 9 254Domestic food price volatility (index) 12.5 12.9Cereal import dependency ratio (%) 8.4 13.4 12.7Underweight, children under-5 (%) 29.8 24.8 19.9Improved water source (% pop) 69.7 77.7 84.9Food supplyFood production value, (2004-2006 mln I$) 27 270 34 289 60 205Agriculture, value added (% GDP) 19 16 14Food exports (mln US$) 922 2 984 24 711Food imports (mln US$) 828 2 583 11 598Production indices (2004-06=100)Net food 62 78 137Net crops 62 79 137Cereals 81 94 134Vegetable oils 23 55 194Roots and tubers 81 84 121Fruit and vegetables 42 65 116Sugar 99 84 119Livestock 63 74 140Milk 68 89 156Meat 67 74 139Fish 51 83 169Net trade (mln US$)Cereals -289 -1 026 -3 708Fruit and vegetables 188 54 -732Meat 3 -62 -158Dairy products -55 -180 -1 002Fish 936 1 489 3 228EnvironmentForest area (%) 65 55 51Renewable water res withdrawn (% of total) 82Terrestrial protect areas (% total land area) 10 14 15Organic area (% total agricultural area) 0Water withdrawal by agriculture (% of total) 82Biofuel production (thousand kt of oil eq.) 59 42 510Wood pellet prod. (1 000 tonnes) 80Net GHG emissions from AFOLU (CO2 eq, Mt) 760 951 1 383
124

Iran (Islamic Republic of)
1990 2000 2014
The settingPopulation, total (mln) 56.4 65.9 78.5Population, rural (mln) 24.6 23.7 23.9Govt expenditure on ag (% total outlays) 3 1.4Area harvested (mln ha) 14 13 22Cropping intensity ratio 0.2 0.2Water resources (1 000 m3/person/year) 2 2 2Area equipped for irrigation (1 000 ha) 9 553Area irrigated (% area equipped for irrigation) 77.4Employment in agriculture (%) 23 21.2Employment in agriculture, female (%) 16.7 30.6Fertilizers, Nitrogen (kg of nutrients per ha) 52.5 17.6Fertilizers, Phosphate (kg of nutrients per ha) 21.6 7.5Fertilizers, Potash (kg nutrients per ha) 6.3 1.3Energy consump, power irrigation (mln kWh) 2 219 1 688Agr value added per worker (constant US$) 2 122 2 558 3 313Hunger dimensionsDietary energy supply (kcal/pc/day) 2 950 3 045 3 287Average dietary energy supply adequacy (%) 135 130 138Dietary en supp, cereals/roots/tubers (%) 62 60 53Prevalence of undernourishment (%) 5.1 5.2 <5.0GDP per capita (US$, PPP) 8 679 10 694 15 090Domestic food price volatility (index) 15.9 19.9Cereal import dependency ratio (%) 22 40.8 28.7Underweight, children under-5 (%) 9.5Improved water source (% pop) 92.2 94.1 95.9Food supplyFood production value, (2004-2006 mln I$) 12 210 17 582 25 588Agriculture, value added (% GDP) 19 14 10Food exports (mln US$) 345 904 3 970Food imports (mln US$) 2 211 2 484 9 668Production indices (2004-06=100)Net food 54 78 113Net crops 55 76 117Cereals 60 59 103Vegetable oils 45 56 105Roots and tubers 55 80 124Fruit and vegetables 52 83 112Sugar 51 63 92Livestock 53 81 105Milk 56 83 105Meat 53 79 108Fish 51 81 169Net trade (mln US$)Cereals -981 -1 465 -4 387Fruit and vegetables 262 452 1 305Meat -290 -33 -506Dairy products -161 -49 188Fish 37 14 178EnvironmentForest area (%) 7 7 7Renewable water res withdrawn (% of total)Terrestrial protect areas (% total land area) 6 6 7Organic area (% total agricultural area) 0Water withdrawal by agriculture (% of total)Biofuel production (thousand kt of oil eq.) 4 13 1Wood pellet prod. (1 000 tonnes)Net GHG emissions from AFOLU (CO2 eq, Mt) 37 43 38
125

Iraq
1990 2000 2014
The settingPopulation, total (mln) 17.5 23.8 34.8Population, rural (mln) 5.3 7.7 11.7Govt expenditure on ag (% total outlays) 0.4Area harvested (mln ha) 3 3 5Cropping intensity ratio 0.4 0.4Water resources (1 000 m3/person/year) 5 4 3Area equipped for irrigation (1 000 ha) 3 525Area irrigated (% area equipped for irrigation) 54.9Employment in agriculture (%) 23.4Employment in agriculture, female (%) 50.7Fertilizers, Nitrogen (kg of nutrients per ha) 0 41.3Fertilizers, Phosphate (kg of nutrients per ha) 0 14.4Fertilizers, Potash (kg nutrients per ha) 0 0.9Energy consump, power irrigation (mln kWh) 0 19 19Agr value added per worker (constant US$) 3 190 4 968 7 046Hunger dimensionsDietary energy supply (kcal/pc/day) 2 609 2 208 2 568Average dietary energy supply adequacy (%) 125 104 118Dietary en supp, cereals/roots/tubers (%) 62 61 62Prevalence of undernourishment (%) 7.9 24.6 22.8GDP per capita (US$, PPP) 11 212 11 764 14 472Domestic food price volatility (index) 22.7Cereal import dependency ratio (%) 35 73.3 56.8Underweight, children under-5 (%) 10.4 12.9 8.5Improved water source (% pop) 78.3 80.1 85.4Food supplyFood production value, (2004-2006 mln I$) 2 725 2 324 2 917Agriculture, value added (% GDP)Food exports (mln US$) 40 6 57Food imports (mln US$) 1 511 1 831 6 333Production indices (2004-06=100)Net food 118 100 126Net crops 101 91 132Cereals 88 15 205Vegetable oils 95 61 60Roots and tubers 26 71 76Fruit and vegetables 111 117 116Sugar 3 204 895 356Livestock 169 124 127Milk 158 193 97Meat 176 108 143Fish 50 47 147Net trade (mln US$)Cereals -692 -1 244 -2 538Fruit and vegetables -52 -27 -498Meat -149 0 -838Dairy products -152 -135 -195Fish 0 -42EnvironmentForest area (%) 2 2 2Renewable water res withdrawn (% of total) 79Terrestrial protect areas (% total land area) 0 0 0Organic area (% total agricultural area)Water withdrawal by agriculture (% of total) 79Biofuel production (thousand kt of oil eq.) 0 0Wood pellet prod. (1 000 tonnes)Net GHG emissions from AFOLU (CO2 eq, Mt) 6 6 7
126

Ireland
1990 2000 2014
The settingPopulation, total (mln) 3.5 3.8 4.7Population, rural (mln) 1.5 1.6 1.7Govt expenditure on ag (% total outlays)Area harvested (mln ha) 2 3 2Cropping intensity ratio 0.3 0.7Water resources (1 000 m3/person/year) 15 14 11Area equipped for irrigation (1 000 ha)Area irrigated (% area equipped for irrigation) 100Employment in agriculture (%) 12.7 6.5 4.7Employment in agriculture, female (%) 3.6 1.8 1.2Fertilizers, Nitrogen (kg of nutrients per ha) 331 239.3Fertilizers, Phosphate (kg of nutrients per ha) 82.9 65.9Fertilizers, Potash (kg nutrients per ha) 119.9 81.5Energy consump, power irrigation (mln kWh)Agr value added per worker (constant US$) 15 132 7 881Hunger dimensionsDietary energy supply (kcal/pc/day)Average dietary energy supply adequacy (%) 147 149 146Dietary en supp, cereals/roots/tubers (%) 34 31 34Prevalence of undernourishment (%) <5.0 <5.0 <5.0GDP per capita (US$, PPP) 22 468 41 198 44 647Domestic food price volatility (index) 3.8 4.2Cereal import dependency ratio (%) 6.5 21.5 32Underweight, children under-5 (%)Improved water source (% pop) 99.8 99.8 99.9Food supplyFood production value, (2004-2006 mln I$) 4 231 4 614 4 317Agriculture, value added (% GDP) 3 2Food exports (mln US$) 4 410 5 651 9 303Food imports (mln US$) 1 401 2 199 5 985Production indices (2004-06=100)Net food 97 106 99Net crops 91 100 94Cereals 87 98 105Vegetable oils 155 66 379Roots and tubers 127 101 86Fruit and vegetables 72 88 98Sugar 91 112 86Livestock 96 106 100Milk 101 96 104Meat 93 112 96Fish 78 105 90Net trade (mln US$)Cereals 104 622 591Fruit and vegetables -243 -306 -995Meat 1 221 1 361 2 787Dairy products 765 804 1 374Fish 169 196 389EnvironmentForest area (%) 7 9 11Renewable water res withdrawn (% of total) 0Terrestrial protect areas (% total land area) 1 8 14Organic area (% total agricultural area) 1Water withdrawal by agriculture (% of total) 0Biofuel production (thousand kt of oil eq.) 0 5 1 871Wood pellet prod. (1 000 tonnes) 32Net GHG emissions from AFOLU (CO2 eq, Mt) 21 21 19
127

Israel
1990 2000 2014
The settingPopulation, total (mln) 4.5 6 7.8Population, rural (mln) 0.4 0.5 0.6Govt expenditure on ag (% total outlays)Area harvested (mln ha) 2 2 1Cropping intensity ratio 3.5 3Water resources (1 000 m3/person/year) 0 0 0Area equipped for irrigation (1 000 ha) 225Area irrigated (% area equipped for irrigation) 80.7Employment in agriculture (%) 4.1 2.2 1.7Employment in agriculture, female (%) 2.3 0.9 0.7Fertilizers, Nitrogen (kg of nutrients per ha) 150.3 216.4Fertilizers, Phosphate (kg of nutrients per ha) 35.6 40.4Fertilizers, Potash (kg nutrients per ha) 97 108.2Energy consump, power irrigation (mln kWh) 306 555 552Agr value added per worker (constant US$)Hunger dimensionsDietary energy supply (kcal/pc/day)Average dietary energy supply adequacy (%) 150 154 161Dietary en supp, cereals/roots/tubers (%) 37 33 35Prevalence of undernourishment (%) <5.0 <5.0 <5.0GDP per capita (US$, PPP) 17 152 25 739 30 927Domestic food price volatility (index) 10.5 10.2Cereal import dependency ratio (%) 91.1 94.8 93.3Underweight, children under-5 (%)Improved water source (% pop) 100 100 100Food supplyFood production value, (2004-2006 mln I$) 1 859 2 250 2 836Agriculture, value added (% GDP)Food exports (mln US$) 976 754 1 875Food imports (mln US$) 932 1 467 3 810Production indices (2004-06=100)Net food 72 87 110Net crops 96 87 106Cereals 149 64 114Vegetable oils 98 104 105Roots and tubers 36 66 101Fruit and vegetables 97 90 106SugarLivestock 57 87 114Milk 82 101 119Meat 42 81 110Fish 90 99 96Net trade (mln US$)Cereals -322 -465 -1 247Fruit and vegetables 638 286 861Meat -32 -110 -391Dairy products -3 -22 -39Fish -76 -121 -359EnvironmentForest area (%) 6 7 7Renewable water res withdrawn (% of total)Terrestrial protect areas (% total land area) 16 17 17Organic area (% total agricultural area)Water withdrawal by agriculture (% of total)Biofuel production (thousand kt of oil eq.) 0Wood pellet prod. (1 000 tonnes)Net GHG emissions from AFOLU (CO2 eq, Mt) 1 1 1
128
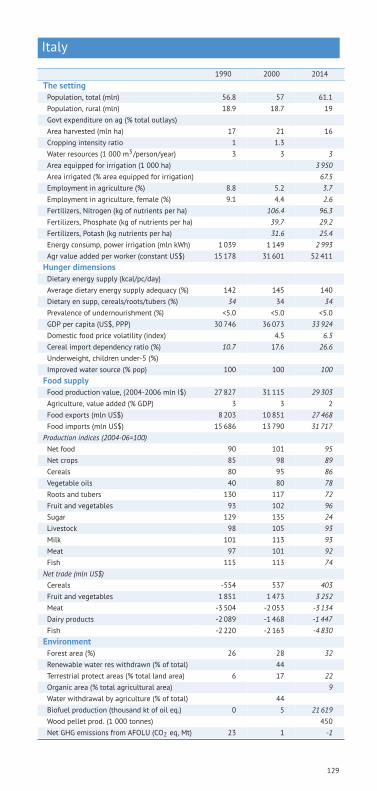
Italy
1990 2000 2014
The settingPopulation, total (mln) 56.8 57 61.1Population, rural (mln) 18.9 18.7 19Govt expenditure on ag (% total outlays)Area harvested (mln ha) 17 21 16Cropping intensity ratio 1 1.3Water resources (1 000 m3/person/year) 3 3 3Area equipped for irrigation (1 000 ha) 3 950Area irrigated (% area equipped for irrigation) 67.5Employment in agriculture (%) 8.8 5.2 3.7Employment in agriculture, female (%) 9.1 4.4 2.6Fertilizers, Nitrogen (kg of nutrients per ha) 106.4 96.3Fertilizers, Phosphate (kg of nutrients per ha) 39.7 29.2Fertilizers, Potash (kg nutrients per ha) 31.6 25.4Energy consump, power irrigation (mln kWh) 1 039 1 149 2 993Agr value added per worker (constant US$) 15 178 31 601 52 411Hunger dimensionsDietary energy supply (kcal/pc/day)Average dietary energy supply adequacy (%) 142 145 140Dietary en supp, cereals/roots/tubers (%) 34 34 34Prevalence of undernourishment (%) <5.0 <5.0 <5.0GDP per capita (US$, PPP) 30 746 36 073 33 924Domestic food price volatility (index) 4.5 6.5Cereal import dependency ratio (%) 10.7 17.6 26.6Underweight, children under-5 (%)Improved water source (% pop) 100 100 100Food supplyFood production value, (2004-2006 mln I$) 27 827 31 115 29 303Agriculture, value added (% GDP) 3 3 2Food exports (mln US$) 8 203 10 851 27 468Food imports (mln US$) 15 686 13 790 31 717Production indices (2004-06=100)Net food 90 101 95Net crops 85 98 89Cereals 80 95 86Vegetable oils 40 80 78Roots and tubers 130 117 72Fruit and vegetables 93 102 96Sugar 129 135 24Livestock 98 105 93Milk 101 113 93Meat 97 101 92Fish 115 113 74Net trade (mln US$)Cereals -554 537 403Fruit and vegetables 1 851 1 473 3 252Meat -3 504 -2 053 -3 134Dairy products -2 089 -1 468 -1 447Fish -2 220 -2 163 -4 830EnvironmentForest area (%) 26 28 32Renewable water res withdrawn (% of total) 44Terrestrial protect areas (% total land area) 6 17 22Organic area (% total agricultural area) 9Water withdrawal by agriculture (% of total) 44Biofuel production (thousand kt of oil eq.) 0 5 21 619Wood pellet prod. (1 000 tonnes) 450Net GHG emissions from AFOLU (CO2 eq, Mt) 23 1 -1
129

Jamaica
1990 2000 2014
The settingPopulation, total (mln) 2.4 2.6 2.8Population, rural (mln) 1.2 1.2 1.3Govt expenditure on ag (% total outlays) 1.6 1.6Area harvested (mln ha) 2 2 1Cropping intensity ratio 5.2 4.2Water resources (1 000 m3/person/year) 4 4 3Area equipped for irrigation (1 000 ha) 25Area irrigated (% area equipped for irrigation) 100Employment in agriculture (%) 24.4 20.8 18.1Employment in agriculture, female (%) 12 9.2 7.9Fertilizers, Nitrogen (kg of nutrients per ha) 72.2 50.5Fertilizers, Phosphate (kg of nutrients per ha) 36.4 30.8Fertilizers, Potash (kg nutrients per ha) 3.5 3.2Energy consump, power irrigation (mln kWh) 0 13 13Agr value added per worker (constant US$) 2 631 2 695 3 725Hunger dimensionsDietary energy supply (kcal/pc/day) 2 615 2 751 2 847Average dietary energy supply adequacy (%) 113 117 118Dietary en supp, cereals/roots/tubers (%) 41 38 40Prevalence of undernourishment (%) 10.4 7.8 8.1GDP per capita (US$, PPP) 7 391 8 139 8 608Domestic food price volatility (index) 5.1 6Cereal import dependency ratio (%) 99.1 99.6 99.5Underweight, children under-5 (%) 8.9 3.8 3.2Improved water source (% pop) 93.4 93.4 93.1Food supplyFood production value, (2004-2006 mln I$) 481 526 563Agriculture, value added (% GDP) 8 7 7Food exports (mln US$) 174 166 234Food imports (mln US$) 216 320 824Production indices (2004-06=100)Net food 91 99 106Net crops 98 104 108Cereals 140 98 166Vegetable oils 31 63 109Roots and tubers 130 118 124Fruit and vegetables 90 109 107Sugar 146 119 82Livestock 80 91 103Milk 106 101 110Meat 70 88 100Fish 82 48 124Net trade (mln US$)Cereals -70 -109 -269Fruit and vegetables 54 17 -35Meat -31 -43 -99Dairy products -28 -22 -38Fish -28 -42 -99EnvironmentForest area (%) 32 31 31Renewable water res withdrawn (% of total) 55Terrestrial protect areas (% total land area) 10 16 16Organic area (% total agricultural area) 0Water withdrawal by agriculture (% of total) 55Biofuel production (thousand kt of oil eq.) 5 5 2Wood pellet prod. (1 000 tonnes)Net GHG emissions from AFOLU (CO2 eq, Mt) 2 2 1
130
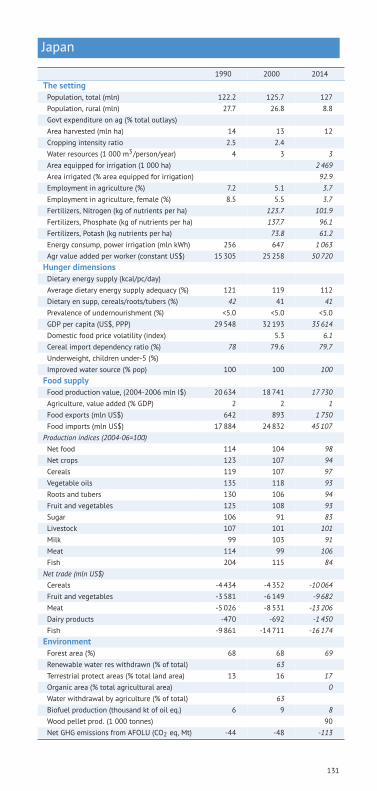
Japan
1990 2000 2014
The settingPopulation, total (mln) 122.2 125.7 127Population, rural (mln) 27.7 26.8 8.8Govt expenditure on ag (% total outlays)Area harvested (mln ha) 14 13 12Cropping intensity ratio 2.5 2.4Water resources (1 000 m3/person/year) 4 3 3Area equipped for irrigation (1 000 ha) 2 469Area irrigated (% area equipped for irrigation) 92.9Employment in agriculture (%) 7.2 5.1 3.7Employment in agriculture, female (%) 8.5 5.5 3.7Fertilizers, Nitrogen (kg of nutrients per ha) 123.7 101.9Fertilizers, Phosphate (kg of nutrients per ha) 137.7 96.1Fertilizers, Potash (kg nutrients per ha) 73.8 61.2Energy consump, power irrigation (mln kWh) 256 647 1 063Agr value added per worker (constant US$) 15 305 25 258 50 720Hunger dimensionsDietary energy supply (kcal/pc/day)Average dietary energy supply adequacy (%) 121 119 112Dietary en supp, cereals/roots/tubers (%) 42 41 41Prevalence of undernourishment (%) <5.0 <5.0 <5.0GDP per capita (US$, PPP) 29 548 32 193 35 614Domestic food price volatility (index) 5.3 6.1Cereal import dependency ratio (%) 78 79.6 79.7Underweight, children under-5 (%)Improved water source (% pop) 100 100 100Food supplyFood production value, (2004-2006 mln I$) 20 634 18 741 17 730Agriculture, value added (% GDP) 2 2 1Food exports (mln US$) 642 893 1 750Food imports (mln US$) 17 884 24 832 45 107Production indices (2004-06=100)Net food 114 104 98Net crops 123 107 94Cereals 119 107 97Vegetable oils 135 118 93Roots and tubers 130 106 94Fruit and vegetables 125 108 93Sugar 106 91 83Livestock 107 101 101Milk 99 103 91Meat 114 99 106Fish 204 115 84Net trade (mln US$)Cereals -4 434 -4 352 -10 064Fruit and vegetables -3 581 -6 149 -9 682Meat -5 026 -8 531 -13 206Dairy products -470 -692 -1 450Fish -9 861 -14 711 -16 174EnvironmentForest area (%) 68 68 69Renewable water res withdrawn (% of total) 63Terrestrial protect areas (% total land area) 13 16 17Organic area (% total agricultural area) 0Water withdrawal by agriculture (% of total) 63Biofuel production (thousand kt of oil eq.) 6 9 8Wood pellet prod. (1 000 tonnes) 90Net GHG emissions from AFOLU (CO2 eq, Mt) -44 -48 -113
131

Jordan
1990 2000 2014
The settingPopulation, total (mln) 3.4 4.8 7.5Population, rural (mln) 0.9 1 1.2Govt expenditure on ag (% total outlays) 1.1 0.7Area harvested (mln ha) 1 1 0Cropping intensity ratio 0.8 0.9Water resources (1 000 m3/person/year) 0 0 0Area equipped for irrigation (1 000 ha) 96Area irrigated (% area equipped for irrigation) 91.3Employment in agriculture (%) 4.9 2Employment in agriculture, female (%) 3.6 0.9Fertilizers, Nitrogen (kg of nutrients per ha) 318.2 144.3Fertilizers, Phosphate (kg of nutrients per ha) 598 121.8Fertilizers, Potash (kg nutrients per ha) 0 994.4Energy consump, power irrigation (mln kWh) 29 106 157Agr value added per worker (constant US$) 2 540 1 858 4 848Hunger dimensionsDietary energy supply (kcal/pc/day) 2 777 2 742 3 154Average dietary energy supply adequacy (%) 128 123 138Dietary en supp, cereals/roots/tubers (%) 48 50 48Prevalence of undernourishment (%) 5.5 7 <5.0GDP per capita (US$, PPP) 7 058 7 695 11 405Domestic food price volatility (index) 8.9 13Cereal import dependency ratio (%) 92.2 97.4 96.2Underweight, children under-5 (%) 4.8 3.6 3Improved water source (% pop) 96.7 96.7 96.1Food supplyFood production value, (2004-2006 mln I$) 557 777 1 315Agriculture, value added (% GDP) 8 2 4Food exports (mln US$) 98 164 1 217Food imports (mln US$) 635 676 3 016Production indices (2004-06=100)Net food 58 81 137Net crops 67 78 131Cereals 198 75 150Vegetable oils 45 96 91Roots and tubers 52 57 63Fruit and vegetables 70 74 144SugarLivestock 44 87 147Milk 34 69 105Meat 42 91 175Fish 40 108 118Net trade (mln US$)Cereals -253 -245 -961Fruit and vegetables 12 15 307Meat -58 -48 -279Dairy products -62 -60 -203Fish -10 -20 -105EnvironmentForest area (%) 1 1 1Renewable water res withdrawn (% of total) 65Terrestrial protect areas (% total land area) 1 2 2Organic area (% total agricultural area) 0Water withdrawal by agriculture (% of total) 65Biofuel production (thousand kt of oil eq.) 0 0Wood pellet prod. (1 000 tonnes)Net GHG emissions from AFOLU (CO2 eq, Mt) 1 1 1
132
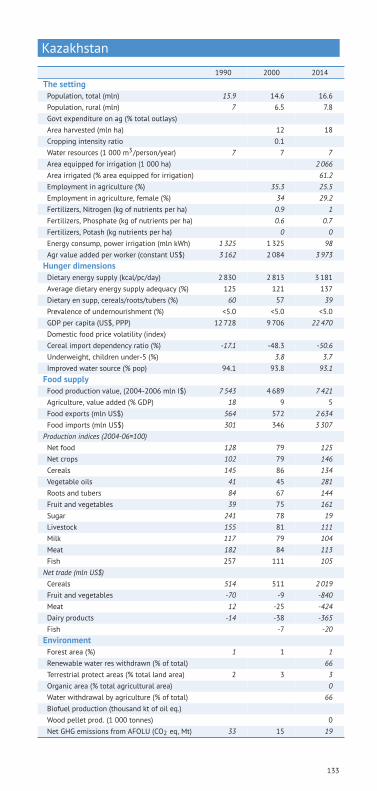
Kazakhstan
1990 2000 2014
The settingPopulation, total (mln) 15.9 14.6 16.6Population, rural (mln) 7 6.5 7.8Govt expenditure on ag (% total outlays)Area harvested (mln ha) 12 18Cropping intensity ratio 0.1Water resources (1 000 m3/person/year) 7 7 7Area equipped for irrigation (1 000 ha) 2 066Area irrigated (% area equipped for irrigation) 61.2Employment in agriculture (%) 35.3 25.5Employment in agriculture, female (%) 34 29.2Fertilizers, Nitrogen (kg of nutrients per ha) 0.9 1Fertilizers, Phosphate (kg of nutrients per ha) 0.6 0.7Fertilizers, Potash (kg nutrients per ha) 0 0Energy consump, power irrigation (mln kWh) 1 325 1 325 98Agr value added per worker (constant US$) 3 162 2 084 3 973Hunger dimensionsDietary energy supply (kcal/pc/day) 2 830 2 813 3 181Average dietary energy supply adequacy (%) 125 121 137Dietary en supp, cereals/roots/tubers (%) 60 57 39Prevalence of undernourishment (%) <5.0 <5.0 <5.0GDP per capita (US$, PPP) 12 728 9 706 22 470Domestic food price volatility (index)Cereal import dependency ratio (%) -17.1 -48.3 -50.6Underweight, children under-5 (%) 3.8 3.7Improved water source (% pop) 94.1 93.8 93.1Food supplyFood production value, (2004-2006 mln I$) 7 543 4 689 7 421Agriculture, value added (% GDP) 18 9 5Food exports (mln US$) 564 572 2 634Food imports (mln US$) 301 346 3 307Production indices (2004-06=100)Net food 128 79 125Net crops 102 79 146Cereals 145 86 134Vegetable oils 41 45 281Roots and tubers 84 67 144Fruit and vegetables 39 75 161Sugar 241 78 19Livestock 155 81 111Milk 117 79 104Meat 182 84 113Fish 257 111 105Net trade (mln US$)Cereals 514 511 2 019Fruit and vegetables -70 -9 -840Meat 12 -25 -424Dairy products -14 -38 -365Fish -7 -20EnvironmentForest area (%) 1 1 1Renewable water res withdrawn (% of total) 66Terrestrial protect areas (% total land area) 2 3 3Organic area (% total agricultural area) 0Water withdrawal by agriculture (% of total) 66Biofuel production (thousand kt of oil eq.)Wood pellet prod. (1 000 tonnes) 0Net GHG emissions from AFOLU (CO2 eq, Mt) 33 15 19
133

Kenya
1990 2000 2014
The settingPopulation, total (mln) 23.4 31.3 45.5Population, rural (mln) 19.5 25.1 34.1Govt expenditure on ag (% total outlays) 4.6 5.1Area harvested (mln ha) 5 4 6Cropping intensity ratio 0.2 0.1Water resources (1 000 m3/person/year) 1 1 1Area equipped for irrigation (1 000 ha) 103Area irrigated (% area equipped for irrigation) 94.2Employment in agriculture (%) 61.1Employment in agriculture, female (%) 68Fertilizers, Nitrogen (kg of nutrients per ha) 13.2 20.3Fertilizers, Phosphate (kg of nutrients per ha) 17.6 18.3Fertilizers, Potash (kg nutrients per ha) 2.3 5.7Energy consump, power irrigation (mln kWh) 53 53 154Agr value added per worker (constant US$) 415 352 396Hunger dimensionsDietary energy supply (kcal/pc/day) 1 997 2 064 2 215Average dietary energy supply adequacy (%) 96 96 102Dietary en supp, cereals/roots/tubers (%) 55 56 56Prevalence of undernourishment (%) 32.4 32.3 21.2GDP per capita (US$, PPP) 2 376 2 143 2 705Domestic food price volatility (index) 9.8 6.5Cereal import dependency ratio (%) 13.7 25.4 36.4Underweight, children under-5 (%) 20.1 17.5 16.4Improved water source (% pop) 42.7 51.8 61.7Food supplyFood production value, (2004-2006 mln I$) 3 564 4 002 6 840Agriculture, value added (% GDP) 30 32 30Food exports (mln US$) 146 227 382Food imports (mln US$) 194 447 1 216Production indices (2004-06=100)Net food 64 72 123Net crops 68 77 127Cereals 78 72 123Vegetable oils 69 101 111Roots and tubers 46 42 127Fruit and vegetables 46 83 130Sugar 99 82 123Livestock 64 69 118Milk 67 66 122Meat 59 69 115Fish 139 148 128Net trade (mln US$)Cereals -51 -246 -606Fruit and vegetables 102 149 102Meat 5 1 7Dairy products 1 -4 -25Fish 26 34 51EnvironmentForest area (%) 7 6 6Renewable water res withdrawn (% of total) 79Terrestrial protect areas (% total land area) 12 12 12Organic area (% total agricultural area) 0Water withdrawal by agriculture (% of total) 79Biofuel production (thousand kt of oil eq.) 43 49 54Wood pellet prod. (1 000 tonnes)Net GHG emissions from AFOLU (CO2 eq, Mt) 33 30 51
134

Kuwait
1990 2000 2014
The settingPopulation, total (mln) 2.1 1.9 3.5Population, rural (mln) 0 0 0.1Govt expenditure on ag (% total outlays) 0 0Area harvested (mln ha) 1 1 0Cropping intensity ratio 9.6 4.7Water resources (1 000 m3/person/year) 0 0 0Area equipped for irrigation (1 000 ha) 10Area irrigated (% area equipped for irrigation) 100Employment in agriculture (%) 1.3 0 2.7Employment in agriculture, female (%) 0.1 0Fertilizers, Nitrogen (kg of nutrients per ha) 0 0Fertilizers, Phosphate (kg of nutrients per ha) 0 42.6Fertilizers, Potash (kg nutrients per ha) 0 294.5Energy consump, power irrigation (mln kWh) 0 4 4Agr value added per worker (constant US$)Hunger dimensionsDietary energy supply (kcal/pc/day) 2 144 3 449 3 314Average dietary energy supply adequacy (%) 92 142 135Dietary en supp, cereals/roots/tubers (%) 42 40 43Prevalence of undernourishment (%) 39.4 <5.0 <5.0GDP per capita (US$, PPP) 74 824 82 358Domestic food price volatility (index) 6 9.6Cereal import dependency ratio (%) 99.5 99.7 97.8Underweight, children under-5 (%) 2.3 2.2Improved water source (% pop) 99 99 99Food supplyFood production value, (2004-2006 mln I$) 90 143 303Agriculture, value added (% GDP) 0Food exports (mln US$) 32 43 131Food imports (mln US$) 492 1 088 2 236Production indices (2004-06=100)Net food 50 80 170Net crops 40 74 163Cereals 52 78 749Vegetable oils 29 12 155Roots and tubers 8 86 226Fruit and vegetables 40 73 156SugarLivestock 58 84 177Milk 56 76 142Meat 65 84 183Fish 79 131 88Net trade (mln US$)Cereals -53 -218 -585Fruit and vegetables -144 -280 -306Meat -34 -119 -430Dairy products -56 -158 -222Fish 1 -20 -112EnvironmentForest area (%) 0 0 0Renewable water res withdrawn (% of total) 54Terrestrial protect areas (% total land area) 2 2 18Organic area (% total agricultural area)Water withdrawal by agriculture (% of total) 54Biofuel production (thousand kt of oil eq.)Wood pellet prod. (1 000 tonnes)Net GHG emissions from AFOLU (CO2 eq, Mt) 0 0 0
135

Kyrgyzstan
1990 2000 2014
The settingPopulation, total (mln) 4.5 5 5.6Population, rural (mln) 2.8 3.2 3.6Govt expenditure on ag (% total outlays) 4.5 1.5Area harvested (mln ha) 2 2Cropping intensity ratio 0.1Water resources (1 000 m3/person/year) 5 5 4Area equipped for irrigation (1 000 ha) 1 023Area irrigated (% area equipped for irrigation) 99.8Employment in agriculture (%) 32.7 53.1 34Employment in agriculture, female (%) 54.8 35.4Fertilizers, Nitrogen (kg of nutrients per ha) 23.4 19.8Fertilizers, Phosphate (kg of nutrients per ha) 1.3 1.2Fertilizers, Potash (kg nutrients per ha) 0 0.6Energy consump, power irrigation (mln kWh) 0 89 1Agr value added per worker (constant US$) 835 1 133 1 418Hunger dimensionsDietary energy supply (kcal/pc/day) 2 667 2 453 2 848Average dietary energy supply adequacy (%) 119 106 122Dietary en supp, cereals/roots/tubers (%) 58 59 54Prevalence of undernourishment (%) 15.9 15.2 6GDP per capita (US$, PPP) 3 475 2 074 3 110Domestic food price volatility (index)Cereal import dependency ratio (%) 32.6 8.2 23.4Underweight, children under-5 (%) 8.2 3.7Improved water source (% pop) 72.9 78.7 87.6Food supplyFood production value, (2004-2006 mln I$) 1 084 1 377 1 619Agriculture, value added (% GDP) 34 37 17Food exports (mln US$) 5 18 203Food imports (mln US$) 134 56 614Production indices (2004-06=100)Net food 75 95 112Net crops 55 94 112Cereals 91 97 106Vegetable oils 16 64 63Roots and tubers 27 83 109Fruit and vegetables 34 100 132Sugar 57 117 51Livestock 106 99 113Milk 79 93 118Meat 119 105 107Fish 3 021 254 755Net trade (mln US$)Cereals -35 -185Fruit and vegetables 1 7 106Meat -2 -73Dairy products 1 9Fish -2 -15EnvironmentForest area (%) 4 4 5Renewable water res withdrawn (% of total) 93Terrestrial protect areas (% total land area) 6 7 6Organic area (% total agricultural area) 0Water withdrawal by agriculture (% of total) 93Biofuel production (thousand kt of oil eq.)Wood pellet prod. (1 000 tonnes)Net GHG emissions from AFOLU (CO2 eq, Mt) 2 1 -11
136

Laos
1990 2000 2014
The settingPopulation, total (mln) 4.2 5.4 6.9Population, rural (mln) 3.6 4.2 4.3Govt expenditure on ag (% total outlays)Area harvested (mln ha) 2 2 4Cropping intensity ratio 0.9 1.3Water resources (1 000 m3/person/year) 79 62 49Area equipped for irrigation (1 000 ha) 310Area irrigated (% area equipped for irrigation) 87.3Employment in agriculture (%) 85.4Employment in agriculture, female (%) 89.3Fertilizers, Nitrogen (kg of nutrients per ha)Fertilizers, Phosphate (kg of nutrients per ha)Fertilizers, Potash (kg nutrients per ha)Energy consump, power irrigation (mln kWh) 0 0 0Agr value added per worker (constant US$) 345 432 522Hunger dimensionsDietary energy supply (kcal/pc/day) 1 987 2 083 2 412Average dietary energy supply adequacy (%) 91 94 104Dietary en supp, cereals/roots/tubers (%) 83 78 72Prevalence of undernourishment (%) 42.8 39.2 18.5GDP per capita (US$, PPP) 1 622 2 327 4 667Domestic food price volatility (index) 12.2 3.6Cereal import dependency ratio (%) 1.1 1.8 -5.1Underweight, children under-5 (%) 39.8 36.4 26.5Improved water source (% pop) 45.5 71.5Food supplyFood production value, (2004-2006 mln I$) 579 968 1 807Agriculture, value added (% GDP) 61 45 28Food exports (mln US$) 23 14 39Food imports (mln US$) 11 32 199Production indices (2004-06=100)Net food 49 82 153Net crops 51 84 163Cereals 55 82 146Vegetable oils 39 68 198Roots and tubers 110 87 524Fruit and vegetables 21 76 153Sugar 45 140 555Livestock 50 83 126Milk 73 93 112Meat 50 83 126Fish 31 80 159Net trade (mln US$)Cereals -2 -14 -21Fruit and vegetables 0 1 -2Meat -1 0 0Dairy productsFish 0 -2 -8EnvironmentForest area (%) 75 72 68Renewable water res withdrawn (% of total) 91Terrestrial protect areas (% total land area) 1 17 17Organic area (% total agricultural area) 0Water withdrawal by agriculture (% of total) 91Biofuel production (thousand kt of oil eq.)Wood pellet prod. (1 000 tonnes)Net GHG emissions from AFOLU (CO2 eq, Mt) 29 27 33
137

Latvia
1990 2000 2014
The settingPopulation, total (mln) 2.6 2.4 2Population, rural (mln) 0.8 0.8 0.7Govt expenditure on ag (% total outlays) 9.9 12.5Area harvested (mln ha) 1 2Cropping intensity ratio 0.6Water resources (1 000 m3/person/year) 14 15 17Area equipped for irrigation (1 000 ha) 1Area irrigated (% area equipped for irrigation) 74.7Employment in agriculture (%) 14.5 8.4Employment in agriculture, female (%) 12.2 4.9Fertilizers, Nitrogen (kg of nutrients per ha) 25.2 55.9Fertilizers, Phosphate (kg of nutrients per ha) 11.7 16.8Fertilizers, Potash (kg nutrients per ha) 12.6 17.5Energy consump, power irrigation (mln kWh) 0 0 0Agr value added per worker (constant US$) 3 838 7 081Hunger dimensionsDietary energy supply (kcal/pc/day)Average dietary energy supply adequacy (%) 135 115 135Dietary en supp, cereals/roots/tubers (%) 47 41 33Prevalence of undernourishment (%) <5.0 <5.0 <5.0GDP per capita (US$, PPP) 13 310 11 256 21 833Domestic food price volatility (index) 6.9 7.5Cereal import dependency ratio (%) 2.4 4.7 -72.2Underweight, children under-5 (%)Improved water source (% pop) 98.5 98.4 98.4Food supplyFood production value, (2004-2006 mln I$) 1 116 570 797Agriculture, value added (% GDP) 5 3Food exports (mln US$) 89 88 1 548Food imports (mln US$) 38 398 1 474Production indices (2004-06=100)Net food 169 86 121Net crops 126 82 125Cereals 96 76 183Vegetable oils 4 9 239Roots and tubers 203 128 41Fruit and vegetables 195 82 62Sugar 60 82 2Livestock 196 94 117Milk 144 103 114Meat 318 84 123Fish 330 98 84Net trade (mln US$)Cereals 1 -45 369Fruit and vegetables -4 -122 -178Meat 21 -34 -96Dairy products 29 13 102Fish 27 13 53EnvironmentForest area (%) 51 52 54Renewable water res withdrawn (% of total) 13Terrestrial protect areas (% total land area) 7 16 19Organic area (% total agricultural area) 11Water withdrawal by agriculture (% of total) 13Biofuel production (thousand kt of oil eq.) 1 8 1 195Wood pellet prod. (1 000 tonnes) 1 280Net GHG emissions from AFOLU (CO2 eq, Mt) -5 -7 -12
138

Lebanon
1990 2000 2014
The settingPopulation, total (mln) 2.7 3.2 5Population, rural (mln) 0.5 0.5 0.6Govt expenditure on ag (% total outlays)Area harvested (mln ha) 1 1 0Cropping intensity ratio 2 1.5Water resources (1 000 m3/person/year) 2 1 1Area equipped for irrigation (1 000 ha) 104Area irrigated (% area equipped for irrigation) 86.5Employment in agriculture (%) 6.3Employment in agriculture, female (%) 5.7Fertilizers, Nitrogen (kg of nutrients per ha) 123.5 74.1Fertilizers, Phosphate (kg of nutrients per ha) 0 182.4Fertilizers, Potash (kg nutrients per ha) 8.9 26.4Energy consump, power irrigation (mln kWh) 82 91 91Agr value added per worker (constant US$) 15 404 35 125Hunger dimensionsDietary energy supply (kcal/pc/day) 3 254 3 342 3 322Average dietary energy supply adequacy (%) 141 142 135Dietary en supp, cereals/roots/tubers (%) 37 37 39Prevalence of undernourishment (%) <5.0 <5.0 <5.0GDP per capita (US$, PPP) 7 734 12 335 16 623Domestic food price volatility (index)Cereal import dependency ratio (%) 89.1 87.5 88.3Underweight, children under-5 (%) 3.5Improved water source (% pop) 100 100 100Food supplyFood production value, (2004-2006 mln I$) 1 016 1 198 1 163Agriculture, value added (% GDP) 7 6Food exports (mln US$) 90 96 478Food imports (mln US$) 552 855 2 348Production indices (2004-06=100)Net food 84 99 96Net crops 97 104 99Cereals 42 70 101Vegetable oils 47 134 72Roots and tubers 51 59 88Fruit and vegetables 124 106 107Sugar 143 521 2Livestock 54 87 93Milk 55 88 161Meat 49 84 75Fish 32 88 110Net trade (mln US$)Cereals -100 -170 -521Fruit and vegetables -77 -97 -92Meat -35 -58 -184Dairy products -68 -148 -287Fish -10 -44 -132EnvironmentForest area (%) 13 13 13Renewable water res withdrawn (% of total) 60Terrestrial protect areas (% total land area) 0 1 1Organic area (% total agricultural area) 0Water withdrawal by agriculture (% of total) 60Biofuel production (thousand kt of oil eq.)Wood pellet prod. (1 000 tonnes)Net GHG emissions from AFOLU (CO2 eq, Mt) 0 1 1
139

Lesotho
1990 2000 2014
The settingPopulation, total (mln) 1.6 1.9 2.1Population, rural (mln) 1.4 1.5 1.5Govt expenditure on ag (% total outlays) 2.4Area harvested (mln ha) 0 0 0Cropping intensity ratio 0.1 0.1Water resources (1 000 m3/person/year) 2 2 1Area equipped for irrigation (1 000 ha) 3Area irrigated (% area equipped for irrigation) 2.5Employment in agriculture (%) 72.3Employment in agriculture, female (%) 64.9Fertilizers, Nitrogen (kg of nutrients per ha)Fertilizers, Phosphate (kg of nutrients per ha)Fertilizers, Potash (kg nutrients per ha)Energy consump, power irrigation (mln kWh)Agr value added per worker (constant US$) 427 393 364Hunger dimensionsDietary energy supply (kcal/pc/day) 2 366 2 468 2 597Average dietary energy supply adequacy (%) 112 115 116Dietary en supp, cereals/roots/tubers (%) 80 80 80Prevalence of undernourishment (%) 15.6 13 11.2GDP per capita (US$, PPP) 1 307 1 637 2 494Domestic food price volatility (index) 12.2 5.1Cereal import dependency ratio (%) 70.1 54.1 78.2Underweight, children under-5 (%) 18.9 15 13.5Improved water source (% pop) 77.5 79.1 81.3Food supplyFood production value, (2004-2006 mln I$) 118 122 132Agriculture, value added (% GDP) 25 12 6Food exports (mln US$) 6 2 0Food imports (mln US$) 112 111 189Production indices (2004-06=100)Net food 100 103 112Net crops 128 113 113Cereals 217 133 93Vegetable oilsRoots and tubers 46 88 126Fruit and vegetables 93 76 95SugarLivestock 85 95 111Milk 83 110 138Meat 85 96 107Fish 64 86 1 179Net trade (mln US$)Cereals -36 -36 -96Fruit and vegetables -24 -27 -33Meat -9 -11 -20Dairy productsFish -9 -3EnvironmentForest area (%) 1 1 1Renewable water res withdrawn (% of total) 9Terrestrial protect areas (% total land area) 0 0 1Organic area (% total agricultural area) 0Water withdrawal by agriculture (% of total) 9Biofuel production (thousand kt of oil eq.)Wood pellet prod. (1 000 tonnes)Net GHG emissions from AFOLU (CO2 eq, Mt) 1 2 1
140

Liberia
1990 2000 2014
The settingPopulation, total (mln) 2.1 2.9 4.4Population, rural (mln) 0.9 1.6 2.2Govt expenditure on ag (% total outlays) 2.4Area harvested (mln ha) 0 1 1Cropping intensity ratio 0.2 0.2Water resources (1 000 m3/person/year) 110 80 54Area equipped for irrigation (1 000 ha) 3Area irrigated (% area equipped for irrigation)Employment in agriculture (%) 48.9Employment in agriculture, female (%) 48.3Fertilizers, Nitrogen (kg of nutrients per ha)Fertilizers, Phosphate (kg of nutrients per ha)Fertilizers, Potash (kg nutrients per ha)Energy consump, power irrigation (mln kWh)Agr value added per worker (constant US$) 574 790Hunger dimensionsDietary energy supply (kcal/pc/day) 2 268 2 084 2 348Average dietary energy supply adequacy (%) 107 98 109Dietary en supp, cereals/roots/tubers (%) 61 65 66Prevalence of undernourishment (%) 29 36.5 31.9GDP per capita (US$, PPP) 502 473 850Domestic food price volatility (index)Cereal import dependency ratio (%) 75.3 64.3 61.1Underweight, children under-5 (%) 22.8 15.3Improved water source (% pop) 61.2 74.6Food supplyFood production value, (2004-2006 mln I$) 207 270 323Agriculture, value added (% GDP)Food exports (mln US$) 5 5 31Food imports (mln US$) 47 84 308Production indices (2004-06=100)Net food 77 100 120Net crops 63 100 96Cereals 128 130 166Vegetable oils 56 100 105Roots and tubers 75 91 101Fruit and vegetables 59 95 104Sugar 82 98 104Livestock 79 101 140Milk 80 92 91Meat 78 102 144Fish 56 99 82Net trade (mln US$)Cereals -27 -52 -167Fruit and vegetables -4 -5 -11Meat -3 -6 -33Dairy products -2 -3 -8Fish -6 -3 -10EnvironmentForest area (%) 51 48 44Renewable water res withdrawn (% of total) 9Terrestrial protect areas (% total land area) 2 2 3Organic area (% total agricultural area)Water withdrawal by agriculture (% of total) 9Biofuel production (thousand kt of oil eq.) 0 0Wood pellet prod. (1 000 tonnes)Net GHG emissions from AFOLU (CO2 eq, Mt) 15 15 16
141

Libya
1990 2000 2014
The settingPopulation, total (mln) 4.3 5.2 6.3Population, rural (mln) 1 1.2 1.4Govt expenditure on ag (% total outlays)Area harvested (mln ha) 1 1 0Cropping intensity ratio 0 0.1Water resources (1 000 m3/person/year) 0 0 0Area equipped for irrigation (1 000 ha) 470Area irrigated (% area equipped for irrigation) 67.2Employment in agriculture (%)Employment in agriculture, female (%)Fertilizers, Nitrogen (kg of nutrients per ha) 17.8 26.3Fertilizers, Phosphate (kg of nutrients per ha) 11.9 4.3Fertilizers, Potash (kg nutrients per ha) 3.3 0.3Energy consump, power irrigation (mln kWh)Agr value added per worker (constant US$) 13 815Hunger dimensionsDietary energy supply (kcal/pc/day)Average dietary energy supply adequacy (%)Dietary en supp, cereals/roots/tubers (%)Prevalence of undernourishment (%)GDP per capita (US$, PPP) 23 085 20 371Domestic food price volatility (index)Cereal import dependency ratio (%) 91.9 91.3 92Underweight, children under-5 (%) 4.3 5.6Improved water source (% pop) 54.4 54.4Food supplyFood production value, (2004-2006 mln I$) 757 943 1 103Agriculture, value added (% GDP) 4 2Food exports (mln US$) 38 50 2Food imports (mln US$) 1 000 991 3 287Production indices (2004-06=100)Net food 76 94 110Net crops 78 97 110Cereals 126 102 152Vegetable oils 40 91 76Roots and tubers 54 77 120Fruit and vegetables 82 100 119SugarLivestock 72 91 113Milk 67 90 97Meat 76 90 122Fish 66 133 96Net trade (mln US$)Cereals -458 -561 -1 233Fruit and vegetables -76 -101 -355Meat -12 -9 -287Dairy products -108 -66 -425Fish -15 3 -246EnvironmentForest area (%) 0 0 0Renewable water res withdrawn (% of total) 83Terrestrial protect areas (% total land area) 0 0 0Organic area (% total agricultural area)Water withdrawal by agriculture (% of total) 83Biofuel production (thousand kt of oil eq.)Wood pellet prod. (1 000 tonnes)Net GHG emissions from AFOLU (CO2 eq, Mt) 2 2 3
142

Lithuania
1990 2000 2014
The settingPopulation, total (mln) 3.7 3.5 3Population, rural (mln) 1.2 1.2 1Govt expenditure on ag (% total outlays)Area harvested (mln ha) 3 4Cropping intensity ratio 0.8Water resources (1 000 m3/person/year) 7 7 8Area equipped for irrigation (1 000 ha) 4Area irrigated (% area equipped for irrigation) 22.4Employment in agriculture (%) 18.7 8.9Employment in agriculture, female (%) 15.1 6.4Fertilizers, Nitrogen (kg of nutrients per ha) 25.4 29.2Fertilizers, Phosphate (kg of nutrients per ha) 44.2 42.5Fertilizers, Potash (kg nutrients per ha) 77.8 27.3Energy consump, power irrigation (mln kWh) 0 18 18Agr value added per worker (constant US$) 12 444Hunger dimensionsDietary energy supply (kcal/pc/day)Average dietary energy supply adequacy (%) 123 129 144Dietary en supp, cereals/roots/tubers (%) 53 49 39Prevalence of undernourishment (%) <5.0 <5.0 <5.0GDP per capita (US$, PPP) 15 611 11 887 24 470Domestic food price volatility (index) 6 5.6Cereal import dependency ratio (%) 6.8 -7.9 -74.7Underweight, children under-5 (%)Improved water source (% pop) 87.1 91 95.9Food supplyFood production value, (2004-2006 mln I$) 1 839 1 403 1 799Agriculture, value added (% GDP) 3Food exports (mln US$) 193 308 3 785Food imports (mln US$) 151 314 2 621Production indices (2004-06=100)Net food 120 91 117Net crops 118 114 156Cereals 98 101 193Vegetable oils 1 44 294Roots and tubers 255 225 58Fruit and vegetables 129 101 93Sugar 106 109 120Livestock 124 88 97Milk 111 92 92Meat 149 85 102Fish 220 52 62Net trade (mln US$)Cereals -22 -23 620Fruit and vegetables 6 -56 -120Meat 25 5 48Dairy products 45 107 436Fish -1 -22 23EnvironmentForest area (%) 31 32 35Renewable water res withdrawn (% of total) 3Terrestrial protect areas (% total land area) 2 12 17Organic area (% total agricultural area) 6Water withdrawal by agriculture (% of total) 3Biofuel production (thousand kt of oil eq.) 7 10 2 431Wood pellet prod. (1 000 tonnes) 250Net GHG emissions from AFOLU (CO2 eq, Mt) 8 7 9
143

Luxembourg
1990 2000 2014
The settingPopulation, total (mln) 0.4 0.5Population, rural (mln) 0.1 0.1Govt expenditure on ag (% total outlays)Area harvested (mln ha) 1 0Cropping intensity ratio 5.3Water resources (1 000 m3/person/year) 9 8 7Area equipped for irrigation (1 000 ha)Area irrigated (% area equipped for irrigation) 100Employment in agriculture (%) 3.3 2.4 1.3Employment in agriculture, female (%) 2.9 1.5 0.9Fertilizers, Nitrogen (kg of nutrients per ha) 208.1 359.1Fertilizers, Phosphate (kg of nutrients per ha) 28.9 12.7Fertilizers, Potash (kg nutrients per ha) 30.4 32.2Energy consump, power irrigation (mln kWh)Agr value added per worker (constant US$) 61 218 36 314Hunger dimensionsDietary energy supply (kcal/pc/day)Average dietary energy supply adequacy (%) 140 140Dietary en supp, cereals/roots/tubers (%) 25 30Prevalence of undernourishment (%) <5.0 <5.0 <5.0GDP per capita (US$, PPP) 56 922 81 425 88 850Domestic food price volatility (index) 6.8 7.3Cereal import dependency ratio (%) -4.3 14.6Underweight, children under-5 (%)Improved water source (% pop) 100 100 100Food supplyFood production value, (2004-2006 mln I$) 204 166Agriculture, value added (% GDP) 1 0Food exports (mln US$) 250 918Food imports (mln US$) 500 1 534Production indices (2004-06=100)Net food 110 90Net crops 96 86Cereals 91 104Vegetable oils 53 96Roots and tubers 124 87Fruit and vegetables 113 59SugarLivestock 113 96Milk 98 111Meat 132 76FishNet trade (mln US$)Cereals -41 -96Fruit and vegetables -90 -201Meat -72 -177Dairy products 8 -12Fish -43 -94EnvironmentForest area (%) 34 33Renewable water res withdrawn (% of total) 0Terrestrial protect areas (% total land area) 15 33 40Organic area (% total agricultural area) 3Water withdrawal by agriculture (% of total) 0Biofuel production (thousand kt of oil eq.) 0 0 12Wood pellet prod. (1 000 tonnes) 45Net GHG emissions from AFOLU (CO2 eq, Mt) 0 1
144

Macedonia
1990 2000 2014
The settingPopulation, total (mln) 2 2.1 2.1Population, rural (mln) 0.8 0.8 0.9Govt expenditure on ag (% total outlays)Area harvested (mln ha) 1 1Cropping intensity ratio 0.5Water resources (1 000 m3/person/year) 3 3 3Area equipped for irrigation (1 000 ha) 128Area irrigated (% area equipped for irrigation)Employment in agriculture (%) 22 17.3Employment in agriculture, female (%) 22.2 17.6Fertilizers, Nitrogen (kg of nutrients per ha) 25.5 39.4Fertilizers, Phosphate (kg of nutrients per ha) 0 9.5Fertilizers, Potash (kg nutrients per ha) 7.3 8.3Energy consump, power irrigation (mln kWh)Agr value added per worker (constant US$) 3 249 5 271 11 460Hunger dimensionsDietary energy supply (kcal/pc/day)Average dietary energy supply adequacy (%) 97 110 119Dietary en supp, cereals/roots/tubers (%) 48 40 37Prevalence of undernourishment (%) <5.0 <5.0 <5.0GDP per capita (US$, PPP) 9 803 8 757 11 609Domestic food price volatility (index) 10.2 7.9Cereal import dependency ratio (%) 22.4 23.1 25.4Underweight, children under-5 (%) 1.9 1.3Improved water source (% pop) 99.3 99.3 99.4Food supplyFood production value, (2004-2006 mln I$) 506 638 764Agriculture, value added (% GDP) 9 12 10Food exports (mln US$) 113 64 367Food imports (mln US$) 164 182 666Production indices (2004-06=100)Net food 78 98 118Net crops 72 98 115Cereals 73 88 89Vegetable oils 72 118 101Roots and tubers 50 84 100Fruit and vegetables 70 101 123Sugar 122 125 21Livestock 98 94 116Milk 68 92 149Meat 135 86 82Fish 0 142 166Net trade (mln US$)Cereals -15 -37 -38Fruit and vegetables 27 13 108Meat -30 -39 -132Dairy products -15 -11 -42Fish -6 -7 -23EnvironmentForest area (%) 36 38 40Renewable water res withdrawn (% of total) 12Terrestrial protect areas (% total land area) 5 6 7Organic area (% total agricultural area) 0Water withdrawal by agriculture (% of total) 12Biofuel production (thousand kt of oil eq.) 54Wood pellet prod. (1 000 tonnes) 0Net GHG emissions from AFOLU (CO2 eq, Mt) 1 1 1
145

Madagascar
1990 2000 2014
The settingPopulation, total (mln) 11.5 15.7 23.6Population, rural (mln) 8.8 11.5 15.4Govt expenditure on ag (% total outlays)Area harvested (mln ha) 3 3 4Cropping intensity ratio 0.1 0.1Water resources (1 000 m3/person/year) 29 21 15Area equipped for irrigation (1 000 ha) 1 086Area irrigated (% area equipped for irrigation) 50.6Employment in agriculture (%) 78 80.4Employment in agriculture, female (%) 79.3 81.1Fertilizers, Nitrogen (kg of nutrients per ha) 1.4 0.7Fertilizers, Phosphate (kg of nutrients per ha) 0.3 0.7Fertilizers, Potash (kg nutrients per ha) 0.5 0.6Energy consump, power irrigation (mln kWh) 0 6 6Agr value added per worker (constant US$) 245 225 175Hunger dimensionsDietary energy supply (kcal/pc/day) 2 128 2 002 2 063Average dietary energy supply adequacy (%) 102 96 97Dietary en supp, cereals/roots/tubers (%) 74 77 79Prevalence of undernourishment (%) 27.3 34.8 33GDP per capita (US$, PPP) 1 661 1 446 1 369Domestic food price volatility (index) 7.6 5Cereal import dependency ratio (%) 5.9 12.2 8.7Underweight, children under-5 (%) 40.9 35.5Improved water source (% pop) 28.6 38.1 49.6Food supplyFood production value, (2004-2006 mln I$) 2 232 2 428 3 312Agriculture, value added (% GDP) 29 29 26Food exports (mln US$) 125 95 274Food imports (mln US$) 66 100 340Production indices (2004-06=100)Net food 81 88 121Net crops 79 83 117Cereals 71 73 109Vegetable oils 94 101 95Roots and tubers 82 91 118Fruit and vegetables 82 89 122Sugar 82 89 132Livestock 99 102 125Milk 94 106 113Meat 103 101 130Fish 72 89 79Net trade (mln US$)Cereals -39 -62 -178Fruit and vegetables 13 19 42Meat 0 0 -1Dairy products -7 -6 -13Fish 45 31 103EnvironmentForest area (%) 24 23 21Renewable water res withdrawn (% of total) 98Terrestrial protect areas (% total land area) 2 3 5Organic area (% total agricultural area) 0Water withdrawal by agriculture (% of total) 98Biofuel production (thousand kt of oil eq.) 3 2 2Wood pellet prod. (1 000 tonnes)Net GHG emissions from AFOLU (CO2 eq, Mt) 59 56 53
146

Malawi
1990 2000 2014
The settingPopulation, total (mln) 9.4 11.3 16.8Population, rural (mln) 8.4 9.7 14.1Govt expenditure on ag (% total outlays)Area harvested (mln ha) 2 5 9Cropping intensity ratio 0.4 1Water resources (1 000 m3/person/year) 2 2 1Area equipped for irrigation (1 000 ha) 74Area irrigated (% area equipped for irrigation) 96Employment in agriculture (%)Employment in agriculture, female (%)Fertilizers, Nitrogen (kg of nutrients per ha) 20.3 30.2Fertilizers, Phosphate (kg of nutrients per ha) 6.9 6Fertilizers, Potash (kg nutrients per ha) 3.9 3.6Energy consump, power irrigation (mln kWh) 1 30 117Agr value added per worker (constant US$) 120 213 253Hunger dimensionsDietary energy supply (kcal/pc/day) 1 875 2 207 2 364Average dietary energy supply adequacy (%) 89 105 111Dietary en supp, cereals/roots/tubers (%) 73 75 71Prevalence of undernourishment (%) 44.7 28.6 20.7GDP per capita (US$, PPP) 540 632 755Domestic food price volatility (index) 18.1 23.6Cereal import dependency ratio (%) 28.2 3.6 1.6Underweight, children under-5 (%) 24.4 21.5 13.8Improved water source (% pop) 42.1 62.5 85Food supplyFood production value, (2004-2006 mln I$) 739 1 580 3 105Agriculture, value added (% GDP) 45 40 33Food exports (mln US$) 35 29 207Food imports (mln US$) 68 29 194Production indices (2004-06=100)Net food 47 100 196Net crops 51 99 182Cereals 72 136 203Vegetable oils 23 67 245Roots and tubers 12 105 214Fruit and vegetables 57 80 121Sugar 77 91 125Livestock 68 93 253Milk 107 102 318Meat 64 92 266Fish 116 79 181Net trade (mln US$)Cereals -42 -11 -94Fruit and vegetables 2 1 44Meat 0 0 -1Dairy products -5 -3 -8Fish -1 0 -1EnvironmentForest area (%) 41 38 34Renewable water res withdrawn (% of total) 86Terrestrial protect areas (% total land area) 15 16 18Organic area (% total agricultural area) 0Water withdrawal by agriculture (% of total) 86Biofuel production (thousand kt of oil eq.) 5 5 7Wood pellet prod. (1 000 tonnes)Net GHG emissions from AFOLU (CO2 eq, Mt) 9 8 11
147

Malaysia
1990 2000 2014
The settingPopulation, total (mln) 18.2 23.4 30.2Population, rural (mln) 9.1 8.9 7.6Govt expenditure on ag (% total outlays) 3 2.6Area harvested (mln ha) 31 57 100Cropping intensity ratio 4.5 8.1Water resources (1 000 m3/person/year) 32 25 20Area equipped for irrigation (1 000 ha) 380Area irrigated (% area equipped for irrigation) 100Employment in agriculture (%) 26 18.4 12.6Employment in agriculture, female (%) 25.3 14 8.2Fertilizers, Nitrogen (kg of nutrients per ha) 470.8 578.1Fertilizers, Phosphate (kg of nutrients per ha) 26.1 231.7Fertilizers, Potash (kg nutrients per ha) 807.2 760.8Energy consump, power irrigation (mln kWh) 0 0 17Agr value added per worker (constant US$) 4 812 5 485 10 127Hunger dimensionsDietary energy supply (kcal/pc/day) 2 689 2 858 3 042Average dietary energy supply adequacy (%) 120 125 129Dietary en supp, cereals/roots/tubers (%) 44 45 45Prevalence of undernourishment (%) 5.1 <5.0 <5.0GDP per capita (US$, PPP) 10 159 15 695 22 589Domestic food price volatility (index) 3.8 4.8Cereal import dependency ratio (%) 70.2 75.5 76Underweight, children under-5 (%) 22.1 16.7 12.9Improved water source (% pop) 88.2 96.4 99.6Food supplyFood production value, (2004-2006 mln I$) 5 983 8 710 14 311Agriculture, value added (% GDP) 15 9 9Food exports (mln US$) 2 893 4 189 21 754Food imports (mln US$) 1 630 2 730 12 373Production indices (2004-06=100)Net food 54 78 128Net crops 60 78 118Cereals 83 95 117Vegetable oils 41 73 128Roots and tubers 409 150 118Fruit and vegetables 84 94 113Sugar 269 228 44Livestock 59 78 139Milk 79 75 174Meat 57 76 136Fish 69 99 121Net trade (mln US$)Cereals -469 -611 -1 571Fruit and vegetables -77 -211 -995Meat -76 -187 -614Dairy products -161 -246 -534Fish 83 52 -223EnvironmentForest area (%) 68 66 62Renewable water res withdrawn (% of total) 22Terrestrial protect areas (% total land area) 17 18 18Organic area (% total agricultural area) 0Water withdrawal by agriculture (% of total) 22Biofuel production (thousand kt of oil eq.) 3 3 230Wood pellet prod. (1 000 tonnes) 180Net GHG emissions from AFOLU (CO2 eq, Mt) -232 -209 160
148

Maldives
1990 2000 2014
The settingPopulation, total (mln) 0.2 0.3 0.4Population, rural (mln) 0.2 0.2 0.2Govt expenditure on ag (% total outlays) 0.7 1.3Area harvested (mln ha) 0 0 0Cropping intensity ratio 18.8 34.8Water resources (1 000 m3/person/year) 0 0 0Area equipped for irrigation (1 000 ha)Area irrigated (% area equipped for irrigation)Employment in agriculture (%) 25.2 13.7 11.5Employment in agriculture, female (%) 13.5 5.4 7.1Fertilizers, Nitrogen (kg of nutrients per ha) 4 50Fertilizers, Phosphate (kg of nutrients per ha) 2 43.7Fertilizers, Potash (kg nutrients per ha) 2 44.3Energy consump, power irrigation (mln kWh)Agr value added per worker (constant US$) 3 268 3 304Hunger dimensionsDietary energy supply (kcal/pc/day) 2 342 2 465 2 933Average dietary energy supply adequacy (%) 116 116 131Dietary en supp, cereals/roots/tubers (%) 45 45 41Prevalence of undernourishment (%) 12.2 11.8 5.2GDP per capita (US$, PPP) 7 695 11 283Domestic food price volatility (index) 57.6 14.2Cereal import dependency ratio (%) 100 100 100Underweight, children under-5 (%) 25.7 17.8Improved water source (% pop) 93.2 95.2 98.6Food supplyFood production value, (2004-2006 mln I$) 9 10 7Agriculture, value added (% GDP) 9 4Food exports (mln US$) 0 0 0Food imports (mln US$) 21 62 256Production indices (2004-06=100)Net food 76 89 64Net crops 74 87 59Cereals 6 89 146Vegetable oils 68 84 3Roots and tubers 240 127 70Fruit and vegetables 62 77 36SugarLivestock 103 116 108MilkMeat 103 116 108FishNet trade (mln US$)Cereals -14 -43Fruit and vegetablesMeat -9 -40Dairy products -11 -32Fish 38 41 135EnvironmentForest area (%) 3 3 3Renewable water res withdrawn (% of total) 0Terrestrial protect areas (% total land area)Organic area (% total agricultural area)Water withdrawal by agriculture (% of total) 0Biofuel production (thousand kt of oil eq.)Wood pellet prod. (1 000 tonnes)Net GHG emissions from AFOLU (CO2 eq, Mt) 0 0 0
149

Mali
1990 2000 2014
The settingPopulation, total (mln) 8 10.3 15.8Population, rural (mln) 6.1 7.4 10Govt expenditure on ag (% total outlays)Area harvested (mln ha) 2 2 6Cropping intensity ratio 0.1 0.1Water resources (1 000 m3/person/year) 15 12 8Area equipped for irrigation (1 000 ha) 378Area irrigated (% area equipped for irrigation) 74.6Employment in agriculture (%) 66Employment in agriculture, female (%) 63.9Fertilizers, Nitrogen (kg of nutrients per ha) 0 18.5Fertilizers, Phosphate (kg of nutrients per ha) 0 4.6Fertilizers, Potash (kg nutrients per ha) 0 2.9Energy consump, power irrigation (mln kWh) 0 0 0Agr value added per worker (constant US$) 598 581 842Hunger dimensionsDietary energy supply (kcal/pc/day) 2 375 2 469 2 856Average dietary energy supply adequacy (%) 114 118 137Dietary en supp, cereals/roots/tubers (%) 69 68 68Prevalence of undernourishment (%) 16.7 13.9 <5.0GDP per capita (US$, PPP) 1 100 1 269 1 589Domestic food price volatility (index) 10.2 6.7Cereal import dependency ratio (%) 3 6.7 4.7Underweight, children under-5 (%) 30.1 27.9Improved water source (% pop) 28.1 45.5 67.2Food supplyFood production value, (2004-2006 mln I$) 1 245 1 579 3 288Agriculture, value added (% GDP) 46 42 42Food exports (mln US$) 92 124 150Food imports (mln US$) 88 82 382Production indices (2004-06=100)Net food 57 72 151Net crops 54 69 139Cereals 50 72 183Vegetable oils 68 68 119Roots and tubers 21 47 143Fruit and vegetables 55 82 117Sugar 92 93 107Livestock 63 72 147Milk 42 48 137Meat 73 84 151Fish 70 109 101Net trade (mln US$)Cereals -14 -24 -191Fruit and vegetables -11 -3 -1Meat -2 0 -1Dairy products -22 -16 -29Fish -3 -1 -11EnvironmentForest area (%) 12 11 10Renewable water res withdrawn (% of total) 98Terrestrial protect areas (% total land area) 3 3 6Organic area (% total agricultural area) 0Water withdrawal by agriculture (% of total) 98Biofuel production (thousand kt of oil eq.) 1 1 1Wood pellet prod. (1 000 tonnes)Net GHG emissions from AFOLU (CO2 eq, Mt) 23 26 34
150

Malta
1990 2000 2014
The settingPopulation, total (mln) 0.4 0.4 0.4Population, rural (mln) 0 0 0Govt expenditure on ag (% total outlays)Area harvested (mln ha) 0 0 0Cropping intensity ratio 26.7 46.1Water resources (1 000 m3/person/year) 0 0 0Area equipped for irrigation (1 000 ha) 4Area irrigated (% area equipped for irrigation) 87.8Employment in agriculture (%) 1.7 1Employment in agriculture, female (%) 0.7 0.5Fertilizers, Nitrogen (kg of nutrients per ha) 56 218.8Fertilizers, Phosphate (kg of nutrients per ha) 18.1 0Fertilizers, Potash (kg nutrients per ha) 20.1 0.3Energy consump, power irrigation (mln kWh) 1 1 1Agr value added per worker (constant US$) 35 909 39 112 56 327Hunger dimensionsDietary energy supply (kcal/pc/day)Average dietary energy supply adequacy (%) 126 133 136Dietary en supp, cereals/roots/tubers (%) 36 37 35Prevalence of undernourishment (%) <5.0 <5.0 <5.0GDP per capita (US$, PPP) 16 596 25 841 28 822Domestic food price volatility (index) 15 9.5Cereal import dependency ratio (%) 95.4 94.6 89.3Underweight, children under-5 (%)Improved water source (% pop) 99.8 100 100Food supplyFood production value, (2004-2006 mln I$) 62 84 72Agriculture, value added (% GDP) 3 2 2Food exports (mln US$) 18 33 121Food imports (mln US$) 146 203 470Production indices (2004-06=100)Net food 79 107 92Net crops 78 102 99Cereals 64 90 134Vegetable oils 400 75 125Roots and tubers 81 170 61Fruit and vegetables 78 95 100SugarLivestock 81 110 86Milk 60 117 99Meat 87 112 82Fish 32 114 255Net trade (mln US$)Cereals -32 -51 -78Fruit and vegetables -20 -33 -78Meat -25 -31 -96Dairy products -23 -25 -53Fish -12 -9 15EnvironmentForest area (%) 1 1 1Renewable water res withdrawn (% of total) 35Terrestrial protect areas (% total land area) 0 15 22Organic area (% total agricultural area) 0Water withdrawal by agriculture (% of total) 35Biofuel production (thousand kt of oil eq.)Wood pellet prod. (1 000 tonnes) 0Net GHG emissions from AFOLU (CO2 eq, Mt) 0 0 0
151

Mauritania
1990 2000 2014
The settingPopulation, total (mln) 2 2.7 4Population, rural (mln) 1.2 1.6 2.3Govt expenditure on ag (% total outlays)Area harvested (mln ha) 0 0 0Cropping intensity ratio 0 0Water resources (1 000 m3/person/year) 6 4 3Area equipped for irrigation (1 000 ha) 45Area irrigated (% area equipped for irrigation)Employment in agriculture (%)Employment in agriculture, female (%)Fertilizers, Nitrogen (kg of nutrients per ha)Fertilizers, Phosphate (kg of nutrients per ha)Fertilizers, Potash (kg nutrients per ha)Energy consump, power irrigation (mln kWh)Agr value added per worker (constant US$) 1 122 1 010 1 102Hunger dimensionsDietary energy supply (kcal/pc/day) 2 511 2 626 2 937Average dietary energy supply adequacy (%) 117 120 132Dietary en supp, cereals/roots/tubers (%) 57 51 51Prevalence of undernourishment (%) 14.6 11.5 5.6GDP per capita (US$, PPP) 2 459 2 436 2 945Domestic food price volatility (index) 6.4 5.5Cereal import dependency ratio (%) 62.3 68.2 74Underweight, children under-5 (%) 43.3 30.4 19.5Improved water source (% pop) 30.3 40.4 49.6Food supplyFood production value, (2004-2006 mln I$) 335 387 521Agriculture, value added (% GDP) 30 36 23Food exports (mln US$) 43 13 19Food imports (mln US$) 105 135 409Production indices (2004-06=100)Net food 77 89 120Net crops 65 107 166Cereals 68 114 215Vegetable oils 148 163 103Roots and tubers 80 90 103Fruit and vegetables 53 100 89SugarLivestock 79 86 112Milk 73 89 110Meat 82 85 114FishNet trade (mln US$)Cereals -40 -53 -219Fruit and vegetables -6 -8 -29Meat 0 -3 -12Dairy products -20 -11 -66Fish 120 87 340EnvironmentForest area (%) 0 0 0Renewable water res withdrawn (% of total) 91Terrestrial protect areas (% total land area) 1 1 1Organic area (% total agricultural area)Water withdrawal by agriculture (% of total) 91Biofuel production (thousand kt of oil eq.)Wood pellet prod. (1 000 tonnes)Net GHG emissions from AFOLU (CO2 eq, Mt) 6 8 8
152

Mauritius
1990 2000 2014
The settingPopulation, total (mln) 1.1 1.2 1.2Population, rural (mln) 0.6 0.7 0.7Govt expenditure on ag (% total outlays)Area harvested (mln ha) 6 5 4Cropping intensity ratio 50 50.6Water resources (1 000 m3/person/year) 3 2 2Area equipped for irrigation (1 000 ha) 19Area irrigated (% area equipped for irrigation) 98Employment in agriculture (%) 16.7 12.1 7.8Employment in agriculture, female (%) 14.3 10.6 6.5Fertilizers, Nitrogen (kg of nutrients per ha) 122.1 120Fertilizers, Phosphate (kg of nutrients per ha) 46.5 29.7Fertilizers, Potash (kg nutrients per ha) 130.9 74.5Energy consump, power irrigation (mln kWh) 0 39 45Agr value added per worker (constant US$) 4 407 5 667 9 121Hunger dimensionsDietary energy supply (kcal/pc/day) 2 796 2 907 3 135Average dietary energy supply adequacy (%) 119 123 129Dietary en supp, cereals/roots/tubers (%) 47 47 49Prevalence of undernourishment (%) 8.1 7.1 <5.0GDP per capita (US$, PPP) 7 570 11 353 17 146Domestic food price volatility (index) 7.4 7.2Cereal import dependency ratio (%) 99.3 99.9 100Underweight, children under-5 (%) 13Improved water source (% pop) 99.2 99.2 99.8Food supplyFood production value, (2004-2006 mln I$) 230 243 241Agriculture, value added (% GDP) 13 7 3Food exports (mln US$) 365 233 320Food imports (mln US$) 162 229 698Production indices (2004-06=100)Net food 90 95 94Net crops 107 102 82Cereals 537 146 430Vegetable oils 354 101 104Roots and tubers 148 114 144Fruit and vegetables 57 105 110Sugar 111 102 76Livestock 46 73 130Milk 275 118 125Meat 43 67 139Fish 143 98 79Net trade (mln US$)Cereals -53 -60 -174Fruit and vegetables -17 -34 -82Meat -21 -25 -72Dairy products -34 -40 -116Fish -7 -5 129EnvironmentForest area (%) 19 19 17Renewable water res withdrawn (% of total) 68Terrestrial protect areas (% total land area) 2 4 4Organic area (% total agricultural area) 0Water withdrawal by agriculture (% of total) 68Biofuel production (thousand kt of oil eq.) 12 12 11Wood pellet prod. (1 000 tonnes) 0Net GHG emissions from AFOLU (CO2 eq, Mt) 0 0 0
153

Mexico
1990 2000 2014
The settingPopulation, total (mln) 86.1 103.9 123.8Population, rural (mln) 24.6 26.3 26Govt expenditure on ag (% total outlays) 3.4 3Area harvested (mln ha) 40 44 61Cropping intensity ratio 0.4 0.4Water resources (1 000 m3/person/year) 5 4 4Area equipped for irrigation (1 000 ha) 6 500Area irrigated (% area equipped for irrigation) 86.1Employment in agriculture (%) 22.6 18 13.4Employment in agriculture, female (%) 3.4 7.2 3.6Fertilizers, Nitrogen (kg of nutrients per ha) 38.6 58.6Fertilizers, Phosphate (kg of nutrients per ha) 20.5 4.6Fertilizers, Potash (kg nutrients per ha) 7.7 8.8Energy consump, power irrigation (mln kWh) 28 985 985Agr value added per worker (constant US$) 2 712 3 111 4 416Hunger dimensionsDietary energy supply (kcal/pc/day) 2 986 3 035 3 089Average dietary energy supply adequacy (%) 132 132 130Dietary en supp, cereals/roots/tubers (%) 47 47 44Prevalence of undernourishment (%) 6.9 <5.0 <5.0GDP per capita (US$, PPP) 12 479 14 704 16 291Domestic food price volatility (index) 4.4 8Cereal import dependency ratio (%) 23.2 33.3 30.7Underweight, children under-5 (%) 6 2.8Improved water source (% pop) 82.3 88.6 94.9Food supplyFood production value, (2004-2006 mln I$) 20 133 27 000 35 142Agriculture, value added (% GDP) 8 4 3Food exports (mln US$) 2 075 4 980 16 230Food imports (mln US$) 4 166 7 599 21 503Production indices (2004-06=100)Net food 66 88 115Net crops 74 89 117Cereals 83 90 107Vegetable oils 121 92 129Roots and tubers 77 100 106Fruit and vegetables 60 87 122Sugar 79 88 122Livestock 60 87 113Milk 62 93 110Meat 60 85 113Fish 96 95 124Net trade (mln US$)Cereals -1 064 -1 570 -4 463Fruit and vegetables 1 051 2 357 6 934Meat -373 -1 423 -2 427Dairy products -714 -526 -1 434Fish 297 564 416EnvironmentForest area (%) 36 34 33Renewable water res withdrawn (% of total) 77Terrestrial protect areas (% total land area) 2 8 13Organic area (% total agricultural area) 0Water withdrawal by agriculture (% of total) 77Biofuel production (thousand kt of oil eq.) 161 204 219Wood pellet prod. (1 000 tonnes) 4Net GHG emissions from AFOLU (CO2 eq, Mt) 123 113 108
154

Mongolia
1990 2000 2014
The settingPopulation, total (mln) 2.2 2.4 2.9Population, rural (mln) 0.9 1 0.8Govt expenditure on ag (% total outlays) 2.1 5.9Area harvested (mln ha) 1 0 0Cropping intensity ratio 0 0Water resources (1 000 m3/person/year) 16 15 12Area equipped for irrigation (1 000 ha) 84Area irrigated (% area equipped for irrigation) 74.6 74.6Employment in agriculture (%) 39.5 48.6 32.6Employment in agriculture, female (%) 36.9 46.5 32.2Fertilizers, Nitrogen (kg of nutrients per ha) 5.7 25.1Fertilizers, Phosphate (kg of nutrients per ha) 0 0Fertilizers, Potash (kg nutrients per ha) 0 0Energy consump, power irrigation (mln kWh) 94 94 94Agr value added per worker (constant US$) 2 426 2 161 4 301Hunger dimensionsDietary energy supply (kcal/pc/day) 2 097 2 177 2 564Average dietary energy supply adequacy (%) 95 94 109Dietary en supp, cereals/roots/tubers (%) 44 46 47Prevalence of undernourishment (%) 29.9 38.2 20.5GDP per capita (US$, PPP) 4 303 3 910 9 132Domestic food price volatility (index) 47.6 16.7Cereal import dependency ratio (%) 15.8 55.3 35.1Underweight, children under-5 (%) 10.8 11.6 1.6Improved water source (% pop) 62.3 68.4 84.6Food supplyFood production value, (2004-2006 mln I$) 829 891 891Agriculture, value added (% GDP) 13 31 16Food exports (mln US$) 91 20 42Food imports (mln US$) 56 76 388Production indices (2004-06=100)Net food 135 145 145Net crops 226 73 247Cereals 613 127 389Vegetable oils 109Roots and tubers 125 60 223Fruit and vegetables 65 66 177SugarLivestock 133 150 136Milk 77 113 134Meat 147 161 139FishNet trade (mln US$)Cereals -10 -44 -87Fruit and vegetables -8 -51Meat 40 16 -3Dairy products -6 -4 -9Fish -2 0 -4EnvironmentForest area (%) 8 8 7Renewable water res withdrawn (% of total) 44Terrestrial protect areas (% total land area) 4 13 14Organic area (% total agricultural area)Water withdrawal by agriculture (% of total) 44Biofuel production (thousand kt of oil eq.)Wood pellet prod. (1 000 tonnes)Net GHG emissions from AFOLU (CO2 eq, Mt) 42 46 44
155

Montenegro
1990 2000 2014
The settingPopulation, total (mln) 0.6Population, rural (mln) 0.2Govt expenditure on ag (% total outlays)Area harvested (mln ha) 0Cropping intensity ratioWater resources (1 000 m3/person/year)Area equipped for irrigation (1 000 ha) 2Area irrigated (% area equipped for irrigation)Employment in agriculture (%) 9 5.7Employment in agriculture, female (%) 6.9 4.8Fertilizers, Nitrogen (kg of nutrients per ha) 7.3Fertilizers, Phosphate (kg of nutrients per ha) 2.8Fertilizers, Potash (kg nutrients per ha) 2.3Energy consump, power irrigation (mln kWh) 0 5Agr value added per worker (constant US$) 5 620Hunger dimensionsDietary energy supply (kcal/pc/day)Average dietary energy supply adequacy (%) 147Dietary en supp, cereals/roots/tubers (%) 35Prevalence of undernourishment (%) <5.0 <5.0 <5.0GDP per capita (US$, PPP) 9 703 14 152Domestic food price volatility (index) 9.1Cereal import dependency ratio (%) 89.1Underweight, children under-5 (%) 1Improved water source (% pop) 97.4 97.8 98Food supplyFood production value, (2004-2006 mln I$) 167Agriculture, value added (% GDP) 12 10Food exports (mln US$) 38Food imports (mln US$) 422Production indices (2004-06=100)Net food 95Net crops 102Cereals 96Vegetable oils 154Roots and tubers 85Fruit and vegetables 106SugarLivestock 88Milk 100Meat 40Fish 0 0 382Net trade (mln US$)Cereals -70Fruit and vegetables -39Meat -100Dairy products -52Fish -14EnvironmentForest area (%) 40Renewable water res withdrawn (% of total) 1Terrestrial protect areas (% total land area) 14 14 15Organic area (% total agricultural area) 1Water withdrawal by agriculture (% of total) 1Biofuel production (thousand kt of oil eq.)Wood pellet prod. (1 000 tonnes) 3Net GHG emissions from AFOLU (CO2 eq, Mt) 0
156

Morocco
1990 2000 2014
The settingPopulation, total (mln) 24.7 28.7 33.5Population, rural (mln) 12.7 13.4 14Govt expenditure on ag (% total outlays)Area harvested (mln ha) 6 5 10Cropping intensity ratio 0.2 0.2Water resources (1 000 m3/person/year) 1 1 1Area equipped for irrigation (1 000 ha) 1 458Area irrigated (% area equipped for irrigation)Employment in agriculture (%) 3.9 5.1 39.2Employment in agriculture, female (%) 3.1 5.2 59.2Fertilizers, Nitrogen (kg of nutrients per ha) 22.9 21.1Fertilizers, Phosphate (kg of nutrients per ha) 24.2 3.2Fertilizers, Potash (kg nutrients per ha) 8.2 3.9Energy consump, power irrigation (mln kWh) 258 258 998Agr value added per worker (constant US$) 2 019 1 565 4 507Hunger dimensionsDietary energy supply (kcal/pc/day) 3 021 3 086 3 364Average dietary energy supply adequacy (%) 136 134 144Dietary en supp, cereals/roots/tubers (%) 63 64 61Prevalence of undernourishment (%) 5.9 6.5 <5.0GDP per capita (US$, PPP) 3 901 4 430 6 967Domestic food price volatility (index) 11.1 6.4Cereal import dependency ratio (%) 35.4 58.2 36.4Underweight, children under-5 (%) 8.1 9.9 3.1Improved water source (% pop) 72.8 78.1 83.6Food supplyFood production value, (2004-2006 mln I$) 4 748 4 954 9 139Agriculture, value added (% GDP) 19 15 16Food exports (mln US$) 572 601 1 870Food imports (mln US$) 514 1 284 4 322Production indices (2004-06=100)Net food 69 72 134Net crops 69 65 129Cereals 82 23 136Vegetable oils 76 65 179Roots and tubers 56 70 131Fruit and vegetables 57 75 119Sugar 102 108 71Livestock 71 88 147Milk 64 83 160Meat 72 88 150Fish 60 96 133Net trade (mln US$)Cereals -219 -727 -2 228Fruit and vegetables 476 463 1 245Meat -8 -3 -27Dairy products -67 -44 -148Fish 520 941 1 582EnvironmentForest area (%) 11 11 12Renewable water res withdrawn (% of total) 88Terrestrial protect areas (% total land area) 0 1 22Organic area (% total agricultural area) 0Water withdrawal by agriculture (% of total) 88Biofuel production (thousand kt of oil eq.) 3 4 2Wood pellet prod. (1 000 tonnes)Net GHG emissions from AFOLU (CO2 eq, Mt) 4 3 14
157

Mozambique
1990 2000 2014
The settingPopulation, total (mln) 13.6 18.3 26.5Population, rural (mln) 10.7 13 18Govt expenditure on ag (% total outlays)Area harvested (mln ha) 5 6 11Cropping intensity ratio 0.1 0.1Water resources (1 000 m3/person/year) 16 12 8Area equipped for irrigation (1 000 ha) 118Area irrigated (% area equipped for irrigation) 33.9Employment in agriculture (%) 80.5Employment in agriculture, female (%) 89.9Fertilizers, Nitrogen (kg of nutrients per ha) 0.4 4.6Fertilizers, Phosphate (kg of nutrients per ha) 0.3 0.6Fertilizers, Potash (kg nutrients per ha) 0 0.8Energy consump, power irrigation (mln kWh)Agr value added per worker (constant US$) 167 158 283Hunger dimensionsDietary energy supply (kcal/pc/day) 1 737 1 991 2 328Average dietary energy supply adequacy (%) 83 94 110Dietary en supp, cereals/roots/tubers (%) 76 77 73Prevalence of undernourishment (%) 56.1 42 25.3GDP per capita (US$, PPP) 462 582 1 070Domestic food price volatility (index) 5.3 6.7Cereal import dependency ratio (%) 57.3 23.1 27.3Underweight, children under-5 (%) 21.2 15.6Improved water source (% pop) 33.6 41.1 49.2Food supplyFood production value, (2004-2006 mln I$) 1 093 1 535 2 828Agriculture, value added (% GDP) 37 24 29Food exports (mln US$) 31 47 297Food imports (mln US$) 191 194 632Production indices (2004-06=100)Net food 62 88 162Net crops 60 77 164Cereals 55 119 173Vegetable oils 72 90 188Roots and tubers 76 93 176Fruit and vegetables 85 61 192Sugar 16 19 184Livestock 45 107 129Milk 94 92 103Meat 41 111 122Fish 36 41 222Net trade (mln US$)Cereals -98 -74 -370Fruit and vegetables 2 11 36Meat -6 -8 -29Dairy products -7 -13 -44Fish 41 90 -23EnvironmentForest area (%) 55 52 49Renewable water res withdrawn (% of total) 78Terrestrial protect areas (% total land area) 15 15 18Organic area (% total agricultural area) 0Water withdrawal by agriculture (% of total) 78Biofuel production (thousand kt of oil eq.) 1 1 7Wood pellet prod. (1 000 tonnes)Net GHG emissions from AFOLU (CO2 eq, Mt) 51 49 49
158

Myanmar
1990 2000 2014
The settingPopulation, total (mln) 42.1 48.5 53.7Population, rural (mln) 31.8 35.3 35.3Govt expenditure on ag (% total outlays) 10.3 6.3Area harvested (mln ha) 14 22 30Cropping intensity ratio 1.4 2Water resources (1 000 m3/person/year) 28 24 22Area equipped for irrigation (1 000 ha) 2 295Area irrigated (% area equipped for irrigation)Employment in agriculture (%) 69.7 62.7Employment in agriculture, female (%)Fertilizers, Nitrogen (kg of nutrients per ha) 7 12.2Fertilizers, Phosphate (kg of nutrients per ha) 2.4 2Fertilizers, Potash (kg nutrients per ha) 0.9 1.5Energy consump, power irrigation (mln kWh) 0 0 0Agr value added per worker (constant US$)Hunger dimensionsDietary energy supply (kcal/pc/day) 1 694 1 902 2 629Average dietary energy supply adequacy (%) 77 84 113Dietary en supp, cereals/roots/tubers (%) 69 68 52Prevalence of undernourishment (%) 62.6 52.4 14.2GDP per capita (US$, PPP)Domestic food price volatility (index) 5.2 8.1Cereal import dependency ratio (%) -5.1 -3.1 -2.9Underweight, children under-5 (%) 28.8 30.1 22.6Improved water source (% pop) 55.6 66.9 85.7Food supplyFood production value, (2004-2006 mln I$) 5 462 9 244 16 517Agriculture, value added (% GDP) 57 57Food exports (mln US$) 184 354 1 584Food imports (mln US$) 75 227 898Production indices (2004-06=100)Net food 43 73 130Net crops 43 71 121Cereals 49 76 105Vegetable oils 36 54 141Roots and tubers 30 53 179Fruit and vegetables 48 80 120Sugar 27 76 130Livestock 25 50 192Milk 53 62 172Meat 21 47 193Fish 33 53 208Net trade (mln US$)Cereals 62 11 -24Fruit and vegetables 88 252 1 345Meat 0 0 -16Dairy productsFish 13 183 638EnvironmentForest area (%) 60 53 48Renewable water res withdrawn (% of total) 89Terrestrial protect areas (% total land area) 3 4 7Organic area (% total agricultural area) 0Water withdrawal by agriculture (% of total) 89Biofuel production (thousand kt of oil eq.) 3 26 27Wood pellet prod. (1 000 tonnes)Net GHG emissions from AFOLU (CO2 eq, Mt) 156 158 153
159

Namibia
1990 2000 2014
The settingPopulation, total (mln) 1.4 1.9 2.3Population, rural (mln) 1 1.3 1.4Govt expenditure on ag (% total outlays) 5 6.5Area harvested (mln ha) 0 0 0Cropping intensity ratio 0 0Water resources (1 000 m3/person/year) 28 21 17Area equipped for irrigation (1 000 ha) 8Area irrigated (% area equipped for irrigation) 100Employment in agriculture (%) 48.2 31.1 27.4Employment in agriculture, female (%) 52 29.1 26.6Fertilizers, Nitrogen (kg of nutrients per ha) 1 5Fertilizers, Phosphate (kg of nutrients per ha) 0.3 0.5Fertilizers, Potash (kg nutrients per ha) 0.2 0.6Energy consump, power irrigation (mln kWh) 8 8 11Agr value added per worker (constant US$) 1 845 2 651 2 080Hunger dimensionsDietary energy supply (kcal/pc/day) 2 054 2 229 2 062Average dietary energy supply adequacy (%) 93 99 89Dietary en supp, cereals/roots/tubers (%) 63 59 55Prevalence of undernourishment (%) 35.9 30.4 42.3GDP per capita (US$, PPP) 5 716 6 110 9 276Domestic food price volatility (index) 7.3 7.2Cereal import dependency ratio (%) 69.9 69.1 55.9Underweight, children under-5 (%) 21.5 20.3 13.2Improved water source (% pop) 67.2 79.1 91.7Food supplyFood production value, (2004-2006 mln I$) 364 375 406Agriculture, value added (% GDP) 10 12 6Food exports (mln US$) 141 67 362Food imports (mln US$) 107 181 599Production indices (2004-06=100)Net food 81 84 91Net crops 55 77 107Cereals 66 83 54Vegetable oils 168 177 38Roots and tubers 67 81 114Fruit and vegetables 22 50 153SugarLivestock 89 87 84Milk 68 79 107Meat 93 89 81Fish 48 108 89Net trade (mln US$)Cereals -36 -122Fruit and vegetables -26 -76Meat 53 10 127Dairy products -11 -43Fish 58 259 717EnvironmentForest area (%) 11 10 9Renewable water res withdrawn (% of total) 70Terrestrial protect areas (% total land area) 12 20 43Organic area (% total agricultural area) 0Water withdrawal by agriculture (% of total) 70Biofuel production (thousand kt of oil eq.)Wood pellet prod. (1 000 tonnes)Net GHG emissions from AFOLU (CO2 eq, Mt) 15 16 19
160

Nepal
1990 2000 2014
The settingPopulation, total (mln) 18.1 23.2 28.1Population, rural (mln) 16.5 20.1 23.1Govt expenditure on ag (% total outlays) 4.9 8.5Area harvested (mln ha) 6 7 9Cropping intensity ratio 1.4 1.7Water resources (1 000 m3/person/year) 12 9 8Area equipped for irrigation (1 000 ha) 1 332Area irrigated (% area equipped for irrigation)Employment in agriculture (%) 81.2 65.7Employment in agriculture, female (%) 90.5 72.8Fertilizers, Nitrogen (kg of nutrients per ha) 2.4 23.4Fertilizers, Phosphate (kg of nutrients per ha) 2.3 4.3Fertilizers, Potash (kg nutrients per ha) 0.4 0.7Energy consump, power irrigation (mln kWh) 0 0 0Agr value added per worker (constant US$) 269 263 271Hunger dimensionsDietary energy supply (kcal/pc/day) 2 211 2 280 2 653Average dietary energy supply adequacy (%) 106 108 121Dietary en supp, cereals/roots/tubers (%) 76 74 70Prevalence of undernourishment (%) 22.8 22.2 7.8GDP per capita (US$, PPP) 1 240 1 577 2 173Domestic food price volatility (index) 10 8.6Cereal import dependency ratio (%) 1.2 1.7 3.9Underweight, children under-5 (%) 43 29.1Improved water source (% pop) 66.5 77.1 88.1Food supplyFood production value, (2004-2006 mln I$) 2 783 3 714 5 553Agriculture, value added (% GDP) 52 41 34Food exports (mln US$) 39 28 170Food imports (mln US$) 69 168 829Production indices (2004-06=100)Net food 65 87 130Net crops 63 85 130Cereals 77 94 109Vegetable oils 74 88 115Roots and tubers 41 67 146Fruit and vegetables 46 77 168Sugar 41 88 124Livestock 71 89 136Milk 68 86 131Meat 73 92 138Fish 34 74 135Net trade (mln US$)Cereals -5 -49 -200Fruit and vegetables 16 -18 -91Meat 0 0 7Dairy products -5 -2 -11Fish 0 0 -7EnvironmentForest area (%) 34 27 25Renewable water res withdrawn (% of total) 98Terrestrial protect areas (% total land area) 8 17 16Organic area (% total agricultural area) 0Water withdrawal by agriculture (% of total) 98Biofuel production (thousand kt of oil eq.) 11 17 21Wood pellet prod. (1 000 tonnes)Net GHG emissions from AFOLU (CO2 eq, Mt) 49 57 28
161

Netherlands
1990 2000 2014
The settingPopulation, total (mln) 14.9 15.9 16.8Population, rural (mln) 4.7 3.7 2.6Govt expenditure on ag (% total outlays)Area harvested (mln ha) 15 26 7Cropping intensity ratio 7.3 13.5Water resources (1 000 m3/person/year) 6 6 5Area equipped for irrigation (1 000 ha) 486Area irrigated (% area equipped for irrigation) 44.2Employment in agriculture (%) 4.5 3 2.5Employment in agriculture, female (%) 3.4 2.2 1.5Fertilizers, Nitrogen (kg of nutrients per ha) 320.7 274.5Fertilizers, Phosphate (kg of nutrients per ha) 57.9 14.8Fertilizers, Potash (kg nutrients per ha) 59.7 20.8Energy consump, power irrigation (mln kWh) 6 6 6Agr value added per worker (constant US$) 31 040 43 101 70 859Hunger dimensionsDietary energy supply (kcal/pc/day)Average dietary energy supply adequacy (%) 128 127 123Dietary en supp, cereals/roots/tubers (%) 22 21 27Prevalence of undernourishment (%) <5.0 <5.0 <5.0GDP per capita (US$, PPP) 32 534 41 771 45 021Domestic food price volatility (index) 4.8 8.8Cereal import dependency ratio (%) 68.8 74.1 84.3Underweight, children under-5 (%)Improved water source (% pop) 100 100 100Food supplyFood production value, (2004-2006 mln I$) 12 169 12 319 13 343Agriculture, value added (% GDP) 4 2 2Food exports (mln US$) 21 160 17 073 56 768Food imports (mln US$) 12 317 11 252 41 002Production indices (2004-06=100)Net food 103 105 113Net crops 90 104 109Cereals 82 100 104Vegetable oils 255 65 93Roots and tubers 101 119 100Fruit and vegetables 78 94 117Sugar 147 116 97Livestock 106 107 115Milk 102 102 114Meat 109 111 116Fish 87 98 66Net trade (mln US$)Cereals -328 1 -853Fruit and vegetables 1 421 1 538 5 085Meat 4 286 2 525 4 732Dairy products 1 972 1 307 3 839Fish 543 183 270EnvironmentForest area (%) 10 11 11Renewable water res withdrawn (% of total) 1Terrestrial protect areas (% total land area) 12 19 20Organic area (% total agricultural area) 3Water withdrawal by agriculture (% of total) 1Biofuel production (thousand kt of oil eq.) 6 12 10 350Wood pellet prod. (1 000 tonnes) 300Net GHG emissions from AFOLU (CO2 eq, Mt) 24 21 20
162
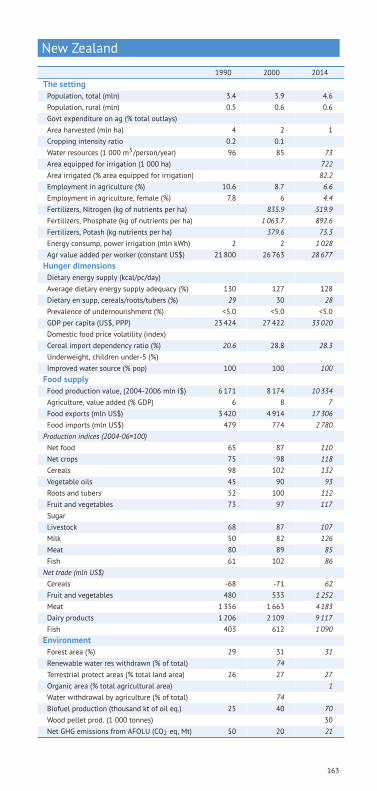
New Zealand
1990 2000 2014
The settingPopulation, total (mln) 3.4 3.9 4.6Population, rural (mln) 0.5 0.6 0.6Govt expenditure on ag (% total outlays)Area harvested (mln ha) 4 2 1Cropping intensity ratio 0.2 0.1Water resources (1 000 m3/person/year) 96 85 73Area equipped for irrigation (1 000 ha) 722Area irrigated (% area equipped for irrigation) 82.2Employment in agriculture (%) 10.6 8.7 6.6Employment in agriculture, female (%) 7.8 6 4.4Fertilizers, Nitrogen (kg of nutrients per ha) 835.9 519.9Fertilizers, Phosphate (kg of nutrients per ha) 1 063.7 892.6Fertilizers, Potash (kg nutrients per ha) 379.6 73.3Energy consump, power irrigation (mln kWh) 2 2 1 028Agr value added per worker (constant US$) 21 800 26 763 28 677Hunger dimensionsDietary energy supply (kcal/pc/day)Average dietary energy supply adequacy (%) 130 127 128Dietary en supp, cereals/roots/tubers (%) 29 30 28Prevalence of undernourishment (%) <5.0 <5.0 <5.0GDP per capita (US$, PPP) 23 424 27 422 33 020Domestic food price volatility (index)Cereal import dependency ratio (%) 20.6 28.8 28.3Underweight, children under-5 (%)Improved water source (% pop) 100 100 100Food supplyFood production value, (2004-2006 mln I$) 6 171 8 174 10 334Agriculture, value added (% GDP) 6 8 7Food exports (mln US$) 3 420 4 914 17 306Food imports (mln US$) 479 774 2 780Production indices (2004-06=100)Net food 65 87 110Net crops 75 98 118Cereals 98 102 132Vegetable oils 45 90 93Roots and tubers 52 100 112Fruit and vegetables 73 97 117SugarLivestock 68 87 107Milk 50 82 126Meat 80 89 85Fish 61 102 86Net trade (mln US$)Cereals -68 -71 62Fruit and vegetables 480 533 1 252Meat 1 356 1 663 4 183Dairy products 1 206 2 109 9 117Fish 403 612 1 090EnvironmentForest area (%) 29 31 31Renewable water res withdrawn (% of total) 74Terrestrial protect areas (% total land area) 26 27 27Organic area (% total agricultural area) 1Water withdrawal by agriculture (% of total) 74Biofuel production (thousand kt of oil eq.) 25 40 70Wood pellet prod. (1 000 tonnes) 30Net GHG emissions from AFOLU (CO2 eq, Mt) 50 20 21
163
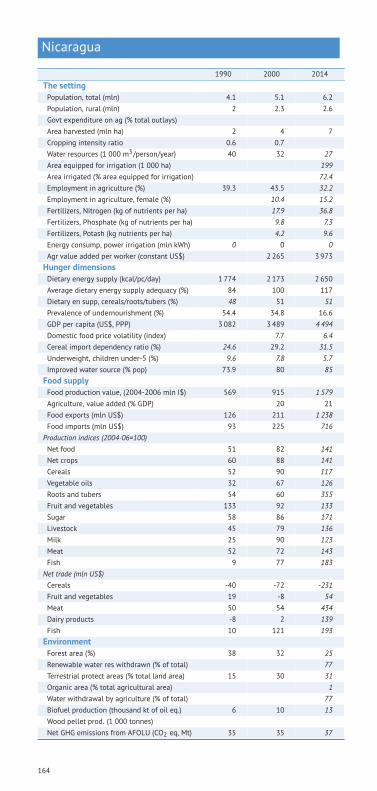
Nicaragua
1990 2000 2014
The settingPopulation, total (mln) 4.1 5.1 6.2Population, rural (mln) 2 2.3 2.6Govt expenditure on ag (% total outlays)Area harvested (mln ha) 2 4 7Cropping intensity ratio 0.6 0.7Water resources (1 000 m3/person/year) 40 32 27Area equipped for irrigation (1 000 ha) 199Area irrigated (% area equipped for irrigation) 72.4Employment in agriculture (%) 39.3 43.5 32.2Employment in agriculture, female (%) 10.4 15.2Fertilizers, Nitrogen (kg of nutrients per ha) 17.9 36.8Fertilizers, Phosphate (kg of nutrients per ha) 9.8 7.3Fertilizers, Potash (kg nutrients per ha) 4.2 9.6Energy consump, power irrigation (mln kWh) 0 0 0Agr value added per worker (constant US$) 2 265 3 973Hunger dimensionsDietary energy supply (kcal/pc/day) 1 774 2 173 2 650Average dietary energy supply adequacy (%) 84 100 117Dietary en supp, cereals/roots/tubers (%) 48 51 51Prevalence of undernourishment (%) 54.4 34.8 16.6GDP per capita (US$, PPP) 3 082 3 489 4 494Domestic food price volatility (index) 7.7 6.4Cereal import dependency ratio (%) 24.6 29.2 31.5Underweight, children under-5 (%) 9.6 7.8 5.7Improved water source (% pop) 73.9 80 85Food supplyFood production value, (2004-2006 mln I$) 569 915 1 579Agriculture, value added (% GDP) 20 21Food exports (mln US$) 126 211 1 238Food imports (mln US$) 93 225 716Production indices (2004-06=100)Net food 51 82 141Net crops 60 88 141Cereals 52 90 117Vegetable oils 32 67 126Roots and tubers 54 60 355Fruit and vegetables 133 92 133Sugar 58 86 171Livestock 45 79 136Milk 25 90 123Meat 52 72 143Fish 9 77 183Net trade (mln US$)Cereals -40 -72 -231Fruit and vegetables 19 -8 54Meat 50 54 434Dairy products -8 2 139Fish 10 121 193EnvironmentForest area (%) 38 32 25Renewable water res withdrawn (% of total) 77Terrestrial protect areas (% total land area) 15 30 31Organic area (% total agricultural area) 1Water withdrawal by agriculture (% of total) 77Biofuel production (thousand kt of oil eq.) 6 10 13Wood pellet prod. (1 000 tonnes)Net GHG emissions from AFOLU (CO2 eq, Mt) 35 35 37
164

Niger
1990 2000 2014
The settingPopulation, total (mln) 7.8 11 18.5Population, rural (mln) 6.6 9.2 15.1Govt expenditure on ag (% total outlays)Area harvested (mln ha) 7 7 10Cropping intensity ratio 0.2 0.2Water resources (1 000 m3/person/year) 4 3 2Area equipped for irrigation (1 000 ha) 100Area irrigated (% area equipped for irrigation) 88Employment in agriculture (%) 56.9Employment in agriculture, female (%) 37.8Fertilizers, Nitrogen (kg of nutrients per ha) 0.2 0.8Fertilizers, Phosphate (kg of nutrients per ha) 0.1 0.2Fertilizers, Potash (kg nutrients per ha) 0 0.3Energy consump, power irrigation (mln kWh)Agr value added per worker (constant US$) 233Hunger dimensionsDietary energy supply (kcal/pc/day) 2 142 2 297 2 595Average dietary energy supply adequacy (%) 102 110 125Dietary en supp, cereals/roots/tubers (%) 76 69 61Prevalence of undernourishment (%) 27.7 22.8 9.5GDP per capita (US$, PPP) 924 778 887Domestic food price volatility (index) 16.5 11.1Cereal import dependency ratio (%) 4.4 8.6 7.3Underweight, children under-5 (%) 41 43.6 37.9Improved water source (% pop) 34.3 42.2 52.3Food supplyFood production value, (2004-2006 mln I$) 1 004 1 508 2 859Agriculture, value added (% GDP) 35 38 37Food exports (mln US$) 50 76 191Food imports (mln US$) 97 93 460Production indices (2004-06=100)Net food 47 71 134Net crops 47 64 160Cereals 62 61 123Vegetable oils 5 60 206Roots and tubers 88 109 185Fruit and vegetables 34 74 166Sugar 43 88 84Livestock 46 80 103Milk 53 81 129Meat 44 79 95Fish 8 37 103Net trade (mln US$)Cereals -39 -39 -236Fruit and vegetables -6 18 60Meat -1 0 -1Dairy products -9 -9 -38Fish -1 1 -1EnvironmentForest area (%) 2 1 1Renewable water res withdrawn (% of total) 67Terrestrial protect areas (% total land area) 7 7 17Organic area (% total agricultural area) 0Water withdrawal by agriculture (% of total) 67Biofuel production (thousand kt of oil eq.) 0Wood pellet prod. (1 000 tonnes)Net GHG emissions from AFOLU (CO2 eq, Mt) 17 21 22
165

Nigeria
1990 2000 2014
The settingPopulation, total (mln) 95.6 122.9 178.5Population, rural (mln) 61.9 70.8 86.6Govt expenditure on ag (% total outlays) 0.8 0.9Area harvested (mln ha) 34 65 100Cropping intensity ratio 0.5 0.9Water resources (1 000 m3/person/year) 3 2 2Area equipped for irrigation (1 000 ha) 293Area irrigated (% area equipped for irrigation)Employment in agriculture (%)Employment in agriculture, female (%)Fertilizers, Nitrogen (kg of nutrients per ha) 4.8 3.3Fertilizers, Phosphate (kg of nutrients per ha) 0.6 0.8Fertilizers, Potash (kg nutrients per ha) 0.7 0.7Energy consump, power irrigation (mln kWh) 0 0Agr value added per worker (constant US$) 1 044 1 489 4 760Hunger dimensionsDietary energy supply (kcal/pc/day) 2 324 2 619 2 639Average dietary energy supply adequacy (%) 108 121 123Dietary en supp, cereals/roots/tubers (%) 68 65 66Prevalence of undernourishment (%) 21.3 9.2 7GDP per capita (US$, PPP) 3 030 2 836 5 423Domestic food price volatility (index) 11.5 4Cereal import dependency ratio (%) 6.4 13.6 21.7Underweight, children under-5 (%) 35.1 27.2 31Improved water source (% pop) 45.6 54.8 64Food supplyFood production value, (2004-2006 mln I$) 15 138 25 335 36 075Agriculture, value added (% GDP) 32 26 20Food exports (mln US$) 158 262 1 219Food imports (mln US$) 480 1 017 6 402Production indices (2004-06=100)Net food 48 81 115Net crops 47 79 109Cereals 66 82 102Vegetable oils 46 76 87Roots and tubers 39 76 118Fruit and vegetables 54 85 103Sugar 100 76 158Livestock 60 86 124Milk 80 88 129Meat 58 87 122Fish 55 81 174Net trade (mln US$)Cereals -119 -493 -3 211Fruit and vegetables -2 -17 159Meat 0 -1 -11Dairy products -73 -134 -519Fish -166 -169 -1 142EnvironmentForest area (%) 19 14 9Renewable water res withdrawn (% of total) 54Terrestrial protect areas (% total land area) 12 13 14Organic area (% total agricultural area) 0Water withdrawal by agriculture (% of total) 54Biofuel production (thousand kt of oil eq.) 1 1 1Wood pellet prod. (1 000 tonnes)Net GHG emissions from AFOLU (CO2 eq, Mt) 221 230 237
166

Norway
1990 2000 2014
The settingPopulation, total (mln) 4.2 4.5 5.1Population, rural (mln) 1.2 1.1 1Govt expenditure on ag (% total outlays)Area harvested (mln ha) 2 3 1Cropping intensity ratio 2.5 3.1Water resources (1 000 m3/person/year) 93 87 78Area equipped for irrigation (1 000 ha) 90Area irrigated (% area equipped for irrigation) 47.8Employment in agriculture (%) 6.4 4.3 2.2Employment in agriculture, female (%) 3.9 2.3 0.8Fertilizers, Nitrogen (kg of nutrients per ha) 117.8 116.1Fertilizers, Phosphate (kg of nutrients per ha) 33.1 23.6Fertilizers, Potash (kg nutrients per ha) 62.6 48Energy consump, power irrigation (mln kWh)Agr value added per worker (constant US$) 20 498 33 262 76 958Hunger dimensionsDietary energy supply (kcal/pc/day)Average dietary energy supply adequacy (%) 126 135 138Dietary en supp, cereals/roots/tubers (%) 32 32 31Prevalence of undernourishment (%) <5.0 <5.0 <5.0GDP per capita (US$, PPP) 42 752 58 093 62 411Domestic food price volatility (index) 7 12.1Cereal import dependency ratio (%) 30 30.1 40.2Underweight, children under-5 (%)Improved water source (% pop) 100 100 100Food supplyFood production value, (2004-2006 mln I$) 1 397 1 278 1 351Agriculture, value added (% GDP) 3 2 2Food exports (mln US$) 191 192 449Food imports (mln US$) 963 1 160 4 706Production indices (2004-06=100)Net food 108 99 104Net crops 136 92 77Cereals 114 99 67Vegetable oils 85 81 100Roots and tubers 134 85 88Fruit and vegetables 190 85 89SugarLivestock 101 101 109Milk 126 110 101Meat 80 94 115Fish 57 104 109Net trade (mln US$)Cereals -149 -185 -818Fruit and vegetables -358 -427 -1 400Meat 0 -19 -198Dairy products 79 56 -25Fish 1 822 2 935 7 547EnvironmentForest area (%) 25 25 28Renewable water res withdrawn (% of total) 29Terrestrial protect areas (% total land area) 7 9 16Organic area (% total agricultural area) 6Water withdrawal by agriculture (% of total) 29Biofuel production (thousand kt of oil eq.) 1 1 1Wood pellet prod. (1 000 tonnes) 56Net GHG emissions from AFOLU (CO2 eq, Mt) -6 -9 -20
167

Pakistan
1990 2000 2014
The settingPopulation, total (mln) 111.1 143.8 185.1Population, rural (mln) 77.1 96.2 116.3Govt expenditure on ag (% total outlays) 0.8 1.2Area harvested (mln ha) 35 46 64Cropping intensity ratio 1.4 1.7Water resources (1 000 m3/person/year) 2 2 1Area equipped for irrigation (1 000 ha) 20 200Area irrigated (% area equipped for irrigation)Employment in agriculture (%) 51.1 48.4 43.7Employment in agriculture, female (%) 72.2 72.9 75.7Fertilizers, Nitrogen (kg of nutrients per ha) 113.8 134.4Fertilizers, Phosphate (kg of nutrients per ha) 31 31.6Fertilizers, Potash (kg nutrients per ha) 1.1 0.9Energy consump, power irrigation (mln kWh)Agr value added per worker (constant US$) 857 1 064 1 083Hunger dimensionsDietary energy supply (kcal/pc/day) 2 297 2 377 2 449Average dietary energy supply adequacy (%) 108 109 108Dietary en supp, cereals/roots/tubers (%) 55 52 50Prevalence of undernourishment (%) 25.1 22.4 22GDP per capita (US$, PPP) 2 961 3 366 4 454Domestic food price volatility (index) 8.5 6.8Cereal import dependency ratio (%) 5 -3.5 -12.2Underweight, children under-5 (%) 39 31.3 31.6Improved water source (% pop) 85.3 88.3 91.4Food supplyFood production value, (2004-2006 mln I$) 17 572 25 714 27 300Agriculture, value added (% GDP) 26 26 25Food exports (mln US$) 399 777 3 621Food imports (mln US$) 1 014 1 249 4 018Production indices (2004-06=100)Net food 60 88 94Net crops 68 90 107Cereals 64 94 108Vegetable oils 61 77 93Roots and tubers 49 100 187Fruit and vegetables 61 87 104Sugar 74 96 131Livestock 56 86 81Milk 50 86 51Meat 68 85 145Fish 85 112 111Net trade (mln US$)Cereals -176 385 2 125Fruit and vegetables 4 -86 -163Meat 0 6 204Dairy products -24 -16 -45Fish 95 150 277EnvironmentForest area (%) 3 3 2Renewable water res withdrawn (% of total) 94Terrestrial protect areas (% total land area) 10 10 11Organic area (% total agricultural area) 0Water withdrawal by agriculture (% of total) 94Biofuel production (thousand kt of oil eq.) 49 180 255Wood pellet prod. (1 000 tonnes)Net GHG emissions from AFOLU (CO2 eq, Mt) 103 121 161
168

Panama
1990 2000 2014
The settingPopulation, total (mln) 2.5 3.1 3.9Population, rural (mln) 1.1 1 0.9Govt expenditure on ag (% total outlays) 3.5 1.8Area harvested (mln ha) 1 2 2Cropping intensity ratio 0.6 0.8Water resources (1 000 m3/person/year) 56 46 36Area equipped for irrigation (1 000 ha) 32Area irrigated (% area equipped for irrigation) 100Employment in agriculture (%) 23.1 17 16.7Employment in agriculture, female (%) 3 1.7 8.5Fertilizers, Nitrogen (kg of nutrients per ha) 32.2 32.1Fertilizers, Phosphate (kg of nutrients per ha) 10.9 19.9Fertilizers, Potash (kg nutrients per ha) 8.1 12.5Energy consump, power irrigation (mln kWh) 0 19 18Agr value added per worker (constant US$) 2 344 3 122 4 187Hunger dimensionsDietary energy supply (kcal/pc/day) 2 248 2 203 2 770Average dietary energy supply adequacy (%) 101 98 121Dietary en supp, cereals/roots/tubers (%) 44 40 45Prevalence of undernourishment (%) 26.4 27.4 9.5GDP per capita (US$, PPP) 7 463 9 954 18 793Domestic food price volatility (index) 3.6 3.2Cereal import dependency ratio (%) 47.9 63.9 69.4Underweight, children under-5 (%) 5.1 3.9Improved water source (% pop) 83.9 90.2 94.3Food supplyFood production value, (2004-2006 mln I$) 754 788 953Agriculture, value added (% GDP) 10 7 3Food exports (mln US$) 292 249 287Food imports (mln US$) 144 308 1 031Production indices (2004-06=100)Net food 92 96 117Net crops 123 98 98Cereals 99 89 125Vegetable oils 5 87 82Roots and tubers 59 76 87Fruit and vegetables 153 103 81Sugar 73 101 139Livestock 65 95 135Milk 69 95 115Meat 66 98 141Fish 52 90 82Net trade (mln US$)Cereals -41 -102 -376Fruit and vegetables 193 113 -21Meat -3 -15 -49Dairy products -5 -9 -60Fish 57 241 68EnvironmentForest area (%) 51 45 43Renewable water res withdrawn (% of total) 43Terrestrial protect areas (% total land area) 18 19 21Organic area (% total agricultural area) 0Water withdrawal by agriculture (% of total) 43Biofuel production (thousand kt of oil eq.) 1 4 7Wood pellet prod. (1 000 tonnes)Net GHG emissions from AFOLU (CO2 eq, Mt) 23 22 10
169
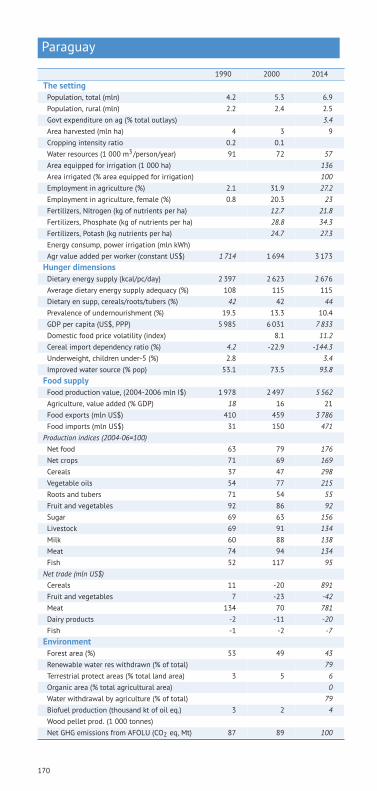
Paraguay
1990 2000 2014
The settingPopulation, total (mln) 4.2 5.3 6.9Population, rural (mln) 2.2 2.4 2.5Govt expenditure on ag (% total outlays) 3.4Area harvested (mln ha) 4 3 9Cropping intensity ratio 0.2 0.1Water resources (1 000 m3/person/year) 91 72 57Area equipped for irrigation (1 000 ha) 136Area irrigated (% area equipped for irrigation) 100Employment in agriculture (%) 2.1 31.9 27.2Employment in agriculture, female (%) 0.8 20.3 23Fertilizers, Nitrogen (kg of nutrients per ha) 12.7 21.8Fertilizers, Phosphate (kg of nutrients per ha) 28.8 34.3Fertilizers, Potash (kg nutrients per ha) 24.7 27.3Energy consump, power irrigation (mln kWh)Agr value added per worker (constant US$) 1 714 1 694 3 173Hunger dimensionsDietary energy supply (kcal/pc/day) 2 397 2 623 2 676Average dietary energy supply adequacy (%) 108 115 115Dietary en supp, cereals/roots/tubers (%) 42 42 44Prevalence of undernourishment (%) 19.5 13.3 10.4GDP per capita (US$, PPP) 5 985 6 031 7 833Domestic food price volatility (index) 8.1 11.2Cereal import dependency ratio (%) 4.2 -22.9 -144.3Underweight, children under-5 (%) 2.8 3.4Improved water source (% pop) 53.1 73.5 93.8Food supplyFood production value, (2004-2006 mln I$) 1 978 2 497 5 562Agriculture, value added (% GDP) 18 16 21Food exports (mln US$) 410 459 3 786Food imports (mln US$) 31 150 471Production indices (2004-06=100)Net food 63 79 176Net crops 71 69 169Cereals 37 47 298Vegetable oils 54 77 215Roots and tubers 71 54 55Fruit and vegetables 92 86 92Sugar 69 63 156Livestock 69 91 134Milk 60 88 138Meat 74 94 134Fish 52 117 95Net trade (mln US$)Cereals 11 -20 891Fruit and vegetables 7 -23 -42Meat 134 70 781Dairy products -2 -11 -20Fish -1 -2 -7EnvironmentForest area (%) 53 49 43Renewable water res withdrawn (% of total) 79Terrestrial protect areas (% total land area) 3 5 6Organic area (% total agricultural area) 0Water withdrawal by agriculture (% of total) 79Biofuel production (thousand kt of oil eq.) 3 2 4Wood pellet prod. (1 000 tonnes)Net GHG emissions from AFOLU (CO2 eq, Mt) 87 89 100
170

Peru
1990 2000 2014
The settingPopulation, total (mln) 21.8 26 30.8Population, rural (mln) 6.8 7 6.7Govt expenditure on ag (% total outlays)Area harvested (mln ha) 7 8 11Cropping intensity ratio 0.3 0.3Water resources (1 000 m3/person/year) 87 73 62Area equipped for irrigation (1 000 ha) 2 580Area irrigated (% area equipped for irrigation) 70.1Employment in agriculture (%) 1.2 0.6 25.8Employment in agriculture, female (%) 0.6 0.2 22.5Fertilizers, Nitrogen (kg of nutrients per ha) 53.2 67.5Fertilizers, Phosphate (kg of nutrients per ha) 16.3 25.1Fertilizers, Potash (kg nutrients per ha) 12.7 11.7Energy consump, power irrigation (mln kWh) 0 70 70Agr value added per worker (constant US$) 1 025 1 408 1 949Hunger dimensionsDietary energy supply (kcal/pc/day) 2 114 2 321 2 760Average dietary energy supply adequacy (%) 98 106 121Dietary en supp, cereals/roots/tubers (%) 60 59 57Prevalence of undernourishment (%) 31.6 21.6 7.5GDP per capita (US$, PPP) 5 280 6 485 11 396Domestic food price volatility (index) 4 5.1Cereal import dependency ratio (%) 60.6 45.4 48.4Underweight, children under-5 (%) 8.8 5.2 3.5Improved water source (% pop) 74.4 80.6 86.8Food supplyFood production value, (2004-2006 mln I$) 3 085 5 319 9 145Agriculture, value added (% GDP) 10 9 7Food exports (mln US$) 121 326 2 738Food imports (mln US$) 595 698 3 238Production indices (2004-06=100)Net food 50 85 147Net crops 46 86 140Cereals 45 89 137Vegetable oils 70 78 284Roots and tubers 43 103 138Fruit and vegetables 43 83 151Sugar 93 105 153Livestock 55 84 153Milk 58 79 133Meat 55 85 156Fish 79 123 69Net trade (mln US$)Cereals -381 -321 -1 332Fruit and vegetables 40 196 1 765Meat -28 -26 -93Dairy products -42 -65 -127Fish 398 1 113 3 177EnvironmentForest area (%) 55 54 53Renewable water res withdrawn (% of total) 89Terrestrial protect areas (% total land area) 5 8 19Organic area (% total agricultural area) 1Water withdrawal by agriculture (% of total) 89Biofuel production (thousand kt of oil eq.) 8 10 259Wood pellet prod. (1 000 tonnes)Net GHG emissions from AFOLU (CO2 eq, Mt) 84 67 97
171

Philippines
1990 2000 2014
The settingPopulation, total (mln) 61.9 77.7 100.1Population, rural (mln) 31.8 40.4 50.5Govt expenditure on ag (% total outlays) 3.9 3.7Area harvested (mln ha) 25 24 32Cropping intensity ratio 2.3 2.2Water resources (1 000 m3/person/year) 8 6 5Area equipped for irrigation (1 000 ha) 1 627Area irrigated (% area equipped for irrigation) 95 95Employment in agriculture (%) 45.2 37.1 32.2Employment in agriculture, female (%) 31.3 23.9 20.1Fertilizers, Nitrogen (kg of nutrients per ha) 115.8 80.7Fertilizers, Phosphate (kg of nutrients per ha) 42.2 18.2Fertilizers, Potash (kg nutrients per ha) 15.7 14.7Energy consump, power irrigation (mln kWh) 0 0 37Agr value added per worker (constant US$) 826 882 1 152Hunger dimensionsDietary energy supply (kcal/pc/day) 2 239 2 375 2 625Average dietary energy supply adequacy (%) 105 110 119Dietary en supp, cereals/roots/tubers (%) 57 57 59Prevalence of undernourishment (%) 26.3 21.3 13.5GDP per capita (US$, PPP) 4 010 4 243 6 326Domestic food price volatility (index) 3.3 4.8Cereal import dependency ratio (%) 16.8 23.5 21.9Underweight, children under-5 (%) 29.9 20.7 20.2Improved water source (% pop) 83.6 87.6 91.8Food supplyFood production value, (2004-2006 mln I$) 11 600 14 232 20 587Agriculture, value added (% GDP) 22 14 11Food exports (mln US$) 996 1 317 3 280Food imports (mln US$) 993 1 991 4 745Production indices (2004-06=100)Net food 68 84 122Net crops 76 85 118Cereals 70 83 127Vegetable oils 81 88 112Roots and tubers 107 101 128Fruit and vegetables 75 85 118Sugar 79 75 99Livestock 48 84 127Milk 209 84 160Meat 46 84 128Fish 78 81 111Net trade (mln US$)Cereals -535 -690 -1 724Fruit and vegetables 365 497 1 229Meat -23 -160 -443Dairy products -266 -389 -638Fish 311 298 566EnvironmentForest area (%) 22 24 26Renewable water res withdrawn (% of total) 82Terrestrial protect areas (% total land area) 9 11 11Organic area (% total agricultural area) 1Water withdrawal by agriculture (% of total) 82Biofuel production (thousand kt of oil eq.) 55 52 2 975Wood pellet prod. (1 000 tonnes)Net GHG emissions from AFOLU (CO2 eq, Mt) 51 42 50
172

Poland
1990 2000 2014
The settingPopulation, total (mln) 38.1 38.4 38.2Population, rural (mln) 14.8 14.7 15Govt expenditure on ag (% total outlays)Area harvested (mln ha) 36 24 28Cropping intensity ratio 1.9 1.3Water resources (1 000 m3/person/year) 2 2 2Area equipped for irrigation (1 000 ha) 97Area irrigated (% area equipped for irrigation) 62.3Employment in agriculture (%) 25.2 18.8 12.6Employment in agriculture, female (%) 18.3 11.7Fertilizers, Nitrogen (kg of nutrients per ha) 71.1 136.5Fertilizers, Phosphate (kg of nutrients per ha) 25.6 36Fertilizers, Potash (kg nutrients per ha) 32.2 40.8Energy consump, power irrigation (mln kWh) 3 8 25Agr value added per worker (constant US$) 1 970 3 320Hunger dimensionsDietary energy supply (kcal/pc/day)Average dietary energy supply adequacy (%) 136 136 139Dietary en supp, cereals/roots/tubers (%) 43 42 41Prevalence of undernourishment (%) <5.0 <5.0 <5.0GDP per capita (US$, PPP) 10 080 14 553 22 835Domestic food price volatility (index) 5.4 6.7Cereal import dependency ratio (%) 5.1 5.3 -2.5Underweight, children under-5 (%)Improved water source (% pop)Food supplyFood production value, (2004-2006 mln I$) 18 397 15 289 17 813Agriculture, value added (% GDP) 3 3Food exports (mln US$) 1 388 1 930 17 021Food imports (mln US$) 536 1 743 10 716Production indices (2004-06=100)Net food 111 92 107Net crops 133 108 106Cereals 104 84 111Vegetable oils 78 60 170Roots and tubers 330 222 56Fruit and vegetables 71 84 118Sugar 139 109 88Livestock 116 94 108Milk 133 100 107Meat 106 91 109Fish 237 126 124Net trade (mln US$)Cereals -211 -267 845Fruit and vegetables 273 61 1 228Meat 288 228 2 657Dairy products 88 138 1 186Fish 142 -55 -53EnvironmentForest area (%) 29 30 31Renewable water res withdrawn (% of total) 10Terrestrial protect areas (% total land area) 16 23 34Organic area (% total agricultural area) 5Water withdrawal by agriculture (% of total) 10Biofuel production (thousand kt of oil eq.) 0 1 7 194Wood pellet prod. (1 000 tonnes) 620Net GHG emissions from AFOLU (CO2 eq, Mt) 20 3 -12
173

Portugal
1990 2000 2014
The settingPopulation, total (mln) 9.9 10.3 10.6Population, rural (mln) 5.2 4.7 4Govt expenditure on ag (% total outlays)Area harvested (mln ha) 2 2 1Cropping intensity ratio 0.6 0.6Water resources (1 000 m3/person/year) 8 8 7Area equipped for irrigation (1 000 ha) 540Area irrigated (% area equipped for irrigation) 72.2Employment in agriculture (%) 17.9 12.5 10.5Employment in agriculture, female (%) 21.1 14.2 8.7Fertilizers, Nitrogen (kg of nutrients per ha) 71.9 93.4Fertilizers, Phosphate (kg of nutrients per ha) 58.5 34.2Fertilizers, Potash (kg nutrients per ha) 46.6 28.5Energy consump, power irrigation (mln kWh) 45 125 125Agr value added per worker (constant US$) 6 739 9 588Hunger dimensionsDietary energy supply (kcal/pc/day)Average dietary energy supply adequacy (%) 137 141 132Dietary en supp, cereals/roots/tubers (%) 36 32 32Prevalence of undernourishment (%) <5.0 <5.0 <5.0GDP per capita (US$, PPP) 20 282 26 147 25 933Domestic food price volatility (index) 8.2 9.2Cereal import dependency ratio (%) 60.1 66.8 77.1Underweight, children under-5 (%)Improved water source (% pop) 96.1 97.9 99.8Food supplyFood production value, (2004-2006 mln I$) 4 016 4 046 4 240Agriculture, value added (% GDP) 4 2Food exports (mln US$) 371 694 3 367Food imports (mln US$) 1 691 2 625 7 452Production indices (2004-06=100)Net food 99 99 104Net crops 111 101 105Cereals 124 141 112Vegetable oils 76 91 116Roots and tubers 197 114 74Fruit and vegetables 111 95 109Sugar 3 89 3Livestock 85 101 103Milk 80 103 93Meat 89 102 108Fish 143 86 88Net trade (mln US$)Cereals -333 -517 -1 293Fruit and vegetables -202 -327 -151Meat -259 -444 -838Dairy products 20 -60 -249Fish -326 -579 -858EnvironmentForest area (%) 36 37 38Renewable water res withdrawn (% of total) 73Terrestrial protect areas (% total land area) 7 22 22Organic area (% total agricultural area) 6Water withdrawal by agriculture (% of total) 73Biofuel production (thousand kt of oil eq.) 34 29 8 629Wood pellet prod. (1 000 tonnes) 800Net GHG emissions from AFOLU (CO2 eq, Mt) 9 8 6
174

Republic of Korea
1990 2000 2014
The settingPopulation, total (mln) 43 46 49.5Population, rural (mln) 11.2 9.4 7.9Govt expenditure on ag (% total outlays) 5.9 2.9Area harvested (mln ha) 10 12 6Cropping intensity ratio 4.6 6.2Water resources (1 000 m3/person/year) 2 2 1Area equipped for irrigation (1 000 ha) 778Area irrigated (% area equipped for irrigation) 100Employment in agriculture (%) 17.9 10.6 6.6Employment in agriculture, female (%) 20.3 12.2 6.9Fertilizers, Nitrogen (kg of nutrients per ha) 202.4 198.9Fertilizers, Phosphate (kg of nutrients per ha) 132.3 140.2Fertilizers, Potash (kg nutrients per ha) 134.1 141.9Energy consump, power irrigation (mln kWh) 0 0 0Agr value added per worker (constant US$) 5 936 11 116 28 795Hunger dimensionsDietary energy supply (kcal/pc/day) 2 970 3 087 3 480Average dietary energy supply adequacy (%) 124 128 142Dietary en supp, cereals/roots/tubers (%) 53 49 44Prevalence of undernourishment (%) <5.0 <5.0 <5.0GDP per capita (US$, PPP) 12 087 20 757 32 708Domestic food price volatility (index) 9 14.2Cereal import dependency ratio (%) 68.9 70.8 74.2Underweight, children under-5 (%) 0.9 0.6Improved water source (% pop) 90.1 93.4 97.8Food supplyFood production value, (2004-2006 mln I$) 7 778 10 168 10 238Agriculture, value added (% GDP) 8 4 2Food exports (mln US$) 639 980 2 705Food imports (mln US$) 2 882 4 993 16 704Production indices (2004-06=100)Net food 79 103 104Net crops 92 105 94Cereals 120 110 86Vegetable oils 170 111 96Roots and tubers 65 100 102Fruit and vegetables 75 102 96SugarLivestock 62 101 119Milk 79 101 94Meat 58 104 126Fish 135 100 95Net trade (mln US$)Cereals -1 303 -1 513 -4 752Fruit and vegetables 26 -283 -2 343Meat -296 -1 078 -2 944Dairy products -14 -133 -595Fish 998 2 -1 723EnvironmentForest area (%) 66 65 64Renewable water res withdrawn (% of total) 62Terrestrial protect areas (% total land area) 4 4 6Organic area (% total agricultural area) 1Water withdrawal by agriculture (% of total) 62Biofuel production (thousand kt of oil eq.) 1 7 8 904Wood pellet prod. (1 000 tonnes) 15Net GHG emissions from AFOLU (CO2 eq, Mt) -13 -13 -18
175

Republic of Moldova
1990 2000 2014
The settingPopulation, total (mln) 4.4 4.1 3.5Population, rural (mln) 2.3 2.3 1.7Govt expenditure on ag (% total outlays) 2.2 4.1Area harvested (mln ha) 2 3Cropping intensity ratio 0.7Water resources (1 000 m3/person/year) 3 3 3Area equipped for irrigation (1 000 ha) 228Area irrigated (% area equipped for irrigation) 72.1Employment in agriculture (%) 33.8 50.9 26.4Employment in agriculture, female (%) 49.8 23.2Fertilizers, Nitrogen (kg of nutrients per ha) 7.2 14.8Fertilizers, Phosphate (kg of nutrients per ha) 0.2 3.1Fertilizers, Potash (kg nutrients per ha) 0.1 1.2Energy consump, power irrigation (mln kWh) 14 14 309Agr value added per worker (constant US$) 935 845 2 638Hunger dimensionsDietary energy supply (kcal/pc/day)Average dietary energy supply adequacy (%) 105 103 116Dietary en supp, cereals/roots/tubers (%) 53 61 46Prevalence of undernourishment (%) <5.0 <5.0 <5.0GDP per capita (US$, PPP) 6 419 2 321 4 521Domestic food price volatility (index) 11.2 5.7Cereal import dependency ratio (%) 12.9 -7.3 -12.5Underweight, children under-5 (%) 2.2Improved water source (% pop) 92.7 93.4 96.5Food supplyFood production value, (2004-2006 mln I$) 2 362 1 220 1 262Agriculture, value added (% GDP) 36 29 15Food exports (mln US$) 154 123 604Food imports (mln US$) 60 37 464Production indices (2004-06=100)Net food 164 85 88Net crops 170 89 102Cereals 123 70 101Vegetable oils 52 72 151Roots and tubers 204 92 67Fruit and vegetables 207 102 102Sugar 200 92 98Livestock 174 94 96Milk 152 90 83Meat 232 103 115Fish 150 27 152Net trade (mln US$)Cereals -52 6 -42Fruit and vegetables 92 43 149Meat 32 10 -23Dairy products 7 5 -28Fish -4 -53EnvironmentForest area (%) 10 10 12Renewable water res withdrawn (% of total) 4Terrestrial protect areas (% total land area) 1 2 4Organic area (% total agricultural area) 1Water withdrawal by agriculture (% of total) 4Biofuel production (thousand kt of oil eq.) 0 0Wood pellet prod. (1 000 tonnes) 0Net GHG emissions from AFOLU (CO2 eq, Mt) 2 1 1
176

Romania
1990 2000 2014
The settingPopulation, total (mln) 23.4 22.4 21.6Population, rural (mln) 10.9 10.5 10.2Govt expenditure on ag (% total outlays)Area harvested (mln ha) 17 10 21Cropping intensity ratio 1.2 0.7Water resources (1 000 m3/person/year) 9 9 10Area equipped for irrigation (1 000 ha) 3 149Area irrigated (% area equipped for irrigation) 28.2Employment in agriculture (%) 29.1 42.8 29Employment in agriculture, female (%) 34.3 45.5 30.1Fertilizers, Nitrogen (kg of nutrients per ha) 26.9 33Fertilizers, Phosphate (kg of nutrients per ha) 10.1 12.8Fertilizers, Potash (kg nutrients per ha) 1.6 4Energy consump, power irrigation (mln kWh) 5 025 5 025 872Agr value added per worker (constant US$) 3 825 3 839 9 117Hunger dimensionsDietary energy supply (kcal/pc/day)Average dietary energy supply adequacy (%) 122 127 137Dietary en supp, cereals/roots/tubers (%) 49 49 45Prevalence of undernourishment (%) <5.0 <5.0 <5.0GDP per capita (US$, PPP) 11 449 9 970 18 184Domestic food price volatility (index) 12.6 7.3Cereal import dependency ratio (%) 9.7 -0.2 -22.6Underweight, children under-5 (%) 5 3.7Improved water source (% pop) 75.3 84.2 87.7Food supplyFood production value, (2004-2006 mln I$) 8 050 7 090 8 556Agriculture, value added (% GDP) 24 12 5Food exports (mln US$) 58 276 4 012Food imports (mln US$) 875 599 4 203Production indices (2004-06=100)Net food 93 81 98Net crops 82 71 103Cereals 85 51 106Vegetable oils 38 47 168Roots and tubers 71 83 73Fruit and vegetables 85 95 93Sugar 385 78 121Livestock 114 89 86Milk 65 78 86Meat 166 103 86Fish 927 124 111Net trade (mln US$)Cereals -141 -75 944Fruit and vegetables -50 -75 -478Meat -214 -72 -226Dairy products -45 -16 -203Fish -37 -27 -184EnvironmentForest area (%) 28 28 29Renewable water res withdrawn (% of total) 17Terrestrial protect areas (% total land area) 18 17 19Organic area (% total agricultural area) 2Water withdrawal by agriculture (% of total) 17Biofuel production (thousand kt of oil eq.) 16 330Wood pellet prod. (1 000 tonnes) 810Net GHG emissions from AFOLU (CO2 eq, Mt) 31 17 4
177

Russian Federation
1990 2000 2014
The settingPopulation, total (mln) 148.8 146.8 142.5Population, rural (mln) 39.6 39.1 36.6Govt expenditure on ag (% total outlays)Area harvested (mln ha) 64 90Cropping intensity ratio 0.3Water resources (1 000 m3/person/year) 30 31 32Area equipped for irrigation (1 000 ha) 4 300Area irrigated (% area equipped for irrigation) 39.5Employment in agriculture (%) 13.9 14.5 9.7Employment in agriculture, female (%) 11.7 6.7Fertilizers, Nitrogen (kg of nutrients per ha) 6.9 9.9Fertilizers, Phosphate (kg of nutrients per ha) 2.5 3.5Fertilizers, Potash (kg nutrients per ha) 1.6 2.3Energy consump, power irrigation (mln kWh)Agr value added per worker (constant US$) 3 635 3 743 5 973Hunger dimensionsDietary energy supply (kcal/pc/day)Average dietary energy supply adequacy (%) 120 116 136Dietary en supp, cereals/roots/tubers (%) 49 47 41Prevalence of undernourishment (%) <5.0 <5.0 <5.0GDP per capita (US$, PPP) 19 349 13 173 23 564Domestic food price volatility (index) 6.3 5.5Cereal import dependency ratio (%) 14.8 5 -27.5Underweight, children under-5 (%)Improved water source (% pop) 93.2 95.1 97Food supplyFood production value, (2004-2006 mln I$) 45 882 33 710 46 439Agriculture, value added (% GDP) 17 6 4Food exports (mln US$) 137 797 11 606Food imports (mln US$) 8 892 4 942 28 907Production indices (2004-06=100)Net food 121 89 122Net crops 95 79 116Cereals 116 80 122Vegetable oils 46 64 195Roots and tubers 96 86 82Fruit and vegetables 70 82 97Sugar 103 57 160Livestock 151 97 122Milk 147 102 97Meat 161 93 150Fish 234 124 138Net trade (mln US$)Cereals -2 068 -600 5 160Fruit and vegetables -1 613 -1 145 -9 689Meat -1 554 -1 025 -7 087Dairy products -552 -153 -2 805Fish 1 452 1 333 411EnvironmentForest area (%) 49 49 49Renewable water res withdrawn (% of total) 20Terrestrial protect areas (% total land area) 5 11 11Organic area (% total agricultural area) 0Water withdrawal by agriculture (% of total) 20Biofuel production (thousand kt of oil eq.)Wood pellet prod. (1 000 tonnes) 892Net GHG emissions from AFOLU (CO2 eq, Mt) 404 310 25
178
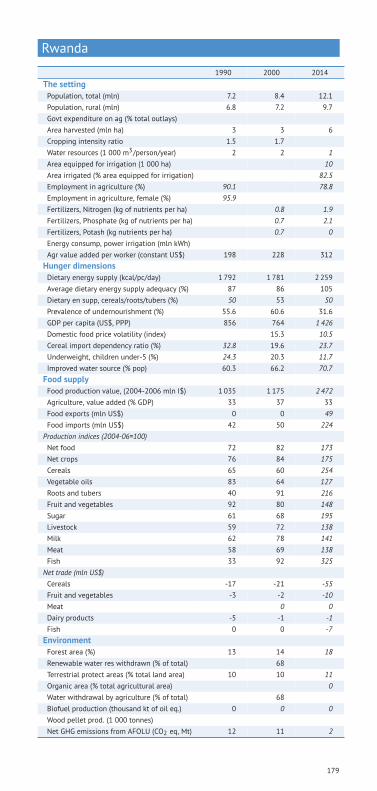
Rwanda
1990 2000 2014
The settingPopulation, total (mln) 7.2 8.4 12.1Population, rural (mln) 6.8 7.2 9.7Govt expenditure on ag (% total outlays)Area harvested (mln ha) 3 3 6Cropping intensity ratio 1.5 1.7Water resources (1 000 m3/person/year) 2 2 1Area equipped for irrigation (1 000 ha) 10Area irrigated (% area equipped for irrigation) 82.5Employment in agriculture (%) 90.1 78.8Employment in agriculture, female (%) 95.9Fertilizers, Nitrogen (kg of nutrients per ha) 0.8 1.9Fertilizers, Phosphate (kg of nutrients per ha) 0.7 2.1Fertilizers, Potash (kg nutrients per ha) 0.7 0Energy consump, power irrigation (mln kWh)Agr value added per worker (constant US$) 198 228 312Hunger dimensionsDietary energy supply (kcal/pc/day) 1 792 1 781 2 259Average dietary energy supply adequacy (%) 87 86 105Dietary en supp, cereals/roots/tubers (%) 50 53 50Prevalence of undernourishment (%) 55.6 60.6 31.6GDP per capita (US$, PPP) 856 764 1 426Domestic food price volatility (index) 15.3 10.5Cereal import dependency ratio (%) 32.8 19.6 23.7Underweight, children under-5 (%) 24.3 20.3 11.7Improved water source (% pop) 60.3 66.2 70.7Food supplyFood production value, (2004-2006 mln I$) 1 035 1 175 2 472Agriculture, value added (% GDP) 33 37 33Food exports (mln US$) 0 0 49Food imports (mln US$) 42 50 224Production indices (2004-06=100)Net food 72 82 173Net crops 76 84 175Cereals 65 60 254Vegetable oils 83 64 127Roots and tubers 40 91 216Fruit and vegetables 92 80 148Sugar 61 68 195Livestock 59 72 138Milk 62 78 141Meat 58 69 138Fish 33 92 325Net trade (mln US$)Cereals -17 -21 -55Fruit and vegetables -3 -2 -10Meat 0 0Dairy products -5 -1 -1Fish 0 0 -7EnvironmentForest area (%) 13 14 18Renewable water res withdrawn (% of total) 68Terrestrial protect areas (% total land area) 10 10 11Organic area (% total agricultural area) 0Water withdrawal by agriculture (% of total) 68Biofuel production (thousand kt of oil eq.) 0 0 0Wood pellet prod. (1 000 tonnes)Net GHG emissions from AFOLU (CO2 eq, Mt) 12 11 2
179

Samoa
1990 2000 2014
The settingPopulation, total (mln) 0.2 0.2 0.2Population, rural (mln) 0.1 0.1 0.2Govt expenditure on ag (% total outlays) 3.9 1.8Area harvested (mln ha) 0 0 0Cropping intensity ratio 7.4 6.9Water resources (1 000 m3/person/year)Area equipped for irrigation (1 000 ha)Area irrigated (% area equipped for irrigation)Employment in agriculture (%) 39.9Employment in agriculture, female (%) 15.8Fertilizers, Nitrogen (kg of nutrients per ha) 0.5 0.2Fertilizers, Phosphate (kg of nutrients per ha) 0.9 0.4Fertilizers, Potash (kg nutrients per ha) 0.4 0.2Energy consump, power irrigation (mln kWh)Agr value added per worker (constant US$) 2 956 3 019Hunger dimensionsDietary energy supply (kcal/pc/day) 2 533 2 761 2 919Average dietary energy supply adequacy (%) 112 123 128Dietary en supp, cereals/roots/tubers (%) 30 31 29Prevalence of undernourishment (%) 10.7 6.6 <5.0GDP per capita (US$, PPP) 3 657 4 336 5 584Domestic food price volatility (index)Cereal import dependency ratio (%)Underweight, children under-5 (%) 1.7Improved water source (% pop) 88.9 93.3 98.5Food supplyFood production value, (2004-2006 mln I$) 44 44 53Agriculture, value added (% GDP)Food exports (mln US$) 7 3 6Food imports (mln US$) 16 21 80Production indices (2004-06=100)Net food 91 92 110Net crops 88 91 110CerealsVegetable oils 91 93 125Roots and tubers 119 86 104Fruit and vegetables 76 92 97Sugar 117 100 100Livestock 102 97 111Milk 74 92 91Meat 102 95 114Fish 14 81 106Net trade (mln US$)Cereals -5 -3 -21Fruit and vegetables 3 1 -3Meat -5 -9 -29Dairy products -1 -2 -9Fish -3 -1 1EnvironmentForest area (%) 46 60 60Renewable water res withdrawn (% of total)Terrestrial protect areas (% total land area) 2 6 7Organic area (% total agricultural area) 96Water withdrawal by agriculture (% of total)Biofuel production (thousand kt of oil eq.) 0 0 0Wood pellet prod. (1 000 tonnes)Net GHG emissions from AFOLU (CO2 eq, Mt) 0 -1 0
180

Sao Tome and Principe
1990 2000 2014
The settingPopulation, total (mln) 0.1 0.1 0.2Population, rural (mln) 0.1 0.1 0.1Govt expenditure on ag (% total outlays)Area harvested (mln ha) 0 0 0Cropping intensity ratio 3 2Water resources (1 000 m3/person/year) 19 16 11Area equipped for irrigation (1 000 ha) 10Area irrigated (% area equipped for irrigation)Employment in agriculture (%) 39.9 27.9Employment in agriculture, female (%) 35 22.8Fertilizers, Nitrogen (kg of nutrients per ha)Fertilizers, Phosphate (kg of nutrients per ha)Fertilizers, Potash (kg nutrients per ha)Energy consump, power irrigation (mln kWh)Agr value added per worker (constant US$) 725Hunger dimensionsDietary energy supply (kcal/pc/day) 2 208 2 348 2 655Average dietary energy supply adequacy (%) 103 107 119Dietary en supp, cereals/roots/tubers (%) 53 50 47Prevalence of undernourishment (%) 22.9 21.5 6.6GDP per capita (US$, PPP) 2 157 2 876Domestic food price volatility (index) 4.5 50.5Cereal import dependency ratio (%)Underweight, children under-5 (%) 10.1 14.4Improved water source (% pop) 78.2 97Food supplyFood production value, (2004-2006 mln I$) 12 25 29Agriculture, value added (% GDP) 12 20Food exports (mln US$) 3 4 5Food imports (mln US$) 7 6 32Production indices (2004-06=100)Net food 47 96 113Net crops 48 97 111Cereals 97 80 27Vegetable oils 36 78 142Roots and tubers 20 97 36Fruit and vegetables 29 88 128SugarLivestock 45 85 135Milk 83 97 121Meat 47 86 136FishNet trade (mln US$)Cereals -14Fruit and vegetables -1 -1 -3MeatDairy products -3Fish -1 0 0EnvironmentForest area (%) 28 28 28Renewable water res withdrawn (% of total)Terrestrial protect areas (% total land area)Organic area (% total agricultural area) 8Water withdrawal by agriculture (% of total)Biofuel production (thousand kt of oil eq.)Wood pellet prod. (1 000 tonnes)Net GHG emissions from AFOLU (CO2 eq, Mt) 0 0 0
181

Saudi Arabia
1990 2000 2014
The settingPopulation, total (mln) 16.2 20.1 29.4Population, rural (mln) 3.8 4.1 5Govt expenditure on ag (% total outlays)Area harvested (mln ha) 4 2 1Cropping intensity ratio 0 0Water resources (1 000 m3/person/year) 0 0 0Area equipped for irrigation (1 000 ha) 1 620Area irrigated (% area equipped for irrigation) 100Employment in agriculture (%) 7.7 6.1 4.7Employment in agriculture, female (%) 0.4 2.3 0.2Fertilizers, Nitrogen (kg of nutrients per ha) 69.5 138.7Fertilizers, Phosphate (kg of nutrients per ha) 45.7 216.8Fertilizers, Potash (kg nutrients per ha) 3.9 1.1Energy consump, power irrigation (mln kWh) 2 558 2 558 2 204Agr value added per worker (constant US$) 8 298 14 933 27 684Hunger dimensionsDietary energy supply (kcal/pc/day) 2 839 3 089 3 290Average dietary energy supply adequacy (%) 128 137 137Dietary en supp, cereals/roots/tubers (%) 52 51 48Prevalence of undernourishment (%) <5.0 <5.0 <5.0GDP per capita (US$, PPP) 35 239 37 066 52 068Domestic food price volatility (index) 5.6 16.1Cereal import dependency ratio (%) 47.5 73.2 88.1Underweight, children under-5 (%) 13.5 5.3Improved water source (% pop) 92 95 97Food supplyFood production value, (2004-2006 mln I$) 2 305 2 651 3 526Agriculture, value added (% GDP) 6 5 2Food exports (mln US$) 311 377 3 308Food imports (mln US$) 2 964 4 547 18 512Production indices (2004-06=100)Net food 71 81 108Net crops 85 75 89Cereals 131 69 31Vegetable oils 49 84 77Roots and tubers 14 91 108Fruit and vegetables 71 76 110SugarLivestock 57 89 129Milk 38 76 183Meat 63 95 107Fish 57 74 131Net trade (mln US$)Cereals -277 -1 539 -5 783Fruit and vegetables -511 -585 -1 844Meat -403 -563 -2 435Dairy products -436 -464 -891Fish -55 -100 -571EnvironmentForest area (%) 0 0 0Renewable water res withdrawn (% of total) 88Terrestrial protect areas (% total land area) 8 31 31Organic area (% total agricultural area) 0Water withdrawal by agriculture (% of total) 88Biofuel production (thousand kt of oil eq.)Wood pellet prod. (1 000 tonnes)Net GHG emissions from AFOLU (CO2 eq, Mt) 5 5 8
182

Senegal
1990 2000 2014
The settingPopulation, total (mln) 7.5 9.9 14.5Population, rural (mln) 4.6 5.9 8.2Govt expenditure on ag (% total outlays)Area harvested (mln ha) 1 1 1Cropping intensity ratio 0.1 0.1Water resources (1 000 m3/person/year) 5 4 3Area equipped for irrigation (1 000 ha) 120Area irrigated (% area equipped for irrigation) 96.6Employment in agriculture (%) 45.6 33.7Employment in agriculture, female (%) 43.7 33Fertilizers, Nitrogen (kg of nutrients per ha) 4.4 6.2Fertilizers, Phosphate (kg of nutrients per ha) 3.5 0.5Fertilizers, Potash (kg nutrients per ha) 2.8 1.3Energy consump, power irrigation (mln kWh) 1 1 1Agr value added per worker (constant US$) 400 412 354Hunger dimensionsDietary energy supply (kcal/pc/day) 2 193 2 164 2 480Average dietary energy supply adequacy (%) 100 98 111Dietary en supp, cereals/roots/tubers (%) 60 61 60Prevalence of undernourishment (%) 24.5 29.4 10GDP per capita (US$, PPP) 1 856 1 916 2 170Domestic food price volatility (index) 14.9 7Cereal import dependency ratio (%) 39.5 48.3 46.9Underweight, children under-5 (%) 21.9 20.3 16.8Improved water source (% pop) 59.9 66.4 74.1Food supplyFood production value, (2004-2006 mln I$) 823 1 139 1 369Agriculture, value added (% GDP) 20 19 17Food exports (mln US$) 155 115 318Food imports (mln US$) 377 351 1 533Production indices (2004-06=100)Net food 77 107 128Net crops 78 111 125Cereals 85 92 125Vegetable oils 101 155 117Roots and tubers 30 58 67Fruit and vegetables 47 80 162Sugar 85 103 107Livestock 75 92 133Milk 77 102 191Meat 77 95 123Fish 79 109 117Net trade (mln US$)Cereals -180 -170 -726Fruit and vegetables -28 -16 -42Meat -6 -5 -14Dairy products -42 -31 -71Fish 169 259 251EnvironmentForest area (%) 49 46 44Renewable water res withdrawn (% of total) 93Terrestrial protect areas (% total land area) 25 25 25Organic area (% total agricultural area) 0Water withdrawal by agriculture (% of total) 93Biofuel production (thousand kt of oil eq.) 2 5 5Wood pellet prod. (1 000 tonnes)Net GHG emissions from AFOLU (CO2 eq, Mt) 18 19 17
183

Serbia
1990 2000 2014
The settingPopulation, total (mln) 9.5Population, rural (mln) 4Govt expenditure on ag (% total outlays) 2.5Area harvested (mln ha) 9Cropping intensity ratioWater resources (1 000 m3/person/year) 17Area equipped for irrigation (1 000 ha) 95Area irrigated (% area equipped for irrigation) 37.2Employment in agriculture (%) 21Employment in agriculture, female (%) 18.9Fertilizers, Nitrogen (kg of nutrients per ha) 107.9Fertilizers, Phosphate (kg of nutrients per ha) 39.2Fertilizers, Potash (kg nutrients per ha) 28Energy consump, power irrigation (mln kWh)Agr value added per worker (constant US$) 5 299Hunger dimensionsDietary energy supply (kcal/pc/day)Average dietary energy supply adequacy (%) 108Dietary en supp, cereals/roots/tubers (%) 40Prevalence of undernourishment (%) <5.0 <5.0 <5.0GDP per capita (US$, PPP) 12 892Domestic food price volatility (index) 23.7 8.5Cereal import dependency ratio (%) -31.8Underweight, children under-5 (%) 1.6Improved water source (% pop) 99.2Food supplyFood production value, (2004-2006 mln I$) 4 062Agriculture, value added (% GDP) 20 10Food exports (mln US$) 2 207Food imports (mln US$) 932Production indices (2004-06=100)Net food 108Net crops 105Cereals 110Vegetable oils 122Roots and tubers 70Fruit and vegetables 107Sugar 94Livestock 101Milk 93Meat 104Fish 0 0 441Net trade (mln US$)Cereals 737Fruit and vegetables 231Meat -15Dairy products 21Fish -94EnvironmentForest area (%) 32Renewable water res withdrawn (% of total) 2Terrestrial protect areas (% total land area) 6Organic area (% total agricultural area) 0Water withdrawal by agriculture (% of total) 2Biofuel production (thousand kt of oil eq.) 0Wood pellet prod. (1 000 tonnes) 212Net GHG emissions from AFOLU (CO2 eq, Mt) -69
184

Sierra Leone
1990 2000 2014
The settingPopulation, total (mln) 4 4.1 6.2Population, rural (mln) 2.7 2.7 3.7Govt expenditure on ag (% total outlays) 2 1.1Area harvested (mln ha) 1 1 4Cropping intensity ratio 0.2 0.3Water resources (1 000 m3/person/year) 40 39 26Area equipped for irrigation (1 000 ha) 30Area irrigated (% area equipped for irrigation)Employment in agriculture (%) 67.3Employment in agriculture, female (%) 69.5Fertilizers, Nitrogen (kg of nutrients per ha)Fertilizers, Phosphate (kg of nutrients per ha)Fertilizers, Potash (kg nutrients per ha)Energy consump, power irrigation (mln kWh) 0 0 0Agr value added per worker (constant US$) 733 748 927Hunger dimensionsDietary energy supply (kcal/pc/day) 1 986 2 018 2 416Average dietary energy supply adequacy (%) 93 94 111Dietary en supp, cereals/roots/tubers (%) 61 64 63Prevalence of undernourishment (%) 42.8 38 22.3GDP per capita (US$, PPP) 1 333 1 006 1 495Domestic food price volatility (index) 13.7 4.4Cereal import dependency ratio (%) 35 50.3 19.7Underweight, children under-5 (%) 25.4 24.7 18.1Improved water source (% pop) 36.7 47.3 60.1Food supplyFood production value, (2004-2006 mln I$) 392 297 1 172Agriculture, value added (% GDP) 47 58 62Food exports (mln US$) 7 2 30Food imports (mln US$) 96 104 278Production indices (2004-06=100)Net food 58 44 172Net crops 58 42 170Cereals 65 24 164Vegetable oils 84 61 121Roots and tubers 14 22 256Fruit and vegetables 73 77 128Sugar 100 116 110Livestock 90 77 198Milk 124 72 214Meat 78 73 191Fish 40 52 140Net trade (mln US$)Cereals -55 -63 -140Fruit and vegetables -3 -6 -16Meat -2 -1 -32Dairy productsFish 14 10 9EnvironmentForest area (%) 43 40 37Renewable water res withdrawn (% of total) 22Terrestrial protect areas (% total land area) 4 7 10Organic area (% total agricultural area) 2Water withdrawal by agriculture (% of total) 22Biofuel production (thousand kt of oil eq.) 0 0 0Wood pellet prod. (1 000 tonnes)Net GHG emissions from AFOLU (CO2 eq, Mt) 7 7 9
185

Slovakia
1990 2000 2014
The settingPopulation, total (mln) 5.3 5.4 5.5Population, rural (mln) 2.3 2.4 2.5Govt expenditure on ag (% total outlays)Area harvested (mln ha) 2 3Cropping intensity ratio 0.9Water resources (1 000 m3/person/year) 9 9 9Area equipped for irrigation (1 000 ha) 87Area irrigated (% area equipped for irrigation) 22.7Employment in agriculture (%) 6.7 3.2Employment in agriculture, female (%) 4 1.7Fertilizers, Nitrogen (kg of nutrients per ha) 56.6 77Fertilizers, Phosphate (kg of nutrients per ha) 11.5 15Fertilizers, Potash (kg nutrients per ha) 10.9 10.5Energy consump, power irrigation (mln kWh)Agr value added per worker (constant US$) 6 219 18 288Hunger dimensionsDietary energy supply (kcal/pc/day)Average dietary energy supply adequacy (%) 119 111 114Dietary en supp, cereals/roots/tubers (%) 39 38 35Prevalence of undernourishment (%) <5.0 <5.0 <5.0GDP per capita (US$, PPP) 11 536 15 242 25 759Domestic food price volatility (index) 7.4 7.3Cereal import dependency ratio (%) -3.3 -7.4 -27.5Underweight, children under-5 (%)Improved water source (% pop) 99.8 99.8 100Food supplyFood production value, (2004-2006 mln I$) 1 850 1 431 1 386Agriculture, value added (% GDP) 4 4Food exports (mln US$) 274 285 3 875Food imports (mln US$) 351 469 3 864Production indices (2004-06=100)Net food 116 90 87Net crops 112 81 97Cereals 91 64 101Vegetable oils 29 55 124Roots and tubers 288 135 46Fruit and vegetables 171 139 90Sugar 72 61 73Livestock 139 103 79Milk 114 99 88Meat 164 110 67Fish 0 80 110Net trade (mln US$)Cereals -21 -22 194Fruit and vegetables -16 -103 -488Meat -6 -40 -381Dairy products 0 20 -25Fish -23 -28 -78EnvironmentForest area (%) 40 40 40Renewable water res withdrawn (% of total) 3Terrestrial protect areas (% total land area) 19 21 36Organic area (% total agricultural area) 9Water withdrawal by agriculture (% of total) 3Biofuel production (thousand kt of oil eq.) 0 3 056Wood pellet prod. (1 000 tonnes) 100Net GHG emissions from AFOLU (CO2 eq, Mt) 4 -7 -4
186

Slovenia
1990 2000 2014
The settingPopulation, total (mln) 2 2 2.1Population, rural (mln) 1 1 1Govt expenditure on ag (% total outlays) 3.2 3.3Area harvested (mln ha) 0 0Cropping intensity ratio 1Water resources (1 000 m3/person/year) 16 16 15Area equipped for irrigation (1 000 ha) 6Area irrigated (% area equipped for irrigation)Employment in agriculture (%) 10.7 9.5 8.3Employment in agriculture, female (%) 10.1 9.7 7.8Fertilizers, Nitrogen (kg of nutrients per ha) 196.7 151.4Fertilizers, Phosphate (kg of nutrients per ha) 86.9 51.1Fertilizers, Potash (kg nutrients per ha) 116.7 62.5Energy consump, power irrigation (mln kWh) 0 15Agr value added per worker (constant US$) 42 840 163 437Hunger dimensionsDietary energy supply (kcal/pc/day)Average dietary energy supply adequacy (%) 104 121 125Dietary en supp, cereals/roots/tubers (%) 40 39 38Prevalence of undernourishment (%) <5.0 <5.0 <5.0GDP per capita (US$, PPP) 22 488 27 368Domestic food price volatility (index) 4.2 10.9Cereal import dependency ratio (%) 56.3 50.3 36.9Underweight, children under-5 (%)Improved water source (% pop) 99.6 99.6 99.6Food supplyFood production value, (2004-2006 mln I$) 661 722 608Agriculture, value added (% GDP) 3 2Food exports (mln US$) 210 218 1 207Food imports (mln US$) 418 481 1 987Production indices (2004-06=100)Net food 90 99 83Net crops 81 102 74Cereals 76 90 83Vegetable oils 53 26 196Roots and tubers 105 132 58Fruit and vegetables 78 104 74Sugar 54 142 107Livestock 93 93 85Milk 84 99 91Meat 98 86 79Fish 0 119 64Net trade (mln US$)Cereals -92 -56 -167Fruit and vegetables -53 -117 -246Meat 16 -35 -122Dairy products 12 19 1Fish -14 -20 -61EnvironmentForest area (%) 60 61 62Renewable water res withdrawn (% of total) 0Terrestrial protect areas (% total land area) 8 9 55Organic area (% total agricultural area) 7Water withdrawal by agriculture (% of total) 0Biofuel production (thousand kt of oil eq.) 0 514Wood pellet prod. (1 000 tonnes) 100Net GHG emissions from AFOLU (CO2 eq, Mt) -7 -8 -13
187

Solomon Islands
1990 2000 2014
The settingPopulation, total (mln) 0.3 0.4 0.6Population, rural (mln) 0.3 0.3 0.4Govt expenditure on ag (% total outlays)Area harvested (mln ha) 0 0 0Cropping intensity ratio 3.2 3.2Water resources (1 000 m3/person/year) 143 108 80Area equipped for irrigation (1 000 ha)Area irrigated (% area equipped for irrigation)Employment in agriculture (%)Employment in agriculture, female (%)Fertilizers, Nitrogen (kg of nutrients per ha)Fertilizers, Phosphate (kg of nutrients per ha)Fertilizers, Potash (kg nutrients per ha)Energy consump, power irrigation (mln kWh)Agr value added per worker (constant US$) 853 811 1 084Hunger dimensionsDietary energy supply (kcal/pc/day) 2 155 2 326 2 464Average dietary energy supply adequacy (%) 103 109 114Dietary en supp, cereals/roots/tubers (%) 67 70 67Prevalence of undernourishment (%) 24.8 15 11.3GDP per capita (US$, PPP) 1 776 1 715 2 003Domestic food price volatility (index)Cereal import dependency ratio (%) 95.3 94.8 97Underweight, children under-5 (%) 11.5Improved water source (% pop) 79.7 80.5Food supplyFood production value, (2004-2006 mln I$) 64 84 121Agriculture, value added (% GDP) 29 35 36Food exports (mln US$) 18 40 83Food imports (mln US$) 12 14 88Production indices (2004-06=100)Net food 62 82 118Net crops 61 81 119Cereals 32 159 146Vegetable oils 61 93 112Roots and tubers 67 84 120Fruit and vegetables 66 76 115SugarLivestock 78 90 106Milk 96 104 103Meat 78 90 104Fish 118 56 105Net trade (mln US$)Cereals -5 -11 -51Fruit and vegetables -2 0 -3Meat -11Dairy products -3Fish 22 12 34EnvironmentForest area (%) 83 81 79Renewable water res withdrawn (% of total)Terrestrial protect areas (% total land area) 0 1 2Organic area (% total agricultural area) 1Water withdrawal by agriculture (% of total)Biofuel production (thousand kt of oil eq.) 2 2 2Wood pellet prod. (1 000 tonnes)Net GHG emissions from AFOLU (CO2 eq, Mt) 2 2 2
188

Somalia
1990 2000 2014
The settingPopulation, total (mln) 6.3 7.4 10.8Population, rural (mln) 4.4 4.9 6.6Govt expenditure on ag (% total outlays)Area harvested (mln ha) 1 1 0Cropping intensity ratio 0 0Water resources (1 000 m3/person/year) 2 2 1Area equipped for irrigation (1 000 ha) 200Area irrigated (% area equipped for irrigation) 32.5Employment in agriculture (%)Employment in agriculture, female (%)Fertilizers, Nitrogen (kg of nutrients per ha)Fertilizers, Phosphate (kg of nutrients per ha)Fertilizers, Potash (kg nutrients per ha)Energy consump, power irrigation (mln kWh)Agr value added per worker (constant US$)Hunger dimensionsDietary energy supply (kcal/pc/day)Average dietary energy supply adequacy (%)Dietary en supp, cereals/roots/tubers (%)Prevalence of undernourishment (%)GDP per capita (US$, PPP)Domestic food price volatility (index)Cereal import dependency ratio (%) 51.2 37.5 69.7Underweight, children under-5 (%) 22.8 32.8Improved water source (% pop) 21 23.5 31.7Food supplyFood production value, (2004-2006 mln I$) 1 460 1 437 1 881Agriculture, value added (% GDP) 65Food exports (mln US$) 70 108 314Food imports (mln US$) 77 132 853Production indices (2004-06=100)Net food 91 90 117Net crops 122 87 124Cereals 175 113 114Vegetable oils 91 49 186Roots and tubers 53 80 103Fruit and vegetables 121 88 109Sugar 131 120 120Livestock 86 90 116Milk 98 93 110Meat 72 86 124FishNet trade (mln US$)Cereals -60 -80 -230Fruit and vegetables 24 4 -239Meat 0 0 0Dairy products -3 -1 -37Fish 15 2 -5EnvironmentForest area (%) 13 12 11Renewable water res withdrawn (% of total) 100Terrestrial protect areas (% total land area) 1 1 1Organic area (% total agricultural area) 0Water withdrawal by agriculture (% of total) 100Biofuel production (thousand kt of oil eq.) 1 0 1Wood pellet prod. (1 000 tonnes)Net GHG emissions from AFOLU (CO2 eq, Mt) 37 37 36
189

South Africa
1990 2000 2014
The settingPopulation, total (mln) 36.8 44.8 53.1Population, rural (mln) 17.6 19.3 19.5Govt expenditure on ag (% total outlays)Area harvested (mln ha) 18 24 18Cropping intensity ratio 0.2 0.2Water resources (1 000 m3/person/year) 1 1 1Area equipped for irrigation (1 000 ha) 1 670Area irrigated (% area equipped for irrigation) 95.9Employment in agriculture (%) 15.6 4.6Employment in agriculture, female (%) 16.1 3.9Fertilizers, Nitrogen (kg of nutrients per ha) 30.9 35.8Fertilizers, Phosphate (kg of nutrients per ha) 14.8 15.8Fertilizers, Potash (kg nutrients per ha) 9.4 10.3Energy consump, power irrigation (mln kWh) 246 2 406 2 406Agr value added per worker (constant US$) 3 308 3 866 7 238Hunger dimensionsDietary energy supply (kcal/pc/day) 2 814 2 878 3 155Average dietary energy supply adequacy (%) 121 121 131Dietary en supp, cereals/roots/tubers (%) 57 57 53Prevalence of undernourishment (%) <5.0 <5.0 <5.0GDP per capita (US$, PPP) 10 364 9 927 12 454Domestic food price volatility (index) 7.1 7.3Cereal import dependency ratio (%) 10 4.8 2.8Underweight, children under-5 (%) 10.1 8.7Improved water source (% pop) 81.3 86.8 95.1Food supplyFood production value, (2004-2006 mln I$) 8 301 10 029 12 753Agriculture, value added (% GDP) 5 3 2Food exports (mln US$) 1 286 1 501 4 764Food imports (mln US$) 593 876 4 679Production indices (2004-06=100)Net food 80 96 122Net crops 84 103 115Cereals 97 123 125Vegetable oils 102 92 120Roots and tubers 68 95 124Fruit and vegetables 72 89 113Sugar 89 118 89Livestock 80 90 131Milk 87 89 119Meat 77 89 134Fish 69 83 54Net trade (mln US$)Cereals 60 -181 -855Fruit and vegetables 585 739 2 404Meat -52 -48 -533Dairy products 22 -9 -77Fish -13 211 255EnvironmentForest area (%) 8 8 8Renewable water res withdrawn (% of total) 63Terrestrial protect areas (% total land area) 7 7 6Organic area (% total agricultural area) 0Water withdrawal by agriculture (% of total) 63Biofuel production (thousand kt of oil eq.) 69 138 135Wood pellet prod. (1 000 tonnes) 75Net GHG emissions from AFOLU (CO2 eq, Mt) 35 32 32
190

South Sudan
1990 2000 2014
The settingPopulation, total (mln) 11.7Population, rural (mln) 8.2Govt expenditure on ag (% total outlays)Area harvested (mln ha)Cropping intensity ratioWater resources (1 000 m3/person/year) 4Area equipped for irrigation (1 000 ha) 100Area irrigated (% area equipped for irrigation)Employment in agriculture (%)Employment in agriculture, female (%)Fertilizers, Nitrogen (kg of nutrients per ha)Fertilizers, Phosphate (kg of nutrients per ha)Fertilizers, Potash (kg nutrients per ha)Energy consump, power irrigation (mln kWh)Agr value added per worker (constant US$)Hunger dimensionsDietary energy supply (kcal/pc/day)Average dietary energy supply adequacy (%)Dietary en supp, cereals/roots/tubers (%)Prevalence of undernourishment (%)GDP per capita (US$, PPP) 1 965Domestic food price volatility (index)Cereal import dependency ratio (%)Underweight, children under-5 (%) 27.6Improved water source (% pop) 56.5Food supplyFood production value, (2004-2006 mln I$)Agriculture, value added (% GDP)Food exports (mln US$)Food imports (mln US$)Production indices (2004-06=100)Net foodNet cropsCerealsVegetable oilsRoots and tubersFruit and vegetablesSugarLivestockMilkMeatFishNet trade (mln US$)CerealsFruit and vegetablesMeatDairy productsFishEnvironmentForest area (%)Renewable water res withdrawn (% of total) 36Terrestrial protect areas (% total land area)Organic area (% total agricultural area)Water withdrawal by agriculture (% of total) 36Biofuel production (thousand kt of oil eq.)Wood pellet prod. (1 000 tonnes)Net GHG emissions from AFOLU (CO2 eq, Mt)
191

Spain
1990 2000 2014
The settingPopulation, total (mln) 38.9 40.3 47.1Population, rural (mln) 9.6 9.6 10.4Govt expenditure on ag (% total outlays)Area harvested (mln ha) 19 25 25Cropping intensity ratio 0.6 0.8Water resources (1 000 m3/person/year) 3 3 2Area equipped for irrigation (1 000 ha) 3 800Area irrigated (% area equipped for irrigation) 89.1Employment in agriculture (%) 11.8 6.7 4.4Employment in agriculture, female (%) 10.2 4.8 2.5Fertilizers, Nitrogen (kg of nutrients per ha) 92.1 68Fertilizers, Phosphate (kg of nutrients per ha) 47.2 30.4Fertilizers, Potash (kg nutrients per ha) 36 25.9Energy consump, power irrigation (mln kWh) 217 309 4 708Agr value added per worker (constant US$) 26 526 43 431Hunger dimensionsDietary energy supply (kcal/pc/day)Average dietary energy supply adequacy (%) 133 133 124Dietary en supp, cereals/roots/tubers (%) 28 26 25Prevalence of undernourishment (%) <5.0 <5.0 <5.0GDP per capita (US$, PPP) 24 126 30 647 31 683Domestic food price volatility (index) 4.6 7.2Cereal import dependency ratio (%) 13.3 21.3 34.2Underweight, children under-5 (%)Improved water source (% pop) 100 100 100Food supplyFood production value, (2004-2006 mln I$) 24 546 29 439 32 045Agriculture, value added (% GDP) 4 2Food exports (mln US$) 6 513 11 438 33 621Food imports (mln US$) 4 942 6 846 22 087Production indices (2004-06=100)Net food 83 100 109Net crops 89 103 115Cereals 95 129 134Vegetable oils 79 104 160Roots and tubers 198 116 84Fruit and vegetables 86 96 102Sugar 110 118 36Livestock 72 95 100Milk 92 96 106Meat 66 96 100Fish 115 119 110Net trade (mln US$)Cereals -319 -591 -3 199Fruit and vegetables 3 142 5 004 12 711Meat -429 516 3 573Dairy products -259 -404 -1 089Fish -1 543 -1 754 -2 467EnvironmentForest area (%) 28 34 37Renewable water res withdrawn (% of total) 60Terrestrial protect areas (% total land area) 13 27 29Organic area (% total agricultural area) 6Water withdrawal by agriculture (% of total) 60Biofuel production (thousand kt of oil eq.) 37 2 183 22 769Wood pellet prod. (1 000 tonnes) 350Net GHG emissions from AFOLU (CO2 eq, Mt) 24 -2 18
192

Sri Lanka
1990 2000 2014
The settingPopulation, total (mln) 17.3 18.8 21.4Population, rural (mln) 14.3 15.9 18.2Govt expenditure on ag (% total outlays) 4.1 5.7Area harvested (mln ha) 3 3 5Cropping intensity ratio 1.1 1.2Water resources (1 000 m3/person/year) 3 3 2Area equipped for irrigation (1 000 ha) 570Area irrigated (% area equipped for irrigation) 81.1Employment in agriculture (%) 47.8 34 39.4Employment in agriculture, female (%) 42.6 39.2 34.7Fertilizers, Nitrogen (kg of nutrients per ha) 158.6 130.9Fertilizers, Phosphate (kg of nutrients per ha) 39.4 50Fertilizers, Potash (kg nutrients per ha) 61.2 18.6Energy consump, power irrigation (mln kWh) 0 0 0Agr value added per worker (constant US$) 650 778 1 046Hunger dimensionsDietary energy supply (kcal/pc/day) 2 169 2 352 2 615Average dietary energy supply adequacy (%) 97 103 115Dietary en supp, cereals/roots/tubers (%) 59 56 58Prevalence of undernourishment (%) 30.6 29.9 22GDP per capita (US$, PPP) 3 340 4 946 9 426Domestic food price volatility (index) 5.9 9.1Cereal import dependency ratio (%) 37.5 36 25.4Underweight, children under-5 (%) 33.8 22.8 26.3Improved water source (% pop) 67.6 79.3 93.8Food supplyFood production value, (2004-2006 mln I$) 1 657 1 843 2 737Agriculture, value added (% GDP) 26 20 10Food exports (mln US$) 119 192 626Food imports (mln US$) 436 633 1 624Production indices (2004-06=100)Net food 86 95 142Net crops 88 96 136Cereals 82 93 154Vegetable oils 99 118 146Roots and tubers 150 97 124Fruit and vegetables 95 98 126Sugar 79 103 92Livestock 75 88 137Milk 154 94 195Meat 53 83 107Fish 66 107 188Net trade (mln US$)Cereals -175 -158 -347Fruit and vegetables 23 -23 -85Meat 0 -2 0Dairy products -56 -116 -305Fish -23 62 55EnvironmentForest area (%) 37 33 29Renewable water res withdrawn (% of total) 87Terrestrial protect areas (% total land area) 20 22 22Organic area (% total agricultural area) 1Water withdrawal by agriculture (% of total) 87Biofuel production (thousand kt of oil eq.) 1 2 1Wood pellet prod. (1 000 tonnes)Net GHG emissions from AFOLU (CO2 eq, Mt) 15 14 13
193
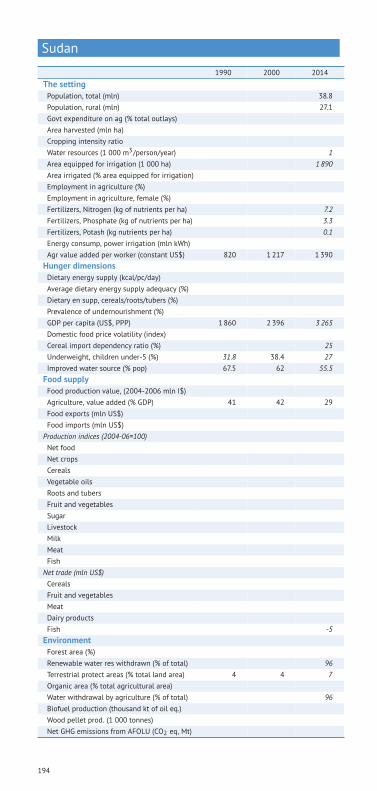
Sudan
1990 2000 2014
The settingPopulation, total (mln) 38.8Population, rural (mln) 27.1Govt expenditure on ag (% total outlays)Area harvested (mln ha)Cropping intensity ratioWater resources (1 000 m3/person/year) 1Area equipped for irrigation (1 000 ha) 1 890Area irrigated (% area equipped for irrigation)Employment in agriculture (%)Employment in agriculture, female (%)Fertilizers, Nitrogen (kg of nutrients per ha) 7.2Fertilizers, Phosphate (kg of nutrients per ha) 3.3Fertilizers, Potash (kg nutrients per ha) 0.1Energy consump, power irrigation (mln kWh)Agr value added per worker (constant US$) 820 1 217 1 390Hunger dimensionsDietary energy supply (kcal/pc/day)Average dietary energy supply adequacy (%)Dietary en supp, cereals/roots/tubers (%)Prevalence of undernourishment (%)GDP per capita (US$, PPP) 1 860 2 396 3 265Domestic food price volatility (index)Cereal import dependency ratio (%) 25Underweight, children under-5 (%) 31.8 38.4 27Improved water source (% pop) 67.5 62 55.5Food supplyFood production value, (2004-2006 mln I$)Agriculture, value added (% GDP) 41 42 29Food exports (mln US$)Food imports (mln US$)Production indices (2004-06=100)Net foodNet cropsCerealsVegetable oilsRoots and tubersFruit and vegetablesSugarLivestockMilkMeatFishNet trade (mln US$)CerealsFruit and vegetablesMeatDairy productsFish -5EnvironmentForest area (%)Renewable water res withdrawn (% of total) 96Terrestrial protect areas (% total land area) 4 4 7Organic area (% total agricultural area)Water withdrawal by agriculture (% of total) 96Biofuel production (thousand kt of oil eq.)Wood pellet prod. (1 000 tonnes)Net GHG emissions from AFOLU (CO2 eq, Mt)
194

Suriname
1990 2000 2014
The settingPopulation, total (mln) 0.4 0.5 0.5Population, rural (mln) 0.2 0.2 0.2Govt expenditure on ag (% total outlays)Area harvested (mln ha) 0 0 0Cropping intensity ratio 3.9 4.5Water resources (1 000 m3/person/year) 243 212 184Area equipped for irrigation (1 000 ha) 57Area irrigated (% area equipped for irrigation) 100Employment in agriculture (%) 3.7 6.1Employment in agriculture, female (%) 2.2 1.8Fertilizers, Nitrogen (kg of nutrients per ha) 101.7 42.2Fertilizers, Phosphate (kg of nutrients per ha) 4.8 1Fertilizers, Potash (kg nutrients per ha) 2.5 19Energy consump, power irrigation (mln kWh) 0 2 2Agr value added per worker (constant US$) 2 939 2 769 3 802Hunger dimensionsDietary energy supply (kcal/pc/day) 2 500 2 514 2 783Average dietary energy supply adequacy (%) 107 107 116Dietary en supp, cereals/roots/tubers (%) 50 45 43Prevalence of undernourishment (%) 15.5 14.1 8GDP per capita (US$, PPP) 10 625 9 908 15 556Domestic food price volatility (index) 18.6 9.7Cereal import dependency ratio (%) -14.6 4.5 6.3Underweight, children under-5 (%) 11.4 5.8Improved water source (% pop) 88.9 95.2Food supplyFood production value, (2004-2006 mln I$) 107 86 136Agriculture, value added (% GDP) 9 11 7Food exports (mln US$) 38 54 95Food imports (mln US$) 46 74 207Production indices (2004-06=100)Net food 122 97 154Net crops 109 97 155Cereals 115 95 153Vegetable oils 406 108 126Roots and tubers 57 76 193Fruit and vegetables 97 95 159Sugar 75 138 139Livestock 163 89 115Milk 212 103 72Meat 160 82 122Fish 24 78 126Net trade (mln US$)Cereals 15 8 -5Fruit and vegetables 6 14 31Meat -1 -28 -38Dairy products -9 -15Fish 2 35 67EnvironmentForest area (%) 95 95 95Renewable water res withdrawn (% of total) 70Terrestrial protect areas (% total land area) 3 15 15Organic area (% total agricultural area)Water withdrawal by agriculture (% of total) 70Biofuel production (thousand kt of oil eq.) 0 0 0Wood pellet prod. (1 000 tonnes)Net GHG emissions from AFOLU (CO2 eq, Mt) 3 3 6
195

Swaziland
1990 2000 2014
The settingPopulation, total (mln) 0.9 1.1 1.3Population, rural (mln) 0.7 0.8 1Govt expenditure on ag (% total outlays) 5.1 4.9Area harvested (mln ha) 4 4 5Cropping intensity ratio 3.1 3.2Water resources (1 000 m3/person/year) 5 4 4Area equipped for irrigation (1 000 ha) 50Area irrigated (% area equipped for irrigation) 89.9Employment in agriculture (%)Employment in agriculture, female (%)Fertilizers, Nitrogen (kg of nutrients per ha)Fertilizers, Phosphate (kg of nutrients per ha)Fertilizers, Potash (kg nutrients per ha)Energy consump, power irrigation (mln kWh) 0 58 58Agr value added per worker (constant US$) 1 173 1 168 1 373Hunger dimensionsDietary energy supply (kcal/pc/day) 2 328 2 312 2 235Average dietary energy supply adequacy (%) 110 105 98Dietary en supp, cereals/roots/tubers (%) 57 54 59Prevalence of undernourishment (%) 15.9 21.7 26.8GDP per capita (US$, PPP) 5 372 5 829 6 471Domestic food price volatility (index)Cereal import dependency ratio (%) 55.2 54.9 72.9Underweight, children under-5 (%) 9.1 5.8Improved water source (% pop) 38.9 51.9 74.1Food supplyFood production value, (2004-2006 mln I$) 250 238 308Agriculture, value added (% GDP) 10 12 7Food exports (mln US$) 319 284 234Food imports (mln US$) 79 151 152Production indices (2004-06=100)Net food 91 87 112Net crops 99 89 111Cereals 162 163 118Vegetable oils 307 136 59Roots and tubers 79 95 127Fruit and vegetables 131 93 117Sugar 77 78 109Livestock 87 88 117Milk 109 97 110Meat 83 86 119Fish 183 198 167Net trade (mln US$)Cereals -22 -32 -96Fruit and vegetables 18 10 11Meat -5 5 -2Dairy products -6 -13 -3Fish -6 -4EnvironmentForest area (%) 27 30 33Renewable water res withdrawn (% of total) 96Terrestrial protect areas (% total land area) 3 3 3Organic area (% total agricultural area) 0Water withdrawal by agriculture (% of total) 96Biofuel production (thousand kt of oil eq.) 9 9 11Wood pellet prod. (1 000 tonnes)Net GHG emissions from AFOLU (CO2 eq, Mt) 2 1 1
196

Sweden
1990 2000 2014
The settingPopulation, total (mln) 8.6 8.9 9.6Population, rural (mln) 1.4 1.4 1.4Govt expenditure on ag (% total outlays)Area harvested (mln ha) 6 6 5Cropping intensity ratio 1.9 1.8Water resources (1 000 m3/person/year) 20 20 18Area equipped for irrigation (1 000 ha) 164Area irrigated (% area equipped for irrigation) 33.9Employment in agriculture (%) 3.4 2.4 2Employment in agriculture, female (%) 1.8 1.2 1Fertilizers, Nitrogen (kg of nutrients per ha) 67.6 57Fertilizers, Phosphate (kg of nutrients per ha) 14.3 4Fertilizers, Potash (kg nutrients per ha) 16.4 8.3Energy consump, power irrigation (mln kWh)Agr value added per worker (constant US$) 18 605 23 810 42 496Hunger dimensionsDietary energy supply (kcal/pc/day)Average dietary energy supply adequacy (%) 118 122 126Dietary en supp, cereals/roots/tubers (%) 27 28 28Prevalence of undernourishment (%) <5.0 <5.0 <5.0GDP per capita (US$, PPP) 30 901 36 816 43 540Domestic food price volatility (index) 4.3 6.3Cereal import dependency ratio (%) -10.7 -31.2 -15Underweight, children under-5 (%)Improved water source (% pop) 100 100 100Food supplyFood production value, (2004-2006 mln I$) 3 108 2 871 2 630Agriculture, value added (% GDP) 4 2 1Food exports (mln US$) 900 1 168 3 841Food imports (mln US$) 2 026 2 507 8 537Production indices (2004-06=100)Net food 110 102 93Net crops 130 106 102Cereals 126 113 99Vegetable oils 186 57 154Roots and tubers 131 106 89Fruit and vegetables 130 90 110Sugar 121 114 102Livestock 103 103 93Milk 109 104 90Meat 97 102 92Fish 96 126 70Net trade (mln US$)Cereals 87 108 227Fruit and vegetables -947 -900 -2 003Meat -76 -270 -1 413Dairy products 21 -10 -581Fish -276 -240 -752EnvironmentForest area (%) 66 67 69Renewable water res withdrawn (% of total) 4Terrestrial protect areas (% total land area) 6 13 15Organic area (% total agricultural area) 16Water withdrawal by agriculture (% of total) 4Biofuel production (thousand kt of oil eq.) 216 143 5 563Wood pellet prod. (1 000 tonnes) 1 577Net GHG emissions from AFOLU (CO2 eq, Mt) 30 10 -16
197
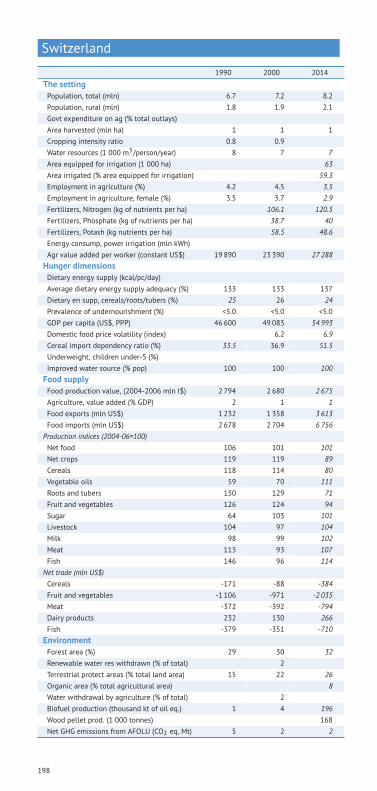
Switzerland
1990 2000 2014
The settingPopulation, total (mln) 6.7 7.2 8.2Population, rural (mln) 1.8 1.9 2.1Govt expenditure on ag (% total outlays)Area harvested (mln ha) 1 1 1Cropping intensity ratio 0.8 0.9Water resources (1 000 m3/person/year) 8 7 7Area equipped for irrigation (1 000 ha) 63Area irrigated (% area equipped for irrigation) 59.3Employment in agriculture (%) 4.2 4.5 3.5Employment in agriculture, female (%) 3.5 3.7 2.9Fertilizers, Nitrogen (kg of nutrients per ha) 106.1 120.5Fertilizers, Phosphate (kg of nutrients per ha) 38.7 40Fertilizers, Potash (kg nutrients per ha) 58.5 48.6Energy consump, power irrigation (mln kWh)Agr value added per worker (constant US$) 19 890 23 390 27 288Hunger dimensionsDietary energy supply (kcal/pc/day)Average dietary energy supply adequacy (%) 133 133 137Dietary en supp, cereals/roots/tubers (%) 25 26 24Prevalence of undernourishment (%) <5.0 <5.0 <5.0GDP per capita (US$, PPP) 46 600 49 083 54 993Domestic food price volatility (index) 6.2 6.9Cereal import dependency ratio (%) 33.5 36.9 51.5Underweight, children under-5 (%)Improved water source (% pop) 100 100 100Food supplyFood production value, (2004-2006 mln I$) 2 794 2 680 2 675Agriculture, value added (% GDP) 2 1 1Food exports (mln US$) 1 232 1 358 3 613Food imports (mln US$) 2 678 2 704 6 756Production indices (2004-06=100)Net food 106 101 101Net crops 119 119 89Cereals 118 114 80Vegetable oils 59 70 111Roots and tubers 150 129 71Fruit and vegetables 126 124 94Sugar 64 103 101Livestock 104 97 104Milk 98 99 102Meat 113 93 107Fish 146 96 114Net trade (mln US$)Cereals -171 -88 -384Fruit and vegetables -1 106 -971 -2 035Meat -372 -392 -794Dairy products 232 130 266Fish -379 -351 -710EnvironmentForest area (%) 29 30 32Renewable water res withdrawn (% of total) 2Terrestrial protect areas (% total land area) 15 22 26Organic area (% total agricultural area) 8Water withdrawal by agriculture (% of total) 2Biofuel production (thousand kt of oil eq.) 1 4 196Wood pellet prod. (1 000 tonnes) 168Net GHG emissions from AFOLU (CO2 eq, Mt) 5 2 2
198

Syria
1990 2000 2014
The settingPopulation, total (mln) 12.5 16.4 22Population, rural (mln) 6.4 7.9 9.4Govt expenditure on ag (% total outlays) 4.4Area harvested (mln ha) 4 4 4Cropping intensity ratio 0.3 0.3Water resources (1 000 m3/person/year) 1 1 1Area equipped for irrigation (1 000 ha) 1 428Area irrigated (% area equipped for irrigation) 95.5Employment in agriculture (%) 31.1 32.9 14.3Employment in agriculture, female (%) 52.7 61.7 22.2Fertilizers, Nitrogen (kg of nutrients per ha) 52.2 23.6Fertilizers, Phosphate (kg of nutrients per ha) 22 6.2Fertilizers, Potash (kg nutrients per ha) 1.7 0.1Energy consump, power irrigation (mln kWh) 77 77 719Agr value added per worker (constant US$) 4 736Hunger dimensionsDietary energy supply (kcal/pc/day)Average dietary energy supply adequacy (%)Dietary en supp, cereals/roots/tubers (%)Prevalence of undernourishment (%)GDP per capita (US$, PPP)Domestic food price volatility (index)Cereal import dependency ratio (%) 13.1 19.8 43.2Underweight, children under-5 (%) 11.5 6 10.1Improved water source (% pop) 85.7 87.5 90.1Food supplyFood production value, (2004-2006 mln I$) 3 151 4 824 5 121Agriculture, value added (% GDP) 30 24 18Food exports (mln US$) 527 423 571Food imports (mln US$) 649 650 1 878Production indices (2004-06=100)Net food 51 78 82Net crops 52 81 76Cereals 49 59 71Vegetable oils 51 96 78Roots and tubers 67 84 76Fruit and vegetables 71 89 87Sugar 34 94 25Livestock 53 75 84Milk 58 71 100Meat 49 79 78Fish 34 78 51Net trade (mln US$)Cereals -345 -237 -612Fruit and vegetables 197 197 -91Meat -2 0 -18Dairy products -4 -46 -78Fish -1 -41 -74EnvironmentForest area (%) 2 2 3Renewable water res withdrawn (% of total) 88Terrestrial protect areas (% total land area) 0 0 1Organic area (% total agricultural area) 0Water withdrawal by agriculture (% of total) 88Biofuel production (thousand kt of oil eq.)Wood pellet prod. (1 000 tonnes)Net GHG emissions from AFOLU (CO2 eq, Mt) 6 5 6
199

Tajikistan
1990 2000 2014
The settingPopulation, total (mln) 5.6 6.2 8.4Population, rural (mln) 3.9 4.5 6.2Govt expenditure on ag (% total outlays) 2.9 2Area harvested (mln ha) 1 1Cropping intensity ratio 0.1Water resources (1 000 m3/person/year) 4 4 3Area equipped for irrigation (1 000 ha) 742Area irrigated (% area equipped for irrigation) 90.9Employment in agriculture (%)Employment in agriculture, female (%)Fertilizers, Nitrogen (kg of nutrients per ha) 0 58.7Fertilizers, Phosphate (kg of nutrients per ha) 0 0Fertilizers, Potash (kg nutrients per ha) 0 0Energy consump, power irrigation (mln kWh) 0 0 0Agr value added per worker (constant US$) 539 518 1 167Hunger dimensionsDietary energy supply (kcal/pc/day) 2 046 1 953 2 153Average dietary energy supply adequacy (%) 97 90 97Dietary en supp, cereals/roots/tubers (%) 64 72 62Prevalence of undernourishment (%) 28.1 38.8 33.2GDP per capita (US$, PPP) 3 635 1 186 2 432Domestic food price volatility (index)Cereal import dependency ratio (%) 85.4 45.4 43.7Underweight, children under-5 (%) 13.3Improved water source (% pop) 58.2 59.6 71.7Food supplyFood production value, (2004-2006 mln I$) 672 597 1 292Agriculture, value added (% GDP) 33 27 27Food exports (mln US$) 12 25 41Food imports (mln US$) 238 123 572Production indices (2004-06=100)Net food 81 72 156Net crops 80 67 151Cereals 29 66 135Vegetable oils 112 68 93Roots and tubers 26 54 204Fruit and vegetables 78 72 202SugarLivestock 87 56 164Milk 91 59 159Meat 81 53 161Fish 1 811 118 737Net trade (mln US$)Cereals -33 -316Fruit and vegetables 7 25 26Meat -14 -26Dairy products -2Fish 0 -3EnvironmentForest area (%) 3 3 3Renewable water res withdrawn (% of total) 91Terrestrial protect areas (% total land area) 2 4 5Organic area (% total agricultural area) 0Water withdrawal by agriculture (% of total) 91Biofuel production (thousand kt of oil eq.)Wood pellet prod. (1 000 tonnes)Net GHG emissions from AFOLU (CO2 eq, Mt) 3 3 5
200

Tanzania
1990 2000 2014
The settingPopulation, total (mln) 25.5 34 50.8Population, rural (mln) 20.7 26.4 36.5Govt expenditure on ag (% total outlays) 3.5 1.6Area harvested (mln ha) 9 6 10Cropping intensity ratio 0.3 0.2Water resources (1 000 m3/person/year) 4 3 2Area equipped for irrigation (1 000 ha) 184Area irrigated (% area equipped for irrigation)Employment in agriculture (%) 84.2 82.1 76.5Employment in agriculture, female (%) 90.4 84 80Fertilizers, Nitrogen (kg of nutrients per ha) 3.1 3.4Fertilizers, Phosphate (kg of nutrients per ha) 0.7 0.5Fertilizers, Potash (kg nutrients per ha) 0.6 0.5Energy consump, power irrigation (mln kWh)Agr value added per worker (constant US$) 257 275 356Hunger dimensionsDietary energy supply (kcal/pc/day) 2 187 2 032 2 207Average dietary energy supply adequacy (%) 105 96 105Dietary en supp, cereals/roots/tubers (%) 68 65 57Prevalence of undernourishment (%) 24.2 36.8 32.1GDP per capita (US$, PPP) 1 460 1 477 2 365Domestic food price volatility (index) 7.1 7Cereal import dependency ratio (%) 7.1 9.6 13.2Underweight, children under-5 (%) 25.1 25.3 13.6Improved water source (% pop) 55 54.3 53.2Food supplyFood production value, (2004-2006 mln I$) 3 648 4 101 8 650Agriculture, value added (% GDP) 46 33 31Food exports (mln US$) 67 184 726Food imports (mln US$) 66 308 1 115Production indices (2004-06=100)Net food 65 73 154Net crops 62 66 157Cereals 66 63 156Vegetable oils 32 43 336Roots and tubers 117 86 133Fruit and vegetables 44 54 133Sugar 58 60 130Livestock 71 89 143Milk 42 56 141Meat 87 107 150Fish 108 89 109Net trade (mln US$)Cereals -16 -112 -370Fruit and vegetables 27 107 313Meat 7 0 -7Dairy products -5 -5 -14Fish 6 94 101EnvironmentForest area (%) 47 42 37Renewable water res withdrawn (% of total) 89Terrestrial protect areas (% total land area) 27 28 32Organic area (% total agricultural area) 0Water withdrawal by agriculture (% of total) 89Biofuel production (thousand kt of oil eq.) 3 3 7Wood pellet prod. (1 000 tonnes)Net GHG emissions from AFOLU (CO2 eq, Mt) 135 134 147
201

Thailand
1990 2000 2014
The settingPopulation, total (mln) 56.6 62.3 67.2Population, rural (mln) 39.9 42.9 43.5Govt expenditure on ag (% total outlays)Area harvested (mln ha) 34 54 100Cropping intensity ratio 1.6 2.7Water resources (1 000 m3/person/year) 8 7 7Area equipped for irrigation (1 000 ha) 6 415Area irrigated (% area equipped for irrigation) 78.9Employment in agriculture (%) 64 48.8 39.6Employment in agriculture, female (%) 65 47.5 37.8Fertilizers, Nitrogen (kg of nutrients per ha) 82.5 96.5Fertilizers, Phosphate (kg of nutrients per ha) 37 30.2Fertilizers, Potash (kg nutrients per ha) 29.7 26.5Energy consump, power irrigation (mln kWh)Agr value added per worker (constant US$) 645 803 1 195Hunger dimensionsDietary energy supply (kcal/pc/day) 2 237 2 580 2 847Average dietary energy supply adequacy (%) 94 107 116Dietary en supp, cereals/roots/tubers (%) 54 52 50Prevalence of undernourishment (%) 34.6 19 7.4GDP per capita (US$, PPP) 6 369 8 939 13 932Domestic food price volatility (index) 3.7 5.2Cereal import dependency ratio (%) -35.3 -39 -41.6Underweight, children under-5 (%) 16.3 15.4 9.2Improved water source (% pop) 86.4 91.7 95.8Food supplyFood production value, (2004-2006 mln I$) 15 396 20 766 28 642Agriculture, value added (% GDP) 12 9 12Food exports (mln US$) 3 257 4 860 18 764Food imports (mln US$) 443 1 170 6 443Production indices (2004-06=100)Net food 69 93 128Net crops 62 91 129Cereals 60 89 123Vegetable oils 38 70 197Roots and tubers 100 94 148Fruit and vegetables 56 100 111Sugar 62 100 185Livestock 81 96 130Milk 15 62 130Meat 82 96 129Fish 68 91 71Net trade (mln US$)Cereals 1 199 1 549 3 892Fruit and vegetables 1 454 1 086 3 039Meat 310 776 2 522Dairy products -152 -214 -448Fish 1 471 3 586 5 022EnvironmentForest area (%) 38 37 37Renewable water res withdrawn (% of total) 90Terrestrial protect areas (% total land area) 12 17 19Organic area (% total agricultural area) 0Water withdrawal by agriculture (% of total) 90Biofuel production (thousand kt of oil eq.) 115 194 13 727Wood pellet prod. (1 000 tonnes) 20Net GHG emissions from AFOLU (CO2 eq, Mt) 76 67 70
202

Timor-Leste
1990 2000 2014
The settingPopulation, total (mln) 0.8 0.9 1.2Population, rural (mln) 0.6 0.6 0.8Govt expenditure on ag (% total outlays)Area harvested (mln ha) 0 0 0Cropping intensity ratio 1 0.7Water resources (1 000 m3/person/year) 11 10 7Area equipped for irrigation (1 000 ha) 35Area irrigated (% area equipped for irrigation) 83.4Employment in agriculture (%) 50.6Employment in agriculture, female (%) 50.2Fertilizers, Nitrogen (kg of nutrients per ha)Fertilizers, Phosphate (kg of nutrients per ha)Fertilizers, Potash (kg nutrients per ha)Energy consump, power irrigation (mln kWh)Agr value added per worker (constant US$) 509 363Hunger dimensionsDietary energy supply (kcal/pc/day) 1 914 1 875 2 195Average dietary energy supply adequacy (%) 91 94 106Dietary en supp, cereals/roots/tubers (%) 74 74 70Prevalence of undernourishment (%) 45.2 43.9 26.9GDP per capita (US$, PPP) 1 322 2 040Domestic food price volatility (index)Cereal import dependency ratio (%) 16.9 30.3 10.6Underweight, children under-5 (%) 41.5 45.3Improved water source (% pop) 54.3 70.5Food supplyFood production value, (2004-2006 mln I$) 95 90 122Agriculture, value added (% GDP) 28 18Food exports (mln US$) 0 0 0Food imports (mln US$) 21 35 73Production indices (2004-06=100)Net food 94 89 121Net crops 80 89 114Cereals 91 97 140Vegetable oils 43 84 96Roots and tubers 89 94 60Fruit and vegetables 91 67 167SugarLivestock 104 91 112Milk 76 76 114Meat 105 90 112Fish 0 99 89Net trade (mln US$)CerealsFruit and vegetables -6 -9 -6MeatDairy productsFish -2EnvironmentForest area (%) 65 57 48Renewable water res withdrawn (% of total)Terrestrial protect areas (% total land area) 3 9Organic area (% total agricultural area) 6Water withdrawal by agriculture (% of total)Biofuel production (thousand kt of oil eq.)Wood pellet prod. (1 000 tonnes)Net GHG emissions from AFOLU (CO2 eq, Mt) 4 4 6
203

Togo
1990 2000 2014
The settingPopulation, total (mln) 3.8 4.9 7Population, rural (mln) 2.7 3.3 4.2Govt expenditure on ag (% total outlays)Area harvested (mln ha) 1 1 2Cropping intensity ratio 0.3 0.4Water resources (1 000 m3/person/year) 4 3 2Area equipped for irrigation (1 000 ha) 7Area irrigated (% area equipped for irrigation) 85.6Employment in agriculture (%) 54.1Employment in agriculture, female (%) 48.2Fertilizers, Nitrogen (kg of nutrients per ha) 2.6 2.6Fertilizers, Phosphate (kg of nutrients per ha) 2.4 2.1Fertilizers, Potash (kg nutrients per ha) 2.4 0.4Energy consump, power irrigation (mln kWh) 1 1 1Agr value added per worker (constant US$) 582 636 681Hunger dimensionsDietary energy supply (kcal/pc/day) 1 971 2 158 2 659Average dietary energy supply adequacy (%) 93 101 122Dietary en supp, cereals/roots/tubers (%) 75 76 72Prevalence of undernourishment (%) 37.9 29.2 11.4GDP per capita (US$, PPP) 1 350 1 305 1 346Domestic food price volatility (index) 26.1 10.9Cereal import dependency ratio (%) 10.9 12.4 14Underweight, children under-5 (%) 23.2 16.5Improved water source (% pop) 48.4 53.4 60Food supplyFood production value, (2004-2006 mln I$) 390 513 763Agriculture, value added (% GDP) 34 35 42Food exports (mln US$) 41 19 147Food imports (mln US$) 79 36 185Production indices (2004-06=100)Net food 64 84 125Net crops 68 91 117Cereals 57 88 151Vegetable oils 87 86 120Roots and tubers 71 95 115Fruit and vegetables 97 98 101SugarLivestock 66 82 144Milk 58 93 105Meat 65 82 146Fish 59 83 74Net trade (mln US$)Cereals -17 -11 -47Fruit and vegetables -8 -1 -7Meat -2 -3 -12Dairy products -6 -1 -6Fish -14 -9 -32EnvironmentForest area (%) 13 9 5Renewable water res withdrawn (% of total) 45Terrestrial protect areas (% total land area) 11 12 25Organic area (% total agricultural area) 0Water withdrawal by agriculture (% of total) 45Biofuel production (thousand kt of oil eq.) 1 1 1Wood pellet prod. (1 000 tonnes)Net GHG emissions from AFOLU (CO2 eq, Mt) 11 10 2
204

Trinidad and Tobago
1990 2000 2014
The settingPopulation, total (mln) 1.2 1.3 1.3Population, rural (mln) 1.1 1.1 1.1Govt expenditure on ag (% total outlays)Area harvested (mln ha) 1 1 0Cropping intensity ratio 19.2 20.5Water resources (1 000 m3/person/year) 3 3 3Area equipped for irrigation (1 000 ha) 7Area irrigated (% area equipped for irrigation) 85Employment in agriculture (%) 12.3 7.2 3.8Employment in agriculture, female (%) 6.3 2.9 1.8Fertilizers, Nitrogen (kg of nutrients per ha) 106.3 506.8Fertilizers, Phosphate (kg of nutrients per ha) 8.1 48.3Fertilizers, Potash (kg nutrients per ha) 36.3 64.3Energy consump, power irrigation (mln kWh) 2 2 2Agr value added per worker (constant US$) 2 048 2 484 1 888Hunger dimensionsDietary energy supply (kcal/pc/day) 2 620 2 761 2 994Average dietary energy supply adequacy (%) 113 114 124Dietary en supp, cereals/roots/tubers (%) 39 37 37Prevalence of undernourishment (%) 12.6 13 7.4GDP per capita (US$, PPP) 13 464 17 721 29 469Domestic food price volatility (index) 12.8 16.5Cereal import dependency ratio (%) 92.6 98.2 98Underweight, children under-5 (%) 4.4Improved water source (% pop) 90.3 92.2 93.6Food supplyFood production value, (2004-2006 mln I$) 131 146 143Agriculture, value added (% GDP) 3 1 1Food exports (mln US$) 74 134 114Food imports (mln US$) 206 259 756Production indices (2004-06=100)Net food 88 98 96Net crops 141 132 60Cereals 472 208 141Vegetable oils 222 128 92Roots and tubers 56 57 118Fruit and vegetables 65 80 88Sugar 244 227 134Livestock 55 75 121Milk 151 142 69Meat 51 73 123Fish 83 95 88Net trade (mln US$)Cereals -43 -20 -145Fruit and vegetables -34 -28 -106Meat -18 -22 -99Dairy products -37 -37 -93Fish -2 4 -30EnvironmentForest area (%) 47 46 44Renewable water res withdrawn (% of total) 9Terrestrial protect areas (% total land area) 30 32 33Organic area (% total agricultural area)Water withdrawal by agriculture (% of total) 9Biofuel production (thousand kt of oil eq.) 3 4 0Wood pellet prod. (1 000 tonnes)Net GHG emissions from AFOLU (CO2 eq, Mt) 1 1 1
205

Tunisia
1990 2000 2014
The settingPopulation, total (mln) 8.1 9.6 11.1Population, rural (mln) 3.4 3.5 3.7Govt expenditure on ag (% total outlays) 8.9 5.4Area harvested (mln ha) 2 2 2Cropping intensity ratio 0.2 0.2Water resources (1 000 m3/person/year) 1 0 0Area equipped for irrigation (1 000 ha) 459Area irrigated (% area equipped for irrigation) 89Employment in agriculture (%) 25.8 16.2Employment in agriculture, female (%) 22.7Fertilizers, Nitrogen (kg of nutrients per ha) 18.9 30.7Fertilizers, Phosphate (kg of nutrients per ha) 14.1 22.6Fertilizers, Potash (kg nutrients per ha) 3.4 2.3Energy consump, power irrigation (mln kWh) 0 147 366Agr value added per worker (constant US$) 3 019 3 601 4 424Hunger dimensionsDietary energy supply (kcal/pc/day) 3 136 3 296 3 491Average dietary energy supply adequacy (%) 141 142 148Dietary en supp, cereals/roots/tubers (%) 55 53 53Prevalence of undernourishment (%) <5.0 <5.0 <5.0GDP per capita (US$, PPP) 5 502 7 464 10 768Domestic food price volatility (index) 4.2 7.3Cereal import dependency ratio (%) 41.5 61 55.3Underweight, children under-5 (%) 3.5 2.3Improved water source (% pop) 81.5 89.4 96.8Food supplyFood production value, (2004-2006 mln I$) 2 287 2 781 3 916Agriculture, value added (% GDP) 18 11 9Food exports (mln US$) 240 373 1 309Food imports (mln US$) 480 535 2 144Production indices (2004-06=100)Net food 69 84 119Net crops 75 78 117Cereals 79 54 65Vegetable oils 85 57 113Roots and tubers 62 83 111Fruit and vegetables 61 91 132SugarLivestock 58 101 120Milk 46 98 126Meat 64 104 117Fish 79 86 109Net trade (mln US$)Cereals -202 -232 -813Fruit and vegetables 60 39 299Meat -27 -7 -41Dairy products -42 -12 -7Fish 105 75 89EnvironmentForest area (%) 4 5 7Renewable water res withdrawn (% of total) 82Terrestrial protect areas (% total land area) 1 1 5Organic area (% total agricultural area) 1Water withdrawal by agriculture (% of total) 82Biofuel production (thousand kt of oil eq.) 6 6Wood pellet prod. (1 000 tonnes)Net GHG emissions from AFOLU (CO2 eq, Mt) 3 4 4
206

Turkey
1990 2000 2014
The settingPopulation, total (mln) 54 63.2 75.8Population, rural (mln) 22 22.3 19.5Govt expenditure on ag (% total outlays)Area harvested (mln ha) 30 32 37Cropping intensity ratio 0.8 0.8Water resources (1 000 m3/person/year) 4 3 3Area equipped for irrigation (1 000 ha) 5 215Area irrigated (% area equipped for irrigation) 98.9Employment in agriculture (%) 46.9 36 23.6Employment in agriculture, female (%) 75.8 60.5 37.2Fertilizers, Nitrogen (kg of nutrients per ha) 57.4 71.6Fertilizers, Phosphate (kg of nutrients per ha) 23.4 29.8Fertilizers, Potash (kg nutrients per ha) 3.6 4.7Energy consump, power irrigation (mln kWh) 0 637 959Agr value added per worker (constant US$) 3 499 4 573 6 863Hunger dimensionsDietary energy supply (kcal/pc/day) 3 736 3 634 3 715Average dietary energy supply adequacy (%) 165 157 156Dietary en supp, cereals/roots/tubers (%) 54 54 47Prevalence of undernourishment (%) <5.0 <5.0 <5.0GDP per capita (US$, PPP) 10 670 13 025 18 567Domestic food price volatility (index) 19.8 14.8Cereal import dependency ratio (%) -7.4 -0.2 0.8Underweight, children under-5 (%) 8.7 7 1.9Improved water source (% pop) 85.4 92.8 99.7Food supplyFood production value, (2004-2006 mln I$) 22 979 27 212 37 484Agriculture, value added (% GDP) 18 11 8Food exports (mln US$) 2 309 2 865 12 641Food imports (mln US$) 1 371 1 366 7 787Production indices (2004-06=100)Net food 80 94 130Net crops 79 96 115Cereals 85 91 109Vegetable oils 78 103 122Roots and tubers 98 121 90Fruit and vegetables 72 93 121Sugar 97 131 115Livestock 83 92 163Milk 87 87 162Meat 85 93 174Fish 62 94 98Net trade (mln US$)Cereals -497 -17 519Fruit and vegetables 1 682 1 625 5 738Meat 7 11 469Dairy products -9 -17 87Fish 42 39 137EnvironmentForest area (%) 13 13 15Renewable water res withdrawn (% of total) 74Terrestrial protect areas (% total land area) 2 2 2Organic area (% total agricultural area) 2Water withdrawal by agriculture (% of total) 74Biofuel production (thousand kt of oil eq.) 15 58 236Wood pellet prod. (1 000 tonnes)Net GHG emissions from AFOLU (CO2 eq, Mt) 40 20 14
207

Turkmenistan
1990 2000 2014
The settingPopulation, total (mln) 4 4.5 5.3Population, rural (mln) 2.2 2.4 2.7Govt expenditure on ag (% total outlays)Area harvested (mln ha) 2 5Cropping intensity ratio 0Water resources (1 000 m3/person/year) 6 6 5Area equipped for irrigation (1 000 ha) 1 995Area irrigated (% area equipped for irrigation) 100Employment in agriculture (%)Employment in agriculture, female (%)Fertilizers, Nitrogen (kg of nutrients per ha)Fertilizers, Phosphate (kg of nutrients per ha)Fertilizers, Potash (kg nutrients per ha)Energy consump, power irrigation (mln kWh) 0 1 0Agr value added per worker (constant US$) 1 737 1 354 2 796Hunger dimensionsDietary energy supply (kcal/pc/day) 2 561 2 614 3 033Average dietary energy supply adequacy (%) 116 114 129Dietary en supp, cereals/roots/tubers (%) 59 63 59Prevalence of undernourishment (%) 8.6 9 <5.0GDP per capita (US$, PPP) 8 353 5 351 13 555Domestic food price volatility (index)Cereal import dependency ratio (%)Underweight, children under-5 (%) 10.5Improved water source (% pop) 83.3 71.1Food supplyFood production value, (2004-2006 mln I$) 905 1 253 2 365Agriculture, value added (% GDP) 32 24 15Food exports (mln US$) 2 6 9Food imports (mln US$) 231 82 373Production indices (2004-06=100)Net food 48 66 124Net crops 75 71 77Cereals 31 54 52Vegetable oils 125 117 63Roots and tubers 17 49 156Fruit and vegetables 46 64 115Sugar 99 103Livestock 46 64 136Milk 41 57 126Meat 49 70 150Fish 299 82 100Net trade (mln US$)CerealsFruit and vegetables -15 -5 -13Meat -25Dairy products 0Fish 0 -7EnvironmentForest area (%) 9 9 9Renewable water res withdrawn (% of total)Terrestrial protect areas (% total land area) 3 3 3Organic area (% total agricultural area)Water withdrawal by agriculture (% of total)Biofuel production (thousand kt of oil eq.)Wood pellet prod. (1 000 tonnes) 0Net GHG emissions from AFOLU (CO2 eq, Mt) 4 5 8
208

Uganda
1990 2000 2014
The settingPopulation, total (mln) 17.5 24.3 38.8Population, rural (mln) 15.6 21.3 32.3Govt expenditure on ag (% total outlays) 4.2 3.6Area harvested (mln ha) 8 10 9Cropping intensity ratio 0.7 0.8Water resources (1 000 m3/person/year) 3 2 2Area equipped for irrigation (1 000 ha) 14Area irrigated (% area equipped for irrigation) 95Employment in agriculture (%) 68.7 65.6Employment in agriculture, female (%) 75.7Fertilizers, Nitrogen (kg of nutrients per ha) 0.7 1Fertilizers, Phosphate (kg of nutrients per ha) 0.5 0.4Fertilizers, Potash (kg nutrients per ha) 0.3 0.4Energy consump, power irrigation (mln kWh) 0 1 5Agr value added per worker (constant US$) 205 220 215Hunger dimensionsDietary energy supply (kcal/pc/day) 2 273 2 265 2 272Average dietary energy supply adequacy (%) 109 109 108Dietary en supp, cereals/roots/tubers (%) 44 45 45Prevalence of undernourishment (%) 23.2 28.4 25.5GDP per capita (US$, PPP) 767 1 042 1 621Domestic food price volatility (index) 19 18.2Cereal import dependency ratio (%) -1.1 5.6 9.1Underweight, children under-5 (%) 19 14.1Improved water source (% pop) 41.6 56.5 74.8Food supplyFood production value, (2004-2006 mln I$) 3 220 4 101 5 360Agriculture, value added (% GDP) 57 29 28Food exports (mln US$) 14 20 446Food imports (mln US$) 20 111 793Production indices (2004-06=100)Net food 68 86 113Net crops 72 93 108Cereals 65 85 136Vegetable oils 45 62 126Roots and tubers 61 91 102Fruit and vegetables 84 100 100Sugar 26 62 141Livestock 53 67 127Milk 42 50 118Meat 57 73 130Fish 61 55 129Net trade (mln US$)Cereals -1 -57 -185Fruit and vegetables 5 5 13Meat -1 0 -1Dairy products -5 -1 16Fish 1 29 61EnvironmentForest area (%) 24 19 14Renewable water res withdrawn (% of total) 41Terrestrial protect areas (% total land area) 8 9 11Organic area (% total agricultural area) 2Water withdrawal by agriculture (% of total) 41Biofuel production (thousand kt of oil eq.) 1 4 11Wood pellet prod. (1 000 tonnes)Net GHG emissions from AFOLU (CO2 eq, Mt) 29 31 42
209

Ukraine
1990 2000 2014
The settingPopulation, total (mln) 51.6 49.1 44.9Population, rural (mln) 17.1 16.1 13.7Govt expenditure on ag (% total outlays) 4.9 2.2Area harvested (mln ha) 24 63Cropping intensity ratio 0.6Water resources (1 000 m3/person/year) 3 3 3Area equipped for irrigation (1 000 ha) 2 167Area irrigated (% area equipped for irrigation) 33.6Employment in agriculture (%) 19.8 23.4 17.2Employment in agriculture, female (%)Fertilizers, Nitrogen (kg of nutrients per ha) 11.1 28.5Fertilizers, Phosphate (kg of nutrients per ha) 2.4 6.8Fertilizers, Potash (kg nutrients per ha) 2.3 6Energy consump, power irrigation (mln kWh) 4 012 4 012 4 012Agr value added per worker (constant US$) 1 923 1 966 5 495Hunger dimensionsDietary energy supply (kcal/pc/day)Average dietary energy supply adequacy (%) 138 116 126Dietary en supp, cereals/roots/tubers (%) 50 50 42Prevalence of undernourishment (%) <5.0 <5.0 <5.0GDP per capita (US$, PPP) 10 507 4 817 8 508Domestic food price volatility (index) 8.7 4.5Cereal import dependency ratio (%) 2.2 -15.2 -60.3Underweight, children under-5 (%) 4.1Improved water source (% pop) 96.9 98Food supplyFood production value, (2004-2006 mln I$) 22 215 15 084 23 686Agriculture, value added (% GDP) 26 17 12Food exports (mln US$) 589 1 475 16 140Food imports (mln US$) 643 666 4 577Production indices (2004-06=100)Net food 130 88 138Net crops 112 77 162Cereals 116 62 178Vegetable oils 43 72 288Roots and tubers 108 99 116Fruit and vegetables 114 88 140Sugar 186 73 59Livestock 152 97 105Milk 135 93 85Meat 189 110 122Fish 362 162 87Net trade (mln US$)Cereals -294 -93 7 003Fruit and vegetables 33 -16 -882Meat 42 218 -361Dairy products 23 143 318Fish -6 -69 -735EnvironmentForest area (%) 16 16 17Renewable water res withdrawn (% of total) 6Terrestrial protect areas (% total land area) 2 4 4Organic area (% total agricultural area) 1Water withdrawal by agriculture (% of total) 6Biofuel production (thousand kt of oil eq.)Wood pellet prod. (1 000 tonnes) 706Net GHG emissions from AFOLU (CO2 eq, Mt) 23 -11 5
210

United Arab Emirates
1990 2000 2014
The settingPopulation, total (mln) 1.8 3 9.4Population, rural (mln) 0.4 0.6 1.4Govt expenditure on ag (% total outlays)Area harvested (mln ha) 1 3 1Cropping intensity ratio 3.1 5.2Water resources (1 000 m3/person/year) 0 0 0Area equipped for irrigation (1 000 ha) 92Area irrigated (% area equipped for irrigation) 82.6Employment in agriculture (%) 7.9 3.8Employment in agriculture, female (%) 0.1 0.1Fertilizers, Nitrogen (kg of nutrients per ha) 767.4 516.2Fertilizers, Phosphate (kg of nutrients per ha) 32.2 0Fertilizers, Potash (kg nutrients per ha) 139.8 89.4Energy consump, power irrigation (mln kWh) 100 100 481Agr value added per worker (constant US$) 30 097 12 079Hunger dimensionsDietary energy supply (kcal/pc/day) 3 118 3 330 3 386Average dietary energy supply adequacy (%) 131 135 132Dietary en supp, cereals/roots/tubers (%) 32 42 42Prevalence of undernourishment (%) <5.0 <5.0 <5.0GDP per capita (US$, PPP) 115 748 108 909 57 045Domestic food price volatility (index)Cereal import dependency ratio (%) 99.7 100 94.7Underweight, children under-5 (%)Improved water source (% pop) 99.7 99.7 99.6Food supplyFood production value, (2004-2006 mln I$) 197 1 119 439Agriculture, value added (% GDP) 2 1Food exports (mln US$) 501 584 2 579Food imports (mln US$) 1 429 2 040 10 821Production indices (2004-06=100)Net food 31 174 68Net crops 30 201 43Cereals 12 330 1 560 579 943Vegetable oilsRoots and tubers 56 220 141Fruit and vegetables 29 201 38SugarLivestock 43 80 153Milk 41 79 147Meat 42 79 153Fish 102 113 78Net trade (mln US$)Cereals -120 -397 -1 790Fruit and vegetables -266 -357 -1 907Meat -169 -140 -1 217Dairy products -135 -163 -617Fish 8 -19 -396EnvironmentForest area (%) 3 4 4Renewable water res withdrawn (% of total) 83Terrestrial protect areas (% total land area) 13 13 18Organic area (% total agricultural area) 1Water withdrawal by agriculture (% of total) 83Biofuel production (thousand kt of oil eq.)Wood pellet prod. (1 000 tonnes)Net GHG emissions from AFOLU (CO2 eq, Mt) 0 0 1
211

United Kingdom
1990 2000 2014
The settingPopulation, total (mln) 57.4 59.2 63.7Population, rural (mln) 12.6 12.7 12.8Govt expenditure on ag (% total outlays)Area harvested (mln ha) 23 24 20Cropping intensity ratio 1.2 1.4Water resources (1 000 m3/person/year) 3 2 2Area equipped for irrigation (1 000 ha) 95Area irrigated (% area equipped for irrigation) 60.6Employment in agriculture (%) 2 1.5 1.2Employment in agriculture, female (%) 1.1 0.8 0.6Fertilizers, Nitrogen (kg of nutrients per ha) 198.8 160.2Fertilizers, Phosphate (kg of nutrients per ha) 49.1 31.2Fertilizers, Potash (kg nutrients per ha) 66.3 43Energy consump, power irrigation (mln kWh) 9 11 214Agr value added per worker (constant US$) 20 139 24 176 29 212Hunger dimensionsDietary energy supply (kcal/pc/day)Average dietary energy supply adequacy (%) 131 136 137Dietary en supp, cereals/roots/tubers (%) 28 31 32Prevalence of undernourishment (%) <5.0 <5.0 <5.0GDP per capita (US$, PPP) 26 424 32 543 36 932Domestic food price volatility (index) 7.4 4.2Cereal import dependency ratio (%) -12.7 -6 -3.2Underweight, children under-5 (%)Improved water source (% pop) 100 100 100Food supplyFood production value, (2004-2006 mln I$) 17 024 16 492 15 878Agriculture, value added (% GDP) 1 1Food exports (mln US$) 6 169 6 927 13 824Food imports (mln US$) 15 794 17 484 42 602Production indices (2004-06=100)Net food 107 104 100Net crops 105 105 93Cereals 103 112 91Vegetable oils 71 64 117Roots and tubers 105 109 92Fruit and vegetables 137 111 102Sugar 94 108 96Livestock 107 102 103Milk 106 100 96Meat 109 104 107Fish 97 109 99Net trade (mln US$)Cereals 447 140 -2 032Fruit and vegetables -4 775 -5 249 -11 552Meat -2 282 -2 655 -6 490Dairy products -705 -719 -2 053Fish -949 -925 -1 703EnvironmentForest area (%) 11 12 12Renewable water res withdrawn (% of total) 10Terrestrial protect areas (% total land area) 23 25 28Organic area (% total agricultural area) 3Water withdrawal by agriculture (% of total) 10Biofuel production (thousand kt of oil eq.) 2 52 4 306Wood pellet prod. (1 000 tonnes) 335Net GHG emissions from AFOLU (CO2 eq, Mt) 64 55 41
212

United States of America
1990 2000 2014
The settingPopulation, total (mln) 254.5 284.6 322.6Population, rural (mln) 62.9 59.5 54.4Govt expenditure on ag (% total outlays) 1 0.6Area harvested (mln ha) 312 343 437Cropping intensity ratio 0.7 0.8Water resources (1 000 m3/person/year) 12 11 10Area equipped for irrigation (1 000 ha) 26 400Area irrigated (% area equipped for irrigation) 86Employment in agriculture (%) 2.9 2.6 1.6Employment in agriculture, female (%) 1.3 1.4 0.8Fertilizers, Nitrogen (kg of nutrients per ha) 67.2 78Fertilizers, Phosphate (kg of nutrients per ha) 24.4 25.7Fertilizers, Potash (kg nutrients per ha) 28 27.5Energy consump, power irrigation (mln kWh) 26 904Agr value added per worker (constant US$) 38 473 69 457Hunger dimensionsDietary energy supply (kcal/pc/day)Average dietary energy supply adequacy (%) 139 146 147Dietary en supp, cereals/roots/tubers (%) 26 25 25Prevalence of undernourishment (%) <5.0 <5.0 <5.0GDP per capita (US$, PPP) 37 026 45 986 51 340Domestic food price volatility (index) 0 0Cereal import dependency ratio (%) -33.7 -33 -24Underweight, children under-5 (%) 0.9 1.3 0.5Improved water source (% pop) 98.4 98.8 99.2Food supplyFood production value, (2004-2006 mln I$) 148 524 182 863 215 750Agriculture, value added (% GDP) 1 1Food exports (mln US$) 28 597 39 317 111 636Food imports (mln US$) 16 696 26 914 63 704Production indices (2004-06=100)Net food 78 96 113Net crops 79 95 109Cereals 86 94 119Vegetable oils 63 88 102Roots and tubers 90 117 100Fruit and vegetables 82 106 98Sugar 85 115 98Livestock 79 97 108Milk 84 95 114Meat 77 99 106Fish 108 95 104Net trade (mln US$)Cereals 11 772 8 515 16 260Fruit and vegetables -1 316 -2 679 -2 493Meat 26 3 536 11 327Dairy products -266 -423 2 126Fish -2 553 -7 395 -11 803EnvironmentForest area (%) 32 33 33Renewable water res withdrawn (% of total) 40Terrestrial protect areas (% total land area) 14 14 14Organic area (% total agricultural area) 0Water withdrawal by agriculture (% of total) 40Biofuel production (thousand kt of oil eq.) 659 1 583 29 835Wood pellet prod. (1 000 tonnes) 6 900Net GHG emissions from AFOLU (CO2 eq, Mt) 146 47 -58
213

Uruguay
1990 2000 2014
The settingPopulation, total (mln) 3.1 3.3 3.4Population, rural (mln) 0.3 0.3 0.2Govt expenditure on ag (% total outlays) 1.2 1.4Area harvested (mln ha) 1 2 4Cropping intensity ratio 0.1 0.1Water resources (1 000 m3/person/year) 55 52 51Area equipped for irrigation (1 000 ha) 238Area irrigated (% area equipped for irrigation) 100Employment in agriculture (%) 0 4.1 10.9Employment in agriculture, female (%) 0 1.1 4.8Fertilizers, Nitrogen (kg of nutrients per ha) 50.7 83.3Fertilizers, Phosphate (kg of nutrients per ha) 64.1 90.9Fertilizers, Potash (kg nutrients per ha) 3.1 18.4Energy consump, power irrigation (mln kWh) 0 0 82Agr value added per worker (constant US$) 5 475 6 967 10 297Hunger dimensionsDietary energy supply (kcal/pc/day) 2 658 2 855 2 918Average dietary energy supply adequacy (%) 112 120 121Dietary en supp, cereals/roots/tubers (%) 37 39 45Prevalence of undernourishment (%) 8.6 <5.0 <5.0GDP per capita (US$, PPP) 9 617 12 584 18 966Domestic food price volatility (index) 5.1 6.5Cereal import dependency ratio (%) -35.5 -116.2 -123.7Underweight, children under-5 (%) 5.7 4.5Improved water source (% pop) 95.5 97.1 99.5Food supplyFood production value, (2004-2006 mln I$) 1 947 2 700 4 211Agriculture, value added (% GDP) 9 7 9Food exports (mln US$) 614 863 5 368Food imports (mln US$) 46 270 701Production indices (2004-06=100)Net food 60 83 130Net crops 49 70 197Cereals 39 82 149Vegetable oils 14 12 384Roots and tubers 98 76 83Fruit and vegetables 76 91 102Sugar 609 95 239Livestock 70 90 104Milk 61 90 134Meat 67 88 95Fish 71 89 47Net trade (mln US$)Cereals 156 156 1 154Fruit and vegetables 15 -20 -35Meat 309 429 1 555Dairy products 60 123 751Fish 68 98 134EnvironmentForest area (%) 5 8 10Renewable water res withdrawn (% of total) 87Terrestrial protect areas (% total land area) 2 2 3Organic area (% total agricultural area) 6Water withdrawal by agriculture (% of total) 87Biofuel production (thousand kt of oil eq.) 2 1 302Wood pellet prod. (1 000 tonnes) 3Net GHG emissions from AFOLU (CO2 eq, Mt) 21 1 4
214

Uzbekistan
1990 2000 2014
The settingPopulation, total (mln) 22 24.8 29.3Population, rural (mln) 13.4 15.5 18.7Govt expenditure on ag (% total outlays)Area harvested (mln ha) 4 7Cropping intensity ratio 0.1Water resources (1 000 m3/person/year) 2 2 2Area equipped for irrigation (1 000 ha) 4 215Area irrigated (% area equipped for irrigation) 88.1Employment in agriculture (%) 38.5Employment in agriculture, female (%)Fertilizers, Nitrogen (kg of nutrients per ha) 0 167.9Fertilizers, Phosphate (kg of nutrients per ha) 0 27.6Fertilizers, Potash (kg nutrients per ha) 0 8Energy consump, power irrigation (mln kWh) 0 11 11Agr value added per worker (constant US$) 913 989 2 352Hunger dimensionsDietary energy supply (kcal/pc/day) 2 713 2 349 2 858Average dietary energy supply adequacy (%) 125 105 122Dietary en supp, cereals/roots/tubers (%) 61 59 58Prevalence of undernourishment (%) <5.0 11.5 <5.0GDP per capita (US$, PPP) 3 043 2 481 5 002Domestic food price volatility (index)Cereal import dependency ratio (%) 63.2 15.7 18.2Underweight, children under-5 (%) 7.1 4.4Improved water source (% pop) 90 88.7 87.3Food supplyFood production value, (2004-2006 mln I$) 4 803 5 281 10 915Agriculture, value added (% GDP) 33 34 19Food exports (mln US$) 75 144 470Food imports (mln US$) 653 362 1 133Production indices (2004-06=100)Net food 72 79 163Net crops 81 76 144Cereals 35 61 123Vegetable oils 113 83 90Roots and tubers 47 76 238Fruit and vegetables 69 76 216SugarLivestock 81 79 166Milk 80 79 173Meat 79 79 157Fish 547 183 223Net trade (mln US$)Cereals -135 -483Fruit and vegetables 38 96 412Meat -21 -31Dairy products -19 -26Fish -1 -3EnvironmentForest area (%) 7 8 8Renewable water res withdrawn (% of total) 90Terrestrial protect areas (% total land area) 2 2 3Organic area (% total agricultural area) 0Water withdrawal by agriculture (% of total) 90Biofuel production (thousand kt of oil eq.)Wood pellet prod. (1 000 tonnes) 0Net GHG emissions from AFOLU (CO2 eq, Mt) 12 14 25
215
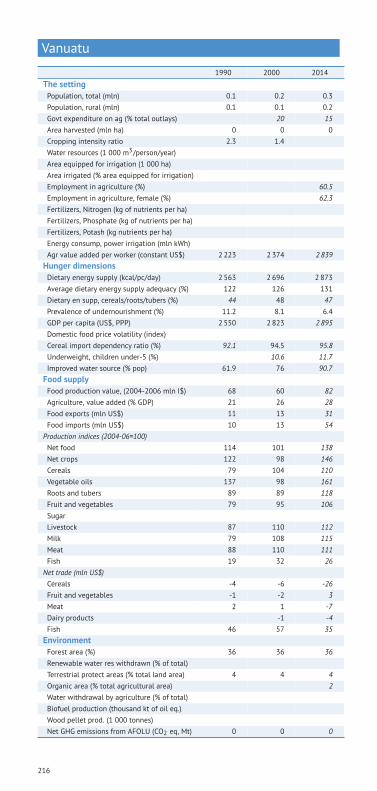
Vanuatu
1990 2000 2014
The settingPopulation, total (mln) 0.1 0.2 0.3Population, rural (mln) 0.1 0.1 0.2Govt expenditure on ag (% total outlays) 20 15Area harvested (mln ha) 0 0 0Cropping intensity ratio 2.3 1.4Water resources (1 000 m3/person/year)Area equipped for irrigation (1 000 ha)Area irrigated (% area equipped for irrigation)Employment in agriculture (%) 60.5Employment in agriculture, female (%) 62.3Fertilizers, Nitrogen (kg of nutrients per ha)Fertilizers, Phosphate (kg of nutrients per ha)Fertilizers, Potash (kg nutrients per ha)Energy consump, power irrigation (mln kWh)Agr value added per worker (constant US$) 2 223 2 374 2 839Hunger dimensionsDietary energy supply (kcal/pc/day) 2 563 2 696 2 873Average dietary energy supply adequacy (%) 122 126 131Dietary en supp, cereals/roots/tubers (%) 44 48 47Prevalence of undernourishment (%) 11.2 8.1 6.4GDP per capita (US$, PPP) 2 550 2 823 2 895Domestic food price volatility (index)Cereal import dependency ratio (%) 92.1 94.5 95.8Underweight, children under-5 (%) 10.6 11.7Improved water source (% pop) 61.9 76 90.7Food supplyFood production value, (2004-2006 mln I$) 68 60 82Agriculture, value added (% GDP) 21 26 28Food exports (mln US$) 11 13 31Food imports (mln US$) 10 13 54Production indices (2004-06=100)Net food 114 101 138Net crops 122 98 146Cereals 79 104 110Vegetable oils 137 98 161Roots and tubers 89 89 118Fruit and vegetables 79 95 106SugarLivestock 87 110 112Milk 79 108 115Meat 88 110 111Fish 19 32 26Net trade (mln US$)Cereals -4 -6 -26Fruit and vegetables -1 -2 3Meat 2 1 -7Dairy products -1 -4Fish 46 57 35EnvironmentForest area (%) 36 36 36Renewable water res withdrawn (% of total)Terrestrial protect areas (% total land area) 4 4 4Organic area (% total agricultural area) 2Water withdrawal by agriculture (% of total)Biofuel production (thousand kt of oil eq.)Wood pellet prod. (1 000 tonnes)Net GHG emissions from AFOLU (CO2 eq, Mt) 0 0 0
216

Venezuela
1990 2000 2014
The settingPopulation, total (mln) 19.7 24.4 30.9Population, rural (mln) 3.1 2.5 1.8Govt expenditure on ag (% total outlays)Area harvested (mln ha) 7 9 7Cropping intensity ratio 0.3 0.4Water resources (1 000 m3/person/year) 67 54 44Area equipped for irrigation (1 000 ha) 1 055Area irrigated (% area equipped for irrigation) 92.8Employment in agriculture (%) 13.4 10.6 7.7Employment in agriculture, female (%) 2.2 1.6 1.8Fertilizers, Nitrogen (kg of nutrients per ha) 125.8 104.9Fertilizers, Phosphate (kg of nutrients per ha) 17.3 25.6Fertilizers, Potash (kg nutrients per ha) 25.8 37Energy consump, power irrigation (mln kWh) 203 203 694Agr value added per worker (constant US$) 4 543 5 789 8 533Hunger dimensionsDietary energy supply (kcal/pc/day) 2 461 2 459 3 027Average dietary energy supply adequacy (%) 110 107 129Dietary en supp, cereals/roots/tubers (%) 39 39 41Prevalence of undernourishment (%) 14.1 16.6 <5.0GDP per capita (US$, PPP) 14 539 14 461 17 615Domestic food price volatility (index) 6.6 12.3Cereal import dependency ratio (%) 54.9 51.3 56.6Underweight, children under-5 (%) 6.7 3.9 2.9Improved water source (% pop) 89.9 92.1 92.9Food supplyFood production value, (2004-2006 mln I$) 4 038 5 354 7 244Agriculture, value added (% GDP) 5 4 5Food exports (mln US$) 168 196 15Food imports (mln US$) 564 1 300 7 416Production indices (2004-06=100)Net food 73 97 131Net crops 76 99 127Cereals 50 76 97Vegetable oils 86 104 71Roots and tubers 57 95 149Fruit and vegetables 85 116 158Sugar 69 92 77Livestock 72 97 140Milk 112 106 197Meat 66 95 130Fish 74 82 50Net trade (mln US$)Cereals -290 -399 -1 846Fruit and vegetables -5 -204 -550Meat 19 -12 -1 248Dairy products -42 -176 -1 232Fish 93 96 -188EnvironmentForest area (%) 59 56 52Renewable water res withdrawn (% of total) 74Terrestrial protect areas (% total land area) 40 53 53Organic area (% total agricultural area) 0Water withdrawal by agriculture (% of total) 74Biofuel production (thousand kt of oil eq.) 14 16 28Wood pellet prod. (1 000 tonnes)Net GHG emissions from AFOLU (CO2 eq, Mt) 139 141 144
217

Viet Nam
1990 2000 2014
The settingPopulation, total (mln) 68.9 80.9 92.5Population, rural (mln) 55 61.2 62Govt expenditure on ag (% total outlays) 2.5Area harvested (mln ha) 20 35 49Cropping intensity ratio 3 3.9Water resources (1 000 m3/person/year) 13 11 10Area equipped for irrigation (1 000 ha) 4 600Area irrigated (% area equipped for irrigation) 100Employment in agriculture (%) 65.3 47.4Employment in agriculture, female (%) 66.3 49.5Fertilizers, Nitrogen (kg of nutrients per ha) 187.1 143.3Fertilizers, Phosphate (kg of nutrients per ha) 89.8 75.2Fertilizers, Potash (kg nutrients per ha) 65.3 78.5Energy consump, power irrigation (mln kWh) 0 0 3Agr value added per worker (constant US$) 266 353 489Hunger dimensionsDietary energy supply (kcal/pc/day) 1 895 2 246 2 840Average dietary energy supply adequacy (%) 88 100 123Dietary en supp, cereals/roots/tubers (%) 77 71 60Prevalence of undernourishment (%) 45.6 28.1 11GDP per capita (US$, PPP) 1 501 2 650 5 125Domestic food price volatility (index)Cereal import dependency ratio (%) -10.6 -15.3 -11Underweight, children under-5 (%) 36.9 26.7 12Improved water source (% pop) 61.6 77.4 95Food supplyFood production value, (2004-2006 mln I$) 10 134 15 838 27 498Agriculture, value added (% GDP) 39 23 18Food exports (mln US$) 492 1 406 7 147Food imports (mln US$) 90 625 7 062Production indices (2004-06=100)Net food 49 77 134Net crops 46 80 133Cereals 52 89 123Vegetable oils 52 74 105Roots and tubers 50 43 134Fruit and vegetables 51 80 150Sugar 34 95 128Livestock 39 68 147Milk 29 46 214Meat 38 68 145Fish 27 62 176Net trade (mln US$)Cereals 262 519 2 081Fruit and vegetables 49 230 1 519Meat 28 119 -1 474Dairy products -8 -141 -581Fish 176 1 447 5 462EnvironmentForest area (%) 29 38 45Renewable water res withdrawn (% of total) 95Terrestrial protect areas (% total land area) 5 6 6Organic area (% total agricultural area) 0Water withdrawal by agriculture (% of total) 95Biofuel production (thousand kt of oil eq.) 12 29 23Wood pellet prod. (1 000 tonnes) 800Net GHG emissions from AFOLU (CO2 eq, Mt) 64 15 46
218
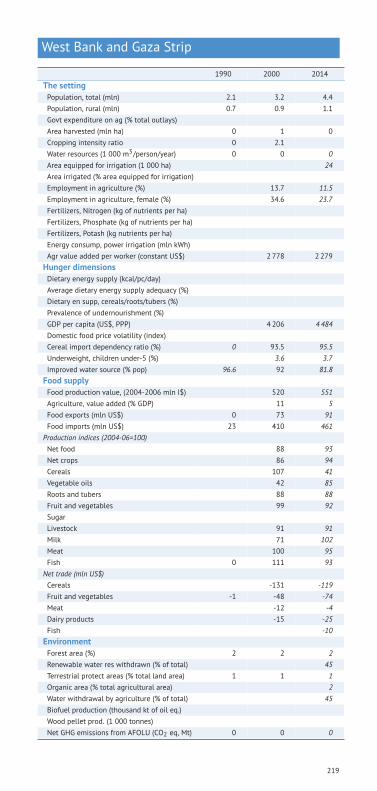
West Bank and Gaza Strip
1990 2000 2014
The settingPopulation, total (mln) 2.1 3.2 4.4Population, rural (mln) 0.7 0.9 1.1Govt expenditure on ag (% total outlays)Area harvested (mln ha) 0 1 0Cropping intensity ratio 0 2.1Water resources (1 000 m3/person/year) 0 0 0Area equipped for irrigation (1 000 ha) 24Area irrigated (% area equipped for irrigation)Employment in agriculture (%) 13.7 11.5Employment in agriculture, female (%) 34.6 23.7Fertilizers, Nitrogen (kg of nutrients per ha)Fertilizers, Phosphate (kg of nutrients per ha)Fertilizers, Potash (kg nutrients per ha)Energy consump, power irrigation (mln kWh)Agr value added per worker (constant US$) 2 778 2 279Hunger dimensionsDietary energy supply (kcal/pc/day)Average dietary energy supply adequacy (%)Dietary en supp, cereals/roots/tubers (%)Prevalence of undernourishment (%)GDP per capita (US$, PPP) 4 206 4 484Domestic food price volatility (index)Cereal import dependency ratio (%) 0 93.5 95.5Underweight, children under-5 (%) 3.6 3.7Improved water source (% pop) 96.6 92 81.8Food supplyFood production value, (2004-2006 mln I$) 520 551Agriculture, value added (% GDP) 11 5Food exports (mln US$) 0 73 91Food imports (mln US$) 23 410 461Production indices (2004-06=100)Net food 88 93Net crops 86 94Cereals 107 41Vegetable oils 42 85Roots and tubers 88 88Fruit and vegetables 99 92SugarLivestock 91 91Milk 71 102Meat 100 95Fish 0 111 93Net trade (mln US$)Cereals -131 -119Fruit and vegetables -1 -48 -74Meat -12 -4Dairy products -15 -25Fish -10EnvironmentForest area (%) 2 2 2Renewable water res withdrawn (% of total) 45Terrestrial protect areas (% total land area) 1 1 1Organic area (% total agricultural area) 2Water withdrawal by agriculture (% of total) 45Biofuel production (thousand kt of oil eq.)Wood pellet prod. (1 000 tonnes)Net GHG emissions from AFOLU (CO2 eq, Mt) 0 0 0
219

Yemen
1990 2000 2014
The settingPopulation, total (mln) 11.8 17.5 25Population, rural (mln) 9.3 12.9 16.5Govt expenditure on ag (% total outlays) 0.9 1.1Area harvested (mln ha) 1 1 1Cropping intensity ratio 0 0Water resources (1 000 m3/person/year) 0 0 0Area equipped for irrigation (1 000 ha) 680Area irrigated (% area equipped for irrigation)Employment in agriculture (%) 52.6 54.1 24.7Employment in agriculture, female (%) 83.1 87.8 28Fertilizers, Nitrogen (kg of nutrients per ha) 3.9 9.3Fertilizers, Phosphate (kg of nutrients per ha) 0 0Fertilizers, Potash (kg nutrients per ha) 0.6 0.5Energy consump, power irrigation (mln kWh) 0 2 2Agr value added per worker (constant US$) 824Hunger dimensionsDietary energy supply (kcal/pc/day) 2 063 2 081 2 223Average dietary energy supply adequacy (%) 104 101 102Dietary en supp, cereals/roots/tubers (%) 68 67 64Prevalence of undernourishment (%) 28.9 29.6 26.1GDP per capita (US$, PPP) 3 441 4 018 3 832Domestic food price volatility (index) 11Cereal import dependency ratio (%) 69.9 78.6 81.2Underweight, children under-5 (%) 29.6 43.1 35.5Improved water source (% pop) 66.3 59.9 54.9Food supplyFood production value, (2004-2006 mln I$) 726 1 058 1 774Agriculture, value added (% GDP) 24 14 10Food exports (mln US$) 30 32 180Food imports (mln US$) 613 719 3 682Production indices (2004-06=100)Net food 57 83 138Net crops 61 84 122Cereals 124 109 141Vegetable oils 45 94 121Roots and tubers 75 99 133Fruit and vegetables 50 79 117SugarLivestock 50 80 159Milk 68 81 126Meat 48 83 170Fish 32 47 87Net trade (mln US$)Cereals -251 -302 -1 917Fruit and vegetables -16 -13 -146Meat -27 -62 -217Dairy products -62 -78 -285Fish 14 16 193EnvironmentForest area (%) 1 1 1Renewable water res withdrawn (% of total) 91Terrestrial protect areas (% total land area) 1 1Organic area (% total agricultural area)Water withdrawal by agriculture (% of total) 91Biofuel production (thousand kt of oil eq.)Wood pellet prod. (1 000 tonnes)Net GHG emissions from AFOLU (CO2 eq, Mt) 4 5 7
220

Zambia
1990 2000 2014
The settingPopulation, total (mln) 7.8 10.1 15Population, rural (mln) 4.8 6.6 8.9Govt expenditure on ag (% total outlays) 9.7Area harvested (mln ha) 1 2 4Cropping intensity ratio 0.1 0.1Water resources (1 000 m3/person/year) 13 10 7Area equipped for irrigation (1 000 ha) 156Area irrigated (% area equipped for irrigation) 100Employment in agriculture (%) 49.8 71.6 72.2Employment in agriculture, female (%) 56 79.6 78.9Fertilizers, Nitrogen (kg of nutrients per ha) 14.9 10.6Fertilizers, Phosphate (kg of nutrients per ha) 5.1 4.5Fertilizers, Potash (kg nutrients per ha) 6.2 3.1Energy consump, power irrigation (mln kWh) 43 43 56Agr value added per worker (constant US$) 458 486 353Hunger dimensionsDietary energy supply (kcal/pc/day) 2 022 1 893 1 954Average dietary energy supply adequacy (%) 96 91 92Dietary en supp, cereals/roots/tubers (%) 78 77 72Prevalence of undernourishment (%) 33.8 42.9 47.8GDP per capita (US$, PPP) 2 407 2 202 3 800Domestic food price volatility (index) 9.2 3.2Cereal import dependency ratio (%) 24.3 7.1 -8.2Underweight, children under-5 (%) 21.2 23.3 14.9Improved water source (% pop) 49.1 53.1 63.3Food supplyFood production value, (2004-2006 mln I$) 709 812 1 772Agriculture, value added (% GDP) 21 18 10Food exports (mln US$) 11 42 756Food imports (mln US$) 49 62 378Production indices (2004-06=100)Net food 74 84 184Net crops 61 72 158Cereals 89 90 215Vegetable oils 41 68 196Roots and tubers 62 78 113Fruit and vegetables 92 89 121Sugar 48 68 169Livestock 78 91 216Milk 95 91 108Meat 80 91 234Fish 95 102 153Net trade (mln US$)Cereals -25 -16 443Fruit and vegetables 3 -1 -27Meat 0 -1 -13Dairy products -2 -3 -22Fish 0 -1 -32EnvironmentForest area (%) 71 69 66Renewable water res withdrawn (% of total) 73Terrestrial protect areas (% total land area) 36 36 38Organic area (% total agricultural area) 0Water withdrawal by agriculture (% of total) 73Biofuel production (thousand kt of oil eq.) 3 5 10Wood pellet prod. (1 000 tonnes)Net GHG emissions from AFOLU (CO2 eq, Mt) 94 92 94
221

Zimbabwe
1990 2000 2014
The settingPopulation, total (mln) 10.5 12.5 14.6Population, rural (mln) 7.4 8.3 8.7Govt expenditure on ag (% total outlays) 16Area harvested (mln ha) 3 4 4Cropping intensity ratio 0.2 0.3Water resources (1 000 m3/person/year) 2 2 1Area equipped for irrigation (1 000 ha) 174Area irrigated (% area equipped for irrigation) 71.4Employment in agriculture (%) 60Employment in agriculture, female (%) 69.5Fertilizers, Nitrogen (kg of nutrients per ha) 21.2 16.6Fertilizers, Phosphate (kg of nutrients per ha) 12.2 10.3Fertilizers, Potash (kg nutrients per ha) 6.6 2.2Energy consump, power irrigation (mln kWh) 197 305 305Agr value added per worker (constant US$) 399 474 279Hunger dimensionsDietary energy supply (kcal/pc/day) 1 977 2 001 2 214Average dietary energy supply adequacy (%) 91 89 98Dietary en supp, cereals/roots/tubers (%) 65 58 60Prevalence of undernourishment (%) 42.7 43.7 33.4GDP per capita (US$, PPP) 2 532 2 521 1 773Domestic food price volatility (index)Cereal import dependency ratio (%) 8.3 1.8 43.9Underweight, children under-5 (%) 11.5 10.1Improved water source (% pop) 79.2 79.5 79.9Food supplyFood production value, (2004-2006 mln I$) 1 199 1 422 1 261Agriculture, value added (% GDP) 16 18 14Food exports (mln US$) 225 243 147Food imports (mln US$) 40 87 1 121Production indices (2004-06=100)Net food 93 110 98Net crops 117 157 108Cereals 146 142 55Vegetable oils 156 203 128Roots and tubers 53 83 118Fruit and vegetables 73 85 110Sugar 82 112 103Livestock 76 97 105Milk 119 121 104Meat 66 91 105Fish 196 116 157Net trade (mln US$)Cereals 83 -7 -583Fruit and vegetables 10 31 -62Meat 7 22 -25Dairy products 5 6 -40Fish -1 -4 -21EnvironmentForest area (%) 57 49 39Renewable water res withdrawn (% of total) 79Terrestrial protect areas (% total land area) 18 18 27Organic area (% total agricultural area) 0Water withdrawal by agriculture (% of total) 79Biofuel production (thousand kt of oil eq.) 12 14 8Wood pellet prod. (1 000 tonnes)Net GHG emissions from AFOLU (CO2 eq, Mt) 50 49 48
222

PART
1

DefinitionsAgricultural areaThe sum arable land, permanent crops, andpermanent pastures.Source: FAO, Statistics DivisionOwner: FAO
Agricultural production indicesThe FAO indices of agricultural productionshow the relative level of the aggregatevolume of agricultural production for eachyear in comparison with the base period2004-2006. They are based on the sumof price-weighted quantities of differentagricultural commodities produced afterdeductions of quantities used as seed and feedweighted in a similar manner. All the indicesare calculated by the Laspeyres formula.Production quantities – except for fish –of each commodity – except for fish – areweighted by 2004-2006 average internationalcommodity prices and summed for each year.To obtain the index, the aggregate for a givenyear is divided by the average aggregatefor the base period 2004-2006. The fishindex is only normalized to the base period2004-06.Since the FAO indices are basedon the concept of agriculture as a singleenterprise, amounts of seed and feed aresubtracted from the production data to avoiddouble counting them, once in the productiondata and once with the crops or livestockproduced from them. Deductions for seed (inthe case of eggs, for hatching) and for livestockand poultry feed apply to both domesticallyproduced and imported commodities. Theycover only primary agricultural productsdestined to animal feed (e.g. maize, potatoes,milk, etc.). Processed and semi-processedfeed items such as bran, oilcakes, meals andmolasses have been completely excludedfrom the calculations at all stages. Whencalculating indices of agricultural, food andnonfood production, all intermediate primaryinputs of agricultural origin are deducted.However, for indices of any other commoditygroup, only inputs originating from withinthe same group are deducted; thus, onlyseed is removed from the group “crops” andfrom all crop subgroups, such as cereals, oilcrops, etc.; and both feed and seed originatingfrom within the livestock sector (e.g. milkfeed, hatching eggs) are removed from thegroup “livestock products”. For the main twolivestock subgroups, namely, meat and milk,only feed originating from the respectivesubgroup is removed. International commodityprices are used in order to avoid the use ofexchange rates for obtaining continental andworld aggregates and to improve internationalcomparative analysis of productivity at thenational level. These ”international prices”,expressed in ”international dollars,” arederived using a Geary-Khamis formula forthe agricultural sector. This method assignsa single “price” to each commodity. Thecommodities covered in the computation ofindices of agricultural production are all cropsand livestock products originating in eachcountry. The category of food productionincludes commodities that are considerededible and that contain nutrients, althoughit does not include fish. Accordingly, coffeeand tea are excluded along with inediblecommodities because, although edible, theyhave practically no nutritive value. Indicesfor meat production are computed based ondata for production from indigenous animals,which takes account of the meat equivalentof exported live animals but excludes themeat equivalent of imported live animals. Forindex purposes, annual changes in livestockand poultry numbers or in their average liveweight are not taken into account.Source: FAO, Statistics Division and Fisheries
DivisionOwner: FAO
Agriculture orientation index (AOI)Measures the ratio of the agriculture share ofgovernment expenditures, over the agriculturecontribution to the economy. An AOI greaterthan 1 gives more prominence to agriculturethan its contribution to the economy, asmeasured by GDP, while those with anAOI less than 1 give more prominence tonon-agricultural sectors.Source: FAO, Statistics DivisionOwner: FAO
Agriculture value added per workerAgriculture comprises value added fromforestry, hunting, and fishing as well ascultivation of crops and livestock production.Data are in constant 2000 U.S. dollars.Agricultural productivity is measured byvalue added per unit of input. Agriculturalvalue added includes that from forestry andfishing. Data on employment are drawnfrom labor force surveys, household surveys,official estimates, censuses and administrativerecords of social insurance schemes, andestablishment surveys when no otherinformation is available. The concept ofemployment generally refers to people abovea certain age who worked, or who held a job,during a reference period. Employment datainclude both full-time and part-time workers.Source: World BankOwner: IMF and FAO
Aid flows (Official Development Assistance,ODA)Consists of disbursements of loans made onconcessional terms (net of repayments ofprincipal) and grants by official agencies ofthe members of the Development AssistanceCommittee (DAC), by multilateral institutions,and by non-DAC countries to promote economicdevelopment and welfare in countries andterritories in the DAC list of ODA recipients. Itincludes loans with a grant element of at least25 percent (calculated at a rate of discount of10 percent).Source: World BankOwner: Development Assistance Committeeof the Organisation for Economic Co-operationand Development, Geographical Distributionof Financial Flows to Developing Countries,Development Co-operation Report, andInternational Development Statistics database.
Anemia among children under 5 years of age,prevalence (%)The percentage of children under age 5 whosehemoglobin level is less than 110 grams perliter at sea level.Source: World BankOwner: WHO. Global anemia prevalenceand trends 1995-2011. Geneva: WorldHealth Organization; forthcoming. StevensGA, Finucane MM, De-Regil LM, et al.Global, regional, and national trends inhemoglobin concentration and prevalenceof total and severe anemia in childrenand pregnant and non-pregnant womenfor 1995-2011: a systematic analysis ofpopulation-representative data. The LancetGlobal Health 2013; 1(1): e16-e25.
Aquaculture fish productionDefined as the farming of aquatic organisms.Farmingimplies some form of intervention inthe rearing process to enhance production,such as regular stocking, feeding, protection
224

from predators, etc. Farming also impliesindividual or corporate ownership of the stockbeing cultivated. For statistical purposes,aquatic organisms which are harvested byan individual or corporate body which hasowned them throughout their rearing periodcontribute to aquaculture, while aquaticorganisms which are exploitable by the publicas a common property resource, with orwithout appropriate licenses, are the harvestof fisheries. In the case of capture-basedaquaculture, only the incremental growth (orweight gain) in captivity, could and should bereported as the production from aquaculture.Data included here covers an aquacultureproduction of fish, molluscs, crustaceans andmiscellaneous aquatic animals but excludingproduction for marine mammals, crocodiles,corals, pearls, sponges and aquatic plants.Fish production is the sum of aquaculture andcapture fish production.Source: Fisheries and Aquaculture Department(Fishery and Aquaculture statistics)Owner: FAO
Arable landThe land under temporary agricultural crops(multiple-cropped areas are counted onlyonce), temporary meadows for mowing orpasture, land under market and kitchengardens and land temporarily fallow (less thanfive years). The abandoned land resulting fromshifting cultivation is not included in thiscategory. Data for arable land are not meant toindicate the amount of land that is potentiallycultivable.Source: FAO, Statistics DivisionOwner: FAO
Area equipped for irrigationArea equipped to provide water (via irrigation)to crops. It includes areas equipped forfull/partial control irrigation, equippedlowland areas, and areas equipped for spateirrigation.Source: Land and Water Division (AQUASTAT)Owner: FAO
Area harvestedRefer to the area from which a crop is gathered.Area harvested, therefore, excludes the areafrom which, although sown or planted, therewas no harvest due to damage, failure, etc.It is usually net of temporary crops andsometimes gross of permanent crops. Netarea differs from gross area insofar as thelatter includes uncultivated patches, footpaths,ditches, headlands, shoulders, shelterbelts,etc. If the crop under consideration isharvested more than once during the year asa consequence of successive cropping (i.e. thesame crop is sown or planted more than oncein the same field during the year), the area iscounted as many times as harvestedSource: FAO, Statistics Division (FAOSTAT)Owner: FAO
Area irrigated (%)Percent of area equipped for irrigation that isactually irrigated in any given year, expressedin percentage. Irrigated land that is cultivatedmore than once a year is counted only once.Source: Land and Water Division (AQUASTAT)Owner: FAO
Average dietary energy supply adequacy (%)Expresses the Dietary Energy Supply (DES)as a percentage of the Average DietaryEnergy Requirement (ADER). Each country’s orregion’s average supply of calories for food
consumption is normalized by the averagedietary energy requirement estimated for itspopulation to provide an index of adequacy ofthe food supply in terms of calories. Data in thecountry profiles are three-year averages for theyears 1990-92, 1999-2001, and 2014-16.Source: FAO, Statistics DivisionOwner: FAO
Average protein supply of animal origin(g/capita/day)Includes the following groups: meat; offals;animal fats and products; milk and products;eggs, fish, seafood and products; and aquaticproducts, other.Source: FAO, Statistics DivisionOwner: FAO
Bioenergy consumption (% total renewableenergy)The share of bioenergy consumption (the sumof primary solid biofuels, biogases, biogasoline,biodiesels, other liquid biofuels and charcoal)over the total renewable final consumption ofa country. Renewable energy is derived fromnatural processes (e.g. sunlight and wind)that are replenished at a higher rate thanthey are consumed. Other common sources ofrenewable energy are solar, wind, geothermal,hydro, and other biomass.Source: FAOOwner: IEA
Biofuel production (thousand kt of oil eq.)Fuel that is produced through biologicalprocesses, including agriculture. They can bederived directly from plants, or indirectly fromagricultural, commercial, domestic, and/orindustrial wastes.Source: United Nations Statistics DivisionOwner: United Nations Statistics Division
Capture fish productionDefined as the hunting, collecting andgathering activities directed at removing orcollecting live wild aquatic organisms. Thecapture production statistics here indicatesthe nominal catches of aquatic organisms,killed, caught, trapped or collected forall commercial, industrial, recreationaland subsistence purposes in live weightequivalent. Data included here covers captureproduction of fish, molluscs, crustaceans andmiscellaneous aquatic animals but excludingproduction for marine mammals, crocodiles,corals, pearls, sponges and aquatic plants.Fish production is the sum of aquaculture andcapture fish production.Source: Fisheries and Aquaculture Department(Fishery and Aquaculture statistics)Owner: FAO
CattleCommon ox (Bos taurus); zebu, humped ox (Bosindicus); Asiatic ox (subgenus Bibos); Tibetanyak (Poephagus grunniens).Source: FAO, Statistics DivisionOwner: FAO
Cereal import dependency ratioTells how much of the available domesticfood supply of cereals has been importedand how much comes from the country’s ownproduction. It is computed as (cereal imports- cereal exports)/(cereal production + cerealimports - cereal exports) * 100. Given thisformula the indicator assumes only values <=
225

100. Negative values indicate that the countryis a net exporter of cereals.Source: FAO, Statistics DivisionOwner: FAO
CerealsInclude wheat, rice paddy, barley, maize,popcorn, rye, oats, millets, sorghum,buckwheat, quinoa, fonio, triticale, canaryseed, mixed grain and cereals nes.Source: FAO, Statistics DivisionOwner: FAO
Children under 5 years of age affected bywasting (%)The proportion of children under fivewhose weight for height is more than twostandard deviations below the median for theinternational reference population ages 0-59.Source: World BankOwner: World Health Organization, GlobalDatabase on Child Growth and Malnutrition
Children under 5 years of age who are stunted(%)Hheight-for-age less than -2 standarddeviations of the WHO Child Growth Standardsmedian, among children aged 0-5 years.Source: World BankOwner: World Health Organization, GlobalDatabase on Child Growth and Malnutrition
Credit to agricultureThis dataset is built by compiling officialcountry data published on-line by nationalcentral banks in their monetary and financialstatistics publications, either through annual orquarterly reports.Source: FAO, Statistics DivisionOwner: FAO
Crop productionRefer to the actual harvested production fromthe field or orchard and gardens, excludingharvesting and threshing losses and thatpart of crop not harvested for any reason.Production therefore includes the quantities ofthe commodity sold in the market (marketedproduction) and the quantities consumed orused by the producers (auto-consumption).When the production data available refers toa production period falling into two successivecalendar years and it is not possible to allocatethe relative production to each of them, itis usual to refer production data to that yearinto which the bulk of the production falls.Crop production data are recorded in tonnes(t). In many countries, crop production dataare obtained as a function of the estimatedyield and the total area. If such a compilationmethod of production statistics is enforcedby the country, it must be ensured that thetotal area does not refer to sown or plantedarea, which would give then the biologicalproduction, but to the actually harvested areaduring the year.Source: FAO, Statistics DivisionOwner: FAO
CroplandIncludes arable land and permanent crops.Source: FAO, Statistics DivisionOwner: FAO
Cropping Intensity RatioThe ratio of area harvested to total arable land.The cropping intensity may exceed 100 percentwhere more than one crop cycle is permittedeach year on the same area.Source: FAO, Statistics Division (FAOSTAT)Owner: FAO
Dietary energy supply (kcal/pc/day)The food available for human consumption,expressed in kilocalories per person per day.At the country level, it is calculated as thefood remaining for human use after takingout all non-food utilization, including exports,industrial use, animal feed, seed, wastage andchanges in stocks. Data in the country profilesare three-year averages for the years 1990-92,1999-2001, and 2014-16.Source: FAO, Statistics DivisionOwner: FAO
Dietary energy supply, cereals, roots and tubers(%)Expresses the energy supply (in kcal/caput/day)provided by cereals, roots and tubers as apercentage of the total Dietary Energy Supply(DES) (in kcal/caput/day) calculated from thecorresponding countries in the FAOSTAT foodbalance sheets.Source: FAO, Statistics DivisionOwner: FAO
Domestic food price level indexAn indicator of the relative price of food ina country. The indicator is calculated fromthe 2011 International Comparison Program(ICP) data from the World Bank as wellas general and food consumer price indicesfrom the International Labour Organizationmade consistent and available on FAOSTAT.Specifically, the ratio of food and non-alcoholicbeverages expenditure to actual individualconsumption is calculated in purchasing powerparity terms relative to the United States. Tocontrol for inflation, this ratio is forecastedand backcasted using the ratio of a country’sFood Consumer Price Index (FPI) and GeneralConsumer Price Index (CPI) using a 2011 baseyear, relative to the United States. Theindicator is computed for countries for whichInternational Comparison Program data as wellas general and food consumer price indices areavailable.Source: FAO, Statistics DivisionOwner: ILO and World Bank
Domestic food price volatilityMeasures the variability in the relative price offood in a country. The indicator is calculatedfrom the monthly domestic food price levelindex using monthly consumer and generalfood price indices and purchasing powerparity data from the International ComparisonProgram conducted by the World Bank (seethe Relative Price of Food Indicator for moreinformation). Month-to-month growth ratesare calculated, and the standard deviation ofthese growth rates are calculated over theprevious 8 months (8-months rolling standarddeviation). The average of these standarddeviations is then computed to obtain anannual volatility indicator.Source: FAO, Statistics DivisionOwner: FAO, ILO and World Bank
Employment in agriculture (%)People who work for a public or privateemployer and receive remuneration in wages,salary, commission, tips, piece rates, or pay inkind. Agriculture corresponds to division 1 (ISIC
226

revision 2) or tabulation categories A and B(ISIC revision 3) and includes hunting, forestry,and fishing.Source: World BankOwner: ILO
Energy consumption in agricultureThe sum of total energy consumption byagriculture, forestry and fishing and considersall fossil fuels and renewable energy carriers(i.e. animal waste, anthracite, aviationgasoline, biodiesel, biogases, biogasoline,brown coal, brown coal briquettes, charcoal,coke oven coke, coking coal, conventionalcrude oil, direct use of geothermal heat,direct use of solar thermal heat, fuel oil,fuelwood, gas oil/ diesel oil, gasworks gas, hardcoal, heat, industrial waste, lignite, liquifiedpetroleum gas, lubricants, motor gasoline,municipal wastes, natural gas including LNG,natural gas liquids, other kerosene, other liquidbiofuels, other oil products, other vegetalmaterial and residues, patent fuel, peat, peatproducts, petroleum coke) and electricity. It ismeasured in Joules.Source: United Nations Statistics DivisionOwner: United Nations Statistics Division
Energy consumption for power irrigationIrrigated area is the sum of "total area equippedfor full control irrigation: sprinkler" and"total area equipped for full control irrigation:localized" taken from the FAO AQUASTATdatabase. Annual values in FAOSTAT areestimated by repeating the last-available valuereported in AQUASTAT within the associatedtime interval.Source: FAO, Statistics DivisionOwner: FAO
Fertilizers (kg/ha)Collected through individual countriesin product weight through the new FAOQuestionnaire on Agricultural Resources –Fertilizers and then converted to nutrientsand validated for consistency regardingsummary totals of production, import,export, non-fertilizer use and consumptionfor the three types of fertilizers: nitrogen(N), phosphate (P205), potash (K2O) andincluding complex fertilizers (NP, PK, NK andNPK).Fertilizers may be organic, inorganic ormineral. Organic fertilizers play an importantrole in crop production and are derivedfrom animals, plants and compost. Mineralfertilizers are available to farmers in solidor liquid form, and are delivered to the farmeither in bulk, in bags or in pressurizedcontainers. All fertilizers contain at least oneof the major plant nutrients: nitrogen (N),phosphorus (P) or potassium (K).Source: FAO, Statistics DivisionOwner: FAO
Food imports and exports (mln US$)Food comprises the commodities in SITCsections 0 (food and live animals), 1 (beveragesand tobacco), and 4 (animal and vegetable oilsand fats) and SITC division 22 (oil seeds, oilnuts, and oil kernels).Source: FAO, Statistics Division and FisheriesDivisionOwner: FAO
Food production, average valueIn International Dollars (I$) divided by thetotal population. It provides a cross countrycomparable measure of the relative economicsize of the food production.Source: FAO, Statistics DivisionOwner: FAO
Forest area (%)The land spanning more than 0.5 hectares withtrees higher than 5 meters and a canopy coverof more than 10 percent, or trees able to reachthese thresholds in situ. It does not includeland that is predominantly under agriculturalor urban land use. Forest is determined both bythe presence of trees and the absence of otherpredominant land uses. The trees should beable to reach a minimum height of 5 metres (m)in situ. Areas under reforestation that have notyet reached but are expected to reach a canopycover of 10 percent and a tree height of 5 m areincluded, as are temporarily unstocked areas,resulting from human intervention or naturalcauses, which are expected to regenerate.Includes: areas with bamboo and palmsprovided that height and canopy cover criteriaare met; forest roads, firebreaks and othersmall open areas; forest in national parks,nature reserves and other protected areas suchas those of specific scientific, historical, culturalor spiritual interest; windbreaks, shelterbeltsand corridors of trees with an area of morethan 0.5 ha and width of more than 20m; plantations primarily used for forestry orprotective purposes, such as: rubber-woodplantations and cork, oak stands. Excludes: treestands in agricultural production systems, forexample in fruit plantations and agroforestrysystems. The term also excludes trees in urbanparks and gardens.Source: FAO, Statistics DivisionOwner: FAO
Forestry productionThe solid volume or weight of all productionof the products specified below. It includes:the production of products that mayimmediately be consumed in the productionof another product (e.g. wood pulp, whichmay immediately be converted into paper aspart of a continuous process). It excludes: theproduction of veneer sheets that are used forplywood production within the same country.It is reported in cubic metres of solid volumein the case of roundwood, sawnwood andwood based panels and metric tons in the caseof charcoal, pulp and paper products.Source: FAO, Statistics DivisionOwner: Forestry Department, FAO
GDP per capita (US$, PPP)Gross domestic product converted tointernational dollars using purchasing powerparity rates. An international dollar has thesame purchasing power over GDP as theU.S. dollar has in the United States. GDPat purchaser’s prices is the sum of grossvalue added by all resident producers in theeconomy plus any product taxes and minusany subsidies not included in the value ofthe products. It is calculated without makingdeductions for depreciation of fabricatedassets or for depletion and degradation ofnatural resources. Data are in constant 2011international dollars.Source: FAO, Statistics DivisionOwner: World Bank
Government expenditure on agriculture (%total outlays)Refers to Core Areas of Government FunctionsRelevant to the Agriculture Sector based onthe Classification of Functions of Government(COFOG) as outlined in the IMFs GovernmentFinance Statistics Manual, 2001 (GFSM 2001).Statistics on expenditures in agriculture,forestry and fisheries and on environmentalprotection can be used to study theeffectiveness of government programs thatsupport an enabling environment for essential
227

public goods with high economic and socialreturns.Source: FAO, Statistics Division (FAOSTAT)Owner: FAO and IMF
Greenhouse gas emissions from agriculture,forestry and other land use (AFOLU)Contains all the emissions produced in thedifferent agricultural emissions sub-domains,providing a picture of the contribution tothe total amount of GHG emissions fromagriculture. GHG Emissions from agricultureconsist of non-CO2 gases, namely methane(CH4) and nitrous oxide (N2O), producedby crop and livestock production andmanagement activities. Land use includes CO2emissions by sources and removals by sinksfrom forest land, cropland and grassland, aswell as emissions of non-CO2 from fires ofbiomass and organic soils.Source: FAO, Statistics DivisionOwner: FAO
Import value index (2004-2006 = 100)Value indices represent the change in thecurrentvalues of Import c.i.f. (cost, insuranceand freight) all expressed in US dollars. Forcountries which report import values on anf.o.b. (free on board) basis, these are adjusted toapproximate c.i.f. values (by a standard factorof 112 percent).Source: FAO, Statistics DivisionOwner: FAO
Improved water source (%)Refers to the percentage of the populationwith reasonable access to an adequateamount of water from an improved source,such as a household connection, publicstandpipe, borehole, protected well orspring, and rainwater collection. Unimprovedsources include vendors, tanker trucks, andunprotected wells and springs. Reasonableaccess is defined as the availability of at least20 liters a person a day from a source withinone kilometer of the dwelling.Source: World BankOwner: World Health Organization and UnitedNations Children’s Fund, Joint MeasurementProgramme (JMP)
Labour force participation rateThe proportion of the population ages 15-64that is economically active: all people whosupply labour for the production of goods andservices during a specified period.Source: World BankOwner: KILM database, ILO
Life expectancy at birth (years)Indicates the number of years a newborn infantwould live if prevailing patterns of mortalityat the time of its birth were to stay the samethroughout its life.Source: World BankOwner: UNPD World Population Prospects2010
Livestock primary productionInclude products from live and slaughteredanimals. Products from slaughtered animalsinclude meat, offals, raw fats, fresh hidesand skins. Products from live animals includemilk, eggs, honey, beeswax and fibres ofanimal origin. All data shown relate to totalmeat production from both commercial andfarm slaughter. Data are given in terms ofdressed carcass weight, i.e. excluding offals
and slaughter fats. Production of beef andbuffalo meat includes veal; mutton and goatmeat includes meat from lambs and kids,respectively; pig meat includes bacon and hamin fresh equivalent. Poultry meat includes meatfrom all domestic birds and refers, whereverpossible, to ready-to-cook weight. Cow milkproduction relates to total production of wholefresh milk, excluding the milk sucked byyoung animals but including amounts fed tolivestock. The concept of production of buffalo,sheep and goat milk is the same as for cowmilk; however, the cover- age is probably lessadequate. Egg production covers all domesticbirds which have contributed to egg productionduring the year, wherever they lay and thecorresponding total production, including eggsintended to be used for hatching but excludingwaste on farms.
Source: FAO, Statistics Division
Owner: FAO
MilkWhole fresh milk production from Buffalos,Camels, Cows, Goats and Sheep.
Source: FAO, Statistics Division
Owner: FAO
Net tradeRefers to imports and exports of food andagriculture products, excluding fishery andforestry products.
Source: FAO, Statistics Division
Owner: FAO
Organic area (%)Sum of areas under "Agricultural area certifiedorganic" and "Agricultural area in conversion toorganic". Agricultural area certified organic isthe land area exclusively dedicated to organicagriculture and managed by applying organicagriculture methods. It refers to the land areafully converted to organic agriculture. It is theportion of land area (including arable lands,pastures or wild areas) managed (cultivated)or wild harvested in accordance with specificorganic standards or technical regulations andthat has been inspected and approved bya certification body. Agricultural area inconversion to organic is the land area which isgoing through the organic conversion process,usually two years period of conversion toorganic land.
Source: FAO, Statistics Division
Owner: FAO
Other naturally regenerated forestNaturally regenerated forest is forestpredominantly composed of trees establishedthrough natural regeneration. Other naturallyregenerated forest is forest where there areclearly visible indications of human activities.
Source: Global Forest Resources Assessment,FAO
Owner: FAO
Per capita food production variability (constant2004-2006 thousand int$ per capita)Corresponds to the variability of the"food net per capita production value inconstant 2004-2006 international dollars" asdisseminated in FAOSTAT.
Source: FAO, Statistics Division
Owner: FAO
228

Per capita food supply variability(kcal/capita/day)Corresponds to the variability of the "foodsupply in kcal/caput/day" as disseminated inFAOSTAT.Source: FAO, Statistics DivisionOwner: FAO
PesticidesRefer to insecticides, fungicides, herbicides,disinfectants and any substance or mixture ofsubstances intended for preventing, destroyingor controlling any pest, including vectors ofhuman or animal disease, unwanted speciesof plants or animals causing harm during orotherwise interfering with the production,processing, storage, transport or marketingof food, agricultural commodities, woodand wood products or animal feedstuffs, orsubstances which may be administered toanimals for the control of insects, arachnidsor other pests in or on their bodies. The termincludes substances intended for use as a plantgrowth regulator, defoliant, desiccant or agentfor thinning fruit or preventing the prematurefall of fruit, and substances applied to cropseither before or after harvest to protect thecommodity from deterioration during storageand transport. Pesticides use data refers toquantities of pesticides applied to crops andseeds in the agriculture sector. Figures areexpressed in metric tons of active ingredients.However, due to some country reportingpractices, the data may be reported by: usein formulated product; sales; distribution orimports for use in the agricultural sector.Source: FAO, Statistics DivisionOwner: FAO
Planted forestPlanted forest is forest predominantlycomposed of trees establishedthroughplanting and/or deliberate seeding.Source: Global Forest Resources Assessment,FAOOwner: FAO
Political stability and absence ofviolence/terrorism (index)Measures perceptions of the likelihood that thegovernment will be destabilized or overthrownby unconstitutional or violent means, includingpolitically-motivated violence and terrorism.Source: World BankOwner: Brookings Institution and World Bank
Population with access to sanitation facilities(%)Refers to the percentage of the populationwith at least adequate access to excretadisposal facilities that can effectively preventhuman, animal, and insect contact with excreta.Improved facilities range from simple butprotected pit latrines to flush toilets with asewerage connection. To be effective, facilitiesmust be correctly constructed and properlymaintained.Source: World BankOwner: World Health Organization and UnitedNations Children’s Fund, Joint MeasurementProgramme (JMP)
Population, ruralDe facto population living in areas classifiedas rural (that is, it is the difference betweenthe total population of a country and its urbanpopulation). Data refer to 1 July of the yearindicated and are presented in thousands.Source: FAO, Statistics DivisionOwner: United Nations Population Division,World Urbanization Prospects.
Population, totalDe facto population in a country, area or regionas of 1 July of the year indicated.Source: FAO, Statistics DivisionOwner: World Population Prospects: The 2012Revision from the UN Population Division
Prevalence of undernourishmentExpresses the probability that a randomlyselected individual from the populationconsumes an amount of calories thatis insufficient to cover her/his energyrequirement for an active and healthy life.The indicator is computed by comparinga probability distribution of habitual dailydietary energy consumption with a thresholdlevel called the minimum dietary energyRequirement. Both are based on the notionof an average individual in the referencepopulation. Data in the country profiles arethree-year averages for the years 1990-92,1999-2001, and 2014-16.Source: FAO, Statistics DivisionOwner: FAO
Primary forestNaturally regenerated forest of native species,where there are no clearly visible indications ofhuman activities and the ecological processesare not significantly disturbed.Source: Global Forest Resources Assessment,FAOOwner: FAO
Renewable water resources withdrawn (% oftotal)The total volume of groundwater and surfacewater withdrawn from their sources forhuman use (in the agricultural, municipal andindustrial sectors), expressed as a percentageof the total actual renewable water resources.Source: Land and Water Division (AQUASTAT)Owner: FAO
RiceOryza spp., mainly oryza sativa. Rice grain afterthreshing and winnowing. Also known as ricein the husk and rough rice. Used mainly forhuman food.Source: FAO, Statistics DivisionOwner: FAO
Road density (per 100 sq km of land area)Includes motorways, highways, and main ornational roads, secondary or regional roads,and all other roads in a country. A motorwayis a road designed and built for motor trafficthat separates the traffic flowing in oppositedirections.Source: World BankOwner: International Road Federation, WorldRoad Statistics and electronic files
Terrestrial protected areas (% total land area)Totally or partially protected areas of atleast 1,000 hectares that are designatedby national authorities as scientific reserveswith limited public access, national parks,natural monuments, nature reserves or wildlifesanctuaries, protected landscapes, and areasmanaged mainly for sustainable use. Marineareas, unclassified areas, littoral (intertidal)areas, and sites protected under local orprovincial law are excluded.Source: World BankOwner: United Nations EnvironmentalProgram and the World ConservationMonitoring Centre, as compiled by the WorldResources Institute
229

The depth of the food deficit (%)Indicates how many calories would beneeded to lift the undernourished fromtheir status, everything else being constant.The average intensity of food deprivationof the undernourished, estimated as thedifference between the average dietaryenergy requirement and the average dietaryenergy consumption of the undernourishedpopulation (food-deprived), is multiplied bythe number of undernourished to providean estimate of the total food deficit in thecountry, which is then normalized by the totalpopulation.Source: FAO, Statistics DivisionOwner: FAO
Total land areaThe total area of the country excluding areaunder inland water bodies.Source: FAO, Statistics DivisionOwner: FAO
Underweight, children under-5 (%)Percentage of underweight (weight-for-ageless than -2 standard deviations of theWHO Child Growth Standards median) amongchildren aged 0-5 years.Source: World BankOwner: World Health Organization, GlobalDatabase on Child Growth and Malnutrition.Country-level data are unadjusted datafrom national surveys, and thus may not becomparable across countries.
Value added from agriculture (% GDP)Agriculture corresponds to ISIC divisions 1-5and includes forestry, hunting, and fishing,as well as cultivation of crops and livestockproduction. Value added is the net outputof a sector after adding up all outputs andsubtracting intermediate inputs. It is calculatedwithout making deductions for depreciation offabricated assets or depletion and degradationof natural resources. The origin of value addedis determined by the International StandardIndustrial Classification (ISIC), revision 3.Source: World Development Indicators, WorldBankOwner: IMF
Value of food (excluding fish) imports over totalmerchandise exportsProvides a measure of vulnerability andcaptures the adequacy of foreign exchangereserves to pay for food imports, whichhas implications for national food securitydepending on production and trade patterns.Source: FAO, Statistics DivisionOwner: FAO
Water resources per capita (m3/person/year)Total annual internal renewable waterresources per inhabitant.Source: Land and Water Division (AQUASTAT)Owner: FAO
Water withdrawal, agriculture (% of total)Annual quantity of water withdrawnfor irrigation, livestock and aquaculturepurposes. It includes renewable freshwaterresources as well as over-abstraction ofrenewable groundwater or withdrawal of fossilgroundwater, use of agricultural drainagewater, (treated) wastewater and desalinatedwater.Source: Land and Water Division (AQUASTAT)Owner: FAO
Water withdrawal, industrial (% of total waterwithdrawal)Industrial water withdrawal as percentage oftotal water withdrawal.Source: Land and Water Division (AQUASTAT)Owner: FAO
WheatTriticum spp.: common (T. aestivum) durum (T.durum) spelt (T. spelta). Common and durumwheat are the main types. Among commonwheat, the main varieties are spring and winter,hard and soft, and red and white. At thenational level, different varieties should bereported separately, reflecting their differentuses. Used mainly for human food.Source: FAO, Statistics DivisionOwner: FAO
Wood pellet production (thousand tonnes)The most common type of pellet fuel and aregenerally made from compacted sawdust andrelated industrial wastes from the milling oflumber, manufacture of wood products andfurniture, and construction. Other industrialwaste sources include Empty Fruit Bunches[EFB], palm kernel shells, coconut shells,and tree tops and branches discarded duringlogging operations.Source: FAO, Statistics DivisionOwner: Forestry Department, FAO
230

NotesThe country classification adopted in this publication is based on the United Nations M49 classification(http://unstats.un.org/unsd/methods/m49/m49.htm). The country names have been abbreviated for thepurpose of this publication. The official FAO names can be found at http://termportal.fao.org/faonocs/appl/.
Following the creation of the Republic of South Sudan in July 2011, the M49 classification consideredthe Sudan as part of the Northern Africa region, and South Sudan as part of Eastern Africa. In this report,data for the Sudan are therefore included in the Northern Africa region.
The asterisk in charts and maps indicates the most recent year available in the specified time interval.In the country profiles, when the country data have not been reported for the reference year, data initalics indicate that the value for the most recent year available is shown.
In the tables, a blank means not applicable or, for an aggregate, not analytically meaningful. A 0 or0.0 means zero or a number that is small enough to round to zero at the displayed number of decimalplaces.
The ~ in the maps refers to the range specified in the class intervals.
In addition:
• <5.0 proportion less than 5 percent• <0.1 less than 100 000 people• ns not statistically significant
Two types of aggregations are used in the book: sum and weighted mean. Two restrictions are imposedwhen computing the aggregation: i) the sufficiency condition – the aggregation is computed only whensufficient countries have reported data, and the current threshold is set at 50 percent of the variableand the weighting variable, if present; and ii) the comparability condition – as aggregations are usuallycomputed over time, this condition is designed to ensure that the number of countries is comparableover several years; under the current restriction the number of countries may not vary by more than 15over time.
This publication was carried out under the direction of Pietro Gennari (Chief Statistician and Director,ESS) . It was prepared by the Statistics Division (Amy Heyman and Markus Kainu). A special thanks theteam leaders for their input and to Nicola Selleri (ESS) for the cover design.
231


I4691E/1/05.15
ISBN 978-92-5-108802-9
9 7 8 9 2 5 1 0 8 8 0 2 9