family of funds - calamos investments · time horizons, risk tolerances and ... in a rapidly...
TRANSCRIPT

ANNUAL REPORT OCTOBER 31, 2017
Calamos Opportunistic Value Fund
Calamos Growth Fund
TIMELY INFORMATION INSIDE
Visit to enroll. You can view shareholdercommunications, including fund prospectuses,annual reports and other shareholder materials online long before the printed publicationsarrive by traditional mail.
GO PAPERLESS SIGN UP FOR E-DELIVERY
www.calamos.com/FundInvestor/GoPaperless
Calamos Growth and Income Fund
Calamos Dividend Growth Fund
Calamos International Growth Fund
Calamos Evolving World Growth Fund
Calamos Emerging Market Equity Fund
Calamos Global Equity Fund
Calamos Global Growth and Income Fund
Calamos Convertible Fund
Calamos Global Convertible Fund
Calamos Total Return Bond Fund
Calamos High Income Opportunities Fund
Calamos Market Neutral Income Fund
Calamos Hedged Equity Income Fund
Calamos Phineus Long/Short Fund
Family of Funds
Experience and Foresight
About Calamos InvestmentsFor 40 years, we have helped investors like you manage and buildwealth to meet long-term objectives. Because investors have differenttime horizons, risk tolerances and goals, we offer funds to suit a varietyof asset allocation needs. Our 16 mutual funds include equity, fixedincome, convertible and alternative funds. We offer U.S. funds as wellas global and international choices.
We are dedicated to helping our clients build and protectwealth. We understand when you entrust us with your assets, youalso entrust us with your achievements, goals and aspirations. Webelieve we best honor this trust by making investment decisions guidedby integrity, discipline and our conscientious research.
We believe an active, risk-conscious approach is essential forwealth creation. In the 1970s, we pioneered the use of convertiblesecurities as a means to control risk in volatile markets. We followedwith strategies that combine convertibles and stocks, with the aim ofparticipating in equity market upside with potentially less volatility thanan all-stock portfolio. In the 1990s, we introduced our first stock fund,which invests in growth companies both large and small. Across ourfunds, our investment process seeks to manage risk at multiple levelsand draws upon our experience investing through many marketcycles. In a rapidly changing environment, we believe that this activemanagement is essential.
We are global in our perspective. We believe globalization offerstremendous opportunities for countries and companies all over theworld. In our U.S., global and international portfolios, we are seekingto capitalize on the potential growth of the global economy.
We believe there are opportunities in all markets. Our historytraces back to the 1970s, a period of significant volatility and economicconcerns. We have invested through multiple market cycles, each withits own challenges. Out of this experience comes our belief that theflipside of volatility is opportunity.
TABLE OF CONTENTS
Letter to Shareholders 1
The Funds
Calamos Growth Fund 4
Calamos Opportunistic Value Fund 8
Calamos Dividend Growth Fund 12
Calamos International Growth Fund 15
Calamos Evolving World Growth Fund 19
Calamos Emerging MarketEquity Fund 22
Calamos Global Equity Fund 25
Calamos Growth and Income Fund 28
Calamos Global Growth andIncome Fund 33
Calamos Convertible Fund 38
Calamos Global Convertible Fund 43
Calamos Total Return Bond Fund 46
Calamos High IncomeOpportunities Fund 49
Calamos Market Neutral Income Fund 53
Calamos Hedged Equity Income Fund 57
Calamos Phineus Long/Short Fund 60
Expense Overview 65
Schedules of Investments 68
Statements of Assets and Liabilities 132
Statements of Operations 136
Statements of Changes In Net Assets 140
Notes to Financial Statements 146
Financial Highlights 179
Report of Independent RegisteredPublic Accounting Firm 211
Trustee Approval of ManagementAgreement 212
Trustees and Officers 217
Tax Information 219
Letter to Shareholders
JOHN P. CALAMOS, SR.Founder, Chairman andGlobal Chief InvestmentOfficer
Dear Fellow Shareholder:
Welcome to your annual report for the one-year period ended October 31, 2017. In this
report, you will find commentary from the Calamos portfolio management teams, as
well as a listing of portfolio holdings, financial statements and highlights, and detailed
information about the performance and positioning of the Calamos Funds. I encourage
you to review this information carefully.
Market Review
During the reporting period, confidence in the synchronized global growth narrative grew
against a backdrop of improving economic data and healthy corporate earnings. Stocks
posted strong returns and a number of bellwether market gauges reached new heights.
From a geographic perspective, gains were broad based, with U.S., developed markets
and emerging markets stocks advancing briskly.1 Convertible securities, which blend
attributes of both stocks and bonds, participated in a large measure of the stock market’s
upside, both in the U.S. and globally.2 Within the fixed-income markets, more econom-
ically sensitive high-yield securities continued to perform well3 as investors maintained an
appetite for risk and yield. However, as the Federal Reserve maintained a gradual course
of raising short-term interest rates and investors gravitated toward stocks, traditional
fixed-income securities, such as investment-grade bonds, encountered headwinds.4
Outlook
Looking forward, we believe global economic conditions can provide a supportive
backdrop for the markets. The U.S. recovery is mature but still has steam, while other
major economies are in earlier stages of recovery. As global growth continues, we see
additional upside in the global business cycle and, in turn, for stocks, convertible
securities and select areas of the high-yield market.
While our outlook is constructive, our teams are watchful of potential downside risks.
Among them, the policies of global central banks are moving away from the exceedingly
accommodative stances of past years. We are also mindful of global political instability,
strained trade relationships, heated rhetoric between the U.S. and North Korea, potential
deceleration in China, and high levels of corporate debt.
www.calamos.com 1

Letter to Shareholders
Further, valuations are stretched in some areas of the market, and we may see consolidation and sector
rotation. Given the sustained rally in equities, we would not be surprised to see a pause or even a correction.
In an environment of economic expansion, downside volatility could provide buying opportunities for our
teams’ long-term approaches.
Calamos at 40 Years: A Look Back … and Ahead
Calamos Investments celebrated its 40-year anniversary earlier this year. Much has changed since I founded
the firm in 1977. Some changes, such as the rise of passive strategies, are concerning to me—especially given
our view that the markets will increasingly require experienced and active management.
However, many of these changes are quite positive, such as an increased focus on global asset allocation. I’m
also encouraged by the growing role of liquid alternative strategies in investors’ portfolios. For decades, we
have offered risk-managed global and alternative strategies as a way to potentially mitigate risk, enhance
returns, and generate income in innovative ways. We’ve continued to expand our capabilities in both areas,
always guided by the asset allocation needs of investors.
When markets are going up as they have been, investors may be more inclined to put financial planning and
asset allocation on cruise control. While that’s understandable, I encourage you to take some time to check in
with your financial advisor to ensure your portfolio is aligned with your goals and risk tolerance. Throughout
the years, I’ve seen the markets change directions quite suddenly in a short period, often catching investors off
guard. The allocations of your portfolio will also shift over time as investments appreciate at different rates.
Regardless of the direction of the market, a periodic check in with your advisor can be a smart strategy, and as
I have noted in the past, the new year presents a good opportunity for these conversations.
As always, we thank you for your continued trust. The longevity and success of our firm over these 40 years is
a reflection of the trust you have placed in us. We look forward to helping you achieve your goals over the
coming decades.
Please visit our website www.calamos.com often. You’ll find a wealth of resources and commentary on the
markets, asset allocation and our funds.
Sincerely,
John P. Calamos, Sr.Founder, Chairman and Global Chief Investment Officer
2 CALAMOS OPEN-END FAMILY OF FUNDS ANNUAL REPORT
Letter to Shareholders
Before investing, carefully consider a fund’s investment objectives, risks, charges and expenses. Please see the prospectus containingthis and other information or call 800.582.6959. Please read the prospectus carefully. Performance data represents past performance,which is no guarantee of future results. Current performance may be lower or higher than the performance quoted.
1 The MSCI All Country World Index is a measure of global stock market performance, which returned 23.86% for the one-yearperiod ending October 31, 2017. The MSCI World Index is a market-capitalization weighted index composed of companies repre-sentative of the market structure of developed market countries in North America, Europe and the Asia/Pacific region. For theone-year period ended, the index returned 23.46%. The S&P 500 Index is an unmanaged index generally considered representativeof the U.S. stock market. For the one-year period, the index returned 23.63%. The MSCI Emerging Markets Index is a free float-adjusted market capitalization index considered broadly representative of emerging market equity performance. The index repre-sents companies within the constituent emerging markets that are available to investors worldwide, and it returned 26.91% for theone-year period ended October 31, 2017.
2 The ICE BofAML All U.S. Convertibles ex-Mandatory Index represents the U.S. convertible securities market excluding mandatoryconvertibles. The index returned 20.69% for the one-year period ending October 31, 2017. The ICE BofAML Global 300 ConvertibleIndex is a global convertible index composed of companies representative of the market structure of countries in North America,Europe and the Asia/Pacific region. The index returned 16.13% for the one-year period ended October 31, 2017.
3 The Credit Suisse U.S. High Yield Index is an unmanaged index of high yield debt securities, which returned 9.04% for the one-yearperiod ending October 31, 2017.
4 The Bloomberg Barclays U.S. Aggregate Index is considered generally representative of the investment-grade bond market. For theone-year period ending October 31, 2017, the index returned 0.90%.
Sources: Lipper, Inc.; Morningstar, Inc.
Unmanaged index returns assume reinvestment of any and all distributions and, unlike fund returns, do not reflect fees, expenses orsales charges. Investors cannot invest directly in an index. Investments in overseas markets pose special risks, including currencyfluctuation and political risks. These risks are generally intensified for investments in emerging markets. Countries, regions, and sectorsmentioned are presented to illustrate countries, regions, and sectors in which a fund may invest. Fund holdings are subject to changedaily. The Funds are actively managed.
The information contained herein is based on internal research derived from various sources and does not purport to be statements ofall material facts relating to the securities mentioned. The information contained herein, while not guaranteed as to accuracy orcompleteness, has been obtained from sources we believe to be reliable. There are certain risks involved with investing in convertiblesecurities in addition to market risk, such as call risk, dividend risk, liquidity risk and default risk, that should be carefully consideredprior to investing. This information is being provided for informational purposes only and should not be considered investment adviceor an offer to buy or sell any security in the portfolio. Investments in alternative strategies may not be suitable for all investors.
This report is intended for informational purposes only and should not be considered investment advice.
www.calamos.com 3
Calamos Growth Fund
OVERVIEWThe fund invests in the equities of U.S.companies from a range of marketcapitalizations that we believe offer thebest potential for growth.
KEY FEATURES▪ Utilizes more than two decades of
extensive research experience in growthinvesting
▪ Active management focuses on top-down views and bottom-upfundamentals
▪ Research-driven approach identifiesopportunities by combining top-downanalysis with a focus on key growthcharacteristics
PORTFOLIO FITThis actively managed fund seeks toprovide attractive returns through itsemphasis on higher growth companiesprimarily in large and mid cap arenas.
FUND NASDAQ SYMBOLS
A Shares CVGRXC Shares CVGCX
I Shares CGRIXR Shares CGRRX
FUND CUSIP NUMBERS
A Shares 128119302C Shares 128119856
I Shares 128119807R Shares 128119435
CALAMOS GROWTH FUNDINVESTMENT TEAM DISCUSSION
How has the Fund performed?For the 12-month period ended October 31, 2017, the Fund returned 22.79% (Class Ashares at net asset value) versus the Russell 3000 Growth Index return of 29.80%. Forthe same period, the S&P 500 Index rose 23.63% and the Russell Midcap Growth Indexreturned 26.25%.
The Fund’s performance reflects a strong equity market, where earnings for U.S.companies showed marked improvement in earnings growth and the global economyrecovered in a more synchronized manner. In the U.S., the earnings recession, whichhad started in the latter half of 2015, finally ended with positive Q3 and Q4 2016results, as measured by the S&P 500 Index.
Since its inception on September 4, 1990, the Fund has returned 12.86% on anannualized basis (Class A shares at net asset value), demonstrating its ability tooutdistance the growth and broad indices over full market cycles. Over the sameperiod, the Russell 3000 Growth Index returned 9.84%, while the S&P 500 Index andthe Russell Midcap Growth Index returned 10.23% and 10.98%, respectively.
What factors influenced performance over the period?U.S. equity markets rallied strongly and steadily over the reporting period. While theperiod was marked by geopolitical volatility, market volatility had notably diminished.U.S. elections in November 2016 caught many by surprise, as Donald Trump was electedpresident. He had campaigned to reduce burdensome regulations, decrease taxes forU.S. businesses, overhaul U.S. health care, bring offshore U.S. cash back on shore, andraise infrastructure spending. Markets rallied strongly, and while many of the businessesthat might benefit most from the new administration’s plans rallied strongest, eventuallythe equity market’s gains broadened out. For the full reporting period, eight of elevensectors within the Russell 3000 Growth Index saw double-digit gains.
Despite concerns about North Korea’s weapons tests, Russia’s attempts to influenceU.S. elections, continuous finger pointing in the U.S. political arena, Federal Reserveinterest rate hikes, the rolling off of quantitative easing, and the selection of a new FedChair, volatility was hard to come by in equity markets. Since the market low onNovember 4, 2016, the U.S. equity market, as measured by the S&P 500 Index, did notexperienced a correction of 3% through the entire period ending October 31, 2017.The index’s steady upward trajectory marked an unusual and impressive feat.
In our view, the markets are climbing on improved economic data. The U.S. was one ofthe first countries in the global economy to make significant efforts to ease the course ofbusiness and help reignite growth. Subsequently, other regions and countries followedcourse, and a global recovery began taking shape as early as the middle of 2016.
Within the Fund, our efforts to add to areas that stood to benefit from this moresynchronous global growth contributed to performance. Maintaining an underweightto areas such as consumer staples was additive to performance. In our view, investorshave overpaid for the perceived stability and higher dividend associated with consumerstaples names, and these businesses do not offer attractive growth. For the reporting
4 CALAMOS OPEN-END FAMILY OF FUNDS ANNUAL REPORT

Calamos Growth Fund
period, consumer staples ranked 11 out of 12 sectors within the Russell 3000 GrowthIndex. Similarly, the Fund’s underweight to real estate was a positive, as the sectorlagged the overall market as well. Holdings within the information technology sector,while delivering strong absolute performance, lagged those of the sector. Under-weights to some high-performing tech stocks, most notably in semiconductors, slowedrelative performance. We maintain an approximate market-weight to informationtechnology, and we remain impressed by the opportunities for growth and cash-flowgeneration within tech companies. Our concern centers on the fact that tech seems tobe a favored investment among market participants, and we have tried to applyadditional risk management within the space.
How is the Fund positioned?In this all-cap growth equity Fund, we seek to invest in U.S. companies that we believehave the best prospects for sustainable and high relative growth. The Fund offers adiversified approach and participates in long-term growth trends by focusing oncompanies with solid fundamentals, global brands, and strong growth catalysts, whilebeing mindful of valuations.
During the reporting period, we had increased our relative positioning within areas of themarket that should benefit from improved U.S. economic growth. Areas such asindustrials and financials have experienced a resurgence from economic conditions withinthe U.S. and abroad. We have taken some gains within the industrials space and reducedour relative weighing on the strength of the sector, but maintain our overweight tofinancials. Within financials, we hold securities that we believe may continue to benefitfrom past expense cuts and an increasing demand for services. We believe that financialsstill offer a compelling combination of valuation and growth potential.
The Fund still maintains its most significant weight in the information technology sectoras it is the largest sector within the growth index and continues to offer compellingopportunities. Technology companies, as a large and diverse pool of names, also offeropportunities for cyclical as well as more defensive growth, which helps to bring a bitof a balanced approach to what the market might prefer for growth. We have reducedthe Fund’s underweight to health care names, believing that some of the pressures thesector faced from political risks may have helped create an attractive entry point forleading-edge, high-growth health care companies.
What closing thoughts do you have for Fund shareholders?The length of this bull market has caused angst for many investors. Recent surveys ofhousehold stock ownership, and the flow of funds to equity funds has shown that wemay not be in the midst of euphoria as some bearish prognosticators might argue. Thatbeing said, the U.S. equity market does have higher valuations when compared torecent history, but we would argue that it is very difficult to make that assessment asconditions today aren’t anywhere near where they were five, ten, or twenty years ago.In fact, when we look at equity valuations from an equity-risk-premium standpoint(how do equity valuations today compare to other investments, such as corporatebonds or U.S. Treasuries), one could argue that the U.S. equity market is cheap. In lightof low interest rates, which are the discounting mechanism when valuing future cashflows, as well as earnings growth and cash flows, we believe that the U.S. equitymarket continues to be a compelling place to invest.
SECTOR WEIGHTINGS
Information Technology 38.5%Consumer Discretionary 17.9
Health Care 14.5Financials 11.8
Industrials 9.2Consumer Staples 2.9
Energy 1.4Materials 1.2
Sector weightings are subject to change daily andare calculated as a percentage of net assets. Thetable excludes cash or cash equivalents, anygovernment/sovereign bonds or broad based indexhedging securities the Fund may hold.
www.calamos.com 5

Calamos Growth Fund
ANNUALIZED RETURN: SINCE INCEPTION (9/4/90) THROUGH 10/31/17
0%
35%
20%
25%
30%
15%
10%
5%
SINCE INCEPTION15-YEAR10-YEAR5-YEAR3-YEAR1-YEAR
Calamos Growth Fund(A Shares at NAV)
Russell Midcap® Growth Index S&P 500 Index Russell 3000Growth Index
26.2522.79 23.63
29.80
9.987.61
10.7712.94 12.48
15.3415.18
16.71
4.248.23 7.51 9.06 8.80
11.779.6010.37
12.86 10.9810.23 9.84
Performance data quoted represents past performance, which is no guarantee of future results. Current performance may be lower or higher than theperformance quoted.
The principal value and investment return of an investment will fluctuate so that your shares, when redeemed, may be worth more or less than theiroriginal cost. You can obtain performance data current to the most recent month end by visiting www.calamos.com. Average annual total return measuresnet investment income and capital gain or loss from portfolio investments as an annualized average. All performance shown assumes reinvestment ofdividends and capital gains distributions. Performance is for the Fund’s Class A shares at net asset value and does not include the Fund’s maximum front-end sales charge of 4.75%. Had it been included, the Fund’s return would have been lower. The Fund also offers Class C, Class I and Class R shares, theperformance of which may vary. Source: State Street Corporation and Lipper, Inc.
6 CALAMOS OPEN-END FAMILY OF FUNDS ANNUAL REPORT

Calamos Growth Fund
GROWTH OF $10,000: FOR THE 10-YEAR PERIOD ENDED 10/31/17
10/31/1710/31/07
Russell Midcap Growth IndexCalamos Growth Fund S&P 500 IndexRussell 3000 Growth
$0
$5,000
$10,000
$15,000
$20,000
$25,000
$30,000
$22,046
$20,638
$23,794
$14,432
10/31/08 10/31/09 10/31/10 10/31/11 10/31/12 10/31/13 10/31/14 10/31/15 10/31/16
AVERAGE ANNUAL TOTAL RETURN† AS OF 10/31/17
1YEAR
5YEARS
10YEARS
Class A Shares – Inception 9/4/90Without Sales Charge 22.79% 12.48% 4.24%With Sales Charge 16.97 11.39 3.74
Class C Shares – Inception 9/3/96Without Sales Charge 21.85 11.64 3.46With Sales Charge 20.85 11.64 3.46
Class I Shares – Inception 9/18/97 23.09 12.76 4.50
Class R Shares – Inception 3/1/07 22.46 12.20 3.98
Performance data quoted represents past performance, which is no guarantee of future results.Current performance may be lower or higher than the performance quoted. The principal value andinvestment return of an investment will fluctuate so that your shares, when redeemed, may be worthmore or less than their original cost.
As of the prospectus dated 2/28/17, the Fund’s gross expense ratio for Class A shares is 1.35%,Class C shares is 2.10%, Class I shares is 1.10% and Class R shares is 1.60%. The expense ratiosshown above may differ from the more recent expense ratios reported in the Financial Highlightssection of this report.† Average annual total return measures net investment income and capital gain or loss from portfolio investments as an
annualized average assuming reinvestment of dividends and capital gains distributions. Performance shown reflects theeffects of an expense reimbursement that improved results and was in effect until March 31, 2000. Load-adjustedreturns are adjusted for the maximum front-end sales load of 4.75% for Class A shares and returns for Class C shareshave been adjusted for the contingent deferred sales charge (CDSC).
NOTES:The graphs do not reflect the income taxes that you would pay on fund distributions or the redemption of fund shares.Fund performance includes reinvestment of dividends and adjustment for the maximum sales charge for Class A shares.The performance of other classes will vary from the performance of the class shown based on the difference in salescharges and fees paid by shareholders investing in different share classes.
The Russell 3000® Growth Index measures the performance of companies with higher price-to-book ratios and higherforecasted growth values. Index data shown for the Annualized Return Since Inception graph is from 8/31/90, sincecomparative index data is only available for full monthly periods. Source: Lipper, Inc.
The S&P 500 Index is an unmanaged index generally considered representative of the U.S. stock market. Index data shownfor the Annualized Return Since Inception graph is from 8/31/90, since comparative index data is only available for fullmonthly periods. Source: Lipper, Inc.
The Russell Midcap® Growth Index measures the performance of mid-sized companies with growth characteristics. Indexdata shown for the Annualized Return Since Inception graph is from 8/31/90, since comparative index data is only availablefor full monthly periods. Source: Lipper, Inc.
Index returns assume reinvestment of dividends and do not reflect deduction of fees and expenses. It is not possible toinvest directly in an index.
www.calamos.com 7

Calamos Opportunistic Value Fund
OVERVIEWThe fund invests in the equities of small,midsize and large U.S. companies that webelieve are undervalued according tocertain financial measurements of theirintrinsic values.
KEY FEATURESUtilizes bottom-up stock picking and abenchmark-agnostic approach, whichfocuses on good businesses with solidcash flow and value prices
PORTFOLIO FITThe fund is a core value option that maybalance a growth allocation andcomplement other value strategies. Ourflexibility in analyzing all companiesregardless of sector helps us avoid thecyclicality inherent in a deep value strategyor momentum growth strategy.
FUND NASDAQ SYMBOLS
A Shares CVAAXC Shares CVACX
I Shares CVAIXR Shares CVARX
FUND CUSIP NUMBERS
A Shares 128119666C Shares 128119641
I Shares 128119633R Shares 128119419
CALAMOS OPPORTUNISTIC VALUE FUNDINVESTMENT TEAM DISCUSSION
How has the Fund performed?For the 12-month period ended October 31, 2017, the Fund returned 21.56% (Class Ashares at net asset value) versus a gain of 23.63% for the S&P 500 Index and increaseof 17.78% for the Russell 1000 Value Index.
The Fund’s strong performance was a result of actively managing the Fund’s sectorweightings and economic exposures. We added to cyclical and secular growth whilereducing investment in “safety trade” names that tend to make up a larger percentageof the value index when compared to the broad market index. The nature of themarket’s moves, as discussed below, provided opportunities for the investment team totake advantage of rotations in leadership and valuation.
What factors influenced performance?U.S. equity markets rallied strongly and steadily over the reporting period. While theperiod was marked by geopolitical volatility, market volatility had notably diminished.U.S. elections in November 2016 caught many by surprise, as Donald Trump waselected president. He had campaigned to reduce burdensome regulations, decreasetaxes for U.S. businesses, overhaul U.S. health care, bring offshore U.S. cash back onshore, and raise infrastructure spending. Markets rallied strongly, and while many ofthe businesses that might benefit most from the new administration’s plans ralliedstrongest, eventually the equity market’s gains broadened out. For the full reportingperiod, eight of eleven sectors within the Russell 1000 Value Index saw double-digitgains, and telecom services was the only sector within the index to finish in negativeterritory for the period.
Despite concerns about North Korea’s weapons tests, Russia’s attempts to influenceU.S. elections, continuous finger pointing in the U.S. political arena, Federal Reserveinterest rate hikes, the roll-off of quantitative easing, and the selection of a new FedChair, volatility was hard to come by in equity markets. Since the market low onNovember 4, 2016, the U.S. equity market, as measured by the S&P 500 Index, has notexperienced a correction of 3%.
In our view, this is because markets are climbing on improved economic data. The U.S.was one of the first countries in the global economy to make significant efforts to easethe course of business and help reignite the animal spirits of growth. Subsequently,other regions and countries have followed course and a global recovery began to takeshape in the middle of 2016.
As the reporting period began, financials, industrials and energy stocks led marketshigher. The November through December 2016 period saw rapid gains to areas thatshould benefit from deregulation, infrastructure investment, or the potential for lowertaxes. Economic conditions also improved, and global GDP growth began to show asynchronized uptrend. In April 2017, we reduced the Fund’s relative weight to finan-cials to take profits in the sector, and we reduced holdings in the “safety trade”—stocks with high dividends but less growth potential and higher valuations. Wereallocated that capital to information technology and consumer discretionary, andmaintained investments in cyclical growth areas such as materials and industrials.
8 CALAMOS OPEN-END FAMILY OF FUNDS ANNUAL REPORT
Calamos Opportunistic Value Fund
Within the value market, financials, materials and information technology stocks all faredbest during the reporting period and contributed to Fund performance. Fund holdings ininformation technology, industrials and health care all strongly outperformed theircounterparts within the value benchmark. The Fund’s focus on companies showingstronger growth characteristics yet trading at attractive valuations worked well during theperiod. An underweight to financials was a drag on performance, but we are pleasedwith the absolute returns achieved in the sector and the profits we were able to takeearlier in the period. An underweight and selection in utilities, though absolutely positive,held back relative return, as did selection in materials.
How is the Fund positioned?We believe that the global economy continues on sound footing and U.S. businesses cancontinue to generate earnings growth. As such, we continue to underweight the “safetytrade” names that typically offer high dividends, but do not offer much opportunity forgrowth, and certainly trade at premiums relative to their growth potential.
The Fund’s largest weighting and overweight remains in the information technologysector. The sector is large and diverse and offers varying opportunities for cyclical andsecular growth. These companies are typically well capitalized and generate high cashflows from operations. The Fund is also overweight consumer discretionary names,where we believe the U.S. consumer has legs based on a strong employment pictureand rising household net worth. The portfolio is underweight financials, as the sectorhas had quite a strong run from the beginning of this reporting period and valuationsare less compelling than they were previously. Energy is another sector where the Fundis underweight, as the sector is a bit larger relative to the broad market. Rising interestrates are positive for financials, but the market controls the long end of the curve andglobal rates are still quite accommodative, which could serve as an anchor for U.S. rates.
What closing thoughts do you have for Fund shareholders?The length of this bull market has caused angst for many investors. Recent surveys ofhousehold stock ownership and the flow of money to equity funds has shown that wemay not be in the midst of euphoria as some bearish prognosticators might argue. Thatbeing said, the U.S. equity market does have higher valuations when compared torecent history, but we would argue that it is very difficult to make that assessment asconditions today aren’t anywhere near where they were five, ten, or twenty years ago.In fact, when we look at equity valuations from an equity-risk-premium standpoint(how do equity valuations today compare to other investments, such as corporatebonds or U.S. Treasuries), we could make an argument that the U.S. equity market ischeap. In light of low interest rates as well as earnings growth and cash flows, webelieve that the U.S. equity market continues to be a compelling place to invest.Likewise, global growth is still providing tailwinds for earnings and sales growth, andwe will continue to look for a mix of secular and cyclical growth opportunities tradingat attractive valuations in other regions.
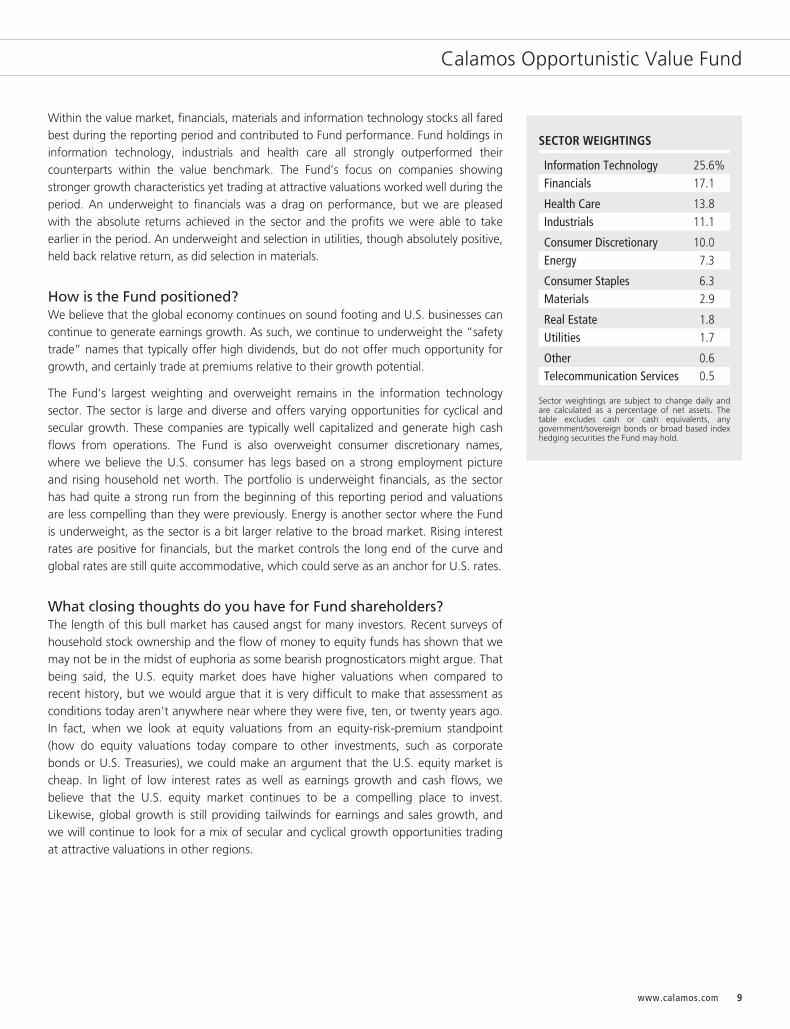
SECTOR WEIGHTINGS
Information Technology 25.6%Financials 17.1
Health Care 13.8Industrials 11.1
Consumer Discretionary 10.0Energy 7.3
Consumer Staples 6.3Materials 2.9
Real Estate 1.8Utilities 1.7
Other 0.6Telecommunication Services 0.5
Sector weightings are subject to change daily andare calculated as a percentage of net assets. Thetable excludes cash or cash equivalents, anygovernment/sovereign bonds or broad based indexhedging securities the Fund may hold.
www.calamos.com 9
Calamos Opportunistic Value Fund
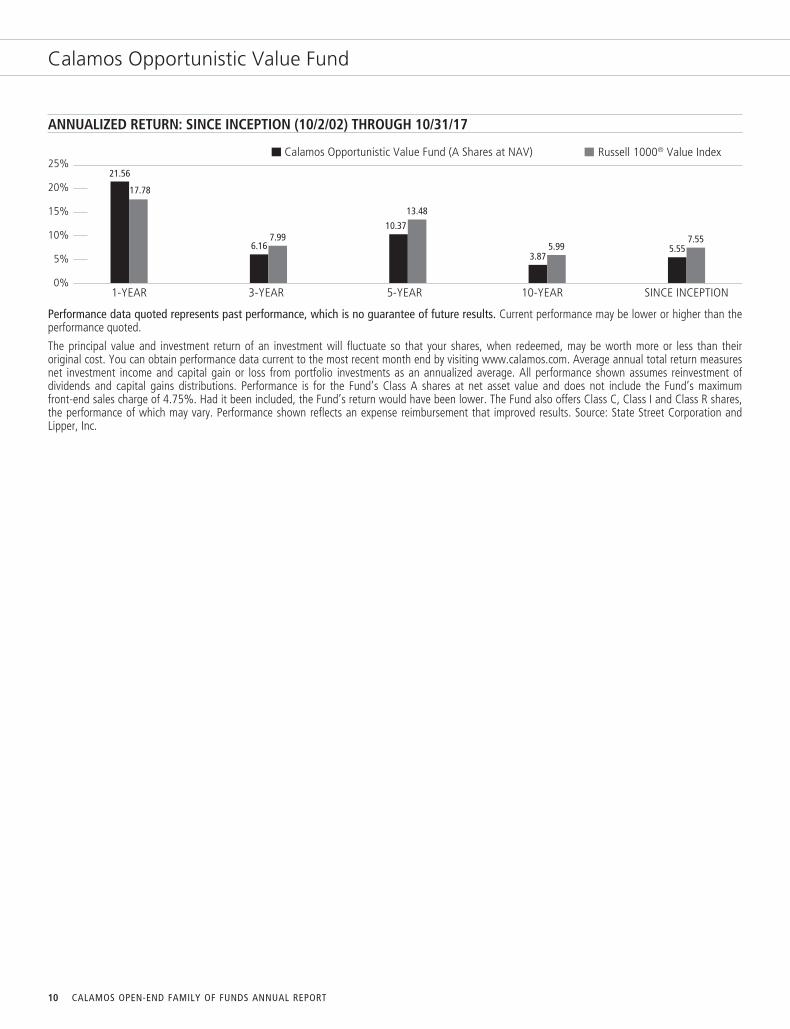
ANNUALIZED RETURN: SINCE INCEPTION (10/2/02) THROUGH 10/31/17
0%
25%
15%
20%
10%
5%
Russell 1000® Value IndexCalamos Opportunistic Value Fund (A Shares at NAV)
1-YEAR
21.56
17.78
3-YEAR
6.167.99
5-YEAR
10.37
13.48
10-YEAR
3.875.99
SINCE INCEPTION
5.557.55
Performance data quoted represents past performance, which is no guarantee of future results. Current performance may be lower or higher than theperformance quoted.
The principal value and investment return of an investment will fluctuate so that your shares, when redeemed, may be worth more or less than theiroriginal cost. You can obtain performance data current to the most recent month end by visiting www.calamos.com. Average annual total return measuresnet investment income and capital gain or loss from portfolio investments as an annualized average. All performance shown assumes reinvestment ofdividends and capital gains distributions. Performance is for the Fund’s Class A shares at net asset value and does not include the Fund’s maximumfront-end sales charge of 4.75%. Had it been included, the Fund’s return would have been lower. The Fund also offers Class C, Class I and Class R shares,the performance of which may vary. Performance shown reflects an expense reimbursement that improved results. Source: State Street Corporation andLipper, Inc.
10 CALAMOS OPEN-END FAMILY OF FUNDS ANNUAL REPORT
Calamos Opportunistic Value Fund
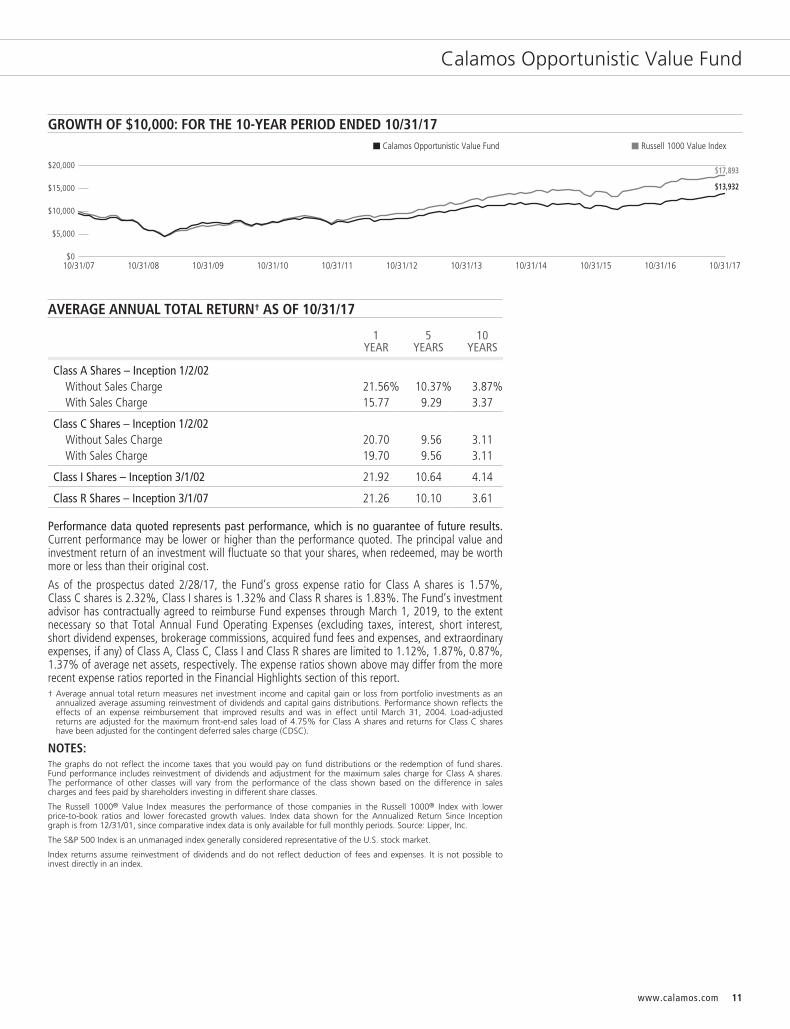
GROWTH OF $10,000: FOR THE 10-YEAR PERIOD ENDED 10/31/17
$0
$5,000
$10,000
$20,000
$15,000
$17,893
$13,932
10/31/07
Calamos Opportunistic Value Fund Russell 1000 Value Index
10/31/1710/31/08 10/31/09 10/31/10 10/31/11 10/31/12 10/31/13 10/31/14 10/31/15 10/31/16
AVERAGE ANNUAL TOTAL RETURN† AS OF 10/31/17
1YEAR
5YEARS
10YEARS
Class A Shares – Inception 1/2/02Without Sales Charge 21.56% 10.37% 3.87%With Sales Charge 15.77 9.29 3.37
Class C Shares – Inception 1/2/02Without Sales Charge 20.70 9.56 3.11With Sales Charge 19.70 9.56 3.11
Class I Shares – Inception 3/1/02 21.92 10.64 4.14
Class R Shares – Inception 3/1/07 21.26 10.10 3.61
Performance data quoted represents past performance, which is no guarantee of future results.Current performance may be lower or higher than the performance quoted. The principal value andinvestment return of an investment will fluctuate so that your shares, when redeemed, may be worthmore or less than their original cost.
As of the prospectus dated 2/28/17, the Fund’s gross expense ratio for Class A shares is 1.57%,Class C shares is 2.32%, Class I shares is 1.32% and Class R shares is 1.83%. The Fund’s investmentadvisor has contractually agreed to reimburse Fund expenses through March 1, 2019, to the extentnecessary so that Total Annual Fund Operating Expenses (excluding taxes, interest, short interest,short dividend expenses, brokerage commissions, acquired fund fees and expenses, and extraordinaryexpenses, if any) of Class A, Class C, Class I and Class R shares are limited to 1.12%, 1.87%, 0.87%,1.37% of average net assets, respectively. The expense ratios shown above may differ from the morerecent expense ratios reported in the Financial Highlights section of this report.† Average annual total return measures net investment income and capital gain or loss from portfolio investments as an
annualized average assuming reinvestment of dividends and capital gains distributions. Performance shown reflects theeffects of an expense reimbursement that improved results and was in effect until March 31, 2004. Load-adjustedreturns are adjusted for the maximum front-end sales load of 4.75% for Class A shares and returns for Class C shareshave been adjusted for the contingent deferred sales charge (CDSC).
NOTES:The graphs do not reflect the income taxes that you would pay on fund distributions or the redemption of fund shares.Fund performance includes reinvestment of dividends and adjustment for the maximum sales charge for Class A shares.The performance of other classes will vary from the performance of the class shown based on the difference in salescharges and fees paid by shareholders investing in different share classes.
The Russell 1000® Value Index measures the performance of those companies in the Russell 1000® Index with lowerprice-to-book ratios and lower forecasted growth values. Index data shown for the Annualized Return Since Inceptiongraph is from 12/31/01, since comparative index data is only available for full monthly periods. Source: Lipper, Inc.
The S&P 500 Index is an unmanaged index generally considered representative of the U.S. stock market.
Index returns assume reinvestment of dividends and do not reflect deduction of fees and expenses. It is not possible toinvest directly in an index.
www.calamos.com 11
Calamos Dividend Growth Fund
OVERVIEWThe fund invests in companies that webelieve have the ability to increasedividends over time, either throughincreasing profits or more efficient use ofcapital.
KEY FEATURES▪ Utilizes bottom-up stock picking and a
benchmark-agnostic approach, whichfocuses on good businesses with solidcash flow and value prices
PORTFOLIO FITThe fund seeks to provide a regular streamof income and dividend-paying equityinvestments that tend to be less volatilethan non-dividend payers.
FUND NASDAQ SYMBOLS
A Shares CADVXC Shares CCDVX
I Shares CIDVX
FUND CUSIP NUMBERS
A Shares 128120839C Shares 128120821
I Shares 128120813
CALAMOS DIVIDEND GROWTH FUNDINVESTMENT TEAM DISCUSSION
How has the Fund performed?For the 12-month period ended October 31, 2017, the Fund returned 23.17% (Class Ashares at net asset value) versus a 23.63% gain for the S&P 500 Index and a 23.67%gain for the Russell 1000 Index.
The Fund largely matched the strong returns of the U.S. equity market for the reportingperiod, despite the fact that some of the market’s leaders came from more cyclicalgrowth areas, which traditionally do not give rise to strong dividend growth stories.Our screening and fundamental research process favors companies with higher-qualitybalance sheets rather than ones that require additional financing in order to maintainoperations. Our top-down view helped steer us toward cyclical growth companies thatmay see improving balance sheets in light of a synchronous global-growthenvironment. However, we also hold traditionally stronger, stable growth companies,avoiding many of the bond-proxy stocks.
What factors influenced performance?U.S. equity markets rallied strongly and steadily over the reporting period. While theperiod was marked by geopolitical volatility, market volatility had notably diminished.U.S. elections in November 2016 caught many by surprise, as Donald Trump waselected president. During the campaign, he had pledged to reduce burdensomeregulations, decrease taxes for U.S. businesses, overhaul U.S. health care, bringoffshore U.S. cash back on shore, and raise infrastructure spending. Markets ralliedstrongly, and while many of the businesses that might benefit most from the newadministration’s plans rallied strongest, eventually the equity market’s gains broadenedout. For the full reporting period, seven of eleven sectors within the S&P 500 Index sawdouble-digit gains, and telecom services was the only sector within the index to have anegative return for the period.
Despite concerns about North Korea’s weapons tests, Russia’s attempts to influenceU.S. elections, continuous finger pointing in the U.S. political arena, Federal Reserveinterest rate hikes, the roll-off of quantitative easing, and the selection of a new FedChair, volatility was hard to come by in equity markets. Since the market low onNovember 4, 2016, the U.S. equity market, as measured by the S&P 500 Index, did notexperienced a correction of 3% through the entire period ending October 31, 2017.The index’s steady upward trajectory marked an impressive feat.
In our view, the markets are climbing on improved economic data. The U.S. was one ofthe first countries in the global economy to make significant efforts to ease the courseof business and help reignite growth. Subsequently, other regions and countriesfollowed course, and a global recovery began taking shape as early as the middleof 2016.
Overall, the full reporting period, the Fund was broadly in line with the U.S. equitymarket as measured by the S&P 500 Index. The rally among deep cyclical names at thebeginning of the reporting period was a bit of a headwind for the Fund because of itshigher-quality business preference, but as the 12-month period continued, the equityrally broadened out a bit, benefitting the Fund’s positioning for the second half ofthe period.
12 CALAMOS OPEN-END FAMILY OF FUNDS ANNUAL REPORT

Calamos Dividend Growth Fund
Sector allocations, based on a combination of our top-down view as well as funda-mental and valuation analysis, were additive to the Fund’s relative performance. Aslight overweight to financials contributed to return, as the sector was a marketoutperformer, though our selection acted as a negative offset. Strengthening balancesheets, an improving economy and the potential for deregulation worked in concert tobenefit underlying businesses in the sector. An underweight to real estate andconsumer staples was also beneficial, as the bond-proxy stocks in these sectors (stockswith higher dividends and perceived stability) fell out of favor and lagged the market. Aslight overweight to energy was a marginal negative, as the sector was among thelaggards within the U.S. equity market. Issue selection was a strong positive, as Fundholdings outperformed in nine of eleven sectors, led by consumer discretionary,industrials and materials holdings. Cash, which was less than 1.5% of the portfolio onaverage for the period, was a drag for the year as the market rallied strongly.
How is the Fund positioned?As always, our focus remains on solid businesses that have sustainable cash flows and aretrading at attractive prices. Moreover, our emphasis on companies that are betterstewards of capital should help relative performance in the current investmentenvironment. We believe that rising interest rates will prove most difficult to companiesheavily reliant on easy access to capital markets to fund their operations. The ability ofcompanies to fund and potentially grow dividends is likely to be a priority amonginvestors as interest rate increases are still modest. Holdings with equity yields and anopportunity for capital appreciation still appear to be an attractive investment allocation.
The Fund holds modest overweights to the financials and information technologysectors, as we believe the sectors offer a strong combination of attractive balancesheets and growth potential in light of improved economic trends. The Fund alsomaintains modest underweights to consumer staples and real estate, as we believediminished growth prospects have made the sectors broadly less attractive.
What closing thoughts do you have for Fund shareholders?The strength of the U.S. equity rally was certainly welcome during a time when it felt asif headlines focused on risks and everything that could go wrong. Despite thepreponderance of angst-inducing topics, the U.S. equity market did not exhibit much inthe way of volatility. Long-term, we maintain our view that improved economicconditions and fiscal policies should help support U.S. businesses and the U.S. equitymarket. Even so, we will continue to invest with an eye toward risks and a focus onstrong fundamentals. We believe that our approach to equity markets through theFund may be well suited for the conditions we face currently. Strong underpinnings ofeconomic growth and improved earnings and sales has benefitted many sectors andthe market overall, but we will continue to look for those businesses that are betterstewards of capital, can benefit from a rising tide, and are able to push ahead shouldmacro conditions slow.
SECTOR WEIGHTINGS
Information Technology 25.0%Financials 15.5
Health Care 13.4Consumer Discretionary 11.4
Industrials 9.7Consumer Staples 7.1
Energy 6.2Utilities 3.0
Materials 2.3Telecommunication Services 2.1
Real Estate 1.8Other 1.0
Sector weightings are subject to change daily andare calculated as a percentage of net assets. Thetable excludes cash or cash equivalents, anygovernment/sovereign bonds or broad based indexhedging securities the Fund may hold.
www.calamos.com 13
Calamos Dividend Growth Fund
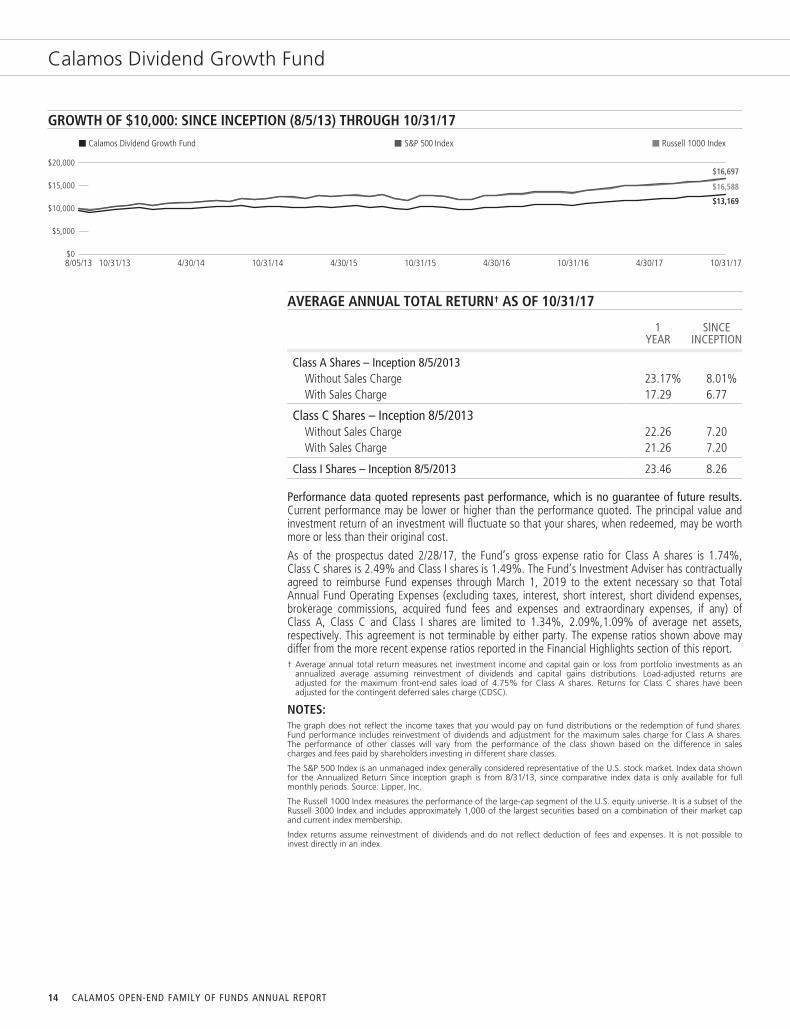
GROWTH OF $10,000: SINCE INCEPTION (8/5/13) THROUGH 10/31/17
10/31/14 4/30/15 10/31/15 4/30/164/30/14 10/31/16 4/30/17$0
$5,000
$10,000
$20,000
$15,000
Calamos Dividend Growth Fund Russell 1000 Index
8/05/13 10/31/13 10/31/17
$16,697
$16,588
$13,169
S&P 500 Index
AVERAGE ANNUAL TOTAL RETURN† AS OF 10/31/17
1YEAR
SINCEINCEPTION
Class A Shares – Inception 8/5/2013Without Sales Charge 23.17% 8.01%With Sales Charge 17.29 6.77
Class C Shares – Inception 8/5/2013Without Sales Charge 22.26 7.20With Sales Charge 21.26 7.20
Class I Shares – Inception 8/5/2013 23.46 8.26
Performance data quoted represents past performance, which is no guarantee of future results.Current performance may be lower or higher than the performance quoted. The principal value andinvestment return of an investment will fluctuate so that your shares, when redeemed, may be worthmore or less than their original cost.
As of the prospectus dated 2/28/17, the Fund’s gross expense ratio for Class A shares is 1.74%,Class C shares is 2.49% and Class I shares is 1.49%. The Fund’s Investment Adviser has contractuallyagreed to reimburse Fund expenses through March 1, 2019 to the extent necessary so that TotalAnnual Fund Operating Expenses (excluding taxes, interest, short interest, short dividend expenses,brokerage commissions, acquired fund fees and expenses and extraordinary expenses, if any) ofClass A, Class C and Class I shares are limited to 1.34%, 2.09%,1.09% of average net assets,respectively. This agreement is not terminable by either party. The expense ratios shown above maydiffer from the more recent expense ratios reported in the Financial Highlights section of this report.† Average annual total return measures net investment income and capital gain or loss from portfolio investments as an
annualized average assuming reinvestment of dividends and capital gains distributions. Load-adjusted returns areadjusted for the maximum front-end sales load of 4.75% for Class A shares. Returns for Class C shares have beenadjusted for the contingent deferred sales charge (CDSC).
NOTES:The graph does not reflect the income taxes that you would pay on fund distributions or the redemption of fund shares.Fund performance includes reinvestment of dividends and adjustment for the maximum sales charge for Class A shares.The performance of other classes will vary from the performance of the class shown based on the difference in salescharges and fees paid by shareholders investing in different share classes.
The S&P 500 Index is an unmanaged index generally considered representative of the U.S. stock market. Index data shownfor the Annualized Return Since Inception graph is from 8/31/13, since comparative index data is only available for fullmonthly periods. Source: Lipper, Inc.
The Russell 1000 Index measures the performance of the large-cap segment of the U.S. equity universe. It is a subset of theRussell 3000 Index and includes approximately 1,000 of the largest securities based on a combination of their market capand current index membership.
Index returns assume reinvestment of dividends and do not reflect deduction of fees and expenses. It is not possible toinvest directly in an index.
14 CALAMOS OPEN-END FAMILY OF FUNDS ANNUAL REPORT

Calamos International Growth Fund
CALAMOS INTERNATIONAL GROWTH FUNDINVESTMENT TEAM DISCUSSION
How has the Fund Performed?For the 12-month period ended October 31, 2017, the Fund returned 29.43% (Class Ashares at net asset value), versus a 24.09% gain for the MSCI EAFE Growth Index and25.19% return for the MSCI ACWI ex-U.S. Growth Index. International equitiesexperienced a broad advance during the period, with gains across regions and sectors.Higher prices reflected generally better economic data, higher corporate earnings andmore bullish investor sentiment across both developed and emerging markets.
The Fund outperformed over the annual period, due in part to a combination of secularand cyclical growth allocations in the Fund, strong performance in emerging marketspositions, and a broad rally in international equities that rewarded companies withleading fundamentals. Specifically, strong security selection imbued with higher earningsgrowth and return-on-invested-capital fundamentals contributed to robust gains over theperiod. Since its inception on March 16, 2005, the Fund gained 7.77% on an annualizedbasis (Class A Shares at net asset value) versus a return of 6.01% for the MSCI EAFEGrowth Index and 6.36% increase for the MSCI ACWI ex-U.S. Growth Index.
What factors influenced performance?With respect to specific effects on performance during the period, we would highlightthe following areas:
Information Technology. From a sector perspective, the Fund’s overweight positionand leading security selection in technology added the most value to performance overthe period. Our technology holdings exhibited earnings and cash-flow growth, positivecatalysts and exposure to key secular themes. Larger weights and selection in theInternet software & services, application software, and semiconductor equipmentindustries notably contributed.
Consumer Staples. The Fund’s underweight stance and relative security selection inconsumer staples also contributed substantially to Fund performance in the period.Fund holdings in packaged foods performed well due to strong company funda-mentals. Within the sector, we own an array of businesses with leading growthpotential and attractive cash-flow characteristics in multiple consumer categories.
Energy. The Fund’s slight overweight position and weaker selection in the energysector held back return, as our exposure to the oil & gas equipment and servicesindustry underperformed. We take a selective stance in energy as we attempt toreconcile global supply and demand issues with some stabilization in market prices.
Options. The Fund’s modest holdings in select protective put options also detracted asmall amount of value from performance over the period. We occasionally utilizeoption securities in the Fund to manage the risk/reward profile. These positions slightlyhampered performance given the persistently positive returns in international equities.
Geographic. From a geographic perspective, Fund holdings in both developed andemerging markets outperformed peer positions in the MSCI ACWI ex-U.S. GrowthIndex. Specifically, Fund positions in Emerging Asia and Japan outperformed those ofthe index and added the most value. Positioning in these regions benefited from strong
OVERVIEWThe fund invests in non-U.S. growthcompanies. We focus on those firms thatwe believe demonstrate key growthcharacteristics, including increasing profitmargins and high returns on investedcapital.
KEY FEATURES▪ Focuses on growth in an asset class that
is mostly defined by core and valueofferings
▪ Stresses company fundamentals,including global presence and strong oraccelerated earnings growth
▪ Investments driven by internationalsources of revenue for companies, noton location of headquarters
PORTFOLIO FITInvestors tend to underinvest in growthoutside the U.S. and emphasize growthwith U.S.-oriented equity funds. The fundstands as a potential growth-focusedaddition to a mostly core- or value-intensive international allocation.
FUND NASDAQ SYMBOLS
A Shares CIGRXC Shares CIGCX
I Shares CIGIXR Shares CIGFX
FUND CUSIP NUMBERS
A Shares 128119575C Shares 128119559
I Shares 128119542R Shares 128119393
www.calamos.com 15
Calamos International Growth Fund
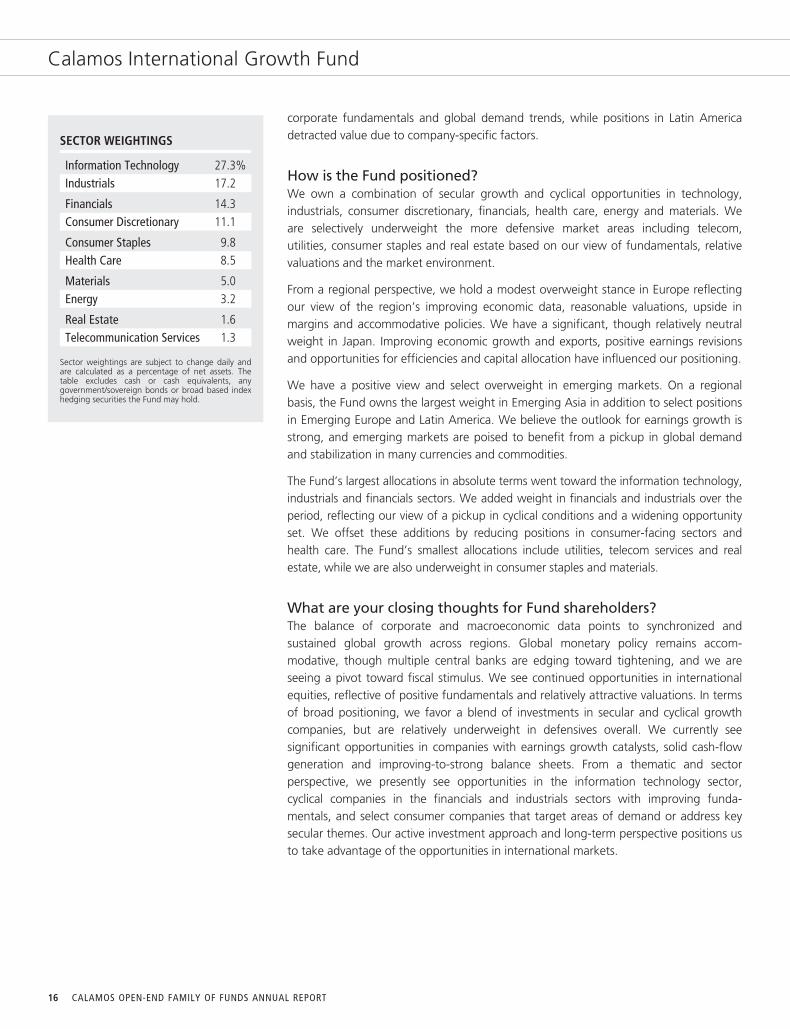
SECTOR WEIGHTINGS
Information Technology 27.3%Industrials 17.2
Financials 14.3Consumer Discretionary 11.1
Consumer Staples 9.8Health Care 8.5
Materials 5.0Energy 3.2
Real Estate 1.6Telecommunication Services 1.3
Sector weightings are subject to change daily andare calculated as a percentage of net assets. Thetable excludes cash or cash equivalents, anygovernment/sovereign bonds or broad based indexhedging securities the Fund may hold.
corporate fundamentals and global demand trends, while positions in Latin Americadetracted value due to company-specific factors.
How is the Fund positioned?We own a combination of secular growth and cyclical opportunities in technology,industrials, consumer discretionary, financials, health care, energy and materials. Weare selectively underweight the more defensive market areas including telecom,utilities, consumer staples and real estate based on our view of fundamentals, relativevaluations and the market environment.
From a regional perspective, we hold a modest overweight stance in Europe reflectingour view of the region’s improving economic data, reasonable valuations, upside inmargins and accommodative policies. We have a significant, though relatively neutralweight in Japan. Improving economic growth and exports, positive earnings revisionsand opportunities for efficiencies and capital allocation have influenced our positioning.
We have a positive view and select overweight in emerging markets. On a regionalbasis, the Fund owns the largest weight in Emerging Asia in addition to select positionsin Emerging Europe and Latin America. We believe the outlook for earnings growth isstrong, and emerging markets are poised to benefit from a pickup in global demandand stabilization in many currencies and commodities.
The Fund’s largest allocations in absolute terms went toward the information technology,industrials and financials sectors. We added weight in financials and industrials over theperiod, reflecting our view of a pickup in cyclical conditions and a widening opportunityset. We offset these additions by reducing positions in consumer-facing sectors andhealth care. The Fund’s smallest allocations include utilities, telecom services and realestate, while we are also underweight in consumer staples and materials.
What are your closing thoughts for Fund shareholders?The balance of corporate and macroeconomic data points to synchronized andsustained global growth across regions. Global monetary policy remains accom-modative, though multiple central banks are edging toward tightening, and we areseeing a pivot toward fiscal stimulus. We see continued opportunities in internationalequities, reflective of positive fundamentals and relatively attractive valuations. In termsof broad positioning, we favor a blend of investments in secular and cyclical growthcompanies, but are relatively underweight in defensives overall. We currently seesignificant opportunities in companies with earnings growth catalysts, solid cash-flowgeneration and improving-to-strong balance sheets. From a thematic and sectorperspective, we presently see opportunities in the information technology sector,cyclical companies in the financials and industrials sectors with improving funda-mentals, and select consumer companies that target areas of demand or address keysecular themes. Our active investment approach and long-term perspective positions usto take advantage of the opportunities in international markets.
16 CALAMOS OPEN-END FAMILY OF FUNDS ANNUAL REPORT

Calamos International Growth Fund
ANNUALIZED RETURN: SINCE INCEPTION (3/16/05) THROUGH 10/31/17
SINCE INCEPTION10-YEAR5-YEAR3-YEAR1-YEAR
MSCI EAFE Growth Index MSCI ACWI ex Growth Index
29.43
24.0925.19
8.04 8.01 7.79 7.219.69 8.74
2.88 2.32 1.92
7.776.01 6.36
0%
35%
25%
30%
10%
15%
5%
20%
Calamos International Growth Fund (A Shares at NAV)
Performance data quoted represents past performance, which is no guarantee of future results. Current performance may be lower or higher than theperformance quoted.
The principal value and investment return of an investment will fluctuate so that your shares, when redeemed, may be worth more or less than theiroriginal cost. You can obtain performance data current to the most recent month end by visiting www.calamos.com. Average annual total return measuresnet investment income and capital gain or loss from portfolio investments as an annualized average. All performance shown assumes reinvestment ofdividends and capital gains distributions. Performance is for the Fund’s Class A shares at net asset value and does not include the Fund’s maximum front-end sales charge of 4.75%. Had it been included, the Fund’s return would have been lower. The Fund also offers Class C, Class I and Class R shares, theperformance of which may vary. Source: State Street Corporation and Lipper, Inc.
www.calamos.com 17
Calamos International Growth Fund
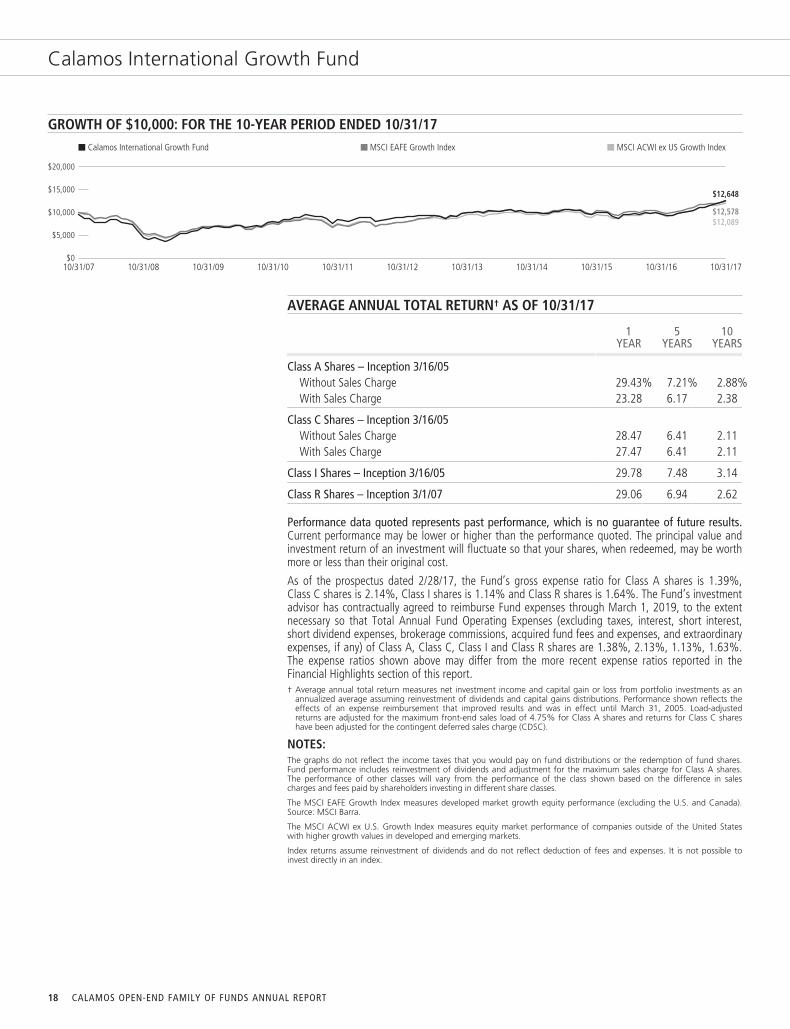
GROWTH OF $10,000: FOR THE 10-YEAR PERIOD ENDED 10/31/17
$0
$5,000
$10,000
$20,000
$15,000
Calamos International Growth Fund MSCI ACWI ex US Growth IndexMSCI EAFE Growth Index
10/31/07
$12,648
$12,089$12,578
10/31/1710/31/08 10/31/09 10/31/10 10/31/11 10/31/12 10/31/13 10/31/14 10/31/15 10/31/16
AVERAGE ANNUAL TOTAL RETURN† AS OF 10/31/17
1YEAR
5YEARS
10YEARS
Class A Shares – Inception 3/16/05Without Sales Charge 29.43% 7.21% 2.88%With Sales Charge 23.28 6.17 2.38
Class C Shares – Inception 3/16/05Without Sales Charge 28.47 6.41 2.11With Sales Charge 27.47 6.41 2.11
Class I Shares – Inception 3/16/05 29.78 7.48 3.14
Class R Shares – Inception 3/1/07 29.06 6.94 2.62
Performance data quoted represents past performance, which is no guarantee of future results.Current performance may be lower or higher than the performance quoted. The principal value andinvestment return of an investment will fluctuate so that your shares, when redeemed, may be worthmore or less than their original cost.
As of the prospectus dated 2/28/17, the Fund’s gross expense ratio for Class A shares is 1.39%,Class C shares is 2.14%, Class I shares is 1.14% and Class R shares is 1.64%. The Fund’s investmentadvisor has contractually agreed to reimburse Fund expenses through March 1, 2019, to the extentnecessary so that Total Annual Fund Operating Expenses (excluding taxes, interest, short interest,short dividend expenses, brokerage commissions, acquired fund fees and expenses, and extraordinaryexpenses, if any) of Class A, Class C, Class I and Class R shares are 1.38%, 2.13%, 1.13%, 1.63%.The expense ratios shown above may differ from the more recent expense ratios reported in theFinancial Highlights section of this report.† Average annual total return measures net investment income and capital gain or loss from portfolio investments as an
annualized average assuming reinvestment of dividends and capital gains distributions. Performance shown reflects theeffects of an expense reimbursement that improved results and was in effect until March 31, 2005. Load-adjustedreturns are adjusted for the maximum front-end sales load of 4.75% for Class A shares and returns for Class C shareshave been adjusted for the contingent deferred sales charge (CDSC).
NOTES:The graphs do not reflect the income taxes that you would pay on fund distributions or the redemption of fund shares.Fund performance includes reinvestment of dividends and adjustment for the maximum sales charge for Class A shares.The performance of other classes will vary from the performance of the class shown based on the difference in salescharges and fees paid by shareholders investing in different share classes.
The MSCI EAFE Growth Index measures developed market growth equity performance (excluding the U.S. and Canada).Source: MSCI Barra.
The MSCI ACWI ex U.S. Growth Index measures equity market performance of companies outside of the United Stateswith higher growth values in developed and emerging markets.
Index returns assume reinvestment of dividends and do not reflect deduction of fees and expenses. It is not possible toinvest directly in an index.
18 CALAMOS OPEN-END FAMILY OF FUNDS ANNUAL REPORT

Calamos Evolving World Growth Fund
CALAMOS EVOLVING WORLD GROWTH FUNDINVESTMENT TEAM DISCUSSION
How has the Fund performed?In the 12-month period, the Fund returned 22.46% (Class A shares at net asset value)versus the 26.91% return of the MSCI Emerging Markets index. Reflecting our risk-aware investment approach, the Fund experienced less volatility overall than the indexbut trailed because of select risk-managed investments in convertible securities andcertain holdings in global multinationals with ties to emerging markets.
What factors influenced performance?With respect to specific effects on performance during the period, we would highlightthe following areas:
Consumer Discretionary. The Fund’s overweight position and security selection in theconsumer discretionary sector negatively affected results over the one-year period.Specifically, holdings in the automobile industry trailed those of the index. However, wedo have a positive view of opportunities in the sector specific to emerging markets andwe own companies in diverse industries including internet retail, automotive, cable &satellite, and casinos & gaming.
Energy. The Fund’s security selection in energy also detracted value. Holdings in theoil & gas exploration and production industry underperformed due to challengingfundamentals and excess global supply. We have a selective stance in energy based onsome stabilization in global supply and demand, along with tolerable market prices.
Telecom Services. The Fund’s security selection in telecom services added significantvalue to performance in the period. Specifically, our holdings in the wireless telecomservices industry outperformed those of the index due to their stronger growthfundamentals and significant addressable markets.
Technology. The Fund’s selection in technology also added value to performance duringthe period. Holdings in the data processing & outsourced services and semiconductorsindustries delivered strong gains. We hold our largest sector weight in technology thatcomprises many disruptive business leaders with excellent earnings growth potential.From a thematic perspective, we believe our holdings are well aligned to benefit frominnovation in mobility, e-commerce, among other trends in emerging economies.
Geographic. From a geographic perspective, the Fund’s select investments in globalmulti-national businesses with significant ties to emerging markets held backperformance as their returns trailed the stronger upside in local emerging marketequities. From an emerging markets regional perspective, the Fund added value. Ournames in Asia especially outperformed due to higher-quality fundamentals andsustainable growth characteristics.
How is the Fund positioned?The Fund’s current positioning favors economies benefiting from domestic demandtrends, pro-growth fiscal reforms, and a blend of secular demand and cyclicalopportunities. We favor investments in China, India, South Korea and select oppor-tunities in Brazil, Mexico, South Africa, Russia and the Philippines.
OVERVIEWThe fund globally invests in growthcompanies, emphasizing businesses withrevenue streams derived within or fromemerging markets. The fund is designed toactively manage risk over a full marketcycle.
KEY FEATURES▪ Active risk management aims to
generate alpha with less downside riskthan the benchmark and peers
▪ Stresses strong or accelerated earningsgrowth and solid returns on investedcapital
▪ Targets well-positioned global growthcompanies that may benefit from long-term secular themes in emergingmarkets such as the rise of theemerging-market consumer
PORTFOLIO FITGiven its focus on risk management, thefund can serve as a long-term emergingmarket allocation.
FUND NASDAQ SYMBOLS
A Shares CNWGXC Shares CNWDX
I Shares CNWIXR Shares CNWRX
FUND CUSIP NUMBERS
A Shares 128119161C Shares 128119146
I Shares 128119138R Shares 128119120
www.calamos.com 19
Calamos Evolving World Growth Fund
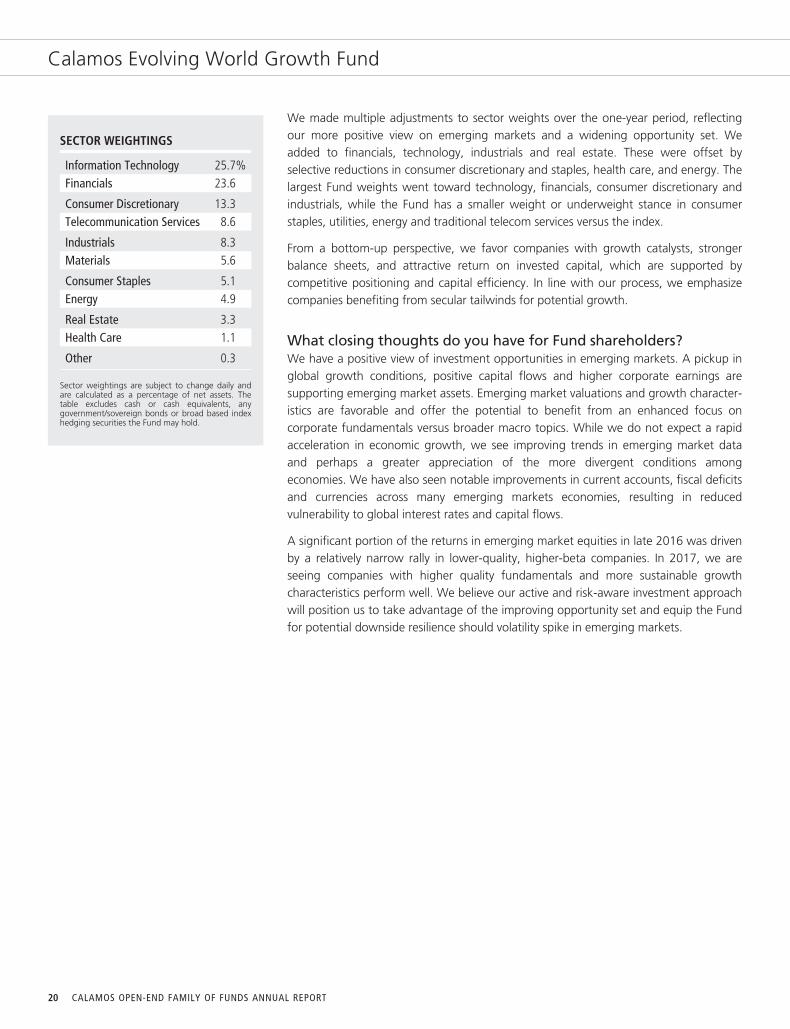
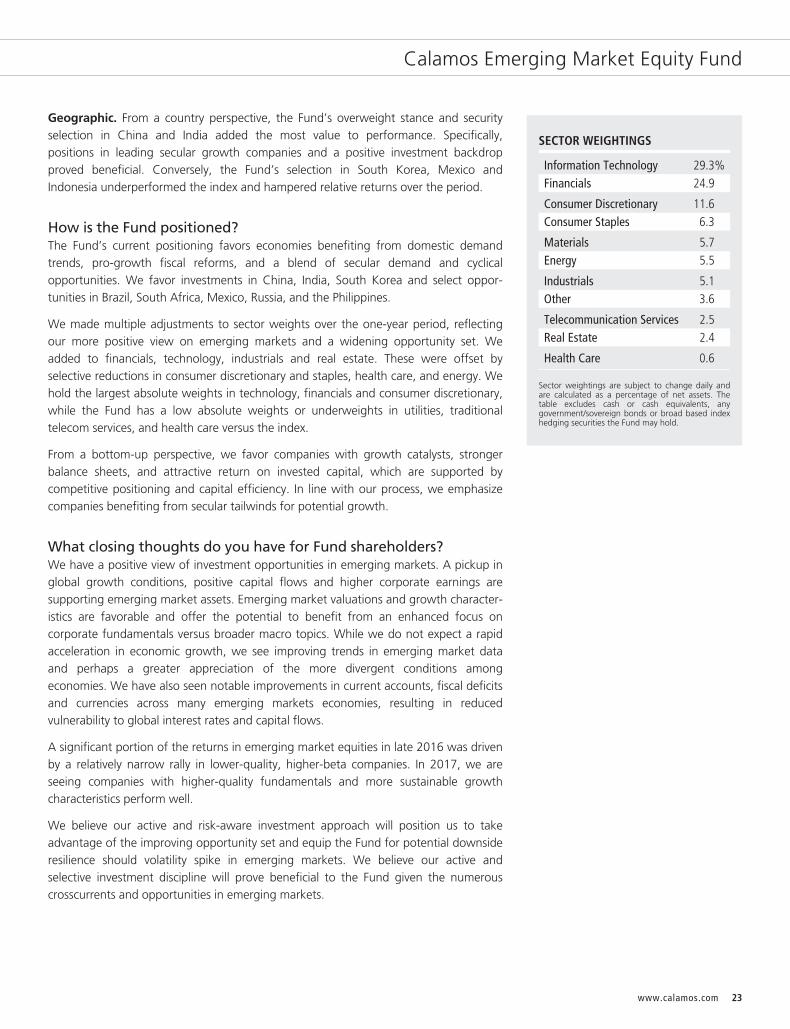
SECTOR WEIGHTINGS
Information Technology 25.7%Financials 23.6
Consumer Discretionary 13.3Telecommunication Services 8.6
Industrials 8.3Materials 5.6
Consumer Staples 5.1Energy 4.9
Real Estate 3.3Health Care 1.1
Other 0.3
Sector weightings are subject to change daily andare calculated as a percentage of net assets. Thetable excludes cash or cash equivalents, anygovernment/sovereign bonds or broad based indexhedging securities the Fund may hold.
We made multiple adjustments to sector weights over the one-year period, reflectingour more positive view on emerging markets and a widening opportunity set. Weadded to financials, technology, industrials and real estate. These were offset byselective reductions in consumer discretionary and staples, health care, and energy. Thelargest Fund weights went toward technology, financials, consumer discretionary andindustrials, while the Fund has a smaller weight or underweight stance in consumerstaples, utilities, energy and traditional telecom services versus the index.
From a bottom-up perspective, we favor companies with growth catalysts, strongerbalance sheets, and attractive return on invested capital, which are supported bycompetitive positioning and capital efficiency. In line with our process, we emphasizecompanies benefiting from secular tailwinds for potential growth.
What closing thoughts do you have for Fund shareholders?We have a positive view of investment opportunities in emerging markets. A pickup inglobal growth conditions, positive capital flows and higher corporate earnings aresupporting emerging market assets. Emerging market valuations and growth character-istics are favorable and offer the potential to benefit from an enhanced focus oncorporate fundamentals versus broader macro topics. While we do not expect a rapidacceleration in economic growth, we see improving trends in emerging market dataand perhaps a greater appreciation of the more divergent conditions amongeconomies. We have also seen notable improvements in current accounts, fiscal deficitsand currencies across many emerging markets economies, resulting in reducedvulnerability to global interest rates and capital flows.
A significant portion of the returns in emerging market equities in late 2016 was drivenby a relatively narrow rally in lower-quality, higher-beta companies. In 2017, we areseeing companies with higher quality fundamentals and more sustainable growthcharacteristics perform well. We believe our active and risk-aware investment approachwill position us to take advantage of the improving opportunity set and equip the Fundfor potential downside resilience should volatility spike in emerging markets.
20 CALAMOS OPEN-END FAMILY OF FUNDS ANNUAL REPORT
Calamos Evolving World Growth Fund
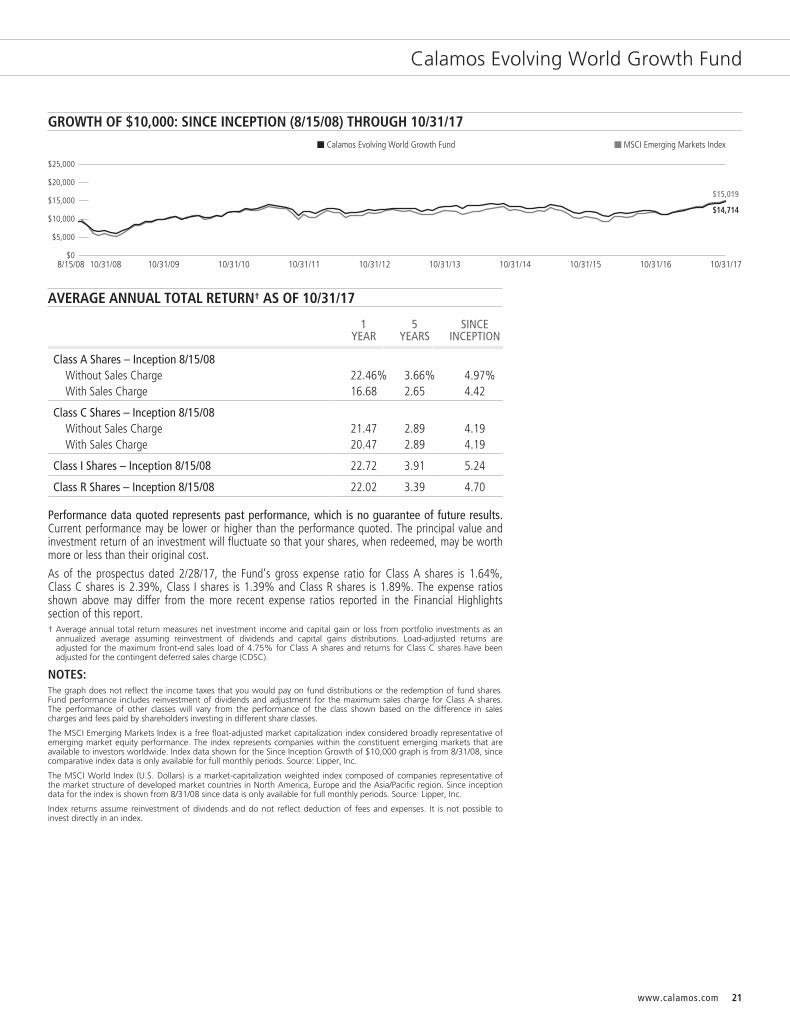
GROWTH OF $10,000: SINCE INCEPTION (8/15/08) THROUGH 10/31/17
$0
$5,000
$10,000
$25,000
$15,000
$20,000
$14,714
$15,019
Calamos Evolving World Growth Fund MSCI Emerging Markets Index
8/15/08 10/31/08 10/31/09 10/31/10 10/31/11 10/31/12 10/31/1710/31/1610/31/1510/31/13 10/31/14
AVERAGE ANNUAL TOTAL RETURN† AS OF 10/31/17
1YEAR
5YEARS
SINCEINCEPTION
Class A Shares – Inception 8/15/08Without Sales Charge 22.46% 3.66% 4.97%With Sales Charge 16.68 2.65 4.42
Class C Shares – Inception 8/15/08Without Sales Charge 21.47 2.89 4.19With Sales Charge 20.47 2.89 4.19
Class I Shares – Inception 8/15/08 22.72 3.91 5.24
Class R Shares – Inception 8/15/08 22.02 3.39 4.70
Performance data quoted represents past performance, which is no guarantee of future results.Current performance may be lower or higher than the performance quoted. The principal value andinvestment return of an investment will fluctuate so that your shares, when redeemed, may be worthmore or less than their original cost.
As of the prospectus dated 2/28/17, the Fund’s gross expense ratio for Class A shares is 1.64%,Class C shares is 2.39%, Class I shares is 1.39% and Class R shares is 1.89%. The expense ratiosshown above may differ from the more recent expense ratios reported in the Financial Highlightssection of this report.† Average annual total return measures net investment income and capital gain or loss from portfolio investments as an
annualized average assuming reinvestment of dividends and capital gains distributions. Load-adjusted returns areadjusted for the maximum front-end sales load of 4.75% for Class A shares and returns for Class C shares have beenadjusted for the contingent deferred sales charge (CDSC).
NOTES:The graph does not reflect the income taxes that you would pay on fund distributions or the redemption of fund shares.Fund performance includes reinvestment of dividends and adjustment for the maximum sales charge for Class A shares.The performance of other classes will vary from the performance of the class shown based on the difference in salescharges and fees paid by shareholders investing in different share classes.
The MSCI Emerging Markets Index is a free float-adjusted market capitalization index considered broadly representative ofemerging market equity performance. The index represents companies within the constituent emerging markets that areavailable to investors worldwide. Index data shown for the Since Inception Growth of $10,000 graph is from 8/31/08, sincecomparative index data is only available for full monthly periods. Source: Lipper, Inc.
The MSCI World Index (U.S. Dollars) is a market-capitalization weighted index composed of companies representative ofthe market structure of developed market countries in North America, Europe and the Asia/Pacific region. Since inceptiondata for the index is shown from 8/31/08 since data is only available for full monthly periods. Source: Lipper, Inc.
Index returns assume reinvestment of dividends and do not reflect deduction of fees and expenses. It is not possible toinvest directly in an index.
www.calamos.com 21
Calamos Emerging Market Equity Fund
OVERVIEWThe fund globally invests in growthcompanies, whose principal activities arein a developing market or are econom-ically tied to a developing market countrythat we believe offers the best oppor-tunities for growth.
KEY FEATURES▪ Stresses company fundamentals,
including global presence, strongrevenue and earnings growth, solidreturns on invested capital, and lowerdebt-to-capital levels
▪ Actively seeks growth opportunities byinvesting in equities with at least 80%emerging-market exposure
▪ Draws upon decades of Calamosexperience investing globally throughmultiple economic, market and creditcycles
PORTFOLIO FITThis actively managed fund complementsemerging-market strategies with a less-pronounced growth orientation, such asthose that more closely track the broadEM equity market.
FUND NASDAQ SYMBOLS
A Shares CEGAXC Shares CEGCX
I Shares CIEIX
FUND CUSIP NUMBERS
A Shares 128120789C Shares 128120771
I Shares 128120763
CALAMOS EMERGING MARKETEQUITY FUNDINVESTMENT TEAM DISCUSSION
How has the Fund performed?For the 12-month period ended October 31, 2017, Calamos Emerging Market EquityFund gained 22.88% (Class A shares at net asset value) versus the robust 26.91%return for the MSCI Emerging Markets Index. The annual period comprised tworelatively distinct phases reflecting rotational markets and significant changes insentiment and fundamentals. Following an extended period of heightened riskappetite, EMs experienced a widespread sell-off after the last year’s U.S. electionbrought on by concerns over rising protectionist sentiment, higher interest rates, andthe path of the U.S. dollar. The Fund struggled during this initial phase due to ouroverweight positions in India and Mexico as well as secular-growth holdings in China,which lagged cyclical, value-oriented companies in the index. Our higher-growth,higher-quality fundamental profile and overweight positioning in India and seculargrowth within China added value year-to-date in 2017 (the second phase), asemerging market performance leadership broadened beyond 2016’s narrow lower-quality, value-led rally.
What factors influenced performance?With respect to specific effects on performance during the period, we would highlightthe following areas:
Consumer Discretionary. The Fund’s overweight position and security selection in theconsumer discretionary sector negatively affected performance over the one-yearperiod. Specifically, holdings in the restaurant and education services industries trailedthose of the index. However, we do have a positive though selective view of oppor-tunities in the sector specific to emerging markets and we own companies in diverseindustries including internet retail, automotive, cable & satellite and casinos & gaming.
Real estate. The Fund’s security selection in the real estate sector also detracted value.Specifically, holdings in the real estate development industry underperformed the rallyin the relatively higher-beta index positions. We have seen increased opportunities inthe sector based on business catalysts and valuations.
Technology. The Fund’s selection in technology added the most value to Fundperformance during the period. Positions in the internet software & service andelectronic components industries generated strong gains for the Fund. We hold ourlargest absolute weight in technology that comprises many disruptive companies withexcellent earnings growth potential. From a thematic perspective, we believe ourholdings are well aligned to benefit from innovation in mobility, e-commerce, amongother trends in emerging economies.
Industrials. The Fund’s holdings in the industrials sector also had a positive impact onperformance. Names in aerospace & defense and industrial machinery outperformedthanks to strong market demand and excellent growth fundamentals. We seeincreased opportunities in the sector, reflecting a pickup in global demand and morecyclical growth opportunities in emerging markets. We own positions in machinery,construction & engineering and aerospace.
22 CALAMOS OPEN-END FAMILY OF FUNDS ANNUAL REPORT
Calamos Emerging Market Equity Fund
Geographic. From a country perspective, the Fund’s overweight stance and securityselection in China and India added the most value to performance. Specifically,positions in leading secular growth companies and a positive investment backdropproved beneficial. Conversely, the Fund’s selection in South Korea, Mexico andIndonesia underperformed the index and hampered relative returns over the period.
How is the Fund positioned?The Fund’s current positioning favors economies benefiting from domestic demandtrends, pro-growth fiscal reforms, and a blend of secular demand and cyclicalopportunities. We favor investments in China, India, South Korea and select oppor-tunities in Brazil, South Africa, Mexico, Russia, and the Philippines.
We made multiple adjustments to sector weights over the one-year period, reflectingour more positive view on emerging markets and a widening opportunity set. Weadded to financials, technology, industrials and real estate. These were offset byselective reductions in consumer discretionary and staples, health care, and energy. Wehold the largest absolute weights in technology, financials and consumer discretionary,while the Fund has a low absolute weights or underweights in utilities, traditionaltelecom services, and health care versus the index.
From a bottom-up perspective, we favor companies with growth catalysts, strongerbalance sheets, and attractive return on invested capital, which are supported bycompetitive positioning and capital efficiency. In line with our process, we emphasizecompanies benefiting from secular tailwinds for potential growth.
What closing thoughts do you have for Fund shareholders?We have a positive view of investment opportunities in emerging markets. A pickup inglobal growth conditions, positive capital flows and higher corporate earnings aresupporting emerging market assets. Emerging market valuations and growth character-istics are favorable and offer the potential to benefit from an enhanced focus oncorporate fundamentals versus broader macro topics. While we do not expect a rapidacceleration in economic growth, we see improving trends in emerging market dataand perhaps a greater appreciation of the more divergent conditions amongeconomies. We have also seen notable improvements in current accounts, fiscal deficitsand currencies across many emerging markets economies, resulting in reducedvulnerability to global interest rates and capital flows.
A significant portion of the returns in emerging market equities in late 2016 was drivenby a relatively narrow rally in lower-quality, higher-beta companies. In 2017, we areseeing companies with higher-quality fundamentals and more sustainable growthcharacteristics perform well.
We believe our active and risk-aware investment approach will position us to takeadvantage of the improving opportunity set and equip the Fund for potential downsideresilience should volatility spike in emerging markets. We believe our active andselective investment discipline will prove beneficial to the Fund given the numerouscrosscurrents and opportunities in emerging markets.
SECTOR WEIGHTINGS
Information Technology 29.3%Financials 24.9
Consumer Discretionary 11.6Consumer Staples 6.3
Materials 5.7Energy 5.5
Industrials 5.1Other 3.6
Telecommunication Services 2.5Real Estate 2.4
Health Care 0.6
Sector weightings are subject to change daily andare calculated as a percentage of net assets. Thetable excludes cash or cash equivalents, anygovernment/sovereign bonds or broad based indexhedging securities the Fund may hold.
www.calamos.com 23

Calamos Emerging Market Equity Fund
GROWTH OF $10,000: SINCE INCEPTION (12/31/13) THROUGH 10/31/17
$0
$5,000
$10,000
$15,000$12,412
$10,010
MSCI Emerging Markets IndexCalamos Emerging Market Equity Fund
12/31/13 1/31/14 4/30/14 7/31/14 10/31/14 4/30/15 7/31/15 10/31/151/31/15 1/31/16 10/31/177/31/174/30/174/30/16 10/31/16 1/31/177/31/16
AVERAGE ANNUAL TOTAL RETURN† AS OF 10/31/17
1YEAR
SINCEINCEPTION
Class A Shares – Inception 12/31/2013Without Sales Charge 22.88% 1.65%With Sales Charge 17.04 0.36
Class C Shares – Inception 12/31/2013Without Sales Charge 22.03 0.93With Sales Charge 21.03 0.93
Class I Shares – Inception 12/31/2013 23.32 1.91
Performance data quoted represents past performance, which is no guarantee of future results.Current performance may be lower or higher than the performance quoted. The principal value andinvestment return of an investment will fluctuate so that your shares, when redeemed, may be worthmore or less than their original cost.
As of the prospectus dated 2/28/17, the Fund’s gross expense ratio for Class A shares is 2.50%,Class C shares is 3.25% and Class I shares is 2.25%. The Fund’s Investment Adviser has contractuallyagreed to reimburse the Fund expenses through March 1, 2019, to the extent necessary so that TotalAnnual Fund Operating Expenses (excluding taxes, interest, short interest, short dividend expenses,brokerage commissions, acquired funds fees and expenses and extraordinary expenses, if any) ofClass A, Class C and Class I shares are limited to 1.68%, 2.44%, 1.43% of average net assets,respectively. This agreement is not terminable by either party. The expense ratios shown above maydiffer from the more recent expense ratios reported in the Financial Highlights section of this report.† Average annual total return measures net investment income and capital gain or loss from portfolio investments as an
annualized average assuming reinvestment of dividends and capital gains distributions. Load-adjusted returns areadjusted for the maximum front-end sales load of 4.75% for Class A shares. Returns for Class C shares have beenadjusted for the contingent deferred sales charge (CDSC).
NOTES:The graph does not reflect the income taxes that you would pay on fund distributions or the redemption of fund shares.Fund performance includes reinvestment of dividends and adjustment for the maximum sales charge for Class A shares.The performance of other classes will vary from the performance of the class shown based on the difference in salescharges and fees paid by shareholders investing in different share classes.
The MSCI Emerging Markets Index is a free float-adjusted market capitalization index considered broadly representative ofemerging market equity performance. The index represents companies within the constituent emerging markets that areavailable to investors worldwide. Index data shown for the Since Inception Growth of $10,000 graph is from 12/31/13,since comparative index data is only available for full monthly periods. Source: Lipper, Inc.
Index returns assume reinvestment of dividends and do not reflect deduction of fees and expenses. It is not possible toinvest directly in an index.
24 CALAMOS OPEN-END FAMILY OF FUNDS ANNUAL REPORT
Calamos Global Equity Fund
CALAMOS GLOBAL EQUITY FUNDINVESTMENT TEAM DISCUSSION
How has the Fund performed?For the 12-month period ended October 31, 2017, the Fund returned 28.42% (Class Ashares at net asset value), versus a 23.46% gain for the MSCI World Index and 26.58%increase for the MSCI ACWI Growth Index. Global equities generated broad-basedgains during the period, with positive returns across regions and sectors. Higher shareprices reflected generally better economic data, higher corporate earnings and morebullish investor sentiment across both developed and emerging markets.
The Fund outperformed over the annual period, due in part to a combination of secularand cyclical growth allocations in the Fund as well as a rally in global equities thatrewarded companies with leading fundamentals. Specifically, strong security selectionimbued with higher earnings growth and return-on-invested-capital fundamentalscontributed to Fund gains over the period.
Since its inception on March 2, 2007 through October 31, 2017, the Fund returned7.94% on an annualized basis (Class A shares at net asset value), versus a 5.81%return for the MSCI World Index and a 6.84% return for the MSCI ACWI GrowthIndex. We believe the Fund’s return profile since inception is a testament to our focuson long-term, active global investing that adds value over complete market cycles.
What factors influenced performance?With respect to specific effects on performance during the period, we would highlightthe following areas:
Information Technology. From a sector perspective, the Fund’s overweight positionand leading security selection in technology added considerably to positiveperformance in the year. Our technology holdings exhibit earnings and cash-flowgrowth, leverage positive catalysts, and participate in key secular themes. The largerweight and selection in Internet software & services and data processing & outsourcedservices notably contributed.
Consumer Staples. The Fund’s underweight stance and relative security selection inconsumer staples also contributed substantially to fund performance in the period.Fund holdings in the packaged foods and personal products industries performed welldue to strong company fundamentals. Within the sector, we own an array ofbusinesses with leading growth potential and attractive cash-flow characteristics inmultiple consumer categories.
Materials. The Fund’s slight overweight position and lagging security selection in thematerials sector detracted the most value from performance. Specifically, holdings inthe construction materials industry underperformed due to security-specific factors. Wecontinue to see select opportunities in materials against a backdrop of improving globaldemand spurred on by increased building and infrastructure projects as multiplegovernments pivot policy toward fiscal initiatives.
Health Care. The Fund’s security selection in health care also negatively affectedperformance. In particular, Fund holdings in the biotechnology industry underperformed.We seek opportunities in health care that provide strong innovation pipelines, superiorreturn on invested capital, and alignment with our secular themes in the sector.
OVERVIEWThe fund invests in equities of companiesaround the globe. We focus on those firmsthat we believe demonstrate key growthcharacteristics, including increasing profitmargins and high returns on investedcapital.
KEY FEATURES▪ Flexibly seeks growth globally, searching
for the best risk/reward opportunitiesacross countries, market capitalizationsand sectors
▪ Seeks global growth companies thatmay benefit from long-term secularthemes, including a burgeoning globalmiddle class and increasing demand forinformation and entertainment
PORTFOLIO FITThe fund can serve as a growth-orientedaddition to a strategic global equityallocation and may complement or providean alternative to value or blended styles.
FUND NASDAQ SYMBOLS
A Shares CAGEXC Shares CCGEX
I Shares CIGEXR Shares CRGEX
FUND CUSIP NUMBERS
A Shares 128119484C Shares 128119468
I Shares 128119450R Shares 128119443
www.calamos.com 25

Calamos Global Equity Fund
SECTOR WEIGHTINGS
Information Technology 34.0%Industrials 14.1
Financials 13.7Consumer Discretionary 10.7
Consumer Staples 8.6Health Care 8.4
Materials 4.4Energy 3.2
Real Estate 0.8Telecommunication Services 0.5
Sector weightings are subject to change daily andare calculated as a percentage of net assets. Thetable excludes cash or cash equivalents, anygovernment/sovereign bonds or broad based indexhedging securities the Fund may hold.
Geographic. From a geographic perspective, Fund holdings in both developed andemerging markets outperformed the benchmark. Specifically, Fund positions inEmerging Asia, the U.S. and Europe outperformed those of the index. Positioning inthese regions benefited from strong corporate fundamentals and global demandtrends, while the Fund’s individual, small positions in Canada and Latin Americaunderperformed and held back return.
How is the Fund positioned?We own a combination of secular growth and cyclical opportunities in technology,industrials, consumer discretionary, financials, health care, energy and materials. Weare selectively underweight the more defensive market areas including telecom,utilities, consumer staples and real estate based on our view of fundamentals, relativevaluations and the market environment.
From a regional perspective, we hold a modest overweight stance in Europe reflectingour view of the region’s improving economic data, reasonable valuations, upside inmargins and accommodative policies. We have a significant, though relatively neutralweight in Japan. Improving economic growth and exports, positive earnings revisionsand opportunities for efficiencies and capital allocation have influenced our positioning.
We have an underweight stance in the U.S. given our concern of relatively expensivevaluations and less accommodative monetary policies, though we are also consideringpositive fundamentals. We own a blend of holdings in core secular growth areas aswell as more cyclical businesses and investment opportunities reflecting our view of apickup in the economy and inflation expectations.
We have a positive view and overweight in emerging market positions. On a regionalbasis, the Fund owns the largest weight in Emerging Asia in addition to select positionsin Emerging Europe and Latin America. Our outlook for earnings growth is strong, andemerging markets are poised to benefit from the pickup in global demand and relativestabilization in many currencies and commodities.
The Fund’s largest allocations in absolute terms went toward the information technology,industrials and financials sectors. We added weight in financials and industrials over theannual period, reflecting our view of a pickup in cyclical conditions and better funda-mentals. We offset these additions by reducing positions in consumer discretionary andhealth care. The Fund’s smallest allocations include utilities, telecom services and realestate, while we are also underweight in health care and consumer staples.
What are your closing thoughts for Fund shareholders?The balance of corporate and macroeconomic data points to continued synchronizedglobal growth across regions. Global monetary policy remains accommodative overall,though multiple central banks are edging toward tightening, and we are seeing a pivottoward fiscal stimulus. We see continued opportunities in global equities, reflective ofpositive fundamentals and relatively attractive valuations. In terms of broad positioning,we favor a blend of investments in secular and cyclical growth companies, but arerelatively underweight in defensives overall. We see significant opportunities incompanies with earnings growth catalysts, solid cash-flow generation andimproving-to-strong balance sheets. From a thematic and sector perspective, we seeopportunities in the information technology sector, consumer companies with targetedareas of demand, and cyclical companies in the financials and industrials sectors withimproving fundamentals and catalysts. Our active investment approach and long-termperspective positions us to take advantage of the opportunities in global equities.
26 CALAMOS OPEN-END FAMILY OF FUNDS ANNUAL REPORT

Calamos Global Equity Fund
GROWTH OF $10,000: FOR THE 10-YEAR PERIOD ENDED 10/31/17
$0
$5,000
$10,000
$20,000
$15,000
Calamos Global Equity Fund MSCI ACWI Growth IndexMSCI World Index
10/31/07
$16,576
$15,818$16,009
10/31/1710/31/08 10/31/09 10/31/10 10/31/11 10/31/12 10/31/13 10/31/14 10/31/15 10/31/16
AVERAGE ANNUAL TOTAL RETURN† AS OF 10/31/17
1YEAR
5YEARS
10YEARS
Class A Shares – Inception 3/1/07Without Sales Charge 28.42% 10.52% 5.33%With Sales Charge 22.27 9.44 4.82
Class C Shares – Inception 3/1/07Without Sales Charge 27.53 9.70 4.55With Sales Charge 26.53 9.70 4.55
Class I Shares – Inception 3/1/07 28.82 10.79 5.60
Class R Shares – Inception 3/1/07 28.19 10.24 5.07
Performance data quoted represents past performance, which is no guarantee of future results.Current performance may be lower or higher than the performance quoted. The principal value andinvestment return of an investment will fluctuate so that your shares, when redeemed, may be worthmore or less than their original cost.
As of the prospectus dated 2/28/17, the Fund’s gross expense ratio for Class A shares is 1.50%,Class C shares is 2.25, Class I shares is 1.25% and Class R shares is 1.75%. The Fund’s investmentadvisor has contractually agreed to reimburse Fund expenses through March 1, 2019, to the extentnecessary so that Total Annual Fund Operating Expenses (excluding taxes, interest, short interest,short dividend expenses, brokerage commissions, acquired fund fees and expenses, and extraordinaryexpenses, if any) of Class A, Class C, Class I and Class R shares are 1.38%, 2.13%, 1.13%, 1.63%.The expense ratios shown above may differ from the more recent expense ratios reported in theFinancial Highlights section of this report.
† Average annual total return measures net investment income and capital gain or loss from portfolio investments as anannualized average assuming reinvestment of dividends and capital gains distributions. Load-adjusted returns areadjusted for the maximum front-end sales load of 4.75% for Class A shares and returns for Class C shares have beenadjusted for the contingent deferred sales charge (CDSC).
NOTES:The graph does not reflect the income taxes that you would pay on fund distributions or the redemption of fund shares.Fund performance includes reinvestment of dividends and adjustment for the maximum sales charge for Class A shares.The performance of other classes will vary from the performance of the class shown based on the difference in salescharges and fees paid by shareholders investing in different share classes.
The MSCI World Index (U.S. Dollars) is a market-capitalization weighted index composed of companies representative ofthe market structure of developed market countries in North America, Europe and the Asia/Pacific region. Since inceptiondata for the index is shown from 2/28/07 since data is only available for full monthly periods. Source: Lipper, Inc.
The MSCI ACWI Growth Index is designed to measure the equity performance of companies with higher growth values indeveloped and emerging markets.
Index returns assume reinvestment of dividends and do not reflect deduction of fees and expenses. It is not possible toinvest directly in an index.
The Fund’s use of derivative instruments involves investment risks and transaction costs to which the Fund would not besubject absent the use of these instruments and, accordingly, may result in losses greater than if they had not been used.Derivative instruments can be illiquid, may disproportionately increase losses and may have a potentially large impact onFund performance.
www.calamos.com 27
Calamos Growth and Income Fund
OVERVIEWThe fund invests primarily in U.S. equityand convertible securities in an attempt tobalance risk/reward while providinggrowth and income.
KEY FEATURES▪ Leverages more than three decades of
research experience combining equitiesand convertible holdings to provideequity-like participation
▪ Provides a core holding option that aimsto maintain a consistent risk posturethroughout the market cycle
▪ Research-driven approach identifiesopportunities by combining top-downanalysis with a focus on key growthcharacteristics
PORTFOLIO FITThe fund can provide a long-term coreequity allocation with the potential forlower volatility.
FUND NASDAQ SYMBOLS
A Shares CVTRXC Shares CVTCX
I Shares CGIIXR Shares CGNRX
FUND CUSIP NUMBERS
A Shares 128119104C Shares 128119831
I Shares 128119872R Shares 128119336
CALAMOS GROWTH AND INCOME FUNDINVESTMENT TEAM DISCUSSION
How has the Fund performed?For the 12-month period ended October 31, 2017, the Fund gained 17.39% (Class AShares at net asset value) versus a return of 23.63% for the S&P 500 Index and20.69% return for the ICE BofAML All U.S. Convertibles ex Mandatory Index.*
We manage this Fund with the goal of achieving upside equity participation andpotential downside protection over full market cycles. Since its inception onSeptember 22, 1988, the Fund has returned 11.02% on an annualized basis (Class Ashares at net asset value) versus a 10.46% gain for the S&P 500 Index and a 9.50%return for the ICE BofAML All U.S. Convertibles ex Mandatory Index.
Please discuss the Fund’s lower-volatility characteristics?We believe the Fund’s historical lower-volatility characteristics are a by-product of ourinvestment style and focus on participating in equity market upside with less volatilitythan the market as a whole. Beta is one popular statistic for measuring volatility. Betaconsiders a fund’s historic volatility versus the market, which is assigned a beta of 1.0.A fund with half the volatility of the market would have a beta of 0.5, while a fundwith a beta of 2.0 would have been twice as volatile as the market.
Since its inception, the Fund has had a beta of 0.73 (Class A shares) versus the S&P 500Index. The Fund has therefore outperformed the broader equity market, as measuredby the S&P 500 Index, over the life of the Fund with less volatility than the equitymarket. Please note that past performance does not indicate future results and thatbeta is one of many measures of risk.
What factors influenced performance?U.S. equity markets rallied strongly and steadily over the reporting period. While theperiod was marked by geopolitical volatility, market volatility had notably diminished.U.S. elections in November 2016 caught many by surprise, as Donald Trump waselected president. He had campaigned to reduce burdensome regulations, decreasetaxes for U.S. businesses, overhaul U.S. health care, bring offshore U.S. cash back onshore and raise infrastructure spending. Markets rallied strongly, and while many of thebusinesses that might benefit most from the new administration’s plans ralliedstrongest, eventually the equity market’s gains broadened out. For the full reportingperiod, seven of eleven sectors within the S&P 500 Index saw double-digit gains, andtelecom services was the only sector within the index to finish negative for the period.
Despite concerns about North Korea’s weapons tests, Russia’s attempts to influenceU.S. elections, continuous finger pointing in the U.S. political arena, Federal Reserveinterest rate hikes, the roll-off of quantitative easing, and the selection of a new FedChair, volatility was hard to come by in equity markets. Since the market low ofNovember 4, 2016, the U.S. equity market, as measured by the S&P 500 Index, did notexperience a correction of 3% through period end, October 31, 2017.
* With Intercontinental Exchange’s (ICE) acquisition of the BofA Merrill Lynch Global Research FICC indexplatform, the BofA Merrill Lynch All U.S. Convertibles ex Mandatory Index has been rebranded to ICEBofAML All U.S. Convertibles ex Mandatory Index.
28 CALAMOS OPEN-END FAMILY OF FUNDS ANNUAL REPORT

Calamos Growth and Income Fund
In our view, this is because markets are climbing on improved economic data. The U.S.was one of the first countries in the global economy to make significant efforts to easethe course of business and help reignite the animal spirits of growth. Subsequently,other regions and countries have followed course and a global recovery began to takeshape in the middle of 2016.
In this environment, the Fund performed well, while staying grounded in riskmanagement during a news-laden and angst-filled 12-month reporting period. Equityholdings within the portfolio performed broadly in line with the S&P 500 Index, whileconvertibles and other securities used to help manage risk, performed well yet laggedthe all-equity index.
During the first few days of November 2016 when markets dropped, the Fundperformed well and protected assets better than the equity benchmark, as it also didduring brief but shallow market sell-offs in March and May of 2017.
In terms of economic sectors, Fund positioning by sector was slightly negative, as anunderweight to financials and an overweight to consumer discretionary detractedvalue, whereas an underweight to consumer staples and real estate added relativevalue. Issue selection, as noted above, detracted from performance when compared tothe all-equity benchmark, as measured by the S&P 500 Index. Not owning several ofthe higher-performing information technology stocks and attempting to accesstechnology growth potential through securities other than common stocks detractedfrom relative performance. It should be noted that not all convertible or non-stockholdings underperformed, and they do offer a means to access the underlyingbusinesses at a different price point or structure. Similarly, holdings in consumerdiscretionary also lagged those of the all-equity benchmark.
Overall, the Fund’s performance was broadly in line with expectations given the riskstaken and the historical participation of the Fund relative to equity markets. The factthat the market largely climbed higher in a fairly stable manner for the reporting perioddoes not mean that there were no risks in the equity market. Just as the absence ofrain doesn’t mean there won’t be any future storms, the absence of risk doesn’t meanthat market risks have been eliminated. The Fund still provides an attractive means toaccess the equity market in a balanced manner.
Please describe the Fund’s participation in up and down marketssince its inception.The Fund invests in a combination of stocks, convertible securities and bonds to offer atotal-return-oriented investment that seeks to consistently balance risk and rewardthrough full market cycles. As we focus on managing volatility, we strive to participatein a greater portion of equity market upside than downside.
There are a variety of ways to express up- and down-market capture, whether it iscalculated daily, monthly, quarterly, or in longer-term up-and-down market trends. Inthe chart below, you can see how the Fund performed through distinct market periods.In the five major market periods shown, the Fund has generally participated in theupside movements of the equity market while limiting the downside exposure duringtimes of tumult.
SECTOR WEIGHTINGS
Information Technology 24.5%Consumer Discretionary 15.1
Financials 12.2Health Care 11.1
Industrials 9.4Consumer Staples 7.1
Energy 5.9Utilities 2.3
Real Estate 2.0Telecommunication Services 1.9
Other 1.8Materials 1.1
Sector weightings are subject to change daily andare calculated as a percentage of net assets. Thetable excludes cash or cash equivalents, anygovernment/sovereign bonds or broad based indexhedging securities the Fund may hold.
www.calamos.com 29
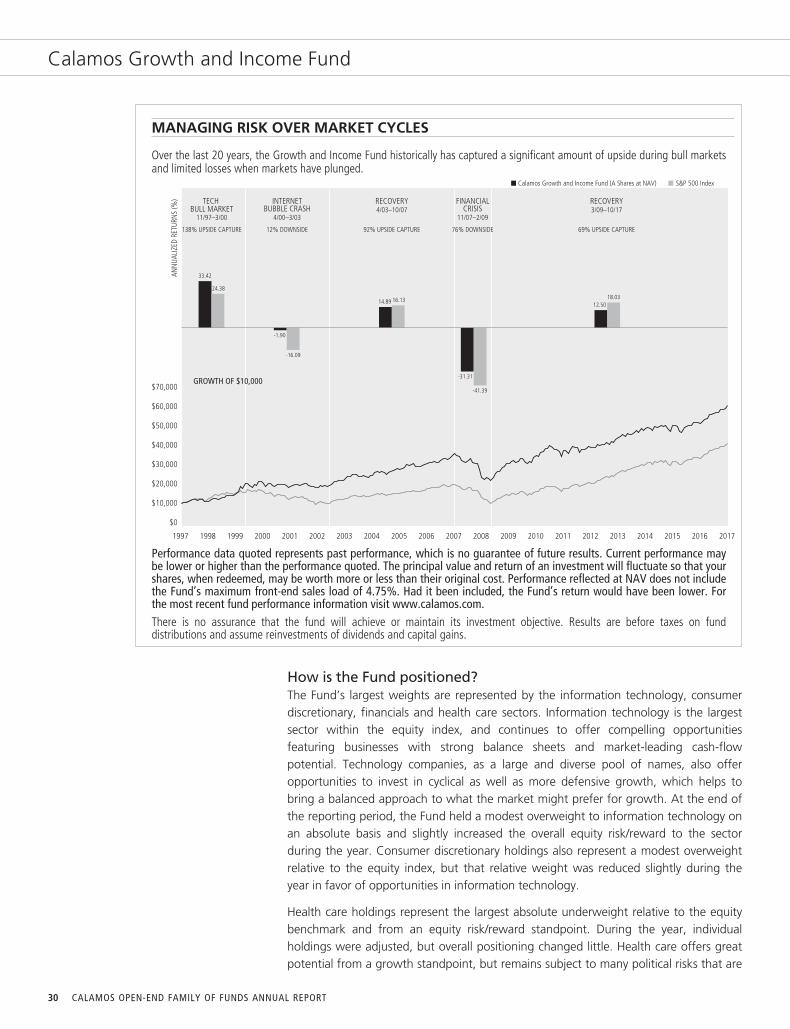
Calamos Growth and Income Fund
MANAGING RISK OVER MARKET CYCLES
Over the last 20 years, the Growth and Income Fund historically has captured a significant amount of upside during bull marketsand limited losses when markets have plunged.
$70,000
$60,000
$30,000
$20,000
$10,000
$50,000
$40,000
$0
20172016
Calamos Growth and Income Fund (A Shares at NAV) S&P 500 Index
1997 1998 1999 2000 2001 2002 2003 2004 2005 2006 2007 2008 2009 2010 2011 2012 201520142013
14.89 16.13
RECOVERY4/03–10/07
92% UPSIDE CAPTURE
-1.90
-16.09
INTERNETBUBBLE CRASH
4/00–3/03
12% DOWNSIDE
-31.31
-41.39
76% DOWNSIDE
FINANCIALCRISIS
11/07–2/09
12.5018.03
RECOVERY3/09–10/17
69% UPSIDE CAPTURE
ANN
UALI
ZED
RETU
RNS
(%)
GROWTH OF $10,000
TECH BULL MARKET
11/97–3/00
138% UPSIDE CAPTURE
33.42
24.38
Performance data quoted represents past performance, which is no guarantee of future results. Current performance maybe lower or higher than the performance quoted. The principal value and return of an investment will fluctuate so that yourshares, when redeemed, may be worth more or less than their original cost. Performance reflected at NAV does not includethe Fund’s maximum front-end sales load of 4.75%. Had it been included, the Fund’s return would have been lower. Forthe most recent fund performance information visit www.calamos.com.There is no assurance that the fund will achieve or maintain its investment objective. Results are before taxes on funddistributions and assume reinvestments of dividends and capital gains.
How is the Fund positioned?The Fund’s largest weights are represented by the information technology, consumerdiscretionary, financials and health care sectors. Information technology is the largestsector within the equity index, and continues to offer compelling opportunitiesfeaturing businesses with strong balance sheets and market-leading cash-flowpotential. Technology companies, as a large and diverse pool of names, also offeropportunities to invest in cyclical as well as more defensive growth, which helps tobring a balanced approach to what the market might prefer for growth. At the end ofthe reporting period, the Fund held a modest overweight to information technology onan absolute basis and slightly increased the overall equity risk/reward to the sectorduring the year. Consumer discretionary holdings also represent a modest overweightrelative to the equity index, but that relative weight was reduced slightly during theyear in favor of opportunities in information technology.
Health care holdings represent the largest absolute underweight relative to the equitybenchmark and from an equity risk/reward standpoint. During the year, individualholdings were adjusted, but overall positioning changed little. Health care offers greatpotential from a growth standpoint, but remains subject to many political risks that are
30 CALAMOS OPEN-END FAMILY OF FUNDS ANNUAL REPORT
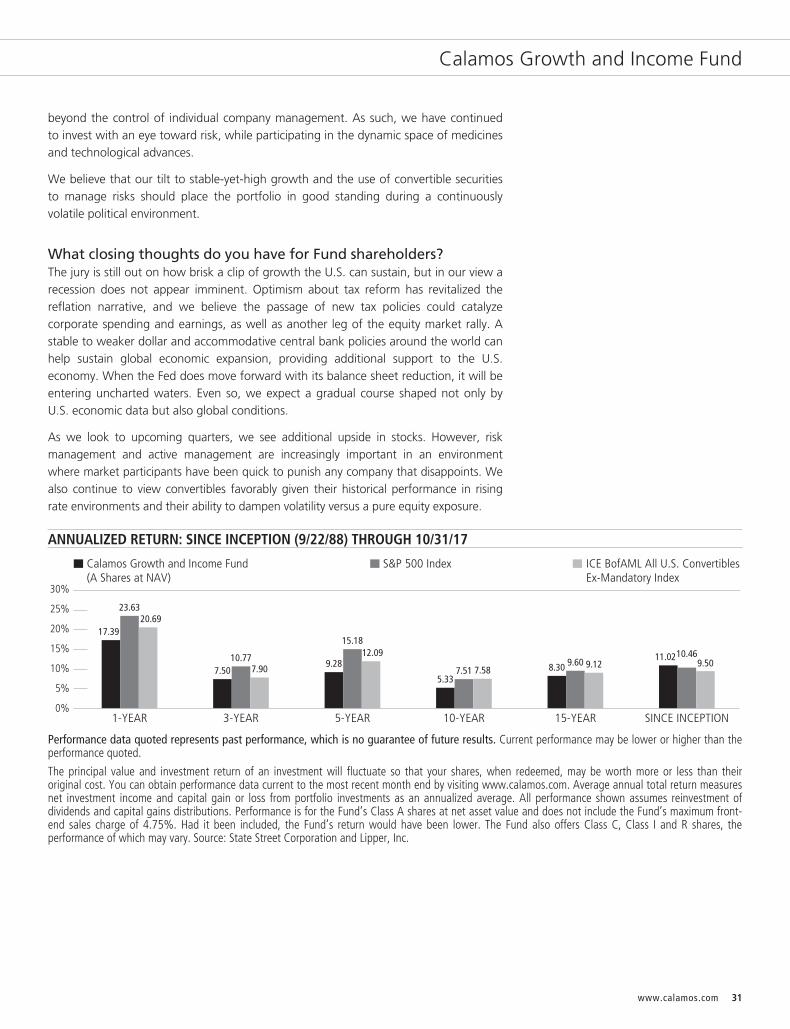
Calamos Growth and Income Fund
beyond the control of individual company management. As such, we have continuedto invest with an eye toward risk, while participating in the dynamic space of medicinesand technological advances.
We believe that our tilt to stable-yet-high growth and the use of convertible securitiesto manage risks should place the portfolio in good standing during a continuouslyvolatile political environment.
What closing thoughts do you have for Fund shareholders?The jury is still out on how brisk a clip of growth the U.S. can sustain, but in our view arecession does not appear imminent. Optimism about tax reform has revitalized thereflation narrative, and we believe the passage of new tax policies could catalyzecorporate spending and earnings, as well as another leg of the equity market rally. Astable to weaker dollar and accommodative central bank policies around the world canhelp sustain global economic expansion, providing additional support to the U.S.economy. When the Fed does move forward with its balance sheet reduction, it will beentering uncharted waters. Even so, we expect a gradual course shaped not only byU.S. economic data but also global conditions.
As we look to upcoming quarters, we see additional upside in stocks. However, riskmanagement and active management are increasingly important in an environmentwhere market participants have been quick to punish any company that disappoints. Wealso continue to view convertibles favorably given their historical performance in risingrate environments and their ability to dampen volatility versus a pure equity exposure.
ANNUALIZED RETURN: SINCE INCEPTION (9/22/88) THROUGH 10/31/17
0%
20%
30%
25%
10%
15%
5%
Calamos Growth and Income Fund(A Shares at NAV)
S&P 500 Index
1-YEAR 3-YEAR 5-YEAR 10-YEAR 15-YEAR SINCE INCEPTION
ICE BofAML All U.S. ConvertiblesEx-Mandatory Index
17.39
23.6320.69
7.5010.77
7.90 9.28
15.1812.09
5.337.51 7.58 8.30 9.60 9.12
11.0210.469.50
Performance data quoted represents past performance, which is no guarantee of future results. Current performance may be lower or higher than theperformance quoted.
The principal value and investment return of an investment will fluctuate so that your shares, when redeemed, may be worth more or less than theiroriginal cost. You can obtain performance data current to the most recent month end by visiting www.calamos.com. Average annual total return measuresnet investment income and capital gain or loss from portfolio investments as an annualized average. All performance shown assumes reinvestment ofdividends and capital gains distributions. Performance is for the Fund’s Class A shares at net asset value and does not include the Fund’s maximum front-end sales charge of 4.75%. Had it been included, the Fund’s return would have been lower. The Fund also offers Class C, Class I and R shares, theperformance of which may vary. Source: State Street Corporation and Lipper, Inc.
www.calamos.com 31
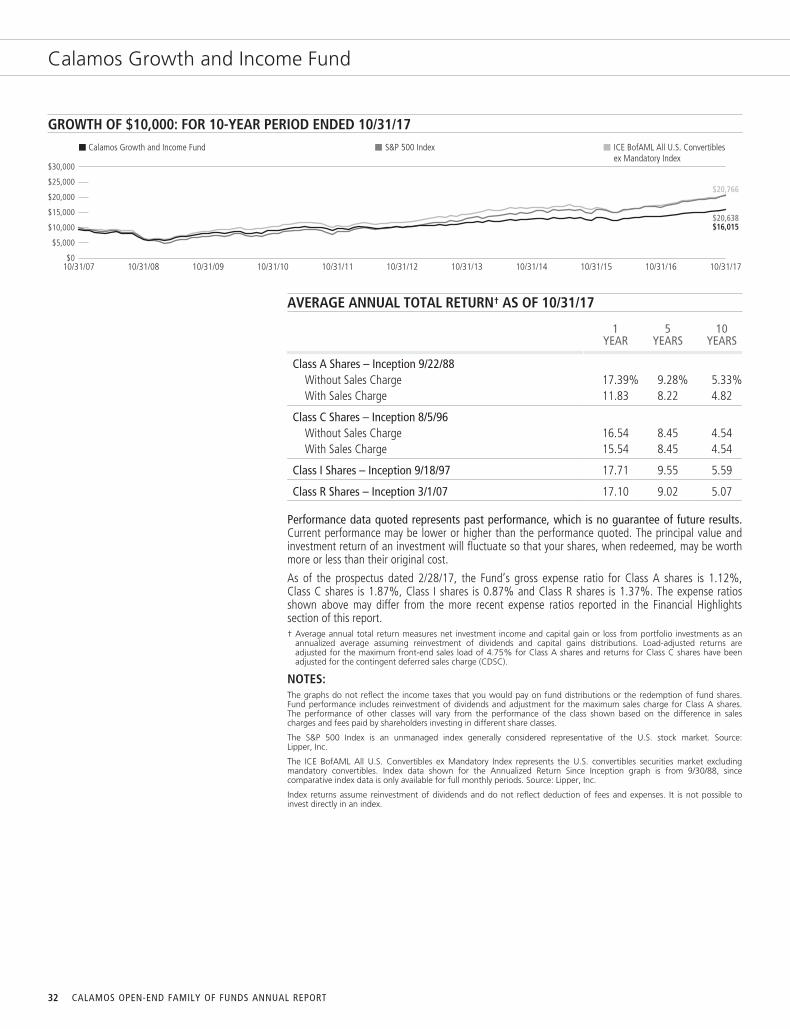
Calamos Growth and Income Fund
GROWTH OF $10,000: FOR 10-YEAR PERIOD ENDED 10/31/17
10/31/07
Calamos Growth and Income Fund ICE BofAML All U.S. Convertiblesex Mandatory Index
S&P 500 Index
$0
$5,000
$10,000
$15,000
$20,000
$25,000
$30,000
$20,638
$20,766
$16,015
10/31/1710/31/08 10/31/09 10/31/10 10/31/11 10/31/12 10/31/13 10/31/14 10/31/15 10/31/16
AVERAGE ANNUAL TOTAL RETURN† AS OF 10/31/17
1YEAR
5YEARS
10YEARS
Class A Shares – Inception 9/22/88Without Sales Charge 17.39% 9.28% 5.33%With Sales Charge 11.83 8.22 4.82
Class C Shares – Inception 8/5/96Without Sales Charge 16.54 8.45 4.54With Sales Charge 15.54 8.45 4.54
Class I Shares – Inception 9/18/97 17.71 9.55 5.59
Class R Shares – Inception 3/1/07 17.10 9.02 5.07
Performance data quoted represents past performance, which is no guarantee of future results.Current performance may be lower or higher than the performance quoted. The principal value andinvestment return of an investment will fluctuate so that your shares, when redeemed, may be worthmore or less than their original cost.
As of the prospectus dated 2/28/17, the Fund’s gross expense ratio for Class A shares is 1.12%,Class C shares is 1.87%, Class I shares is 0.87% and Class R shares is 1.37%. The expense ratiosshown above may differ from the more recent expense ratios reported in the Financial Highlightssection of this report.† Average annual total return measures net investment income and capital gain or loss from portfolio investments as an
annualized average assuming reinvestment of dividends and capital gains distributions. Load-adjusted returns areadjusted for the maximum front-end sales load of 4.75% for Class A shares and returns for Class C shares have beenadjusted for the contingent deferred sales charge (CDSC).
NOTES:The graphs do not reflect the income taxes that you would pay on fund distributions or the redemption of fund shares.Fund performance includes reinvestment of dividends and adjustment for the maximum sales charge for Class A shares.The performance of other classes will vary from the performance of the class shown based on the difference in salescharges and fees paid by shareholders investing in different share classes.
The S&P 500 Index is an unmanaged index generally considered representative of the U.S. stock market. Source:Lipper, Inc.
The ICE BofAML All U.S. Convertibles ex Mandatory Index represents the U.S. convertibles securities market excludingmandatory convertibles. Index data shown for the Annualized Return Since Inception graph is from 9/30/88, sincecomparative index data is only available for full monthly periods. Source: Lipper, Inc.
Index returns assume reinvestment of dividends and do not reflect deduction of fees and expenses. It is not possible toinvest directly in an index.
32 CALAMOS OPEN-END FAMILY OF FUNDS ANNUAL REPORT
Calamos Global Growth and Income Fund
CALAMOS GLOBAL GROWTH ANDINCOME FUNDINVESTMENT TEAM DISCUSSION
How has the Fund performed?For the 12-month period ended October 31, 2017, the Fund returned 17.16% (Class Ashares at net asset value), versus a 23.86% return for the MSCI ACWI Index and23.46% gain for the MSCI World Index. Global equities generated broad-based gainsduring the period, with positive returns across regions and sectors. Higher share pricesreflected generally better economic data, growth in corporate earnings and morebullish investor sentiment across both developed and emerging markets.
We position the Fund to capture a majority of equity market upside over full marketcycles, while also giving diligent attention to mitigating downside risk. We believe thatour focus on potential downside protection can provide compelling advantages in adynamic market environment, but this prudence hampered returns during this periodwhen equities experienced a broad and brisk advance.
In tandem with our risk-managed approach, the Fund’s absolute performancebenefited from a combination of secular and cyclical growth as well as a rally in globalequities that rewarded companies with leading fundamentals in earnings, capitalefficiency and large addressable markets.
What factors influenced performance?With respect to specific effects on performance during the period, we would highlightthe following areas:
Information Technology. From a sector perspective, the Fund’s overweight positionand security selection in technology added considerably to positive performance inthe year. Our technology holdings exhibit earnings and cash-flow growth, leveragepositive catalysts, and participate in key secular themes. The larger weight andselection in Internet software & services and data processing & outsourced servicesnotably contributed.
Consumer Staples. The Fund’s underweight stance and relative security selection inconsumer staples also contributed substantially to Fund performance in the period.Fund holdings in the packaged foods and personal products industries performed welldue to strong company fundamentals. Within the sector, we own an array ofbusinesses with leading growth potential and attractive cash-flow characteristics inmultiple consumer categories.
Consumer Discretionary. An overweight position and security selection in consumerdiscretionary hindered the Fund return over the period. Portfolio selection in theInternet retail and apparel & accessories industries trailed the stronger outcome in thebenchmark MSCI ACWI Index.
Materials. The Fund’s underweight position and lagging security selection in thematerials sector also detracted value during the period. Specifically, Fund holdings inthe construction materials industry were a disappointment due to security-specificfactors. We continue to see select opportunities in materials given a backdrop ofimproving global demand.
OVERVIEWThe fund invests primarily in global equityand convertible securities in an attempt tobalance risk/reward while providinggrowth and income.
KEY FEATURES▪ Combines equity and convertible
holdings in order to limit downside riskwhile potentially capturing upside equityparticipation
▪ Provides a core holding option thatseeks to maintain a consistent riskposture throughout the market cycle
▪ Seeks to participate in the upsidemovements of the global equity marketwhile lessening the impact of downperiods
PORTFOLIO FITThe fund can provide a long-term, global-equity core allocation with the potentialfor lower volatility over a full market cycle.
FUND NASDAQ SYMBOLS
A Shares CVLOXC Shares CVLCX
I Shares CGCIXR Shares CVLRX
FUND CUSIP NUMBERS
A Shares 128119500C Shares 128119708
I Shares 128119609R Shares 128119385
www.calamos.com 33

Calamos Global Growth and Income Fund
SECTOR WEIGHTINGS
Information Technology 23.0%Financials 15.1
Industrials 13.8Consumer Discretionary 13.1Health Care 8.4Consumer Staples 6.6
Telecommunication Services 5.2Energy 4.8
Materials 3.3Real Estate 2.0
Utilities 1.9Other 0.3
Sector weightings are subject to change daily andare calculated as a percentage of net assets. Thetable excludes cash or cash equivalents, anygovernment/sovereign bonds or broad based indexhedging securities the Fund may hold.
Geographic. From a geographic perspective, Fund holdings in the U.S. and Europegenerated strong absolute gains but significantly trailed the all-equity MSCI ACWIIndex. Fund positions in Emerging Asia added the most value, as they benefited fromhigher-quality attributes and secular growth leadership.
Please describe the Fund’s participation in up- and down-marketssince its inception.The Fund invests in a combination of stocks, convertible securities and bonds to offer atotal return-oriented portfolio that seeks to consistently balance risk and rewardthrough full market cycles. As we focus on managing volatility, we strive to participatein a greater portion of equity market upside than downside.
There are a variety of ways to express up- and down-market capture, whether it iscalculated daily, monthly, quarterly, or as we look at the markets—in longer-term upand down market trends. In the chart below, you can see how the Fund performedthrough a few distinct market periods. In the five major market periods shown, webelieve that the Fund has participated in the upside movements of the equity marketwhile limiting the downside exposure over times of tumult.
MANAGING RISK OVER MARKET CYCLESOver the last 20 years, the Global Growth and Income Fund historically has captured a significant amount of upside during bullmarkets and limited losses when global markets have plunged.
$50,000
$40,000
$30,000
$10,000
$20,000
$0
Calamos Global Growth and Income Fund (A Shares at NAV) MSCI ACWI Index
1998 1999 2000 2001 2002 2003 2004 2005 2006 2007 2008 2009 2010 2011 2012 2015201420131997 20172016
ANN
UALI
ZED
RETU
RNS
(%)
GROWTH OF $10,000
TECH BULL MARKET
11/97–3/00
119% UPSIDE CAPTURE
INTERNET BUBBLE CRASH
4/00–3/03
37% DOWNSIDECAPTURE
RECOVERY4/03–10/07
81% UPSIDE CAPTURE
FINANCIALCRISIS
11/07–2/09
77% DOWNSIDECAPTURE
RECOVERY3/09–10/17
68% UPSIDE CAPTURE
25.9721.78
-6.62
-18.04
19.1023.52
-34.21
-44.67
10.36
14.94
Performance data quoted represents past performance, which is no guarantee of future results. Current performance maybe lower or higher than the performance quoted. The principal value and return of an investment will fluctuate so that yourshares, when redeemed, may be worth more or less than their original cost. Performance reflected at NAV does not includethe Fund’s maximum front-end sales load of 4.75%. Had it been included, the Fund’s return would have been lower. Forthe most recent fund performance information visit www.calamos.com.There is no assurance that the fund will achieve or maintain its investment objective. Results are before taxes on funddistributions and assume reinvestment of dividends and capital gains.
34 CALAMOS OPEN-END FAMILY OF FUNDS ANNUAL REPORT
Calamos Global Growth and Income Fund
How is the Fund positioned?We continue to position the Fund for participation in the global equity market’s upside,while also preparing it to be resilient for market declines and downside volatility. Webelieve that actively blending convertibles and equities allows us to construct a portfoliothat can provide equity-like returns with significantly less volatility and equity beta overfull market cycles.
From a regional perspective, we hold a modest overweight stance in Europe reflectingour view of the region’s improving economic data, reasonable valuations, upside inmargins and accommodative policies. We have a significant, though relatively neutralstance in Japan. Improving economic growth and exports, positive earnings revisionsand opportunities for efficiencies and capital allocation have influenced our positioning.
We have an underweight stance in the U.S. given our concern of relatively expensivevaluations and less accommodative monetary policies, though we are also consideringmany positive fundamental attributes. We own a blend of holdings in core seculargrowth areas as well as more cyclical businesses and investment opportunitiesreflecting our view of a pickup in the economy and inflation expectations.
We have a positive view and selective overweight position in emerging markets. On aregional basis, the Fund owns the larger weight in Emerging Asia in addition to selectpositions in Emerging Europe and Latin America. The outlook for earnings growth isstrong, and emerging markets are poised to benefit from the pickup in global demandand relative stabilization in many currencies and commodities.
From a sector standpoint, the Fund’s largest allocations in absolute terms went towardthe information technology, industrials and financial sectors. We added weight infinancials and industrials over the annual period, reflecting our view of a pickup incyclical conditions and better fundamentals.
We offset these additions by reducing positions in consumer discretionary and healthcare. The Fund’s smallest allocations include utilities, telecom services and real estate,while we are also underweight in health care and consumer staples.
What are your closing thoughts for Fund shareholders?The balance of corporate and macroeconomic data points to continued synchronizedglobal growth across regions. Global monetary policy remains accommodative overall,though multiple central banks are edging toward tightening and we are seeing a pivottoward fiscal stimulus. We see continued opportunities in global equities, reflective ofpositive fundamentals and relatively attractive valuations. In terms of broad positioning,we favor a blend of investments in secular and cyclical growth companies, but arerelatively underweight in defensives overall. We see significant opportunities incompanies with earnings growth catalysts, solid cash flow generation and improving tostrong balance sheets. From a thematic and sector perspective, we see opportunities inthe information technology sector, consumer companies with targeted areas ofdemand, and cyclical companies in the financials and industrials sectors with improvingfundamentals and catalysts. Overall, we remain selective in our allocation of capital andcontinue to execute on our time-tested process with a focus on managing risks, notreturns. We believe our active, risk-managed investment approach and long-termperspective positions us to take advantage of the opportunities in global markets.
www.calamos.com 35

Calamos Global Growth and Income Fund
ANNUALIZED RETURN: SINCE INCEPTION (9/9/96) THROUGH 10/31/17
0%
20%
15%
25%
30%
5%
SINCE INCEPTION15-YEAR10-YEAR5-YEAR3-YEAR1-YEAR
Calamos Global Growth and Income Fund(A Shares at NAV)
10%
MSCI ACWI Index MSCI World Index
17.16
23.8623.46
5.928.51 8.75
6.80
11.4012.19
3.01 4.26 4.697.65
9.34 9.22 8.06 7.11 7.17
Performance data quoted represents past performance, which is no guarantee of future results. Current performance may be lower or higher than theperformance quoted.
The principal value and investment return of an investment will fluctuate so that your shares, when redeemed, may be worth more or less than theiroriginal cost. You can obtain performance data current to the most recent month end by visiting www.calamos.com. Average annual total return measuresnet investment income and capital gain or loss from portfolio investments as an annualized average. All performance shown assumes reinvestment ofdividends and capital gains distributions. Performance is for the Fund’s Class A shares at net asset value and does not include the Fund’s maximum front-end sales charge of 4.75%. Had it been included, the Fund’s return would have been lower. The Fund also offers Class C, Class I and Class R shares, theperformance of which may vary. Source: State Street Corporation and Lipper, Inc.
36 CALAMOS OPEN-END FAMILY OF FUNDS ANNUAL REPORT

Calamos Global Growth and Income Fund
GROWTH OF $10,000: FOR THE 10-YEAR PERIOD ENDED 10/31/17
10/31/08 10/31/09$0
$5,000
$10,000
$15,000
$20,000
$25,000
$12,807
$15,179$15,818
Calamos Global Growth and Income Fund MSCI World IndexMSCI ACWI Index
10/31/07 10/31/1710/31/10 10/31/11 10/31/12 10/31/13 10/31/14 10/31/15 10/31/16
AVERAGE ANNUAL TOTAL RETURN† AS OF 10/31/17
1YEAR
5YEARS
10YEARS
Class A Shares – Inception 9/9/96Without Sales Charge 17.16% 6.80% 3.01%With Sales Charge 11.63 5.77 2.50
Class C Shares – Inception 9/24/96Without Sales Charge 16.41 6.00 2.23With Sales Charge 15.41 6.00 2.23
Class I Shares – Inception 9/18/97 17.51 7.06 3.26
Class R Shares – Inception 3/1/07 16.99 6.54 2.76
Performance data quoted represents past performance, which is no guarantee of future results.Current performance may be lower or higher than the performance quoted. The principal value andinvestment return of an investment will fluctuate so that your shares, when redeemed, may be worthmore or less than their original cost.
As of the prospectus dated 2/28/17, the Fund’s gross expense ratio for Class A shares is 1.46%,Class C shares is 2.21%, Class I shares is 1.21% and Class R shares is 1.71%. The expense ratiosshown above may differ from the more recent expense ratios reported in the Financial Highlightssection of this report.† Average annual total return measures net investment income and capital gain or loss from portfolio investments as an
annualized average assuming reinvestment of dividends and capital gains distributions. Performance shown reflects theeffects of an expense reimbursement that improved results and was in effect until March 31, 2003. Load-adjustedreturns are adjusted for the maximum front-end sales load of 4.75% for Class A shares and returns for C shares havebeen adjusted for the contingent deferred sales charge (CDSC).
NOTES:The graphs do not reflect the income taxes that you would pay on fund distributions or the redemption of fund shares.Fund performance includes reinvestment of dividends and adjustment for the maximum sales charge for Class A shares.The performance of other classes will vary from the performance of the class shown based on the difference in salescharges and fees paid by shareholders investing in different share classes.
The MSCI ACWI Index is a free float-adjusted market capitalization weighted index that is designed to measure the equitymarket performance of developed and emerging markets.
The MSCI World Index (U.S. Dollars) is a market-capitalization weighted index composed of companies representative ofthe market structure of developed market countries in North America, Europe and the Asia/Pacific region. Since inceptiondata for the index is shown from 9/30/96 since data is only available for full monthly periods. Source: Lipper, Inc.
Index returns assume reinvestment of dividends and do not reflect deduction of fees and expenses. It is not possible toinvest directly in an index.
The Fund’s use of derivative instruments involves investment risks and transaction costs to which the Fund would not besubject absent the use of these instruments and, accordingly, may result in losses greater than if they had not been used.Derivative instruments can be illiquid, may disproportionately increase losses and may have a potentially large impact onFund performance.
www.calamos.com 37
Calamos Convertible Fund
OVERVIEWThe fund invests primarily in convertiblesecurities of U.S. companies that arediversified across market sector and creditquality.
KEY FEATURES▪ Leverages more than three decades of
research and experience in convertiblesecurity investing
▪ Provides diversification across marketsectors and credit quality, emphasizingmidsize companies with higher-qualitybalance sheets
▪ Seeks to provide upside participation inequity markets with less exposure todownside than an equity-only portfolioover a full market cycle
PORTFOLIO FITWhen used in conjunction with an equityallocation, the fund offers a way poten-tially to manage risk by employingsecurities that engage in upside equitymovements with limited downsideparticipation.
FUND NASDAQ SYMBOLS
A Shares CCVIXC Shares CCVCX
I Shares CICVXR Shares CCVRX
FUND CUSIP NUMBERS
A Shares 128119401C Shares 128119823
I Shares 128119864R Shares 128119369
CALAMOS CONVERTIBLE FUNDINVESTMENT TEAM DISCUSSION
How has the Fund performed?For the 12-month period ended October 31, 2017, the Fund returned 16.88% (Class Ashares at net asset value), versus the ICE BofAML All U.S. Convertibles Index* return of18.13%. For the same period, the Value Line Convertible Index rose 15.83% and theS&P 500 Index gained 23.63%.
What factors influenced performance?The convertible and equity markets rallied during the annual reporting period followingDonald Trump’s largely unexpected victory. While Congress has been challenged toimplement items on the president’s election platform, investors remained hopeful thattax reform, reduced regulation, and increased infrastructure spending (if implemented)could provide an economic boost. Improved economic data and higher corporateearnings also supported bullish investor sentiment.
Interest rates moved higher during the period as the Federal Reserve hiked its fed fundsrate three times during the period to 1.25%. The 3-year U.S. Treasury yield increasedfrom 1.00% to 1.73%, while the 5-year U.S. Treasury yield moved from 1.31% to2.01%. The 10-year U.S. Treasury yield increased from 1.84% to 2.38%. After the10-year U.S. Treasury yield hit its bottom of 1.37% on July 8, 2016, the BloombergBarclays U.S. Government/Credit Bond Index went on to decline 0.31% throughOctober 31, 2017. This contrasted sharply with the positive 16.81% return of the U.S.convertible index over the same period. This provided yet another proof point that, inour view, convertibles outperform bonds during a period of rising interest rates.
High yield credit spreads narrowed during the period with JPMorgan reporting spreadscontracting 142 basis points to 408 basis points above Treasuries. Narrower spreadssupported the largely below-investment grade convertible market.
During the period, the rising equity environment was most favorable to convertibleswith the most equity sensitivity. Convertibles with most equity sensitivity were up36.24% and strongly outperformed those with balanced risk-reward attributes(+15.38%) and those with the most credit sensitivity (+9.05%)
Economic Sector DetractorsHealth Care. An underweight position and selection in health care detracted from theFund’s return. Fund holdings in the biotechnology and managed health care industriesnotably underperformed.
Energy. An underweight position and selection within the energy sector also held backthe period result, as Fund holdings within oil & gas exploration & production and oil &gas drilling were a drag.
* With Intercontinental Exchange’s (ICE) acquisition of the BofA Merrill Lynch Global Research FICC indexplatform, the BofA Merrill Lynch All U.S. Convertibles Index has been rebranded to ICE BofAML All U.S.Convertibles Index.
38 CALAMOS OPEN-END FAMILY OF FUNDS ANNUAL REPORT
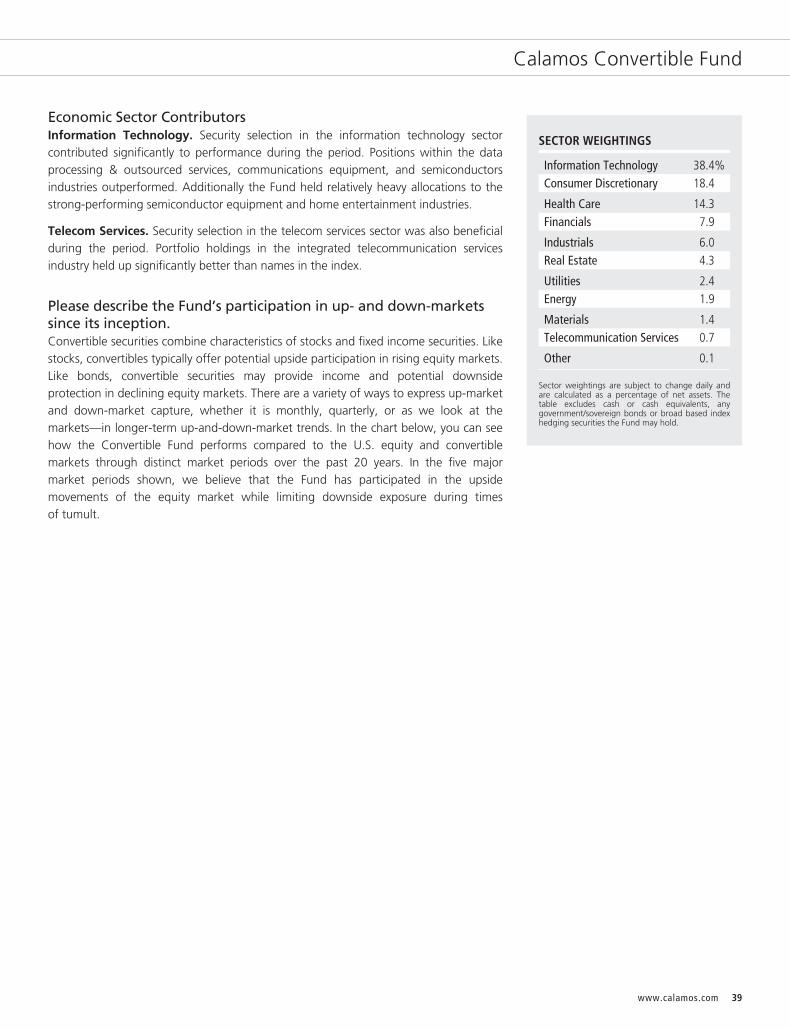
Calamos Convertible Fund
Economic Sector ContributorsInformation Technology. Security selection in the information technology sectorcontributed significantly to performance during the period. Positions within the dataprocessing & outsourced services, communications equipment, and semiconductorsindustries outperformed. Additionally the Fund held relatively heavy allocations to thestrong-performing semiconductor equipment and home entertainment industries.
Telecom Services. Security selection in the telecom services sector was also beneficialduring the period. Portfolio holdings in the integrated telecommunication servicesindustry held up significantly better than names in the index.
Please describe the Fund’s participation in up- and down-marketssince its inception.Convertible securities combine characteristics of stocks and fixed income securities. Likestocks, convertibles typically offer potential upside participation in rising equity markets.Like bonds, convertible securities may provide income and potential downsideprotection in declining equity markets. There are a variety of ways to express up-marketand down-market capture, whether it is monthly, quarterly, or as we look at themarkets—in longer-term up-and-down-market trends. In the chart below, you can seehow the Convertible Fund performs compared to the U.S. equity and convertiblemarkets through distinct market periods over the past 20 years. In the five majormarket periods shown, we believe that the Fund has participated in the upsidemovements of the equity market while limiting downside exposure during timesof tumult.
SECTOR WEIGHTINGS
Information Technology 38.4%Consumer Discretionary 18.4
Health Care 14.3Financials 7.9
Industrials 6.0Real Estate 4.3
Utilities 2.4Energy 1.9
Materials 1.4Telecommunication Services 0.7
Other 0.1
Sector weightings are subject to change daily andare calculated as a percentage of net assets. Thetable excludes cash or cash equivalents, anygovernment/sovereign bonds or broad based indexhedging securities the Fund may hold.
www.calamos.com 39

Calamos Convertible Fund
MANAGING RISK OVER MARKET CYCLES
Over the last 20 years, the Convertible Fund historically has captured a significant amount of upside during bull markets andlimited losses when markets have plunged.
GROWTH OF $10,000
ANN
UALI
ZED
RETU
RNS
(%)
Calamos Convertible Fund (A Shares at NAV) S&P 500 Index ICE BofAML All U.S. Convertibles Index
$50,000
$40,000
$30,000
$20,000
$10,000
$0
1997 1998 1999 2000 2001 2002 2003 2004 2005 2006 2007 2008 2009 2010 2011 2012 201520142013
BULL MARKET11/97–3/00
89% UPSIDECAPTURE
TECH
20172016
BUBBLE CRASH4/00–3/03
16% DOWNSIDECAPTURE
INTERNET RECOVERY4/03–10/07
77% UPSIDE CAPTURE 56% DOWNSIDECAPTURE
11/07–2/09
FINANCIALCRISIS
RECOVERY3/09–10/17
53% UPSIDE CAPTURE
22.6724.38 23.40
-2.54
-16.09
-9.19
12.4616.13
12.23
-23.00
-41.39
-32.24
9.78
18.0314.54
Performance data quoted represents past performance, which is no guarantee of future results. Current performance maybe lower or higher than the performance quoted. The principal value and return of an investment will fluctuate so that yourshares, when redeemed, may be worth more or less than their original cost. Performance reflected at NAV does not includethe Fund’s maximum front-end sales load of 2.25%.* Had it been included, the Fund’s return would have been lower. Forthe most recent fund performance information visit www.calamos.com.There is no assurance that the fund will achieve or maintain its investment objective. Results are before taxes on funddistributions and assume reinvestment of dividend and capital gains.*Prior to 2/28/17, the Fund had a maximum front-end sales charge of 4.75%.
How is the fund positioned?The Fund’s largest allocation went toward information technology where favorablecyclical and secular opportunities remain intact. Within the sector, semiconductorsrepresent our largest industry allocation and have been one of the strongest-performing areas of the market during the quarter as heavy demand continued to drivequarterly results. Consumer discretionary remains the largest relative overweight. Thisleaning has been bottom-up driven based on attractive positions in the media and autoindustries. Positive employment data, wage gains, stock market and home-valuationappreciation have all contributed to a positive consumer wealth effect and consumerconfidence, which, in our view, should continue to prove positive for the consumer andsupport our overweight positioning.
The relative underweights fall within REITs, utilities and staples, as these have beenprimarily defensive sectors and the convertibles in these sectors offered unattractiverisk/reward structures. The financials sector is also a relative underweight, asconvertibles in the sector present predominantly bond-like profiles and will not benefitfrom a potentially favorable equity backdrop.
40 CALAMOS OPEN-END FAMILY OF FUNDS ANNUAL REPORT

Calamos Convertible Fund
What are your closing thoughts for Fund shareholders?We continue to have a favorable view of equity markets supported by agradual-but-strengthening global economy, accommodative monetary policy, tameinflation expectations, strong corporate earnings and a reduced regulatory environmentin the U.S. While the lack of volatility in the markets was one of the more surprisingdevelopments during the reporting period, we continue to believe that maintaining anappropriate risk/reward profile is prudent. As such, the balanced portion of theconvertibles market remains the largest exposure in the portfolio. Moreover, we activelymanage the Fund, seeking to ensure it has the appropriate level of downsideprotection. In addition, we expect that developments on U.S. tax reform could have anoutsized positive effect on convertible market issuers as they tend to have smallermarket capitalizations and are more domestically exposed than the broader market. Wealso anticipate there will be healthy new issuance into year-end, given the strong equitymarket performance and motivated issuers looking to raise capital for growth projects.We continue to view convertibles as a favorable asset class given their historicalperformance in rising rate environments and their potential to dampen volatility versusa pure-equity exposure.
ANNUALIZED RETURN: SINCE INCEPTION (6/21/85) THROUGH 10/31/17
0%
30%
20%
10%
SINCE INCEPTION15-YEAR10-YEAR5-YEAR3-YEAR1-YEAR
Calamos Convertible Fund(A Shares at NAV)
ICE BofAML All Convertibles VXAO
S&P 500 Index Value LineConvertible Index
16.88
23.63
18.1315.83
4.62
10.77
6.878.53 8.09
15.18
11.41 11.23
4.717.516.80
8.717.04
8.90 9.6010.10 9.02 8.8010.91
N/A
Performance data quoted represents past performance, which is no guarantee of future results. Current performance may be lower or higher than theperformance quoted.
The principal value and investment return of an investment will fluctuate so that your shares, when redeemed, may be worth more or less than theiroriginal cost. You can obtain performance data current to the most recent month end by visiting www.calamos.com. Average annual total return measuresnet investment income and capital gain or loss from portfolio investments as an annualized average. All performance shown assumes reinvestment ofdividends and capital gains distributions. Performance is for the Fund’s Class A shares at net asset value and does not include the Fund’s maximum front-end sales charge of 2.25%.* Had it been included, the Fund’s return would have been lower. The Fund also offers Class C, Class I and Class R shares, theperformance of which may vary. Source: State Street Corporation, Lipper, Inc., and Mellon Analytical Solutions, LLC.*Prior to 2/28/17, the Fund had a maximum front-end sales charge of 4.75%.
www.calamos.com 41
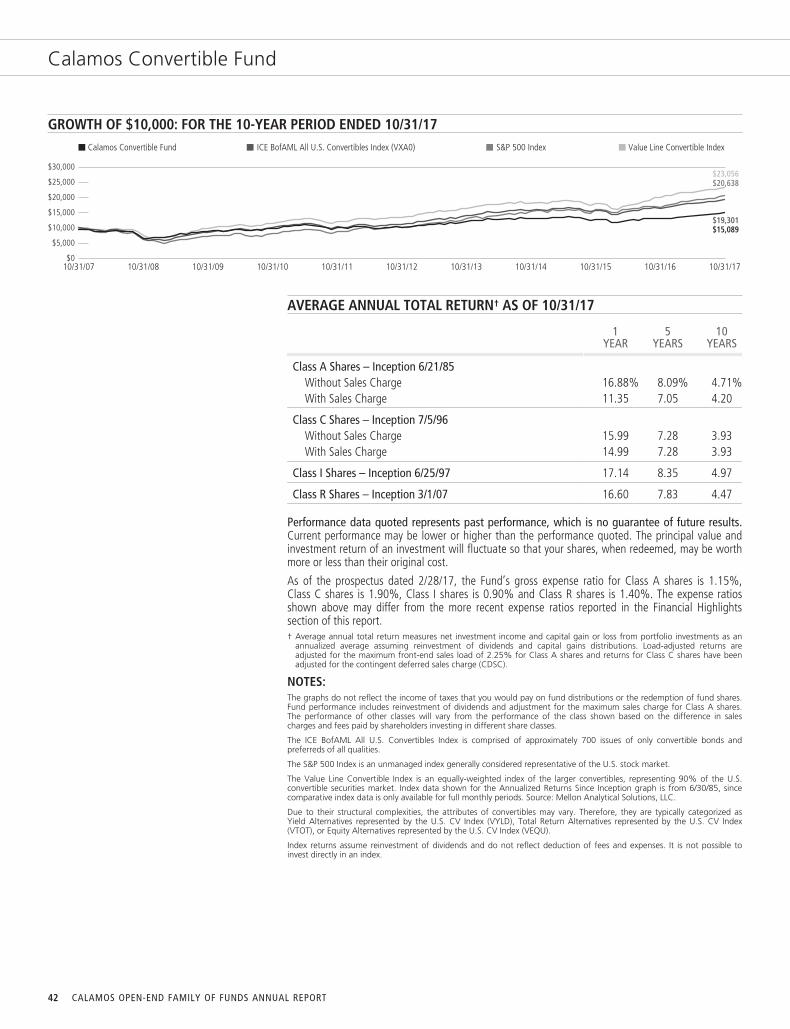
Calamos Convertible Fund
GROWTH OF $10,000: FOR THE 10-YEAR PERIOD ENDED 10/31/17
$0
$5,000
$10,000
$15,000
$20,000
$25,000
$30,000
$15,089
$20,638
$19,301
$23,056
Calamos Convertible Fund Value Line Convertible IndexS&P 500 IndexICE BofAML All U.S. Convertibles Index (VXA0)
10/31/07 10/31/08 10/31/09 10/31/10 10/31/11 10/31/12 10/31/13 10/31/14 10/31/15 10/31/16 10/31/17
AVERAGE ANNUAL TOTAL RETURN† AS OF 10/31/17
1YEAR
5YEARS
10YEARS
Class A Shares – Inception 6/21/85Without Sales Charge 16.88% 8.09% 4.71%With Sales Charge 11.35 7.05 4.20
Class C Shares – Inception 7/5/96Without Sales Charge 15.99 7.28 3.93With Sales Charge 14.99 7.28 3.93
Class I Shares – Inception 6/25/97 17.14 8.35 4.97
Class R Shares – Inception 3/1/07 16.60 7.83 4.47
Performance data quoted represents past performance, which is no guarantee of future results.Current performance may be lower or higher than the performance quoted. The principal value andinvestment return of an investment will fluctuate so that your shares, when redeemed, may be worthmore or less than their original cost.
As of the prospectus dated 2/28/17, the Fund’s gross expense ratio for Class A shares is 1.15%,Class C shares is 1.90%, Class I shares is 0.90% and Class R shares is 1.40%. The expense ratiosshown above may differ from the more recent expense ratios reported in the Financial Highlightssection of this report.† Average annual total return measures net investment income and capital gain or loss from portfolio investments as an
annualized average assuming reinvestment of dividends and capital gains distributions. Load-adjusted returns areadjusted for the maximum front-end sales load of 2.25% for Class A shares and returns for Class C shares have beenadjusted for the contingent deferred sales charge (CDSC).
NOTES:The graphs do not reflect the income of taxes that you would pay on fund distributions or the redemption of fund shares.Fund performance includes reinvestment of dividends and adjustment for the maximum sales charge for Class A shares.The performance of other classes will vary from the performance of the class shown based on the difference in salescharges and fees paid by shareholders investing in different share classes.
The ICE BofAML All U.S. Convertibles Index is comprised of approximately 700 issues of only convertible bonds andpreferreds of all qualities.
The S&P 500 Index is an unmanaged index generally considered representative of the U.S. stock market.
The Value Line Convertible Index is an equally-weighted index of the larger convertibles, representing 90% of the U.S.convertible securities market. Index data shown for the Annualized Returns Since Inception graph is from 6/30/85, sincecomparative index data is only available for full monthly periods. Source: Mellon Analytical Solutions, LLC.
Due to their structural complexities, the attributes of convertibles may vary. Therefore, they are typically categorized asYield Alternatives represented by the U.S. CV Index (VYLD), Total Return Alternatives represented by the U.S. CV Index(VTOT), or Equity Alternatives represented by the U.S. CV Index (VEQU).
Index returns assume reinvestment of dividends and do not reflect deduction of fees and expenses. It is not possible toinvest directly in an index.
42 CALAMOS OPEN-END FAMILY OF FUNDS ANNUAL REPORT

Calamos Global Convertible Fund
CALAMOS GLOBAL CONVERTIBLE FUNDINVESTMENT TEAM DISCUSSION
How has the Fund performed?For the 12-month period ended October 31, 2017, the Fund returned 14.86% (Class Ashares at net asset value) versus the ICE BofAML Global 300 Convertible Index* returnof 16.13%.
What factors influenced performance?The global equity and convertible markets performed strongly as prices reflectedsynchronized global growth that included generally better global economic data,supportive monetary policy, higher corporate earnings and more bullish investorsentiment across both developed and emerging markets.
Global interest rates moved higher during the period as illustrated by the BarclaysBloomberg Global Aggregate Index 1.18% return, which was below its yield. U.S.Interest rates rose after the Federal Reserve hiked its fed funds rate three times duringthe period up to 1.25%. The 3-year U.S. Treasury yield increased from 1.00% to1.73%, while the 5-year U.S. Treasury yield moved from 1.31% to 2.01%. The 10-yearU.S. Treasury yield increased from 1.84% to 2.38%. After the 10-year U.S. Treasuryyield reached its bottom of 1.37% on July 8, 2016, the Bloomberg Barclays GlobalAggregate Index went on to decline 1.18% through October 31, 2017. This contrastedsharply with the positive 14.28% return of the ICE BofAML Global 300 ConvertibleIndex over the same period.
Global high yield credit spreads narrowed during the period with JPMorgan reportingglobal spreads contracting 152 basis points to 399 basis points above governmentsecurities. Narrower spreads supported the largely below-investment-grade convertiblemarket, especially convertibles with CCC-implied credit ratings. Consistent with ourinvestment process, we were relatively underweight to these weak credit names.
During the period, the market environment was most favorable to the equity-sensitiveconvertibles. Convertibles with most equity sensitivity were up 42.3% and stronglyoutperformed those with balanced risk/reward attributes (+11.4%) and those with themost credit sensitivity (+8.1%) Our approach led us to be underweight the most equity-sensitive convertibles in favor of those with balanced risk/reward attributes.
Economic Sector ContributorsIndustrials. Security selection in the industrials sector was supportive to the periodresult, as holdings within the aerospace & defense and construction machinery & heavytrucks industries strongly outperformed.
Consumer Discretionary. Strong security selection in the consumer discretionary sectoralso added value during the period. Holdings in the apparel, accessories & luxury goods,movies & entertainment, and automobile manufacturers industries all outperformed.
* With Intercontinental Exchange’s (ICE) acquisition of the BofA Merrill Lynch Global Research FICC indexplatform, the BofA Merrill Lynch Global 300 Convertible Index has been rebranded to ICE BofAMLGlobal 300 Convertible Index.
OVERVIEWThe fund invests in global convertiblesecurities. It strives to balance risk/reward,while providing growth and income.
KEY FEATURES▪ Provides broadly diversified exposure to
the global convertible bond universe
▪ Leverages more than 30 years ofresearch in convertible security investing
▪ Seeks to provide upside participation inequity markets with less exposure todownside than an equity-only portfolioover a full market cycle
▪ Blends global investment themes andfundamental research via activemanagement
PORTFOLIO FITConsisting of convertible securities thatcan participate in upside equitymovements with potentially limiteddownside exposure, the fund can providea means to manage risk in conjunctionwith an equity allocation. The fund canalso serve a role within a fixed incomeallocation, as convertibles have performedwell during periods of rising interest ratesand inflation.
FUND NASDAQ SYMBOLS
A Shares CAGCXC Shares CCGCX
I Shares CXGCXR Shares CRGCX
FUND CUSIP NUMBERS
A Shares 128120748C Shares 128120730
I Shares 128120722R Shares 128120714
www.calamos.com 43
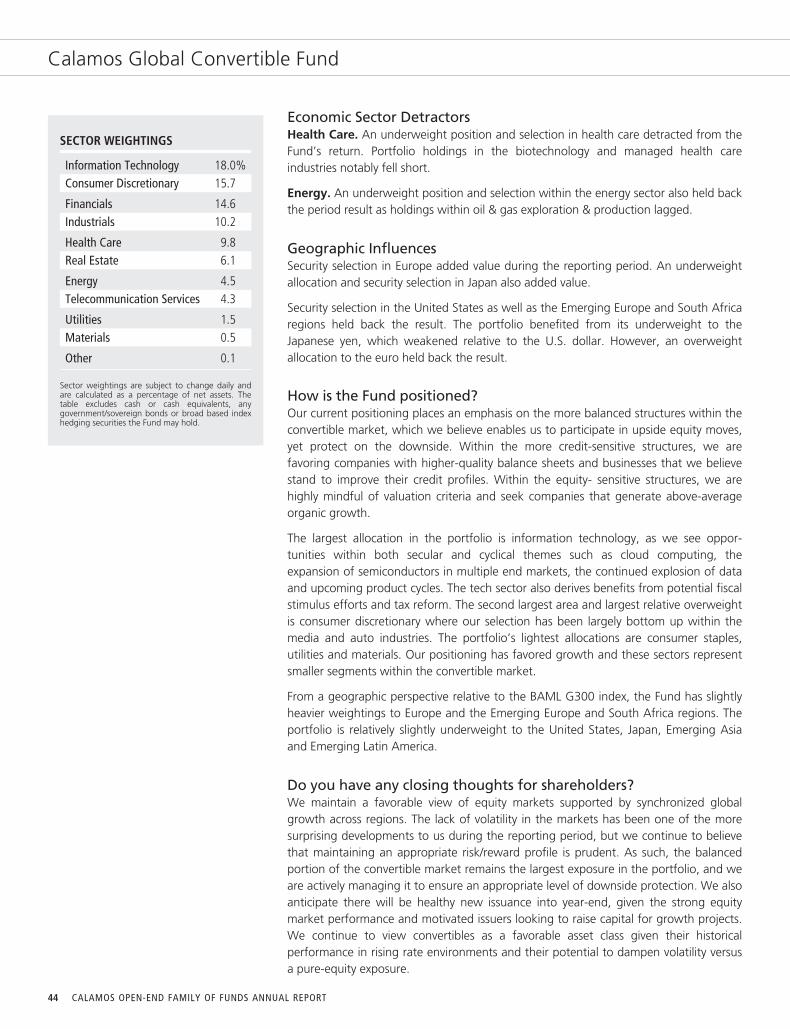
Calamos Global Convertible Fund
SECTOR WEIGHTINGS
Information Technology 18.0%Consumer Discretionary 15.7
Financials 14.6Industrials 10.2
Health Care 9.8Real Estate 6.1
Energy 4.5Telecommunication Services 4.3
Utilities 1.5Materials 0.5
Other 0.1
Sector weightings are subject to change daily andare calculated as a percentage of net assets. Thetable excludes cash or cash equivalents, anygovernment/sovereign bonds or broad based indexhedging securities the Fund may hold.
Economic Sector DetractorsHealth Care. An underweight position and selection in health care detracted from theFund’s return. Portfolio holdings in the biotechnology and managed health careindustries notably fell short.
Energy. An underweight position and selection within the energy sector also held backthe period result as holdings within oil & gas exploration & production lagged.
Geographic InfluencesSecurity selection in Europe added value during the reporting period. An underweightallocation and security selection in Japan also added value.
Security selection in the United States as well as the Emerging Europe and South Africaregions held back the result. The portfolio benefited from its underweight to theJapanese yen, which weakened relative to the U.S. dollar. However, an overweightallocation to the euro held back the result.
How is the Fund positioned?Our current positioning places an emphasis on the more balanced structures within theconvertible market, which we believe enables us to participate in upside equity moves,yet protect on the downside. Within the more credit-sensitive structures, we arefavoring companies with higher-quality balance sheets and businesses that we believestand to improve their credit profiles. Within the equity- sensitive structures, we arehighly mindful of valuation criteria and seek companies that generate above-averageorganic growth.
The largest allocation in the portfolio is information technology, as we see oppor-tunities within both secular and cyclical themes such as cloud computing, theexpansion of semiconductors in multiple end markets, the continued explosion of dataand upcoming product cycles. The tech sector also derives benefits from potential fiscalstimulus efforts and tax reform. The second largest area and largest relative overweightis consumer discretionary where our selection has been largely bottom up within themedia and auto industries. The portfolio’s lightest allocations are consumer staples,utilities and materials. Our positioning has favored growth and these sectors representsmaller segments within the convertible market.
From a geographic perspective relative to the BAML G300 index, the Fund has slightlyheavier weightings to Europe and the Emerging Europe and South Africa regions. Theportfolio is relatively slightly underweight to the United States, Japan, Emerging Asiaand Emerging Latin America.
Do you have any closing thoughts for shareholders?We maintain a favorable view of equity markets supported by synchronized globalgrowth across regions. The lack of volatility in the markets has been one of the moresurprising developments to us during the reporting period, but we continue to believethat maintaining an appropriate risk/reward profile is prudent. As such, the balancedportion of the convertible market remains the largest exposure in the portfolio, and weare actively managing it to ensure an appropriate level of downside protection. We alsoanticipate there will be healthy new issuance into year-end, given the strong equitymarket performance and motivated issuers looking to raise capital for growth projects.We continue to view convertibles as a favorable asset class given their historicalperformance in rising rate environments and their potential to dampen volatility versusa pure-equity exposure.
44 CALAMOS OPEN-END FAMILY OF FUNDS ANNUAL REPORT
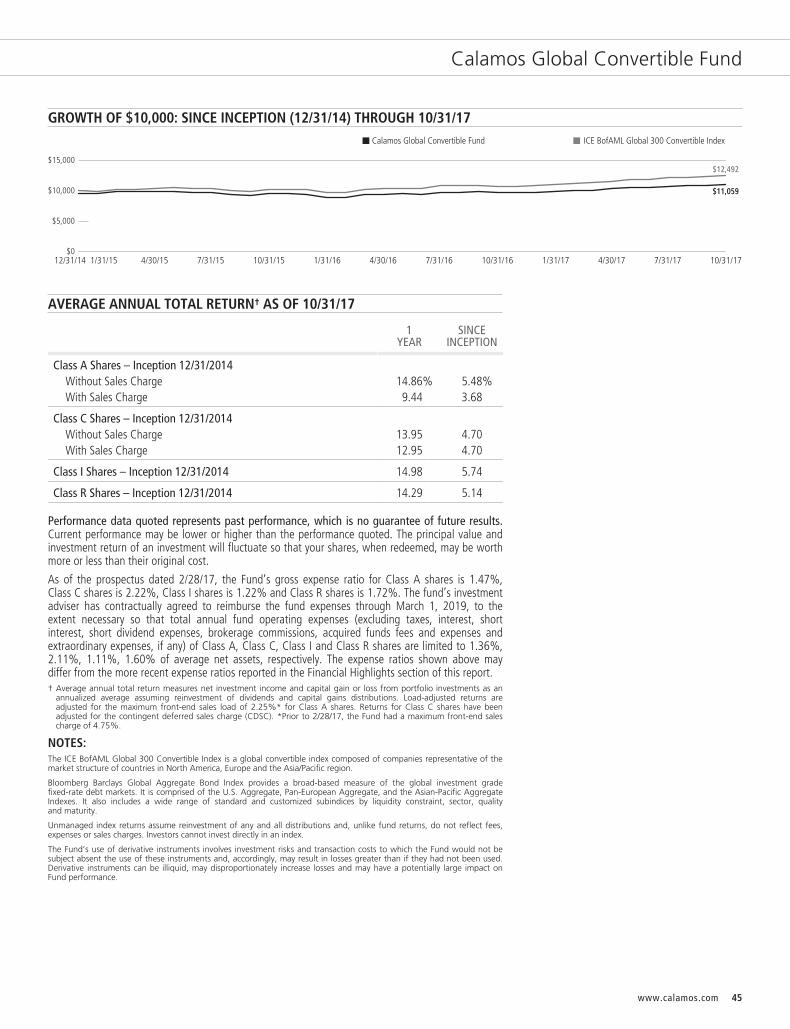
Calamos Global Convertible Fund
GROWTH OF $10,000: SINCE INCEPTION (12/31/14) THROUGH 10/31/17
$0
$5,000
$10,000
$15,000
$11,059
$12,492
Calamos Global Convertible Fund ICE BofAML Global 300 Convertible Index
12/31/14 1/31/15 4/30/15 7/31/15 10/31/15 4/30/161/31/16 10/31/1710/31/16 1/31/17 4/30/17 7/31/177/31/16
AVERAGE ANNUAL TOTAL RETURN† AS OF 10/31/17
1YEAR
SINCEINCEPTION
Class A Shares – Inception 12/31/2014Without Sales Charge 14.86% 5.48%With Sales Charge 9.44 3.68
Class C Shares – Inception 12/31/2014Without Sales Charge 13.95 4.70With Sales Charge 12.95 4.70
Class I Shares – Inception 12/31/2014 14.98 5.74
Class R Shares – Inception 12/31/2014 14.29 5.14
Performance data quoted represents past performance, which is no guarantee of future results.Current performance may be lower or higher than the performance quoted. The principal value andinvestment return of an investment will fluctuate so that your shares, when redeemed, may be worthmore or less than their original cost.
As of the prospectus dated 2/28/17, the Fund’s gross expense ratio for Class A shares is 1.47%,Class C shares is 2.22%, Class I shares is 1.22% and Class R shares is 1.72%. The fund’s investmentadviser has contractually agreed to reimburse the fund expenses through March 1, 2019, to theextent necessary so that total annual fund operating expenses (excluding taxes, interest, shortinterest, short dividend expenses, brokerage commissions, acquired funds fees and expenses andextraordinary expenses, if any) of Class A, Class C, Class I and Class R shares are limited to 1.36%,2.11%, 1.11%, 1.60% of average net assets, respectively. The expense ratios shown above maydiffer from the more recent expense ratios reported in the Financial Highlights section of this report.† Average annual total return measures net investment income and capital gain or loss from portfolio investments as an
annualized average assuming reinvestment of dividends and capital gains distributions. Load-adjusted returns areadjusted for the maximum front-end sales load of 2.25%* for Class A shares. Returns for Class C shares have beenadjusted for the contingent deferred sales charge (CDSC). *Prior to 2/28/17, the Fund had a maximum front-end salescharge of 4.75%.
NOTES:The ICE BofAML Global 300 Convertible Index is a global convertible index composed of companies representative of themarket structure of countries in North America, Europe and the Asia/Pacific region.
Bloomberg Barclays Global Aggregate Bond Index provides a broad-based measure of the global investment gradefixed-rate debt markets. It is comprised of the U.S. Aggregate, Pan-European Aggregate, and the Asian-Pacific AggregateIndexes. It also includes a wide range of standard and customized subindices by liquidity constraint, sector, qualityand maturity.
Unmanaged index returns assume reinvestment of any and all distributions and, unlike fund returns, do not reflect fees,expenses or sales charges. Investors cannot invest directly in an index.
The Fund’s use of derivative instruments involves investment risks and transaction costs to which the Fund would not besubject absent the use of these instruments and, accordingly, may result in losses greater than if they had not been used.Derivative instruments can be illiquid, may disproportionately increase losses and may have a potentially large impact onFund performance.
www.calamos.com 45
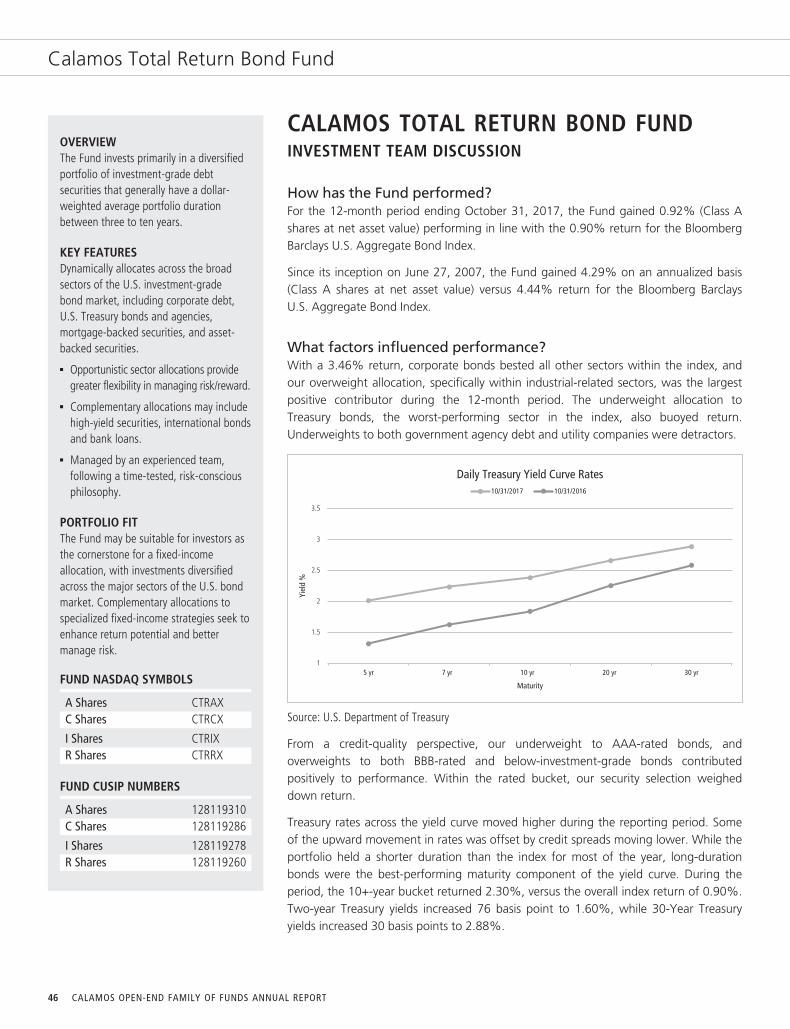
Calamos Total Return Bond Fund
OVERVIEWThe Fund invests primarily in a diversifiedportfolio of investment-grade debtsecurities that generally have a dollar-weighted average portfolio durationbetween three to ten years.
KEY FEATURESDynamically allocates across the broadsectors of the U.S. investment-gradebond market, including corporate debt,U.S. Treasury bonds and agencies,mortgage-backed securities, and asset-backed securities.
▪ Opportunistic sector allocations providegreater flexibility in managing risk/reward.
▪ Complementary allocations may includehigh-yield securities, international bondsand bank loans.
▪ Managed by an experienced team,following a time-tested, risk-consciousphilosophy.
PORTFOLIO FITThe Fund may be suitable for investors asthe cornerstone for a fixed-incomeallocation, with investments diversifiedacross the major sectors of the U.S. bondmarket. Complementary allocations tospecialized fixed-income strategies seek toenhance return potential and bettermanage risk.
FUND NASDAQ SYMBOLS
A Shares CTRAXC Shares CTRCX
I Shares CTRIXR Shares CTRRX
FUND CUSIP NUMBERS
A Shares 128119310C Shares 128119286
I Shares 128119278R Shares 128119260
CALAMOS TOTAL RETURN BOND FUNDINVESTMENT TEAM DISCUSSION
How has the Fund performed?For the 12-month period ending October 31, 2017, the Fund gained 0.92% (Class Ashares at net asset value) performing in line with the 0.90% return for the BloombergBarclays U.S. Aggregate Bond Index.
Since its inception on June 27, 2007, the Fund gained 4.29% on an annualized basis(Class A shares at net asset value) versus 4.44% return for the Bloomberg BarclaysU.S. Aggregate Bond Index.
What factors influenced performance?With a 3.46% return, corporate bonds bested all other sectors within the index, andour overweight allocation, specifically within industrial-related sectors, was the largestpositive contributor during the 12-month period. The underweight allocation toTreasury bonds, the worst-performing sector in the index, also buoyed return.Underweights to both government agency debt and utility companies were detractors.
1.5
2
2.5
3
3.5
Yiel
d %
Daily Treasury Yield Curve Rates
15 yr 7 yr 10 yr 20 yr 30 yr
Maturity
10/31/2017 10/31/2016
Source: U.S. Department of Treasury
From a credit-quality perspective, our underweight to AAA-rated bonds, andoverweights to both BBB-rated and below-investment-grade bonds contributedpositively to performance. Within the rated bucket, our security selection weigheddown return.
Treasury rates across the yield curve moved higher during the reporting period. Someof the upward movement in rates was offset by credit spreads moving lower. While theportfolio held a shorter duration than the index for most of the year, long-durationbonds were the best-performing maturity component of the yield curve. During theperiod, the 10+-year bucket returned 2.30%, versus the overall index return of 0.90%.Two-year Treasury yields increased 76 basis point to 1.60%, while 30-Year Treasuryyields increased 30 basis points to 2.88%.
46 CALAMOS OPEN-END FAMILY OF FUNDS ANNUAL REPORT
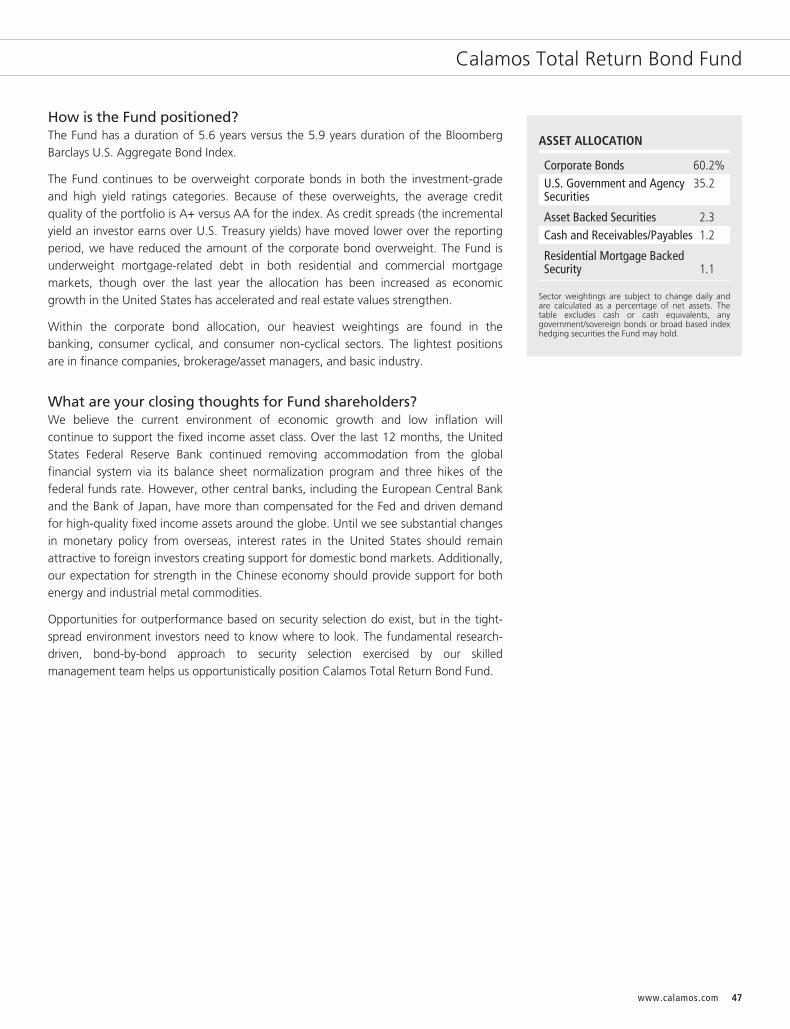
Calamos Total Return Bond Fund
How is the Fund positioned?The Fund has a duration of 5.6 years versus the 5.9 years duration of the BloombergBarclays U.S. Aggregate Bond Index.
The Fund continues to be overweight corporate bonds in both the investment-gradeand high yield ratings categories. Because of these overweights, the average creditquality of the portfolio is A+ versus AA for the index. As credit spreads (the incrementalyield an investor earns over U.S. Treasury yields) have moved lower over the reportingperiod, we have reduced the amount of the corporate bond overweight. The Fund isunderweight mortgage-related debt in both residential and commercial mortgagemarkets, though over the last year the allocation has been increased as economicgrowth in the United States has accelerated and real estate values strengthen.
Within the corporate bond allocation, our heaviest weightings are found in thebanking, consumer cyclical, and consumer non-cyclical sectors. The lightest positionsare in finance companies, brokerage/asset managers, and basic industry.
What are your closing thoughts for Fund shareholders?We believe the current environment of economic growth and low inflation willcontinue to support the fixed income asset class. Over the last 12 months, the UnitedStates Federal Reserve Bank continued removing accommodation from the globalfinancial system via its balance sheet normalization program and three hikes of thefederal funds rate. However, other central banks, including the European Central Bankand the Bank of Japan, have more than compensated for the Fed and driven demandfor high-quality fixed income assets around the globe. Until we see substantial changesin monetary policy from overseas, interest rates in the United States should remainattractive to foreign investors creating support for domestic bond markets. Additionally,our expectation for strength in the Chinese economy should provide support for bothenergy and industrial metal commodities.
Opportunities for outperformance based on security selection do exist, but in the tight-spread environment investors need to know where to look. The fundamental research-driven, bond-by-bond approach to security selection exercised by our skilledmanagement team helps us opportunistically position Calamos Total Return Bond Fund.
ASSET ALLOCATION
Corporate Bonds 60.2%U.S. Government and AgencySecurities
35.2
Asset Backed Securities 2.3Cash and Receivables/Payables 1.2
Residential Mortgage BackedSecurity 1.1
Sector weightings are subject to change daily andare calculated as a percentage of net assets. Thetable excludes cash or cash equivalents, anygovernment/sovereign bonds or broad based indexhedging securities the Fund may hold.
www.calamos.com 47
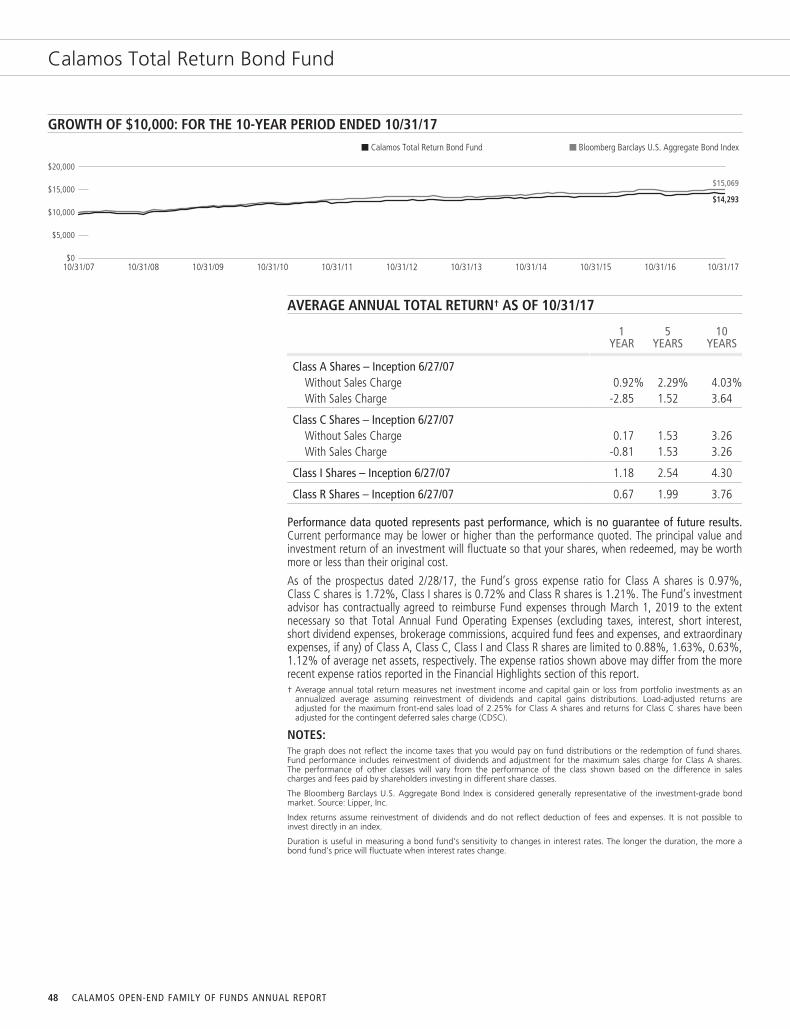
Calamos Total Return Bond Fund
GROWTH OF $10,000: FOR THE 10-YEAR PERIOD ENDED 10/31/17
$0
$5,000
$10,000
$20,000
$15,000
10/31/17
$14,293
$15,069
Calamos Total Return Bond Fund Bloomberg Barclays U.S. Aggregate Bond Index
10/31/0810/31/07 10/31/09 10/31/10 10/31/11 10/31/12 10/31/13 10/31/14 10/31/15 10/31/16
AVERAGE ANNUAL TOTAL RETURN† AS OF 10/31/17
1YEAR
5YEARS
10YEARS
Class A Shares – Inception 6/27/07Without Sales Charge 0.92% 2.29% 4.03%With Sales Charge -2.85 1.52 3.64
Class C Shares – Inception 6/27/07Without Sales Charge 0.17 1.53 3.26With Sales Charge -0.81 1.53 3.26
Class I Shares – Inception 6/27/07 1.18 2.54 4.30
Class R Shares – Inception 6/27/07 0.67 1.99 3.76
Performance data quoted represents past performance, which is no guarantee of future results.Current performance may be lower or higher than the performance quoted. The principal value andinvestment return of an investment will fluctuate so that your shares, when redeemed, may be worthmore or less than their original cost.
As of the prospectus dated 2/28/17, the Fund’s gross expense ratio for Class A shares is 0.97%,Class C shares is 1.72%, Class I shares is 0.72% and Class R shares is 1.21%. The Fund’s investmentadvisor has contractually agreed to reimburse Fund expenses through March 1, 2019 to the extentnecessary so that Total Annual Fund Operating Expenses (excluding taxes, interest, short interest,short dividend expenses, brokerage commissions, acquired fund fees and expenses, and extraordinaryexpenses, if any) of Class A, Class C, Class I and Class R shares are limited to 0.88%, 1.63%, 0.63%,1.12% of average net assets, respectively. The expense ratios shown above may differ from the morerecent expense ratios reported in the Financial Highlights section of this report.† Average annual total return measures net investment income and capital gain or loss from portfolio investments as an
annualized average assuming reinvestment of dividends and capital gains distributions. Load-adjusted returns areadjusted for the maximum front-end sales load of 2.25% for Class A shares and returns for Class C shares have beenadjusted for the contingent deferred sales charge (CDSC).
NOTES:The graph does not reflect the income taxes that you would pay on fund distributions or the redemption of fund shares.Fund performance includes reinvestment of dividends and adjustment for the maximum sales charge for Class A shares.The performance of other classes will vary from the performance of the class shown based on the difference in salescharges and fees paid by shareholders investing in different share classes.
The Bloomberg Barclays U.S. Aggregate Bond Index is considered generally representative of the investment-grade bondmarket. Source: Lipper, Inc.
Index returns assume reinvestment of dividends and do not reflect deduction of fees and expenses. It is not possible toinvest directly in an index.
Duration is useful in measuring a bond fund’s sensitivity to changes in interest rates. The longer the duration, the more abond fund’s price will fluctuate when interest rates change.
48 CALAMOS OPEN-END FAMILY OF FUNDS ANNUAL REPORT
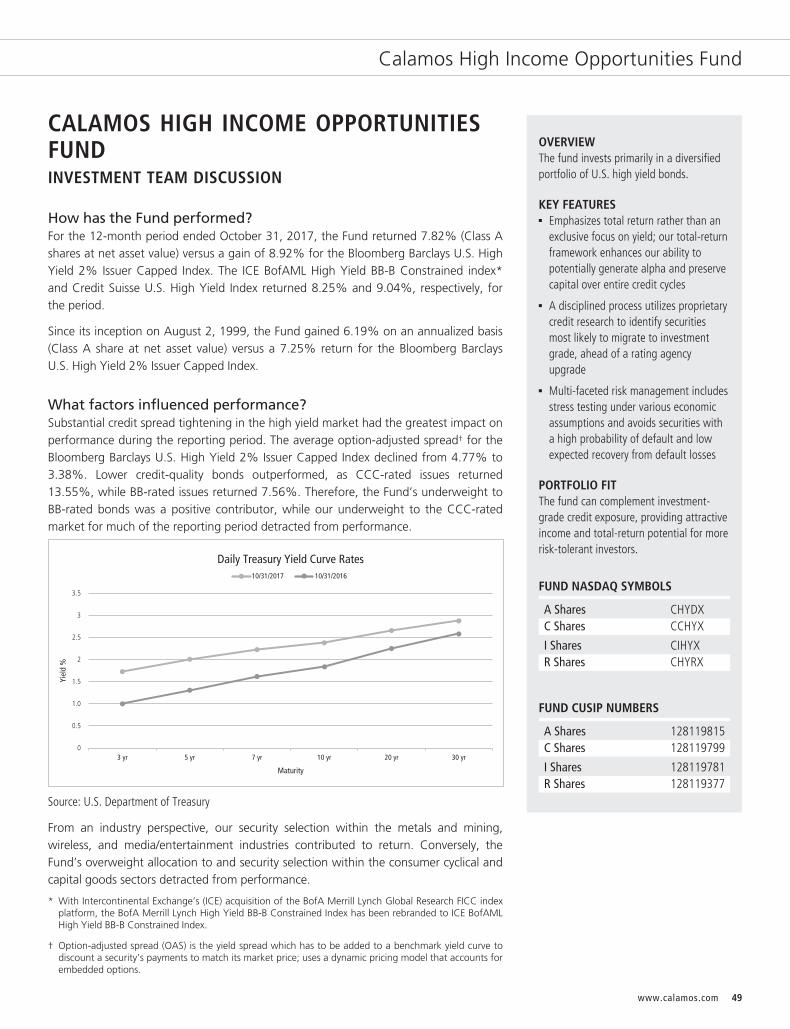
Calamos High Income Opportunities Fund
CALAMOS HIGH INCOME OPPORTUNITIESFUNDINVESTMENT TEAM DISCUSSION
How has the Fund performed?For the 12-month period ended October 31, 2017, the Fund returned 7.82% (Class Ashares at net asset value) versus a gain of 8.92% for the Bloomberg Barclays U.S. HighYield 2% Issuer Capped Index. The ICE BofAML High Yield BB-B Constrained index*and Credit Suisse U.S. High Yield Index returned 8.25% and 9.04%, respectively, forthe period.
Since its inception on August 2, 1999, the Fund gained 6.19% on an annualized basis(Class A share at net asset value) versus a 7.25% return for the Bloomberg BarclaysU.S. High Yield 2% Issuer Capped Index.
What factors influenced performance?Substantial credit spread tightening in the high yield market had the greatest impact onperformance during the reporting period. The average option-adjusted spread† for theBloomberg Barclays U.S. High Yield 2% Issuer Capped Index declined from 4.77% to3.38%. Lower credit-quality bonds outperformed, as CCC-rated issues returned13.55%, while BB-rated issues returned 7.56%. Therefore, the Fund’s underweight toBB-rated bonds was a positive contributor, while our underweight to the CCC-ratedmarket for much of the reporting period detracted from performance.
1.5
2
2.5
3
3.5
Yiel
d %
Daily Treasury Yield Curve Rates
05 yr3 yr 7 yr 10 yr 20 yr 30 yr
Maturity
0.5
1.0
10/31/2017 10/31/2016
Source: U.S. Department of Treasury
From an industry perspective, our security selection within the metals and mining,wireless, and media/entertainment industries contributed to return. Conversely, theFund’s overweight allocation to and security selection within the consumer cyclical andcapital goods sectors detracted from performance.
* With Intercontinental Exchange’s (ICE) acquisition of the BofA Merrill Lynch Global Research FICC indexplatform, the BofA Merrill Lynch High Yield BB-B Constrained Index has been rebranded to ICE BofAMLHigh Yield BB-B Constrained Index.
† Option-adjusted spread (OAS) is the yield spread which has to be added to a benchmark yield curve todiscount a security’s payments to match its market price; uses a dynamic pricing model that accounts forembedded options.
OVERVIEWThe fund invests primarily in a diversifiedportfolio of U.S. high yield bonds.
KEY FEATURES▪ Emphasizes total return rather than an
exclusive focus on yield; our total-returnframework enhances our ability topotentially generate alpha and preservecapital over entire credit cycles
▪ A disciplined process utilizes proprietarycredit research to identify securitiesmost likely to migrate to investmentgrade, ahead of a rating agencyupgrade
▪ Multi-faceted risk management includesstress testing under various economicassumptions and avoids securities witha high probability of default and lowexpected recovery from default losses
PORTFOLIO FITThe fund can complement investment-grade credit exposure, providing attractiveincome and total-return potential for morerisk-tolerant investors.
FUND NASDAQ SYMBOLS
A Shares CHYDXC Shares CCHYX
I Shares CIHYXR Shares CHYRX
FUND CUSIP NUMBERS
A Shares 128119815C Shares 128119799
I Shares 128119781R Shares 128119377
www.calamos.com 49
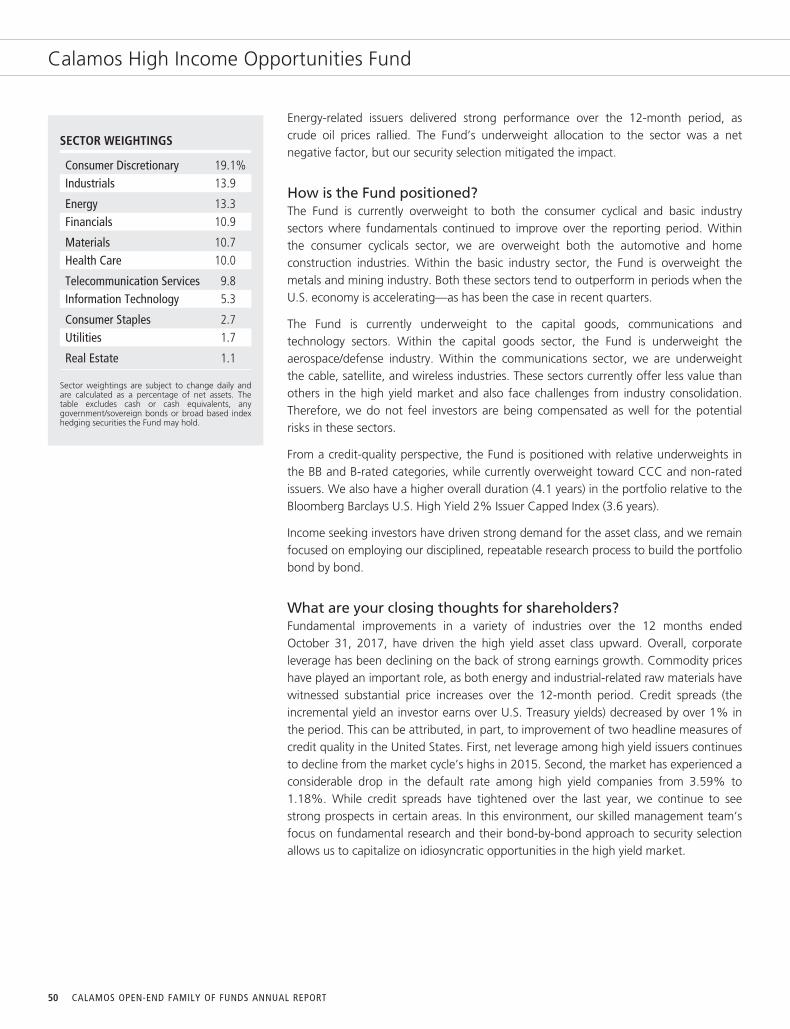
Calamos High Income Opportunities Fund
SECTOR WEIGHTINGS
Consumer Discretionary 19.1%Industrials 13.9
Energy 13.3Financials 10.9
Materials 10.7Health Care 10.0
Telecommunication Services 9.8Information Technology 5.3
Consumer Staples 2.7Utilities 1.7
Real Estate 1.1
Sector weightings are subject to change daily andare calculated as a percentage of net assets. Thetable excludes cash or cash equivalents, anygovernment/sovereign bonds or broad based indexhedging securities the Fund may hold.
Energy-related issuers delivered strong performance over the 12-month period, ascrude oil prices rallied. The Fund’s underweight allocation to the sector was a netnegative factor, but our security selection mitigated the impact.
How is the Fund positioned?The Fund is currently overweight to both the consumer cyclical and basic industrysectors where fundamentals continued to improve over the reporting period. Withinthe consumer cyclicals sector, we are overweight both the automotive and homeconstruction industries. Within the basic industry sector, the Fund is overweight themetals and mining industry. Both these sectors tend to outperform in periods when theU.S. economy is accelerating—as has been the case in recent quarters.
The Fund is currently underweight to the capital goods, communications andtechnology sectors. Within the capital goods sector, the Fund is underweight theaerospace/defense industry. Within the communications sector, we are underweightthe cable, satellite, and wireless industries. These sectors currently offer less value thanothers in the high yield market and also face challenges from industry consolidation.Therefore, we do not feel investors are being compensated as well for the potentialrisks in these sectors.
From a credit-quality perspective, the Fund is positioned with relative underweights inthe BB and B-rated categories, while currently overweight toward CCC and non-ratedissuers. We also have a higher overall duration (4.1 years) in the portfolio relative to theBloomberg Barclays U.S. High Yield 2% Issuer Capped Index (3.6 years).
Income seeking investors have driven strong demand for the asset class, and we remainfocused on employing our disciplined, repeatable research process to build the portfoliobond by bond.
What are your closing thoughts for shareholders?Fundamental improvements in a variety of industries over the 12 months endedOctober 31, 2017, have driven the high yield asset class upward. Overall, corporateleverage has been declining on the back of strong earnings growth. Commodity priceshave played an important role, as both energy and industrial-related raw materials havewitnessed substantial price increases over the 12-month period. Credit spreads (theincremental yield an investor earns over U.S. Treasury yields) decreased by over 1% inthe period. This can be attributed, in part, to improvement of two headline measures ofcredit quality in the United States. First, net leverage among high yield issuers continuesto decline from the market cycle’s highs in 2015. Second, the market has experienced aconsiderable drop in the default rate among high yield companies from 3.59% to1.18%. While credit spreads have tightened over the last year, we continue to seestrong prospects in certain areas. In this environment, our skilled management team’sfocus on fundamental research and their bond-by-bond approach to security selectionallows us to capitalize on idiosyncratic opportunities in the high yield market.
50 CALAMOS OPEN-END FAMILY OF FUNDS ANNUAL REPORT
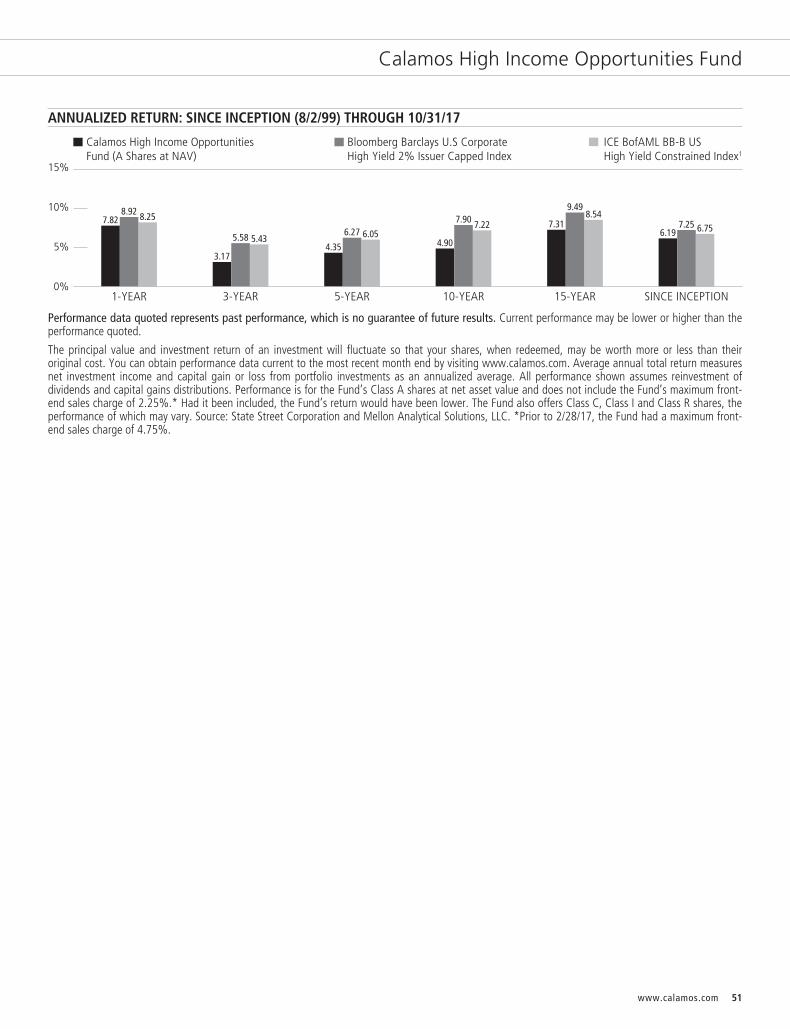
Calamos High Income Opportunities Fund
ANNUALIZED RETURN: SINCE INCEPTION (8/2/99) THROUGH 10/31/17
0%
15%
10%
5%
SINCE INCEPTION15-YEAR10-YEAR5-YEAR3-YEAR1-YEAR
Calamos High Income Opportunities Fund (A Shares at NAV)
ICE BofAML BB-B US High Yield Constrained Index1
Bloomberg Barclays U.S Corporate High Yield 2% Issuer Capped Index
7.82 8.258.92
3.17
5.435.584.35
6.056.274.90
7.227.90 7.318.54
9.49
6.19 6.757.25
Performance data quoted represents past performance, which is no guarantee of future results. Current performance may be lower or higher than theperformance quoted.
The principal value and investment return of an investment will fluctuate so that your shares, when redeemed, may be worth more or less than theiroriginal cost. You can obtain performance data current to the most recent month end by visiting www.calamos.com. Average annual total return measuresnet investment income and capital gain or loss from portfolio investments as an annualized average. All performance shown assumes reinvestment ofdividends and capital gains distributions. Performance is for the Fund’s Class A shares at net asset value and does not include the Fund’s maximum front-end sales charge of 2.25%.* Had it been included, the Fund’s return would have been lower. The Fund also offers Class C, Class I and Class R shares, theperformance of which may vary. Source: State Street Corporation and Mellon Analytical Solutions, LLC. *Prior to 2/28/17, the Fund had a maximum front-end sales charge of 4.75%.
www.calamos.com 51
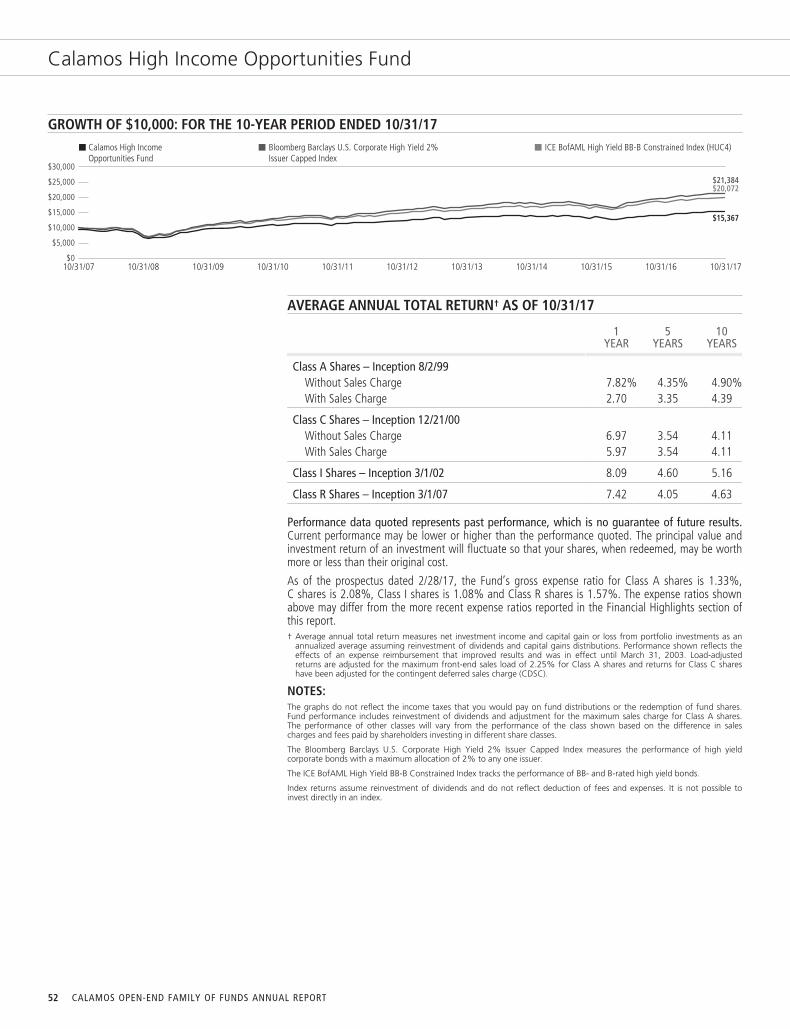
Calamos High Income Opportunities Fund
GROWTH OF $10,000: FOR THE 10-YEAR PERIOD ENDED 10/31/17
10/31/1710/31/07
Calamos High IncomeOpportunities Fund
ICE BofAML High Yield BB-B Constrained Index (HUC4)Bloomberg Barclays U.S. Corporate High Yield 2%Issuer Capped Index
$0
$5,000
$10,000
$15,000
$20,000
$25,000
$30,000
$20,072$21,384
$15,367
10/31/08 10/31/09 10/31/10 10/31/11 10/31/12 10/31/13 10/31/14 10/31/15 10/31/16
AVERAGE ANNUAL TOTAL RETURN† AS OF 10/31/17
1YEAR
5YEARS
10YEARS
Class A Shares – Inception 8/2/99Without Sales Charge 7.82% 4.35% 4.90%With Sales Charge 2.70 3.35 4.39
Class C Shares – Inception 12/21/00Without Sales Charge 6.97 3.54 4.11With Sales Charge 5.97 3.54 4.11
Class I Shares – Inception 3/1/02 8.09 4.60 5.16
Class R Shares – Inception 3/1/07 7.42 4.05 4.63
Performance data quoted represents past performance, which is no guarantee of future results.Current performance may be lower or higher than the performance quoted. The principal value andinvestment return of an investment will fluctuate so that your shares, when redeemed, may be worthmore or less than their original cost.
As of the prospectus dated 2/28/17, the Fund’s gross expense ratio for Class A shares is 1.33%,C shares is 2.08%, Class I shares is 1.08% and Class R shares is 1.57%. The expense ratios shownabove may differ from the more recent expense ratios reported in the Financial Highlights section ofthis report.† Average annual total return measures net investment income and capital gain or loss from portfolio investments as an
annualized average assuming reinvestment of dividends and capital gains distributions. Performance shown reflects theeffects of an expense reimbursement that improved results and was in effect until March 31, 2003. Load-adjustedreturns are adjusted for the maximum front-end sales load of 2.25% for Class A shares and returns for Class C shareshave been adjusted for the contingent deferred sales charge (CDSC).
NOTES:The graphs do not reflect the income taxes that you would pay on fund distributions or the redemption of fund shares.Fund performance includes reinvestment of dividends and adjustment for the maximum sales charge for Class A shares.The performance of other classes will vary from the performance of the class shown based on the difference in salescharges and fees paid by shareholders investing in different share classes.
The Bloomberg Barclays U.S. Corporate High Yield 2% Issuer Capped Index measures the performance of high yieldcorporate bonds with a maximum allocation of 2% to any one issuer.
The ICE BofAML High Yield BB-B Constrained Index tracks the performance of BB- and B-rated high yield bonds.
Index returns assume reinvestment of dividends and do not reflect deduction of fees and expenses. It is not possible toinvest directly in an index.
52 CALAMOS OPEN-END FAMILY OF FUNDS ANNUAL REPORT

Calamos Market Neutral Income Fund
CALAMOS MARKET NEUTRAL INCOME FUNDINVESTMENT TEAM DISCUSSION
How has the Fund performed?For the 12-month period ended October 31, 2017, the Fund returned 4.74% (Class Ashares at net asset value) versus a 1.05% increase for the Bloomberg Barclays U.S.Government/Credit Bond Index and a 0.67% return for the Citigroup 30-Day U.S.Treasury Bill Index. For both the 5-year and 10-year periods as of October 31, 2017, theFund’s A shares return ranked in the 15th percentile and 16th percentile, respectively,in the Morningstar Market Neutral category peer group.* Launched more than 25years ago, the strategy is one of the first liquid alternative mutual funds and blends twomain strategies, convertible arbitrage and covered call writing. In addition to offeringan attractive historical risk/reward profile, the Fund may enhance long-term portfoliodiversification potential, especially versus fixed income securities.
Both strategies utilized in the Fund, convertible arbitrage and covered call writing,contributed positively to performance during a period that included rising interest rates.Since its inception on September 4, 1990, the Fund gained 6.32% on an annualizedbasis (Class A shares at net asset value). For the same period, the Bloomberg BarclaysU.S. Government/Credit Bond Index gained 6.17% while the Citigroup 30-DayU.S. Treasury bill Index returned 2.54%.
What factors influenced performance?The Convertible Arbitrage and Covered Call Writing strategies of the Market NeutralIncome Fund performed positively during the reporting period and contributed to theoverall Fund Return.
Volatility declined during the period. The CBOE Volatility Index (VIX) declined from17.06 at the beginning of the period to 10.18. With the exception of the first few daysof the period surrounding the U.S. Presidential election and short bouts brought on byNorth Korean weapons testing, volatility traded significantly below its long-termaverage of 19.42 during the period. Lower overall volatility muted the Fund’s ability togenerate results from convertible arbitrage rebalancing and call option premiumcapture. On the other hand, put protection was relatively inexpensive which worked tothe Fund’s advantage.
Elevated option skew was persistent during the period. The Credit Suisse “FearBarometer” Index, an index that compares the relative value of calls versus puts,finished the reporting period at 33.07. This level was well above the 20.28 historicalaverage of the Fear Barometer and indicated that calls were relatively inexpensivecompared to puts given the low interest rate environment. While the option skewpresented the challenge of collecting narrower premium capture than historically, italso presented opportunities to use call and put spreads.
* Data is as of 10/31/17. Morningstar category percentile ranking is based on annualized total return forthe 5-year and 10-year periods. Calamos Market Neutral Income Fund Class A shares were in the 38th,22nd, 15th, and 16th percentiles of 153, 121, 84 and 43 funds for the 1-year, 3-year, 5-year and10-year periods, respectively, for the Morningstar Market Neutral category.
† Skew describes asymmetry from the normal distribution in a set of statistical data.
OVERVIEWThe fund’s core market strategies includecovered call writing and convertiblearbitrage. Together, these strategiesintend to provide the fund with anenhanced potential for risk-managedreturns due to their differing responses tovolatility.
KEY FEATURES▪ One of the first alternative mutual funds
capitalizes on more than three decadesof experience in the convertible space
▪ Lower correlation with most fixedincome benchmarks provides a meansto dampen volatility
▪ Risk-management focus blends strat-egies to achieve the most appropriaterisk/reward profile
PORTFOLIO FITThe fund may provide potentialdiversification, particularly in a low-interest-rate environment.
FUND NASDAQ SYMBOLS
A Shares CVSIXC Shares CVSCX
I Shares CMNIXR Shares CVSRX
FUND CUSIP NUMBERS
A Shares 128119203C Shares 128119849
I Shares 128119880R Shares 128119351
www.calamos.com 53

Calamos Market Neutral Income Fund
SECTOR WEIGHTINGS
Information Technology 36.6%Consumer Discretionary 16.5
Health Care 13.5Financials 9.0
Industrials 7.3Energy 4.6
Consumer Staples 4.1Telecommunication Services 3.6
Real Estate 2.6Materials 2.6
Utilities 2.2Other 0.8
Sector weightings are subject to change daily andare calculated as a percentage of net assets. Thetable excludes cash or cash equivalents, anygovernment/sovereign bonds or broad based indexhedging securities the Fund may hold.
During the period, the Federal Reserve raised the fed funds rate by 25 basis points onthree occasions up to 1.25%. This was supportive to the interest carry on ourconvertible arbitrage short equity positions.
According to JPMorgan, high yield credit spreads contracted 142 basis points duringthe period to 408 basis points above Treasuries. Narrower spreads were supportive tothe convertible arbitrage portion of the portfolio, as the bond portion of the convertiblebecame more valuable. Narrowing spreads also more than offset rising interest ratesduring the period. Three and five-year Treasury yields moved 45 and 50 basis pointshigher to 1.45% and 1.84%, respectively.
How is the Fund positioned?At the end of the reporting period, the Fund had roughly equal allocations betweenthe convertible arbitrage (52.6%) and covered call writing (47.4%) strategies. Ouroutlook projects similar though complementary risk-adjusted returns going forward,which accounts for this strategy parity. Given the elevated option skew discussedabove, we have found call and put spreads to be very valuable tools. By using slightlycloser-to-the-money calls, buying out-of-the-money calls, and adding near-the-moneyput spreads, we are able to construct a more effective hedge that still has a delta andprofile similar to our historical hedge.
What are your closing thoughts for Fund shareholders?While VIX volatility has been historically low, economic sector and single name volatilityhas not been as depressed, and we have been able to benefit from volatility in ourconvertible arbitrage strategy. Volatility in the market may increase at some point in thefuture stemming from a variety of potential sources. Post-election euphoria has waneda year out in a politically polarized Washington. Geopolitical events surrounding Syria,ISIS, North Korea and even Spain may also potentially disrupt markets.
After a prolonged period of historically low interest rates, the Fed has been increasingshort-term rates, and longer-term rates are poised to move higher. While accommodativemonetary policies and purchase programs from other global central banks may preventsoaring U.S. interest rates, the interest rate environment is likely to see fluctuation amidspeculation over the direction and magnitude of interest rates movements. Within assetallocation, we see opportunities for investors in the Fund. When used within the fixedincome allocation, the Fund has historically provided bond-like returns with bond-like riskwithout having bond-like interest rate sensitivity. Additionally, as the Fund has had lowercorrelations to other asset classes, portfolios should benefit as the Fund can providestability in a market environment that turns increasingly volatile.
54 CALAMOS OPEN-END FAMILY OF FUNDS ANNUAL REPORT
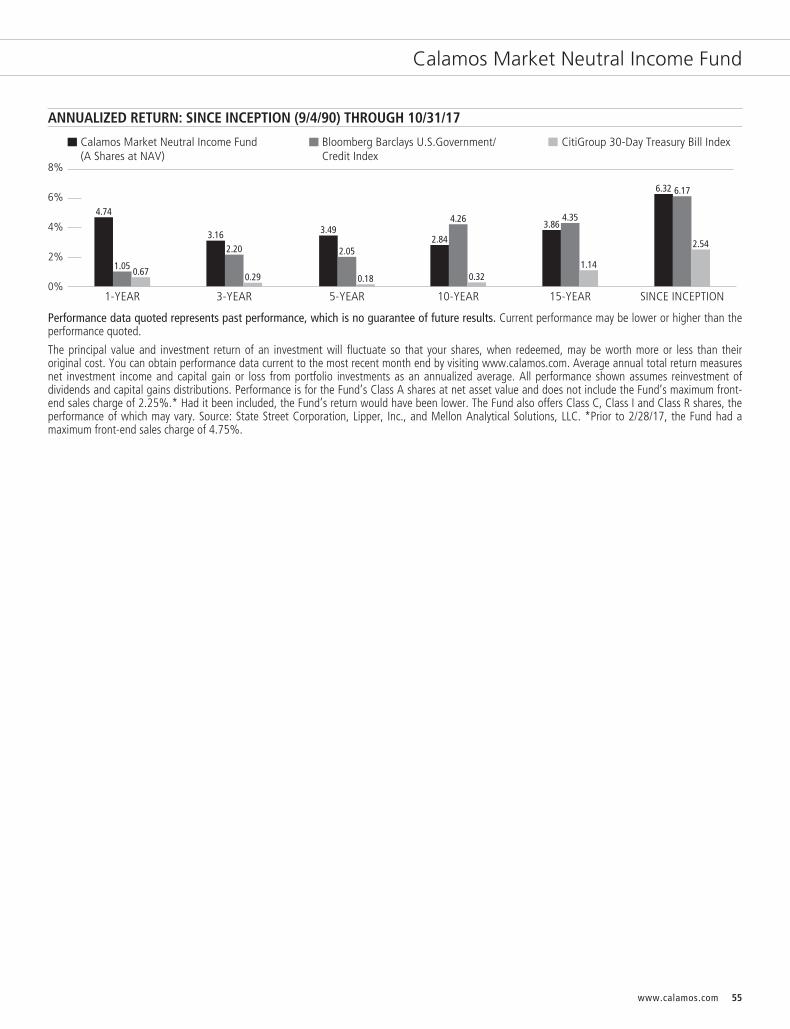
Calamos Market Neutral Income Fund
ANNUALIZED RETURN: SINCE INCEPTION (9/4/90) THROUGH 10/31/17
0%
8%
4%
6%
2%
10-YEAR 15-YEAR5-YEAR3-YEAR1-YEAR SINCE INCEPTION
3.49
2.05
0.18
2.84
4.26
0.32
6.32 6.17
2.54
3.864.35
1.14
4.74
1.050.67
3.162.20
0.29
Calamos Market Neutral Income Fund(A Shares at NAV)
CitiGroup 30-Day Treasury Bill IndexBloomberg Barclays U.S.Government/Credit Index
Performance data quoted represents past performance, which is no guarantee of future results. Current performance may be lower or higher than theperformance quoted.
The principal value and investment return of an investment will fluctuate so that your shares, when redeemed, may be worth more or less than theiroriginal cost. You can obtain performance data current to the most recent month end by visiting www.calamos.com. Average annual total return measuresnet investment income and capital gain or loss from portfolio investments as an annualized average. All performance shown assumes reinvestment ofdividends and capital gains distributions. Performance is for the Fund’s Class A shares at net asset value and does not include the Fund’s maximum front-end sales charge of 2.25%.* Had it been included, the Fund’s return would have been lower. The Fund also offers Class C, Class I and Class R shares, theperformance of which may vary. Source: State Street Corporation, Lipper, Inc., and Mellon Analytical Solutions, LLC. *Prior to 2/28/17, the Fund had amaximum front-end sales charge of 4.75%.
www.calamos.com 55
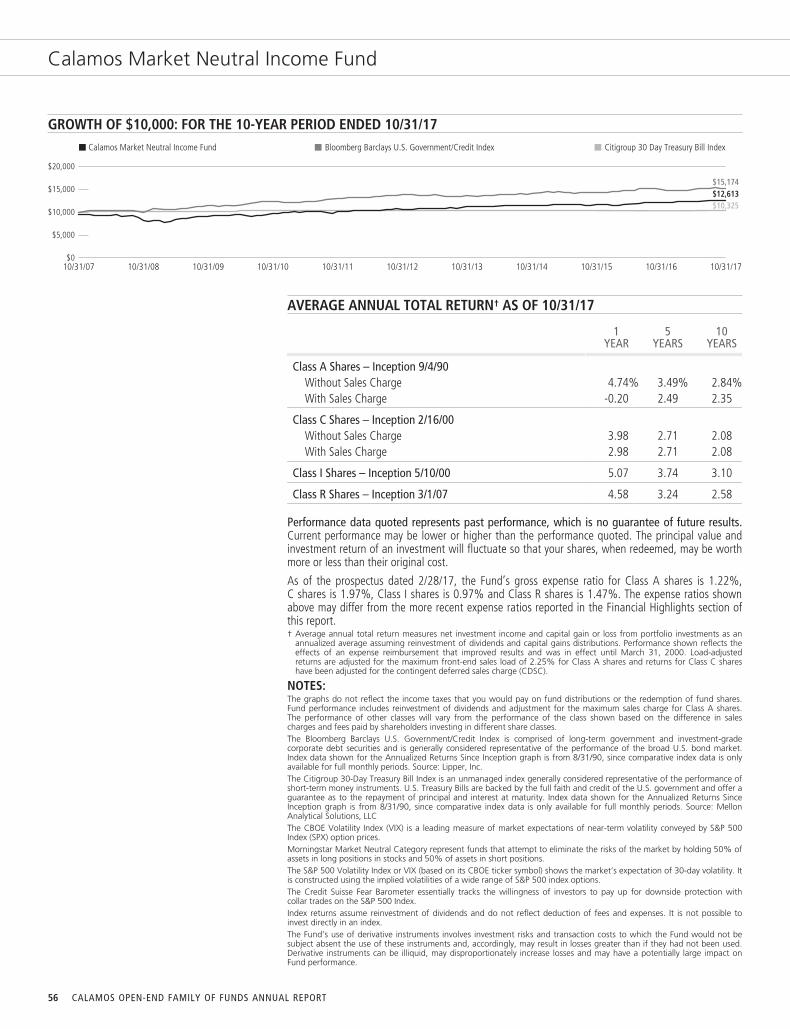
Calamos Market Neutral Income Fund
GROWTH OF $10,000: FOR THE 10-YEAR PERIOD ENDED 10/31/17
$0
$5,000
$10,000
$15,000
$20,000
$10,325$12,613$15,174
Calamos Market Neutral Income Fund Citigroup 30 Day Treasury Bill IndexBloomberg Barclays U.S. Government/Credit Index
10/31/07 10/31/1710/31/08 10/31/09 10/31/10 10/31/11 10/31/12 10/31/13 10/31/14 10/31/15 10/31/16
AVERAGE ANNUAL TOTAL RETURN† AS OF 10/31/17
1YEAR
5YEARS
10YEARS
Class A Shares – Inception 9/4/90Without Sales Charge 4.74% 3.49% 2.84%With Sales Charge -0.20 2.49 2.35
Class C Shares – Inception 2/16/00Without Sales Charge 3.98 2.71 2.08With Sales Charge 2.98 2.71 2.08
Class I Shares – Inception 5/10/00 5.07 3.74 3.10
Class R Shares – Inception 3/1/07 4.58 3.24 2.58
Performance data quoted represents past performance, which is no guarantee of future results.Current performance may be lower or higher than the performance quoted. The principal value andinvestment return of an investment will fluctuate so that your shares, when redeemed, may be worthmore or less than their original cost.
As of the prospectus dated 2/28/17, the Fund’s gross expense ratio for Class A shares is 1.22%,C shares is 1.97%, Class I shares is 0.97% and Class R shares is 1.47%. The expense ratios shownabove may differ from the more recent expense ratios reported in the Financial Highlights section ofthis report.† Average annual total return measures net investment income and capital gain or loss from portfolio investments as an
annualized average assuming reinvestment of dividends and capital gains distributions. Performance shown reflects theeffects of an expense reimbursement that improved results and was in effect until March 31, 2000. Load-adjustedreturns are adjusted for the maximum front-end sales load of 2.25% for Class A shares and returns for Class C shareshave been adjusted for the contingent deferred sales charge (CDSC).
NOTES:The graphs do not reflect the income taxes that you would pay on fund distributions or the redemption of fund shares.Fund performance includes reinvestment of dividends and adjustment for the maximum sales charge for Class A shares.The performance of other classes will vary from the performance of the class shown based on the difference in salescharges and fees paid by shareholders investing in different share classes.The Bloomberg Barclays U.S. Government/Credit Index is comprised of long-term government and investment-gradecorporate debt securities and is generally considered representative of the performance of the broad U.S. bond market.Index data shown for the Annualized Returns Since Inception graph is from 8/31/90, since comparative index data is onlyavailable for full monthly periods. Source: Lipper, Inc.The Citigroup 30-Day Treasury Bill Index is an unmanaged index generally considered representative of the performance ofshort-term money instruments. U.S. Treasury Bills are backed by the full faith and credit of the U.S. government and offer aguarantee as to the repayment of principal and interest at maturity. Index data shown for the Annualized Returns SinceInception graph is from 8/31/90, since comparative index data is only available for full monthly periods. Source: MellonAnalytical Solutions, LLCThe CBOE Volatility Index (VIX) is a leading measure of market expectations of near-term volatility conveyed by S&P 500Index (SPX) option prices.Morningstar Market Neutral Category represent funds that attempt to eliminate the risks of the market by holding 50% ofassets in long positions in stocks and 50% of assets in short positions.The S&P 500 Volatility Index or VIX (based on its CBOE ticker symbol) shows the market’s expectation of 30-day volatility. Itis constructed using the implied volatilities of a wide range of S&P 500 index options.The Credit Suisse Fear Barometer essentially tracks the willingness of investors to pay up for downside protection withcollar trades on the S&P 500 Index.Index returns assume reinvestment of dividends and do not reflect deduction of fees and expenses. It is not possible toinvest directly in an index.The Fund’s use of derivative instruments involves investment risks and transaction costs to which the Fund would not besubject absent the use of these instruments and, accordingly, may result in losses greater than if they had not been used.Derivative instruments can be illiquid, may disproportionately increase losses and may have a potentially large impact onFund performance.
56 CALAMOS OPEN-END FAMILY OF FUNDS ANNUAL REPORT
Calamos Hedged Equity Income Fund
CALAMOS HEDGED EQUITY INCOME FUNDINVESTMENT TEAM DISCUSSION
How has the Fund performed?For the 12-month period ended October 31, 2017, the Fund gained 8.77% (Class Ashares at net asset value) versus the S&P 500 Index gain of 23.63% and the BloombergBarclays U.S. Aggregate Bond Index return of 0.90%. Since its inception on December 31,2014, the Fund gained 4.25% on an annualized basis (Class A shares at net asset value),versus 10.50% for the S&P 500 Index and 2.25% for the Bloomberg Barclays U.S.Aggregate Bond Index. In this strategy, we utilize covered call writing in which we sell calloptions for income and buy a basket of equities that represents the broad stock market.The selling prices of call options tend to be higher when volatility is higher.
What factors influenced performance?The equity markets rallied during the annual reporting period following DonaldTrump’s largely unexpected victory. While Congress has been challenged to implementitems on the president’s election platform, investors remained hopeful that tax reform,reduced regulation, and increased infrastructure spending (if implemented) couldprovide an economic boost. Improved economic data and higher corporate earningsalso supported bullish investor sentiment.
Volatility declined during the period. The CBOE Volatility Index (VIX) declined from17.06 at the beginning of the period to 10.18. With the exception of the first few daysof the period surrounding the U.S. Presidential election and short bouts brought on byNorth Korean weapons testing, volatility traded significantly below its long-termaverage of 19.42 during the period. Lower overall volatility muted the Fund’s ability togenerate results from call option premium capture. On the other hand, put protectionwas relatively inexpensive, which worked to the Fund’s advantage.
Elevated option skew was persistent during the period. The Credit Suisse “FearBarometer” Index, an index that compares the relative value of calls versus puts,finished the reporting period at 33.07. This level was well above the 20.28 historicalaverage of the index and indicated that calls were relatively inexpensive compared toputs given the low interest rate environment. While the option skew presented thechallenge of collecting narrower premium capture than historically, it also providedopportunities to use call and put spreads.
How is the fund positioned?Option Positioning. The current skew in the options market has presentedopportunites to utilize call and put spreads, which have provided positive results interms of the current portfolio’s risk/reward (skew). This positioning has providedadditional protection over and above our typical 40–50% put notional minimum andadded upside participation potential. Our call spread positioning involves writing callsthat are closer-to-the-money while at the same time purchasing out-of-the-moneycalls. In addition to buying protective puts, we are using put spreads to improve thedownside protection. We have sold deep out-of-the-money puts and utilized thepremium to purchase closer-to-the-money puts. We have frequently adjusted the calland put quantities to maintain a balanced risk/reward.
OVERVIEWThe fund is an alternative strategy thatinvests in equities and sells options withthe aim of achieving the total return ofequity markets with lower volatility. Itutilizes a covered call strategy, whichinvolves investing in a diversified portfolioof equities while using options to generateincome and manage risk.
KEY FEATURES▪ Draws upon almost a decade of
experience in covered call writing andtwo decades of equity investing
▪ Option-based risk-management strategyattempts to lower the volatility of equityinvestments
▪ An alternative approach potentiallyprovides upside participation in equitymarkets while limiting downsideexposure
PORTFOLIO FITThe fund provides an alternative strategythat can generate income and provideequity exposure with potentially lowervolatility than equities.
FUND NASDAQ SYMBOLS
A Shares CAHEXC Shares CCHEX
I Shares CIHEX
FUND CUSIP NUMBERS
A Shares 128120698C Shares 128120680
I Shares 128120672
www.calamos.com 57
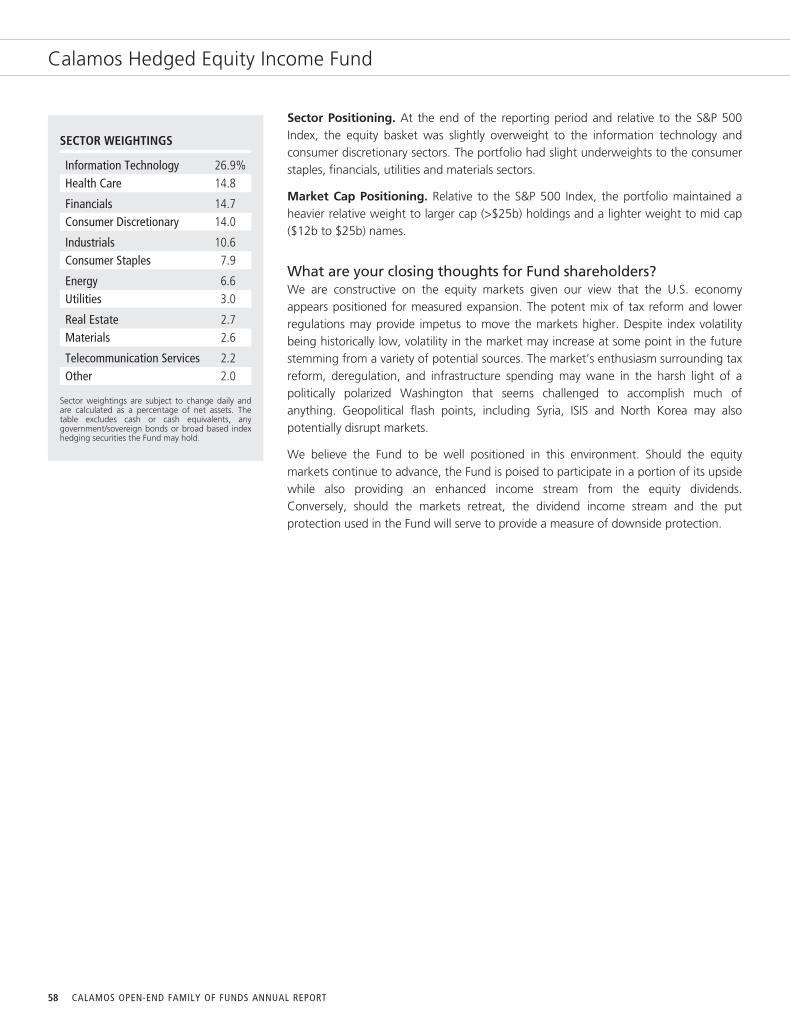
Calamos Hedged Equity Income Fund
SECTOR WEIGHTINGS
Information Technology 26.9%Health Care 14.8
Financials 14.7Consumer Discretionary 14.0
Industrials 10.6Consumer Staples 7.9
Energy 6.6Utilities 3.0
Real Estate 2.7Materials 2.6
Telecommunication Services 2.2Other 2.0
Sector weightings are subject to change daily andare calculated as a percentage of net assets. Thetable excludes cash or cash equivalents, anygovernment/sovereign bonds or broad based indexhedging securities the Fund may hold.
Sector Positioning. At the end of the reporting period and relative to the S&P 500Index, the equity basket was slightly overweight to the information technology andconsumer discretionary sectors. The portfolio had slight underweights to the consumerstaples, financials, utilities and materials sectors.
Market Cap Positioning. Relative to the S&P 500 Index, the portfolio maintained aheavier relative weight to larger cap (>$25b) holdings and a lighter weight to mid cap($12b to $25b) names.
What are your closing thoughts for Fund shareholders?We are constructive on the equity markets given our view that the U.S. economyappears positioned for measured expansion. The potent mix of tax reform and lowerregulations may provide impetus to move the markets higher. Despite index volatilitybeing historically low, volatility in the market may increase at some point in the futurestemming from a variety of potential sources. The market’s enthusiasm surrounding taxreform, deregulation, and infrastructure spending may wane in the harsh light of apolitically polarized Washington that seems challenged to accomplish much ofanything. Geopolitical flash points, including Syria, ISIS and North Korea may alsopotentially disrupt markets.
We believe the Fund to be well positioned in this environment. Should the equitymarkets continue to advance, the Fund is poised to participate in a portion of its upsidewhile also providing an enhanced income stream from the equity dividends.Conversely, should the markets retreat, the dividend income stream and the putprotection used in the Fund will serve to provide a measure of downside protection.
58 CALAMOS OPEN-END FAMILY OF FUNDS ANNUAL REPORT

Calamos Hedged Equity Income Fund
GROWTH OF $10,000: SINCE INCEPTION (12/31/14) THROUGH 10/31/17
4/30/151/31/15 7/31/15 10/31/15 1/31/16 4/30/16 10/31/16 1/31/177/31/16 4/30/17 7/31/17 10/31/17
Bloomberg Barclays U.S. Aggregate Bond IndexCalamos Hedged Equity Income Fund S&P 500 Index
$0
$5,000
$10,000
$15,000
$20,000
$13,270
$10,698
$10,652
12/31/14
AVERAGE ANNUAL TOTAL RETURN† AS OF 10/31/17
1YEAR
SINCEINCEPTION
Class A Shares – Inception 12/31/2014Without Sales Charge 8.77% 4.25%With Sales Charge 3.60 2.48
Class C Shares – Inception 12/31/2014Without Sales Charge 8.09 3.50With Sales Charge 7.09 3.50
Class I Shares – Inception 12/31/2014 9.12 4.54
Performance data quoted represents past performance, which is no guarantee of future results.Current performance may be lower or higher than the performance quoted. The principal value andinvestment return of an investment will fluctuate so that your shares, when redeemed, may be worthmore or less than their original cost.
As of the prospectus dated 2/28/17, the Fund’s gross expense ratio for Class A shares is 2.04%,Class C shares is 2.08% and Class I shares is 1.82%. The Fund’s investment advisor has contractuallyagreed to reimburse Fund expenses through March 1, 2019, to the extent necessary so that TotalAnnual Fund Operating Expenses (excluding taxes, interest, short interest, short dividend expenses,brokerage commissions, acquired fund fees and expenses, and extraordinary expenses, if any) ofClass A, Class C and Class I shares are limited to 1.23%, 1.98%, 0.98% of average net assets,respectively. The expense ratios shown above may differ from the more recent expense ratiosreported in the Financial Highlights section of this report.† Average annual total return measures net investment income and capital gain or loss from portfolio investments as an
annualized average assuming reinvestment of dividends and capital gains distributions. Load-adjusted returns areadjusted for the maximum front-end sales load of 4.75% for Class A shares. Returns for Class C shares have beenadjusted for the contingent deferred sales charge (CDSC).
NOTES:The S&P 500 Index is an unmanaged index generally considered representative of the U.S. stock market.
The Bloomberg Barclays U.S. Aggregate Bond Index is considered generally representative of the investment-grade bondmarket. Index data shown for the Since Inception Growth of $10,000 graph is from 6/30/07, since comparative index datais only available for full monthly periods. Source: Lipper, Inc.
The CBOE Volatility Index (VIX) is a leading measure of market expectations of near-term volatility conveyed by S&P 500Index (SPX) option prices.
The Credit Suisse Fear Barometer essentially tracks the willingness of investors to pay up for downside protection withcollar trades on the S&P 500 Index.
Index returns assume reinvestment of dividends and do not reflect deduction of fees and expenses. It is not possible toinvest directly in an index.
The Fund’s use of derivative instruments involves investment risks and transaction costs to which the Fund would not besubject absent the use of these instruments and, accordingly, may result in losses greater than if they had not been used.Derivative instruments can be illiquid, may disproportionately increase losses and may have a potentially large impact onFund performance.
www.calamos.com 59
Calamos Phineus Long/Short Fund
FUND OVERVIEWThe fund seeks strong risk-adjusted andabsolute returns across the global equityuniverse. The fund uses a global long/short strategy to invest in publicly listedequity securities.
KEY FEATURES▪ Fundamental global approach blends
top-down and bottom-up considerations
▪ Flexible asset allocation allows for allinvestment styles, market caps andgeographic regions depending on themarket environment
▪ Comprehensive approach assessesstock, industry, style, country andmarket factors
▪ Knowledge-based industry concen-tration includes technology,communications, media, financials andhealth care
PORTFOLIO FITThe fund seeks to provide strong risk-adjusted returns via an alternative solutionthat complements and diversifies a globalor U.S. equity allocation.
FUND NASDAQ SYMBOLS
A Shares CPLSXC Shares CPCLX
I Shares CPLIX
FUND CUSIP NUMBERS
A Shares 128120656C Shares 128120649
I Shares 128120631
CALAMOS PHINEUS LONG/SHORT FUNDINVESTMENT TEAM DISCUSSION
What is the essence of the investment approach?Through a global long/short structure, the Fund invests in publicly listed equitysecurities. Components of the strategy include:
A fundamental global approach that blends top-down and bottom-upconsiderations. Company analysis is integrated with industry, thematic andmacro research.
An inclusive framework for identifying potential returns and associatedrisks. The framework accounts for company, industry, style, country andmarket factors.
Flexible capital allocation allowing for all investment styles, market capsand geographic regions. The investment universe is global, liquid andscalable. Exposure levels and investment styles depend upon marketconditions and the economic cycle.
How has the Fund performed?For the 12-month period ended October 31, 2017, the Fund increased 15.46%(Class A shares at net asset value). The S&P 500 Index rose 23.63% and the MSCIWorld Index climbed 23.46% over the same period.
Equity markets enjoyed a respectable start to 2017, extending the prior year’s healthyperformance. While the U.S. election and corollary hopes for tax reform, infrastructurespending and less regulation have undoubtedly supported this rally, this latest leg ofthe bull market began over a year ago—long before November 2016—whenU.S. corporate and consumer surveys first hinted that the global profit recession wasnearing its end. Global markets are finally being buoyed by global synchronization ascorporate profits resume and reflation becomes prevalent.
Since its inception on May 1, 2002, the Fund has returned 11.35% on an annualizedbasis (Class A shares at net asset value) and thus, markedly outperformed both theS&P 500 and MSCI World Indices, which returned 7.96% and 7.58%, respectively, overthe same period.
What contributed to performance over the one-year periodunder review?The largest contributors arose from long investments in financials and industrialssectors, while short exposure in consumer staples and health care hinderedperformance. Notable contributors during the period included long positions in Bank ofAmerica and JPMorgan Chase (financials), D.R. Horton (consumer discretionary) andPayPal Inc. (information technology). Detractors included short positions in Colgate-Palmolive* (consumer staples) and the Nasdaq Biotech Index* (health care), as well aslong positions in SLM Corp. (financials) and NCR Corporation (information technology).
* Colgate-Palmolive and Nasdaq Biotech Index were sold prior to the end date of this report.
60 CALAMOS OPEN-END FAMILY OF FUNDS ANNUAL REPORT
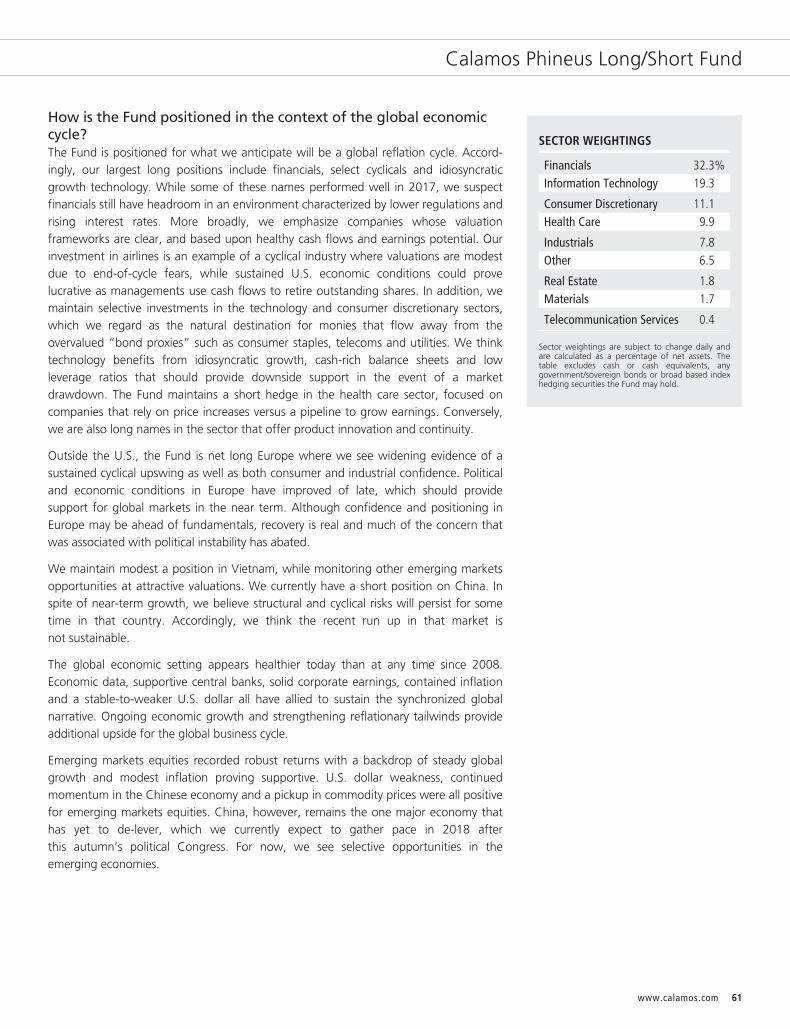
Calamos Phineus Long/Short Fund
How is the Fund positioned in the context of the global economiccycle?The Fund is positioned for what we anticipate will be a global reflation cycle. Accord-ingly, our largest long positions include financials, select cyclicals and idiosyncraticgrowth technology. While some of these names performed well in 2017, we suspectfinancials still have headroom in an environment characterized by lower regulations andrising interest rates. More broadly, we emphasize companies whose valuationframeworks are clear, and based upon healthy cash flows and earnings potential. Ourinvestment in airlines is an example of a cyclical industry where valuations are modestdue to end-of-cycle fears, while sustained U.S. economic conditions could provelucrative as managements use cash flows to retire outstanding shares. In addition, wemaintain selective investments in the technology and consumer discretionary sectors,which we regard as the natural destination for monies that flow away from theovervalued “bond proxies” such as consumer staples, telecoms and utilities. We thinktechnology benefits from idiosyncratic growth, cash-rich balance sheets and lowleverage ratios that should provide downside support in the event of a marketdrawdown. The Fund maintains a short hedge in the health care sector, focused oncompanies that rely on price increases versus a pipeline to grow earnings. Conversely,we are also long names in the sector that offer product innovation and continuity.
Outside the U.S., the Fund is net long Europe where we see widening evidence of asustained cyclical upswing as well as both consumer and industrial confidence. Politicaland economic conditions in Europe have improved of late, which should providesupport for global markets in the near term. Although confidence and positioning inEurope may be ahead of fundamentals, recovery is real and much of the concern thatwas associated with political instability has abated.
We maintain modest a position in Vietnam, while monitoring other emerging marketsopportunities at attractive valuations. We currently have a short position on China. Inspite of near-term growth, we believe structural and cyclical risks will persist for sometime in that country. Accordingly, we think the recent run up in that market isnot sustainable.
The global economic setting appears healthier today than at any time since 2008.Economic data, supportive central banks, solid corporate earnings, contained inflationand a stable-to-weaker U.S. dollar all have allied to sustain the synchronized globalnarrative. Ongoing economic growth and strengthening reflationary tailwinds provideadditional upside for the global business cycle.
Emerging markets equities recorded robust returns with a backdrop of steady globalgrowth and modest inflation proving supportive. U.S. dollar weakness, continuedmomentum in the Chinese economy and a pickup in commodity prices were all positivefor emerging markets equities. China, however, remains the one major economy thathas yet to de-lever, which we currently expect to gather pace in 2018 afterthis autumn’s political Congress. For now, we see selective opportunities in theemerging economies.
SECTOR WEIGHTINGS
Financials 32.3%Information Technology 19.3
Consumer Discretionary 11.1Health Care 9.9
Industrials 7.8Other 6.5
Real Estate 1.8Materials 1.7
Telecommunication Services 0.4
Sector weightings are subject to change daily andare calculated as a percentage of net assets. Thetable excludes cash or cash equivalents, anygovernment/sovereign bonds or broad based indexhedging securities the Fund may hold.
www.calamos.com 61

Calamos Phineus Long/Short Fund
What are your closing thoughts for the coming year?Although we remain optimistic going into 2018, caution may be warranted as the yearprogresses. As the U.S. expansion matures, end-of-cycle risks should be monitoredclosely. As the fed funds rate moves above the neutral real rate, it may lead todecelerating growth and rising corporate pressures later on. A flatter yield curve bymid-2018 may lead to fears that the Fed has over tightened, which could put a damperon growth. In addition, corporations will be paying higher borrowing costs onfinancing, which may also slow earnings growth.
Outside the U.S., a setback in euro zone growth, higher valuations and politicalinstability, such as the case in Spain, may eventually weigh on equities.
China’s growth may slow as its leadership moves more aggressively to restructure theeconomy and address bad debt.
While we do not believe the imminent reduction in the Fed’s balance sheet will disruptfinancial markets, quantitative tapering—by any central bank—marks a move intounchartered waters. The slowdown in the expansion of central bank balance sheets—which ballooned from $4 trillion pre-financial crisis to $17 trillion today—presents aclear challenge to investors. The slowdown, already underway, is set to enter a newphase with the Fed’s first post-QE reduction in its balance sheet.
The rotation from defensive stocks into cyclicals that was prominent through the latterpart of 2016 has gone back and forth, as the markets assessed the dynamics ofdeflation versus reflation. In our view, this pause in market leadership was based moreon concerns of fulfilling the Trump agenda rather than any deterioration in economicfundamentals. Indeed, both business and consumer confidence remain near recenthighs. Corporate managements appear inspired by the prospect of a more pro-growth,less-regulatory setting and most also acknowledge the ongoing improvement inconditions overseas. The jobless rate remains low, though inflation remains in check,which continues to mitigate the effects of interest rate movements.
We believe that global equity markets still have some room to run heading into 2018.At some point, after some Fed tightening, the market may begin to focus on reces-sionary forces. Expected increased borrowing costs through higher interest rates willlikely impact corporate financing into mid-year. Higher borrowing costs may begin tohave an impact on corporate earnings later in 2018 or into 2019.
Both consumer and corporate sentiment, as well as the markets, will continue to bebuoyed by government policy that, at a minimum, is viewed as less intrusive. Congress’ability to enact tax reform and pass legislation reducing regulation, would be especiallybeneficial for financial companies and companies with untaxed earnings held offshore.Any notable advancement along those lines could certainly prolong the move higher inthe equity markets.
62 CALAMOS OPEN-END FAMILY OF FUNDS ANNUAL REPORT
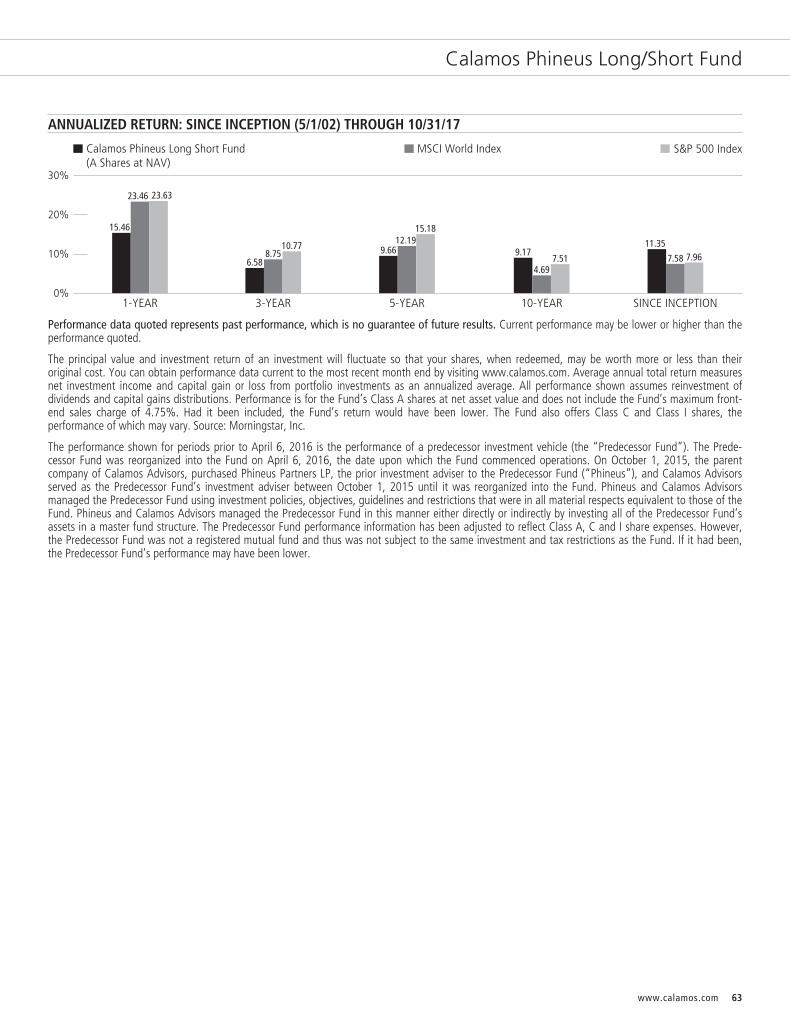
Calamos Phineus Long/Short Fund
ANNUALIZED RETURN: SINCE INCEPTION (5/1/02) THROUGH 10/31/17
0%
30%
20%
10%
SINCE INCEPTION10-YEAR5-YEAR3-YEAR1-YEAR
Calamos Phineus Long Short Fund(A Shares at NAV)
S&P 500 IndexMSCI World Index
15.46
23.46 23.63
6.588.75
10.777.51
4.69
9.17 7.967.58
11.35
15.1812.19
9.66
Performance data quoted represents past performance, which is no guarantee of future results. Current performance may be lower or higher than theperformance quoted.
The principal value and investment return of an investment will fluctuate so that your shares, when redeemed, may be worth more or less than theiroriginal cost. You can obtain performance data current to the most recent month end by visiting www.calamos.com. Average annual total return measuresnet investment income and capital gain or loss from portfolio investments as an annualized average. All performance shown assumes reinvestment ofdividends and capital gains distributions. Performance is for the Fund’s Class A shares at net asset value and does not include the Fund’s maximum front-end sales charge of 4.75%. Had it been included, the Fund’s return would have been lower. The Fund also offers Class C and Class I shares, theperformance of which may vary. Source: Morningstar, Inc.
The performance shown for periods prior to April 6, 2016 is the performance of a predecessor investment vehicle (the “Predecessor Fund”). The Prede-cessor Fund was reorganized into the Fund on April 6, 2016, the date upon which the Fund commenced operations. On October 1, 2015, the parentcompany of Calamos Advisors, purchased Phineus Partners LP, the prior investment adviser to the Predecessor Fund (“Phineus”), and Calamos Advisorsserved as the Predecessor Fund’s investment adviser between October 1, 2015 until it was reorganized into the Fund. Phineus and Calamos Advisorsmanaged the Predecessor Fund using investment policies, objectives, guidelines and restrictions that were in all material respects equivalent to those of theFund. Phineus and Calamos Advisors managed the Predecessor Fund in this manner either directly or indirectly by investing all of the Predecessor Fund’sassets in a master fund structure. The Predecessor Fund performance information has been adjusted to reflect Class A, C and I share expenses. However,the Predecessor Fund was not a registered mutual fund and thus was not subject to the same investment and tax restrictions as the Fund. If it had been,the Predecessor Fund’s performance may have been lower.
www.calamos.com 63

Calamos Phineus Long/Short Fund
GROWTH OF $10,000: FOR THE 10-YEAR PERIOD ENDED 10/31/17Calamos Phineus Long/Short Fund MSCI World Index S&P 500 Index
$0
$5,000
$10,000
$15,000
$20,000
$30,000
$25,000
$15,818
$20,638
10/31/07 10/31/08 10/31/09 10/31/10 10/31/11 10/31/12 10/31/13 10/31/14 10/31/15 10/31/16 10/31/17
AVERAGE ANNUAL TOTAL RETURN† AS OF 10/31/17
1YEAR
5YEARS
10YEARS
Class A Shares (With Predecessor) – Inception 5/1/2002Without Sales Charge 15.46% 9.66% 9.17%With Sales Charge 9.95 8.60 8.64
Class C Shares (With Predecessor) – Inception 5/1/2002Without Sales Charge 14.58 8.85 8.37With Sales Charge 13.58 8.85 8.37
Class I Shares (With Predecessor) – Inception 5/1/2002 15.70 9.95 9.46
Performance data quoted represents past performance, which is no guarantee of future results.Current performance may be lower or higher than the performance quoted. The principal value andinvestment return of an investment will fluctuate so that your shares, when redeemed, may be worthmore or less than their original cost.
As of the prospectus dated 2/28/27, the Fund’s gross expense ratio for Class A shares is 4.29%,Class C shares is 5.07% and Class I shares is 4.29%. The Fund’s investment advisor has contractuallyagreed to reimburse Fund expenses through March 31, 2019, to the extent necessary so that TotalAnnual Fund Operating Expenses (excluding taxes, interest, short interest, short dividend expenses,brokerage commissions, acquired fund fees and expenses, and extraordinary expenses, if any) ofClass A, Class C and Class I shares are 3.24%, 3.94% and 3.02%. The expense ratios shown abovemay differ from the more recent expense ratios reported in the Financial Highlights section ofthis report.† Average annual total return measures net investment income and capital gain or loss from portfolio investments as an
annualized average assuming reinvestment of dividends and capital gains distributions. Load-adjusted returns areadjusted for the maximum front-end sales load of 4.75% for Class A shares. Returns for Class C shares have beenadjusted for the contingent deferred sales charge (CDSC).
NOTES:The graph does not reflect the income taxes that you would pay on fund distributions or the redemption of fund shares.Fund performance includes reinvestment of dividends and adjustment for the maximum sales charge for Class A shares.The performance of other classes will vary from the performance of the class shown based on the difference in salescharges and fees paid by shareholders investing in different share classes.
The MSCI World Index (U.S. Dollars) is a market-capitalization weighted index composed of companies representative ofthe market structure of developed market countries in North America, Europe and the Asia/Pacific region. Since inceptiondata for the index is shown from 4/30/02 since data is only available for full monthly periods. Source: Lipper, Inc.
The S&P 500 Index is an unmanaged index generally considered representative of the U.S. stock market. Source: Lipper, Inc.
Index returns assume reinvestment of dividends and do not reflect deduction of fees and expenses. It is not possible toinvest directly in an index.
64 CALAMOS OPEN-END FAMILY OF FUNDS ANNUAL REPORT

Expense Overview
EXPENSE OVERVIEWAs a shareholder of a mutual fund, you incur two types of costs. You incur:
1) Transaction costs, including sales charges, or loads, on purchase payment and redemption fees.
2) Ongoing costs, including management fees, distribution and/or service (12b-1) fees and other fund expenses.
The examples in this report are based on an investment of $1,000 made at the beginning of the period and
held for the entire period from May 1, 2017 to October 31, 2017. It is intended to help you understand the
ongoing costs associated with investing in each mutual fund and to compare these costs with the ongoing costs
of investing in other mutual funds.
There are two parts of each Fund’s chart:
Actual
In this part of the chart, you’ll see the actual expenses you would have paid on a $1,000 investment made at
the beginning of the period and held for the entire period in each fund from May 1, 2017 to October 31, 2017,
the period covered by this report. This chart also shows the actual returns, after expenses, you would have
earned during that time. This chart can help you estimate your own expenses. For example, if you invested
$8,600 in Class A shares of the fund, simply divide $8,600 by $1,000, then multiply that result by the figure in
the Actual Expenses per $1,000 row. In this example, you would multiply 8.6 times the figure.
Hypothetical
In this part of the chart, you’ll see the hypothetical expenses you would have paid on a $1,000 investment from
May 1, 2017 to October 31, 2017, and the hypothetical returns, after expenses, you would have earned during
that time. The Securities and Exchange Commission (SEC) has established the guidelines for this chart, including
the assumed 5% annual rate of return before expenses, which is what you’ll see in the chart. Note that this
chart will not help you determine your own expenses, but will help you compare expenses of the fund you own
to the expenses of another fund since the information for that fund should be calculated using the
same assumptions.
Please note that the expenses shown in the chart are meant to highlight your ongoing costs only and do not
include any transactional costs, such as sales charges (loads), redemption fees or exchange fees. Therefore, the
second line of the chart is useful in comparing ongoing costs only and will not help you determine the relative
total costs of owning different funds. In addition, if these transaction costs were included, your costs would
have been higher.
www.calamos.com 65
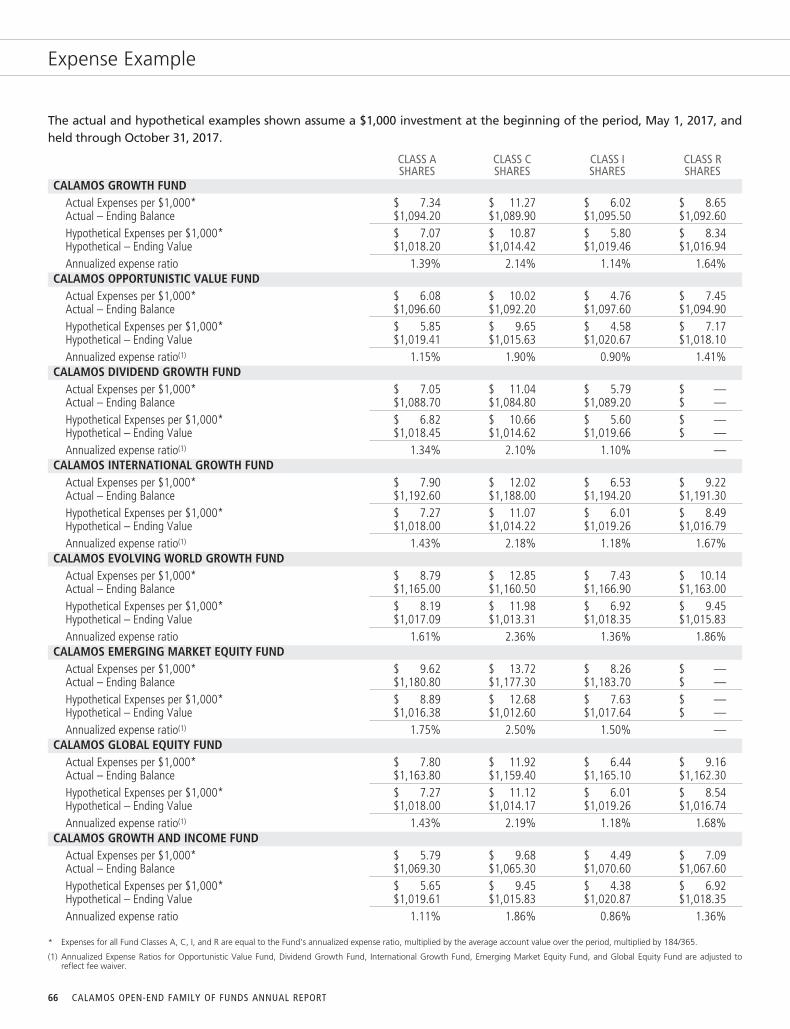
Expense Example
The actual and hypothetical examples shown assume a $1,000 investment at the beginning of the period, May 1, 2017, andheld through October 31, 2017.
CLASS ASHARES
CLASS CSHARES
CLASS ISHARES
CLASS RSHARES
CALAMOS GROWTH FUNDActual Expenses per $1,000* $ 7.34 $ 11.27 $ 6.02 $ 8.65Actual – Ending Balance $1,094.20 $1,089.90 $1,095.50 $1,092.60Hypothetical Expenses per $1,000* $ 7.07 $ 10.87 $ 5.80 $ 8.34Hypothetical – Ending Value $1,018.20 $1,014.42 $1,019.46 $1,016.94Annualized expense ratio 1.39% 2.14% 1.14% 1.64%
CALAMOS OPPORTUNISTIC VALUE FUNDActual Expenses per $1,000* $ 6.08 $ 10.02 $ 4.76 $ 7.45Actual – Ending Balance $1,096.60 $1,092.20 $1,097.60 $1,094.90Hypothetical Expenses per $1,000* $ 5.85 $ 9.65 $ 4.58 $ 7.17Hypothetical – Ending Value $1,019.41 $1,015.63 $1,020.67 $1,018.10Annualized expense ratio(1) 1.15% 1.90% 0.90% 1.41%
CALAMOS DIVIDEND GROWTH FUNDActual Expenses per $1,000* $ 7.05 $ 11.04 $ 5.79 $ —Actual – Ending Balance $1,088.70 $1,084.80 $1,089.20 $ —Hypothetical Expenses per $1,000* $ 6.82 $ 10.66 $ 5.60 $ —Hypothetical – Ending Value $1,018.45 $1,014.62 $1,019.66 $ —Annualized expense ratio(1) 1.34% 2.10% 1.10% —
CALAMOS INTERNATIONAL GROWTH FUNDActual Expenses per $1,000* $ 7.90 $ 12.02 $ 6.53 $ 9.22Actual – Ending Balance $1,192.60 $1,188.00 $1,194.20 $1,191.30Hypothetical Expenses per $1,000* $ 7.27 $ 11.07 $ 6.01 $ 8.49Hypothetical – Ending Value $1,018.00 $1,014.22 $1,019.26 $1,016.79Annualized expense ratio(1) 1.43% 2.18% 1.18% 1.67%
CALAMOS EVOLVING WORLD GROWTH FUNDActual Expenses per $1,000* $ 8.79 $ 12.85 $ 7.43 $ 10.14Actual – Ending Balance $1,165.00 $1,160.50 $1,166.90 $1,163.00Hypothetical Expenses per $1,000* $ 8.19 $ 11.98 $ 6.92 $ 9.45Hypothetical – Ending Value $1,017.09 $1,013.31 $1,018.35 $1,015.83Annualized expense ratio 1.61% 2.36% 1.36% 1.86%
CALAMOS EMERGING MARKET EQUITY FUNDActual Expenses per $1,000* $ 9.62 $ 13.72 $ 8.26 $ —Actual – Ending Balance $1,180.80 $1,177.30 $1,183.70 $ —Hypothetical Expenses per $1,000* $ 8.89 $ 12.68 $ 7.63 $ —Hypothetical – Ending Value $1,016.38 $1,012.60 $1,017.64 $ —Annualized expense ratio(1) 1.75% 2.50% 1.50% —
CALAMOS GLOBAL EQUITY FUNDActual Expenses per $1,000* $ 7.80 $ 11.92 $ 6.44 $ 9.16Actual – Ending Balance $1,163.80 $1,159.40 $1,165.10 $1,162.30Hypothetical Expenses per $1,000* $ 7.27 $ 11.12 $ 6.01 $ 8.54Hypothetical – Ending Value $1,018.00 $1,014.17 $1,019.26 $1,016.74Annualized expense ratio(1) 1.43% 2.19% 1.18% 1.68%
CALAMOS GROWTH AND INCOME FUNDActual Expenses per $1,000* $ 5.79 $ 9.68 $ 4.49 $ 7.09Actual – Ending Balance $1,069.30 $1,065.30 $1,070.60 $1,067.60Hypothetical Expenses per $1,000* $ 5.65 $ 9.45 $ 4.38 $ 6.92Hypothetical – Ending Value $1,019.61 $1,015.83 $1,020.87 $1,018.35Annualized expense ratio 1.11% 1.86% 0.86% 1.36%
* Expenses for all Fund Classes A, C, I, and R are equal to the Fund’s annualized expense ratio, multiplied by the average account value over the period, multiplied by 184/365.
(1) Annualized Expense Ratios for Opportunistic Value Fund, Dividend Growth Fund, International Growth Fund, Emerging Market Equity Fund, and Global Equity Fund are adjusted toreflect fee waiver.
66 CALAMOS OPEN-END FAMILY OF FUNDS ANNUAL REPORT

Expense Example
The actual and hypothetical examples shown assume a $1,000 investment at the beginning of the period, May 1, 2017, andheld through October 31, 2017.
CLASS ASHARES
CLASS CSHARES
CLASS ISHARES
CLASS RSHARES
CALAMOS GLOBAL GROWTH AND INCOME FUNDActual Expenses per $1,000* $ 8.08 $ 12.02 $ 6.76 $ 9.39Actual – Ending Balance $1,095.30 $1,091.40 $1,095.60 $1,093.90Hypothetical Expenses per $1,000* $ 7.78 $ 11.57 $ 6.51 $ 9.05Hypothetical – Ending Value $1,017.49 $1,013.71 $1,018.75 $1,016.23Annualized expense ratio 1.53% 2.28% 1.28% 1.78%
CALAMOS CONVERTIBLE FUNDActual Expenses per $1,000* $ 6.11 $ 10.02 $ 4.81 $ 7.42Actual – Ending Balance $1,073.50 $1,069.90 $1,074.60 $1,072.60Hypothetical Expenses per $1,000* $ 5.96 $ 9.75 $ 4.69 $ 7.22Hypothetical – Ending Value $1,019.31 $1,015.53 $1,020.57 $1,018.05Annualized expense ratio 1.17% 1.92% 0.92% 1.42%
CALAMOS GLOBAL CONVERTIBLE FUNDActual Expenses per $1,000* $ 7.10 $ 10.95 $ 5.75 $ 8.40Actual – Ending Balance $1,071.50 $1,067.90 $1,072.50 $1,068.80Hypothetical Expenses per $1,000* $ 6.92 $ 10.66 $ 5.60 $ 8.19Hypothetical – Ending Value $1,018.35 $1,014.62 $1,019.66 $1,017.09Annualized expense ratio(1) 1.36% 2.10% 1.10% 1.61%
CALAMOS TOTAL RETURN BOND FUNDActual Expenses per $1,000* $ 4.61 $ 8.40 $ 3.35 $ 5.88Actual – Ending Balance $1,011.10 $1,007.30 $1,012.40 $1,009.80Hypothetical Expenses per $1,000* $ 4.63 $ 8.44 $ 3.36 $ 5.90Hypothetical – Ending Value $1,020.62 $1,016.84 $1,021.88 $1,019.36Annualized expense ratio(1) 0.91% 1.66% 0.66% 1.16%
CALAMOS HIGH INCOME OPPORTUNITIES FUNDActual Expenses per $1,000* $ 5.77 $ 9.64 $ 4.50 $ 7.10Actual – Ending Balance $1,027.00 $1,022.70 $1,028.30 $1,025.70Hypothetical Expenses per $1,000** $ 5.75 $ 9.60 $ 4.48 $ 7.07Hypothetical – Ending Value $1,019.51 $1,015.68 $1,020.77 $1,018.20Annualized expense ratio(1) 1.13% 1.89% 0.88% 1.39%
CALAMOS MARKET NEUTRAL INCOME FUNDActual Expenses per $1,000* $ 6.61 $ 10.35 $ 5.24 $ 7.83Actual – Ending Balance $1,017.60 $1,013.70 $1,018.50 $1,016.40Hypothetical Expenses per $1,000* $ 6.61 $ 10.36 $ 5.24 $ 7.83Hypothetical – Ending Value $1,018.65 $1,014.92 $1,020.01 $1,017.44Annualized expense ratio(2) 1.30% 2.04% 1.03% 1.54%
CALAMOS HEDGED EQUITY INCOME FUNDActual Expenses per $1,000* $ 7.06 $ 10.37 $ 5.22 $ —Actual – Ending Balance $1,029.60 $1,026.50 $1,031.70 $ —Hypothetical Expenses per $1,000* $ 7.02 $ 10.31 $ 5.19 $ —Hypothetical – Ending Value $1,018.25 $1,014.97 $1,020.06 $ —Annualized expense ratio(1) 1.38% 2.03% 1.02% —
CALAMOS PHINEUS LONG/SHORT FUNDActual Expenses per $1,000* $ 13.58 $ 17.48 $ 12.37 $ —Actual – Ending Balance $1,025.80 $1,021.80 $1,027.40 $ —Hypothetical Expenses per $1,000* $ 13.49 $ 17.36 $ 12.28 $ —Hypothetical – Ending Value $1,011.80 $1,007.91 $1,013.01 $ —Annualized expense ratio(2) 2.66% 3.43% 2.42% —
* Expenses for all Fund Classes A, C, I, and R are equal to the Fund’s annualized expense ratio, multiplied by the average account value over the period, multiplied by 184/365.
(1) Annualized Expense Ratios for Global Convertible Fund, Total Return Bond Fund, High Income Opportunities Fund, and Hedged Equity Income Fund are adjusted to reflect fee waiver.
(2) Includes 0.20% and 0.98% related to dividend expense on short positions for Market Neutral income Fund and Phineus Long/Short Fund, respectively.
www.calamos.com 67

Growth Fund Schedule of Investments October 31, 2017
NUMBER OFSHARES VALUE
COMMON STOCKS (97.2%)Consumer Discretionary (17.7%)
323,900 Adtalem Global Education, Inc. $ 11,968,10553,320 Amazon.com, Inc.#~ 58,933,530
786,900 Canada Goose Holdings, Inc.# 16,902,612582,400 Comcast Corp. - Class A~ 20,983,872122,100 Expedia, Inc. 15,220,986215,000 Lowe’s Companies, Inc. 17,189,250551,200 MGM Resorts International 17,280,12041,700 Mohawk Industries, Inc.# 10,915,39212,000 Priceline Group, Inc.# 22,943,520
558,600 PulteGroup, Inc. 16,886,478404,100 Starbucks Corp. 22,160,84478,100 Tesla Motors, Inc.# 25,892,493
113,700 TJX Companies, Inc. 7,936,26066,200 Ulta Salon Cosmetics & Fragrance,
Inc.# 13,358,498170,900 Walt Disney Company 16,715,729
295,287,689
Consumer Staples (2.9%)97,800 Constellation Brands, Inc. - Class A 21,427,002
327,600 Monster Beverage Corp.# 18,977,86877,400 Philip Morris International, Inc. 8,099,136
48,504,006
Energy (1.4%)261,900 Halliburton Company 11,193,606199,900 Schlumberger, Ltd. 12,793,600
23,987,206
Financials (11.8%)85,600 Affiliated Managers Group, Inc. 15,964,400
294,700 Citigroup, Inc. 21,660,450302,500 Discover Financial Services 20,125,325580,000 E*TRADE Financial Corp.# 25,282,200215,400 Evercore Partners, Inc. - Class A 17,253,540500,000 First Horizon National Corp. 9,385,000400,500 Intercontinental Exchange, Inc.~ 26,473,050164,000 Marsh & McLennan Companies, Inc. 13,272,520796,500 Radian Group, Inc. 16,694,640
1,433,800 SLM Corp.# 15,183,942345,800 Zions Bancorporation 16,065,868
197,360,935
Health Care (14.5%)187,000 AbbVie, Inc. 16,876,750170,300 Aetna, Inc. 28,956,109114,400 Alexion Pharmaceuticals, Inc.# 13,689,104121,100 Allergan, PLC 21,462,553521,700 Baxter International, Inc. 33,633,999
NUMBER OFSHARES VALUE
148,400 Bristol-Myers Squibb Company $ 9,150,344171,750 Celgene Corp.# 17,341,598292,858 Hologic, Inc.# 11,084,67563,000 Incyte Corp.# 7,134,750
232,000 Johnson & Johnson 32,343,120151,400 Laboratory Corp. of America
Holdings# 23,271,69437,700 Regeneron Pharmaceuticals, Inc.# 15,178,77457,100 UnitedHealth Group, Inc. 12,003,562
242,127,032
Industrials (9.2%)432,300 Air Lease Corp. 18,783,435116,900 Cintas Corp. 17,422,776426,600 Delta Air Lines, Inc. 21,342,798411,600 Masco Corp. 16,389,91252,217 Parker-Hannifin Corp. 9,535,346
120,800 Raytheon Company 21,768,160457,600 Spirit Airlines, Inc.# 16,972,384306,700 TransUnion#~ 16,098,683229,000 Waste Connections, Inc. 16,183,430
154,496,924
Information Technology (38.5%)79,000 Alphabet, Inc. - Class A#~ 81,610,160
661,600 Apple, Inc.~ 111,836,864391,300 Applied Materials, Inc. 22,081,05966,500 Broadcom, Ltd. 17,550,015
137,800 Ellie Mae, Inc.# 12,395,110326,700 Facebook, Inc. - Class A#~ 58,825,602187,050 Fidelity National Information Services,
Inc. 17,350,758142,900 FleetCor Technologies, Inc.# 23,617,083131,400 Harris Corp. 18,306,648317,100 Lumentum Holdings, Inc.# 20,024,865127,000 Microchip Technology, Inc. 12,039,600663,900 Microsoft Corp.~ 55,223,202670,700 NCR Corp.#~ 21,522,763108,100 Paycom Software, Inc.# 8,885,820338,100 PayPal Holdings, Inc.# 24,532,536209,400 RealPage, Inc.# 9,067,020232,000 Salesforce.com, Inc.# 23,742,880219,100 Total System Services, Inc.~ 15,786,155273,000 Visa, Inc. - Class A 30,024,540234,000 Workday, Inc. - Class A# 25,971,660
1,082,400 Zendesk, Inc.# 33,554,400643,948,740
Materials (1.2%)109,800 Celanese Corp. - Class A 11,453,238
68 CALAMOS OPEN-END FAMILY OF FUNDS ANNUAL REPORT See accompanying Notes to Schedule of Investments

Growth Fund Schedule of Investments October 31, 2017
NUMBER OFSHARES VALUE
82,300 Eagle Materials, Inc. $ 8,688,41120,141,649
TOTAL COMMON STOCKS(Cost $1,190,768,667) 1,625,854,181
NUMBER OFCONTRACTS/NOTIONALAMOUNT VALUE
PURCHASED OPTIONS (0.2%)#Consumer Discretionary (0.2%)
1,221122,100
Expedia, Inc.Put, 11/03/17, Strike $143.00 2,234,430
12012,000
Priceline Group, Inc.Put, 11/10/17, Strike $1,800.00 193,800
2,428,230
Other (0.0%)6,700
670,000SPDR S&P 500 ETF TrustPut, 11/17/17, Strike $247.00 211,050
Information Technology (0.0%)3,308
330,800Apple, Inc.Put, 11/10/17, Strike $150.00 95,932
4,207420,700
Zendesk, Inc.Put, 11/17/17, Strike $30.00 588,980
684,912
TOTAL PURCHASED OPTIONS(Cost $3,598,324) 3,324,192
NUMBER OFSHARES VALUE
SHORT TERM INVESTMENTS (2.7%)
22,430,155 Fidelity Prime Money Market Fund -Institutional Class 22,436,884
22,222,102 Morgan Stanley Institutional LiquidityFunds - Government Portfolio 22,222,102
TOTAL SHORT TERMINVESTMENTS(Cost $44,658,986) 44,658,986
TOTAL INVESTMENTS (100.1%)(Cost $1,239,025,977) 1,673,837,359
LIABILITIES, LESS OTHER ASSETS (-0.1%) (1,410,078)
NET ASSETS (100.0%) $1,672,427,281
NUMBER OFCONTRACTS/NOTIONALAMOUNT VALUE
WRITTEN OPTIONS (-0.2%)#Consumer Discretionary (-0.1%)
1,832183,200
Expedia, Inc.Put, 12/15/17, Strike $130.00 $ (1,410,640)
Information Technology (-0.1%)7,716
771,600Apple, Inc.Put, 12/15/17, Strike $140.00 (239,196)
5,000500,000
Facebook, Inc.Put, 12/15/17, Strike $145.00 (195,000)
1,081108,100
Paycom Software, Inc.Call, 11/17/17, Strike $80.00 (475,640)
3,381338,100
Paypal Holdings, Inc.Call, 11/17/17, Strike $70.00 (1,048,110)
(1,957,946)
TOTAL WRITTEN OPTIONS(Premium $2,498,611) (3,368,586)
NOTES TO SCHEDULE OF INVESTMENTS# Non-income producing security.
~ Security, or portion of security, is segregated as collateral (or potentialcollateral for future transactions) for written options. The aggregatevalue of such securities is $65,855,219.
Note: The date on options represents the expiration date of the option contract. Theoption contract may be exercised at any date on or before the date shown.
See accompanying Notes to Financial Statements www.calamos.com 69
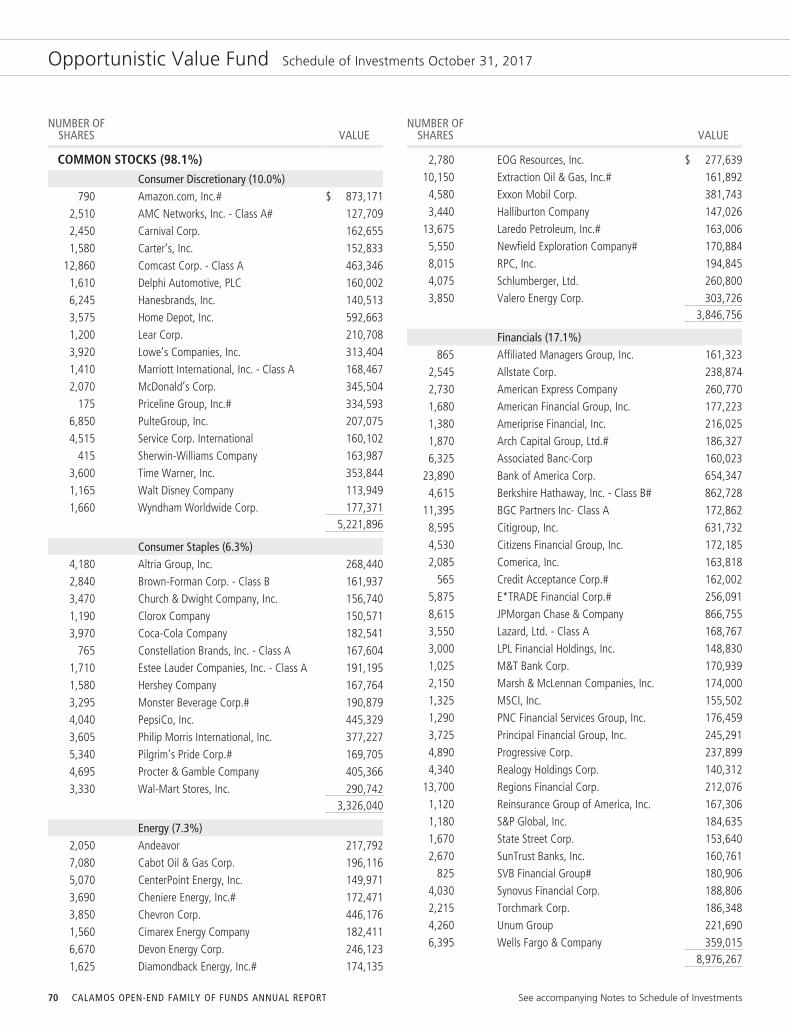
Opportunistic Value Fund Schedule of Investments October 31, 2017
NUMBER OFSHARES VALUE
COMMON STOCKS (98.1%)Consumer Discretionary (10.0%)
790 Amazon.com, Inc.# $ 873,1712,510 AMC Networks, Inc. - Class A# 127,7092,450 Carnival Corp. 162,6551,580 Carter’s, Inc. 152,833
12,860 Comcast Corp. - Class A 463,3461,610 Delphi Automotive, PLC 160,0026,245 Hanesbrands, Inc. 140,5133,575 Home Depot, Inc. 592,6631,200 Lear Corp. 210,7083,920 Lowe’s Companies, Inc. 313,4041,410 Marriott International, Inc. - Class A 168,4672,070 McDonald’s Corp. 345,504
175 Priceline Group, Inc.# 334,5936,850 PulteGroup, Inc. 207,0754,515 Service Corp. International 160,102
415 Sherwin-Williams Company 163,9873,600 Time Warner, Inc. 353,8441,165 Walt Disney Company 113,9491,660 Wyndham Worldwide Corp. 177,371
5,221,896
Consumer Staples (6.3%)4,180 Altria Group, Inc. 268,4402,840 Brown-Forman Corp. - Class B 161,9373,470 Church & Dwight Company, Inc. 156,7401,190 Clorox Company 150,5713,970 Coca-Cola Company 182,541
765 Constellation Brands, Inc. - Class A 167,6041,710 Estee Lauder Companies, Inc. - Class A 191,1951,580 Hershey Company 167,7643,295 Monster Beverage Corp.# 190,8794,040 PepsiCo, Inc. 445,3293,605 Philip Morris International, Inc. 377,2275,340 Pilgrim’s Pride Corp.# 169,7054,695 Procter & Gamble Company 405,3663,330 Wal-Mart Stores, Inc. 290,742
3,326,040
Energy (7.3%)2,050 Andeavor 217,7927,080 Cabot Oil & Gas Corp. 196,1165,070 CenterPoint Energy, Inc. 149,9713,690 Cheniere Energy, Inc.# 172,4713,850 Chevron Corp. 446,1761,560 Cimarex Energy Company 182,4116,670 Devon Energy Corp. 246,1231,625 Diamondback Energy, Inc.# 174,135
NUMBER OFSHARES VALUE
2,780 EOG Resources, Inc. $ 277,63910,150 Extraction Oil & Gas, Inc.# 161,8924,580 Exxon Mobil Corp. 381,7433,440 Halliburton Company 147,026
13,675 Laredo Petroleum, Inc.# 163,0065,550 Newfield Exploration Company# 170,8848,015 RPC, Inc. 194,8454,075 Schlumberger, Ltd. 260,8003,850 Valero Energy Corp. 303,726
3,846,756
Financials (17.1%)865 Affiliated Managers Group, Inc. 161,323
2,545 Allstate Corp. 238,8742,730 American Express Company 260,7701,680 American Financial Group, Inc. 177,2231,380 Ameriprise Financial, Inc. 216,0251,870 Arch Capital Group, Ltd.# 186,3276,325 Associated Banc-Corp 160,023
23,890 Bank of America Corp. 654,3474,615 Berkshire Hathaway, Inc. - Class B# 862,728
11,395 BGC Partners Inc- Class A 172,8628,595 Citigroup, Inc. 631,7324,530 Citizens Financial Group, Inc. 172,1852,085 Comerica, Inc. 163,818
565 Credit Acceptance Corp.# 162,0025,875 E*TRADE Financial Corp.# 256,0918,615 JPMorgan Chase & Company 866,7553,550 Lazard, Ltd. - Class A 168,7673,000 LPL Financial Holdings, Inc. 148,8301,025 M&T Bank Corp. 170,9392,150 Marsh & McLennan Companies, Inc. 174,0001,325 MSCI, Inc. 155,5021,290 PNC Financial Services Group, Inc. 176,4593,725 Principal Financial Group, Inc. 245,2914,890 Progressive Corp. 237,8994,340 Realogy Holdings Corp. 140,312
13,700 Regions Financial Corp. 212,0761,120 Reinsurance Group of America, Inc. 167,3061,180 S&P Global, Inc. 184,6351,670 State Street Corp. 153,6402,670 SunTrust Banks, Inc. 160,761
825 SVB Financial Group# 180,9064,030 Synovus Financial Corp. 188,8062,215 Torchmark Corp. 186,3484,260 Unum Group 221,6906,395 Wells Fargo & Company 359,015
8,976,267
70 CALAMOS OPEN-END FAMILY OF FUNDS ANNUAL REPORT See accompanying Notes to Schedule of Investments

Opportunistic Value Fund Schedule of Investments October 31, 2017
NUMBER OFSHARES VALUE
Health Care (13.8%)6,815 AbbVie, Inc. $ 615,0544,020 Agilent Technologies, Inc. 273,4813,125 Amgen, Inc. 547,562
755 Anthem, Inc. 157,9542,515 Baxter International, Inc. 162,142
520 Biogen, Inc.# 162,0632,050 Centene Corp.# 192,0241,425 Charles River Laboratories International,
Inc.# 165,7131,140 Cigna Corp. 224,831
890 Cooper Companies, Inc. 213,8311,060 Edwards Lifesciences Corp.# 108,3642,960 Eli Lilly and Company 242,5424,630 Gilead Sciences, Inc. 347,065
720 Humana, Inc. 183,8527,335 Johnson & Johnson 1,022,5721,200 Laboratory Corp. of America Holdings# 184,4526,255 Merck & Company, Inc. 344,588
11,725 Pfizer, Inc. 411,0781,090 Thermo Fisher Scientific, Inc. 211,2753,130 UnitedHealth Group, Inc. 657,9892,720 Veeva Systems, Inc., Class A# 165,757
925 Waters Corp.# 181,3461,500 WellCare Health Plans, Inc.# 296,6102,200 Zoetis, Inc. 140,404
7,212,549
Industrials (11.1%)1,625 3M Company 374,0591,945 Allegion, PLC 162,1936,285 Allison Transmission Holdings, Inc. 267,0502,435 Ametek, Inc. 164,3383,270 Armstrong World Industries, Inc.# 167,0971,841 Boeing Company 474,941
965 Caterpillar, Inc. 131,0471,470 Cummins, Inc. 260,0143,020 DCT Industrial Trust, Inc. 175,220
785 FedEx Corp. 177,2611,370 General Dynamics Corp. 278,0831,245 Graco, Inc. 164,0781,560 Honeywell International, Inc. 224,890
725 Huntington Ingalls Industries, Inc. 168,8021,400 IDEX Corp. 179,494
990 Illinois Tool Works, Inc. 154,9552,010 Ingersoll-Rand, PLC 178,0861,120 Lennox International, Inc. 214,0661,660 Manpowergroup, Inc. 204,6451,450 Norfolk Southern Corp. 190,559
NUMBER OFSHARES VALUE
1,845 Oshkosh Corp. $ 168,9282,345 Owens Corning 193,9081,315 Parker-Hannifin Corp. 240,1321,055 Rockwell Automation, Inc. 211,8654,400 Timken Company 207,4602,180 Union Pacific Corp. 252,4221,500 United Rentals, Inc.# 212,220
5,797,813
Information Technology (25.6%)1,300 Accenture, PLC - Class A 185,0681,050 Adobe Systems, Inc.# 183,9181,465 Alphabet, Inc. - Class A# 1,513,4043,350 Analog Devices, Inc. 305,8551,640 Ansys, Inc.# 224,204
13,370 Apple, Inc. 2,260,0655,495 Applied Materials, Inc. 310,0831,070 Broadcom, Ltd. 282,3847,975 Cisco Systems, Inc. 272,3464,600 CoreLogic, Inc.# 215,7405,780 Facebook, Inc. - Class A# 1,040,7478,290 First Data Corp. - Class A# 147,6451,335 Fiserv, Inc.# 172,7893,575 GoDaddy, Inc. - Class A# 166,953
10,370 Intel Corp. 471,7311,660 Lam Research Corp. 346,2263,250 MasterCard, Inc. - Class A 483,502
20,705 Microsoft Corp. 1,722,2426,735 NetApp, Inc. 299,169
915 NVIDIA Corp. 189,23110,255 Oracle Corp. 521,9794,695 Symantec Corp. 152,5882,955 Synopsys, Inc.# 255,6673,430 Texas Instruments, Inc. 331,6474,980 Trimble, Inc.# 203,5825,705 Visa, Inc. - Class A 627,4362,345 VMware, Inc. - Class A# 280,6733,250 Xilinx, Inc. 239,492
13,406,366
Materials (2.9%)1,650 Avery Dennison Corp. 175,1801,725 Celanese Corp. - Class A 179,9353,180 Chemours Company 180,0202,942 DowDuPont, Inc. 212,7361,660 Eagle Materials, Inc. 175,2461,650 Eastman Chemical Company 149,8375,690 Huntsman Corp. 182,1946,105 Owens-Illinois, Inc.# 145,848
See accompanying Notes to Schedule of Investments www.calamos.com 71
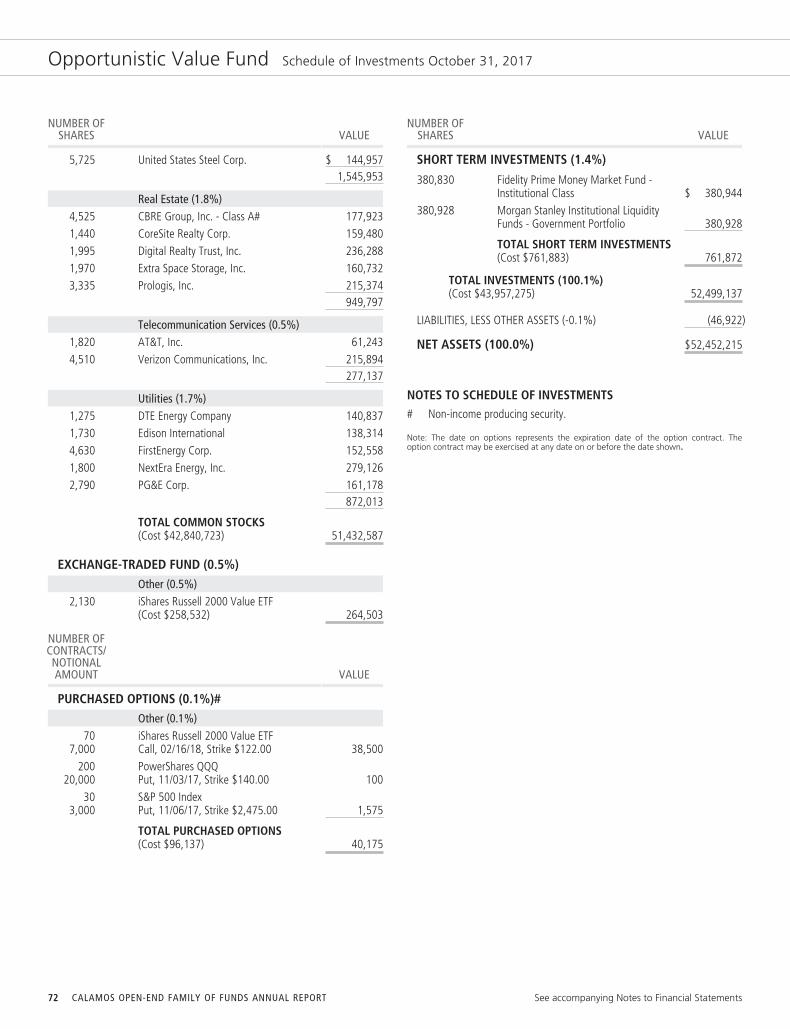
Opportunistic Value Fund Schedule of Investments October 31, 2017
NUMBER OFSHARES VALUE
5,725 United States Steel Corp. $ 144,9571,545,953
Real Estate (1.8%)4,525 CBRE Group, Inc. - Class A# 177,9231,440 CoreSite Realty Corp. 159,4801,995 Digital Realty Trust, Inc. 236,2881,970 Extra Space Storage, Inc. 160,7323,335 Prologis, Inc. 215,374
949,797
Telecommunication Services (0.5%)1,820 AT&T, Inc. 61,2434,510 Verizon Communications, Inc. 215,894
277,137
Utilities (1.7%)1,275 DTE Energy Company 140,8371,730 Edison International 138,3144,630 FirstEnergy Corp. 152,5581,800 NextEra Energy, Inc. 279,1262,790 PG&E Corp. 161,178
872,013
TOTAL COMMON STOCKS(Cost $42,840,723) 51,432,587
EXCHANGE-TRADED FUND (0.5%)Other (0.5%)
2,130 iShares Russell 2000 Value ETF(Cost $258,532) 264,503
NUMBER OFCONTRACTS/NOTIONALAMOUNT VALUE
PURCHASED OPTIONS (0.1%)#Other (0.1%)
707,000
iShares Russell 2000 Value ETFCall, 02/16/18, Strike $122.00 38,500
20020,000
PowerShares QQQPut, 11/03/17, Strike $140.00 100
303,000
S&P 500 IndexPut, 11/06/17, Strike $2,475.00 1,575
TOTAL PURCHASED OPTIONS(Cost $96,137) 40,175
NUMBER OFSHARES VALUE
SHORT TERM INVESTMENTS (1.4%)
380,830 Fidelity Prime Money Market Fund -Institutional Class $ 380,944
380,928 Morgan Stanley Institutional LiquidityFunds - Government Portfolio 380,928
TOTAL SHORT TERM INVESTMENTS(Cost $761,883) 761,872
TOTAL INVESTMENTS (100.1%)(Cost $43,957,275) 52,499,137
LIABILITIES, LESS OTHER ASSETS (-0.1%) (46,922)
NET ASSETS (100.0%) $52,452,215
NOTES TO SCHEDULE OF INVESTMENTS# Non-income producing security.
Note: The date on options represents the expiration date of the option contract. Theoption contract may be exercised at any date on or before the date shown.
72 CALAMOS OPEN-END FAMILY OF FUNDS ANNUAL REPORT See accompanying Notes to Financial Statements
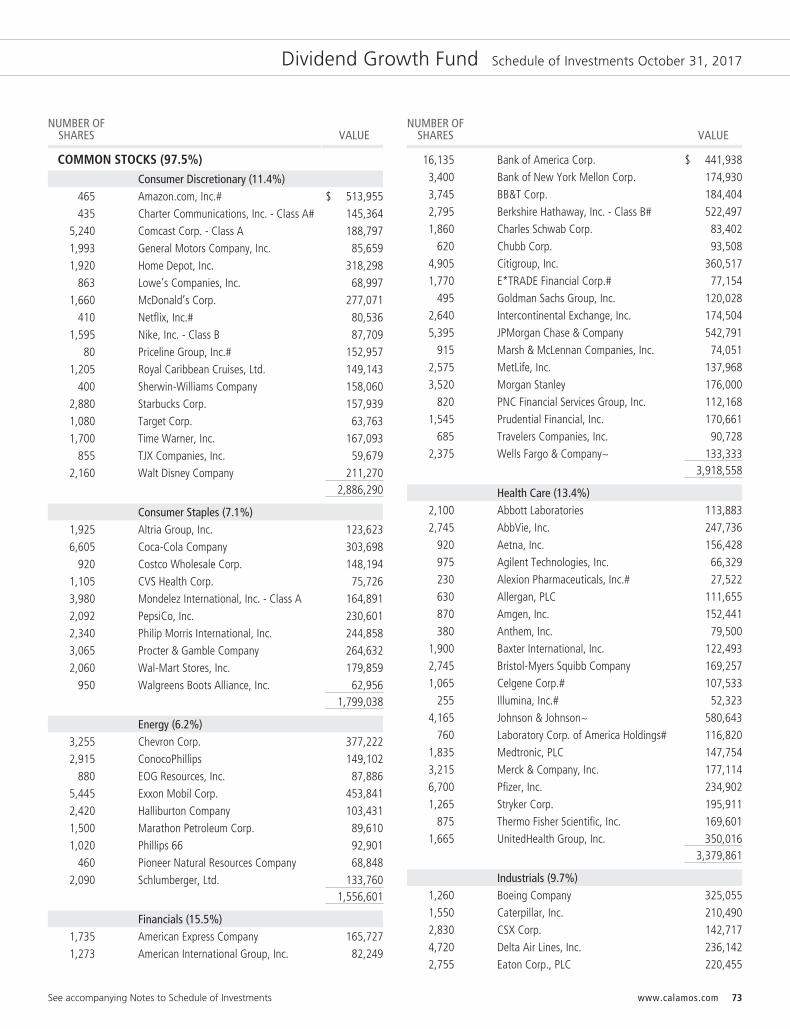
Dividend Growth Fund Schedule of Investments October 31, 2017
NUMBER OFSHARES VALUE
COMMON STOCKS (97.5%)Consumer Discretionary (11.4%)
465 Amazon.com, Inc.# $ 513,955435 Charter Communications, Inc. - Class A# 145,364
5,240 Comcast Corp. - Class A 188,7971,993 General Motors Company, Inc. 85,6591,920 Home Depot, Inc. 318,298
863 Lowe’s Companies, Inc. 68,9971,660 McDonald’s Corp. 277,071
410 Netflix, Inc.# 80,5361,595 Nike, Inc. - Class B 87,709
80 Priceline Group, Inc.# 152,9571,205 Royal Caribbean Cruises, Ltd. 149,143
400 Sherwin-Williams Company 158,0602,880 Starbucks Corp. 157,9391,080 Target Corp. 63,7631,700 Time Warner, Inc. 167,093
855 TJX Companies, Inc. 59,6792,160 Walt Disney Company 211,270
2,886,290
Consumer Staples (7.1%)1,925 Altria Group, Inc. 123,6236,605 Coca-Cola Company 303,698
920 Costco Wholesale Corp. 148,1941,105 CVS Health Corp. 75,7263,980 Mondelez International, Inc. - Class A 164,8912,092 PepsiCo, Inc. 230,6012,340 Philip Morris International, Inc. 244,8583,065 Procter & Gamble Company 264,6322,060 Wal-Mart Stores, Inc. 179,859
950 Walgreens Boots Alliance, Inc. 62,9561,799,038
Energy (6.2%)3,255 Chevron Corp. 377,2222,915 ConocoPhillips 149,102
880 EOG Resources, Inc. 87,8865,445 Exxon Mobil Corp. 453,8412,420 Halliburton Company 103,4311,500 Marathon Petroleum Corp. 89,6101,020 Phillips 66 92,901
460 Pioneer Natural Resources Company 68,8482,090 Schlumberger, Ltd. 133,760
1,556,601
Financials (15.5%)1,735 American Express Company 165,7271,273 American International Group, Inc. 82,249
NUMBER OFSHARES VALUE
16,135 Bank of America Corp. $ 441,9383,400 Bank of New York Mellon Corp. 174,9303,745 BB&T Corp. 184,4042,795 Berkshire Hathaway, Inc. - Class B# 522,4971,860 Charles Schwab Corp. 83,402
620 Chubb Corp. 93,5084,905 Citigroup, Inc. 360,5171,770 E*TRADE Financial Corp.# 77,154
495 Goldman Sachs Group, Inc. 120,0282,640 Intercontinental Exchange, Inc. 174,5045,395 JPMorgan Chase & Company 542,791
915 Marsh & McLennan Companies, Inc. 74,0512,575 MetLife, Inc. 137,9683,520 Morgan Stanley 176,000
820 PNC Financial Services Group, Inc. 112,1681,545 Prudential Financial, Inc. 170,661
685 Travelers Companies, Inc. 90,7282,375 Wells Fargo & Company~ 133,333
3,918,558
Health Care (13.4%)2,100 Abbott Laboratories 113,8832,745 AbbVie, Inc. 247,736
920 Aetna, Inc. 156,428975 Agilent Technologies, Inc. 66,329230 Alexion Pharmaceuticals, Inc.# 27,522630 Allergan, PLC 111,655870 Amgen, Inc. 152,441380 Anthem, Inc. 79,500
1,900 Baxter International, Inc. 122,4932,745 Bristol-Myers Squibb Company 169,2571,065 Celgene Corp.# 107,533
255 Illumina, Inc.# 52,3234,165 Johnson & Johnson~ 580,643
760 Laboratory Corp. of America Holdings# 116,8201,835 Medtronic, PLC 147,7543,215 Merck & Company, Inc. 177,1146,700 Pfizer, Inc. 234,9021,265 Stryker Corp. 195,911
875 Thermo Fisher Scientific, Inc. 169,6011,665 UnitedHealth Group, Inc. 350,016
3,379,861
Industrials (9.7%)1,260 Boeing Company 325,0551,550 Caterpillar, Inc. 210,4902,830 CSX Corp. 142,7174,720 Delta Air Lines, Inc. 236,1422,755 Eaton Corp., PLC 220,455
See accompanying Notes to Schedule of Investments www.calamos.com 73
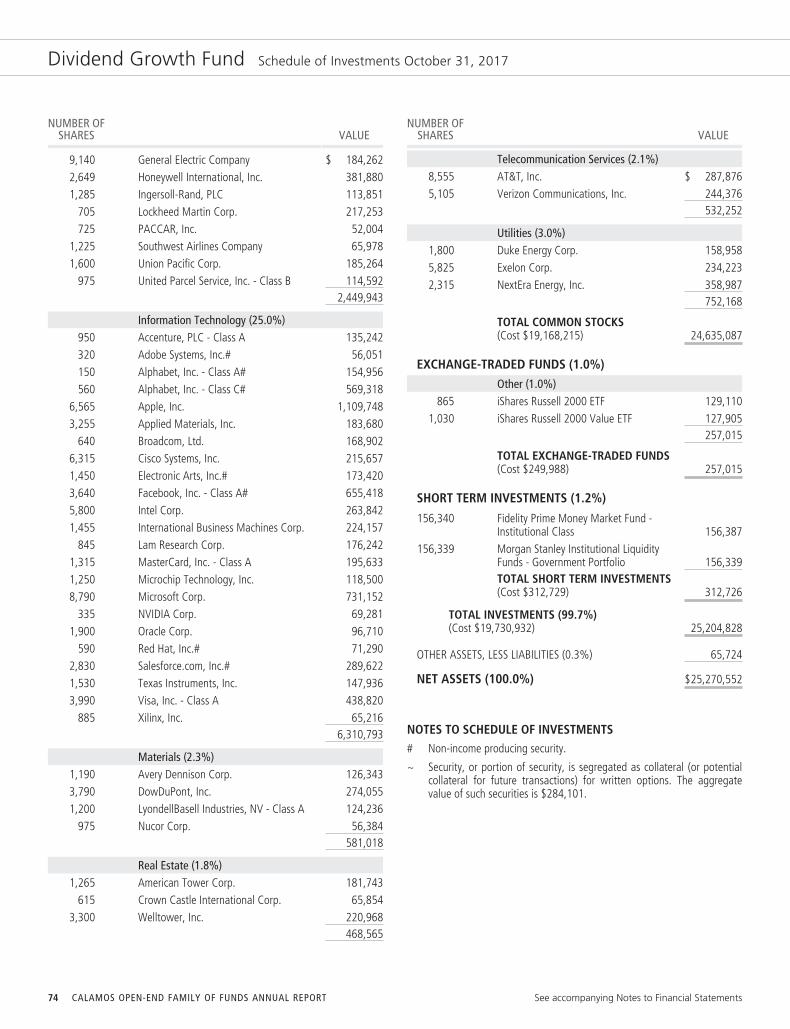
Dividend Growth Fund Schedule of Investments October 31, 2017
NUMBER OFSHARES VALUE
9,140 General Electric Company $ 184,2622,649 Honeywell International, Inc. 381,8801,285 Ingersoll-Rand, PLC 113,851
705 Lockheed Martin Corp. 217,253725 PACCAR, Inc. 52,004
1,225 Southwest Airlines Company 65,9781,600 Union Pacific Corp. 185,264
975 United Parcel Service, Inc. - Class B 114,5922,449,943
Information Technology (25.0%)950 Accenture, PLC - Class A 135,242320 Adobe Systems, Inc.# 56,051150 Alphabet, Inc. - Class A# 154,956560 Alphabet, Inc. - Class C# 569,318
6,565 Apple, Inc. 1,109,7483,255 Applied Materials, Inc. 183,680
640 Broadcom, Ltd. 168,9026,315 Cisco Systems, Inc. 215,6571,450 Electronic Arts, Inc.# 173,4203,640 Facebook, Inc. - Class A# 655,4185,800 Intel Corp. 263,8421,455 International Business Machines Corp. 224,157
845 Lam Research Corp. 176,2421,315 MasterCard, Inc. - Class A 195,6331,250 Microchip Technology, Inc. 118,5008,790 Microsoft Corp. 731,152
335 NVIDIA Corp. 69,2811,900 Oracle Corp. 96,710
590 Red Hat, Inc.# 71,2902,830 Salesforce.com, Inc.# 289,6221,530 Texas Instruments, Inc. 147,9363,990 Visa, Inc. - Class A 438,820
885 Xilinx, Inc. 65,2166,310,793
Materials (2.3%)1,190 Avery Dennison Corp. 126,3433,790 DowDuPont, Inc. 274,0551,200 LyondellBasell Industries, NV - Class A 124,236
975 Nucor Corp. 56,384581,018
Real Estate (1.8%)1,265 American Tower Corp. 181,743
615 Crown Castle International Corp. 65,8543,300 Welltower, Inc. 220,968
468,565
NUMBER OFSHARES VALUE
Telecommunication Services (2.1%)8,555 AT&T, Inc. $ 287,8765,105 Verizon Communications, Inc. 244,376
532,252
Utilities (3.0%)1,800 Duke Energy Corp. 158,9585,825 Exelon Corp. 234,2232,315 NextEra Energy, Inc. 358,987
752,168
TOTAL COMMON STOCKS(Cost $19,168,215) 24,635,087
EXCHANGE-TRADED FUNDS (1.0%)Other (1.0%)
865 iShares Russell 2000 ETF 129,1101,030 iShares Russell 2000 Value ETF 127,905
257,015
TOTAL EXCHANGE-TRADED FUNDS(Cost $249,988) 257,015
SHORT TERM INVESTMENTS (1.2%)
156,340 Fidelity Prime Money Market Fund -Institutional Class 156,387
156,339 Morgan Stanley Institutional LiquidityFunds - Government Portfolio 156,339TOTAL SHORT TERM INVESTMENTS(Cost $312,729) 312,726
TOTAL INVESTMENTS (99.7%)(Cost $19,730,932) 25,204,828
OTHER ASSETS, LESS LIABILITIES (0.3%) 65,724
NET ASSETS (100.0%) $25,270,552
NOTES TO SCHEDULE OF INVESTMENTS# Non-income producing security.
~ Security, or portion of security, is segregated as collateral (or potentialcollateral for future transactions) for written options. The aggregatevalue of such securities is $284,101.
74 CALAMOS OPEN-END FAMILY OF FUNDS ANNUAL REPORT See accompanying Notes to Financial Statements
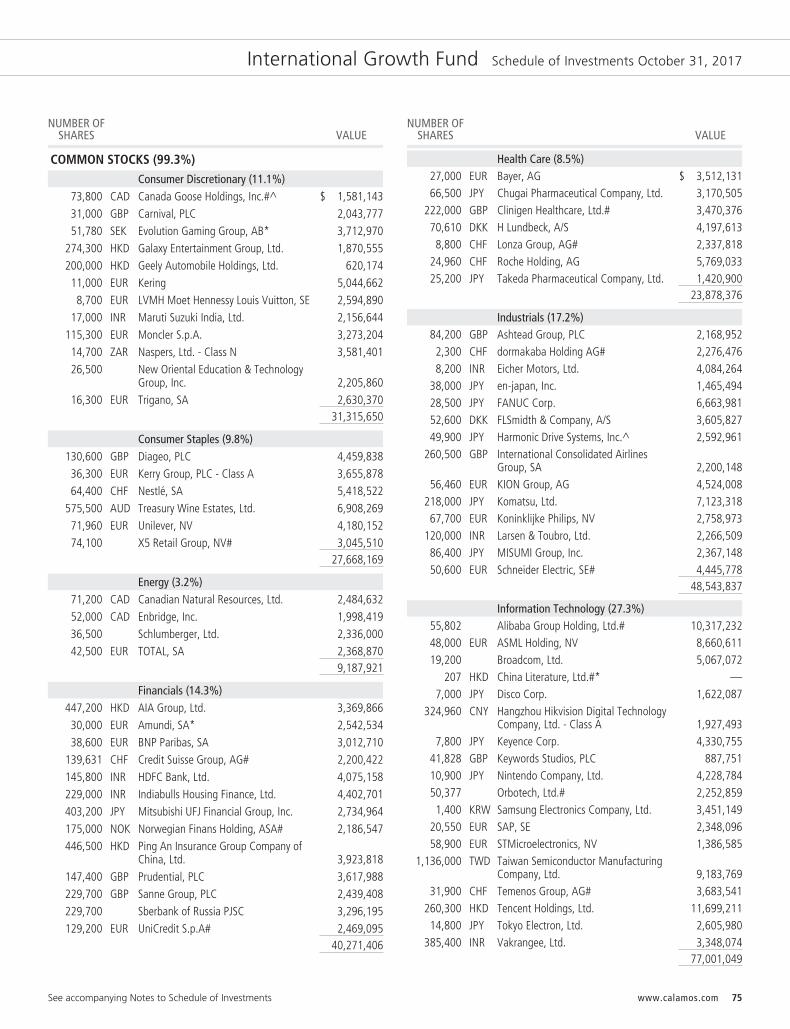
International Growth Fund Schedule of Investments October 31, 2017
NUMBER OFSHARES VALUE
COMMON STOCKS (99.3%)Consumer Discretionary (11.1%)
73,800 CAD Canada Goose Holdings, Inc.#^ $ 1,581,14331,000 GBP Carnival, PLC 2,043,77751,780 SEK Evolution Gaming Group, AB* 3,712,970
274,300 HKD Galaxy Entertainment Group, Ltd. 1,870,555200,000 HKD Geely Automobile Holdings, Ltd. 620,17411,000 EUR Kering 5,044,6628,700 EUR LVMH Moet Hennessy Louis Vuitton, SE 2,594,890
17,000 INR Maruti Suzuki India, Ltd. 2,156,644115,300 EUR Moncler S.p.A. 3,273,20414,700 ZAR Naspers, Ltd. - Class N 3,581,40126,500 New Oriental Education & Technology
Group, Inc. 2,205,86016,300 EUR Trigano, SA 2,630,370
31,315,650
Consumer Staples (9.8%)130,600 GBP Diageo, PLC 4,459,83836,300 EUR Kerry Group, PLC - Class A 3,655,87864,400 CHF Nestlé, SA 5,418,522
575,500 AUD Treasury Wine Estates, Ltd. 6,908,26971,960 EUR Unilever, NV 4,180,15274,100 X5 Retail Group, NV# 3,045,510
27,668,169
Energy (3.2%)71,200 CAD Canadian Natural Resources, Ltd. 2,484,63252,000 CAD Enbridge, Inc. 1,998,41936,500 Schlumberger, Ltd. 2,336,00042,500 EUR TOTAL, SA 2,368,870
9,187,921
Financials (14.3%)447,200 HKD AIA Group, Ltd. 3,369,86630,000 EUR Amundi, SA* 2,542,53438,600 EUR BNP Paribas, SA 3,012,710
139,631 CHF Credit Suisse Group, AG# 2,200,422145,800 INR HDFC Bank, Ltd. 4,075,158229,000 INR Indiabulls Housing Finance, Ltd. 4,402,701403,200 JPY Mitsubishi UFJ Financial Group, Inc. 2,734,964175,000 NOK Norwegian Finans Holding, ASA# 2,186,547446,500 HKD Ping An Insurance Group Company of
China, Ltd. 3,923,818147,400 GBP Prudential, PLC 3,617,988229,700 GBP Sanne Group, PLC 2,439,408229,700 Sberbank of Russia PJSC 3,296,195129,200 EUR UniCredit S.p.A# 2,469,095
40,271,406
NUMBER OFSHARES VALUE
Health Care (8.5%)27,000 EUR Bayer, AG $ 3,512,13166,500 JPY Chugai Pharmaceutical Company, Ltd. 3,170,505
222,000 GBP Clinigen Healthcare, Ltd.# 3,470,37670,610 DKK H Lundbeck, A/S 4,197,6138,800 CHF Lonza Group, AG# 2,337,818
24,960 CHF Roche Holding, AG 5,769,03325,200 JPY Takeda Pharmaceutical Company, Ltd. 1,420,900
23,878,376
Industrials (17.2%)84,200 GBP Ashtead Group, PLC 2,168,9522,300 CHF dormakaba Holding AG# 2,276,4768,200 INR Eicher Motors, Ltd. 4,084,264
38,000 JPY en-japan, Inc. 1,465,49428,500 JPY FANUC Corp. 6,663,98152,600 DKK FLSmidth & Company, A/S 3,605,82749,900 JPY Harmonic Drive Systems, Inc.^ 2,592,961
260,500 GBP International Consolidated AirlinesGroup, SA 2,200,148
56,460 EUR KION Group, AG 4,524,008218,000 JPY Komatsu, Ltd. 7,123,31867,700 EUR Koninklijke Philips, NV 2,758,973
120,000 INR Larsen & Toubro, Ltd. 2,266,50986,400 JPY MISUMI Group, Inc. 2,367,14850,600 EUR Schneider Electric, SE# 4,445,778
48,543,837
Information Technology (27.3%)55,802 Alibaba Group Holding, Ltd.# 10,317,23248,000 EUR ASML Holding, NV 8,660,61119,200 Broadcom, Ltd. 5,067,072
207 HKD China Literature, Ltd.#* —7,000 JPY Disco Corp. 1,622,087
324,960 CNY Hangzhou Hikvision Digital TechnologyCompany, Ltd. - Class A 1,927,493
7,800 JPY Keyence Corp. 4,330,75541,828 GBP Keywords Studios, PLC 887,75110,900 JPY Nintendo Company, Ltd. 4,228,78450,377 Orbotech, Ltd.# 2,252,8591,400 KRW Samsung Electronics Company, Ltd. 3,451,149
20,550 EUR SAP, SE 2,348,09658,900 EUR STMicroelectronics, NV 1,386,585
1,136,000 TWD Taiwan Semiconductor ManufacturingCompany, Ltd. 9,183,769
31,900 CHF Temenos Group, AG# 3,683,541260,300 HKD Tencent Holdings, Ltd. 11,699,21114,800 JPY Tokyo Electron, Ltd. 2,605,980
385,400 INR Vakrangee, Ltd. 3,348,07477,001,049
See accompanying Notes to Schedule of Investments www.calamos.com 75

International Growth Fund Schedule of Investments October 31, 2017
NUMBER OFSHARES VALUE
Materials (5.0%)166,400 Cemex, SAB de CV# $ 1,349,504945,000 GBP Glencore, PLC# 4,557,925
7,000 KRW LG Chem, Ltd. 2,523,89715,000 GBP Randgold Resources, Ltd. 1,474,017
137,200 Vale, SA# 1,343,18887,442 GBP Victrex, PLC 2,784,231
14,032,762
Real Estate (1.6%)196,000 EUR Aroundtown, SA 1,374,83450,400 JPY Investors Cloud Company, Ltd.^ 3,073,554
4,448,388
Telecommunication Services (1.3%)42,000 JPY SoftBank Group Corp. 3,722,132
TOTAL COMMON STOCKS(Cost $206,873,149) 280,069,690
SHORT TERM INVESTMENTS (0.4%)
596,904 Fidelity Prime Money Market Fund -Institutional Class 597,083
596,199 Morgan Stanley Institutional LiquidityFunds - Government Portfolio 596,199
TOTAL SHORT TERMINVESTMENTS(Cost $1,193,282) 1,193,282
NUMBER OFSHARES/
PRINCIPALAMOUNT VALUE
INVESTMENT OF CASH COLLATERAL FOR SECURITIESLOANED (1.0%)
2,879,438 Deutsche Bank Securities, Inc.†1.040%, 11/01/17(Cost $2,879,438) 2,879,438
TOTAL INVESTMENTS (100.7%)(Cost $210,945,869) 284,142,410
PAYABLE UPON RETURN OF SECURITIES ON LOAN (-1.0%) (2,879,438)
OTHER ASSETS, LESS LIABILITIES (0.3%) 896,328
NET ASSETS (100.0%) $282,159,300
FORWARD FOREIGN CURRENCY CONTRACTS
COUNTERPARTYLONG
CONTRACTSSETTLEMENT
DATELOCAL
CURRENCYCURRENT
VALUEUNREALIZEDGAIN/LOSS
State Street Bankand Trust Canadian Dollar 11/30/17 16,309,000 $12,644,690 $(255,129)Bank of New York Swiss Franc 11/30/17 375,000 376,550 (879)
$(256,008)
COUNTERPARTYSHORT
CONTRACTSSETTLEMENT
DATELOCAL
CURRENCYCURRENT
VALUEUNREALIZEDGAIN/LOSS
State Street Bankand Trust Swiss Franc 11/30/17 5,495,000 $ 5,517,709 $ 53,132
NOTES TO SCHEDULE OF INVESTMENTS# Non-income producing security.
^ Security, or portion of security, is on loan.
* Securities issued and sold pursuant to a Rule 144A transaction areexcepted from the registration requirement of the Securities Act of 1933,as amended. These securities may only be sold to qualified institutionalbuyers (“QIBs”), such as the Fund. Any resale of these securities mustgenerally be effected through a sale that is registered under the Act orotherwise exempted from such registration requirements.
† Repurchase agreement collateralized by the following security:2,936,878 United States Treasury Note, 3.625%, 02/15/20.
FOREIGN CURRENCY ABBREVIATIONSAUD Australian DollarCAD Canadian DollarCHF Swiss FrancCNY Chinese Yuan RenminbiDKK Danish KroneEUR European Monetary UnitGBP British Pound SterlingHKD Hong Kong DollarINR Indian RupeeJPY Japanese YenKRW South Korean WonNOK Norwegian KroneSEK Swedish KronaTWD New Taiwan DollarZAR South African Rand
Note: Value for securities denominated in foreign currencies is shown in U.S. dollars.
76 CALAMOS OPEN-END FAMILY OF FUNDS ANNUAL REPORT See accompanying Notes to Financial Statements
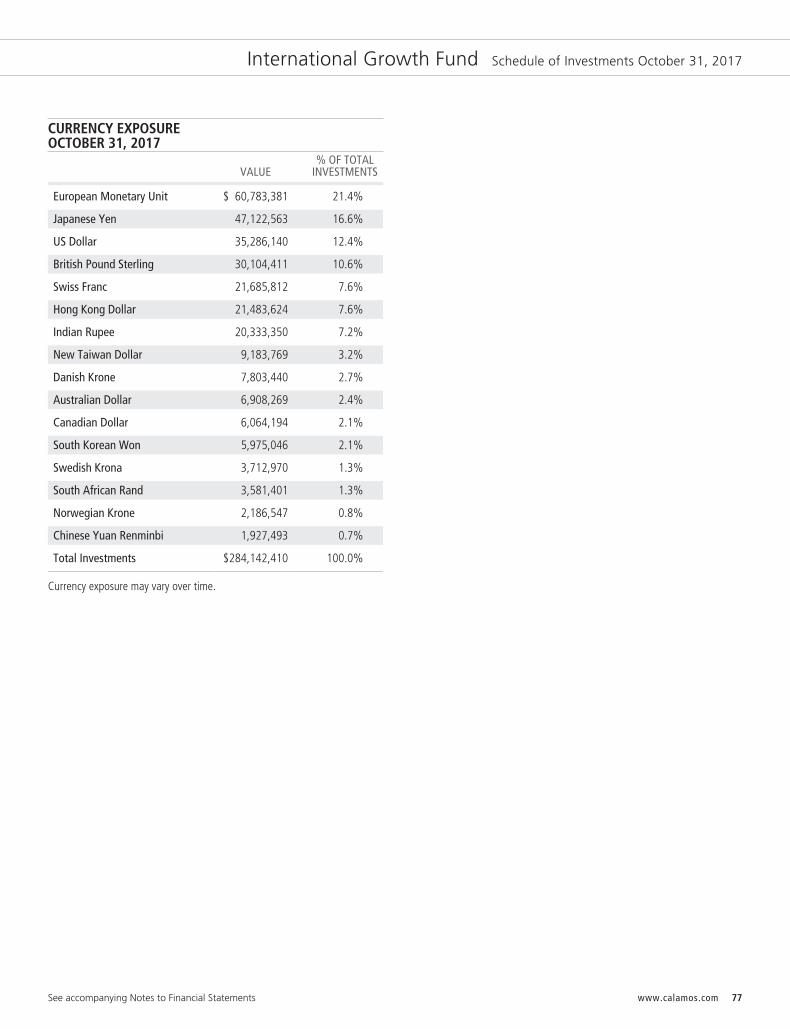
International Growth Fund Schedule of Investments October 31, 2017
CURRENCY EXPOSUREOCTOBER 31, 2017
VALUE% OF TOTAL
INVESTMENTS
European Monetary Unit $ 60,783,381 21.4%
Japanese Yen 47,122,563 16.6%
US Dollar 35,286,140 12.4%
British Pound Sterling 30,104,411 10.6%
Swiss Franc 21,685,812 7.6%
Hong Kong Dollar 21,483,624 7.6%
Indian Rupee 20,333,350 7.2%
New Taiwan Dollar 9,183,769 3.2%
Danish Krone 7,803,440 2.7%
Australian Dollar 6,908,269 2.4%
Canadian Dollar 6,064,194 2.1%
South Korean Won 5,975,046 2.1%
Swedish Krona 3,712,970 1.3%
South African Rand 3,581,401 1.3%
Norwegian Krone 2,186,547 0.8%
Chinese Yuan Renminbi 1,927,493 0.7%
Total Investments $284,142,410 100.0%
Currency exposure may vary over time.
See accompanying Notes to Financial Statements www.calamos.com 77
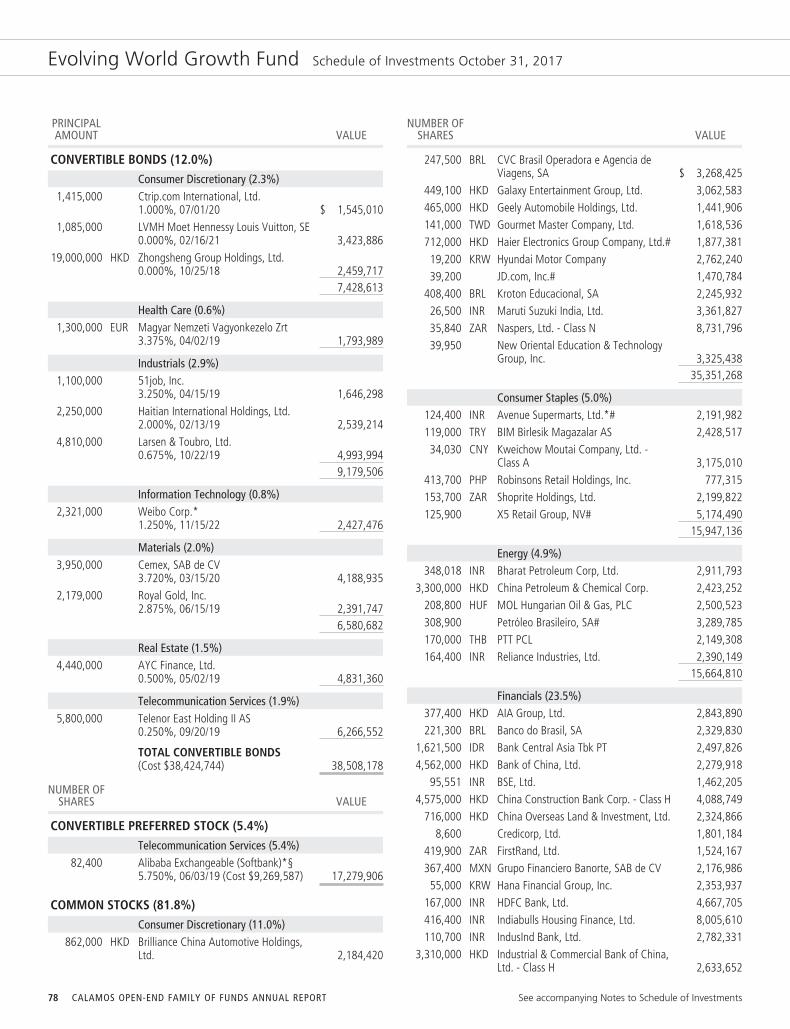
Evolving World Growth Fund Schedule of Investments October 31, 2017
PRINCIPALAMOUNT VALUE
CONVERTIBLE BONDS (12.0%)Consumer Discretionary (2.3%)
1,415,000 Ctrip.com International, Ltd.1.000%, 07/01/20 $ 1,545,010
1,085,000 LVMH Moet Hennessy Louis Vuitton, SE0.000%, 02/16/21 3,423,886
19,000,000 HKD Zhongsheng Group Holdings, Ltd.0.000%, 10/25/18 2,459,717
7,428,613
Health Care (0.6%)1,300,000 EUR Magyar Nemzeti Vagyonkezelo Zrt
3.375%, 04/02/19 1,793,989
Industrials (2.9%)1,100,000 51job, Inc.
3.250%, 04/15/19 1,646,2982,250,000 Haitian International Holdings, Ltd.
2.000%, 02/13/19 2,539,2144,810,000 Larsen & Toubro, Ltd.
0.675%, 10/22/19 4,993,9949,179,506
Information Technology (0.8%)2,321,000 Weibo Corp.*
1.250%, 11/15/22 2,427,476
Materials (2.0%)3,950,000 Cemex, SAB de CV
3.720%, 03/15/20 4,188,9352,179,000 Royal Gold, Inc.
2.875%, 06/15/19 2,391,7476,580,682
Real Estate (1.5%)4,440,000 AYC Finance, Ltd.
0.500%, 05/02/19 4,831,360
Telecommunication Services (1.9%)5,800,000 Telenor East Holding II AS
0.250%, 09/20/19 6,266,552
TOTAL CONVERTIBLE BONDS(Cost $38,424,744) 38,508,178
NUMBER OFSHARES VALUE
CONVERTIBLE PREFERRED STOCK (5.4%)Telecommunication Services (5.4%)
82,400 Alibaba Exchangeable (Softbank)*§5.750%, 06/03/19 (Cost $9,269,587) 17,279,906
COMMON STOCKS (81.8%)Consumer Discretionary (11.0%)
862,000 HKD Brilliance China Automotive Holdings,Ltd. 2,184,420
NUMBER OFSHARES VALUE
247,500 BRL CVC Brasil Operadora e Agencia deViagens, SA $ 3,268,425
449,100 HKD Galaxy Entertainment Group, Ltd. 3,062,583465,000 HKD Geely Automobile Holdings, Ltd. 1,441,906141,000 TWD Gourmet Master Company, Ltd. 1,618,536712,000 HKD Haier Electronics Group Company, Ltd.# 1,877,38119,200 KRW Hyundai Motor Company 2,762,24039,200 JD.com, Inc.# 1,470,784
408,400 BRL Kroton Educacional, SA 2,245,93226,500 INR Maruti Suzuki India, Ltd. 3,361,82735,840 ZAR Naspers, Ltd. - Class N 8,731,79639,950 New Oriental Education & Technology
Group, Inc. 3,325,43835,351,268
Consumer Staples (5.0%)124,400 INR Avenue Supermarts, Ltd.*# 2,191,982119,000 TRY BIM Birlesik Magazalar AS 2,428,51734,030 CNY Kweichow Moutai Company, Ltd. -
Class A 3,175,010413,700 PHP Robinsons Retail Holdings, Inc. 777,315153,700 ZAR Shoprite Holdings, Ltd. 2,199,822125,900 X5 Retail Group, NV# 5,174,490
15,947,136
Energy (4.9%)348,018 INR Bharat Petroleum Corp, Ltd. 2,911,793
3,300,000 HKD China Petroleum & Chemical Corp. 2,423,252208,800 HUF MOL Hungarian Oil & Gas, PLC 2,500,523308,900 Petróleo Brasileiro, SA# 3,289,785170,000 THB PTT PCL 2,149,308164,400 INR Reliance Industries, Ltd. 2,390,149
15,664,810
Financials (23.5%)377,400 HKD AIA Group, Ltd. 2,843,890221,300 BRL Banco do Brasil, SA 2,329,830
1,621,500 IDR Bank Central Asia Tbk PT 2,497,8264,562,000 HKD Bank of China, Ltd. 2,279,918
95,551 INR BSE, Ltd. 1,462,2054,575,000 HKD China Construction Bank Corp. - Class H 4,088,749
716,000 HKD China Overseas Land & Investment, Ltd. 2,324,8668,600 Credicorp, Ltd. 1,801,184
419,900 ZAR FirstRand, Ltd. 1,524,167367,400 MXN Grupo Financiero Banorte, SAB de CV 2,176,98655,000 KRW Hana Financial Group, Inc. 2,353,937
167,000 INR HDFC Bank, Ltd. 4,667,705416,400 INR Indiabulls Housing Finance, Ltd. 8,005,610110,700 INR IndusInd Bank, Ltd. 2,782,331
3,310,000 HKD Industrial & Commercial Bank of China,Ltd. - Class H 2,633,652
78 CALAMOS OPEN-END FAMILY OF FUNDS ANNUAL REPORT See accompanying Notes to Schedule of Investments

Evolving World Growth Fund Schedule of Investments October 31, 2017
NUMBER OFSHARES VALUE
353,700 Itau Unibanco Holding, SA $ 4,530,89724,057 PLN KRUK, SA 1,843,955
2,278,000 THB Muangthai Leasing PCL 2,691,4961,017,000 HKD Ping An Insurance Group Company of
China, Ltd. 8,937,34153,264 Qudian, Inc.# 1,326,274
384,000 Sberbank of Russia PJSC 5,510,400388,000 PHP Security Bank Corp. 1,848,87293,600 KRW Shinhan Financial Group Company, Ltd. 4,204,343
205,000 INR State Bank of India 968,17175,634,605
Health Care (0.5%)936,000 HKD CSPC Pharmaceutical Group, Ltd. 1,628,391
Industrials (5.4%)1,264,780 INR Bharat Electronics, Ltd. 3,608,452
11,600 INR Eicher Motors, Ltd. 5,777,739286,360 TWD Hiwin Technologies Corp. 2,874,152136,460 INR Larsen & Toubro, Ltd. 2,577,399
5,360,000 HKD Lonking Holdings, Ltd. 2,411,73517,249,477
Information Technology (24.8%)25,600 58.com, Inc.# 1,719,55217,980 Baidu, Inc.# 4,386,041
295 HKD China Literature, Ltd.*# —544,511 CNY Hangzhou Hikvision Digital Technology
Company, Ltd. - Class A 3,229,754752,000 TWD Hon Hai Precision Industry Company,
Ltd. 2,795,1424,991,500 MYR My EG Services Bhd 2,582,249
2,100 KRW NAVER Corp. 1,678,4716,354 KRW Samsung Electronics Company, Ltd. 15,663,286
169,000 TWD Silergy Corp. 3,650,18823,500 KRW SK Hynix, Inc. 1,732,719
217,318 HKD Sunny Optical Technology GroupCompany, Ltd. 3,187,498
2,035,649 TWD Taiwan Semiconductor ManufacturingCompany, Ltd. 16,456,804
370,700 HKD Tencent Holdings, Ltd. 16,661,151460,300 INR Vakrangee, Ltd. 3,998,75159,200 Yandex, NV - Class A# 2,002,736
79,744,342
Materials (3.6%)705,250 GBP Glencore, PLC# 3,401,562545,400 INR Hindustan Zinc, Ltd. 2,657,68810,500 KRW LG Chem, Ltd. 3,785,846
161,900 Vale, SA# 1,585,00111,430,097
NUMBER OFSHARES VALUE
Real Estate (1.8%)965,000 HKD Country Garden Holdings Company,
Ltd. $ 1,529,7281,201,000 AED Emaar Properties PJSC 2,710,246
136,600 BRL Iguatemi Empresa de Shopping Centers,SA 1,606,813
5,846,787
Telecommunication Services (1.3%)133,000 América Móvil, SAB de CV - Series L 2,276,960192,000 HKD China Mobile, Ltd. 1,931,207
4,208,167
TOTAL COMMON STOCKS(Cost $187,513,282) 262,705,080
NUMBER OFCONTRACTS/NOTIONALAMOUNT VALUE
PURCHASED OPTIONS (0.6%)#Information Technology (0.1%)
13513,500
Baidu, Inc.Call, 03/16/18, Strike $240.00 289,913
Other (0.3%)1,390
139,000Ishares MSCI Brazil Capped ETFCall, 12/15/17, Strike $40.00 244,640
7,250725,000
iShares MSCI Emerging Markets ETFPut, 12/15/17, Strike $45.50 496,625
5,000500,000
Ishares MSCI India ETFPut, 12/15/17, Strike $33.00 112,500
3,385338,500
Vaneck Vectors Russia ETFCall, 01/19/18, Strike $22.00 162,480
1,016,245
Consumer Staples (0.1%)345
34,500Estee Lauder Companies Inc.Call, 04/20/18, Strike $110.00 250,125
Financials (0.1%)2,200
220,000China Life Insurance Company, Ltd.Call, 04/20/18, Strike $17.50 192,500
TOTAL PURCHASED OPTIONS(Cost $2,894,665) 1,748,783
NUMBER OFSHARES VALUE
SHORT TERM INVESTMENTS (2.0%)
3,277,142 Fidelity Prime Money Market Fund -Institutional Class 3,278,125
See accompanying Notes to Schedule of Investments www.calamos.com 79
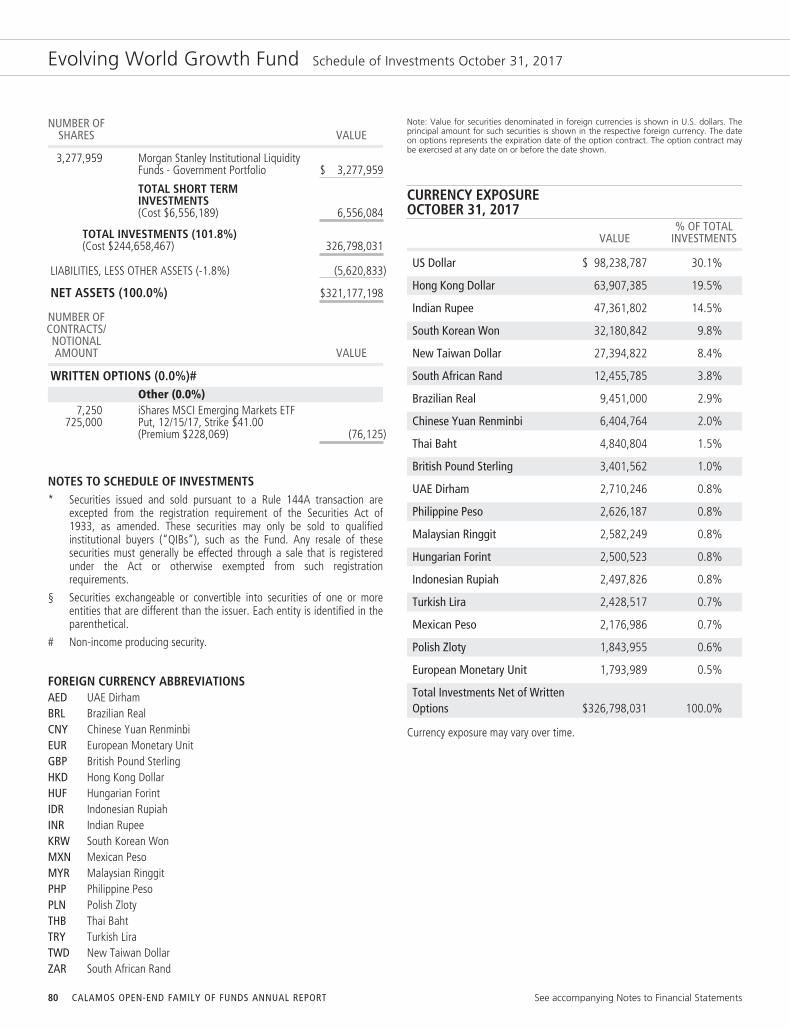
Evolving World Growth Fund Schedule of Investments October 31, 2017
NUMBER OFSHARES VALUE
3,277,959 Morgan Stanley Institutional LiquidityFunds - Government Portfolio $ 3,277,959
TOTAL SHORT TERMINVESTMENTS(Cost $6,556,189) 6,556,084
TOTAL INVESTMENTS (101.8%)(Cost $244,658,467) 326,798,031
LIABILITIES, LESS OTHER ASSETS (-1.8%) (5,620,833)
NET ASSETS (100.0%) $321,177,198
NUMBER OFCONTRACTS/NOTIONALAMOUNT VALUE
WRITTEN OPTIONS (0.0%)#Other (0.0%)
7,250725,000
iShares MSCI Emerging Markets ETFPut, 12/15/17, Strike $41.00(Premium $228,069) (76,125)
NOTES TO SCHEDULE OF INVESTMENTS* Securities issued and sold pursuant to a Rule 144A transaction are
excepted from the registration requirement of the Securities Act of1933, as amended. These securities may only be sold to qualifiedinstitutional buyers (“QIBs”), such as the Fund. Any resale of thesesecurities must generally be effected through a sale that is registeredunder the Act or otherwise exempted from such registrationrequirements.
§ Securities exchangeable or convertible into securities of one or moreentities that are different than the issuer. Each entity is identified in theparenthetical.
# Non-income producing security.
FOREIGN CURRENCY ABBREVIATIONSAED UAE DirhamBRL Brazilian RealCNY Chinese Yuan RenminbiEUR European Monetary UnitGBP British Pound SterlingHKD Hong Kong DollarHUF Hungarian ForintIDR Indonesian RupiahINR Indian RupeeKRW South Korean WonMXN Mexican PesoMYR Malaysian RinggitPHP Philippine PesoPLN Polish ZlotyTHB Thai BahtTRY Turkish LiraTWD New Taiwan DollarZAR South African Rand
Note: Value for securities denominated in foreign currencies is shown in U.S. dollars. Theprincipal amount for such securities is shown in the respective foreign currency. The dateon options represents the expiration date of the option contract. The option contract maybe exercised at any date on or before the date shown.
CURRENCY EXPOSUREOCTOBER 31, 2017
VALUE% OF TOTAL
INVESTMENTS
US Dollar $ 98,238,787 30.1%
Hong Kong Dollar 63,907,385 19.5%
Indian Rupee 47,361,802 14.5%
South Korean Won 32,180,842 9.8%
New Taiwan Dollar 27,394,822 8.4%
South African Rand 12,455,785 3.8%
Brazilian Real 9,451,000 2.9%
Chinese Yuan Renminbi 6,404,764 2.0%
Thai Baht 4,840,804 1.5%
British Pound Sterling 3,401,562 1.0%
UAE Dirham 2,710,246 0.8%
Philippine Peso 2,626,187 0.8%
Malaysian Ringgit 2,582,249 0.8%
Hungarian Forint 2,500,523 0.8%
Indonesian Rupiah 2,497,826 0.8%
Turkish Lira 2,428,517 0.7%
Mexican Peso 2,176,986 0.7%
Polish Zloty 1,843,955 0.6%
European Monetary Unit 1,793,989 0.5%
Total Investments Net of WrittenOptions $326,798,031 100.0%
Currency exposure may vary over time.
80 CALAMOS OPEN-END FAMILY OF FUNDS ANNUAL REPORT See accompanying Notes to Financial Statements
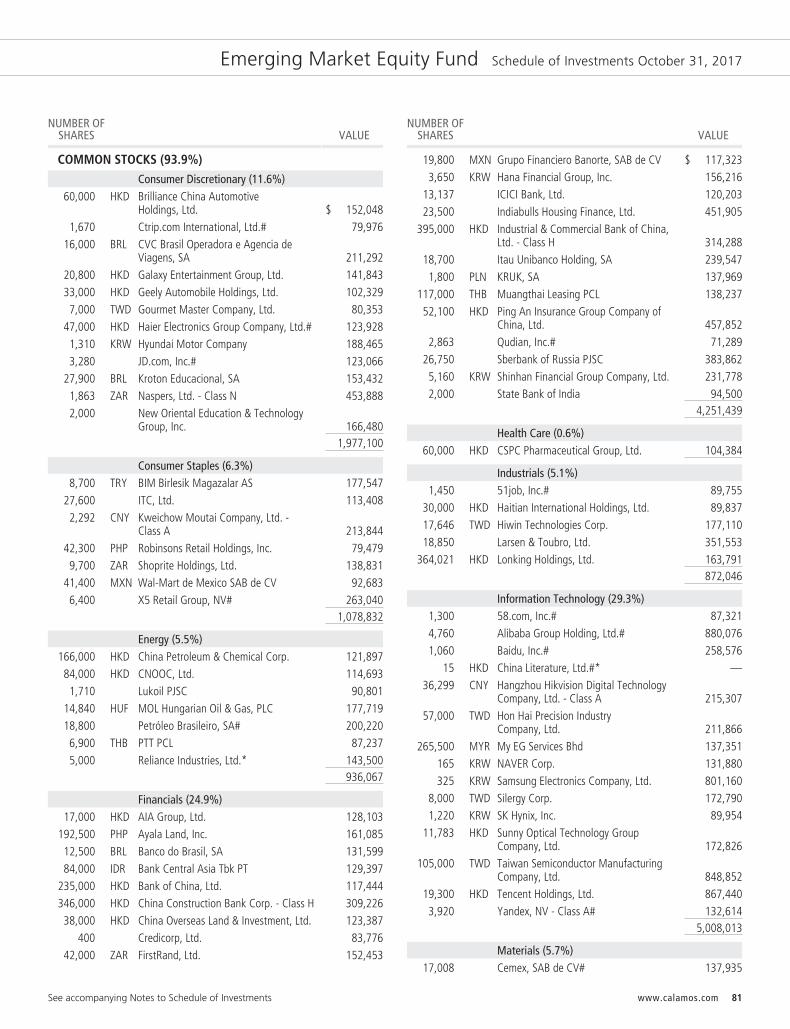
Emerging Market Equity Fund Schedule of Investments October 31, 2017
NUMBER OFSHARES VALUE
COMMON STOCKS (93.9%)Consumer Discretionary (11.6%)
60,000 HKD Brilliance China AutomotiveHoldings, Ltd. $ 152,048
1,670 Ctrip.com International, Ltd.# 79,97616,000 BRL CVC Brasil Operadora e Agencia de
Viagens, SA 211,29220,800 HKD Galaxy Entertainment Group, Ltd. 141,84333,000 HKD Geely Automobile Holdings, Ltd. 102,3297,000 TWD Gourmet Master Company, Ltd. 80,353
47,000 HKD Haier Electronics Group Company, Ltd.# 123,9281,310 KRW Hyundai Motor Company 188,4653,280 JD.com, Inc.# 123,066
27,900 BRL Kroton Educacional, SA 153,4321,863 ZAR Naspers, Ltd. - Class N 453,8882,000 New Oriental Education & Technology
Group, Inc. 166,4801,977,100
Consumer Staples (6.3%)8,700 TRY BIM Birlesik Magazalar AS 177,547
27,600 ITC, Ltd. 113,4082,292 CNY Kweichow Moutai Company, Ltd. -
Class A 213,84442,300 PHP Robinsons Retail Holdings, Inc. 79,4799,700 ZAR Shoprite Holdings, Ltd. 138,831
41,400 MXN Wal-Mart de Mexico SAB de CV 92,6836,400 X5 Retail Group, NV# 263,040
1,078,832
Energy (5.5%)166,000 HKD China Petroleum & Chemical Corp. 121,89784,000 HKD CNOOC, Ltd. 114,6931,710 Lukoil PJSC 90,801
14,840 HUF MOL Hungarian Oil & Gas, PLC 177,71918,800 Petróleo Brasileiro, SA# 200,2206,900 THB PTT PCL 87,2375,000 Reliance Industries, Ltd.* 143,500
936,067
Financials (24.9%)17,000 HKD AIA Group, Ltd. 128,103
192,500 PHP Ayala Land, Inc. 161,08512,500 BRL Banco do Brasil, SA 131,59984,000 IDR Bank Central Asia Tbk PT 129,397
235,000 HKD Bank of China, Ltd. 117,444346,000 HKD China Construction Bank Corp. - Class H 309,22638,000 HKD China Overseas Land & Investment, Ltd. 123,387
400 Credicorp, Ltd. 83,77642,000 ZAR FirstRand, Ltd. 152,453
NUMBER OFSHARES VALUE
19,800 MXN Grupo Financiero Banorte, SAB de CV $ 117,3233,650 KRW Hana Financial Group, Inc. 156,216
13,137 ICICI Bank, Ltd. 120,20323,500 Indiabulls Housing Finance, Ltd. 451,905
395,000 HKD Industrial & Commercial Bank of China,Ltd. - Class H 314,288
18,700 Itau Unibanco Holding, SA 239,5471,800 PLN KRUK, SA 137,969
117,000 THB Muangthai Leasing PCL 138,23752,100 HKD Ping An Insurance Group Company of
China, Ltd. 457,8522,863 Qudian, Inc.# 71,289
26,750 Sberbank of Russia PJSC 383,8625,160 KRW Shinhan Financial Group Company, Ltd. 231,7782,000 State Bank of India 94,500
4,251,439
Health Care (0.6%)60,000 HKD CSPC Pharmaceutical Group, Ltd. 104,384
Industrials (5.1%)1,450 51job, Inc.# 89,755
30,000 HKD Haitian International Holdings, Ltd. 89,83717,646 TWD Hiwin Technologies Corp. 177,11018,850 Larsen & Toubro, Ltd. 351,553
364,021 HKD Lonking Holdings, Ltd. 163,791872,046
Information Technology (29.3%)1,300 58.com, Inc.# 87,3214,760 Alibaba Group Holding, Ltd.# 880,0761,060 Baidu, Inc.# 258,576
15 HKD China Literature, Ltd.#* —36,299 CNY Hangzhou Hikvision Digital Technology
Company, Ltd. - Class A 215,30757,000 TWD Hon Hai Precision Industry
Company, Ltd. 211,866265,500 MYR My EG Services Bhd 137,351
165 KRW NAVER Corp. 131,880325 KRW Samsung Electronics Company, Ltd. 801,160
8,000 TWD Silergy Corp. 172,7901,220 KRW SK Hynix, Inc. 89,954
11,783 HKD Sunny Optical Technology GroupCompany, Ltd. 172,826
105,000 TWD Taiwan Semiconductor ManufacturingCompany, Ltd. 848,852
19,300 HKD Tencent Holdings, Ltd. 867,4403,920 Yandex, NV - Class A# 132,614
5,008,013
Materials (5.7%)17,008 Cemex, SAB de CV# 137,935
See accompanying Notes to Schedule of Investments www.calamos.com 81
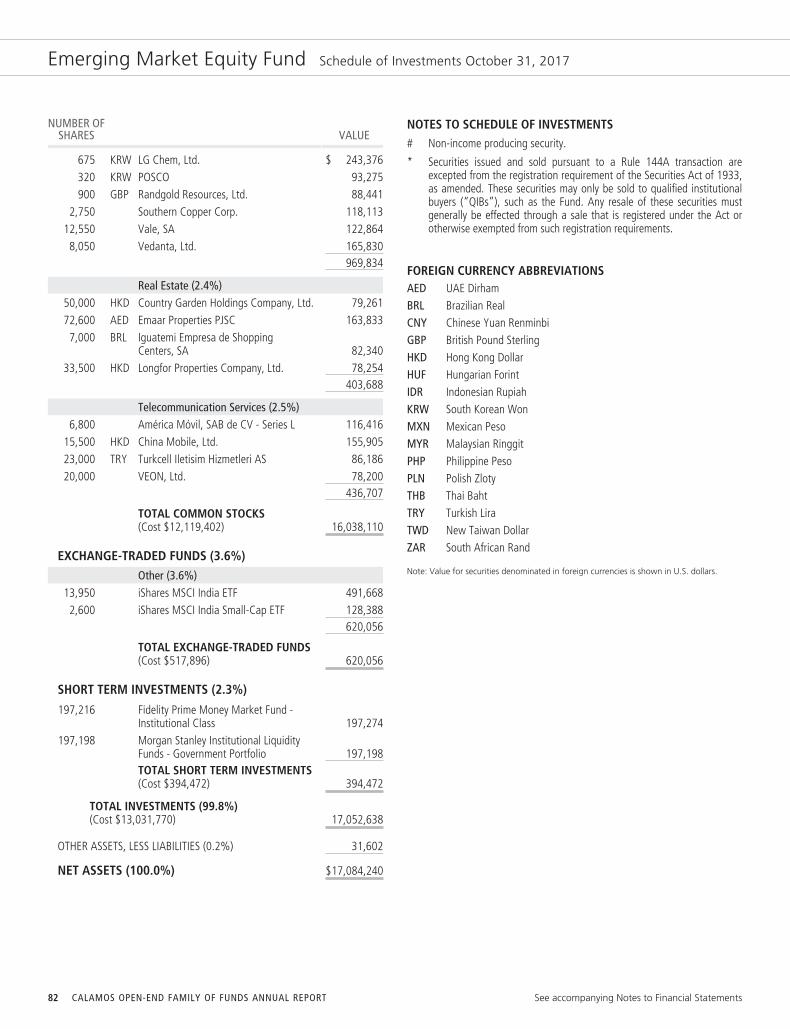
Emerging Market Equity Fund Schedule of Investments October 31, 2017
NUMBER OFSHARES VALUE
675 KRW LG Chem, Ltd. $ 243,376320 KRW POSCO 93,275900 GBP Randgold Resources, Ltd. 88,441
2,750 Southern Copper Corp. 118,11312,550 Vale, SA 122,8648,050 Vedanta, Ltd. 165,830
969,834
Real Estate (2.4%)50,000 HKD Country Garden Holdings Company, Ltd. 79,26172,600 AED Emaar Properties PJSC 163,8337,000 BRL Iguatemi Empresa de Shopping
Centers, SA 82,34033,500 HKD Longfor Properties Company, Ltd. 78,254
403,688
Telecommunication Services (2.5%)6,800 América Móvil, SAB de CV - Series L 116,416
15,500 HKD China Mobile, Ltd. 155,90523,000 TRY Turkcell Iletisim Hizmetleri AS 86,18620,000 VEON, Ltd. 78,200
436,707
TOTAL COMMON STOCKS(Cost $12,119,402) 16,038,110
EXCHANGE-TRADED FUNDS (3.6%)Other (3.6%)
13,950 iShares MSCI India ETF 491,6682,600 iShares MSCI India Small-Cap ETF 128,388
620,056
TOTAL EXCHANGE-TRADED FUNDS(Cost $517,896) 620,056
SHORT TERM INVESTMENTS (2.3%)
197,216 Fidelity Prime Money Market Fund -Institutional Class 197,274
197,198 Morgan Stanley Institutional LiquidityFunds - Government Portfolio 197,198TOTAL SHORT TERM INVESTMENTS(Cost $394,472) 394,472
TOTAL INVESTMENTS (99.8%)(Cost $13,031,770) 17,052,638
OTHER ASSETS, LESS LIABILITIES (0.2%) 31,602
NET ASSETS (100.0%) $17,084,240
NOTES TO SCHEDULE OF INVESTMENTS# Non-income producing security.
* Securities issued and sold pursuant to a Rule 144A transaction areexcepted from the registration requirement of the Securities Act of 1933,as amended. These securities may only be sold to qualified institutionalbuyers (“QIBs”), such as the Fund. Any resale of these securities mustgenerally be effected through a sale that is registered under the Act orotherwise exempted from such registration requirements.
FOREIGN CURRENCY ABBREVIATIONSAED UAE DirhamBRL Brazilian RealCNY Chinese Yuan RenminbiGBP British Pound SterlingHKD Hong Kong DollarHUF Hungarian ForintIDR Indonesian RupiahKRW South Korean WonMXN Mexican PesoMYR Malaysian RinggitPHP Philippine PesoPLN Polish ZlotyTHB Thai BahtTRY Turkish LiraTWD New Taiwan DollarZAR South African Rand
Note: Value for securities denominated in foreign currencies is shown in U.S. dollars.
82 CALAMOS OPEN-END FAMILY OF FUNDS ANNUAL REPORT See accompanying Notes to Financial Statements

Emerging Market Equity Fund Schedule of Investments October 31, 2017
CURRENCY EXPOSUREOCTOBER 31, 2017
VALUE% OF TOTAL
INVESTMENTS
US Dollar $ 6,179,354 36.2%
Hong Kong Dollar 3,918,736 23.0%
South Korean Won 1,936,104 11.4%
New Taiwan Dollar 1,490,971 8.8%
South African Rand 745,172 4.4%
Brazilian Real 578,663 3.4%
Chinese Yuan Renminbi 429,151 2.5%
Turkish Lira 263,733 1.5%
Philippine Peso 240,564 1.4%
Thai Baht 225,474 1.3%
Mexican Peso 210,006 1.2%
Hungarian Forint 177,719 1.0%
UAE Dirham 163,833 1.0%
Polish Zloty 137,969 0.8%
Malaysian Ringgit 137,351 0.8%
Indonesian Rupiah 129,397 0.8%
British Pound Sterling 88,441 0.5%
Total Investments $17,052,638 100.0%
Currency exposure may vary over time.
See accompanying Notes to Financial Statements www.calamos.com 83

Global Equity Fund Schedule of Investments October 31, 2017
NUMBER OFSHARES VALUE
COMMON STOCKS (98.4%)Consumer Discretionary (10.7%)
2,460 Amazon.com, Inc.# $ 2,718,98933,000 CAD Canada Goose Holdings, Inc.# 707,01547,236 D.R. Horton, Inc. 2,088,30311,400 SEK Evolution Gaming Group, AB* 817,4563,700 EUR LVMH Moet Hennessy Louis Vuitton, SE 1,103,5745,700 Marriott International, Inc. - Class A 681,0363,700 Netflix, Inc.# 726,791
11,600 New Oriental Education & TechnologyGroup, Inc. 965,584
855 Priceline Group, Inc.# 1,634,72649,891 PulteGroup, Inc. 1,508,20511,900 Walt Disney Company 1,163,939
14,115,618
Consumer Staples (8.6%)22,000 Blue Buffalo Pet Products, Inc.# 636,46032,083 GBP Diageo, PLC 1,095,59716,830 EUR Kerry Group, PLC - Class A 1,694,99817,200 Monster Beverage Corp.# 996,39628,900 CHF Nestlé, SA 2,431,604
209,000 AUD Treasury Wine Estates, Ltd. 2,508,82416,800 EUR Unilever, NV 975,91125,000 X5 Retail Group, NV# 1,027,500
11,367,290
Energy (3.2%)6,150 EOG Resources, Inc. 614,200
23,000 Halliburton Company 983,0207,300 Pioneer Natural Resources Company 1,092,591
47,600 EUR Royal Dutch Shell, PLC - Class A 1,495,1244,184,935
Financials (13.7%)189,600 HKD AIA Group, Ltd. 1,428,72770,000 Bank of America Corp. 1,917,30010,500 EUR BNP Paribas, SA 819,52024,100 Citigroup, Inc. 1,771,35062,684 CHF Credit Suisse Group, AG# 987,82724,000 E*TRADE Financial Corp.# 1,046,16064,000 INR HDFC Bank, Ltd. 1,788,82177,000 INR Indiabulls Housing Finance, Ltd. 1,480,38413,800 JPMorgan Chase & Company 1,388,418
115,500 HKD Ping An Insurance Group Company ofChina, Ltd. 1,015,008
57,000 GBP Prudential, PLC 1,399,086100,000 GBP Sanne Group, PLC 1,061,99772,200 Sberbank of Russia PJSC 1,036,070
NUMBER OFSHARES VALUE
50,000 EUR UniCredit S.p.A# $ 955,53218,096,200
Health Care (8.4%)9,780 Alexion Pharmaceuticals, Inc.# 1,170,275
37,810 Baxter International, Inc. 2,437,61110,000 Bristol-Myers Squibb Company 616,60010,600 Celgene Corp.# 1,070,28263,000 GBP Clinigen Healthcare, Ltd.# 984,83729,138 DKK H Lundbeck, A/S 1,732,1912,600 Regeneron Pharmaceuticals, Inc.# 1,046,8123,700 CHF Roche Holding, AG 855,1855,900 UnitedHealth Group, Inc. 1,240,298
11,154,091
Industrials (14.1%)39,300 GBP Ashtead Group, PLC 1,012,34919,800 CSX Corp. 998,5141,040 CHF dormakaba Holding AG# 1,029,3632,750 INR Eicher Motors, Ltd. 1,369,723
17,700 JPY en-japan, Inc. 682,61213,100 JPY FANUC Corp. 3,063,09322,400 DKK FLSmidth & Company, A/S 1,535,561
115,000 GBP International Consolidated AirlinesGroup, SA 971,274
18,909 EUR KION Group, AG 1,515,13487,100 JPY Komatsu, Ltd. 2,846,06052,675 INR Larsen & Toubro, Ltd. 994,9035,200 Raytheon Company 937,040
19,530 EUR Schneider Electric, SE# 1,715,93018,671,556
Information Technology (34.0%)24,100 Alibaba Group Holding, Ltd.# 4,455,8493,725 Alphabet, Inc. - Class A# 3,848,074
29,918 Apple, Inc. 5,057,3398,500 EUR ASML Holding, NV 1,533,6505,300 Broadcom, Ltd. 1,398,723
71 HKD China Literature, Ltd.#* —18,700 Facebook, Inc. - Class A# 3,367,122
139,983 CNY Hangzhou Hikvision Digital TechnologyCompany, Ltd. - Class A 830,306
2,800 JPY Keyence Corp. 1,554,63019,261 GBP Keywords Studios, PLC 408,7926,100 Lam Research Corp. 1,272,277
15,900 Lumentum Holdings, Inc.# 1,004,08510,100 MasterCard, Inc. - Class A 1,502,5774,200 JPY Nintendo Company, Ltd. 1,629,4393,600 NVIDIA Corp. 744,516
57,200 ON Semiconductor Corp.# 1,219,504
84 CALAMOS OPEN-END FAMILY OF FUNDS ANNUAL REPORT See accompanying Notes to Schedule of Investments
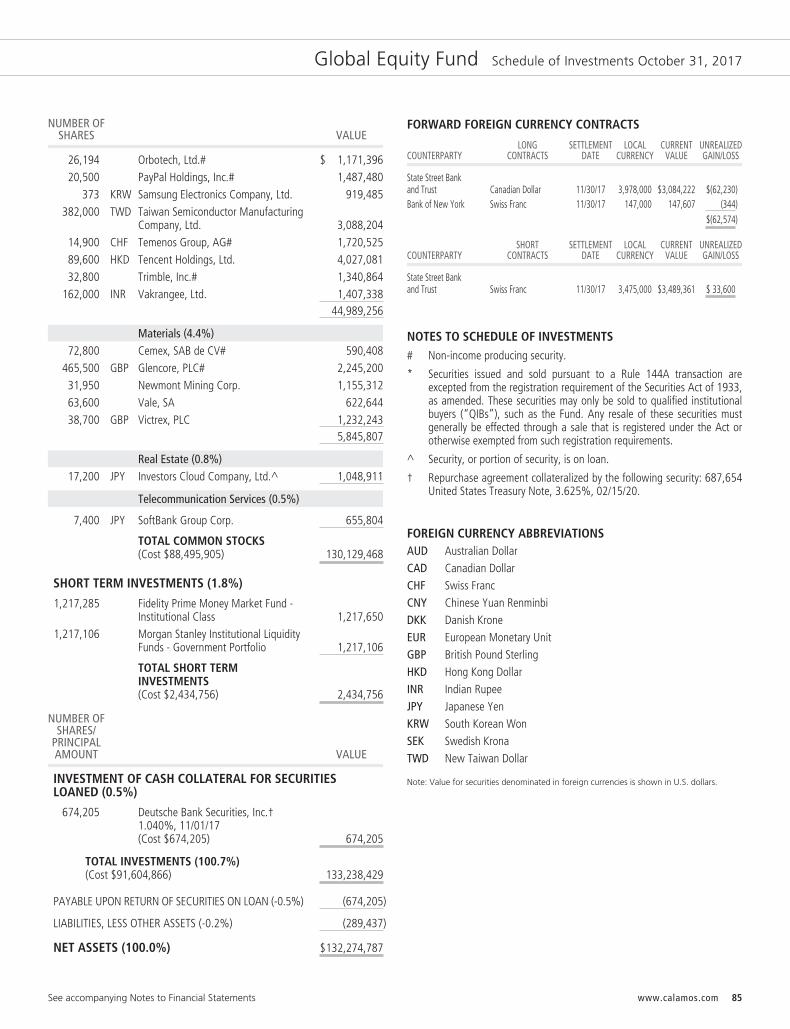
Global Equity Fund Schedule of Investments October 31, 2017
NUMBER OFSHARES VALUE
26,194 Orbotech, Ltd.# $ 1,171,39620,500 PayPal Holdings, Inc.# 1,487,480
373 KRW Samsung Electronics Company, Ltd. 919,485382,000 TWD Taiwan Semiconductor Manufacturing
Company, Ltd. 3,088,20414,900 CHF Temenos Group, AG# 1,720,52589,600 HKD Tencent Holdings, Ltd. 4,027,08132,800 Trimble, Inc.# 1,340,864
162,000 INR Vakrangee, Ltd. 1,407,33844,989,256
Materials (4.4%)72,800 Cemex, SAB de CV# 590,408
465,500 GBP Glencore, PLC# 2,245,20031,950 Newmont Mining Corp. 1,155,31263,600 Vale, SA 622,64438,700 GBP Victrex, PLC 1,232,243
5,845,807
Real Estate (0.8%)17,200 JPY Investors Cloud Company, Ltd.^ 1,048,911
Telecommunication Services (0.5%)
7,400 JPY SoftBank Group Corp. 655,804
TOTAL COMMON STOCKS(Cost $88,495,905) 130,129,468
SHORT TERM INVESTMENTS (1.8%)
1,217,285 Fidelity Prime Money Market Fund -Institutional Class 1,217,650
1,217,106 Morgan Stanley Institutional LiquidityFunds - Government Portfolio 1,217,106
TOTAL SHORT TERMINVESTMENTS(Cost $2,434,756) 2,434,756
NUMBER OFSHARES/
PRINCIPALAMOUNT VALUE
INVESTMENT OF CASH COLLATERAL FOR SECURITIESLOANED (0.5%)
674,205 Deutsche Bank Securities, Inc.†1.040%, 11/01/17(Cost $674,205) 674,205
TOTAL INVESTMENTS (100.7%)(Cost $91,604,866) 133,238,429
PAYABLE UPON RETURN OF SECURITIES ON LOAN (-0.5%) (674,205)
LIABILITIES, LESS OTHER ASSETS (-0.2%) (289,437)
NET ASSETS (100.0%) $132,274,787
FORWARD FOREIGN CURRENCY CONTRACTS
COUNTERPARTYLONG
CONTRACTSSETTLEMENT
DATELOCAL
CURRENCYCURRENT
VALUEUNREALIZEDGAIN/LOSS
State Street Bankand Trust Canadian Dollar 11/30/17 3,978,000 $3,084,222 $(62,230)Bank of New York Swiss Franc 11/30/17 147,000 147,607 (344)
$(62,574)
COUNTERPARTYSHORT
CONTRACTSSETTLEMENT
DATELOCAL
CURRENCYCURRENT
VALUEUNREALIZEDGAIN/LOSS
State Street Bankand Trust Swiss Franc 11/30/17 3,475,000 $3,489,361 $ 33,600
NOTES TO SCHEDULE OF INVESTMENTS# Non-income producing security.
* Securities issued and sold pursuant to a Rule 144A transaction areexcepted from the registration requirement of the Securities Act of 1933,as amended. These securities may only be sold to qualified institutionalbuyers (“QIBs”), such as the Fund. Any resale of these securities mustgenerally be effected through a sale that is registered under the Act orotherwise exempted from such registration requirements.
^ Security, or portion of security, is on loan.
† Repurchase agreement collateralized by the following security: 687,654United States Treasury Note, 3.625%, 02/15/20.
FOREIGN CURRENCY ABBREVIATIONSAUD Australian DollarCAD Canadian DollarCHF Swiss FrancCNY Chinese Yuan RenminbiDKK Danish KroneEUR European Monetary UnitGBP British Pound SterlingHKD Hong Kong DollarINR Indian RupeeJPY Japanese YenKRW South Korean WonSEK Swedish KronaTWD New Taiwan Dollar
Note: Value for securities denominated in foreign currencies is shown in U.S. dollars.
See accompanying Notes to Financial Statements www.calamos.com 85
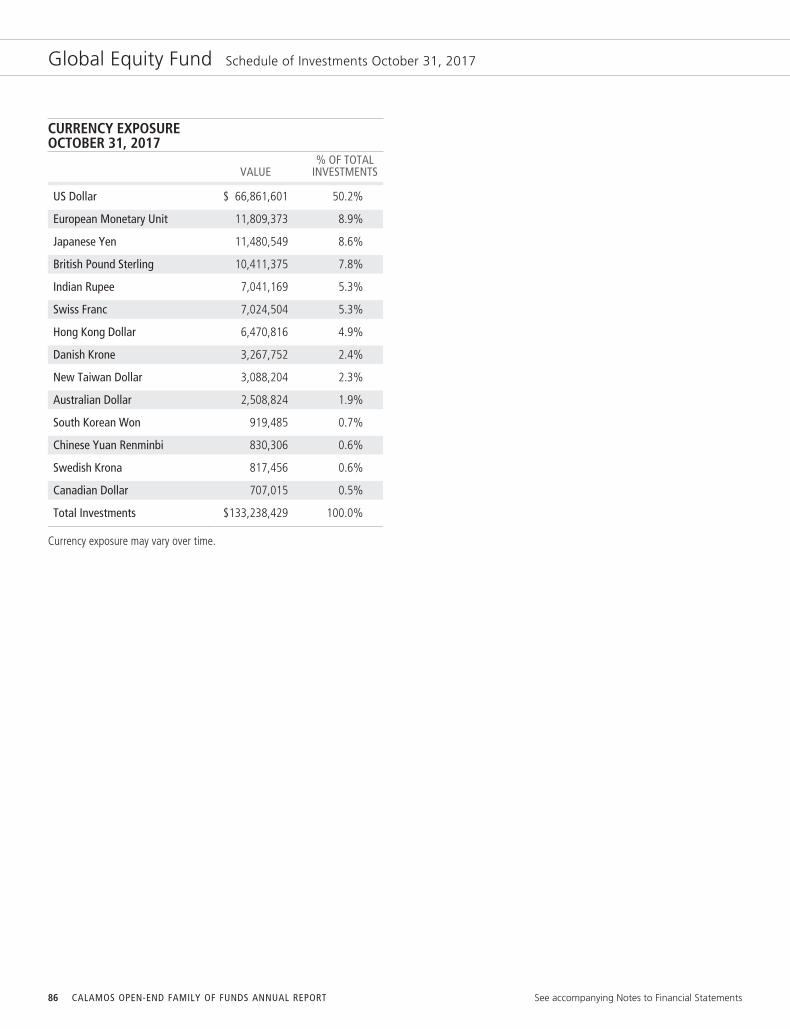
Global Equity Fund Schedule of Investments October 31, 2017
CURRENCY EXPOSUREOCTOBER 31, 2017
VALUE% OF TOTAL
INVESTMENTS
US Dollar $ 66,861,601 50.2%
European Monetary Unit 11,809,373 8.9%
Japanese Yen 11,480,549 8.6%
British Pound Sterling 10,411,375 7.8%
Indian Rupee 7,041,169 5.3%
Swiss Franc 7,024,504 5.3%
Hong Kong Dollar 6,470,816 4.9%
Danish Krone 3,267,752 2.4%
New Taiwan Dollar 3,088,204 2.3%
Australian Dollar 2,508,824 1.9%
South Korean Won 919,485 0.7%
Chinese Yuan Renminbi 830,306 0.6%
Swedish Krona 817,456 0.6%
Canadian Dollar 707,015 0.5%
Total Investments $133,238,429 100.0%
Currency exposure may vary over time.
86 CALAMOS OPEN-END FAMILY OF FUNDS ANNUAL REPORT See accompanying Notes to Financial Statements
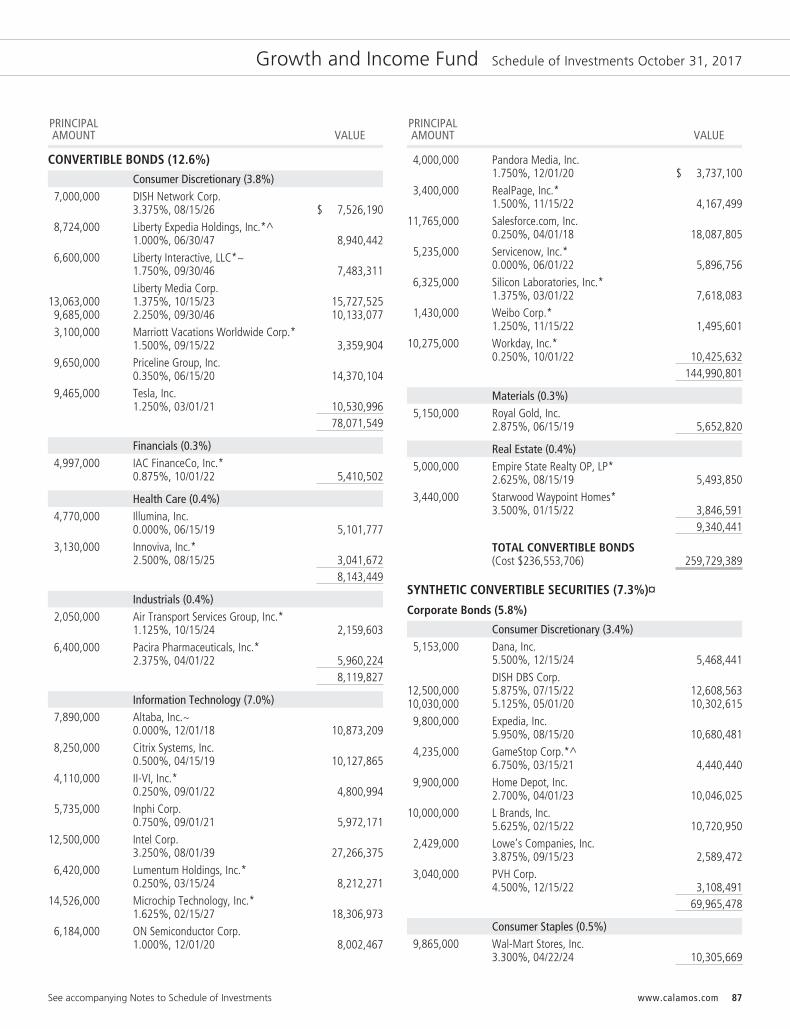
Growth and Income Fund Schedule of Investments October 31, 2017
PRINCIPALAMOUNT VALUE
CONVERTIBLE BONDS (12.6%)Consumer Discretionary (3.8%)
7,000,000 DISH Network Corp.3.375%, 08/15/26 $ 7,526,190
8,724,000 Liberty Expedia Holdings, Inc.*^1.000%, 06/30/47 8,940,442
6,600,000 Liberty Interactive, LLC*~1.750%, 09/30/46 7,483,311Liberty Media Corp.
13,063,000 1.375%, 10/15/23 15,727,5259,685,000 2.250%, 09/30/46 10,133,0773,100,000 Marriott Vacations Worldwide Corp.*
1.500%, 09/15/22 3,359,9049,650,000 Priceline Group, Inc.
0.350%, 06/15/20 14,370,1049,465,000 Tesla, Inc.
1.250%, 03/01/21 10,530,99678,071,549
Financials (0.3%)4,997,000 IAC FinanceCo, Inc.*
0.875%, 10/01/22 5,410,502
Health Care (0.4%)4,770,000 Illumina, Inc.
0.000%, 06/15/19 5,101,7773,130,000 Innoviva, Inc.*
2.500%, 08/15/25 3,041,6728,143,449
Industrials (0.4%)2,050,000 Air Transport Services Group, Inc.*
1.125%, 10/15/24 2,159,6036,400,000 Pacira Pharmaceuticals, Inc.*
2.375%, 04/01/22 5,960,2248,119,827
Information Technology (7.0%)7,890,000 Altaba, Inc.~
0.000%, 12/01/18 10,873,2098,250,000 Citrix Systems, Inc.
0.500%, 04/15/19 10,127,8654,110,000 II-VI, Inc.*
0.250%, 09/01/22 4,800,9945,735,000 Inphi Corp.
0.750%, 09/01/21 5,972,17112,500,000 Intel Corp.
3.250%, 08/01/39 27,266,3756,420,000 Lumentum Holdings, Inc.*
0.250%, 03/15/24 8,212,27114,526,000 Microchip Technology, Inc.*
1.625%, 02/15/27 18,306,9736,184,000 ON Semiconductor Corp.
1.000%, 12/01/20 8,002,467
PRINCIPALAMOUNT VALUE
4,000,000 Pandora Media, Inc.1.750%, 12/01/20 $ 3,737,100
3,400,000 RealPage, Inc.*1.500%, 11/15/22 4,167,499
11,765,000 Salesforce.com, Inc.0.250%, 04/01/18 18,087,805
5,235,000 Servicenow, Inc.*0.000%, 06/01/22 5,896,756
6,325,000 Silicon Laboratories, Inc.*1.375%, 03/01/22 7,618,083
1,430,000 Weibo Corp.*1.250%, 11/15/22 1,495,601
10,275,000 Workday, Inc.*0.250%, 10/01/22 10,425,632
144,990,801
Materials (0.3%)5,150,000 Royal Gold, Inc.
2.875%, 06/15/19 5,652,820
Real Estate (0.4%)5,000,000 Empire State Realty OP, LP*
2.625%, 08/15/19 5,493,8503,440,000 Starwood Waypoint Homes*
3.500%, 01/15/22 3,846,5919,340,441
TOTAL CONVERTIBLE BONDS(Cost $236,553,706) 259,729,389
SYNTHETIC CONVERTIBLE SECURITIES (7.3%)¤
Corporate Bonds (5.8%)
Consumer Discretionary (3.4%)5,153,000 Dana, Inc.
5.500%, 12/15/24 5,468,441DISH DBS Corp.
12,500,000 5.875%, 07/15/22 12,608,56310,030,000 5.125%, 05/01/20 10,302,6159,800,000 Expedia, Inc.
5.950%, 08/15/20 10,680,4814,235,000 GameStop Corp.*^
6.750%, 03/15/21 4,440,4409,900,000 Home Depot, Inc.
2.700%, 04/01/23 10,046,02510,000,000 L Brands, Inc.
5.625%, 02/15/22 10,720,9502,429,000 Lowe’s Companies, Inc.
3.875%, 09/15/23 2,589,4723,040,000 PVH Corp.
4.500%, 12/15/22 3,108,49169,965,478
Consumer Staples (0.5%)9,865,000 Wal-Mart Stores, Inc.
3.300%, 04/22/24 10,305,669
See accompanying Notes to Schedule of Investments www.calamos.com 87

Growth and Income Fund Schedule of Investments October 31, 2017
PRINCIPALAMOUNT VALUE
Financials (0.2%)4,950,000 Berkshire Hathaway, Inc.
2.750%, 03/15/23 $ 5,019,820
Health Care (0.2%)3,000,000 Universal Health Services, Inc.*
4.750%, 08/01/22 3,099,150
Industrials (0.1%)1,020,000 Icahn Enterprises, LP
4.875%, 03/15/19 1,026,013
Information Technology (1.4%)2,230,000 ACI Worldwide, Inc.*
6.375%, 08/15/20 2,273,5189,865,000 Alphabet, Inc.
3.375%, 02/25/24 10,352,2824,935,000 Apple, Inc.
3.450%, 05/06/24 5,174,42211,415,000 Brocade Communications Systems, Inc.
4.625%, 01/15/23 11,678,40129,478,623
TOTAL CORPORATE BONDS 118,894,753
U.S. Government and Agency Securities (1.1%)
United States Treasury Note11,600,000 1.125%, 06/30/21 11,304,1535,800,000 1.625%, 05/15/26 5,482,8455,500,000 2.000%, 11/15/26 5,341,848
TOTAL U.S. GOVERNMENT ANDAGENCY SECURITIES 22,128,846
NUMBER OFCONTRACTS/NOTIONALAMOUNT VALUE
Purchased Options (0.4%)#
Consumer Discretionary (0.0%)933
93,300General Motors Company, Inc.Call, 12/15/17, Strike $49.00 9,796
Other (0.4%)iShares MSCI EAFE ETF
17,7001,770,000 Call, 12/15/17, Strike $67.00 5,150,700
15,0001,500,000 Call, 12/15/17, Strike $69.00 1,897,500
6,000600,000
iShares Russell 2000 ETFCall, 12/15/17, Strike $148.00 2,247,000
9,295,200
TOTAL PURCHASED OPTIONS 9,304,996
TOTAL SYNTHETIC CONVERTIBLESECURITIES(Cost $144,424,161) 150,328,595
NUMBER OFSHARES VALUE
CONVERTIBLE PREFERRED STOCKS (7.0%)Energy (0.9%)
80,675 CenterPoint Energy, Inc. (Time Warner,Inc., Charter Communications, Time,Inc.)**§3.399%, 09/15/29 $ 5,709,531
211,030 Hess Corp.8.000%, 02/01/19 11,648,856
17,358,387
Financials (0.2%)80,250 Affiliated Managers Group, Inc.
5.150%, 10/15/37 4,904,784
Health Care (1.3%)16,600 Allergan, PLC
5.500%, 03/01/18 10,685,254199,610 Anthem, Inc.
5.250%, 05/01/18 10,635,221104,250 Becton Dickinson and Company
6.125%, 05/01/20 5,918,27227,238,747
Industrials (0.6%)110,000 Rexnord Corp.
5.750%, 11/15/19 6,329,40051,350 Stanley Black & Decker, Inc.
5.375%, 05/15/20 6,073,16512,402,565
Real Estate (1.5%)153,776 American Tower Corp.
5.500%, 02/15/18 19,401,91810,450 Crown Castle International Corp.
6.875%, 08/01/20 11,494,05930,895,977
Telecommunication Services (0.7%)141,890 T-Mobile USA, Inc.
5.500%, 12/15/17 13,734,952
Utilities (1.8%)39,953 Dominion Resources, Inc.
6.750%, 08/15/19 2,090,741134,000 DTE Energy Company
6.500%, 10/01/19 7,374,395394,000 NextEra Energy, Inc.
6.371%, 09/01/18 27,481,50036,946,636
TOTAL CONVERTIBLE PREFERREDSTOCKS(Cost $129,705,502) 143,482,048
COMMON STOCKS (67.2%)Consumer Discretionary (7.9%)
39,100 Amazon.com, Inc.# 43,216,448
88 CALAMOS OPEN-END FAMILY OF FUNDS ANNUAL REPORT See accompanying Notes to Schedule of Investments
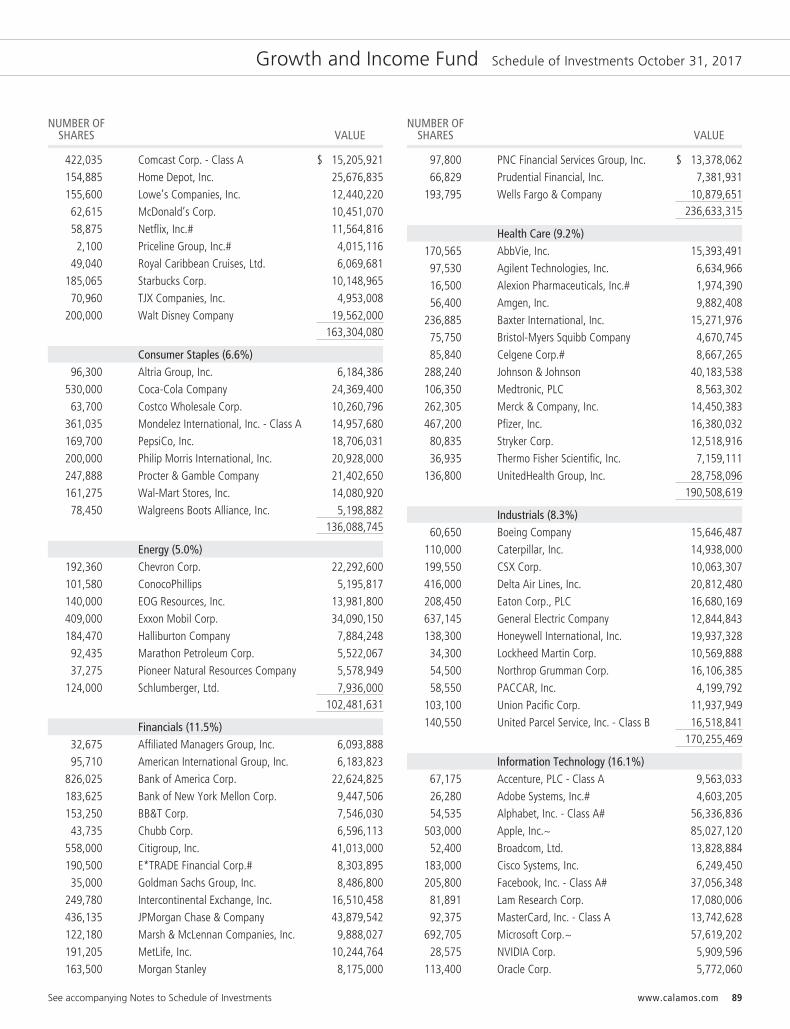
Growth and Income Fund Schedule of Investments October 31, 2017
NUMBER OFSHARES VALUE
422,035 Comcast Corp. - Class A $ 15,205,921154,885 Home Depot, Inc. 25,676,835155,600 Lowe’s Companies, Inc. 12,440,22062,615 McDonald’s Corp. 10,451,07058,875 Netflix, Inc.# 11,564,8162,100 Priceline Group, Inc.# 4,015,116
49,040 Royal Caribbean Cruises, Ltd. 6,069,681185,065 Starbucks Corp. 10,148,96570,960 TJX Companies, Inc. 4,953,008
200,000 Walt Disney Company 19,562,000163,304,080
Consumer Staples (6.6%)96,300 Altria Group, Inc. 6,184,386
530,000 Coca-Cola Company 24,369,40063,700 Costco Wholesale Corp. 10,260,796
361,035 Mondelez International, Inc. - Class A 14,957,680169,700 PepsiCo, Inc. 18,706,031200,000 Philip Morris International, Inc. 20,928,000247,888 Procter & Gamble Company 21,402,650161,275 Wal-Mart Stores, Inc. 14,080,92078,450 Walgreens Boots Alliance, Inc. 5,198,882
136,088,745
Energy (5.0%)192,360 Chevron Corp. 22,292,600101,580 ConocoPhillips 5,195,817140,000 EOG Resources, Inc. 13,981,800409,000 Exxon Mobil Corp. 34,090,150184,470 Halliburton Company 7,884,24892,435 Marathon Petroleum Corp. 5,522,06737,275 Pioneer Natural Resources Company 5,578,949
124,000 Schlumberger, Ltd. 7,936,000102,481,631
Financials (11.5%)32,675 Affiliated Managers Group, Inc. 6,093,88895,710 American International Group, Inc. 6,183,823
826,025 Bank of America Corp. 22,624,825183,625 Bank of New York Mellon Corp. 9,447,506153,250 BB&T Corp. 7,546,03043,735 Chubb Corp. 6,596,113
558,000 Citigroup, Inc. 41,013,000190,500 E*TRADE Financial Corp.# 8,303,89535,000 Goldman Sachs Group, Inc. 8,486,800
249,780 Intercontinental Exchange, Inc. 16,510,458436,135 JPMorgan Chase & Company 43,879,542122,180 Marsh & McLennan Companies, Inc. 9,888,027191,205 MetLife, Inc. 10,244,764163,500 Morgan Stanley 8,175,000
NUMBER OFSHARES VALUE
97,800 PNC Financial Services Group, Inc. $ 13,378,06266,829 Prudential Financial, Inc. 7,381,931
193,795 Wells Fargo & Company 10,879,651236,633,315
Health Care (9.2%)170,565 AbbVie, Inc. 15,393,49197,530 Agilent Technologies, Inc. 6,634,96616,500 Alexion Pharmaceuticals, Inc.# 1,974,39056,400 Amgen, Inc. 9,882,408
236,885 Baxter International, Inc. 15,271,97675,750 Bristol-Myers Squibb Company 4,670,74585,840 Celgene Corp.# 8,667,265
288,240 Johnson & Johnson 40,183,538106,350 Medtronic, PLC 8,563,302262,305 Merck & Company, Inc. 14,450,383467,200 Pfizer, Inc. 16,380,03280,835 Stryker Corp. 12,518,91636,935 Thermo Fisher Scientific, Inc. 7,159,111
136,800 UnitedHealth Group, Inc. 28,758,096190,508,619
Industrials (8.3%)60,650 Boeing Company 15,646,487
110,000 Caterpillar, Inc. 14,938,000199,550 CSX Corp. 10,063,307416,000 Delta Air Lines, Inc. 20,812,480208,450 Eaton Corp., PLC 16,680,169637,145 General Electric Company 12,844,843138,300 Honeywell International, Inc. 19,937,32834,300 Lockheed Martin Corp. 10,569,88854,500 Northrop Grumman Corp. 16,106,38558,550 PACCAR, Inc. 4,199,792
103,100 Union Pacific Corp. 11,937,949140,550 United Parcel Service, Inc. - Class B 16,518,841
170,255,469
Information Technology (16.1%)67,175 Accenture, PLC - Class A 9,563,03326,280 Adobe Systems, Inc.# 4,603,20554,535 Alphabet, Inc. - Class A# 56,336,836
503,000 Apple, Inc.~ 85,027,12052,400 Broadcom, Ltd. 13,828,884
183,000 Cisco Systems, Inc. 6,249,450205,800 Facebook, Inc. - Class A# 37,056,34881,891 Lam Research Corp. 17,080,00692,375 MasterCard, Inc. - Class A 13,742,628
692,705 Microsoft Corp.~ 57,619,20228,575 NVIDIA Corp. 5,909,596
113,400 Oracle Corp. 5,772,060
See accompanying Notes to Schedule of Investments www.calamos.com 89
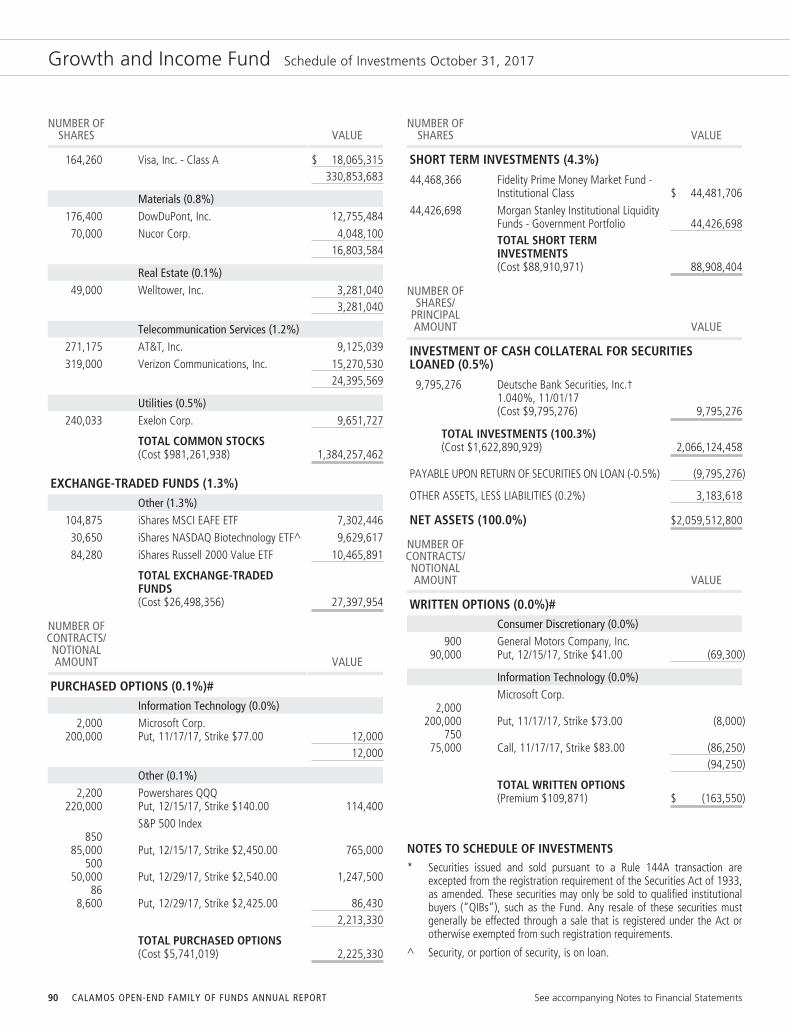
Growth and Income Fund Schedule of Investments October 31, 2017
NUMBER OFSHARES VALUE
164,260 Visa, Inc. - Class A $ 18,065,315330,853,683
Materials (0.8%)176,400 DowDuPont, Inc. 12,755,48470,000 Nucor Corp. 4,048,100
16,803,584
Real Estate (0.1%)49,000 Welltower, Inc. 3,281,040
3,281,040
Telecommunication Services (1.2%)271,175 AT&T, Inc. 9,125,039319,000 Verizon Communications, Inc. 15,270,530
24,395,569
Utilities (0.5%)240,033 Exelon Corp. 9,651,727
TOTAL COMMON STOCKS(Cost $981,261,938) 1,384,257,462
EXCHANGE-TRADED FUNDS (1.3%)Other (1.3%)
104,875 iShares MSCI EAFE ETF 7,302,44630,650 iShares NASDAQ Biotechnology ETF^ 9,629,61784,280 iShares Russell 2000 Value ETF 10,465,891
TOTAL EXCHANGE-TRADEDFUNDS(Cost $26,498,356) 27,397,954
NUMBER OFCONTRACTS/NOTIONALAMOUNT VALUE
PURCHASED OPTIONS (0.1%)#Information Technology (0.0%)
2,000200,000
Microsoft Corp.Put, 11/17/17, Strike $77.00 12,000
12,000
Other (0.1%)2,200
220,000Powershares QQQPut, 12/15/17, Strike $140.00 114,400S&P 500 Index
85085,000 Put, 12/15/17, Strike $2,450.00 765,000
50050,000 Put, 12/29/17, Strike $2,540.00 1,247,500
868,600 Put, 12/29/17, Strike $2,425.00 86,430
2,213,330
TOTAL PURCHASED OPTIONS(Cost $5,741,019) 2,225,330
NUMBER OFSHARES VALUE
SHORT TERM INVESTMENTS (4.3%)
44,468,366 Fidelity Prime Money Market Fund -Institutional Class $ 44,481,706
44,426,698 Morgan Stanley Institutional LiquidityFunds - Government Portfolio 44,426,698TOTAL SHORT TERMINVESTMENTS(Cost $88,910,971) 88,908,404
NUMBER OFSHARES/
PRINCIPALAMOUNT VALUE
INVESTMENT OF CASH COLLATERAL FOR SECURITIESLOANED (0.5%)
9,795,276 Deutsche Bank Securities, Inc.†1.040%, 11/01/17(Cost $9,795,276) 9,795,276
TOTAL INVESTMENTS (100.3%)(Cost $1,622,890,929) 2,066,124,458
PAYABLE UPON RETURN OF SECURITIES ON LOAN (-0.5%) (9,795,276)
OTHER ASSETS, LESS LIABILITIES (0.2%) 3,183,618
NET ASSETS (100.0%) $2,059,512,800
NUMBER OFCONTRACTS/NOTIONALAMOUNT VALUE
WRITTEN OPTIONS (0.0%)#Consumer Discretionary (0.0%)
90090,000
General Motors Company, Inc.Put, 12/15/17, Strike $41.00 (69,300)
Information Technology (0.0%)Microsoft Corp.
2,000200,000 Put, 11/17/17, Strike $73.00 (8,000)
75075,000 Call, 11/17/17, Strike $83.00 (86,250)
(94,250)
TOTAL WRITTEN OPTIONS(Premium $109,871) $ (163,550)
NOTES TO SCHEDULE OF INVESTMENTS* Securities issued and sold pursuant to a Rule 144A transaction are
excepted from the registration requirement of the Securities Act of 1933,as amended. These securities may only be sold to qualified institutionalbuyers (“QIBs”), such as the Fund. Any resale of these securities mustgenerally be effected through a sale that is registered under the Act orotherwise exempted from such registration requirements.
^ Security, or portion of security, is on loan.
90 CALAMOS OPEN-END FAMILY OF FUNDS ANNUAL REPORT See accompanying Notes to Financial Statements
Growth and Income Fund Schedule of Investments October 31, 2017
~ Security, or portion of security, is segregated as collateral (or potentialcollateral for future transactions) for written options. The aggregatevalue of such securities is $4,047,724.
¤ The synthetic convertible securities strategy combines separatesecurities that together possess the economic characteristics similar to aconvertible security.
# Non-income producing security.
** Step Coupon security. Coupon changes periodically based upon apredetermined schedule. The rate shown is the rate in effect atOctober 31, 2017.
§ Securities exchangeable or convertible into securities of one or moreentities that are different than the issuer. Each entity is identified inthe parenthetical.
† Repurchase agreement collateralized by the following security:9,990,677 United States Treasury Note, 3.625%, 02/15/20.
Note: The date on options represents the expiration date of the option contract. Theoption contract may be exercised at any date on or before the date shown.
See accompanying Notes to Financial Statements www.calamos.com 91
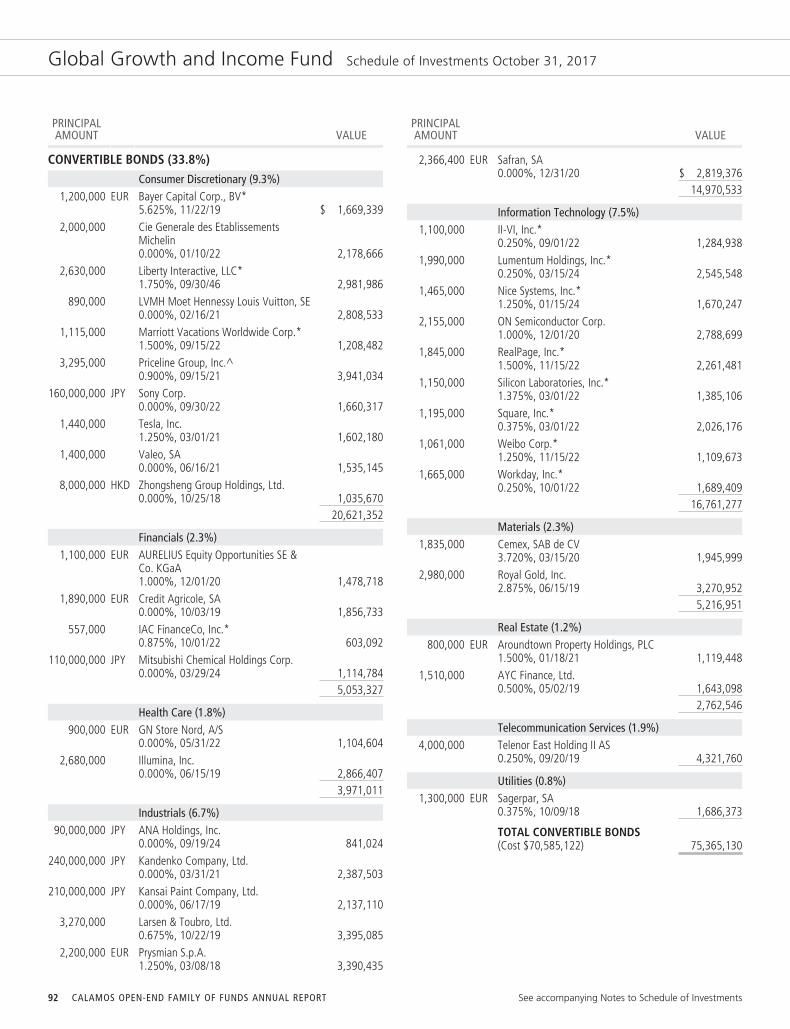
Global Growth and Income Fund Schedule of Investments October 31, 2017
PRINCIPALAMOUNT VALUE
CONVERTIBLE BONDS (33.8%)Consumer Discretionary (9.3%)
1,200,000 EUR Bayer Capital Corp., BV*5.625%, 11/22/19 $ 1,669,339
2,000,000 Cie Generale des EtablissementsMichelin0.000%, 01/10/22 2,178,666
2,630,000 Liberty Interactive, LLC*1.750%, 09/30/46 2,981,986
890,000 LVMH Moet Hennessy Louis Vuitton, SE0.000%, 02/16/21 2,808,533
1,115,000 Marriott Vacations Worldwide Corp.*1.500%, 09/15/22 1,208,482
3,295,000 Priceline Group, Inc.^0.900%, 09/15/21 3,941,034
160,000,000 JPY Sony Corp.0.000%, 09/30/22 1,660,317
1,440,000 Tesla, Inc.1.250%, 03/01/21 1,602,180
1,400,000 Valeo, SA0.000%, 06/16/21 1,535,145
8,000,000 HKD Zhongsheng Group Holdings, Ltd.0.000%, 10/25/18 1,035,670
20,621,352
Financials (2.3%)1,100,000 EUR AURELIUS Equity Opportunities SE &
Co. KGaA1.000%, 12/01/20 1,478,718
1,890,000 EUR Credit Agricole, SA0.000%, 10/03/19 1,856,733
557,000 IAC FinanceCo, Inc.*0.875%, 10/01/22 603,092
110,000,000 JPY Mitsubishi Chemical Holdings Corp.0.000%, 03/29/24 1,114,784
5,053,327
Health Care (1.8%)900,000 EUR GN Store Nord, A/S
0.000%, 05/31/22 1,104,6042,680,000 Illumina, Inc.
0.000%, 06/15/19 2,866,4073,971,011
Industrials (6.7%)90,000,000 JPY ANA Holdings, Inc.
0.000%, 09/19/24 841,024240,000,000 JPY Kandenko Company, Ltd.
0.000%, 03/31/21 2,387,503210,000,000 JPY Kansai Paint Company, Ltd.
0.000%, 06/17/19 2,137,1103,270,000 Larsen & Toubro, Ltd.
0.675%, 10/22/19 3,395,0852,200,000 EUR Prysmian S.p.A.
1.250%, 03/08/18 3,390,435
PRINCIPALAMOUNT VALUE
2,366,400 EUR Safran, SA0.000%, 12/31/20 $ 2,819,376
14,970,533
Information Technology (7.5%)1,100,000 II-VI, Inc.*
0.250%, 09/01/22 1,284,9381,990,000 Lumentum Holdings, Inc.*
0.250%, 03/15/24 2,545,5481,465,000 Nice Systems, Inc.*
1.250%, 01/15/24 1,670,2472,155,000 ON Semiconductor Corp.
1.000%, 12/01/20 2,788,6991,845,000 RealPage, Inc.*
1.500%, 11/15/22 2,261,4811,150,000 Silicon Laboratories, Inc.*
1.375%, 03/01/22 1,385,1061,195,000 Square, Inc.*
0.375%, 03/01/22 2,026,1761,061,000 Weibo Corp.*
1.250%, 11/15/22 1,109,6731,665,000 Workday, Inc.*
0.250%, 10/01/22 1,689,40916,761,277
Materials (2.3%)1,835,000 Cemex, SAB de CV
3.720%, 03/15/20 1,945,9992,980,000 Royal Gold, Inc.
2.875%, 06/15/19 3,270,9525,216,951
Real Estate (1.2%)800,000 EUR Aroundtown Property Holdings, PLC
1.500%, 01/18/21 1,119,4481,510,000 AYC Finance, Ltd.
0.500%, 05/02/19 1,643,0982,762,546
Telecommunication Services (1.9%)4,000,000 Telenor East Holding II AS
0.250%, 09/20/19 4,321,760
Utilities (0.8%)1,300,000 EUR Sagerpar, SA
0.375%, 10/09/18 1,686,373
TOTAL CONVERTIBLE BONDS(Cost $70,585,122) 75,365,130
92 CALAMOS OPEN-END FAMILY OF FUNDS ANNUAL REPORT See accompanying Notes to Schedule of Investments

Global Growth and Income Fund Schedule of Investments October 31, 2017
NUMBER OFCONTRACTS/NOTIONALAMOUNT VALUE
SYNTHETIC CONVERTIBLE SECURITIES (3.2%)¤Purchased Options (1.3%)#
Consumer Discretionary (0.4%)32
3,200Amazon.com, Inc.Call, 01/19/18, Strike $950.00 $ 525,280
35535,500
Carnival Corp.Call, 04/20/18, Strike $65.00 157,975
14014,000
Vail Resorts, Inc.Call, 04/20/18, Strike $230.00 184,100
867,355
Consumer Staples (0.2%)235
23,500Estee Lauder Companies Inc.Call, 04/20/18, Strike $110.00 170,375
38538,500
Monster Beverage Corp.Call, 03/16/18, Strike $55.00 213,675
384,050
Energy (0.1%)145
14,500Pioneer Natural Resources CompanyCall, 01/19/18, Strike $150.00 123,250
Health Care (0.0%)45
4,500Regeneron Pharmaceuticals, Inc.Call, 01/19/18, Strike $470.00 16,875
Information Technology (0.3%)90
9,000Baidu, Inc.Call, 03/16/18, Strike $240.00 193,275
15015,000
Lam Research Corp.Call, 12/15/17, Strike $185.00 383,250
11011,000
Nvidia Corp.Call, 12/15/17, Strike $200.00 180,125
756,650
Other (0.3%)1,140
114,000iShares MSCI Brazil Capped ETFCall, 12/15/17, Strike $41.00 141,930
1,560156,000
iShares MSCI Japan ETFCall, 01/19/18, Strike $58.00 223,860
67567,500
iShares Russell 2000 Value ETFCall, 02/16/18, Strike $122.00 371,250
737,040
TOTAL PURCHASED OPTIONS 2,885,220
PRINCIPALAMOUNT VALUE
U.S. Government and Agency Securities (1.9%)
United States Treasury Note2,205,000 1.875%, 05/31/22 2,195,9722,200,000 1.875%, 10/31/22 2,183,948
TOTAL U.S. GOVERNMENT ANDAGENCY SECURITIES 4,379,920
TOTAL SYNTHETICCONVERTIBLE SECURITIES(Cost $6,652,846) 7,265,140
NUMBER OFSHARES VALUE
CONVERTIBLE PREFERRED STOCKS (6.9%)Health Care (1.7%)
4,200 Allergan, PLC5.500%, 03/01/18 $ 2,703,498
21,700 Anthem, Inc.5.250%, 05/01/18 1,156,176
3,859,674
Industrials (0.5%)20,300 Rexnord Corp.
5.750%, 11/15/19 1,168,062
Real Estate (0.8%)5,605 American Tower Corp.
5.500%, 02/15/18 707,183980 Crown Castle International Corp.
6.875%, 08/01/20 1,077,9121,785,095
Telecommunication Services (2.8%)30,000 Alibaba Exchangeable (Softbank)*§
5.750%, 06/03/19 6,291,228
Utilities (1.1%)NextEra Energy, Inc.
21,900 6.371%, 09/01/18 1,527,52514,000 6.123%, 09/01/19 798,000
2,325,525
TOTAL CONVERTIBLEPREFERRED STOCKS(Cost $12,343,771) 15,429,584
COMMON STOCKS (55.5%)Consumer Discretionary (3.4%)
53,800 D.R. Horton, Inc. 2,378,49838,000 EUR Daimler, AG 3,172,47421,200 Walt Disney Company 2,073,572
7,624,544
Consumer Staples (6.4%)49,800 Coca-Cola Company 2,289,80414,000 EUR Danone 1,144,23655,700 GBP Diageo, PLC 1,902,09017,200 EUR Kerry Group, PLC - Class A 1,732,26244,800 CHF Nestlé, SA 3,769,40619,083 EUR Unilever, NV 1,108,53127,200 Wal-Mart Stores, Inc. 2,374,832
14,321,161
Energy (4.7%)10,400 Chevron Corp. 1,205,25642,000 CAD Enbridge, Inc. 1,614,10721,600 Exxon Mobil Corp. 1,800,36081,800 EUR Royal Dutch Shell, PLC - Class A 2,569,352
See accompanying Notes to Schedule of Investments www.calamos.com 93

Global Growth and Income Fund Schedule of Investments October 31, 2017
NUMBER OFSHARES VALUE
20,700 Schlumberger, Ltd. $ 1,324,80033,290 EUR TOTAL, SA 1,855,522
10,369,397
Financials (12.8%)217,200 HKD AIA Group, Ltd. 1,636,706123,500 Bank of America Corp. 3,382,66520,000 EUR BNP Paribas, SA 1,560,99034,000 Citigroup, Inc. 2,499,000
110,563 CHF Credit Suisse Group, AG# 1,742,34442,800 E*TRADE Financial Corp.# 1,865,652
117,000 INR HDFC Bank, Ltd. 3,270,18985,000 INR Indiabulls Housing Finance, Ltd. 1,634,19032,800 JPMorgan Chase & Company 3,300,008
271,100 JPY Mitsubishi UFJ Financial Group, Inc. 1,838,911139,500 HKD Ping An Insurance Group Company of
China, Ltd. 1,225,91813,900 PNC Financial Services Group, Inc. 1,901,38169,475 GBP Prudential, PLC 1,705,29054,100 EUR UniCredit S.p.A# 1,033,886
28,597,130
Health Care (4.9%)7,800 Alexion Pharmaceuticals, Inc.# 933,348
35,600 Baxter International, Inc. 2,295,1329,100 Celgene Corp.# 918,827
25,100 Johnson & Johnson 3,499,1917,150 CHF Roche Holding, AG 1,652,5887,400 UnitedHealth Group, Inc. 1,555,628
10,854,714
Industrials (6.6%)17,400 JPY FANUC Corp. 4,068,536
274,000 GBP International Consolidated AirlinesGroup, SA 2,314,167
14,100 EUR KION Group, AG 1,129,800113,600 JPY Komatsu, Ltd. 3,711,96761,950 INR Larsen & Toubro, Ltd. 1,170,0856,000 Raytheon Company 1,081,200
12,900 EUR Schneider Electric, SE# 1,133,41014,609,165
Information Technology (15.2%)5,280 Alphabet, Inc. - Class A# 5,454,451
28,500 Apple, Inc. 4,817,6408,225 EUR ASML Holding, NV 1,484,0327,800 Broadcom, Ltd. 2,058,498
85 HKD China Literature, Ltd.*# —15,600 Facebook, Inc. - Class A# 2,808,93614,300 MasterCard, Inc. - Class A 2,127,41131,100 Microsoft Corp. 2,586,898
NUMBER OFSHARES VALUE
2,900 JPY Nintendo Company, Ltd. $ 1,125,089675 KRW Samsung Electronics Company, Ltd. 1,663,947
463,000 TWD Taiwan Semiconductor ManufacturingCompany, Ltd. 3,743,032
10,100 CHF Temenos Group, AG# 1,166,262108,000 HKD Tencent Holdings, Ltd. 4,854,072
33,890,268
Materials (1.0%)480,000 GBP Glencore, PLC# 2,315,136
Telecommunication Services (0.5%)13,300 JPY SoftBank Group Corp. 1,178,675
TOTAL COMMON STOCKS(Cost $93,254,522) 123,760,190
SHORT TERM INVESTMENTS (1.0%)
1,094,795 Fidelity Prime Money Market Fund -Institutional Class 1,095,124
1,093,071 Morgan Stanley Institutional LiquidityFunds - Government Portfolio 1,093,071
TOTAL SHORT TERMINVESTMENTS(Cost $2,188,195) 2,188,195
NUMBER OFSHARES/
PRINCIPALAMOUNT VALUE
INVESTMENT OF CASH COLLATERAL FOR SECURITIESLOANED (0.9%)
2,001,348 Deutsche Bank Securities, Inc.†1.040%, 11/01/17(Cost $2,001,348) 2,001,348
TOTAL INVESTMENTS (101.3%)(Cost $187,025,804) 226,009,587
PAYABLE UPON RETURN OF SECURITIES ON LOAN (-0.9%) (2,001,348)
LIABILITIES,LESS OTHER ASSETS (-0.4%) (976,816)
NET ASSETS (100.0%) $223,031,423
FORWARD FOREIGN CURRENCY CONTRACTS
COUNTERPARTYLONG
CONTRACTSSETTLEMENT
DATELOCAL
CURRENCYCURRENT
VALUEUNREALIZEDGAIN/LOSS
State Street Bankand Trust Canadian Dollar 11/30/17 6,642,000 $5,149,674 $(103,904)Bank of New York Swiss Franc 11/30/17 482,000 483,992 (1,130)
$(105,034)
COUNTERPARTYSHORT
CONTRACTSSETTLEMENT
DATELOCAL
CURRENCYCURRENT
VALUEUNREALIZEDGAIN/LOSS
State Street Bankand Trust Swiss Franc 11/30/17 2,893,000 $2,904,956 $ 27,972
94 CALAMOS OPEN-END FAMILY OF FUNDS ANNUAL REPORT See accompanying Notes to Financial Statements
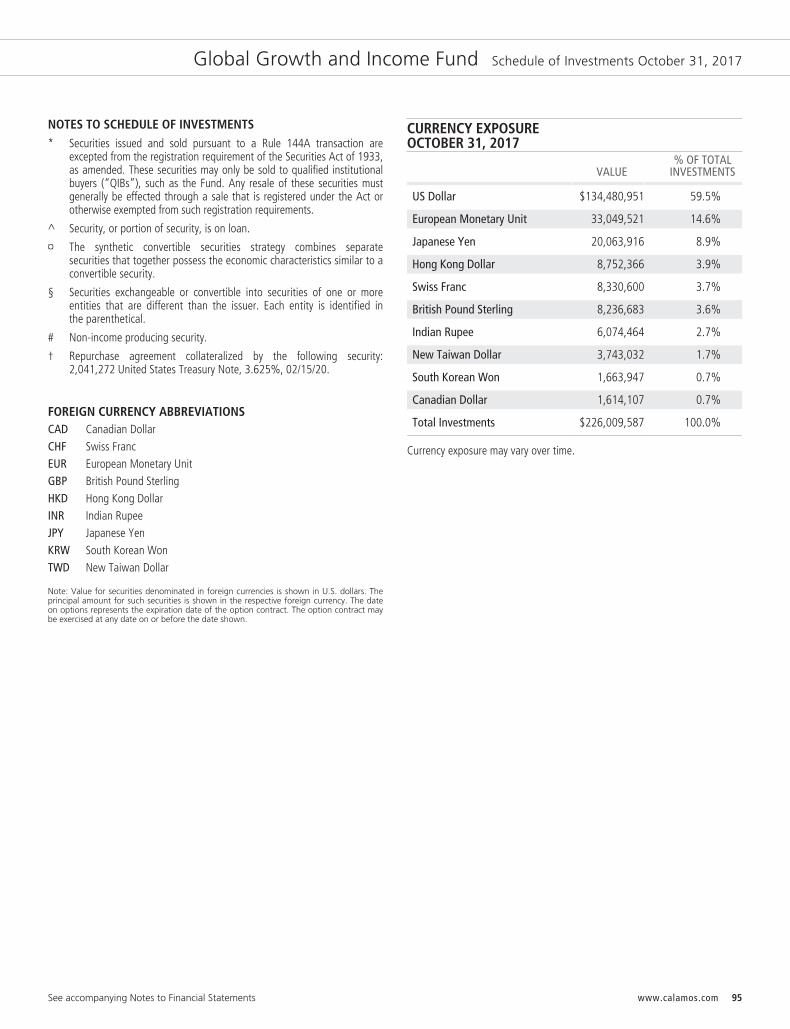
Global Growth and Income Fund Schedule of Investments October 31, 2017
NOTES TO SCHEDULE OF INVESTMENTS* Securities issued and sold pursuant to a Rule 144A transaction are
excepted from the registration requirement of the Securities Act of 1933,as amended. These securities may only be sold to qualified institutionalbuyers (“QIBs”), such as the Fund. Any resale of these securities mustgenerally be effected through a sale that is registered under the Act orotherwise exempted from such registration requirements.
^ Security, or portion of security, is on loan.
¤ The synthetic convertible securities strategy combines separatesecurities that together possess the economic characteristics similar to aconvertible security.
§ Securities exchangeable or convertible into securities of one or moreentities that are different than the issuer. Each entity is identified inthe parenthetical.
# Non-income producing security.
† Repurchase agreement collateralized by the following security:2,041,272 United States Treasury Note, 3.625%, 02/15/20.
FOREIGN CURRENCY ABBREVIATIONSCAD Canadian DollarCHF Swiss FrancEUR European Monetary UnitGBP British Pound SterlingHKD Hong Kong DollarINR Indian RupeeJPY Japanese YenKRW South Korean WonTWD New Taiwan Dollar
Note: Value for securities denominated in foreign currencies is shown in U.S. dollars. Theprincipal amount for such securities is shown in the respective foreign currency. The dateon options represents the expiration date of the option contract. The option contract maybe exercised at any date on or before the date shown.
CURRENCY EXPOSUREOCTOBER 31, 2017
VALUE% OF TOTAL
INVESTMENTS
US Dollar $134,480,951 59.5%
European Monetary Unit 33,049,521 14.6%
Japanese Yen 20,063,916 8.9%
Hong Kong Dollar 8,752,366 3.9%
Swiss Franc 8,330,600 3.7%
British Pound Sterling 8,236,683 3.6%
Indian Rupee 6,074,464 2.7%
New Taiwan Dollar 3,743,032 1.7%
South Korean Won 1,663,947 0.7%
Canadian Dollar 1,614,107 0.7%
Total Investments $226,009,587 100.0%
Currency exposure may vary over time.
See accompanying Notes to Financial Statements www.calamos.com 95
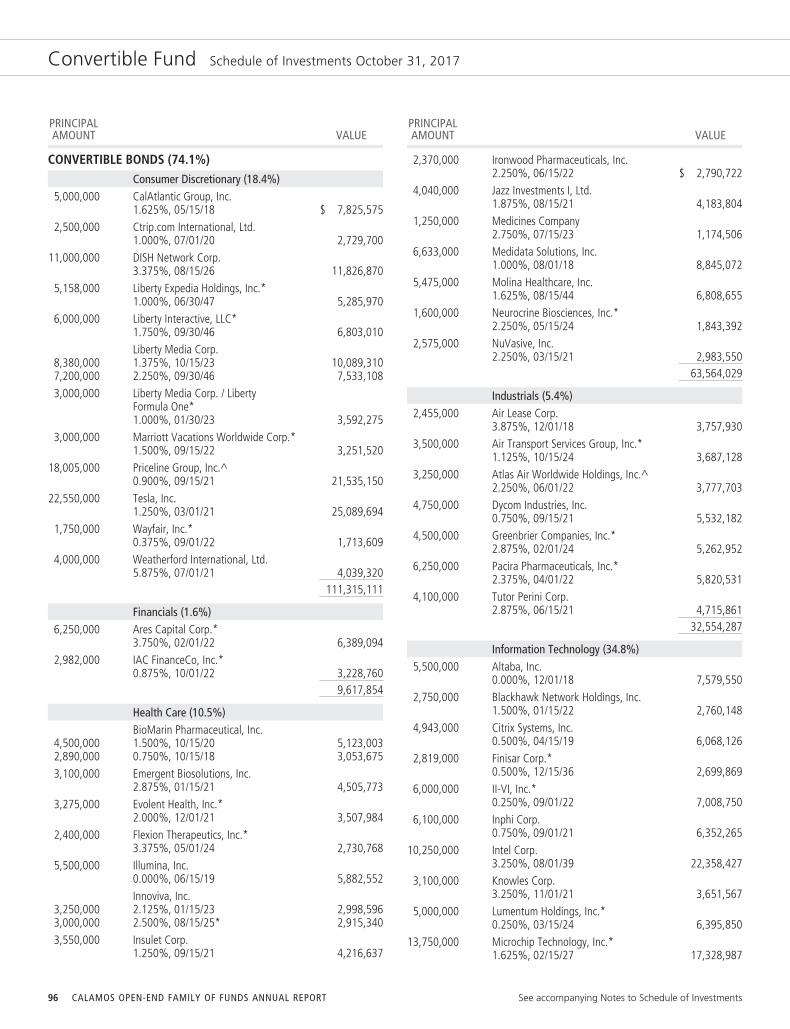
Convertible Fund Schedule of Investments October 31, 2017
PRINCIPALAMOUNT VALUE
CONVERTIBLE BONDS (74.1%)Consumer Discretionary (18.4%)
5,000,000 CalAtlantic Group, Inc.1.625%, 05/15/18 $ 7,825,575
2,500,000 Ctrip.com International, Ltd.1.000%, 07/01/20 2,729,700
11,000,000 DISH Network Corp.3.375%, 08/15/26 11,826,870
5,158,000 Liberty Expedia Holdings, Inc.*1.000%, 06/30/47 5,285,970
6,000,000 Liberty Interactive, LLC*1.750%, 09/30/46 6,803,010Liberty Media Corp.
8,380,000 1.375%, 10/15/23 10,089,3107,200,000 2.250%, 09/30/46 7,533,1083,000,000 Liberty Media Corp. / Liberty
Formula One*1.000%, 01/30/23 3,592,275
3,000,000 Marriott Vacations Worldwide Corp.*1.500%, 09/15/22 3,251,520
18,005,000 Priceline Group, Inc.^0.900%, 09/15/21 21,535,150
22,550,000 Tesla, Inc.1.250%, 03/01/21 25,089,694
1,750,000 Wayfair, Inc.*0.375%, 09/01/22 1,713,609
4,000,000 Weatherford International, Ltd.5.875%, 07/01/21 4,039,320
111,315,111
Financials (1.6%)6,250,000 Ares Capital Corp.*
3.750%, 02/01/22 6,389,0942,982,000 IAC FinanceCo, Inc.*
0.875%, 10/01/22 3,228,7609,617,854
Health Care (10.5%)BioMarin Pharmaceutical, Inc.
4,500,000 1.500%, 10/15/20 5,123,0032,890,000 0.750%, 10/15/18 3,053,6753,100,000 Emergent Biosolutions, Inc.
2.875%, 01/15/21 4,505,7733,275,000 Evolent Health, Inc.*
2.000%, 12/01/21 3,507,9842,400,000 Flexion Therapeutics, Inc.*
3.375%, 05/01/24 2,730,7685,500,000 Illumina, Inc.
0.000%, 06/15/19 5,882,552Innoviva, Inc.
3,250,000 2.125%, 01/15/23 2,998,5963,000,000 2.500%, 08/15/25* 2,915,3403,550,000 Insulet Corp.
1.250%, 09/15/21 4,216,637
PRINCIPALAMOUNT VALUE
2,370,000 Ironwood Pharmaceuticals, Inc.2.250%, 06/15/22 $ 2,790,722
4,040,000 Jazz Investments I, Ltd.1.875%, 08/15/21 4,183,804
1,250,000 Medicines Company2.750%, 07/15/23 1,174,506
6,633,000 Medidata Solutions, Inc.1.000%, 08/01/18 8,845,072
5,475,000 Molina Healthcare, Inc.1.625%, 08/15/44 6,808,655
1,600,000 Neurocrine Biosciences, Inc.*2.250%, 05/15/24 1,843,392
2,575,000 NuVasive, Inc.2.250%, 03/15/21 2,983,550
63,564,029
Industrials (5.4%)2,455,000 Air Lease Corp.
3.875%, 12/01/18 3,757,9303,500,000 Air Transport Services Group, Inc.*
1.125%, 10/15/24 3,687,1283,250,000 Atlas Air Worldwide Holdings, Inc.^
2.250%, 06/01/22 3,777,7034,750,000 Dycom Industries, Inc.
0.750%, 09/15/21 5,532,1824,500,000 Greenbrier Companies, Inc.*
2.875%, 02/01/24 5,262,9526,250,000 Pacira Pharmaceuticals, Inc.*
2.375%, 04/01/22 5,820,5314,100,000 Tutor Perini Corp.
2.875%, 06/15/21 4,715,86132,554,287
Information Technology (34.8%)5,500,000 Altaba, Inc.
0.000%, 12/01/18 7,579,5502,750,000 Blackhawk Network Holdings, Inc.
1.500%, 01/15/22 2,760,1484,943,000 Citrix Systems, Inc.
0.500%, 04/15/19 6,068,1262,819,000 Finisar Corp.*
0.500%, 12/15/36 2,699,8696,000,000 II-VI, Inc.*
0.250%, 09/01/22 7,008,7506,100,000 Inphi Corp.
0.750%, 09/01/21 6,352,26510,250,000 Intel Corp.
3.250%, 08/01/39 22,358,4273,100,000 Knowles Corp.
3.250%, 11/01/21 3,651,5675,000,000 Lumentum Holdings, Inc.*
0.250%, 03/15/24 6,395,85013,750,000 Microchip Technology, Inc.*
1.625%, 02/15/27 17,328,987
96 CALAMOS OPEN-END FAMILY OF FUNDS ANNUAL REPORT See accompanying Notes to Schedule of Investments
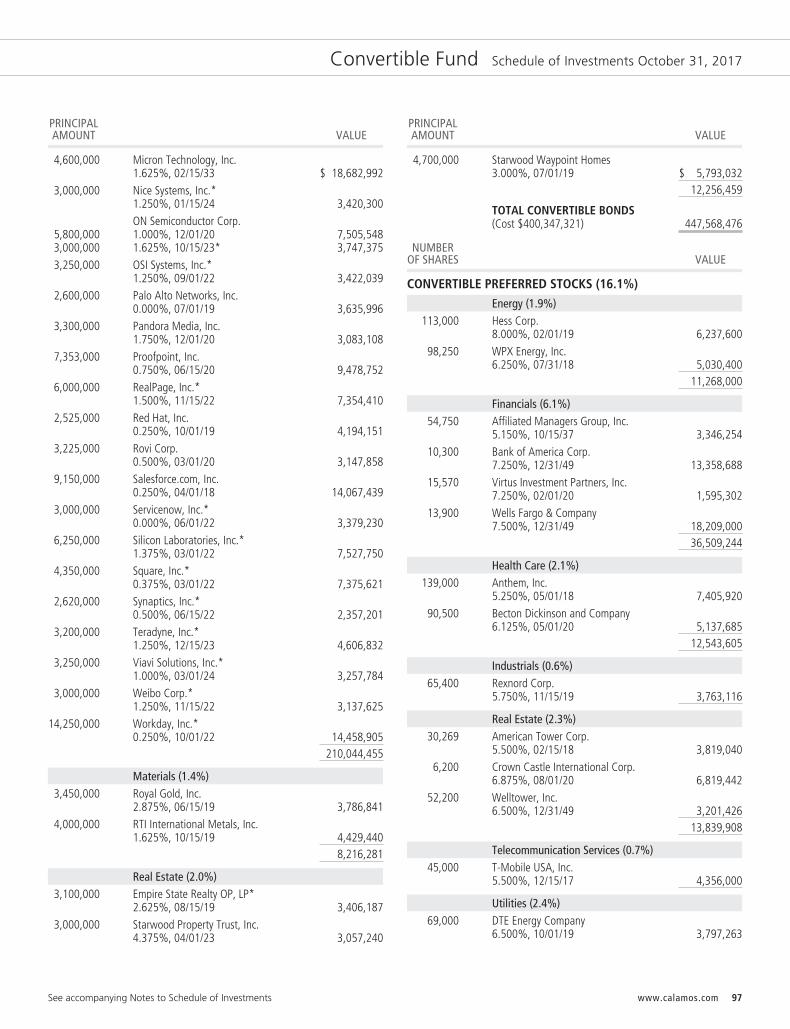
Convertible Fund Schedule of Investments October 31, 2017
PRINCIPALAMOUNT VALUE
4,600,000 Micron Technology, Inc.1.625%, 02/15/33 $ 18,682,992
3,000,000 Nice Systems, Inc.*1.250%, 01/15/24 3,420,300ON Semiconductor Corp.
5,800,000 1.000%, 12/01/20 7,505,5483,000,000 1.625%, 10/15/23* 3,747,3753,250,000 OSI Systems, Inc.*
1.250%, 09/01/22 3,422,0392,600,000 Palo Alto Networks, Inc.
0.000%, 07/01/19 3,635,9963,300,000 Pandora Media, Inc.
1.750%, 12/01/20 3,083,1087,353,000 Proofpoint, Inc.
0.750%, 06/15/20 9,478,7526,000,000 RealPage, Inc.*
1.500%, 11/15/22 7,354,4102,525,000 Red Hat, Inc.
0.250%, 10/01/19 4,194,1513,225,000 Rovi Corp.
0.500%, 03/01/20 3,147,8589,150,000 Salesforce.com, Inc.
0.250%, 04/01/18 14,067,4393,000,000 Servicenow, Inc.*
0.000%, 06/01/22 3,379,2306,250,000 Silicon Laboratories, Inc.*
1.375%, 03/01/22 7,527,7504,350,000 Square, Inc.*
0.375%, 03/01/22 7,375,6212,620,000 Synaptics, Inc.*
0.500%, 06/15/22 2,357,2013,200,000 Teradyne, Inc.*
1.250%, 12/15/23 4,606,8323,250,000 Viavi Solutions, Inc.*
1.000%, 03/01/24 3,257,7843,000,000 Weibo Corp.*
1.250%, 11/15/22 3,137,62514,250,000 Workday, Inc.*
0.250%, 10/01/22 14,458,905210,044,455
Materials (1.4%)3,450,000 Royal Gold, Inc.
2.875%, 06/15/19 3,786,8414,000,000 RTI International Metals, Inc.
1.625%, 10/15/19 4,429,4408,216,281
Real Estate (2.0%)3,100,000 Empire State Realty OP, LP*
2.625%, 08/15/19 3,406,1873,000,000 Starwood Property Trust, Inc.
4.375%, 04/01/23 3,057,240
PRINCIPALAMOUNT VALUE
4,700,000 Starwood Waypoint Homes3.000%, 07/01/19 $ 5,793,032
12,256,459
TOTAL CONVERTIBLE BONDS(Cost $400,347,321) 447,568,476
NUMBEROF SHARES VALUE
CONVERTIBLE PREFERRED STOCKS (16.1%)Energy (1.9%)
113,000 Hess Corp.8.000%, 02/01/19 6,237,600
98,250 WPX Energy, Inc.6.250%, 07/31/18 5,030,400
11,268,000
Financials (6.1%)54,750 Affiliated Managers Group, Inc.
5.150%, 10/15/37 3,346,25410,300 Bank of America Corp.
7.250%, 12/31/49 13,358,68815,570 Virtus Investment Partners, Inc.
7.250%, 02/01/20 1,595,30213,900 Wells Fargo & Company
7.500%, 12/31/49 18,209,00036,509,244
Health Care (2.1%)139,000 Anthem, Inc.
5.250%, 05/01/18 7,405,92090,500 Becton Dickinson and Company
6.125%, 05/01/20 5,137,68512,543,605
Industrials (0.6%)65,400 Rexnord Corp.
5.750%, 11/15/19 3,763,116
Real Estate (2.3%)30,269 American Tower Corp.
5.500%, 02/15/18 3,819,0406,200 Crown Castle International Corp.
6.875%, 08/01/20 6,819,44252,200 Welltower, Inc.
6.500%, 12/31/49 3,201,42613,839,908
Telecommunication Services (0.7%)45,000 T-Mobile USA, Inc.
5.500%, 12/15/17 4,356,000
Utilities (2.4%)69,000 DTE Energy Company
6.500%, 10/01/19 3,797,263
See accompanying Notes to Schedule of Investments www.calamos.com 97

Convertible Fund Schedule of Investments October 31, 2017
NUMBER OFSHARES VALUE
NextEra Energy, Inc.116,000 6.123%, 09/01/19 $ 6,612,00062,000 6.371%, 09/01/18 4,324,500
14,733,763
TOTAL CONVERTIBLEPREFERRED STOCKS(Cost $87,280,213) 97,013,636
COMMON STOCKS (5.3%)Health Care (1.7%)
60,000 Allergan, PLC 10,633,800
Information Technology (3.6%)83,000 Lam Research Corp. 17,311,31039,000 Take-Two Interactive Software, Inc.# 4,315,350
21,626,660
TOTAL COMMON STOCKS(Cost $20,194,600) 32,260,460
NUMBER OFCONTRACTS/NOTIONALAMOUNT VALUE
Purchased Options (0.3%)#
Financials (0.2%)3,000
300,000Bank Of America Corp.Call, 01/18/19, Strike $25.00 1,335,000
Health Care (0.0%)750
75,000Gilead Sciences, Inc.Call, 01/19/18, Strike $85.00 64,875
Information Technology (0.0%)2,475
247,500Intel Corp.Put, 01/19/18, Strike $40.00 65,588
Other (0.1%)335
33,500S&P 500 IndexPut, 12/01/17, Strike $2,495.00 276,375
TOTAL PURCHASED OPTIONS(Cost $2,140,221) 1,741,838
NUMBER OFSHARES VALUE
SHORT TERM INVESTMENTS (4.1%)
12,454,426 Fidelity Prime Money Market Fund -Institutional Class 12,458,162
12,453,315 Morgan Stanley Institutional LiquidityFunds - Government Portfolio 12,453,315
TOTAL SHORT TERMINVESTMENTS(Cost $24,912,360) 24,911,477
NUMBER OFSHARES/
PRINCIPALAMOUNT VALUE
INVESTMENT OF CASH COLLATERAL FOR SECURITIESLOANED (1.9%)
11,175,523 Deutsche Bank Securities, Inc.†1.040%, 11/01/17(Cost $11,175,523) $ 11,175,523
TOTAL INVESTMENTS (101.8%)(Cost $546,050,238) 614,671,410
PAYABLE UPON RETURN OF SECURITIES ON LOAN (-1.9%) (11,175,523)
OTHER ASSETS, LESS LIABILITIES (0.1%) 463,779
NET ASSETS (100.0%) $603,959,666
NOTES TO SCHEDULE OF INVESTMENTS* Securities issued and sold pursuant to a Rule 144A transaction are
excepted from the registration requirement of the Securities Act of 1933,as amended. These securities may only be sold to qualified institutionalbuyers (“QIBs”), such as the Fund. Any resale of these securities mustgenerally be effected through a sale that is registered under the Act orotherwise exempted from such registration requirements.
^ Security, or portion of security, is on loan.
¤ The synthetic convertible securities strategy combines separatesecurities that together possess the economic characteristics similar to aconvertible security.
# Non-income producing security.
† Repurchase agreement collateralized by the following security:11,398,458 United States Treasury Note, 3.625%, 02/15/20.
Note: The date on options represents the expiration date of the option contract. Theoption contract may be exercised at any date on or before the date shown.
98 CALAMOS OPEN-END FAMILY OF FUNDS ANNUAL REPORT See accompanying Notes to Financial Statements

Global Convertible Fund Schedule of Investments October 31, 2017
PRINCIPALAMOUNT VALUE
CONVERTIBLE BONDS (71.5%)Consumer Discretionary (14.1%)
400,000 EUR Bayer Capital Corp., BV*5.625%, 11/22/19 $ 556,446
1,000,000 Cie Generale des EtablissementsMichelin0.000%, 01/10/22 1,089,333Ctrip.com International, Ltd.
775,000 1.250%, 09/15/22 811,460690,000 1.000%, 07/01/20 753,397850,000 DISH Network Corp.
3.375%, 08/15/26 913,89560,000,000 JPY Iida Group Holdings Company, Ltd.
0.000%, 06/18/20 562,321425,000 Liberty Expedia Holdings, Inc.*
1.000%, 06/30/47 435,544725,000 Liberty Interactive, LLC*
1.750%, 09/30/46 822,030745,000 Liberty Media Corp.
1.375%, 10/15/23 896,961510,000 Marriott Vacations Worldwide Corp.*
1.500%, 09/15/22 552,759436,000 EUR SEB, SA
0.000%, 11/17/21 1,025,344470,000 Shanghai Port Group BVI Holding
Company, Ltd.0.000%, 08/09/22 478,105
134,000,000 JPY Sony Corp.0.000%, 09/30/22 1,390,516
500,000 EUR Steinhoff Finance Holding Company1.250%, 10/21/23 515,501
400,000 EUR Steinhoff Finance Holding GmbH4.000%, 01/30/21 551,007Tesla, Inc.
1,475,000 1.250%, 03/01/21 1,641,122365,000 2.375%, 03/15/22 443,315
1,000,000 Valeo, SA0.000%, 06/16/21 1,096,532
4,000,000 HKD Zhongsheng Group Holdings, Ltd.0.000%, 10/25/18 517,835
15,053,423
Energy (2.0%)405,000 Nabors Industries, Inc.*
0.750%, 01/15/24 299,578450,000 SM Energy Company
1.500%, 07/01/21 433,807800,000 Tullow Oil Jersey, Ltd.
6.625%, 07/12/21 931,138480,000 Whiting Petroleum Corp.
1.250%, 04/01/20 433,5652,098,088
PRINCIPALAMOUNT VALUE
Financials (9.5%)95,000,000 JPY AEON Financial Service Company, Ltd.
0.000%, 09/13/19 $ 906,9291,600,000 EUR AURELIUS Equity Opportunities SE &
Co. KGaA1.000%, 12/01/20 2,150,862
2,869,000 EUR Credit Agricole, SA0.000%, 10/03/19 2,818,501
700,000 EUR Cromwell SPV Finance Pty, Ltd.2.000%, 02/04/20 817,437
2,000,000 HKD Haitong International SecuritiesGroup, Ltd.0.000%, 10/25/21 263,353
250,000 IAC FinanceCo, Inc.*0.875%, 10/01/22 270,688
400,000 EUR LEG Immobilien, AG0.875%, 09/01/25 483,222
50,000,000 JPY Mitsubishi Chemical Holdings Corp.0.000%, 03/29/24 506,720
800,000 EUR Solidium Oy0.000%, 09/04/18 965,590
129,000 EUR Unibail-Rodamco, SE0.000%, 01/01/22 512,773
400,000 Yamaguchi Financial Group, Inc.‡0.829%, 03/26/203 mo. USD LIBOR - 0.50% 424,798
10,120,873
Health Care (8.9%)900,000 EUR Bayer, AG
0.050%, 06/15/20 1,240,089BioMarin Pharmaceutical, Inc.
425,000 1.500%, 10/15/20 483,839330,000 0.750%, 10/15/18 348,690671,000 Emergent Biosolutions, Inc.
2.875%, 01/15/21 975,282500,000 EUR GN Store Nord, A/S
0.000%, 05/31/22 613,669620,000 Illumina, Inc.
0.000%, 06/15/19 663,124455,000 Innoviva, Inc.*
2.500%, 08/15/25 442,160460,000 Insulet Corp.
1.250%, 09/15/21 546,381800,000 EUR Magyar Nemzeti Vagyonkezelo Zrt
3.375%, 04/02/19 1,103,993360,000 Medidata Solutions, Inc.
1.000%, 08/01/18 480,058700,000 Molina Healthcare, Inc.
1.625%, 08/15/44 870,513575,000 NuVasive, Inc.
2.250%, 03/15/21 666,230800,000 QIAGEN, NV
0.875%, 03/19/21 1,021,6689,455,696
See accompanying Notes to Schedule of Investments www.calamos.com 99
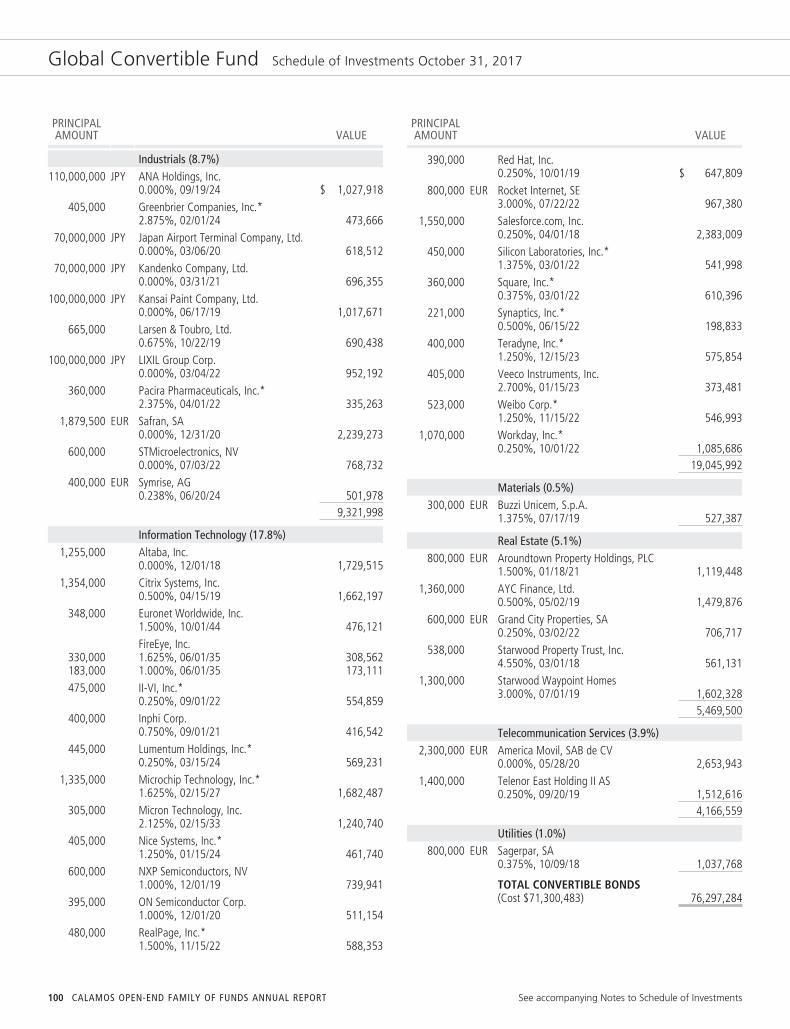
Global Convertible Fund Schedule of Investments October 31, 2017
PRINCIPALAMOUNT VALUE
Industrials (8.7%)110,000,000 JPY ANA Holdings, Inc.
0.000%, 09/19/24 $ 1,027,918405,000 Greenbrier Companies, Inc.*
2.875%, 02/01/24 473,66670,000,000 JPY Japan Airport Terminal Company, Ltd.
0.000%, 03/06/20 618,51270,000,000 JPY Kandenko Company, Ltd.
0.000%, 03/31/21 696,355100,000,000 JPY Kansai Paint Company, Ltd.
0.000%, 06/17/19 1,017,671665,000 Larsen & Toubro, Ltd.
0.675%, 10/22/19 690,438100,000,000 JPY LIXIL Group Corp.
0.000%, 03/04/22 952,192360,000 Pacira Pharmaceuticals, Inc.*
2.375%, 04/01/22 335,2631,879,500 EUR Safran, SA
0.000%, 12/31/20 2,239,273600,000 STMicroelectronics, NV
0.000%, 07/03/22 768,732400,000 EUR Symrise, AG
0.238%, 06/20/24 501,9789,321,998
Information Technology (17.8%)1,255,000 Altaba, Inc.
0.000%, 12/01/18 1,729,5151,354,000 Citrix Systems, Inc.
0.500%, 04/15/19 1,662,197348,000 Euronet Worldwide, Inc.
1.500%, 10/01/44 476,121FireEye, Inc.
330,000 1.625%, 06/01/35 308,562183,000 1.000%, 06/01/35 173,111475,000 II-VI, Inc.*
0.250%, 09/01/22 554,859400,000 Inphi Corp.
0.750%, 09/01/21 416,542445,000 Lumentum Holdings, Inc.*
0.250%, 03/15/24 569,2311,335,000 Microchip Technology, Inc.*
1.625%, 02/15/27 1,682,487305,000 Micron Technology, Inc.
2.125%, 02/15/33 1,240,740405,000 Nice Systems, Inc.*
1.250%, 01/15/24 461,740600,000 NXP Semiconductors, NV
1.000%, 12/01/19 739,941395,000 ON Semiconductor Corp.
1.000%, 12/01/20 511,154480,000 RealPage, Inc.*
1.500%, 11/15/22 588,353
PRINCIPALAMOUNT VALUE
390,000 Red Hat, Inc.0.250%, 10/01/19 $ 647,809
800,000 EUR Rocket Internet, SE3.000%, 07/22/22 967,380
1,550,000 Salesforce.com, Inc.0.250%, 04/01/18 2,383,009
450,000 Silicon Laboratories, Inc.*1.375%, 03/01/22 541,998
360,000 Square, Inc.*0.375%, 03/01/22 610,396
221,000 Synaptics, Inc.*0.500%, 06/15/22 198,833
400,000 Teradyne, Inc.*1.250%, 12/15/23 575,854
405,000 Veeco Instruments, Inc.2.700%, 01/15/23 373,481
523,000 Weibo Corp.*1.250%, 11/15/22 546,993
1,070,000 Workday, Inc.*0.250%, 10/01/22 1,085,686
19,045,992
Materials (0.5%)300,000 EUR Buzzi Unicem, S.p.A.
1.375%, 07/17/19 527,387
Real Estate (5.1%)800,000 EUR Aroundtown Property Holdings, PLC
1.500%, 01/18/21 1,119,4481,360,000 AYC Finance, Ltd.
0.500%, 05/02/19 1,479,876600,000 EUR Grand City Properties, SA
0.250%, 03/02/22 706,717538,000 Starwood Property Trust, Inc.
4.550%, 03/01/18 561,1311,300,000 Starwood Waypoint Homes
3.000%, 07/01/19 1,602,3285,469,500
Telecommunication Services (3.9%)2,300,000 EUR America Movil, SAB de CV
0.000%, 05/28/20 2,653,9431,400,000 Telenor East Holding II AS
0.250%, 09/20/19 1,512,6164,166,559
Utilities (1.0%)800,000 EUR Sagerpar, SA
0.375%, 10/09/18 1,037,768
TOTAL CONVERTIBLE BONDS(Cost $71,300,483) 76,297,284
100 CALAMOS OPEN-END FAMILY OF FUNDS ANNUAL REPORT See accompanying Notes to Schedule of Investments
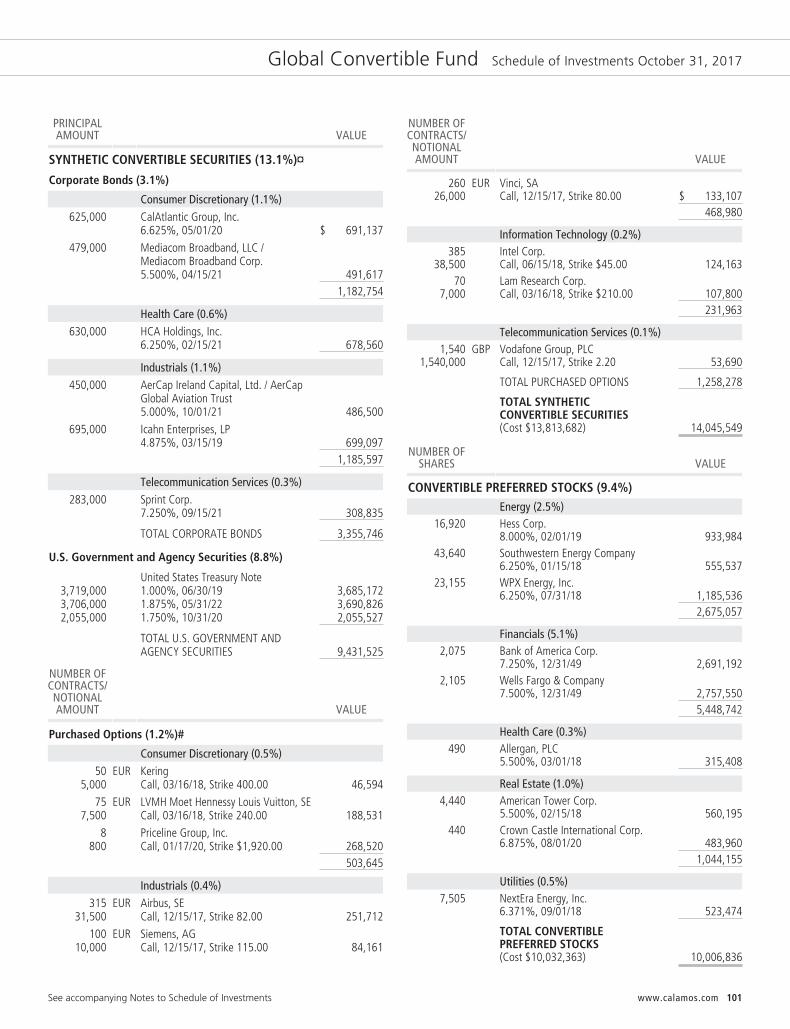
Global Convertible Fund Schedule of Investments October 31, 2017
PRINCIPALAMOUNT VALUE
SYNTHETIC CONVERTIBLE SECURITIES (13.1%)¤
Corporate Bonds (3.1%)
Consumer Discretionary (1.1%)625,000 CalAtlantic Group, Inc.
6.625%, 05/01/20 $ 691,137
479,000 Mediacom Broadband, LLC /Mediacom Broadband Corp.5.500%, 04/15/21 491,617
1,182,754
Health Care (0.6%)630,000 HCA Holdings, Inc.
6.250%, 02/15/21 678,560
Industrials (1.1%)450,000 AerCap Ireland Capital, Ltd. / AerCap
Global Aviation Trust5.000%, 10/01/21 486,500
695,000 Icahn Enterprises, LP4.875%, 03/15/19 699,097
1,185,597
Telecommunication Services (0.3%)283,000 Sprint Corp.
7.250%, 09/15/21 308,835
TOTAL CORPORATE BONDS 3,355,746
U.S. Government and Agency Securities (8.8%)
United States Treasury Note3,719,000 1.000%, 06/30/19 3,685,1723,706,000 1.875%, 05/31/22 3,690,8262,055,000 1.750%, 10/31/20 2,055,527
TOTAL U.S. GOVERNMENT ANDAGENCY SECURITIES 9,431,525
NUMBER OFCONTRACTS/NOTIONALAMOUNT VALUE
Purchased Options (1.2%)#
Consumer Discretionary (0.5%)50
5,000EUR Kering
Call, 03/16/18, Strike 400.00 46,594
757,500
EUR LVMH Moet Hennessy Louis Vuitton, SECall, 03/16/18, Strike 240.00 188,531
8800
Priceline Group, Inc.Call, 01/17/20, Strike $1,920.00 268,520
503,645
Industrials (0.4%)315
31,500EUR Airbus, SE
Call, 12/15/17, Strike 82.00 251,712
10010,000
EUR Siemens, AGCall, 12/15/17, Strike 115.00 84,161
NUMBER OFCONTRACTS/NOTIONALAMOUNT VALUE
26026,000
EUR Vinci, SACall, 12/15/17, Strike 80.00 $ 133,107
468,980
Information Technology (0.2%)385
38,500Intel Corp.Call, 06/15/18, Strike $45.00 124,163
707,000
Lam Research Corp.Call, 03/16/18, Strike $210.00 107,800
231,963
Telecommunication Services (0.1%)1,540
1,540,000GBP Vodafone Group, PLC
Call, 12/15/17, Strike 2.20 53,690
TOTAL PURCHASED OPTIONS 1,258,278
TOTAL SYNTHETICCONVERTIBLE SECURITIES(Cost $13,813,682) 14,045,549
NUMBER OFSHARES VALUE
CONVERTIBLE PREFERRED STOCKS (9.4%)Energy (2.5%)
16,920 Hess Corp.8.000%, 02/01/19 933,984
43,640 Southwestern Energy Company6.250%, 01/15/18 555,537
23,155 WPX Energy, Inc.6.250%, 07/31/18 1,185,536
2,675,057
Financials (5.1%)2,075 Bank of America Corp.
7.250%, 12/31/49 2,691,1922,105 Wells Fargo & Company
7.500%, 12/31/49 2,757,5505,448,742
Health Care (0.3%)490 Allergan, PLC
5.500%, 03/01/18 315,408
Real Estate (1.0%)4,440 American Tower Corp.
5.500%, 02/15/18 560,195440 Crown Castle International Corp.
6.875%, 08/01/20 483,9601,044,155
Utilities (0.5%)7,505 NextEra Energy, Inc.
6.371%, 09/01/18 523,474
TOTAL CONVERTIBLEPREFERRED STOCKS(Cost $10,032,363) 10,006,836
See accompanying Notes to Schedule of Investments www.calamos.com 101

Global Convertible Fund Schedule of Investments October 31, 2017
NUMBER OFCONTRACTS/NOTIONALAMOUNT VALUE
PURCHASED OPTION (0.1%)#Other (0.1%)
60 S&P 500 IndexPut, 12/01/17, Strike $2,495.00(Cost $ 108,201) $ 49,500
NUMBER OFSHARES VALUE
SHORT TERM INVESTMENTS (6.4%)
3,431,685 Fidelity Prime Money Market Fund -Institutional Class 3,432,714
3,428,924 Morgan Stanley Institutional LiquidityFunds - Government Portfolio 3,428,924
TOTAL SHORT TERMINVESTMENTS(Cost $6,861,891) 6,861,638
TOTAL INVESTMENTS (100.5%)(Cost $102,116,620) 107,260,807
LIABILITIES, LESS OTHER ASSETS (-0.5%) (566,809)
NET ASSETS (100.0%) $106,693,998
NOTES TO SCHEDULE OF INVESTMENTS* Securities issued and sold pursuant to a Rule 144A transaction are
excepted from the registration requirement of the Securities Act of 1933,as amended. These securities may only be sold to qualified institutionalbuyers (“QIBs”), such as the Fund. Any resale of these securities mustgenerally be effected through a sale that is registered under the Act orotherwise exempted from such registration requirements.
‡ Variable rate security. The rate shown is the rate in effect atOctober 31, 2017.
¤ The synthetic convertible securities strategy combines separatesecurities that together possess the economic characteristics similar to aconvertible security.
# Non-income producing security.
FOREIGN CURRENCY ABBREVIATIONSEUR European Monetary UnitGBP British Pound SterlingHKD Hong Kong DollarJPY Japanese Yen
Note: Value for securities denominated in foreign currencies is shown in U.S. dollars. Theprincipal amount for such securities is shown in the respective foreign currency. The dateon options represents the expiration date of the option contract. The option contract maybe exercised at any date on or before the date shown.
CURRENCY EXPOSUREOCTOBER 31, 2017
VALUE% OF TOTAL
INVESTMENTS
US Dollar $ 74,934,362 69.9%
European Monetary Unit 23,812,433 22.2%
Japanese Yen 7,679,134 7.1%
Hong Kong Dollar 781,188 0.7%
British Pound Sterling 53,690 0.1%
Total Investments $107,260,807 100.0%
Currency exposure may vary over time.
102 CALAMOS OPEN-END FAMILY OF FUNDS ANNUAL REPORT See accompanying Notes to Financial Statements
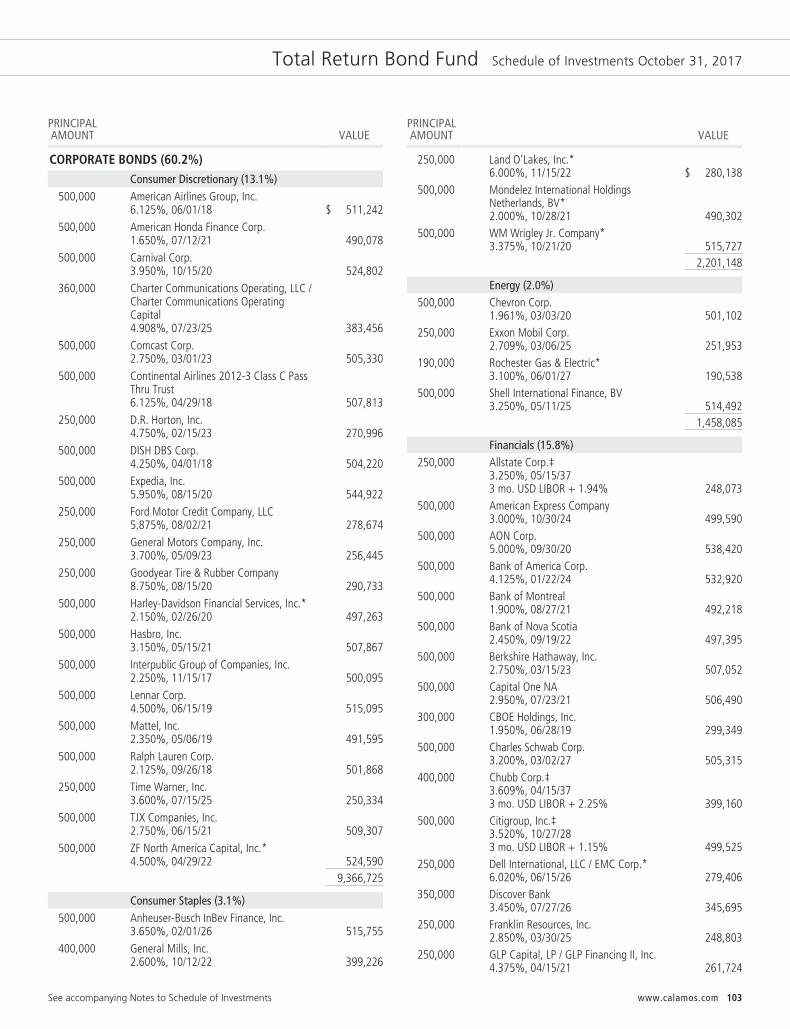
Total Return Bond Fund Schedule of Investments October 31, 2017
PRINCIPALAMOUNT VALUE
CORPORATE BONDS (60.2%)Consumer Discretionary (13.1%)
500,000 American Airlines Group, Inc.6.125%, 06/01/18 $ 511,242
500,000 American Honda Finance Corp.1.650%, 07/12/21 490,078
500,000 Carnival Corp.3.950%, 10/15/20 524,802
360,000 Charter Communications Operating, LLC /Charter Communications OperatingCapital4.908%, 07/23/25 383,456
500,000 Comcast Corp.2.750%, 03/01/23 505,330
500,000 Continental Airlines 2012-3 Class C PassThru Trust6.125%, 04/29/18 507,813
250,000 D.R. Horton, Inc.4.750%, 02/15/23 270,996
500,000 DISH DBS Corp.4.250%, 04/01/18 504,220
500,000 Expedia, Inc.5.950%, 08/15/20 544,922
250,000 Ford Motor Credit Company, LLC5.875%, 08/02/21 278,674
250,000 General Motors Company, Inc.3.700%, 05/09/23 256,445
250,000 Goodyear Tire & Rubber Company8.750%, 08/15/20 290,733
500,000 Harley-Davidson Financial Services, Inc.*2.150%, 02/26/20 497,263
500,000 Hasbro, Inc.3.150%, 05/15/21 507,867
500,000 Interpublic Group of Companies, Inc.2.250%, 11/15/17 500,095
500,000 Lennar Corp.4.500%, 06/15/19 515,095
500,000 Mattel, Inc.2.350%, 05/06/19 491,595
500,000 Ralph Lauren Corp.2.125%, 09/26/18 501,868
250,000 Time Warner, Inc.3.600%, 07/15/25 250,334
500,000 TJX Companies, Inc.2.750%, 06/15/21 509,307
500,000 ZF North America Capital, Inc.*4.500%, 04/29/22 524,590
9,366,725
Consumer Staples (3.1%)500,000 Anheuser-Busch InBev Finance, Inc.
3.650%, 02/01/26 515,755400,000 General Mills, Inc.
2.600%, 10/12/22 399,226
PRINCIPALAMOUNT VALUE
250,000 Land O’Lakes, Inc.*6.000%, 11/15/22 $ 280,138
500,000 Mondelez International HoldingsNetherlands, BV*2.000%, 10/28/21 490,302
500,000 WM Wrigley Jr. Company*3.375%, 10/21/20 515,727
2,201,148
Energy (2.0%)500,000 Chevron Corp.
1.961%, 03/03/20 501,102250,000 Exxon Mobil Corp.
2.709%, 03/06/25 251,953190,000 Rochester Gas & Electric*
3.100%, 06/01/27 190,538500,000 Shell International Finance, BV
3.250%, 05/11/25 514,4921,458,085
Financials (15.8%)250,000 Allstate Corp.‡
3.250%, 05/15/373 mo. USD LIBOR + 1.94% 248,073
500,000 American Express Company3.000%, 10/30/24 499,590
500,000 AON Corp.5.000%, 09/30/20 538,420
500,000 Bank of America Corp.4.125%, 01/22/24 532,920
500,000 Bank of Montreal1.900%, 08/27/21 492,218
500,000 Bank of Nova Scotia2.450%, 09/19/22 497,395
500,000 Berkshire Hathaway, Inc.2.750%, 03/15/23 507,052
500,000 Capital One NA2.950%, 07/23/21 506,490
300,000 CBOE Holdings, Inc.1.950%, 06/28/19 299,349
500,000 Charles Schwab Corp.3.200%, 03/02/27 505,315
400,000 Chubb Corp.‡3.609%, 04/15/373 mo. USD LIBOR + 2.25% 399,160
500,000 Citigroup, Inc.‡3.520%, 10/27/283 mo. USD LIBOR + 1.15% 499,525
250,000 Dell International, LLC / EMC Corp.*6.020%, 06/15/26 279,406
350,000 Discover Bank3.450%, 07/27/26 345,695
250,000 Franklin Resources, Inc.2.850%, 03/30/25 248,803
250,000 GLP Capital, LP / GLP Financing II, Inc.4.375%, 04/15/21 261,724
See accompanying Notes to Schedule of Investments www.calamos.com 103

Total Return Bond Fund Schedule of Investments October 31, 2017
PRINCIPALAMOUNT VALUE
500,000 JPMorgan Chase & Company‡3.220%, 03/01/253 mo. USD LIBOR + 1.16% $ 505,760
450,000 Markel Corp.3.500%, 11/01/27 449,051
400,000 MetLife, Inc.6.400%, 12/15/36 461,616
500,000 Morgan Stanley2.500%, 04/21/21 501,292
500,000 RenaissanceRe Finance, Inc.3.450%, 07/01/27 493,733
500,000 State Street Corp.1.950%, 05/19/21 496,480
500,000 SunTrust Banks, Inc.3.300%, 05/15/26 496,247
500,000 Toronto-Dominion Bank2.125%, 04/07/21 498,180
250,000 US Bancorp3.600%, 09/11/24 260,581
500,000 Wells Fargo & Company4.400%, 06/14/46 516,922
11,340,997
Health Care (3.3%)500,000 AbbVie, Inc.
2.850%, 05/14/23 502,105500,000 Edwards Lifesciences Corp.
2.875%, 10/15/18 504,883250,000 Gilead Sciences, Inc.
3.650%, 03/01/26 260,551400,000 HCA, Inc.
4.500%, 02/15/27 404,986250,000 Johnson & Johnson
2.450%, 03/01/26 244,474200,000 Teva Pharmaceutical Finance
Netherlands III, BV2.200%, 07/21/21 188,247
250,000 Zoetis, Inc.3.000%, 09/12/27 245,481
2,350,727
Industrials (6.2%)250,000 AerCap Ireland Capital, Ltd. / AerCap
Global Aviation Trust5.000%, 10/01/21 270,278
400,000 Alimentation Couche-Tard, Inc.*3.550%, 07/26/27 401,552
400,000 Delta Air Lines, Inc.3.625%, 03/15/22 411,002
500,000 Eaton Corp.1.500%, 11/02/17 500,000
500,000 Honeywell International, Inc.1.850%, 11/01/21 494,200
200,000 IHO Verwaltungs GmbH*4.125%, 09/15/214.875% PIK rate 204,394
PRINCIPALAMOUNT VALUE
400,000 Kaiser Aluminum Corp.5.875%, 05/15/24 $ 431,030
500,000 Parker-Hannifin Corp.5.500%, 05/15/18 510,367
200,000 Rockwell Collins, Inc.2.800%, 03/15/22 202,044
500,000 Southwest Airlines Company2.750%, 11/06/19 506,820
500,000 Verisk Analytics, Inc.4.125%, 09/12/22 527,197
4,458,884
Information Technology (7.3%)500,000 Alliance Data Systems Corp.*
5.375%, 08/01/22 510,292500,000 Amphenol Corp.
4.000%, 02/01/22 524,952500,000 Apple, Inc.
4.375%, 05/13/45 548,027200,000 CDK Global, Inc.*
4.875%, 06/01/27 208,676500,000 Cisco Systems, Inc.
1.850%, 09/20/21 494,173300,000 Electronic Arts, Inc.
4.800%, 03/01/26 331,571500,000 Fiserv, Inc.
3.500%, 10/01/22 516,305250,000 Hewlett Packard Enterprise Company
4.900%, 10/15/25 266,040500,000 Microsoft Corp.
4.100%, 02/06/37 548,220185,000 Nuance Communications, Inc.
6.000%, 07/01/24 200,097550,000 NXP Semiconductors, NV*
4.125%, 06/01/21 575,300500,000 Visa, Inc.
2.200%, 12/14/20 503,8735,227,526
Materials (1.4%)500,000 Georgia-Pacific, LLC*
3.600%, 03/01/25 516,110140,000 Kinross Gold Corp.*
4.500%, 07/15/27 141,808350,000 Steel Dynamics, Inc.
5.000%, 12/15/26 372,4091,030,327
Real Estate (3.3%)500,000 American Tower Corp.
5.900%, 11/01/21 560,267400,000 Federal Realty Investment Trust
3.250%, 07/15/27 397,142250,000 HCP, Inc.
4.200%, 03/01/24 262,289
104 CALAMOS OPEN-END FAMILY OF FUNDS ANNUAL REPORT See accompanying Notes to Schedule of Investments
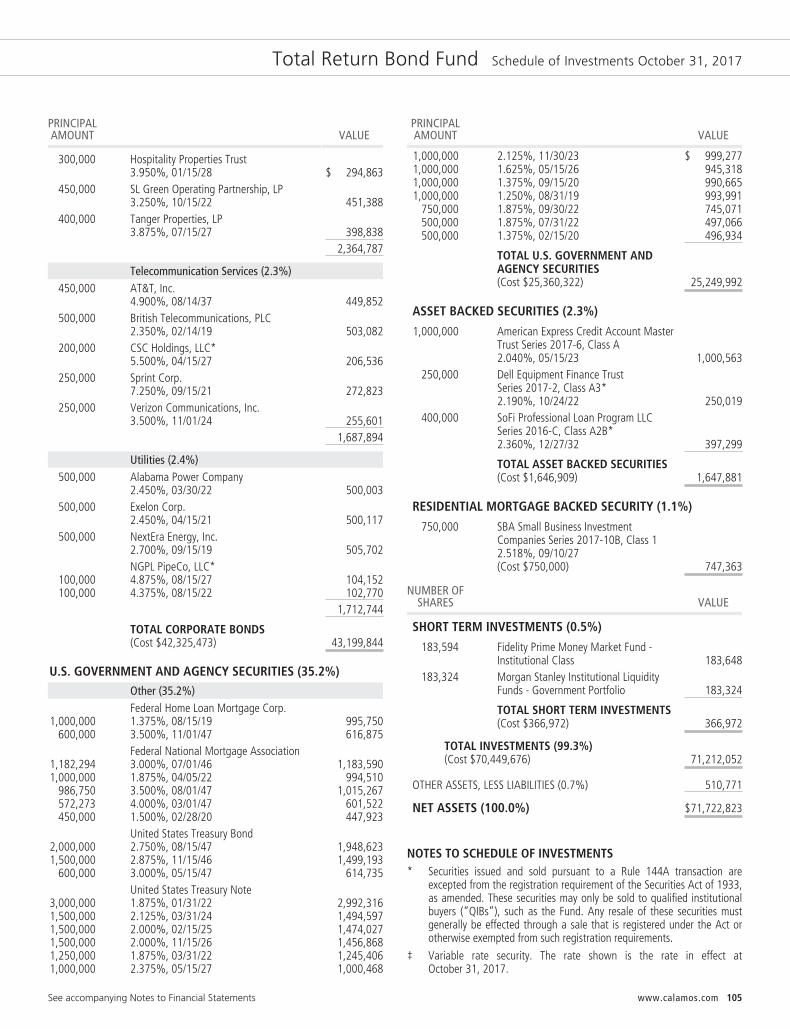
Total Return Bond Fund Schedule of Investments October 31, 2017
PRINCIPALAMOUNT VALUE
300,000 Hospitality Properties Trust3.950%, 01/15/28 $ 294,863
450,000 SL Green Operating Partnership, LP3.250%, 10/15/22 451,388
400,000 Tanger Properties, LP3.875%, 07/15/27 398,838
2,364,787
Telecommunication Services (2.3%)450,000 AT&T, Inc.
4.900%, 08/14/37 449,852500,000 British Telecommunications, PLC
2.350%, 02/14/19 503,082200,000 CSC Holdings, LLC*
5.500%, 04/15/27 206,536250,000 Sprint Corp.
7.250%, 09/15/21 272,823250,000 Verizon Communications, Inc.
3.500%, 11/01/24 255,6011,687,894
Utilities (2.4%)500,000 Alabama Power Company
2.450%, 03/30/22 500,003500,000 Exelon Corp.
2.450%, 04/15/21 500,117500,000 NextEra Energy, Inc.
2.700%, 09/15/19 505,702NGPL PipeCo, LLC*
100,000 4.875%, 08/15/27 104,152100,000 4.375%, 08/15/22 102,770
1,712,744
TOTAL CORPORATE BONDS(Cost $42,325,473) 43,199,844
U.S. GOVERNMENT AND AGENCY SECURITIES (35.2%)Other (35.2%)Federal Home Loan Mortgage Corp.
1,000,000 1.375%, 08/15/19 995,750600,000 3.500%, 11/01/47 616,875
Federal National Mortgage Association1,182,294 3.000%, 07/01/46 1,183,5901,000,000 1.875%, 04/05/22 994,510
986,750 3.500%, 08/01/47 1,015,267572,273 4.000%, 03/01/47 601,522450,000 1.500%, 02/28/20 447,923
United States Treasury Bond2,000,000 2.750%, 08/15/47 1,948,6231,500,000 2.875%, 11/15/46 1,499,193
600,000 3.000%, 05/15/47 614,735United States Treasury Note
3,000,000 1.875%, 01/31/22 2,992,3161,500,000 2.125%, 03/31/24 1,494,5971,500,000 2.000%, 02/15/25 1,474,0271,500,000 2.000%, 11/15/26 1,456,8681,250,000 1.875%, 03/31/22 1,245,4061,000,000 2.375%, 05/15/27 1,000,468
PRINCIPALAMOUNT VALUE
1,000,000 2.125%, 11/30/23 $ 999,2771,000,000 1.625%, 05/15/26 945,3181,000,000 1.375%, 09/15/20 990,6651,000,000 1.250%, 08/31/19 993,991
750,000 1.875%, 09/30/22 745,071500,000 1.875%, 07/31/22 497,066500,000 1.375%, 02/15/20 496,934
TOTAL U.S. GOVERNMENT ANDAGENCY SECURITIES(Cost $25,360,322) 25,249,992
ASSET BACKED SECURITIES (2.3%)
1,000,000 American Express Credit Account MasterTrust Series 2017-6, Class A2.040%, 05/15/23 1,000,563
250,000 Dell Equipment Finance TrustSeries 2017-2, Class A3*2.190%, 10/24/22 250,019
400,000 SoFi Professional Loan Program LLCSeries 2016-C, Class A2B*2.360%, 12/27/32 397,299
TOTAL ASSET BACKED SECURITIES(Cost $1,646,909) 1,647,881
RESIDENTIAL MORTGAGE BACKED SECURITY (1.1%)
750,000 SBA Small Business InvestmentCompanies Series 2017-10B, Class 12.518%, 09/10/27(Cost $750,000) 747,363
NUMBER OFSHARES VALUE
SHORT TERM INVESTMENTS (0.5%)
183,594 Fidelity Prime Money Market Fund -Institutional Class 183,648
183,324 Morgan Stanley Institutional LiquidityFunds - Government Portfolio 183,324
TOTAL SHORT TERM INVESTMENTS(Cost $366,972) 366,972
TOTAL INVESTMENTS (99.3%)(Cost $70,449,676) 71,212,052
OTHER ASSETS, LESS LIABILITIES (0.7%) 510,771
NET ASSETS (100.0%) $71,722,823
NOTES TO SCHEDULE OF INVESTMENTS* Securities issued and sold pursuant to a Rule 144A transaction are
excepted from the registration requirement of the Securities Act of 1933,as amended. These securities may only be sold to qualified institutionalbuyers (“QIBs”), such as the Fund. Any resale of these securities mustgenerally be effected through a sale that is registered under the Act orotherwise exempted from such registration requirements.
‡ Variable rate security. The rate shown is the rate in effect atOctober 31, 2017.
See accompanying Notes to Financial Statements www.calamos.com 105

High Income Opportunities Fund Schedule of Investments October 31, 2017
PRINCIPALAMOUNT VALUE
CORPORATE BONDS (93.8%)Consumer Discretionary (17.9%)
68,000 Altice US Finance I Corp.*5.500%, 05/15/26 $ 70,771
140,000 AV Homes, Inc.6.625%, 05/15/22 145,607
195,000 Beverages & More, Inc.*11.500%, 06/15/22 175,758CCO Holdings, LLC / CCO Holdings CapitalCorp.*
365,000 5.125%, 05/01/27 368,32980,000 5.000%, 02/01/28 79,463
469,000 Century Communities, Inc.6.875%, 05/15/22 493,808
500,000 Cooper Tire & Rubber Company8.000%, 12/15/19 554,935
155,000 CRC Escrow Issuer, LLC*5.250%, 10/15/25 156,144
460,000 Dana, Inc.5.500%, 12/15/24 488,159
290,000 DISH DBS Corp.5.875%, 11/15/24 290,403
125,000 Eldorado Resorts, Inc.6.000%, 04/01/25 132,296
375,000 ESH Hospitality, Inc.*5.250%, 05/01/25 388,579
150,000 goeasy, Ltd.*7.875%, 11/01/22 154,227
25,000 Guitar Center, Inc.*6.500%, 04/15/19 23,413
200,000 Horizon Pharma, Inc. / Horizon PharmaUSA, Inc.*8.750%, 11/01/24 209,580
600,000 L Brands, Inc.6.875%, 11/01/35 596,778
195,000 Lions Gate Entertainment Corp.*5.875%, 11/01/24 206,963
170,000 M/I Homes, Inc.5.625%, 08/01/25 173,701
445,000 Meritage Homes Corp.7.000%, 04/01/22 510,593
90,000 Netflix, Inc.*4.875%, 04/15/28 89,621
300,000 Nexstar Escrow Corp.*5.625%, 08/01/24 308,173
560,000 Penske Automotive Group, Inc.5.375%, 12/01/24 578,119PetSmart, Inc.*
140,000 5.875%, 06/01/25 122,05635,000 8.875%, 06/01/25 27,636
515,000 Reliance Intermediate Holdings, LP*6.500%, 04/01/23 547,043Rite Aid Corp.
325,000 7.700%, 02/15/27 276,216310,000 6.125%, 04/01/23* 289,549
PRINCIPALAMOUNT VALUE
320,000 Salem Media Group, Inc.*6.750%, 06/01/24 $ 335,659
205,000 Sally Holdings, LLC / Sally Capital, Inc.5.625%, 12/01/25 203,860SFR Group, SA*
275,000 6.000%, 05/15/22 286,940150,000 7.375%, 05/01/26 161,620315,000 Sirius XM Radio, Inc.*
6.000%, 07/15/24 337,272575,000 Speedway Motorsports, Inc.
5.125%, 02/01/23 595,548425,000 Time, Inc.*^
5.750%, 04/15/22 429,875350,000 Toll Brothers Finance Corp.
5.625%, 01/15/24 384,484500,000 ZF North America Capital, Inc.*
4.500%, 04/29/22 524,59010,717,768
Consumer Staples (2.7%)150,000 Albertsons Companies, LLC / Safeway, Inc.
/ New Albertson’s, Inc. / Albertson’s, LLC5.750%, 03/15/25 132,635
485,000 Fresh Market, Inc.*9.750%, 05/01/23 274,020
765,000 JBS USA LUX SA / JBS USA Finance, Inc.*7.250%, 06/01/21 782,132New Albertson’s, Inc.
145,000 7.450%, 08/01/29 121,55170,000 8.000%, 05/01/31 60,982
Pilgrim’s Pride Corp.*30,000 5.750%, 03/15/25 31,78525,000 5.875%, 09/30/27 26,014
170,000 Post Holdings, Inc.*5.750%, 03/01/27 177,005
1,606,124
Energy (10.1%)545,000 Antero Midstream Partners, LP / Antero
Midstream Finance Corp.5.375%, 09/15/24 567,928
250,000 Blue Racer Midstream, LLC / Blue RacerFinance Corp.*6.125%, 11/15/22 261,266
240,000 Calfrac Holdings, LP*7.500%, 12/01/20 235,922
375,000 Carrizo Oil & Gas, Inc.6.250%, 04/15/23 382,260
150,000 Chesapeake Energy Corp.*8.000%, 01/15/25 148,305
30,000 Consol Mining Corp.*11.000%, 11/15/25 30,786
30,000 CrownRock, LP / CrownRock Finance, Inc.*5.625%, 10/15/25 30,467
365,000 DCP Midstream, LLC*‡5.850%, 05/21/433 mo. USD LIBOR + 3.85% 348,175
106 CALAMOS OPEN-END FAMILY OF FUNDS ANNUAL REPORT See accompanying Notes to Schedule of Investments

High Income Opportunities Fund Schedule of Investments October 31, 2017
PRINCIPALAMOUNT VALUE
75,000 Diamond Offshore Drilling, Inc.7.875%, 08/15/25 $ 80,300
535,000 Energy Transfer Equity, LP5.500%, 06/01/27 566,945
555,000 Energy Transfer Partners, LP‡4.394%, 11/01/663 mo. USD LIBOR + 3.02% 503,662
175,000 EP Energy, LLC / Everest AcquisitionFinance, Inc.*8.000%, 02/15/25 129,607
150,000 Genesis Energy, LP / Genesis EnergyFinance Corp.6.500%, 10/01/25 152,495
507,000 Gulfmark Offshore, [email protected]%, 03/15/22 141,960Gulfport Energy Corp.
185,000 6.000%, 10/15/24 186,010130,000 6.375%, 05/15/25 131,801115,000 Halcon Resources Corp.*
6.750%, 02/15/25 117,933320,000 Laredo Petroleum, Inc.
6.250%, 03/15/23 332,781250,000 Petroleum Geo Services Company*^
7.375%, 12/15/20 230,832150,000 Plains All American Pipeline, LP‡
6.125%, 11/15/223 mo. USD LIBOR + 4.11% 152,958
250,000 QEP Resources, Inc.6.875%, 03/01/21 266,779
109,000 Rice Energy, Inc.7.250%, 05/01/23 117,692
190,000 SESI, LLC*7.750%, 09/15/24 196,831
60,000 SM Energy Company6.750%, 09/15/26 61,722
135,000 Southwestern Energy Company7.500%, 04/01/26 140,433
60,000 Transocean, Inc.*7.500%, 01/15/26 61,927
150,000 Vine Oil & Gas, LP / Vine Oil & GasFinance Corp.*8.750%, 04/15/23 146,834
176,401 W&T Offshore, Inc.*9.000%, 05/15/2010.750% PIK rate 159,807
85,000 Weatherford International, Ltd.8.250%, 06/15/23 85,553
60,000 WildHorse Resource Development Corp.*6.875%, 02/01/25 59,987
6,029,958
Financials (10.9%)510,000 Ally Financial, Inc.
8.000%, 11/01/31 675,462200,000 Ardonagh Midco 3, PLC*
8.625%, 07/15/23 210,728
PRINCIPALAMOUNT VALUE
315,000 AssuredPartners, Inc.*7.000%, 08/15/25 $ 328,775CyrusOne, LP / CyrusOne Finance Corp.*
175,000 5.375%, 03/15/27 187,79150,000 5.000%, 03/15/24 52,494
405,000 Dell International, LLC / EMC Corp.*6.020%, 06/15/26 452,638
150,000 Discover Financial Services‡5.500%, 10/30/273 mo. USD LIBOR + 3.08% 153,175
845,000 GLP Capital, LP / GLP Financing II, Inc.~5.375%, 04/15/26 916,048
150,000 HUB International, Ltd.*7.875%, 10/01/21 156,192
160,000 ILFC E-Capital Trust II*‡4.610%, 12/21/65 155,300
625,000 Jefferies Finance, LLC*7.250%, 08/15/24 638,369
150,000 Level 3 Financing, Inc.5.375%, 05/01/25 156,989
175,000 LPL Holdings, Inc.*5.750%, 09/15/25 182,213
260,000 MetLife, Inc.6.400%, 12/15/66 300,050Navient Corp.
225,000 6.750%, 06/25/25 235,51489,000 6.500%, 06/15/22 94,834
400,000 Oil Insurance, Ltd.*‡~4.317%, 01/08/183 mo. USD LIBOR + 2.98% 382,376
550,000 Quicken Loans, Inc.*5.750%, 05/01/25 583,621
60,000 Radian Group, Inc.4.500%, 10/01/24 61,634
270,000 Springleaf Finance Corp.8.250%, 10/01/23 308,002
160,000 Tronox Finance, PLC*5.750%, 10/01/25 167,564
100,000 VEREIT Operating Partnership, LP3.950%, 08/15/27 99,883
6,499,652
Health Care (9.7%)Acadia Healthcare Company, Inc.
185,000 5.625%, 02/15/23 190,359180,000 6.500%, 03/01/24 190,910
Community Health Systems, Inc.385,000 7.125%, 07/15/20 334,365350,000 6.875%, 02/01/22 255,591500,000 DaVita, Inc.
5.125%, 07/15/24 503,475525,000 Endo, Ltd.*
6.000%, 07/15/23 426,389275,000 Greatbatch, Ltd.*
9.125%, 11/01/23 298,941
See accompanying Notes to Schedule of Investments www.calamos.com 107
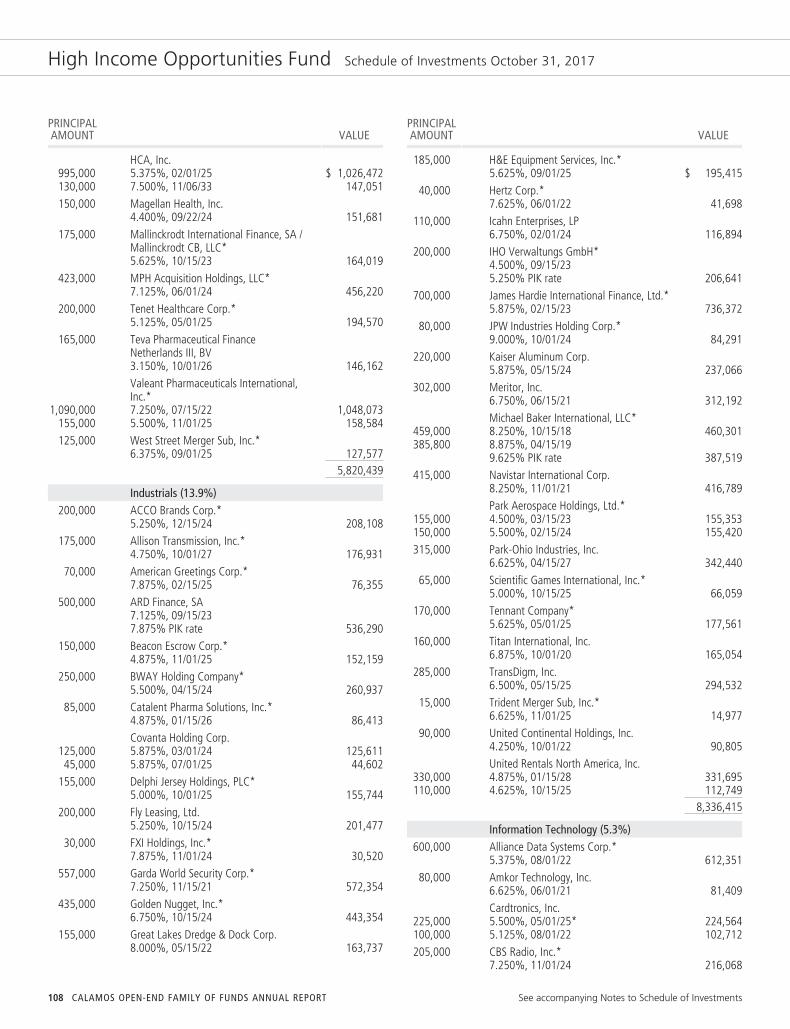
High Income Opportunities Fund Schedule of Investments October 31, 2017
PRINCIPALAMOUNT VALUE
HCA, Inc.995,000 5.375%, 02/01/25 $ 1,026,472130,000 7.500%, 11/06/33 147,051150,000 Magellan Health, Inc.
4.400%, 09/22/24 151,681175,000 Mallinckrodt International Finance, SA /
Mallinckrodt CB, LLC*5.625%, 10/15/23 164,019
423,000 MPH Acquisition Holdings, LLC*7.125%, 06/01/24 456,220
200,000 Tenet Healthcare Corp.*5.125%, 05/01/25 194,570
165,000 Teva Pharmaceutical FinanceNetherlands III, BV3.150%, 10/01/26 146,162Valeant Pharmaceuticals International,Inc.*
1,090,000 7.250%, 07/15/22 1,048,073155,000 5.500%, 11/01/25 158,584125,000 West Street Merger Sub, Inc.*
6.375%, 09/01/25 127,5775,820,439
Industrials (13.9%)200,000 ACCO Brands Corp.*
5.250%, 12/15/24 208,108175,000 Allison Transmission, Inc.*
4.750%, 10/01/27 176,93170,000 American Greetings Corp.*
7.875%, 02/15/25 76,355500,000 ARD Finance, SA
7.125%, 09/15/237.875% PIK rate 536,290
150,000 Beacon Escrow Corp.*4.875%, 11/01/25 152,159
250,000 BWAY Holding Company*5.500%, 04/15/24 260,937
85,000 Catalent Pharma Solutions, Inc.*4.875%, 01/15/26 86,413Covanta Holding Corp.
125,000 5.875%, 03/01/24 125,61145,000 5.875%, 07/01/25 44,602
155,000 Delphi Jersey Holdings, PLC*5.000%, 10/01/25 155,744
200,000 Fly Leasing, Ltd.5.250%, 10/15/24 201,477
30,000 FXI Holdings, Inc.*7.875%, 11/01/24 30,520
557,000 Garda World Security Corp.*7.250%, 11/15/21 572,354
435,000 Golden Nugget, Inc.*6.750%, 10/15/24 443,354
155,000 Great Lakes Dredge & Dock Corp.8.000%, 05/15/22 163,737
PRINCIPALAMOUNT VALUE
185,000 H&E Equipment Services, Inc.*5.625%, 09/01/25 $ 195,415
40,000 Hertz Corp.*7.625%, 06/01/22 41,698
110,000 Icahn Enterprises, LP6.750%, 02/01/24 116,894
200,000 IHO Verwaltungs GmbH*4.500%, 09/15/235.250% PIK rate 206,641
700,000 James Hardie International Finance, Ltd.*5.875%, 02/15/23 736,372
80,000 JPW Industries Holding Corp.*9.000%, 10/01/24 84,291
220,000 Kaiser Aluminum Corp.5.875%, 05/15/24 237,066
302,000 Meritor, Inc.6.750%, 06/15/21 312,192Michael Baker International, LLC*
459,000 8.250%, 10/15/18 460,301385,800 8.875%, 04/15/19
9.625% PIK rate 387,519415,000 Navistar International Corp.
8.250%, 11/01/21 416,789Park Aerospace Holdings, Ltd.*
155,000 4.500%, 03/15/23 155,353150,000 5.500%, 02/15/24 155,420315,000 Park-Ohio Industries, Inc.
6.625%, 04/15/27 342,44065,000 Scientific Games International, Inc.*
5.000%, 10/15/25 66,059170,000 Tennant Company*
5.625%, 05/01/25 177,561160,000 Titan International, Inc.
6.875%, 10/01/20 165,054285,000 TransDigm, Inc.
6.500%, 05/15/25 294,53215,000 Trident Merger Sub, Inc.*
6.625%, 11/01/25 14,97790,000 United Continental Holdings, Inc.
4.250%, 10/01/22 90,805United Rentals North America, Inc.
330,000 4.875%, 01/15/28 331,695110,000 4.625%, 10/15/25 112,749
8,336,415
Information Technology (5.3%)600,000 Alliance Data Systems Corp.*
5.375%, 08/01/22 612,35180,000 Amkor Technology, Inc.
6.625%, 06/01/21 81,409Cardtronics, Inc.
225,000 5.500%, 05/01/25* 224,564100,000 5.125%, 08/01/22 102,712205,000 CBS Radio, Inc.*
7.250%, 11/01/24 216,068
108 CALAMOS OPEN-END FAMILY OF FUNDS ANNUAL REPORT See accompanying Notes to Schedule of Investments

High Income Opportunities Fund Schedule of Investments October 31, 2017
PRINCIPALAMOUNT VALUE
160,000 CDK Global, Inc.*4.875%, 06/01/27 $ 166,941
480,000 Clear Channel Worldwide Holdings, Inc.7.625%, 03/15/20 475,115
290,000 CommScope Technologies, LLC*6.000%, 06/15/25 307,233
282,000 First Data Corp. - Class A*7.000%, 12/01/23 302,122
145,000 Harland Clarke Holdings Corp.*8.375%, 08/15/22 152,821
200,000 Nuance Communications, Inc.*5.625%, 12/15/26 212,715
150,000 TTM Technologies, Inc.*5.625%, 10/01/25 152,940
155,000 VFH Parent, LLC*6.750%, 06/15/22 161,217
3,168,208
Materials (10.7%)308,000 AK Steel Corp.
6.375%, 10/15/25 303,737400,000 Alcoa Nederland Holding, BV*
7.000%, 09/30/26 457,528565,000 ArcelorMittal, SA~
7.500%, 10/15/39 706,329335,000 Ardagh Packaging Finance, PLC / Ardagh
Holdings USA, Inc.*6.000%, 02/15/25 355,929
695,000 Cascades, Inc.*5.750%, 07/15/23 730,990
615,000 Constellium, NV*8.000%, 01/15/23 656,857
200,000 First Quantum Minerals, Ltd.*7.250%, 04/01/23 212,335Freeport-McMoRan, Inc.
280,000 4.550%, 11/14/24 280,03590,000 3.550%, 03/01/22 89,123
350,000 Huntsman International, LLC5.125%, 11/15/22 376,448
150,000 IAMGOLD Corp.*7.000%, 04/15/25 158,523
535,000 INEOS Group Holdings, SA*5.625%, 08/01/24 558,682
110,000 Kinross Gold Corp.*4.500%, 07/15/27 111,421
220,000 Koppers, Inc.*6.000%, 02/15/25 236,222
120,000 New Gold, Inc.*6.375%, 05/15/25 127,864
275,000 PBF Holding Company, LLC / PBF FinanceCorp.*7.250%, 06/15/25 285,920Steel Dynamics, Inc.
157,000 5.000%, 12/15/26 167,05270,000 4.125%, 09/15/25* 70,540
PRINCIPALAMOUNT VALUE
75,000 Trinseo Materials Operating, SCA*5.375%, 09/01/25 $ 78,978United States Steel Corp.
285,000 8.375%, 07/01/21* 313,18275,000 6.875%, 08/15/25 76,28115,000 Warrior Met Coal, Inc.*
8.000%, 11/01/24 15,3886,369,364
Real Estate (1.1%)174,000 Crescent Communities, LLC/Crescent
Ventures, Inc.*8.875%, 10/15/21 185,092iStar, Inc.
125,000 6.000%, 04/01/22 130,98135,000 4.625%, 09/15/20 35,778
275,000 MPT Operating Partnership, LP / MPTFinance Corp.5.000%, 10/15/27 282,462
634,313
Telecommunication Services (9.8%)200,000 Altice Financing, SA*
7.500%, 05/15/26 219,83535,000 Block Communications, Inc.*
6.875%, 02/15/25 37,895145,000 CB Escrow Corp.*
8.000%, 10/15/25 150,456575,000 CSC Holdings, LLC*
5.500%, 04/15/27 593,791602,000 Embarq Corp.
7.995%, 06/01/36 609,663Frontier Communications Corp.
745,000 7.625%, 04/15/24 570,230275,000 10.500%, 09/15/22 241,502170,000 Hughes Satellite Systems Corp.
6.625%, 08/01/26 180,241300,000 Inmarsat Finance, PLC*~
4.875%, 05/15/22 306,169Intelsat Jackson Holdings, SA
255,000 9.750%, 07/15/25* 257,037165,000 7.500%, 04/01/21 156,956140,000 8.000%, 02/15/24* 149,328155,000 Qwest Corp.
6.875%, 09/15/33 153,1171,220,000 Sprint Corp.
7.875%, 09/15/23 1,366,925410,000 T-Mobile USA, Inc.
6.625%, 04/01/23 430,922171,000 United States Cellular Corp.
6.700%, 12/15/33 180,773Windstream Services, LLC
210,000 7.750%, 10/01/21 160,023125,000 7.750%, 10/15/20 112,023
5,876,886
See accompanying Notes to Schedule of Investments www.calamos.com 109
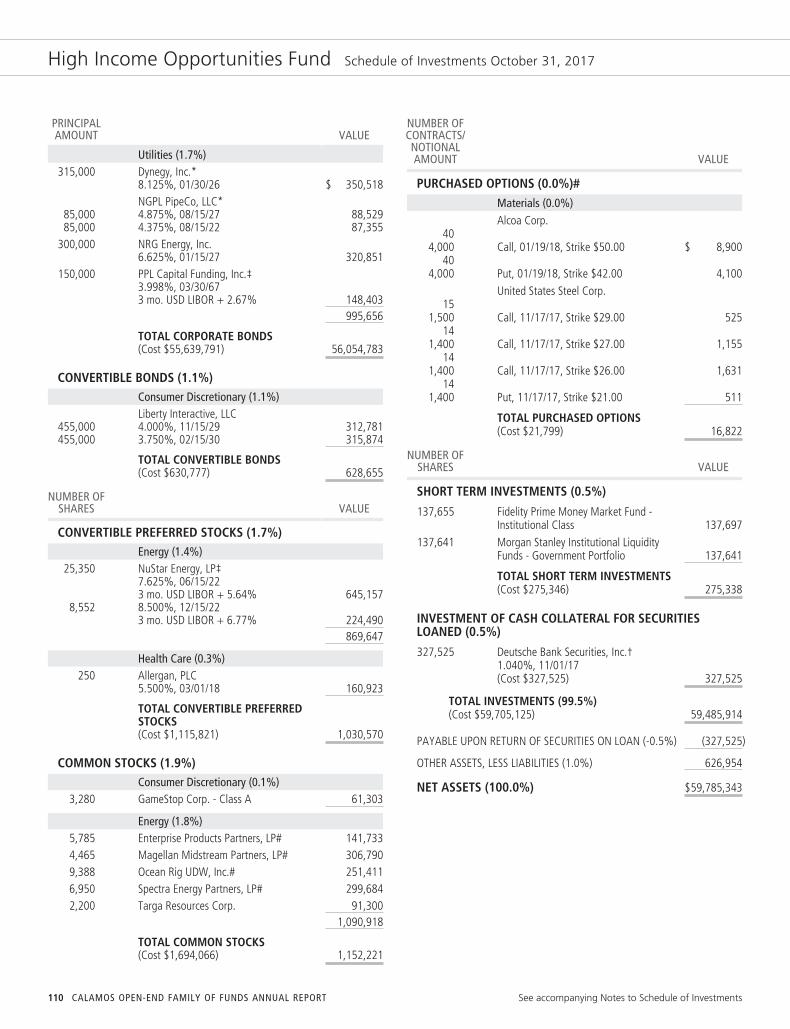
High Income Opportunities Fund Schedule of Investments October 31, 2017
PRINCIPALAMOUNT VALUE
Utilities (1.7%)315,000 Dynegy, Inc.*
8.125%, 01/30/26 $ 350,518NGPL PipeCo, LLC*
85,000 4.875%, 08/15/27 88,52985,000 4.375%, 08/15/22 87,355
300,000 NRG Energy, Inc.6.625%, 01/15/27 320,851
150,000 PPL Capital Funding, Inc.‡3.998%, 03/30/673 mo. USD LIBOR + 2.67% 148,403
995,656
TOTAL CORPORATE BONDS(Cost $55,639,791) 56,054,783
CONVERTIBLE BONDS (1.1%)Consumer Discretionary (1.1%)Liberty Interactive, LLC
455,000 4.000%, 11/15/29 312,781455,000 3.750%, 02/15/30 315,874
TOTAL CONVERTIBLE BONDS(Cost $630,777) 628,655
NUMBER OFSHARES VALUE
CONVERTIBLE PREFERRED STOCKS (1.7%)Energy (1.4%)
25,350 NuStar Energy, LP‡7.625%, 06/15/223 mo. USD LIBOR + 5.64% 645,157
8,552 8.500%, 12/15/223 mo. USD LIBOR + 6.77% 224,490
869,647
Health Care (0.3%)250 Allergan, PLC
5.500%, 03/01/18 160,923
TOTAL CONVERTIBLE PREFERREDSTOCKS(Cost $1,115,821) 1,030,570
COMMON STOCKS (1.9%)Consumer Discretionary (0.1%)
3,280 GameStop Corp. - Class A 61,303
Energy (1.8%)5,785 Enterprise Products Partners, LP# 141,7334,465 Magellan Midstream Partners, LP# 306,7909,388 Ocean Rig UDW, Inc.# 251,4116,950 Spectra Energy Partners, LP# 299,6842,200 Targa Resources Corp. 91,300
1,090,918
TOTAL COMMON STOCKS(Cost $1,694,066) 1,152,221
NUMBER OFCONTRACTS/NOTIONALAMOUNT VALUE
PURCHASED OPTIONS (0.0%)#Materials (0.0%)Alcoa Corp.
404,000 Call, 01/19/18, Strike $50.00 $ 8,900
404,000 Put, 01/19/18, Strike $42.00 4,100
United States Steel Corp.15
1,500 Call, 11/17/17, Strike $29.00 52514
1,400 Call, 11/17/17, Strike $27.00 1,15514
1,400 Call, 11/17/17, Strike $26.00 1,63114
1,400 Put, 11/17/17, Strike $21.00 511
TOTAL PURCHASED OPTIONS(Cost $21,799) 16,822
NUMBER OFSHARES VALUE
SHORT TERM INVESTMENTS (0.5%)
137,655 Fidelity Prime Money Market Fund -Institutional Class 137,697
137,641 Morgan Stanley Institutional LiquidityFunds - Government Portfolio 137,641
TOTAL SHORT TERM INVESTMENTS(Cost $275,346) 275,338
INVESTMENT OF CASH COLLATERAL FOR SECURITIESLOANED (0.5%)
327,525 Deutsche Bank Securities, Inc.†1.040%, 11/01/17(Cost $327,525) 327,525
TOTAL INVESTMENTS (99.5%)(Cost $59,705,125) 59,485,914
PAYABLE UPON RETURN OF SECURITIES ON LOAN (-0.5%) (327,525)
OTHER ASSETS, LESS LIABILITIES (1.0%) 626,954
NET ASSETS (100.0%) $59,785,343
110 CALAMOS OPEN-END FAMILY OF FUNDS ANNUAL REPORT See accompanying Notes to Schedule of Investments

High Income Opportunities Fund Schedule of Investments October 31, 2017
NUMBER OFCONTRACTS/NOTIONALAMOUNT VALUE
WRITTEN OPTIONS (0.0%)#Materials (0.0%)
404,000
Alcoa Corp.Put, 01/19/18, Strike $47.00 $ (10,700)
141,400
United States Steel Corp.Put, 11/17/17, Strike $25.00 (1,855)
TOTAL WRITTEN OPTIONS(Premium $14,504) $ (12,555)
NOTES TO SCHEDULE OF INVESTMENTS* Securities issued and sold pursuant to a Rule 144A transaction are
excepted from the registration requirement of the Securities Act of 1933,as amended. These securities may only be sold to qualified institutionalbuyers (“QIBs”), such as the Fund. Any resale of these securities mustgenerally be effected through a sale that is registered under the Act orotherwise exempted from such registration requirements.
^ Security, or portion of security, is on loan.
‡ Variable rate security. The rate shown is the rate in effect atOctober 31, 2017.
@ In default status and considered non-income producing.
~ Security, or portion of security, is segregated as collateral (or potentialcollateral for future transactions) for written options. The aggregatevalue of such securities is $51,305.
# Non-income producing security.
† Repurchase agreement collateralized by the following security: 334,059United States Treasury Note, 3.625%, 02/15/20.
Note: The date on options represents the expiration date of the option contract. Theoption contract may be exercised at any date on or before the date shown.
See accompanying Notes to Financial Statements www.calamos.com 111
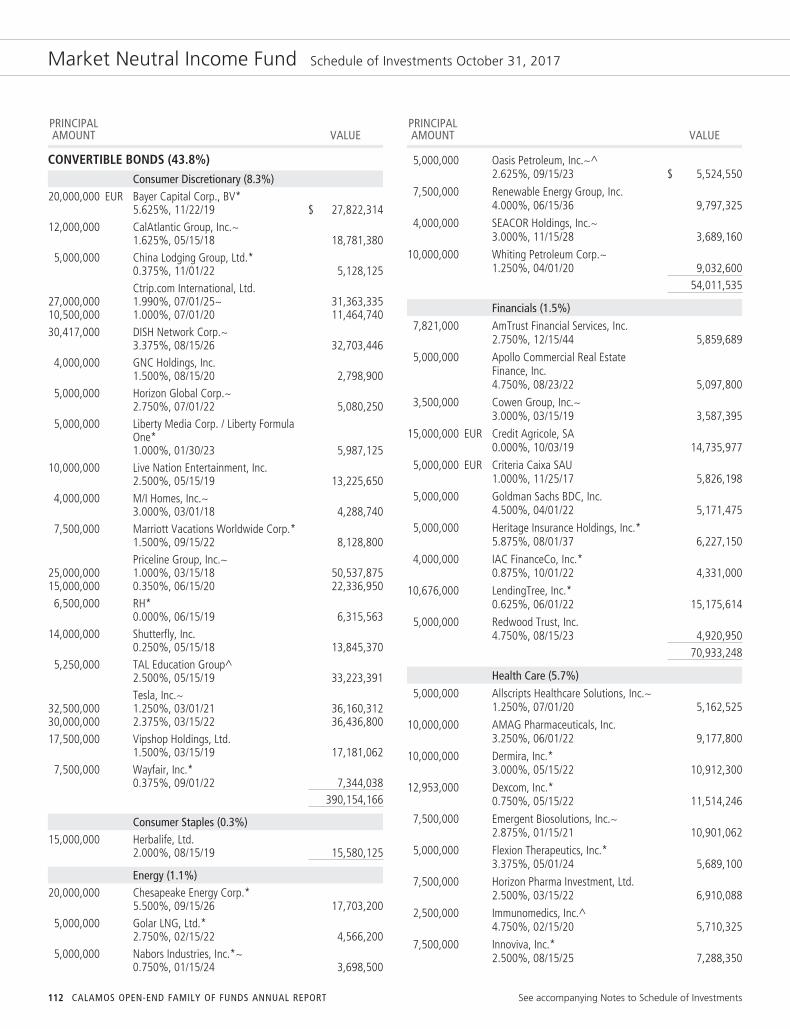
Market Neutral Income Fund Schedule of Investments October 31, 2017
PRINCIPALAMOUNT VALUE
CONVERTIBLE BONDS (43.8%)Consumer Discretionary (8.3%)
20,000,000 EUR Bayer Capital Corp., BV*5.625%, 11/22/19 $ 27,822,314
12,000,000 CalAtlantic Group, Inc.~1.625%, 05/15/18 18,781,380
5,000,000 China Lodging Group, Ltd.*0.375%, 11/01/22 5,128,125Ctrip.com International, Ltd.
27,000,000 1.990%, 07/01/25~ 31,363,33510,500,000 1.000%, 07/01/20 11,464,74030,417,000 DISH Network Corp.~
3.375%, 08/15/26 32,703,4464,000,000 GNC Holdings, Inc.
1.500%, 08/15/20 2,798,9005,000,000 Horizon Global Corp.~
2.750%, 07/01/22 5,080,2505,000,000 Liberty Media Corp. / Liberty Formula
One*1.000%, 01/30/23 5,987,125
10,000,000 Live Nation Entertainment, Inc.2.500%, 05/15/19 13,225,650
4,000,000 M/I Homes, Inc.~3.000%, 03/01/18 4,288,740
7,500,000 Marriott Vacations Worldwide Corp.*1.500%, 09/15/22 8,128,800Priceline Group, Inc.~
25,000,000 1.000%, 03/15/18 50,537,87515,000,000 0.350%, 06/15/20 22,336,9506,500,000 RH*
0.000%, 06/15/19 6,315,56314,000,000 Shutterfly, Inc.
0.250%, 05/15/18 13,845,3705,250,000 TAL Education Group^
2.500%, 05/15/19 33,223,391Tesla, Inc.~
32,500,000 1.250%, 03/01/21 36,160,31230,000,000 2.375%, 03/15/22 36,436,80017,500,000 Vipshop Holdings, Ltd.
1.500%, 03/15/19 17,181,0627,500,000 Wayfair, Inc.*
0.375%, 09/01/22 7,344,038390,154,166
Consumer Staples (0.3%)15,000,000 Herbalife, Ltd.
2.000%, 08/15/19 15,580,125
Energy (1.1%)20,000,000 Chesapeake Energy Corp.*
5.500%, 09/15/26 17,703,2005,000,000 Golar LNG, Ltd.*
2.750%, 02/15/22 4,566,2005,000,000 Nabors Industries, Inc.*~
0.750%, 01/15/24 3,698,500
PRINCIPALAMOUNT VALUE
5,000,000 Oasis Petroleum, Inc.~^2.625%, 09/15/23 $ 5,524,550
7,500,000 Renewable Energy Group, Inc.4.000%, 06/15/36 9,797,325
4,000,000 SEACOR Holdings, Inc.~3.000%, 11/15/28 3,689,160
10,000,000 Whiting Petroleum Corp.~1.250%, 04/01/20 9,032,600
54,011,535
Financials (1.5%)
7,821,000 AmTrust Financial Services, Inc.2.750%, 12/15/44 5,859,689
5,000,000 Apollo Commercial Real EstateFinance, Inc.4.750%, 08/23/22 5,097,800
3,500,000 Cowen Group, Inc.~3.000%, 03/15/19 3,587,395
15,000,000 EUR Credit Agricole, SA0.000%, 10/03/19 14,735,977
5,000,000 EUR Criteria Caixa SAU1.000%, 11/25/17 5,826,198
5,000,000 Goldman Sachs BDC, Inc.4.500%, 04/01/22 5,171,475
5,000,000 Heritage Insurance Holdings, Inc.*5.875%, 08/01/37 6,227,150
4,000,000 IAC FinanceCo, Inc.*0.875%, 10/01/22 4,331,000
10,676,000 LendingTree, Inc.*0.625%, 06/01/22 15,175,614
5,000,000 Redwood Trust, Inc.4.750%, 08/15/23 4,920,950
70,933,248
Health Care (5.7%)
5,000,000 Allscripts Healthcare Solutions, Inc.~1.250%, 07/01/20 5,162,525
10,000,000 AMAG Pharmaceuticals, Inc.3.250%, 06/01/22 9,177,800
10,000,000 Dermira, Inc.*3.000%, 05/15/22 10,912,300
12,953,000 Dexcom, Inc.*0.750%, 05/15/22 11,514,246
7,500,000 Emergent Biosolutions, Inc.~2.875%, 01/15/21 10,901,062
5,000,000 Flexion Therapeutics, Inc.*3.375%, 05/01/24 5,689,100
7,500,000 Horizon Pharma Investment, Ltd.2.500%, 03/15/22 6,910,088
2,500,000 Immunomedics, Inc.^4.750%, 02/15/20 5,710,325
7,500,000 Innoviva, Inc.*2.500%, 08/15/25 7,288,350
112 CALAMOS OPEN-END FAMILY OF FUNDS ANNUAL REPORT See accompanying Notes to Schedule of Investments
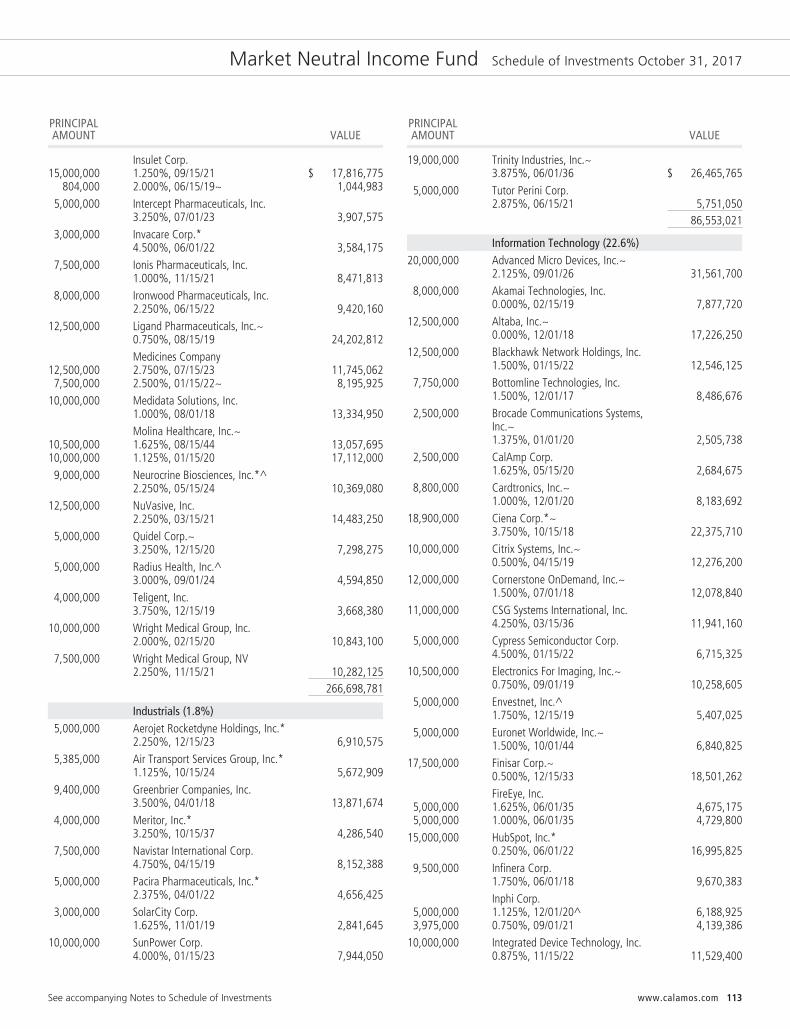
Market Neutral Income Fund Schedule of Investments October 31, 2017
PRINCIPALAMOUNT VALUE
Insulet Corp.15,000,000 1.250%, 09/15/21 $ 17,816,775
804,000 2.000%, 06/15/19~ 1,044,9835,000,000 Intercept Pharmaceuticals, Inc.
3.250%, 07/01/23 3,907,5753,000,000 Invacare Corp.*
4.500%, 06/01/22 3,584,1757,500,000 Ionis Pharmaceuticals, Inc.
1.000%, 11/15/21 8,471,8138,000,000 Ironwood Pharmaceuticals, Inc.
2.250%, 06/15/22 9,420,16012,500,000 Ligand Pharmaceuticals, Inc.~
0.750%, 08/15/19 24,202,812Medicines Company
12,500,000 2.750%, 07/15/23 11,745,0627,500,000 2.500%, 01/15/22~ 8,195,925
10,000,000 Medidata Solutions, Inc.1.000%, 08/01/18 13,334,950Molina Healthcare, Inc.~
10,500,000 1.625%, 08/15/44 13,057,69510,000,000 1.125%, 01/15/20 17,112,0009,000,000 Neurocrine Biosciences, Inc.*^
2.250%, 05/15/24 10,369,08012,500,000 NuVasive, Inc.
2.250%, 03/15/21 14,483,2505,000,000 Quidel Corp.~
3.250%, 12/15/20 7,298,2755,000,000 Radius Health, Inc.^
3.000%, 09/01/24 4,594,8504,000,000 Teligent, Inc.
3.750%, 12/15/19 3,668,38010,000,000 Wright Medical Group, Inc.
2.000%, 02/15/20 10,843,1007,500,000 Wright Medical Group, NV
2.250%, 11/15/21 10,282,125266,698,781
Industrials (1.8%)5,000,000 Aerojet Rocketdyne Holdings, Inc.*
2.250%, 12/15/23 6,910,5755,385,000 Air Transport Services Group, Inc.*
1.125%, 10/15/24 5,672,9099,400,000 Greenbrier Companies, Inc.
3.500%, 04/01/18 13,871,6744,000,000 Meritor, Inc.*
3.250%, 10/15/37 4,286,5407,500,000 Navistar International Corp.
4.750%, 04/15/19 8,152,3885,000,000 Pacira Pharmaceuticals, Inc.*
2.375%, 04/01/22 4,656,4253,000,000 SolarCity Corp.
1.625%, 11/01/19 2,841,64510,000,000 SunPower Corp.
4.000%, 01/15/23 7,944,050
PRINCIPALAMOUNT VALUE
19,000,000 Trinity Industries, Inc.~3.875%, 06/01/36 $ 26,465,765
5,000,000 Tutor Perini Corp.2.875%, 06/15/21 5,751,050
86,553,021
Information Technology (22.6%)20,000,000 Advanced Micro Devices, Inc.~
2.125%, 09/01/26 31,561,7008,000,000 Akamai Technologies, Inc.
0.000%, 02/15/19 7,877,72012,500,000 Altaba, Inc.~
0.000%, 12/01/18 17,226,25012,500,000 Blackhawk Network Holdings, Inc.
1.500%, 01/15/22 12,546,1257,750,000 Bottomline Technologies, Inc.
1.500%, 12/01/17 8,486,6762,500,000 Brocade Communications Systems,
Inc.~1.375%, 01/01/20 2,505,738
2,500,000 CalAmp Corp.1.625%, 05/15/20 2,684,675
8,800,000 Cardtronics, Inc.~1.000%, 12/01/20 8,183,692
18,900,000 Ciena Corp.*~3.750%, 10/15/18 22,375,710
10,000,000 Citrix Systems, Inc.~0.500%, 04/15/19 12,276,200
12,000,000 Cornerstone OnDemand, Inc.~1.500%, 07/01/18 12,078,840
11,000,000 CSG Systems International, Inc.4.250%, 03/15/36 11,941,160
5,000,000 Cypress Semiconductor Corp.4.500%, 01/15/22 6,715,325
10,500,000 Electronics For Imaging, Inc.~0.750%, 09/01/19 10,258,605
5,000,000 Envestnet, Inc.^1.750%, 12/15/19 5,407,025
5,000,000 Euronet Worldwide, Inc.~1.500%, 10/01/44 6,840,825
17,500,000 Finisar Corp.~0.500%, 12/15/33 18,501,262FireEye, Inc.
5,000,000 1.625%, 06/01/35 4,675,1755,000,000 1.000%, 06/01/35 4,729,800
15,000,000 HubSpot, Inc.*0.250%, 06/01/22 16,995,825
9,500,000 Infinera Corp.1.750%, 06/01/18 9,670,383Inphi Corp.
5,000,000 1.125%, 12/01/20^ 6,188,9253,975,000 0.750%, 09/01/21 4,139,386
10,000,000 Integrated Device Technology, Inc.0.875%, 11/15/22 11,529,400
See accompanying Notes to Schedule of Investments www.calamos.com 113

Market Neutral Income Fund Schedule of Investments October 31, 2017
PRINCIPALAMOUNT VALUE
30,000,000 Intel Corp.~3.250%, 08/01/39 $ 65,439,300
15,000,000 Lumentum Holdings, Inc.*0.250%, 03/15/24 19,187,550
10,000,000 MercadoLibre, Inc.~2.250%, 07/01/19 19,497,350Microchip Technology, Inc.~
20,000,000 1.625%, 02/15/25 36,740,20019,903,000 1.625%, 02/15/27* 25,083,5527,500,000 2.250%, 02/15/37* 9,603,000
25,000,000 Micron Technology, Inc.~3.125%, 05/01/32 112,099,875
5,000,000 Nice Systems, Inc.*1.250%, 01/15/24 5,700,500
15,000,000 Nuance Communications, Inc.~1.000%, 12/15/35 13,836,750
10,000,000 NXP Semiconductors, NV~1.000%, 12/01/19 12,332,350
20,000,000 ON Semiconductor Corp.*~1.625%, 10/15/23 24,982,500
10,000,000 OSI Systems, Inc.*1.250%, 09/01/22 10,529,350
10,600,000 Palo Alto Networks, Inc.~0.000%, 07/01/19 14,823,676
7,500,000 Pandora Media, Inc.1.750%, 12/01/20 7,007,063
15,000,000 Proofpoint, Inc.1.250%, 12/15/18 35,568,450
10,000,000 Rambus, Inc.~1.125%, 08/15/18 12,510,500
15,000,000 RealPage, Inc.*1.500%, 11/15/22 18,386,025
10,000,000 Red Hat, Inc.~0.250%, 10/01/19 16,610,500
7,500,000 Rovi Corp.0.500%, 03/01/20 7,320,600
55,000,000 Salesforce.com, Inc.~0.250%, 04/01/18 84,558,375
30,000,000 ServiceNow, Inc.~0.000%, 11/01/18 51,453,000
15,000,000 Silicon Laboratories, Inc.*1.375%, 03/01/22 18,066,600
10,000,000 SINA Corp.1.000%, 12/01/18 11,567,750
25,000,000 Square, Inc.*0.375%, 03/01/22 42,388,625
12,500,000 Synaptics, Inc.*0.500%, 06/15/22 11,246,187
5,000,000 Teradyne, Inc.*1.250%, 12/15/23 7,198,175
10,000,000 TTM Technologies, Inc.~1.750%, 12/15/20 17,335,850
10,000,000 Twitter, Inc.~1.000%, 09/15/21 9,221,850
PRINCIPALAMOUNT VALUE
Viavi Solutions, Inc.10,000,000 0.625%, 08/15/33~ $ 10,446,5005,000,000 1.000%, 03/01/24.* 5,011,975
15,000,000 Weibo Corp.*1.250%, 11/15/22 15,688,125Workday, Inc.
24,500,000 0.750%, 07/15/18~ 33,383,0877,500,000 1.500%, 07/15/20 11,045,550
10,000,000 Zillow Group, Inc.*2.000%, 12/01/21 10,895,800
1,062,162,962
Materials (1.3%)10,000,000 Allegheny Technologies, Inc.
4.750%, 07/01/22 19,200,9504,000,000 B2Gold Corp.~
3.250%, 10/01/18 4,106,4603,000,000 Pretium Resources, Inc.*
2.250%, 03/15/22 3,079,41010,000,000 RTI International Metals, Inc.
1.625%, 10/15/19 11,073,6005,000,000 TimkenSteel Corp.
6.000%, 06/01/21 7,128,27510,000,000 GBP Volcan Holdings, PLC
4.125%, 04/11/20 14,798,17959,386,874
Real Estate (1.0%)4,000,000 American Residential Properties OP,
LP*3.250%, 11/15/18 4,885,540
8,200,000 Extra Space Storage, LP*3.125%, 10/01/35 8,960,755
6,000,000 Forestar Group, Inc.3.750%, 03/01/20 6,120,660
5,000,000 iStar, Inc.*3.125%, 09/15/22 5,064,850
5,000,000 Starwood Property Trust, Inc.~4.000%, 01/15/19 5,544,050Starwood Waypoint Homes
7,700,000 3.500%, 01/15/22* 8,610,1026,000,000 3.000%, 07/01/19 7,395,360
46,581,317
Telecommunication Services (0.2%)10,000,000 EUR America Movil, SAB de CV
0.000%, 05/28/20 11,538,883
TOTAL CONVERTIBLE BONDS(Cost $1,841,318,510) 2,063,600,912
SYNTHETIC CONVERTIBLE SECURITIES (3.1%)¤
Corporate Bonds (2.9%)
Consumer Discretionary (1.5%)5,000,000 American Airlines Group, Inc.~
6.125%, 06/01/18 5,112,425
114 CALAMOS OPEN-END FAMILY OF FUNDS ANNUAL REPORT See accompanying Notes to Schedule of Investments

Market Neutral Income Fund Schedule of Investments October 31, 2017
PRINCIPALAMOUNT VALUE
4,575,000 Continental Airlines 2012-3 Class CPass Thru Trust6.125%, 04/29/18 $ 4,646,484
6,820,000 D. R. Horton, Inc.~3.750%, 03/01/19 6,938,395
10,000,000 DISH DBS Corp.~4.250%, 04/01/18 10,084,400
1,000,000 Ford Motor Credit Company, LLC~2.943%, 01/08/19 1,010,450General Motors Company, Inc.~
3,000,000 3.250%, 05/15/18 3,024,0902,500,000 3.500%, 10/02/18 2,536,6132,000,000 2.400%, 05/09/19 2,008,670
Lennar Corp.~8,760,000 4.500%, 06/15/19 9,024,4647,000,000 4.125%, 12/01/18 7,154,6655,745,000 Meritage Homes Corp.~
4.500%, 03/01/18 5,786,13413,760,000 Toll Brothers Finance Corp.~
4.000%, 12/31/18 14,051,91971,378,709
Energy (0.1%)500,000 Exxon Mobil Corp.~
1.708%, 03/01/19 500,4232,000,000 Shell International Finance, BV~
1.375%, 09/12/19 1,985,5202,485,943
Financials (0.3%)2,500,000 Ally Financial, Inc.~
3.250%, 11/05/18 2,521,8871,000,000 Berkshire Hathaway Finance Corp.~
1.700%, 03/15/19 1,000,6252,000,000 Capital One NA~
1.850%, 09/13/19 1,988,2203,000,000 Fifth Third Bancorp~
1.625%, 09/27/19 2,980,5001,500,000 Goldman Sachs Group, Inc.~
2.000%, 04/25/19 1,499,685Hyundai Capital America*~
1,000,000 2.500%, 03/18/19 999,475500,000 2.000%, 07/01/19 495,673
2,000,000 Metropolitan Life Global Funding I*~1.550%, 09/13/19 1,986,500PNC Bank NA~
1,000,000 1.950%, 03/04/19 1,001,4951,000,000 1.800%, 11/05/18 1,000,690
15,474,750
Health Care (0.1%)2,703,000 HCA, Inc.~
3.750%, 03/15/19 2,751,181500,000 Teva Pharmaceutical Finance
Netherlands III, BV~1.700%, 07/19/19 489,358
PRINCIPALAMOUNT VALUE
2,500,000 UnitedHealth Group, Inc.~1.700%, 02/15/19 $ 2,498,237
5,738,776
Information Technology (0.9%)14,700,000 Alliance Data Systems Corp.*
5.250%, 12/01/17 14,727,1212,000,000 eBay, Inc.~
2.500%, 03/09/18 2,007,03010,000,000 Hewlett Packard Enterprise
Company~2.850%, 10/05/18 10,085,900
1,000,000 Juniper Networks, Inc.~3.125%, 02/26/19 1,013,450
2,725,000 NXP Semiconductors, NV*~3.750%, 06/01/18 2,749,539
7,000,000 Sanmina Corp.*~4.375%, 06/01/19 7,192,010
5,000,000 Seagate Technology, PLC~3.750%, 11/15/18 5,092,775
42,867,825
TOTAL CORPORATE BONDS 137,946,003
NUMBER OFCONTRACTS/NOTIONALAMOUNT VALUE
Purchased Options (0.2%)
Consumer Discretionary (0.1%)500
250,000EUR Moncler S.p.A.
Call, 03/16/18, Strike 25.00 249,190500
50,000RHCall, 01/18/19, Strike $75.00 1,225,000
7,500750,000
Vipshop Holdings, Ltd.Call, 01/18/19, Strike $12.00 525,000
1,999,190
Energy (0.0%)1,250
125,000Nabors Industries, Ltd.Call, 01/18/19, Strike $8.00 116,875
Health Care (0.0%)1,000
100,000Abbvie, Inc.Call, 01/19/18, Strike $92.50 273,500
90090,000
Allergan, PLCCall, 01/19/18, Strike $290.00 9,000
282,500
Industrials (0.0%)1,250
125,000Navistar International Corp.Call, 01/18/19, Strike $35.00 1,537,500
2,000200,000
Team, Inc.Call, 03/16/18, Strike $20.00 20,000
1,557,500
See accompanying Notes to Schedule of Investments www.calamos.com 115
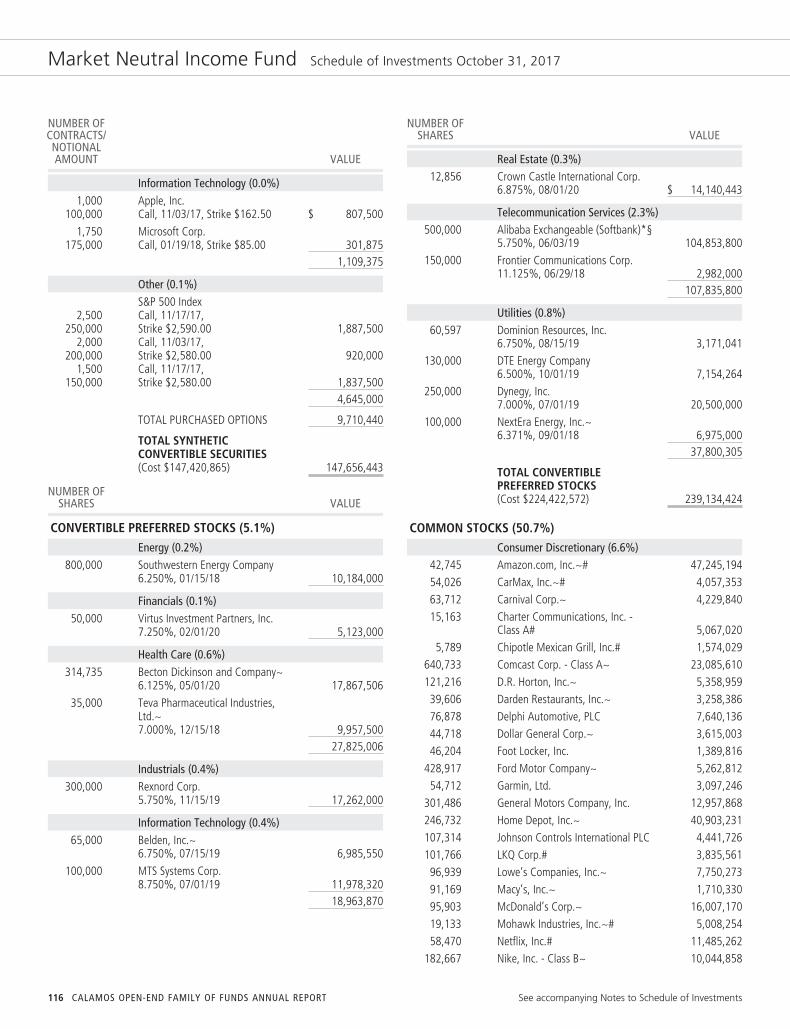
Market Neutral Income Fund Schedule of Investments October 31, 2017
NUMBER OFCONTRACTS/NOTIONALAMOUNT VALUE
Information Technology (0.0%)1,000
100,000Apple, Inc.Call, 11/03/17, Strike $162.50 $ 807,500
1,750175,000
Microsoft Corp.Call, 01/19/18, Strike $85.00 301,875
1,109,375
Other (0.1%)S&P 500 Index
2,500250,000
Call, 11/17/17,Strike $2,590.00 1,887,500
2,000200,000
Call, 11/03/17,Strike $2,580.00 920,000
1,500150,000
Call, 11/17/17,Strike $2,580.00 1,837,500
4,645,000
TOTAL PURCHASED OPTIONS 9,710,440
TOTAL SYNTHETICCONVERTIBLE SECURITIES(Cost $147,420,865) 147,656,443
NUMBER OFSHARES VALUE
CONVERTIBLE PREFERRED STOCKS (5.1%)
Energy (0.2%)800,000 Southwestern Energy Company
6.250%, 01/15/18 10,184,000
Financials (0.1%)50,000 Virtus Investment Partners, Inc.
7.250%, 02/01/20 5,123,000
Health Care (0.6%)314,735 Becton Dickinson and Company~
6.125%, 05/01/20 17,867,506
35,000 Teva Pharmaceutical Industries,Ltd.~7.000%, 12/15/18 9,957,500
27,825,006
Industrials (0.4%)300,000 Rexnord Corp.
5.750%, 11/15/19 17,262,000
Information Technology (0.4%)65,000 Belden, Inc.~
6.750%, 07/15/19 6,985,550
100,000 MTS Systems Corp.8.750%, 07/01/19 11,978,320
18,963,870
NUMBER OFSHARES VALUE
Real Estate (0.3%)12,856 Crown Castle International Corp.
6.875%, 08/01/20 $ 14,140,443
Telecommunication Services (2.3%)500,000 Alibaba Exchangeable (Softbank)*§
5.750%, 06/03/19 104,853,800150,000 Frontier Communications Corp.
11.125%, 06/29/18 2,982,000107,835,800
Utilities (0.8%)60,597 Dominion Resources, Inc.
6.750%, 08/15/19 3,171,041130,000 DTE Energy Company
6.500%, 10/01/19 7,154,264250,000 Dynegy, Inc.
7.000%, 07/01/19 20,500,000100,000 NextEra Energy, Inc.~
6.371%, 09/01/18 6,975,00037,800,305
TOTAL CONVERTIBLEPREFERRED STOCKS(Cost $224,422,572) 239,134,424
COMMON STOCKS (50.7%)Consumer Discretionary (6.6%)
42,745 Amazon.com, Inc.~# 47,245,19454,026 CarMax, Inc.~# 4,057,35363,712 Carnival Corp.~ 4,229,84015,163 Charter Communications, Inc. -
Class A# 5,067,0205,789 Chipotle Mexican Grill, Inc.# 1,574,029
640,733 Comcast Corp. - Class A~ 23,085,610121,216 D.R. Horton, Inc.~ 5,358,95939,606 Darden Restaurants, Inc.~ 3,258,38676,878 Delphi Automotive, PLC 7,640,13644,718 Dollar General Corp.~ 3,615,00346,204 Foot Locker, Inc. 1,389,816
428,917 Ford Motor Company~ 5,262,81254,712 Garmin, Ltd. 3,097,246
301,486 General Motors Company, Inc. 12,957,868246,732 Home Depot, Inc.~ 40,903,231107,314 Johnson Controls International PLC 4,441,726101,766 LKQ Corp.# 3,835,56196,939 Lowe’s Companies, Inc.~ 7,750,27391,169 Macy’s, Inc.~ 1,710,33095,903 McDonald’s Corp.~ 16,007,17019,133 Mohawk Industries, Inc.~# 5,008,25458,470 Netflix, Inc.# 11,485,262
182,667 Nike, Inc. - Class B~ 10,044,858
116 CALAMOS OPEN-END FAMILY OF FUNDS ANNUAL REPORT See accompanying Notes to Schedule of Investments
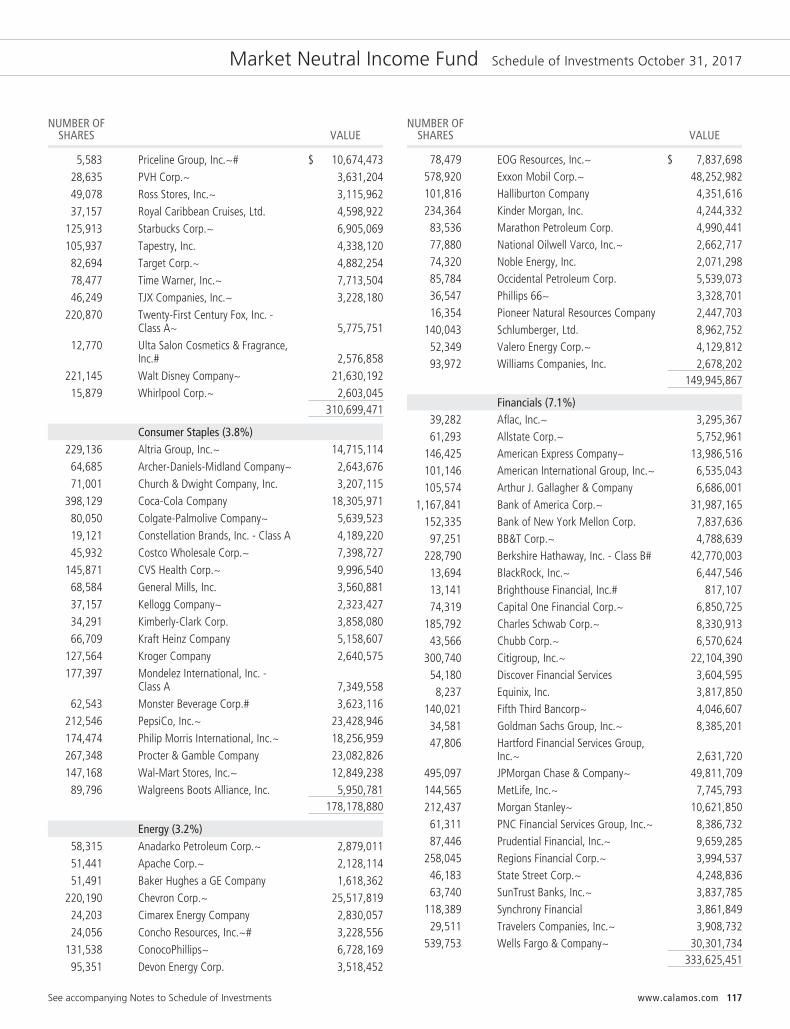
Market Neutral Income Fund Schedule of Investments October 31, 2017
NUMBER OFSHARES VALUE
5,583 Priceline Group, Inc.~# $ 10,674,47328,635 PVH Corp.~ 3,631,20449,078 Ross Stores, Inc.~ 3,115,96237,157 Royal Caribbean Cruises, Ltd. 4,598,922
125,913 Starbucks Corp.~ 6,905,069105,937 Tapestry, Inc. 4,338,12082,694 Target Corp.~ 4,882,25478,477 Time Warner, Inc.~ 7,713,50446,249 TJX Companies, Inc.~ 3,228,180
220,870 Twenty-First Century Fox, Inc. -Class A~ 5,775,751
12,770 Ulta Salon Cosmetics & Fragrance,Inc.# 2,576,858
221,145 Walt Disney Company~ 21,630,19215,879 Whirlpool Corp.~ 2,603,045
310,699,471
Consumer Staples (3.8%)229,136 Altria Group, Inc.~ 14,715,11464,685 Archer-Daniels-Midland Company~ 2,643,67671,001 Church & Dwight Company, Inc. 3,207,115
398,129 Coca-Cola Company 18,305,97180,050 Colgate-Palmolive Company~ 5,639,52319,121 Constellation Brands, Inc. - Class A 4,189,22045,932 Costco Wholesale Corp.~ 7,398,727
145,871 CVS Health Corp.~ 9,996,54068,584 General Mills, Inc. 3,560,88137,157 Kellogg Company~ 2,323,42734,291 Kimberly-Clark Corp. 3,858,08066,709 Kraft Heinz Company 5,158,607
127,564 Kroger Company 2,640,575177,397 Mondelez International, Inc. -
Class A 7,349,55862,543 Monster Beverage Corp.# 3,623,116
212,546 PepsiCo, Inc.~ 23,428,946174,474 Philip Morris International, Inc.~ 18,256,959267,348 Procter & Gamble Company 23,082,826147,168 Wal-Mart Stores, Inc.~ 12,849,23889,796 Walgreens Boots Alliance, Inc. 5,950,781
178,178,880
Energy (3.2%)58,315 Anadarko Petroleum Corp.~ 2,879,01151,441 Apache Corp.~ 2,128,11451,491 Baker Hughes a GE Company 1,618,362
220,190 Chevron Corp.~ 25,517,81924,203 Cimarex Energy Company 2,830,05724,056 Concho Resources, Inc.~# 3,228,556
131,538 ConocoPhillips~ 6,728,16995,351 Devon Energy Corp. 3,518,452
NUMBER OFSHARES VALUE
78,479 EOG Resources, Inc.~ $ 7,837,698578,920 Exxon Mobil Corp.~ 48,252,982101,816 Halliburton Company 4,351,616234,364 Kinder Morgan, Inc. 4,244,33283,536 Marathon Petroleum Corp. 4,990,44177,880 National Oilwell Varco, Inc.~ 2,662,71774,320 Noble Energy, Inc. 2,071,29885,784 Occidental Petroleum Corp. 5,539,07336,547 Phillips 66~ 3,328,70116,354 Pioneer Natural Resources Company 2,447,703
140,043 Schlumberger, Ltd. 8,962,75252,349 Valero Energy Corp.~ 4,129,81293,972 Williams Companies, Inc. 2,678,202
149,945,867
Financials (7.1%)39,282 Aflac, Inc.~ 3,295,36761,293 Allstate Corp.~ 5,752,961
146,425 American Express Company~ 13,986,516101,146 American International Group, Inc.~ 6,535,043105,574 Arthur J. Gallagher & Company 6,686,001
1,167,841 Bank of America Corp.~ 31,987,165152,335 Bank of New York Mellon Corp. 7,837,63697,251 BB&T Corp.~ 4,788,639
228,790 Berkshire Hathaway, Inc. - Class B# 42,770,00313,694 BlackRock, Inc.~ 6,447,54613,141 Brighthouse Financial, Inc.# 817,10774,319 Capital One Financial Corp.~ 6,850,725
185,792 Charles Schwab Corp.~ 8,330,91343,566 Chubb Corp.~ 6,570,624
300,740 Citigroup, Inc.~ 22,104,39054,180 Discover Financial Services 3,604,5958,237 Equinix, Inc. 3,817,850
140,021 Fifth Third Bancorp~ 4,046,60734,581 Goldman Sachs Group, Inc.~ 8,385,20147,806 Hartford Financial Services Group,
Inc.~ 2,631,720495,097 JPMorgan Chase & Company~ 49,811,709144,565 MetLife, Inc.~ 7,745,793212,437 Morgan Stanley~ 10,621,85061,311 PNC Financial Services Group, Inc.~ 8,386,73287,446 Prudential Financial, Inc.~ 9,659,285
258,045 Regions Financial Corp.~ 3,994,53746,183 State Street Corp.~ 4,248,83663,740 SunTrust Banks, Inc.~ 3,837,785
118,389 Synchrony Financial 3,861,84929,511 Travelers Companies, Inc.~ 3,908,732
539,753 Wells Fargo & Company~ 30,301,734333,625,451
See accompanying Notes to Schedule of Investments www.calamos.com 117
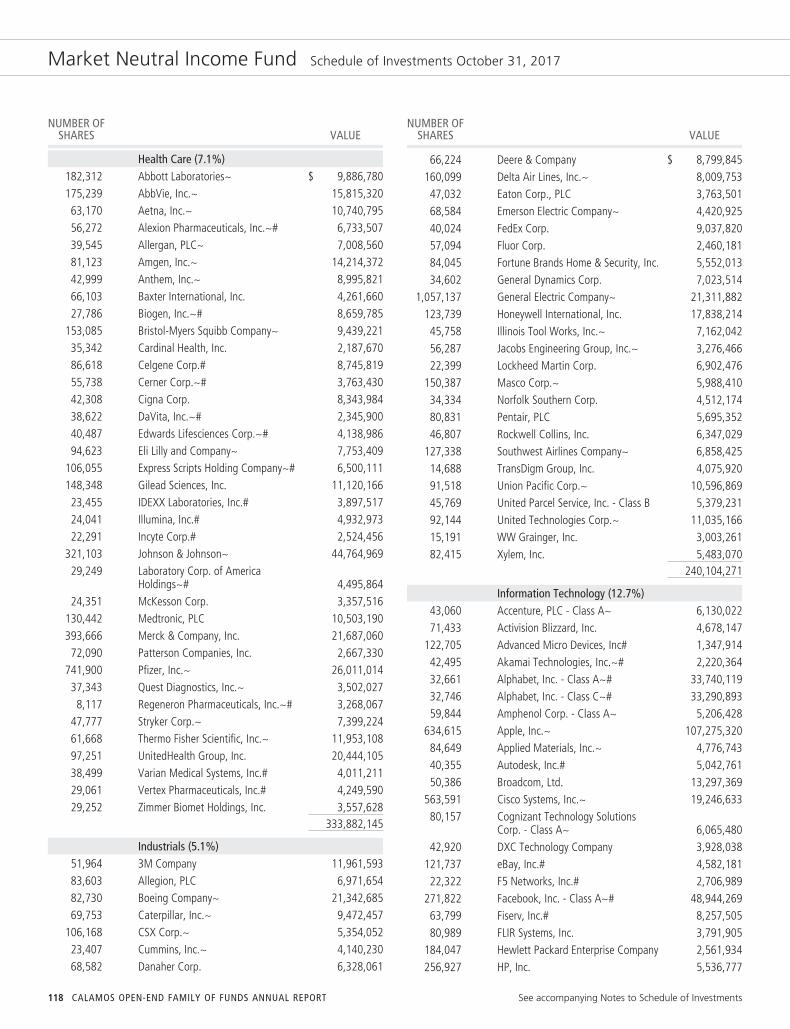
Market Neutral Income Fund Schedule of Investments October 31, 2017
NUMBER OFSHARES VALUE
Health Care (7.1%)182,312 Abbott Laboratories~ $ 9,886,780175,239 AbbVie, Inc.~ 15,815,32063,170 Aetna, Inc.~ 10,740,79556,272 Alexion Pharmaceuticals, Inc.~# 6,733,50739,545 Allergan, PLC~ 7,008,56081,123 Amgen, Inc.~ 14,214,37242,999 Anthem, Inc.~ 8,995,82166,103 Baxter International, Inc. 4,261,66027,786 Biogen, Inc.~# 8,659,785
153,085 Bristol-Myers Squibb Company~ 9,439,22135,342 Cardinal Health, Inc. 2,187,67086,618 Celgene Corp.# 8,745,81955,738 Cerner Corp.~# 3,763,43042,308 Cigna Corp. 8,343,98438,622 DaVita, Inc.~# 2,345,90040,487 Edwards Lifesciences Corp.~# 4,138,98694,623 Eli Lilly and Company~ 7,753,409
106,055 Express Scripts Holding Company~# 6,500,111148,348 Gilead Sciences, Inc. 11,120,16623,455 IDEXX Laboratories, Inc.# 3,897,51724,041 Illumina, Inc.# 4,932,97322,291 Incyte Corp.# 2,524,456
321,103 Johnson & Johnson~ 44,764,96929,249 Laboratory Corp. of America
Holdings~# 4,495,86424,351 McKesson Corp. 3,357,516
130,442 Medtronic, PLC 10,503,190393,666 Merck & Company, Inc. 21,687,06072,090 Patterson Companies, Inc. 2,667,330
741,900 Pfizer, Inc.~ 26,011,01437,343 Quest Diagnostics, Inc.~ 3,502,0278,117 Regeneron Pharmaceuticals, Inc.~# 3,268,067
47,777 Stryker Corp.~ 7,399,22461,668 Thermo Fisher Scientific, Inc.~ 11,953,10897,251 UnitedHealth Group, Inc. 20,444,10538,499 Varian Medical Systems, Inc.# 4,011,21129,061 Vertex Pharmaceuticals, Inc.# 4,249,59029,252 Zimmer Biomet Holdings, Inc. 3,557,628
333,882,145
Industrials (5.1%)51,964 3M Company 11,961,59383,603 Allegion, PLC 6,971,65482,730 Boeing Company~ 21,342,68569,753 Caterpillar, Inc.~ 9,472,457
106,168 CSX Corp.~ 5,354,05223,407 Cummins, Inc.~ 4,140,23068,582 Danaher Corp. 6,328,061
NUMBER OFSHARES VALUE
66,224 Deere & Company $ 8,799,845160,099 Delta Air Lines, Inc.~ 8,009,75347,032 Eaton Corp., PLC 3,763,50168,584 Emerson Electric Company~ 4,420,92540,024 FedEx Corp. 9,037,82057,094 Fluor Corp. 2,460,18184,045 Fortune Brands Home & Security, Inc. 5,552,01334,602 General Dynamics Corp. 7,023,514
1,057,137 General Electric Company~ 21,311,882123,739 Honeywell International, Inc. 17,838,21445,758 Illinois Tool Works, Inc.~ 7,162,04256,287 Jacobs Engineering Group, Inc.~ 3,276,46622,399 Lockheed Martin Corp. 6,902,476
150,387 Masco Corp.~ 5,988,41034,334 Norfolk Southern Corp. 4,512,17480,831 Pentair, PLC 5,695,35246,807 Rockwell Collins, Inc. 6,347,029
127,338 Southwest Airlines Company~ 6,858,42514,688 TransDigm Group, Inc. 4,075,92091,518 Union Pacific Corp.~ 10,596,86945,769 United Parcel Service, Inc. - Class B 5,379,23192,144 United Technologies Corp.~ 11,035,16615,191 WW Grainger, Inc. 3,003,26182,415 Xylem, Inc. 5,483,070
240,104,271
Information Technology (12.7%)43,060 Accenture, PLC - Class A~ 6,130,02271,433 Activision Blizzard, Inc. 4,678,147
122,705 Advanced Micro Devices, Inc# 1,347,91442,495 Akamai Technologies, Inc.~# 2,220,36432,661 Alphabet, Inc. - Class A~# 33,740,11932,746 Alphabet, Inc. - Class C~# 33,290,89359,844 Amphenol Corp. - Class A~ 5,206,428
634,615 Apple, Inc.~ 107,275,32084,649 Applied Materials, Inc.~ 4,776,74340,355 Autodesk, Inc.# 5,042,76150,386 Broadcom, Ltd. 13,297,369
563,591 Cisco Systems, Inc.~ 19,246,63380,157 Cognizant Technology Solutions
Corp. - Class A~ 6,065,48042,920 DXC Technology Company 3,928,038
121,737 eBay, Inc.# 4,582,18122,322 F5 Networks, Inc.# 2,706,989
271,822 Facebook, Inc. - Class A~# 48,944,26963,799 Fiserv, Inc.# 8,257,50580,989 FLIR Systems, Inc. 3,791,905
184,047 Hewlett Packard Enterprise Company 2,561,934256,927 HP, Inc. 5,536,777
118 CALAMOS OPEN-END FAMILY OF FUNDS ANNUAL REPORT See accompanying Notes to Schedule of Investments

Market Neutral Income Fund Schedule of Investments October 31, 2017
NUMBER OFSHARES VALUE
656,963 Intel Corp.~ $ 29,885,24790,877 International Business Machines
Corp. 14,000,51194,433 Juniper Networks, Inc.~ 2,344,77124,132 Lam Research Corp. 5,033,211
111,425 MasterCard, Inc. - Class A 16,576,69753,234 Microchip Technology, Inc. 5,046,583
144,830 Micron Technology, Inc.~# 6,417,417877,437 Microsoft Corp.~ 72,985,21072,041 NVIDIA Corp. 14,898,799
335,266 Oracle Corp. 17,065,039121,736 PayPal Holdings, Inc.# 8,833,164193,418 QUALCOMM, Inc. 9,866,25241,337 Red Hat, Inc.~# 4,994,75069,871 Salesforce.com, Inc.# 7,150,59824,466 Skyworks Solutions, Inc. 2,785,69990,243 Symantec Corp.~ 2,932,89858,893 TE Connectivity, Ltd. 5,357,49656,127 Texas Instruments, Inc.~ 5,426,920
323,323 Visa, Inc. - Class A~ 35,559,06446,762 Western Digital Corp. 4,174,44442,734 Xilinx, Inc. 3,149,068
597,111,629
Materials (1.3%)29,729 Air Products & Chemicals, Inc.~ 4,739,69432,517 Avery Dennison Corp. 3,452,330
108,834 Ball Corp. 4,672,243240,555 DowDuPont, Inc. 17,394,532222,860 Freeport-McMoRan, Inc.# 3,115,58357,224 LyondellBasell Industries, NV -
Class A 5,924,40154,990 Monsanto Company 6,659,28980,052 Mosaic Company~ 1,788,36279,692 Newmont Mining Corp.~ 2,881,66336,521 PPG Industries, Inc. 4,245,20140,024 Praxair, Inc. 5,848,307
60,721,605
Real Estate (1.3%)37,698 Alexandria Real Estate Equities, Inc. 4,673,04442,999 American Tower Corp.~ 6,177,66679,004 Apartment Investment &
Management Company 3,474,59612,746 AvalonBay Communities, Inc.~ 2,311,23235,249 Crown Castle International Corp. 3,774,46334,015 Digital Realty Trust, Inc. 4,028,73738,883 Equity Residential 2,615,27036,309 Federal Realty Investment Trust 4,375,96164,746 Macerich Company 3,535,132
NUMBER OFSHARES VALUE
58,391 Prologis, Inc.~ $ 3,770,891
15,766 Public Storage~ 3,267,503
42,774 Realty Income Corp. 2,295,681
46,928 Simon Property Group, Inc. 7,289,326
70,996 UDR, Inc. 2,753,935
19,206 Vornado Realty Trust 1,437,761
35,222 Welltower, Inc. 2,358,465
103,517 Weyerhaeuser Company 3,717,29561,856,958
Telecommunication Services (1.1%)789,802 AT&T, Inc.~ 26,576,837
107,547 CenturyLink, Inc.~ 2,042,318
446,115 Verizon Communications, Inc.~ 21,355,52549,974,680
Utilities (1.4%)334,977 AES Corp.~ 3,560,805
72,088 American Electric Power Company,Inc.~ 5,364,068
58,392 CMS Energy Corp.~ 2,824,421
42,494 Consolidated Edison, Inc. 3,656,609
36,219 Dominion Resources, Inc.~ 2,938,810
143,007 Duke Energy Corp.~ 12,628,948
53,084 Edison International 4,244,066
74,320 Exelon Corp.~ 2,988,407
131,794 FirstEnergy Corp.~ 4,342,612
87,484 NextEra Energy, Inc. 13,566,144
176,080 NiSource, Inc. 4,643,230
63,739 PG&E Corp. 3,682,202
63,740 Public Service Enterprise Group,Inc.~ 3,136,008
67,576,330
TOTAL COMMON STOCKS(Cost $2,140,825,414) 2,383,677,287
EXCHANGE-TRADED FUND (0.5%)
Other (0.5%)85,064 SPDR S&P 500 ETF Trust
(Cost $20,708,141) 21,874,208
NUMBER OFCONTRACTS/NOTIONALAMOUNT VALUE
PURCHASED OPTIONS (0.2%)#
Consumer Discretionary (0.0%)Tesla Motors, Inc.
3,734373,400 Put, 01/19/18, Strike $20.00 5,601
See accompanying Notes to Schedule of Investments www.calamos.com 119
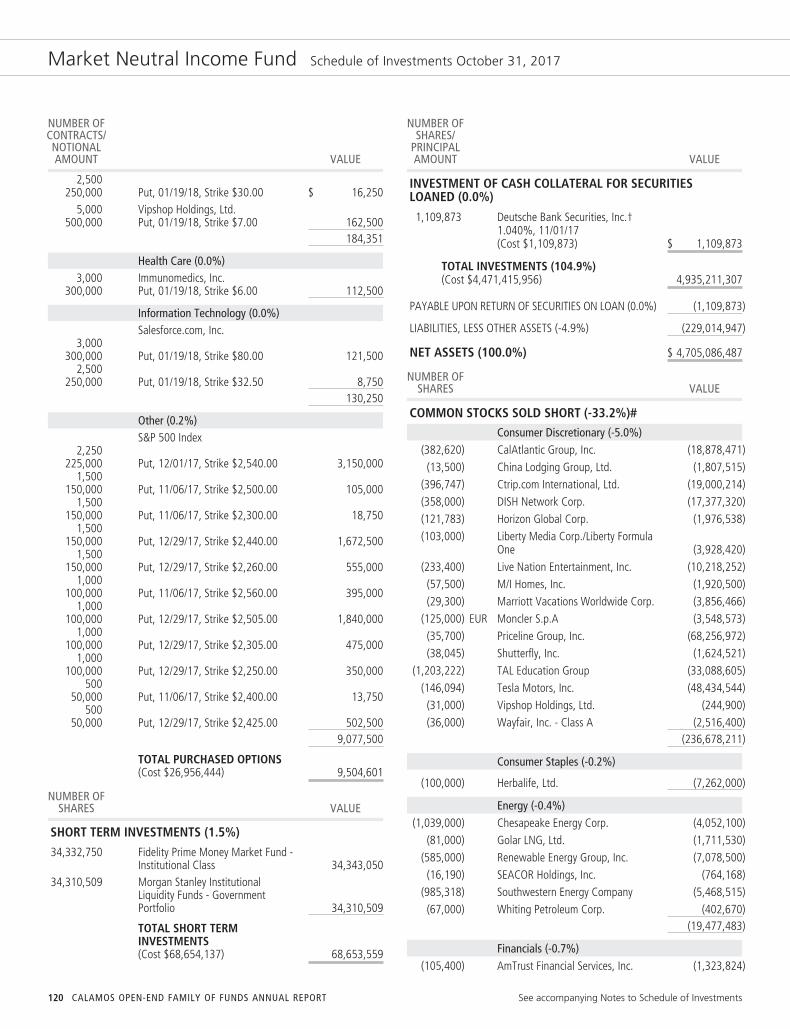
Market Neutral Income Fund Schedule of Investments October 31, 2017
NUMBER OFCONTRACTS/NOTIONALAMOUNT VALUE
2,500250,000 Put, 01/19/18, Strike $30.00 $ 16,250
5,000500,000
Vipshop Holdings, Ltd.Put, 01/19/18, Strike $7.00 162,500
184,351
Health Care (0.0%)3,000
300,000Immunomedics, Inc.Put, 01/19/18, Strike $6.00 112,500
Information Technology (0.0%)Salesforce.com, Inc.
3,000300,000 Put, 01/19/18, Strike $80.00 121,500
2,500250,000 Put, 01/19/18, Strike $32.50 8,750
130,250
Other (0.2%)S&P 500 Index
2,250225,000 Put, 12/01/17, Strike $2,540.00 3,150,000
1,500150,000 Put, 11/06/17, Strike $2,500.00 105,000
1,500150,000 Put, 11/06/17, Strike $2,300.00 18,750
1,500150,000 Put, 12/29/17, Strike $2,440.00 1,672,500
1,500150,000 Put, 12/29/17, Strike $2,260.00 555,000
1,000100,000 Put, 11/06/17, Strike $2,560.00 395,000
1,000100,000 Put, 12/29/17, Strike $2,505.00 1,840,000
1,000100,000 Put, 12/29/17, Strike $2,305.00 475,000
1,000100,000 Put, 12/29/17, Strike $2,250.00 350,000
50050,000 Put, 11/06/17, Strike $2,400.00 13,750
50050,000 Put, 12/29/17, Strike $2,425.00 502,500
9,077,500
TOTAL PURCHASED OPTIONS(Cost $26,956,444) 9,504,601
NUMBER OFSHARES VALUE
SHORT TERM INVESTMENTS (1.5%)
34,332,750 Fidelity Prime Money Market Fund -Institutional Class 34,343,050
34,310,509 Morgan Stanley InstitutionalLiquidity Funds - GovernmentPortfolio 34,310,509
TOTAL SHORT TERMINVESTMENTS(Cost $68,654,137) 68,653,559
NUMBER OFSHARES/
PRINCIPALAMOUNT VALUE
INVESTMENT OF CASH COLLATERAL FOR SECURITIESLOANED (0.0%)
1,109,873 Deutsche Bank Securities, Inc.†1.040%, 11/01/17(Cost $1,109,873) $ 1,109,873
TOTAL INVESTMENTS (104.9%)(Cost $4,471,415,956) 4,935,211,307
PAYABLE UPON RETURN OF SECURITIES ON LOAN (0.0%) (1,109,873)
LIABILITIES, LESS OTHER ASSETS (-4.9%) (229,014,947)
NET ASSETS (100.0%) $ 4,705,086,487
NUMBER OFSHARES VALUE
COMMON STOCKS SOLD SHORT (-33.2%)#Consumer Discretionary (-5.0%)
(382,620) CalAtlantic Group, Inc. (18,878,471)(13,500) China Lodging Group, Ltd. (1,807,515)
(396,747) Ctrip.com International, Ltd. (19,000,214)(358,000) DISH Network Corp. (17,377,320)(121,783) Horizon Global Corp. (1,976,538)(103,000) Liberty Media Corp./Liberty Formula
One (3,928,420)(233,400) Live Nation Entertainment, Inc. (10,218,252)(57,500) M/I Homes, Inc. (1,920,500)(29,300) Marriott Vacations Worldwide Corp. (3,856,466)
(125,000) EUR Moncler S.p.A (3,548,573)(35,700) Priceline Group, Inc. (68,256,972)(38,045) Shutterfly, Inc. (1,624,521)
(1,203,222) TAL Education Group (33,088,605)(146,094) Tesla Motors, Inc. (48,434,544)(31,000) Vipshop Holdings, Ltd. (244,900)(36,000) Wayfair, Inc. - Class A (2,516,400)
(236,678,211)
Consumer Staples (-0.2%)
(100,000) Herbalife, Ltd. (7,262,000)
Energy (-0.4%)(1,039,000) Chesapeake Energy Corp. (4,052,100)
(81,000) Golar LNG, Ltd. (1,711,530)(585,000) Renewable Energy Group, Inc. (7,078,500)(16,190) SEACOR Holdings, Inc. (764,168)
(985,318) Southwestern Energy Company (5,468,515)(67,000) Whiting Petroleum Corp. (402,670)
(19,477,483)
Financials (-0.7%)(105,400) AmTrust Financial Services, Inc. (1,323,824)
120 CALAMOS OPEN-END FAMILY OF FUNDS ANNUAL REPORT See accompanying Notes to Schedule of Investments

Market Neutral Income Fund Schedule of Investments October 31, 2017
NUMBER OFSHARES VALUE
(79,475) Cowen Group, Inc. $ (1,192,125)(128,000) EUR Eurazeo, SA (11,899,966)(286,100) Heritage Insurance Holdings, Inc. (4,589,044)(45,500) LendingTree, Inc. (12,196,275)(34,000) Virtus Investment Partners, Inc. (3,957,600)
(35,158,834)
Health Care (-4.2%)(210,000) Allscripts Healthcare Solutions, Inc. (2,830,800)(226,000) AMAG Pharmaceuticals, Inc. (3,548,200)(169,000) EUR Bayer, AG (21,983,338)(65,000) Becton Dickinson and Company (13,563,550)
(200,000) Dermira, Inc. (5,354,000)(60,000) DexCom, Inc. (2,698,200)
(190,000) Emergent Biosolutions, Inc. (7,788,100)(150,000) Flexion Therapeutics, Inc. (3,301,500)(107,000) Horizon Pharma, PLC (1,450,920)(115,000) Immunomedics, Inc. (1,232,800)(342,700) Innoviva, Inc. (4,194,648)(194,100) Insulet Corp. (11,415,021)(12,000) Intercept Pharmaceuticals, Inc. (739,560)
(153,000) Invacare Corp. (2,371,500)(78,600) Ionis Pharmaceuticals, Inc. (4,488,846)
(382,000) Ironwood Pharmaceuticals, Inc. (5,875,160)(156,700) Ligand Pharmaceuticals, Inc. (22,776,345)(267,000) Medicines Company (7,673,580)(145,000) Medidata Solutions, Inc. (10,908,350)(351,100) Molina Healthcare, Inc. (23,815,113)(88,371) Neurocrine Biosciences, Inc. (5,488,723)
(145,500) NuVasive, Inc. (8,254,215)(130,973) Quidel Corp. (5,363,344)(140,000) Teligent, Inc. (795,200)(346,300) Teva Pharmaceutical Industries, Ltd. (4,778,940)(520,717) Wright Medical Group, NV (13,647,993)
(196,337,946)
Industrials (-1.3%)(155,659) Aerojet Rocketdyne Holdings, Inc. (4,915,711)(116,500) Air Transport Services Group, Inc. (2,819,300)(251,177) Greenbrier Companies, Inc. (13,111,440)(30,000) Meritor, Inc. (780,300)(33,500) Pacira Pharmaceuticals, Inc. (1,073,675)
(535,000) Rexnord Corp. (13,653,200)(692,700) Trinity Industries, Inc. (22,526,604)(122,000) Tutor Perini Corp. (3,440,400)
(62,320,630)
Information Technology (-19.2%)(2,162,100) Advanced Micro Devices, Inc. (23,750,669)
(530,000) Alibaba Group Holding, Ltd. (97,991,700)
NUMBER OFSHARES VALUE
(190,200) Altaba, Inc. $ (13,336,824)(75,000) Belden, Inc. (5,993,250)
(146,000) Blackhawk Network Holdings, Inc. (4,956,700)(103,426) Bottomline Technologies, Inc. (3,367,551)(45,076) Brocade Communications Systems,
Inc. (525,135)(55,000) CalAmp Corp. (1,250,150)(48,999) Cardtronics, PLC - Class A (1,122,077)
(662,400) Ciena Corp. (14,089,248)(108,866) Citrix Systems, Inc. (8,993,420)(54,400) Cornerstone OnDemand, Inc. (2,086,784)(95,000) CSG Systems International, Inc. (4,022,300)
(265,000) Cypress Semiconductor Corp. (4,202,900)(40,000) Electronics For Imaging, Inc. (1,234,400)(50,900) Envestnet, Inc. (2,718,060)(58,700) Euronet Worldwide, Inc. (5,672,768)
(237,600) Finisar Corp. (5,593,104)(39,000) FireEye, Inc. (659,880)
(117,000) HubSpot, Inc. (10,126,350)(16,800) IAC/InterActiveCorp (2,168,040)
(216,050) Infinera Corp. (1,808,338)(124,100) Inphi Corp. (5,085,618)(208,800) Integrated Device Technology, Inc. (6,487,416)
(1,415,500) Intel Corp. (64,391,095)(207,500) Lumentum Holdings, Inc. (13,103,625)(77,700) MercadoLibre, Inc. (18,672,087)
(813,000) Microchip Technology, Inc. (77,072,400)(2,494,800) Micron Technology, Inc. (110,544,588)
(190,500) MTS Systems Corp. (9,915,525)(50,000) Nice, Ltd. (4,165,500)
(314,700) Nuance Communications, Inc. (4,638,678)(48,773) NXP Semiconductors, NV (5,708,880)
(725,000) ON Semiconductor Corp. (15,457,000)(64,800) OSI Systems, Inc. (5,727,024)(81,700) Palo Alto Networks, Inc. (12,026,240)
(377,300) Proofpoint, Inc. (34,866,293)(649,000) Rambus, Inc. (9,546,790)(277,500) RealPage, Inc. (12,015,750)(125,000) Red Hat, Inc. (15,103,750)(808,909) Salesforce.com, Inc. (82,783,747)(391,100) ServiceNow, Inc. (49,423,307)(112,600) Silicon Laboratories, Inc. (10,685,740)(58,719) SINA Corp. (6,321,100)
(977,200) Square, Inc. - Class A (36,342,068)(69,000) Synaptics, Inc. (2,561,280)
(134,800) Teradyne, Inc. (5,781,572)(117,000) TiVo Corp. (2,123,550)(951,000) TTM Technologies, Inc. (15,006,780)
See accompanying Notes to Schedule of Investments www.calamos.com 121

Market Neutral Income Fund Schedule of Investments October 31, 2017
NUMBER OFSHARES VALUE
(569,600) Viavi Solutions, Inc. $ (5,285,888)(68,000) Weibo Corp. (6,300,200)
(330,200) Workday, Inc. - Class A (36,648,898)(113,700) Zillow Group, Inc. - Class C (4,693,536)
(904,155,573)
Materials (-0.9%)(642,000) Allegheny Technologies, Inc. (16,165,560)(680,000) GBP Anglo American, PLC (12,826,857)(191,615) Arconic, Inc. (4,813,369)(278,000) B2Gold Corp. (703,340)(125,500) Pretium Resources, Inc. (1,414,385)(340,000) TimkenSteel Corp. (4,760,000)
(40,683,511)
Real Estate (-0.7%)(185,000) American Homes 4 Rent (3,936,800)(90,000) Crown Castle International Corp. (9,637,200)(30,000) Extra Space Storage, Inc. (2,447,700)
(160,900) iStar, Inc. (1,882,530)(197,000) Starwood Property Trust, Inc. (4,237,470)(278,500) Starwood Waypoint Homes (10,112,335)
(32,254,035)
Telecommunication Services (0.0%)(306,000) EUR Koninklijke KPN, NV (1,052,907)
Utilities (-0.6%)
(30,000) Dominion Resources, Inc. (2,434,200)(42,000) DTE Energy Company (4,639,320)
(1,240,000) Dynegy, Inc. (15,438,000)(39,000) NextEra Energy, Inc. (6,047,730)
(28,559,250)
TOTAL COMMON STOCKS SOLDSHORT(Proceeds $1,190,045,771) (1,563,940,380)
NUMBER OFCONTRACTS/NOTIONALAMOUNT VALUE
WRITTEN OPTIONS (-4.6%)#Consumer Discretionary (-0.1%)
44044,000
Carmax, Inc.Call, 01/19/18, Strike $77.50 (123,200)
24024,000
Netflix, Inc.Call, 12/15/17, Strike $215.00 (59,520)
1,000100,000
RHCall, 01/18/19, Strike $95.00 (1,540,000)
15,0001,500,000
Vipshop Holdings, Ltd.Call, 01/18/19, Strike $17.00 (450,000)
(2,172,720)
NUMBER OFCONTRACTS/NOTIONALAMOUNT VALUE
Energy (0.0%)2,500
250,000Nabors Industries, Ltd.Call, 01/18/19, Strike $12.00 $ (67,500)
3,000300,000
Oasis Petroleum, Inc.Call, 01/17/20, Strike $12.00 (742,500)
(810,000)
Health Care (0.0%)2,000
200,000Abbvie, Inc.Call, 01/19/18, Strike $105.00 (59,000)
40040,000
Dermira, Inc.Call, 03/16/18, Strike $40.00 (126,000)
3,000300,000
Immunomedics, Inc.Call, 01/18/19, Strike $10.00 (1,275,000)
80080,000
Radius Health, Inc.Call, 01/19/18, Strike $40.00 (186,000)
(1,646,000)
Industrials (-0.1%)300
30,000Meritor, Inc.Call, 05/18/18, Strike $25.00 (112,500)
2,500250,000
Navistar International Corp.Call, 01/18/19, Strike $45.00 (1,775,000)
(1,887,500)
Information Technology (0.0%)2,000
200,000Apple, Inc.Call, 11/03/17, Strike $167.50 (935,000)
30030,000
NXP Semiconductors, NVCall, 01/18/19, Strike $115.00 (309,000)
6,000600,000
Salesforce.com, Inc.Put, 01/19/18, Strike $72.50 (150,000)
(1,394,000)
Information Technology (0.0%)Advanced Micro Devices, Inc.
3,453345,300 Put, 01/18/19, Strike $10.00 (597,369)
2,000200,000 Call, 01/18/19, Strike $7.00 (955,000)
(1,552,369)
Other (-4.4%)S&P 500 Index
3,000300,000 Put, 12/29/17, Strike $2,350.00 (1,860,000)
2,250225,000 Call, 01/19/18, Strike $2,450.00 (31,803,750)
2,000200,000 Call, 12/15/17, Strike $2,300.00 (55,010,000)
2,000200,000 Call, 12/15/17, Strike $2,200.00 (74,690,000)
2,000200,000 Put, 12/29/17, Strike $2,405.00 (1,750,000)
2,000200,000 Put, 12/29/17, Strike $2,325.00 (1,060,000)
122 CALAMOS OPEN-END FAMILY OF FUNDS ANNUAL REPORT See accompanying Notes to Schedule of Investments

Market Neutral Income Fund Schedule of Investments October 31, 2017
NUMBER OFCONTRACTS/NOTIONALAMOUNT VALUE
1,300130,000 Call, 12/15/17, Strike $2,375.00 $ (26,273,000)
1,100110,000 Call, 12/29/17, Strike $2,450.00 (14,844,500)
1,000100,000 Put, 12/29/17, Strike $2,300.00 (460,000)
(207,751,250)
TOTAL WRITTEN OPTIONS(Premium $122,917,572) $ (217,213,839)
FORWARD FOREIGN CURRENCY CONTRACTS
COUNTERPARTYLONG
CONTRACTSSETTLEMENT
DATELOCAL
CURRENCYCURRENT
VALUEUNREALIZEDGAIN/LOSS
Citibank N.A. European MonetaryUnit 01/30/18 2,724,000 $ 3,189,815 $ 17,756
$ 17,756
COUNTERPARTYSHORT
CONTRACTSSETTLEMENT
DATELOCAL
CURRENCYCURRENT
VALUEUNREALIZEDGAIN/LOSS
Northern TrustCompany British Pound Sterling 01/30/18 10,799,000 $14,383,696 $(140,095)State Street Bankand Trust
European MonetaryUnit 01/30/18 51,669,000 60,504,606 576,729
$ 436,634
NOTES TO SCHEDULE OF INVESTMENTS* Securities issued and sold pursuant to a Rule 144A transaction are
excepted from the registration requirement of the Securities Act of 1933,as amended. These securities may only be sold to qualified institutionalbuyers (“QIBs”), such as the Fund. Any resale of these securities mustgenerally be effected through a sale that is registered under the Act orotherwise exempted from such registration requirements.
~ Security, or portion of security, is segregated as collateral (or potentialcollateral for future transactions) for written options and securities soldshort. The aggregate value of such securities is $1,060,551,918.
^ Security, or portion of security, is on loan.
¤ The synthetic convertible securities strategy combines separatesecurities that together possess the economic characteristics similar to aconvertible security.
§ Securities exchangeable or convertible into securities of one ormore entities that are different than the issuer. Each entity is identifiedin the parenthetical.
# Non-income producing security.
† Repurchase agreement collateralized by the following security:1,132,013 United States Treasury Note, 3.625%, 02/15/20.
FOREIGN CURRENCY ABBREVIATIONEUR European Monetary UnitGBP British Pound Sterling
Note: Value for securities denominated in foreign currencies is shown in U.S. dollars. Theprincipal amount for such securities is shown in the respective foreign currency. The dateon options represents the expiration date of the option contract. The option contract maybe exercised at any date on or before the date shown.
See accompanying Notes to Financial Statements www.calamos.com 123
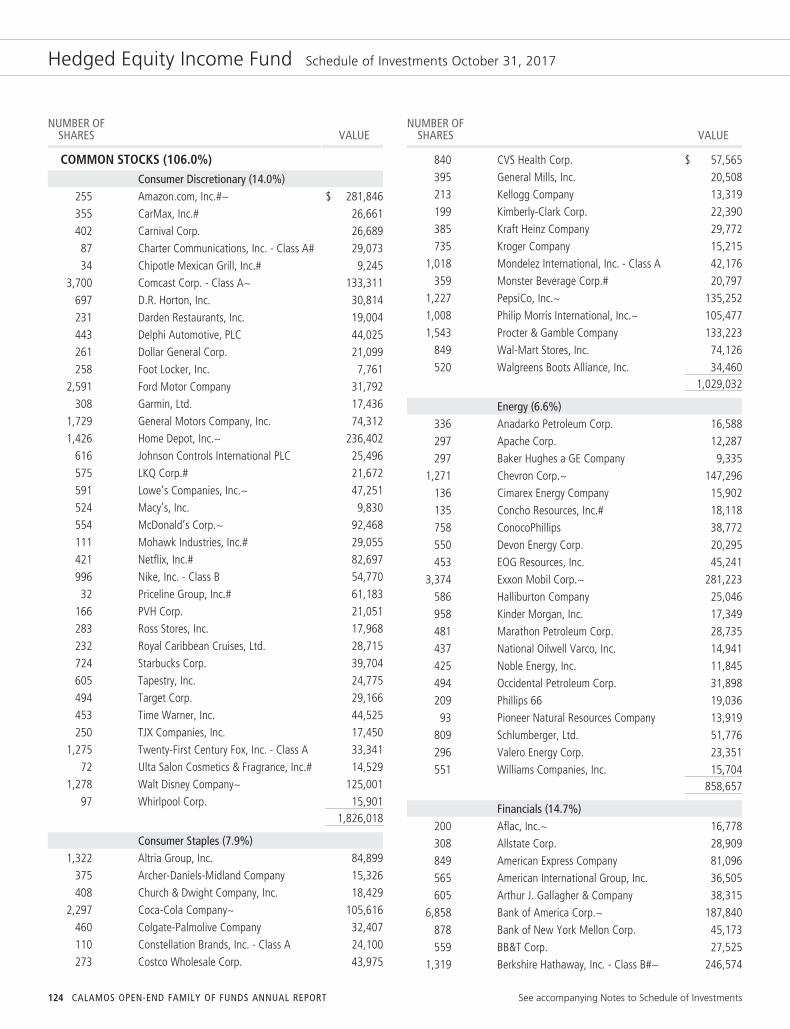
Hedged Equity Income Fund Schedule of Investments October 31, 2017
NUMBER OFSHARES VALUE
COMMON STOCKS (106.0%)Consumer Discretionary (14.0%)
255 Amazon.com, Inc.#~ $ 281,846355 CarMax, Inc.# 26,661402 Carnival Corp. 26,68987 Charter Communications, Inc. - Class A# 29,07334 Chipotle Mexican Grill, Inc.# 9,245
3,700 Comcast Corp. - Class A~ 133,311697 D.R. Horton, Inc. 30,814231 Darden Restaurants, Inc. 19,004443 Delphi Automotive, PLC 44,025261 Dollar General Corp. 21,099258 Foot Locker, Inc. 7,761
2,591 Ford Motor Company 31,792308 Garmin, Ltd. 17,436
1,729 General Motors Company, Inc. 74,3121,426 Home Depot, Inc.~ 236,402
616 Johnson Controls International PLC 25,496575 LKQ Corp.# 21,672591 Lowe’s Companies, Inc.~ 47,251524 Macy’s, Inc. 9,830554 McDonald’s Corp.~ 92,468111 Mohawk Industries, Inc.# 29,055421 Netflix, Inc.# 82,697996 Nike, Inc. - Class B 54,77032 Priceline Group, Inc.# 61,183
166 PVH Corp. 21,051283 Ross Stores, Inc. 17,968232 Royal Caribbean Cruises, Ltd. 28,715724 Starbucks Corp. 39,704605 Tapestry, Inc. 24,775494 Target Corp. 29,166453 Time Warner, Inc. 44,525250 TJX Companies, Inc. 17,450
1,275 Twenty-First Century Fox, Inc. - Class A 33,34172 Ulta Salon Cosmetics & Fragrance, Inc.# 14,529
1,278 Walt Disney Company~ 125,00197 Whirlpool Corp. 15,901
1,826,018
Consumer Staples (7.9%)1,322 Altria Group, Inc. 84,899
375 Archer-Daniels-Midland Company 15,326408 Church & Dwight Company, Inc. 18,429
2,297 Coca-Cola Company~ 105,616460 Colgate-Palmolive Company 32,407110 Constellation Brands, Inc. - Class A 24,100273 Costco Wholesale Corp. 43,975
NUMBER OFSHARES VALUE
840 CVS Health Corp. $ 57,565395 General Mills, Inc. 20,508213 Kellogg Company 13,319199 Kimberly-Clark Corp. 22,390385 Kraft Heinz Company 29,772735 Kroger Company 15,215
1,018 Mondelez International, Inc. - Class A 42,176359 Monster Beverage Corp.# 20,797
1,227 PepsiCo, Inc.~ 135,2521,008 Philip Morris International, Inc.~ 105,4771,543 Procter & Gamble Company 133,223
849 Wal-Mart Stores, Inc. 74,126520 Walgreens Boots Alliance, Inc. 34,460
1,029,032
Energy (6.6%)336 Anadarko Petroleum Corp. 16,588297 Apache Corp. 12,287297 Baker Hughes a GE Company 9,335
1,271 Chevron Corp.~ 147,296136 Cimarex Energy Company 15,902135 Concho Resources, Inc.# 18,118758 ConocoPhillips 38,772550 Devon Energy Corp. 20,295453 EOG Resources, Inc. 45,241
3,374 Exxon Mobil Corp.~ 281,223586 Halliburton Company 25,046958 Kinder Morgan, Inc. 17,349481 Marathon Petroleum Corp. 28,735437 National Oilwell Varco, Inc. 14,941425 Noble Energy, Inc. 11,845494 Occidental Petroleum Corp. 31,898209 Phillips 66 19,03693 Pioneer Natural Resources Company 13,919
809 Schlumberger, Ltd. 51,776296 Valero Energy Corp. 23,351551 Williams Companies, Inc. 15,704
858,657
Financials (14.7%)200 Aflac, Inc.~ 16,778308 Allstate Corp. 28,909849 American Express Company 81,096565 American International Group, Inc. 36,505605 Arthur J. Gallagher & Company 38,315
6,858 Bank of America Corp.~ 187,840878 Bank of New York Mellon Corp. 45,173559 BB&T Corp. 27,525
1,319 Berkshire Hathaway, Inc. - Class B#~ 246,574
124 CALAMOS OPEN-END FAMILY OF FUNDS ANNUAL REPORT See accompanying Notes to Schedule of Investments
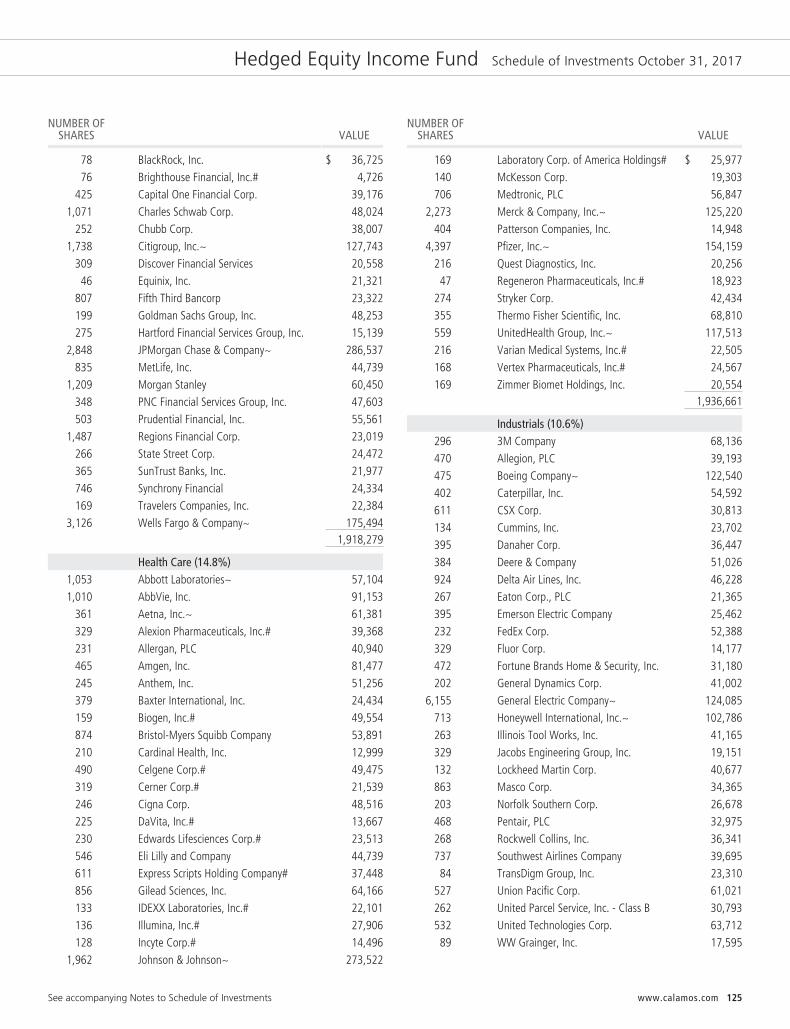
Hedged Equity Income Fund Schedule of Investments October 31, 2017
NUMBER OFSHARES VALUE
78 BlackRock, Inc. $ 36,72576 Brighthouse Financial, Inc.# 4,726
425 Capital One Financial Corp. 39,1761,071 Charles Schwab Corp. 48,024
252 Chubb Corp. 38,0071,738 Citigroup, Inc.~ 127,743
309 Discover Financial Services 20,55846 Equinix, Inc. 21,321
807 Fifth Third Bancorp 23,322199 Goldman Sachs Group, Inc. 48,253275 Hartford Financial Services Group, Inc. 15,139
2,848 JPMorgan Chase & Company~ 286,537835 MetLife, Inc. 44,739
1,209 Morgan Stanley 60,450348 PNC Financial Services Group, Inc. 47,603503 Prudential Financial, Inc. 55,561
1,487 Regions Financial Corp. 23,019266 State Street Corp. 24,472365 SunTrust Banks, Inc. 21,977746 Synchrony Financial 24,334169 Travelers Companies, Inc. 22,384
3,126 Wells Fargo & Company~ 175,4941,918,279
Health Care (14.8%)1,053 Abbott Laboratories~ 57,1041,010 AbbVie, Inc. 91,153
361 Aetna, Inc.~ 61,381329 Alexion Pharmaceuticals, Inc.# 39,368231 Allergan, PLC 40,940465 Amgen, Inc. 81,477245 Anthem, Inc. 51,256379 Baxter International, Inc. 24,434159 Biogen, Inc.# 49,554874 Bristol-Myers Squibb Company 53,891210 Cardinal Health, Inc. 12,999490 Celgene Corp.# 49,475319 Cerner Corp.# 21,539246 Cigna Corp. 48,516225 DaVita, Inc.# 13,667230 Edwards Lifesciences Corp.# 23,513546 Eli Lilly and Company 44,739611 Express Scripts Holding Company# 37,448856 Gilead Sciences, Inc. 64,166133 IDEXX Laboratories, Inc.# 22,101136 Illumina, Inc.# 27,906128 Incyte Corp.# 14,496
1,962 Johnson & Johnson~ 273,522
NUMBER OFSHARES VALUE
169 Laboratory Corp. of America Holdings# $ 25,977140 McKesson Corp. 19,303706 Medtronic, PLC 56,847
2,273 Merck & Company, Inc.~ 125,220404 Patterson Companies, Inc. 14,948
4,397 Pfizer, Inc.~ 154,159216 Quest Diagnostics, Inc. 20,25647 Regeneron Pharmaceuticals, Inc.# 18,923
274 Stryker Corp. 42,434355 Thermo Fisher Scientific, Inc. 68,810559 UnitedHealth Group, Inc.~ 117,513216 Varian Medical Systems, Inc.# 22,505168 Vertex Pharmaceuticals, Inc.# 24,567169 Zimmer Biomet Holdings, Inc. 20,554
1,936,661
Industrials (10.6%)296 3M Company 68,136470 Allegion, PLC 39,193475 Boeing Company~ 122,540402 Caterpillar, Inc. 54,592611 CSX Corp. 30,813134 Cummins, Inc. 23,702395 Danaher Corp. 36,447384 Deere & Company 51,026924 Delta Air Lines, Inc. 46,228267 Eaton Corp., PLC 21,365395 Emerson Electric Company 25,462232 FedEx Corp. 52,388329 Fluor Corp. 14,177472 Fortune Brands Home & Security, Inc. 31,180202 General Dynamics Corp. 41,002
6,155 General Electric Company~ 124,085713 Honeywell International, Inc.~ 102,786263 Illinois Tool Works, Inc. 41,165329 Jacobs Engineering Group, Inc. 19,151132 Lockheed Martin Corp. 40,677863 Masco Corp. 34,365203 Norfolk Southern Corp. 26,678468 Pentair, PLC 32,975268 Rockwell Collins, Inc. 36,341737 Southwest Airlines Company 39,69584 TransDigm Group, Inc. 23,310
527 Union Pacific Corp. 61,021262 United Parcel Service, Inc. - Class B 30,793532 United Technologies Corp. 63,71289 WW Grainger, Inc. 17,595
See accompanying Notes to Schedule of Investments www.calamos.com 125

Hedged Equity Income Fund Schedule of Investments October 31, 2017
NUMBER OFSHARES VALUE
462 Xylem, Inc. $ 30,7371,383,337
Information Technology (26.9%)247 Accenture, PLC - Class A 35,163410 Activision Blizzard, Inc. 26,851704 Advanced Micro Devices, Inc.# 7,733243 Akamai Technologies, Inc.# 12,697198 Alphabet, Inc. - Class A#~ 204,542188 Alphabet, Inc. - Class C#~ 191,128344 Amphenol Corp. - Class A 29,928
3,456 Apple, Inc.~ 584,202589 Applied Materials, Inc. 33,237231 Autodesk, Inc.# 28,866275 Broadcom, Ltd. 72,575
3,172 Cisco Systems, Inc.~ 108,324462 Cognizant Technology Solutions Corp. -
Class A 34,960223 DXC Technology Company 20,409699 eBay, Inc.# 26,310129 F5 Networks, Inc.# 15,644
1,972 Facebook, Inc. - Class A#~ 355,078367 Fiserv, Inc.# 47,501464 FLIR Systems, Inc. 21,725961 Hewlett Packard Enterprise Company 13,377
1,490 HP, Inc. 32,1103,811 Intel Corp.~ 173,362
525 International Business Machines Corp.~ 80,882540 Juniper Networks, Inc. 13,408139 Lam Research Corp. 28,991642 MasterCard, Inc. - Class A~ 95,510305 Microchip Technology, Inc. 28,914841 Micron Technology, Inc.# 37,265
5,085 Microsoft Corp.~ 422,970403 NVIDIA Corp. 83,344
2,026 Oracle Corp.~ 103,123699 PayPal Holdings, Inc.# 50,720
1,131 QUALCOMM, Inc. 57,692242 Red Hat, Inc.# 29,241397 Salesforce.com, Inc.# 40,629141 Skyworks Solutions, Inc. 16,054520 Symantec Corp. 16,900343 TE Connectivity, Ltd. 31,203375 Texas Instruments, Inc. 36,259
1,991 Visa, Inc. - Class A~ 218,970277 Western Digital Corp. 24,728245 Xilinx, Inc. 18,054
3,510,579
NUMBER OFSHARES VALUE
Materials (2.6%)170 Air Products & Chemicals, Inc. $ 27,103183 Avery Dennison Corp. 19,429622 Ball Corp. 26,703
1,387 DowDuPont, Inc. 100,2941,272 Freeport-McMoRan, Inc.# 17,783
329 LyondellBasell Industries, NV - Class A 34,061314 Monsanto Company 38,025460 Mosaic Company 10,276455 Newmont Mining Corp. 16,453212 PPG Industries, Inc. 24,643232 Praxair, Inc. 33,900
348,670
Real Estate (2.7%)217 Alexandria Real Estate Equities, Inc. 26,899245 American Tower Corp. 35,199444 Apartment Investment & Management
Company 19,52776 AvalonBay Communities, Inc. 13,781
204 Crown Castle International Corp. 21,844193 Digital Realty Trust, Inc. 22,859221 Equity Residential 14,864202 Federal Realty Investment Trust 24,345388 Macerich Company 21,185334 Prologis, Inc. 21,57094 Public Storage 19,481
240 Realty Income Corp. 12,881272 Simon Property Group, Inc. 42,250401 UDR, Inc. 15,555115 Vornado Realty Trust 8,609204 Welltower, Inc. 13,660594 Weyerhaeuser Company 21,331
355,840
Telecommunication Services (2.2%)4,677 AT&T, Inc.~ 157,381
621 CenturyLink, Inc. 11,7932,575 Verizon Communications, Inc. 123,265
292,439
Utilities (3.0%)1,924 AES Corp. 20,452
415 American Electric Power Company, Inc. 30,880333 CMS Energy Corp. 16,107244 Consolidated Edison, Inc. 20,996207 Dominion Resources, Inc. 16,796824 Duke Energy Corp.~ 72,768307 Edison International 24,545425 Exelon Corp. 17,089
126 CALAMOS OPEN-END FAMILY OF FUNDS ANNUAL REPORT See accompanying Notes to Schedule of Investments
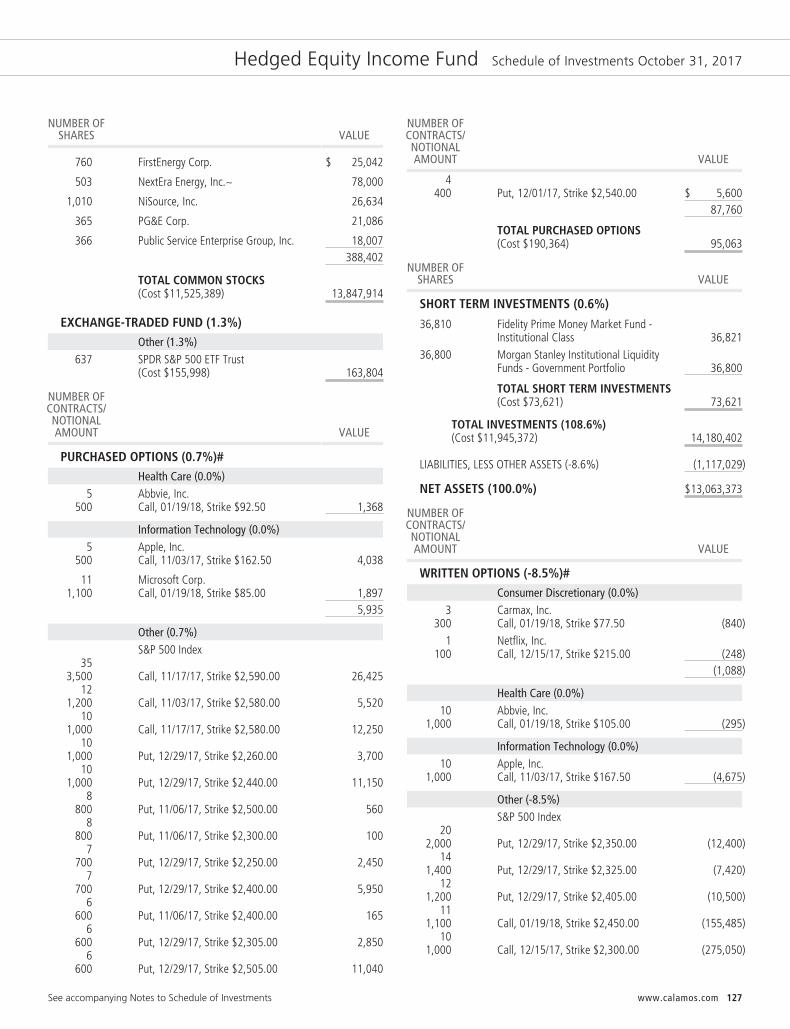
Hedged Equity Income Fund Schedule of Investments October 31, 2017
NUMBER OFSHARES VALUE
760 FirstEnergy Corp. $ 25,042
503 NextEra Energy, Inc.~ 78,000
1,010 NiSource, Inc. 26,634
365 PG&E Corp. 21,086
366 Public Service Enterprise Group, Inc. 18,007388,402
TOTAL COMMON STOCKS(Cost $11,525,389) 13,847,914
EXCHANGE-TRADED FUND (1.3%)Other (1.3%)
637 SPDR S&P 500 ETF Trust(Cost $155,998) 163,804
NUMBER OFCONTRACTS/NOTIONALAMOUNT VALUE
PURCHASED OPTIONS (0.7%)#Health Care (0.0%)
5500
Abbvie, Inc.Call, 01/19/18, Strike $92.50 1,368
Information Technology (0.0%)5
500Apple, Inc.Call, 11/03/17, Strike $162.50 4,038
111,100
Microsoft Corp.Call, 01/19/18, Strike $85.00 1,897
5,935
Other (0.7%)S&P 500 Index
353,500 Call, 11/17/17, Strike $2,590.00 26,425
121,200 Call, 11/03/17, Strike $2,580.00 5,520
101,000 Call, 11/17/17, Strike $2,580.00 12,250
101,000 Put, 12/29/17, Strike $2,260.00 3,700
101,000 Put, 12/29/17, Strike $2,440.00 11,150
8800 Put, 11/06/17, Strike $2,500.00 560
8800 Put, 11/06/17, Strike $2,300.00 100
7700 Put, 12/29/17, Strike $2,250.00 2,450
7700 Put, 12/29/17, Strike $2,400.00 5,950
6600 Put, 11/06/17, Strike $2,400.00 165
6600 Put, 12/29/17, Strike $2,305.00 2,850
6600 Put, 12/29/17, Strike $2,505.00 11,040
NUMBER OFCONTRACTS/NOTIONALAMOUNT VALUE
4400 Put, 12/01/17, Strike $2,540.00 $ 5,600
87,760
TOTAL PURCHASED OPTIONS(Cost $190,364) 95,063
NUMBER OFSHARES VALUE
SHORT TERM INVESTMENTS (0.6%)
36,810 Fidelity Prime Money Market Fund -Institutional Class 36,821
36,800 Morgan Stanley Institutional LiquidityFunds - Government Portfolio 36,800
TOTAL SHORT TERM INVESTMENTS(Cost $73,621) 73,621
TOTAL INVESTMENTS (108.6%)(Cost $11,945,372) 14,180,402
LIABILITIES, LESS OTHER ASSETS (-8.6%) (1,117,029)
NET ASSETS (100.0%) $13,063,373
NUMBER OFCONTRACTS/NOTIONALAMOUNT VALUE
WRITTEN OPTIONS (-8.5%)#Consumer Discretionary (0.0%)
3300
Carmax, Inc.Call, 01/19/18, Strike $77.50 (840)
1100
Netflix, Inc.Call, 12/15/17, Strike $215.00 (248)
(1,088)
Health Care (0.0%)10
1,000Abbvie, Inc.Call, 01/19/18, Strike $105.00 (295)
Information Technology (0.0%)10
1,000Apple, Inc.Call, 11/03/17, Strike $167.50 (4,675)
Other (-8.5%)S&P 500 Index
202,000 Put, 12/29/17, Strike $2,350.00 (12,400)
141,400 Put, 12/29/17, Strike $2,325.00 (7,420)
121,200 Put, 12/29/17, Strike $2,405.00 (10,500)
111,100 Call, 01/19/18, Strike $2,450.00 (155,485)
101,000 Call, 12/15/17, Strike $2,300.00 (275,050)
See accompanying Notes to Schedule of Investments www.calamos.com 127
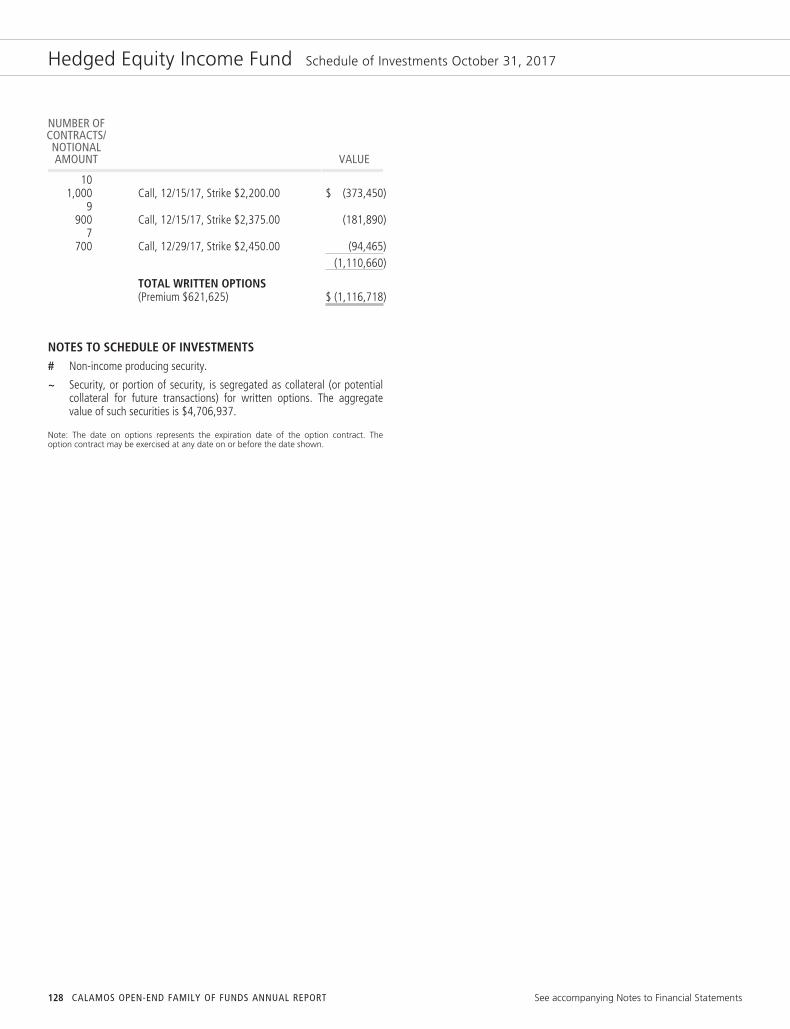
Hedged Equity Income Fund Schedule of Investments October 31, 2017
NUMBER OFCONTRACTS/NOTIONALAMOUNT VALUE
101,000 Call, 12/15/17, Strike $2,200.00 $ (373,450)
9900 Call, 12/15/17, Strike $2,375.00 (181,890)
7700 Call, 12/29/17, Strike $2,450.00 (94,465)
(1,110,660)
TOTAL WRITTEN OPTIONS(Premium $621,625) $ (1,116,718)
NOTES TO SCHEDULE OF INVESTMENTS# Non-income producing security.
~ Security, or portion of security, is segregated as collateral (or potentialcollateral for future transactions) for written options. The aggregatevalue of such securities is $4,706,937.
Note: The date on options represents the expiration date of the option contract. Theoption contract may be exercised at any date on or before the date shown.
128 CALAMOS OPEN-END FAMILY OF FUNDS ANNUAL REPORT See accompanying Notes to Financial Statements

Phineus Long/Short Fund Schedule of Investments October 31, 2017
NUMBER OFSHARES VALUE
COMMON STOCKS (84.0%)Consumer Discretionary (10.9%)
95,000 Adtalem Global Education, Inc.~ $ 3,510,250266,500 Canada Goose Holdings, Inc.#^ 5,724,42097,500 D.R. Horton, Inc.~ 4,310,47551,500 Expedia, Inc.~ 6,419,990
162,900 MGM Resorts International~ 5,106,91521,000 Netflix, Inc.# 4,125,0304,200 Priceline Group, Inc.~# 8,030,232
20,900 Tesla Motors, Inc.# 6,928,97721,000 Ulta Salon Cosmetics & Fragrance,
Inc.# 4,237,59048,393,879
Financials (32.3%)56,000 Affiliated Managers Group, Inc.~ 10,444,000
404,000 Bank of America Corp.~ 11,065,560163,200 Citigroup, Inc.~ 11,995,200140,500 Discover Financial Services~ 9,347,465217,000 E*TRADE Financial Corp.~# 9,459,03082,500 Evercore Partners, Inc. - Class A 6,608,25074,800 Goldman Sachs Group, Inc.~ 18,137,504
132,000 Intercontinental Exchange, Inc.~ 8,725,200168,000 JPMorgan Chase & Company~ 16,902,480287,000 Morgan Stanley~ 14,350,000370,500 Radian Group, Inc.~ 7,765,680772,000 SLM Corp.~# 8,175,480636,000 UBS Group, AG~# 10,818,360
143,794,209
Health Care (9.9%)25,000 Alexion Pharmaceuticals, Inc.~# 2,991,50053,700 Allergan, PLC 9,517,25190,500 Celgene Corp.~# 9,137,78525,000 Incyte Corp.# 2,831,25080,500 Johnson & Johnson~ 11,222,50528,000 Laboratory Corp. of America Holdings# 4,303,8809,800 Regeneron Pharmaceuticals, Inc.# 3,945,676
43,949,847
Industrials (7.8%)248,500 Air Lease Corp.~ 10,797,325216,000 Delta Air Lines, Inc.~ 10,806,480177,500 Spirit Airlines, Inc.~# 6,583,475114,000 United Continental Holdings, Inc.~# 6,666,720
34,854,000
Information Technology (19.2%)7,700 Alphabet, Inc. - Class A~# 7,954,408
109,000 Apple, Inc.~ 18,425,360
NUMBER OFSHARES VALUE
408,073 Canadian Solar, Inc.~# $ 7,186,16535,800 Ellie Mae, Inc.# 3,220,21082,600 Lumentum Holdings, Inc.# 5,216,190
327,500 NCR Corp.~# 10,509,475172,500 PayPal Holdings, Inc.~# 12,516,60087,500 Workday, Inc. - Class A~# 9,711,625
343,000 Zendesk, Inc.~# 10,633,00085,373,033
Materials (1.7%)47,500 EUR Wacker Chemie, AG 7,418,546
Real Estate (1.8%)200,300 CBRE Group, Inc. - Class A~# 7,875,796
Telecommunication Services (0.4%)221,000 GBP Inmarsat, PLC 1,822,922
TOTAL COMMON STOCKS(Cost $341,651,909) 373,482,232
EXCHANGE-TRADED FUNDS (6.4%)Other (6.4%)
248,000 Global X MSCI Greece ETF 2,298,960195,000 VanEck Vectors Vietnam ETF~ 3,123,900390,500 Vanguard FTSE Europe ETF~ 22,883,300
28,306,160
TOTAL EXCHANGE-TRADEDFUNDS(Cost $23,410,280) 28,306,160
NUMBER OFCONTRACTS/NOTIONALAMOUNT VALUE
PURCHASED OPTIONS (0.4%)#Consumer Discretionary (0.2%)
51551,500
Expedia, Inc.Put, 11/03/17, Strike $143.00 942,450
424,200
Priceline Group, Inc.Put, 11/10/17, Strike $1,800.00 67,830
1,010,280
Information Technology (0.1%)545
54,500Apple, Inc.Put, 11/10/17, Strike $150.00 15,805
1,333133,300
Zendesk, Inc.Put, 11/17/17, Strike $30.00 186,620
202,425
Other (0.1%)6,250
625,000S&P 500 ETF TrustPut, 11/17/17, Strike $253.00 453,125
See accompanying Notes to Schedule of Investments www.calamos.com 129
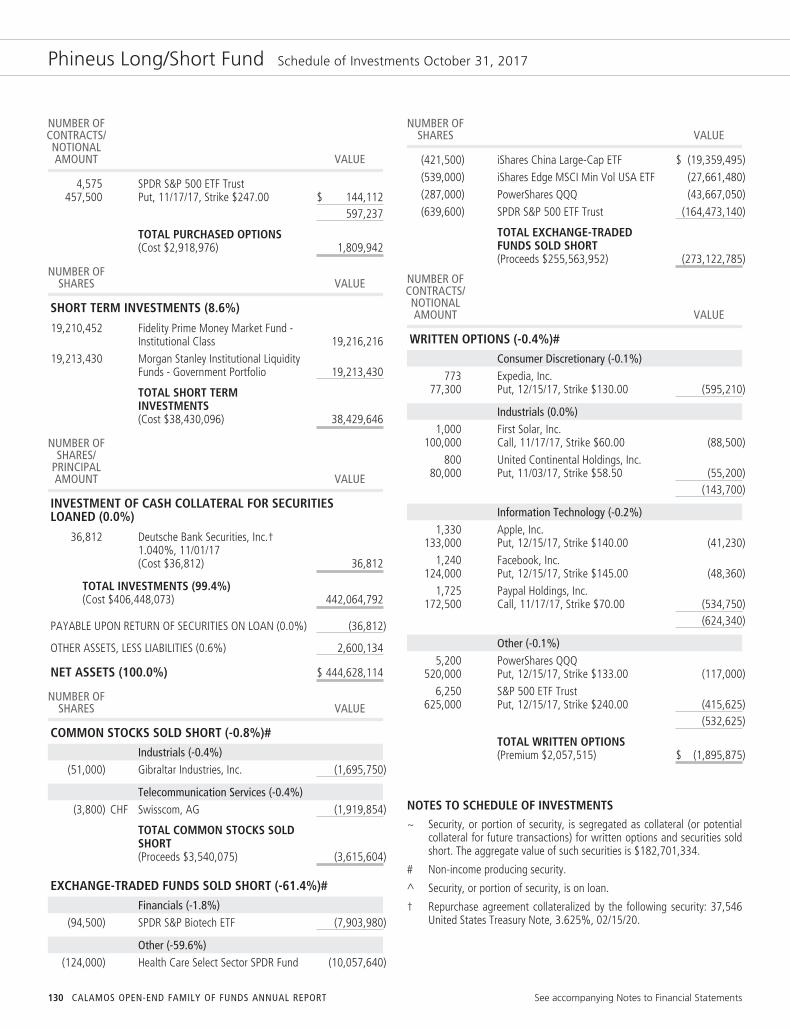
Phineus Long/Short Fund Schedule of Investments October 31, 2017
NUMBER OFCONTRACTS/NOTIONALAMOUNT VALUE
4,575457,500
SPDR S&P 500 ETF TrustPut, 11/17/17, Strike $247.00 $ 144,112
597,237
TOTAL PURCHASED OPTIONS(Cost $2,918,976) 1,809,942
NUMBER OFSHARES VALUE
SHORT TERM INVESTMENTS (8.6%)
19,210,452 Fidelity Prime Money Market Fund -Institutional Class 19,216,216
19,213,430 Morgan Stanley Institutional LiquidityFunds - Government Portfolio 19,213,430
TOTAL SHORT TERMINVESTMENTS(Cost $38,430,096) 38,429,646
NUMBER OFSHARES/
PRINCIPALAMOUNT VALUE
INVESTMENT OF CASH COLLATERAL FOR SECURITIESLOANED (0.0%)
36,812 Deutsche Bank Securities, Inc.†1.040%, 11/01/17(Cost $36,812) 36,812
TOTAL INVESTMENTS (99.4%)(Cost $406,448,073) 442,064,792
PAYABLE UPON RETURN OF SECURITIES ON LOAN (0.0%) (36,812)
OTHER ASSETS, LESS LIABILITIES (0.6%) 2,600,134
NET ASSETS (100.0%) $ 444,628,114
NUMBER OFSHARES VALUE
COMMON STOCKS SOLD SHORT (-0.8%)#Industrials (-0.4%)
(51,000) Gibraltar Industries, Inc. (1,695,750)
Telecommunication Services (-0.4%)(3,800) CHF Swisscom, AG (1,919,854)
TOTAL COMMON STOCKS SOLDSHORT(Proceeds $3,540,075) (3,615,604)
EXCHANGE-TRADED FUNDS SOLD SHORT (-61.4%)#Financials (-1.8%)
(94,500) SPDR S&P Biotech ETF (7,903,980)
Other (-59.6%)(124,000) Health Care Select Sector SPDR Fund (10,057,640)
NUMBER OFSHARES VALUE
(421,500) iShares China Large-Cap ETF $ (19,359,495)(539,000) iShares Edge MSCI Min Vol USA ETF (27,661,480)(287,000) PowerShares QQQ (43,667,050)(639,600) SPDR S&P 500 ETF Trust (164,473,140)
TOTAL EXCHANGE-TRADEDFUNDS SOLD SHORT(Proceeds $255,563,952) (273,122,785)
NUMBER OFCONTRACTS/NOTIONALAMOUNT VALUE
WRITTEN OPTIONS (-0.4%)#Consumer Discretionary (-0.1%)
77377,300
Expedia, Inc.Put, 12/15/17, Strike $130.00 (595,210)
Industrials (0.0%)1,000
100,000First Solar, Inc.Call, 11/17/17, Strike $60.00 (88,500)
80080,000
United Continental Holdings, Inc.Put, 11/03/17, Strike $58.50 (55,200)
(143,700)
Information Technology (-0.2%)1,330
133,000Apple, Inc.Put, 12/15/17, Strike $140.00 (41,230)
1,240124,000
Facebook, Inc.Put, 12/15/17, Strike $145.00 (48,360)
1,725172,500
Paypal Holdings, Inc.Call, 11/17/17, Strike $70.00 (534,750)
(624,340)
Other (-0.1%)5,200
520,000PowerShares QQQPut, 12/15/17, Strike $133.00 (117,000)
6,250625,000
S&P 500 ETF TrustPut, 12/15/17, Strike $240.00 (415,625)
(532,625)
TOTAL WRITTEN OPTIONS(Premium $2,057,515) $ (1,895,875)
NOTES TO SCHEDULE OF INVESTMENTS~ Security, or portion of security, is segregated as collateral (or potential
collateral for future transactions) for written options and securities soldshort. The aggregate value of such securities is $182,701,334.
# Non-income producing security.
^ Security, or portion of security, is on loan.
† Repurchase agreement collateralized by the following security: 37,546United States Treasury Note, 3.625%, 02/15/20.
130 CALAMOS OPEN-END FAMILY OF FUNDS ANNUAL REPORT See accompanying Notes to Financial Statements

Phineus Long/Short Fund Schedule of Investments October 31, 2017
FOREIGN CURRENCY ABBREVIATIONSCHF Swiss FrancEUR European Monetary UnitGBP British Pound Sterling
Note: Value for securities denominated in foreign currencies is shown in U.S. dollars. Thedate on options represents the expiration date of the option contract. The option contractmay be exercised at any date on or before the date shown.
See accompanying Notes to Financial Statements www.calamos.com 131

Statements of Assets and Liabilities October 31, 2017
GROWTHFUND
OPPORTUNISTICVALUE FUND
DIVIDENDGROWTH FUND
INTERNATIONALGROWTH FUND
EVOLVING WORLDGROWTH FUND
ASSETSInvestments in securities, at cost $1,239,025,977 $43,957,275 $19,730,932 $210,945,869 $244,658,467
Investment in securities, at value $1,673,837,359 $52,499,137 $25,204,828 $284,142,410 $326,798,031Cash with custodian (interest bearing) 881 — — — —Restricted cash for short positions (interest bearing) — — — — —Restricted cash for collateral on securities loaned — — — 2,752,402 —Restricted foreign currency for short positions (cost $-) — — — — —Foreign currency (cost $11 and $16) — — — 11 16Restricted cash for open forward foreign currency contracts — — — 280,000 —Unrealized appreciation on forward foreign currency contracts — — — 53,132 —Receivables:
Accrued interest and dividends 555,557 31,785 22,847 789,696 462,354Investments sold 13,350,962 — 40,503 3,362,724 1,499,168Fund shares sold 213,231 4,645 — 203,864 276,284Due from investment advisor — 24,528 33,916 — 221
Prepaid expenses 69,980 19,978 29,012 30,858 45,056Other assets 710,797 107,226 11,911 104,698 74,934
Total assets 1,688,738,767 52,687,299 25,343,017 291,719,795 329,156,064
LIABILITIESDue to custodian bank — — — 473 —Collateral for securities loaned — — — 5,631,840 —Foreign currency overdraft (cost $-) — — — — —Securities sold short, at value (proceeds $-) — — — — —Options written, at value (premium $2,498,611 and $228,069) 3,368,586 — — — 76,125Unrealized depreciation on forward foreign currency contracts — — — 256,008 —Payables:
Investments purchased 6,991,026 496 — 1,812,166 4,609,695Fund shares redeemed 2,695,271 45,215 11,555 280,446 675,012Dividends payable — — — — —Affiliates:
Investment advisory fees 1,262,283 44,225 21,543 249,483 301,138Distribution fees 35,183 563 85 2,690 2,365Deferred compensation to trustees 712,280 107,226 11,911 104,698 74,934Financial accounting fees 16,509 514 251 2,747 3,186Trustees’ fees and officer compensation 21,687 2,721 2,505 5,591 5,673
Other accounts payable and accrued liabilities 1,208,661 34,124 24,615 1,214,353 2,230,738
Total liabilities 16,311,486 235,084 72,465 9,560,495 7,978,866
NET ASSETS $1,672,427,281 $52,452,215 $25,270,552 $282,159,300 $321,177,198
COMPOSITION OF NET ASSETSPaid in capital $1,022,104,044 $42,152,139 $17,848,602 $198,183,966 $295,997,557Undistributed net investment income (loss) (607,467) 139,246 5,843 116,038 281,214Accumulated net realized gain (loss) on investments, foreign currency
transactions, written options and short positions 216,989,297 1,618,968 1,942,211 11,943,214 (55,351,888)Unrealized appreciation (depreciation) of investments, foreign currency
translations, written options and short positions 433,941,407 8,541,862 5,473,896 71,916,082* 80,250,315*
NET ASSETS $1,672,427,281 $52,452,215 $25,270,552 $282,159,300 $321,177,198
CLASS A SHARES†
Net assets applicable to shares outstanding $ 967,725,128 $21,893,678 $ 2,030,956 $ 72,490,721 $ 68,141,655Shares outstanding 27,229,317 1,439,309 159,584 3,363,680 4,595,457Net asset value and redemption price per share $ 35.54 $ 15.21 $ 12.73 $ 21.55 $ 14.83
Maximum offering price per share (Net asset value, plus 4.75% ofoffering price) $ 37.31 $ 15.97 $ 13.36 $ 22.62 $ 15.57
CLASS C SHARES†**Net assets applicable to shares outstanding $ 398,115,396 $ 4,728,060 $ 1,038,917 $ 27,840,091 $ 24,845,505Shares outstanding 16,413,681 344,135 82,976 1,411,734 1,771,278Net asset value and redemption price per share $ 24.26 $ 13.74 $ 12.52 $ 19.72 $ 14.03
CLASS I SHARES†
Net assets applicable to shares outstanding $ 301,236,574 $25,669,390 $22,200,679 $175,069,961 $225,338,764Shares outstanding 6,667,273 1,642,444 1,746,309 7,954,490 15,062,136Net asset value and redemption price per share $ 45.18 $ 15.63 $ 12.71 $ 22.01 $ 14.96
CLASS R SHARES†
Net assets applicable to shares outstanding $ 5,350,183 $ 161,087 $ — $ 6,758,527 $ 2,851,274Shares outstanding 159,616 10,737 — 321,035 194,826Net asset value and redemption price per share $ 33.52 $ 15.00 $ — $ 21.05 $ 14.63
* Net of deferred foreign capital gains tax of $(1,077,929) and $(2,039,376).
† No par value; unlimited number of shares authorized.
** Redemption price may be reduced by contingent deferred sales charge.
132 CALAMOS OPEN-END FAMILY OF FUNDS ANNUAL REPORT See accompanying Notes to Financial Statements

Statements of Assets and Liabilities October 31, 2017
EMERGING MARKETEQUITY FUND
GLOBALEQUITY FUND
GROWTH ANDINCOME FUND
GLOBALGROWTH ANDINCOME FUND
CONVERTIBLEFUND
ASSETSInvestments in securities, at cost $13,031,770 $ 91,604,866 $1,622,890,929 $187,025,804 $546,050,238
Investment in securities, at value $17,052,638 $133,238,429 $2,066,124,458 $226,009,587 $614,671,410Cash with custodian (interest bearing) — — — — —Restricted cash for short positions (interest bearing) — — — — —Restricted cash for collateral on securities loaned — 644,459 9,363,124 1,913,052 10,682,477Restricted foreign currency for short positions (cost $-) — — — — —Foreign currency (cost $4) — 4 — — —Restricted cash for open forward foreign currency contracts — — — — —Unrealized appreciation on forward foreign currency contracts — 33,600 — 27,972 —Receivables:
Accrued interest and dividends 6,026 185,749 4,055,404 514,691 1,844,774Investments sold 261,479 1,077,319 7,699,324 1,247,535 —Fund shares sold — 52,783 564,065 42,948 411,339Due from investment advisor 8,864 — 14,348 — —
Prepaid expenses 14,239 22,117 79,098 36,503 56,626Other assets 11,908 79,909 334,936 151,860 191,888
Total assets 17,355,154 135,334,369 2,088,234,757 229,944,148 627,858,514
LIABILITIESDue to custodian bank — 371 — — —Collateral for securities loaned — 1,318,664 19,158,400 3,914,400 21,858,000Foreign currency overdraft (cost $109,468) — — — 109,418 —Securities sold short, at value (proceeds $-) — — — — —Options written, at value (premium $109,871) — — 163,550 — —Unrealized depreciation on forward foreign currency contracts — 62,574 — 105,034 —Payables:
Investments purchased 215,644 988,151 4,686,806 1,882,325 —Fund shares redeemed — 53,821 2,423,748 165,891 1,253,493Dividends payable — — — — —Affiliates:
Investment advisory fees 15,909 114,456 1,200,321 189,901 378,290Distribution fees 96 1,258 44,400 4,939 11,082Deferred compensation to trustees 11,908 79,909 334,936 151,860 191,888Financial accounting fees 168 1,285 20,349 2,190 5,936Trustees’ fees and officer compensation 2,186 3,454 25,165 5,473 8,800
Other accounts payable and accrued liabilities 25,003 435,639 664,282 381,294 191,359
Total liabilities 270,914 3,059,582 28,721,957 6,912,725 23,898,848
NET ASSETS $17,084,240 $132,274,787 $2,059,512,800 $223,031,423 $603,959,666
COMPOSITION OF NET ASSETSPaid in capital $15,860,556 $ 79,339,838 $1,494,946,010 $170,858,849 $509,125,311Undistributed net investment income (loss) 4,877 61,718 (5,247,530) (321,787) (3,961,053)Accumulated net realized gain (loss) on investments, foreign currency
transactions, written options and short positions (2,802,322) 11,640,253 126,634,470 13,870,502 30,175,345Unrealized appreciation (depreciation) of investments, foreign currency
translations, written options and short positions 4,021,129 41,232,978* 443,179,850 38,623,859* 68,620,063
NET ASSETS $17,084,240 $132,274,787 $2,059,512,800 $223,031,423 $603,959,666
CLASS A SHARES†
Net assets applicable to shares outstanding $ 5,491,030 $ 26,956,550 $ 918,694,559 $ 78,195,790 $222,016,798Shares outstanding 518,788 1,724,555 27,715,465 7,938,489 12,152,515Net asset value and redemption price per share $ 10.58 $ 15.63 $ 33.15 $ 9.85 $ 18.27
Maximum offering price per share (Net asset value, plus 4.75% of offering price) $ 11.11 $ 16.41 $ 34.80 $ 10.34 $ 18.69#
CLASS C SHARES†**Net assets applicable to shares outstanding $ 385,921 $ 13,768,648 $ 574,454,648 $ 70,210,035 $147,111,897Shares outstanding 37,252 956,473 17,251,744 7,942,174 8,133,607Net asset value and redemption price per share $ 10.36 $ 14.40 $ 33.30 $ 8.84 $ 18.09
CLASS I SHARES†
Net assets applicable to shares outstanding $11,207,289 $ 86,429,216 $ 554,489,640 $ 73,360,649 $233,076,721Shares outstanding 1,054,555 5,418,427 17,350,971 7,253,397 14,165,299Net asset value and redemption price per share $ 10.63 $ 15.95 $ 31.96 $ 10.11 $ 16.45
CLASS R SHARES†
Net assets applicable to shares outstanding $ — $ 5,120,373 $ 11,873,953 $ 1,264,949 $ 1,754,250Shares outstanding — 337,327 361,107 130,606 96,397Net asset value and redemption price per share $ — $ 15.18 $ 32.88 $ 9.69 $ 18.20
* Net of deferred foreign capital gains tax of $(369,437) and $(274,943).
† No par value; unlimited number of shares authorized.
** Redemption price may be reduced by contingent deferred sales charge.
# For Convertible Fund, maximum offering price per share is Net asset value plus 2.25% of offering price.
See accompanying Notes to Financial Statements www.calamos.com 133
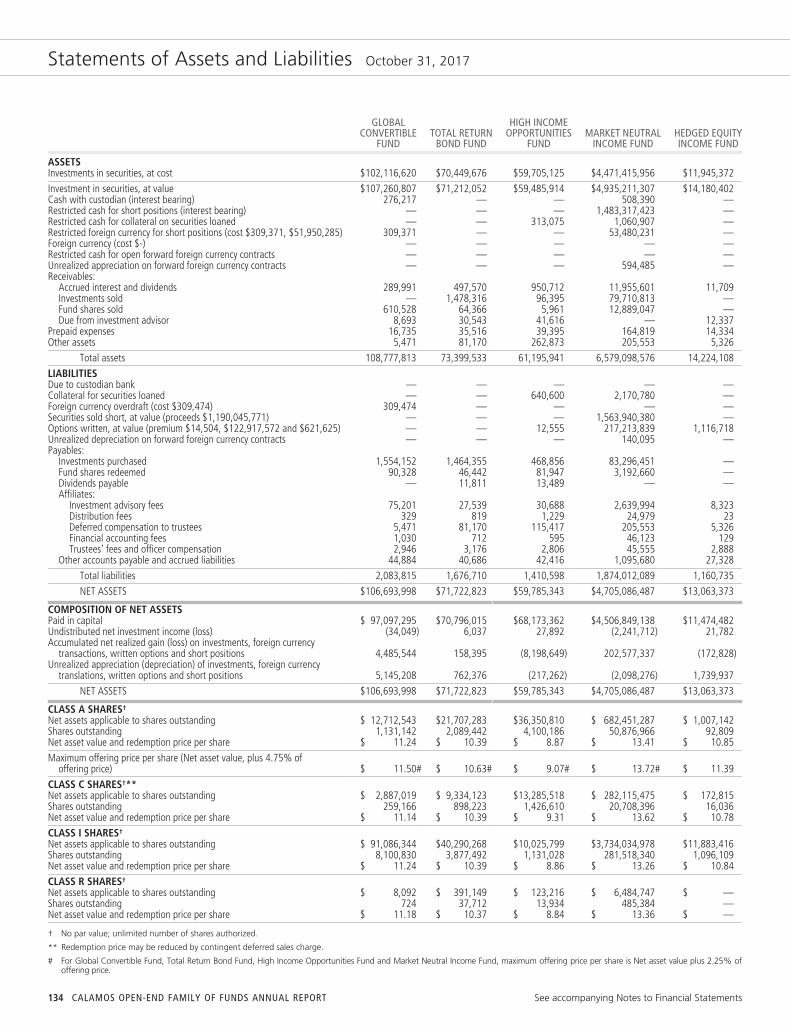
Statements of Assets and Liabilities October 31, 2017
GLOBALCONVERTIBLE
FUNDTOTAL RETURN
BOND FUND
HIGH INCOMEOPPORTUNITIES
FUNDMARKET NEUTRAL
INCOME FUNDHEDGED EQUITYINCOME FUND
ASSETSInvestments in securities, at cost $102,116,620 $70,449,676 $59,705,125 $4,471,415,956 $11,945,372
Investment in securities, at value $107,260,807 $71,212,052 $59,485,914 $4,935,211,307 $14,180,402Cash with custodian (interest bearing) 276,217 — — 508,390 —Restricted cash for short positions (interest bearing) — — — 1,483,317,423 —Restricted cash for collateral on securities loaned — — 313,075 1,060,907 —Restricted foreign currency for short positions (cost $309,371, $51,950,285) 309,371 — — 53,480,231 —Foreign currency (cost $-) — — — — —Restricted cash for open forward foreign currency contracts — — — — —Unrealized appreciation on forward foreign currency contracts — — — 594,485 —Receivables:
Accrued interest and dividends 289,991 497,570 950,712 11,955,601 11,709Investments sold — 1,478,316 96,395 79,710,813 —Fund shares sold 610,528 64,366 5,961 12,889,047 —Due from investment advisor 8,693 30,543 41,616 — 12,337
Prepaid expenses 16,735 35,516 39,395 164,819 14,334Other assets 5,471 81,170 262,873 205,553 5,326
Total assets 108,777,813 73,399,533 61,195,941 6,579,098,576 14,224,108
LIABILITIESDue to custodian bank — — — — —Collateral for securities loaned — — 640,600 2,170,780 —Foreign currency overdraft (cost $309,474) 309,474 — — — —Securities sold short, at value (proceeds $1,190,045,771) — — — 1,563,940,380 —Options written, at value (premium $14,504, $122,917,572 and $621,625) — — 12,555 217,213,839 1,116,718Unrealized depreciation on forward foreign currency contracts — — — 140,095 —Payables:
Investments purchased 1,554,152 1,464,355 468,856 83,296,451 —Fund shares redeemed 90,328 46,442 81,947 3,192,660 —Dividends payable — 11,811 13,489 — —Affiliates:
Investment advisory fees 75,201 27,539 30,688 2,639,994 8,323Distribution fees 329 819 1,229 24,979 23Deferred compensation to trustees 5,471 81,170 115,417 205,553 5,326Financial accounting fees 1,030 712 595 46,123 129Trustees’ fees and officer compensation 2,946 3,176 2,806 45,555 2,888
Other accounts payable and accrued liabilities 44,884 40,686 42,416 1,095,680 27,328
Total liabilities 2,083,815 1,676,710 1,410,598 1,874,012,089 1,160,735
NET ASSETS $106,693,998 $71,722,823 $59,785,343 $4,705,086,487 $13,063,373
COMPOSITION OF NET ASSETSPaid in capital $ 97,097,295 $70,796,015 $68,173,362 $4,506,849,138 $11,474,482Undistributed net investment income (loss) (34,049) 6,037 27,892 (2,241,712) 21,782Accumulated net realized gain (loss) on investments, foreign currency
transactions, written options and short positions 4,485,544 158,395 (8,198,649) 202,577,337 (172,828)Unrealized appreciation (depreciation) of investments, foreign currency
translations, written options and short positions 5,145,208 762,376 (217,262) (2,098,276) 1,739,937
NET ASSETS $106,693,998 $71,722,823 $59,785,343 $4,705,086,487 $13,063,373
CLASS A SHARES†
Net assets applicable to shares outstanding $ 12,712,543 $21,707,283 $36,350,810 $ 682,451,287 $ 1,007,142Shares outstanding 1,131,142 2,089,442 4,100,186 50,876,966 92,809Net asset value and redemption price per share $ 11.24 $ 10.39 $ 8.87 $ 13.41 $ 10.85
Maximum offering price per share (Net asset value, plus 4.75% ofoffering price) $ 11.50# $ 10.63# $ 9.07# $ 13.72# $ 11.39
CLASS C SHARES†**Net assets applicable to shares outstanding $ 2,887,019 $ 9,334,123 $13,285,518 $ 282,115,475 $ 172,815Shares outstanding 259,166 898,223 1,426,610 20,708,396 16,036Net asset value and redemption price per share $ 11.14 $ 10.39 $ 9.31 $ 13.62 $ 10.78
CLASS I SHARES†
Net assets applicable to shares outstanding $ 91,086,344 $40,290,268 $10,025,799 $3,734,034,978 $11,883,416Shares outstanding 8,100,830 3,877,492 1,131,028 281,518,340 1,096,109Net asset value and redemption price per share $ 11.24 $ 10.39 $ 8.86 $ 13.26 $ 10.84
CLASS R SHARES†
Net assets applicable to shares outstanding $ 8,092 $ 391,149 $ 123,216 $ 6,484,747 $ —Shares outstanding 724 37,712 13,934 485,384 —Net asset value and redemption price per share $ 11.18 $ 10.37 $ 8.84 $ 13.36 $ —
† No par value; unlimited number of shares authorized.
** Redemption price may be reduced by contingent deferred sales charge.
# For Global Convertible Fund, Total Return Bond Fund, High Income Opportunities Fund and Market Neutral Income Fund, maximum offering price per share is Net asset value plus 2.25% ofoffering price.
134 CALAMOS OPEN-END FAMILY OF FUNDS ANNUAL REPORT See accompanying Notes to Financial Statements
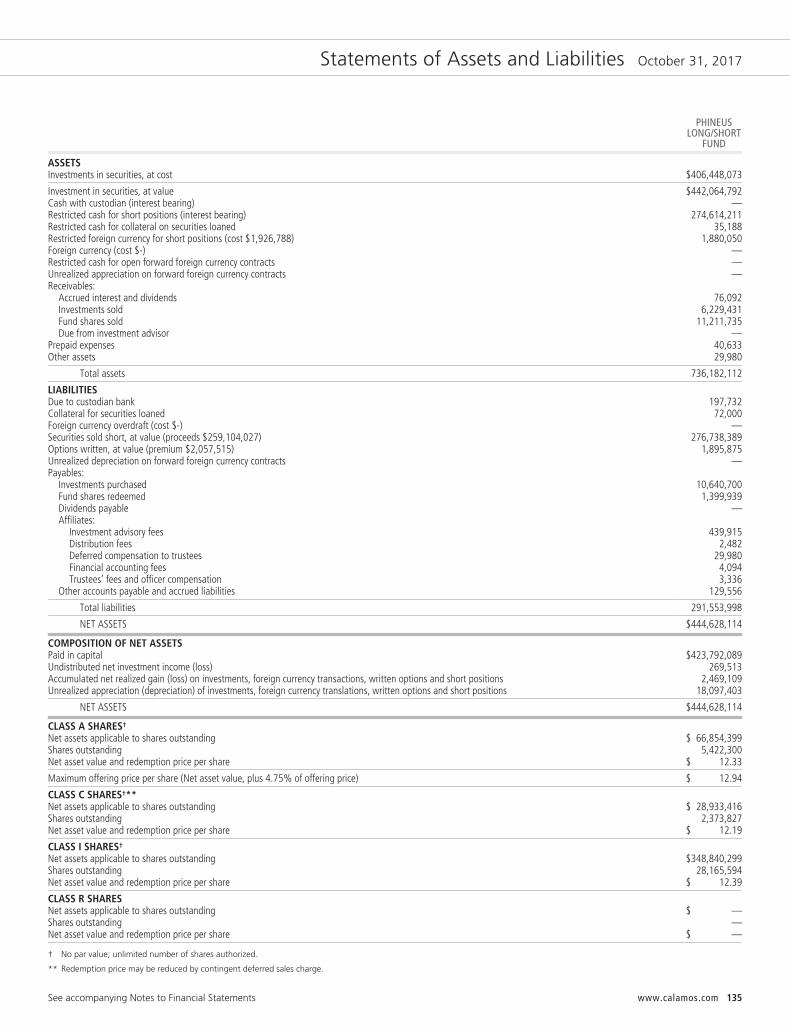
Statements of Assets and Liabilities October 31, 2017
PHINEUSLONG/SHORT
FUND
ASSETSInvestments in securities, at cost $406,448,073
Investment in securities, at value $442,064,792Cash with custodian (interest bearing) —Restricted cash for short positions (interest bearing) 274,614,211Restricted cash for collateral on securities loaned 35,188Restricted foreign currency for short positions (cost $1,926,788) 1,880,050Foreign currency (cost $-) —Restricted cash for open forward foreign currency contracts —Unrealized appreciation on forward foreign currency contracts —Receivables:
Accrued interest and dividends 76,092Investments sold 6,229,431Fund shares sold 11,211,735Due from investment advisor —
Prepaid expenses 40,633Other assets 29,980
Total assets 736,182,112
LIABILITIESDue to custodian bank 197,732Collateral for securities loaned 72,000Foreign currency overdraft (cost $-) —Securities sold short, at value (proceeds $259,104,027) 276,738,389Options written, at value (premium $2,057,515) 1,895,875Unrealized depreciation on forward foreign currency contracts —Payables:
Investments purchased 10,640,700Fund shares redeemed 1,399,939Dividends payable —Affiliates:
Investment advisory fees 439,915Distribution fees 2,482Deferred compensation to trustees 29,980Financial accounting fees 4,094Trustees’ fees and officer compensation 3,336
Other accounts payable and accrued liabilities 129,556
Total liabilities 291,553,998
NET ASSETS $444,628,114
COMPOSITION OF NET ASSETSPaid in capital $423,792,089Undistributed net investment income (loss) 269,513Accumulated net realized gain (loss) on investments, foreign currency transactions, written options and short positions 2,469,109Unrealized appreciation (depreciation) of investments, foreign currency translations, written options and short positions 18,097,403
NET ASSETS $444,628,114
CLASS A SHARES†
Net assets applicable to shares outstanding $ 66,854,399Shares outstanding 5,422,300Net asset value and redemption price per share $ 12.33
Maximum offering price per share (Net asset value, plus 4.75% of offering price) $ 12.94
CLASS C SHARES†**Net assets applicable to shares outstanding $ 28,933,416Shares outstanding 2,373,827Net asset value and redemption price per share $ 12.19
CLASS I SHARES†
Net assets applicable to shares outstanding $348,840,299Shares outstanding 28,165,594Net asset value and redemption price per share $ 12.39
CLASS R SHARESNet assets applicable to shares outstanding $ —Shares outstanding —Net asset value and redemption price per share $ —
† No par value; unlimited number of shares authorized.
** Redemption price may be reduced by contingent deferred sales charge.
See accompanying Notes to Financial Statements www.calamos.com 135
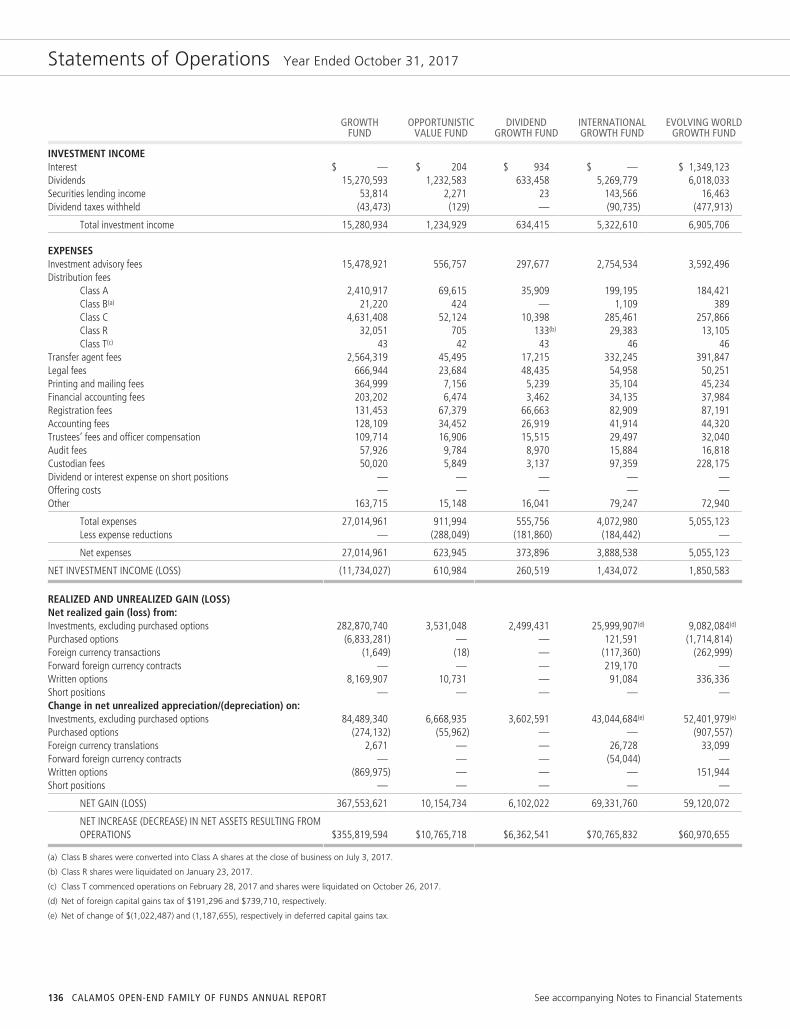
Statements of Operations Year Ended October 31, 2017
GROWTHFUND
OPPORTUNISTICVALUE FUND
DIVIDENDGROWTH FUND
INTERNATIONALGROWTH FUND
EVOLVING WORLDGROWTH FUND
INVESTMENT INCOMEInterest $ — $ 204 $ 934 $ — $ 1,349,123Dividends 15,270,593 1,232,583 633,458 5,269,779 6,018,033Securities lending income 53,814 2,271 23 143,566 16,463Dividend taxes withheld (43,473) (129) — (90,735) (477,913)
Total investment income 15,280,934 1,234,929 634,415 5,322,610 6,905,706
EXPENSESInvestment advisory fees 15,478,921 556,757 297,677 2,754,534 3,592,496Distribution fees
Class A 2,410,917 69,615 35,909 199,195 184,421Class B(a) 21,220 424 — 1,109 389Class C 4,631,408 52,124 10,398 285,461 257,866Class R 32,051 705 133(b) 29,383 13,105Class T(c) 43 42 43 46 46
Transfer agent fees 2,564,319 45,495 17,215 332,245 391,847Legal fees 666,944 23,684 48,435 54,958 50,251Printing and mailing fees 364,999 7,156 5,239 35,104 45,234Financial accounting fees 203,202 6,474 3,462 34,135 37,984Registration fees 131,453 67,379 66,663 82,909 87,191Accounting fees 128,109 34,452 26,919 41,914 44,320Trustees’ fees and officer compensation 109,714 16,906 15,515 29,497 32,040Audit fees 57,926 9,784 8,970 15,884 16,818Custodian fees 50,020 5,849 3,137 97,359 228,175Dividend or interest expense on short positions — — — — —Offering costs — — — — —Other 163,715 15,148 16,041 79,247 72,940
Total expenses 27,014,961 911,994 555,756 4,072,980 5,055,123Less expense reductions — (288,049) (181,860) (184,442) —
Net expenses 27,014,961 623,945 373,896 3,888,538 5,055,123
NET INVESTMENT INCOME (LOSS) (11,734,027) 610,984 260,519 1,434,072 1,850,583
REALIZED AND UNREALIZED GAIN (LOSS)Net realized gain (loss) from:Investments, excluding purchased options 282,870,740 3,531,048 2,499,431 25,999,907(d) 9,082,084(d)
Purchased options (6,833,281) — — 121,591 (1,714,814)Foreign currency transactions (1,649) (18) — (117,360) (262,999)Forward foreign currency contracts — — — 219,170 —Written options 8,169,907 10,731 — 91,084 336,336Short positions — — — — —Change in net unrealized appreciation/(depreciation) on:Investments, excluding purchased options 84,489,340 6,668,935 3,602,591 43,044,684(e) 52,401,979(e)
Purchased options (274,132) (55,962) — — (907,557)Foreign currency translations 2,671 — — 26,728 33,099Forward foreign currency contracts — — — (54,044) —Written options (869,975) — — — 151,944Short positions — — — — —
NET GAIN (LOSS) 367,553,621 10,154,734 6,102,022 69,331,760 59,120,072
NET INCREASE (DECREASE) IN NET ASSETS RESULTING FROMOPERATIONS $355,819,594 $10,765,718 $6,362,541 $70,765,832 $60,970,655
(a) Class B shares were converted into Class A shares at the close of business on July 3, 2017.
(b) Class R shares were liquidated on January 23, 2017.
(c) Class T commenced operations on February 28, 2017 and shares were liquidated on October 26, 2017.
(d) Net of foreign capital gains tax of $191,296 and $739,710, respectively.
(e) Net of change of $(1,022,487) and (1,187,655), respectively in deferred capital gains tax.
136 CALAMOS OPEN-END FAMILY OF FUNDS ANNUAL REPORT See accompanying Notes to Financial Statements
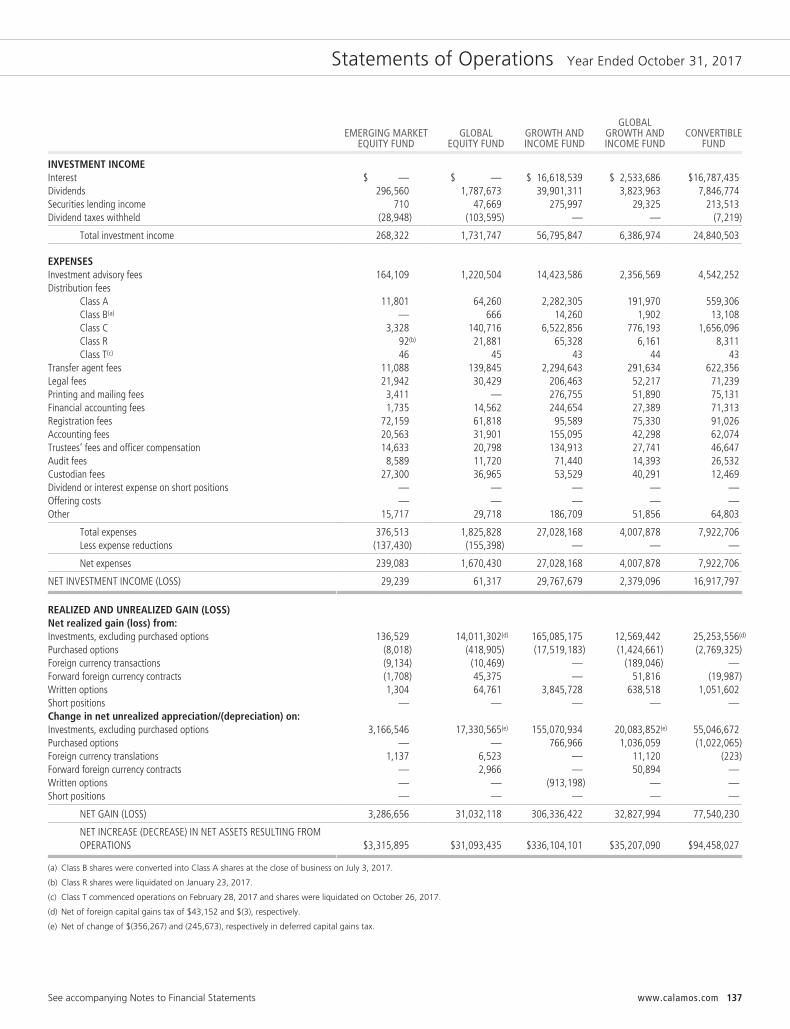
Statements of Operations Year Ended October 31, 2017
EMERGING MARKETEQUITY FUND
GLOBALEQUITY FUND
GROWTH ANDINCOME FUND
GLOBALGROWTH ANDINCOME FUND
CONVERTIBLEFUND
INVESTMENT INCOMEInterest $ — $ — $ 16,618,539 $ 2,533,686 $16,787,435Dividends 296,560 1,787,673 39,901,311 3,823,963 7,846,774Securities lending income 710 47,669 275,997 29,325 213,513Dividend taxes withheld (28,948) (103,595) — — (7,219)
Total investment income 268,322 1,731,747 56,795,847 6,386,974 24,840,503
EXPENSESInvestment advisory fees 164,109 1,220,504 14,423,586 2,356,569 4,542,252Distribution fees
Class A 11,801 64,260 2,282,305 191,970 559,306Class B(a) — 666 14,260 1,902 13,108Class C 3,328 140,716 6,522,856 776,193 1,656,096Class R 92(b) 21,881 65,328 6,161 8,311Class T(c) 46 45 43 44 43
Transfer agent fees 11,088 139,845 2,294,643 291,634 622,356Legal fees 21,942 30,429 206,463 52,217 71,239Printing and mailing fees 3,411 — 276,755 51,890 75,131Financial accounting fees 1,735 14,562 244,654 27,389 71,313Registration fees 72,159 61,818 95,589 75,330 91,026Accounting fees 20,563 31,901 155,095 42,298 62,074Trustees’ fees and officer compensation 14,633 20,798 134,913 27,741 46,647Audit fees 8,589 11,720 71,440 14,393 26,532Custodian fees 27,300 36,965 53,529 40,291 12,469Dividend or interest expense on short positions — — — — —Offering costs — — — — —Other 15,717 29,718 186,709 51,856 64,803
Total expenses 376,513 1,825,828 27,028,168 4,007,878 7,922,706Less expense reductions (137,430) (155,398) — — —
Net expenses 239,083 1,670,430 27,028,168 4,007,878 7,922,706
NET INVESTMENT INCOME (LOSS) 29,239 61,317 29,767,679 2,379,096 16,917,797
REALIZED AND UNREALIZED GAIN (LOSS)Net realized gain (loss) from:Investments, excluding purchased options 136,529 14,011,302(d) 165,085,175 12,569,442 25,253,556(d)
Purchased options (8,018) (418,905) (17,519,183) (1,424,661) (2,769,325)Foreign currency transactions (9,134) (10,469) — (189,046) —Forward foreign currency contracts (1,708) 45,375 — 51,816 (19,987)Written options 1,304 64,761 3,845,728 638,518 1,051,602Short positions — — — — —Change in net unrealized appreciation/(depreciation) on:Investments, excluding purchased options 3,166,546 17,330,565(e) 155,070,934 20,083,852(e) 55,046,672Purchased options — — 766,966 1,036,059 (1,022,065)Foreign currency translations 1,137 6,523 — 11,120 (223)Forward foreign currency contracts — 2,966 — 50,894 —Written options — — (913,198) — —Short positions — — — — —
NET GAIN (LOSS) 3,286,656 31,032,118 306,336,422 32,827,994 77,540,230
NET INCREASE (DECREASE) IN NET ASSETS RESULTING FROMOPERATIONS $3,315,895 $31,093,435 $336,104,101 $35,207,090 $94,458,027
(a) Class B shares were converted into Class A shares at the close of business on July 3, 2017.
(b) Class R shares were liquidated on January 23, 2017.
(c) Class T commenced operations on February 28, 2017 and shares were liquidated on October 26, 2017.
(d) Net of foreign capital gains tax of $43,152 and $(3), respectively.
(e) Net of change of $(356,267) and (245,673), respectively in deferred capital gains tax.
See accompanying Notes to Financial Statements www.calamos.com 137
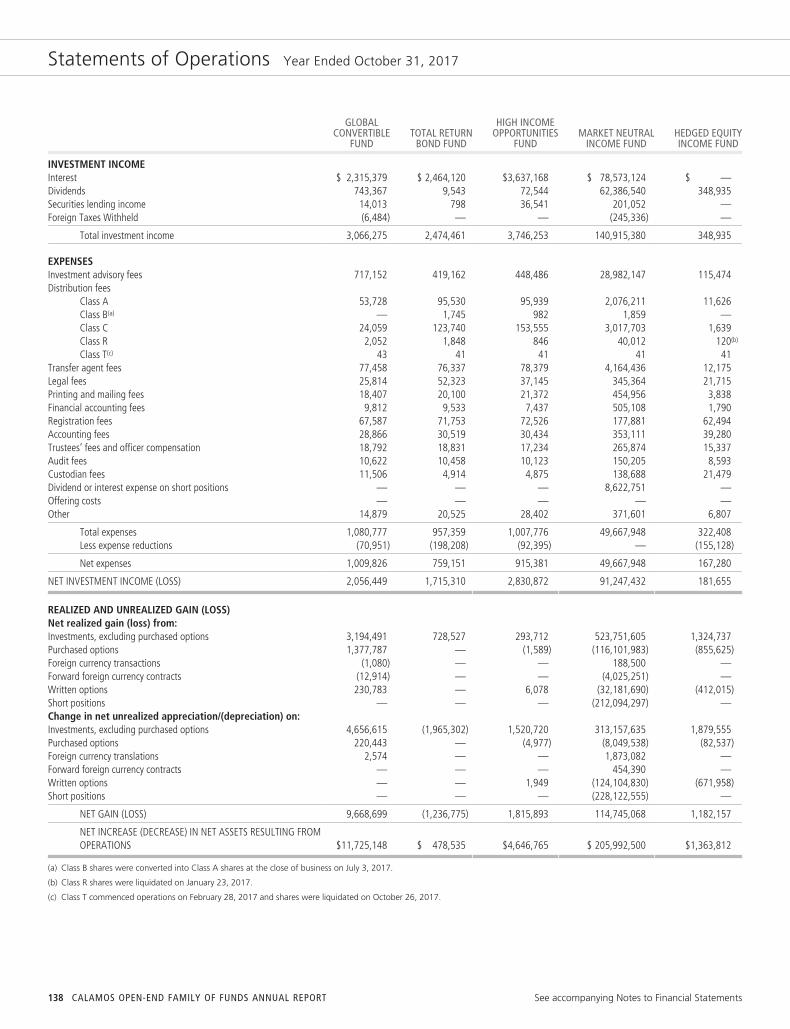
Statements of Operations Year Ended October 31, 2017
GLOBALCONVERTIBLE
FUNDTOTAL RETURN
BOND FUND
HIGH INCOMEOPPORTUNITIES
FUNDMARKET NEUTRAL
INCOME FUNDHEDGED EQUITYINCOME FUND
INVESTMENT INCOMEInterest $ 2,315,379 $ 2,464,120 $3,637,168 $ 78,573,124 $ —Dividends 743,367 9,543 72,544 62,386,540 348,935Securities lending income 14,013 798 36,541 201,052 —Foreign Taxes Withheld (6,484) — — (245,336) —
Total investment income 3,066,275 2,474,461 3,746,253 140,915,380 348,935
EXPENSESInvestment advisory fees 717,152 419,162 448,486 28,982,147 115,474Distribution fees
Class A 53,728 95,530 95,939 2,076,211 11,626Class B(a) — 1,745 982 1,859 —Class C 24,059 123,740 153,555 3,017,703 1,639Class R 2,052 1,848 846 40,012 120(b)
Class T(c) 43 41 41 41 41Transfer agent fees 77,458 76,337 78,379 4,164,436 12,175Legal fees 25,814 52,323 37,145 345,364 21,715Printing and mailing fees 18,407 20,100 21,372 454,956 3,838Financial accounting fees 9,812 9,533 7,437 505,108 1,790Registration fees 67,587 71,753 72,526 177,881 62,494Accounting fees 28,866 30,519 30,434 353,111 39,280Trustees’ fees and officer compensation 18,792 18,831 17,234 265,874 15,337Audit fees 10,622 10,458 10,123 150,205 8,593Custodian fees 11,506 4,914 4,875 138,688 21,479Dividend or interest expense on short positions — — — 8,622,751 —Offering costs — — — — —Other 14,879 20,525 28,402 371,601 6,807
Total expenses 1,080,777 957,359 1,007,776 49,667,948 322,408Less expense reductions (70,951) (198,208) (92,395) — (155,128)
Net expenses 1,009,826 759,151 915,381 49,667,948 167,280
NET INVESTMENT INCOME (LOSS) 2,056,449 1,715,310 2,830,872 91,247,432 181,655
REALIZED AND UNREALIZED GAIN (LOSS)Net realized gain (loss) from:Investments, excluding purchased options 3,194,491 728,527 293,712 523,751,605 1,324,737Purchased options 1,377,787 — (1,589) (116,101,983) (855,625)Foreign currency transactions (1,080) — — 188,500 —Forward foreign currency contracts (12,914) — — (4,025,251) —Written options 230,783 — 6,078 (32,181,690) (412,015)Short positions — — — (212,094,297) —Change in net unrealized appreciation/(depreciation) on:Investments, excluding purchased options 4,656,615 (1,965,302) 1,520,720 313,157,635 1,879,555Purchased options 220,443 — (4,977) (8,049,538) (82,537)Foreign currency translations 2,574 — — 1,873,082 —Forward foreign currency contracts — — — 454,390 —Written options — — 1,949 (124,104,830) (671,958)Short positions — — — (228,122,555) —
NET GAIN (LOSS) 9,668,699 (1,236,775) 1,815,893 114,745,068 1,182,157
NET INCREASE (DECREASE) IN NET ASSETS RESULTING FROMOPERATIONS $11,725,148 $ 478,535 $4,646,765 $ 205,992,500 $1,363,812
(a) Class B shares were converted into Class A shares at the close of business on July 3, 2017.
(b) Class R shares were liquidated on January 23, 2017.
(c) Class T commenced operations on February 28, 2017 and shares were liquidated on October 26, 2017.
138 CALAMOS OPEN-END FAMILY OF FUNDS ANNUAL REPORT See accompanying Notes to Financial Statements

Statements of Operations Year Ended October 31, 2017
PHINEUSLONG/SHORT
FUND
INVESTMENT INCOMEInterest $ 387,847Dividends 2,865,648Securities lending income 72,937Dividend taxes withheld (3,741)
Total investment income 3,322,691
EXPENSESInvestment advisory fees 3,052,655Distribution fees
Class A 96,627Class C 150,829Class R —Class T(a) 42
Transfer agent fees 238,468Legal fees 20,897Printing and mailing fees 16,263Financial accounting fees 28,390Registration fees 87,246Accounting fees 32,668Trustees’ fees and officer compensation 26,733Audit fees 15,878Custodian fees 49,737Dividend or interest expense on short positions 2,391,454Offering costs and organizational fees 10,040Other 21,830
Total expenses 6,239,757Less expense reductions —
Net expenses 6,239,757
NET INVESTMENT INCOME (LOSS) (2,917,066)
REALIZED AND UNREALIZED GAIN (LOSS)Net realized gain (loss) from:Investments, excluding purchased options 17,759,449Purchased options (14,747,059)Foreign currency transactions (39,404)Forward foreign currency contracts —Written options 9,052,251Short positions (5,273,482)Change in net unrealized appreciation/(depreciation) on:Investments, excluding purchased options 35,549,786Purchased options (1,199,086)Foreign currency translations (47,086)Forward foreign currency contracts —Written options 180,411Short positions (17,773,592)
NET GAIN (LOSS) 23,462,188
NET INCREASE (DECREASE) IN NET ASSETS RESULTING FROM OPERATIONS $ 20,545,122
(a) Class T commenced operations on February 28, 2017 and shares were liquidated on October 26, 2017.
See accompanying Notes to Financial Statements www.calamos.com 139
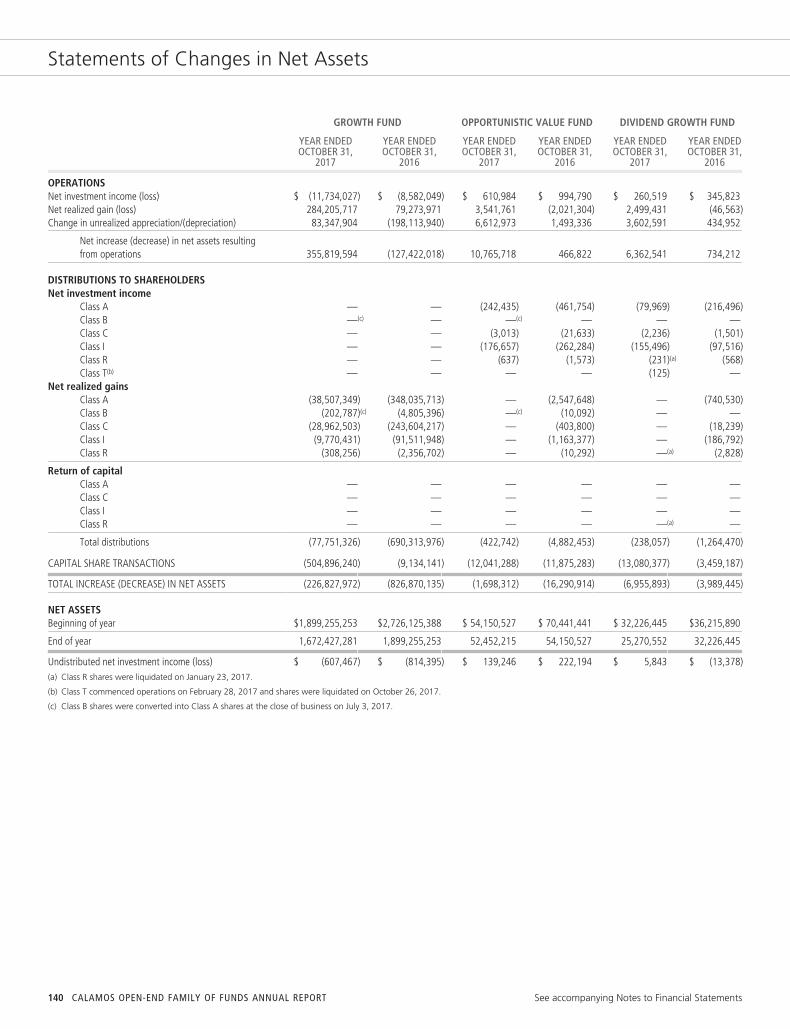
Statements of Changes in Net Assets
GROWTH FUND OPPORTUNISTIC VALUE FUND DIVIDEND GROWTH FUND
YEAR ENDEDOCTOBER 31,
2017
YEAR ENDEDOCTOBER 31,
2016
YEAR ENDEDOCTOBER 31,
2017
YEAR ENDEDOCTOBER 31,
2016
YEAR ENDEDOCTOBER 31,
2017
YEAR ENDEDOCTOBER 31,
2016
OPERATIONSNet investment income (loss) $ (11,734,027) $ (8,582,049) $ 610,984 $ 994,790 $ 260,519 $ 345,823Net realized gain (loss) 284,205,717 79,273,971 3,541,761 (2,021,304) 2,499,431 (46,563)Change in unrealized appreciation/(depreciation) 83,347,904 (198,113,940) 6,612,973 1,493,336 3,602,591 434,952
Net increase (decrease) in net assets resultingfrom operations 355,819,594 (127,422,018) 10,765,718 466,822 6,362,541 734,212
DISTRIBUTIONS TO SHAREHOLDERSNet investment income
Class A — — (242,435) (461,754) (79,969) (216,496)Class B —(c) — —(c) — — —Class C — — (3,013) (21,633) (2,236) (1,501)Class I — — (176,657) (262,284) (155,496) (97,516)Class R — — (637) (1,573) (231)(a) (568)Class T(b) — — — — (125) —
Net realized gainsClass A (38,507,349) (348,035,713) — (2,547,648) — (740,530)Class B (202,787)(c) (4,805,396) —(c) (10,092) — —Class C (28,962,503) (243,604,217) — (403,800) — (18,239)Class I (9,770,431) (91,511,948) — (1,163,377) — (186,792)Class R (308,256) (2,356,702) — (10,292) —(a) (2,828)
Return of capitalClass A — — — — — —Class C — — — — — —Class I — — — — — —Class R — — — — —(a) —
Total distributions (77,751,326) (690,313,976) (422,742) (4,882,453) (238,057) (1,264,470)
CAPITAL SHARE TRANSACTIONS (504,896,240) (9,134,141) (12,041,288) (11,875,283) (13,080,377) (3,459,187)
TOTAL INCREASE (DECREASE) IN NET ASSETS (226,827,972) (826,870,135) (1,698,312) (16,290,914) (6,955,893) (3,989,445)
NET ASSETSBeginning of year $1,899,255,253 $2,726,125,388 $ 54,150,527 $ 70,441,441 $ 32,226,445 $36,215,890
End of year 1,672,427,281 1,899,255,253 52,452,215 54,150,527 25,270,552 32,226,445
Undistributed net investment income (loss) $ (607,467) $ (814,395) $ 139,246 $ 222,194 $ 5,843 $ (13,378)(a) Class R shares were liquidated on January 23, 2017.
(b) Class T commenced operations on February 28, 2017 and shares were liquidated on October 26, 2017.
(c) Class B shares were converted into Class A shares at the close of business on July 3, 2017.
140 CALAMOS OPEN-END FAMILY OF FUNDS ANNUAL REPORT See accompanying Notes to Financial Statements
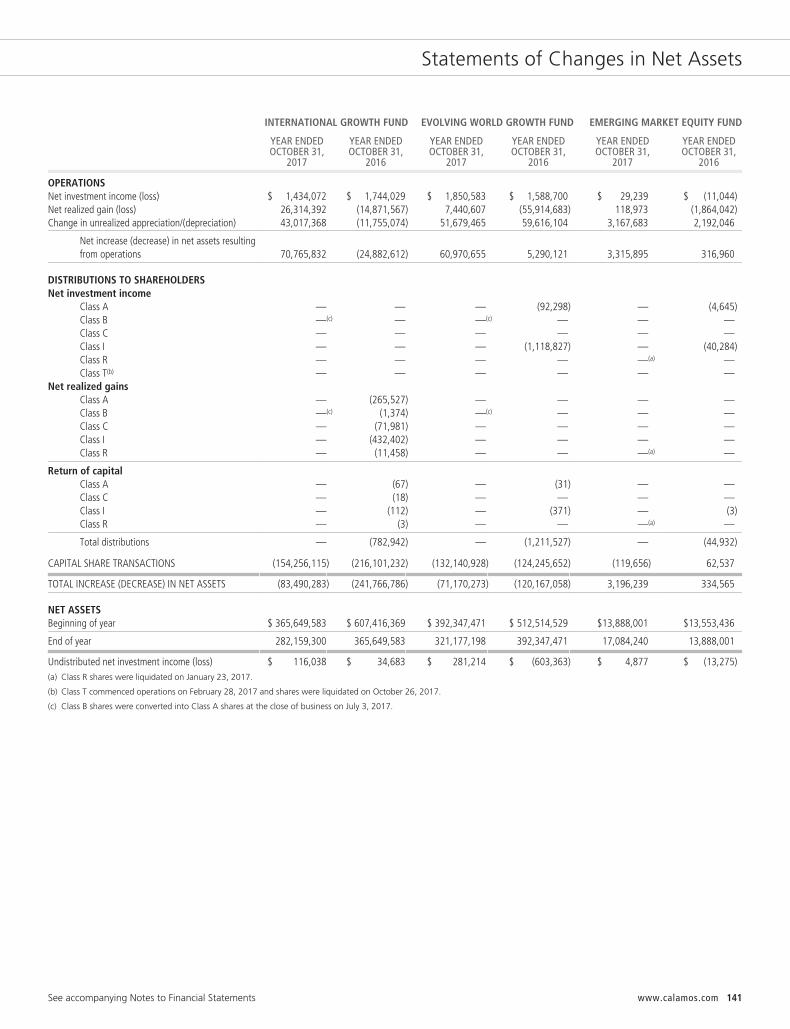
Statements of Changes in Net Assets
INTERNATIONAL GROWTH FUND EVOLVING WORLD GROWTH FUND EMERGING MARKET EQUITY FUND
YEAR ENDEDOCTOBER 31,
2017
YEAR ENDEDOCTOBER 31,
2016
YEAR ENDEDOCTOBER 31,
2017
YEAR ENDEDOCTOBER 31,
2016
YEAR ENDEDOCTOBER 31,
2017
YEAR ENDEDOCTOBER 31,
2016
OPERATIONSNet investment income (loss) $ 1,434,072 $ 1,744,029 $ 1,850,583 $ 1,588,700 $ 29,239 $ (11,044)Net realized gain (loss) 26,314,392 (14,871,567) 7,440,607 (55,914,683) 118,973 (1,864,042)Change in unrealized appreciation/(depreciation) 43,017,368 (11,755,074) 51,679,465 59,616,104 3,167,683 2,192,046
Net increase (decrease) in net assets resultingfrom operations 70,765,832 (24,882,612) 60,970,655 5,290,121 3,315,895 316,960
DISTRIBUTIONS TO SHAREHOLDERSNet investment income
Class A — — — (92,298) — (4,645)Class B —(c) — —(c) — — —Class C — — — — — —Class I — — — (1,118,827) — (40,284)Class R — — — — —(a) —Class T(b) — — — — — —
Net realized gainsClass A — (265,527) — — — —Class B —(c) (1,374) —(c) — — —Class C — (71,981) — — — —Class I — (432,402) — — — —Class R — (11,458) — — —(a) —
Return of capitalClass A — (67) — (31) — —Class C — (18) — — — —Class I — (112) — (371) — (3)Class R — (3) — — —(a) —
Total distributions — (782,942) — (1,211,527) — (44,932)
CAPITAL SHARE TRANSACTIONS (154,256,115) (216,101,232) (132,140,928) (124,245,652) (119,656) 62,537
TOTAL INCREASE (DECREASE) IN NET ASSETS (83,490,283) (241,766,786) (71,170,273) (120,167,058) 3,196,239 334,565
NET ASSETSBeginning of year $ 365,649,583 $ 607,416,369 $ 392,347,471 $ 512,514,529 $13,888,001 $13,553,436
End of year 282,159,300 365,649,583 321,177,198 392,347,471 17,084,240 13,888,001
Undistributed net investment income (loss) $ 116,038 $ 34,683 $ 281,214 $ (603,363) $ 4,877 $ (13,275)(a) Class R shares were liquidated on January 23, 2017.
(b) Class T commenced operations on February 28, 2017 and shares were liquidated on October 26, 2017.
(c) Class B shares were converted into Class A shares at the close of business on July 3, 2017.
See accompanying Notes to Financial Statements www.calamos.com 141
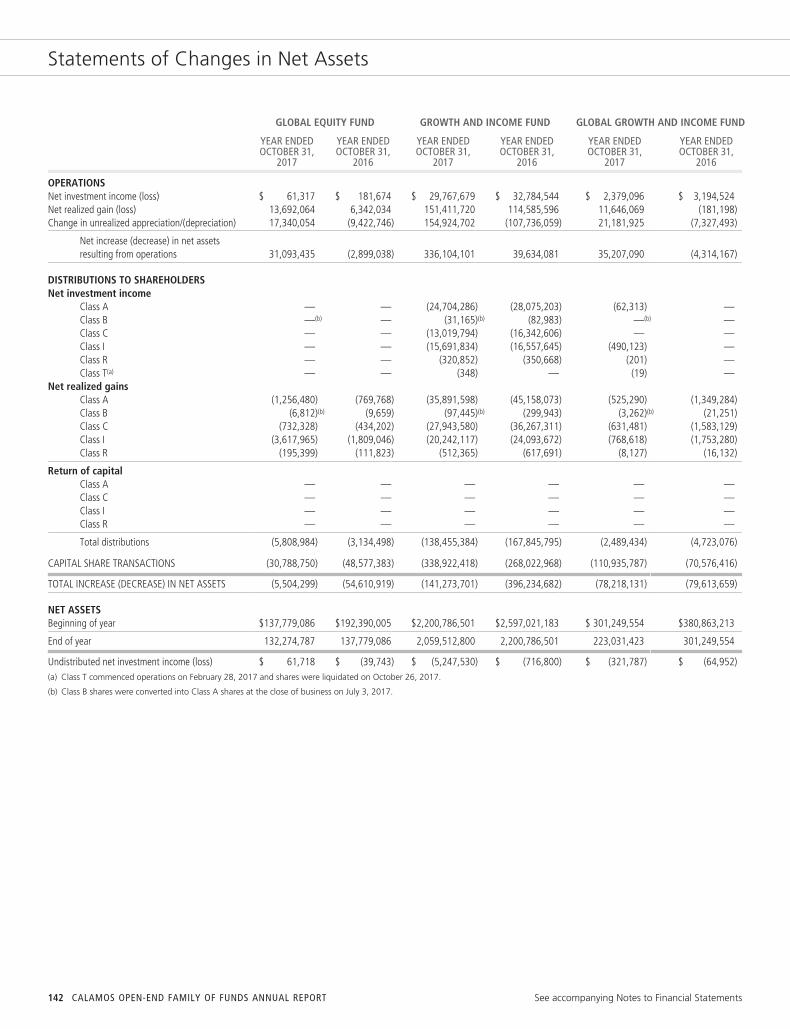
Statements of Changes in Net Assets
GLOBAL EQUITY FUND GROWTH AND INCOME FUND GLOBAL GROWTH AND INCOME FUND
YEAR ENDEDOCTOBER 31,
2017
YEAR ENDEDOCTOBER 31,
2016
YEAR ENDEDOCTOBER 31,
2017
YEAR ENDEDOCTOBER 31,
2016
YEAR ENDEDOCTOBER 31,
2017
YEAR ENDEDOCTOBER 31,
2016
OPERATIONSNet investment income (loss) $ 61,317 $ 181,674 $ 29,767,679 $ 32,784,544 $ 2,379,096 $ 3,194,524Net realized gain (loss) 13,692,064 6,342,034 151,411,720 114,585,596 11,646,069 (181,198)Change in unrealized appreciation/(depreciation) 17,340,054 (9,422,746) 154,924,702 (107,736,059) 21,181,925 (7,327,493)
Net increase (decrease) in net assetsresulting from operations 31,093,435 (2,899,038) 336,104,101 39,634,081 35,207,090 (4,314,167)
DISTRIBUTIONS TO SHAREHOLDERSNet investment income
Class A — — (24,704,286) (28,075,203) (62,313) —Class B —(b) — (31,165)(b) (82,983) —(b) —Class C — — (13,019,794) (16,342,606) — —Class I — — (15,691,834) (16,557,645) (490,123) —Class R — — (320,852) (350,668) (201) —Class T(a) — — (348) — (19) —
Net realized gainsClass A (1,256,480) (769,768) (35,891,598) (45,158,073) (525,290) (1,349,284)Class B (6,812)(b) (9,659) (97,445)(b) (299,943) (3,262)(b) (21,251)Class C (732,328) (434,202) (27,943,580) (36,267,311) (631,481) (1,583,129)Class I (3,617,965) (1,809,046) (20,242,117) (24,093,672) (768,618) (1,753,280)Class R (195,399) (111,823) (512,365) (617,691) (8,127) (16,132)
Return of capitalClass A — — — — — —Class C — — — — — —Class I — — — — — —Class R — — — — — —
Total distributions (5,808,984) (3,134,498) (138,455,384) (167,845,795) (2,489,434) (4,723,076)
CAPITAL SHARE TRANSACTIONS (30,788,750) (48,577,383) (338,922,418) (268,022,968) (110,935,787) (70,576,416)
TOTAL INCREASE (DECREASE) IN NET ASSETS (5,504,299) (54,610,919) (141,273,701) (396,234,682) (78,218,131) (79,613,659)
NET ASSETSBeginning of year $137,779,086 $192,390,005 $2,200,786,501 $2,597,021,183 $ 301,249,554 $380,863,213
End of year 132,274,787 137,779,086 2,059,512,800 2,200,786,501 223,031,423 301,249,554
Undistributed net investment income (loss) $ 61,718 $ (39,743) $ (5,247,530) $ (716,800) $ (321,787) $ (64,952)(a) Class T commenced operations on February 28, 2017 and shares were liquidated on October 26, 2017.
(b) Class B shares were converted into Class A shares at the close of business on July 3, 2017.
142 CALAMOS OPEN-END FAMILY OF FUNDS ANNUAL REPORT See accompanying Notes to Financial Statements
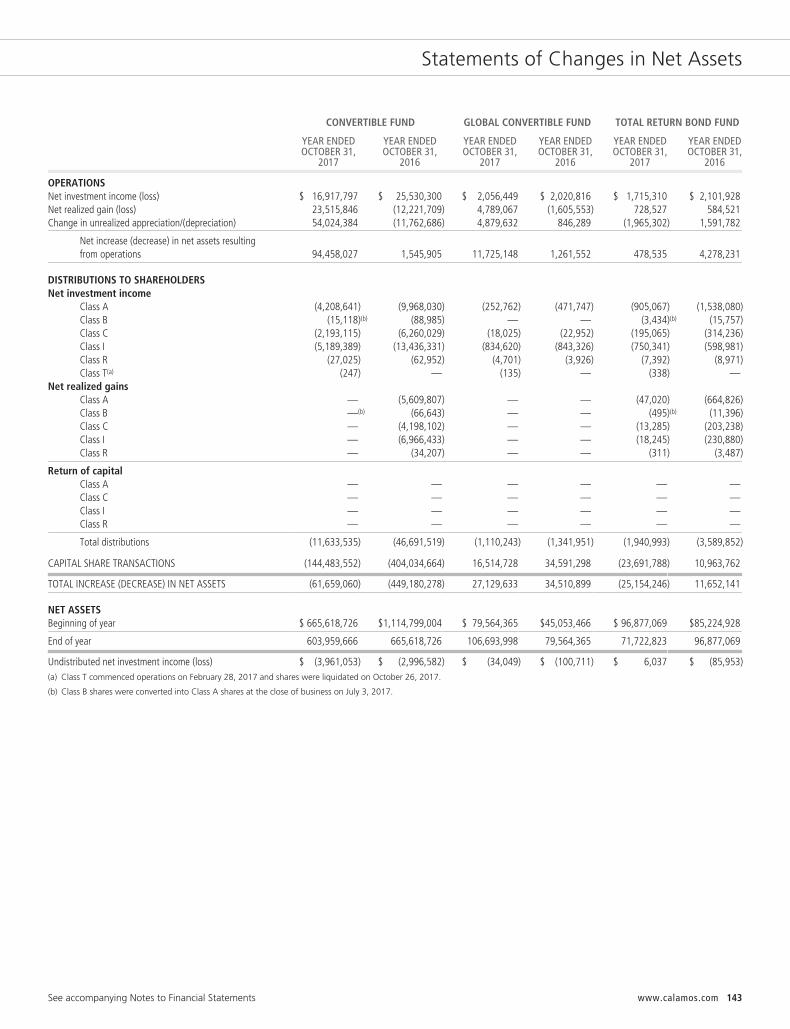
Statements of Changes in Net Assets
CONVERTIBLE FUND GLOBAL CONVERTIBLE FUND TOTAL RETURN BOND FUND
YEAR ENDEDOCTOBER 31,
2017
YEAR ENDEDOCTOBER 31,
2016
YEAR ENDEDOCTOBER 31,
2017
YEAR ENDEDOCTOBER 31,
2016
YEAR ENDEDOCTOBER 31,
2017
YEAR ENDEDOCTOBER 31,
2016
OPERATIONSNet investment income (loss) $ 16,917,797 $ 25,530,300 $ 2,056,449 $ 2,020,816 $ 1,715,310 $ 2,101,928Net realized gain (loss) 23,515,846 (12,221,709) 4,789,067 (1,605,553) 728,527 584,521Change in unrealized appreciation/(depreciation) 54,024,384 (11,762,686) 4,879,632 846,289 (1,965,302) 1,591,782
Net increase (decrease) in net assets resultingfrom operations 94,458,027 1,545,905 11,725,148 1,261,552 478,535 4,278,231
DISTRIBUTIONS TO SHAREHOLDERSNet investment income
Class A (4,208,641) (9,968,030) (252,762) (471,747) (905,067) (1,538,080)Class B (15,118)(b) (88,985) — — (3,434)(b) (15,757)Class C (2,193,115) (6,260,029) (18,025) (22,952) (195,065) (314,236)Class I (5,189,389) (13,436,331) (834,620) (843,326) (750,341) (598,981)Class R (27,025) (62,952) (4,701) (3,926) (7,392) (8,971)Class T(a) (247) — (135) — (338) —
Net realized gainsClass A — (5,609,807) — — (47,020) (664,826)Class B —(b) (66,643) — — (495)(b) (11,396)Class C — (4,198,102) — — (13,285) (203,238)Class I — (6,966,433) — — (18,245) (230,880)Class R — (34,207) — — (311) (3,487)
Return of capitalClass A — — — — — —Class C — — — — — —Class I — — — — — —Class R — — — — — —
Total distributions (11,633,535) (46,691,519) (1,110,243) (1,341,951) (1,940,993) (3,589,852)
CAPITAL SHARE TRANSACTIONS (144,483,552) (404,034,664) 16,514,728 34,591,298 (23,691,788) 10,963,762
TOTAL INCREASE (DECREASE) IN NET ASSETS (61,659,060) (449,180,278) 27,129,633 34,510,899 (25,154,246) 11,652,141
NET ASSETSBeginning of year $ 665,618,726 $1,114,799,004 $ 79,564,365 $45,053,466 $ 96,877,069 $85,224,928
End of year 603,959,666 665,618,726 106,693,998 79,564,365 71,722,823 96,877,069
Undistributed net investment income (loss) $ (3,961,053) $ (2,996,582) $ (34,049) $ (100,711) $ 6,037 $ (85,953)(a) Class T commenced operations on February 28, 2017 and shares were liquidated on October 26, 2017.
(b) Class B shares were converted into Class A shares at the close of business on July 3, 2017.
See accompanying Notes to Financial Statements www.calamos.com 143

Statements of Changes in Net Assets
HIGH INCOME OPPORTUNITIES FUND MARKET NEUTRAL INCOME FUND HEDGED EQUITY INCOME FUND
YEAR ENDEDOCTOBER 31,
2017
YEAR ENDEDOCTOBER 31,
2016
YEAR ENDEDOCTOBER 31,
2017
YEAR ENDEDOCTOBER 31,
2016
YEAR ENDEDOCTOBER 31,
2017
YEAR ENDEDOCTOBER 31,
2016
OPERATIONSNet investment income (loss) $ 2,830,872 $ 3,951,449 $ 91,247,432 $ 75,644,461 $ 181,655 $ 166,302Net realized gain (loss) 298,201 (5,078,931) 159,536,884 (17,809,051) 57,097 (451,298)Change in unrealized appreciation/(depreciation) 1,517,692 4,641,429 (44,791,816) 62,758,252 1,125,060 899,250
Net increase (decrease) in net assetsresulting from operations 4,646,765 3,513,947 205,992,500 120,593,662 1,363,812 614,254
DISTRIBUTIONS TO SHAREHOLDERSNet investment income
Class A (1,791,822) (2,566,700) (8,322,047) (12,315,287) (43,240) (116,799)Class B (3,444)(c) (16,605) (178)(c) (339) — —Class C (562,447) (789,624) (790,382) (1,441,834) (425) (912)Class I (487,920) (778,240) (40,383,844) (36,128,886) (113,498) (104,488)Class R (7,164) (8,297) (61,200) (80,343) (322)(a) (1,295)Class T(b) (702) — (186) — (128) —
Net realized gainsClass A — — (14,401,508) (15,743,390) — (49,274)Class B —(c) — (4,667)(c) (20,890) — —Class C — — (4,704,234) (4,999,398) — (941)Class I — — (41,369,190) (35,916,097) — (48,109)Class R — — (128,066) (130,687) —(a) (877)
Return of capitalClass A — — — — — —Class C — — — — — —Class I — — — — — —Class R — — — — —(a) —
Total distributions (2,853,499) (4,159,466) (110,165,502) (106,777,151) (157,613) (322,695)
CAPITAL SHARE TRANSACTIONS (16,247,787) (36,059,312) 722,732,603 94,143,472 (6,711,161) 6,888,865
TOTAL INCREASE (DECREASE) IN NET ASSETS (14,454,521) (36,704,831) 818,559,601 107,959,983 (5,504,962) 7,180,424
NET ASSETSBeginning of year $ 74,239,864 $110,944,695 $3,886,526,886 $3,778,566,903 $18,568,335 $11,387,911
End of year 59,785,343 74,239,864 4,705,086,487 3,886,526,886 13,063,373 18,568,335
Undistributed net investment income (loss) $ 27,892 $ (91,813) $ (2,241,712) $ (4,230,603) $ 21,782 $ 4,970(a) Class R shares were liquidated on January 23, 2017.
(b) Class T commenced operations on February 28, 2017 and shares were liquidated on October 26, 2017.
(c) Class B shares were converted into Class A shares at the close of business on July 3, 2017.
144 CALAMOS OPEN-END FAMILY OF FUNDS ANNUAL REPORT See accompanying Notes to Financial Statements
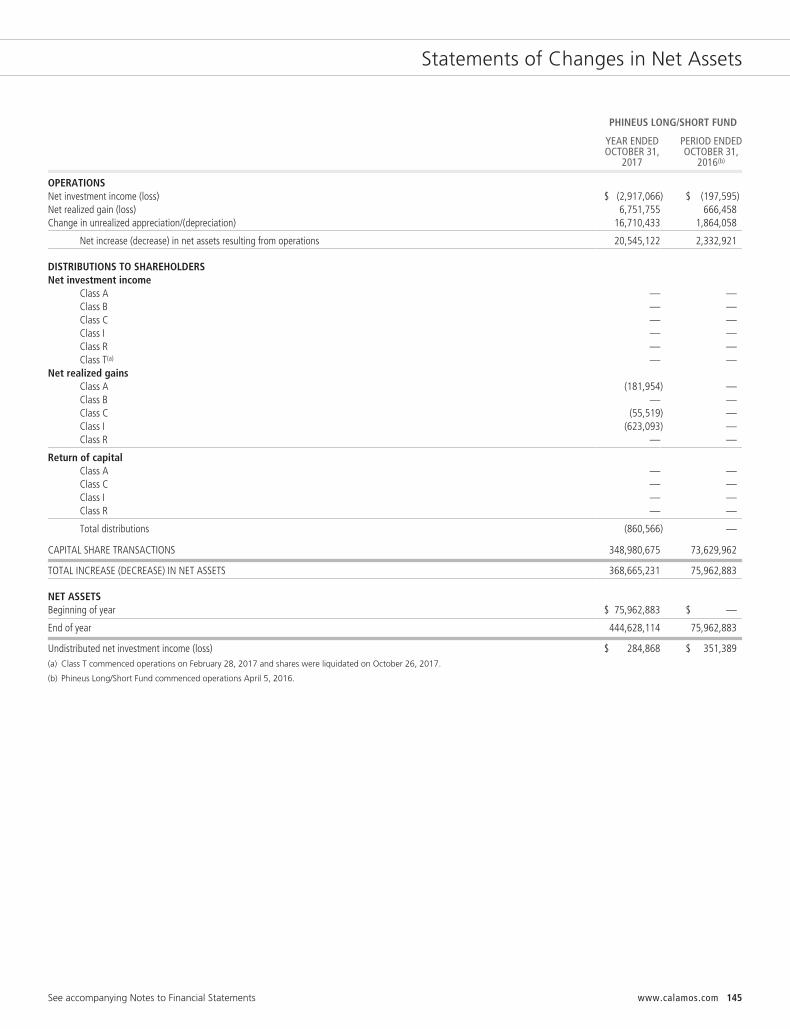
Statements of Changes in Net Assets
PHINEUS LONG/SHORT FUND
YEAR ENDEDOCTOBER 31,
2017
PERIOD ENDEDOCTOBER 31,
2016(b)
OPERATIONSNet investment income (loss) $ (2,917,066) $ (197,595)Net realized gain (loss) 6,751,755 666,458Change in unrealized appreciation/(depreciation) 16,710,433 1,864,058
Net increase (decrease) in net assets resulting from operations 20,545,122 2,332,921
DISTRIBUTIONS TO SHAREHOLDERSNet investment income
Class A — —Class B — —Class C — —Class I — —Class R — —Class T(a) — —
Net realized gainsClass A (181,954) —Class B — —Class C (55,519) —Class I (623,093) —Class R — —
Return of capitalClass A — —Class C — —Class I — —Class R — —
Total distributions (860,566) —
CAPITAL SHARE TRANSACTIONS 348,980,675 73,629,962
TOTAL INCREASE (DECREASE) IN NET ASSETS 368,665,231 75,962,883
NET ASSETSBeginning of year $ 75,962,883 $ —
End of year 444,628,114 75,962,883
Undistributed net investment income (loss) $ 284,868 $ 351,389(a) Class T commenced operations on February 28, 2017 and shares were liquidated on October 26, 2017.
(b) Phineus Long/Short Fund commenced operations April 5, 2016.
See accompanying Notes to Financial Statements www.calamos.com 145
Notes to Financial Statements
Note 1 – Organization and Significant Accounting PoliciesOrganization. CALAMOS INVESTMENT TRUST, a Massachusetts business trust organized December 21, 1987 (the “Trust”), consistsof sixteen series, Growth Fund, Opportunistic Value Fund, Dividend Growth Fund, International Growth Fund, Evolving World GrowthFund, Emerging Market Equity Fund, Global Equity Fund, Growth and Income Fund, Global Growth and Income Fund, ConvertibleFund, Global Convertible Fund, Total Return Bond Fund, High Income Opportunities Fund (formerly, High Income Fund), MarketNeutral Income Fund, Hedged Equity Income Fund, and Phineus Long/Short Fund, (each a “Fund” and collectively the “Funds”). TheTrust is registered under the Investment Company Act of 1940 as amended (the “1940 Act”) as an open-end managementinvestment company. The Fund is considered an investment company under U.S. GAAP and follows the accounting and reportingguidance applicable to investment companies. The Trust currently offers Class A, Class C, Class I, Class R and Class T shares of each ofthe Funds. Class T shares are not currently available for purchase.
Significant Accounting Policies. The financial statements have been prepared in conformity with accounting principles generallyaccepted in the United States of America (U.S. GAAP), and the Funds’ are each considered an investment company under U.S. GAAPand follow the accounting and reporting guidance applicable to investment companies. The Funds adhere to the accounting andreporting requirements set forth in ASU 2013-08 and ASC 946. Under U.S. GAAP, management is required to make certain estimatesand assumptions at the date of the financial statements and actual results may differ from those estimates. Subsequent events, if any,through the date that the financial statements were issued, have been evaluated in the preparation of the financial statements. Thefollowing summarizes the significant accounting policies of the Funds:
Fund Valuation. The valuation of the Funds’ investments is in accordance with policies and procedures adopted by and under theultimate supervision of the board of trustees.
Fund securities that are traded on U.S. securities exchanges, except option securities, are valued at the official closing price, which isthe last current reported sales price on its principal exchange at the time each Fund determines its net asset value (“NAV”). Securitiestraded in the over-the-counter market and quoted on The NASDAQ Stock Market are valued at the NASDAQ Official Closing Price, asdetermined by NASDAQ, or lacking a NASDAQ Official Closing Price, the last current reported sale price on NASDAQ at the time aFund determines its NAV. When a last sale or closing price is not available, equity securities, other than option securities, that aretraded on a U.S. securities exchange and other equity securities traded in the over-the-counter market are valued at the meanbetween the most recent bid and asked quotations on its principal exchange in accordance with guidelines adopted by the board oftrustees. Each option security traded on a U.S. securities exchange is valued at the mid-point of the consolidated bid/ask quote for theoption security, also in accordance with guidelines adopted by the board of trustees. Each over-the-counter option that is not tradedthrough the Options Clearing Corporation is valued based on a quotation provided by the counterparty to such option under theultimate supervision of the board of trustees.
Fixed income securities, certain convertible preferred securities, and non-exchange traded derivatives are normally valued byindependent pricing services or by dealers or brokers who make markets in such securities. Valuations of such fixed income securities,certain convertible preferred securities and non-exchange traded derivatives consider yield or price of equivalent securities ofcomparable quality, coupon rate, maturity, type of issue, trading characteristics and other market data and do not rely exclusivelyupon exchange or over-the-counter prices.
Trading on European and Far Eastern exchanges and over-the-counter markets is typically completed at various times before the closeof business on each day on which the New York Stock Exchange (“NYSE”) is open. Each security trading on these exchanges or inover-the-counter markets may be valued utilizing a systematic fair valuation model provided by an independent pricing serviceapproved by the board of trustees. The valuation of each security that meets certain criteria in relation to the valuation model issystematically adjusted to reflect the impact of movement in the U.S. market after the foreign markets close. Securities that do notmeet the criteria, or that are principally traded in other foreign markets, are valued as of the last reported sale price at the time therespective Fund determines its NAV, or when reliable market prices or quotations are not readily available, at the mean between themost recent bid and asked quotations as of the close of the appropriate exchange or other designated time. Trading of foreignsecurities may not take place on every NYSE business day. In addition, trading may take place in various foreign markets on Saturdaysor on other days when the NYSE is not open and on which the respective Fund’s NAV is not calculated.
146 CALAMOS OPEN-END FAMILY OF FUNDS ANNUAL REPORT
Notes to Financial Statements
If the pricing committee determines that the valuation of a security in accordance with the methods described above is not reflectiveof a fair value for such security, the security is valued at a fair value by the pricing committee, under the ultimate supervision of theboard of trustees, following the guidelines and/or procedures adopted by the board of trustees.
Each Fund also may use fair value pricing, pursuant to guidelines adopted by the board of trustees and under the ultimate supervisionof the board of trustees, if trading in the security is halted or if the value of a security it holds is materially affected by eventsoccurring before the Fund’s pricing time but after the close of the primary market or exchange on which the security is listed. Thoseprocedures may utilize valuations furnished by pricing services approved by the board of trustees, which may be based on markettransactions for comparable securities and various relationships between securities that are generally recognized by institutionaltraders, a computerized matrix system, or appraisals derived from information concerning the securities or similar securities receivedfrom recognized dealers in those securities.
When fair value pricing of securities is employed, the prices of securities used by the Fund to calculate its NAV may differ from marketquotations or official closing prices. In light of the judgment involved in fair valuations, there can be no assurance that a fair valueassigned to a particular security is accurate.
Investment Transactions. Investment transactions are recorded on a trade date basis as of October 31, 2017. Net realized gainsand losses from investment transactions are reported on an identified cost basis. Interest income is recognized using the accrualmethod and includes accretion of original issue and market discount and amortization of premium. Dividend income is recognized onthe ex-dividend date, except that certain dividends from foreign securities are recorded as soon as the information becomes availableafter the ex-dividend date.
Foreign Currency Translation. Values of investments and other assets and liabilities denominated in foreign currencies are trans-lated into U.S. dollars using a rate quoted by a major bank or dealer in the particular currency market, as reported by a recognizedquotation dissemination service.
The Funds do not isolate that portion of the results of operations resulting from changes in foreign exchange rates on investmentsfrom the fluctuations arising from changes in market prices of securities held. Such fluctuations are included with the net realized andunrealized gain or loss from investments.
Reported net realized foreign currency gains or losses arise from disposition of foreign currency, the difference in the foreignexchange rates between the trade and settlement dates on securities transactions, and the difference between the amounts ofdividends, interest and foreign withholding taxes recorded on the ex-date or accrual date and the U.S. dollar equivalent of theamounts actually received or paid. Net unrealized foreign exchange gains and losses arise from changes (due to the changes in theexchange rate) in the value of foreign currency and other assets and liabilities denominated in foreign currencies held at year end.
Allocation of Expenses Among Funds and Classes. Expenses directly attributable to a Fund are charged to that Fund; certain othercommon expenses of the Trust, Calamos Advisors Trust, Calamos Convertible Opportunities and Income Fund, Calamos Convertible andHigh Income Fund, Calamos Strategic Total Return Fund, Calamos Global Total Return Fund, Calamos Global Dynamic Income Fund andCalamos Dynamic Convertible and Income Fund are allocated proportionately among each Fund to which the expenses relate in relationto the net assets of each Fund or on another reasonable basis. Expenses directly attributable to a particular class of a fund in the Trust arecharged directly to such class. In calculating the net asset value per share of each class, investment income, realized and unrealized gainsand losses and expenses other than class specific expenses are allocated daily to each class of shares based upon the proportion of netassets of each class at the beginning of each day plus current day fund share activity.
Income Taxes. No provision has been made for U.S. income taxes because the Trust’s policy is to continue to qualify as a regulatedinvestment company under the Internal Revenue Code of 1986, as amended, and distribute to shareholders substantially all of theFunds’ taxable income and net realized gains.
Dividends and distributions paid to shareholders are recorded on the ex-dividend date. The amount of dividends and distributionsfrom net investment income and net realized capital gains is determined in accordance with federal income tax regulations, whichmay differ from U.S. generally accepted accounting principles. To the extent these “book/tax” differences are permanent in nature,such amounts are reclassified within the capital accounts based on their federal tax-basis treatment. These differences are primarilydue to differing treatments for foreign currency transactions, contingent payment debt instruments and methods of amortizing andaccreting for fixed income securities. The financial statements are not adjusted for temporary differences.
www.calamos.com 147
Notes to Financial Statements
The Funds recognized no liabilities for uncertain tax positions. A reconciliation is not provided as the beginning and ending amountsof unrecognized benefits are zero, with no interim additions, reductions or settlements. Tax years 2013 – 2016 remain subject toexamination by the U.S. and the State of Illinois tax jurisdictions for those Funds that have been in existence during that time, and forall years since inception for those Funds created subsequent to October 31, 2012.
Indemnifications. Under the Trust’s organizational documents, the Trust is obligated to indemnify its officers and trustees againstcertain liabilities incurred by them by reason of having been an officer or trustee of the Trust. In addition, in the normal course ofbusiness, the Trust may enter into contracts that provide general indemnifications to other parties. Each Fund’s maximum exposureunder these arrangements is unknown as this would involve future claims that may be made against the Fund that have not yetoccurred. Currently, the Funds’ management expects the risk of material loss in connection to a potential claim to be remote.
Note 2 – Investment Adviser and Transactions With Affiliates Or Certain Other PartiesPursuant to an investment advisory agreement with Calamos Advisors LLC (“Calamos Advisors”), each Fund pays a monthlyinvestment advisory fee based on the average daily net assets of the Fund, as shown below:
AVERAGE DAILY NET ASSETSGROWTH FUNDANNUAL RATE
EVOLVING WORLDGROWTH FUND,
EMERGING MARKETEQUITY FUNDANNUAL RATE
TOTAL RETURNBOND FUND
ANNUAL RATE
OPPORTUNISTIC VALUE FUND,DIVIDEND GROWTH FUND,
INTERNATIONAL GROWTH FUND*,GLOBAL EQUITY FUND*,
GLOBAL GROWTH AND INCOME FUNDANNUAL RATE
First $500 million 1.00% 1.10% 0.45% 1.00%
Next $500 million 0.90% 1.05% 0.43% 0.95%
Next $5 billion 0.80% 1.00% 0.41% 0.90%
Next $5 billion 0.78% 0.98% 0.39% 0.88%
Next $5 billion 0.76% 0.96% 0.38% 0.86%
Next $5 billion 0.74% 0.94% 0.37% 0.84%
Next $5 billion 0.72% 0.92% 0.36% 0.82%
Over $26 billion 0.70% 0.90% 0.35% 0.80%
* International Growth Fund and Global Equity Fund are subject to a possible adjustment based on performance as described below.
AVERAGE DAILY NET ASSETSGLOBAL CONVERTIBLEFUND ANNUAL RATE
GROWTH AND INCOME FUND,CONVERTIBLE FUND,
MARKET NEUTRAL INCOME FUND,HEDGED EQUITY INCOME FUND
ANNUAL RATE
HIGH INCOMEOPPORTUNITIES
FUNDANNUAL RATE
PHINEUSLONG/SHORT FUND
ANNUAL RATE
First $500 million 0.85% 0.75% 0.60% 1.25%
Next $500 million 0.80% 0.70% 0.55% 1.20%
Over $1 billion 0.75% 0.65% 0.50% 1.15%
148 CALAMOS OPEN-END FAMILY OF FUNDS ANNUAL REPORT

Notes to Financial Statements
The average investment advisory fee for the year ended October 31, 2017 was as follows:
FUND PERCENTAGE
Growth Fund 0.89%Opportunistic Value Fund 1.00Dividend Growth Fund 1.00International Growth Fund 0.94Evolving World Growth Fund 1.10Emerging Market Equity Fund 1.10Global Equity Fund 0.98Growth and Income Fund 0.69Global Growth and Income Fund 1.00Convertible Fund 0.74Global Convertible Fund 0.85Total Return Bond Fund 0.51High Income Opportunities Fund 0.70Market Neutral Income Fund 0.67Hedged Equity Income Fund 0.75Phineus Long/Short Fund 1.25
Each of the International Growth and Global Equity Funds pays a fee based on average daily net assets of the Fund that is accrueddaily and paid on a monthly basis, subject to possible adjustment based on the Fund’s investment performance (since March 2006 forInternational Growth Fund and since February 2008 for Global Equity Fund). The performance adjustment increases or decreases themanagement fee, on a monthly basis, by 1/12 of 0.03% of a Fund’s average daily net assets over the performance period for eachfull 1% increment amount by which a Fund outperforms or underperforms the benchmark index (“Index”), on an annualized basis,over the performance measurement period. The benchmark indexes are the MSCI EAFE Growth Index and the MSCI World Index forthe International Growth Fund and Global Equity Fund, respectively.
The base fee is shown in the table above. The performance adjustment rate is calculated by comparing over the performancemeasurement period the Fund’s Class A share performance to that of the respective Index. The performance measurement periodcommenced at the beginning of each Fund’s first full month of operation (April 2005 and March 2007 for the International GrowthFund and Global Equity Fund, respectively). The first performance adjustment was applied to the advisory fee at the end of thetwelfth month. Each month subsequent to the twelfth month, a new month is added to the performance measurement period untilthe performance measurement period includes 36 months. Thereafter, the performance measurement period consists of the mostrecent month plus the previous 35 months.
The performance comparison is made at the end of each month. The maximum annualized performance adjustment rate is+/- 0.30% of the Fund’s average daily net assets over the performance measurement period. The performance adjustment rate isdivided by twelve and multiplied by the Fund’s average daily net assets over the performance measurement period, and the resultingdollar amount is then added to or subtracted from the base fee. Calamos Advisors may receive a positive performance adjustmenteven if the Fund has a negative return over a performance measurement period if it otherwise outperforms the Index during thatperiod.
Pursuant to a financial accounting services agreement, during the year the Fund paid Calamos Advisors a fee for financial accountingservices payable monthly at the annual rate of 0.0175% on the first $1 billion of combined assets, 0.0150% on the next $1 billion ofcombined assets and 0.0110% on combined assets above $2 billion (for purposes of this calculation “combined assets” means thesum of the total average daily net assets of Calamos Investment Trust and Calamos Advisors Trust and the total average weeklymanaged assets of Calamos Convertible and High Income Fund, Calamos Strategic Total Return Fund, Calamos Convertible Oppor-tunities and Income Fund, Calamos Global Total Return Fund, Calamos Global Dynamic Income Fund and Calamos DynamicConvertible and Income Fund). Financial accounting services include, but are not limited to, the following: managing expenses andexpense payment processing; monitoring the calculation of expense accrual amounts; calculating, tracking and reporting tax
www.calamos.com 149

Notes to Financial Statements
adjustments on all assets; and monitoring trustee deferred compensation plan accruals and valuations. The Funds pay their pro ratashare of the financial accounting services fee payable to Calamos Advisors based on their relative portion of combined assets used incalculating the fee.
The Funds reimburses Calamos Advisors for a portion of compensation paid to the Trust’s Chief Compliance Officer. Thiscompensation is reported as part of the “Trustees’ fees and officer compensation” expense on the Statements of Operations.
Calamos Advisors has contractually agreed to limit the annual ordinary operating expenses of each Fund as a percentage of theaverage daily net assets as follows:
FUNDCLASS ASHARES
CLASS CSHARES
CLASS ISHARES
CLASS RSHARES
CLASS TSHARES
Growth Fund 1.75% 2.50% 1.50% 2.00% 1.75%Opportunistic Value Fund 1.15% 1.90% 0.90% 1.40% 1.15%Dividend Growth Fund 1.35% 2.10% 1.10% 1.60% 1.35%International Growth Fund 1.40% 2.15% 1.15% 1.65% 1.40%Evolving World Growth Fund 1.75% 2.50% 1.50% 2.00% 1.75%Emerging Market Equity Fund 1.75% 2.50% 1.50% — 1.75%Global Equity Fund 1.40% 2.15% 1.15% 1.65% 1.40%Growth and Income Fund 1.75% 2.50% 1.50% 2.00% 1.75%Global Growth and Income Fund 1.75% 2.50% 1.50% 2.00% 1.75%Convertible Fund 1.75% 2.50% 1.50% 2.00% 1.75%Global Convertible Fund 1.35% 2.10% 1.10% 1.60% 1.35%Total Return Bond Fund 0.90% 1.65% 0.65% 1.15% 0.90%High Income Opportunities Fund 1.00% 1.75% 0.75% 1.25% 1.00%Market Neutral Income Fund 1.75% 2.50% 1.50% 2.00% 1.75%Hedged Equity Income Fund 1.25% 2.00% 1.00% — 1.25%Phineus Long/Short Fund 2.00% 2.75% 1.75% — 2.00%
These agreements are binding on Calamos Advisors through July 31, 2018.
For the year ended October 31, 2017, Calamos Advisors waived or absorbed the following expenses:
FUND AMOUNT
Opportunistic Value Fund $288,049Dividend Growth Fund 181,860International Growth Fund 184,442Emerging Market Equity Fund 137,430Global Equity Fund 155,398Global Convertible Fund 70,951Total Return Bond Fund 198,208High Income Opportunities Fund 92,395Hedged Equity Income Fund 155,128
These amounts are included in the Statements of Operations under the caption “Expense reductions”.
As Distributor, Calamos Financial Services LLC (“CFS”) assumed all expenses of personnel, office space, office facilities and equipmentincidental to such service. Each Fund has adopted a Distribution Plan pursuant to Rule 12b-1 under the 1940 Act whereby the Fundpays to CFS a distribution and/or service fee at the annual rate of 0.25% of the average daily net assets of the Fund’s Class A shares;a service fee at the annual rate of 0.25% and a distribution fee at the rate of 0.75% of the average daily net assets of the Fund’sClass B and Class C shares; a service fee at the annual rate of 0.25% and a distribution fee of 0.25% of the average daily net assetsof the Fund’s Class R shares; and a distribution fee at the annual rate of 0.25% of the average daily net assets of the Fund’s Class Tshares. No such fees are paid on each Fund’s Class I shares.
150 CALAMOS OPEN-END FAMILY OF FUNDS ANNUAL REPORT

Notes to Financial Statements
CFS also receives a sales commission and/or an underwriting fee on certain sales of each Fund’s Class A shares. During the year endedOctober 31, 2017, CFS received commissions and underwriting fees as follows:
FUND AMOUNT
Growth Fund $ 39,058Opportunistic Value Fund 1,111Dividend Growth Fund 308International Growth Fund 2,420Evolving World Growth Fund 3,845Emerging Market Equity Fund 8Global Equity Fund 1,329Growth and Income Fund 61,952Global Growth and Income Fund 13,134Convertible Fund 13,963Global Convertible Fund 1,315Total Return Bond Fund 769High Income Opportunities Fund 1,561Market Neutral Income Fund 50,210Hedged Equity Income Fund 1,270Phineus Long/Short Fund 135,454
A trustee and certain officers of the Trust are also officers and directors of CFS and Calamos Advisors. Such trustee and officers servewithout direct compensation from the Trust. The Trust’s Statement of Additional Information contains additional information aboutthe Trust’s Trustees and Officers and is available without charge, upon request, at www.calamos.com or by calling 800.582.6959.
As of October 31, 2017, certain affiliates of Calamos Advisors hold material investments in the Funds as follows:
FUND PERCENTAGE
Opportunistic Value Fund 34%Emerging Market Equity Fund 89Hedged Equity Income Fund 39
The Trust has adopted a deferred compensation plan (the “Plan”). Under the Plan, a trustee who is not an “interested person” (asdefined in the 1940 Act) and has elected to participate in the Plan (a “participating trustee”) may defer receipt of all or a portion ofhis compensation from the Trust. The deferred compensation payable to the participating trustee is credited to the trustee’s deferralaccount as of the business day such compensation would have been paid to the participating trustee. The value of amounts deferredfor a participating trustee is determined by reference to the change in value of Class I shares of one or more funds of the Trustdesignated by the participant. The value of the account increases with contributions to the account or with increases in the value ofthe measuring shares, and the value of the account decreases with withdrawals from the account or with declines in the value of themeasuring shares.
www.calamos.com 151

Notes to Financial Statements
At October 31, 2017, the Funds had deferred compensation balances, which are included in “Other assets” on the Statements ofAssets and Liabilities, as follows:
FUND AMOUNT
Growth Fund $712,280Opportunistic Value Fund 107,226Dividend Growth Fund 11,911International Growth Fund 104,698Evolving World Growth Fund 74,934Emerging Market Equity Fund 11,908Global Equity Fund 79,909Growth and Income Fund 334,936Global Growth and Income Fund 151,860Convertible Fund 191,888Global Convertible Fund 5,471Total Return Bond Fund 81,170High Income Opportunities Fund 115,417Market Neutral Income Fund 205,553Hedged Equity Income Fund 5,326Phineus Long/Short Fund 29,980
Each Fund’s obligation to make payments under the Plan is a general obligation of the Fund and is included in “Payable for deferredcompensation to trustees” on the Statements of Assets and Liabilities at October 31, 2017.
Note 3 – InvestmentsThe cost of purchases and proceeds from sales of long-term investments for the year ended October 31, 2017 were as follows:
COST OF PURCHASES PROCEEDS FROM SALES
FUNDU.S. GOV’TSECURITIES OTHER
U.S. GOV’TSECURITIES OTHER
Growth Fund $ — $1,762,196,009 $ — $2,412,908,681Opportunistic Value Fund — 57,395,861 — 75,822,433Dividend Growth Fund — 4,465,333 — 22,192,061International Growth Fund — 293,667,950 — 472,101,239Evolving World Growth Fund — 339,122,763 — 457,198,917Emerging Market Equity Fund — 15,186,231 — 15,911,407Global Equity Fund — 126,485,503 — 167,992,229Growth and Income Fund 5,278,711 639,336,306 — 1,291,297,617Global Growth and Income Fund 6,658,898 224,635,316 2,231,682 350,526,648Convertible Fund — 330,308,158 — 501,197,530Global Convertible Fund 9,468,757 47,253,355 — 41,885,922Total Return Bond Fund 33,171,514 30,700,418 13,181,699 77,137,648High Income Opportunities Fund — 58,301,352 — 76,217,448Market Neutral Income Fund — 4,847,146,431 — 4,662,161,761Hedged Equity Income Fund — 8,039,129 — 15,797,143Phineus Long/Short Fund — 691,978,823 — 614,104,161
The following information is presented on a federal income tax basis as of October 31, 2017. Differences between the cost basisunder U.S. generally accepted accounting principles and federal income tax purposes are primarily due to temporary differences.
152 CALAMOS OPEN-END FAMILY OF FUNDS ANNUAL REPORT
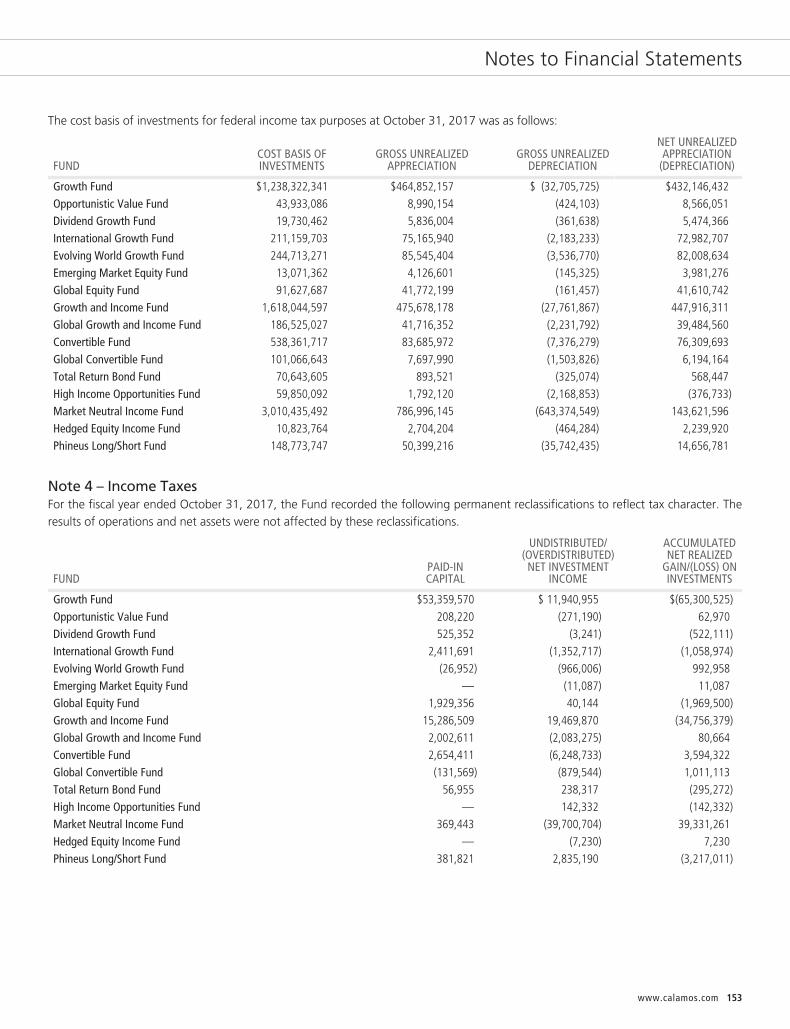
Notes to Financial Statements
The cost basis of investments for federal income tax purposes at October 31, 2017 was as follows:
FUNDCOST BASIS OFINVESTMENTS
GROSS UNREALIZEDAPPRECIATION
GROSS UNREALIZEDDEPRECIATION
NET UNREALIZEDAPPRECIATION
(DEPRECIATION)
Growth Fund $1,238,322,341 $464,852,157 $ (32,705,725) $432,146,432Opportunistic Value Fund 43,933,086 8,990,154 (424,103) 8,566,051Dividend Growth Fund 19,730,462 5,836,004 (361,638) 5,474,366International Growth Fund 211,159,703 75,165,940 (2,183,233) 72,982,707Evolving World Growth Fund 244,713,271 85,545,404 (3,536,770) 82,008,634Emerging Market Equity Fund 13,071,362 4,126,601 (145,325) 3,981,276Global Equity Fund 91,627,687 41,772,199 (161,457) 41,610,742Growth and Income Fund 1,618,044,597 475,678,178 (27,761,867) 447,916,311Global Growth and Income Fund 186,525,027 41,716,352 (2,231,792) 39,484,560Convertible Fund 538,361,717 83,685,972 (7,376,279) 76,309,693Global Convertible Fund 101,066,643 7,697,990 (1,503,826) 6,194,164Total Return Bond Fund 70,643,605 893,521 (325,074) 568,447High Income Opportunities Fund 59,850,092 1,792,120 (2,168,853) (376,733)Market Neutral Income Fund 3,010,435,492 786,996,145 (643,374,549) 143,621,596Hedged Equity Income Fund 10,823,764 2,704,204 (464,284) 2,239,920Phineus Long/Short Fund 148,773,747 50,399,216 (35,742,435) 14,656,781
Note 4 – Income TaxesFor the fiscal year ended October 31, 2017, the Fund recorded the following permanent reclassifications to reflect tax character. Theresults of operations and net assets were not affected by these reclassifications.
FUNDPAID-INCAPITAL
UNDISTRIBUTED/(OVERDISTRIBUTED)NET INVESTMENT
INCOME
ACCUMULATEDNET REALIZED
GAIN/(LOSS) ONINVESTMENTS
Growth Fund $53,359,570 $ 11,940,955 $(65,300,525)Opportunistic Value Fund 208,220 (271,190) 62,970Dividend Growth Fund 525,352 (3,241) (522,111)International Growth Fund 2,411,691 (1,352,717) (1,058,974)Evolving World Growth Fund (26,952) (966,006) 992,958Emerging Market Equity Fund — (11,087) 11,087Global Equity Fund 1,929,356 40,144 (1,969,500)Growth and Income Fund 15,286,509 19,469,870 (34,756,379)Global Growth and Income Fund 2,002,611 (2,083,275) 80,664Convertible Fund 2,654,411 (6,248,733) 3,594,322Global Convertible Fund (131,569) (879,544) 1,011,113Total Return Bond Fund 56,955 238,317 (295,272)High Income Opportunities Fund — 142,332 (142,332)Market Neutral Income Fund 369,443 (39,700,704) 39,331,261Hedged Equity Income Fund — (7,230) 7,230Phineus Long/Short Fund 381,821 2,835,190 (3,217,011)
www.calamos.com 153
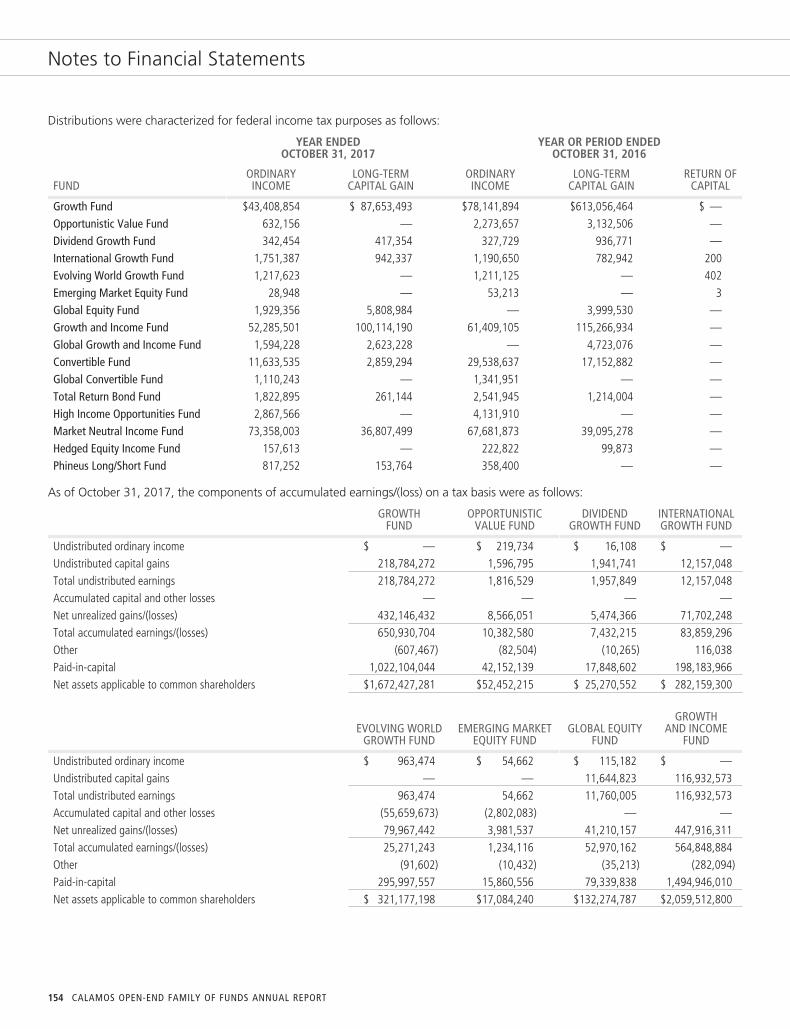
Notes to Financial Statements
Distributions were characterized for federal income tax purposes as follows:
YEAR ENDEDOCTOBER 31, 2017
YEAR OR PERIOD ENDEDOCTOBER 31, 2016
FUNDORDINARYINCOME
LONG-TERMCAPITAL GAIN
ORDINARYINCOME
LONG-TERMCAPITAL GAIN
RETURN OFCAPITAL
Growth Fund $43,408,854 $ 87,653,493 $78,141,894 $613,056,464 $ —Opportunistic Value Fund 632,156 — 2,273,657 3,132,506 —Dividend Growth Fund 342,454 417,354 327,729 936,771 —International Growth Fund 1,751,387 942,337 1,190,650 782,942 200Evolving World Growth Fund 1,217,623 — 1,211,125 — 402Emerging Market Equity Fund 28,948 — 53,213 — 3Global Equity Fund 1,929,356 5,808,984 — 3,999,530 —Growth and Income Fund 52,285,501 100,114,190 61,409,105 115,266,934 —Global Growth and Income Fund 1,594,228 2,623,228 — 4,723,076 —Convertible Fund 11,633,535 2,859,294 29,538,637 17,152,882 —Global Convertible Fund 1,110,243 — 1,341,951 — —Total Return Bond Fund 1,822,895 261,144 2,541,945 1,214,004 —High Income Opportunities Fund 2,867,566 — 4,131,910 — —Market Neutral Income Fund 73,358,003 36,807,499 67,681,873 39,095,278 —Hedged Equity Income Fund 157,613 — 222,822 99,873 —Phineus Long/Short Fund 817,252 153,764 358,400 — —
As of October 31, 2017, the components of accumulated earnings/(loss) on a tax basis were as follows:
GROWTHFUND
OPPORTUNISTICVALUE FUND
DIVIDENDGROWTH FUND
INTERNATIONALGROWTH FUND
Undistributed ordinary income $ — $ 219,734 $ 16,108 $ —Undistributed capital gains 218,784,272 1,596,795 1,941,741 12,157,048Total undistributed earnings 218,784,272 1,816,529 1,957,849 12,157,048Accumulated capital and other losses — — — —Net unrealized gains/(losses) 432,146,432 8,566,051 5,474,366 71,702,248Total accumulated earnings/(losses) 650,930,704 10,382,580 7,432,215 83,859,296Other (607,467) (82,504) (10,265) 116,038Paid-in-capital 1,022,104,044 42,152,139 17,848,602 198,183,966Net assets applicable to common shareholders $1,672,427,281 $52,452,215 $ 25,270,552 $ 282,159,300
EVOLVING WORLDGROWTH FUND
EMERGING MARKETEQUITY FUND
GLOBAL EQUITYFUND
GROWTHAND INCOME
FUND
Undistributed ordinary income $ 963,474 $ 54,662 $ 115,182 $ —Undistributed capital gains — — 11,644,823 116,932,573Total undistributed earnings 963,474 54,662 11,760,005 116,932,573Accumulated capital and other losses (55,659,673) (2,802,083) — —Net unrealized gains/(losses) 79,967,442 3,981,537 41,210,157 447,916,311Total accumulated earnings/(losses) 25,271,243 1,234,116 52,970,162 564,848,884Other (91,602) (10,432) (35,213) (282,094)Paid-in-capital 295,997,557 15,860,556 79,339,838 1,494,946,010Net assets applicable to common shareholders $ 321,177,198 $17,084,240 $132,274,787 $2,059,512,800
154 CALAMOS OPEN-END FAMILY OF FUNDS ANNUAL REPORT
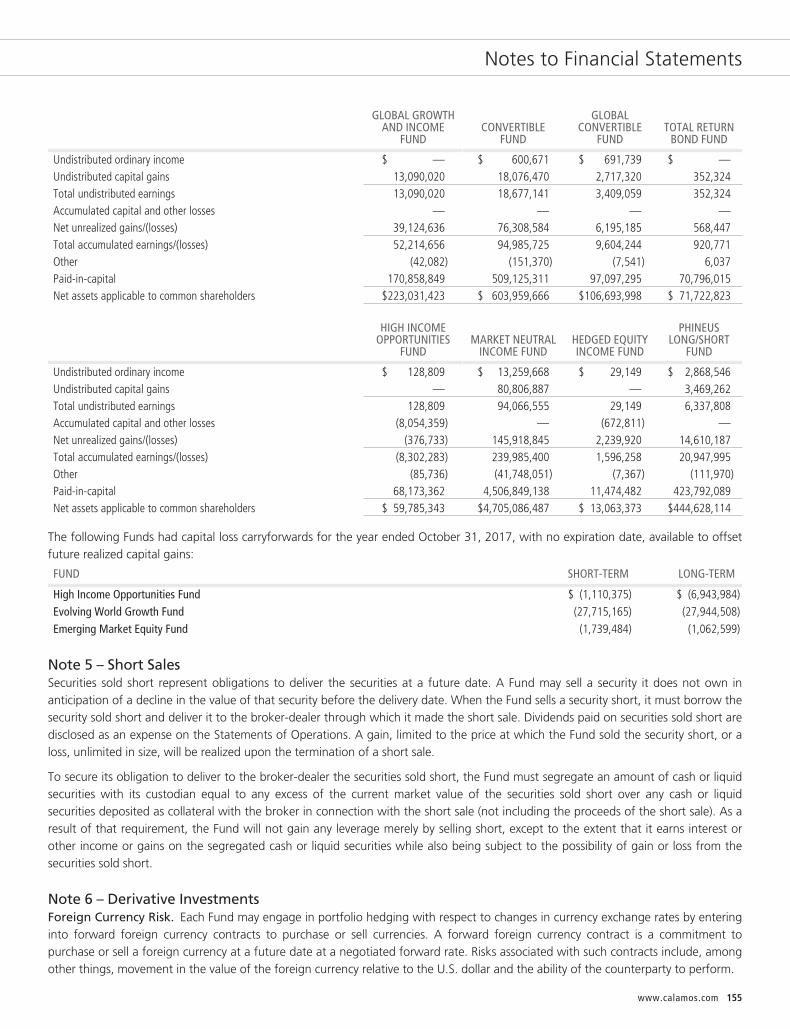
Notes to Financial Statements
GLOBAL GROWTHAND INCOME
FUNDCONVERTIBLE
FUND
GLOBALCONVERTIBLE
FUNDTOTAL RETURN
BOND FUND
Undistributed ordinary income $ — $ 600,671 $ 691,739 $ —Undistributed capital gains 13,090,020 18,076,470 2,717,320 352,324Total undistributed earnings 13,090,020 18,677,141 3,409,059 352,324Accumulated capital and other losses — — — —Net unrealized gains/(losses) 39,124,636 76,308,584 6,195,185 568,447Total accumulated earnings/(losses) 52,214,656 94,985,725 9,604,244 920,771Other (42,082) (151,370) (7,541) 6,037Paid-in-capital 170,858,849 509,125,311 97,097,295 70,796,015Net assets applicable to common shareholders $223,031,423 $ 603,959,666 $106,693,998 $ 71,722,823
HIGH INCOMEOPPORTUNITIES
FUNDMARKET NEUTRAL
INCOME FUNDHEDGED EQUITYINCOME FUND
PHINEUSLONG/SHORT
FUND
Undistributed ordinary income $ 128,809 $ 13,259,668 $ 29,149 $ 2,868,546Undistributed capital gains — 80,806,887 — 3,469,262Total undistributed earnings 128,809 94,066,555 29,149 6,337,808Accumulated capital and other losses (8,054,359) — (672,811) —Net unrealized gains/(losses) (376,733) 145,918,845 2,239,920 14,610,187Total accumulated earnings/(losses) (8,302,283) 239,985,400 1,596,258 20,947,995Other (85,736) (41,748,051) (7,367) (111,970)Paid-in-capital 68,173,362 4,506,849,138 11,474,482 423,792,089Net assets applicable to common shareholders $ 59,785,343 $4,705,086,487 $ 13,063,373 $444,628,114
The following Funds had capital loss carryforwards for the year ended October 31, 2017, with no expiration date, available to offsetfuture realized capital gains:
FUND SHORT-TERM LONG-TERM
High Income Opportunities Fund $ (1,110,375) $ (6,943,984)Evolving World Growth Fund (27,715,165) (27,944,508)Emerging Market Equity Fund (1,739,484) (1,062,599)
Note 5 – Short SalesSecurities sold short represent obligations to deliver the securities at a future date. A Fund may sell a security it does not own inanticipation of a decline in the value of that security before the delivery date. When the Fund sells a security short, it must borrow thesecurity sold short and deliver it to the broker-dealer through which it made the short sale. Dividends paid on securities sold short aredisclosed as an expense on the Statements of Operations. A gain, limited to the price at which the Fund sold the security short, or aloss, unlimited in size, will be realized upon the termination of a short sale.
To secure its obligation to deliver to the broker-dealer the securities sold short, the Fund must segregate an amount of cash or liquidsecurities with its custodian equal to any excess of the current market value of the securities sold short over any cash or liquidsecurities deposited as collateral with the broker in connection with the short sale (not including the proceeds of the short sale). As aresult of that requirement, the Fund will not gain any leverage merely by selling short, except to the extent that it earns interest orother income or gains on the segregated cash or liquid securities while also being subject to the possibility of gain or loss from thesecurities sold short.
Note 6 – Derivative InvestmentsForeign Currency Risk. Each Fund may engage in portfolio hedging with respect to changes in currency exchange rates by enteringinto forward foreign currency contracts to purchase or sell currencies. A forward foreign currency contract is a commitment topurchase or sell a foreign currency at a future date at a negotiated forward rate. Risks associated with such contracts include, amongother things, movement in the value of the foreign currency relative to the U.S. dollar and the ability of the counterparty to perform.
www.calamos.com 155
Notes to Financial Statements
To mitigate the counterparty risk, the Fund may enter into an International Swaps and Derivatives Association, Inc. Master Agreement(“ISDA Master Agreement”) or similar agreement with its derivative contract counterparties. An ISDA Master Agreement is a bilateralagreement between the Fund and a counterparty that governs over-the-counter derivatives and foreign exchange contracts andtypically contains, among other things, collateral posting terms and netting provisions in the event of a default and/or terminationevent. Under an ISDA Master Agreement, the Fund may, under certain circumstances, offset with the counterparty certain derivativefinancial instrument’s payables and/or receivables with collateral held and/or posted and create one single net payment. The provi-sions of the ISDA Master Agreement typically permit a single net payment in the event of default (close-out netting) including thebankruptcy or insolvency of the counterparty. Generally, collateral is exchanged between the Fund and the counterparty and theamount of collateral due from the Fund or to a counterparty has to exceed a minimum transfer amount threshold before a transferhas to be made. To the extent amounts due to the Fund from its counterparties are not fully collateralized, contractually or otherwise,the Fund bears the risk of loss from counterparty nonperformance. When a Fund is required to post collateral under the terms of aderivatives transaction and master netting agreement, the Fund’s custodian holds the collateral in a segregated account, subject tothe terms of a tri-party agreement among the Fund, the custodian and the counterparty. The master netting agreement and tri-partyagreement provide, in relevant part, that the counterparty may have rights to the amounts in the segregated account in the eventthat the Fund defaults in its obligation with respect to the derivative instrument that is subject to the collateral requirement. When acounterparty is required to post collateral under the terms of a derivatives transaction and master netting agreement, the counter-party delivers such amount to the Fund’s custodian. The master netting agreement provides, in relevant part, that the Fund may haverights to such collateral in the event that the counterparty defaults in its obligation with respect to the derivative instrument that issubject to the collateral requirement.
For financial reporting purposes, the Funds do not offset derivative assets and derivative liabilities that are subject to nettingarrangements in the Statements of Assets and Liabilities. The Fund’s net counterparty exposure is reflected in the counterparty tablebelow. The net unrealized gain, if any, represents the credit risk to the respective Fund on a forward foreign currency contract. Thecontracts are valued daily at forward foreign exchange rates. The Funds realize a gain or loss when a position is closed or uponsettlement of the contracts. Please see the disclosure regarding ISDA Master Agreements under Foreign Currency Risk within thisnote.
As of October 31, 2017, the Funds had outstanding forward foreign currency contracts listed on the Schedules of Investments.
Equity Risk. Each Fund may engage in option transactions and in doing so achieves similar objectives to what it would achievethrough the sale or purchase of individual securities. A call option, upon payment of a premium, gives the purchaser of the option theright to buy, and the seller of the option the obligation to sell, the underlying security, index or other instrument at the exercise price.A put option gives the purchaser of the option, upon payment of a premium, the right to sell, and the seller the obligation to buy,the underlying security, index, or other instrument at the exercise price.
To seek to offset some of the risk of a potential decline in value of certain long positions, each Fund may also purchase put optionson individual securities, broad-based securities indexes or certain exchange-traded funds (“ETFs”). Each Fund may also seek togenerate income from option premiums by writing (selling) options on a portion of the equity securities (including securities that areconvertible into equity securities) in the Fund’s portfolio, on broad-based securities indexes, or certain ETFs.
When the Fund purchases an option, it pays a premium and an amount equal to that premium is recorded as an asset. When theFund writes an option, it receives a premium and an amount equal to that premium is recorded as a liability. The asset or liability isadjusted daily to reflect the current market value of the option. If an option expires unexercised, the Fund realizes a gain or loss to theextent of the premium received or paid. If an option is exercised, the premium received or paid is recorded as an adjustment to theproceeds from the sale or the cost basis of the purchase. The difference between the premium and the amount received or paid on aclosing purchase or sale transaction is also treated as a realized gain or loss. The cost of securities acquired through the exercise of calloptions is increased by premiums paid. The proceeds from securities sold through the exercise of put options are decreased by thepremiums paid. Gain or loss on written options and purchased options is presented separately as net realized gain or loss on writtenoptions and net realized gain or loss on purchased options, respectively.
Options written by each Fund do not typically give rise to counterparty credit risk since options written obligate each Fund and notthe counterparty to perform. Exchange traded purchased options have minimal counterparty credit risk to each Fund since theexchange’s clearinghouse, as counterparty to such instruments, guarantees against a possible default.
156 CALAMOS OPEN-END FAMILY OF FUNDS ANNUAL REPORT
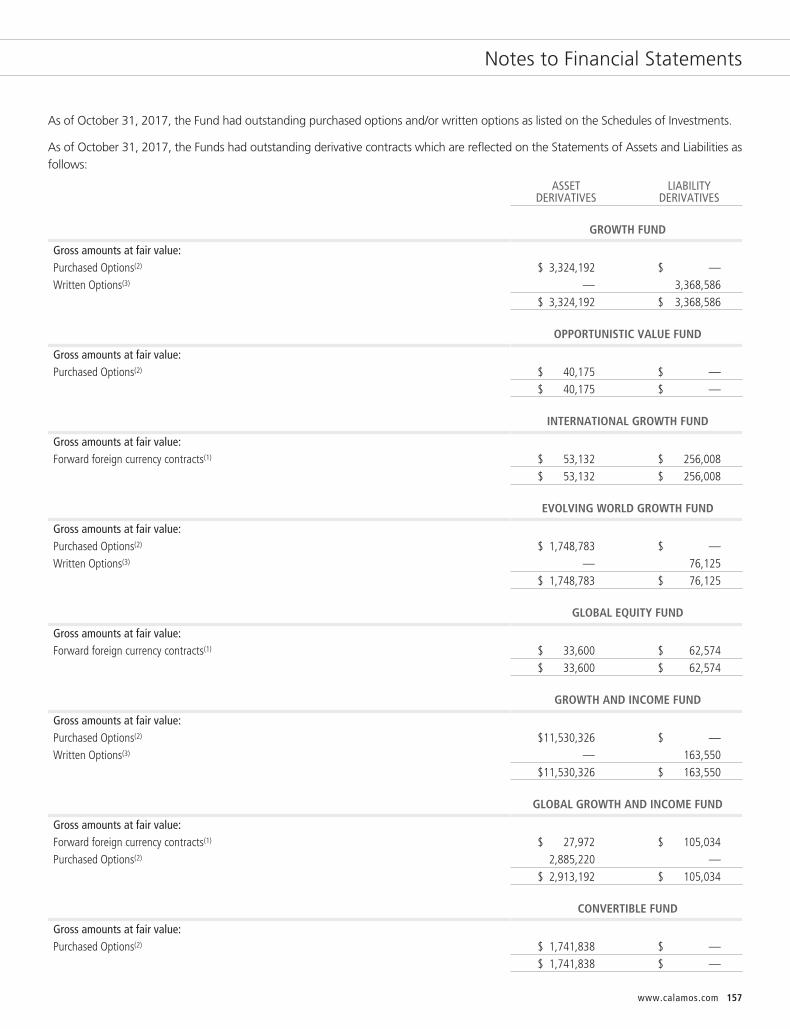
Notes to Financial Statements
As of October 31, 2017, the Fund had outstanding purchased options and/or written options as listed on the Schedules of Investments.
As of October 31, 2017, the Funds had outstanding derivative contracts which are reflected on the Statements of Assets and Liabilities asfollows:
ASSETDERIVATIVES
LIABILITYDERIVATIVES
GROWTH FUND
Gross amounts at fair value:Purchased Options(2) $ 3,324,192 $ —Written Options(3) — 3,368,586
$ 3,324,192 $ 3,368,586
OPPORTUNISTIC VALUE FUND
Gross amounts at fair value:Purchased Options(2) $ 40,175 $ —
$ 40,175 $ —
INTERNATIONAL GROWTH FUND
Gross amounts at fair value:Forward foreign currency contracts(1) $ 53,132 $ 256,008
$ 53,132 $ 256,008
EVOLVING WORLD GROWTH FUND
Gross amounts at fair value:Purchased Options(2) $ 1,748,783 $ —Written Options(3) — 76,125
$ 1,748,783 $ 76,125
GLOBAL EQUITY FUND
Gross amounts at fair value:Forward foreign currency contracts(1) $ 33,600 $ 62,574
$ 33,600 $ 62,574
GROWTH AND INCOME FUND
Gross amounts at fair value:Purchased Options(2) $11,530,326 $ —Written Options(3) — 163,550
$11,530,326 $ 163,550
GLOBAL GROWTH AND INCOME FUND
Gross amounts at fair value:Forward foreign currency contracts(1) $ 27,972 $ 105,034Purchased Options(2) 2,885,220 —
$ 2,913,192 $ 105,034
CONVERTIBLE FUND
Gross amounts at fair value:Purchased Options(2) $ 1,741,838 $ —
$ 1,741,838 $ —
www.calamos.com 157
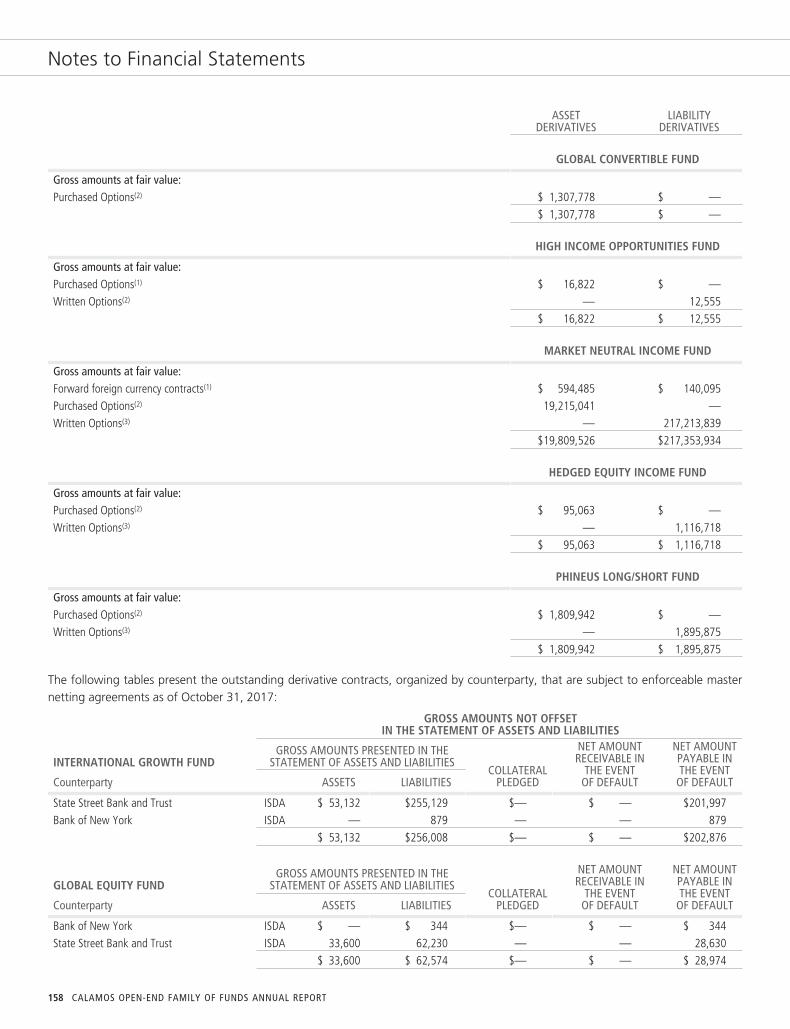
Notes to Financial Statements
ASSETDERIVATIVES
LIABILITYDERIVATIVES
GLOBAL CONVERTIBLE FUND
Gross amounts at fair value:Purchased Options(2) $ 1,307,778 $ —
$ 1,307,778 $ —
HIGH INCOME OPPORTUNITIES FUND
Gross amounts at fair value:Purchased Options(1) $ 16,822 $ —Written Options(2) — 12,555
$ 16,822 $ 12,555
MARKET NEUTRAL INCOME FUND
Gross amounts at fair value:Forward foreign currency contracts(1) $ 594,485 $ 140,095Purchased Options(2) 19,215,041 —Written Options(3) — 217,213,839
$19,809,526 $217,353,934
HEDGED EQUITY INCOME FUND
Gross amounts at fair value:Purchased Options(2) $ 95,063 $ —Written Options(3) — 1,116,718
$ 95,063 $ 1,116,718
PHINEUS LONG/SHORT FUND
Gross amounts at fair value:Purchased Options(2) $ 1,809,942 $ —Written Options(3) — 1,895,875
$ 1,809,942 $ 1,895,875
The following tables present the outstanding derivative contracts, organized by counterparty, that are subject to enforceable masternetting agreements as of October 31, 2017:
GROSS AMOUNTS NOT OFFSETIN THE STATEMENT OF ASSETS AND LIABILITIES
INTERNATIONAL GROWTH FUNDGROSS AMOUNTS PRESENTED IN THE
STATEMENT OF ASSETS AND LIABILITIESCOLLATERAL
PLEDGED
NET AMOUNTRECEIVABLE IN
THE EVENTOF DEFAULT
NET AMOUNTPAYABLE INTHE EVENT
OF DEFAULTCounterparty ASSETS LIABILITIES
State Street Bank and Trust ISDA $ 53,132 $255,129 $— $ — $201,997Bank of New York ISDA — 879 — — 879
$ 53,132 $256,008 $— $ — $202,876
GLOBAL EQUITY FUNDGROSS AMOUNTS PRESENTED IN THE
STATEMENT OF ASSETS AND LIABILITIESCOLLATERAL
PLEDGED
NET AMOUNTRECEIVABLE IN
THE EVENTOF DEFAULT
NET AMOUNTPAYABLE INTHE EVENT
OF DEFAULTCounterparty ASSETS LIABILITIES
Bank of New York ISDA $ — $ 344 $— $ — $ 344State Street Bank and Trust ISDA 33,600 62,230 — — 28,630
$ 33,600 $ 62,574 $— $ — $ 28,974
158 CALAMOS OPEN-END FAMILY OF FUNDS ANNUAL REPORT

Notes to Financial Statements
GROSS AMOUNTS NOT OFFSETIN THE STATEMENT OF ASSETS AND LIABILITIES
GLOBAL GROWTH AND INCOME FUNDGROSS AMOUNTS PRESENTED IN THE
STATEMENT OF ASSETS AND LIABILITIESCOLLATERAL
PLEDGED
NET AMOUNTRECEIVABLE IN
THE EVENTOF DEFAULT
NET AMOUNTPAYABLE INTHE EVENT
OF DEFAULTCounterparty ASSETS LIABILITIES
Bank of New York ISDA $ — $ 1,130 $— $ — $ 1,130State Street Bank and Trust ISDA 27,972 103,904 — — 75,932
$ 27,972 $105,034 $— $ — $ 77,062
MARKET NEUTRAL INCOME FUNDGROSS AMOUNTS PRESENTED IN THE
STATEMENT OF ASSETS AND LIABILITIESCOLLATERAL
PLEDGED
NET AMOUNTRECEIVABLE IN
THE EVENTOF DEFAULT
NET AMOUNTPAYABLE INTHE EVENT
OF DEFAULTCounterparty ASSETS LIABILITIES
Citibank N.A. ISDA $ 17,756 $ — $— $ 17,756 $ —Northern Trust Company ISDA — 140,095 — — 140,095State Street Bank and Trust ISDA 576,729 — — 576,729 —
$594,485 $140,095 $— $594,485 $140,095
For the year ended October 31, 2017, the volume of derivative activity for the Fund is reflected below:*
FUND FORWARD CONTRACTS(1) OPTIONS PURCHASED(2) OPTIONS WRITTEN(3)
Growth Fund — 68,935 86,804Opportunistic Value Fund — 300 230Dividend Growth Fund — — —International Growth Fund 119,436,943 11,905 5,125Evolving World Growth Fund — 85,918 30,606Emerging Market Equity Fund — 136 3Global Equity Fund 71,888,589 4,204 2,265Growth and Income Fund — 120,827 45,710Global Growth and Income Fund 93,723,080 32,308 13,770Convertible Fund 1,936,420 18,550 1,665Global Convertible Fund 940,751 10,594 452Total Return Bond Fund — — —High Income Opportunities Fund — 195 83Market Neutral Income Fund 152,023,943 270,238 168,251Hedged Equity Income Fund — 1,676 802Phineus Long/Short Fund — 241,328 273,909
* Activity during the period is measured by opened number of contracts for options purchased or written and opened foreign currency contracts (measured in notional).
(1) Generally, the Statement of Assets and Liabilities location for Forward contracts is Unrealized appreciation on forward foreign currency contracts for asset derivatives and Unrealizeddepreciation on forward foreign currency contracts for liability derivatives.
(2) Generally, the Statement of Assets and Liabilities location for Options purchased is Investments in securities, at value.
(3) Generally, the Statement of Assets and Liabilities location for Options written is Options written, at value.
Note 7 – Securities LendingThe Funds may loan one or more of their securities to broker-dealers and banks. Any such loan must be secured by collateral in cashor cash equivalents maintained on a current basis in an amount at least equal to the value of the securities loaned by the Funds. TheFunds continue to receive the equivalent of the interest or dividends paid by the issuer on the securities loaned and also receive anadditional return that may be in the form of a fixed fee or a percentage of the collateral. The additional return is disclosed on a netbasis as Securities lending income in the Statement of Operations. Upon receipt of cash or cash equivalent collateral, the Funds’securities lending agent invests the collateral into short term investments following investment guidelines approved by CalamosAdvisors. The Funds record the investment of collateral as an asset and the value of the collateral as a liability on the Statements ofAssets and Liabilities. If the value of the invested collateral declines below the value of the collateral deposited by the borrower, the
www.calamos.com 159

Notes to Financial Statements
Funds will record unrealized depreciation equal to the decline in value of the invested collateral. The Funds will pay reasonable fees topersons unaffiliated with the Funds for services in arranging these loans. The Funds have the right to call a loan and obtain thesecurities loaned at any time. The Funds do not have the right to vote the securities during the existence of the loan but could call theloan in an attempt to permit voting of the securities in certain circumstances. Upon return of the securities loaned, the cash or cashequivalent collateral will be returned to the borrower. In the event of bankruptcy or other default of the borrower, the Funds couldexperience both delays in liquidating the loan collateral or recovering the loaned securities and losses, including (a) possible decline inthe value of the collateral or in the value of the securities loaned during the period while the Funds seek to enforce its rights thereto,(b) possible subnormal levels of income and lack of access to income during this period, and (c) the expenses of enforcing their rights.In an effort to reduce these risks, the Funds’ security lending agent monitors and reports to Calamos Advisors on the creditworthinessof the firms to which a Fund lends securities.
The following table indicates the total amount of securities loaned by asset class, reconciled to the gross liability payable upon returnof the securities loaned by the Funds as of October 31, 2017.
VALUE OF SECURITIESON LOAN TO
BROKER-DEALERSAND BANKS
AMOUNT OF COLLATERAL HELD IN SHORT TERM INVESTMENTSAND RESTRICTED CASH BY ASSET CLASS ON LOAN
EXCESS AMOUNTDUE TO
COUNTERPARTYFUND EQUITY FIXED INCOME TOTAL
Growth Fund $ — $ — $ — $ — $ —Opportunistic Value Fund — — — — —Dividend Growth Fund — — — — —International Growth Fund 5,376,140 5,631,840 — 5,631,840 255,700Evolving World Growth Fund — — — — —Emerging Market Equity Fund — — — — —Global Equity Fund 1,269,404 1,318,664 — 1,318,664 49,260Growth and Income Fund 18,791,180 6,790,806 12,367,594 19,158,400 367,220Global Growth and Income Fund 3,901,564 — 3,914,400 3,914,400 12,836Convertible Fund 21,773,149 — 21,858,000 21,858,000 84,851Global Convertible Fund — — — — —Total Return Bond Fund — — — — —High Income Opportunities Fund 626,187 — 640,600 640,600 14,413Market Neutral Income Fund 2,129,569 — 2,170,780 2,170,780 41,211Hedged Equity Income Fund — — — — —Phineus Long/Short Fund 68,736 72,000 — 72,000 3,264
Note 8 – Fair Value MeasurementsVarious inputs are used to determine the value of the Funds’ investments. These inputs are categorized into three broad levels asfollows:
• Level 1 – Prices are determined using inputs from unadjusted quoted prices from active markets (including securities activelytraded on a securities exchange) for identical assets.
• Level 2 – Prices are determined using significant observable market inputs other than unadjusted quoted prices, includingquoted prices of similar securities, fair value adjustments to quoted foreign securities, interest rates, credit risk, prepaymentspeeds, and other relevant data.
• Level 3 – Prices reflect unobservable market inputs (including the Funds’ own judgments about assumptions marketparticipants would use in determining fair value) when observable inputs are unavailable.
Debt securities are valued based upon evaluated prices received from an independent pricing service or from a dealer or broker whomakes markets in such securities. Pricing services utilize various observable market data and as such, debt securities are generallycategorized as Level 2. The levels are not necessarily an indication of the risk or liquidity of the Fund’s investments. Transfers betweenthe levels for investment securities or other financial instruments are measured at the end of the reporting period.
160 CALAMOS OPEN-END FAMILY OF FUNDS ANNUAL REPORT
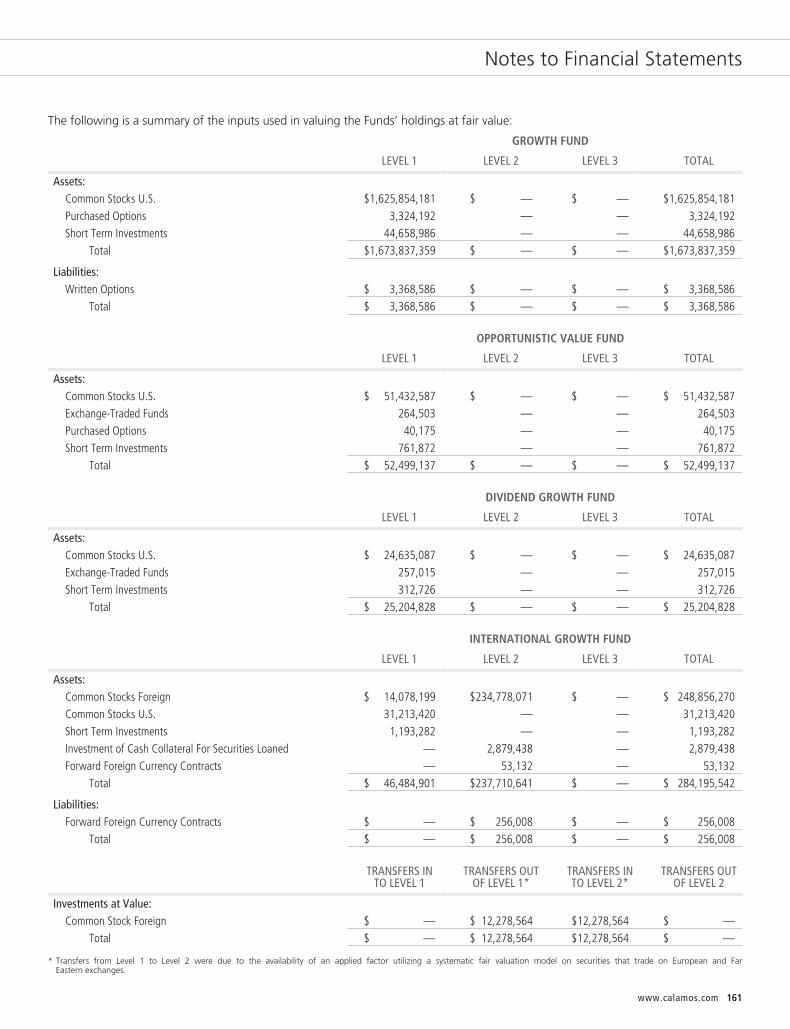
Notes to Financial Statements
The following is a summary of the inputs used in valuing the Funds’ holdings at fair value:
GROWTH FUND
LEVEL 1 LEVEL 2 LEVEL 3 TOTAL
Assets:Common Stocks U.S. $1,625,854,181 $ — $ — $1,625,854,181Purchased Options 3,324,192 — — 3,324,192Short Term Investments 44,658,986 — — 44,658,986
Total $1,673,837,359 $ — $ — $1,673,837,359
Liabilities:Written Options $ 3,368,586 $ — $ — $ 3,368,586
Total $ 3,368,586 $ — $ — $ 3,368,586
OPPORTUNISTIC VALUE FUND
LEVEL 1 LEVEL 2 LEVEL 3 TOTAL
Assets:Common Stocks U.S. $ 51,432,587 $ — $ — $ 51,432,587Exchange-Traded Funds 264,503 — — 264,503Purchased Options 40,175 — — 40,175Short Term Investments 761,872 — — 761,872
Total $ 52,499,137 $ — $ — $ 52,499,137
DIVIDEND GROWTH FUND
LEVEL 1 LEVEL 2 LEVEL 3 TOTAL
Assets:Common Stocks U.S. $ 24,635,087 $ — $ — $ 24,635,087Exchange-Traded Funds 257,015 — — 257,015Short Term Investments 312,726 — — 312,726
Total $ 25,204,828 $ — $ — $ 25,204,828
INTERNATIONAL GROWTH FUND
LEVEL 1 LEVEL 2 LEVEL 3 TOTAL
Assets:Common Stocks Foreign $ 14,078,199 $234,778,071 $ — $ 248,856,270Common Stocks U.S. 31,213,420 — — 31,213,420Short Term Investments 1,193,282 — — 1,193,282Investment of Cash Collateral For Securities Loaned — 2,879,438 — 2,879,438Forward Foreign Currency Contracts — 53,132 — 53,132
Total $ 46,484,901 $237,710,641 $ — $ 284,195,542
Liabilities:Forward Foreign Currency Contracts $ — $ 256,008 $ — $ 256,008
Total $ — $ 256,008 $ — $ 256,008
TRANSFERS INTO LEVEL 1
TRANSFERS OUTOF LEVEL 1*
TRANSFERS INTO LEVEL 2*
TRANSFERS OUTOF LEVEL 2
Investments at Value:Common Stock Foreign $ — $ 12,278,564 $12,278,564 $ —
Total $ — $ 12,278,564 $12,278,564 $ —
* Transfers from Level 1 to Level 2 were due to the availability of an applied factor utilizing a systematic fair valuation model on securities that trade on European and FarEastern exchanges.
www.calamos.com 161

Notes to Financial Statements
EVOLVING WORLD GROWTH FUND
LEVEL 1 LEVEL 2 LEVEL 3 TOTAL
Assets:Convertible Bonds $ — $ 38,508,178 $ — $ 38,508,178Convertible Preferred Stocks — 17,279,906 — 17,279,906Common Stocks Foreign 23,138,754 201,166,784 — 224,305,538Common Stocks U.S. 38,399,542 — — 38,399,542Purchased Options 1,748,783 — — 1,748,783Short Term Investments 6,556,084 — — 6,556,084
Total $69,843,163 $256,954,868 $ — $326,798,031
Liabilities:Written Options $ 76,125 $ — $ — $ 76,125
Total $ 76,125 $ — $ — $ 76,125
TRANSFERS INTO LEVEL 1
TRANSFERS OUTOF LEVEL 1*
TRANSFERS INTO LEVEL 2*
TRANSFERS OUTOF LEVEL 2
Investments at Value:Common Stock Foreign $ — $ 20,151,240 $20,151,240 $ —
Total $ — $ 20,151,240 $20,151,240 $ —
* Transfers from Level 1 to Level 2 were due to the availability of an applied factor utilizing a systematic fair valuation model on securities that trade on European and Far Easternexchanges.
EMERGING MARKET EQUITY FUND
LEVEL 1 LEVEL 2 LEVEL 3 TOTAL
Assets:Common Stocks Foreign $ 1,531,507 $ 9,341,777 $ — $ 10,873,284Common Stocks U.S. 5,164,826 — — 5,164,826Exchange-Traded Funds 620,056 — — 620,056Short Term Investments 394,472 — — 394,472
Total $ 7,710,861 $ 9,341,777 $ — $ 17,052,638
TRANSFERS INTO LEVEL 1
TRANSFERS OUTOF LEVEL 1*
TRANSFERS INTO LEVEL 2*
TRANSFERS OUTOF LEVEL 2
Investments at Value:Common Stock Foreign $ 138,831 $ — $ — $ 138,831
Total $ 138,831 $ — $ — $ 138,831
* Transfers from Level 2 to Level 1 were due to the lack of the availability of an applied factor utilizing a systematic fair valuation model on securities that trade on European and Far Easternexchanges.
162 CALAMOS OPEN-END FAMILY OF FUNDS ANNUAL REPORT
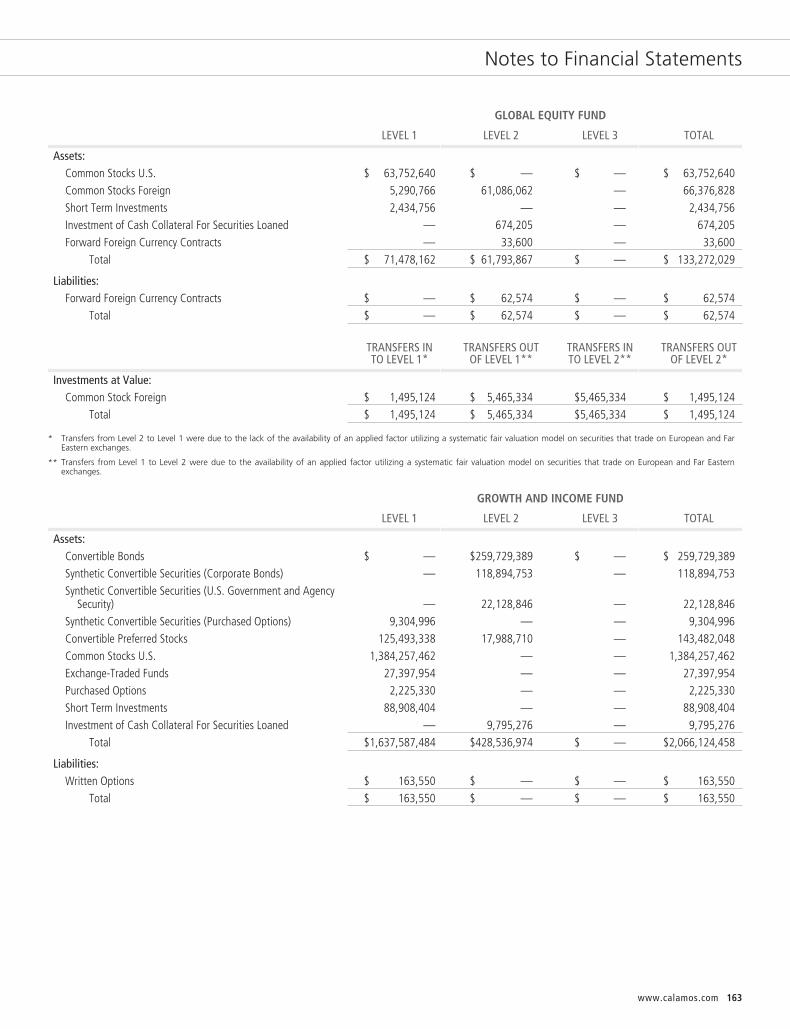
Notes to Financial Statements
GLOBAL EQUITY FUND
LEVEL 1 LEVEL 2 LEVEL 3 TOTAL
Assets:Common Stocks U.S. $ 63,752,640 $ — $ — $ 63,752,640Common Stocks Foreign 5,290,766 61,086,062 — 66,376,828Short Term Investments 2,434,756 — — 2,434,756Investment of Cash Collateral For Securities Loaned — 674,205 — 674,205Forward Foreign Currency Contracts — 33,600 — 33,600
Total $ 71,478,162 $ 61,793,867 $ — $ 133,272,029
Liabilities:Forward Foreign Currency Contracts $ — $ 62,574 $ — $ 62,574
Total $ — $ 62,574 $ — $ 62,574
TRANSFERS INTO LEVEL 1*
TRANSFERS OUTOF LEVEL 1**
TRANSFERS INTO LEVEL 2**
TRANSFERS OUTOF LEVEL 2*
Investments at Value:Common Stock Foreign $ 1,495,124 $ 5,465,334 $5,465,334 $ 1,495,124
Total $ 1,495,124 $ 5,465,334 $5,465,334 $ 1,495,124
* Transfers from Level 2 to Level 1 were due to the lack of the availability of an applied factor utilizing a systematic fair valuation model on securities that trade on European and FarEastern exchanges.
** Transfers from Level 1 to Level 2 were due to the availability of an applied factor utilizing a systematic fair valuation model on securities that trade on European and Far Easternexchanges.
GROWTH AND INCOME FUND
LEVEL 1 LEVEL 2 LEVEL 3 TOTAL
Assets:Convertible Bonds $ — $259,729,389 $ — $ 259,729,389Synthetic Convertible Securities (Corporate Bonds) — 118,894,753 — 118,894,753Synthetic Convertible Securities (U.S. Government and Agency
Security) — 22,128,846 — 22,128,846Synthetic Convertible Securities (Purchased Options) 9,304,996 — — 9,304,996Convertible Preferred Stocks 125,493,338 17,988,710 — 143,482,048Common Stocks U.S. 1,384,257,462 — — 1,384,257,462Exchange-Traded Funds 27,397,954 — — 27,397,954Purchased Options 2,225,330 — — 2,225,330Short Term Investments 88,908,404 — — 88,908,404Investment of Cash Collateral For Securities Loaned — 9,795,276 — 9,795,276
Total $1,637,587,484 $428,536,974 $ — $2,066,124,458
Liabilities:Written Options $ 163,550 $ — $ — $ 163,550
Total $ 163,550 $ — $ — $ 163,550
www.calamos.com 163

Notes to Financial Statements
GLOBAL GROWTH AND INCOME FUND
LEVEL 1 LEVEL 2 LEVEL 3 TOTAL
Assets:Convertible Bonds $ — $ 75,365,130 $ — $ 75,365,130Synthetic Convertible Securities (Purchased Options) 2,885,220 — — 2,885,220Synthetic Convertible Securities (U.S. Government and Agency
Security) — 4,379,920 — 4,379,920Convertible Preferred Stocks 9,138,356 6,291,228 — 15,429,584Common Stocks U.S. 56,532,988 — — 56,532,988Common Stocks Foreign 5,915,721 61,311,481 — 67,227,202Short Term Investments 2,188,195 — — 2,188,195Investment of Cash Collateral For Securities Loaned — 2,001,348 — 2,001,348Forward Foreign Currency Contracts — 27,972 — 27,972
Total $ 76,660,480 $149,377,079 $ — $ 226,037,559
Liabilities:Forward Foreign Currency Contracts $ — $ 105,034 $ — $ 105,034
Total $ — $ 105,034 $ — $ 105,034
TRANSFERS INTO LEVEL 1**
TRANSFERS OUTOF LEVEL 1*
TRANSFERS INTO LEVEL 2*
TRANSFERS OUTOF LEVEL 2**
Investments at Value:Common Stock Foreign $ 2,569,352 $ 5,238,621 $5,238,621 $ 2,569,352
Total $ 2,569,352 $ 5,238,621 $5,238,621 $ 2,569,352
* Transfers from Level 1 to Level 2 were due to the availability of an applied factor utilizing a systematic fair valuation model on securities that trade on European and Far Easternexchanges.
** Transfers from Level 2 to Level 1 were due to the lack of the availability of an applied factor utilizing a systematic fair valuation model on securities that trade on European and FarEastern exchanges.
CONVERTIBLE FUND
LEVEL 1 LEVEL 2 LEVEL 3 TOTAL
Assets:Convertible Bonds $ — $447,568,476 $ — $ 447,568,476Convertible Preferred Stocks 89,870,119 7,143,517 — 97,013,636Common Stocks U.S. 32,260,460 — — 32,260,460Purchased Options 1,741,838 — — 341,963Short Term Investments 24,911,477 — — 24,911,477Investment of Cash Collateral For Securities Loaned 11,175,523 — — 11,175,523
Total $ 159,959,417 $454,711,993 $ — $ 614,671,410
GLOBAL CONVERTIBLE FUND
LEVEL 1 LEVEL 2 LEVEL 3 TOTAL
Assets:Convertible Bonds $ — $ 76,297,284 $ — $ 76,297,284Synthetic Convertible Securities (Corporate Bonds) — 3,355,746 — 3,355,746Synthetic Convertible Securities (U.S. Government and Agency
Security) — 9,431,525 — 9,431,525Synthetic Convertible Securities (Purchased Options) 1,258,278 — — 1,258,278Convertible Preferred Stocks 10,006,836 — — 10,006,836Purchased Options 49,500 — — 49,500Short Term Investments 6,861,638 — — 6,861,638
Total $ 18,176,252 $ 89,084,555 $ — $ 107,260,807
164 CALAMOS OPEN-END FAMILY OF FUNDS ANNUAL REPORT
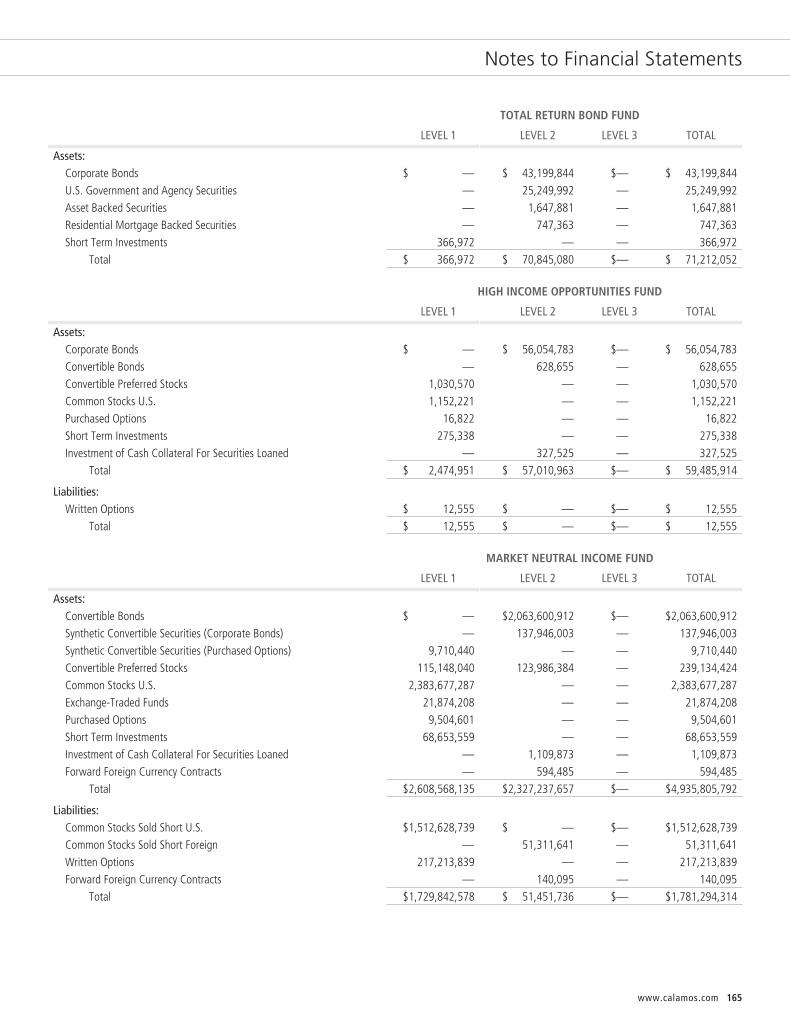
Notes to Financial Statements
TOTAL RETURN BOND FUND
LEVEL 1 LEVEL 2 LEVEL 3 TOTAL
Assets:Corporate Bonds $ — $ 43,199,844 $— $ 43,199,844U.S. Government and Agency Securities — 25,249,992 — 25,249,992Asset Backed Securities — 1,647,881 — 1,647,881Residential Mortgage Backed Securities — 747,363 — 747,363Short Term Investments 366,972 — — 366,972
Total $ 366,972 $ 70,845,080 $— $ 71,212,052
HIGH INCOME OPPORTUNITIES FUND
LEVEL 1 LEVEL 2 LEVEL 3 TOTAL
Assets:Corporate Bonds $ — $ 56,054,783 $— $ 56,054,783Convertible Bonds — 628,655 — 628,655Convertible Preferred Stocks 1,030,570 — — 1,030,570Common Stocks U.S. 1,152,221 — — 1,152,221Purchased Options 16,822 — — 16,822Short Term Investments 275,338 — — 275,338Investment of Cash Collateral For Securities Loaned — 327,525 — 327,525
Total $ 2,474,951 $ 57,010,963 $— $ 59,485,914
Liabilities:Written Options $ 12,555 $ — $— $ 12,555
Total $ 12,555 $ — $— $ 12,555
MARKET NEUTRAL INCOME FUND
LEVEL 1 LEVEL 2 LEVEL 3 TOTAL
Assets:Convertible Bonds $ — $2,063,600,912 $— $2,063,600,912Synthetic Convertible Securities (Corporate Bonds) — 137,946,003 — 137,946,003Synthetic Convertible Securities (Purchased Options) 9,710,440 — — 9,710,440Convertible Preferred Stocks 115,148,040 123,986,384 — 239,134,424Common Stocks U.S. 2,383,677,287 — — 2,383,677,287Exchange-Traded Funds 21,874,208 — — 21,874,208Purchased Options 9,504,601 — — 9,504,601Short Term Investments 68,653,559 — — 68,653,559Investment of Cash Collateral For Securities Loaned — 1,109,873 — 1,109,873Forward Foreign Currency Contracts — 594,485 — 594,485
Total $2,608,568,135 $2,327,237,657 $— $4,935,805,792
Liabilities:Common Stocks Sold Short U.S. $1,512,628,739 $ — $— $1,512,628,739Common Stocks Sold Short Foreign — 51,311,641 — 51,311,641Written Options 217,213,839 — — 217,213,839Forward Foreign Currency Contracts — 140,095 — 140,095
Total $1,729,842,578 $ 51,451,736 $— $1,781,294,314
www.calamos.com 165
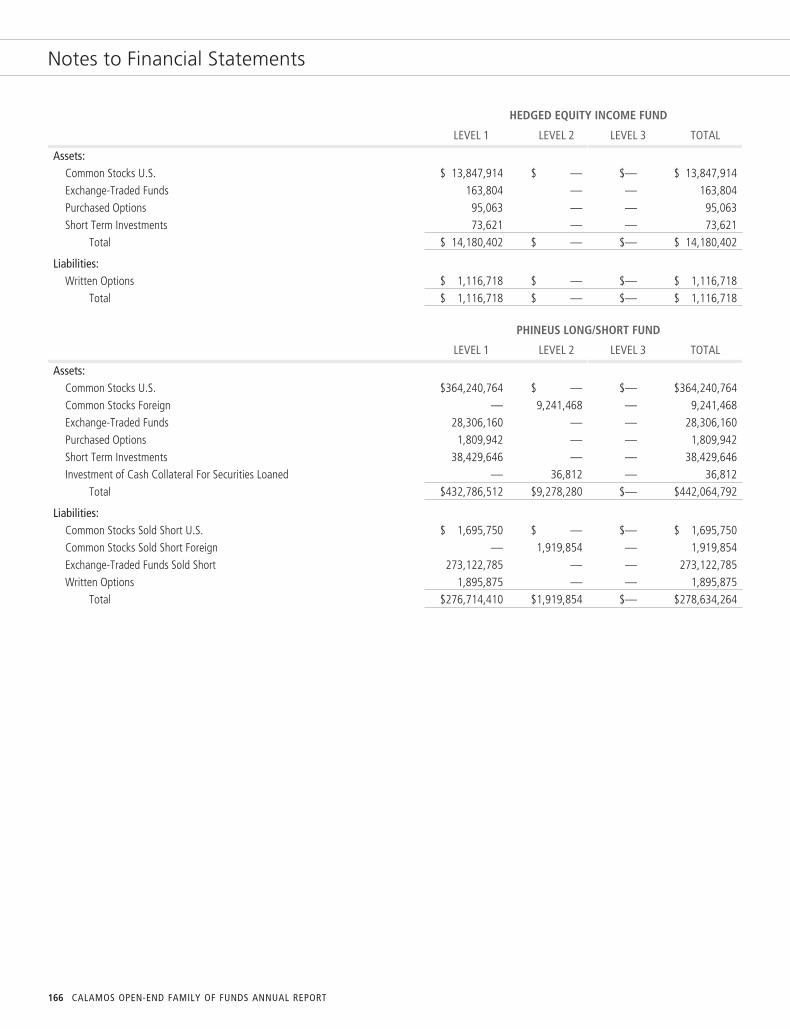
Notes to Financial Statements
HEDGED EQUITY INCOME FUND
LEVEL 1 LEVEL 2 LEVEL 3 TOTAL
Assets:Common Stocks U.S. $ 13,847,914 $ — $— $ 13,847,914Exchange-Traded Funds 163,804 — — 163,804Purchased Options 95,063 — — 95,063Short Term Investments 73,621 — — 73,621
Total $ 14,180,402 $ — $— $ 14,180,402
Liabilities:Written Options $ 1,116,718 $ — $— $ 1,116,718
Total $ 1,116,718 $ — $— $ 1,116,718
PHINEUS LONG/SHORT FUND
LEVEL 1 LEVEL 2 LEVEL 3 TOTAL
Assets:Common Stocks U.S. $364,240,764 $ — $— $364,240,764Common Stocks Foreign — 9,241,468 — 9,241,468Exchange-Traded Funds 28,306,160 — — 28,306,160Purchased Options 1,809,942 — — 1,809,942Short Term Investments 38,429,646 — — 38,429,646Investment of Cash Collateral For Securities Loaned — 36,812 — 36,812
Total $432,786,512 $9,278,280 $— $442,064,792
Liabilities:Common Stocks Sold Short U.S. $ 1,695,750 $ — $— $ 1,695,750Common Stocks Sold Short Foreign — 1,919,854 — 1,919,854Exchange-Traded Funds Sold Short 273,122,785 — — 273,122,785Written Options 1,895,875 — — 1,895,875
Total $276,714,410 $1,919,854 $— $278,634,264
166 CALAMOS OPEN-END FAMILY OF FUNDS ANNUAL REPORT
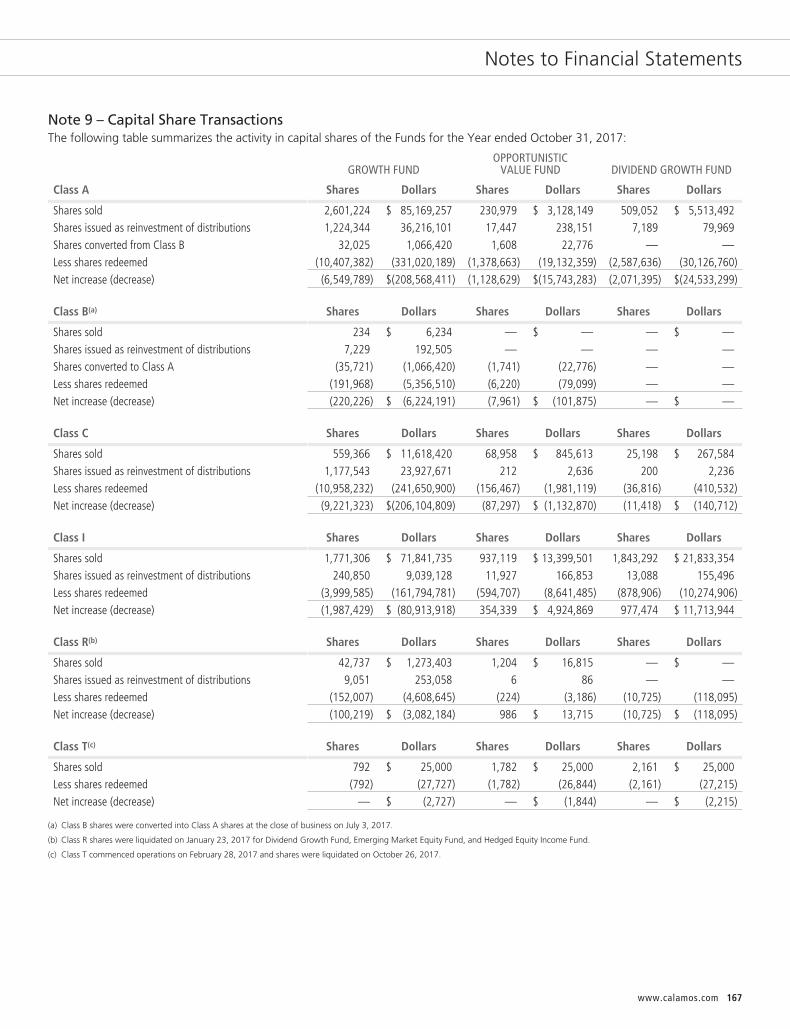
Notes to Financial Statements
Note 9 – Capital Share TransactionsThe following table summarizes the activity in capital shares of the Funds for the Year ended October 31, 2017:
GROWTH FUNDOPPORTUNISTIC
VALUE FUND DIVIDEND GROWTH FUND
Class A Shares Dollars Shares Dollars Shares Dollars
Shares sold 2,601,224 $ 85,169,257 230,979 $ 3,128,149 509,052 $ 5,513,492Shares issued as reinvestment of distributions 1,224,344 36,216,101 17,447 238,151 7,189 79,969Shares converted from Class B 32,025 1,066,420 1,608 22,776 — —Less shares redeemed (10,407,382) (331,020,189) (1,378,663) (19,132,359) (2,587,636) (30,126,760)Net increase (decrease) (6,549,789) $(208,568,411) (1,128,629) $(15,743,283) (2,071,395) $(24,533,299)
Class B(a) Shares Dollars Shares Dollars Shares Dollars
Shares sold 234 $ 6,234 — $ — — $ —Shares issued as reinvestment of distributions 7,229 192,505 — — — —Shares converted to Class A (35,721) (1,066,420) (1,741) (22,776) — —Less shares redeemed (191,968) (5,356,510) (6,220) (79,099) — —Net increase (decrease) (220,226) $ (6,224,191) (7,961) $ (101,875) — $ —
Class C Shares Dollars Shares Dollars Shares Dollars
Shares sold 559,366 $ 11,618,420 68,958 $ 845,613 25,198 $ 267,584Shares issued as reinvestment of distributions 1,177,543 23,927,671 212 2,636 200 2,236Less shares redeemed (10,958,232) (241,650,900) (156,467) (1,981,119) (36,816) (410,532)Net increase (decrease) (9,221,323) $(206,104,809) (87,297) $ (1,132,870) (11,418) $ (140,712)
Class I Shares Dollars Shares Dollars Shares Dollars
Shares sold 1,771,306 $ 71,841,735 937,119 $ 13,399,501 1,843,292 $ 21,833,354Shares issued as reinvestment of distributions 240,850 9,039,128 11,927 166,853 13,088 155,496Less shares redeemed (3,999,585) (161,794,781) (594,707) (8,641,485) (878,906) (10,274,906)Net increase (decrease) (1,987,429) $ (80,913,918) 354,339 $ 4,924,869 977,474 $ 11,713,944
Class R(b) Shares Dollars Shares Dollars Shares Dollars
Shares sold 42,737 $ 1,273,403 1,204 $ 16,815 — $ —Shares issued as reinvestment of distributions 9,051 253,058 6 86 — —Less shares redeemed (152,007) (4,608,645) (224) (3,186) (10,725) (118,095)Net increase (decrease) (100,219) $ (3,082,184) 986 $ 13,715 (10,725) $ (118,095)
Class T(c) Shares Dollars Shares Dollars Shares Dollars
Shares sold 792 $ 25,000 1,782 $ 25,000 2,161 $ 25,000Less shares redeemed (792) (27,727) (1,782) (26,844) (2,161) (27,215)Net increase (decrease) — $ (2,727) — $ (1,844) — $ (2,215)
(a) Class B shares were converted into Class A shares at the close of business on July 3, 2017.
(b) Class R shares were liquidated on January 23, 2017 for Dividend Growth Fund, Emerging Market Equity Fund, and Hedged Equity Income Fund.
(c) Class T commenced operations on February 28, 2017 and shares were liquidated on October 26, 2017.
www.calamos.com 167
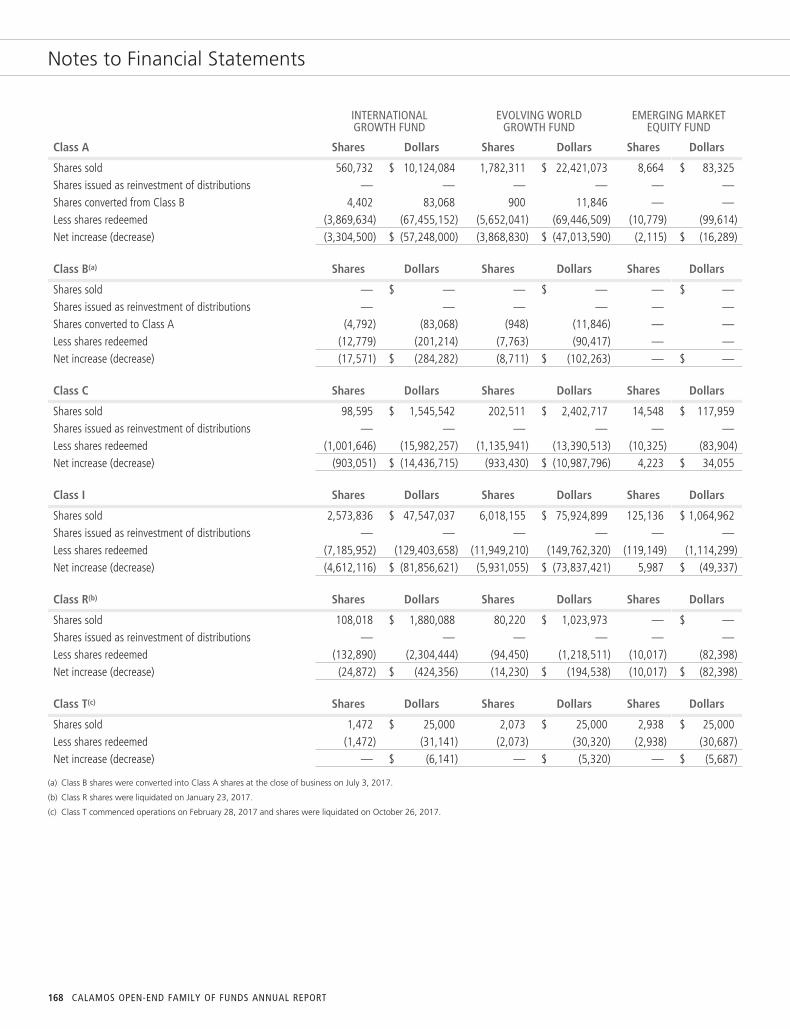
Notes to Financial Statements
INTERNATIONALGROWTH FUND
EVOLVING WORLDGROWTH FUND
EMERGING MARKETEQUITY FUND
Class A Shares Dollars Shares Dollars Shares Dollars
Shares sold 560,732 $ 10,124,084 1,782,311 $ 22,421,073 8,664 $ 83,325Shares issued as reinvestment of distributions — — — — — —Shares converted from Class B 4,402 83,068 900 11,846 — —Less shares redeemed (3,869,634) (67,455,152) (5,652,041) (69,446,509) (10,779) (99,614)Net increase (decrease) (3,304,500) $ (57,248,000) (3,868,830) $ (47,013,590) (2,115) $ (16,289)
Class B(a) Shares Dollars Shares Dollars Shares Dollars
Shares sold — $ — — $ — — $ —Shares issued as reinvestment of distributions — — — — — —Shares converted to Class A (4,792) (83,068) (948) (11,846) — —Less shares redeemed (12,779) (201,214) (7,763) (90,417) — —Net increase (decrease) (17,571) $ (284,282) (8,711) $ (102,263) — $ —
Class C Shares Dollars Shares Dollars Shares Dollars
Shares sold 98,595 $ 1,545,542 202,511 $ 2,402,717 14,548 $ 117,959Shares issued as reinvestment of distributions — — — — — —Less shares redeemed (1,001,646) (15,982,257) (1,135,941) (13,390,513) (10,325) (83,904)Net increase (decrease) (903,051) $ (14,436,715) (933,430) $ (10,987,796) 4,223 $ 34,055
Class I Shares Dollars Shares Dollars Shares Dollars
Shares sold 2,573,836 $ 47,547,037 6,018,155 $ 75,924,899 125,136 $ 1,064,962Shares issued as reinvestment of distributions — — — — — —Less shares redeemed (7,185,952) (129,403,658) (11,949,210) (149,762,320) (119,149) (1,114,299)Net increase (decrease) (4,612,116) $ (81,856,621) (5,931,055) $ (73,837,421) 5,987 $ (49,337)
Class R(b) Shares Dollars Shares Dollars Shares Dollars
Shares sold 108,018 $ 1,880,088 80,220 $ 1,023,973 — $ —Shares issued as reinvestment of distributions — — — — — —Less shares redeemed (132,890) (2,304,444) (94,450) (1,218,511) (10,017) (82,398)Net increase (decrease) (24,872) $ (424,356) (14,230) $ (194,538) (10,017) $ (82,398)
Class T(c) Shares Dollars Shares Dollars Shares Dollars
Shares sold 1,472 $ 25,000 2,073 $ 25,000 2,938 $ 25,000Less shares redeemed (1,472) (31,141) (2,073) (30,320) (2,938) (30,687)Net increase (decrease) — $ (6,141) — $ (5,320) — $ (5,687)
(a) Class B shares were converted into Class A shares at the close of business on July 3, 2017.
(b) Class R shares were liquidated on January 23, 2017.
(c) Class T commenced operations on February 28, 2017 and shares were liquidated on October 26, 2017.
168 CALAMOS OPEN-END FAMILY OF FUNDS ANNUAL REPORT

Notes to Financial Statements
GLOBAL EQUITYFUND
GROWTH ANDINCOME FUND
GLOBAL GROWTHAND INCOME FUND
Class A Shares Dollars Shares Dollars Shares Dollars
Shares sold 267,886 $ 3,631,787 3,777,741 $ 119,020,123 1,271,007 $ 11,536,491Shares issued as reinvestment of distributions 82,310 994,304 1,805,326 54,495,015 62,980 534,014Shares converted from Class B 1,461 20,314 25,222 796,749 3,521 32,254Less shares redeemed (928,684) (12,069,159) (8,742,755) (272,081,567) (3,398,601) (29,999,159)Net increase (decrease) (577,027) $ (7,422,754) (3,134,466) $ (97,769,680) (2,061,093) $(17,896,400)
Class B(a) Shares Dollars Shares Dollars Shares Dollars
Shares sold 88 $ 1,043 1,234 $ 46,381 33 $ 276Shares issued as reinvestment of distributions 607 6,812 3,326 121,506 352 2,986Shares converted to Class A (1,579) (20,314) (20,587) (796,749) (3,514) (32,254)Less shares redeemed (13,353) (161,512) (80,438) (3,007,950) (59,827) (523,560)Net increase (decrease) (14,237) $ (173,971) (96,465) $ (3,636,812) (62,956) $ (552,552)
Class C Shares Dollars Shares Dollars Shares Dollars
Shares sold 79,865 $ 1,020,183 688,905 $ 21,218,249 392,300 $ 3,098,222Shares issued as reinvestment of distributions 52,717 590,436 1,093,204 33,026,832 69,000 524,399Less shares redeemed (556,903) (6,824,659) (8,959,162) (280,900,715) (4,362,066) (34,932,226)Net increase (decrease) (424,321) $ (5,214,040) (7,177,053) $(226,655,634) (3,900,766) $(31,309,605)
Class I Shares Dollars Shares Dollars Shares Dollars
Shares sold 842,940 $ 11,438,592 6,605,429 $ 198,145,185 1,904,954 $ 17,526,653Shares issued as reinvestment of distributions 290,431 3,572,303 1,102,432 32,173,200 134,938 1,169,624Less shares redeemed (2,477,622) (32,885,172) (7,973,494) (238,550,682) (9,061,190) (79,702,176)Net increase (decrease) (1,344,251) $(17,874,277) (265,633) $ (8,232,297) (7,021,298) $(61,005,899)
Class R Shares Dollars Shares Dollars Shares Dollars
Shares sold 66,830 $ 893,328 134,902 $ 4,209,111 18,580 $ 164,274Shares issued as reinvestment of distributions 13,200 155,231 24,431 731,321 714 5,930Less shares redeemed (90,324) (1,147,337) (241,126) (7,566,968) (38,431) (338,695)Net increase (decrease) (10,294) $ (98,778) (81,793) $ (2,626,536) (19,137) $ (168,491)
Class T(b) Shares Dollars Shares Dollars Shares Dollars
Shares sold 1,953 $ 25,000 805 $ 25,000 2,867 $ 25,000Less shares redeemed (1,953) (29,930) (805) (26,459) (2,867) (27,840)Net increase (decrease) — $ (4,930) — $ (1,459) — $ (2,840)
(a) Class B shares were converted into Class A shares at the close of business on July 3, 2017.
(b) Class T commenced operations on February 28, 2017 and shares were liquidated on October 26, 2017.
www.calamos.com 169

Notes to Financial Statements
CONVERTIBLEFUND
GLOBAL CONVERTIBLEFUND
TOTAL RETURNBOND FUND
Class A Shares Dollars Shares Dollars Shares Dollars
Shares sold 3,984,897 $ 67,754,277 1,550,252 $ 16,157,712 616,675 $ 6,401,692Shares issued as reinvestment of distributions 228,135 3,777,198 25,305 251,672 81,886 845,848Shares converted from Class B 30,017 519,892 — — 2,756 28,576Less shares redeemed (6,421,325) (108,531,659) (3,378,936) (35,740,967) (4,051,289) (41,987,744)Net increase (decrease) (2,178,276) $ (36,480,292) (1,803,379) $(19,331,583) (3,349,972) $(34,711,628)
Class B(a) Shares Dollars Shares Dollars Shares Dollars
Shares sold 67 $ 1,413 — $ — — $ —Shares issued as reinvestment of distributions 613 12,855 — — 370 3,802Shares converted to Class A (23,067) (519,892) — — (2,754) (28,576)Less shares redeemed (168,336) (3,602,455) — — (54,904) (566,190)Net increase (decrease) (190,723) $ (4,108,079) — $ — (57,288) $ (590,964)
Class C Shares Dollars Shares Dollars Shares Dollars
Shares sold 288,413 $ 4,836,026 126,493 $ 1,340,655 85,621 $ 884,124Shares issued as reinvestment of distributions 108,187 1,759,129 1,739 17,384 14,688 151,828Less shares redeemed (4,508,178) (75,412,207) (116,735) (1,203,798) (752,710) (7,787,857)Net increase (decrease) (4,111,578) $ (68,817,052) 11,497 $ 154,241 (652,401) $ (6,751,905)
Class I Shares Dollars Shares Dollars Shares Dollars
Shares sold 5,735,409 $ 87,769,797 6,238,579 $ 66,840,028 2,931,151 $ 30,402,823Shares issued as reinvestment of distributions 319,581 4,786,811 80,483 832,389 71,487 741,606Less shares redeemed (8,457,705) (127,450,124) (3,022,710) (31,481,137) (1,218,817) (12,652,880)Net increase (decrease) (2,402,715) $ (34,893,516) 3,296,352 $ 36,191,280 1,783,821 $ 18,491,549
Class R Shares Dollars Shares Dollars Shares Dollars
Shares sold 18,593 $ 316,073 12,378 $ 125,851 5,384 $ 55,765Shares issued as reinvestment of distributions 1,248 20,524 462 4,665 206 2,125Less shares redeemed (31,304) (519,535) (57,696) (627,440) (18,061) (186,669)Net increase (decrease) (11,463) $ (182,938) (44,856) $ (496,924) (12,471) $ (128,779)
Class T(b) Shares Dollars Shares Dollars Shares Dollars
Shares sold 1,484 $ 25,000 2,456 $ 25,000 2,418 $ 25,000Less shares redeemed (1,484) (26,675) (2,456) (27,286) (2,418) (25,061)Net increase (decrease) — $ (1,675) — $ (2,286) — $ (61)
(a) Class B shares were converted into Class A shares at the close of business on July 3, 2017.
(b) Class T commenced operations on February 28, 2017 and shares were liquidated on October 26, 2017.
170 CALAMOS OPEN-END FAMILY OF FUNDS ANNUAL REPORT

Notes to Financial Statements
HIGH INCOMEOPPORTUNITIES FUND
MARKET NEUTRALINCOME FUND
HEDGED EQUITYINCOME FUND
Class A Shares Dollars Shares Dollars Shares Dollars
Shares sold 1,414,032 $ 12,403,213 21,809,752 $ 288,217,457 229,714 $ 2,379,482Shares issued as reinvestment of distributions 188,421 1,655,641 1,654,029 21,633,797 4,200 43,240Shares converted from Class B 2,831 24,971 11,244 149,539 — —Less shares redeemed (2,267,440) (19,857,958) (46,555,325) (615,948,605) (1,165,890) (12,155,368)Net increase (decrease) (662,156) $ (5,774,133) (23,080,300) $ (305,947,812) (931,976) $ (9,732,646)
Class B(a) Shares Dollars Shares Dollars Shares Dollars
Shares sold 10 $ 93 34 $ 472 — $ —Shares issued as reinvestment of distributions 330 3,051 313 4,353 — —Shares converted to Class A (2,661) (24,971) (10,542) (149,539) — —Less shares redeemed (26,145) (242,613) (25,818) (361,652) — —Net increase (decrease) (28,466) $ (264,440) (36,013) $ (506,366) — $ —
Class C Shares Dollars Shares Dollars Shares Dollars
Shares sold 104,430 $ 958,954 3,546,155 $ 47,603,403 1,392 $ 14,704Shares issued as reinvestment of distributions 54,380 501,112 342,645 4,544,452 41 425Less shares redeemed (667,377) (6,147,863) (7,104,810) (95,465,679) (966) (10,085)Net increase (decrease) (508,567) $ (4,687,797) (3,216,010) $ (43,317,824) 467 $ 5,044
Class I Shares Dollars Shares Dollars Shares Dollars
Shares sold 782,434 $ 6,895,841 141,201,499 $1,847,652,277 658,780 $ 6,979,240Shares issued as reinvestment of distributions 48,476 426,255 5,468,217 70,919,796 10,792 113,498Less shares redeemed (1,462,485) (12,688,275) (64,456,477) (843,868,311) (373,898) (3,971,061)Net increase (decrease) (631,575) $ (5,366,179) 82,213,239 $1,074,703,762 295,674 $ 3,121,677
Class R(b) Shares Dollars Shares Dollars Shares Dollars
Shares sold 753 $ 6,580 185,761 $ 2,444,666 — $ —Shares issued as reinvestment of distributions 630 5,517 10,348 134,876 — —Less shares redeemed (19,095) (167,180) (361,746) (4,778,397) (10,223) (104,618)Net increase (decrease) (17,712) $ (155,083) (165,637) $ (2,198,855) (10,223) $ (104,618)
Class T(c) Shares Dollars Shares Dollars Shares Dollars
Shares sold 2,818 $ 25,000 1,891 $ 25,000 2,376 $ 25,000Less shares redeemed (2,818) (25,155) (1,891) (25,302) (2,376) (25,618)Net increase (decrease) — $ (155) — $ (302) — $ (618)
(a) Class B shares were converted into Class A shares at the close of business on July 3, 2017.
(b) Class R shares were liquidated on January 23, 2017.
(c) Class T commenced operations on February 28, 2017 and shares were liquidated on October 26, 2017.
www.calamos.com 171
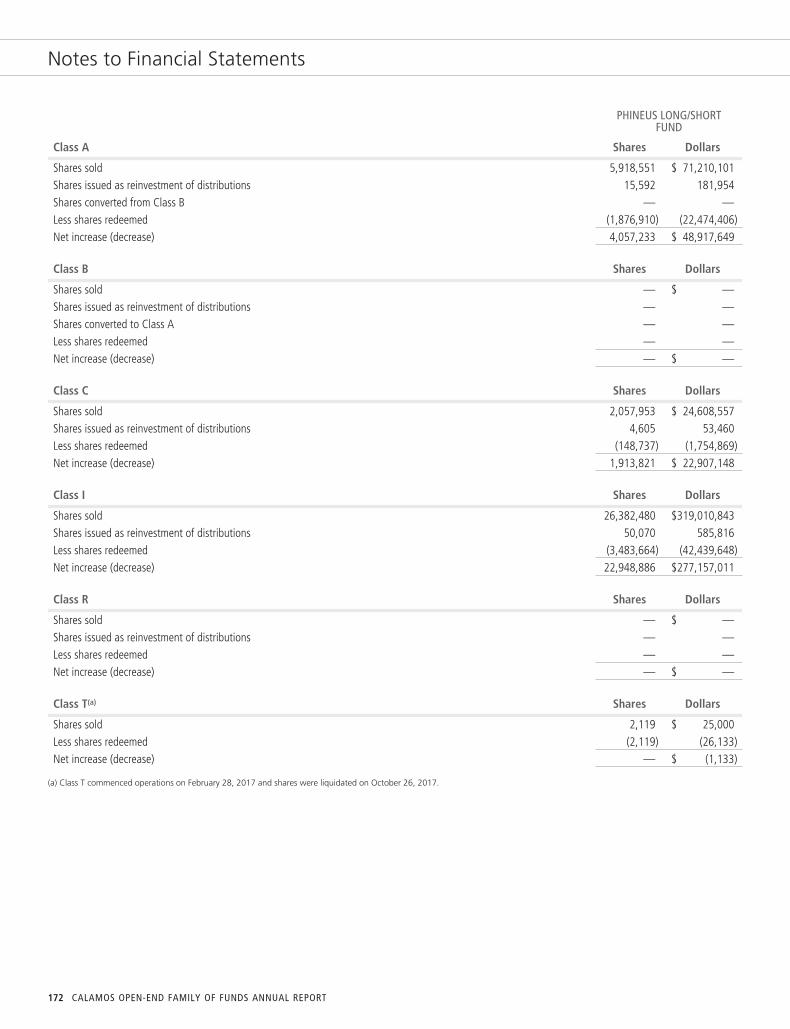
Notes to Financial Statements
PHINEUS LONG/SHORTFUND
Class A Shares Dollars
Shares sold 5,918,551 $ 71,210,101Shares issued as reinvestment of distributions 15,592 181,954Shares converted from Class B — —Less shares redeemed (1,876,910) (22,474,406)Net increase (decrease) 4,057,233 $ 48,917,649
Class B Shares Dollars
Shares sold — $ —Shares issued as reinvestment of distributions — —Shares converted to Class A — —Less shares redeemed — —Net increase (decrease) — $ —
Class C Shares Dollars
Shares sold 2,057,953 $ 24,608,557Shares issued as reinvestment of distributions 4,605 53,460Less shares redeemed (148,737) (1,754,869)Net increase (decrease) 1,913,821 $ 22,907,148
Class I Shares Dollars
Shares sold 26,382,480 $319,010,843Shares issued as reinvestment of distributions 50,070 585,816Less shares redeemed (3,483,664) (42,439,648)Net increase (decrease) 22,948,886 $277,157,011
Class R Shares Dollars
Shares sold — $ —Shares issued as reinvestment of distributions — —Less shares redeemed — —Net increase (decrease) — $ —
Class T(a) Shares Dollars
Shares sold 2,119 $ 25,000Less shares redeemed (2,119) (26,133)Net increase (decrease) — $ (1,133)
(a) Class T commenced operations on February 28, 2017 and shares were liquidated on October 26, 2017.
172 CALAMOS OPEN-END FAMILY OF FUNDS ANNUAL REPORT
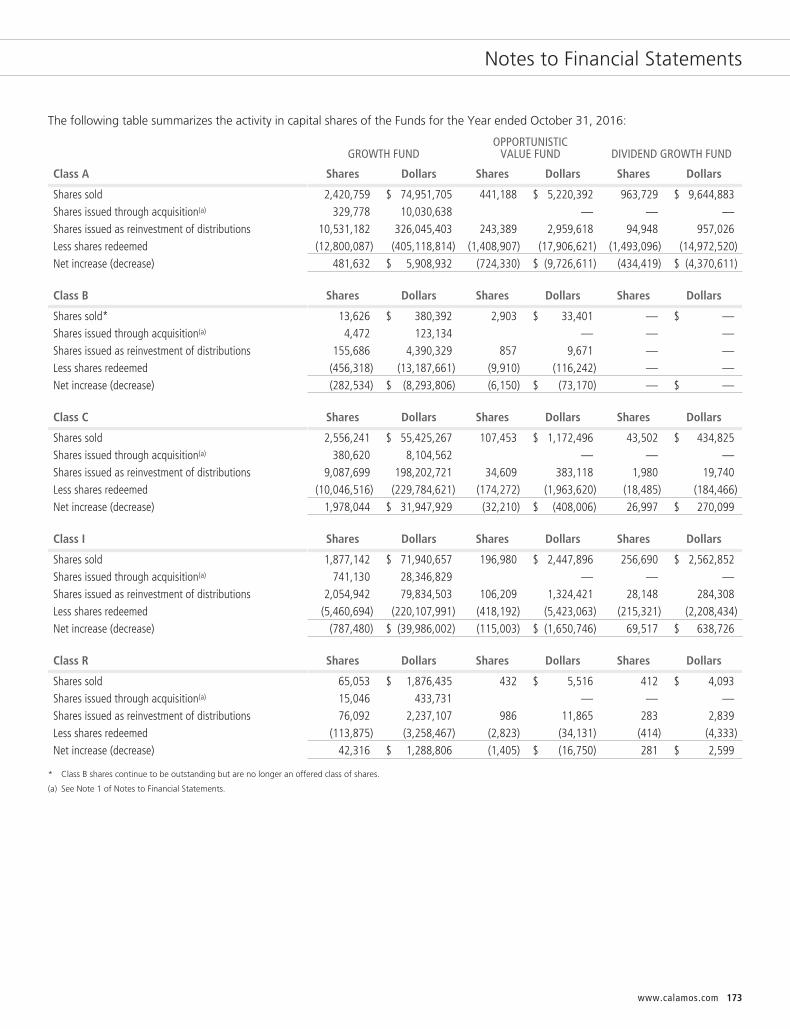
Notes to Financial Statements
The following table summarizes the activity in capital shares of the Funds for the Year ended October 31, 2016:
GROWTH FUNDOPPORTUNISTIC
VALUE FUND DIVIDEND GROWTH FUND
Class A Shares Dollars Shares Dollars Shares Dollars
Shares sold 2,420,759 $ 74,951,705 441,188 $ 5,220,392 963,729 $ 9,644,883Shares issued through acquisition(a) 329,778 10,030,638 — — —Shares issued as reinvestment of distributions 10,531,182 326,045,403 243,389 2,959,618 94,948 957,026Less shares redeemed (12,800,087) (405,118,814) (1,408,907) (17,906,621) (1,493,096) (14,972,520)Net increase (decrease) 481,632 $ 5,908,932 (724,330) $ (9,726,611) (434,419) $ (4,370,611)
Class B Shares Dollars Shares Dollars Shares Dollars
Shares sold* 13,626 $ 380,392 2,903 $ 33,401 — $ —Shares issued through acquisition(a) 4,472 123,134 — — —Shares issued as reinvestment of distributions 155,686 4,390,329 857 9,671 — —Less shares redeemed (456,318) (13,187,661) (9,910) (116,242) — —Net increase (decrease) (282,534) $ (8,293,806) (6,150) $ (73,170) — $ —
Class C Shares Dollars Shares Dollars Shares Dollars
Shares sold 2,556,241 $ 55,425,267 107,453 $ 1,172,496 43,502 $ 434,825Shares issued through acquisition(a) 380,620 8,104,562 — — —Shares issued as reinvestment of distributions 9,087,699 198,202,721 34,609 383,118 1,980 19,740Less shares redeemed (10,046,516) (229,784,621) (174,272) (1,963,620) (18,485) (184,466)Net increase (decrease) 1,978,044 $ 31,947,929 (32,210) $ (408,006) 26,997 $ 270,099
Class I Shares Dollars Shares Dollars Shares Dollars
Shares sold 1,877,142 $ 71,940,657 196,980 $ 2,447,896 256,690 $ 2,562,852Shares issued through acquisition(a) 741,130 28,346,829 — — —Shares issued as reinvestment of distributions 2,054,942 79,834,503 106,209 1,324,421 28,148 284,308Less shares redeemed (5,460,694) (220,107,991) (418,192) (5,423,063) (215,321) (2,208,434)Net increase (decrease) (787,480) $ (39,986,002) (115,003) $ (1,650,746) 69,517 $ 638,726
Class R Shares Dollars Shares Dollars Shares Dollars
Shares sold 65,053 $ 1,876,435 432 $ 5,516 412 $ 4,093Shares issued through acquisition(a) 15,046 433,731 — — —Shares issued as reinvestment of distributions 76,092 2,237,107 986 11,865 283 2,839Less shares redeemed (113,875) (3,258,467) (2,823) (34,131) (414) (4,333)Net increase (decrease) 42,316 $ 1,288,806 (1,405) $ (16,750) 281 $ 2,599
* Class B shares continue to be outstanding but are no longer an offered class of shares.
(a) See Note 1 of Notes to Financial Statements.
www.calamos.com 173
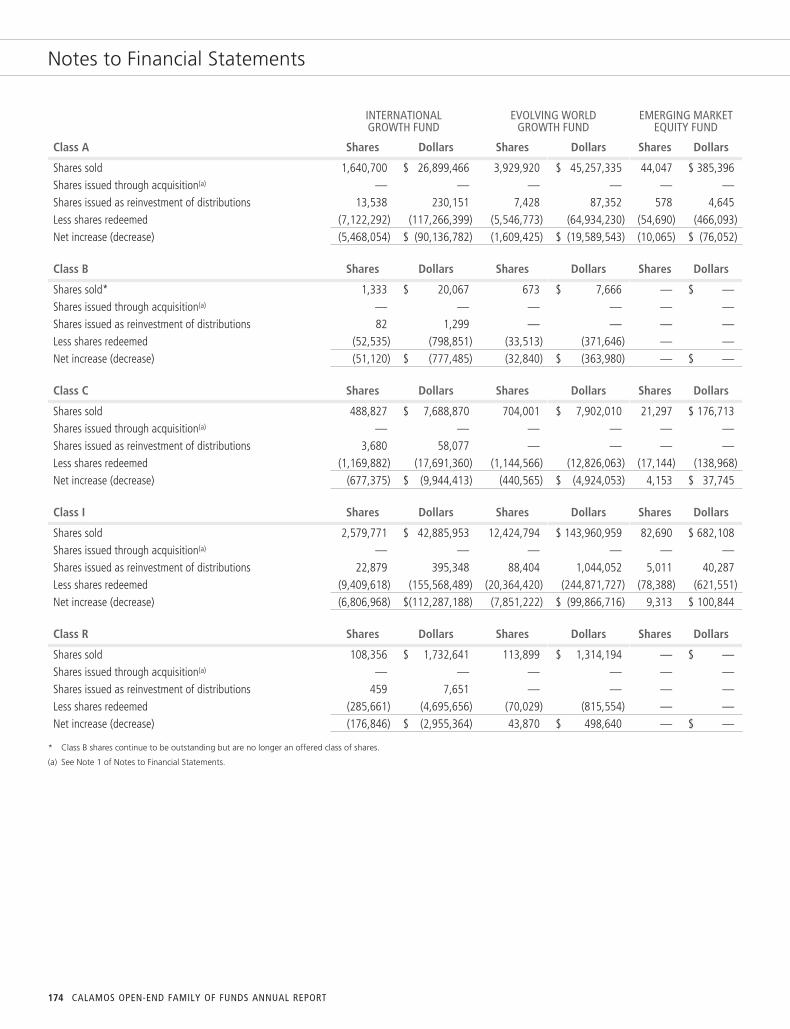
Notes to Financial Statements
INTERNATIONALGROWTH FUND
EVOLVING WORLDGROWTH FUND
EMERGING MARKETEQUITY FUND
Class A Shares Dollars Shares Dollars Shares Dollars
Shares sold 1,640,700 $ 26,899,466 3,929,920 $ 45,257,335 44,047 $ 385,396Shares issued through acquisition(a) — — — — — —Shares issued as reinvestment of distributions 13,538 230,151 7,428 87,352 578 4,645Less shares redeemed (7,122,292) (117,266,399) (5,546,773) (64,934,230) (54,690) (466,093)Net increase (decrease) (5,468,054) $ (90,136,782) (1,609,425) $ (19,589,543) (10,065) $ (76,052)
Class B Shares Dollars Shares Dollars Shares Dollars
Shares sold* 1,333 $ 20,067 673 $ 7,666 — $ —Shares issued through acquisition(a) — — — — — —Shares issued as reinvestment of distributions 82 1,299 — — — —Less shares redeemed (52,535) (798,851) (33,513) (371,646) — —Net increase (decrease) (51,120) $ (777,485) (32,840) $ (363,980) — $ —
Class C Shares Dollars Shares Dollars Shares Dollars
Shares sold 488,827 $ 7,688,870 704,001 $ 7,902,010 21,297 $ 176,713Shares issued through acquisition(a) — — — — — —Shares issued as reinvestment of distributions 3,680 58,077 — — — —Less shares redeemed (1,169,882) (17,691,360) (1,144,566) (12,826,063) (17,144) (138,968)Net increase (decrease) (677,375) $ (9,944,413) (440,565) $ (4,924,053) 4,153 $ 37,745
Class I Shares Dollars Shares Dollars Shares Dollars
Shares sold 2,579,771 $ 42,885,953 12,424,794 $ 143,960,959 82,690 $ 682,108Shares issued through acquisition(a) — — — — — —Shares issued as reinvestment of distributions 22,879 395,348 88,404 1,044,052 5,011 40,287Less shares redeemed (9,409,618) (155,568,489) (20,364,420) (244,871,727) (78,388) (621,551)Net increase (decrease) (6,806,968) $(112,287,188) (7,851,222) $ (99,866,716) 9,313 $ 100,844
Class R Shares Dollars Shares Dollars Shares Dollars
Shares sold 108,356 $ 1,732,641 113,899 $ 1,314,194 — $ —Shares issued through acquisition(a) — — — — — —Shares issued as reinvestment of distributions 459 7,651 — — — —Less shares redeemed (285,661) (4,695,656) (70,029) (815,554) — —Net increase (decrease) (176,846) $ (2,955,364) 43,870 $ 498,640 — $ —
* Class B shares continue to be outstanding but are no longer an offered class of shares.
(a) See Note 1 of Notes to Financial Statements.
174 CALAMOS OPEN-END FAMILY OF FUNDS ANNUAL REPORT
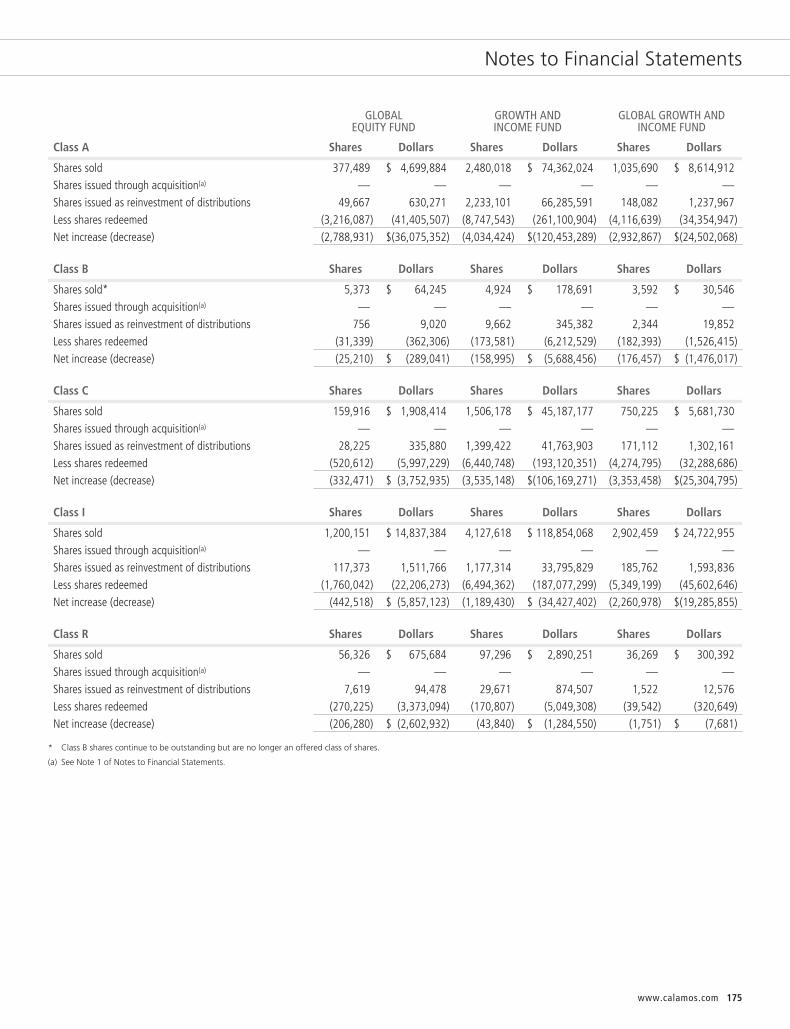
Notes to Financial Statements
GLOBALEQUITY FUND
GROWTH ANDINCOME FUND
GLOBAL GROWTH ANDINCOME FUND
Class A Shares Dollars Shares Dollars Shares Dollars
Shares sold 377,489 $ 4,699,884 2,480,018 $ 74,362,024 1,035,690 $ 8,614,912Shares issued through acquisition(a) — — — — — —Shares issued as reinvestment of distributions 49,667 630,271 2,233,101 66,285,591 148,082 1,237,967Less shares redeemed (3,216,087) (41,405,507) (8,747,543) (261,100,904) (4,116,639) (34,354,947)Net increase (decrease) (2,788,931) $(36,075,352) (4,034,424) $(120,453,289) (2,932,867) $(24,502,068)
Class B Shares Dollars Shares Dollars Shares Dollars
Shares sold* 5,373 $ 64,245 4,924 $ 178,691 3,592 $ 30,546Shares issued through acquisition(a) — — — — — —Shares issued as reinvestment of distributions 756 9,020 9,662 345,382 2,344 19,852Less shares redeemed (31,339) (362,306) (173,581) (6,212,529) (182,393) (1,526,415)Net increase (decrease) (25,210) $ (289,041) (158,995) $ (5,688,456) (176,457) $ (1,476,017)
Class C Shares Dollars Shares Dollars Shares Dollars
Shares sold 159,916 $ 1,908,414 1,506,178 $ 45,187,177 750,225 $ 5,681,730Shares issued through acquisition(a) — — — — — —Shares issued as reinvestment of distributions 28,225 335,880 1,399,422 41,763,903 171,112 1,302,161Less shares redeemed (520,612) (5,997,229) (6,440,748) (193,120,351) (4,274,795) (32,288,686)Net increase (decrease) (332,471) $ (3,752,935) (3,535,148) $(106,169,271) (3,353,458) $(25,304,795)
Class I Shares Dollars Shares Dollars Shares Dollars
Shares sold 1,200,151 $ 14,837,384 4,127,618 $ 118,854,068 2,902,459 $ 24,722,955Shares issued through acquisition(a) — — — — — —Shares issued as reinvestment of distributions 117,373 1,511,766 1,177,314 33,795,829 185,762 1,593,836Less shares redeemed (1,760,042) (22,206,273) (6,494,362) (187,077,299) (5,349,199) (45,602,646)Net increase (decrease) (442,518) $ (5,857,123) (1,189,430) $ (34,427,402) (2,260,978) $(19,285,855)
Class R Shares Dollars Shares Dollars Shares Dollars
Shares sold 56,326 $ 675,684 97,296 $ 2,890,251 36,269 $ 300,392Shares issued through acquisition(a) — — — — — —Shares issued as reinvestment of distributions 7,619 94,478 29,671 874,507 1,522 12,576Less shares redeemed (270,225) (3,373,094) (170,807) (5,049,308) (39,542) (320,649)Net increase (decrease) (206,280) $ (2,602,932) (43,840) $ (1,284,550) (1,751) $ (7,681)
* Class B shares continue to be outstanding but are no longer an offered class of shares.
(a) See Note 1 of Notes to Financial Statements.
www.calamos.com 175
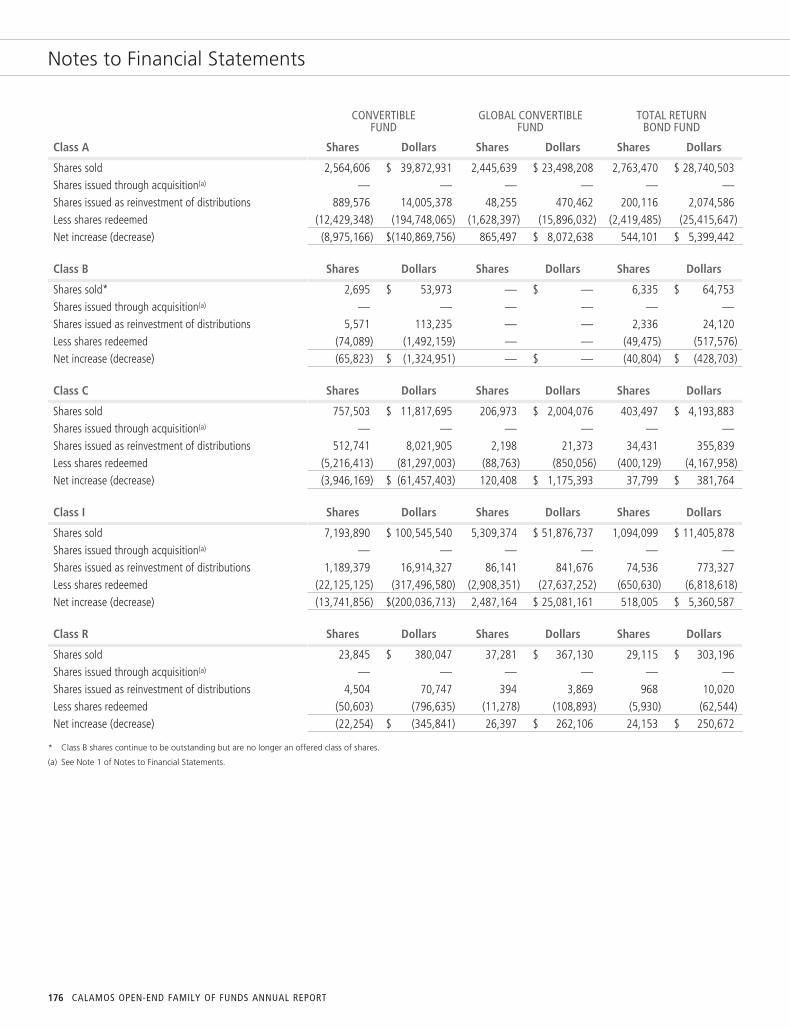
Notes to Financial Statements
CONVERTIBLEFUND
GLOBAL CONVERTIBLEFUND
TOTAL RETURNBOND FUND
Class A Shares Dollars Shares Dollars Shares Dollars
Shares sold 2,564,606 $ 39,872,931 2,445,639 $ 23,498,208 2,763,470 $ 28,740,503Shares issued through acquisition(a) — — — — — —Shares issued as reinvestment of distributions 889,576 14,005,378 48,255 470,462 200,116 2,074,586Less shares redeemed (12,429,348) (194,748,065) (1,628,397) (15,896,032) (2,419,485) (25,415,647)Net increase (decrease) (8,975,166) $(140,869,756) 865,497 $ 8,072,638 544,101 $ 5,399,442
Class B Shares Dollars Shares Dollars Shares Dollars
Shares sold* 2,695 $ 53,973 — $ — 6,335 $ 64,753Shares issued through acquisition(a) — — — — — —Shares issued as reinvestment of distributions 5,571 113,235 — — 2,336 24,120Less shares redeemed (74,089) (1,492,159) — — (49,475) (517,576)Net increase (decrease) (65,823) $ (1,324,951) — $ — (40,804) $ (428,703)
Class C Shares Dollars Shares Dollars Shares Dollars
Shares sold 757,503 $ 11,817,695 206,973 $ 2,004,076 403,497 $ 4,193,883Shares issued through acquisition(a) — — — — — —Shares issued as reinvestment of distributions 512,741 8,021,905 2,198 21,373 34,431 355,839Less shares redeemed (5,216,413) (81,297,003) (88,763) (850,056) (400,129) (4,167,958)Net increase (decrease) (3,946,169) $ (61,457,403) 120,408 $ 1,175,393 37,799 $ 381,764
Class I Shares Dollars Shares Dollars Shares Dollars
Shares sold 7,193,890 $ 100,545,540 5,309,374 $ 51,876,737 1,094,099 $ 11,405,878Shares issued through acquisition(a) — — — — — —Shares issued as reinvestment of distributions 1,189,379 16,914,327 86,141 841,676 74,536 773,327Less shares redeemed (22,125,125) (317,496,580) (2,908,351) (27,637,252) (650,630) (6,818,618)Net increase (decrease) (13,741,856) $(200,036,713) 2,487,164 $ 25,081,161 518,005 $ 5,360,587
Class R Shares Dollars Shares Dollars Shares Dollars
Shares sold 23,845 $ 380,047 37,281 $ 367,130 29,115 $ 303,196Shares issued through acquisition(a) — — — — — —Shares issued as reinvestment of distributions 4,504 70,747 394 3,869 968 10,020Less shares redeemed (50,603) (796,635) (11,278) (108,893) (5,930) (62,544)Net increase (decrease) (22,254) $ (345,841) 26,397 $ 262,106 24,153 $ 250,672
* Class B shares continue to be outstanding but are no longer an offered class of shares.
(a) See Note 1 of Notes to Financial Statements.
176 CALAMOS OPEN-END FAMILY OF FUNDS ANNUAL REPORT
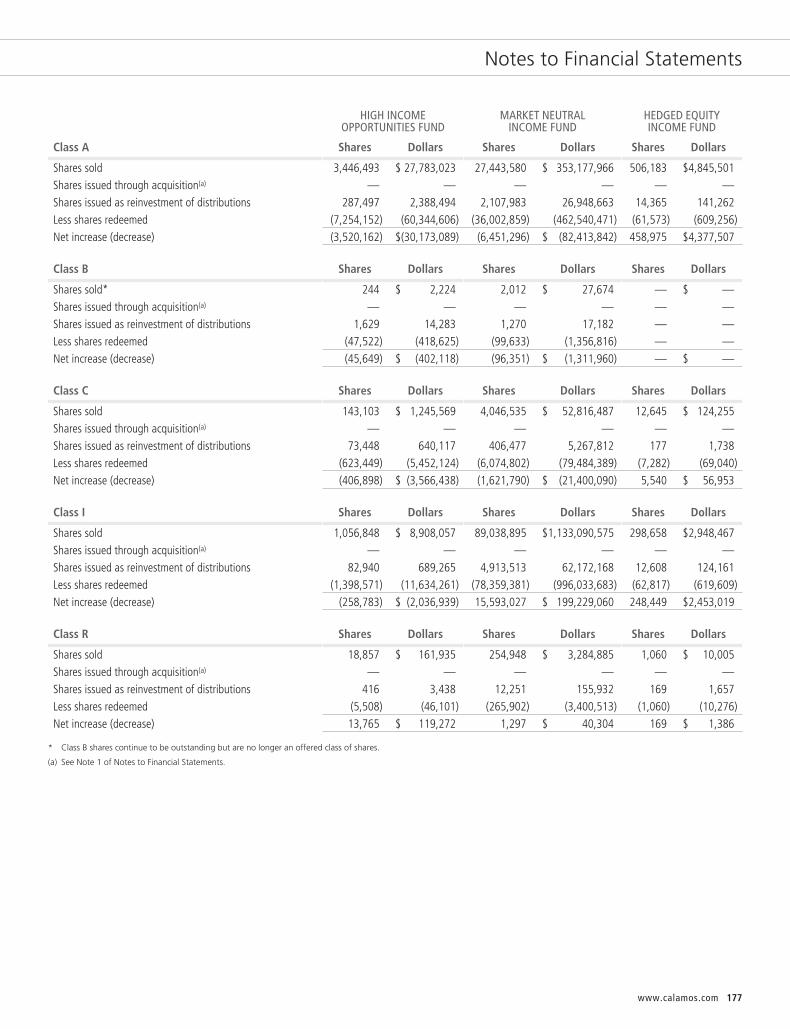
Notes to Financial Statements
HIGH INCOMEOPPORTUNITIES FUND
MARKET NEUTRALINCOME FUND
HEDGED EQUITYINCOME FUND
Class A Shares Dollars Shares Dollars Shares Dollars
Shares sold 3,446,493 $ 27,783,023 27,443,580 $ 353,177,966 506,183 $4,845,501Shares issued through acquisition(a) — — — — — —Shares issued as reinvestment of distributions 287,497 2,388,494 2,107,983 26,948,663 14,365 141,262Less shares redeemed (7,254,152) (60,344,606) (36,002,859) (462,540,471) (61,573) (609,256)Net increase (decrease) (3,520,162) $(30,173,089) (6,451,296) $ (82,413,842) 458,975 $4,377,507
Class B Shares Dollars Shares Dollars Shares Dollars
Shares sold* 244 $ 2,224 2,012 $ 27,674 — $ —Shares issued through acquisition(a) — — — — — —Shares issued as reinvestment of distributions 1,629 14,283 1,270 17,182 — —Less shares redeemed (47,522) (418,625) (99,633) (1,356,816) — —Net increase (decrease) (45,649) $ (402,118) (96,351) $ (1,311,960) — $ —
Class C Shares Dollars Shares Dollars Shares Dollars
Shares sold 143,103 $ 1,245,569 4,046,535 $ 52,816,487 12,645 $ 124,255Shares issued through acquisition(a) — — — — — —Shares issued as reinvestment of distributions 73,448 640,117 406,477 5,267,812 177 1,738Less shares redeemed (623,449) (5,452,124) (6,074,802) (79,484,389) (7,282) (69,040)Net increase (decrease) (406,898) $ (3,566,438) (1,621,790) $ (21,400,090) 5,540 $ 56,953
Class I Shares Dollars Shares Dollars Shares Dollars
Shares sold 1,056,848 $ 8,908,057 89,038,895 $1,133,090,575 298,658 $2,948,467Shares issued through acquisition(a) — — — — — —Shares issued as reinvestment of distributions 82,940 689,265 4,913,513 62,172,168 12,608 124,161Less shares redeemed (1,398,571) (11,634,261) (78,359,381) (996,033,683) (62,817) (619,609)Net increase (decrease) (258,783) $ (2,036,939) 15,593,027 $ 199,229,060 248,449 $2,453,019
Class R Shares Dollars Shares Dollars Shares Dollars
Shares sold 18,857 $ 161,935 254,948 $ 3,284,885 1,060 $ 10,005Shares issued through acquisition(a) — — — — — —Shares issued as reinvestment of distributions 416 3,438 12,251 155,932 169 1,657Less shares redeemed (5,508) (46,101) (265,902) (3,400,513) (1,060) (10,276)Net increase (decrease) 13,765 $ 119,272 1,297 $ 40,304 169 $ 1,386
* Class B shares continue to be outstanding but are no longer an offered class of shares.
(a) See Note 1 of Notes to Financial Statements.
www.calamos.com 177
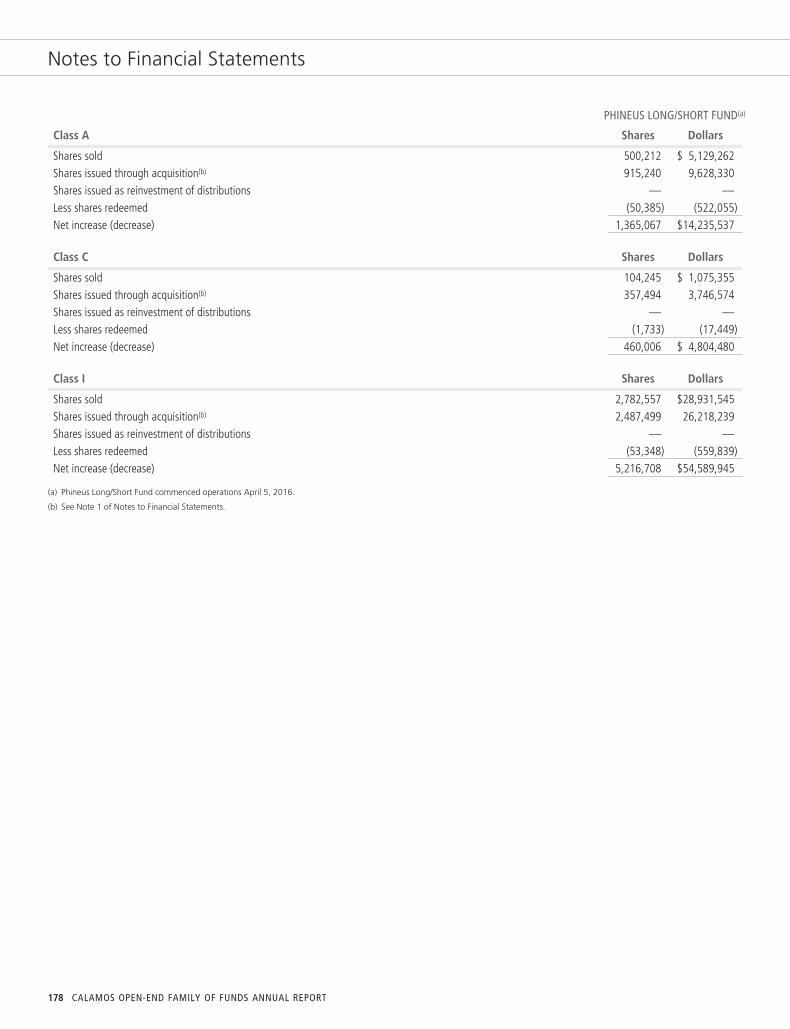
Notes to Financial Statements
PHINEUS LONG/SHORT FUND(a)
Class A Shares Dollars
Shares sold 500,212 $ 5,129,262Shares issued through acquisition(b) 915,240 9,628,330Shares issued as reinvestment of distributions — —Less shares redeemed (50,385) (522,055)Net increase (decrease) 1,365,067 $14,235,537
Class C Shares Dollars
Shares sold 104,245 $ 1,075,355Shares issued through acquisition(b) 357,494 3,746,574Shares issued as reinvestment of distributions — —Less shares redeemed (1,733) (17,449)Net increase (decrease) 460,006 $ 4,804,480
Class I Shares Dollars
Shares sold 2,782,557 $28,931,545Shares issued through acquisition(b) 2,487,499 26,218,239Shares issued as reinvestment of distributions — —Less shares redeemed (53,348) (559,839)Net increase (decrease) 5,216,708 $54,589,945
(a) Phineus Long/Short Fund commenced operations April 5, 2016.
(b) See Note 1 of Notes to Financial Statements.
178 CALAMOS OPEN-END FAMILY OF FUNDS ANNUAL REPORT

Calamos Growth Fund Financial Highlights
Selected data for a share outstanding throughout each year were as follows:
Class AYear Ended October 31,
2017 2016 2015 2014 2013
Net asset value, beginning of year $30.12 $42.80 $50.16 $58.75 $49.90
Income from investment operations:Net investment income (loss)(a) (0.17) (0.07) (0.07) (0.20) (0.05)
Net realized and unrealized gain (loss) 6.79 (1.67) 2.84 6.90 12.63
Total from investment operations 6.62 (1.74) 2.77 6.70 12.58
Distributions:Dividends from net investment income — — — — —
Dividends from net realized gains (1.20) (10.94) (10.13) (15.29) (3.73)
Total distributions (1.20) (10.94) (10.13) (15.29) (3.73)
Net asset value, end of year $35.54 $30.12 $42.80 $50.16 $58.75
Ratios and supplemental data:Total return(b) 22.79% (4.76%) 6.55% 13.84% 26.95%
Net assets, end of year (000) $967,725 $1,017,541 $1,424,967 $1,718,674 $2,237,328
Ratio of net expenses to average net assets 1.39% 1.34% 1.31% 1.26% 1.26%
Ratio of gross expenses to average net assets prior to expense reductions 1.39% 1.34% 1.31% 1.26% 1.26%
Ratio of net investment income (loss) to average net assets (0.52%) (0.21%) (0.17%) (0.42%) (0.10%)
Year Ended October 31,2017 2016 2015 2014 2013
Portfolio turnover rate 104.4% 90.0% 60.0% 41.8% 67.1%
Class CYear Ended October 31,
2017 2016 2015 2014 2013
Net asset value, beginning of year $21.08 $33.48 $41.66 $51.58 $44.56
Income from investment operations:Net investment income (loss)(a) (0.28) (0.21) (0.32) (0.48) (0.38)
Net realized and unrealized gain (loss) 4.66 (1.25) 2.27 5.85 11.13
Total from investment operations 4.38 (1.46) 1.95 5.37 10.75
Distributions:Dividends from net investment income — — — — —
Dividends from net realized gains (1.20) (10.94) (10.13) (15.29) (3.73)
Total distributions (1.20) (10.94) (10.13) (15.29) (3.73)
Net asset value, end of year $24.26 $21.08 $33.48 $41.66 $51.58
Ratios and supplemental data:Total return(b) 21.85% (5.45%) 5.75% 12.97% 26.00%
Net assets, end of year (000) $398,115 $540,422 $792,046 $959,445 $1,096,492
Ratio of net expenses to average net assets 2.14% 2.09% 2.06% 2.01% 2.01%
Ratio of gross expenses to average net assets prior to expense reductions 2.14% 2.09% 2.06% 2.01% 2.01%
Ratio of net investment income (loss) to average net assets (1.26%) (0.96%) (0.92%) (1.17%) (0.85%)
(a) Net investment income (loss) allocated based on average shares method.
(b) Total return measures net investment income (loss) and capital gain or loss from portfolio investments assuming reinvestment of dividends and capital gains distributions. Total return isnot annualized for periods that are less than a full year, does not reflect the effect of sales charge for Class A shares nor the contingent deferred sales charge for Class B and C sharesand does not reflect the deduction of taxes that a shareholder would pay on fund distributions or the redemption of fund shares.
www.calamos.com 179

Calamos Growth Fund Financial Highlights
Class IYear Ended October 31,
2017 2016 2015 2014 2013
Net asset value, beginning of year $37.88 $50.84 $57.59 $65.15 $54.81
Income from investment operations:Net investment income (loss)(a) (0.11) 0.02 0.05 (0.10) 0.08
Net realized and unrealized gain (loss) 8.61 (2.04) 3.33 7.83 13.99
Total from investment operations 8.50 (2.02) 3.38 7.73 14.07
Distributions:Dividends from net investment income — — — — —
Dividends from net realized gains (1.20) (10.94) (10.13) (15.29) (3.73)
Total distributions (1.20) (10.94) (10.13) (15.29) (3.73)
Net asset value, end of year $45.18 $37.88 $50.84 $57.59 $65.15
Ratios and supplemental data:Total return(b) 23.09% (4.51%) 6.80% 14.12% 27.27%
Net assets, end of year (000) $301,237 $327,872 $480,028 $759,432 $1,010,805
Ratio of net expenses to average net assets 1.14% 1.09% 1.06% 1.01% 1.02%
Ratio of gross expenses to average net assets prior to expense reductions 1.14% 1.09% 1.06% 1.01% 1.02%
Ratio of net investment income (loss) to average net assets (0.27%) 0.04% 0.09% (0.18%) 0.15%
Class RYear Ended October 31,
2017 2016 2015 2014 2013
Net asset value, beginning of year $28.55 $41.22 $48.78 $57.65 $49.15
Income from investment operations:Net investment income (loss)(a) (0.23) (0.14) (0.18) (0.32) (0.18)
Net realized and unrealized gain (loss) 6.40 (1.59) 2.75 6.74 12.41
Total from investment operations 6.17 (1.73) 2.57 6.42 12.23
Distributions:Dividends from net investment income — — — — —
Dividends from net realized gains (1.20) (10.94) (10.13) (15.29) (3.73)
Total distributions (1.20) (10.94) (10.13) (15.29) (3.73)
Net asset value, end of year $33.52 $28.55 $41.22 $48.78 $57.65
Ratios and supplemental data:Total return(b) 22.46% (4.96%) 6.28% 13.56% 26.62%
Net assets, end of year (000) $5,350 $7,417 $8,966 $10,089 $11,634
Ratio of net expenses to average net assets 1.64% 1.59% 1.56% 1.51% 1.51%
Ratio of gross expenses to average net assets prior to expense reductions 1.64% 1.59% 1.56% 1.51% 1.51%
Ratio of net investment income (loss) to average net assets (0.76%) (0.46%) (0.43%) (0.67%) (0.35%)
(a) Net investment income (loss) allocated based on average shares method.
(b) Total return measures net investment income (loss) and capital gain or loss from portfolio investments assuming reinvestment of dividends and capital gains distributions. Total return isnot annualized for periods that are less than a full year, does not reflect the effect of sales charge for Class A shares nor the contingent deferred sales charge for Class B and C sharesand does not reflect the deduction of taxes that a shareholder would pay on fund distributions or the redemption of fund shares.
180 CALAMOS OPEN-END FAMILY OF FUNDS ANNUAL REPORT
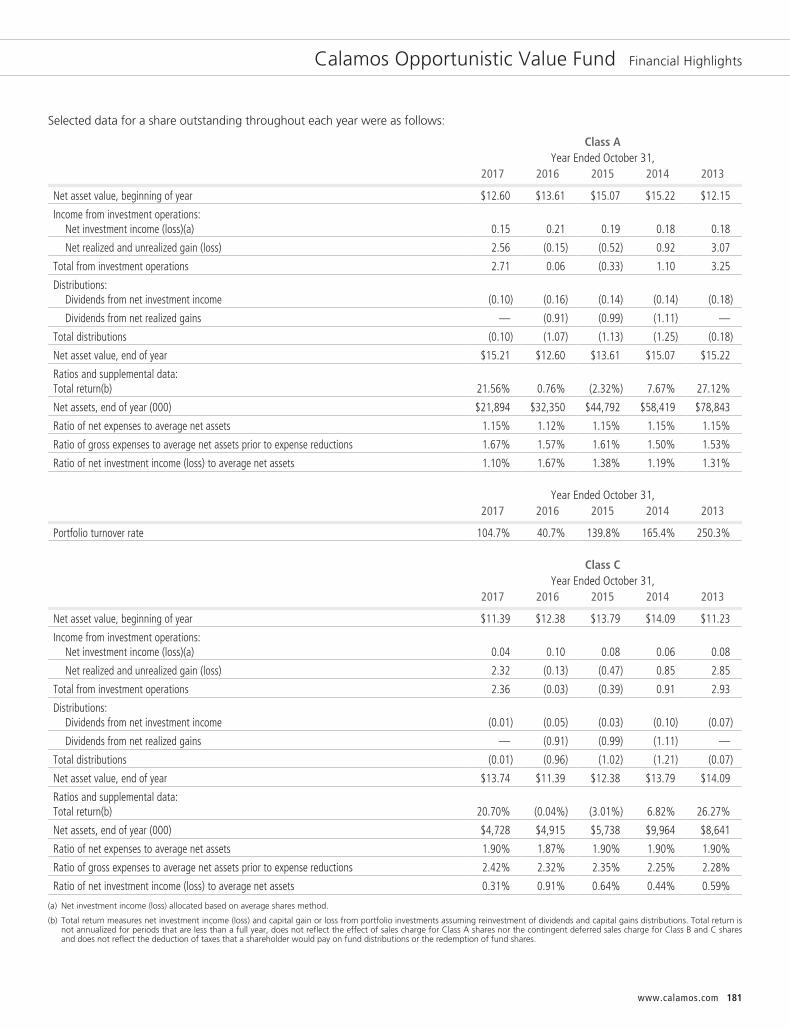
Calamos Opportunistic Value Fund Financial Highlights
Selected data for a share outstanding throughout each year were as follows:
Class AYear Ended October 31,
2017 2016 2015 2014 2013
Net asset value, beginning of year $12.60 $13.61 $15.07 $15.22 $12.15
Income from investment operations:Net investment income (loss)(a) 0.15 0.21 0.19 0.18 0.18
Net realized and unrealized gain (loss) 2.56 (0.15) (0.52) 0.92 3.07
Total from investment operations 2.71 0.06 (0.33) 1.10 3.25
Distributions:Dividends from net investment income (0.10) (0.16) (0.14) (0.14) (0.18)
Dividends from net realized gains — (0.91) (0.99) (1.11) —
Total distributions (0.10) (1.07) (1.13) (1.25) (0.18)
Net asset value, end of year $15.21 $12.60 $13.61 $15.07 $15.22
Ratios and supplemental data:Total return(b) 21.56% 0.76% (2.32%) 7.67% 27.12%
Net assets, end of year (000) $21,894 $32,350 $44,792 $58,419 $78,843
Ratio of net expenses to average net assets 1.15% 1.12% 1.15% 1.15% 1.15%
Ratio of gross expenses to average net assets prior to expense reductions 1.67% 1.57% 1.61% 1.50% 1.53%
Ratio of net investment income (loss) to average net assets 1.10% 1.67% 1.38% 1.19% 1.31%
Year Ended October 31,2017 2016 2015 2014 2013
Portfolio turnover rate 104.7% 40.7% 139.8% 165.4% 250.3%
Class CYear Ended October 31,
2017 2016 2015 2014 2013
Net asset value, beginning of year $11.39 $12.38 $13.79 $14.09 $11.23
Income from investment operations:Net investment income (loss)(a) 0.04 0.10 0.08 0.06 0.08
Net realized and unrealized gain (loss) 2.32 (0.13) (0.47) 0.85 2.85
Total from investment operations 2.36 (0.03) (0.39) 0.91 2.93
Distributions:Dividends from net investment income (0.01) (0.05) (0.03) (0.10) (0.07)
Dividends from net realized gains — (0.91) (0.99) (1.11) —
Total distributions (0.01) (0.96) (1.02) (1.21) (0.07)
Net asset value, end of year $13.74 $11.39 $12.38 $13.79 $14.09
Ratios and supplemental data:Total return(b) 20.70% (0.04%) (3.01%) 6.82% 26.27%
Net assets, end of year (000) $4,728 $4,915 $5,738 $9,964 $8,641
Ratio of net expenses to average net assets 1.90% 1.87% 1.90% 1.90% 1.90%
Ratio of gross expenses to average net assets prior to expense reductions 2.42% 2.32% 2.35% 2.25% 2.28%
Ratio of net investment income (loss) to average net assets 0.31% 0.91% 0.64% 0.44% 0.59%
(a) Net investment income (loss) allocated based on average shares method.
(b) Total return measures net investment income (loss) and capital gain or loss from portfolio investments assuming reinvestment of dividends and capital gains distributions. Total return isnot annualized for periods that are less than a full year, does not reflect the effect of sales charge for Class A shares nor the contingent deferred sales charge for Class B and C sharesand does not reflect the deduction of taxes that a shareholder would pay on fund distributions or the redemption of fund shares.
www.calamos.com 181
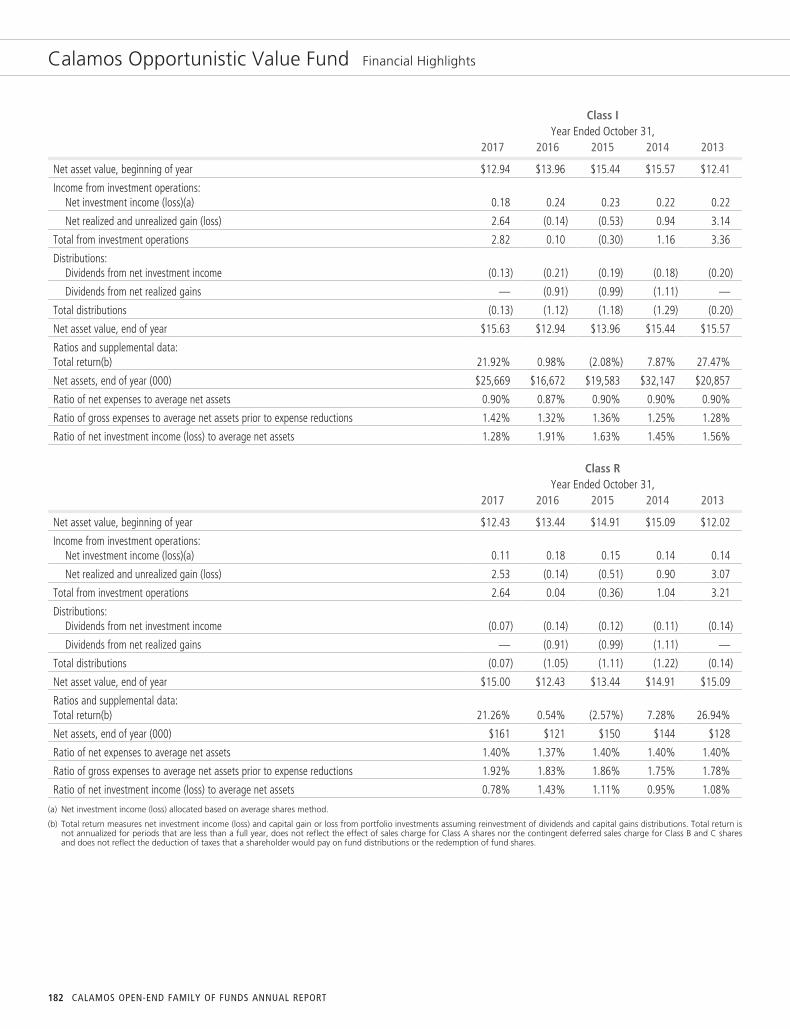
Calamos Opportunistic Value Fund Financial Highlights
Class IYear Ended October 31,
2017 2016 2015 2014 2013
Net asset value, beginning of year $12.94 $13.96 $15.44 $15.57 $12.41
Income from investment operations:Net investment income (loss)(a) 0.18 0.24 0.23 0.22 0.22
Net realized and unrealized gain (loss) 2.64 (0.14) (0.53) 0.94 3.14
Total from investment operations 2.82 0.10 (0.30) 1.16 3.36
Distributions:Dividends from net investment income (0.13) (0.21) (0.19) (0.18) (0.20)
Dividends from net realized gains — (0.91) (0.99) (1.11) —
Total distributions (0.13) (1.12) (1.18) (1.29) (0.20)
Net asset value, end of year $15.63 $12.94 $13.96 $15.44 $15.57
Ratios and supplemental data:Total return(b) 21.92% 0.98% (2.08%) 7.87% 27.47%
Net assets, end of year (000) $25,669 $16,672 $19,583 $32,147 $20,857
Ratio of net expenses to average net assets 0.90% 0.87% 0.90% 0.90% 0.90%
Ratio of gross expenses to average net assets prior to expense reductions 1.42% 1.32% 1.36% 1.25% 1.28%
Ratio of net investment income (loss) to average net assets 1.28% 1.91% 1.63% 1.45% 1.56%
Class RYear Ended October 31,
2017 2016 2015 2014 2013
Net asset value, beginning of year $12.43 $13.44 $14.91 $15.09 $12.02
Income from investment operations:Net investment income (loss)(a) 0.11 0.18 0.15 0.14 0.14
Net realized and unrealized gain (loss) 2.53 (0.14) (0.51) 0.90 3.07
Total from investment operations 2.64 0.04 (0.36) 1.04 3.21
Distributions:Dividends from net investment income (0.07) (0.14) (0.12) (0.11) (0.14)
Dividends from net realized gains — (0.91) (0.99) (1.11) —
Total distributions (0.07) (1.05) (1.11) (1.22) (0.14)
Net asset value, end of year $15.00 $12.43 $13.44 $14.91 $15.09
Ratios and supplemental data:Total return(b) 21.26% 0.54% (2.57%) 7.28% 26.94%
Net assets, end of year (000) $161 $121 $150 $144 $128
Ratio of net expenses to average net assets 1.40% 1.37% 1.40% 1.40% 1.40%
Ratio of gross expenses to average net assets prior to expense reductions 1.92% 1.83% 1.86% 1.75% 1.78%
Ratio of net investment income (loss) to average net assets 0.78% 1.43% 1.11% 0.95% 1.08%
(a) Net investment income (loss) allocated based on average shares method.
(b) Total return measures net investment income (loss) and capital gain or loss from portfolio investments assuming reinvestment of dividends and capital gains distributions. Total return isnot annualized for periods that are less than a full year, does not reflect the effect of sales charge for Class A shares nor the contingent deferred sales charge for Class B and C sharesand does not reflect the deduction of taxes that a shareholder would pay on fund distributions or the redemption of fund shares.
182 CALAMOS OPEN-END FAMILY OF FUNDS ANNUAL REPORT
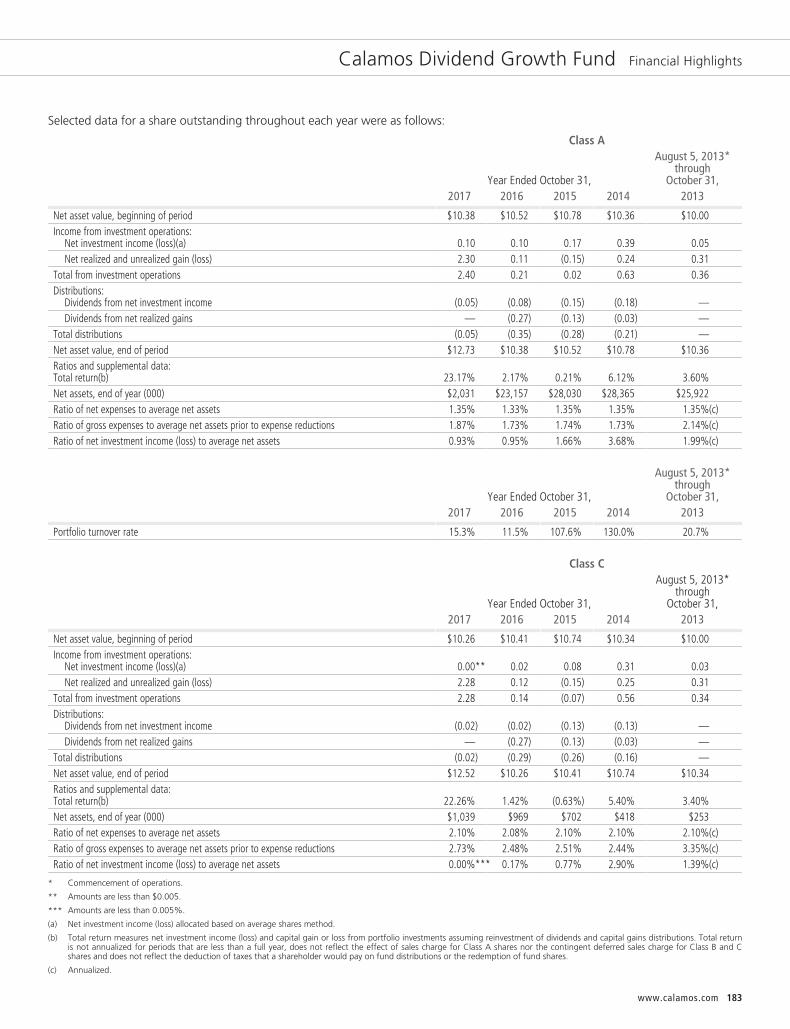
Calamos Dividend Growth Fund Financial Highlights
Selected data for a share outstanding throughout each year were as follows:
Class A
Year Ended October 31,
August 5, 2013*through
October 31,2017 2016 2015 2014 2013
Net asset value, beginning of period $10.38 $10.52 $10.78 $10.36 $10.00Income from investment operations:
Net investment income (loss)(a) 0.10 0.10 0.17 0.39 0.05Net realized and unrealized gain (loss) 2.30 0.11 (0.15) 0.24 0.31
Total from investment operations 2.40 0.21 0.02 0.63 0.36Distributions:
Dividends from net investment income (0.05) (0.08) (0.15) (0.18) —Dividends from net realized gains — (0.27) (0.13) (0.03) —
Total distributions (0.05) (0.35) (0.28) (0.21) —Net asset value, end of period $12.73 $10.38 $10.52 $10.78 $10.36Ratios and supplemental data:Total return(b) 23.17% 2.17% 0.21% 6.12% 3.60%Net assets, end of year (000) $2,031 $23,157 $28,030 $28,365 $25,922Ratio of net expenses to average net assets 1.35% 1.33% 1.35% 1.35% 1.35%(c)Ratio of gross expenses to average net assets prior to expense reductions 1.87% 1.73% 1.74% 1.73% 2.14%(c)Ratio of net investment income (loss) to average net assets 0.93% 0.95% 1.66% 3.68% 1.99%(c)
Year Ended October 31,
August 5, 2013*through
October 31,2017 2016 2015 2014 2013
Portfolio turnover rate 15.3% 11.5% 107.6% 130.0% 20.7%
Class C
Year Ended October 31,
August 5, 2013*through
October 31,2017 2016 2015 2014 2013
Net asset value, beginning of period $10.26 $10.41 $10.74 $10.34 $10.00Income from investment operations:
Net investment income (loss)(a) 0.00** 0.02 0.08 0.31 0.03Net realized and unrealized gain (loss) 2.28 0.12 (0.15) 0.25 0.31
Total from investment operations 2.28 0.14 (0.07) 0.56 0.34Distributions:
Dividends from net investment income (0.02) (0.02) (0.13) (0.13) —Dividends from net realized gains — (0.27) (0.13) (0.03) —
Total distributions (0.02) (0.29) (0.26) (0.16) —Net asset value, end of period $12.52 $10.26 $10.41 $10.74 $10.34Ratios and supplemental data:Total return(b) 22.26% 1.42% (0.63%) 5.40% 3.40%Net assets, end of year (000) $1,039 $969 $702 $418 $253Ratio of net expenses to average net assets 2.10% 2.08% 2.10% 2.10% 2.10%(c)Ratio of gross expenses to average net assets prior to expense reductions 2.73% 2.48% 2.51% 2.44% 3.35%(c)Ratio of net investment income (loss) to average net assets 0.00%*** 0.17% 0.77% 2.90% 1.39%(c)
* Commencement of operations.
** Amounts are less than $0.005.
*** Amounts are less than 0.005%.
(a) Net investment income (loss) allocated based on average shares method.
(b) Total return measures net investment income (loss) and capital gain or loss from portfolio investments assuming reinvestment of dividends and capital gains distributions. Total returnis not annualized for periods that are less than a full year, does not reflect the effect of sales charge for Class A shares nor the contingent deferred sales charge for Class B and Cshares and does not reflect the deduction of taxes that a shareholder would pay on fund distributions or the redemption of fund shares.
(c) Annualized.
www.calamos.com 183

Calamos Dividend Growth Fund Financial Highlights
Class I
Year Ended October 31,
August 5, 2013*through
October 31,2017 2016 2015 2014 2013
Net asset value, beginning of period $10.39 $10.55 $10.79 $10.37 $10.00
Income from investment operations:Net investment income (loss)(a) 0.11 0.12 0.20 0.42 0.05
Net realized and unrealized gain (loss) 2.32 0.12 (0.16) 0.23 0.32
Total from investment operations 2.43 0.24 0.04 0.65 0.37
Distributions:Dividends from net investment income (0.11) (0.13) (0.15) (0.20) —
Dividends from net realized gains — (0.27) (0.13) (0.03) —
Total distributions (0.11) (0.40) (0.28) (0.23) —
Net asset value, end of period $12.71 $10.39 $10.55 $10.79 $10.37
Ratios and supplemental data:Total return(b) 23.46% 2.39% 0.47% 6.33% 3.70%
Net assets, end of year (000) $22,201 $7,989 $7,375 $8,020 $7,586
Ratio of net expenses to average net assets 1.10% 1.08% 1.10% 1.10% 1.10%(c)
Ratio of gross expenses to average net assets prior to expense reductions 1.80% 1.48% 1.49% 1.48% 2.13%(c)
Ratio of net investment income (loss) to average net assets 0.89% 1.17% 1.91% 3.97% 2.13%(c)
* Commencement of operations.
(a) Net investment income (loss) allocated based on average shares method.
(b) Total return measures net investment income (loss) and capital gain or loss from portfolio investments assuming reinvestment of dividends and capital gains distributions. Total return isnot annualized for periods that are less than a full year, does not reflect the effect of sales charge for Class A shares nor the contingent deferred sales charge for Class B and C sharesand does not reflect the deduction of taxes that a shareholder would pay on fund distributions or the redemption of fund shares.
(c) Annualized.
184 CALAMOS OPEN-END FAMILY OF FUNDS ANNUAL REPORT

Calamos International Growth Fund Financial Highlights
Selected data for a share outstanding throughout each year were as follows:
Class AYear Ended October 31,
2017 2016 2015 2014 2013
Net asset value, beginning of year $16.65 $17.27 $19.27 $19.24 $17.27
Income from investment operations:Net investment income (loss)(a) 0.07 0.05 0.09 0.09 0.09
Net realized and unrealized gain (loss) 4.83 (0.65) 0.02 0.02 1.92
Total from investment operations 4.90 (0.60) 0.11 0.11 2.01
Distributions:Dividends from net investment income — — — (0.08) (0.04)
Dividends from net realized gains — (0.02) (2.11) — —
Return of capital — (0.00)* — — —
Total distributions — (0.02) (2.11) (0.08) (0.04)
Net asset value, end of year $21.55 $16.65 $17.27 $19.27 $19.24
Ratios and supplemental data:Total return(b) 29.43% (3.46%) 0.94% 0.57% 11.64%
Net assets, end of year (000) $72,491 $111,036 $209,548 $254,400 $368,964
Ratio of net expenses to average net assets 1.40% 1.38% 1.31% 1.39% 1.40%
Ratio of gross expenses to average net assets prior to expense reductions 1.46% 1.39% 1.31% 1.39% 1.48%
Ratio of net investment income (loss) to average net assets 0.41% 0.32% 0.52% 0.43% 0.50%
Year Ended October 31,2017 2016 2015 2014 2013
Portfolio turnover rate 100.4% 69.0% 65.0% 81.6% 73.4%
Class CYear Ended October 31,
2017 2016 2015 2014 2013
Net asset value, beginning of year $15.35 $16.04 $18.18 $18.21 $16.43
Income from investment operations:Net investment income (loss)(a) (0.05) (0.07) (0.04) (0.06) (0.04)
Net realized and unrealized gain (loss) 4.42 (0.60) 0.01 0.03 1.82
Total from investment operations 4.37 (0.67) (0.03) (0.03) 1.78
Distributions:Dividends from net investment income — — — — —
Dividends from net realized gains — (0.02) (2.11) — —
Return of capital — (0.00)* — — —
Total distributions — (0.02) (2.11) — —
Net asset value, end of year $19.72 $15.35 $16.04 $18.18 $18.21
Ratios and supplemental data:Total return(b) 28.47% (4.16%) 0.15% (0.16%) 10.83%
Net assets, end of year (000) $27,840 $35,537 $47,996 $59,756 $65,622
Ratio of net expenses to average net assets 2.15% 2.13% 2.06% 2.13% 2.15%
Ratio of gross expenses to average net assets prior to expense reductions 2.21% 2.14% 2.06% 2.13% 2.23%
Ratio of net investment income (loss) to average net assets (0.33%) (0.46%) (0.23%) (0.32%) (0.23%)
* Amounts are less than $0.005.
(a) Net investment income (loss) allocated based on average shares method.
(b) Total return measures net investment income (loss) and capital gain or loss from portfolio investments assuming reinvestment of dividends and capital gains distributions. Total return isnot annualized for periods that are less than a full year, does not reflect the effect of sales charge for Class A shares nor the contingent deferred sales charge for Class B and C sharesand does not reflect the deduction of taxes that a shareholder would pay on fund distributions or the redemption of fund shares.
www.calamos.com 185
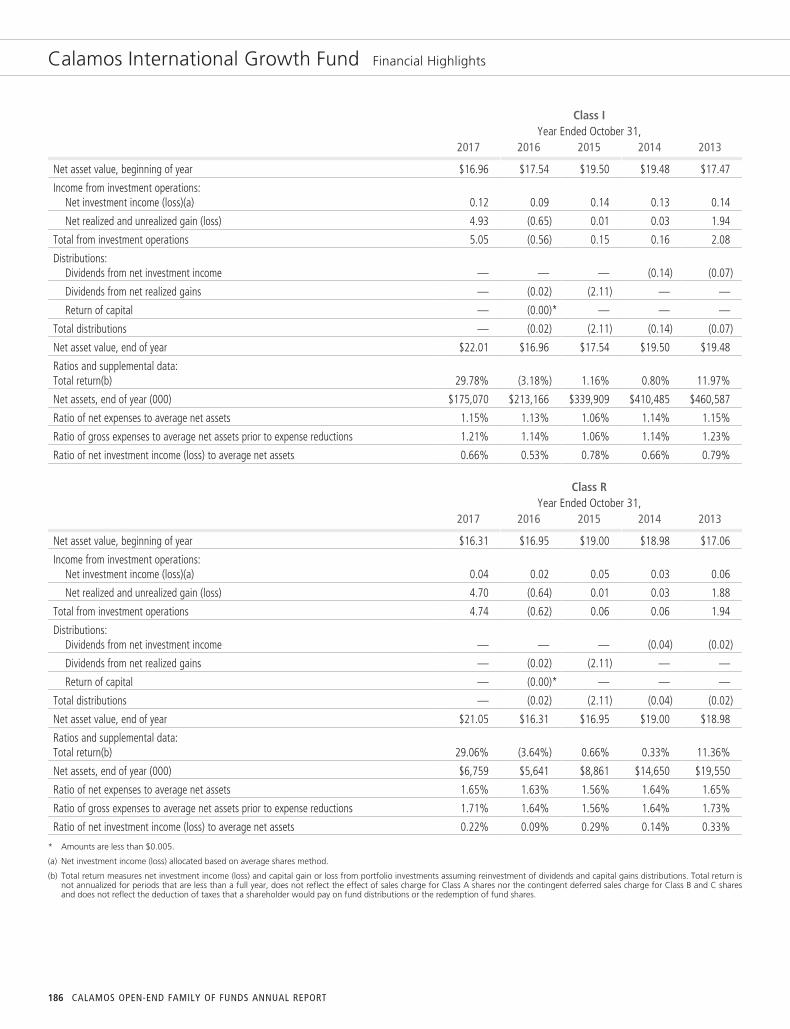
Calamos International Growth Fund Financial Highlights
Class IYear Ended October 31,
2017 2016 2015 2014 2013
Net asset value, beginning of year $16.96 $17.54 $19.50 $19.48 $17.47
Income from investment operations:Net investment income (loss)(a) 0.12 0.09 0.14 0.13 0.14
Net realized and unrealized gain (loss) 4.93 (0.65) 0.01 0.03 1.94
Total from investment operations 5.05 (0.56) 0.15 0.16 2.08
Distributions:Dividends from net investment income — — — (0.14) (0.07)
Dividends from net realized gains — (0.02) (2.11) — —
Return of capital — (0.00)* — — —
Total distributions — (0.02) (2.11) (0.14) (0.07)
Net asset value, end of year $22.01 $16.96 $17.54 $19.50 $19.48
Ratios and supplemental data:Total return(b) 29.78% (3.18%) 1.16% 0.80% 11.97%
Net assets, end of year (000) $175,070 $213,166 $339,909 $410,485 $460,587
Ratio of net expenses to average net assets 1.15% 1.13% 1.06% 1.14% 1.15%
Ratio of gross expenses to average net assets prior to expense reductions 1.21% 1.14% 1.06% 1.14% 1.23%
Ratio of net investment income (loss) to average net assets 0.66% 0.53% 0.78% 0.66% 0.79%
Class RYear Ended October 31,
2017 2016 2015 2014 2013
Net asset value, beginning of year $16.31 $16.95 $19.00 $18.98 $17.06
Income from investment operations:Net investment income (loss)(a) 0.04 0.02 0.05 0.03 0.06
Net realized and unrealized gain (loss) 4.70 (0.64) 0.01 0.03 1.88
Total from investment operations 4.74 (0.62) 0.06 0.06 1.94
Distributions:Dividends from net investment income — — — (0.04) (0.02)
Dividends from net realized gains — (0.02) (2.11) — —
Return of capital — (0.00)* — — —
Total distributions — (0.02) (2.11) (0.04) (0.02)
Net asset value, end of year $21.05 $16.31 $16.95 $19.00 $18.98
Ratios and supplemental data:Total return(b) 29.06% (3.64%) 0.66% 0.33% 11.36%
Net assets, end of year (000) $6,759 $5,641 $8,861 $14,650 $19,550
Ratio of net expenses to average net assets 1.65% 1.63% 1.56% 1.64% 1.65%
Ratio of gross expenses to average net assets prior to expense reductions 1.71% 1.64% 1.56% 1.64% 1.73%
Ratio of net investment income (loss) to average net assets 0.22% 0.09% 0.29% 0.14% 0.33%
* Amounts are less than $0.005.
(a) Net investment income (loss) allocated based on average shares method.
(b) Total return measures net investment income (loss) and capital gain or loss from portfolio investments assuming reinvestment of dividends and capital gains distributions. Total return isnot annualized for periods that are less than a full year, does not reflect the effect of sales charge for Class A shares nor the contingent deferred sales charge for Class B and C sharesand does not reflect the deduction of taxes that a shareholder would pay on fund distributions or the redemption of fund shares.
186 CALAMOS OPEN-END FAMILY OF FUNDS ANNUAL REPORT

Calamos Evolving World Growth Fund Financial Highlights
Selected data for a share outstanding throughout each year were as follows:
Class AYear Ended October 31,
2017 2016 2015 2014 2013
Net asset value, beginning of year $12.11 $12.11 $13.73 $13.97 $12.83
Income from investment operations:Net investment income (loss)(a) 0.05 0.03 0.02 0.06 0.03
Net realized and unrealized gain (loss) 2.67 (0.02) (1.31) (0.18) 1.11
Total from investment operations 2.72 0.01 (1.29) (0.12) 1.14
Distributions:Dividends from net investment income — (0.01) (0.03) (0.01) —
Dividends from net realized gains — — (0.30) (0.11) —
Return of capital — (0.00)* (0.00)* — —
Total distributions — (0.01) (0.33) (0.12) —
Net asset value, end of year $14.83 $12.11 $12.11 $13.73 $13.97
Ratios and supplemental data:Total return(b) 22.46% 0.08% (9.56%) (0.84%) 8.89%
Net assets, end of year (000) $68,142 $102,545 $121,946 $168,332 $164,273
Ratio of net expenses to average net assets 1.67% 1.64% 1.65% 1.61% 1.63%
Ratio of gross expenses to average net assets prior to expense reductions 1.67% 1.64% 1.65% 1.61% 1.63%
Ratio of net investment income (loss) to average net assets 0.40% 0.23% 0.14% 0.45% 0.23%
Year Ended October 31,2017 2016 2015 2014 2013
Portfolio turnover rate 104.8% 87.4% 58.8% 99.9% 85.8%
Class CYear Ended October 31,
2017 2016 2015 2014 2013
Net asset value, beginning of year $11.55 $11.62 $13.26 $13.59 $12.57
Income from investment operations:Net investment income (loss)(a) (0.03) (0.06) (0.07) (0.04) (0.06)
Net realized and unrealized gain (loss) 2.51 (0.01) (1.27) (0.18) 1.08
Total from investment operations 2.48 (0.07) (1.34) (0.22) 1.02
Distributions:Dividends from net investment income — — — — —
Dividends from net realized gains — — (0.30) (0.11) —
Return of capital — (0.00)* (0.00)* — —
Total distributions — — (0.30) (0.11) —
Net asset value, end of year $14.03 $11.55 $11.62 $13.26 $13.59
Ratios and supplemental data:Total return(b) 21.47% (0.60%) (10.25%) (1.59%) 8.11%
Net assets, end of year (000) $24,846 $31,231 $36,532 $44,611 $34,022
Ratio of net expenses to average net assets 2.41% 2.39% 2.40% 2.37% 2.39%
Ratio of gross expenses to average net assets prior to expense reductions 2.41% 2.39% 2.40% 2.37% 2.39%
Ratio of net investment income (loss) to average net assets (0.29%) (0.54%) (0.59%) (0.33%) (0.50%)
* Amounts are less than $0.005.
(a) Net investment income (loss) allocated based on average shares method.
(b) Total return measures net investment income (loss) and capital gain or loss from portfolio investments assuming reinvestment of dividends and capital gains distributions. Total return isnot annualized for periods that are less than a full year, does not reflect the effect of sales charge for Class A shares nor the contingent deferred sales charge for Class B and C sharesand does not reflect the deduction of taxes that a shareholder would pay on fund distributions or the redemption of fund shares.
www.calamos.com 187
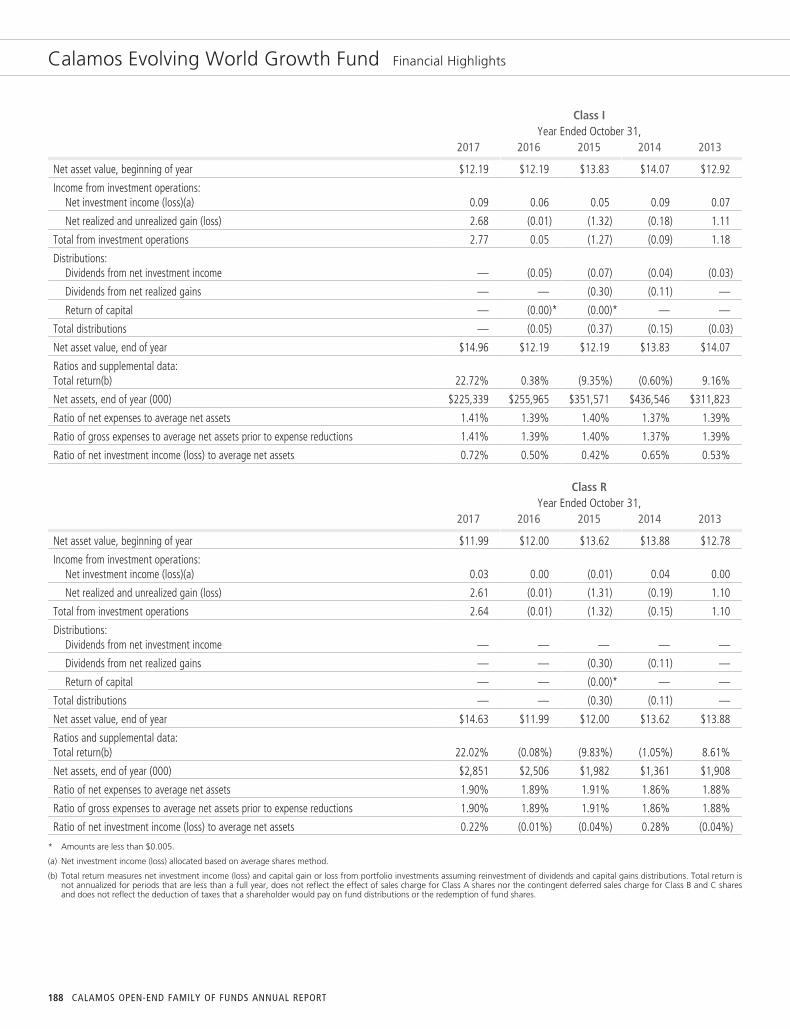
Calamos Evolving World Growth Fund Financial Highlights
Class IYear Ended October 31,
2017 2016 2015 2014 2013
Net asset value, beginning of year $12.19 $12.19 $13.83 $14.07 $12.92
Income from investment operations:Net investment income (loss)(a) 0.09 0.06 0.05 0.09 0.07
Net realized and unrealized gain (loss) 2.68 (0.01) (1.32) (0.18) 1.11
Total from investment operations 2.77 0.05 (1.27) (0.09) 1.18
Distributions:Dividends from net investment income — (0.05) (0.07) (0.04) (0.03)
Dividends from net realized gains — — (0.30) (0.11) —
Return of capital — (0.00)* (0.00)* — —
Total distributions — (0.05) (0.37) (0.15) (0.03)
Net asset value, end of year $14.96 $12.19 $12.19 $13.83 $14.07
Ratios and supplemental data:Total return(b) 22.72% 0.38% (9.35%) (0.60%) 9.16%
Net assets, end of year (000) $225,339 $255,965 $351,571 $436,546 $311,823
Ratio of net expenses to average net assets 1.41% 1.39% 1.40% 1.37% 1.39%
Ratio of gross expenses to average net assets prior to expense reductions 1.41% 1.39% 1.40% 1.37% 1.39%
Ratio of net investment income (loss) to average net assets 0.72% 0.50% 0.42% 0.65% 0.53%
Class RYear Ended October 31,
2017 2016 2015 2014 2013
Net asset value, beginning of year $11.99 $12.00 $13.62 $13.88 $12.78
Income from investment operations:Net investment income (loss)(a) 0.03 0.00 (0.01) 0.04 0.00
Net realized and unrealized gain (loss) 2.61 (0.01) (1.31) (0.19) 1.10
Total from investment operations 2.64 (0.01) (1.32) (0.15) 1.10
Distributions:Dividends from net investment income — — — — —
Dividends from net realized gains — — (0.30) (0.11) —
Return of capital — — (0.00)* — —
Total distributions — — (0.30) (0.11) —
Net asset value, end of year $14.63 $11.99 $12.00 $13.62 $13.88
Ratios and supplemental data:Total return(b) 22.02% (0.08%) (9.83%) (1.05%) 8.61%
Net assets, end of year (000) $2,851 $2,506 $1,982 $1,361 $1,908
Ratio of net expenses to average net assets 1.90% 1.89% 1.91% 1.86% 1.88%
Ratio of gross expenses to average net assets prior to expense reductions 1.90% 1.89% 1.91% 1.86% 1.88%
Ratio of net investment income (loss) to average net assets 0.22% (0.01%) (0.04%) 0.28% (0.04%)
* Amounts are less than $0.005.
(a) Net investment income (loss) allocated based on average shares method.
(b) Total return measures net investment income (loss) and capital gain or loss from portfolio investments assuming reinvestment of dividends and capital gains distributions. Total return isnot annualized for periods that are less than a full year, does not reflect the effect of sales charge for Class A shares nor the contingent deferred sales charge for Class B and C sharesand does not reflect the deduction of taxes that a shareholder would pay on fund distributions or the redemption of fund shares.
188 CALAMOS OPEN-END FAMILY OF FUNDS ANNUAL REPORT
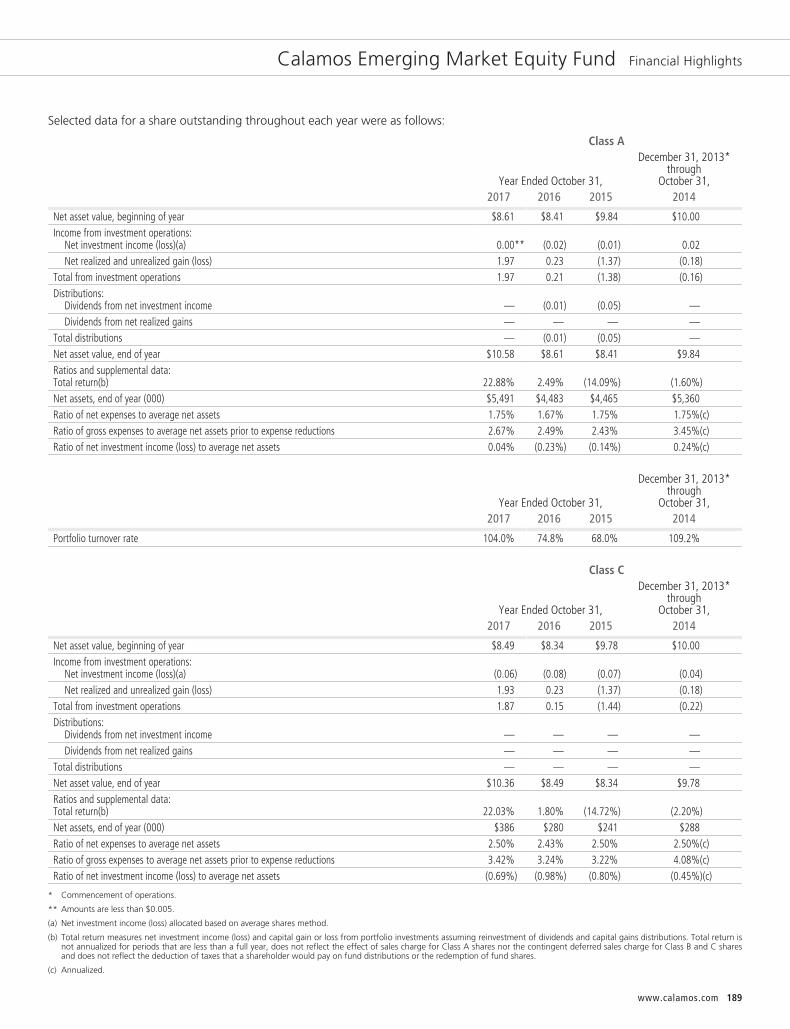
Calamos Emerging Market Equity Fund Financial Highlights
Selected data for a share outstanding throughout each year were as follows:
Class A
Year Ended October 31,
December 31, 2013*through
October 31,2017 2016 2015 2014
Net asset value, beginning of year $8.61 $8.41 $9.84 $10.00Income from investment operations:
Net investment income (loss)(a) 0.00** (0.02) (0.01) 0.02Net realized and unrealized gain (loss) 1.97 0.23 (1.37) (0.18)
Total from investment operations 1.97 0.21 (1.38) (0.16)Distributions:
Dividends from net investment income — (0.01) (0.05) —Dividends from net realized gains — — — —
Total distributions — (0.01) (0.05) —Net asset value, end of year $10.58 $8.61 $8.41 $9.84Ratios and supplemental data:Total return(b) 22.88% 2.49% (14.09%) (1.60%)Net assets, end of year (000) $5,491 $4,483 $4,465 $5,360Ratio of net expenses to average net assets 1.75% 1.67% 1.75% 1.75%(c)Ratio of gross expenses to average net assets prior to expense reductions 2.67% 2.49% 2.43% 3.45%(c)Ratio of net investment income (loss) to average net assets 0.04% (0.23%) (0.14%) 0.24%(c)
Year Ended October 31,
December 31, 2013*through
October 31,2017 2016 2015 2014
Portfolio turnover rate 104.0% 74.8% 68.0% 109.2%
Class C
Year Ended October 31,
December 31, 2013*through
October 31,2017 2016 2015 2014
Net asset value, beginning of year $8.49 $8.34 $9.78 $10.00Income from investment operations:
Net investment income (loss)(a) (0.06) (0.08) (0.07) (0.04)Net realized and unrealized gain (loss) 1.93 0.23 (1.37) (0.18)
Total from investment operations 1.87 0.15 (1.44) (0.22)Distributions:
Dividends from net investment income — — — —Dividends from net realized gains — — — —
Total distributions — — — —Net asset value, end of year $10.36 $8.49 $8.34 $9.78Ratios and supplemental data:Total return(b) 22.03% 1.80% (14.72%) (2.20%)Net assets, end of year (000) $386 $280 $241 $288Ratio of net expenses to average net assets 2.50% 2.43% 2.50% 2.50%(c)Ratio of gross expenses to average net assets prior to expense reductions 3.42% 3.24% 3.22% 4.08%(c)Ratio of net investment income (loss) to average net assets (0.69%) (0.98%) (0.80%) (0.45%)(c)
* Commencement of operations.
** Amounts are less than $0.005.
(a) Net investment income (loss) allocated based on average shares method.
(b) Total return measures net investment income (loss) and capital gain or loss from portfolio investments assuming reinvestment of dividends and capital gains distributions. Total return isnot annualized for periods that are less than a full year, does not reflect the effect of sales charge for Class A shares nor the contingent deferred sales charge for Class B and C sharesand does not reflect the deduction of taxes that a shareholder would pay on fund distributions or the redemption of fund shares.
(c) Annualized.
www.calamos.com 189
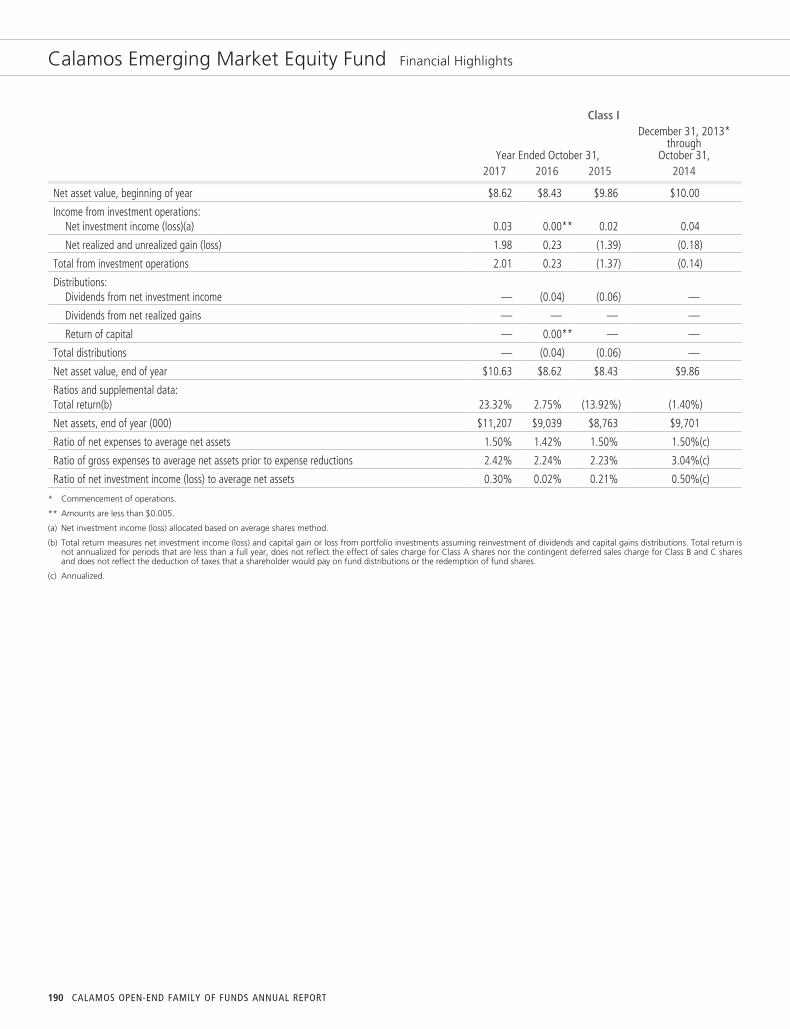
Calamos Emerging Market Equity Fund Financial Highlights
Class I
Year Ended October 31,
December 31, 2013*through
October 31,2017 2016 2015 2014
Net asset value, beginning of year $8.62 $8.43 $9.86 $10.00
Income from investment operations:Net investment income (loss)(a) 0.03 0.00** 0.02 0.04
Net realized and unrealized gain (loss) 1.98 0.23 (1.39) (0.18)
Total from investment operations 2.01 0.23 (1.37) (0.14)
Distributions:Dividends from net investment income — (0.04) (0.06) —
Dividends from net realized gains — — — —
Return of capital — 0.00** — —
Total distributions — (0.04) (0.06) —
Net asset value, end of year $10.63 $8.62 $8.43 $9.86
Ratios and supplemental data:Total return(b) 23.32% 2.75% (13.92%) (1.40%)
Net assets, end of year (000) $11,207 $9,039 $8,763 $9,701
Ratio of net expenses to average net assets 1.50% 1.42% 1.50% 1.50%(c)
Ratio of gross expenses to average net assets prior to expense reductions 2.42% 2.24% 2.23% 3.04%(c)
Ratio of net investment income (loss) to average net assets 0.30% 0.02% 0.21% 0.50%(c)
* Commencement of operations.
** Amounts are less than $0.005.
(a) Net investment income (loss) allocated based on average shares method.
(b) Total return measures net investment income (loss) and capital gain or loss from portfolio investments assuming reinvestment of dividends and capital gains distributions. Total return isnot annualized for periods that are less than a full year, does not reflect the effect of sales charge for Class A shares nor the contingent deferred sales charge for Class B and C sharesand does not reflect the deduction of taxes that a shareholder would pay on fund distributions or the redemption of fund shares.
(c) Annualized.
190 CALAMOS OPEN-END FAMILY OF FUNDS ANNUAL REPORT

Calamos Global Equity Fund Financial Highlights
Selected data for a share outstanding throughout each year were as follows:
Class AYear Ended October 31,
2017 2016 2015 2014 2013
Net asset value, beginning of year $12.74 $13.19 $15.67 $14.97 $13.00
Income from investment operations:Net investment income (loss)(a) 0.00* 0.01 0.00* (0.01) 0.03
Net realized and unrealized gain (loss) 3.45 (0.21) 0.62 1.08 1.96
Total from investment operations 3.45 (0.20) 0.62 1.07 1.99
Distributions:Dividends from net investment income — — — (0.10) (0.02)
Dividends from net realized gains (0.56) (0.25) (3.10) (0.27) —
Total distributions (0.56) (0.25) (3.10) (0.37) (0.02)
Net asset value, end of year $15.63 $12.74 $13.19 $15.67 $14.97
Ratios and supplemental data:Total return(b) 28.42% (1.47%) 5.33% 7.25% 15.35%
Net assets, end of year (000) $26,957 $29,314 $67,141 $87,989 $152,068
Ratio of net expenses to average net assets 1.40% 1.38% 1.34% 1.40% 1.40%
Ratio of gross expenses to average net assets prior to expense reductions 1.53% 1.50% 1.34% 1.40% 1.44%
Ratio of net investment income (loss) to average net assets (0.02%) 0.06% 0.00%** (0.10%) 0.22%
Year Ended October 31,2017 2016 2015 2014 2013
Portfolio turnover rate 102.0% 64.6% 43.0% 53.3% 75.3%
Class CYear Ended October 31,
2017 2016 2015 2014 2013
Net asset value, beginning of year $11.86 $12.39 $15.00 $14.36 $12.54
Income from investment operations:Net investment income (loss)(a) (0.09) (0.08) (0.09) (0.12) (0.07)
Net realized and unrealized gain (loss) 3.19 (0.20) 0.58 1.03 1.89
Total from investment operations 3.10 (0.28) 0.49 0.91 1.82
Distributions:Dividends from net investment income — — — — —
Dividends from net realized gains (0.56) (0.25) (3.10) (0.27) —
Total distributions (0.56) (0.25) (3.10) (0.27) —
Net asset value, end of year $14.40 $11.86 $12.39 $15.00 $14.36
Ratios and supplemental data:Total return(b) 27.53% (2.23%) 4.55% 6.43% 14.51%
Net assets, end of year (000) $13,769 $16,375 $21,227 $28,811 $32,975
Ratio of net expenses to average net assets 2.15% 2.13% 2.09% 2.14% 2.15%
Ratio of gross expenses to average net assets prior to expense reductions 2.27% 2.25% 2.09% 2.14% 2.19%
Ratio of net investment income (loss) to average net assets (0.76%) (0.68%) (0.76%) (0.82%) (0.51%)
* Amounts are less than $0.005.
** Amounts are less than 0.005%.
(a) Net investment income (loss) allocated based on average shares method.
(b) Total return measures net investment income (loss) and capital gain or loss from portfolio investments assuming reinvestment of dividends and capital gains distributions. Total return isnot annualized for periods that are less than a full year, does not reflect the effect of sales charge for Class A shares nor the contingent deferred sales charge for Class B and C sharesand does not reflect the deduction of taxes that a shareholder would pay on fund distributions or the redemption of fund shares.
www.calamos.com 191

Calamos Global Equity Fund Financial Highlights
Class IYear Ended October 31,
2017 2016 2015 2014 2013
Net asset value, beginning of year $12.95 $13.38 $15.81 $15.11 $13.11
Income from investment operations:Net investment income (loss)(a) 0.03 0.04 0.04 0.02 0.06
Net realized and unrealized gain (loss) 3.53 (0.22) 0.63 1.09 1.99
Total from investment operations 3.56 (0.18) 0.67 1.11 2.05
Distributions:Dividends from net investment income — — — (0.14) (0.05)
Dividends from net realized gains (0.56) (0.25) (3.10) (0.27) —
Total distributions (0.56) (0.25) (3.10) (0.41) (0.05)
Net asset value, end of year $15.95 $12.95 $13.38 $15.81 $15.11
Ratios and supplemental data:Total return(b) 28.82% (1.30%) 5.64% 7.48% 15.65%
Net assets, end of year (000) $86,429 $87,605 $96,390 $101,511 $212,913
Ratio of net expenses to average net assets 1.15% 1.13% 1.09% 1.15% 1.15%
Ratio of gross expenses to average net assets prior to expense reductions 1.28% 1.25% 1.09% 1.15% 1.19%
Ratio of net investment income (loss) to average net assets 0.23% 0.33% 0.26% 0.15% 0.46%
Class RYear Ended October 31,
2017 2016 2015 2014 2013
Net asset value, beginning of year $12.41 $12.89 $15.42 $14.75 $12.83
Income from investment operations:Net investment income (loss)(a) (0.04) (0.02) (0.03) (0.04) 0.00*
Net realized and unrealized gain (loss) 3.37 (0.21) 0.60 1.05 1.93
Total from investment operations 3.33 (0.23) 0.57 1.01 1.93
Distributions:Dividends from net investment income — — — (0.07) (0.01)
Dividends from net realized gains (0.56) (0.25) (3.10) (0.27) —
Total distributions (0.56) (0.25) (3.10) (0.34) (0.01)
Net asset value, end of year $15.18 $12.41 $12.89 $15.42 $14.75
Ratios and supplemental data:Total return(b) 28.19% (1.74%) 5.03% 6.97% 15.07%
Net assets, end of year (000) $5,120 $4,315 $7,142 $8,314 $9,369
Ratio of net expenses to average net assets 1.65% 1.63% 1.59% 1.64% 1.65%
Ratio of gross expenses to average net assets prior to expense reductions 1.78% 1.75% 1.59% 1.64% 1.69%
Ratio of net investment income (loss) to average net assets (0.28%) (0.19%) (0.25%) (0.29%) 0.00%
* Amounts are less than $0.005.
(a) Net investment income (loss) allocated based on average shares method.
(b) Total return measures net investment income (loss) and capital gain or loss from portfolio investments assuming reinvestment of dividends and capital gains distributions. Total return isnot annualized for periods that are less than a full year, does not reflect the effect of sales charge for Class A shares nor the contingent deferred sales charge for Class B and C sharesand does not reflect the deduction of taxes that a shareholder would pay on fund distributions or the redemption of fund shares.
192 CALAMOS OPEN-END FAMILY OF FUNDS ANNUAL REPORT
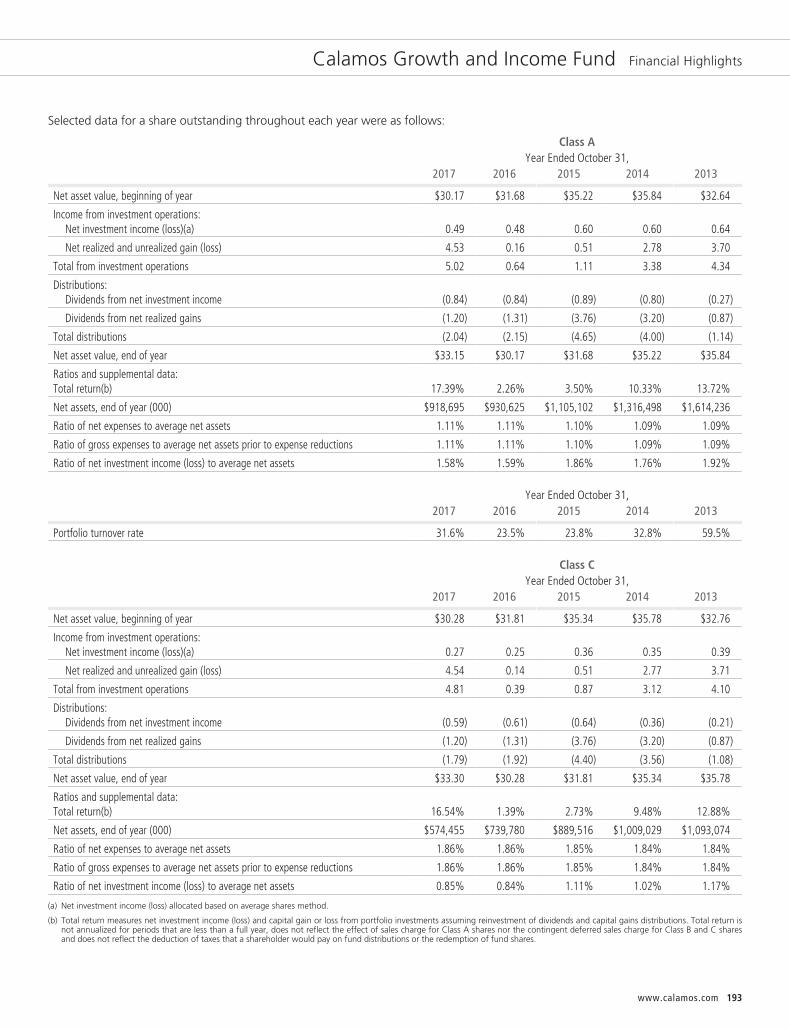
Calamos Growth and Income Fund Financial Highlights
Selected data for a share outstanding throughout each year were as follows:
Class AYear Ended October 31,
2017 2016 2015 2014 2013
Net asset value, beginning of year $30.17 $31.68 $35.22 $35.84 $32.64
Income from investment operations:Net investment income (loss)(a) 0.49 0.48 0.60 0.60 0.64
Net realized and unrealized gain (loss) 4.53 0.16 0.51 2.78 3.70
Total from investment operations 5.02 0.64 1.11 3.38 4.34
Distributions:Dividends from net investment income (0.84) (0.84) (0.89) (0.80) (0.27)
Dividends from net realized gains (1.20) (1.31) (3.76) (3.20) (0.87)
Total distributions (2.04) (2.15) (4.65) (4.00) (1.14)
Net asset value, end of year $33.15 $30.17 $31.68 $35.22 $35.84
Ratios and supplemental data:Total return(b) 17.39% 2.26% 3.50% 10.33% 13.72%
Net assets, end of year (000) $918,695 $930,625 $1,105,102 $1,316,498 $1,614,236
Ratio of net expenses to average net assets 1.11% 1.11% 1.10% 1.09% 1.09%
Ratio of gross expenses to average net assets prior to expense reductions 1.11% 1.11% 1.10% 1.09% 1.09%
Ratio of net investment income (loss) to average net assets 1.58% 1.59% 1.86% 1.76% 1.92%
Year Ended October 31,2017 2016 2015 2014 2013
Portfolio turnover rate 31.6% 23.5% 23.8% 32.8% 59.5%
Class CYear Ended October 31,
2017 2016 2015 2014 2013
Net asset value, beginning of year $30.28 $31.81 $35.34 $35.78 $32.76
Income from investment operations:Net investment income (loss)(a) 0.27 0.25 0.36 0.35 0.39
Net realized and unrealized gain (loss) 4.54 0.14 0.51 2.77 3.71
Total from investment operations 4.81 0.39 0.87 3.12 4.10
Distributions:Dividends from net investment income (0.59) (0.61) (0.64) (0.36) (0.21)
Dividends from net realized gains (1.20) (1.31) (3.76) (3.20) (0.87)
Total distributions (1.79) (1.92) (4.40) (3.56) (1.08)
Net asset value, end of year $33.30 $30.28 $31.81 $35.34 $35.78
Ratios and supplemental data:Total return(b) 16.54% 1.39% 2.73% 9.48% 12.88%
Net assets, end of year (000) $574,455 $739,780 $889,516 $1,009,029 $1,093,074
Ratio of net expenses to average net assets 1.86% 1.86% 1.85% 1.84% 1.84%
Ratio of gross expenses to average net assets prior to expense reductions 1.86% 1.86% 1.85% 1.84% 1.84%
Ratio of net investment income (loss) to average net assets 0.85% 0.84% 1.11% 1.02% 1.17%
(a) Net investment income (loss) allocated based on average shares method.
(b) Total return measures net investment income (loss) and capital gain or loss from portfolio investments assuming reinvestment of dividends and capital gains distributions. Total return isnot annualized for periods that are less than a full year, does not reflect the effect of sales charge for Class A shares nor the contingent deferred sales charge for Class B and C sharesand does not reflect the deduction of taxes that a shareholder would pay on fund distributions or the redemption of fund shares.
www.calamos.com 193

Calamos Growth and Income Fund Financial Highlights
Class IYear Ended October 31, 2017
2017 2016 2015 2014 2013
Net asset value, beginning of year $29.15 $30.71 $34.28 $35.07 $31.91
Income from investment operations:Net investment income (loss)(a) 0.55 0.53 0.66 0.68 0.71
Net realized and unrealized gain (loss) 4.38 0.14 0.50 2.69 3.62
Total from investment operations 4.93 0.67 1.16 3.37 4.33
Distributions:Dividends from net investment income (0.92) (0.92) (0.97) (0.96) (0.30)
Dividends from net realized gains (1.20) (1.31) (3.76) (3.20) (0.87)
Total distributions (2.12) (2.23) (4.73) (4.16) (1.17)
Net asset value, end of year $31.96 $29.15 $30.71 $34.28 $35.07
Ratios and supplemental data:Total return(b) 17.71% 2.43% 3.79% 10.60% 13.99%
Net assets, end of year (000) $554,490 $513,604 $577,449 $688,258 $668,124
Ratio of net expenses to average net assets 0.86% 0.86% 0.85% 0.84% 0.84%
Ratio of gross expenses to average net assets prior to expense reductions 0.86% 0.86% 0.85% 0.84% 0.84%
Ratio of net investment income (loss) to average net assets 1.83% 1.84% 2.11% 2.04% 2.18%
Class RYear Ended October 31,
2017 2016 2015 2014 2013
Net asset value, beginning of year $29.94 $31.45 $34.99 $35.57 $32.46
Income from investment operations:Net investment income (loss)(a) 0.41 0.39 0.51 0.51 0.55
Net realized and unrealized gain (loss) 4.49 0.18 0.52 2.75 3.69
Total from investment operations 4.90 0.57 1.03 3.26 4.24
Distributions:Dividends from net investment income (0.76) (0.77) (0.81) (0.64) (0.26)
Dividends from net realized gains (1.20) (1.31) (3.76) (3.20) (0.87)
Total distributions (1.96) (2.08) (4.57) (3.84) (1.13)
Net asset value, end of year $32.88 $29.94 $31.45 $34.99 $35.57
Ratios and supplemental data:Total return(b) 17.10% 2.01% 3.26% 10.04% 13.44%
Net assets, end of year (000) $11,874 $13,262 $15,307 $18,547 $22,181
Ratio of net expenses to average net assets 1.36% 1.36% 1.35% 1.34% 1.34%
Ratio of gross expenses to average net assets prior to expense reductions 1.36% 1.36% 1.35% 1.34% 1.34%
Ratio of net investment income (loss) to average net assets 1.34% 1.32% 1.61% 1.52% 1.66%
(a) Net investment income (loss) allocated based on average shares method.
(b) Total return measures net investment income (loss) and capital gain or loss from portfolio investments assuming reinvestment of dividends and capital gains distributions. Total return isnot annualized for periods that are less than a full year, does not reflect the effect of sales charge for Class A shares nor the contingent deferred sales charge for Class B and C sharesand does not reflect the deduction of taxes that a shareholder would pay on fund distributions or the redemption of fund shares.
194 CALAMOS OPEN-END FAMILY OF FUNDS ANNUAL REPORT
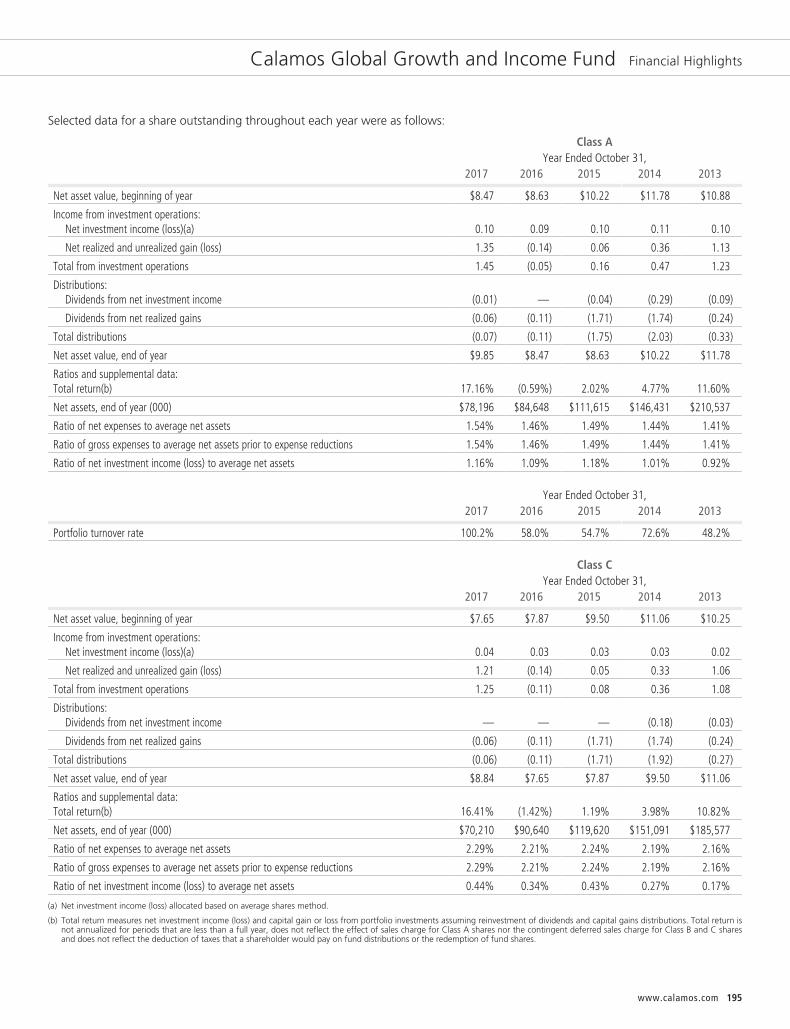
Calamos Global Growth and Income Fund Financial Highlights
Selected data for a share outstanding throughout each year were as follows:
Class AYear Ended October 31,
2017 2016 2015 2014 2013
Net asset value, beginning of year $8.47 $8.63 $10.22 $11.78 $10.88
Income from investment operations:Net investment income (loss)(a) 0.10 0.09 0.10 0.11 0.10
Net realized and unrealized gain (loss) 1.35 (0.14) 0.06 0.36 1.13
Total from investment operations 1.45 (0.05) 0.16 0.47 1.23
Distributions:Dividends from net investment income (0.01) — (0.04) (0.29) (0.09)
Dividends from net realized gains (0.06) (0.11) (1.71) (1.74) (0.24)
Total distributions (0.07) (0.11) (1.75) (2.03) (0.33)
Net asset value, end of year $9.85 $8.47 $8.63 $10.22 $11.78
Ratios and supplemental data:Total return(b) 17.16% (0.59%) 2.02% 4.77% 11.60%
Net assets, end of year (000) $78,196 $84,648 $111,615 $146,431 $210,537
Ratio of net expenses to average net assets 1.54% 1.46% 1.49% 1.44% 1.41%
Ratio of gross expenses to average net assets prior to expense reductions 1.54% 1.46% 1.49% 1.44% 1.41%
Ratio of net investment income (loss) to average net assets 1.16% 1.09% 1.18% 1.01% 0.92%
Year Ended October 31,2017 2016 2015 2014 2013
Portfolio turnover rate 100.2% 58.0% 54.7% 72.6% 48.2%
Class CYear Ended October 31,
2017 2016 2015 2014 2013
Net asset value, beginning of year $7.65 $7.87 $9.50 $11.06 $10.25
Income from investment operations:Net investment income (loss)(a) 0.04 0.03 0.03 0.03 0.02
Net realized and unrealized gain (loss) 1.21 (0.14) 0.05 0.33 1.06
Total from investment operations 1.25 (0.11) 0.08 0.36 1.08
Distributions:Dividends from net investment income — — — (0.18) (0.03)
Dividends from net realized gains (0.06) (0.11) (1.71) (1.74) (0.24)
Total distributions (0.06) (0.11) (1.71) (1.92) (0.27)
Net asset value, end of year $8.84 $7.65 $7.87 $9.50 $11.06
Ratios and supplemental data:Total return(b) 16.41% (1.42%) 1.19% 3.98% 10.82%
Net assets, end of year (000) $70,210 $90,640 $119,620 $151,091 $185,577
Ratio of net expenses to average net assets 2.29% 2.21% 2.24% 2.19% 2.16%
Ratio of gross expenses to average net assets prior to expense reductions 2.29% 2.21% 2.24% 2.19% 2.16%
Ratio of net investment income (loss) to average net assets 0.44% 0.34% 0.43% 0.27% 0.17%
(a) Net investment income (loss) allocated based on average shares method.
(b) Total return measures net investment income (loss) and capital gain or loss from portfolio investments assuming reinvestment of dividends and capital gains distributions. Total return isnot annualized for periods that are less than a full year, does not reflect the effect of sales charge for Class A shares nor the contingent deferred sales charge for Class B and C sharesand does not reflect the deduction of taxes that a shareholder would pay on fund distributions or the redemption of fund shares.
www.calamos.com 195

Calamos Global Growth and Income Fund Financial Highlights
Class IYear Ended October 31,
2017 2016 2015 2014 2013
Net asset value, beginning of year $8.70 $8.84 $10.43 $11.99 $11.06
Income from investment operations:Net investment income (loss)(a) 0.13 0.11 0.13 0.14 0.13
Net realized and unrealized gain (loss) 1.38 (0.14) 0.05 0.36 1.15
Total from investment operations 1.51 (0.03) 0.18 0.50 1.28
Distributions:Dividends from net investment income (0.04) — (0.06) (0.32) (0.11)
Dividends from net realized gains (0.06) (0.11) (1.71) (1.74) (0.24)
Total distributions (0.10) (0.11) (1.77) (2.06) (0.35)
Net asset value, end of year $10.11 $8.70 $8.84 $10.43 $11.99
Ratios and supplemental data:Total return(b) 17.51% (0.35%) 2.23% 4.99% 11.90%
Net assets, end of year (000) $73,361 $124,175 $146,241 $182,064 $232,583
Ratio of net expenses to average net assets 1.29% 1.21% 1.24% 1.19% 1.14%
Ratio of gross expenses to average net assets prior to expense reductions 1.29% 1.21% 1.24% 1.19% 1.14%
Ratio of net investment income (loss) to average net assets 1.43% 1.34% 1.43% 1.29% 1.16%
Class RYear Ended October 31,
2017 2016 2015 2014 2013
Net asset value, beginning of year $8.34 $8.53 $10.13 $11.67 $10.79
Income from investment operations:Net investment income (loss)(a) 0.08 0.07 0.08 0.08 0.07
Net realized and unrealized gain (loss) 1.33 (0.15) 0.05 0.37 1.12
Total from investment operations 1.41 (0.08) 0.13 0.45 1.19
Distributions:Dividends from net investment income 0.00* — (0.02) (0.25) (0.07)
Dividends from net realized gains (0.06) (0.11) (1.71) (1.74) (0.24)
Total distributions (0.06) (0.11) (1.73) (1.99) (0.31)
Net asset value, end of year $9.69 $8.34 $8.53 $10.13 $11.67
Ratios and supplemental data:Total return(b) 16.99% (0.96%) 1.74% 4.62% 11.27%
Net assets, end of year (000) $1,265 $1,249 $1,292 $1,741 $1,674
Ratio of net expenses to average net assets 1.79% 1.71% 1.73% 1.69% 1.66%
Ratio of gross expenses to average net assets prior to expense reductions 1.79% 1.71% 1.73% 1.69% 1.66%
Ratio of net investment income (loss) to average net assets 0.92% 0.81% 0.94% 0.77% 0.68%
* Amounts are less than $0.005.
(a) Net investment income (loss) allocated based on average shares method.
(b) Total return measures net investment income (loss) and capital gain or loss from portfolio investments assuming reinvestment of dividends and capital gains distributions. Total return isnot annualized for periods that are less than a full year, does not reflect the effect of sales charge for Class A shares nor the contingent deferred sales charge for Class B and C sharesand does not reflect the deduction of taxes that a shareholder would pay on fund distributions or the redemption of fund shares.
196 CALAMOS OPEN-END FAMILY OF FUNDS ANNUAL REPORT

Calamos Convertible Fund Financial Highlights
Selected data for a share outstanding throughout each year were as follows:
Class AYear Ended October 31,
2017 2016 2015 2014 2013
Net asset value, beginning of year $15.93 $16.56 $18.59 $19.14 $17.70
Income from investment operations:Net investment income (loss)(a) 0.49 0.50 0.44 0.40 0.39
Net realized and unrealized gain (loss) 2.16 (0.30) (1.01) 1.14 2.63
Total from investment operations 2.65 0.20 (0.57) 1.54 3.02
Distributions:Dividends from net investment income (0.31) (0.56) (0.58) (0.76) (0.02)
Dividends from net realized gains — (0.27) (0.88) (1.33) (1.56)
Total distributions (0.31) (0.83) (1.46) (2.09) (1.58)
Net asset value, end of year $18.27 $15.93 $16.56 $18.59 $19.14
Ratios and supplemental data:Total return(b) 16.88% 1.33% (3.31%) 8.74% 18.50%
Net assets, end of year (000) $222,017 $228,334 $385,844 $488,842 $514,593
Ratio of net expenses to average net assets 1.18% 1.15% 1.13% 1.10% 1.11%
Ratio of gross expenses to average net assets prior to expense reductions 1.18% 1.15% 1.13% 1.10% 1.11%
Ratio of net investment income (loss) to average net assets 2.87% 3.17% 2.53% 2.18% 2.18%
Year Ended October 31,2017 2016 2015 2014 2013
Portfolio turnover rate 55.7% 43.8% 63.0% 68.1% 73.1%
Class CYear Ended October 31,
2017 2016 2015 2014 2013
Net asset value, beginning of year $15.79 $16.41 $18.43 $18.87 $17.57
Income from investment operations:Net investment income (loss)(a) 0.36 0.37 0.31 0.26 0.25
Net realized and unrealized gain (loss) 2.14 (0.28) (1.00) 1.11 2.61
Total from investment operations 2.50 0.09 (0.69) 1.37 2.86
Distributions:Dividends from net investment income (0.20) (0.44) (0.45) (0.48) —
Dividends from net realized gains — (0.27) (0.88) (1.33) (1.56)
Total distributions (0.20) (0.71) (1.33) (1.81) (1.56)
Net asset value, end of year $18.09 $15.79 $16.41 $18.43 $18.87
Ratios and supplemental data:Total return(b) 15.99% 0.62% (4.01%) 7.86% 17.62%
Net assets, end of year (000) $147,112 $193,339 $265,686 $319,654 $325,823
Ratio of net expenses to average net assets 1.93% 1.90% 1.88% 1.86% 1.86%
Ratio of gross expenses to average net assets prior to expense reductions 1.93% 1.90% 1.88% 1.86% 1.86%
Ratio of net investment income (loss) to average net assets 2.14% 2.40% 1.78% 1.43% 1.43%
(a) Net investment income (loss) allocated based on average shares method.
(b) Total return measures net investment income (loss) and capital gain or loss from portfolio investments assuming reinvestment of dividends and capital gains distributions. Total return isnot annualized for periods that are less than a full year, does not reflect the effect of sales charge for Class A shares nor the contingent deferred sales charge for Class B and C sharesand does not reflect the deduction of taxes that a shareholder would pay on fund distributions or the redemption of fund shares.
www.calamos.com 197
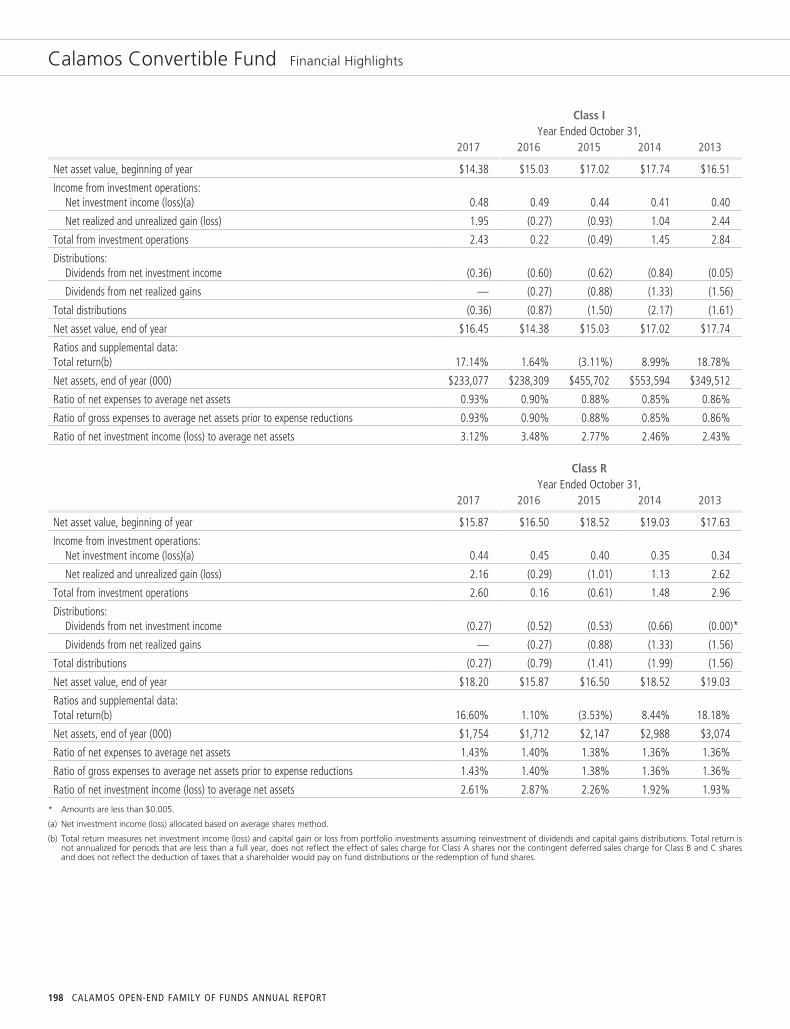
Calamos Convertible Fund Financial Highlights
Class IYear Ended October 31,
2017 2016 2015 2014 2013
Net asset value, beginning of year $14.38 $15.03 $17.02 $17.74 $16.51
Income from investment operations:Net investment income (loss)(a) 0.48 0.49 0.44 0.41 0.40
Net realized and unrealized gain (loss) 1.95 (0.27) (0.93) 1.04 2.44
Total from investment operations 2.43 0.22 (0.49) 1.45 2.84
Distributions:Dividends from net investment income (0.36) (0.60) (0.62) (0.84) (0.05)
Dividends from net realized gains — (0.27) (0.88) (1.33) (1.56)
Total distributions (0.36) (0.87) (1.50) (2.17) (1.61)
Net asset value, end of year $16.45 $14.38 $15.03 $17.02 $17.74
Ratios and supplemental data:Total return(b) 17.14% 1.64% (3.11%) 8.99% 18.78%
Net assets, end of year (000) $233,077 $238,309 $455,702 $553,594 $349,512
Ratio of net expenses to average net assets 0.93% 0.90% 0.88% 0.85% 0.86%
Ratio of gross expenses to average net assets prior to expense reductions 0.93% 0.90% 0.88% 0.85% 0.86%
Ratio of net investment income (loss) to average net assets 3.12% 3.48% 2.77% 2.46% 2.43%
Class RYear Ended October 31,
2017 2016 2015 2014 2013
Net asset value, beginning of year $15.87 $16.50 $18.52 $19.03 $17.63
Income from investment operations:Net investment income (loss)(a) 0.44 0.45 0.40 0.35 0.34
Net realized and unrealized gain (loss) 2.16 (0.29) (1.01) 1.13 2.62
Total from investment operations 2.60 0.16 (0.61) 1.48 2.96
Distributions:Dividends from net investment income (0.27) (0.52) (0.53) (0.66) (0.00)*
Dividends from net realized gains — (0.27) (0.88) (1.33) (1.56)
Total distributions (0.27) (0.79) (1.41) (1.99) (1.56)
Net asset value, end of year $18.20 $15.87 $16.50 $18.52 $19.03
Ratios and supplemental data:Total return(b) 16.60% 1.10% (3.53%) 8.44% 18.18%
Net assets, end of year (000) $1,754 $1,712 $2,147 $2,988 $3,074
Ratio of net expenses to average net assets 1.43% 1.40% 1.38% 1.36% 1.36%
Ratio of gross expenses to average net assets prior to expense reductions 1.43% 1.40% 1.38% 1.36% 1.36%
Ratio of net investment income (loss) to average net assets 2.61% 2.87% 2.26% 1.92% 1.93%
* Amounts are less than $0.005.
(a) Net investment income (loss) allocated based on average shares method.
(b) Total return measures net investment income (loss) and capital gain or loss from portfolio investments assuming reinvestment of dividends and capital gains distributions. Total return isnot annualized for periods that are less than a full year, does not reflect the effect of sales charge for Class A shares nor the contingent deferred sales charge for Class B and C sharesand does not reflect the deduction of taxes that a shareholder would pay on fund distributions or the redemption of fund shares.
198 CALAMOS OPEN-END FAMILY OF FUNDS ANNUAL REPORT
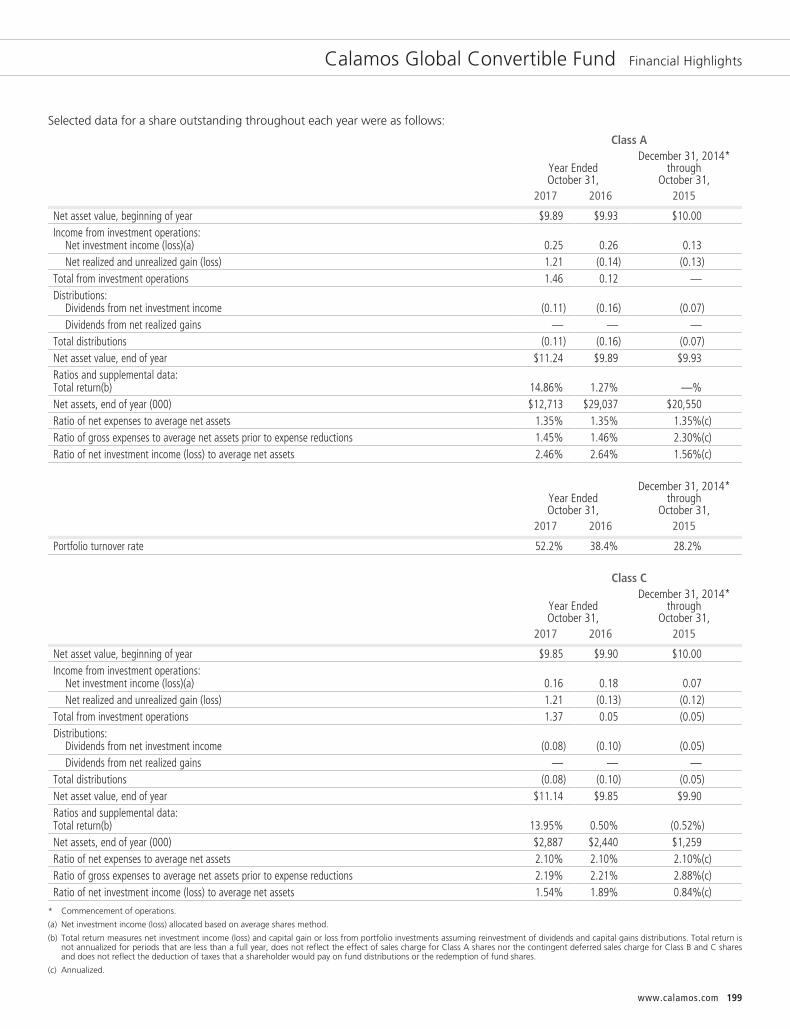
Calamos Global Convertible Fund Financial Highlights
Selected data for a share outstanding throughout each year were as follows:
Class A
Year EndedOctober 31,
December 31, 2014*through
October 31,2017 2016 2015
Net asset value, beginning of year $9.89 $9.93 $10.00Income from investment operations:
Net investment income (loss)(a) 0.25 0.26 0.13Net realized and unrealized gain (loss) 1.21 (0.14) (0.13)
Total from investment operations 1.46 0.12 —Distributions:
Dividends from net investment income (0.11) (0.16) (0.07)Dividends from net realized gains — — —
Total distributions (0.11) (0.16) (0.07)Net asset value, end of year $11.24 $9.89 $9.93Ratios and supplemental data:Total return(b) 14.86% 1.27% —%Net assets, end of year (000) $12,713 $29,037 $20,550Ratio of net expenses to average net assets 1.35% 1.35% 1.35%(c)Ratio of gross expenses to average net assets prior to expense reductions 1.45% 1.46% 2.30%(c)Ratio of net investment income (loss) to average net assets 2.46% 2.64% 1.56%(c)
Year EndedOctober 31,
December 31, 2014*through
October 31,2017 2016 2015
Portfolio turnover rate 52.2% 38.4% 28.2%
Class C
Year EndedOctober 31,
December 31, 2014*through
October 31,2017 2016 2015
Net asset value, beginning of year $9.85 $9.90 $10.00Income from investment operations:
Net investment income (loss)(a) 0.16 0.18 0.07Net realized and unrealized gain (loss) 1.21 (0.13) (0.12)
Total from investment operations 1.37 0.05 (0.05)Distributions:
Dividends from net investment income (0.08) (0.10) (0.05)Dividends from net realized gains — — —
Total distributions (0.08) (0.10) (0.05)Net asset value, end of year $11.14 $9.85 $9.90Ratios and supplemental data:Total return(b) 13.95% 0.50% (0.52%)Net assets, end of year (000) $2,887 $2,440 $1,259Ratio of net expenses to average net assets 2.10% 2.10% 2.10%(c)Ratio of gross expenses to average net assets prior to expense reductions 2.19% 2.21% 2.88%(c)Ratio of net investment income (loss) to average net assets 1.54% 1.89% 0.84%(c)
* Commencement of operations.
(a) Net investment income (loss) allocated based on average shares method.
(b) Total return measures net investment income (loss) and capital gain or loss from portfolio investments assuming reinvestment of dividends and capital gains distributions. Total return isnot annualized for periods that are less than a full year, does not reflect the effect of sales charge for Class A shares nor the contingent deferred sales charge for Class B and C sharesand does not reflect the deduction of taxes that a shareholder would pay on fund distributions or the redemption of fund shares.
(c) Annualized.
www.calamos.com 199
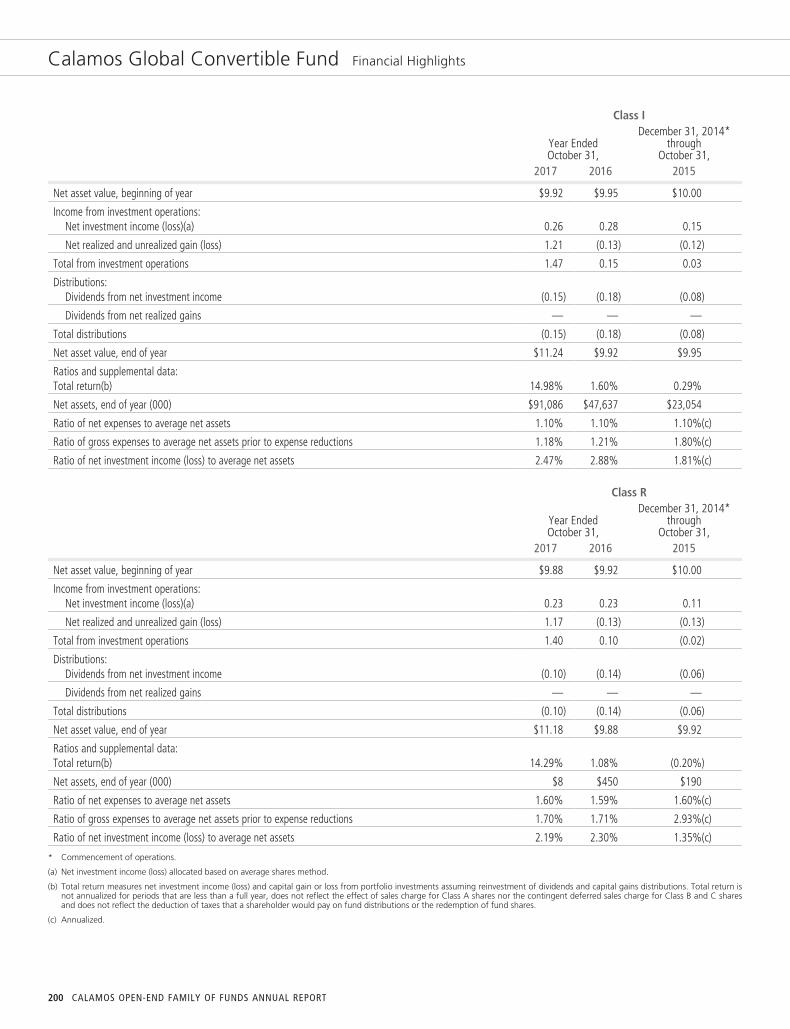
Calamos Global Convertible Fund Financial Highlights
Class I
Year EndedOctober 31,
December 31, 2014*through
October 31,2017 2016 2015
Net asset value, beginning of year $9.92 $9.95 $10.00
Income from investment operations:Net investment income (loss)(a) 0.26 0.28 0.15
Net realized and unrealized gain (loss) 1.21 (0.13) (0.12)
Total from investment operations 1.47 0.15 0.03
Distributions:Dividends from net investment income (0.15) (0.18) (0.08)
Dividends from net realized gains — — —
Total distributions (0.15) (0.18) (0.08)
Net asset value, end of year $11.24 $9.92 $9.95
Ratios and supplemental data:Total return(b) 14.98% 1.60% 0.29%
Net assets, end of year (000) $91,086 $47,637 $23,054
Ratio of net expenses to average net assets 1.10% 1.10% 1.10%(c)
Ratio of gross expenses to average net assets prior to expense reductions 1.18% 1.21% 1.80%(c)
Ratio of net investment income (loss) to average net assets 2.47% 2.88% 1.81%(c)
Class R
Year EndedOctober 31,
December 31, 2014*through
October 31,2017 2016 2015
Net asset value, beginning of year $9.88 $9.92 $10.00
Income from investment operations:Net investment income (loss)(a) 0.23 0.23 0.11
Net realized and unrealized gain (loss) 1.17 (0.13) (0.13)
Total from investment operations 1.40 0.10 (0.02)
Distributions:Dividends from net investment income (0.10) (0.14) (0.06)
Dividends from net realized gains — — —
Total distributions (0.10) (0.14) (0.06)
Net asset value, end of year $11.18 $9.88 $9.92
Ratios and supplemental data:Total return(b) 14.29% 1.08% (0.20%)
Net assets, end of year (000) $8 $450 $190
Ratio of net expenses to average net assets 1.60% 1.59% 1.60%(c)
Ratio of gross expenses to average net assets prior to expense reductions 1.70% 1.71% 2.93%(c)
Ratio of net investment income (loss) to average net assets 2.19% 2.30% 1.35%(c)
* Commencement of operations.
(a) Net investment income (loss) allocated based on average shares method.
(b) Total return measures net investment income (loss) and capital gain or loss from portfolio investments assuming reinvestment of dividends and capital gains distributions. Total return isnot annualized for periods that are less than a full year, does not reflect the effect of sales charge for Class A shares nor the contingent deferred sales charge for Class B and C sharesand does not reflect the deduction of taxes that a shareholder would pay on fund distributions or the redemption of fund shares.
(c) Annualized.
200 CALAMOS OPEN-END FAMILY OF FUNDS ANNUAL REPORT
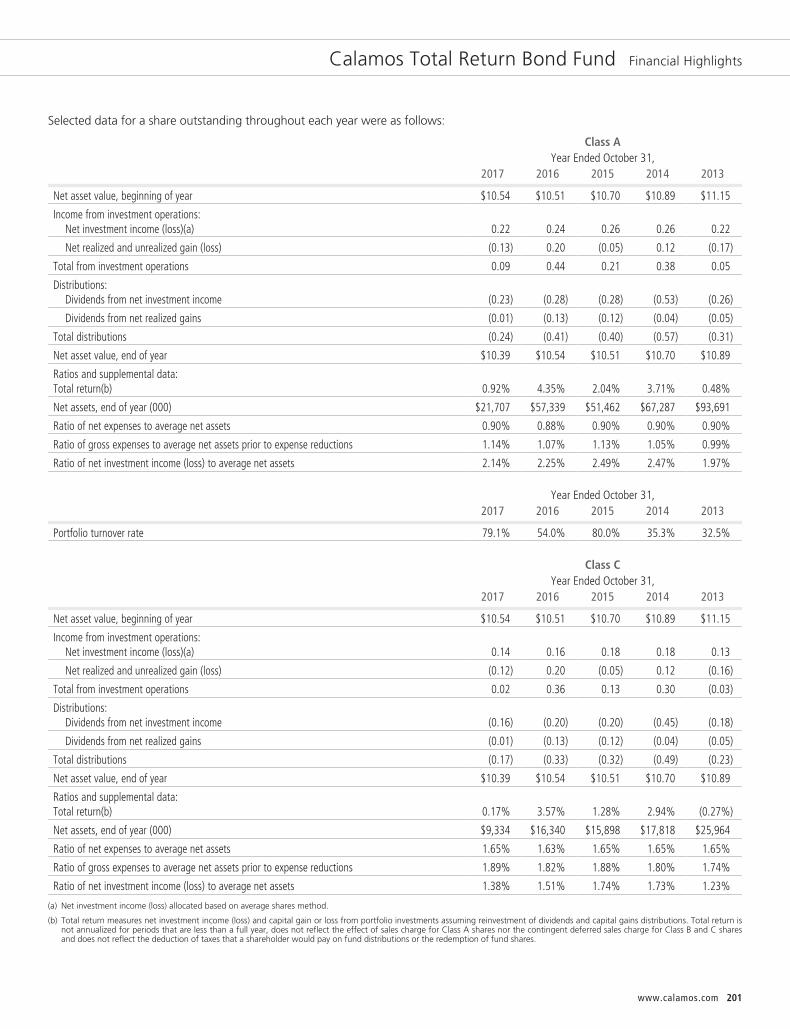
Calamos Total Return Bond Fund Financial Highlights
Selected data for a share outstanding throughout each year were as follows:
Class AYear Ended October 31,
2017 2016 2015 2014 2013
Net asset value, beginning of year $10.54 $10.51 $10.70 $10.89 $11.15
Income from investment operations:Net investment income (loss)(a) 0.22 0.24 0.26 0.26 0.22
Net realized and unrealized gain (loss) (0.13) 0.20 (0.05) 0.12 (0.17)
Total from investment operations 0.09 0.44 0.21 0.38 0.05
Distributions:Dividends from net investment income (0.23) (0.28) (0.28) (0.53) (0.26)
Dividends from net realized gains (0.01) (0.13) (0.12) (0.04) (0.05)
Total distributions (0.24) (0.41) (0.40) (0.57) (0.31)
Net asset value, end of year $10.39 $10.54 $10.51 $10.70 $10.89
Ratios and supplemental data:Total return(b) 0.92% 4.35% 2.04% 3.71% 0.48%
Net assets, end of year (000) $21,707 $57,339 $51,462 $67,287 $93,691
Ratio of net expenses to average net assets 0.90% 0.88% 0.90% 0.90% 0.90%
Ratio of gross expenses to average net assets prior to expense reductions 1.14% 1.07% 1.13% 1.05% 0.99%
Ratio of net investment income (loss) to average net assets 2.14% 2.25% 2.49% 2.47% 1.97%
Year Ended October 31,2017 2016 2015 2014 2013
Portfolio turnover rate 79.1% 54.0% 80.0% 35.3% 32.5%
Class CYear Ended October 31,
2017 2016 2015 2014 2013
Net asset value, beginning of year $10.54 $10.51 $10.70 $10.89 $11.15
Income from investment operations:Net investment income (loss)(a) 0.14 0.16 0.18 0.18 0.13
Net realized and unrealized gain (loss) (0.12) 0.20 (0.05) 0.12 (0.16)
Total from investment operations 0.02 0.36 0.13 0.30 (0.03)
Distributions:Dividends from net investment income (0.16) (0.20) (0.20) (0.45) (0.18)
Dividends from net realized gains (0.01) (0.13) (0.12) (0.04) (0.05)
Total distributions (0.17) (0.33) (0.32) (0.49) (0.23)
Net asset value, end of year $10.39 $10.54 $10.51 $10.70 $10.89
Ratios and supplemental data:Total return(b) 0.17% 3.57% 1.28% 2.94% (0.27%)
Net assets, end of year (000) $9,334 $16,340 $15,898 $17,818 $25,964
Ratio of net expenses to average net assets 1.65% 1.63% 1.65% 1.65% 1.65%
Ratio of gross expenses to average net assets prior to expense reductions 1.89% 1.82% 1.88% 1.80% 1.74%
Ratio of net investment income (loss) to average net assets 1.38% 1.51% 1.74% 1.73% 1.23%
(a) Net investment income (loss) allocated based on average shares method.
(b) Total return measures net investment income (loss) and capital gain or loss from portfolio investments assuming reinvestment of dividends and capital gains distributions. Total return isnot annualized for periods that are less than a full year, does not reflect the effect of sales charge for Class A shares nor the contingent deferred sales charge for Class B and C sharesand does not reflect the deduction of taxes that a shareholder would pay on fund distributions or the redemption of fund shares.
www.calamos.com 201
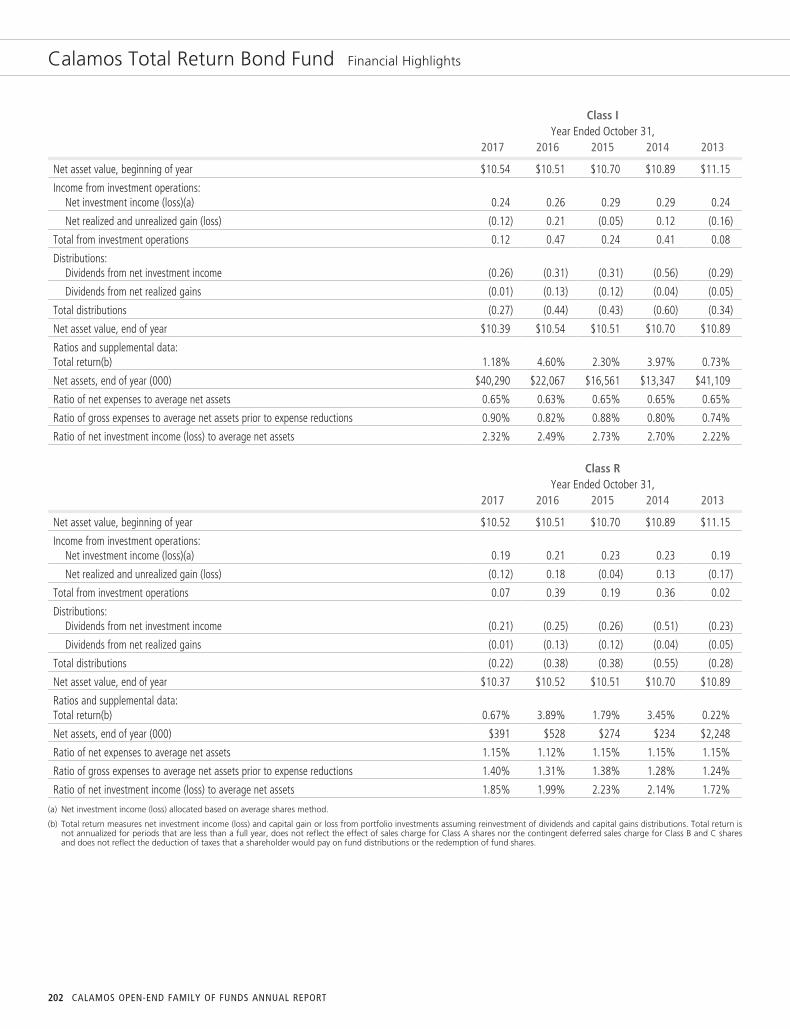
Calamos Total Return Bond Fund Financial Highlights
Class IYear Ended October 31,
2017 2016 2015 2014 2013
Net asset value, beginning of year $10.54 $10.51 $10.70 $10.89 $11.15
Income from investment operations:Net investment income (loss)(a) 0.24 0.26 0.29 0.29 0.24
Net realized and unrealized gain (loss) (0.12) 0.21 (0.05) 0.12 (0.16)
Total from investment operations 0.12 0.47 0.24 0.41 0.08
Distributions:Dividends from net investment income (0.26) (0.31) (0.31) (0.56) (0.29)
Dividends from net realized gains (0.01) (0.13) (0.12) (0.04) (0.05)
Total distributions (0.27) (0.44) (0.43) (0.60) (0.34)
Net asset value, end of year $10.39 $10.54 $10.51 $10.70 $10.89
Ratios and supplemental data:Total return(b) 1.18% 4.60% 2.30% 3.97% 0.73%
Net assets, end of year (000) $40,290 $22,067 $16,561 $13,347 $41,109
Ratio of net expenses to average net assets 0.65% 0.63% 0.65% 0.65% 0.65%
Ratio of gross expenses to average net assets prior to expense reductions 0.90% 0.82% 0.88% 0.80% 0.74%
Ratio of net investment income (loss) to average net assets 2.32% 2.49% 2.73% 2.70% 2.22%
Class RYear Ended October 31,
2017 2016 2015 2014 2013
Net asset value, beginning of year $10.52 $10.51 $10.70 $10.89 $11.15
Income from investment operations:Net investment income (loss)(a) 0.19 0.21 0.23 0.23 0.19
Net realized and unrealized gain (loss) (0.12) 0.18 (0.04) 0.13 (0.17)
Total from investment operations 0.07 0.39 0.19 0.36 0.02
Distributions:Dividends from net investment income (0.21) (0.25) (0.26) (0.51) (0.23)
Dividends from net realized gains (0.01) (0.13) (0.12) (0.04) (0.05)
Total distributions (0.22) (0.38) (0.38) (0.55) (0.28)
Net asset value, end of year $10.37 $10.52 $10.51 $10.70 $10.89
Ratios and supplemental data:Total return(b) 0.67% 3.89% 1.79% 3.45% 0.22%
Net assets, end of year (000) $391 $528 $274 $234 $2,248
Ratio of net expenses to average net assets 1.15% 1.12% 1.15% 1.15% 1.15%
Ratio of gross expenses to average net assets prior to expense reductions 1.40% 1.31% 1.38% 1.28% 1.24%
Ratio of net investment income (loss) to average net assets 1.85% 1.99% 2.23% 2.14% 1.72%
(a) Net investment income (loss) allocated based on average shares method.
(b) Total return measures net investment income (loss) and capital gain or loss from portfolio investments assuming reinvestment of dividends and capital gains distributions. Total return isnot annualized for periods that are less than a full year, does not reflect the effect of sales charge for Class A shares nor the contingent deferred sales charge for Class B and C sharesand does not reflect the deduction of taxes that a shareholder would pay on fund distributions or the redemption of fund shares.
202 CALAMOS OPEN-END FAMILY OF FUNDS ANNUAL REPORT
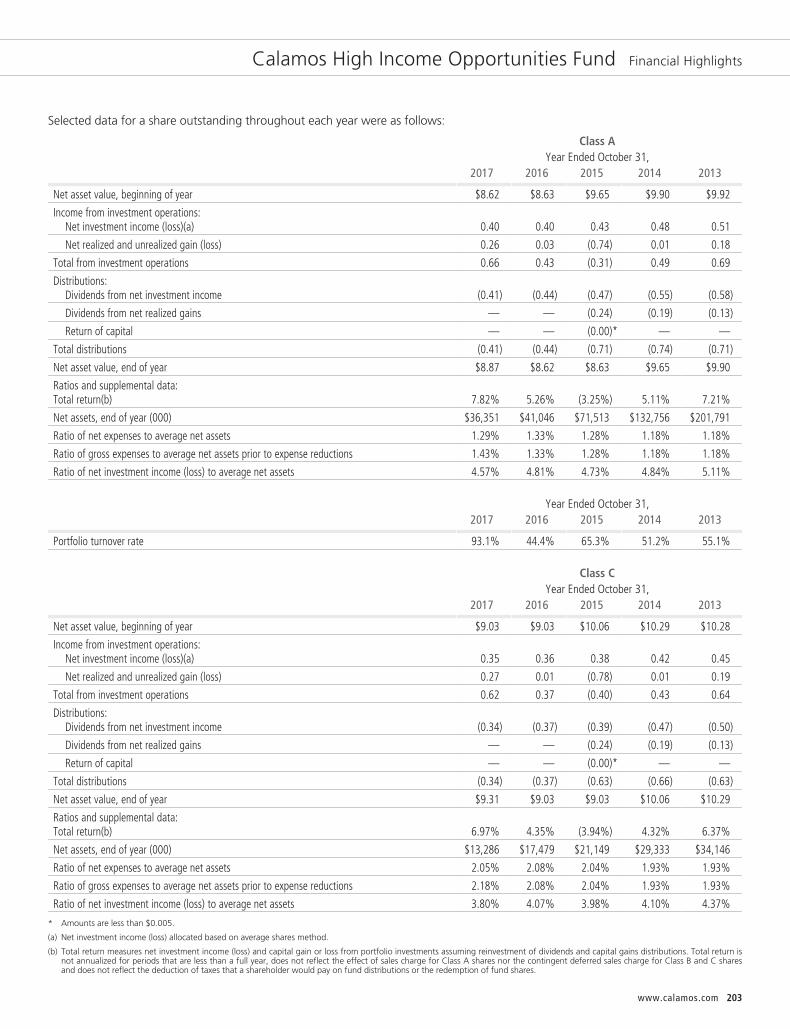
Calamos High Income Opportunities Fund Financial Highlights
Selected data for a share outstanding throughout each year were as follows:
Class AYear Ended October 31,
2017 2016 2015 2014 2013
Net asset value, beginning of year $8.62 $8.63 $9.65 $9.90 $9.92
Income from investment operations:Net investment income (loss)(a) 0.40 0.40 0.43 0.48 0.51
Net realized and unrealized gain (loss) 0.26 0.03 (0.74) 0.01 0.18
Total from investment operations 0.66 0.43 (0.31) 0.49 0.69
Distributions:Dividends from net investment income (0.41) (0.44) (0.47) (0.55) (0.58)
Dividends from net realized gains — — (0.24) (0.19) (0.13)
Return of capital — — (0.00)* — —
Total distributions (0.41) (0.44) (0.71) (0.74) (0.71)
Net asset value, end of year $8.87 $8.62 $8.63 $9.65 $9.90
Ratios and supplemental data:Total return(b) 7.82% 5.26% (3.25%) 5.11% 7.21%
Net assets, end of year (000) $36,351 $41,046 $71,513 $132,756 $201,791
Ratio of net expenses to average net assets 1.29% 1.33% 1.28% 1.18% 1.18%
Ratio of gross expenses to average net assets prior to expense reductions 1.43% 1.33% 1.28% 1.18% 1.18%
Ratio of net investment income (loss) to average net assets 4.57% 4.81% 4.73% 4.84% 5.11%
Year Ended October 31,2017 2016 2015 2014 2013
Portfolio turnover rate 93.1% 44.4% 65.3% 51.2% 55.1%
Class CYear Ended October 31,
2017 2016 2015 2014 2013
Net asset value, beginning of year $9.03 $9.03 $10.06 $10.29 $10.28
Income from investment operations:Net investment income (loss)(a) 0.35 0.36 0.38 0.42 0.45
Net realized and unrealized gain (loss) 0.27 0.01 (0.78) 0.01 0.19
Total from investment operations 0.62 0.37 (0.40) 0.43 0.64
Distributions:Dividends from net investment income (0.34) (0.37) (0.39) (0.47) (0.50)
Dividends from net realized gains — — (0.24) (0.19) (0.13)
Return of capital — — (0.00)* — —
Total distributions (0.34) (0.37) (0.63) (0.66) (0.63)
Net asset value, end of year $9.31 $9.03 $9.03 $10.06 $10.29
Ratios and supplemental data:Total return(b) 6.97% 4.35% (3.94%) 4.32% 6.37%
Net assets, end of year (000) $13,286 $17,479 $21,149 $29,333 $34,146
Ratio of net expenses to average net assets 2.05% 2.08% 2.04% 1.93% 1.93%
Ratio of gross expenses to average net assets prior to expense reductions 2.18% 2.08% 2.04% 1.93% 1.93%
Ratio of net investment income (loss) to average net assets 3.80% 4.07% 3.98% 4.10% 4.37%
* Amounts are less than $0.005.
(a) Net investment income (loss) allocated based on average shares method.
(b) Total return measures net investment income (loss) and capital gain or loss from portfolio investments assuming reinvestment of dividends and capital gains distributions. Total return isnot annualized for periods that are less than a full year, does not reflect the effect of sales charge for Class A shares nor the contingent deferred sales charge for Class B and C sharesand does not reflect the deduction of taxes that a shareholder would pay on fund distributions or the redemption of fund shares.
www.calamos.com 203

Calamos High Income Opportunities Fund Financial Highlights
Class IYear Ended October 31,
2017 2016 2015 2014 2013
Net asset value, beginning of year $8.61 $8.63 $9.65 $9.90 $9.92
Income from investment operations:Net investment income (loss)(a) 0.43 0.42 0.45 0.50 0.53
Net realized and unrealized gain (loss) 0.25 0.02 (0.74) 0.02 0.19
Total from investment operations 0.68 0.44 (0.29) 0.52 0.72
Distributions:Dividends from net investment income (0.43) (0.46) (0.49) (0.58) (0.61)
Dividends from net realized gains — — (0.24) (0.19) (0.13)
Return of capital — — (0.00)* — —
Total distributions (0.43) (0.46) (0.73) (0.77) (0.74)
Net asset value, end of year $8.86 $8.61 $8.63 $9.65 $9.90
Ratios and supplemental data:Total return(b) 8.09% 5.41% (3.00%) 5.37% 7.50%
Net assets, end of year (000) $10,026 $15,183 $17,452 $24,342 $25,103
Ratio of net expenses to average net assets 1.02% 1.08% 1.04% 0.93% 0.93%
Ratio of gross expenses to average net assets prior to expense reductions 1.18% 1.08% 1.04% 0.93% 0.93%
Ratio of net investment income (loss) to average net assets 4.84% 5.07% 4.98% 5.10% 5.37%
Class RYear Ended October 31,
2017 2016 2015 2014 2013
Net asset value, beginning of year $8.60 $8.62 $9.64 $9.89 $9.91
Income from investment operations:Net investment income (loss)(a) 0.37 0.38 0.41 0.45 0.48
Net realized and unrealized gain (loss) 0.26 0.02 (0.75) 0.02 0.18
Total from investment operations 0.63 0.40 (0.34) 0.47 0.66
Distributions:Dividends from net investment income (0.39) (0.42) (0.44) (0.53) (0.55)
Dividends from net realized gains — — (0.24) (0.19) (0.13)
Return of capital — — (0.00)* — —
Total distributions (0.39) (0.42) (0.68) (0.72) (0.68)
Net asset value, end of year $8.84 $8.60 $8.62 $9.64 $9.89
Ratios and supplemental data:Total return(b) 7.42% 4.90% (3.48%) 4.87% 6.92%
Net assets, end of year (000) $123 $272 $154 $209 $192
Ratio of net expenses to average net assets 1.57% 1.57% 1.54% 1.43% 1.43%
Ratio of gross expenses to average net assets prior to expense reductions 1.69% 1.57% 1.54% 1.43% 1.43%
Ratio of net investment income (loss) to average net assets 4.29% 4.55% 4.49% 4.60% 4.89%
* Amounts are less than $0.005.
(a) Net investment income (loss) allocated based on average shares method.
(b) Total return measures net investment income (loss) and capital gain or loss from portfolio investments assuming reinvestment of dividends and capital gains distributions. Total return isnot annualized for periods that are less than a full year, does not reflect the effect of sales charge for Class A shares nor the contingent deferred sales charge for Class B and C sharesand does not reflect the deduction of taxes that a shareholder would pay on fund distributions or the redemption of fund shares.
204 CALAMOS OPEN-END FAMILY OF FUNDS ANNUAL REPORT
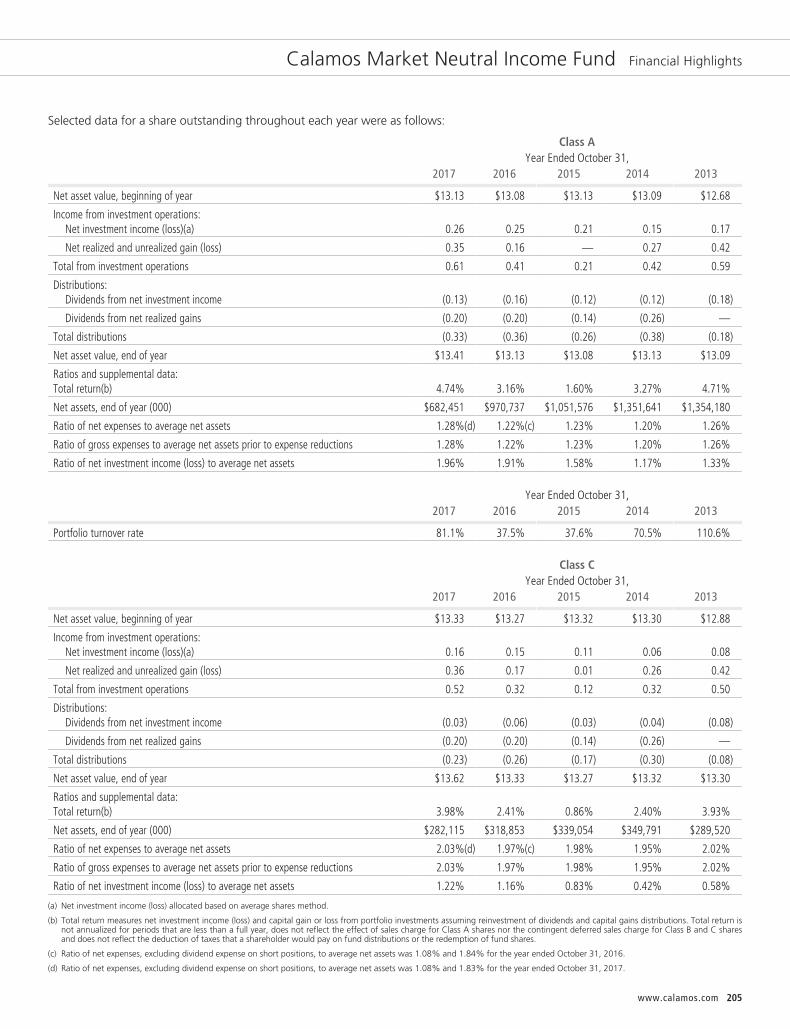
Calamos Market Neutral Income Fund Financial Highlights
Selected data for a share outstanding throughout each year were as follows:
Class AYear Ended October 31,
2017 2016 2015 2014 2013
Net asset value, beginning of year $13.13 $13.08 $13.13 $13.09 $12.68
Income from investment operations:Net investment income (loss)(a) 0.26 0.25 0.21 0.15 0.17
Net realized and unrealized gain (loss) 0.35 0.16 — 0.27 0.42
Total from investment operations 0.61 0.41 0.21 0.42 0.59
Distributions:Dividends from net investment income (0.13) (0.16) (0.12) (0.12) (0.18)
Dividends from net realized gains (0.20) (0.20) (0.14) (0.26) —
Total distributions (0.33) (0.36) (0.26) (0.38) (0.18)
Net asset value, end of year $13.41 $13.13 $13.08 $13.13 $13.09
Ratios and supplemental data:Total return(b) 4.74% 3.16% 1.60% 3.27% 4.71%
Net assets, end of year (000) $682,451 $970,737 $1,051,576 $1,351,641 $1,354,180
Ratio of net expenses to average net assets 1.28%(d) 1.22%(c) 1.23% 1.20% 1.26%
Ratio of gross expenses to average net assets prior to expense reductions 1.28% 1.22% 1.23% 1.20% 1.26%
Ratio of net investment income (loss) to average net assets 1.96% 1.91% 1.58% 1.17% 1.33%
Year Ended October 31,2017 2016 2015 2014 2013
Portfolio turnover rate 81.1% 37.5% 37.6% 70.5% 110.6%
Class CYear Ended October 31,
2017 2016 2015 2014 2013
Net asset value, beginning of year $13.33 $13.27 $13.32 $13.30 $12.88
Income from investment operations:Net investment income (loss)(a) 0.16 0.15 0.11 0.06 0.08
Net realized and unrealized gain (loss) 0.36 0.17 0.01 0.26 0.42
Total from investment operations 0.52 0.32 0.12 0.32 0.50
Distributions:Dividends from net investment income (0.03) (0.06) (0.03) (0.04) (0.08)
Dividends from net realized gains (0.20) (0.20) (0.14) (0.26) —
Total distributions (0.23) (0.26) (0.17) (0.30) (0.08)
Net asset value, end of year $13.62 $13.33 $13.27 $13.32 $13.30
Ratios and supplemental data:Total return(b) 3.98% 2.41% 0.86% 2.40% 3.93%
Net assets, end of year (000) $282,115 $318,853 $339,054 $349,791 $289,520
Ratio of net expenses to average net assets 2.03%(d) 1.97%(c) 1.98% 1.95% 2.02%
Ratio of gross expenses to average net assets prior to expense reductions 2.03% 1.97% 1.98% 1.95% 2.02%
Ratio of net investment income (loss) to average net assets 1.22% 1.16% 0.83% 0.42% 0.58%
(a) Net investment income (loss) allocated based on average shares method.
(b) Total return measures net investment income (loss) and capital gain or loss from portfolio investments assuming reinvestment of dividends and capital gains distributions. Total return isnot annualized for periods that are less than a full year, does not reflect the effect of sales charge for Class A shares nor the contingent deferred sales charge for Class B and C sharesand does not reflect the deduction of taxes that a shareholder would pay on fund distributions or the redemption of fund shares.
(c) Ratio of net expenses, excluding dividend expense on short positions, to average net assets was 1.08% and 1.84% for the year ended October 31, 2016.
(d) Ratio of net expenses, excluding dividend expense on short positions, to average net assets was 1.08% and 1.83% for the year ended October 31, 2017.
www.calamos.com 205

Calamos Market Neutral Income Fund Financial Highlights
Class IYear Ended October 31,
2017 2016 2015 2014 2013
Net asset value, beginning of year $12.98 $12.94 $12.99 $12.97 $12.56
Income from investment operations:Net investment income (loss)(a) 0.29 0.27 0.24 0.18 0.20
Net realized and unrealized gain (loss) 0.36 0.16 — 0.25 0.42
Total from investment operations 0.65 0.43 0.24 0.43 0.62
Distributions:Dividends from net investment income (0.17) (0.19) (0.15) (0.15) (0.21)
Dividends from net realized gains (0.20) (0.20) (0.14) (0.26) —
Total distributions (0.37) (0.39) (0.29) (0.41) (0.21)
Net asset value, end of year $13.26 $12.98 $12.94 $12.99 $12.97
Ratios and supplemental data:Total return(b) 5.07% 3.38% 1.89% 3.40% 5.01%
Net assets, end of year (000) $3,734,035 $2,587,922 $2,377,641 $2,470,829 $1,574,197
Ratio of net expenses to average net assets 1.02%(d) 0.97%(c) 0.98% 0.95% 1.01%
Ratio of gross expenses to average net assets prior to expense reductions 1.02% 0.97% 0.98% 0.95% 1.01%
Ratio of net investment income (loss) to average net assets 2.22% 2.15% 1.83% 1.41% 1.57%
Class RYear Ended October 31,
2017 2016 2015 2014 2013
Net asset value, beginning of year $13.07 $13.03 $13.08 $13.05 $12.64
Income from investment operations:Net investment income (loss)(a) 0.23 0.21 0.17 0.12 0.14
Net realized and unrealized gain (loss) 0.36 0.15 0.01 0.26 0.42
Total from investment operations 0.59 0.36 0.18 0.38 0.56
Distributions:Dividends from net investment income (0.10) (0.12) (0.09) (0.09) (0.15)
Dividends from net realized gains (0.20) (0.20) (0.14) (0.26) —
Total distributions (0.30) (0.32) (0.23) (0.35) (0.15)
Net asset value, end of year $13.36 $13.07 $13.03 $13.08 $13.05
Ratios and supplemental data:Total return(b) 4.58% 2.84% 1.36% 2.97% 4.47%
Net assets, end of year (000) $6,485 $8,512 $8,464 $9,099 $5,408
Ratio of net expenses to average net assets 1.53%(d) 1.47%(c) 1.48% 1.45% 1.52%
Ratio of gross expenses to average net assets prior to expense reductions 1.53% 1.47% 1.48% 1.45% 1.52%
Ratio of net investment income (loss) to average net assets 1.72% 1.66% 1.33% 0.91% 1.08%
(a) Net investment income (loss) allocated based on average shares method.
(b) Total return measures net investment income (loss) and capital gain or loss from portfolio investments assuming reinvestment of dividends and capital gains distributions. Total return isnot annualized for periods that are less than a full year, does not reflect the effect of sales charge for Class A shares nor the contingent deferred sales charge for Class B and C sharesand does not reflect the deduction of taxes that a shareholder would pay on fund distributions or the redemption of fund shares.
(c) Ratio of net expenses, excluding dividend expense on short positions, to average net assets was 0.84% and 1.34% for the year ended October 31, 2016.
(d) Ratio of net expenses, excluding dividend expense on short positions, to average net assets was 0.83% and 1.33% for the year ended October 31, 2017.
206 CALAMOS OPEN-END FAMILY OF FUNDS ANNUAL REPORT

Calamos Hedged Equity Income Fund Financial Highlights
Selected data for a share outstanding throughout each year were as follows:
Class A
Year EndedOctober 31
December 31, 2014*through
October 31,2017 2016 2015
Net asset value, beginning of year $10.03 $10.00 $10.00Income from investment operations:
Net investment income (loss)(a) 0.12 0.10 0.06Net realized and unrealized gain (loss) 0.76 0.17 0.01
Total from investment operations 0.88 0.27 0.07Distributions:
Dividends from net investment income (0.06) (0.15) (0.07)Dividends from net realized gains — (0.09) —
Total distributions (0.06) (0.24) (0.07)Net asset value, end of year $10.85 $10.03 $10.00Ratios and supplemental data:Total return(b) 8.77% 2.79% 0.67%Net assets, end of year (000) $1,007 $10,275 $5,661Ratio of net expenses to average net assets 1.25% 1.22% 1.25%(c)Ratio of gross expenses to average net assets prior to expense reductions 2.14% 2.03% 3.05%(c)Ratio of net investment income (loss) to average net assets 1.12% 1.01% 0.78%(c)
Year EndedOctober 31,
December 31, 2014*through
October 31,2017 2016 2015
Portfolio turnover rate 49.2% 19.6% 29.4%
Class C
Year EndedOctober 31,
December 31, 2014*through
October 31,2017 2016 2015
Net asset value, beginning of year $10.00 $9.98 $10.00Income from investment operations:
Net investment income (loss)(a) 0.02 0.03 (0.00)**Net realized and unrealized gain (loss) 0.79 0.16 0.01
Total from investment operations 0.81 0.19 0.01Distributions:
Dividends from net investment income (0.03) (0.08) (0.03)Dividends from net realized gains — (0.09) —
Total distributions (0.03) (0.17) (0.03)Net asset value, end of year $10.78 $10.00 $9.98Ratios and supplemental data:Total return(b) 8.09% 1.92% 0.09%Net assets, end of year (000) $173 $156 $100Ratio of net expenses to average net assets 2.00% 1.97% 2.00%(c)Ratio of gross expenses to average net assets prior to expense reductions 3.03% 2.79% 3.79%(c)Ratio of net investment income (loss) to average net assets 0.24% 0.26% 0.03%(c)
* Commencement of operations.
** Amounts are less than $0.005.
(a) Net investment income (loss) allocated based on average shares method.
(b) Total return measures net investment income (loss) and capital gain or loss from portfolio investments assuming reinvestment of dividends and capital gains distributions. Total return isnot annualized for periods that are less than a full year, does not reflect the effect of sales charge for Class A shares nor the contingent deferred sales charge for Class B and C sharesand does not reflect the deduction of taxes that a shareholder would pay on fund distributions or the redemption of fund shares.
(c) Annualized.
www.calamos.com 207
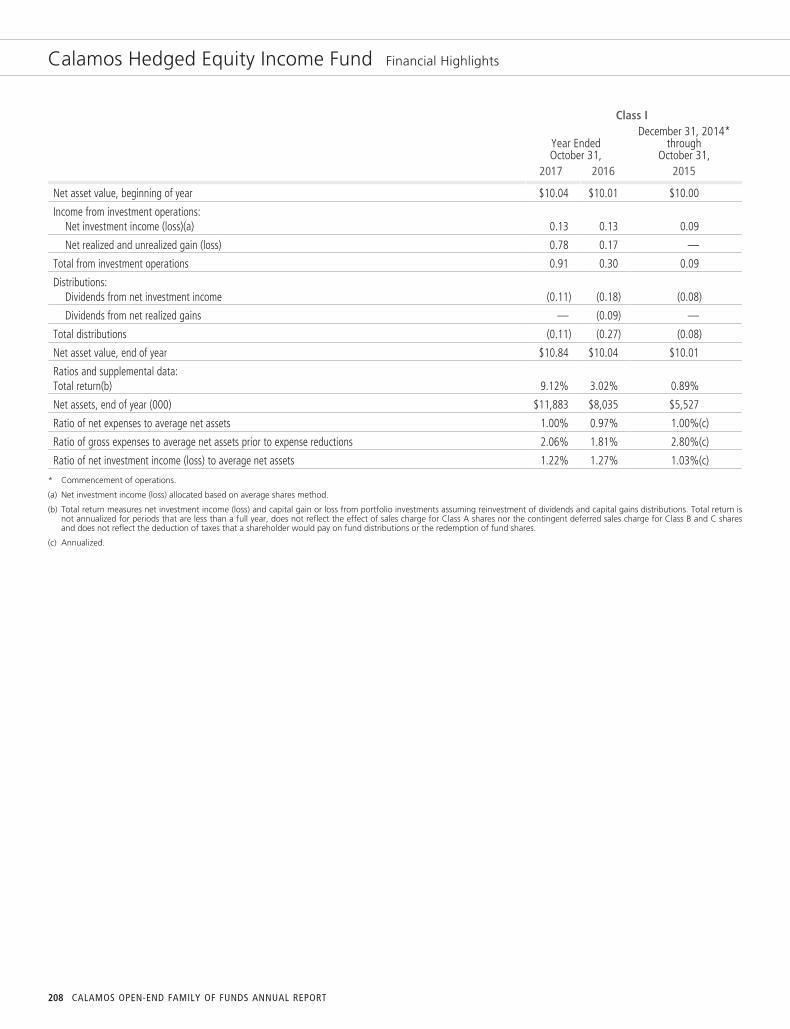
Calamos Hedged Equity Income Fund Financial Highlights
Class I
Year EndedOctober 31,
December 31, 2014*through
October 31,2017 2016 2015
Net asset value, beginning of year $10.04 $10.01 $10.00
Income from investment operations:Net investment income (loss)(a) 0.13 0.13 0.09
Net realized and unrealized gain (loss) 0.78 0.17 —
Total from investment operations 0.91 0.30 0.09
Distributions:Dividends from net investment income (0.11) (0.18) (0.08)
Dividends from net realized gains — (0.09) —
Total distributions (0.11) (0.27) (0.08)
Net asset value, end of year $10.84 $10.04 $10.01
Ratios and supplemental data:Total return(b) 9.12% 3.02% 0.89%
Net assets, end of year (000) $11,883 $8,035 $5,527
Ratio of net expenses to average net assets 1.00% 0.97% 1.00%(c)
Ratio of gross expenses to average net assets prior to expense reductions 2.06% 1.81% 2.80%(c)
Ratio of net investment income (loss) to average net assets 1.22% 1.27% 1.03%(c)
* Commencement of operations.
(a) Net investment income (loss) allocated based on average shares method.
(b) Total return measures net investment income (loss) and capital gain or loss from portfolio investments assuming reinvestment of dividends and capital gains distributions. Total return isnot annualized for periods that are less than a full year, does not reflect the effect of sales charge for Class A shares nor the contingent deferred sales charge for Class B and C sharesand does not reflect the deduction of taxes that a shareholder would pay on fund distributions or the redemption of fund shares.
(c) Annualized.
208 CALAMOS OPEN-END FAMILY OF FUNDS ANNUAL REPORT
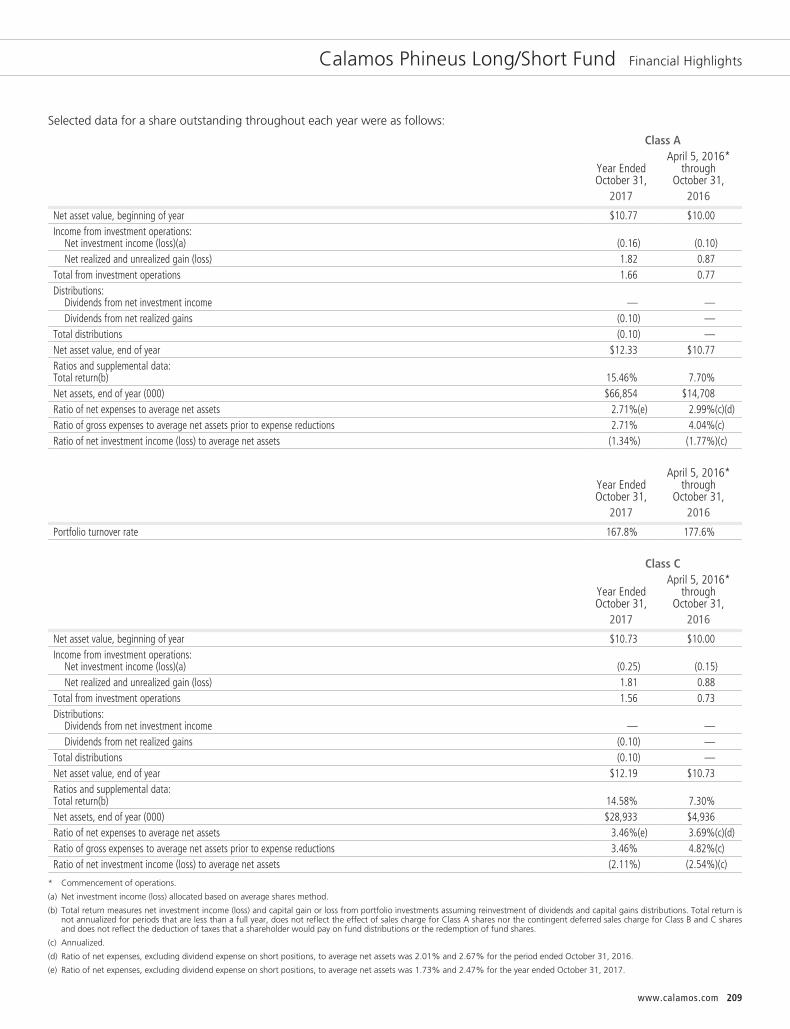
Calamos Phineus Long/Short Fund Financial Highlights
Selected data for a share outstanding throughout each year were as follows:
Class A
Year EndedOctober 31,
April 5, 2016*through
October 31,2017 2016
Net asset value, beginning of year $10.77 $10.00Income from investment operations:
Net investment income (loss)(a) (0.16) (0.10)Net realized and unrealized gain (loss) 1.82 0.87
Total from investment operations 1.66 0.77Distributions:
Dividends from net investment income — —Dividends from net realized gains (0.10) —
Total distributions (0.10) —Net asset value, end of year $12.33 $10.77Ratios and supplemental data:Total return(b) 15.46% 7.70%Net assets, end of year (000) $66,854 $14,708Ratio of net expenses to average net assets 2.71%(e) 2.99%(c)(d)Ratio of gross expenses to average net assets prior to expense reductions 2.71% 4.04%(c)Ratio of net investment income (loss) to average net assets (1.34%) (1.77%)(c)
Year EndedOctober 31,
April 5, 2016*through
October 31,2017 2016
Portfolio turnover rate 167.8% 177.6%
Class C
Year EndedOctober 31,
April 5, 2016*through
October 31,2017 2016
Net asset value, beginning of year $10.73 $10.00Income from investment operations:
Net investment income (loss)(a) (0.25) (0.15)Net realized and unrealized gain (loss) 1.81 0.88
Total from investment operations 1.56 0.73Distributions:
Dividends from net investment income — —Dividends from net realized gains (0.10) —
Total distributions (0.10) —Net asset value, end of year $12.19 $10.73Ratios and supplemental data:Total return(b) 14.58% 7.30%Net assets, end of year (000) $28,933 $4,936Ratio of net expenses to average net assets 3.46%(e) 3.69%(c)(d)Ratio of gross expenses to average net assets prior to expense reductions 3.46% 4.82%(c)Ratio of net investment income (loss) to average net assets (2.11%) (2.54%)(c)
* Commencement of operations.
(a) Net investment income (loss) allocated based on average shares method.
(b) Total return measures net investment income (loss) and capital gain or loss from portfolio investments assuming reinvestment of dividends and capital gains distributions. Total return isnot annualized for periods that are less than a full year, does not reflect the effect of sales charge for Class A shares nor the contingent deferred sales charge for Class B and C sharesand does not reflect the deduction of taxes that a shareholder would pay on fund distributions or the redemption of fund shares.
(c) Annualized.
(d) Ratio of net expenses, excluding dividend expense on short positions, to average net assets was 2.01% and 2.67% for the period ended October 31, 2016.
(e) Ratio of net expenses, excluding dividend expense on short positions, to average net assets was 1.73% and 2.47% for the year ended October 31, 2017.
www.calamos.com 209
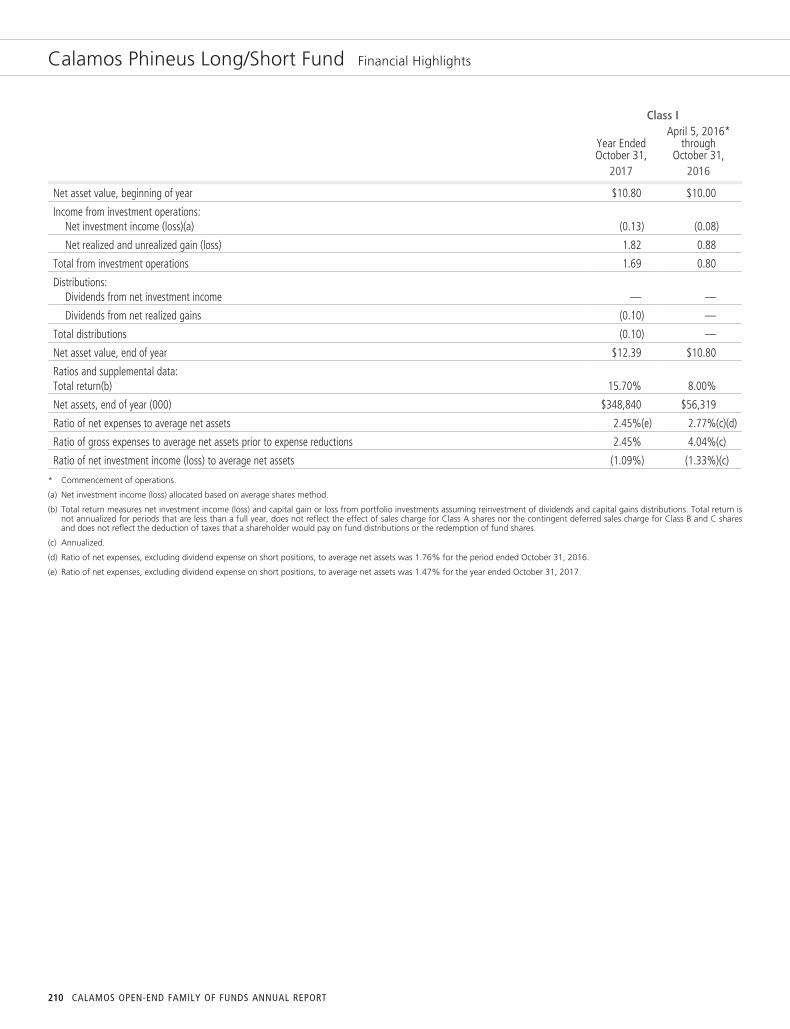
Calamos Phineus Long/Short Fund Financial Highlights
Class I
Year EndedOctober 31,
April 5, 2016*through
October 31,2017 2016
Net asset value, beginning of year $10.80 $10.00
Income from investment operations:Net investment income (loss)(a) (0.13) (0.08)
Net realized and unrealized gain (loss) 1.82 0.88
Total from investment operations 1.69 0.80
Distributions:Dividends from net investment income — —
Dividends from net realized gains (0.10) —
Total distributions (0.10) —
Net asset value, end of year $12.39 $10.80
Ratios and supplemental data:Total return(b) 15.70% 8.00%
Net assets, end of year (000) $348,840 $56,319
Ratio of net expenses to average net assets 2.45%(e) 2.77%(c)(d)
Ratio of gross expenses to average net assets prior to expense reductions 2.45% 4.04%(c)
Ratio of net investment income (loss) to average net assets (1.09%) (1.33%)(c)
* Commencement of operations.
(a) Net investment income (loss) allocated based on average shares method.
(b) Total return measures net investment income (loss) and capital gain or loss from portfolio investments assuming reinvestment of dividends and capital gains distributions. Total return isnot annualized for periods that are less than a full year, does not reflect the effect of sales charge for Class A shares nor the contingent deferred sales charge for Class B and C sharesand does not reflect the deduction of taxes that a shareholder would pay on fund distributions or the redemption of fund shares.
(c) Annualized.
(d) Ratio of net expenses, excluding dividend expense on short positions, to average net assets was 1.76% for the period ended October 31, 2016.
(e) Ratio of net expenses, excluding dividend expense on short positions, to average net assets was 1.47% for the year ended October 31, 2017.
210 CALAMOS OPEN-END FAMILY OF FUNDS ANNUAL REPORT
Report of Independent Registered Public Accounting Firm
To the Shareholders and Board of Trustees of Calamos Investment Trust
We have audited the accompanying statements of assets and liabilities, including the schedules of investments of Calamos InvestmentTrust, comprising of the Calamos Growth Fund, Calamos Opportunistic Value Fund, Calamos Dividend Growth Fund, CalamosInternational Growth Fund, Calamos Evolving World Growth Fund, Calamos Emerging Market Equity Fund, Calamos Global EquityFund, Calamos Growth and Income Fund, Calamos Global Growth and Income Fund, Calamos Convertible Fund, Calamos GlobalConvertible Fund, Calamos Total Return Bond Fund, Calamos High Income Opportunities Fund, Calamos Market Neutral IncomeFund, Calamos Hedged Equity Income Fund and Calamos Phineus Long/Short Fund (the “Funds”), as of October 31, 2017, and therelated statements of operations for the year then ended, and the statements of changes in net assets and the financial highlights foreach of the periods presented. These financial statements and financial highlights are the responsibility of the Funds’ management.Our responsibility is to express an opinion on these financial statements and financial highlights based on our audits.
We conducted our audits in accordance with the standards of the Public Company Accounting Oversight Board (United States). Thosestandards require that we plan and perform the audit to obtain reasonable assurance about whether the financial statements andfinancial highlights are free of material misstatement. The Funds are not required to have, nor were we engaged to perform, an auditof their internal control over financial reporting. Our audits included consideration of internal control over financial reporting as abasis for designing audit procedures that are appropriate in the circumstances, but not for the purpose of expressing an opinion onthe effectiveness of the Funds’ internal control over financial reporting. Accordingly, we express no such opinion. An audit alsoincludes examining, on a test basis, evidence supporting the amounts and disclosures in the financial statements, assessing theaccounting principles used and significant estimates made by management, as well as evaluating the overall financial statementpresentation. Our procedures included confirmation of securities owned as of October 31, 2017, by correspondence with thecustodian and brokers; when replies were not received from brokers, we performed other auditing procedures. We believe that ouraudits provide a reasonable basis for our opinion.
In our opinion, the financial statements and financial highlights referred to above present fairly, in all material respects, the financialposition of each of the Funds as of October 31, 2017, the results of their operations for the year then ended, and the changes in theirnet assets and the financial highlights for each of the periods presented, in conformity with accounting principles generally acceptedin the United States of America.
Chicago, IllinoisDecember 15, 2017
www.calamos.com 211
Trustee Approval of Management Agreement (Unaudited)
The board of trustees of the (the “Board”) Trust oversees the management of each of the Funds, and, as required by law, determinesannually whether to continue the Trust’s management agreement with Calamos Advisors LLC (the “Adviser”) pursuant to which theAdviser serves as the investment manager and administrator for each of the Funds. The “Independent Trustees,” who comprise morethan 80% of the Board, have never been affiliated with the Adviser.
In connection with their most recent consideration regarding the continuation of the management agreement, the Trustees receivedand reviewed a substantial amount of information provided by the Adviser in response to detailed requests of the IndependentTrustees and their independent legal counsel. In the course of their consideration of the agreement, the Independent Trustees wereadvised by their counsel and, in addition to meeting with management of the Adviser, they met separately in executive session withtheir counsel.
At a meeting held on June 21, 2017, based on their evaluation of the information referred to above and other information provided inthis and previous meetings, the Trustees determined that the overall arrangements between the Trust and the Adviser on behalf of theFunds were fair in light of the nature, quality and extent of the services provided by the Adviser and its affiliates, the fees charged forthose services and other matters that the Trustees considered relevant in the exercise of their business judgment. At that meeting, theTrustees, including all of the Independent Trustees, approved the continuation of the management agreement with respect to all ofthe Funds through July 31, 2018, subject to possible earlier termination as provided in the agreement.
In connection with its consideration of the management agreement, the Board considered, among other things: (i) the nature, qualityand extent of the Adviser’s services, (ii) the investment performance of each Fund as well as performance information for comparablefunds and other comparable clients of the Adviser, (iii) the fees and other expenses paid by each Fund as well as expense information forcomparable funds and for other, comparable clients of the Adviser, (iv) the profitability of the Adviser and its affiliates from theirrelationship with each Fund, (v) whether economies of scale may be realized as each Fund grows and whether potential economies maybe shared, in some measure, with Fund investors and (vi) other benefits to the Adviser from its relationship with the Funds. In theBoard’s deliberations, no single factor was responsible for the Board’s decision to approve continuation of the management agreements.
Nature, Quality and Extent of Services. The Board’s consideration of the nature, quality and extent of the Adviser’s services to theFunds took into account the knowledge gained from the Board’s meetings with the Adviser throughout the years. In addition, theBoard considered: the Adviser’s long-term history of managing the Funds; the consistency of investment approach; the backgroundand experience of the Adviser’s investment personnel responsible for managing the Funds; and the Adviser’s performance asadministrator of the Funds, including, among other things, in the areas of brokerage selection, trade execution, compliance andshareholder communications. The Board also reviewed the Adviser’s resources and key personnel involved in providing investmentmanagement services to the Funds. The Board noted the personal investments that the Adviser’s key investment personnel havemade in the Funds, which further aligns the interests of the Adviser and its personnel with those of the Funds’ shareholders. Inaddition, the Board considered compliance reports about the Adviser from the Funds’ Chief Compliance Officer.
The Board also considered the information provided by the Adviser regarding the Funds’ performance and the steps the Adviser istaking to improve performance. In particular, the Board noted the additional personnel added or planned to be added to theinvestment teams, which includes portfolio managers, research analysts, research associates and risk management personnel. TheBoard also noted the Adviser’s significant investment into its infrastructure and investment processes.
Investment Performance of the Funds. The Board considered each Fund’s investment performance over various time periods,including how the Fund performed compared to the median performance of a group of comparable funds (the Fund’s “Category”)selected by an independent third-party service provider. In certain instances noted below, the Category represents a custom group ofcomparable funds, also selected by an independent third-party service provider. The performance periods considered by the Boardended on March 31, 2017, except where otherwise noted. Where available, the Board considered one-, three-, five- and ten-yearperformance. To the extent the Board considered data for periods other than those ending on March 31, 2017 or consideredcomparative data in addition to that of the Category, the data was still produced by the independent third-party service provider.
Further detail considered by the Board regarding the investment performance of each Fund is set forth below:
Calamos Growth Fund. The Board considered that, while the Fund underperformed its custom Category median for all periods, theAdviser has made numerous changes which the Adviser believes will positively affect performance, including changes to the Fund’smanagement team and portfolio positioning. In this regard, the Board noted that the Adviser appointed a new lead portfolio
212 CALAMOS OPEN-END FAMILY OF FUNDS ANNUAL REPORT

Trustee Approval of Management Agreement (Unaudited)
manager in February 2017. The Board further considered that the Adviser’s changes appear to be resulting in improved performancewith the Fund placing in the 32nd percentile of its Category for the first quarter of 2017. In light of the foregoing and other mattersconsidered, the Board determined it would be prudent to allow the Adviser’s restructured investment team more time to develop itsperformance record.
Calamos Opportunistic Value Fund. The Board considered that, while the Fund underperformed its custom Category median forall periods, the Fund’s current management team has only been together since February 2015. The Board further noted the Adviser’sassertion that the Fund performed well in the year following the team restructuring, but that external market conditions hinderedperformance in the second half of 2016. The Board considered the Adviser’s assertion that recent changes made in the positioning ofthe Fund have resulted in improving performance, with the Fund outperforming its benchmark for the year-to-date period endedMay 31, 2017. The Board noted that it would continue to closely monitor performance.
Calamos Dividend Growth Fund. The Board considered that, while the fund underperformed its custom Category median for theone-and three-year periods, the majority of the Fund’s underperformance was not attributable to the Fund’s current portfoliomanagement team, which only assumed responsibility in February 2015. The Board also considered that the Fund’s performance isimproving, ranking in the 3rd percentile for the first quarter of 2017. In light of the improving performance, the Board determinedthat it would be prudent to allow the restructured investment team more time to develop its performance record.
Calamos International Growth Fund. The Board considered that the Fund outperformed its Category median during the ten-yearperiod, though the Fund underperformed its Category median for the shorter periods. The Board further considered that the Fundranked in the 49th percentile for the year-to-date period ended May 31, 2017.
Calamos Evolving World Growth Fund. The Board considered that, while the fund underperformed its Category median for allperiods, the Fund invests through a risk-managed approach, which underperforms when lower-quality value companies are favored.In view of this, the Board considered that the Fund ranked in the 20th percentile since inception and that it had outperformed itsbenchmark index in over 90% of the rolling five-year periods, measured in quarterly intervals, since inception. The Board alsoconsidered the Adviser’s representations that recent refinements to its investment process are resulting in improved performance. Tothis end, the Board considered that the Fund ranked in the 47th percentile for the year-to-date- ended May 31, 2017. In light of theFund’s strong long-term performance and favorable short-term performance trends, the Board considered that it would be prudentto allow the Fund’s investment team time to further develop its performance record and noted that it would continue to closelymonitor performance.
Calamos Emerging Market Equity Fund. The Board considered that, while the Fund underperformed its Category median for theone- and three-year periods, it only commenced operations in December 2013. The Board further considered that the Fund’sperformance has improved in 2017, with the Fund ranked in the 46th percentile for the year-to-date period ended May 31, 2017 andin the 25th percentile for the quarter ended on the same date. The Board noted the Adviser’s expectation of continued improvementsin performance as a result of its investment into infrastructure and risk management tools as well as a selective portfolio repositioningin response to the market environment. In light of the foregoing, the Board concluded that it would be prudent to allow theinvestment team time to develop its performance record and noted that it would continue to closely monitor performance.
Calamos Global Equity Fund. The Board considered that the Fund outperformed its Category median for the three- and ten-yearperiods, though the Fund underperformed its Category median during the other periods.
Calamos Growth and Income Fund. The Board considered that the Fund outperformed its custom Category median during theone-, three- and ten-year periods, though the Fund underperformed its custom Category median during the five-year period.
Calamos Global Growth and Income Fund. The Board considered that, while the Fund underperformed its custom Categorymedian during all periods, the Fund ranked in the 19th percentile for year-to-date period ended March 31, 2017. The Board alsonoted the Adviser’s significant recent additions to the investment management team.
Calamos Convertible Fund. The Board considered that, while the Fund underperformed its Category median during all periods, theFund ranked in the 47th percentile for the rolling one-year period ended May 31, 2017 and that it ranked in the 27th percentile for theyear-to-date period ended on the same date.
www.calamos.com 213
Trustee Approval of Management Agreement (Unaudited)
Calamos Global Convertible Fund. The Board considered that, while the Fund underperformed its Category median for the one-year period, the Fund ranked in the 7th percentile for the year-to-date period ended May 31, 2017. The Board also took into accountthat the Fund only commenced operations in December 2014. The Board noted, therefore, that it would be prudent to allow theAdviser additional time to develop its long-term performance record with the Fund.
Calamos Total Return Bond Fund. The Board considered that the Fund outperformed its custom Category median for the three-year period, though it was in the 56th and 59th percentiles, during the one- and five-year periods, respectively. The Board also notedthe Adviser’s significant recent additions to the investment management team.
Calamos High Income Opportunities Fund. The Board considered that, while the Fund underperformed its Category median for allperiods, the Adviser had recently made significant changes to the portfolio management team. To this end, the Board noted that theAdviser hired a new lead portfolio manager in November 2016 and also added four additional investment team members in 2017. TheBoard further considered the Adviser’s assertion that team changes were starting to have a positive effect on performance, with theFund ranking in the 47th percentile for the rolling one-year period ended May 31, 2017 and the Fund ranking in the 6th percentile forthe quarter ended on the same date. The Board determined that, in light of the Adviser’s changes and improving performance trends,it would be prudent to allow the Adviser’s restructured team more time to continue to develop its performance record.
Calamos Market Neutral Income Fund. The Board considered that the Fund outperformed its Category median for all periods.
Calamos Hedged Equity Income Fund. The Board considered that the Fund outperformed its Category median during the one-year period.
Calamos Phineus Long/Short Fund. The Board considered that the Fund outperformed its Category median for all periods.
Costs of Services Provided and Profits Realized by the Adviser. Using information provided by an independent third-party serviceprovider, the Board evaluated each Fund’s actual management fee rate compared to the median management fee rate for othermutual funds similar in size, character and investment strategy (the Fund’s “Expense Group”), and the Fund’s total expense ratiocompared to the median total expense ratio of the Fund’s Expense Group.
The Board also reviewed the Adviser’s management fee rates for its institutional separate accounts and for its sub-advised funds (forwhich the Adviser provides portfolio management services only). The Board took into account the Adviser’s assertion that although,generally, the rates of fees paid by institutional clients were lower than the rates of fees paid by the Funds, the differences reflectedthe Adviser’s greater level of responsibilities and significantly broader scope of services regarding the Funds, the more extensiveregulatory obligations and risks associated with managing the Funds, and other financial considerations with respect to creation andsponsorship of the Funds. The Board considered factors that lead to more expenses for registered funds including but not limited to:(i) capital expenditures to establish a fund, (ii) length of time to reach critical mass, and the related expenses, (iii) higher servicing costsof intermediaries and shareholders, (iv) higher redemption rates of assets under management and (v) greater exposure to “makewhole” errors.
The Board also considered the Adviser’s costs in serving as the Funds’ investment adviser and manager, including but not limited tocosts associated with technology, infrastructure and compliance necessary to manage the Funds. The Board reviewed the Adviser’smethodology for allocating costs among the Adviser’s lines of business. The Board also considered information regarding thestructure of the Adviser’s compensation program for portfolio managers, analysts and certain other employees and the relationship ofsuch compensation to the attraction and retention of quality personnel. Finally, the Board reviewed information on the profitability ofthe Adviser in serving as each Fund’s investment manager and of the Adviser and its affiliates in all of their relationships with eachFund, as well as an explanation of the methodology utilized in allocating various expenses among the Funds and the Adviser’s otherbusiness units. Data was provided to the Board with respect to profitability, both on a pre- and post-marketing cost basis. The Boardreviewed the annual report of the Adviser’s parent company and discussed its corporate structure.
Further detail considered by the Board regarding the management fee rate and total expense ratio of each Fund is set forth below:
Calamos Growth Fund. The Board considered that, while the Fund’s management fee rate and total expense ratio are higher thanthe respective medians of the Fund’s Expense Group, the Adviser continues to invest resources in the Fund to address performance.
Calamos Opportunistic Value Fund. The Board considered that the Fund’s management fee rate and total expense ratio are lowerthan the respective medians of the Fund’s Expense Group.
214 CALAMOS OPEN-END FAMILY OF FUNDS ANNUAL REPORT
Trustee Approval of Management Agreement (Unaudited)
Calamos Dividend Growth Fund. The Board considered that the Fund’s management fee rate is within two basis points of theFund’s Expense Group median, though the Fund’s total expense ratio is higher.
Calamos International Growth Fund. The Board considered that the Fund’s management fee rate and total expense ratio arelower than the respective medians of the Fund’s Expense Group. The Board considered that the Fund’s management fee is subject toa performance adjustment, which serves to lower the management fee during periods of underperformance.
Calamos Evolving World Growth Fund. The Board considered that the Fund’s management fee rate and total expense ratio arehigher than the respective medians of the Fund’s Expense Group.
Calamos Emerging Market Equity Fund. The Board considered that the Fund’s management fee rate is equal to the median of theFund’s Expense Group, though the Fund’s total expense ratio is higher.
Calamos Global Equity Fund. The Board considered that the Fund’s management fee rate and total expense ratio are both higherthan the respective medians of the Fund’s Expense Group. The Board considered that the Fund’s management fee is subject to aperformance adjustment, which serves to lower the management fee during periods of underperformance. The Board reviewed theFund’s expenses in light of its performance record.
Calamos Growth and Income Fund. The Board considered that the Fund’s management fee rate and total expense ratio are bothhigher than the respective medians of the Fund’s Expense Group. The Board took into account, however, that the Fund’smanagement fee rate and its total expense ratio are both within one basis point of the respective Expense Group medians.
Calamos Global Growth and Income Fund. The Board considered that the Fund’s management fee rate and total expense ratioare both higher than the respective medians of the Fund’s Expense Group. The Board reviewed the Fund’s expenses in light of itsperformance record.
Calamos Convertible Fund. The Board considered that the Fund’s management fee rate and total expense ratio are both higherthan the respective medians of the Fund’s Expense Group. The Board reviewed the Fund’s expenses in light of its performance record.
Calamos Global Convertible Fund. The Board considered that the Fund’s management fee rate and total expense ratio are higherthan the respective medians of the Fund’s Expense Group.
Calamos Total Return Bond Fund. The Board considered that the Fund’s management fee rate is within three basis points of theFund’s Expense Group median. The Board also noted that, while the Fund’s total expense ratio is higher than the median, the Advisercontinues to invest resources in the Fund to address performance. The Board also considered the Adviser’s recent ten basis pointreduction to the Fund’s management fee rate.
Calamos High Income Opportunities Fund. The Board considered that, while the Fund’s management fee and total expense ratioare both higher than the median of the Fund’s Expense Group, the Adviser continues to invest resources in the Fund to addressperformance.
Calamos Market Neutral Income Fund. The Board considered that the Fund’s management fee rate and total expense ratio areboth lower than the respective medians of the Fund’s Expense Group. The Board also noted that the Fund’s total expense ratio is thesecond lowest of the Fund’s Expense Group.
Calamos Hedged Equity Income Fund. The Board considered that the Fund’s management fee rate is the second lowest of theFund’s Expense Group. The Board also noted that the Fund’s total expense ratio is the lowest of the Fund’s Expense Group.
Calamos Phineus Long/Short Fund. The Board considered that the Fund’s management fee rate and total expense ratio are boththe lowest of the Fund’s Expense Group.
Economies of Scale. The Board considered whether each Fund’s management fee shares with shareholders potential economies ofscale that may be achieved by the Adviser. The Board recognized that breakpoints in the fee schedule for each open-end Fund couldresult in the sharing of economies of scale as Fund assets increase. The Board also considered the Adviser’s agreement to reimburseeach open-end Fund for a portion of its expenses if the Fund’s expense ratio otherwise would exceed a certain level. The Board alsoconsidered the benefits accruing to shareholders from the Adviser’s investments into its infrastructure and investment processes. TheBoard concluded that the breakpoints in the fee schedule for each open-end Fund allow shareholders to benefit from potentialeconomies of scale that may be achieved by the Adviser.
www.calamos.com 215
Trustee Approval of Management Agreement (Unaudited)
Other Benefits Derived from the Relationship with the Funds. The Board also considered other benefits that accrue to the Adviser andits affiliates from their relationship with the Funds. The Board concluded that while the Adviser may potentially benefit from itsrelationship with the Funds in ways other than the fees payable by the Funds, the Funds also may benefit from their relationship withthe Adviser in ways other than the services to be provided by the Adviser and its affiliates pursuant to their agreements with theFunds and the fees payable by the Funds.
The Board also considered the Adviser’s use of a portion of the commissions paid by the Funds on their portfolio brokerage trans-actions to obtain research products and services benefiting the Funds and/or other clients of the Adviser and concluded, based onreports from the Funds’ Chief Compliance Officer, that the Adviser’s use of “soft” commission dollars to obtain research productsand services was consistent with regulatory requirements.
After full consideration of the above factors as well as other factors that were instructive in their consideration, the Trustees,including all of the Independent Trustees, concluded that the continuation of the management agreement for each Fund with theAdviser was in the best interest of each respective Fund and its shareholders.
216 CALAMOS OPEN-END FAMILY OF FUNDS ANNUAL REPORT
Trustees and Officers (Unaudited)
The management of the Fund, including general supervision of the duties performed for the Fund under the investment managementagreement between the Fund and Calamos Advisors, is the responsibility of its board of trustees. Each trustee elected will hold officefor the terms noted below or until such trustee’s earlier resignation, death or removal; however, each trustee who is not an interestedperson of the Fund shall retire as a trustee at the end of the calendar year in which the trustee attains the age of 75 years.
The following table sets forth each trustee’s name, year of birth, position(s) with the Fund, number of portfolios in the Calamos FundComplex overseen, principal occupation(s) during the past five years and other directorships held, and date first elected or appointed.Each Trustee oversees each Fund of the Trust.
NAME AND YEAR OF BIRTH POSITION(S) WITH FUND
PORTFOLIOS INFUND COMPLEX^
OVERSEEN
PRINCIPAL OCCUPATION(S)DURING THE PAST 5 YEARSAND OTHER DIRECTORSHIPS
Trustees who are interested persons of the Fund:
John P. Calamos, Sr., (1940)* Chairman, Trustee andPresident (since 1988)
23 Founder, Chairman, and Global Chief Investment Officer,Calamos Asset Management, Inc. (“CAM”), CalamosInvestments LLC (“CILLC”), Calamos Advisors LLC and itspredecessor (“Calamos Advisors”) and Calamos WealthManagement LLC (“CWM”), prior thereto, Chief ExecutiveOfficer (until 2016), and previously Chief Executive Officer,Calamos Financial Services LLC and its predecessor (“CFS”)(until 2013); Director, CAM
Trustees who are not interested persons of the Fund:
John E. Neal, (1950) Trustee (since 2001) 23 Private investor; Director, Equity Residential Trust (publicly-owned REIT) and Creation Investments (privateinternational microfinance company); Partner, Linden LLC(health care private equity); Director, Centrust Bank(Northbrook, Illinois community bank)
William R. Rybak, (1951) Trustee (since 2002) 23 Private investor; Chairman (since February 2016) andDirector, (since February 2010) Christian BrothersInvestment Services Inc.; Director, Private Bancorp; Trustee,JNL Series Trust, JNL Investors Series Trust and JNL VariableFund LLC**; (since January 2007) Trustee, Lewis University(since October 2012) formerly Executive Vice President andChief Financial Officer, Van Kampen Investments, Inc. andsubsidiaries (investment manager);
Stephen B. Timbers, (1944) Trustee (since 2004); LeadIndependent Trustee (since 2005)
23 Private investor
David D. Tripple, (1944) Trustee (since 2006) 23 Private investor; Trustee, Century Growth OpportunitiesFund (since 2010), Century Shares Trust and Century SmallCap Select Fund (since January 2004)***
Virginia G. Breen, (1964) Trustee (since 2015) 23 Trustee, Neuberger, Berman Fund Complex (since2015)****; Trustee, Jones Lang LaSalle Income PropertyTrust (since 2004); Director, UBS A&Q Fund Complex (since2008)*****; Director, Bank of America/US Trust Company(until 2015); Director of Modus Link Global Solutions, Inc.(until 2013)
* Mr. Calamos is an “interested person” of the Trust as defined in the 1940 Act because he is an officer of the Trust and an affiliate of Calamos Advisors and CFS.
** Overseeing 118 portfolios in fund complex.
*** Overseeing two portfolios in fund complex.
**** Overseeing eleven portfolios in fund complex.
***** Overseeing eight portfolios in fund complex.
^ The Fund Complex consists of CALAMOS Investment Trust, CALAMOS Advisors Trust, CALAMOS ETF Trust, CALAMOS Convertible Opportunities and Income Fund, CALAMOSConvertible and High Income Fund, CALAMOS Strategic Total Return Fund, CALAMOS Global Total Return Fund, CALAMOS Global Dynamic Income Fund and CALAMOS DynamicConvertible and Income Fund.
The address of each trustee is 2020 Calamos Court, Naperville, Illinois 60563.
www.calamos.com 217

Trustees and Officers (Unaudited)
Officers. The preceding table gives information about John P. Calamos, Sr., who is Chairman, Trustee and President of the Fund. Thefollowing table sets forth each other officer’s name, year of birth, position with the Fund and date first appointed to that position,and principal occupation(s) during the past five years. Each officer serves until his or her successor is chosen and qualified or until hisor her resignation or removal by the board of trustees.
NAME AND YEAR OF BIRTH POSITION(S) WITH FUNDPRINCIPAL OCCUPATION(S)DURING THE PAST 5 YEARS
John S. Koudounis, (1966) Vice President (since 2016) Chief Executive Officer, CAM, CILLC, Calamos Advisors, CWM and CFS (since 2016);Director CAM (Since 2016); President and Chief Executive Officer (2010-2016), MizuhoSecurities USA Inc.
Thomas Herman, (1961) Vice President (since 2016); priorthereto Chief Financial Officer(2016-2017)
Senior Vice President and Chief Financial Officer, CAM, CILLC, Calamos Advisors, CWM,and CFS (since 2016); Chief Financial Officer and Treasurer, Harris Associates(2010-2016)
Curtis Holloway, (1967) Chief Financial Officer(since March 2017) andTreasurer (since 2010), Priorthereto Assistant Treasurer(2007-2010)
Senior Vice President, Head of Fund Administration (since 2017), Calamos Advisors; VicePresident, Fund Administration, (since 2013)
Robert Behan, (1964) Vice President(since September 2013)
President (since 2015), Head of Global Distribution (since April 2013), CAM, CILLC,Calamos Advisors, and CFS; prior thereto Senior Vice President (2009-2013), priorthereto Head of US Intermediary Distribution (2010-2013)
J. Christopher Jackson, (1951) Vice President and Secretary(since 2010)
Senior Vice President, General Counsel and Secretary, CAM, CILLC, Calamos Advisors andCFS (since 2010); Director, Calamos Global Funds plc (since 2011)
Mark J. Mickey, (1951) Chief Compliance Officer(since 2005)
Chief Compliance Officer, Calamos Funds (since 2005)
The address of each officer is 2020 Calamos Court, Naperville, Illinois 60563.
218 CALAMOS OPEN-END FAMILY OF FUNDS ANNUAL REPORT
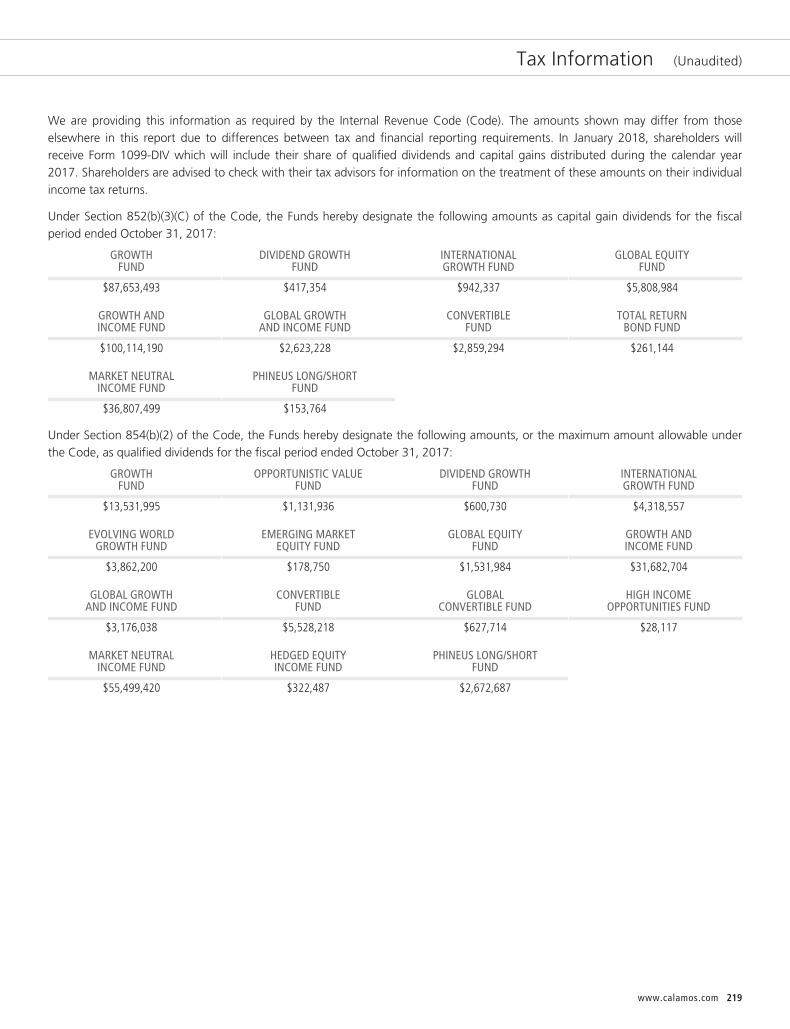
Tax Information (Unaudited)
We are providing this information as required by the Internal Revenue Code (Code). The amounts shown may differ from thoseelsewhere in this report due to differences between tax and financial reporting requirements. In January 2018, shareholders willreceive Form 1099-DIV which will include their share of qualified dividends and capital gains distributed during the calendar year2017. Shareholders are advised to check with their tax advisors for information on the treatment of these amounts on their individualincome tax returns.
Under Section 852(b)(3)(C) of the Code, the Funds hereby designate the following amounts as capital gain dividends for the fiscalperiod ended October 31, 2017:
GROWTHFUND
DIVIDEND GROWTHFUND
INTERNATIONALGROWTH FUND
GLOBAL EQUITYFUND
$87,653,493 $417,354 $942,337 $5,808,984
GROWTH ANDINCOME FUND
GLOBAL GROWTHAND INCOME FUND
CONVERTIBLEFUND
TOTAL RETURNBOND FUND
$100,114,190 $2,623,228 $2,859,294 $261,144
MARKET NEUTRALINCOME FUND
PHINEUS LONG/SHORTFUND
$36,807,499 $153,764
Under Section 854(b)(2) of the Code, the Funds hereby designate the following amounts, or the maximum amount allowable underthe Code, as qualified dividends for the fiscal period ended October 31, 2017:
GROWTHFUND
OPPORTUNISTIC VALUEFUND
DIVIDEND GROWTHFUND
INTERNATIONALGROWTH FUND
$13,531,995 $1,131,936 $600,730 $4,318,557
EVOLVING WORLDGROWTH FUND
EMERGING MARKETEQUITY FUND
GLOBAL EQUITYFUND
GROWTH ANDINCOME FUND
$3,862,200 $178,750 $1,531,984 $31,682,704
GLOBAL GROWTHAND INCOME FUND
CONVERTIBLEFUND
GLOBALCONVERTIBLE FUND
HIGH INCOMEOPPORTUNITIES FUND
$3,176,038 $5,528,218 $627,714 $28,117
MARKET NEUTRALINCOME FUND
HEDGED EQUITYINCOME FUND
PHINEUS LONG/SHORTFUND
$55,499,420 $322,487 $2,672,687
www.calamos.com 219
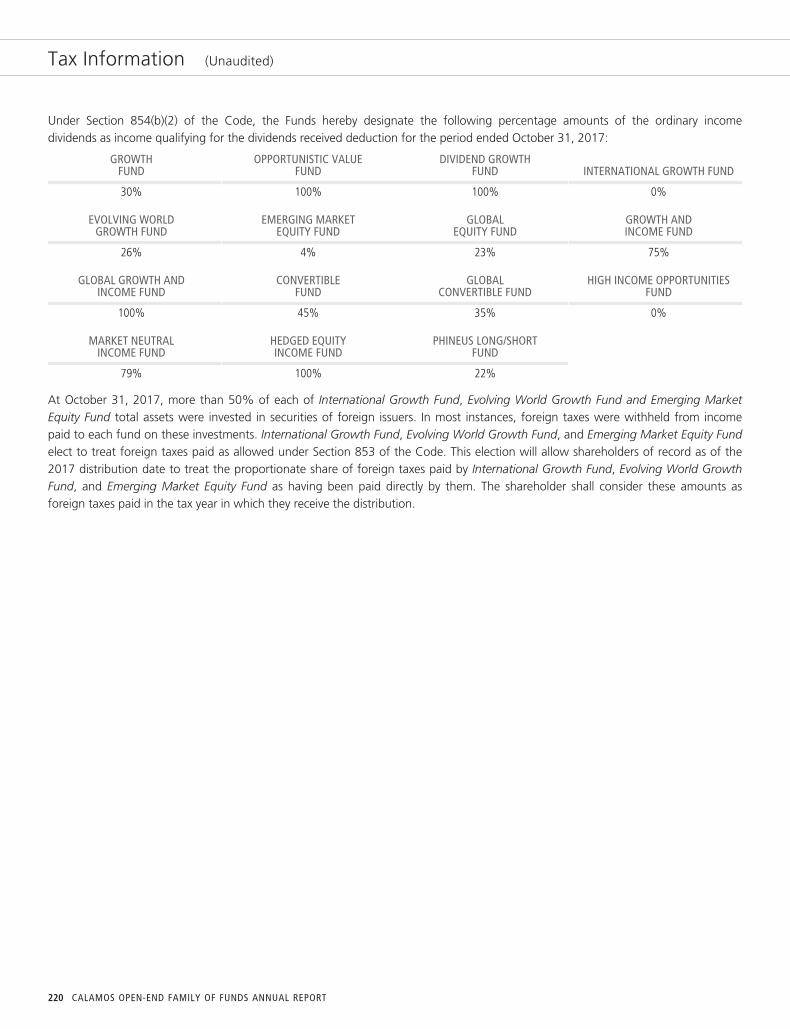
Tax Information (Unaudited)
Under Section 854(b)(2) of the Code, the Funds hereby designate the following percentage amounts of the ordinary incomedividends as income qualifying for the dividends received deduction for the period ended October 31, 2017:
GROWTHFUND
OPPORTUNISTIC VALUEFUND
DIVIDEND GROWTHFUND INTERNATIONAL GROWTH FUND
30% 100% 100% 0%
EVOLVING WORLDGROWTH FUND
EMERGING MARKETEQUITY FUND
GLOBALEQUITY FUND
GROWTH ANDINCOME FUND
26% 4% 23% 75%
GLOBAL GROWTH ANDINCOME FUND
CONVERTIBLEFUND
GLOBALCONVERTIBLE FUND
HIGH INCOME OPPORTUNITIESFUND
100% 45% 35% 0%
MARKET NEUTRALINCOME FUND
HEDGED EQUITYINCOME FUND
PHINEUS LONG/SHORTFUND
79% 100% 22%
At October 31, 2017, more than 50% of each of International Growth Fund, Evolving World Growth Fund and Emerging MarketEquity Fund total assets were invested in securities of foreign issuers. In most instances, foreign taxes were withheld from incomepaid to each fund on these investments. International Growth Fund, Evolving World Growth Fund, and Emerging Market Equity Fundelect to treat foreign taxes paid as allowed under Section 853 of the Code. This election will allow shareholders of record as of the2017 distribution date to treat the proportionate share of foreign taxes paid by International Growth Fund, Evolving World GrowthFund, and Emerging Market Equity Fund as having been paid directly by them. The shareholder shall consider these amounts asforeign taxes paid in the tax year in which they receive the distribution.
220 CALAMOS OPEN-END FAMILY OF FUNDS ANNUAL REPORT

MANAGING YOUR CALAMOSFUNDS INVESTMENTSCalamos Investments offers several convenient meansto monitor, manage and feel confident about yourCalamos investment choice.
24-HOUR AUTOMATED SHAREHOLDERASSISTANCE: 800.823.7386Through a single toll-free number, Calamos 24-Hour ShareholderAssistance is fast and easy. Get fund prices and account balances,review recent transactions, order statements, literature and more.
PERSONAL ASSISTANCE: 800.582.6959Dial this toll-free number to speak with a knowledgeable ClientServices Representative who can help answer questions oraddress issues concerning your Calamos Fund.
ONLINE ACCOUNT MANAGEMENT:www.calamos.comManage your personal account of Calamos Funds online atwww.calamos.com. On your account access page, you can viewaccount history and download data.
YOUR FINANCIAL ADVISORWe encourage you to talk to your financial advisor to determinehow the Calamos Funds can benefit your investment portfoliobased on your financial goals, risk tolerance, time horizon andincome needs.

This report, including the audited financial statements contained herein, is submittedfor general information for the shareholders of the Funds. The report is not authorizedfor distribution to prospective investors in the Funds unless accompanied by a currentlyeffective prospectus of the Funds and, after January 31, 2018, updated performancedata for the most recently completed fiscal quarter. The views expressed in this reportreflect those of Calamos Advisors LLC only through October 31, 2017. The managers’views are subject to change at any time based on market and other conditions.
A description of the Calamos Proxy Voting Policies and Procedures and the Funds’proxy voting record for the 12-month period ended June 30, 2017 are available free ofcharge upon request by calling 800.582.6959, by visiting the Calamos Web site atwww.calamos.com, or by writing Calamos at: Calamos Investments, Attn: ClientServices, 2020 Calamos Court, Naperville, IL 60563. The Funds’ proxy voting record isalso available free of charge by visiting the SEC Web site at www.sec.gov.
The Funds file a complete list of their portfolio holdings with the SEC for the first andthird quarters each fiscal year on Form N-Q. The Forms N-Q are available free of charge,upon request, by calling or writing Calamos Investments at the phone number oraddress provided above or by visiting the SEC Web site at www.sec.gov. You may alsoreview or, for a fee, copy the forms at the SEC’s Public Reference Room in Washington,D.C. Information on the operation of the Public Reference Room may be obtained bycalling 800.732.0330.
FOR 24-HOUR AUTOMATED SHAREHOLDER ASSISTANCE: 800.823.7386
TO OBTAIN INFORMATION ABOUT YOUR INVESTMENTS: 800.582.6959
VISIT OUR WEB SITE: www.calamos.com
INVESTMENT ADVISER:Calamos Advisors LLC2020 Calamos CourtNaperville, IL 60563-2787
CUSTODIAN AND FUND ACCOUNTING AGENT:State Street Bank and Trust CompanyBoston, MA
TRANSFER AGENT:U.S. Bancorp Fund Services, LLC615 E. Michigan St., 3rd FloorMilwaukee, WI 53202
INDEPENDENT REGISTERED PUBLIC ACCOUNTING FIRM:Deloitte & Touche LLPChicago, IL
LEGAL COUNSEL:Ropes & Gray LLPChicago, IL
STAY CONNECTEDwww.calamos.com/connect
Visit our Web site for timely fundperformance, detailed fund profiles, fundnews and insightful market commentary.
2020 Calamos CourtNaperville, IL 60563-2787800.582.6959www.calamos.com© 2017 Calamos Investments LLC. All Rights Reserved.Calamos® and Calamos Investments® are registeredtrademarks of Calamos Investments LLC.MFANR 1631 2017