family formation and ethnicity - australian institute of ... · pdf filefamily formation and...
TRANSCRIPT

9 June 1985
WORKING PAPER
Family Formation and Ethnicity
A report using Australian Family Formation Project data prepared for the Institute of Family Studies by Siew-Ean Khoo

Family Formation and Ethnicity
A report using Australian Family Formation Project data prepared for the Institute of Family Studies by Siew-Ean Khoo
Australian Family Formation Project-1981-82 IFS Survey A longitudinal survey of Australians aged 18 to 34 years conducted by the Institute of Family Studies in 1981-82. The Australian Family Formation Project team comprised D.E. Edgar, H. Glezer, C. Kilmartin, P. McDonald, A. Prolisko, D.E. Stewart, D. Storer and T. Tremayne
Institute of Family Studies Working Paper No. 9 June 1985

© Institute of Family Studies - Commonwealth of Australia 1985
Institute of Family Studies 766 Elizabeth Street Melbourne 3000 Australia Telephone (03) 342 9100
June 1985
The Australian Family Formation Project team comprised D. E. Edgar, H. Glezer, C. Kilmartin, P. McDonald, A. Prolisko, D. E. Stewart, D. Storer and T. Tremayne
National Library of Australia Cataloguing-in-Publication data
Khoo, Siew-Ean, 1949-Family formation and ethnicity.
ISBN 0 642 074712. 1. Family - Australia. 2. Family life surveys - Australia. I. Edgar, Don, 1936- . H. Australia. Institute of Family Studies. HI. Australian Family Formation Project. IV. Title. (Series: Working paper (Australia. Institute of Family Studies; no. 9).
306.8'0994
Typeset by Bookset Print~d by Globe Press Designed by Lauren Statham

Contents
Foreword vu
List of Tables IX
Introduction 1
1 Methodology 3 Scope of the analysis 3 Distribution of the sample 3
2 Characteristics of the Respondents 6 Age 6 Marital status 6 Location 7 Education 9 Work status 11 Family income 13 Religion 13 Summary 13
3 Family Background 14 Household size and composition 14 Family history 16
4 Leaving Home 20 Proportion leaving at age 18 or earlier 20 Reasons for leaving home 21 Living arrangements after leaving home 22 Destination after leaving home 24 Contact with parents after leaving home 24 Attitudes to living with parents 26
5 Relationships 29 Relationship patterns during adolescence 29 Sex life patterns 31 De facto relationships 32

6 Marriage 36 1981 Census: proportions married 36 Australian Family Formation Project: proportions married 36 Marital stability 37 Choice of partner 38 The proper time to marry 43 Attitudes 44
7 Child Bearing 48 Fertility and desired family size 48 Having children: preferences, pressures and reasons 52 Child care 54
8 Respondents' General Attitudes 59 Attitudes to sex roles 59 Major life pressures 59 Attitude to the future 60
9 Discussion 62 Differences between the groups 62 Similarities between the groups 64
10 Recommendations 65 Further analysis of the AFF Project survey data 65 Questions for future surveys 65
Appendices 67
List of References 69
Institute of Family Studies - Original Data Collection Australian Family Formation Project 70
iv

The author
Dr Siew-Ean Khoo is a Research Fellow at the Development Studies Centre, Australian National University. At the time of writing this Working Paper she was a consultant with the Australian Institute of Family Studies. Her research interests include family demography and population and development issues.

Foreword
This Working Paper is based on data from the Institute's first-phase survey of the Australian Family Formation Project. The national sample of 18 to 34 year olds, designed to represent the Australian population, contained a wide cross-section of ethnic groups. Inevitably however, the numbers from individual countries were not high enough to allow detailed country by country comparisons; Siew-Ean Khoo has therefore grouped them into broader categories which share certain characteristics.
Despite her careful disclaimers and cautionary notes, such a grouping is clearly valid and useful. For differences do show up in the attitudes towards marriage and having children between Northern and Southern Europeans, Asians, those of English-speaking origin and the Australian-born. Such differences are impottant for us all to keep in mind when we make sweeping generalisations about 'migrants' or 'non-English speakers' and their family values.
Perhaps even more important though, are the similarities that emerge from this study. Contrary to 'common knowledge' and stereotype, even contrary to patterns in their countries of origin, South-East Asians and Southern Europeans do not want or have large families, do not necessarily marry young and do look for attributes in a marital partner similar to those sought by Australians and Western Europeans. Such findings remind us that the demographic and social forces affecting our lifestyles and life choices are, to an extent, global ones.
We need to understand those pressures if we are to plan appropriately for young Australians. Though a study of 'family formation' may not seem, at first glance, to be very practical or policy-relevant, it is central to all social planning. The Australian Family Formation Project was the first project designed by the newly established Institute in 1980, because the future of marriage and family life depends upon how the young regard these two most basic institutions. If the high divorce rate, unemployment, economic uncertainty, changing sex roles, pessimism about the future turn young people away from forming their own families, the whole structure of society, its very cultural fabric, will change. Child care, schooling, housing, homeless youth, infant welfare and health centres are only a few of the areas obviously affected by changes in family formation patterns.
Our first-phase survey, conducted in 1981-82, shows some of the effects we predicted of social and economic pressures on attitudes to marriage and fertility. It also showed how strongly affirmed the family still is in Australian society, with over 90 per cent of our 18 to 34 year old sample expecting to marry or actually being already married, agreeing that 'marriage is for life' and wanting at least some children.
vii

This Working Paper, Family formation and ethnicity, gives a broad picture of these patterns for young Australians, in the context of the varied cultural values of our many ethnic groups. The Institute's Annual Report for 1982-83 describes many of the broader results, and more detailed papers are contained in the volumes of proceedings from both the 1983 Australian Family Research Conference and the 1984 XXth International CFR Seminar on 'Social Change and Family Policies', both published by and available from the Institute of Family Studies. We are soon to publish three other reports based on the Australian Family Formation Project: a study of de facto living by Siew-Ean Khoo, a study of marriage entry patterns by Gordon Carmichael and a study of the patterns of leaving home by Christabel Young.
The data from this major survey are available to the wider research fraternity via ACSPRI and the ANU Social Science Data Archives. It is Institute policy to have its larger data sets prepared for further analysis by others and there is a wealth of material for academics, students and government or independent researchers to use for their own purposes.
I should add that the Institute's other major contribution to the study of multiculturalism is soon to appear. This is a book called Ethnic family values in Australia, written by a distinguished collection of Australian experts and edited by Des Storer. The book analyses what is known about some fourteen different ethnic groups, their attitudes and social norms in relation to marriage, family, men, women, children, and divorce both here and in their countries of origin. Prentice-Hall Australia is the publisher.
Finally, I want to thank Siew-Ean Khoo for doing such a careful and succinct analysis of data which could never quite satisfy her demands. I trust this report will help enlighten the wider Australian public about the similarities and contrasts between their own lives and the many who have chosen to make their homes here.
viii
Don Edgar Director
Institute of Family Studies

List of Tables
1 Distribution of respondents in the AFF Project - 1981-82 IFS Survey according to birthplace categories .
2 Distribution of respondents in the AFF Project-1981-82 IFS Survey according to revised birthplace categories
3 Demographic characteristics of male sample 3a Demographic characteristics of female sample 4 Distribution of population aged 20-34 according to age group and sex 5 Socio-economic characteristics of male sample 5 a Socio-economic characteristics of female sample 6 Respondents aged 18-22 studying full or part time 7 Work status of respondents 8 Occupational distribution of employed respondents 9 Distribution of respondents according to household size
10 Distribution of respondents according to household structure 11 Respondents according to parents' characteristics 12 Foreign-born who came to Australia before age 15 13 Respondents according to parents' work status 14 Distribution of respondents according to their number of siblings 15 Respondents who left home by age 18 or earlier according to whether they came to
Australia after age 15 15a Australian-born respondents who had left home by age 18 according to parents'
birthplace 16 Respondents who left home at age 18 or earlier according to education and religious
practice 17 Respondents' reasons for leaving home 17a Respondents' living arrangements after leaving home 17b Respondents' destination after leaving home 18 Respondents who felt close to parents and kept in close contact after leaving home 19 Respondents who returned home after leaving the first time 20 Males agreeing with specific advantages/disadvantages of living with parents 20a Females agreeing with specific advantages/disadvantages of living with parents 21 Respondents willing to answer questions on sexual experience 22 Relationship patterns at age 15-17 23 Males serious about one person at age 18 according to education, religion and
religious practice
ix

23a Females serious about one person at age 18 according to education, religion and religious practice
24 Males who had had sex by age 18 according to education, occupation, religion and religious practice
24a Females who had had sex by age 18 according to education, occupation, religion and religious practice
25 Respondents who had been in a de facto relationship and/or were now in a de facto relationship
26 Males ever in a de facto relationship according to education, religion and religious practice
26a Females ever in a de facto relationship according to education, religion and religious practice
27 Males agreeing with specific advantages/disadvantages of de facto relationships 27a Females agreeing with specific advantages/disadvantages of de facto relationships 28 Respondents aged 20-34 ever married according to age group 29 Median age at first marriage of respondents aged 28-34 30 Respondents ever married whose first marriage was still iritact 31 Present marital status of respondents ever separated or divorced 32 Where males met or expected to meet their partners 32a Where females met or expected to meet their partners 33 Respondents with an Australian-born partner or a partner born in the same region 34 Characteristics respondents looked for in a partner 35 Respondents' views of what they would do if their parents disapproved of their choice
of partner 36 Respondents who agreed with statements on the 'proper time to marry' 37 Respondents who felt any pressure to marry earlier than they wanted to and source of
pressure 38 Reasons for marriage most frequently mentioned by married respondents 39 Respondents agreeing with specific advantages/disadvantages of marriage 40 Respondents agreeing with statements about divorce 41 Females ever married who had had children and average number of children ever had
according to age group 42 Females married at present according to number of children desired 43 Family size desired by females married at present according to demographic and
socio-economic characteristics 44 Family size desired by males married at present according to demographic and
socio-economic characteristics 45 Preferences of respondents with a partner at present for sons or daughters 46 Respondents, with a partner at present, who felt some pressure to have children 47 Respondents, with a partner at present, who would or did delay having children
according to reasons 48 Advantages/disadvantages of having children most frequently mentioned by males 48a Advantages/disadvantages of having children most frequently mentioned by females 49 Child care arrangements of respondents with a child under 12 while at work 49a Child care arrangements of respondents with a child under 12 when going out 50 Cost of paid child care per week to respondents 51 Respondents' agreement with statements about sex roles 52 Major pressures respondents faced in life at this stage 53 Interviewers' ratings of the language problems and the interview
x

Introduction
In 1981,22 per cent of the population in Australia were born overse<l;s, compared with 10 per cent in 1947. The immigration of people since World War 11, first from Eastern Europe, then from Northern and So~thern Europe and the Middle East, and most r~cently from South-East Asia - in addition to the continuing immigration of people from the Englishspeaking countries - has made Australia 'a nation of migrants' (Drury, 1976, in Rowland, 1982).
The history of post-war immigration to Australia and its consequences for the ethnic composition of the population has been well documented (Price, 1982; Rowland, 1982). However, in spite of the importance of the family in the social structure, not much work has been done to understand the ideas and traditions migrants bring to Australia, especially in regard to family roles and family formation.
This Working Paper is a beginning in this direction. Although exploratory in nature because of its small overseas-born sample, it represents a first step in efforts by the Australian Institute of Family Studies to examine the role of the family among the major migrant groups in Australia.
As the first stage in its major Australian Family Formation Project (AFF Project), * the Institute of Family Studies undertook a nationwide survey of family formation in Australia which included questions on ethnicity. This Working Paper, Family formation and ethnicity, is a comparison of the foreign-born (grouped according to their region of origin) and the Australian-born, based on the data collected in that 1981-82 IFS Survey concerning household structure, family background, marriage and fertility patterns, attitudes and decisions.
The findings which emerge from this investigation are complex. In some areas of family formation a number of foreign-born groups differed from the Australian-born; in other areas one foreign-born group contrasted not only with the Australian-born but also with the other foreign-born groups; in yet other areas there were strong similarities between all groups.
For example, several foreign-born groups still held to the social and religious values of the old country in the new, and these values continued to influence their attitudes to marriage and child bearing. The Southern European, Middle Eastern and South-East Asian groups were more traditional in their views of sex outside marriage, sex roles and the centrality of the family. People in these groups often had partners from the same ethnic background. • For details of the Institute's Australian Family Formation Project (AFF Project) see page 70 of this Working
Paper.

2 Institute of Family Studies WORKING PAPER No. 9
But with regard to age at marriage and concepts of marriage, one group - that from the Southern European/Middle Eastern region - contrasted with all other foreign-born groups as well as with the Australian-born. This group was unambiguously positive about marriage and child bearing; the family was seen as the main source of pleasure and emotional support. Southern European and Middle Eastern women married earlier than the women in all other groups and their marriages appeared more stable.
Yet all groups (English-speaking and non-English-speaking foreign-born and Australianborn) agreed on important aspects of family life. All wanted small families. All believed that the partners to a marriage should share the same goals and values.
The first part of this report (Chapters 2 and 3) describes the AFF Project survey data, the scope of the analysis, the demographic and socio-economic characteristics of the respondents and their household composition and family history. In the second part (Chapters 4 to 9), the findings on family formation patterns, attitudes and intentions are presented. The report concludes with an assessment of the main findings of the analysis, the effectiveness of the AFF Project survey questionnaire and with recommendations for the structuring of future surveys.

Family Formation and Ethnicity 3
1 Methodology
Data for this Working Paper come from the Australian Family Formation Project's Australiawide 1981 ~82 IFS Survey conducted by the Institute of Family Studies between October 1981 and February 1982 to examine family formation patterns of men and women then aged 18 to 34 years. The survey questionnaire covered such areas as family background, education, occupation, history of personal relationships, and attitudes and intentions regarding marriage and family formation.
Respondents in the AFF Project survey were selected using a probability sample design and came from randomly chosen households in 650 Collectors' Districts (CD) scattered throughout Australia. A skip interval of three occupied dwellings was adopted using random starting points within each CD. Approximately 15 households were contacted in each CD to yield four completed interviews. Whoever answered the door at each house call was asked first for details about the people living there and their relationship to one another. Then, in households where there was at least one person aged between 18 and 34 years, a detailed interview was obtained with one, randomly selected, person in that age range. A total of 2544 interviews was obtained from 1118 men and 1426 women.
Scope of the analysis
The primary objective of this report is to examine the data collected in the AFF Project survey for any important differences between the various ethnic groups concerning family formation plans and patterns and attitudes to marriage and the family. The report is an exploratory work; it cannot examine specific issues in depth because the AFF Project survey was designed to cover a broad range of topics.
The report takes a broad and simple definition of ethnicity. Ethnicity is defined by birthplace only. Consequently, the emphasis throughout is on a comparison of the foreign-born respondents of different ethnic origins with each other and with the Australian-born respondents. Because of sample size limitations, the foreign-born have been grouped according to the region rather than the specific country from which they came.
Distribution of the sample
Of the 2544 men and women interViewed in the AFF Project survey, 565 (22.3 per cent) were foreign-born. The distribution of the survey respondents by birthplace and sex is shown in Table 1.

4 Institute of Family Studies WORKING PAPER No. 9
Table 1 Distribution of respondents in the AFF Project-1981-82 IFS Survey according to birthplace categories
Total
Birthplace Males Females Number Percent
(1) Australia 857 1122 1979 77.8 (2) New Zealand 28 23 51 2.0 (3) Pacific Islands 5 7 12 0.5 (4) United Kingdom, Ireland 95 120 215 8.4 (5) Germany 10 14 24 0.9 (6) Netherlands 7 7 14 0.6 (7) Other Western Europe 7 3 10 0.4 (8) Greece 10 10 20 0.8 (9) Italy 16 23 39 1.5
(10) Yugoslavia 11 7 18 0.7 (11) Other Southern Europe 13 7 20 0.8 (12) Eastern Europe 8 5 13 0.5 (13) Middle East 14 13 27 1.1 (14) Africa 5 14 19 0.7 (15) South Asia 7 7 14 0.6 (16) South-East Asia, China 18 29 47 1.8 (17) USA, Canada 4 9 13 0.5 (18) South America 3 6 9 0.4
Total 1 118 1426 2544 100.0
The number of migrants from countries other than Britain and Ireland was small. Since the research required an examination of men and women separately and at times needed to control for such characteristics as age and marital status, a regrouping of the foreign-born was necessary to maintain adequate numbers of cases for analysis. The foreign-born were identified by region of origin rather than country of birth, a region being comprised of people with similar ethnic backgrounds. .
Respondents from the English-speaking countries (United Kingdom, Ireland, New Zealand, United States and Canada) were grouped together. Although there were linguistic and cultural differences between Western and Eastern Europeans, their small numbers also made it necessary to put them in one category. The third group, a 'Mediterranean' bloc, consisted of all those from the Southern European and Middle Eastern countries. Men and women from South-East Asia and China formed a fourth group which included two sub-groups - migrants and Indo-Chinese refugees. The last group comprised all the other foreign-born, a residual category consisting of the few persons born in Africa, South America, South Asia and the Pacific Islands. The distribution of the sample according to these new categories is shown in Table 2.
The construction of the survey sample to make it representative of the Australian population in terms of its sex ratio, marital status distribution and labour force participation rates resulted in some distortion of the numbers in the smaller ethnic groups. Therefore, it was decided that the unweighted sample would be used. Consequently, the findings reflect the respondents' rather than the Australian population's views and behaviour.
The small sample size of migrants meant that only tabulations by one or two characteristics other than region of origin and sex were possible. Statistical or demographic methods that

Family Formation and Ethnicity 5
Table 2 Distribution of respondents in the AFF Project- 1981-82 IFS Survey according to revised birthplace categories
Total
Birthplace Males Females Number Percent
Australia (1) 857 1122 1979 77.8 Other English-speaking countries 127 152 279 11.0
(2,4,17) Western and Eastern Europe 32 29 61 2.4
(5,6,7,12) Southern Europe, Middle East 64 60 124 4.9
(8,9, 10, 11, 13) South-East Asia, China (16) 18 29 47 1.8 Elsewhere (3,14,15,18) 20 34 54 2.1
Total 1118 1426 2544 100.0
Note: The flUmbers in parentheses refer to the birthplace numbers in Table 1.
required a reasonably large sample size fOJ stable and significant results could not be used unless the sample was classified into even broader ethnic categories, for example, persons of English-speaking origin, Europeans and Asians.
Notwithstanding these limitations, the analyses and findings that follow provide an insight into the attitudes and the family formation plans and patterns of the very diverse ethnic groups that now comprise the population of Australia.

6 Institute of Family Studies WORKING PAPER No. 9
2 Characteristics of the Respondents
To establish the backgrounds of the different ethnic groups against which their family formation patterns and attitudes could be considered, and to set up a number of the possible variables which could affect these patterns and attitudes, the demographic and socioeconomic characteristics of the respondents were examined. Levels of education, rates of workforce participation and unemployment, occupation and the distribution of family income were looked at in order to establish a profile of the socio-economic status of the different groups.
Age
The respondents were all aged between 18 and 34 years old. More women than men in the sample fell within the 28-34 age group. More than half of all the foreign-born women were in this oldest age group compared with 43 per cent of Australian-born women. One-half of the male respondents from Europe were also in this oldest age group, compared with one-third of the Australian-born males. Males who were born 'elsewhere' were comparatively younger. (See Tables 3 and 3a.)
The age distributions of the male respondents in the different birthplace groups bear out the census findings. According to the 1981 Census, the proportions of males born in other English-speaking countries and Europe were higher in the age groups 25-29 and 30-34 than in the age group 20-24 (Table 4). The age distribution of the Australian-born female respondents differs somewhat from that indicated in the census which shows a higher proportion in the younger age groups. Women over age 25 were slightly oversampled in the survey mainly because they were more likely to be at home minding young children and therefore available for the interview.
Marital status
More than half of the Australian-born males but only one-third of those born in Southern Europe and the Middle East were still single at the time of the survey. This difference results partly from the older age distribution of the Southern European/Middle Eastern men in the sample. About 45 per cent of Western and Eastern European males and two-thirds of the South-East Asian males were still single (Table 3).
Since women generally married at younger ages than men, a smaller proportion of the female respondents was still single. Only one-quarter of those born in the English-speaking countries and in Western and Eastern Europe were single, but one-third of the Australianborn and other foreign-born women were still single (Table 3a).

Family Formation and Ethnicity 7
Table 3 Demographic characteristics of male sample
Birthplace
Other Western Southern South-English- and Europe, East speaking Eastern Middle Asia,
Characteristics Australia countries Europe East China Elsewhere
AgeJyears) 18-22 37% 32% 25% 20% 28% 40% 23-27 30 29 25 23 39 45 28-34 33 39 50 56 33 15
Marital status Single 52 42 44 33 67 70 Married 39 45 44 64 28 25 De facto 7 9 9 2 0 0 Separated 1 2 0 2 6 5 Divorced 2 2 3 0 0 0 Widowed 0 0 0 0 0 0
Locality Metropolitan 68 84 81 84 100 85 Non-metropolitan 32 17 19 16 0 15
State NSW 38 30 28 45 39 60 Vic 24 17 28 39 22 20 Qld 14 12 13 3 0 5 SA 10 J3 22 6 0 10 WA 10. 21 6 5 33 5 Tas 3 1 3 0 0 0 NT 0 1 0 0 0 0 ACT 3 5 0 2 6 0
Number 857 127 32 64 18 20
The group born in Southern Europe and the Middle East had. the highest proportion of married males - nearly two-thirds. Very few men in this group were in de facto relationships or separated (less than 2 per cent in each category), and none were divorced. By. comparison, 7 per cent of the Australian-born men and 9 per cent of those born in the other English-speaking countries and Western and Eastern Europe were in de facto unions, and 2-4 per cent were separated or divorced. A similar marital status distribution is observed for the women in these groups. None of the respondents born in South-East Asia were in de facto unions, although about 6 per cent were separated or divorced: (SeeTables 3 and" 3a;)'
Location
Most of the foreign-born lived in metropolitan areas compared with about two-thirds of the Australian-born respondents. People from different regions appeared to favour different States. Those from English-speaking countries were found disproportionately in Western Australia, and Western and Eastern'European males were overrepresented in South Australia compared with the Australian-born respondents. About 80 per cent of the respondents from Southern Europe and the Middle East were in New South Wales and Victoria, mainly in the

8 Institute of Family Studies WORKING PAPER No. 9
Table 3a Demographic characteristics of female sample
Birthplace
Other Western Southern South-English- and Europe, East
speaking Eastern Middle Asia, Characteristics Australia countries Europe East China Elsewhere
Age (years) 18-22 32% 22% 21% 25% 14% 21% 23-27 25 26 17 18 28 32 28-34 43 51 62 57 59 47
Marital status Single 35 25 24 33 31 21 Married 53 59 69 63 62 71 De facto 4 7 0 2 0 9 Separated 3 3 3 2 3 0 Divorced 4 5 3 0 3 0 Widowed 0 1 0 0 0 0
Locality Metropolitan 67 75 76 87 86 91 Non-metropolitan 33 25 24 13 14 9
State NSW 35 35 38 50 48 41 Vic 23 20 28 25 17 21 Qld 16 12 7 5 14 9 SA 11 12 8 8 7 6 WA 9 17 14 12 10 21 Tas 3 2 7 0 0 0 NT 1 1 0 0 0 0 ACT 3 2 0 0 3 3
Number 1-122 152 29 60 29 34
Table 4 Distribution of population aged 20-34 according to age group and sex
Birthplace
Other Western Southern South-English- and Europe, East speaking Eastern Middle Asia,
Age group Australia countries Europe East China Elsewhere
Males 20-24 years 37% 30% 16% 23% 35% 29% 25-29 33 31 28 31 32 33 30-34 30 39 56 46 32 39
Females 20-24 years 37 31 16 23 29 29 25-29 33 31 28 32 35 35 30-34 30 38 55 44 36 37
Source: 1981 Census.

Family Formation and Ethnicity 9
Sydney and Melbourne metropolitan areas. Those from South-East Asia were somewhat more dispersed among the States (Tables 3 and 3a).
Education
Distribution across the different educational levels was much the same for the Australian-born and the respondents from the other English-speaking countries and Europe, excluding Southern Europe. Those from Southern Europe and the Middle East had a slightly lower level of education on average. More than half of the male respondents from this region and nearly two-thirds of the female respondents had less than 11 years of schooling. Respon-dents from South-East Asia were more highly educated; 44 per cent of males and 31 per cent of females had some tertiary education (Tables S and Sa).
TableS Socio-economic characteristics of male sample
Birthplace
Other Western Southern South-Engl~sh- and Europe, East
speaking Eastern Middle Asia, Characteristics Australia countries Europe East China Elsewhere
Education / < 11 years 44% 47% 41% 53% 39% 45% 11-12 years 30 28 28 19 17 30 Tertiary 27 25 31 28 44 25
Activity Working 87 83 84 83 61 85 Studying 5 10 6 8 22 0 Home duties 0 0 0 0 6 0 Unemployed 6 7 9 8 6 15 Other 0 0 0 2 6 0
Family income Not stated 4 9 6 4 6 0 < $4 000 10 12 9 8 33 20 $4001-$10 000 20 17 13 22 28 20 $10001-$18000 32 27 38 39 11 35 $18001-$30000 25' 26 34 22 22 20 > $30 001 9 9 0 5 0 5
Religion Catholic 26 11 31 58 22 45 Other Christian 52 56 38 30 33 45 Muslim 0 0 0 6 6 0 Other 1 2 0 0 17 0 No religion 22 32 31 6 22 10
Religious practice Practising 46 39 44 73 61 80 Not practising 54 61 53 27 39 20'
Number 857 127 32 64 18 20

10 Institute of Family Studies WORKING PAPER No. 9
Table Sa Socio-economic characteristics of female sample
Birthplace
Other Western Southern South-English- and Europe, East
speaking Eastern Middle Asia, Characteristics Australia countries Europe East China Elsewhere
Education < 11 years 49% 50% 52% 62% 31% 29% 11-12 years 24 23 28 20 38 29 Tertiary 27 27 21 18 31 41
Activity Working full time 36 32 35 32 41 65 Working part time 18 20 21 12 7 3 Studying 5 3 0 5 10 3 Home duties 37 43 41 42 41 27 Unemployed 4 2 3 10 0 3
Family income Not stated 10 9 3 4 14 6 < $4000 10 11 7 12 7 3 $4001-$10000 16 11 10 25 21 12 $10001-$18000 32 27 38 37 24 32 $18001-$30000 24 32 21 17 28 35 > $30 001 8 10 21 6 7 12
Religion Catholic 27 17 48 63 21 62 Other Christian 60 65 24 25 31 27 Muslim 0 0 0 5 0 3 Other 1 1 0 0 21 3 No religion 12 17 28 7 28 6
Religious practice Practising 56 45 52 85 55 77 Not practising 44 55 48 15 45 24
Number 1122 152 29 60 29 34
Among the respondents aged 18 to 22, 43 per cent of the Australian-born males and 28 per cent of the females were full-time or part-time students. Compared with the Australianborn, a higher proportion of males but a lower proportion of females from the other English-speaking countries and Western and Eastern Europe were studying. The proportion of students among male and female Southern European/Middle Eastern respondents was about the same: 11 out of the 26 respondents were enrolled in full-time or part-time study. Two-thirds of the nine South-East Asian-born respondents in this age group were students, the highest proportion found for the six birthplace groups being compared, although the number of cases was the smallest (Table 6).
An examination of the questionnaires of the 12 South-East Asian-born respondents aged 18 to 34 years who were full-time or part-time students showed that three of them (two males and one female) were foreign students who shared a house with a group of people and

Family Formation and Ethnicity 11
Table 6 Respondents aged 18-22 studying full or part time
Birthplace
Australia Other English-speaking countries Western and Eastern Europe Southern Europe, Middle East South-East Asia, China Elsewhere
% Studying
43 48 75 39 60 13
Males
Number 18-22 yrs
318 40
8 13 5 8
Females
% Studying
28 15 17 47 75 29
Number 18-22 yrs
364 34
6 13 4 7
whose parents had never been in Australia, and two were male Caucasians born in South-East Asia of Australian parents. The other seven appeared to be permanent migrants. Although it would have been preferable to exclude the Caucasians from the South-East Asian category, two should not affect the group pattern very much except where the number of cases is small.
Work status
Of the men, the Australian-born had the highest proportion working (87 per cent) and the lowest proportion studying (5 per cent); the South-East Asians had the lowest proportion working (61 per cent) and the highest proportion of students (22 per cent). The labour force participation rates of the male respondents were between 90 and 94 per cent for all birthplace categories except South-East Asia which had a rate of 67 per cent. The unemployment rate was lowest among the Australian-born respondents (6.5 per cent) while males in the 'elsewhere' category and those from Europe had comparatively high unemployment rates of 10 to 15 per cent (Table 7).
Table 7 Work status of respondents
Birthplace
Other Western Southern South-English- and Europe, East
speaking Eastern Middle Asia, Australia countries Europe East China Elsewhere
Males In labour force 94% 90% 94% 91% 67% 100%
Of those in labour force employed 94 92 90 91 92 85 unemployed 7 8 10 9 8 15
Females In labour force 58 54 59 53 48 71
Of those in labour force full-time employed 61 60 59 59 86 92 part-time employed 31 37 35 20 14 4 unemployed 8 4 6 19 0 4

12 Institute of Family Studies WORKING PAPER No. 9
About 40 per cent of women in all the birthplace groups except the 'elsewhere' category were involved in home duties; only 27 per cent of women in the 'elsewhere' group were homemakers. Women from this category had the highest labour force participation rate (71 per cent) and those from South-East Asia had the lowest (48 per cent). Ten per cent of the South-East Asian women were students compared with 5 per cent or less of the other women (Table Sa).
Of the women who were in the labour fotce, about 90 per cent of those from South-East Asia and 'elsewhere' worked full time while only about 60 per cent of the Australian-born and those from the other English-speaking countries and Europe, excluding Southern Europe, were full-time workers. The unemployment rate was low for foreign-born women (4-6 per cent), with the exception of those from Southern Europe and the Middle East (19 per cent). Among the Australian-born women, the unemployment rate was 7.5 per cent (Table 7).
Among working male respondents, one-quarter of those born in Australia and the other English-speaking countries were in professional or managerial occupations compared with 9 per cent of those from Southern Europe, the Middle East and South-East Asia. A higher proportion of the foreign-born men worked as tradesmen and labourers, or as clerical and sales personnel (Table 8).
Similar differences in occupational distribution were observed among working women. There was little difference between Australian-born women and women from the other English-speaking countries in their occupational distribution. A disproportionate number of women from European countries were service workers. Many women from Southern Europe, the Middle East and South-East Asia were employed in blue collar occupations (Table 8).
TableS Occupational distribution of employed respondents
Birthplace
Other Western Southern South-English- and Europe, East
speaking Eastern Middle Asia, Australia countries Europe East China Elsewhere
Males Professional/ Admin 24% 26% 15% 9% 9% 12% Clerical, sales 16 11 22 26 18 35 Farmers, miners 4 3 0 2 0 0 Tradesmen, etc 49 51 55 55 64 47 Service workers 8 10 8 8 9 6
Females Professional! admin 27 28 19 15 0 40 Clerical, sales 49 42 44 39 36 39 Tradeswomen, etc 9 9 6 27 50 17 Service workers 16 22 31 19 14 4
Number employed Males 749 105 27 53 11 17 Females 604 79 16 26 14 23

Family Formation and Ethnicity 13
Family income
There was not much difference between respondents born in Australia and the other English-speaking countries with regard to family income distribution. Respondents from Southern Europe and the Middle East had relatively lower family incomes than the other groups. Males from South-East Asia also reported relatively low family incomes, but this was not the case with the female respondents whose family income distribution was comparable to that of the Australian-born women (Tables 5 and Sa). It is difficult to say how reliable income reporting is without a proper evaluation of the data and comparison with income data from other sources.
Religion
About 27 per cent of the Australian-born respondents were Catholics, more than half were other types of Christians and 21 per cent of the males and 12 per cent of the females reported that they belonged to no religion. The proportion of Catholics was highest for the Southern European/Middle Eastern group and lowest for the other English-speaking countries. There were only nine Muslims among the respondents; seven from the Middle East, one from South-East Asia and one from South Asia. The percentage of foreign-born who reported no religion ranged between 24 and 30 per cent with the exception of those in the Southern European/Middle Eastern and 'elsewhere' categories; this compared with 16 per cent of the Australian-born respondents (Tables 5 and Sa).
A measure of religious practice was derived from the question about attendance at religious services. Those who indicated that they attended three or more services a year were considered to be practising their religion, those who attended fewer than three services were considered to be not practising a religion. About 50 per cent of the Australian-born respondents could be classified as practising a religion. The groups with the highest proportions of practising respondents were Southern Europe and the Middle East and 'elsewhere' (about 80 per cent) where the proportions of Catholics were relatively high. Less than half of the respondents from English-speaking countries were practising a religion (TablesS and Sa).
Summary
In general, the characteristics of the respondents in each birthplace category confirmed expectations formulated on the basis of other data such as the Census. For example, the Southern European and Middle Eastern respondents were mainly Catholics, had a lower level of education than the Australian-born and were often unskilled workers. They were also distinguished by a high rate of marriage and low rate of divorce or separation. The South-East Asians, too, differed from the other groups in certain areas: they had the highest proportion of students and the highest level of education. Persons born in the other Englishcspeaking countries shared more characteristics with the Australian-born than with persons born 'in non-English-speaking regions.

14 Institute of Family Studies WORKING PAPER No. 9
3 Family Background
To complete the analysis of the demographic and socio-economic characteristics of the respondents which might have a bearing on their family behaviour and attitudes, their present living arrangements and families of origin were examined. Of particular interest were the types and sizes of the households in which the respondents were living at the time of interview: although these living arrangements probably reflect a variety of influences, they may also be related to the respondents' attitudes to their families of origin and to the families they establish or hope to establish themselves which are analysed later in this report.
Also examined were the characteristics of the respondents' families of origin - whether the respondents' parents had also migrated to Australia, the size of the families they had established, their past and present work situation and their marital status. Clearly, factors such as the values the respondents' parents posited in the family, the positive or negative aspects of family life which the respondents experienced, and the sizes and types of families of origin need to be taken into account in any investigation of the factors influencing the family behaviour and attitudes of respondents.
Household size and composition
About half of the sample of men and women lived in households with two to three other persons, a quarter lived alone or with one person, and another quarter lived with four or more other people. Various birthplace groups deviated from this general pattern. The Southern European and Middle Eastern respondents lived in larger households: 32 per cent lived in households comprising five or more people including themselves and only 14.5 per cent lived in households of one to two people. Respondents from the Western and Eastern European countries showed the opposite pattern: 34 per cent lived in households of one to two people. Nearly 60 per cent of the respondents from South-East Asia lived in households of three to four people; of the remaining 40 per cent, half lived in households comprising one to two people, and half in households of five or more persons' (Table 9).
The 'typical' nuclear family of a married couple and children was moregrevalent among the foreign-born than among the Australian-born. This is because a greater proportion of the foreign-born respondents were married. Also, the respondents from Southern Europe and the Middle East who had never married were more likely to be still living with their parents at home (see Chapter 4). Thirty-five per cent of the Australian-born respondents were in nuclear families compared with 47 per cent of the respondents from Southern Europe and the Middle East, and 43 per cent of those from Western and Eastern Europe and the other

Family Formation and Ethnicity 15
Table 9 Distribution of respondents according to household size
Number of persons in household Number of
Birthplace 1-2 3-4 5 or more respondents
Australia 26% 51% 23% 1979 Other English-speaking countries 28 50 22 279 Western and Eastern Europe, 34 44 21 61 Southern Europe, Middle East 15 54 32 124 South-East Asia, China 19 60 21 47 Elsewhere 37 44 19 54
English-speaking countries. The proportion of respondents who lived with their marriage partner only was lowest for the South-East Asian and Southern European/Middle Eastern groups, an indication of the older age and possibly earlier child bearing patterns of these respondents (Table 10).
Three-generation households (comprising a married couple, their parents and children) were also more prevalent among respondents from Southern Europe, the Middle East, South-East Asia and the 'elsewhere' category (2-3 per cent), and least prevalent among the Australian-born and those from English-speaking countries (less than 1 per cent). Young married couples from Southern Europe and the Middle East still without children were also more likely to be living with their parents either in their own or their parents' home (Table 10).
Table 10 Distribution of respondents according to household structure
Birthplace
Other Western Southern South-English- and Europe, East
speaking Eastern Middle Asia, Household type Australia countries Europe East China Elsewhere
Married couple families Couple only 15% 15% 13% 11% 6% 24% Couple and children 35 43 43 47 40 33 Couple and parents 0 1 0 2 0 0 Couple and others 1 2 2 1 0 0 Couple, children, parents 1 0 2 3 2 4 Couple, children, others 1 0 2 2 0 0
Other families Self only 5 7 12 2 6 4 Self and children 4 4 3 1 2 2 Self and parents 30 20 13 31 15 20 Self, children, parents 1 1 2 0 0 0 Self, children, others 1 0 0 0 0 0 Self and relatives 2 1 3 1 9 6 Self and others 6 5 7 1 19 7
N umber of persons 1979 279 61 124 47 54

16 Institute of Family Studies WORKING PAPER No. 9
Respondents born in Australia, the other English-speaking countries and Europe were more likely to live alone, or with children or with people unrelated to themselves. Few of the Southern European/Middle Eastern respondents lived alone, and because their incidence of separation or divorce was low (see Chapter 6), very few lived in single-parent households. A comparatively high proportion of the respondents from South-East Asia lived alone or with people not related to themselves. This reflects the number of tertiary students in this group, which also had the highest proportion living in flats.
Family history
Since we would not expect male and female respondents to have different family backgrounds, the tabulations for this aspect were not made separately for each sex. The combination of both sexes allows separate tabulations to be made for Greek, Italian, Yugoslav and Middle Eastern respondents.
Clearly it is significant in any consideration of the influence of tradition to establish whether respondents emigrated, or were reunited in Australia, with their families of origin: that is, to establish if they had the possibilities of continuing to live with and be influenced by their families of origin. Moreover, the fact that a family migrates together should be an indicator of the strength of the family bond.
The Italian-born respondents formed the group with the highest proportion of parents settled in Australia (97 per cent), and the South-East Asians formed the group with the lowest (43 per cent). Oiher groups whose parents were less likely to have settled in this country were the Greeks (50 per cent had parents here), those from 'elsewhere' (57 per cent) and the Middle Eastern respondents (59 per cent). (See Table 11.)
The particular age of respondents when they arrived in Australia may be a moderating factor in a study of this kind. It is important to establish whether primary socialisation of the foreign-born took place in Australia or in the country of origin. Respondents were therefore asked whether they had immigrated to Australia before or after the age of fifteen.
Among the foreign-born, 87 per cent of the Italian respondents came to Australia before the age of 15 compared with 52 per cent of the respondents from the English-speaking countries and 41 per cent of those from the Middle East. Three-quarters of the South-East Asian respondents came after age 15; many would have come either as refugees or tertiary students (Table 12). It appears from this information that most Italian-born respondents came to Australia as young children with their. migrant parents. Other groups were more likely to come on their own as primary migrants. This is particularly so of respondents from South-East Asia.
Most of the respondents from the Southern European countries came from working class families. The fathers of 90 per cent ofthe Greek-born respondents, and of 84 per cent of those born in the other Southern European countries, were unskilled workers. This compares with the fathers of about 60 per cent of the Australian and other English-speaking respondents, and the fathers of 44 and 49 per cent of those born in the Middle East and South-East Asia respectively (Table 13).
The proportion of respondents with mothers in the workforce while they were growing up was highest for the Greek group (70 per cent) and lowest for the Middle Eastern and South-East Asian groups (26 per cent). About half of the respondents born in Australia and the other English-speaking countries had a working mother while they were growing up.

Table 11 Respondents according to parents' characteristics
Birthplace
Other Western South-English- and East
Parents' speaking Eastern Southern Middle Asia, characteristics Australia countries Europe Greece Italy Yugoslavia Europe East China Elsewhere
Came to Australia 62% 85% 50% 97% 78% 70% 59% 43% 57% Divorced 5% 9 13 0 0 0 0 0 2* 4* Separated 5 5 10 0 0 6* 0 0 9* 0
Present age Father:
Under 55 36 38 33 15* 33 50 30 41 34 39 55-64 31 33 43 45 31 28 45 22 30 32 65 and over 13 12 20 15* 26 11* 5* 2;2. 11 11 Dead 15 12 3* 20* 10* 11* 15* 11* 23 13 Don't know 4 4 2* 5* 0 0 5* 4* 2* 6*
Mother: Under 55 51 54 46 40 46 61 60 52 51 59 55-64 30 27 36 30 41 22* 15* 33 23 22 65 and over 8 10 10 5" 10* 11* 15* 7* 9* 7* Dead 9<- 7*
-n 7 7 7* 20* 3* 6* 5* 4* III
Don't know 4 3 2* 5* 0 0 5* 4* 9* 4* 3 -<
Number of persons 1979 279 61 20 39 18 20 27 47 54 -n 0 -.
Note: * = less than five cases_ 3 III -6-::I III :J C. m -:r :J 0-;:::-.--< .... .....

Table 13 Respondents according to parents' work status ... Birthplace 00
Other Western South- ::J C/)
English- and East ..... ;::;. Parents' speaking Eastern Southern Middle Asia, c ..... work status Australia countries Europe Greece Italy Yugoslavia Europe East China Elsewhere
CD 0 ....
Father: "T1 Ql
Unskilled worker 59% 60% 71% 91% 87% 89% 75% 44% 49% 54% 3 Semi-skilled -< worker 37 37 23 11* 5* 11* 20* 56 49 46 Cl) .....
Mother: c c..
Worked while CD· C/)
respondent ~ growing up 45 55 53 70 49 50 40 26 26 33 0
::0 Unskilled worker 43 44 59 79 79 56 63 57 33 28 A
Z Present situation G>
Father: iJ » Wage earner 43 50 46 35 18 67 45 30 49 37 iJ
m Employer 15 12 12 20* 23* 6* 5* 30 9* 22 ::0
Unemployed 1 2 10 0 3* 0 0 11* 0 4* z ~
Invalid 3 1* 0 0 15 11* 10* 0 0 0 (0
Retired 21 19 21 25 31 6* 20* 19 19 24 Dead 15 12 3* 20* 10* 11* 15* 11* 23 13 Don't know 2 4 8 0 0 0 5* 0 0 0
Mother: Wage earner 24 35 25 15* 8* 33 20* 11* 11 35 Employer 4 4 3* 0 8* 6* 0 7* 6* 2* Unemployed 1 1* 0 0 0 0 0 4* 2* 0 Home duties 51 40 56 40 64 50 55 56 57 37 Invalid 1 1* 2* 0 0 0 0 0 2* 2* Retired 11 10 8 25 18 0 15* 19 13 15 Dead 7 7 7* 20* 3* 6* 5* 4* 9* 7* Don't know 1 2* 0 0 0 6* 5* 0 0 2*
Number of persons 1979 279 61 20 39 18 20 27 47 54
Note: .. = less than five cases.

Family Formation and Ethnicity 19
Table 12 Foreign-born who came to Australia before age 15
Birthplace
English-speaking countries Western and Eastern Europe Greece Italy Yugoslavia Other Southern European Middle East South-East Asia, China Elsewhere
Percentage
52 77 40 87 56 65 41 26 39
Total number of
respondents
279 61 20 39 18 20 27 47 54
Nearly 80 per cent of the working mothers of Greek and Italian respondents were unskilled workers compared with 44 per cent of the working mothers of the Australian-born and other English-speaking respondents (Table 14).
None of the Southern European and Middle Eastern respondents' parents were separated or divorced; one out of ten of the Australian-born respondents' parents and 14 per cent of the other English-speaking respondents' parents were. The Western and Eastern Europeans had the highest proportion of parents divorced or separated: 13 per cent of the parents were divorced and 10 per cent were separated. Nine per cent of the parents of the South-East Asian respondents were also separated; however, the Indo-Chinese parents who had been " separated because of political conflict might account for this percentage. A higher proportion of the respondents from this last category and from Greece mentioned that they no longer had living parents (Table 11).
Many respondents from the Middle East and South-East Asia came from large families: about half were from families of five or more children. The Yugoslav respondents came from smaller families: only 11 per cent reported having five or more siblings and 16 per cent reported no siblings at all. Most of the English-speaking and Australian-born respondents were from families of one to four children (Table 14).
Following this review of the relevant demographic and socio-economic characteristics and family background of the survey sample, we turn now to the major findings about respondents' family formation plans, patterns and attitudes.
Table 14 Distribution of respondents according to their number of siblings
Number of siblings No. of
Birthplace 0 1-2 3-4 5 or more persons
Australia 3% 47% 32% 18% 1979 Other English-speaking countries 3 51 31 15 279 Western and Eastern Europe 8 46 38 8 61 Greece 10 35 30 25 20 Italy 5 41 33 21 39 Yugoslavia 16 44 28 11 18 Other Southern European 15 30 30 25 20 Middle East 0 11 30 59 27 South-East Asia, China 2 19 30 49 47 Elsewhere 2 39 30 30 54
All 4 46 32 19 2544

20 Institute of Family Studies WORKING PAPER No. 9
4 Leaving Home
Because not everyone interviewed had left home, a comparison of the ages at which the respondents in the different groups left would be biased towards those people who had done so early. Using life table methods would avoid this bias but would require a much larger sample of each ethnic group. It was decided, therefore, that a simple measure, the proportion of respondents who had left home at age 18 or earlier in each birthplace group, would provide an adequate basis for comparison. Eighteen years is chosen as the dividing point since the respondents were all aged 18 or older. It is also the age usually associated with the beginning of adulthood, and leaving the parental home is in many ways an event signalling this transition. Leaving home is considered as a life cycle stage and those respondents who had to leave home at an early age (arbitrarily set at less than ten years old) for other reasons have been excluded from this part of the analysis.
Proportion leaving at age 18 or earlier
About one-third of the Australian-born men had left home before they were nineteen. The proportion of men leaving home by that age was highest for the other English-speaking countries (46 per cent) and lowest for the Southern European/Middle Eastern group (14 per cent).
Women in all ethnic groups tended to leave home at an earlier age than men. The Southern European and Middle Eastern women left home later than women in the other groups. About half of the women from the other English-speaking counties, Western and Eastern Europe and South-East Asia had left home at age 18 or earlier compared with 20 per cent of the Southern European/Middle Eastern women (Table 15).
Those foreign-born who came to Australia after age 15 had left home earlier than those who came before the age of fifteen. Some of them, of course, probably left home to come to Australia.
An analysis of the Australian-born respondents according .to their parents' place of origin, showed that those with both parents born in non-English-speaking countries were more likely to leave home later than those who had English-speaking parents. This pattern was observed for both men and women (Table lSa).
Controlling for level of education or religious practice does not on the whole alter the pattern of leaving home for each birthplace group. The Southern Europeans were still less likely to leave home at age 18 or earlier than the other groups with the same level of education or religious commitment (Table 16). However, in almost all categories, and

Family Formation and Ethnicity 21
Table 15 Respondents who left home at age 18 or earlier, according to whether they came to Australia after age 15
All respondents Total number Came after age 15 Total number
Birthplace Males Females Males Females Males Females Males
Australia 32% 44% 851 1115 Other English-speaking
countries 46 51 125 152 59% 58% 58 Western and Eastern Europe 28 48 32 29 36 50 11 Southern Europe,
Middle East 14 20 64 60 25 40 28 South-East Asia, China 33 52 18 29 31 35 13 Elsewhere 30 27 20 30 20 26 10
Table 15a Australian-born respondents who had left home by age 18 according to parents' birthplace
Females
78 6
20 20 23
Total number
Pa~ents' birthplace Males Females M F
Australia 34% 43% 669 877 Bqth parents from English-
speaking countries 27 52 81 106 One parent from non-English-
speaking countries 31 46 26 39 Both parents from non-English-
speaking countries 16 34 75 93
especially among the women, those who were not practising a religion left home at an earlier age than those who were practising a religion.
Level of education does not have a consistent effect on leaving home for all the birthplace groups. Among the Australian-born, the proportion leaving home by age 19 decreased with level of education, probably because those who continued their education beyond the minimum school leaving age were more likely to stay at home than those who left school early to get a job or to get married. A similar pattern was observed, although to a lesser extent, for some of the other birthplace groups. However, 50 per cent of the South-East Asian males with tertiary education left home at age 18 or earlier compared with 14 per cent of those with less than 11 years of schooling. Many probably left home to come to Australia to study at university or to m'atriculate for university entry. However, this result should be viewed with some caution since the number of cases was very small.
Reasons for leaving home
Marked differences were often observed, both between the groups and between men and women within the groups, regarding reasons for leaving home.
Independence, marriage and jobs accounted equally for about 60 per cent of Australianborn males leaving home. Of the Australian-born women, 38 per cent had left home to get married; other common reasons given were the need for independence, study, work, or conflict at home, each being mentioned by about 10 per cent as the main reasons for leaving

22 Institute of Family Studies WORKING PAPER No. 9
Table 16 Respondents who left home at age 18 or earlier according to education and religious practice
Birthplace
Other Western Southern South-English- and Europe, East speaking Eastern Middle Asia,
Characteristic Australia countries Europe East China Elsewhere
Males Education
< 11 years 38% 53% 31% 15% 14% 33% 11-12 years 26 37 33 17 33 33 Tertiary 28 45 20 11 50 20
Religious practice Practising 25 44 21 13 18 25 Not practising 37 48 35 18 57 50
Females Education
< 11 years 51 59 40 24 67 0 11-12 years 40 29 50 25 46 20 Tertiary 34 56 67 0 44 46
Religious practice Practising 37 38 40 18 56 26 Not practising 52 63 57 33 46 29
home. Men and women from the othet English-speaking countries and Europe, excluding Southern Europe, differed only slightly from the Australian-born in their reasons for leaving home. Fewer of the English-speaking respondents left for job-related reasons, and 6 per cent mentioned migration as the reason for leaving (Table 17).
Marriage was the main reason for leaving home for most men and women from Southern Europe and the Middle East. Two-thirds of the women and 43 per cent of the men left home when they got married. Compared with the Australian-born and other English-speaking respondents, few Southern European and Middle Eastern respondents left home in order to be independent (9 per cent), to study, to travel, or because of their jobs (2-4 per cent of males, no females). Also, a lower proportion left because of conflict.
Of the 13 males from South-East Asia, six (46 per cent) had left home to study. Two (15 per cent) had left to marry, one had left to be independent and another had left to migrate. Three had left for 'other' reasons, which included joining the armed forces or a religious order. Of the women, nearly 40 per cent had left to get married, 14 per cent had left to study and, surprisingly, another 14 per cent had left because of conflict.
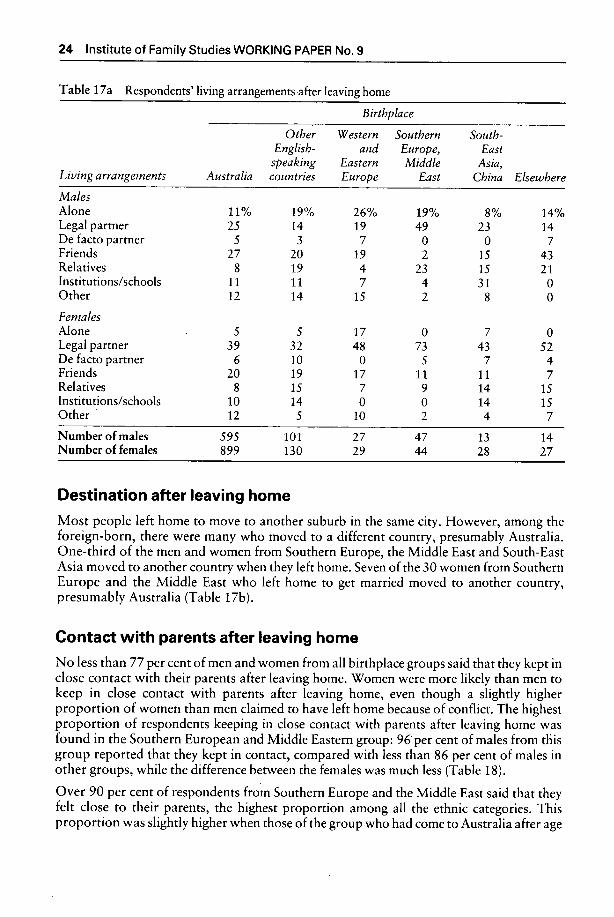
Living arrangements after leaving home
The living arrangements of the respondents after they had left home were, of course, related to their reasons for leaving. Those who had left to get married would obviously live with

Family Formation and Ethnicity 23
Table 17 Respondents' reasons for leaving home
Birthplace
Other Western Southern South-English- and Europe, East
speaking Eastern Middle Asia, Reasons for leaving Australia countries Europe East China Elsewhere
Males Independence 20% 20% 26% 9% 8% 14% Marriage 23 12 19 43 15 14 Live with partner 4 4 4 6 0 0 Live with others 3 1 4 0 0 7 Travel 5 14 7 2 0 14 Migrate 1 6 0 19 8 7 Study 7 10 4 2 46 0 Job 16 5 11 4 0 7 Conflict 8 8 11 2 0 21 Other 14 21 15 13 23 14
Females Independence 11 15 17 9 7 4 Marriage 38 30 48 68 39 48 Live with partner 4 5 0 0 0 4 Live with others 3 2 0 2 4 0 Travel 4 5 3 0 4 7 Migrate 1 5 3 11 7 11 Study 10 9 0 0 14 19 Job 10 5 10 0 4 7 Conflict 11 14 10 7 14 0 Other 9 10 7 2 7 0
Number of males 595 101 27 47 13 14 Number of females 899 130 29 44 28 27
their marriage partner, while those who had left to be independent might live alone or with friends.
As expected, since many of the men and women from Southern Europe and the Middle East left home to get married, a high proportion of them lived with their legal partners after leaving home. No woman from this region went to live alone after leaving home, although 19 per cent of the men did. Over 20 per cent of the men also went to live with relatives. Presumably some of these men were migrants who lived with relatives on their arrival in Australia.
Men from South-East Asia, many of whom had migrated to study, were more likely than those in other ethnic groups to live in boarding schools, hostels or other institutions. The highest proportion living alone was found in the group from Western and Eastern Europe; many of its members said they left in order to be independent. Many English-speaking respondents went to live with friends or relatives. Ten per cent of women from the English-speaking countries and 5 per cent of Australian-born men and women left home to live with a de facto partner (Table 17a).
24 Institute of Family Studies WORKING PAPER No. 9
Table 17a Respondents' living arrangements after leaving home
Birthplace
Other Western Southern South-English- and Europe, East
speaking Eastern Middle Asia, Living arrangements Australia countries Europe East China Elsewhere
Males Alone 11% 19% 26% 19% 8% 14% Legal partner 25 14 19 49 23 14 De facto partner 5 3 7 0 0 7 Friends 27 20 19 2 15 43 Relatives 8 19 4 23 15 21 Institutions/schools 11 11 7 4 31 0 Other 12 14 15 2 8 0
Females Alone 5 5 17 0 7 0 Legal partner 39 32 48 73 43 52 De facto partner 6 10 0 5 7 4 Friends 20 19 17 11 11 7 Relatives 8 15 7 9 14 15 Institutions/schools 10 14 0 0 14 15 Other 12 5 10 2 4 7
Number of males 595 101 27 47 13 14 Number of females 899 130 29 44 28 27
Destination after leaving home
Most people left home to move to another suburb in the same city. However, among the foreign-born, there were many who moved to a different country, presumably Australia. One-third of the men and women from Southern Europe, the Middle East and South-East Asia moved to another country when they left home. Seven of the 30 women from Southern Europe and the Middle East who left home to get married moved to another country, presumably Australia (Table 17b).
Contact with parents after leaving home
No less than 77 per cent of men and women from all birthplace groups said that they kept in close contact with their parents after leaving home. Women were more likely than men to keep in close contact with parents after leaving home, even though a slightly higher proportion of women than men claimed to have left home because of conflict. The highest proportion of respondents keeping in close contact with parents after leaving home was found in the Southern European and Middle Eastern group: 96 per cent of males from this group reported that they kept in contact, compared with less than 86 per cent of males in other groups, while the difference between the females was much less (Table 18).
Over 90 per cent of respondents from Southern Europe and the Middle East said that they felt close to their parents, the highest proportion among all the ethnic categories. This proportion was slightly higher when those of the group who had come to Australia after age

Family Formation and Ethnicity 25
Table 17b Respondents' destination after leaving home
Birthplace
Other Western Southern Sbuth-English- and Europe, East speaking Eastern Middle Asia,
Destination Australia countries Europe East China Elsewhere
Males Same suburb 13% 8% 22% 17% 15% 21% Same city 41 40 44 30 15 29 Same State 29 13 7 13 0 0 Different State 12 19 19 4 31 7 Another country 2 17 4 37 39 43 Moved around 2 4 4 0 0 0
Females Same suburb 13 16 10 16 14 11 Same city 46 41 41 50 25 30 Same State 29 16 28 2 7 7 Different state 8 10 10 0 14 15 Another country 3 15 7 30 39 37 'Moved around 1 2 0 0 0 0
Number of males 595 101 27 47 13 14 Number of females 899 130 ' 29 44 28 27
Table 18 Respondents who felt close to parents and kept in close contact after leaving home
Birthplace
Other Western Southern South-English- and Europe, East
speaking Eastern Middle Asia, Respondents Australia countries Europe East China Elsewhere
Close to parents Of total sample:
Males 84% 82% 78% 91% 67% 85% Females 85 83 76 93 79 83
Came after age 15: Males 71 100 93 69 80 Females ,82 67 95 85 87
Kept in close contact after leaving home Males 84 78 78 96 77 86 Females 88 90 86 ,93 93 93
Number of males 851 125 32 64 18 20 Number of females 1115 152 29 60 29 30
Came after age 15: Males 58 11 28 13 10 Females 78 6 20 20 23
Number ever left Males 595 101 27 47 13 14 Females 899 130 29 44 28 27

26 Institute of Family Studies WORKING PAPER No. 9
15 were considered; nearly all Southern European and Middle Eastern women who had come to Australia after age 15 said that they felt close to their parents (Table 18). Of the other ethnic groups, about 80 per cent felt that they were close to their parents.
While about 40 per cent of Australian-born and other English-speaking respondents returned home after leaving the first time, only about 15 per cent of the Southern European/ Middle Eastern respondents did (Table 19). This is again related to their reasons for leaving. Most of the Southern European/Middle Eastern men and women left to get married and therefore were less likely to return compared with the Australian-born and Englishspeaking respondents who were more likely to leave home for reasons of work, education, independence, or family conflict.
Attitudes to living with parents
More Southern European, Middle Eastern and South-East Asian respondents than Englishspeaking respondents had positive feelings about living with parents. Although many Southern European and Middle Eastern respondents admitted that living with parents hindered their social life, they also felt accepted at home, found it pleasant and thought that they would have been lonely by themselves. Many were expected to live at home until they were married (Table 20). South-East Asian males held attitudes similar to those of the Southern European and Middle Eastern respondents.
However, South-East Asian females were less positive than their male counterparts about living with their parents. The females in the Southern European/Middle Eastern and South-East Asian groups were not expected to contribute as much to the household income as were the men, but both men and women were expected to help look after the family. This probably meant different things for males and females: daughters were probably expected to help with the daily household duties while sons were expected to look after the family's general welfare. This difference may account for the South-East Asian female respondents feeling less positive about living with parents. The males liked living at home because they usually had most things done for them and were also allowed more freedom. Not quite two-thirds of the female respondents from Southern Europe, the Middle East, South-East Asia and 'elsewhere', compared with 83 per cent of female respondents born in Australia and Europe and 88 per cent of those from other English-speaking countries, said that their parents encouraged them to be independent (Table 20a).
Western and Eastern Europeans were the most qualified of all the groups in their statements about living with parents. This group had the lowest proportion of respondents who found it pleasant or felt accepted, and it had the highest proportion of men who thought that their social life was hindered. A greater proportion of men than women in all groups except the Southern European/Middle Eastern and 'elsewhere' categories said that living at home hindered their sex life.

Family Formation and Ethnicity 27
Table 19 Respondents who returned home after leaving the first time
Number ever left
Birthplace Males Females M F
Australia 46% 38% 595 899 Other English-speaking countries 43 40 101 130 Western and Eastern Europe 41 21 27 29 Southern Europe, Middle East 13 16 47 44 South-East Asia, China 31 18 13 28 Elsewhere 43 26 14 27
Table 20 Males agreeing with specific advantages/disadvantages of living'with parents
Birthplace
Other Western Southern South-English- and Europe, East speaking Eastern Middle Asia,
Advantages/disadvantages Australia countries Europe East China Elsewhere
Save more money 79% 72% 63% 72% 67% 80% Pleasant 85 78 78 94 95 95 Can discuss things 66 63 69 81 61 70 Feel accepted 92 91 84 95 100 85 Lonely by self 39 31 40 66 72 45 Can leave whenever 83 84 88 75 72 75 Social life hindered 20 17 31 27 22 20 Nothing good about it 9 6 13 5 0 5 There are arguments 34 28 34 23 39 30 Feel uncomfortable 19 25 22 13 17 30 Sex life hindered 32 37 31 27 33 25 Expected to contribute
to household income 53 58 53 58 61 75 Parents expect R to stay
until married 18 9 22 59 45 25 Sex forbidden until
R leaves home 30 28 31 38 56 25 Parents want R to be
financially independent 52 43 47 38 44 50 R encouraged to
be independent 85 87 85 75 89 85 Education encouraged 80 82 75 79 94 85 R can afford to leave 68 69 69 67 39 65 Help look after family 10 4 13 30 56 10
Number of males 857 127 32 64 18 20

28 Institute of Family Studies WORKING PAPER No. 9
Table 20a Females agreeing with specific advantages/disadvantages of living with parents
Birthplace
Other Western Southern South-English- and Europe, East spea~ing Eastern Middle Asia,
Advantages/disadvantages Australia countries Europe East China Elsewhere
Save more money 79% 67% 59% 63% 55% 53% Pleasant 83 81 59 93 76 82 Can discuss things 64 54 55 65 62 59 Feel accepted 88 93 83 92 93 85 Lonely by self 55 54 38 65 48 65 Can leave whenever 69 68 52 47 59 53 Social life hindered 22 27 17 37 28 32 Nothing good about it 9 9 17 10 21 15 There are arguments 30 39 34 25 28 50 Feel uncomfortable 21 22 35 10 41 26 Sex life hindered 20 24 21 33 31 44 Expected to contribute
to household income 52 65 52 33 48 56 Parents expect R to stay
until married 28 26 45 72 59 50 Sex forbidden until
R leaves home 61 61 59 72 66 77 Parents want R to be
financially independent 38 44 31 27 41 35 R encouraged to be
independent 83 88 83 62 62 68 Education encouraged 75 72 72 78 90 91 R can afford to leave 59 69 55 50 48 76 Help look after family 15 17 31 28 55 26
Number of females 1122 152 29 60 29 34
Family Formation and Ethnicity 29
5 Relationships
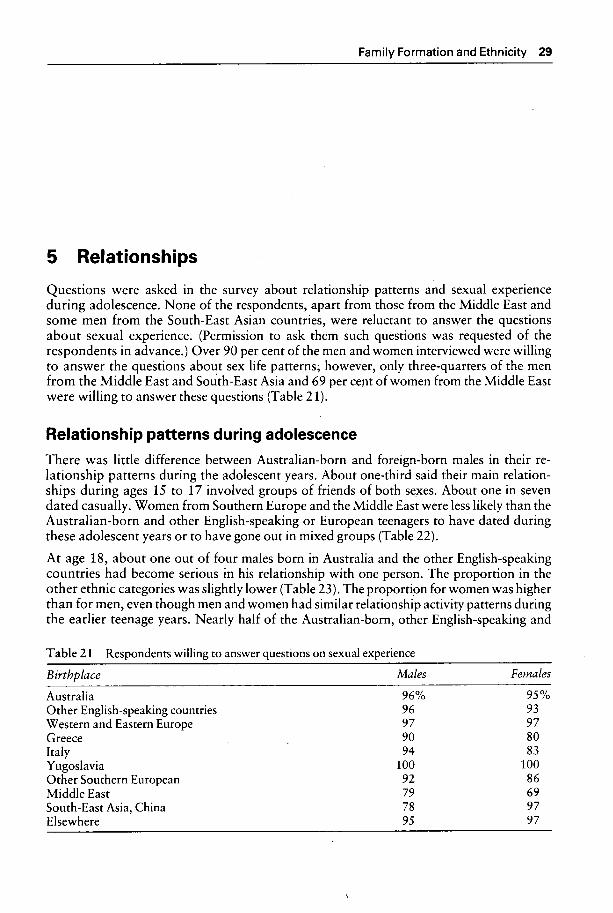
Questions were asked in the survey about relationship patterns and sexual experience during adolescence. None of the respondents, apart from those from the Middle East and some men from the South-East Asian countries, were reluctant to answer the questions about sexual experience. (Permission to ask them such questions was requested of the respondents in advance.) Over 90 per cent of the men and women interviewed were willing to answer the questions about sex life patterns; however, only three-quarters of the men from the Middle East and SOlith-East Asia and 69 per cent of women from the Middle East were willing to answer these questions (Table 21).
Relationship patterns during adolescence
There was little difference between Australian-born and foreign-born males in their relationship patterns during the adolescent years. About one-third said their main relationships during ages 15 to 17 involved groups of friends of both sexes. About one in seven dated casually. Women from Southern Europe and the Middle East were less likely than the Australian-born and other English-speaking or European teenagers to have dated during these adolescent years or to have gone out in mixed groups (Table 22).
At age 18, about one out of four males born in Australia and the other English-speaking countries had become serious in his relationship with one person. The proportion in the other ethnic categories was slightly lower (Table 23). The proportion for women was higher than for men, even though men and women had similar relationship activity patterns during the earlier teenage years. Nearly half of the Australian-born, other English-speaking and
Table 21 Respondents willing to answer questions on sexual experience
Birthplace
Australia Other English-speaking countries Western and Eastern Europe Greece Italy Yugoslavia Other Southern European Middle East South-East Asia, China Elsewhere
Males
96% 96 97 90 94
100 92 79 78 95
Females
95% 93 97 80 83
100 86 69 97 97

30 Institute of Family Studies WORKING PAPER No. 9
Table 22 Relationship patterns at age 15-17
Main activities at age 15-17
With friends With friends Dating Sex, birthplace With family of same sex mixed casually
Males Australia 6% 25% 44% 14% Other English-speaking countries 4 26 38 20 Western and Eastern Europe 6 28 47 13 Southern Europe, Middle East 11 11 50 17 South-East Asia, China 22 6 33 33 Elsewhere 10 25 40 15
Females Australia 10 16 38 15 Other English-speaking countries 5 19 36 16 Western and Eastern Europe 7 17 38 21 Southern Europe, Middle East 33 17 23 3 South-East Asia, China 28 10 41 10 Elsewhere 29 18 35 9
Table 23 Males serious about one person at age 18 according to education, religion and religious practice
Birthplace
Other Western Southern South-English- and Europe, East
speaking Eastern Middle Asia, Characteristics Australia countries Europe East China Elsewhere
Education < 11 years 31% 32% 8%* 18% 14%* 33%* 11-12 years 23 20 11 * 17 * 0 0 Tertiary 21 19 30 * 22 * 25 * 60 *
Religion Catholic 28 36 10 * 24 25 * 22 * Other Christian 24 24 8 * 16 * 17 * 33 * None 29 25 30 * 0 25 50 *
Religious practice Practising 22 24 0 21 18 * 38 Not practising 29 26 29 12 * 14 * 0
All 26 25 16 19 17 30
Note: * = less than five cases in cell.
Western and Eastern European female respondents were in a serious relationship at age eighteen. Less than one-third of the women in the other categories (Southern Europe/ Middle East, South-East Asia and 'elsewhere') were in a serious relationship at that age (Table 23a).
Education and religious commitment did not appear to have any consistent influence on adolescent relationship patterns. Of the Australian-born, the more educated men and

Family Formation and Ethnicity 31
Table23a Females serious about one person at age 18 according to education, religion and religious practice
Birthplace
Other Western Southern South-English- and Europe, East
speaking Eastern Middle Asia, Characteristics Australia countries Europe East China Elsewhere
Education <11 years 56% 66% 47% 35% 33%· 10%· 11-12 years 40 40 75 25 • 18 • 40 • Tertiary 33 37 33 • 27 • 22 • 43
Religion Catholic 41 50 50 34 0 19 • Other Christian 50 53 71 13 • 44 • 67 • None 41 50 38 25 • 25 • 50 •
Religious practice Practising 42 51 53 31 31 50 Not practising 51 53 50 33 • 15 • 50 •
All 46 52 51 32 24 32
Note: • = less than five cases in cell.
women were less likely to be in a serious relationship at age eighteen. However, this pattern was not observed in the other ethnic groups. Because of the small number of cases involved in the cross-classification of the foreign-born by educational level, it was difficult to draw any reliable conclusions (Tables 23 and 23a).
Sex life patterns
Over two-thirds of the male respondents had had sex by age eighteen. Half of the males from South-East Asia who were willing to answer the question had had sex (Table 24). The proportion of women was lower. Even so, nearly two-thirds of the respondents born in Australia, the other English-speaking countries and Western and Eastern Europe had had sex. Women from Southern Europe, the Middle East and South-East Asia were less likely to have had sex by age 18: two-thirds of the women from Southern Europe and the Middle East and nearly 80 per cent of the South-East Asian women had had no sexual involvement by age eighteen (Table 24a).
Education made little difference. However, religious affiliation appeared to be related to a lower probability of early sexual involvement. Men and women born in Australia and the ' other English-speaking countries who had no religious affiliation were slightly more likely to have had a sexual involvement by the time they were 18 than those with some religious affiliation. Southern European women who were Catholics were much less likely to have had sex than women who were not. This pattern did not hold for the Southern European men. Sexual involvement at age 18 was clearly related to religious practice in most ethnic groups. Respondents, with the exception of the South-East Asian males, who did not practise a religion were more likely to have had sex than those who did; religious practice did not appear to have the same influence on the sexual activitY of the South-East Asian males (Table 24).

32 Institute of Family Studies WORKING PAPER No. 9
Table 24 Males who had had sex by age 18 according to education, occupation, religion and religious practice '
Birthplace
Other Western Southern South-English- and Europe, East
speaking Eastern Middle Asia, Characteristics Australia countries Europe East China Elsewhere
Education <11 years 79% 81% 69% 76% 50%* 75% 11-12 years 75 88 67 58 33 * 83 Tertiary 67 72 67 75 57 * 80 *
Occupation Professional, clerical 68 84 64 69 50 * 89 Trades, labour, other,
unskilled 78 84 73 69 50 * 57 *
Religion Catholic 72 71 33 * 74 67 * 88 Other Christian 72 79 84 71 40 * 67 None 82 84 80 50 * 50 * 100 *
Religious practice Practising 67 69 39 62 56 87 Not practising 80 88 88 88 40 * 50 *
All 74 80 68 69 50 79
Note: * = less than five cases in cell.
De facto relationships
In many English-speaking countries such as the United States, Britain, New Zealand, and including Australia, a small but increasing proportion of couples now live in de facto unions. In some cases, a de facto relationship is perceived as a step towards legal marriage, in others it is perceived as an alternative to legal marriage. The survey showed that 17 per cent of all those interviewed had been in a de facto relationship and that 8 per cent of the men and 5 per cent of the women were in a de facto relationship at the time of the survey.
The proportion of men and women in a de facto relationship was highest in the Englishspeaking and Western and Eastern European groups. Over 20 per cent of men from these countries had been in a de facto relationship and 9 per cent were in one at the time of the survey. By comparison, only two male respondents from the Southern European/Middle Eastern region (a Yugoslav and a Middle Eastern man) and none from South-East Asia had been in such a relationship (Table 25).
Nearly 30 per cent of women from the English-speaking countries had been in a de facto relationship and 9 per cent were so at the time of the survey - the highest percentage recorded for the different ethnic groups. Women from South-East Asia and Southern Europe were more likely to have been in de facto relationships than men from the same regions. However, no woman from any of the foreign-born groups, apart from one Italian and three from the 'elsewhere' category, was at present in a de facto relationship. Of the Australian-born women, 5 per cent were in a de facto union at the time of the survey. Those

Family Formation and Ethnicity 33
Table 24a Females who had had sex by age 18 according to education, occupation, religion and religious practice
Birthplace
Other Western Southern South-English- and Europe, East
speaking Eastern Middle Asia, Characteristics Australia countries Europe East China Elsewhere
Education <11 years 69% 79% 64% 34% 44%· 11%· 11-12 years 57 61 63 44 • 30 • 40 • Tertiary 44 55 67 * 38 • 22 * 14 • Occupation Professional, clerical 55 73 64 • 24 57 * 32 Trades, unskilled 80 57 * 0 83 * 0 0 (Not working) 61 65 69 * 35 33 10
Religion Catholic 54 68 62 22 17 * 15 * Other Christian 59 67 57 * 60 38 • 33 * None 69 72 75 50 * 50 * 50 *
Religious practice Practising 49 65 53 31 27 • 20 Not practising 72 71 77 71 39 25 *
All 59 68 64 37 22 21
Note: • = less than five cases in cell.
in de facto relationships were more likely not to be practising a religion but no difference was observed between Catholics and other Christians (Tables 26 and 26a).
That few men and women from Southern Europe, the Middle East and South-East Asia were in de facto relationships was understandable considering that they saw few advantages in such relationships. Many of them thought that there would be a lot of social disapproval and that there would be problems if there were children, although surprisingly the proportion agreeing with the latter statement was lowest among the Southern European/Middle Eastern women (Tables 27 and 27a). While most Australian-born and other Englishspeaking respondents thought it was all right for a couple to live together without planning to get married, less than half of the respondents from the Southern European, Middle Eastern and South-East Asian countries approved of it.
Table 25 Respondents who had been in a de facto relationship and/or were now in a de facto relationship
Had been Were now I
Birthplace Males Females Males Females
Australia 18% 17% 8% 5% Other English-speaking countries 21 29 9 9 Western and Eastern Europe 28 7 9 0 Southern Europe, Middle East 3 5 2 2 South-East Asia, China 0 14 0 0 Elsewhere 20 21 5 9

34 Institute of Family Studies WORKING PAPER No. 9
Table 26 Males ever in a de facto relationship according to education, religion and religious practice
Birthplace
Other Western Southern South-English- and Europe, East
speaking Eastern Middle Asia, Characteristic Australia countries Europe East China Elsewhere
Education <11 years 21% 12% 46% 3%* 0% 11%* 11-12 years 16 14 0 0 0 17 Tertiary 14 31 30 6 0 40
Religion Catholic 16 36 20 3 0 0 Other Christian 15 14 25 5 0 33 * None 26 23 40 0 0 50 *
Religious practice Practising 10 12 7 * 2 0 19 Not practising 25 26 41 6 0 25
Note: * = less than five cases in cell.
Table 26a Females ever. in a de facto relationship according to education, religion and religious practice
Birthplace
Other Western Southern South-English- and Europe, East
speaking Eastern Middle Asia, Characteristic Australia countries Europe East China Elsewhere
Education <11 years 17% 33% 0% 5%* 22%* 20%* 11-12 years 19 17 13 * 0 18 30 * Tertiary 16 32 17 * 9 0 14 *
Religion Catholic 15 31 0 5 0 10 * Other Christian 14 25 0 0 11 22 * None 34 39 25 25 * 25 100 *
Religious practice Practising 11 19 0 2 13 12 Not practising 25 37 14 22 * 15 50 *
Note: * = less than five cases in cell.

Family Formation and Ethnicity 35
Table 27 Males agreeing with specific advantages/disadvantages of de facto relationships
Birthplace
Other Western Southern SOllth-English- and Europe, East
speaking Eastern Middle Asia, Advantages/disadvantages Australia COlllltries Europe East China Elsewhere
. No legal responsibility 29% 22% 16% 36% 28% 40% Regular sex life 58 54 47 63 44 50 Trial marriage 60 57 59 42 56 65 Can save money 43 48 53 45 61 45 Easier to get out of 77 73 63 77 72 70 All right to live together
without planning marriage 83 86 75 50 39 75 Lack of security 41 33 38 53 44 35 Problems if children 67 65 53 69 72 45 Social disapproval 39 32 41 75 56 35 No advantages over
marriage 39 30 44 44 45 60
Table 27a Females agreeing with specific advantages/disadvantages of de facto relationships
Birthplace
Other Western Southern South-English- and Europe, East
speaking Eastern Middle Asia, Advantage~/ disadvantages Australia countries Europe East China Elsewhere
No legal responsibility 37% 23% 38% 43% 48% 35% Regular sex life 67 70 55 57 38 62 Trial marriage 54 63 41 37 52 35 Can save money 34 34 41 33 41 50 Easier to get out of 76 79 55 67 52 77 All right to live together
without planning marriage 76 85 66 48 38 68 Lack of security 53 44 59 57 48 68 Problems if children 74 78 83 65 79 74 Social disapproval 47 39 45 67 48 35 No advantages over
marnage 47 46 48 50 52 53

36 Institute of Family Studies WORKING PAPER No. 9
6 Marriage
Data from the 1981 Census on marital status by age provide a better comparison of marriage patterns among the different birthplace groups than the smaller AFF Project survey. Using the Census data, Table 28 shows the proportions ever married among men and women aged 20-34 years, the population relevant to this study.
1981 Census: proportions married
Compared with the Australian-born, a higher proportion of the foreign-born in their twenties had been married. Over 25 per cent of European men aged 20-24 had been married compared with 22 per cent of Australian-born men. The Netherlands, Southern Europe and the Middle East had the highest proportions of married men in that age group: about 30 per cent had been married. These areas also had higher proportions of married men aged 30-34 years. The pattern among women was similar. Over 70 per cent of Yugoslav women aged 20-24 and 64 per cent of women from Greece and the other Southern European countries (excluding Italy) had been married compared with 44 per cent of Australian-born women.
Africa, the Pacific Islands and most of the Asian countries had lower proportions of men and women who were married than Australia. Only 12 per cent of the men aged 20-24 from South-East Asia (excluding Indo-China) and 37 per cent of their female counterparts had been married. Less than 20 per cent of men in the same age group from Africa, South Asia, the Pacific Islands, New Zealand and North America had been married. Some of these people could have been tertiary students and therefore more likely to marry later. There was no difference in the proportions of Indo-Chinese and Australian-born married in the 20-24 age group, although the proportion married at age 25 was lower among the Indo-Chinese.
Australian Family Formation Project: proportions married
Although the sample size of the Institute's AFF Project survey was small, it was possible to compare the median age at first marriage of respondents aged 28-34. This older age group was chosen because Australian marriage patterns show that over half of the men and women in this age group have been married by age 28 (McDonald, 1982: 187). Among the Australian-born, the median age at first marriage was 24.6 years for men and 21.6 years for women. The European-born male respondents in this age group had a somewhat higher median age at first marriage than Australian-born males, but European-born female respondents married at a slightly younger age than Australian-born women. The Asian-born respondents had the highest median age at first marriage: 28 years for men and 24.2 years for women (Table 29).

Family Formation and Ethnicity 37
Table 28 Respondents aged 20-34 ever married according to age group
Males Females
Birthplace 20-24 25-29 30-34 20-24 25-29 30-34
Australia 22% 65% 84% 44% 80% 91% UK and Ireland 26 68 86 " 50 82 93 Germany 26 66 83 48 81 91 Netherlands 33 75 89 55 87 94 Other N-W European 29 58 80 57 78 90 Greece 28 72 90 65 93 97 Italy 29 73 89 55 88 95 Yugoslavia 29 75 90 72 93 97 Other S European 32 75 86 64 91 95 Eastern Europe 22 57 81 54 81 93 Middle East 31 68 87 72 91 95 Africa 19 64 83 45 80 92 South Asia 18 60 85 47 83 91 Indo-China 22 56 80 45 70 81 Other South-East,
East Asia 12 54 81 37 77 85 USA, Canada 18 58 79 38 73 87 Other American 24 70 87 53 87 93 New Zealand 20 55 80 37 71 87 Pacific Islands 19 63 82 43 77 89
Source: 1981 Census of Population and Housing.
Table 29 Median age at first marriage of respondents aged 28-34
Males Females
Birthplace Mediallage Number Median age Number
Australia 25 285 22 477 Other English-speaking countries 24 50 21 78 Western and Eastern Europe 26 16 21 18 Southern Europe, Middle East 25 36 21 34 South-East Asia, China 28 6 24 17
Marital stability
The incidence of separation or divorce was lowest among the Southern European/Middle Eastern men and women: 98 per cent of the men and 95 per cent of the women aged 18-34 who had been married were still in their first marriage (see also ]osephian, 1983). By comparison, 88 per cent of Australian-born men and 81 per cent of Australian-born women who had been married were still in their first marriage, and the proportion was even lower among men and women from the other English-speaking countries (Table 30). The sex difference results from the fact that more women had been married for a longer time.
Since so few of the non-English-speaking foreign-born were separated or divorced, it is difficult to examine the consequences of marital breakdown by birthplace groups. Table 31 shows the current marital status of those who had been separated or divorced. A significant proportion of divorced men and women born in Australia, the other English-speaking countries and Western and Eastern Europe had remarried and some were in de facto

38 Institute of Family Studies WORKING PAPER No. 9
Table 30 Respondents ever married whose first marriage was still intact
Number Number Birthplace Males ever married Females ever married
Australia 88% 363 81% 700 Other English-speaking countries 86 65 76 104 Western and Eastern Europe 87 15 91 22 Southern Europe, Middle East 98 42 95 40 South-East Asia, China 83 6 90 20 Elsewhere 83 6 89 26
relationships. Of the four Southern European and Middle Eastern respondents who were separated or divorced, only one (a Yugoslav man) had remarried. None of the three persons from South-East Asia who had been separated or divorced had remarried or entered into a marriage-like relationship. Since the incidence of marital breakdown is low among these groups, a much larger sample is needed in order to obtain enough separated or divorced persons for a study of the consequences of marital breakdown.
A strong family tradition and the role of religion in their lives probably helps to explain the relatively high level of marital stability among the Southern European and Middle Eastern respondents. Other related factors might be their choice of partners, reasons for marriage and attitudes to marriage and the family, to be discussed in the following sections.
Choice of partner
Questions were asked in the survey about where respondents met or expected to meet their partners, what qualities they considered important in partners and their parents' influence on their selection of partners.
Table 31 Present marital status of respondents ever separated or divorced
Present marital status
Sex, birthplace Married De (acto Separated Divorced Total
Males Number
Australia 18 9 7 13 47 Other English-speaking countries 2 3 2 3 10 Western and Eastern Europe 4 0 0 1 5 Greece 0 0 1 0 1 Yugoslavia 1 0 0 0 1 South-East Asia, China 0 0 1 0 1 Elsewhere 0 0 1 0 1
Females Australia 32 16 37 49 134 Other English-speaking countries 11 1 5 8 25 Western and Eastern Europe 2 0 1 1 4 Italy 0 1 0 0 1 Middle East 0 0 1 0 1 South-East Asia, China 0 0 1 1 2 Elsewhere 2 2 0 0 4

Family Formation and Ethnicity 39
About one-quarter of all the respondents met their partners at some form of recreational activity, such as dances, discos or sporting events, during holidays or at the beach and many of those who intended to marry indicated that they expected to meet their partners at these same places. Friends were also important: many respondents had,met or expected,to meet their partners through them. Southern European and Middle Eastern men and women were more likely to meet their partners through parents, relatives and friends than were the respondents in the other groups. One-third of the South-East Asian males met or expected to meet their partners at school or university; and three out of the' 11 females without partners also expected to meet their partners at these places. However, those South-East Asian women with partners had met their partners through parents and friends and at recreational places (Tables 32 and 32a).
Marriage with another person from the same region of origin is also more common among respondents from certain birthplace groups. Table 33 shows the proportions of men and women having a partner born in the same group of countries and the proportions with an Australian-born partner. Four out of the five South-East Asian male respondents had a partner from the same birthplace category. As mentioned earlier, this category had the highest proportion of respondents coming to Australia after the age of 15 and the men were probably married before their arrival in this country. About half of the male respondents
Table32 Where males met or expected to meet their partners
Birthplace
Other Western Southern South-English- and Europe, East
speaking Eastern Middle Asia, Source Australia countries Europe East China Elsewhere
Had met through Childhood connections 3 0 0 3 0 1 School, university 32 8 0 0 2 0 Parents, relatives 42 6 1 9 1 0 Friends 52 7 1 4 1 1 Recreational places 98 14 6 9 0 2 Church 10 3 1 2 1 0 Streets 49 11 0 1 0 0 Work 44 9 5 7 0 0 Other 59 11 3 7 0 1
Number 389 69 17 42 5 5
Expected to meet through School, university 40 8 1 2 4 0 Parents, relatives 6 0 2 1 1 0 Friends 80 5 3 5 2 4 Recreation places 131 19 5 4 2 4 Church 7 1 1 1 1 0 Streets 0 1 0 0 0 0 Work 6 1 0 0 0 0 Not appropiate* 198 23 3 9 3 7
Number 468 58 15 22 13 15
Note: • = includes those who did not expect to marry or would not be looking for a partner,

40 Institute of Family Studies WORKING PAPER No. 9
Table 32a Where females met or expected to meet their partners
Birthplace
Other Western Southern South-English- and Europe, East
speaking Eastern Middle Asia, Source Australia countries Europe East China Elsewhere
Had met through Childhood connections 10 1 0 0 0 1
. School, university 35 8 1 1 0 3 Parents, relatives 73 11 2 9 2 3 Friends 104 7 3 9 3 6 Recreation places 158 19 8 6 5 4 Church 18 1 0 0 1 0 Streets 68 14 0 7 1 3 Work 95 13 4. 1 2 5 Other 80 26 2 6 4 2
Number 641 100 20 39 18 27
Expected to meet through School, university 49 1 0 1 3 1 Parents, relatives 8 4 0 1 2 0 Friends . 75 9 3 3 2 3 Recreation places 87 11 1 5 0 0 Church. 9 0 0 0 1 0 Work 9 1 0 0 0 0 Not appropriate* 244 26 5 11 3 3
Number 481 52 9 21 11 7
Note: * = includes those who did not expect to marry or would not be looking for a partner.
from Southern Europe, the Middle East and the English-speaking countries had partners born in the same region as themselves, but only a quarter of those born in Western and Eastern Europe did. More than half of the women from Southern Europe and the Middle East had partners in the same birthplace category; only one-third of those from Europe, excluding Southern Europe, and 'elsewhere' did.
A higher proportion of foreign-born men than foreign-born women had an Australian-born partner, with the exception of the South-East Asian and Chinese respondents. Nearly two-thirds of the men from the Western and Eastern European countries had an Australianborn partner, compared with 29 per cent of the Southern European and Middle Eastern men and 20 per cent of the South-East Asian men. The difference between the proportions of women in the various groups with an Australian-born partner was smaller. The lowest proportion with an Australian-born partner came from the Southern European/Middle Eastern and 'elsewhere' categories (26 per cent).
In discussing partners' attributes, most men and women in all birthplace groups considered it important that their partners should have similar goals and ideas as themselves, and a 'great personality'. Most men also like their partners to be 'attractive', although only half the women considered this quality to be important. Education was important to the South-East Asians and Chinese; two-thirds of these respondents compared with less than
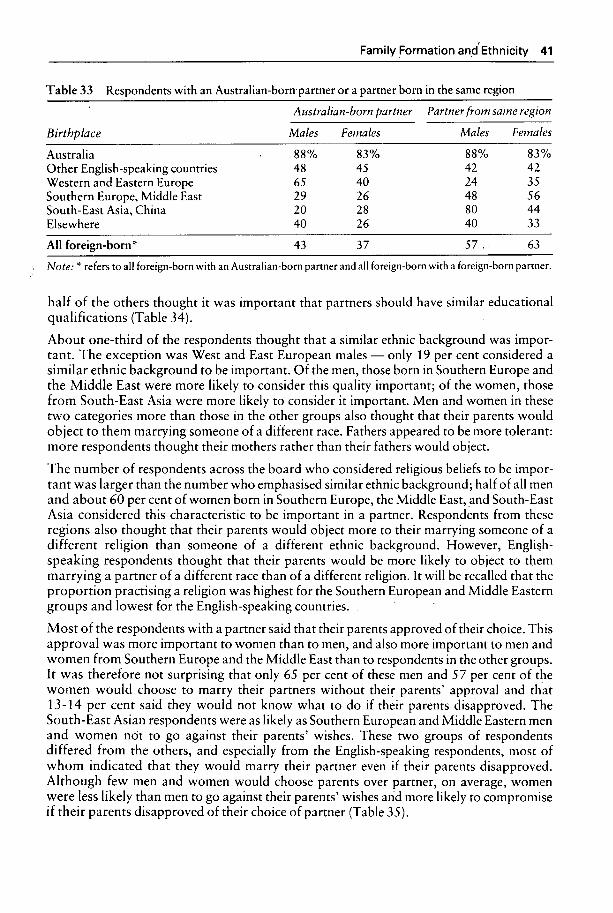
Family Formation and Ethnicity 41
Table 33 Respondents with an Australian-born partner or a partner born in the same region
Australian-born partner Partner from same regiol1
Birthplace Males Females Males Females
Australia 88% 83% 88% 83% Other English-speaking countries 48 45 42 42 Western and Eastern Europe 65 40 24 35 Southern Europe, Middle East 29 26 48 56 South-East Asia, China 20 28 80 44 Elsewhere 40 26 40 33
All foreign-born * 43 37 57 . 63
Note: * refers to all foreign-born with an Australian-born partner and all foreign-born with a foreign-born partner.
half of the others thought it was important that partners should have similar educational qualifications (Table 34).
About one-third of the respondents thought that a similar ethnic background was important. The exception was West and East European males - only 19 per cent considered a similar ethnic background to be important. Of the men, those born in Southern Europe and the Middle East were more likely to consider this quality important; of the women, those from South-East Asia were more likely to consider it important. Men and women in these two categories more than those in the other groups also thought that their parents would object to them marrying someone of a different race. Fathers appeared to be more tolerant: more respondents thought their mothers rather than their fathers would object.
The number of respondents across the board who considered religious beliefs to be important was larger than the number who emphasised similar ethnic background; half of all men and about 60 per cent of women born in Southern Europe, the Middle East, and South-East Asia considered this characteristic to be important in a partner. Respondents from these regions also thought that their parents would object more to their marrying someone of a different religion than someone of a different ethnic background. However, Engli~hspeaking respondents thought that their parents would be more likely to object to them marrying a partner of a different race than of a different religion. It will be recalled that the proportion practising a religion was highest for the Southern European and Middle Eastern groups and lowest for the English-speaking countries.
Most of the respondents with a partner said that their parents approved of their choice. This approval was more important to women than to men, and also more important to men and women from Southern Europe and the Middle East than to respondents in the other groups. It was therefore not surprising that only 65 per cent of these men and 57 per cent of the women would choose to marry their partners without their parents' approval and th'at 13 -14 per cent said they would not know what to do if their parents disapproved. The South-East Asian respondents were as likely as Southern European and Middle Eastern men and women not to go against their parents' wishes. These two groups of respondents differed from the others, and especially from the English-speaking respondents, most of whom indicated that they would marry their partner even if their parents disapproved. Although few men and women would choose parents over partner, on average, women were less likely than men to go against their parents' wishes arid more likely to compromise if their parents disapproved of their choice of partner (Table 35).

Tabld4 Characteristics respondents looked for in a partner t
Birthplace ::J ~
Other Western Southern South-;::1: c
English- and Europe East .... CD
Looked-for speaking Eastern Middle Asia, 0 -characteristics Australia countries Europe East China Elsewhere Total -n III
3 Males < Similar education, 49% 48% 34% 47% 78% 40% 49% en .... Similar social background 56 49 47 60 54 47 61 c
Cl. Attractive appearance 80 80 75 81 78 75 80 iiiO
Similar ethnic background 32 31 19 34 28 25 31 I/)
:E Similar religious beliefs 33 31 28 50 50 50 34 0 Similar ideas 78 79 66 80 89 70 78 ::c Similar occupational
2:'5 Z
background 9 4 16 14 17 20 9 G)
A great personality 77 80 78 69 83 80 77 ""tl l>
Similar goals 81 83 84 77 89 65 81 ""tl m ::c
Females Z Similar education 54 53 35 48 66 59 53 ? Similar social background 61 57 35 55 62 53 60 co
Attractive appearance 59 57 41 57 62 59 59' Similar ethnic background 37 32 34 43 52 32 37 Similar religious beliefs 39 35 35 62 59 41 40 Similar ideas 80 78 76 68 86 65 79 Similar occupational
background 12 9 10 15 28 3 12 A great personality 68 68 72 72 66 68 68 Similar goals 83 83 79 59 69 79 82

Family Formation and Ethnicity 43
Table 35 Respondents' views of what they would do if their parents disapproved of their choice of partner
Birthplace
Other Western Southern South-English- and Europe, East
speaking Eastern Middle Asia, Anticipated action Australia countries Europe East China Elsewhere
Males Choose partner 73% 80% 71% 65% 69% 73% Compromise 18 12 18 13 15 20 Choose parents 2 3 12 9 8 7 Unsure/don't know 7 5 0 13 8 0
Females Choose partner 67 72 67 57 55 70 Compromise 22 16 0 24 18 20 Choose parents 3 3 11 5 18 0 Unsure/don't know 8 8 22 14 9 10
Number of males 511 65 17 23 13 15 Number of females 516 61 9 21 11 10
The proper time to marry
It has been suggested that there has been a strong return recently to the 19th century maxim of 'the proper time to marry' (McDonald, 1982).
Today the economically 'proper time' is when the couple have sufficient savings to begin marriage 'in a substantial, well-furnished house' while the psychologically 'proper time' is when one's 'personality is fully developed' through travel, career and freedom of relationship with a broad range of people (p.190).
Evidence of the idea of an economically and psychologically proper time to marry was strongest for the South-East Asians, followed by the Southern European and Middle East respondents, the Australian-born, and less so for the Western and Eastern Europeans. It should be kept in mind, however, that each of these groups may also have its own definition of what is economically and psychologically the proper time to marry, which may differ from that specified above.
Among the unmarried respondents, nearly all the South-East Asian. men and more than three-quarters of the South-East Asian women felt that they would like to be more mature and financially secure before they married. Financial security was also important to many respondents from Southern Europe and the Middle East, and to Australian-born men. Overall, men were more concerned about financial security. than women: women were more likely to agree that 'marriage will happen when it happens'. Many respondents from South-East Asia also said that they would like to finish their education before getting married (Table 36).
Few of the unmarried men and women felt that parents, relatives or friends put pressure on them to marry. The exceptions were the South-East Asians, of whom about 20 per cent (five out of 24) felt some pressure, mainly from parents, to marry earlier than they would like (Table 37).

44 Institute of Family Studies WORKING PAPER No. 9
Table 36 Respondents who agreed with statements on the 'proper time to marry'
Birthplace
Other Western Southern South-English- and Europe, East
speaking Eastern Middle Asia, Statement Australia countries Europe East China Elsewhere
Males 'Before 1 marry 1 would like to':
'be more mature' 52% 44% 33% 48% 92% 64% 'be financially secure' 83 75 67 87 100 93 'finish my education' 37 44 28 35 58 36
'I would rather have children later in life' 60 56 39 70 67 71
'Marriage will happen when it happens' 82 84 72 74 75 79
Females 'Before 1 marry 1 would like to':
'be more mature' 49 35 29 53 78 50 'be financially secure' 67 57 43 74 89 63 'finish my education' 31 27 29 32 44 25
'I would rather have children later in life' 52 45 14 68 44 50
'Marriage will happen when it happens' 83 88 86 90 78 75
Number of males 462 55 18 23 12 14 Number of females 434 49 7 19 9 8
The ultimate question, 'Why marry?' brought forth further indications of the concept of 'the proper time to marry'. Love was the most frequently mentioned reason for marriage, the next being the desire to have a family, a home and a future with their partner (Table 38). However, 17 per cent of the men and 11 per cent of the women also said that one of the reasons they got married was because marriage was the 'next step' or the 'right step' in life for them. Male respondents born in Australia, the other English-speaking countries and Western and Eastern Europe were more likely than females as a whole or males born in other places to say that marriage was the next or right step for them.
Attitudes A knowledge of the respondents' perceptions and expectations of marriage clarifies some of the statistics on marriage and divorce for the different ethnic groups. Respondents were asked whether they agreed or disagreed with a number of statements about the specific advantages and disadvantages of marriage and about divorce (Tables 39 and 40)"
Southern European and Middle Eastern men and women were consistently more likely to agree with statements about the positive aspects of marriage and to recognise its responsibilities and limitations. They had the highest proportion agreeing that marriage provided love, warmth and happiness, a regular sex life and the opportunity to have and bring up children, and that marriage also developed a sense of responsibility. A higher proportion in this

Family Formation and Ethnicity 45
Table 37 Respondents who felt any pressure to marry earlier than they wanted to and source of pressure
Birthplace
Other Western Southern South-English- and Europe, East
speaking Eastern Middle Asia, Australia countries Europe East China Elsewhere
Males Felt pressure to marry 8% 4% 12% 9% 23% 13% Source of pressure:
Parents . (13) (1) (2) (2) (3) (2) Relatives ( 6) (1) (1) (2) (1) (0) Friends (11) (1) (1) (1) (0) (0) Pregnancy ( 2) (0) (0) (0) (0) (0) Other (19) (1) (1) (0) (2) (2)
Females Felt pressure to marry 7% 11% 0% 5% 18% 20% Source of pressure:
Parents (22) (3) (0) (0) (2) (2) Relatives (15) (0) (0) (0) (0) (1) Friends (11) (2) (0) (0) (0) (0) Pregnancy ( 4) (1) (0) (0) (0) (0) Other ( 6) (3) (0) (1) (0) (1)
Note: The figures in parentheses refer to the number of cases.
Table 38 Reasons for marriage most frequently mentioned by married respondents
Birthplace
Other Western Southern South-English- and Europe, East
speaking Eastern Middle Asia, Reason Australia countries Europe East China Elsewhere
Males Love 55% 59% 43% 44% 67% 50% Family, home together 19 9 14 34 17 21 Next/right step 16 20 43 13 0 7 Happy together 11 15 21 18 17 7 To have children 10 8 0 6 17 7
Females Love 63 53 46 55 55 64 Family, home together 13 7 18 28 10 15 Next/right step 11 8 18 17 20 18 Happy together 12 10 23 14 5 15 To have children 8 7 0 7 10 9
Number of males 357 66 14 32 6 14 Number of females 603 100 22 29 20 33

46 Institute of Family Studies WORKING PAPER No. 9
Table 39 Respondents agreeing with specific advantages/disadvantages of marriage
Birthplace
Other Western Southern South-English- and Europe, East
speaking Eastern Middle Asia, Advantages/disadvantages Australia countries Europe East China Elsewhere
Males Economic security 45% 44% 44% 55% 44% 50% Love, warmth, happiness 86 79 75 94 89 80 Regular sex life 83 71 91 91 78 85 Sense of responsibility 81 76 81 91 89 90 Having children 73 72 69 91 78 70 Easier to save money 36 34 41 41 56 55 No freedomlindependence 32 34 34 52 67 55 Take one another for
granted 47 52 31 36 45 55 No advantages 12 12 3 16 0 15 Marriage is for life 75 65 75 94 89 85
Females Economic security 61 53 66 72 66 56 Love, warmth, happiness 84 80 90 .90 86 77 Regular sex life 81 80 79 82 83 79 Sense of responsibility 73 65 72 82 79 82 Having children 64 65 66 80 59 71 Easier to save money 29 26 52 40 41 36 No freedomlindependence 29 28 41 35 45 41 Take one another for
granted 46 53 41 47 21 12 No advantages 12 13 10 13 21 12 Marriage is for life 73 68 69 78 66 79
Number of males 857 127 32 64 18 20 Number of females 1 122 152 29 60 29 34
category than in the others also agreed that marriage gave economic security. Half of the Southern European/Middle Eastern men, compared with one-third of the English-speaking men agreed that one sacrificed independence and personal freedom when one married. This group also had the highest proportion (94 per cent of the men and 78 per cent of the women) agreeing that 'marriage is for life'. (Table 39.)
The South-East Asians also came close to the Southern European and Middle Eastern respondents in their attitude to marriage. In comparison with these two groups, respondents from the English-speaking countries were more cynical about marriage, with more than half agreeing that people took one another for granted after marriage, and only two-thirds agreeing that 'marriage is for life'.
It is difficult to say whether it was the attitude of these people which determined their marital status patterns as shown in Table 30 or whether their marital status influenced their attitude. Did the Southern European and Middle Eastern respondents feel more positive about marriage because most of them were still in their first marriage, or did their attitude

Family Formation and Ethnicity 47
Table 40 Respondents agreeing with statements about divorce
Birthplace
Other Western Southern Southc
English- and Europe, East speaking Eastern Middle Asia,
Statement Australia countries Europe East China Elsewhere
Males 'Couple should be able to
get divorce if want to' 91% 91% 84% 81% 78% 95% 'Feel devastated if spouse
wanted divorce' 65 55 56 75 56 60 'Frightened to be single
at 40' 53 42 50 53 17 60 'Divorce is too easy
to get' 45 37 59 75 67 70
Females 'Couple should be able to
get divorce if want to' 93 94 79 85 69 88 'Feel devastated if spouse
wanted divorce' 68 64 62 60 58 68 'Frightened to be single
at40' 52 47 45 62 48 32 'Divorce is too easy to get' 52 43 69 67 52 68
N umber of males 857 127 32 64 18 20 Number of females 1 122 152 29 60 29 34
contribute to the low incidence of marital dissolution among them? It is likely that attitude and behaviour reinforced each other.
Most people agreed that a couple should be able to get a divorce if they wanted to. The proportion agreeing was lowest for men and women born in South-East Asia (78 per cent and 69 per cent respectively) and highest for persons born in Australia and the other English-speaking countries (over 90 per cent). A higher proportion of respondents born in the non-English-speaking countries also thought that it was too easy to obtain a divorce. Men were more likely to think this than women, with the exception of those men from Western and Eastern Europe and the English-speaking countries. About 60 per cent of the Southern European/Middle Eastern women agreed that they would be 'frightened to be single at 40' and felt that they would be 'devastated' if their spouse mentioned divorce. However, while 75 per cent of the men in that group felt that they would be 'devastated' if their spouse mentioned divorce, only 53 per cent said that they would-be frightened to be single at age forty. Compared with the Southern European/Middle Eastern women, even more Australian-born women thought that they would be 'devastated' if their spouse mentioned divorce, although fewer agreed that they would be afraid of being single at age. 40 (Table 40).

48 Institute of Family Studies WORKING PAPER No. 9
7 Child Bearing
Fertility differences between the ethnic groups have been indicated in many previous studies of child-bearing patterns in Australia (Ware, 1975; Ruzicka and Caldwell, 1977, 1982). These studies have all been based on data for older women in the 1970s. Data from the Institute's AFF Project survey allow us to examine the fertility patterns and intentions of young women now in their family-building years, providing some indication of current patterns and future trends. The survey also collected additional information on respondents' ideas of the 'proper time to have children' and reasons for having children, thus providing an insight into some of the factors underlying the observed fertility patterns.
Fertility and desired family size Eighty-six per cent of South-East Asian and Chinese women under age 30 who had ever married had had at least one child, as had 80 per cent of Southern European and Middle Eastern women in the same category. In comparison, only 69 per cent of Australian-born women in that category had. Most of the women in the age group 30-34 had had at least one child; there was not much difference between the birthplace groups.
The South-East Asian and Chinese women. under the age of 30 had an average of 1.9 children; the Southern European and Middle Eastern women and the Australian-born women averaged 1.3 births. Women from the other English-speaking countries had a slightly higher fertility than the Australian-born. Only those from Western and Eastern Europe and the 'elsewhere' category had lower fertility (Table 41).
Table 41 Females ever married who had had children and average number of children ever had according to age group
% ever had children Average no of children No of females
Birthplace Under 30 yrs 30-34 yrs Under 30 yr~ 30-34 yrs Under 30 yrs 30-34 yrs
Australia 69% 91% 1.3 2.2 377 324 Other English-speaking
countries 79 86 1.4 2.1 47 58 Western and Eastern
Europe 71 93 1.1 2.3 7 15 Southern Europe,
Middle East 80 88 1.3 2.1 15 25 South-East Asia, China 86 92 1.9 1.6 7 13 Elsewhere 50 83 0.6 1.6 14 12
All 70 90 1.3 2.1 467 447

Family Formation and Ethnicity 49
For women aged 30-34 who had ever married, the pattern was a little different. The Western and Eastern European women had higher fertility than the Australian-born women but the Southern European/Middle Eastern women and the South-East Asians had lower fertility. This pattern suggests that although the Southern Europeans and South-East Asians were likely to have children in the early years of marriage, their family size at later ages might still be smaller than that of the Australian-born. .
Indeed, a comparison of the family sizes desired by the different groups shows that Australian-born wives expected to have slightly larger families than foreign-born wives. (Although every respondent was asked about the number of children he or she would like, discussion of desired family size is restricted in this report to the sample of men and women married at the time of the survey because of the question's greater relevance to them than to single men and women.) Forty-seven per cent of Australian-born wives wanted three or more children compared with 43 per cent or less among the foreign-born. Married women from South-East Asia and China were the most homogeneous in their expectations concerning family size: two-thirds wanted two children and only 11 per cent wanted three or more. Single-child families were not popular with the .Southern European, Middle Eastern, English-speaking, 'elsewhere' and Australian-born respondents. However, about one in five women from Western and Eastern Europe and South-East Asia wanted to have only one child (Table 42). On average, the Australian-born wives wanted 2.5 children, the SouthEast Asians wanted 1.9 and the other groups fell in between.
There was little difference in desired fertility between married women under age 30 and those aged 30-34 across the groups, with the exception of the Western and Eastern European women; in this group the younger cohort expected an average of 1.6 children, while the older cohort anticipated an average of 2.5. There was also no consistent pattern by educational level across the various birthplace groups (Table 43). Among wives born in Australia and the other English-speaking countries, the more educated wanted slightly smaller families than the less educated, but the reverse was true of the Southern European, Middle Eastern and Asian wives. Most working wives wanted smaller families than did non-working wives. The Asian women were the exception: those who were working wanted 2.3 children, the non-working wanted only 1.6. Further tabulations controlling for other characteristics are necessary to see if this pattern is real or spurious, but a larger sample would be needed for this.
Catholics differed across the groups regarding desired family size. Australian-born Catholic wives wanted the largest families; an average of 2.8 children, while the Southern European Ca tholics wanted 2.5 and those from the other European countries wanted 2.1. This finding
Table 42 Females married at present according to number of children desired
Females wanting to have children Average Number numbering: number of
Birthplace 0 1 2 3 4 or more wanted females
Australia 6% 5% 42% 31% 17% 3% 586 Other English-speaking countries 8 2 51 28 11 2 89 Western and Eastern Europe 5 20 40 25 10 2 20 Southern Europe, Middle East 8 3 46 27 16 2 37 South-East Asia, China 6 17 67 6 6 2 18 Elsewhere 8 0 63 17 13 2 24
All 6 5 44 29 15 3 774

50 Institute of Family Studies WORKING PAPER No. 9
Table 43 Family size desired by females married at present according to demographic and socio-economic characteristics
Birthplace
Other Western Southern South-English- and Europe, East
speaking Eastern Middle Asia, Australia countries Europe East China Elsewhere
Characteristic Average number of children desired
Age (years) Under 30 2.5 2.3 1.6 2.4 2.0 2.2 30-34 2.5 2.3 2.5 2.4 1.8 2.3
Education <11 years 2.6 2.4 2.7 2.4 1.8 2.7 11-.12 years 2.5 2.4 1.0" 2.9 1.8 2.5 Tertiary 2.4 2.0 1.7" 2.7" 2.0 1.8
Work status Working 2.3 2.1 1.7 2.1 2.3 2.2 Not working 2.7 2.5 2.7 2.6 1.6 2.4
Religion Catholic 2.8 2.4 2.1 2.5 2.5" 2.5 Other Christian 2.5 2.3 2.7 2.9 2.0 1.7 None 2.0 i.2 1.0" 1.3" 1.7" 2.0"
Religious practice Practising 2.6 2.4 2.5 2.6 2.2 2.4 Not practising 2.4 2.3 1.6 1.2 1.5 1.5"
Came to Australia Before age 15 2.4 2.2 2.3 2.3 2.8 After age 15 2.3 2.0 2.5 1.8 2.2
All 2.5 2.3 2.2 2.4 1.9 2.3
Note: .. = less than five cases in cell.
agrees with those of earlier studies (Callan, 1980; Ware, 1975). It has been suggested that the foreign-born Catholics are less attached than the native-born to the Australian Catholic system of values (Day, 1964, as quoted in Callan, 1980: 32) and that the Australian Catholic education system strongly reinforces the Church's traditional teachings (Callan, 1980: 32). The practice of a religion was associated with a larger desired family size for all the birthplace groups.
Length of residence in Australia did not affect the family size desired by respondents in the different birthplace groups in the same way. While most of the foreign-born wives who came to Australia after age 15 wanted slightly smaller families, the reverse was observed among wives from Southern Europe and the Middle East.
Australian-born male respondents did not differ much from female respondents in their desired family size. Male respondents who were married at the time of the survey wanted an average of 2.4 children. However, male respondents from Southern Europe, the Middle East and South-East Asia wanted larger families than did the female respondents from the same regions and the Australian-born males. The Southern European/Middle Eastern men

Family Formation and Ethnicity 51
wanted an average of 2.9 children and the five South-East Asian men wanted an average of 2.6. Men from Western and Eastern Europe wanted smaller families, on average 1.8 children. They and the male respondents from the other English-speaking countries did not differ much from the women of the same regions regarding desired family size (Table 44).
Australian-born males under the age of 30 wanted larger families (an average of 2.6 children) than those aged 30-34 (an average of 2.2). It is difficult to account for this pattern without further examination of the characteristics of this younger cohort. Men born in the other English-speaking countries, Europe and the Middle East who were under 30 wanted slightly smaller families than those aged 30-34. The practice of a religion is also associated with a larger desired family size for most males; only the Western and Eastern European men desired the same sized family regardless of religious practice (Table 44).
Since there were fewer male than female respondents married at the time of the survey, division of the male respondents into the other socio-economic groups resulted in very small cell sizes. Consequently, any average desired family sizes obtained from male respondents according to characteristics such as education, occupation and religion, were likely to be unreliable.
Table 44 Family size desired by males married at present according to demographic and socio-economic characteristics
Birthplace
Other Western Southern South-English- and Europe, East
speaking Eastern Middle Asia, Australia countries Europe East China Elsewhere
Characteristic Average number of children desired
Age (years) Under 30 2.6 1.9 1.4 2.8 2.7* 1.7* 30-34 2.2 2.6 2.2 3.0 2.5* 2.5*
Education < 11 years 2.5 2.1 1.6 3.3 2.0* 1.7* 11-12 years 2.4 2.1 1.8* 2.1 3.0* Tertiary 2.4 2.7 2.4 2.7 3.5* 2.0*
Occupation Professional, clerical 2.4 1.2 2.1 2.8 3.0* 2.5* Trades, labourer, etc. 2.4 2.3 1.7 3.2 2.5* 1. 7*
Religion Catholic 2.7 1.7 1.6 2.9 1.7* Other Christian 2.5 2.4 2.0 3.2 3.0* 2.5* None 1.9 2.1 2.3* 2.0* 2.0*
Religiolls practice Practising 2.6 2.5 1.9 3.2 3.5* 2.0 Not practising 2.2 2.1 1.9 2.4 2.0*
All 2.4 2.2 1.9 2.9 2.6 2.0 Number 325 57 14 39 5 5
Note: * = less than five cases in cell.

52 Institute of Family Studies WORKING PAPER No. 9
Having children: preferences, pressures and reasons
In this section some of the information on the child-bearing decisions made by the different ethnic groups will be examined. Specifically, the section will look at the respondents' preferences for sons or daughters, ideas about the timing of children, and reasons for having children.
About one-half to two-thirds of men and women in all the birthplace groups wanted to have children of both sexes, and about one-third said they would not mind having either sex. There is evidence of a slight preference for sons among the Australian and other Englishspeaking husbands but not among the men in the other groups. Only about 20 per cent of men from the other English-speaking countries said they would not mind having either boys or girls and 12 per cent preferred just boys. Western and Eastern Europeans were the least likely to mind whether they had boys or girls. Women from South-East Asia, Southern Europe and the Middle East were also less likely than men from the same regions to mind having children of either sex (Table 45).
About one-third of male respondents with a partner at present said that they felt some pressure from their parents, their partners and themselves to have children. Men from Southern Europe, the Middle East and South-East Asia were more likely to feel such pressure from their partners. A lower proportion of women said that they felt pressure from their parents or partners to have children, probably because more women than men in this age group already had children. About one-third of the women felt some pressure from themselves to have children. Possibly this pressure arose from their awareness that they were in their prime reproductive years and that it was less desirable to have children once they were over the age of thirty-five. Pressure from self was lowest among Austalian-born males (Table 46).
Table 45 Preferences of respondents with a partner at present for sons or daughters
Birthplace
Other Western Southern South-English- and Europe, East
speaking Eastern Middle Asia, Preference Australia countries Europe East China Elsewhere
Males Both sexes 60% 64% 47% 64% 80% 20% Either, don't mind 31 22 47 33 20 80 Just boys 6 12 0 0 0 0 Just girls 2 0 0 2 0 0 None 1 3 6 0 0 0
Females Both sexes 59 53 50 54 56 52 Either, don't mind 28 29 40 41 39 41 Just boys 6 4 5 3 0 4 Just girls 6 10 5 3 0 4 None 1 4 0 0 6 0
N umber of males 389 69 17 42 5 5 N umber of females 641 100 20 39 18 27

Family Formation and Ethnicity 53
Table 46 Respondents, with a partner at present, who felt some pressure to have children
Birthplace
Other Western Southern South-English- and Europe, East
speaking Eastern Middle Asia, Source of pressure Australia countries Europe East China Elsewhere
On males Parents 29% 30% 24% 31% 60% 0% Friends 14 9 12 19 40 40 Partner 31 26 27 45 40 40 Relatives 19 13 18 17 40 40 Self 24 28 41 38 40 40
On females Parents 18 15 20 16 22 41 Friends 15 14 10 8 11 26 Partner 15 15 25 15 22 22 Relatives 18 19 15 13 28 26 Self 35 31 30 41 44 44
Number of males 389 69 17 42 5 5 Number of females 641 100 20 39 18 27
Many men felt it was important to delay child beariQg until they a'nd their pa~tners could cope with the additional responsibilities, until their marriagehadsett\ed and until they had saved enough money. Women who were born in Australi,a and the other English-speak,ing, countries were more ready to delay child bearing than those f.ro~ po~,English-speaking countries, particularly Southern Europe, the Middle East and South-East Asia er able 47). In his study of Greek and Italian parents, Callan (1980: 14) also found that the Southern European wives were more likely to want to have a child in the initial years of marriage than Australian wives. Thus, even though more Southern European and Middle Eastern male respondents compared with the Australian-born indicated that they would delay having children for a number of the reasons suggested, it is possible that they might not if their. wives were 'ready to cope'.
The various birthplace groups differed from one another regarding reasons for having children. Callan (1980: 14) reported that 'there was immense social importance in having a child in the Southern European community': having children was perceived as a fulfilment of the marriage and established the couple in the community. Such sentiments were also indicated by the AFF Project survey data. Southern European and Middle Eastern respondents felt that having children was an important part of marriage and they more frequently expressed a liking for children - 'kids make life more fun'. Few respondents in this group mentioned that having children affected their social life or the family finances, or resulted in the loss of freedom; none regarded children as 'demanding'. When asked to list some of the bad effects of having children, the Southern European and Middle Eastern respondents were more likely to mention their worries about their children's well-being and future (Tables 48 and 48a).
Western and Eastern Europeans also appeared to enjoy children. Many men mentioned their pride in creating their own family and rearing children, while women tended to stress the satisfaction and love they derived from their children. Many men from English-speaking

54 Institute of Family Studies WORKING PAPER No. 9
Table 47 Respondents, with a partner at present, who would or did delay having children according to reasons
Birthplace
Other Western Southern South-English- and Europe, East
speaking Eastern Middle Asia, Reasons Australia countries Europe East China Elsewhere
Males did/would delay until, Had enough money 46% 44% 18% 38% 40% 100% Hada steady job 37 36 29 41 60 80 Partner had job 3 7 6 5 40 40 Could cope 43 45 47 57 80 40
.. Partner could cope 44 52 59 57 80 60 Had a house 37 36 18 41 60 80 Marriage established 44 44 41 45 40 80
. Females did/would delay until Had enough money 34 28 30 28 28 26 Had steady job ·7 5 0 8 11 4 Partner had job 28 24 15 21 17 19 Could cope 38 45 30 33 33 41 Partner could cope 36 38 25 23 22 37 Had a house· 31 33 35 26 28 19 Marriage established 43 40 30 33 22 44
Number of males 389 69 17 42 5 5 Number of females 641 100 20 39 18 27
countries also enjoyed watching their children grow up and teaching them, while women valued the togetherness ofa family. However, unlike the Southern Europeans, they were more likely to note that children were demanding in several respects, that they affected their parents' social life and finances, and meant many sleepless nights and some loss of freedom.
There were only four male respondents from South-East Asia with children, thus making it difficult to form any reliable conclusions about their perceptions of having children. Many of the women regarded having children as part of marriage and the natural sequence of events. Nonetheless, many thought that children made life enjoyable and made them more responsible. Like the Southern European and Middle Eastern women, the South-East Asian women considered the disadvantages of child rearing to be the worries about their wellbeing and future rather than the demands they made.
Child care
The survey also collected information from all respondents who had at least one child under age 12 on their child care arrangements when they went to work or out for entertainment. However, the number of cases involved was quite small especially among the foreign-born respondents. Therefore, the results may not be very reliable.

Family Formatibn'ahdEthnicity 55
Table 48 Advantages/disadvantages of having children most frequently mentioned by males
Birthplace
Other Western Southern South-English- and Europe, East
Advantages/ speaking Eastern Middle Asia, disadvantages Australia countries Europe East China' Elsewhere All
Watch grow up, teach 30% 28% 40% 17% 0% 0% 28% Makes me more
responsible 20 4 30 13 0 9 20 Satisfaction, love 20 9 20 17 0 0 18 Makes life fun 16 17 30 39 O. 19 18 Gives meaning to life 11 11 0 22 25 45 1r·£, Form family 10 15 40 26 25· 27 13 .. I."J~;
Togetherness 13 9 10 9 25 18 13 .~f.'
Do things together 10 13 10 22 0 0 11 " Someone to work for 8 17 10 13 25 18 10,·,,;1
Fulfilment 11 9 10 4 0 ,0 10
Affects social life 19 22 20 4 0 9 18 Affects finances 15 11 20 0 0 9 13 Sleepless nights 15 13 0 9 0 0 '13 Loss of freedom 13 9 10 0 0 0 'H Worries 7 7 20 9 0 9 7 Future fears 6 7 10 13 0 0 6 Discipline problems 6 7 10 13 0 0 6 Demanding 5 7 20 0 0 0 5 Less time, privacy 6 4 0 0 0 0 5 Affects marriage 4 7 10 0 25 0 4
Number 256 46 10 23 4 11 350
Most male respondents indicated that their wives minded the children when they went to work. One-third of the female respondents with a child under age 12 were working. Their most common arrangement was to leave the child or children with relatives. Many women relied on more than one arrangement, usuallY'on relatives in combination with neighbours, baby-sitters and friends. 'Other' arrangements also included school (16 women), friends (eight), taking their children along to work (four) and working at home (two). There was not much difference between Australian-born women and women from the non-English-speaking countries as regards leaving children with relatives, but the proportion of women born in English-speaking countries who were able to leave children with relatives was a little lower. A greater proportion of respondents from the non-English-speaking countries than from Australia or the other English-speaking countries left their children with neighbours or at a day care centre (Table 49).
There was not much difference in the child care arrangements made by male and female respondents when they went out for entertainment so the responses of both sexes have been combined to increase the cell sizes for the foreign-born categories. Relatives were most frequently called on to baby-sit when the parents went out. Again, many respondents relied on some combination of relatives, neighbours, baby-sitters and friends. Common 'other'

56 .Institute of Family Studies WORKING PAPER No. 9
Table 48a Advantages/disadvantages of having children most frequently mentioned by females
Birthplace
Other Western Southern South-
"
English- and Europe, East Advantages/ '1\\' ','-.-.. speaking Eastern . Middle Asia, disadvantages Australia countries Europe East China Elsewhere All
Satisfaction, love .24% 12% 24% 29% 11% 8% 24% Makeslife'"fun ~. ; 19 22 19 36 50 25 21 Watch grow up, teach 20 19 24 25 11 13 20 Togetherness 17 27 24 29 11 13 18 Form' family 16 15 24 25 11 17 16 Males me more
responsible 15 9 19 0 22 17 14 Changes marriage
positively 14 13 19 7 0 17 13 Meaning to life 12 7 10 11 0 13 11 Less lonely 11 12 14 4 0 13 11 Makes me complete
woman 10 8 10 11 6 4 10
Affects social life 13 24 5 4 6 4 13 loss of freedom 12 23 .10 7 6 8 13 Affects finances 11 16 0 4 6 17 11 Future fears 9 8 14 14 11 13 10 Discipline problems 8 8 14 0 6 0 8 Sleepless nights 8 4 14 0 11 8 8 Less time, privacy 9 6 0 4 0 0 7 Worries 5 5 0 29 17 21 7 Demanding 7 5 5 0 6 0 7 Lose self-control 5 7 0 4 0 0 5
arrangements were to take the children along, or to use friends or a baby-sitting club. Fewer respondents from the English-speaking countries and South-East Asia than from the other groups were able to rely solely, on relatives. More of those born in the Englishspeaking countries' asked neighbours or had baby-sitters instead. The South-East Asians were more likely than the other groups to leave the children with one spouse or with a neighbour (Table 49a).
Since children were mainly cared for by the spouse or relatives when a parent worked or went out, only about one-quarter of the respondents who mentioned any child care arrangements paid for the service; the average weekly cost was higher for respondents from non-English-speaking countries and lowest for those from English-speaking countries. However, the results might be biased by the small sample size (Table 50). This topic needs further study with a larger sample.

Family Formation and Ethnicity 57
Table 49 Child care arrangements of respondents with a child· under 12 while at work
Birthplace
Other Western Southern South-English- and Europe, East
Child care speaking Eastern Middle Asia, arrangement Australia countries Europe East China Elsewhere All
Of working males Spouse 137 21 5 19 2 1 185 Older children 0 1 0 0 0 0 1 Relatives 15 3 0 2 0 0 20 Neighbour 1 1 0 0 0 0 2 Baby-sitter 7 0 0 1 0 2 10 Creche, pre-school, etc 7 4 1 0 0 0 12 Other* 12 3 1 3 0 0 19 Not stated 1 2 0 1 0 0 4
Total 180 35 7 26 2 3 253
Of working females Spouse 34 7 1 3 1 0 46 Older children 5 2 0 0 0 0 7 Relatives 53 6 1 4 1 3 68 Neighbour 7 2 1 0 2 2 14 Baby-sitter 21 0 0 2 0 2 25 Leave at home 1 0 1 1 0 0 3 Creche, pre-school, etc 16 3 0 2 1 2 24 Other* 50 9 2 0 0 1 62 Not stated 13 1 0 1 0 16
Total 200 30 6 13 6 10 265 Per cent working 34% 31% 27% 38% 33% 56% 34%
Note: * refers to a combination of arrangements. The most common combinations involved relatives, neighbours, baby-sitters and friends. Sixteen respondents had children who were in school and could take care of themselves; four said they took the child with them to work, and two worked at home.
Table 49a Child care arrangements of respondents with a child under 12 when going out
Birthplace
Other Western Southern South-English- and Europe, East
Child care speaking Eastern Middle Asia, arrangement Australia cOllntries Europe East China Elsewhere All
Spouse 17 4 0 4 2 0 27 Older children 18 5 0 0 0 0 23 Relatives 393 39 18 31 5 10 496 Neighbour 56 15 1 2 2 1 77 Baby-sitter 93 31 5 3 1 4 137 Leave at home 2 1 0 0 0 0 3 Creche, pre-school, etc 3 1 0 0 0 0 4 Other* 151 22 5 12 4 2 196 Not stated 15 3 1 4 0 0 23
Total 748 121 30 56 14 17 986
Note: * refers to a combination of arrangements. The most commonly mentioned (by 70 respondents) was the combination of relatives and neighbours or baby-sitter. Twenty-two said they usually took the children along; 28 left the children with friends; and 11 used baby-sitting clubs.

58 Institute of Family Studies WORKING PAPER No. 9
Table 50 Cost of paid child care per week to respondents
Cost per week
< $10 $10-19 $20-29 $30 or more Average
Birthplace, number of respondents Number who paid
Australia (156) 65 42 18 31 $16 Other English-speaking countries (36) 17 11 4 4 $12 Western and Eastern Europe (6) 1 2 2 1 $18 Southern Europe, Middle East (5) 0 2 1 2 $26 South-East Asia, China (4) 0 1 3 0 $18 Elsewhere (8) 1 2 0 5 $27

Family Formation and Ethnicity 59
8 Respondents' General Attitudes
An attempt was made to elicit some general attitudes from the AFF Project survey respondents. They were asked about their concept of the male and female roles, the major pressures they were experiencing in their lives and their views of the future.
Attitudes to sex roles
Respondents' attitudes to sex roles could be ascertained from their agreement or disagreement with eight statements about male and female roles (Table 51). Respondents from Southern Europe, the Middle East and South-East Asia could be classified as more traditional in their sex role attitudes than respondents from the other categories. They were more likely to agree that the motherhood role was the most important one for women and that important decisions should be made by the husband. Only 62 per cent of female respondents from Southern Europe and the Middle East agreed that husbands should help with housework compared with 76 per cent of women from South-East Asia and Western and Eastern Europe, and 82 per cent of women born in Australia and the other English-speaking countries.
Major life pressures
When asked what was the major pressure they faced in life at this stage, about 13 per cent of the respondents could not think of any. Twenty-five per cent of men from Southern Europe, the Middle East and South-East Asia and nearly 20 per cent of the Southern European! Middle Eastern females, compared with 10 per cent of Australian-born respondents, felt no major pressures. It is possible, of course, that they could be more reluctant to reveal any pressures on them (Table 52). .
The majority of people in all ethnic categories, except the South-East Asians, who said they faced major pressures mentioned money. Next, for males, were pressures related to work and career, home mortgages and the cost of living. Four of the 18 South-East Asian males felt that getting ahead in their career was the major pressure. Many of the female respondents also mentioned the cost of living as a major pressure but fewer mentioned pressures related to work and career. Instead, a number of women (81 out of 1274) born in Australia and the other English-speaking countries said that being a good parent was their major pressure, but this was a pressure for only four out of the 152 female respondents from the non-English-speaking countries. Many of the foreign-born men and women, but relatively few of the Australian-born, said that finding work was the major pressure they faced at this stage of their lives. Five of the South-East Asians said their major pressure was completing their education.

60 Institute of Family Studies WORKING PAPER No. 9
Table 51 Respondents' agreement with statements about sex roles
Birthplace
Other Western Southern South-English- and Europe East
speaking Eastern Middle Asia, Statement Australia countries Europe East China Elsewhere
Males 'Husband should make
important decisions' 21% 22% 31% 55% 44% 35% 'A woman is only fulfilled
as a mother' 21 13 22 47 44 20 'Whatever a woman's career,
her most important role in life is still that of mother' 45 33 44 73 73 55
'Wives who don't have to shouldn't work' 57 56 69 69 61 75
'Husband provides protection for wife' 91 89 88 95 100 95
'Husbands should help regularly with housework' 85 89 91 72 89 90
Females 'Husband should make
important decisions' 13 9 21 25 45 24 'A woman is only fulfilled
as a mother' 25 18 38 53 52 21 'Whatever a woman's career,
her most important role is still that of mother' 43 28 48 70 72 41
'Wives who don't have to shouldn't work 52 39 52 62 55 61
'Husband provides protection for wife' 79 72 69 88 72 71
'Husbands should help regularly with housework' 82 82 76 62 76 82
Number of males 857 127 32 64 18 20 Number of females 1122 152 29 60 29 34
Attitude to the future
Many respondents felt that things would either be the same in two years' time or that they would be better. Very few expressed pessimism about the future. Both men and women, native-born and foreign-born, said that they might be in a better financial situation, working, or married and living in their own home, or expecting their first child.

Family Formation and Ethnicity 61
Table 52 Major pressures respondents faced in life at this stage
Birthplace
Other Western Southern South-English- and Europe, East
speaking Eastern Middle Asia, Australia countries Europe East China Elsewhere
Pressure (Order of ranking)
Males Money 1 1 1 1 Career 2 4 2 1 2 Work 3 2 2 1 2 Housing debt 4 3 2 3 2 Cost of living 5 4 3 Finding work 3 2 2 3 Completing education 2 Saving 2
Female Money 1 1 2 1 2 1 Cost of living 2 2 1 2 1 Being good parent 3 4 Finding work 3 5 2 2 Study for exams 4 Housing debt 3 3 1 Work 5 2 Children's welfare 5 Health 3 2 Completing education 1 Pregnancy - 1st child 2 Career 2 Interest rates debts 4
Percentage of respondents saying no pressures Males 10 10 19 22 28 15 Females 14 9 10 19 14 2

62 Institute of Family Studies WORKING PAPER No. 9
9 Discussion
The marriage and child-bearing patterns and attitudes to family formation of the men and women from the various ethnic backgrounds differed from one another and from the Australian-born population in many ways.
Differences between the groups
Most of the differences observed in this report were between the Southern European, Middle Eastern and South-East Asian respondents and the Australian-born, Englishspeaking and Western and Eastern European respondents. The Southern European, Middle Eastern and South-East Asian men and women were more traditional in their attitudes to living together and sex roles than the Australian-born and other English-speaking people. They were also more family oriented. They were more likely to do things with their families during the early teenage years and to leave home a little later, usually at the time of marriage.
On average the Southern European and Middle Eastern women were married at younger ages than Australian-born women but their marriages, like those of the men from the same region, were more stable. They were the most likely of all the respondents to agree that marriage provided love, warmth and happiness, a sense of responsibility, and the opportunity to have and bring up children. Many respondents felt it was important that their parents approve of their partner; not surprisingly many had partners from the same ethnic group and many in fact met their partners through parents, relatives and friends.
The family was regarded as an important social institution. Children were much valued and were considered an important part of marriage. However, Southern European/Middle Eastern women wanted slightly smaller families on average than the Australian-born respondents. Ware (1975: 376) has suggested that differences in fertility behaviour between the Southern Europeans and the native-born Australians can be explained by differences in socio-economic status. That hypothesis remains to be tested by further analysis of the data. These preliminary findings indicate that in spite of the social importance Southern European/ Middle Eastern respondents attach to having children, concern for their children's future could be the motivating factor in their desire for a small family. It has been suggested that as migrants, they are likely to be relatively more achievement oriented than the native-born (Ware, 1975: 377). Many of them probably want their children to be successful in their new country and the best way is to have few children and give them the best upbringing they can afford. An earlier study has shown that Greek women would like at least a son to attend university (Callan, 1980: 33).

Family Formation and Ethnicity 63
The other group which differed significantly in its family formation patterns from the Australian-born was the South-East Asian and Chinese. The respondents in this category married much later and on average wanted smaller families. Two-thirds of the married women wanted rwo children; only one in ten wanted to have three or more~ They also appeared achievement oriented and many had tertiary education. This factor could be related to their age at marriage and lower fertility. But even those who did not have tertiary education wanted small families.
Like the Southern European/Middle Eastern respondents, many South-East Asian respondents felt that parental approval of their partner was important and many had partners of the same ethnic background. However, more of them came to Australia after the age of 15 and therefore could have been married before their arrival in this country. Religion was less important to them than to the Southern European and Middle Eastern men and women.
It would have been preferable to have differentiated the Indo-Chinese from the rest of the Asians in this group because the lndo-Chinese came to this country as refugees while the other Asians came for further education and other socio-economic reasons. Their attitudes to many of the issues addressed by the survey could be the same as those of the other Asians and yet some aspects of their family formation behaviour could of necessity be different. It is hoped that future studies will address these rwo groups separately.
Men and women born in the other English-speaking countries were not very different from the Australian-born in their attitudes to marriage and child bearing. However, they were married at slightly younger ages than the Australian-born and the incidence of marital breakdown also appeared to be higher among them. Married women began child bearing earlier than Australian-born women but wanted slightly smaller families.
Men and women from Western and Eastern Europe were closer to the English-speaking and Australian-born respondents in their attitudes to marriage and child bearing and their marriage patterns than they were to the Southern Europeans. Male respondents in this group were also more likely than those in the other foreign-born categories to have an Australian-born partner. Married female respondents in this group also wanted smaller families than the Australian-born and other English-speaking respondents; four out of the 20 (20 per cent) wanted or expected to have only one child.
It is possible that the combination of people from so many national origins into a European category might have caused differences berween a particular people and native-born Australians to balance out. For example, data from earlier censuses had indicated that Germanborn wives had lower fertility than Australian-born wives, but that the Dutch had higher fertility (Ruzicka and Caldwell, 1982). The combination of these rwo groups into a European category would result in that category having similar fertility to the Australianborn. However, their small numbers made such a regrouping necessary. It would also have been preferable to consider Eastern Europeans as a separate category since many came as refugees and 'dieir family formation'patterns might'be differendrom'those of the Western Europeans.
It is difficult to form any conclusions about the 'elsewhere' category because it consisted of very small numbers of very diverse people. Collectively, respondents in this group formed only 1.7 per cent of the Australian population in 1981. Thus, it would be difficult to include many of them in any survey.

64 Institute of Family Studies WORKING PAPER No. 9
Similarities between the groups
It is equally important to note similarities between the foreign-born and native-born Australians. For example, the most recent Census data showed that the proportions of men and women aged 20-24 who had married were the same for those born in Indo-China and Australia. Men and women from the various ethnic backgrounds also largely agreed about the attributes in a partner which were important; for example, they agreed that partners should share goals and ideas.
Only the marriages of the Southern European/Middle Eastern respondents stood out in their stability. The South-East Asians and Western and Eastern Europeans held a number of views similar to those of the Australian-born and English-speaking respondents about the advantages and disadvantages of marriage and probably experienced comparable rates of marital dissolution. Further analyses oflarger samples would be necessary to establish this.
Young women from all birthplace groups were agreed in wanting a small family. The two-child family appeared to be the norm for women in all the birthplace groups. About half of all European and English-speaking respondents and two-thirds of the Asians and others wanted to have two children. The average desired family size of the Australian-born women was 2.5 compared with 2.4 for the Southern European and Middle Eastern women and 2.2 for Western and Eastern European women. The Asians, coming from a tradition of high fertility, wanted an even smaller family of not more than two children.
These findings indicate that while some members of the foreign-born population in Australia have retained the social and religious values of their societies of origin, which have influenced aspects of their marriage patterns, they have also adapted in a pragmatic way to the fertility behaviour of this country. Additional research which followed up these respondents and their demographic behaviour in their later child-bearing years, and compared them with Australian-born persons of migrant parents from the same ethnic backgrounds, would provide further understanding of the family formation and dissolution patterns of the different ethnic groups.

Family Formation and Ethnicity 65
10 Recommendations
Further analysis of the AFF Project survey data
Because of time constraints, it was not possible to examine each topic in depth or to test particular hypotheses about family formation among different ethnic groups. Several directions for further analysis are possible.
1 It would be of interest to examine people born in Australia of non-English-speaking parents and compare them with the foreign-born and the Australian-born of Australian parents. There were 168 Australian-born respondents with non-English-speaking 'parents, most of whom were from Europe.
2 Further comparisons could be made between the foreign-born who came to Australia before the age of 15 and those who came after. Although this report makes this distinction in the examination of a few topics, it was not possible to carry out the comparison consistently throughout the analysis because of the time limitation. It would be of interest to compare the attitudes to family formation of the foreign-born according to their length of residence in this country.
3 Further analysis of fertility behaviour and differentials could help answer some specific questions such as the extent to which socio-economic status affects the fertility of the foreign-born compared with that of the native-born Australians. Other questions which could be examined are whether the size of the respondents' family of origin is related to their own desired family size and whether this holds for all ethnic groups.
4 It might be useful also to examine a few case studies from some of the ethnic groups in depth. It would then be possible to link family background, family formation behaviour and attitudes to obtain a more complete picture of individuals and their adaptation to the social and economic conditions of this country.
Questions for future surveys
This analysis has pointed out several issues which could be addressed in future research based on larger samples of the foreign-born.
1 Marital breakdown and its consequences: there were too few cases of separated and divorced persons among the foreign-born in this sample for an adequate analysis of their characteristics and their experiences of marital breakdown. A larger sample but one which also includes the older ages (up to age 45, for example) would be helpful for such a study.

66 Institute of Family Studies WORKING PAPER No. 9
2 Child care: there were too few foreign-born women with young children in this survey sample for a useful study of child care arrangements and costs. Future examination of this topic needs a much larger sample.
3 It would be very useful to follow up the foreign-born respondents in-this sample as they pass through their child-bearing years to see how closely their family formation behaviour conforms to their plans and intentions as indicated in 1981-82, and how they have settled into this country.
4 In fairness to the different ethnic groups resident in Australia, each should be examined individually instead of being organised into broad regional categories as is the case here. Future survey questionnaires should allow for more specific birthplace codes; for example, Indo-China and the rest of South-East Asia should be coded separately. People put into the same birthplace groups in this enquiry came to Australia under different circumstances: some came as refugees, others came for economic reasons, still others came to join family members. It is, therefore, all the more important to consider them separately in analysing their family formation patterns.

Family Formation and Ethnicity 67
Appendices
Appendix 1: Language problems with the survey
As expec~ed, respondents from Southern Europe, the Middle East and South-East Asia were more likely than the others to have problems with the English vocabulary used in the AFF Project survey. About one-third of the men from these regions and 45 per cent of the South-East Asian women had problems with vocabulary. The female respondents from Southern Europe and the Middle East were apparently better at English than the male respondents; only 27 per cent had language problems (Table 53).
The fact that some of the non-English-speaking respondents did have problems with words used in the survey raises the question of how reliable their responses were, especially those to the attitude questions. It is unlikely that questions requesting factual information would be misunderstood. However, some of the statements measuring attitudes could be misinterpreted. Therefore, assessment of attitudes to various issues was made not by examining
Table53 Interviewers' ratings of the language problems and the interview
Birthplace
Other Western Southern South-English- and Europe, East
speaking Eastern Middle Asia, Australia countries Europe East China Elsewhere
Language problems Males: No problems 98% 96% 81% 63% 56% 85% Small vocabulary 2 3 13 36 39 15
Females: No problems 98 97 93 72 52 85 Small vocabulary 2 3 7 27 45 15
Agreeable to follow-up interview Males 97 97 97 94 94 100 Females 96 95 97 92 83 94
Comfortable during interview" Males 2.2 2.1 2.3 2.3 2.3 2.2 Females 2.0 1.9 2.0 2.1 2.2 2.0
.. Average score from 1 (comfortable) to 5 (uncomfortable).

68 Institute of Family Studies WORKING PAPER No. 9
people's responses to single statements, but by examining their responses to several statements on each issue to obtain a general view. During the analysis, consistency of patterns were checked where possible before any conclusions were drawn. The attitudes of the different birthplace groups to the various family formation issues appear to be internally consistent and in accordance with related behavioural patterns. The language problem might alter the attitude findings by a few percentage points for some birthplace groups but it is not serious enough to affect the major conclusions of this report. A more serious factor which could affect the findings is the small number of cases available for some of the tabulations.
Appendix 2: The interview
The AFF Project survey interviewers were asked to rate the respondents on a scale of one (most comfortable) to five (uncomfortable) according to how comfortable they appeared during the interview. Most respondents seemed comfortable during the interview, scoring an average of 2.2. Women were more comfortable than men; their scores were siightly lower than men's (Table 53) .
. : Most respondents were agreeable to a follow-up interview. Only about 5 per cent of the male respondents were unwilling to be interview.ed again. Female respondents were a little less willing than male respondents to be interviewed again. This is somewhat surprising since they were rated by the interviewers as more comfortable than males during the interview. About 18 per cent of the South-East Asian female respondents were unwilling to be· interviewed ·again. Since this group also had the largest proportion with language difficulties, it could be that they were unwilling to talk to the interviewers again because they felt embarrassed about their English.
About 80 per cent of the respondents also agreed that 'questionnaires like this get very close to the truth'. Whether this was to please the interviewer is not known. The South-East Asian female respondents appeared more cynical (presuming that they had understood the statement correctly): only 62 per cent felt that such surveys were useful.

Family Formation and Ethnicity 69
List of References
CALLAN, Victor J. (1980), 'The value and cost of children: Australian, Greek, and Italian couples in Sydney, Australia', Journal of Cross-Cultural Psychology, Vol.ll, December, pp.482-497.
DA Y, L.H. (1964), 'Fertility differentials among Catholics in Australia', Milbank Memorial Fund Quarterly, Vo1.42, pp.57-83.
DRUR Y, Sue and Neville (1976), A nation of migrants, Thomas Nelson, Melbourne.
JOSEPHIAN, Virginia (1983), Divorce in Australia, 1971-1981: an examination of period analysis, Paper presented at the Australian Famiiy Research Conference, Canberra.
McDONALD, P.F. (1974), Marriage in Australia: age at first marriage and proportions marrying, 1860-1971, Australian Family Formation Project Monograph No.2, Department of Demography, Australian National University, Canberra.
McDONALD, P.F. (1982), 'Marriage and divorce in Australia', Population of Australia, United Nations (ESCAP) Country Monographs Series, VoU, No.9, pp.183-198.
PRICE, CA. (1982), 'International migration: contribution to growth and distribution of Australian population', Population of Australia, United Nations (ESCAP) Country Monographs Series, Vol.1, No.9, pp.46-70.
ROWLAND, Jennifer J. (1982), 'Ethnic composition of the population', Population of Australia, United Nations (ESCAP): Country Monographs Series, Vo1.1, No.9, pp.1 0 1-12 7.
RUZICKA, L.T. and CALDWELL, ].C (1977), The end of demographic transition in Australia, Australian Family Fobriation Project Monograph No.5, Department of Demography, Australian National University, Canberra.
RUZICKA, L.T. and CALDWELL, J.C (1982), 'Fertility', Population of Australia, United Nations (ESCAP) Country Monographs Series, VoU, No.9, pp.199-229.
WARE, Helen (1975), 'Immigrant fertility: behaviour anp attitudes', International Migration Review, Vol.9 Fall, pp.361-378.;

70 Institute of Family Studies WORKING PAPER No. 9
Institute of Family Studies - Original Data Collection
The Institute of Family Studies, established under the provisions of the Family Law Act 1975, began operation in 1980 with the aim of developing a comprehensive and detailed understanding of factors affecting family structure and family life in Australia. The policy advisory approach of the Institute stresses the importance of the economic status and well-being of Australian families and positive programs of support for families and the needs of children.
An important part of the Institute's work involves four original data collection projects. Data collected from individual surveys from each of these projects will be analysed and reported on by the Institute. Subsequently, data from selected surveys will also be released for analysis by other researchers.
To date, the four orginal data collection projects are: • the Australian Family Formation Project (AFF Project), aimed at discovering how young
Australians feel about getting married and having children and what factors influence their decisions for the future;
• the Family Re-formation Project (FRE Project), designed to examine the reasons why marriages dissolve, how people cope, the legal process of divorce and its economic and social consequences, remarriage and step-parenting;
• the Children in Families Project (CIF Project), designed to explore how young children and adolescents living with both natural parents, with one parent or in re-formed families view family life, and their active use of family resources in the development of competence;
• the Family Support Networks Project (FSN Project), aimed at examining the types of support that families offer to their members as well as the types of formal support services they.use,.and in what circumstances these kinds of support and services are sought.
Australian Family Formation Project Aims of the Project
The Australian Family Formation Project (AFF Project) is a longitudinal study of a large national sample of 18 to 34 year-old Australians designed to explore the patterns of family formation in families of origin and families of creation.
Because young people today are more likely than people in past generations to leave home earlier and live independently of their family of origin, to delay marriage, to delay having children, and to enter into de facto unions, it is important to examine the reasons for these changes and the consequences of them on family life in Australia.

Family Formation and Ethnicity 71
Changes in the structure of the Australian population and in the variety of family types on which the AFF Project focuses include:
• leaving home patterns • the increased incidence of delayed marriages and later child bearing • divorce and remarriage rates • increased lone parenthood • declining birth rates • the occurrence and nature of de facto relationships • sexual experience • the impact of sex roles and work arrangements on family patterns • social values about marriage, divorce, work, individual and community responsibilities.
By giving a comprehensive progressive picture of what young Australians are thinking and doing about family life, their plans for forming families and their social values, the AFF Project provides detailed information on changes occurring in Australian society that have far-reaching policy implications for both immediate and projected social security costs and for social planning.
Description of the Project Surveys
AFF Project - 1981-82 IFS Survey Members of the survey team: Don Edgar, Helen Glezer, Christine Kilmartin, Peter McDonald, Andrew Prolisko, Don Stewart, Des Storer, Terry Tremayne.
The first stage of the AFF Project was a major, national survey of 2544 Australians aged 18 to 34 years (1118 men and 1426 women). After extensive planning and pilot-testing by the Institute's AFF Project team, the survey went into'the field in October 1981.
The survey's interview schedule covered such issues as family background, residential mobility during childhood, stability of parents' marriage, educational, occupational and personal relationship history, family formation plans and experiences, expectations for and of marriage, having children, experience of economic or personal difficulties, and'attitudes and values about marriage, divorce, work and social policies.
Each person interviewed was asked to give permission for the Institute to contact them again so that what actu'ally happens to them can be checked against the plans, expectations and values they had at the time of this first survey. A very high response was received, and contact with respondents is being maintained.
Selected on a probability sample design, the respondents came from randomly chosen households in 650 Collectors' Districts (CD) scattered throughout Australia. These Census areas containing roughly 300 households were stratified to ensure that each State, and each region within each State, was represented in direct proportion to the number of households contained within, it. A skip interval of three occupied dwellings was adopted using random start points within each CD. At least three call-backs at the selected households were required to obtain an interview with a person randomly selected from among those aged 18 to 34 within that household.
Approximately 15 household contacts were made in each CD to yield four completed interviews. Thus a total of 9750 households were contacted. Whoever opened the door at each house call was asked first for details about the people living there and their relationships to one another. This information provides a more exhaustive set of relationships than

72 Institute of Family Studies WORKING PAPER No. 9
does the Census and so gives a first complete national picture of the frequency of intact two-parent households, one-parent households and re-formed families, of the numbers of adopted, step and 'half' children, and of the number of households containing extended or multiple families, group living arrangements and couples 'living together as married' (de facto). These findings about household structure patterns include families right across the age range. Then, in all households where there was at least one person aged between 18 and 34 years a detailed interview was obtained with one person in that age range.
Logistically, this exercise required training of 120 interviewers across Australia and field supervision of their work. Completed interview schedules were returned to Melbourne and Reark Research Pty Ltd coded and punched the data from item responses onto computer tape. The entire exercise took from October 1981 until the end of March 1982. Since then, the Institute has been checking the data, coding the more complex open-ended questionnaire items and analysing the data.
AFF Project - 1986 IFS Survey
It is intended to follow up the 1981 national sample in order to examine family formation changes which have occurred since the first interview. By 1986, 18 year-olds in the original sample will be 23 to 24 and the 1986 Survey will look at their changed economic circumstances, attitudes to marriage, relationships formed, reality versus earlier expectations and future plans.
Contracted research
In addition to research conducted by the staff of the Institute of Family Studies, additional research has been contracted to researchers external to the Institute.
AFF Project - 1982 Marriage Case Studies
This set of case studies of 60 young married people from the national sample of 2544 gives a picture of how couples negotiate their roles in newly formed families and the main factors affecting family functioning and marital satisfaction. The researchers are Helen Glezer and Tamara Kotler.
AFF Project Publications
To date, publications based on'AFF Project data include:
'The transition to marriage: trends in age at first marriage and proportions marrying in Australia', by Gordon Carmichael, in Proceedings Volume I, Family Formation, Structure, Values, Australian Family Research Conference, Institute of Family Studies, Melbourne, 1984. (Price: $8.00, or $50.00 full set 7 vols.)
'Changes in marriage and sex-role attitudes among young married women: 1971-1982', by Helen Glezer, in Proceedings Volume I, Family Formation, Structure, Values, Australian Family Research Conference, Institute of Family Studies, Melbourne, 1984. (Price: $8.00, or $50.00 full set 7 vols.)
'Family formation and ethnicity'; by Siew-Ean Khoo, in Proceedings Volume I, Family Formation, Structure, Values, Australian Family Research Conference, Institute of Family Studies, Melbourne, 1984. (Price: $8.00, or $50.00 full set 7 vols.)

Family Formation and Ethnicity 73
Family formation and ethnicity, by Siew-Ean Khoo, Working Paper No. 9, Institute of Family Studies, Melbourne, March 1985. (Price: $5.00)
Living together: young couples in informal marriages, by Siew-Ean Khoo, Working Paper No. 10, Institute of Family Studies, Melbourne, July 1985. (Price: $5.00)
Institute of Family Studies Annual Report 1982-83, Chapter 1. (Price: $6.50)
Can the family survive?, by Peter McDonald, Discussion Paper No. 11, Institute of Family Studies, Melbourne, 1984. (Price $1.50)
Further publications based on AFF Project data are being prepared by the Australian Institute of Family Studies.

~
, ;
;
, ~
<i
l' 11-
Institute of Family Studies . 766 Elizabeth Street Melbourne Victoria 3000
Telephone (03) 342 9100
;
e-
I.
" , •
, ,
J' ,
. ,
•
!
I
r-" t,
,
i
• " ' ..
" "
" ; \'
!
J .~. ,