family firms, expropriation and firm value :...
TRANSCRIPT
FAMILY FIRMS, EXPROPRIATION AND FIRM VALUE : EVIDENCE FROM
MALAYSIA
LIEW CHEE YOONG
THESIS SUBMITTED IN FULFILLMENT
OF THE REQUIREMENTS
FOR THE DEGREE OF DOCTOR OF PHILOSOPHY
FACULTY OF BUSINESS AND ACCOUNTANCY
UNIVERSITY OF MALAYA
KUALA LUMPUR
2013

ii
ABSTRACT
The primary objective of this study is to examine whether minority shareholder
expropriation in Malaysian firms occur through related party transactions (RPTs) which
are likely to result in expropriation and the domestic banking channel as well as whether
it is influence by independent directors’ tenure. An analysis is made on whether this
expropriation is stronger in family firms compared to non-family firms. Furthermore, an
assessment is also made whether there is a positive moderating effect of controlling
shareholders’ ownership on the relationship between related party transactions (RPTs)
which are likely to result in expropriation, independent directors’ tenure and the number
of domestic banks that the firm engages with, and firm value in Malaysian firms.
Further analysis is also made on whether this positive moderating effect (if any) is
stronger in family firms compared to non-family firms. This research utilises panel data
pooled Ordinary Least Square (OLS) regression model and the Fixed Effect Least
Square Dummy Variable (LSDV) model for data analysis. In this research, minority
shareholder expropriation is found in both family and non-family firms. However,
minority shareholder expropriation through RPTs is found to be stronger in family firms
compared to non-family firms. In addition, expropriation due to long tenure of
independent directors occur only in family firms in exclusive industries and this
expropriation cannot be proven whether it is stronger in family firms or non-family
firms. In family firms, corporate reputational effects after the Transmile scandal also
help reduce expropriation through the positive moderating effects of controlling
shareholders’ ownership. This moderating effects is stronger in family firms compared
to non-family firms. Basically, this study shows us that there is a need for the relevant
authorities in this country i.e. the Securities Commission (SC) to seriously incorporate
minority shareholder protection in future issuance of Codes of Corporate Governance.

iii
ABSTRAK
Objektif utama kajian ini adalah untuk mengkaji sama ada rampasan pemegang saham
minoriti dalam syarikat Malaysia berlaku melalui urus niaga pihak berkaitan (RPT) dan
saluran perbankan domestik serta sama ada ia dipengaruhi oleh tempoh pengarah bebas.
Analisis dibuat sama ada rampasan ini adalah lebih kuat dalam firma keluarga
berbanding dengan firma bukan keluarga. Tambahan pula, penilaian juga dibuat sama
ada terdapat kesan pemilikan pemegang saham utama di atas hubungan antara urus
niaga pihak berkaitan (RPT) yang mungkin menyebabkan rampasan, pengarah bebas
pemegang saham tempoh dan bilangan bank tempatan bahawa firma itu terlibat dengan
nilai firma dalam syarikat-syarikat Malaysia. Analisis juga dibuat mengenai sama ada
kesan positif ini sederhana (jika ada) adalah lebih kuat dalam firma keluarga berbanding
dengan firma bukan keluarga. Kajian ini menggunakan data panel (OLS) model regresi
dan Kesan Tetap (LSDV) untuk menganalisis data. Dalam kajian ini, rampasan
pemegang saham minoriti didapati dalam firma keluarga dan bukan keluarga. Walau
bagaimanapun, rampasan pemegang saham minoriti melalui RPT didapati lebih kuat
dalam firma keluarga berbanding dengan firma bukan keluarga. Di samping itu,
rampasan kerana tempoh lama pengarah bebas berlaku hanya di firma keluarga dalam
industri eksklusif dan rampasan ini tidak dapat dibuktikan sama ada ia adalah lebih kuat
dalam firma keluarga atau firma bukan keluarga. Dalam syarikat keluarga, kesan
reputasi korporat selepas skandal Transmile juga membantu mengurangkan rampasan
pemegang saham minoriti. Kesan positif pemilikan saham pemegang saham utama
melalui RPT didapati lebih kuat dalam firma keluarga berbanding dengan firma bukan
keluarga. Kajian ini menunjukkan bahawa terdapat keperluan bagi pihak berkuasa
seperti Suruhanjaya Sekuriti (SC) memberi perlindungan kepada pemegang saham
minoriti dalam penerbitan Kod Tadbir Urus Korporat pada masa hadapan.

iv
ACKNOWLEDGMENTS
I am aware initially that undertaking PhD studies is not an easy task. Throughout this
study, I have learnt many new knowledge and skills. The completion of this thesis
would not be achieved if not for the assistance and contributions from my supervisors,
Associate Professor Dr. S.Susela Devi and Dr. Ervina Alfan as well as from past
supervisors, Dr. Sa’adiah Munir and Associate Professor Dr. M.Fazilah Samad. My
supervisors have assisted me by providing advice, ideas and guidance and I am greatly
indebted to them.
My appreciation is also extended to the Dean of the Faculty of Business and
Accountancy and all the staff in the Faculty of Business and Accountancy, University
Malaya for their willingness to provide help and support when requested.
Most importantly, I would like to extend my sincerest thanks and appreciation to my
parents and sister for their emotional support and encouragement. Without their
encouragement and understanding, it would have been impossible for me to complete
this thesis.

v
TABLE OF CONTENTS
Page
ABSTRACT ii
ABSTRACT (BAHASA MELAYU) iii
ACKNOWLEDGEMENT iv
TABLE OF CONTENTS v
LIST OF FIGURES xii
LIST OF TABLES xiii
LIST OF ABBREVIATIONS xvii
CHAPTER ONE : OVERVIEW OF THESIS
1.1 INTRODUCTION 1
1.2 BACKGROUND 3
1.3 PROBLEM STATEMENT 6
1.4 RESEARCH QUESTIONS AND RESEARCH OBJECTIVES 14
1.5 SIGNIFICANCE OF STUDY 17
1.6 SUMMARY OF RESEARCH RESULTS AND IMPLICATIONS OF
RESEARCH RESULTS
18
1.7
1.8
ORGANISATION OF THIS STUDY
CONCLUSION
19
20
CHAPTER TWO : THE MALAYSIAN INSTITUTIONAL ENVIRONMENT,
OWNERSHIP STRUCTURE AND MINORITY
SHAREHOLDER EXPROPRIATION
2.1 INTRODUCTION 21
2.2 CORPORATE GOVERNANCE 21
2.2.1 Definitions of Corporate Governance 22

vi
2.3 AGENCY PROBLEMS, OWNERSHIP STRUCTURE & CONTROL AND
LEGAL PROTECTION OF MINORITY SHAREHOLDERS
26
2.3.1 Agency Problem: The Principal-Agent Conflict (Agency Problem
Type I)
26
2.3.2 Ownersip Structure & Control And Legal Protection Of Minority
Shareholders: International Evidence
27
2.3.2.1 Ownership Structure & Control outside United States
(USA)
27
2.3.2.2 Ownership Structure & Control in Malaysia 31
2.3.2.3 Legal Protection of Minority Shareholders outside
United States (USA)
32
2.3.3 Agency Problem: The Principal-Principal Conflict (Agency
Problem Type II)
34
2.3.3.1 Corporate Governance in Emerging Markets and the
Nature of the Principal-Principal Conflict
34
2.3.3.2 Extension of Agency Theory 37
2.3.3.3 The Costs of Principal-Principal Conflict 39
2.3.3.4 Minority Shareholder Expropriation 43
2.3.4 Factors Which Encourage Minority Shareholder Expropriation 45
2.3.4.1 Private Benefits of Control and Expropriation 45
2.3.4.2 Capital Market Development, Moral Hazard Banking
and Expropriation
47
2.3.4.3 Agency Cost of Debt And Expropriation 50
2.3.4.4 Lack of Informed Trading In Equity Markets and
Expropriation
50
2.3.4.5 Lack of Market For Corporate Control And
Expropriation
52
2.3.4.6 Inadequate and Costly Legal Protection of Minority
Shareholders
53
2.3.4.7 Restrictive Licensing Practices and Expropriation 56
2.3.4.8 Rent Seeking and Expropriation 56
2.3.5 Minority Shareholder Expropriation during Financial Crisis 58

vii
2.4 CORPORATE GOVERNANCE MECHANISMS 63
2.5 INSTITUTIONAL SETTING IN MALAYSIA 65
2.5.1
2.5.2
2.5.3
Malaysia’s Political Economy
Corporate Governance Reforms in Malaysia
Regulatory Framework on Related Party Transactions (RPTs) in
Malaysia
65
67
77
2.6
CONCLUSION 79
CHAPTER THREE : FAMILY FIRMS AND MINORITY SHAREHOLDER
EXPROPRIATION
3.1 INTRODUCTION 80
3.2 FAMILY FIRMS 80
3.2.1 Definition of Family Firms 80
3.2.2 Family Firm Formation 82
3.2.3 Family Firm Characteristics 84
3.2.4 Family Business Groups 86
3.2.5 Family Businesses in Malaysia 88
3.3 MINORITY SHAREHOLDER EXPROPRIATION IN FAMILY FIRMS 90
3.3.1 Separation of Cash-flow Rights (Ownership Rights) to Control
Rights (Voting Rights)
90
3.3.2 Corporate Pyramidal Structures 92
3.3.3 Incentives for Corporate Pyramidal Structures To Be Used For
Expropriation
95
3.3.4 Private Objectives of Family Firms 97
3.3.5 Stock Market Abuses and Perception of Minority Shareholders in
Asia
98
3.3.6 Altruism of Family Owners 100
3.3.7 Lack of Firm Monitoring 101

viii
3.3.8 Information Asymmetry 102
3.3.9 Undiluted Private Benefits of Control 103
3.3.10 Opportunistic Investment 103
3.3.11 Reputational Effects in Family Firms 104
3.4 RELATED PARTY TRANSACTIONS (RPTs) 107
3.5 ROLE OF INDEPENDENT DIRECTORS 120
3.6 DOMESTIC BANKING RELATIONSHIP 126
3.7 MODERATING ROLE OF CONTROLLING SHAREHOLDERS’
OWNERSHIP
131
3.8 CONCLUSION 136
CHAPTER FOUR : THEORETICAL FRAMEWORK AND HYPOTHESES
DEVELOPMENT
4.1 INTRODUCTION 137
4.2 RESEARCH PARADIGM 137
4.3 THEORETICAL FRAMEWORK 138
4.4 HYPOTHESES DEVELOPMENT 142
4.4.1 Related Party Transactions (RPTs) 142
4.4.2 Independent Directors’ Tenure and Firm Value 148
4.4.3 The Number of Domestic Banks that the Firm Engages With 152
4.4.4 The Moderating Effects of Controlling Shareholders’ Ownership 156
4.5 CONCLUSION 161
CHAPTER FIVE : RESEARCH DESIGN AND METHODOLOGY
5.1 RESEARCH MODEL 162
5.2 MEASUREMENTS OF DEPENDENT VARIABLES AND INDEPENDENT
VARIABLES
165
5.2.1 Dependent Variable: Firm value 165

ix
5.2.2 Accounting-based Firm value Measurement 166
5.2.3 Market-Based Firm value Measurement 167
5.2.4 Independent Variables 169
5.2.4.1 Related Party Transactions (RPTs) 169
5.2.4.2 Independent Directors’ Tenure 169
5.2.4.3 Domestic Banks 170
5.2.4.4 Ownership Concentration 170
5.2.5 Control Variables 171
5.2.5.1 Firm Size 171
5.2.5.2 Firm Risk 172
5.2.5.3 Leverage 173
5.2.5.4 Independent Directors 174
5.2.5.5 Non-Affiliated Blockholders 175
3.6.5.6 Firm Age 175
3.6.5.7 Sales Growth 176
3.6.5.8 Research and Development (R&D) Expenditure 176
3.6.5.9 Capital Expenditure 176
3.6.5.10 Marketing and Advertising Expenditure 177
3.6.5.11 Gross Domestic Product 177
5.3 SAMPLE SELECTION 178
5.4 DATA ANALYSIS METHODS 181
5.5 ASSUMPTIONS OF STATISTICAL ANALYSIS 181
5.5.1 Independence of Observations and Variables 182
5.5.2 Normal Distribution, Homoscedasticity and No Serial Correlation 182
5.6 SELECTIONS IN THE POOLED DATA ANALYSIS 184

x
5.6.1 Model Selection Criteria 184
5.7 STATISTICAL ISSUES 186
5.7.1 Endogeneity Issues 186
5.7.2 Correlation Issues 198
5.7.3 Multicollinearity Issues 201
5.7.4 Normality Issues 203
5.8 ROBUSTNESS TEST 205
5.9 CONCLUSION 207
CHAPTER SIX : RESEARCH RESULTS
6.1 INTRODUCTION 208
6.2 THE R-SQUARED (R2) AND THE ADJUSTED R-SQUARED (R
2) 208
6.3 DESCRIPTIVE STATISTICS 209
6.4 RESEARCH FINDINGS 215
6.5 ROBUSTNESS TEST RESULTS 231
6.6 HYPOTHESES TESTED 249
6.7 SUMMARY OF HYPOTHESES 254
6.8 CONCLUSION 256
CHAPTER SEVEN : DISCUSSION AND CONCLUSION
7.1 INTRODUCTION 257
7.2 DISCUSSION: OVERVIEW OF THE FINDINGS 257
7.2.1 Research Objective 1
257
7.2.2 Research Objective 2 259
7.2.3 Research Objective 3 260
7.2.4 Research Objective 4 262
7.3 IMPLICATIONS OF FINDINGS 263

xi
7.4 RESEARCH SIGNIFICANCE 274
7.4.1 Theoretical Contributions 274
7.4.2 Policy Implications 277
7.5 LIMITATIONS OF RESEARCH 279
7.6 SUGGESTIONS FOR FUTURE RESEARCH 280
7.7 CONCLUSION 282
8.0 REFERENCES 284
9.0 APPENDICES 323
9.1 APPENDIX A
9.1.1 List Of Public-listed Companies Utilised In This Research 323
9.2 APPENDIX B
9.2.1 List Of Publications From This Thesis 335

xii
LIST OF FIGURES
Figure 2.1 Principal-principal Conflict vs Principal-agent Conflict 36
Figure 2.2 The Costs of Principal-Agent Conflict 37
Figure 2.3 The Costs of Principal-Principal Conflict 40
Figure 2.4 Corporate Governance Mechanisms Designed to Mitigate the
Principal-Agent Conflict
64
Figure 2.5 Major Corporate Governance Reforms in Malaysia 67
Figure 3.1 Example of a Corporate Pyramidal Structure in a Family
Group
94
Figure 3.2 Traditional Views on RPTs 113
Figure 3.3 RPTs under a Contingency Perspective 114
Figure 4.1 Theoretical Framework 141

xiii
LIST OF TABLES
Table 2.1 Concentration Of Family Control For 1996 and 2008 30
Table 2.2 Investor Protection & Corporate Governance (CG) Scores for
Eleven Asian Countries
33
Table 2.3 Principal-Agent Conflict versus Principal-Principal Conflict 42
Table 2.4 Corporate Governance Recommendations in Capital Market
Masterplan (2001)
73
Table 3.1 Cash-flow-to-Control Rights Ratio across Different Types of
Firms
91
Table 3.2 Classifications Of Related Party Transactions (RPTs) 108
Table 3.3 Disadvantages Of Related Party Transactions (RPTs) 112
Table 3.4 Summary of Past Key Research on Ownership Structure as a
Form Of Corporate Governance
133
Table 5.1 Family Firms and Non-Family Firms Sample 180
Table 5.2 Family Firms Regression Model (Tobin’s Q as dependent
variable)
185
Table 5.3 Non-Family Firms Regression Model (Tobin’s Q as dependent
variable)
185
Table 5.4 Pooled (Family and Non-family firms) Regression Model
(Tobin’s Q as dependent variable)
185
Table 5.5 Hausman Test Results To Test For Endogeneity (Family Firms) 194
Table 5.6 Hausman Test Results To Test For Endogeneity (Non-Family
Firms)
195
Table 5.7 Hausman Test Results To Test For Endogeneity (Pooled Model
of Family Firms and Non-Family Firms)
196

xiv
Table 5.8 Possible Endogeneity in Family Firms Regression Model 197
Table 5.9 Possible Endogeneity in Non-Family Firms Regression Model 197
Table 5.10 Possible Endogeneity in Pooled (Family Firms and Non-Family
Firms) Regression Model
197
Table 5.11 Rule Of Thumb for Interpreting The Size of a Correlation
Coefficient
198
Table 5.12 Correlation Matrix (Family Firms) 199
Table 5.13 Correlation Matrix (Non-Family Firms) 200
Table 5.14 VIF Values for Family Firms and Non-Family Firms 202
Table 5.15 VIF Values for Family Firms and Non-Family Firms (With
Predicted Ownership Concentration)
202
Table 5.16 Skewness And Kurtosis Values For Family Firms 204
Table 5.17 Skewness And Kurtosis Values For Non-Family Firms 204
Table 5.18 Exclusive Industries In Family Firms And Non-Family Firms 206
Table 6.1 Descriptive Statistics for Family Firms 209
Table 6.2 Descriptive Statistics for Non-Family Firms 210
Table 6.3 T-Test Results (2-Tail) To Compare The Variable Values Of
Family Firms And Non-Family Firms
211
Table 6.4 Actual Regression Results (Main Results): Normal OLS
Regression Pooled Model (Family Firms)
216
Table 6.5 Actual Regression Results (Main Results): Normal OLS
Regression Fixed Effects Model (Family Firms)
217
Table 6.6 Actual Regression Results (Main Results): Normal OLS
Regression Pooled Model (Non-Family Firms)
218
Table 6.7 Actual Regression Results (Main Results): Normal OLS 219

xv
Regression Fixed Effects Model (Non-Family Firms)
Table 6.8 Actual Regression Results (Main Results): Normal OLS
Regression Pooled Model (Family and Non-Family Firms)
220
Table 6.9 Actual Regression Results (Main Results): Normal OLS
Regression Fixed Effects Model (Family and Non-Family Firms)
221
Table 6.10 Summary of Research Results (Key
Variables)(Coefficients)(Family Firms)
222
Table 6.11 Summary of Research Results (Key
Variables)(Coefficients)(Non-Family Firms)
223
Table 6.12 Summary of Research Results (Key
Variables)(Coefficients)(Family and Non-Family Firms)
224
Table 6.13 Actual Regression Results (Main Results): Normal OLS
Regression Pooled Model (Family Firms)(Without Biased
Industries)
232
Table 6.14 Actual Regression Results (Main Results): Normal OLS
Regression Fixed Effects Model (Family Firms)(Without Biased
Industries)
233
Table 6.15 Actual Regression Results (Main Results): Normal OLS
Regression Pooled Model (Non-Family Firms)(Without Biased
Industries)
234
Table 6.16 Actual Regression Results (Main Results): Normal OLS
Regression Fixed Effects Model (Non-Family Firms)(Without
Biased Industries)
235
Table 6.17 Actual Regression Results (Main Results): Normal OLS
Regression Pooled Model (Family and Non-Family Firms)
236

xvi
(Without Biased Industries)
Table 6.18 Actual Regression Results (Main Results): Normal OLS
Regression Fixed Effects Model (Family and Non-Family Firms)
(Without Biased Industries)
237
Table 6.19 Summary of Research Results (Key
Variables)(Coefficients)(Family Firms) (Without Biased
Industries)
238
Table 6.20 Summary of Research Results (Key
Variables)(Coefficients)(Non-Family Firms) (Without Biased
Industries)
239
Table 6.21 Summary of Research Results (Key
Variables)(Coefficients)(Family and Non-Family Firms)
(Without Biased Industries)
240
Table 6.22 Summary Of Hypotheses Tested 255

xvii
LIST OF ABBREVIATIONS
RPTs Related Party Transactions
SC Securities Commission
MCCG Malaysian Code of Corporate Governance
VIF Variance Inflation Factor
CG Corporate Governance
ACGA Asian Corporate Governance Association
CFA Chartered Financial Analyst
CLSA Credit Lyonnaise Securities Asia
MSWG Minority Shareholder Watchdog Group
FRS Financial Reporting Standards
CMP Capital Market Master Plan
KLSE Kuala Lumpur Stock Exchange
KLSELR Kuala Lumpur Stock Exchange Listing Requirements
NEP New Economic Policy
NDP National Development Policy
EPU Economic Planning Unit
CCM Companies Commission of Malaysia
PDRM Royal Malaysian Police

1
CHAPTER ONE
OVERVIEW OF THESIS
1.1 INTRODUCTION
Most corporate governance discussions centre on the traditional shareholder-manager
problems generally referred to as Agency Problem Type I – principal-agent problem
(De Cesari, 2012) which is prevalent in widely held firms (Jensen and Meckling, 1976).
However, in firms controlled by one or more shareholders with large stakes (controlled
firms), the interests of the firms‘ controlling shareholders usually are not aligned with
the firms‘ minority shareholders. The consequence of this misalignment is that
corporate insiders possess incentives to pursue private benefits at the expense of outside
shareholders, which result in minority shareholder expropriation (De Cesari, 2012).
This is generally referred to as Agency Problem Type II – principal-principal problem.
In this scenario, the conflict is between principal (majority shareholder) and principal
(minority shareholder). The minority shareholder expropriation refers to the transfer of
resources out of a company to its controlling shareholder at the expense of minority
shareholders (Johnson, La Porta, Lopez-de-Silanes and Shleifer, 2000b). Minority
shareholder expropriation often occurs in countries with weak corporate governance
such as those in emerging markets where most firms are controlled by families and
ownership is highly concentrated (Claessens and Yurtoglu, 2012).
In these markets, family controlling shareholders assume control of most business
corporations (Ahlstrom, Chen and Yeh, 2010; Liu, Yang and Zhang, 2010) and they
possess the incentives to expropriate minority shareholders as well as depriving them
their right to appropriate returns on their investments (Cueto, 2013). This makes
family-controlled firms in emerging markets different from non-family firms due to the
tendency of family controlling shareholders to expropriate minority shareholders

2
(Bertrand, Mehta and Mullainathan, 2002; Peng and Jiang, 2010). Jiang and Peng
(2011) supported this assertion when they find that family firms tend to use certain
control structures associated with expropriation activities. Apart from the literature
which reasons that family firms in emerging markets are more prone to minority
shareholder expropriation, there are also studies which argue that within these markets,
expropriation in family firms can be reduced due to reputational effects. These studies
include Gomes (2000), Khanna and Palepu (2000) as well as Khanna and Yafeh (2007).
However, Peng and Jiang (2010) argue that in emerging markets, these effects are
deemed as a poor substitute for institutional deficiencies such as poor legal protection of
minority shareholders because even firms with good reputation have exploited minority
shareholders particularly during periods of financial crisis (Johnson, Boone, Breach and
Friedman, 2000a). Nevertheless, this line of reasoning is unconvincing because it does
not take into account the effect of corporate governance fiascos such as the Transmile1
case in Malaysia, which could have a strong reputational impact on the corporate
governance of family firms. For that reason, the argument that reputational effects are a
poor substitute for institutional deficiencies may not be valid.
Having considered the various arguments by academic scholars, this research examines
expropriation in Malaysian public-listed companies with attention given to family firms.
Malaysia is chosen as the country for analysis due to its high ownership concentration,
family ownership dominance as well as its weaker corporate governance compared with
developed economies (Liew, 2007). Furthermore, it is envisaged that there will be
negative firm value effects particularly in family firms in Malaysia as the highly
concentrated ownership structure encourages family controlling shareholders to
expropriate resources from their firms using related party transactions (RPTs).
1 In the Transmile case which occurred in early 2007, the firm‘s revenue was inflated in the financial statement (Securities
Commission, 2011c). This is a dent to the corporate reputation of family firms in this country as Transmile at that time is owned by the Kuok family which is one of the large family business groups in Malaysia.

3
An overview of this research is provided by this chapter. The discussion in this chapter
is organised as follows. Section 1.2 provides the background of this study. Section 1.3
discusses the problem statement, which highlight the research gaps in the corporate
governance literature related to expropriation. Section 1.4 discusses the research
objectives and research questions. Section 1.5 discusses the research hypotheses.
Section 1.6 discusses the significance of this research. Section 1.7 explains the
organisation of this study and Section 1.8 concludes the chapter.
1.2 BACKGROUND
Increasingly it appears that there is no ―one-size-fits-all‖ corporate governance model
which is relevant in all national contexts (La Porta, Lopez-de-Silanes, Shleifer and
Vishny, 1997, 1998; Lubatkin, Lane, Collin and Very, 2005). The predominant model
of corporate governance is a product of developed economies (primarily the United
States and United Kingdom), where efficient enforcement of arm‘s-length agency
contracts is prevalent (Peng, 2003). Also, in developed economies, because ownership
and control are often separated and legal mechanisms are available to protect owners‘
interests; such as the governance conflict that receives the major attention is the
principal-agent conflict between owners (principals) and managers (agents) (Jensen and
Meckling, 1976). On the other hand, in emerging economies, the institutional context
makes the enforcement of agency contracts more costly and problematic (North, 1990;
Wright, Filatotchev, Hoskisson and Peng, 2005). This results in the prevalence of
concentrated firm ownership (Dharwadkar, George and Brandes, 2000) especially by
families (Ahlstrom et.al., 2010; Heugens, Van Essen and Van Oosterhout, 2009; Liu
et.al., 2010; Peng and Jiang, 2010; Schulze and Gedajlovic, 2010; Zhang and Ma,
2009). Claessens, Djankov and Lang (2000a) finds that the largest ten families in
emerging markets such as Indonesia, Philippines and Thailand control half of the
corporate assets. Concentrated ownership coupled with absence of effective external

4
corporate governance mechanisms provide opportunities for controlling shareholders
especially from family groups to expropriate resources from their firms and indirectly
disadvantage the minority shareholders (Morck, Wolfenzon and Yeung, 2005). An
important consequence of minority shareholder expropriation is the reduction in firm
value (Barclay and Holderness, 1989; Bebchuk, 1999; Bebchuk, Kraakman and
Triantis, 1999; Claessens, Djankov, Fan and Lang, 1999b; Claessens, Djankov, Fan and
Lang, 2002; Dahya, Dimitrov and McConnell, 2008; Durnev and Kim, 2005; Grossman
and Hart, 1988; Harris and Raviv, 1988b; Lemmon and Lins, 2003; Lins, 2003;
McConnell and Servaes, 1990; Morck, Shleifer and Vishny, 1988; Zingales, 1994).
This reduction in firm value occurs because firms, which are expropriated by
controlling shareholders, engage in actions which provide private benefits to controlling
shareholders rather than enhancing overall shareholder value (Anderson and Reeb,
2003; Dahya et.al., 2008; La Porta, Lopez-de-Silanes and Shleifer, 1999; Lins, 2003;
Morck, Stangeland and Yeung, 2001; Shleifer and Vishny, 1997; Qian, Pan and Yeung,
2011).
Such actions include appointing unqualified friends or family members as senior
managers, engaging in self-beneficial trades, advancing family and political agendas
that hamper corporate performance and appropriating the profits of lower-tier firms in a
pyramid business group e.g.tunnelling (Chen, Li and Shapiro, 2011). These actions
usually occur in family-controlled firms because family owners possess the incentives
to engage in actions which are in their best interest but not necessarily in the best
interests of their minority shareholders who may not have any voice in firm governance
and only limited formal or informal means to protect their interests (Yoshikawa and
Rasheed, 2010).
The possibility of controlling shareholders expropriating minority shareholders and the
resulting reduction in the firm value had attracted the interests of numerous academic

5
scholars. Many studies have examined the indicators of minority shareholder
expropriation (Faccio, Lang and Young, 2001a; Jiang, Lee and Yue, 2010;
Krishnamurti, Sevic and Sevic, 2005; La Porta, Lopez-de-Silanes, Shleifer and Vishny,
2000a; Mitton, 2002; among others) as well as the likelihood of the existence of
expropriation (Djankov, La Porta, Lopez-de-Silanes and Shleifer, 2008; Johnson et.al.,
2000a; La Porta, Lopez-de-Silanes, Shleifer and Vishny, 1998; 2000b; Nenova, 2003;
among others). However, there is still limited evidence on the specific transactions
which controlling shareholders could use for minority shareholder expropriation, the
impact of independent directors‘ tenure on expropriation, the effect of the number of
domestic banks that the firm engages with on expropriation, the moderating effects of
ownership types (i.e. family and non-family ownership) on expropriation and whether
expropriation as well as the moderating effects of ownership on expropriation is
stronger in Malaysian family firms compared to non-family firms.
These studies are significant because the analysis on the specific transactions which
could be used for minority shareholder expropriation shows the real act of expropriation
whereas the impact of independent directors‘ tenure on expropriation shows the
effectiveness of independent directors as the firm‘s internal corporate governance
mechanism. In addition, the impact of the number of domestic banks that the firm
engages with on expropriation shows how the domestic banking channel could be
abused for expropriation purposes. Furthermore, the analysis of the moderating effects
of controlling shareholder‘s ownership on expropriation shows the effectiveness of
controlling shareholder‘s ownership as the firm‘s internal corporate governance
mechanism or as a source of entrenchment. The comparison of whether expropriation
as well as the moderating effects of ownership on expropriation is more prevalent in
Malaysian family firms or non-family firms shows the significance of these issues in
both types of firms. Therefore, in this study, I examine expropriation in public-listed

6
family firms, within the context of Malaysia. It is important to examine minority
shareholder expropriation within the context of the different institutional settings
(Aguilera and Crespi-Cladera, 2012) as the efficacy of corporate governance in a
particular country is strongly determined by its institutional context (Doidge, Karolyi
and Stulz, 2007). Malaysia provides an interesting emerging market setting to analyse
minority shareholder expropriation due to its high ownership concentration, dominance
of family ownership and weaker corporate governance compared with developed
economies (Liew, 2007)
1.3 PROBLEM STATEMENT
In most corporate governance studies, expropriation is indirectly inferred such as the
firm value effects of the separation of ownership and control rights of the firm‘s
controlling shareholder (i.e. the effect of its ratio of cash-flow rights over its control
rights towards firm value) (Claessens et.al., 2002; Krishnamurti et.al., 2005; Mitton,
2002; among others) as well as by the rate of dividends paid to shareholders (Faccio
et.al., 2001a; La Porta et.al., 2000a; among others). Furthermore, economists also
indirectly infer expropriation through the price paid for corporate control (Zingales,
1994; Dyck and Zingales; Nenova, 2003; Atanasov, 2005). Some studies even used the
legal system (in particular investor protection) to examine the likelihood of the
existence of expropriation in a particular country or region (Djankov et.al., 2008;
Johnson et.al., 2000a; La Porta et.al., 1998; 2000b; among others).
While these studies have generally suggested the existence of expropriation, they do not
identify specific types of transactions that could be used by controlling shareholders to
expropriate resources from their firms. Furthermore, the firm value effects of these
transactions have not been widely examined (Jiang, Lee and Yue, 2010). This study
examines a particular type of transaction that could be used for that purpose (i.e. related

7
party transactions (RPTs) which are likely to result in expropriation) and their firm
value effects. The extant literature only provides limited evidence with respect to this
i.e. Cheung, Rau and Stouraitis (2006), Cheung, Jing, Lu, Rau and Stouraitis (2009) and
Peng, Wei and Yang (2011). In addition to that, their studies only focussed on the
market reaction (market valuation) to the announcement of RPTs which are likely to
result in expropriation (i.e. what they conduct are event studies) (Cheung et.al., 2006;
Cheung et.al., 2009; Peng et.al., 2011). However, the timeframe that they used to gauge
the market reaction is within a maximum range of twenty days (i.e. maximum days
before the announcement and maximum ten days after the announcement). The
weaknesses of such studies are that their results do not provide a comprehensive
understanding of the firm value effects. Event studies deal with the change around the
status i.e. usually within a short timeframe surrounding the event that occurred
(MacKinlay, 1997).
In the context of expropriation studies, event studies are not entirely suitable as firm
value effects should not just be measured within a short timeframe (only days)(Cheung
et.al., 2006; Cheung et.al., 2009; Peng et.al., 2011) but in years as expropriation by
controlling shareholders can exist for years within their firms as demonstrated by the
findings of Faccio et.al. (2001a), Krishnamurti et.al. (2005), La Porta et.al. (2000a),
Mitton (2002), among others. Hence, a regression of firm value effects that cover
several years will provide a clearer picture of the relationship between RPTs which are
likely to result in expropriation and firm value. Panel regression will provide a clearer
indication of the existence of controlling shareholders‘ expropriation as it focuses on the
progress and allows observation of the change of a particular variable over a period of
time and it can provide a detectable change on that variable as the process involves
repeated measurements of that same variable over time (Diggle, Liang and Zigger,
1994; Rajulton, 2001). This research examines the firm value effects of RPTs which

8
are likely to result in expropriation using an approach which analyse a period of a few
years (i.e. 3 years) rather than an event study approach.
In order to reduce the usage of RPTs by controlling shareholders for expropriation,
board oversight is important. As such, an independent director is a significant internal
corporate governance mechanism for monitoring expropriation activities (OECD,
2009). However, there are certain problems related to the monitoring function of
independent directors. Their impartiality in executing their duties may be affected by
their tenure as their independence are very likely to be compromised when their tenure
increase2. As the tenure of the independent directors increase, controlling shareholders
particularly those from family firms, possess the incentives to exert influence on the
independent directors in order to expropriate resources from their firms; hence, reducing
firm value (Anderson, Mansi and Reeb, 2004; Lin, Piotroski, Tan and Yang, 2011b;
Securities Commission, 2011a; Yunos, Smith, Ismail and Ahmad, 2011). As a result,
the social cohesion between controlling shareholders and the independent directors will
increase (Westphal, 1999) which consequently contributes to expropriation by the
former (Anderson et.al., 2004; Lin et.al., 2011b; Securities Commission, 2011a; Yunos
et.al., 2011).
On the other hand, within the context of the corporate governance problems that occur
in Malaysia; independent directors‘ tenure may also have a positive impact on firm
value. This possibility could arise in the post-Transmile period. During this period,
reputational considerations come into play as independent directors of family firms
want to preserve the corporate reputation of their firms (Oh, 2011). Independent
directors want good corporate reputation because poor reputation may lower their future
employment prospects with non-family firms (Othman and Rahman, 2010). Hence, as
2 In fact, the Malaysian Code of Corporate Governance (MCCG) 2012 proposes to limit independent directors‘ tenure to a
maximum of nine years (Part 3, Para. 3.3).

9
their tenure increases, they may fully utilise their experiences and skills gained to add
value to their firms in order to maintain the company‘s reputation.
Despite the possibility of a negative or a positive effect of independent directors‘ tenure
on firm value, the extant corporate governance literature provides very limited empirical
evidence on issues related to the effects of board tenure. Previous research only
documented evidence with respect to the effects of independent directors‘ tenure on
CEO compensation (Vafeas, 2003), timeliness of corporate internet reporting
(Abdelsalam and El-Masry, 2008) and earnings management (Liu and Sun, 2010).
Hence, it would be interesting to examine the firm value effects of independent
directors‘ tenure, as this would contribute to the corporate governance literature.
Despite the corporate reputational effects on independent directors of family firms, I
expect independent directors‘ tenure particularly those from family firms to have a
negative impact on firm value in Malaysia as this is in line with the proposal in the
Malaysian Code of Corporate Governance (MCCG) 2012 to limit the tenure to a
maximum nine years.
Although independent directors can be considered a significant internal corporate
governance mechanism to reduce expropriation; there are also other potential internal
corporate governance mechanisms which can be considered. One such mechanism is
ownership concentration. However, the corporate governance implication of
concentrated ownership by different types of owners such as family owners, state
owners, foreign owners, etc is a relatively unexplored area (Cascino, Pugliese,
Mussolino and Sansone, 2010; Holderness and Sheehan, 1988; Short, 1994). The
existing corporate governance literature only provides limited empirical evidence on the
moderating effects of ownership types (family vs non-family) on expropriation
(Iskandar, Bukit and Sanusi, 2012; Yoshikawa and Rasheed, 2010). Iskandar et.al.
(2012) show the significance of the moderating effects of foreign and managerial

10
ownership on expropriation. Yoshikawa and Rasheed (2010) demonstrate that bank and
foreign ownership play a significant role in moderating expropriation. However, these
studies did not examine the moderating effects of controlling shareholders‘ ownership
on the relationship between RPTs, independent directors‘ tenure and the number of
domestic banks that the firm engages with, against firm value as they only generally
demonstrate the significance of the different types of ownership in moderating
expropriation.
It is important to analyse the moderating effects of controlling shareholders‘ ownership
because theoretically, there are two possible implications of concentrated ownership.
Morck et.al. (1988) argue that controlling shareholders respond to two opposing forces
and that the moderating effect of concentrated ownership depends on which force
dominates. The opposing forces work in the following way. Controlling shareholders‘
natural tendency is to allocate the firm‘s resources in their own best interests, which
may conflict with the interests of the minority shareholders. This is called the
entrenchment effect of controlling shareholders. However, as their ownership increases,
their interests could also be likely to coincide more closely with those of minority
shareholders. This is called the incentive alignment effect (Jensen and Meckling, 1976).
The first of these forces has a negative moderating effect whereas, the second has a
positive effect (Morck et.al., 1988).
However, within the context of the unique institutional setting as well as the corporate
governance issues in Malaysia, it is argued that the explanations of these moderating
effects are somewhat different. Contrary to the assertions by Morck et.al. (1988), it is
argued that in Malaysian family firms, controlling shareholders‘ ownership may have a
positive moderating effect when their ownership increases. This is likely to occur in the
post-Transmile period as investors confidence on family firms was shattered following
the Transmile episode (Song, 2010). When family controlled shareholders‘ ownership

11
increases, they possess higher ownership of their firms‘ equity. Since, they own more
of their firms‘ equity; their incentives to preserve corporate reputation and to reduce
expropriation are higher because poor corporate reputation can affect them as well as
their family members (Gomez, 1999; Loy, 2010). As a result, this corporate
reputational effect helps align the incentives of controlling shareholders to the minority
shareholders when ownership of controlling shareholders increases (Loy, 2010).
Therefore, it would be interesting to empirically analyse the positive moderating effects
of family controlling shareholders‘ ownership on expropriation in Malaysia. This
analysis will verify the prediction made as well as contribute to the corporate
governance literature.
Apart from the internal corporate governance mechanisms, external corporate
governance mechanisms such as bank monitoring may also play a role in firm
governance. Most studies of bank monitoring are associated with syndicated loans,
focusing more on the information asymmetry between the lead bank with the syndicated
participants (Dennis and Mullineaux, 2000; Lee and Mullineaux, 2004; Champagne and
Kryzanowski, 2007; Sufi, 2007). However, these studies did not test the strength of the
monitoring role of banks in corporate governance in which the strength is measured by
the number of banks that the firm engages with (Fan, Wei and Xu, 2011; Hermawan and
Dina, 2011). Theoretically, an increase in the number of banks that the firm engages
with may render the bank monitoring function to become ineffective (Hermawan and
Dina, 2011). This is because when a company deals with many banks as its source of
debt financing, each bank might rely on the other banks to do the monitoring function
on their borrowers and does not do the monitoring on their own. This may allow
controlling shareholders to engage in opportunistic behaviours such as loan
expropriation (Hermawan and Dina, 2011). The empirical evidence with regards to this
is limited. Hermawan and Dina (2011) find that an increase in the number of banks that

12
the firm engages with reduces firm value. However, their study did not segregate the
banks into domestic and foreign categories. The strength of monitoring in domestic
banks may be different from foreign banks within certain institutional contexts
(Thillainathan, 1999). The extant literature provides limited evidence on the strength of
domestic bank monitoring.
Only Fok, Chang and Lee (2004) provide some evidence with regards to this by
analysing the relationship between the number of domestic banks that the firm engages
with and firm value in Taiwan. Since, the strength of monitoring in domestic banks is
dependent upon its institutional context (Thillainathan, 1999), it can be argued that the
institutional setting in Taiwan has a strong effect on the results obtained by Fok et.al.
(2004). The generalisability of their results can be debated because the institutional
setting in Taiwan may not be the same as other countries. For example, the level of
investor protection in Taiwan is not the same as common law countries or French-civil-
law countries because German origin laws are used in Taiwan (La Porta et.al., 1998).
As a result, it can be argued that the findings by Fok et.al. (2004) are contextual by
nature. Since, contextual findings are important in expropriation studies (Aguilera and
Crespi-Cladera, 2012), it is important to analyse these effects in Malaysia.
Furthermore, another unique institutional feature in Malaysia is the existence of bank-
directed lending in the domestic banking system (Ang, 2009; Ang and Sen, 2011;
Economic Planning Unit, 1981, 2001, 2006, 2011) which further increases the
significance of conducting such a study in the Malaysian context. Due to the existence
of bank-directed lending within the domestic banking system, controlling shareholders
particularly those from family firms may expropriate the loans obtained from these
domestic banks as debt provide incentives for expropriation in emerging markets
(Faccio, Lang and Young, 2001c). They can also obtain these loans without proper
scrutiny (Bhattacharya, 2001; Laeven, 1999; Perera, 2011; Sharma, 2001; Thillainathan,

13
1999). Moreover, the more domestic banks are engaged by the firm, the more loans the
firm can obtain via bank-directed lending (IMF, 1998; Kroszner, 1998; Kwack, 2000;
Oh, 1998; Perera, 2011; Sharma, 2001; Thillainathan, 1999). Hence, if the firm engages
more domestic banks for financing purposes, the more loans the controlling shareholder
may expropriate via bank-directed lending and as a result, firm value may be reduced.
Therefore, it would be interesting to analyse the firm value effects due to the number of
domestic banks that Malaysian firms engages with in particular, family firms.
Despite the previous arguments, the extant literature only provides limited empirical
evidence as to whether expropriation and the positive moderating effects of controlling
shareholders‘ ownership on expropriation is more prevalent in family firms or among
non-family firms in the context of the Malaysian institutional setting. So far, only
Munir and Gul (2011) and Munir and Salleh (2010) provide some evidence about this
assessment. However, their studies do not assess the relevance of expropriation with
respect to the impact of expropriation against the independent directors‘ tenure and the
strength of domestic bank monitoring. The relevance of the positive moderating effect
of controlling shareholders‘ ownership on expropriation is not assessed as well.
Besides, it is likely that the potential negative relationships between RPTs (which are
likely to result in expropriation), independent directors‘ tenure and the number of
domestic banks that the firm engages with, may result in firm value which is higher
among family firms compared with non-family firms. This is because family owners
possess private objectives which can result in actions which advance their family
welfare at the expense of minority shareholders (Schulze, Lubatkin, Dino and Bucholtz,
2001). Furthermore, it is also likely that the positive moderating effect of controlling
shareholders‘ ownership on expropriation is stronger in family firms due to the
corporate reputational effects as predicted previously. Hence, it is timely to investigate
empirically the incidence of expropriation and observe whether the relationship between

14
expropriation and firm value is stronger among firms with controlling shareholders‘
ownership (family firms) than non-family firms in Malaysia.
1.4 RESEARCH QUESTIONS AND RESEARCH OBJECTIVES
Considering the limited evidence and research gaps as discussed in the previous section
as well as the argument that reduction in firm value is an indicator of minority
shareholder expropriation (Barclay and Holderness, 1989; Bebchuk, 1999; Bebchuk
et.al., 1999; Claessens et.al., 1999b; Claessens et.al., 2002; Dahya et.al., 2008;
Grossman and Hart, 1988; Harris and Raviv, 1988b; Lemmon and Lins, 2003; Lins,
2003; McConnell and Servaes, 1990; Morck et.al., 1988; Zingales, 1994); the research
questions can be broadly categorised into four parts as discussed below :
Part I
Is there a negative relationship between:-
1) related party transactions (RPTs) (which are likely to result in expropriation) and
firm value in Malaysian firms?
2) independent directors‘ tenure and firm value in Malaysian firms?
3) the number of domestic banks that the firm engages with and firm value in
Malaysian firms ?
Part II
If there is a negative relationship between:-
4) the related party transactions (RPTs) (which are likely to result in expropriation)
and firm value in Malaysian firms, is this negative relationship stronger in
family firms compared to non-family firms?

15
5) the independent directors‘ tenure and firm value in Malaysian firms, is this
negative relationship stronger in family firms compared to non-family firms?
6) the number of domestic banks that the firm engages with and firm value in
Malaysian firms, is this negative relationship stronger in family firms compared
to non-family firms?
Part III
Is there a positive moderating effect of controlling shareholders‘ ownership on the
relationship between:-
7) the related party transactions (RPTs) (which are likely to result in expropriation)
and firm value in Malaysian firms?
8) the independent directors‘ tenure and firm value in Malaysian firms?
9) the number of domestic banks that the firm engages with and firm value in
Malaysian firms?
Part IV
If there is a positive moderating effect of controlling shareholders‘ ownership on the
relationship between the related party transactions (RPTs) (which are likely to result in
expropriation) and firm value, the independent directors‘ tenure and firm value and the
number of domestic banks that the firm engages with and firm value in Malaysian
firms; are these positive moderating effects stronger in family firms compared to non-
family firms ?
16
In summary, the research objectives of this study are to find out the following:
1. Whether there is a negative relationship between related party transactions
(RPTs) (which are likely to result in expropriation) and independent directors‘
tenure, the number of domestic banks that the firm engages with, and firm value
in Malaysian firms.
2. If there is a negative relationship between related party transactions (RPTs) (that
are likely to result in expropriation), and independent directors‘ tenure, the
number of domestic banks that the firm engages with, and firm value in
Malaysian firms; is this negative relationship stronger among family firms
compared to non-family firms.
3. Whether, there is a positive moderating effect of controlling shareholders‘
ownership on the relationship between related party transactions (RPTs) (which
are likely to result in expropriation) and independent directors‘ tenure, the
number of domestic banks that the firm engages with, and firm value in
Malaysian firms.
4. If there is a positive moderating effect of controlling shareholders‘ ownership on
the relationship between related party transactions (RPTs) (which are likely to
result in expropriation) and independent directors‘ tenure, the number of
domestic banks that the firm engages with, and firm value in Malaysian firms; is
this positive moderating effect stronger among family firms compared to non-
family firms.

17
1.5 SIGNIFICANCE OF STUDY
There are several theoretical contributions emanating from this research. First, this
research provides a new perspective to agency theory by showing that corporate
reputational effects help mitigate minority shareholder expropriation in Malaysian
family firms even during the period of the global financial crisis which started in 2008
through the positive moderating effects of controlling shareholders‘ ownership on
expropriation via RPTs and through the positive moderating effects of controlling
shareholders‘ ownership on expropriation due to long tenure of independent directors
(only in Malaysian family firms in exclusive industries). Hence, the argument by Peng
and Jiang (2010) that reputational effects is a poor substitute for weak minority
shareholder protection in emerging markets can be disputed. Second, the significant
negative relationship between independent directors‘ tenure and firm value in Malaysian
family firms only in exlusive industries shows that the assumptions of agency theory
with respect to the positive effects of having independent directors working in firms; do
not hold within family firms in exclusive industries in emerging markets. Third, this
research also contributes to the theory of ownership structure by showing that
controlling shareholders‘ ownership has a significant positive moderating effect on
expropriation via RPTs in family firms as well as on expropriation due to long tenure of
independent directors (only in family firms in exclusive industries). The contribution to
the theory of ownership structure is also shown by the results of the significant negative
moderating effect of controlling shareholders on the relationship between RPTs which
are like to result in expropriation and firm value as well as between the number of
domestic banks that the firm engages with and firm value, in non-family firms.
18
1.6 SUMMARY OF RESEARCH RESULTS AND IMPLICATIONS OF
RESEARCH RESULTS
Generally, the conclusions derived from the research results in this study consider a
limitation of this research where the accounting-based performance measures may be
subject to management manipulation (Chakravarthy, 1986; Lubatkin and Shrieves,
1986; Purkayastha, 2013) which result in higher sensitivity of market-based
performance measures towards Agency Problem Type II (principal-principal conflict) as
well as contradictory significant research results between market-based and accounting-
based performance measures. The contradictory research results in this study will not be
considered as significant findings because the study that is conducted is conclusive
research. Therefore, only conclusive evidence which are robust against all the
performance measures utilised or only restricted to one particular performance measure
are accepted as significant findings in this type of research (Saunders, Lewis and
Thornhill, 2009; Singh, 2007).
With consideration of this limitation, basically, in the Malaysian context, this research
shows that minority shareholder expropriation do exist in family and non-family firms.
In family firms, minority shareholder expropriation occurs through RPTs as well as due
to long tenure of independent directors. In non-family firms, expropriation occurs as a
result of the negative moderating effect of controlling shareholders‘ ownership on the
firm value effects of RPTs as well as on the firm value effects of the number of
domestic banks that the firm engages with. Likewise, it is found that minority
shareholder expropriation through RPTs is stronger in family firms compared to non-
family firms. Furthermore, in family firms in exclusive industries, minority shareholder
expropriation occurs due to the long tenure of independent directors but it cannot be
proven whether this expropriation is stronger in family firms or non-family firms. On
the other hand, in family firms, corporate reputational effects after the Transmile

19
scandal help reduce minority shareholder expropriation through RPTs as well as
expropriation due to long tenure of independent directors through the moderating effects
of controlling shareholders‘ ownership. Basically, this study shows us that there is a
need for the relevant authorities in this country i.e. the Securities Commission (SC) to
seriously incorporate minority shareholder protection in future issuance of Codes of
Corporate Governance as the current Malaysian Code of Corporate Governance
(MCCG) 2012 does not incorporate this protection in its code. Furthermore, the current
MCCG 2012 which sets the limit of the tenure of independent directors to 9 years ought
to be continued in future codes issuance as it is shown in this research, that long tenure
of independent directors are detrimental to the interests of minority shareholders.
1.7 ORGANISATION OF THIS STUDY
This thesis is divided into seven chapters. Chapter one provides an overview of the
thesis by introducing the research topic, background of study, problem statement,
research questions, research objectives, hypotheses used and the significance of its
contribution. Chapter two discusses the literature related to agency problems, ownership
structure and control, legal protection of minority shareholders, corporate governance
mechanism and the Malaysian institutional setting. Chapter three discusses the
expropriation in family firms, RPTs in family firms, independent directors in family
firms, the banking relationship of family firms and the moderating role of controlling
shareholders‘ ownership. Chapter four discusses philosophical paradigm, theoretical
framework and hypotheses development. Chapter five discusses the research model,
variable measurements, sampling design and the data analysis techniques used in this
research. Whilst in Chapter six, the discussion is focussed on the descriptive statistics,
research results, conclusions, endogeneity issues, multicollinearity issues and robustness
checks. Finally, Chapter seven discusses the summary of the findings by hypotheses,

20
implications of these findings, theoretical contributions, policy implications, limitations
in this research as well as suggestions for future research.
1.8 CONCLUSION
This chapter has introduced the thesis by outlining the topic of this research, the
background of study, the problem statement, the research questions and the objectives,
the hypotheses examined, the research significance and a brief summary of the research
results and its implications. The next chapter discusses the relevant literature related to
this research which provide the background and foundation for issues related to
expropriation. In addition, the institutional setting in Malaysia is discussed as well.

21
CHAPTER TWO
THE MALAYSIAN INSTITUTIONAL ENVIRONMENT,
OWNERSHIP STRUCTURE AND MINORITY SHAREHOLDER
EXPROPRIATION
2.1 INTRODUCTION
The main aim of this chapter is to explain the Malaysian institutional environment as
well as explain issues of ownership structure and how it relates to minority shareholder
expropriation.
The rest of the discussions in this chapter is organised as follows. Section 2.2 discusses
the definition of corporate governance. Section 2.3 discusses the literature on agency
problems, ownership structure & control and legal protection of minority shareholders.
Section 2.4 discusses the corporate governance mechanisms available to mitigate
agency problems. Section 2.5 discusses the Malaysian institutional setting.
2.2 CORPORATE GOVERNANCE
Corporate governance is very significant for a firm to succeed and for gaining trust from
investors and the public generally. Besides that, effective corporate governance can
boost market confidence and sustain both economic and social stability (Ibrahim, 2009).
McKinsey (2000) conducted a survey and finds that ASEAN investors show
appreciation for those companies which ensure protection of minority shareholder rights
and they are willing to pay a valuable premium to purchase shares in well governed
firms. As a result, an efficient corporate governance system is required for the firm‘s
success and overall market stability (OECD, 2004, 2011).

22
2.2.1 Definitions of Corporate Governance
The definition of corporate governance is very subjective. There are various definitions
of corporate governance, each in line with the field of research in which they are
committed. Blair (1995) argues that corporate governance should be defined in a
broader context, which takes into consideration the business environment, social culture
and political framework. Therefore, he defines corporate governance as:
―The whole set of legal, cultural and institutional arrangements that determines
what publicly traded corporations can do, who controls them, how that control is
exercised, and how the risks and returns from the activities they undertake are
allocated‖
(Blair, 1995, p.3)
In the United Kingdom (UK), corporate governance is defined as the system to direct
and control a company as described by the Cadbury Committee on the financial aspects
of corporate governance (MacMillan and Downing, 1999). In sequence, the
Organisation for Economic Co-operation and Development (OECD) Principles of
Corporate Governance (1999) improves the view of corporate governance with a sound
set of relationships between the firm‘s board, shareholders and stakeholders:
―Corporate governance is the system by which business corporations are
directed and controlled. The corporate governance structure specifies the
distribution of rights and responsibilities among different participants in the
corporation, such as the board, managers, shareholders and other stakeholders,
and spells out the rules and procedures for making decisions on corporate affairs.
By doing this, it also provides the structure through which the company
objectives are set, the means of attaining those objectives and monitoring
performance.‖

23
(OECD, 1999)
Basically, the OECD principles concentrate on five items which are the rights of
shareholders, fair treatment to shareholders, role of stakeholders, transparency and
responsibility of the board members. As such, the shareholders look forward to a well
maintained management since they place their trust in firms to use their invested funds
in an appropriate manner (OECD, 1999).
On the other hand, The Malaysian High Level Finance Committee on Corporate
Governance defines corporate governance as:
―The process and structure used to direct and manage the business and affairs of
the company towards enhancing business prosperity and corporate
accountability with the ultimate objective of realising long term shareholder
value, whilst taking into account the interests of other stakeholders‖.
(Finance Committee of Corporate Governance, 1999, p.52)
This definition indicates that corporate governance is concerned about both internal and
external controls. The board‘s structure and the relationship with both shareholders and
stakeholders are also taken into account in well organised governance. Furthermore,
internal and external governance mechanisms are also taken into consideration. The
internal mechanism of main interest are the Board of Directors and the ownership
structure of the companies, while the main external mechanisms are the external market
for corporate control like the takeover market and the legal system (Cremers and Nair,
2004). Well monitored governance mechanisms can enhance the corporate governance
stability, thus increase a firm‘s productivity as well as the overall economy.
Furthermore, from the finance perspective, corporate governance is defined as the ways
in which suppliers of funds to firms assure themselves of obtaining a return on their

24
investment (Shleifer and Vishny, 1997). An entrepreneur or a manager raises funds
from investors either to productively use them or to cash out his holdings in the firm.
The financiers need the managers‘ expertise to generate returns on their investments.
The manager needs the financiers‘ investments, since he either does not possess
sufficient capital of his own to invest or else wants to cash out his holdings. One
interesting and significant question that arises is, how can financiers be assured that
they obtain returns on their investments? The agency problem in this context refers to
the difficulties financiers have in assuring that their investments are not expropriated or
wasted on unproductive projects (Shleifer and Vishny, 1997).
To resolve this problem, the financiers and the manager sign a contract which specifies
what the manager does with the funds, and how the returns are divided between him and
the financiers. Ideally, they would sign a complete contract, which specifies exactly
what the manager does in all states of the world and how the profits are distributed. The
difficulty in this process is that most future contingencies are hard to describe and
predict, and as a result, complete contracts are technically infeasible (Shleifer and
Vishny, 1997). Due to the problem of incomplete contracts, the manager and the
financier have to allocate the residual control rights which are the rights to make
decisions in situations not fully foreseen by the contract (Grossman and Hart, 1986;
Hart and Moore, 1990). In principle, the financiers could invest in the firm if only they
retain all the residual control rights. Anytime something unexpected occurs, they get to
decide what to do. However, this approach is too idealistic, for the simple reason that
the financiers are not qualified or sufficiently informed to decide what to do as this is
the very reason they hired the manager in the first place. As a result, the manager ends
up with substantial residual control rights and therefore, discretion to allocate funds as
he chooses. There may be limits on this discretion specified in the contract and much of

25
corporate governance deals with these limits but the fact is that managers do possess
most of the residual rights (Shleifer and Vishny, 1997).
In reality, the situation is more complicated. First, the contracts that the managers and
investors sign cannot require too much interpretation if they are to be enforced by
outside courts. In the United States (USA), the role of the courts is more extensive than
anywhere else in the world, but even the so-called business judgment rule keeps the
courts out of the affairs of companies. In much of the rest of the world, courts only get
involved in massive violations by investors‘ rights such as erasing shareholders‘ names
from the register, etc. Second, in the cases where financing requires collection of funds
from many investors, these investors themselves are often small and too poorly
informed to exercise even the control rights that they actually possess. Furthermore, the
free rider problem encountered by individual investors makes it uninteresting for them
to learn about the firms they have financed, or even to participate in the governance. As
a result, the effective control rights of the managers and hence, the room they have for
discretionary allocation of funds end up being excessive than they would have been if
courts or investors became actively involved in detailed contract enforcement (Shleifer
and Vishny, 1997).
The outcome of this is that managers end up with significant control rights
(discretionary rights) over how to allocate investors‘ funds. They can expropriate these
funds and in many pyramid schemes, for example, the organisers abscond with the
money. Managerial expropriation of funds can also take more complicated forms than
just taking the cash out, such as transfer pricing. As a consequence of the opportunistic
behaviours of managers due to the possession of significant control rights, agency
problems arise. The agency problem that arises here is between the principal (investor)
and the agents (managers). This problem is called the Principal-Agent Problem or
generally referred to as Agency Problem Type I (Shleifer and Vishny, 1997).

26
2.3 AGENCY PROBLEMS, OWNERSHIP STRUCTURE & CONTROL AND
LEGAL PROTECTION OF MINORITY SHAREHOLDERS
2.3.1 Agency Problem: The Principal-Agent Conflict (Agency Problem Type I)
Traditionally, agency problems involve the relationship between the principal and the
agent (Jensen and Meckling, 1976). Jensen and Meckling (1976) define this agency
relationship as a contract in which one party (the principal) provides another party (the
agent) the decision-making authority to perform some service on its behalf. In the
classical principal-agent problem, professional managers assume the role of the agent
who acts on behalf of the company‘s shareholders (the principal). The basic agency
problem arises when the interests of the professional managers and the company‘s
shareholders are not aligned. This misalignment of interests occurs as a result of the
separation between decision-making, which is carried out by professional managers, and
the bearing of residual risk by shareholders (Clacher, Hillier and McColgan, 2010).
This separation of ownership and control provide managers with the power to control
the firm. Due to their controlling power, managers possess the incentives to realise
private benefits of control that are unavailable to the firm‘s shareholders. When
managers derive private benefits from the firm, they are not acting in the best interest of
the shareholders. The latter want to see their investment returns maximised and not
their firm investments being expropriated by managers (Clacher et.al., 2010). Jensen
and Meckling (1976) argue that this inefficiency is reduced with the increase of
managerial incentives to make value-maximising decisions so that the interests of
professional managers are more aligned with those of shareholders. Clacher et.al.
(2010) further argue that agency costs arise because providing managers with the
appropriate incentives to act in the best interest of company shareholders imposes costs
on the principals. This cost can be seen as the value loss to shareholders arising from the

27
cost of minimising divergence of interest between company shareholders and corporate
managers (Clacher et.al., 2010).
In developed economies such as United States (USA), this principal-agent problem or
Agency Problem Type I receive major attention because in these economies, often there
is separation of ownership and control as well as legal mechanisms exist to protect
owners‘ interests (Jensen and Meckling, 1976; Young, Peng, Ahlstrom, Bruton and
Jiang, 2008). However, this is not the norm for most countries across the world outside
USA, where family groups own and control many firms (Clacher et.al., 2010). There is
also no effective and predictable rule of law that protect investors (Dharwadkar et.al.,
2000; Mitton, 2002). The difference is further elaborated next.
2.3.2 Ownersip Structure & Control And Legal Protection Of Minority
Shareholders: International Evidence
2.3.2.1 Ownership Structure & Control outside United States (USA)
One of the major differences between developed economies such as USA and the rest of
the world lies in terms of ownership structure and control. Traditionally, the literature
on the role and function of modern firm is based on the assumption of the prevalence of
widely dispersed ownership (Claessens et.al., 1999b). In widely dispersed firms, the
control over companies is being transferred to professional managers (Claessens et.al.,
1999b). This assumption is applicable to countries like USA as the corporate
governance literature concluded that almost half of large American firms are widely
held (Claessens et.al., 1999b). This assumption has also been propagated by Baumol
(1959), Jensen and Meckling (1976) and Grossman and Hart (1980), among others.

28
However, a subsequent line of the empirical literature finds results, which go against
this traditional assumption (Claessens et.al., 1999b). La Porta et.al. (1999) finds a huge
concentration of ownership in countries outside USA. La Porta et.al. (1999) is one of
the pioneering studies which investigates the significant issue of ultimate control i.e.
they trace the chain of ownership to find who has the most voting rights. Their findings
suggest that ownership is largely concentrated in the hands of families and the state
particularly in emerging markets. The study by La Porta et.al. (1999) presented a
different picture of the ownership structure of a modern corporation than that suggested
by Berle and Means and which is widely accepted in the finance literature. The Berle
and Means widely held firms is only common for large firms in the richest common law
countries such as USA. Outside USA, particularly in countries with poor shareholder
protection, even the largest firms tend to possess controlling shareholders. Sometimes,
the controlling shareholder is the State but more often, it is a family, usually the founder
of the firm or his descendants (La Porta et.al., 1999).
La Porta et.al. (1999) further find that the controlling shareholders in countries outside
USA typically have high control over firms in excess of their cash-flow rights
(ownership rights). This is so because they often control large firms through pyramidal
structures and in part because they manage the firms they control. As a result, large
firms particularly in emerging markets have a problem of separation of ownership and
control. These firms are run not by professional managers without equity stakes who
are unaccountable to shareholders, but by controlling shareholders. These controlling
shareholders are ideally placed to monitor the management, and in fact, the top
management is usually part of the controlling family. As a result, they possess the
power to expropriate minority shareholders. Generally, the findings by La Porta et.al.
(1999) reflects the negative impact of huge control by controlling shareholders
particularly in emerging markets.

29
Claessens et.al. (1999b) further investigates ultimate control patterns in 2,980 publicly
traded firms in nine East Asian countries (i.e. Hong Kong, Indonesia, Japan, South
Korea, Malaysia, Philippines, Singapore, Taiwan and Thailand). They find large family
control within more than half of East Asian firms (Claessens et.al., 1999b). They also
find that smaller firms in East Asia are more likely to be family-controlled, as are older
firms. In many East Asian countries, control is enhanced through pyramid structures,
deviations from one-share-one-vote rules, and voting rights exceeding cash-flow rights
(Claessens et.al., 1999b). Separation of management from ownership control is rare and
management of two-third of firms, which are not widely held, is related to the family of
the controlling shareholder (Claessens et.al., 1999b). Since, the 1996 statistics by
Claessens et.al. (2000a), there has been relatively little change to the ownership
structure and control in East Asia. Carney and Child (in press) finds that for the year
2008, family control remains the most dominant form of ownership across East Asia,
though widely held firms dominate in Japan and Taiwan and is substantial in both South
Korea and Thailand. The Philippines has witnessed the largest increase in family-
controlled firms, while Taiwan has undergone the largest decline.
Basically, the separation of ownership and control has undergone little change from
1996 to 2008 for the East Asian region as a whole and remains highest among family-
controlled firms (Carney and Child, in press). Furthermore, it shows among firms with
a dominant family owner, the average number of firms belonging to a single family or
the top families has also remained relatively stable over time when looking at East Asia
in the aggregate, although changes have occurred for individual countries. For example,
family control has increased substantially in South Korea from an average of 1.61 firms
per family in 1996 to 3.22 in 2008. Hong Kong and the Philippines, by contrast, have
shown the largest declines, from 1.92 for Hong Kong in 1996 to 1.33 in 2008, and 2.42
for the Philippines in 1996 to 1.69 in 2008 (Carney and Child, in press). On average,

30
the number of family firms from 1996 to 2008 has reduced as well, from an average of
179 to 144 (Carney and Child, in press). Table 2.1 below shows the concentration of
family control for both 1996 and 2008. One of these East Asian countries which
demonstrate high ownership concentration as well as large family ownership and
control is Malaysia (1.49 firms per family for 2008 as shown in Table 2.1).
Table 2.1: Concentration of Family Control for 1996 and 2008
Percentage of Sample Firms That Families Control
Country Average
Number of
Firms per
Family
Top One
Family
Top Five
Families
Top 10
Families
Number of
Firms
1996
Hong Kong 1.92 8.0 30.0 39.0 200
Indonesia 1.55 4.5 18.0 29.2 178
Japan 1.00 0.5 2.5 5.0 200
South Korea 1.61 5.0 16.0 23.5 200
Malaysia 1.75 10.5 29.0 37.0 200
Philippines 2.42 6.7 25.0 39.2 120
Singapore 1.23 3.0 10.0 14.5 200
Taiwan 1.08 3.5 7.8 11.3 141
Thailand 1.67 7.8 24.0 33.5 167
East Asia nine 1.58 5.49 18.02 25.8
2008
Hong Kong 1.33 3.2 11.4 17.7 158
Indonesia 1.49 4.5 18.9 26.5 132
Japan 1.07 1.5 4.4 8.1 136
South Korea 3.22 10.1 37.5 42.8 159
Malaysia 1.49 5.2 16.4 23.4 154
Philippines 1.69 5.3 16.9 36.0 114
Singapore 1.16 3.8 12.2 16.0 131
Taiwan 1.24 1.2 5.5 8.6 163
Thailand 1.53 4.7 13.4 19.5 149
East Asia nine 1.58 4.38 15.18 22.05
Change
Hong Kong -0.59 -4.84 -18.61 -21.28
Indonesia -0.06 0.05 0.96 -2.70
Japan 0.07 0.97 1.91 3.09
South Korea 1.61 5.06 21.50 19.27
Malaysia -0.26 -5.31 -12.65 -13.62
Philippines -0.74 -1.40 -8.12 -3.20
Singapore -0.06 0.82 2.21 1.53
Taiwan 0.15 -2.32 -2.28 -2.76
Thailand -0.14 -3.09 -10.53 -14.07
East Asia nine 0.00 -1.12 -2.84 -3.75
Source: Carney and Child (in press)

31
2.3.2.2 Ownership Structure & Control in Malaysia
Malaysia is an emerging market which possesses very different ownership structure and
controls compared to developed economies. Yunos, Smith and Ismail (2010) found that
between 2001-2007, 96.8% of Malaysian public-firms are closely held by a controlling
shareholder. They also found that 30.8% of public-listed firms are controlled by
management whereby the manager is supplied by the controlling shareholder (Yunos
et.al., 2010). Moreover, family shareholders form the predominant controlling
shareholders and 67.2% of the total firms in the stock exchange are family owned
(Claessens et.al., 2000a; Ibrahim and Samad, 2010). This figure is the highest among
East Asian countries i.e. Hong Kong, Indonesia, Japan, Korea, Philippines, Singapore,
Taiwan and Thailand for 1996 (Claessens et.al., 2000a; Ibrahim and Samad, 2010). In
fact, for the year 2004, the average shareholding of family controlling shareholders in
Malaysian public-listed firms amounts to 27.3% (Munir and Salleh, 2010).
Aside from ownership structure, Malaysian public-listed firms also demonstrate very
high concentration of control. The percentage of concentration of control among
Malaysian public-listed family firms amounts to 76.2% of its Gross Domestic Product
(GDP), which is the second highest after Hong Kong for the year 1996 among all the
East Asian countries (Claessens et.al., 2000a; Lee and Li, 2009). Concentration of
control is also reflected by the ratio of cash-flow rights to control rights. This ratio
explains how much of the firm a controlling shareholder own (cash-flow rights)
compared to how much he could control the firm (control rights). A low ratio signifies
a high concentration of control as control rights exceed cash-flow rights (Claessens
et.al., 2000a). In Malaysia, for the year 2008, public-listed firms demonstrate a
relatively low cash-flow-to-control rights ratio i.e. 0.81 (Carney and Child, in press).
This ratio is the second lowest in East Asia after South Korea, from nine East Asian
countries analysed (Carney and Child, in press). Whereas, for family firms its cash-

32
flow-to-control rights ratio i.e. 0.743 (Carney and Child, in press). This ratio is the
lowest in East Asia, from nine East Asian countries analysed (Carney and Child, in
press). As Malaysia is ranked second lowest for public-listed firms and lowest for
family firms, respectively, in East Asia, it can be inferred that the concentration of
control in Malaysian public-listed firms, particularly, family firms, is very high for this
region3. The high concentration of ownership and control in Malaysia as well as in
other emerging markets provide opportunities to controlling shareholders to expropriate
minority shareholders due to the lack of investor protection in these markets compared
to developed economies (Claessens et.al., 2000a; Young et.al., 2008). Hence, the
following section provides a further explanation of the protection of minority
shareholders in these economies.
2.3.2.3 Legal Protection of Minority Shareholders outside United States (USA)
The extant literature on corporate governance systems and models, which are widely
practiced in developed economies such as USA, are based upon the assumption of
strong legal protection for minority shareholders‘ rights (Shleifer and Vishny, 1997). In
USA, both small and large shareholders are protected through an extensive system of
rules that protect minority shareholders‘ rights allows easy transfer of shares, keeps
election of directors relatively uninhibited by managers and gives shareholders
extensive powers to sue directors for violations of fiduciary duty, including through
class-action suits (Shleifer and Vishny, 1997). However, in the rest of the world
particularly emerging markets, legal protection of investors is less substantial, due to
laws are not good or because courts do not enforce these laws (Shleifer and Vishny,
1997). As a result, firms remain family-controlled and, some of these firms have
difficulties raising external funds, therefore, have to finance their investments internally
3 For public-listed firms in general, the low range of cash-flow rights-to-voting rights is between 0.79 to 0.855 and the high range
between 0.855 to 0.92. For family firms, the low range of cash-flow rights-to-voting rights is between 0.743 to 0.817 and the high range between 0.817 to 0.891 (Carney and Child, in press).

33
(Mayer, 1990). In fact, the Asian Corporate Governance Association (ACGA) and
Credit Lyonnaise Securities Asia (CLSA) jointly conducted an investor protection and
corporate governance assessment on eleven Asian countries in 20124. Table 2.2 shows
the investor protection and corporate governance scores for these countries.
Table 2.2: Investor Protection & Corporate Governance (CG) Scores for Eleven Asian Countries
No. Country Total
(Average
Score)
CG Rules
&
Practices
Legal Enforcement Political &
Regulatory
Accounting &
Auditing
Standards
CG
Culture
1 Singapore 69 68 64 73 87 54
2 Hong Kong 66 62 68 71 75 53
3 Thailand 58 62 44 54 80 50
4 Japan 55 45 57 52 70 53
5 Malaysia 55 52 39 63 80 38
6 Taiwan 53 50 35 56 77 46
7 India 51 49 42 56 63 43
8 South
Korea
49 43 39 56 75 34
9 China 45 43 39 56 63 43
10 Philippines 41 35 25 44 73 29
11 Indonesia 37 35 22 33 62 33
Source: ACGA (2012b)
From Table 2.2, it can be observed that Asian emerging markets such as Thailand,
Malaysia, India, China, Philippines and Indonesia only demonstrate overall decent and
below average scores in this assessment (total average scores range between 37 to 58
out of 100). Hence, it can be concluded that investor protection in Asian emerging
markets is basically poor or mediocre. The lack of legal protection of minority
shareholders and the prevalence of high ownership concentration in emerging markets
give rise to the principal-principal conflict which is generally known as Agency
Problem Type II (Morck et.al., 2005; Young et.al., 2008). This is explained in the next
section.
4 Asian Corporate Governance Association (ACGA) and Credit Lyonnaise Securities Asia (CLSA) are non-profit organisation and
independent financial services provider respectively, which assess corporate governance and investor protection in Asia (ACGA, 2012a; Krishnamurti et.al., 2005).

34
2.3.3 Agency Problem: The Principal-Principal Conflict (Agency Problem Type
II)
2.3.3.1 Corporate Governance in Emerging Markets and the Nature of the Principal-
Principal Conflict
Emerging economies are low-income, rapid growth countries which use economic
liberalisation as their primary growth engine (Hoskisson, Eden, Lau and Wright, 2000).
In these economies, formal institutions often do not exist to promote mutually beneficial
arms‘ length transactions between economic actors (North, 1990; 1994). Consequently,
firms in emerging markets are guided by informal institutions, to a huge extent. (Peng
and Heath, 1996). In the case of corporate governance, emerging economies typically
do not possess effective and predictable rule of law which in turn, creates a weak
governance environment (Dharwadkar et.al., 2000; Mitton, 2002). This is not to say
that emerging economies have no laws dealing with corporate governance.
In most situations, emerging economies have attempted to practise legal frameworks of
developed economies, in particular those of Anglo-American system, either as a result
of internally driven reforms such as in Malaysia or as a response to international
demands such as in South Korea and Thailand. However, formal institutions such as
laws and regulations with regards to accounting requirements, information disclosure,
securities trading and their enforcement are either absent, inefficient or do not operate as
expected. Consequently, standard corporate governance mechanisms possess relatively
little institutional support in emerging markets (Peng, 2004; Peng, Buck and
Filatotchev, 2003). This results in informal institutions such as relational ties, business
groups, family connections and government contacts, all playing a stronger role in
influencing corporate governance (Peng and Heath, 1996; Yeung, 2006).

35
For threshold firms5, the transition to professional management is always difficult
(Daily and Dalton, 1992). It is even more difficult in emerging markets due to the weak
institutional environment and it is common for even the largest firms to still be under
the control of the founding family. Basically, these companies attempt to appear as
having crossed the threshold from founder control to professional management.
However, the founding family often retains control through other informal means (Liu,
Ahlstrom and Yeh, 2006; Young, Ahlstrom and Bruton, 2004). In addition, public-
listed firms in emerging markets possess shareholders, board of directors and
professional managers, which reflect the characteristics of firms with modern corporate
governance (Monks and Minnow, 1995). Even the largest public listed firms in an
emerging economy may have adopted the appearance of corporate governance
mechanisms from developed economies but these mechanisms rarely function like their
counterparts in developed countries (Young et.al., 2008).
Generally, the corporate governance structures in emerging markets often resemble
those of developed economies in form but their implementation is poor (Backman,
2001; Peng, 2004). Consequently, concentrated ownership and other informal
mechanisms emerge to fill the corporate governance gap. While these ad hoc
mechanisms may resolve some problems such as the principal-agent conflict, they
create other agency problems in the process such as the principal-principal conflict or
generally known as Agency Problem Type II (Young et.al., 2008).
The principal-principal conflict or Agency Problem Type II has been identified as a
major corporate governance problem in emerging markets (Young et.al., 2008). This
conflict is between two groups of principals: controlling shareholders and minority
shareholders (Jiang and Peng, 2011). Young et.al. (2008) argue that the principal-
5 Threshold firms are firms which are undergoing a transition from the emergence to the professional management stage (Zahra
and Filatotchev, 2004).

36
principal conflict is likely to be severe when the firm is owned and controlled by one
large shareholder or a single family owner. The principal-principal conflict in emerging
markets differs from the principal-agent problem that is prevalent in developed
economies. This difference is explained by Figure 2.1.
(a) Principal-Agent Conflict
(c) Principal-Principal Conflict
(b)
Figure 2.1: Principal-Principal Conflict vs. Principal-Agent Conflict
Source: Young et.al. (2008)
In the top panel of Figure 2.1, arrow (a) depicts the traditional principal-agent conflict
that occurs between dispersed shareholders and professional managers. In the bottom
panel of Figure 2.1, the slanting arrow (b) depicts the relationship between the
controlling shareholders and their affiliated managers. These affiliated managers may
be family members or associates who reports directly to the controlling shareholders
(Young et.al., 2008). The straight line (c) depicting the conflict is drawn between the
affiliated managers – who represent the controlling shareholders - and the minority
shareholders. Hence, the conflict actually is between the controlling shareholders on one
hand and dispersed minority shareholders on the other hand (Young et.al., 2008). This
Dispersed
Shareholders
Managers
affiliated with
controlling
shareholders
Dispersed
Shareholders
Controlling
Shareholders
Controlling
Shareholder
Professional
Managers (Agents)
Widely-dispersed
Shareholders
Widely-dispersed
Shareholders

37
principal-principal conflict has certain costs associated with it, which is missing from
agency theory (Dalziel, White and Arthurs, 2011).
2.3.3.2 Extension of Agency Theory
Largely missing from agency theory is the discussion of the potential costs which could
arise from principal-principal conflict. In order to fully understand the costs associated
with such conflicts, I briefly review the costs and benefits associated with mitigating
principal-agent conflict (see Figure 2.2) and then extend this agency theory foundation
by specifying the costs and benefits associated with mitigating principal-principal
conflict (see Figure 2.3).
$
A (Marginal Control Costs)
$benefit
L
G X
B1(Marginal
$cost Residual
Loss Reduction)
C0 Cx Control
Figure 2.2: The costs of principal-agent conflict
Source: Dalziel et.al. (2011)

38
In Figure 2.2, curve A represents marginal control costs. Marginal control costs are the
additional costs incurred from incremental control. Marginal reductions in residual
losses, depicted by curve B1 are the reduction in residual losses expected from
additional control. Thus, curve A represents incremental costs, while curve B1
represents incremental benefits. Curves A and B1 intersect at point X. When control
reaches Cx, the marginal benefit of control equals or breaks even with the marginal cost
of control.
To illustrate, consider the arbitrary point C0 shown in Figure 2.2, which is to the left of
level of control Cx. At this level, the benefit of an additional unit of control (shown in
the figure as $benefit) is larger than the cost ($cost) associated with that same additional
unit of control, so overall the principals are benefiting from control. At this level, there
are also additional benefits which can be derived if more control is exerted, but it is
important to note that the marginal costs associated with achieving these marginal
benefits are higher. In other words, when control is very low, a principal who increases
control (e.g. through additional monitoring) will be able to substantially reduce the risk
of huge losses associated with opportunistic agent behaviour. However, further increase
in control ultimately yields smaller and smaller returns as remaining opportunism
becomes increasingly trivial or difficult to obviate. Accordingly, the marginal benefits
of control (i.e. the marginal reduction in residual losses depicted as curve B1) dwindle at
the same time as the marginal costs of control (curve A) increase. From an agency
perspective, the goal is to ensure that the benefits of control surpass the costs, yielding
net gains to principals. Shaded area G represents these gains to principals as control
reduces more costly residual losses.

39
If the principals exert too much control, the firm enters the area to the right of point Cx,
where the marginal costs of control are higher than the marginal benefits and the firm
begins to experience losses. Exerting too much control or ‗over-governance‘ can occur
in a variety of ways. For example, rigid checks and balances, excessive reporting
requirements (Manzi, 2007), over-monitoring of executive compensation (Tosi and
Gomez-Mejia, 1994), and too many layers of supervision can constrain managerial
behaviour in undesirable ways and impose costs on the organisation which are far above
the benefits to be obtained (Shapiro, 2005). Additionally, principals who typically
possess less knowledge of the internal workings of the firm than agents – must
frequently monitor using gross proxies of performance such as financial measures rather
than strategic criteria or first-hand operational insights. As a consequence, when these
principals ―try to closely monitor managerial actions, they may inadvertently cause
managers to pursue non-wealth-maximising strategies‖ (Lane, Cannella and Lubatkin,
1998, p. 560). Finally, over-governance can shift risk to managers in ways which are
ultimately detrimental to firm performance (Hoskisson, Castleton and Withers, 2009).
Shaded area L depicts the losses firms suffer to the right of Cx when control is
exceptionally high.
2.3.3.3 The Costs of Principal-Principal Conflict
In addition to examining the costs associated with principal-agent conflict, it is also
important to analyse the potential costs of principal-principal conflict (Dalziel et.al.,
2011). Figure 2.3 depicts what happens as principals exert ―biased control‖.

40
$
A (Marginal Control Costs)
FG X L
B1 (Marginal
RG Residual Loss Reduction)
B2 (Marginal Residual
Loss Reduction)
CY CX Control
Figure 2.3: The costs of principal-principal conflict
Source: Dalziel et.al. (2011)
When a given principal uses its influence to bend the governance of the firm to its own
benefit rather than focusing on the shared interests of all the firm‘s principals, it
redirects the governance devices towards tasks that suit its own ends but which will be
less useful in reducing residual losses. This is indicated by the lower marginal residual
loss reduction curve (B2) shown in Figure 2.3. This result in a new equilibrium level of
control indicated as CY.
By lowering the residual loss reduction curve, principal-principal conflict deprives the
firm of some of the benefits of control. In effect, the gain area G is divided into two
sections, such that G = RG + FG. The (actual or realised) gains, which are represented
by area RG, are substantially smaller than G because worthwhile tasks are being

41
neglected as powerful principals use governance mechanisms to pursue their own
agendas. Potential gains which the firm could have enjoyed are forfeited as governance
mechanisms are diverted away from their intended purpose. The region FG shows the
size of these forfeited gains and is a measure of unrealised governance potential. This
region depicts the cost of principal-principal conflict or principal costs.
Dalziel et.al. (2011) define principal costs as the forfeited gains which result from
principal-principal conflict and the associated neglect of important governance tasks.
Principal costs have the effect of reducing the value of the firm below what it otherwise
would have been.
Basically, the differences between principal-agent conflict and principal conflict are
outlined in the following table :

42
Table 2.3: Principal-Agent Conflict versus Principal-Principal Conflict
Principal-Agent conflict as depicted in Anglo-
American variety of agency theory
Principal-Principal conflict that commonly occur in
emerging economies
Goal incongruence Between fragmented, dispersed shareholders and
professional managers.
Between controlling shareholders and minority shareholders.
Manifestation Strategies that benefit managers at the expense of
shareholders in general (e.g. shirking, pet projects,
excessive compensation and empire building).
Strategies that benefit controlling shareholders at the
expense of minority shareholders (e.g. minority shareholder
expropriation, nepotism and cronyism).
Institutional protection of
minority shareholders
Formal constraints (e.g. judicial reviews and courts)
set an upper bound on potential expropriation by
majority shareholders. Informal norms generally
adhere to shareholder wealth maximization.
Formal institutional protection is often lacking, corrupt or
un-enforced. Informal norms typically favour the interests of
controlling shareholders over minority shareholders.
Market for corporate control. Active as a governance mechanism ―of last resort‖. Inactive even in principle. Concentrated ownership thwarts
notions of takeover.
Ownership pattern. Dispersed – holding 5-20% equity is considered
―concentrated ownership‖. A shareholder with 5%
equity stake is regarded as a ―block holder‖.
Concentrated – often more than 50% of equity is held by
controlling shareholder. Often structured as a ―pyramid
where control rights are greater than ownership rights.
Board of directors Legitimate legal and social institutions with
fiduciary duty to safeguard shareholders‘ interests.
Research focuses on factors that affect day-to-day
operations such as insiders vs. outsiders,
background of directors, committee structures, etc.
In emerging economies, boards often have yet to establish
institutional legitimacy and thus are ineffective. Research
indicates they are often the ―rubber stamp‖ of controlling
shareholders.
Top management team Professional managers who often have made their
way up through the ranks or are hired from outside
after extensive search and scrutiny of qualifications.
Monitored internally by boards of directors and
externally by managerial labour market.
Typically, family members or associates. Monitored mainly
through family consensus or self-regulation adhering to
―gentlemen‘s agreements‖.
Source: Young et.al. (2008)

43
The reduction in firm value as a result of principal-principal conflict (minority
shareholder expropriation) will be further discussed in the next section on minority
shareholder expropriation.
2.3.3.4 Minority Shareholder Expropriation
Since principal-principal conflict incurs costs, it is important to discuss a significant
manifestation of this conflict. One significant manifestation of principal-principal
conflict is minority shareholder expropriation (Le Breton-Miller and Miller, 2009;
Young et.al., 2008). Minority shareholder expropriation is defined as the transfer of
resources out of a company to its controlling shareholder at the expense of minority
shareholders (Johnson, Porta, Lopez-de-Silanes and Shleifer, 2000b). It is also called
tunnelling and often, the term expropriation and tunnelling is used interchangeably
(Johnson et.al., 2000b). Expropriation by controlling shareholders occurs due to
conflict of interest between controlling shareholders and minority shareholders as the
interests of both these shareholders are diverged and the former do not act in the best
interest of the latter.
When expropriation by controlling shareholders occurs, there is a transfer of value from
minority shareholders to controlling shareholders (Shleifer and Vishny, 1997). This
value transfer emphasises the point that expropriation is indeed a key characteristic of
Agency Problem Type II, because it is used to fulfil controlling shareholders‘ interests
which are in direct conflict with, as well as, at the expense of minority shareholders‘
interests (Claessens et al., 2000a; Faccio et al., 2001a; Johnson et al., 2000b; Mitton,
2002; Young et.al., 2008). The reason for this is that controlling shareholders have the
incentives to expropriate resources from the firm due to their power in controlling the
corporation (Dharwadkar et.al., 2000; San Martin-Reyna and Duran-Encalada, 2012;
Shleifer and Vishny, 1997; Young et.al., 2008). Such expropriation generally reduces

44
the observed market value of the firm (Dahya et.al., 2008). This reduction in firm value
occurs due to the cost of the principal-principal conflict (forfeited gains) as discussed
previously which basically refers to the unrealised governance potential of the firm.
Instead of governing their firms properly, controlling shareholders direct their activities
and actions to benefit themselves at the expense of minority shareholders (Anderson
and Reeb, 2003; Dahya et.al., 2008; La Porta et.al., 1999; Lins, 2003; Morck et.al.,
1988; Shleifer and Vishny, 1997; Qian et.al., 2011).
Such activities or actions can take many forms – some legal, some illegal and some in
grey areas (La Porta et.al., 2000a,b). These include putting less-than-qualified family
members, friends, and cronies in key positions (Chen et.al., 2011; Faccio et.al., 2001a);
engaging in advantageous transfer pricing transactions (Chang and Hong, 2000; Chen
et.al., 2011; Khanna and Rivkin, 2001); engaging in strategies which advance personal,
family or political agendas at the expense of firm value such as excessive corporate
diversification (Backman, 1990; Chen et.al., 2011); tunnelling profits from companies
at the bottom of the corporate pyramidal structure to the holding firm or to other
subsidiaries or associated companies (Chen et.al., 2011); excessive executive
compensation (Wiwattanakantang, 2001); self-beneficial trades (Atanasov, Boone and
Haushalter, 2010; Hand and Skantz, 1999; Nanda, 1991; Powers, 2003); loan guarantees
(Johnson et.al., 2000b); outright theft or fraud (Johnson et.al., 2000b) as well as dilutive
share issues (Johnson et.al., 2000b). Djankov et.al. (2008) argue that self-dealing
transactions such as advantageous transfer pricing, excessive executive compensation,
loan guarantees and outright theft enable controlling shareholders to utilise RPTs to
expropriate resources from their firms for their own private benefits.
As minority shareholder expropriation reduces firm value, it is also significant to know
the factors which encourage minority shareholder expropriation as outlined in the next
section.

45
2.3.4 Factors Which Encourage Minority Shareholder Expropriation
Several factors could encourage minority shareholder expropriation. These include:
(i) private benefits of control and expropriation;
(ii) capital market development and moral hazard banking;
(iii) agency cost of debt;
(iv) lack of informed trading in equity markets;
(v) lack of market for corporate control;
(vi) inadequate and costly legal protection of minority shareholders;
(vii) restrictive licensing practices; and
(viii) rent seeking practices.
2.3.4.1 Private Benefits of Control and Expropriation
Private benefits of control is defined as the benefits which accrue to managers or
shareholders who possess control of the corporation, but not to minority shareholders
(Benos and Weisbach, 2004). They can be non-pecuniary, such as the ability to direct a
company‘s resources to a cause one agrees with (Demsetz and Lehn, 1985), a
preference for glamorous projects (Jensen, 1993), or the use of a position for the
enhancement of one‘s human capital (Shleifer and Vishny, 1989).
Private benefits of control can have an enormous direct financial effect on minority
shareholders through transactions which divert corporate resources to other companies
owned by the controlling shareholder or their families (Benos and Weisbach, 2004).
Hence, measuring the extent of private benefits accruing to controlling shareholders is
therefore a central question in corporate finance because the nature of these benefits are

46
interesting and important in their own right because they are detrimental to the interests
of minority shareholders (Benos and Weisbach, 2004).
One significant method to measure private benefits of control was originally proposed
by Barclay and Holderness (1989) and relies on ownership changes of controlling
blocks of shares. Barclay and Holderness (1989) argue that the difference between the
price per share paid by the acquiring party and the price per share prevailing on the
market after the acquisition has taken place, reflect private benefits associated with the
control of the company. This difference is a plausible measure of private benefits since
the price per share paid by the acquiring party reflects not only the expected future cash
flows but also the value of control, whereas the market price of the shares reflects only
the cash flow benefits (Benos and Weisbach, 2004).
Extending the Barclay/Holderness approach to an international context, Dyck and
Zingales (2004) calculate the control (or block) premium in 393 control-transactions
spanning 39 countries for the years 1990-2000. These authors define block premium as
the difference between the price per share paid for the control block in firms and the
price on the Stock Exchange two days after the announcement of the control transaction,
divided by the price on the Exchange after the announcement and multiplied by the
proportion of cash-flow rights represented in the controlling block (Dyck and Zingales,
2004). In Malaysia, the average private benefits of control are just 7% (Dyck and
Zingales, 2004). This low figure signals some interesting postulations about the state of
corporate governance in this country.
First, if controlling shareholders do purchase their controlling blocks and subsequently
enjoy on average low private benefits of control, they definitely have more incentives to
engage in expropriation activities in order to increase their private benefits (assuming
they are utility maximisers). Secondly, the 7% of private benefits are actually only

47
representing the private benefits derived from the acquisition of control blocks6. It does
not represent other types of private benefits of control such as private benefits enjoyed
by the controlling shareholder since the firm started, without any change of hands in the
controlling block. This type of private benefits could be huge if we consider the
opportunities for expropriation in emerging markets where investor protection is lower.
As a conclusion, these 7% of private benefits only indicate that either the potential for
expropriation by controlling shareholders is high or it is not definitive of the entire
private benefits of control enjoyed by them. Aside from private benefits of control, the
lack of capital market development also plays a part in encouraging minority
shareholder expropriation.
2.3.4.2 Capital Market Development, Moral Hazard Banking and Expropriation
The bond market in Malaysia is relatively underdeveloped (Sharma, 2001) which
increases the expropriation incentives of controlling shareholders. The poor
development of the bond market can be explained by the ‗supply side‘ and ‗demand
side‘ constraints. For the former, the heavy reliance on bank financing creates a strong
hindrance for the utilisation of bonds to obtain capital. In fact, between 2001 to 2006,
corporate loans comprise the largest category of loans for commercial banks, finance
companies and merchant banks in Malaysia (Zulkhibri, 2013).
The weak Malaysian bond market is also related to the links between business and
politics. In this country, the ethnic dimension increases the intricacies with the
adoption of ―Bumiputra‖ policy7 leading to the ownership of many companies and
banks being reserved for Malay citizens. As a result, the major connections in Malaysia
tend to be between political parties and powerful families within specific ethnic groups
6 Based upon the average, the range of the percentage of private benefits considered low is between -4% to 34.5% and considered
high is between 34.5% to 65% (Dyck and Zingales, 2004). 7 Bumiputra policy means policy for the natives.

48
controlling companies (Sharma, 2001). A common institutional characteristic is that
there is a close and often interlocking relationship between members of government and
the owners of banks and conglomerates (Sharma, 2001). These links explain the heavy
reliance on bank financing by business groups. Consequently, relationship banking
works well for both, businesses as well as banks (Bliss and Gul, 2012).
Adding to this ‗relationship banking‘ is the rationale provided by government support.
The Government promises bail-out in the case of bank failures. This gave the private as
well as state banks the confidence to lend without much prudence and rigorous credit
criteria, hence, creating a moral hazard in the banking industry. It also gave businesses
the security to undertake long-term strategic investments by the availability of long-
term loans. Consequently, firms rarely encounter the need to diversify their sources of
debt financing and issue medium-term instruments (Sharma, 2001). This not only
retards bond market development but also encourages expropriation by controlling
shareholders. Moral hazard bank lending gives rise to the utilisation of bank loans for
the private benefits of controlling shareholders such as engaging in unprofitable
investments (empire building) and increases the risk of bank failures (Faccio et.al.,
2001c; Sarkar and Sarkar, 2008).
Aside from the ‗supply side‘ constraints, there are also the ‗demand side‘ constraints.
Given the predominance of bank financing; there has been little perceived need to
develop the governance infrastructure related to arms‘-length mechanisms of finance,
i.e. the legal rights of creditors and minority shareholders and corporate transparency
(Sharma, 2001). Though, creditors‘ rights have been well defined in Malaysia, the
enforcement is problematic8 due to corruption, political interference and the fact that
8 The joint assessment by Asian Corporate Governance Association (ACGA) and Credit Lyonnaise Securities Asia (CLSA) only
provides a score of 35 out of 100 for legal enforcement in Malaysia (ACGA, 2012b).

49
courts still do not possess the expertise and practical knowledge for handling
proceedings like critical bankruptcy cases (Sharma, 2001).
Failure to develop a proper governance infrastructure for arms-length debt (bond)
financing retards the development of the bond market because it discourages investors
to lend their funds as they will never know whether they will obtain their principal back
when the bond matures or when the firm becomes insolvent. If investors are
discouraged to lend to firms then the controlling shareholders will have more incentive
to expropriate through continued reliance on long-term bank loans.
In essence, the bond market is a market-based debt system where ratings agency such as
Ratings Agency Malaysia (RAM) regularly rates the bonds of corporations based upon
the quality of the firm‘s financials and bond characteristics such as amount and duration
borrowed. If firms with poor quality financials borrow excessively from the market on
a long-term basis, its rating will drop due to the increased risk of bond default. This
will deter future investors from lending to these firms; thus, reducing the incentives for
controlling shareholders to engage in debt expropriation. On the other hand, bank
financing particularly in Malaysia is very much a relationship-based system influenced
by moral hazard, which ultimately, creates strong incentives for expropriation.
Unless the supply and demand side constraints of bond market development are
addressed seriously in Malaysia, it is unlikely that the bond market will grow. The lack
of bond market development means the retardation of a market-based system, which can
help constrain expropriation by controlling shareholders through the disciplinary effects
of bond ratings. As a result, businesses will depend more on bank financing for
financing needs through a relationship-based system, which is influenced by moral
hazard and provide the incentives for expropriation. Besides capital market

50
development and moral hazard banking, the lower agency cost of debt also plays a role
in encouraging expropriation.
2.3.4.3 Agency Cost of Debt and Expropriation
Agency cost of debt is lower when firms are highly concentrated in shareholding. As a
result, highly concentrated firms obtain loans more easily from banks as well as find it
easier to secure capital from bond investors. This increases the incentives for debt
being used as an expropriation tool (Kim and Sorensen, 1986). Therefore, it is not
surprising that in emerging markets such Malaysia, in which bank financing is dominant
and shareholding concentration is high; access to debt financing becomes easier such
that the share of domestic debt of the banking system increased from 62% in 1986 to
75% in 1997 (Thillainathan, 1999). With the increase in debt usage by firms, the
amount and the likelihood of debt being used as an expropriation tool by controlling
shareholders will increase indefinitely. Although, debt can be expropriated by
controlling shareholders, the characteristic of the equity market also play a role in
encouraging minority shareholder expropriation.
2.3.4.4 Lack of Informed Trading In Equity Markets and Expropriation
Morck, Yeung and Wu (2000) conducted a cross-country study on developed and
emerging markets (total 40 countries) to examine the stock returns synchronicity in both
markets. Stock returns synchronicity is measured as the average R-squared values of
firm-level regressions of bi-weekly stock returns (dependent variable) on local and US
market indexes (independent variables) in each country. Malaysia is ranked third
highest behind Poland and China in terms of stock returns synchronicity with an R-
squared value of 42.9%. This means 42.9% of the variation in bi-weekly stock returns
in Malaysia is explained by the variation in the domestic market index and the US
market returns. The higher R-squared values, it indicates that stock prices frequently

51
move together and this measurement is consistent with Roll (1988) and French and Roll
(1986) measurement.
Both these papers argue that low levels of synchronicity in some country‘s stock prices
reflect the incorporation of more firm-specific information into the stock prices in their
markets. They further argue that if less firm-specific information is capitalised into
stock prices, investors would carry out less risk-arbitrage activities (informed trading).
When less risk-arbitrage activities are being carried out, noise trading instead of
informed trading of stocks occur, which is not based upon stock fundamentals but by
market trends.
In finance theory, it is argued that risk arbitrageurs utilise resources to uncover
proprietary information about stocks and earn an acceptable return by using that
information to trade against less informed investors (Morck et.al., 2000). Hence,
indirectly, they are actually acting as firm monitors. Morck et.al. (2000) further argues
that this activity might not be attractive in countries with poor minority shareholder
rights protection because risk arbitrageurs fear they may not be allowed to keep their
earnings in these countries, especially if they are not politically connected.
Since, Malaysia is ranked the third highest in stock returns synchronicity (Morck et.al.,
2000), it can be argued that risk arbitrageurs are not interested in trading in this
country‘s stock market due to lack of minority shareholder rights protection. With lack
of informed trading, there is less monitoring by risk arbitrageurs in the capital markets
(Holmstrom and Tirole, 1993; Morck et.al., 2005). This further provide incentives for
controlling shareholders to expropriate minority shareholders through stock market
manipulation such as share repurchases, share price dilution, etc. This opportunistic
behaviour is also encouraged by the lack of market for corporate control.

52
2.3.4.5 Lack of Market for Corporate Control and Expropriation
Due to the prevalence of high ownership concentration in Malaysia, there is a lack of
market for corporate control (Abdullah, 2006; Thillainathan, 1999). Ownership
concentration reduces the incentives for takeovers and acquisitions because of the
higher price the acquirer has to pay to become the new controlling shareholder of the
acquired firm (due to the higher volume of shares needed to be purchased) compared to
the price they have to pay to acquire a stake in widely held corporations. As a result,
the disciplinary effects of the market for corporate control are greatly reduced. This
encourages expropriation because controlling shareholders know that the likelihood that
they will be replaced is low due to their ownership concentration (Thillainathan, 1999).
The argument by Thillainathan (1999) is consistent with the argument by Stulz (1988)
who argues that an increase in the fraction of voting rights of controlling shareholders
decreases the probability of a successful tender offer to acquire the firm and increases
the premium offered if a tender offer is made. The lack of disciplinary effects of the
market for corporate control can also be attributed to the strategic under pricing of
Initial Public Offering (IPO) shares by controlling shareholders in order to elicit
oversubscription of these shares and allow lotteries to ration the shares. This prevents
large subscribers from purchasing large-block shares and weakening the control of the
controlling shareholders, hence, the under pricing helps maintain the control power of
controlling shareholders. This is detrimental to the interests of minority shareholders as
the market for corporate control is weakened by the IPO under pricing (Lin and Chuang,
2011).
Apart from a low likelihood of being replaced, the inadequate and costly legal
protection of minority shareholders also encourages controlling shareholders to
expropriate.

53
2.3.4.6 Inadequate and Costly Legal Protection of Minority Shareholders
The adequacy of investor protection for minority shareholders in Malaysia can be
analysed with regards to their rights as shareholders, the protection they enjoy against
expropriation as well as the quality of law enforcement (Thillainathan, 1999; World
Bank, 2005). Equity ownership in firms provides a shareholder several basic rights,
which include the following:
a) The right to a secure method of ownership registration
b) The right to convey or transfer shares
c) The right to obtain relevant information on the corporation on a regular basis
d) The right to participate and vote at general shareholders meetings on key
corporate matters
e) The right to elect members of the board
f) The right to share in the residual interest in the profits of the corporation
The principal rights that minority shareholders possess is the right to vote on the
election of directors, on amendments to the corporate charter as well as on key
corporate matters such as asset sales, mergers and acquisitions, and liquidation; thus
restricting the discretion of corporate insiders on these key issues (Thillainathan, 1999;
World Bank, 2005).
In assessing how well Malaysia performs with regard to these principal shareholder
rights; an assessment of the voting rights attached to shares as well as the rights that
support the voting mechanism against intervention by corporate insiders (also known as
anti-director rights) was conducted by La Porta et.al.(1998) (as cited in Thillainathan,
1999).
54
La Porta et.al. (1998) find that Malaysia is one of only eleven countries out of a total of
forty nine, which adopts a genuine one-share-one-vote rule. They also find that
Malaysia scored four out of six in anti-director rights whereby proxy mail and
cumulative voting are not allowed. This provides incentives for controlling
shareholders to take advantage of this weakness by engaging in expropriation activities.
In Malaysia, as in many other common law countries, shareholder-voting rights are
supplemented by an affirmative duty of loyalty of managers to shareholders. Managers
have a duty to act in shareholders‘ interests. The most commonly accepted element of
the duty of loyalty are the legal restrictions on managerial self-dealing, such as outright
theft from the firm, excessive compensation or issues of issuing additional securities
(such as equity) to the management and its relatives. Malaysian courts would intervene
in cases of management theft and asset diversion, and they would definitely intervene if
managers dilute existing shareholders through equity issuance to themselves
(Thillainathan, 1999; World Bank, 2005).
However, the courts are less likely to intervene in cases of excessive compensation and
in line with the business judgment rule (that keeps the courts out of corporate
decisions), they are also very unlikely to second guess managers‘ business decisions,
including those decisions that could hurt minority shareholders (Thillainatan, 1999;
Pascoe and Rachagan, 2005; Salim, 2009). This is a window of opportunity for
controlling shareholders to engage in expropriation activities.
The minority shareholders in this country, as in the United States, have the right to sue
firms using class action suits that bypass the free rider problems, if they believe that
corporate insiders have violated their duty of loyalty to them. However, Malaysian civil
procedures are less accommodative to class action suits and contingent fees are
prohibitive (Chan, 2007; Thillainathan, 1999). This hinders legal action by minority

55
shareholders and increases the incentives for expropriation by controlling shareholders.
Although, overall, there is an avenue for minority shareholders to take legal action on
behalf of the firm‘s name, the practical realities discourage such actions. This is
because the legal costs of initiating legal action as well as the substantive and
procedural requirements to carry out such actions are generally burdensome (Chan,
2007; Thillainathan, 1999). This further provides incentives for minority shareholder
expropriation.
Apart from property rights and the quality of investor protection, the quality of legal
enforcement is also significant for good corporate governance (Berglof and Claessens,
2006; Thillainathan, 1999). As shown in the investor protection scores from the Asian
Corporate Governance Association (ACGA) and Credit Lyonnaise Securities Asia
(CLSA), Malaysia only obtained a score of 39 out of 100 for legal enforcement (ACGA,
2012). Consequently, it is very clear that emerging markets such as Malaysia need to
improve upon its legal enforcement.
In addition, there is a growing public perception that the judiciary standards have
declined in this country (Thillainathan, 1999; Wain, 2009). For example, it is perceived
that the independence, impartiality and integrity of the judiciary have been
compromised, whereby judges are perceived to be not ‗truly‘ independent in their
judgments. Declining standards of the judiciary system will definitely serve as a
catalyst for expropriation by controlling shareholders, as they are confident that the
likelihood of receiving a favourable outcome from court cases is high. Although, legal
weaknesses and cost of legal protection is an important factor in encouraging
expropriation, economic practices too play a role in encouraging this behaviour.

56
2.3.4.7 Restrictive Licensing Practices and Expropriation
In Malaysia, one significant issue which encourages expropriation is the presence of
restrictive licensing practices (exclusive economic practices), which benefit certain
controlling shareholders of large business groups. These practices result in monopolies
in certain industries and hence, concentrated shareholding (Nambiar, 2011;
Thillainathan, 1999). These practices need to be reduced or eliminated which is crucial
for encouraging more dispersed shareholding and risk diversification at the level of
individual or family wealth holders which will result in less expropriation by controlling
shareholders. However, the practice of restrictive licensing is likely to continue as long
as firms have the tendency to be rent-seekers.
2.3.4.8 Rent Seeking and Expropriation
Generally, the theory of the firm presumes that in a perfect market, all firms compete
for resources and market share on an even level. In a pure, competitive market with low
ownership concentration and limited economic distortions, a highly efficient firm sells
its product at market prices and earns a normal profit. This firm employs a reasonable
number of workers at market rate wages and using optimum capital structure, is able to
pay normal dividends and provide a reasonable return on equity to shareholders. This
was basically the idea of traditional business corporations in the early twentieth century
as postulated by Coase (1937). He argues that firms control the transformation of inputs
into outputs and earn a resulting profit. As a result of this, the theory by Coase (1937)
predicts that the whole economy could operate efficiently as one great system of
markets, in which autonomous agents enter into very elaborate contracts with each other
without any transaction and agency costs incurred.

57
However, due to market imperfections such as transaction costs, barriers to entry, the
existence of monopolies, oligopolies and monopsonies, market illiquidity, etc; firms
strive to maximise profits by engaging in rent-seeking activities (Ariffin, 2009). Morck
et.al. (2001) define rent seeking as business practices which extract uncompensated
value from others without taking actions to improve productivity or create a mutual
beneficial transaction. Although, rent seeking is unethical in nature, given the urgency
of the firm in maximising shareholder wealth along with various economic constraints,
rent seeking may be the only business solution to the firm (Krueger, 1974).
In the model by Krueger (1974), it is shown that firms which seek rent try to create a
barrier of entry into the market and monopolise the production line in which the rent is
created. This distortion creates an artificial market price for a product that, in turn,
creates a higher profit margin for the firms.
Murphy, Shleifer and Vishny (1993) find that rent-seeking activities show increasing
returns for firms which practise them. Since the returns from rent-seeking activities are
attractive, this makes rent-seeking more attractive relative to productive activities.
Basically, this is costly to the firm‘s growth because resources are channelled to rent-
seeking instead of production. This expropriates minority shareholders. Murphy et.al.
(1993) further explain that firms which choose to maximise their rent-seeking activities
instead of production, had most of their resources diverted to unproductive activities.
Hence, minority shareholders are expropriated. For example, instead of channelling
investment funds into research and development (R&D), the funds are used to finance
the lobbying of a specific government agency. If the lobbying is successful, it will help
the participating firms maintain their rent seeking activities. In the long run, the
economy will suffer because no product development occurs but corruption, minority
shareholder expropriation and other unhealthy business practices prevail.

58
Having known the factors which encourage minority shareholder expropriation, it is
also important to know that the risk of minority shareholder expropriation occurring is
the highest during times of financial crisis (Johnson et.al., 2000a). This is explained
further next.
2.3.5 Minority Shareholder Expropriation during Financial Crisis
Young et.al. (2008) argue that the principal-principal conflict may increase during
periods of economic crisis. This can occur because during these periods where
controlling shareholders possess stronger incentives to expropriate minority
shareholders due to the financial losses that they have suffered. This occurs because
controlling shareholders become more desperate to extract firm resources in an attempt
to protect their own wealth (Young et.al., 2008; Jiang and Peng, 2011).
In addition to that, Johnson et.al. (2000a) argue that minority shareholders expropriation
becomes more severe during periods of financial crisis because controlling shareholders
are led to expropriate more as the expected returns on investment falls. During the 1997
Asian financial crisis, even firms with a good reputation exploited their minority
shareholders (Johnson et.al., 2000a). Johnson et.al. (2000a) used a simple model to
show that agency problems can make countries with weak legal systems vulnerable to
the effects of a sudden loss of investor confidence. They show that corporate
governance variables particularly those related to minority shareholder protection such
as contracts enforceability and shareholder rights explain more of the variation in
exchange rates and stock market performance during the Asian financial crisis
compared to macroeconomic variables. The evidence provided by Johnson et.al.
(2000a) suggest that corporate governance particularly minority shareholders protection
is a first-order significance in determining the extent of macroeconomic problems in
crisis situations.

59
The model used by Johnson et.al. (2000a) show that minority shareholder protection
matters more in explaining the changes in the exchange rate and stock market
performance during the Asian financial crisis is as following:
As in Jensen and Meckling (1976), the conflict of interest is between insiders (managers)
and outsiders (shareholders in our simple model). The manager owns a fraction α of the
firm‘s equity and shareholders own equity of (1-α) fraction. Retained earnings are
represented by I. The manager steals S≥ 0 of retained earnings and receives utility of S
from them. Johnson et.al. (2000a) utilise ―stealing‖ as shorthand for more general
forms of managerial expropriation. Stealing is costly and the manager expects to lose
C(S)=(S2/2k) when he steals because, for example, other people need to be compensated
and there is some probability that the manager will be caught and punished. A higher
value of k - representing, in this case, weaker corporate governance rules or a weaker
legal system or both - means that it is cheaper to steal. Thus, the value of stealing, S -
C(S), is concave in S. The marginal value of stealing is reduced as the amount stolen
increases because it becomes harder to steal as the absolute amount of theft increases;
the stealing becomes more obvious and easier for a court to stop9.
The manager invests what he does not steal in a project that earns a gross rate of return
R, which is greater than one, and from which he receives the share α of profits. The
manager's optimisation problem is given by MaxS U(S; R, k, a) = Max[αR(I - S) + S -
(S2/2k)], and the optimal amount of theft, S*, is found by solving δU/δS = 1 - (S*/k) –
αR = 0, which yields S*(R, k, a) = k(1 - αR). Johnson et.al. (2000a) assumes that the
parameter values are such that the manager will not attempt to steal more than the total
amount of retained earnings, or S*(R, k, a) ≤ I. This simplifies the analysis by avoiding
a corner solution, without changing the main insights.
9 A referee has pointed out that Johnson et.al. (2000a) could cast the model in terms of general agency problems for managers (e.g.,
shirking). Their results apply directly to any managerial agency problems that become worse in an economic downturn. Note that many forms of stealing are actually legal in countries with weak legal environments (Johnson et al., 2000b).

60
The manager equates the marginal cost and marginal benefit of stealing. Because the
manager owns α of the firm, he possess an incentive to invest at least some of the firm's
cash rather than to steal it all. As k rises, the equilibrium amount of stealing falls. As k
rises, the amount of stealing in equilibrium rises. If α > 1/R, the manager's stealing is
―negative‖, meaning the manager puts in some of his own money into the firm, perhaps
to ensure firm survival and enjoy positive stealing in the future (Friedman and Johnson,
1999). For their own objectives, Johnson et.al. (2000a) assume that α is low enough
that the manager decides to steal. Alternatively, they assume that the manager is credit
constrained. In this static model, assuming that the manager never steals less than zero
does not substantially change the analysis.
Differentiating the optimal stealing equation with respect to R gives
(δS*/δR) = - αk.
An increase in the rate of return on the invested resources lowers the amount of stealing
because it increases the marginal opportunity cost of the stolen resources.
A higher α means δS*/δR is more negative. If the manager owns more of the firm, then
a given increase in the return on investment convinces him to put more resources into
the investment project and, therefore, to steal less. Conversely, if the manager owns
more but the return on investment declines, then he steals more.
A higher value of k means that δS*/δR is more negative. A lower cost of stealing
(higher k) both raises the equilibrium value of stealing and makes stealing more
responsive to variation in the rate of return on investment. This is because larger k both
shifts up the stealing function and makes it less concave (i.e., the returns to stealing do
not decrease so strongly).

61
The shareholder receives share (1 - α) of the returns from the funds that are actually
invested in the firm. The expected value of the firm‘s shares is therefore
Π = R(I - k(1 - αR)),
where P is the share value of the firm. This is the value of all the shares owned by both
shareholders and managers, which equals the total value of the firm minus the value of
stealing.
Differentiating with respect to R gives the ―absolute responsiveness,‖
ρa = δΠ/δR = I – k + 2Rkα,
which is the sensitivity of firm value to variations in R. This is always positive because
Johnson et.al. (2000a) have assumed that the optimal level of stealing is less than I. The
maximum value of stealing, given by the first-order condition when αR is zero, is k.
Johnson et.al. (2000a) assumed that there cannot be negative stealing, so k ≤ I, and thus
is adequate to ensure that ρa > 0.
There are two effects of a higher R. The first, direct effect is to increase the expected
payoff and thus increase the amount that the investor is willing to invest in the firm.
Holding the level of stealing constant, the direct effect shows that the value of the firm
increases. The second, indirect effect works because higher investment returns decrease
the optimal level of stealing, so δS*/δR < 0. Reduced stealing also increases the
expected payoff for shareholders and increases the firm value10
.
What is the effect on δΠ/δR of altering the penalty for managerial theft, k ? The effect
on the absolute responsiveness is
δρa/δk = 2Rα - 1.
10 In order to make the point, Johnson et.al. (2000a) presented a simplified model that ignores general equilibrium effects.
Assuming α is exogenous, the expected return for a shareholder varies between countries that have a different value of k. In
equilibrium this would not occur because shareholders would want to invest more in the country with a higher return. A complete model would include these general equilibrium effects.

62
For low values of αR, such that Rα < 1/2, a larger value of k (a lower penalty) implies a
reduction in δΠ/δR. For large values of αR, however, a larger value of k implies an
increase in δΠ/δR. The intuition for this result is that when αR is low, the manager is
already stealing a huge amount, so Π is already low in absolute terms and thus further
variations in R do not induce much additional stealing11
.
However, Johnson et.al. (2000a) receive an unambiguous prediction for the relative
responsiveness, ρr = (δΠ/δR)/Π = (I - k(1 - αR) + Rkα)/R(I - k(1 - αR)), which is the
sensitivity of firm value in percentage terms. The differentiation of this variation with
respect to k is
δρr/δk = Iα/(I – k + Rkα)2 > 0.
This impact is positive regardless of the α value. Note that the relation between absolute
and relative responsiveness is
δ(ρa )/δk = δ(Πρr)/δk = Π[δρr/δk] + [δΠ/δk](ρr).
The first term is positive. The second term contains δΠ/δk, which is negative. A higher
value of k (i.e., a weaker legal environment) implies that (δΠ /δR)/Π increases, so that
the value of the firm, P, becomes more sensitive in percentage terms to a variation in the
rate of return, R. The same result holds if they allow firms to borrow debt as well as
issue equity. However, the presence of debt implies a range of values for R within
which a lower value of R actually means reduced stealing because the manager steals
less (or even transfers funds into the firm if that is possible) in order to enable the firm
to service its debt and therefore preserve the possibility of future stealing. If R falls
sufficiently low, however, then the manager will choose to loot the firm and it will go
11 Differentiating absolute responsiveness with respect to k gives:
δρa /δk = δ2Π/δRδk = ( - δS/δk) + [ - R(δ2S/δRδk)].
The first term is always negative: a larger value of k increases the absolute level of stealing. But the second term is positive -
when k is larger, a given variation in R induces a smaller change in the level of stealing (due to the convex stealing costs). When the second term is relatively high in absolute terms, i.e., when R is large, then δ2Π/δRδk will be positive.
63
out of existence. Therefore, in the data, Johnson et.al. (2000a) look at the percentage
variation in firm values.
Besides the model by Johnson et.al. (2000a), Mitton (2002) further finds that firms
which have poorer minority shareholder protection have a negative impact on firm
performance during the East Asian financial crisis. His study complements the study by
Johnson et.al. (2000a) that corporate governance particularly minority shareholder
protection is a significant determinant of firm performance during periods of financial
crisis.
Jiang and Peng (2011) find that during the Asian financial crisis, family firms tend to
select certain control structures associated with principal-principal conflict. These
control structures are corporate pyramidal structures which provide family controlling
shareholders excess control rights as well as the appointment of an owner Chief
Executive Officer (CEO).
Based upon the empirical evidence by Johnson et.al. (2000a), Mitton (2002) and Jiang
and Peng (2011), minority shareholder protection is indeed a significant issue during
periods of financial crisis as the likelihood of principal-principal conflict occurring is
the highest. Since minority shareholder expropriation is a significant corporate
governance problem in emerging markets particularly during times of financial crisis,
corporate governance mechanisms can possibly be used to mitigate this problem.
2.4 CORPORATE GOVERNANCE MECHANISMS
Traditionally, corporate governance mechanisms are designed to mitigate the principal-
agent conflict which is prevalent in developed economies (Young et.al., 2008). These
include internal corporate governance mechanisms such as board of directors,
ownership concentration, executive compensation packages and external corporate
governance mechanisms such as product market competition, managerial labour market

64
and the market for corporate control (Demsetz and Lehn, 1985; Fama and Jensen,
1983b). Figure 2.4 illustrate these mechanisms.
Figure 2.4: Corporate Governance Mechanisms Designed to Mitigate the
Principal-Agent Conflict
Source: Demsetz and Lehn (1985), Fama and Jensen (1983b)
Figure 2.4 depicts a bundle of corporate governance mechanisms designed to mitigate
the principal-agent problem. It comes in a bundle as the effectiveness of a particular
corporate governance mechanism depends on the effectiveness of other mechanisms
(Davis and Useem, 2002; Rediker and Seth, 1995). In other words, one mechanism
may act as a substitute for or complement another mechanism. If one or more
mechanisms are less effective, then others will be relied on more heavily (Rediker and
Seth, 1995; Suhomliva, 2006).
Corporate Governance
Mechanisms Designed to
Mitigate the Principal-Agent
Conflict
Internal Corporate Governance
Mechanisms:
Board Of Directors
Ownership Concentration
Executive Compensation
External Corporate Governance
Mechanisms:
Product Market Competition
Managerial Labour Market
Market For Corporate Control

65
However, in emerging markets, since the major corporate governance problem is the
principal-principal conflict instead of principal-agent conflict; a different bundle of
corporate governance mechanisms are needed rather than those depicted in Figure 2.4
(Young et.al., 2008). This is because the institutional setting in emerging markets
where the principal-principal conflict is dominant and different from the institutional
setting in developed economies such as USA where the principal-agent conflict is more
prevalent. Such bundle may include bank monitoring, more effective independent
directors, etc and this bundle differs across different countries as each bundle is
dependent upon the institutional setting in each country (Guillen, 2000, 2001; La Porta
et.al., 1997, 1998, 2002; Suhomliva, 2006).
2.5 INSTITUTIONAL SETTING IN MALAYSIA
One of the emerging markets, which possess different institutional setting from
developed economies such as USA is Malaysia. Institutional setting in Malaysia is
unique in certain ways. This uniqueness is possibly one of the factors which may
contribute to the prevalence of principal-principal conflict in Malaysia. The
institutional setting in Malaysia constitutes three major parts, its political economy,
corporate governance reforms and regulatory framework.
2.5.1 Malaysia’s Political Economy
In Malaysia, the principal-principal conflict to a certain extent can be influenced by its
political economy. The main landscape for Malaysia‘s political economy from 1970
onwards was shaped by the New Economic Policy (NEP). The primary objective of the
NEP, formed in 1970, was to achieve national unity by eliminating poverty, regardless
of race and by ‗restructuring society‘ to achieve inter-ethnic economic equality between
the predominantly Malay bumiputras and the predominantly Chinese non-bumiputras
(Gomez and Jomo, 1997; Searle, 1999). The New Economic Policy (NEP) was

66
implemented during the last thirty-two years with the aim of promoting national unity
through the eradication of poverty among all Malaysians and the restructuring of society
to eliminate the identification of race with economic function. The NEP and later the
National Development Policy (NDP)12
basically, involves restructuring of corporate
stock ownership, employment and education (with the latter two often considered
together).
Although, the NEP has been successful to a certain extent, this restructuring has
generated a group of elite minorities who usually possess huge shareholding stakes in
large public-listed firms. This group of elite minorities are also very well politically
connected. In other words, the NEP had encouraged ownership concentration by an
elite group of minorities who are also politically connected (Gomez and Jomo, 1997;
Liew, 2007; Searle, 1999). This political connection enables large business groups to
practice political patronage and one of the major benefits is that these conglomerates
could obtain bank loans effortlessly from domestic banks via bank-directed lending as
the government has a huge influence on the loans provided (Ang, 2009; Ang and Sen,
2011; Gomez and Jomo, 1997).
This widespread practice of political patronage by business corporations, particularly
large business groups, in this country (Gomez and Jomo, 1997; Liew, 2007; Searle,
1999), can possibly motivate firms‘ controlling shareholders particularly those from
family firms, to expropriate minority shareholders by devoting some of the firms‘
resources obtained through political patronage and connections, for their own private
benefits or for the purpose of empire building by engaging in unprofitable business
ventures and excessive unrelated business diversification. In short, the NEP encourages
a rent-seeking culture among business corporations in this country (Gomez and Jomo,
1997; Liew, 2007; Searle, 1999) and hence, can possibly encourage minority
12 The NDP is an extension of the NEP with the same original objectives promulgated by the ruling government in 1990.
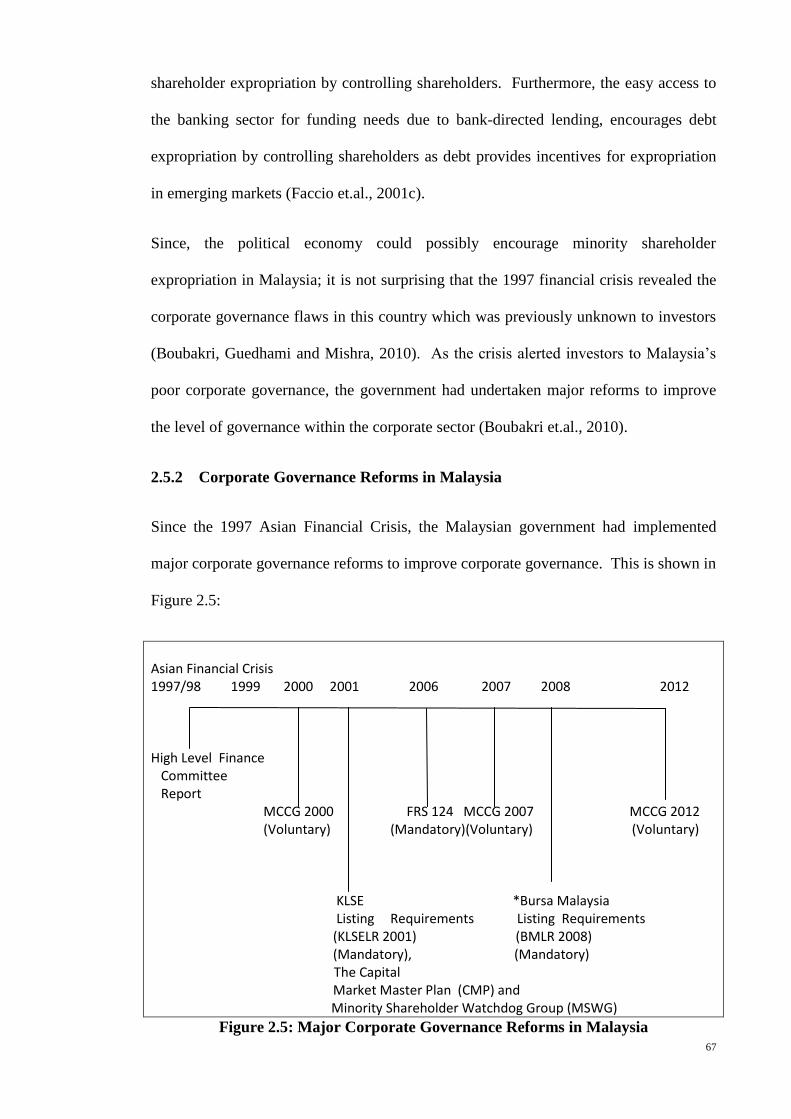
67
shareholder expropriation by controlling shareholders. Furthermore, the easy access to
the banking sector for funding needs due to bank-directed lending, encourages debt
expropriation by controlling shareholders as debt provides incentives for expropriation
in emerging markets (Faccio et.al., 2001c).
Since, the political economy could possibly encourage minority shareholder
expropriation in Malaysia; it is not surprising that the 1997 financial crisis revealed the
corporate governance flaws in this country which was previously unknown to investors
(Boubakri, Guedhami and Mishra, 2010). As the crisis alerted investors to Malaysia‘s
poor corporate governance, the government had undertaken major reforms to improve
the level of governance within the corporate sector (Boubakri et.al., 2010).
2.5.2 Corporate Governance Reforms in Malaysia
Since the 1997 Asian Financial Crisis, the Malaysian government had implemented
major corporate governance reforms to improve corporate governance. This is shown in
Figure 2.5:
Asian Financial Crisis 1997/98 1999 2000 2001 2006 2007 2008 2012 High Level Finance Committee Report MCCG 2000 FRS 124 MCCG 2007 MCCG 2012 (Voluntary) (Mandatory)(Voluntary) (Voluntary) KLSE *Bursa Malaysia Listing Requirements Listing Requirements (KLSELR 2001) (BMLR 2008) (Mandatory), (Mandatory) The Capital Market Master Plan (CMP) and Minority Shareholder Watchdog Group (MSWG)
Figure 2.5: Major Corporate Governance Reforms in Malaysia

68
One of the major post-1997 corporate governance reforms in this country is the
establishment of the High Level Finance Committee on March 24, 1998 in response to
the urgent need to raise standards of corporate governance by setting up a sound
corporate governance and best practices framework in Malaysia (Shim, 2006). The
Finance Committee on Corporate Governance chaired by the Secretary General of
Treasury, Ministry of Finance, was a smart partnership between the government and the
private sector. Its twelve member committee was represented by almost all sectors of
the business and regulatory communities including the Securities Commission, the
Financial Reporting Foundation, the Malaysian Accounting Standards Board (MASB),
the Registrar of Companies (ROC), the KLSE (later called Bursa Malaysia), the Central
Bank, Federation of Public-Listed Companies and the Association of Banks. Extensive
consultations with government ministries, private sector, independent consultants and
professional bodies were conducted during the term of office of the committee (Shim,
2006).
The terms of reference of the Finance Committee (Shim, 2006) are:
(i) to develop an acceptable definition of corporate governance for Malaysian
companies
(ii) to identify and clarify the role and responsibilities of key participants in the
corporate sector
(iii) to raise standards of corporate governance
(iv) to promote training and education for directors and
(v) to ensure effective enforcement mechanisms

69
The Committee started on the premise that corporate governance standards in Malaysia
were lacking and that there was a need to increase these standards. It submitted its final
report (after consultation with the various professional and administrative bodies) to the
Minister of Finance in February, 1999. The 275 page Report (commonly known as the
Green Book) has eight chapters. It broadly covers three areas namely: the establishment
of the Malaysian Code of Corporate Governance (MCCG), the reform of laws,
regulations and rules relating to corporate governance and training and education for
directors. It has made seventy recommendations. Many of them have been
implemented and some of them were even updated or implemented before the release of
the report, a move which was highly praised by those involved in the capital market
(Shim, 2006). Central to the report on corporate governance is the recommendation for
the establishment of the Malaysian Code on Corporate Governance (MCCG).
The Malaysian Code of Corporate Governance (MCCG) was established in 2000. The
recommendations set out in the MCCG are prescriptive in nature and fall under four
main parts:
Part (1) Principles;
Part (2) Best Practices;
Part (3) Exhortations to Other Participants; and
Part (4) Explanatory Notes (Wahab, How and Verhoeven, 2007).
In part (1) on Principles it addresses four main issues: board of directors, directors‘
remuneration, shareholders, and accountability and audit. A narrative statement in the
annual report of how the relevant principles have been applied is perceived adequate
disclosure for investors to assess the firms. In part (2) on the area of best practices; it
provides a set of guidelines or practices relating to the board of directors and

70
accountability and audit to assist firms in designing their approach to corporate
governance. Compliance is voluntary but firms are required to state in their annual
reports the extent of their compliance, with an explanation for any deviations. Part (3)
advice other participants addresses primarily institutional investors and auditors and the
enhancement of their role in corporate governance. In part (4) explanatory notes provide
further explanation of the three parts mentioned above. However, unlike part (2) Best
Practices, part (4) Guidelines on Explanatory Notes does not require firms to justify
deviations from best practices (Wahab et.al., 2007).
Despite significant improvements, the code was revised in 2007 (Securities
Commission, 2007). The MCCG 2007 emphasised strengthening the Board of
Directors and Audit Committees and ensuring that the Board of Directors and Audit
Committees discharge their roles and responsibilities effectively (Securities
Commission, 2007). To increase reforms, the Securities Commission (SC) further
established the Corporate Governance Blueprint 2011 in 2011 (Securities Commission,
2011b). This blueprint consists of recommendations focusing on shareholder rights,
role of institutional investors, board‘s role in governance, improving disclosure and
transparency, role of gatekeepers and influencers and public as well as private
enforcement (Asian Corporate Governance Association, 2012). In order to implement
the Corporate Governance Blueprint 2011, the Securities Commission further revised
the MCCG 2007 in 2012 (Securities Commission, 2012). The MCCG 2012, which
supersedes the 2007 code, sets out principles on structures and processes for companies‘
board so that the board could incorporate good corporate governance into their firms‘
business dealings and corporate culture (Securities Commission, 2012).

71
Despite the issuance of the MCCG in 2000, 2007 and 2012, these codes of corporate
governance are possibly ineffective in improving corporate governance (i.e. reducing
minority shareholder expropriation) due to the voluntary nature of the adoption of its
principles. Controlling shareholders in Malaysia possibly view the adoption of these
principles as not mandatory, and this provides them incentives to expropriate minority
shareholders, even though, they are still required to state in their annual reports the
extent of their compliance, with an explanation for any departure (Securities
Commission, 2007, 2012; Wahab et.al., 2007).
Subsequent to the establishment of MCCG in 2000, another significant corporate
governance reform in this country is the issuance of the revamped listing requirements
in January, 2001 by Bursa Malaysia (Shim, 2006). This was a move widely seen as a
major effort to strengthen the capital market and the securities industry in Malaysia.
The new listing requirements are perceived to be highly effective in the area of financial
reporting, disclosure of corporate governance matters and continuing listing obligations.
The revamped listing requirements of 2001 have devoted an entire chapter (chapter 15)
to corporate governance. It requires the listed issuer and its directors to conform with
the requirements of Chapter 15 which deals with board composition (at least one third
of the total board must be independent directors), restrictions on the number of
directorships which may be held by a person to not more than 25 directorships),
prescribing an audit committee of no less than three members with a majority being
independent directors, provisions as to external auditors including their role,
appointment and removal, adaptation of MCCG with a comply or explain approach,
.responsibility statements‘ by the directors and the training of directors (Shim, 2006).

72
In 2008, the listing requirements were further revamped to further strengthen the capital
market and the securities industry in this country. The Bursa Malaysia listing
requirements is argued to be a more effective tool in promoting good corporate
governance among Malaysian public-listed firms because it is mandatory unlike the
MCCG which is voluntary. Bursa Malaysia has the power to reprimand, fine or
suspend a listed firm and/or its defaulting dealer‘s representative. It also has the power
to issue a caution letter, private or public reprimand, impose a fine, suspend trading, or
delist an issuer from the official list of the exchange, with public reprimand and fines
being the most common disciplinary actions (Shim, 2006). However, the powers
exercisable by Bursa Malaysia, being an inferior tribunal are not absolute. They are
always subject to the usual remedy of judicial review with the usual test of good faith
and legality. Hence, although Bursa Malaysia listing requirements can be argued to be a
more effective tool in promoting good corporate governance, it is not an entirely
effective one due to the possibility of judicial review of its decisions (Shim, 2006).
Hence, this may provide opportunities for controlling shareholders to expropriate
minority shareholders as they view that the disciplinary actions taken by Bursa
Malaysia can be subjected to judicial review. In the same year Bursa Malaysia issued
its revamped listing requirements in 2001, The Malaysian Capital Market Master Plan
(CMP) was also established.
The Capital Market Steering Committee was formed in 2001 under the auspices of the
Securities Commission with a vision of having an internationally competitive capital
market in all core areas (Shim, 2006). The committee has the following terms of
reference (Shim, 2006):
(i) formulate a comprehensive vision and programme for the development of
the Malaysian Capital Market going forward;

73
(ii) formulate a framework for the orderly and effective sequencing of further
deregulation and liberalisation; and
(iii) identify and map the direction for the strategic positioning of the Malaysian
capital market both domestically and externally.
The works of the Committee were largely undertaken by the Securities Commission.
The seven men Committee chaired by the Chairman of the Securities Commission
undertook extensive consultations with experts in the industry at home and
internationally, professional bodies, government ministries as well as members of the
public. Its 291 page report is most comprehensive and prolifically written. It has six
key objectives, 24 strategic initiatives and 152 specific recommendations, 10 of which
relating to corporate governance and 15 relating to regulatory framework. In so far as
corporate governance is concerned, the Steering Committee recommended as follows:
Table 2.4: Corporate Governance Recommendations in Capital Market Masterplan (2001)
No. Recommendation
1 The recommendations contained in the report on corporate governance will be effected
in a timely and comprehensive manner.
2 The Securities Commission (SC) will further facilitate efforts towards enhancing
shareholder rights, especially those of minority shareholders and broadening avenues
for private enforcement of these rights.
3 Minority shareholders‘ rights in respect of related transactions will be further
strengthened.
4 Public-listed firms will be required to provide appropriate shareholder value
disclosures for securities issuance, restructuring, takeovers and merger exercises.
5 A set of principles best practices and standards will be developed to encourage
institutional investor activism in corporate governance and the promotion of
shareholder value recognition. The SC will strongly support the efforts of Minority
Shareholder Watchdog Group (MSWG) in promoting shareholder activism in
Malaysia.
6 The SC will work with relevant industry bodies in enhancing the quality and
independence of auditors of public-listed firms.
7 The SC will encourage the improvement of channels of communication between firms
and their shareholders.
8 The SC and Bursa Malaysia will initiate further measures to promote timely,
comprehensive and regular dissemination of material and relevant company
information to shareholders.
9 Efforts to further enhance disclosures in annual reports by public-listed firms will be
examined.
Source: Shim (2006)

74
The futuristic CMP can be characterised into three distinct phases premised on the
vision, objectives and strategic initiatives and simultaneously taking into account the
practical issues involved in their implementation (Shim, 2006):
(1) Phase 1 (2001-2003): Strengthen domestic capacity and develop strategic and
nascent sectors,
(2) Phase 2 (2004-2005): Further strengthen key sectors and gradually liberalise market
access,
(3) Phase 3 (2006-2010): Further expansion and strengthening of marker processes and
infrastructure towards becoming a fully-developed capital
market and enhancing international positioning in areas of
competitive advantage.
An implementation task force through the Capital Market Advisory Council was
appointed by the SC to advise the Commission on issues relating to the implementation
of the CMP. As part of the CMP implemented initiatives, a tripartite High Level
Enforcement Committee on corporate governance was established with the involvement
of the SC, Companies Commission of Malaysia (CCM) and the Royal Malaysian Police
Force (PDRM) as members to implement strong and proactive market surveillance and
enforcement mechanisms to promote good corporate governance. The tripartite
Committee reports directly to the Prime Minister (Shim, 2006). So far, there is no
direct evidence of the committee in making arrests, charges or convictions against white
collar criminals. Hence, the effectiveness of CMP i.e. through the tripartite High Level
Enforcement Committee in proactively enforcing good corporate governance among
Malaysian public-listed firms is questionable. This provides an opportunity for
controlling shareholders to take advantage of this ineffectiveness to expropriate
minority shareholders.
75
Aside from Bursa Malaysia‘s revamped listing requirements and the CMP, another
important corporate governance reform in Malaysia is with respect to RPTs disclosure.
In Malaysia, all RPTs have to be disclosed (Rachagan, 2006). In 2006, the International
Accounting Standard (IAS) 24 on related party disclosures has been adopted as an
accounting standard in Malaysia and it is called Financial Reporting Standards (FRS)
124 (Rachagan, 2006). The objective of this standard is to ensure that a firm‘s financial
statements contain the necessary disclosures to draw attention to the possibility that its
financial position may have been affected by the existence of RPTs (Financial
Reporting Standard 124, 2010). Some examples of RPTs which need to be disclosed
include those transactions which are analysed in this study. These are RPTs which are
likely to result in expropriation such as asset acquisitions, asset sales, equity sales,
trading relationships and cash payments to a related party (Financial Reporting Standard
124, 2010). Since the purpose of FRS 124 is to disclose RPTs to investors, it is logical
to argue that this disclosure requirement can possibly help increase the awareness of
investors on RPT activities. As a consequence of this increased awareness, it is also
rational to assert that investors may increase their shareholder activism to counter
minority shareholder expropriation through RPTs.
However, despite the implementation of FRS 124 since 2006, it is found that there is a
possibility of insufficient information on RPTs being disclosed by companies‘
controlling shareholders (CFA, 2009). With insufficient RPTs disclosure, minority
shareholders tend to lose out because those undisclosed RPTs could be detrimental to
their interests. Moreover, relevant material information on RPTs is not always easily
identifiable and this information may not easily be tracked by the company‘s internal
controls. All these make it difficult for all relevant information on RPTs to be properly
disclosed (CFA, 2009). Therefore, the implementation of FRS124 can be considered to

76
be not entirely effective in raising the awareness and increasing shareholder activism on
expropriation through RPTs due to the possibility of incomplete disclosure.
Another important corporate governance development in Malaysia is the creation of
external corporate governance mechanisms to ensure fair treatment and protection of
minority shareholder rights (Wahab et.al., 2011). Given the fact that ownership
structure in Malaysian companies is highly concentrated, minority shareholder
protection becomes more significant. Therefore, to monitor and protect the rights of
minority shareholders and to promote shareholder activism, the High Level Finance
Committee recommended the establishment of the Minority Shareholder Watchdog
Group (MSWG) in February, 1999 (Wahab et.al., 2011). In 2001, MSWG was formally
established and funded by five local institutional investors, namely; Employees
Provident Fund (EPF), The National Equities Corporation (PNB), The Armed Forces
Fund Board (LTAT), Pilgrims Fund Board (Lembaga Urusan Tabung Haji) and the
Social Security Organisation (SOCSO).
The main roles of MSWG are to act as a platform in initiating collective shareholder
activism on unethical or disputable practices by management of public-listed firms;
monitoring of breaches and non-compliance in corporate governance practices by
public-listed companies; to disclose current corporate governance practices to
stakeholders and provide training, education and awareness programmes to promote
shareholder activism and the benefits of good corporate governance practices (Wahab
et.al., 2011). With the formation of MSWG, it is expected that the conflict of interest
between the controlling shareholders and minority shareholders can be reduced as this is
one avenue of market discipline to encourage good corporate governance amongst
public listed companies with the objective of raising shareholder value over time
(MSWG, 2012). However, the effectiveness of MSWG in reducing minority
shareholder expropriation is disputable because unlike the Securities Commission (SC),

77
it does not possess the legal authority to bring cases of minority shareholder
expropriation to the courts. Its main role is only to promote shareholder activism to
protect the rights of minority shareholders by acting as external monitors of corporate
governance practices in public-listed firms. Therefore, the role of MSWG in reducing
the problem of minority shareholder expropriation is deemed to be not entirely
effective. In fact, Azizan and Ameer (2012) investigate the effect of shareholder
activism led by MSWG on the level of RPTs in Malaysian family-controlled firms and
find that it had not much impact on the level of these transactions within these firms.
This provides an additional support to the argument that shareholder activism promoted
by MSWG is not entirely effective in reducing the problem of minority shareholder
expropriation particularly through RPTs in family-controlled firms.
Although corporate governance reforms can be considered to play a central role in
assisting the improvement of corporate governance in Malaysia, the existing regulatory
framework is also crucial as corporate governance activities such as RPTs are regulated
by it. Two significant regulatory frameworks which regulate RPTs are the Companies
Act (1965) Sections 131-133 and the Listing Requirements (World Bank, 2005).
2.5.3 Regulatory Framework on Related Party Transactions (RPTs) in Malaysia
In Malaysia, the Companies Act (1965) plays a significant role in regulating RPTs. For
this purpose, the relevant sections in the Companies Act (1965) are Section 131, 131A,
132C, 132E, 133 and 133A (Thillainathan, 1999). However, these sections contain
loopholes, which could be taken advantage of by controlling shareholders. A closer
review of these Sections reveals several weaknesses, which could be manipulated by
controlling shareholders particularly from family firms to expropriate through RPTs
(Thillainathan, 1999):

78
a) Section 132E of the Companies Act (1965) only embraces transactions with
directors or persons connected with directors. It does not embrace transactions
between a company and a substantial shareholder. Section 132G recognises the
concept of a substantial shareholder in RPTs. Therefore, the ambit of Section
132E should be extended to cover substantial shareholders and persons
connected to substantial shareholders.
b) Section 132E of the Companies Act (1965) only requires that RPTs be disclosed
and approved by shareholders but it does not prohibit the related party from
exercising its voting rights on such transactions (World Bank, 2005).
Amendments should be considered to require the related parties (and in
particular when the ambit of the section is expanded to cover substantial
shareholders) to abstain from voting on interested party transactions (World
Bank, 2005).
c) There are also weaknesses in existing legal provisions with respect to a
substantial acquisition or disposal, which requires shareholders approval. Koh
(1997) argued that Section 132C of the Company‘s Act (1965) is ambiguous
with respect to the scope of the meaning of ―undertaking‖, ―property‖ and
―substantial values‖; leading to doubts as to whether in any one transaction,
approval of a general meeting is needful. Furthermore, it can be disputed that
only acquisition or disposal, which materially and adversely affects the
performance or financial position of the company, would require general
meeting approval. It can also be debated in anyone case whether the transaction
is adverse to the performance of the company or its financial position.

79
These regulatory loopholes indicate a weak legal system in the governance of RPTs,
which could be taken advantage by family controlling shareholders. Coupled with low
cash-flow-to-control rights ratio (Claessens et.al., 2000a) and poor legal enforcement
(Thillainathan, 1999; World Bank, 2005), minority shareholder expropriation is indeed
a significant corporate governance problem in Malaysia particularly in family-
controlled firms. Hence, the following section provides a detailed explanation of family
firms and how its existence impedes the minority shareholders through expropriation
activities.
2.6 CONCLUSION
This chapter explain the various issues related to the Malaysian institutional
environment and ownership structure and how they relate to minority shareholder
expropriation. Basically, this chapter discuss the differences between the traditional
principal-agent conflict and principal-principal conflicts as outlined in Table 2.3. The
next chapter will explain issues related to family firms and minority shareholder
expropriation.

80
CHAPTER THREE
FAMILY FIRMS AND MINORITY SHAREHOLDER EXPROPRIATION
3.1 INTRODUCTION
This chapter will discuss issues related to family firms and minority shareholder
expropriation. Section 3.2 will discuss issues related to family firms. Section 3.3 will
discuss issues related to minority shareholder expropriation in family firms. Section 3.4
will discuss about RPTs. Section 3.5 will discuss about the tenure of independent
directors. Section 3.6 will discuss the issues related to the domestic banking channel
used by firms. Section 3.7 will discuss the moderating effects of controlling
shareholders‘ ownership. Section 3.8 concludes.
3.2 FAMILY FIRMS
3.2.1 Definition of Family Firms
Family firms have always been significant to free-market economies. They have been
defined in various ways by theorists in accordance with the research being conducted at
that time. First, family firms is defined based on the degree of ownership and/or
management by family members, e.g. Alcorn (1982), Barnes and Hershon (1976), Barry
(2004), Dyer (1986), Lansberg, Perrow and Rogolsky (1988). Second, others use the
degree of family involvement to define family firms (Beckhard and Dyer, 1983; Davis,
1983). Third, some theorists define family firms as a potential for generation transfer
(Churchill and Hattern, 1987; Ward, 1987).
Furthermore, according to empirical studies e.g. McConaughy, Walker, Henderson and
Mishra (1998), Mishra and McConaughy (1999) and Sraer and Thesmar (2007); they
view family controlled firms as firms whose CEOs are either the founder or a
descendant of the founder. Furthermore, others define firms as family firms when

81
families hold shares in the firms according to a certain level of equity stake, and also
whether family members appear on the board (Anderson and Reeb, 2003; Yammeesri
and Lodh, 2004; Yeh, Lee and Woidtke, 2001). In fact, in the case of a public family
business, the term ownership brings a similar meaning for control (Churchill and
Hatten, 1987).
This study utilises the definition of family firms as suggested by Barnes and Hershon
(1976) whereby a firm is classified as a family firm if an individual or members of a
single family is the controlling shareholder; that is a person (rather than a state,
corporation, management trust or mutual fund) can obtain enough shares to assure at
least 20% of the voting rights and the highest percentage of voting rights in comparison
to other shareholders (Bjuggren, Johansson and Sjogren, 2011; Chakrabarty, 2009; De
Vries and Manfred, 1993; La Porta et.al. 1999). The definition by Barnes and Hershon
(1976) as well as the 20% threshold is used in this study as the majority (i.e. 76%)13
of
family firms‘ controlling shareholders in the Main Market of Bursa Malaysia holds at
least 20% shareholding.
Moreover, in order to be classified as a family firm, there must be family involvement
in the management of the firm and this requires at least one member of the controlling
family hold a managerial position (i.e. board member, CEO or chairman, chairman of
the syndicate pact) (Cascino et.al. 2010). Hence, the definition of family firms used in
this study is based upon a threshold of 20% family shareholding as well as family
involvement in the management of the firm. This definition is stricter than those used
by Ibrahim (2009) and Munir and Gul (2011), where these authors also studied
Malaysian family firms. Ibrahim (2009) define family firms as firms which have the
presence of a family member on the board or the family members must hold at least
13
As found from the sample data in this study.

82
20% equity stake in the firm. Munir and Gul (2011) define family firms as firms where
the family holds at least 10% equity stake in the firm.
Apart from the definition of family firms, there are also certain characteristics and
problems within these types of firms.
3.2.2 Family Firm Formation
Social scientists have discussed various reasons which can explain the existence of
family firms (Bhaumik and Gregoriou, 2010). Economists argue that the existence of
family firms is a consequence of imperfections in the market for managerial talent or a
market for corporate control (Burkart, Panunzi and Shleifer, 2003). In the absence of a
market for managerial talent, for example, firms may need to depend on successive
generations of the founding families to provide managerial personnel. Similarly, if
there is no market for takeovers, such that it is difficult to credibly threaten the
management of poorly performing firms with the prospect of a takeover, the
convergence of management and ownership could be a (second best) response aimed at
mitigating Agency Problem Type I. The latter argument has been extended to argue
that family ownership of firms is an optimal outcome in situations where the cost of
contract enforcement is high, such that informal agreements or social norms backed by
the threat of social sanctions are used to facilitate transaction of resources and output,
thereby explaining the ubiquity of family firms (Redding, 1990; Peng and Heath, 1996).
Furthermore, the concentrated ownership structure found in family firms is a rational
response to the institutional environment confronting these firms. The lower investor
protection and lack of legal development in emerging markets such as those in East
Asia increase the cost of enforcing arm‘s-length contracts. As a result, concentrated
ownership arise within family firms as family owners possess the incentives to increase
their control of the firm in order to extract private benefits and outside investors do not
83
have the incentives to invest in these firms due to the lower minority shareholder rights
protection offered by the institutional structures in these markets (Redding, 1990;
Yeung, 2006).
On the other hand, the market imperfections argument suggests that family firms might
be an outcome of factors such as altruism, externalities associated with social capital
and high cost of contract enforceability. It is now well established in the labour
economics literature that even in firms which are not characterised by familial
relationship among sections of the management and employees, individual effort is
determined by reciprocal altruistic gestures the genesis of which lie in norms (Akerlof,
1982). The collaboration that results from such reciprocal gestures can lead to better
firm performance (Rizov and Croucher, 2009).
Similarly, reciprocal altruism among family members could reduce their reservation
price for key resources, thereby allowing them to outbid (or undercut) non-family firms
in the product market (Eaton, Yuan and Wu, 2002). Similarly, while a firm can prosper
with addition to its social capital, it may not acquire this social capital from a widely
dispersed group of individuals because the private benefits of these individuals would
be much less than the aggregate social capital of the firm. If the firm is owned by a
family, it can however acquire the social capital of the family, an institution which
heavily invests in social capital (Arregle, Hitt, Sirmon and Very, 2007).
Basically, when family firms are formed, they have certain characteristics which
differentiate them from non-family firms.
84
3.2.3 Family Firm Characteristics
Family firms differ from non-family firms in that family firms are governed and/or
managed by members of the same family or a small number of families with a vision of
continuing the business across generations (Chua, Chrisman and Sharma, 1999). Daily
and Dollinger (1992) argue that family businesses reflect different structural, process
and strategic differences as compared with professionally managed non-family firms.
They also suggest that family owners behave differently from professional managers
and that firms managed by families are generally characterised by centralised decision-
making processes. In addition to that, the type of strategic and operational planning
undertaken by these two groups differs because family owners have distinct goals from
professional managers. Ward (1988) further argues that strategic planning for family
firms differs from professionally managed non-family firms because family owners
must incorporate family issues into their strategies and planning processes. He finds
that family firms are reluctant to utilise strategic planning and strategy formulation as
well as implementation due to a lack of formal training, insufficient knowledge of
management techniques (Dyer, 1989), fear of losing control (Hutchinson, 1995; Storey,
1994) and beliefs that professionalisation is unnecessary. Family firms also have their
own business goals and objectives which are different from professionally non-family
managed firms. Furthermore, File, Prince and Rankin (1984) and Dunn (1995) argue
that family firms possess complex, multiple goals and varying priorities compared to
non-family firms.
In terms of financing decisions, Croci, Doukas and Gonenc (2011) find that family-
controlled firms raise less equity capital and more debt capital compared to non-family
firms. The financing policies of the former are influenced by control motives. While
information asymmetry in family firms favour debt financing, control considerations
exert a larger influence on debt over equity financing. Moreover, Croci et.al. (2011) find

85
that family-controlled firms are more likely to issue long-term than short-term debt,
indicating that they are viewed by credit markets as non-risk-seeking firms. The non-
risk-seeking behaviour of family firms is confirmed by the nature of their investment
decisions. Barth, Gulbrandsen and Schone (2005) and Croci et.al. (2011) find that
family-controlled firms commit less capital resources in R&D expenditures and high-
risk investments compared to non-family firms; and thus, family firms could miss
profitable investment opportunities. Feng and Li (2009) further point out that family
firms tend to pay fewer cash dividends compared to non-family firms.
Gama and Galvao (2012) argue that there are particular attributes of family firms.
Some of these attributes include long CEO tenures (typically more than 15 years) and
concern for subsequent family generations. Family firms are also more likely to take a
long-term orientation in making strategic investments (Lee, 2006). These type of firms
also have to deal with additional issues, namely family ones (Schulze et.al., 2001),
which might be resource-consuming. Gomez-Mejia, Larraza-Kintana and Makri (2003)
argue that family firms are less innovative compared to non-family firms. Dalton and
Daily (1992) further argue that family firms are more efficient forms of organisation
than non-family firms due to less separation between ownership and control.
Fan, Wong and Zhang (2005) argue that family firms tend to control their listed firms
through pyramidal structures14
due to difficulties in obtaining external financing. This is
consistent with the studies by Williamson (1985) and Stein (1997) who believe that the
internal capital market based upon the pyramidal structure can relieve a family-
controlled firm from funding difficulties.
14 Pyramidal structures will be discussed in more detail in Sections 3.3.2 and 3.3.3 of this research.

86
Aside from the differences between family firms and non-family firms, these types of
firms are also mostly found in most parts of the world outside USA and UK. La Porta
et.al. (1999) document that most large firms in most other countries besides USA and
UK are family-owned. Fukuyama (1996) and Rajan and Zingales (1998) find that East
Asian firms are highly concentrated and usually owned by families. In most East Asian
countries, wealth is very much concentrated in the hands of a few families and links
between government and business are extensive (Claessens et.al., 1999b). Another
significant characteristic of family firms is the family business group structure.
3.2.4 Family Business Groups
Another common feature of corporations in emerging markets is family business groups
(Ghemawat and Khanna, 1998; Peng and Delios, 2006). A business group is a
collection of legally independent firms that are bound by economic (such as ownership,
financial and commercial) and social (such as family, kinship and friendship) ties (Yiu,
Bruton and Lu, 2005). Each member firm in a business group may be a distinct legal
entity that publishes its own financial statements, possess its own board of directors, and
is responsible to its own shareholders. This is different from conglomerates in
developed markets where individual lines of business typically do possess any of these
properties (Khanna and Rivkin, 2001). Large family businesses in emerging economies
often are organised around business groups with different affiliated companies being
run by various family members or branches (Biggart and Hamilton, 1992; Wilkinson,
1996). Business group networks, together with family structure are some of the key
institutional features characterising emerging economies (Hamilton and Biggart, 1988).
In family business groups, informal ties such as cross-holdings, board interlocks and
coordinated actions are strong (Chung, 2006; Dieleman and Sachs, 2006).

87
Family business groups can be further divided into those that emphasise vertical
strategies versus those that emphasise horizontal strategies. Vertical strategies are
primarily used to overcome product market and labour market failures, while horizontal
strategies are more useful in overcoming capital market failures (Li, Ramaswamy and
Petit, 2006). In general, family business groups especially those with high levels of
horizontal product diversification may provide advantage in emerging economies
(Chakrabarti, Singh and Mahmood, 2007; Khanna and Palepu, 2000, Wan, 2005). This
is primarily because they can substitute capital for weak institutional environments
(Guillen, 2000; Li et.al., 2006; Wan, 2005). For example, they could facilitate
technology transfer or inter-group capital allocation which otherwise might not be
possible because of insufficient infrastructure (Zheng, Anand and Mitchell, 2005).
While there are benefits of family business groups, they have particular disadvantages.
They tend to be large cumbersome organisations which carry coordination and
administration costs (Bae, Kang and Kim, 2002; Claessens et.al., 2002; Ferris, Kim and
Kitsabunnarat, 2003; Joh, 2003). Poor performance of family business groups are in
part due to problems in coordinating and allocating resources between the affiliated
members (Isobe, Makino and Goerzen, 2006; Mursitama, 2006). The low transparency
of family business groups makes it difficult for minority shareholders to determine
where control is located. Thus, this makes it hard to identify and challenge unfair intra-
group transactions (Chang, 2003) since family business networks provide significant
collusion opportunities or unethical transactions (Hoskisson et.al., 2000; Woodruff,
1999). Therefore, business group affiliation provides a means by which controlling
shareholders can expand control and thus increase the likelihood of minority
shareholder expropriation (Khanna and Rivkin, 2001).
One of the Asian countries which possess a large number of family business groups is
Malaysia (Ibrahim and Samad, 2010).

88
3.2.5 Family Businesses in Malaysia
Family businesses form an essential part of the Malaysian economy. It is estimated that
family firms contribute more than half of Malaysia‘s Gross Domestic Product (GDP)
(Ngui, 2002). Family firms do not embrace openness in the firm‘s practices and they
still practice a similar business culture to the founders (Ow-Yong and Cheah, 2000). A
survey by Jasani (2002) finds that the majority of Malaysian family firms are small-
scale; the founders manage the firm with assistance from their children and relatives;
and the founders do not force the children to join the firms, unless the children
themselves are willing to work with their families. Gomez (2004) argues that family
firms emerged in Malaysia due to the difficulties migrants encountered in securing start-
up capital and recruiting labour. Chinese family businesses in Malaysia possess a
history of intra-ethnic business partnership. This business tradition exists among
migrants in the colonial period with some firms failed and some still operating until
today (Gomez, 2004). In Malaysia, most public-listed firms are owned or controlled by
families and they are inherited from their own ancestors (Rahman, 2006). Such firms
include Genting Group, Kuok Group, Lion Group, YTL Group, Mah Sing Group, etc.
The number of Malaysian firms is increasing yearly due to the positive economic
growth (Pricewaterhouse Coopers, 1998; Claessens and Fan, 2002; Haniffa and Cooke,
2002; Soederberg, 2003). Although, some of the established Malaysian family business
groups such as Sapura, Melewar, Kuok, Genting, YTL, Tan Chong, IOI, Oriental and
Berjaya Group have ventured into diverse economic sectors; there are also smaller firms
such as Habib and Kamdar which maintain their business within their respective sectors.
The established family business groups also contribute to the number of richest people
in Malaysia (Forbes, 2012). According to the top 40 list of Malaysia‘s richest people,
Tan Sri Robert Kuok dominates the chart. His outstanding wealth accounted for

89
approximately RM 38 billion or 19.24 percent of the wealth of the 40 richest. The top
ten wealthiest, account for 72.64 percent of the top 40‘s wealth (Forbes, 2012).
Tan Sri Robert Kuok, also known as the ―Sugar King‖, conquered the fundamentally
typical economy assets such as consumer edibles, property and shipping, which
combined to provide him a RM 7.6625 billion disparity with his closest rival,
telecommunications tycoon T. Ananda Krishnan (Forbes, 2012). Singh (2008) states
that Kuok acquired the remaining 55.5 percent stake in his media group of SCMP
Group Ltd with a cash offer of HKD 2.37 billion or HKD 2.75 per share. Previously, he
was also successful in taking over the Singapore based Pacific Carriers and had a huge
investment with the flagship of PPB Group Bhd. The PPB Group, which is involved in
the government project of ―Iskandar Malaysia‖, is one of the biggest property
development projects in Malaysia.
Despite the enormous wealth that some of the family owners garner, the overall
concentration of control among Malaysian public-listed family firms is still high as
discussed earlier and presented in Table 2.1 (Carney and Child, in press). Due to the
high concentration of control, Morck and Yeung (2003) and Bloom and Van Reenen
(2007) argue that in emerging markets such as Malaysia, family controlled firms may
give rise to serious corporate governance problems such as the principal-principal
conflict. The next section discusses the reasons why principal-principal conflict or
minority shareholder expropriation is more prevalent in family firms.

90
3.3 MINORITY SHAREHOLDER EXPROPRIATION IN FAMILY FIRMS
There are several reasons why principal-principal conflict is more prevalent in family
firms particularly in emerging markets. One of these reasons is the relatively high
separation of ownership rights to control rights.
3.3.1 Separation of Cash-flow Rights (Ownership Rights) to Control Rights
(Voting Rights)
Edwards and Weichenrieder (2004) defines cash-flow rights (or ownership rights) of a
controlling shareholder as the fraction of the firm‘s profits to which he is entitled
whereas his control rights (or voting rights) refers to his ability to influence the way the
company is run. The control rights of ownership of firms can be separated from the
cash-flow rights in two main ways. Firstly, firms can issue classes of shares that differ
in terms of their relative proportion of voting rights and dividend entitlement.
Secondly, even if all shares have the same voting rights, but engages in pyramiding, i.e.
ownership via a chain of firms provides another method of separating control and cash-
flow rights (Edwards and Weichenrieder, 2004). The process of how pyramiding can
separate cash-flow rights and control rights will be shown in the next section. Edwards
and Weichenrieder (2004) further argue that the distinction between the control rights
and cash-flow rights of the controlling shareholder has been central to the analysis of
conflict of interest. A low cash-flow-to-control rights ratio of the controlling
shareholder indicates his higher ability to influence how the firm is run with lower
ownership stakes. This increases his ability to obtain private benefits of control at the
expense of minority shareholders. Vice versa, a high cash-flow-to-control rights ratio
signifies that his incentives are closer aligned with those of minority shareholders.
Thus, the incentives of the controlling shareholder to expropriate minority shareholders
will be lower (Edwards and Weichenrieder, 2004). Table 3.1 shows that overall, the
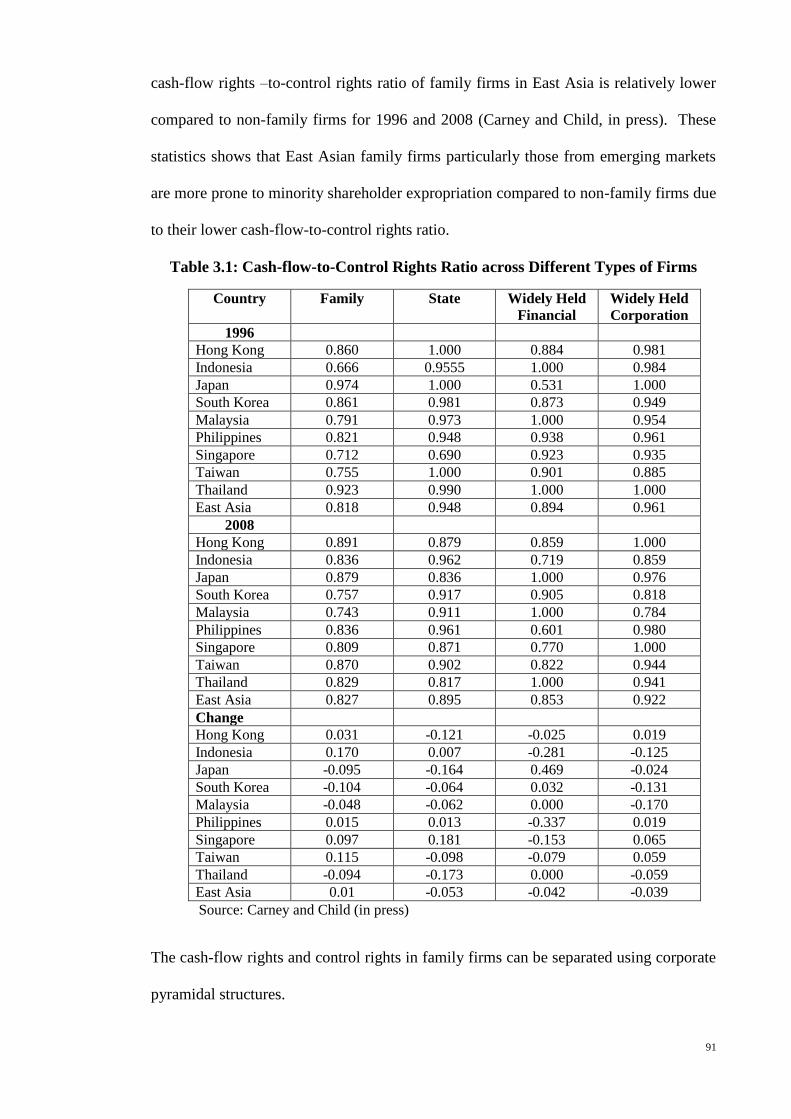
91
cash-flow rights –to-control rights ratio of family firms in East Asia is relatively lower
compared to non-family firms for 1996 and 2008 (Carney and Child, in press). These
statistics shows that East Asian family firms particularly those from emerging markets
are more prone to minority shareholder expropriation compared to non-family firms due
to their lower cash-flow-to-control rights ratio.
Table 3.1: Cash-flow-to-Control Rights Ratio across Different Types of Firms
Country Family State Widely Held
Financial
Widely Held
Corporation
1996
Hong Kong 0.860 1.000 0.884 0.981
Indonesia 0.666 0.9555 1.000 0.984
Japan 0.974 1.000 0.531 1.000
South Korea 0.861 0.981 0.873 0.949
Malaysia 0.791 0.973 1.000 0.954
Philippines 0.821 0.948 0.938 0.961
Singapore 0.712 0.690 0.923 0.935
Taiwan 0.755 1.000 0.901 0.885
Thailand 0.923 0.990 1.000 1.000
East Asia 0.818 0.948 0.894 0.961
2008
Hong Kong 0.891 0.879 0.859 1.000
Indonesia 0.836 0.962 0.719 0.859
Japan 0.879 0.836 1.000 0.976
South Korea 0.757 0.917 0.905 0.818
Malaysia 0.743 0.911 1.000 0.784
Philippines 0.836 0.961 0.601 0.980
Singapore 0.809 0.871 0.770 1.000
Taiwan 0.870 0.902 0.822 0.944
Thailand 0.829 0.817 1.000 0.941
East Asia 0.827 0.895 0.853 0.922
Change
Hong Kong 0.031 -0.121 -0.025 0.019
Indonesia 0.170 0.007 -0.281 -0.125
Japan -0.095 -0.164 0.469 -0.024
South Korea -0.104 -0.064 0.032 -0.131
Malaysia -0.048 -0.062 0.000 -0.170
Philippines 0.015 0.013 -0.337 0.019
Singapore 0.097 0.181 -0.153 0.065
Taiwan 0.115 -0.098 -0.079 0.059
Thailand -0.094 -0.173 0.000 -0.059
East Asia 0.01 -0.053 -0.042 -0.039
Source: Carney and Child (in press)
The cash-flow rights and control rights in family firms can be separated using corporate
pyramidal structures.

92
3.3.2 Corporate Pyramidal Structures
Pyramidal ownership structure is defined as an entity whose ownership structure
displays a top-down chain of control (La Porta et.al., 1999). In such structures, the
controlling shareholders which are usually family owners are located at the apex and
what follows below are successive levels of firm subsidiaries. With a pyramid structure,
a family controls multiple firms, each becoming a member of an informal business
group (Almeida and Wolfenzon, 2006). Guillen (2000) argue that the proponents of the
resource-based view emphasises controlling shareholders‘ contributions, which suggest
that corporate pyramidal structures may be beneficial to a firm‘s performance.
Essentially, business groups form an internal capital market where resource allocation is
made within groups. Other group members in the pyramid may provide useful
information, access to finances and technologies, and significant social interactions
(Carney, Gedajlovic, Huegens, Van Essen and Van Oosterhout, 2011; Khanna and
Yafeh, 2007). If the holding company fails to perform financially, other member firms
may come to rescue it by injecting assets such as funds and talents (Estrin, Poukliakova
and Shapiro, 2009; Gedajlovic and Shapiro, 2002; Hoskisson, Cannella, Tihanyi and
Faraci, 2003; Li et.al., 2006). As a result, pyramid firms may outperform independent
firms without such pyramid/business group affiliations (Bruton, Ahlstrom and Wan,
2003; Peng, 2003). However, it is argued that this is unlikely to occur because the cost
of corporate pyramidal structures outweigh its benefits as the internal capital market in
the pyramidal structures is very likely to be abused by controlling shareholders in
countries with weak investor protection such as those in emerging markets.

93
This abuse occurs as a result of the separation of actual ownership and control in firms
located at the lower part of the pyramid structure (Claessens et.al., 2000a). Ownership
and control is separated because the pyramid structure enables the controlling
shareholders particularly from family firms to garner control disproportionately to the
amount of ownership he has in every one of the successive levels of firm subsidiaries.
With such structures, the family controlling shareholder‘s actual ownership becomes
smaller and relative to his control farther down the pyramid and this evidently creates
some negative consequences (Ariffin, 2009). These negative implications refer to the
opportunity for family owners to expropriate minority shareholders through tunnelling
funds from firms at the lower level of the pyramidal structure to the holding company or
to other subsidiaries or associated companies; due to the discrepancy between the
controlling shareholders‘ ownership and control rights which gets larger farther down
the pyramid (Morck and Yeung, 2003; Jiang and Peng, 2011). This explains why
principal-principal conflict is more prevalent in emerging markets as corporate
pyramidal structures is very common in these regions particularly among large family
business groups (La Porta et.al., 1999; Morck and Yeung, 2003). Figure 3.1 explains
how family owners can expropriate via corporate pyramidal structures:
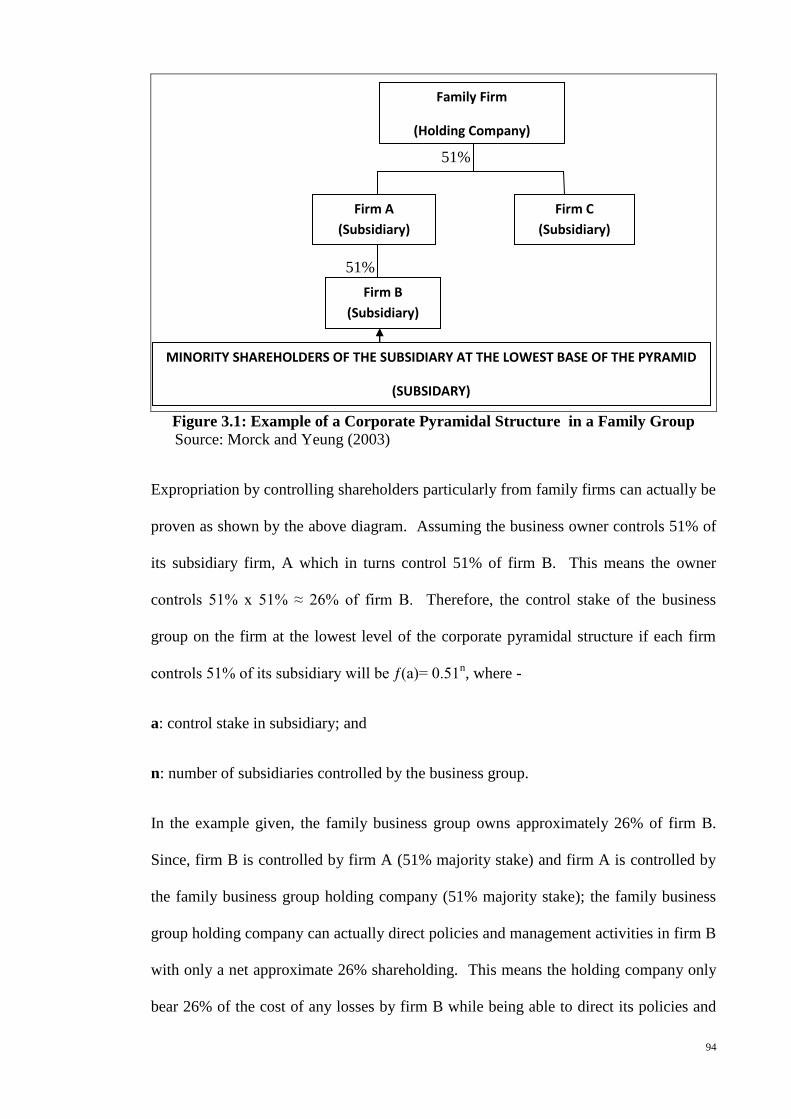
94
51%
51%
Figure 3.1: Example of a Corporate Pyramidal Structure in a Family Group
Source: Morck and Yeung (2003)
Expropriation by controlling shareholders particularly from family firms can actually be
proven as shown by the above diagram. Assuming the business owner controls 51% of
its subsidiary firm, A which in turns control 51% of firm B. This means the owner
controls 51% x 51% ≈ 26% of firm B. Therefore, the control stake of the business
group on the firm at the lowest level of the corporate pyramidal structure if each firm
controls 51% of its subsidiary will be ƒ(a)= 0.51n, where -
a: control stake in subsidiary; and
n: number of subsidiaries controlled by the business group.
In the example given, the family business group owns approximately 26% of firm B.
Since, firm B is controlled by firm A (51% majority stake) and firm A is controlled by
the family business group holding company (51% majority stake); the family business
group holding company can actually direct policies and management activities in firm B
with only a net approximate 26% shareholding. This means the holding company only
bear 26% of the cost of any losses by firm B while being able to direct its policies and
Family Firm
(Holding Company)
Firm A
(Subsidiary)
Firm C
(Subsidiary)
Firm B
(Subsidiary)
MINORITY SHAREHOLDERS OF THE SUBSIDIARY AT THE LOWEST BASE OF THE PYRAMID
(SUBSIDARY)

95
management activities. The lower the firm at the corporate pyramidal structure, the
lower the cost of any losses of the subsidiary that the holding company has to bear
assuming it controls at least 51% at every level.
As a result, managerial entrenchment occurs (due to the affiliation of the managers to
the controlling shareholders) and other people‘s money problems left unattended. Thus,
the risk of expropriation is highest at the bottom of the corporate pyramidal structure.
The cost to minority shareholders as a result of managerial entrenchment in a corporate
pyramidal structure is the minority shareholder expropriation cost. This cost is basically
due to the deviation of cash-flow rights from control rights, whereby the family
controlling shareholder owns only 26% of the cash-flow rights of the subsidiary at the
base of the pyramid but 51% control rights (adopting the 1-share-1-vote principle). As
pyramidal structures enable controlling shareholders to expropriate minority
shareholders, there are certain incentives which encourage their usage for expropriation
purposes.
3.3.3 Incentives for Corporate Pyramidal Structures To Be Used For
Expropriation
In Malaysia, most firms particularly family businesses are highly diversified (Ayoib,
Zuaini and Nor Aziah, 2003). Overall, there is a high level of investment needed due to
the different businesses that the firm engages in. The relatively low investor protection
and mediocre corporate governance (CG) (Joint Asian Corporate Governance
Association (ACGA) and Credit Lyonnaise Securities Asia (CLSA) total average
investor protection and CG score of 55 out of 100 (ACGA, 2012b)), encourage family
firms to utilise pyramidal structures to structure their different subsidiaries in order to
expropriate minority shareholders. This can be done by tunnelling profits from the
subsidiary at the bottom of the corporate pyramidal structure to the holding company or

96
to other subsidiaries or associated companies. Tunnelling is a common method of
expropriation in corporate pyramidal structures because family controlling shareholders
are able to control their subsidiaries at the bottom of their pyramidal structures with
little cash-flow rights. The usage of corporate pyramidal structures by family owners
for expropriation purposes further support the argument that the principal-principal
conflict is more prevalent in family firms compared to non-family firms.
Riyanto and Toolsema (2008) further argue that the existence of corporate pyramidal
structures in family firms is attributed to the anticipation of tunnelling and propping by
rational outside investors. Although tunnelling will be discussed in more detail in later
sections, in the context of the study by Riyanto and Toolsema (2008); tunnelling refers
to RPTs which move funds from a lower-level firm to a higher-level firm in the
corporate pyramidal structures and propping refers to transfers of funds in the opposite
direction (Friedman, Johnson and Mitton, 2003). Tunnelling involves expropriation of
minority shareholders of the lower-level firm. Propping however, is only optimal to the
controlling shareholder when it is used to guarantee future cash-flows, say to save the
lower-level firm from insolvency, and thereby usually benefits minority shareholders
(Riyanto and Toolsema, 2008). Riyanto and Toolsema (2008) point out that when
investors are rational, tunnelling alone does not justify the existence of corporate
pyramidal structures. Rational shareholders anticipate the expropriation and adjust their
willingness-to-pay for the firm‘s shares accordingly. This fully eliminates the potential
benefit to the family of self-dealing in the pyramidal structure, and the family will
prefer the independent, horizontal structure. Empirical evidence indicates that investors
may be myopic and underestimate the extent of tunnelling. However, a justification for
pyramidal ownership relying on myopic investors may not be very attractive from a
modelling perspective.
97
When the pyramidal structure does not only involve tunnelling but also propping,
Riyanto and Toolsema (2008) argue that the family may indeed prefer to use the
pyramidal ownership structure. The possibility of propping in pyramidal business
groups implicitly provides outside investors with an intercorporate insurance in case of
financial distress. In this case, rational outside investors are willing to be expropriated
to some extent via tunnelling in exchange for a larger probability of realising positive
returns from their investment in the future. This explanation is consistent with Morck
et.al. (2005), who argue that the benefit of intercorporate insurance is one of the factors
that underlies the creation of pyramidal business groups. Cheung et.al. (2006) analyze a
sample of 328 filings of RPTs between Hong Kong public-listed companies and their
controlling shareholders during the period 1998-2000, and find evidence that market
participants do not discount firms with potential for expropriation beforehand. This
indicates that investors may deliberately accept tunnelling in exchange for the insurance
against financial distress. Basically, the explanation by Morck et.al. (2005) and the
findings by Cheung et.al. (2006) support the arguments by Riyanto and Toolsema
(2008).
Furthermore, the higher prevalence of principal-principal conflict in family firms is also
due to the private objectives of family firms.
3.3.4 Private Objectives of Family Firms
The presence of private objectives within family firm owners can cause them to take
actions, which advance their family welfare at the expense of minority shareholders
(Schulze et.al., 2001). These preferences cannot be fully quantified financially
(Bergstrom, 1989). In addition, the utility that family firm owners gain from indulging
in private objectives is indistinguishable from the utility that they obtained from
rationally motivated actions (Becker and Murphy, 1988; Thaler and Shefrin, 1981).

98
These private objectives can translate in many forms and one of these is the
appointment of family members as agents of the firm (Faccio et.al., 2001a; Young et.al.,
2008). Founding families of family firms can expropriate minority shareholders by
appointing less-than-qualified family members or associates, friends or cronies to be
agents of its firm (Faccio et.al., 2001a). They can decide who sits on the board,
therefore, effectively neutralize a board‘s ability to oversee the family controlling
shareholder. In addition, legal recourse for boards not overseeing minority
shareholders‘ interests is limited. Such arrangements coupled with limited legal
recourse provide family controlling shareholders the power to expropriate (Young et.al.,
2008). Hence, it is argued that principal-principal conflict is more prevalent in family
firms as compared to non-family firms. Besides private objectives, the higher
occurrence of principal-principal conflict in family firms can also be attributed to the
stock market abuses by family owners and the negative perception of minority
shareholders.
3.3.5 Stock Market Abuses and Perception of Minority Shareholders in Asia
Stock market abuses by family owners and the negative perception of minority
shareholders are additional possible reasons why family firms are more prone to
expropriation. Backman (2001) argues that in Asian emerging markets, founding
families of business groups only list unprofitable firms in stock exchanges. Profitable
firms are kept as privately limited companies in their groups. In other words, founding
families list only unprofitable firms with the hope of securing capital for expropriation
purposes. When the founding family controlling shareholder expropriate resources
from the firm, its creditors, minority shareholders and other unaffiliated major
shareholders (blockholders) share the cost and risk of expropriation with the family
controlling shareholder. In the case of firm insolvency, family controlling shareholders
will still be able to claim some of the firm‘s assets and profits (if any) after the principal

99
and interests have been repaid to the creditors (Radcliffe, 1997). This explains why
family controlling shareholders expropriate because they have more to gain through
expropriation compared to what they can lose in the case of insolvency.
After the family controlling shareholder had expropriated extensively from the listed
firm in the stock exchange, the latter suffer extensive value losses and
underperformance of stock returns. In this situation, the family controlling shareholder
might no longer find it in their best interest to keep the firm public. Hence, they might
take the firm private (Du, He and Yuen, in press). Du et.al. (in press) further argue that
to minimise the compensation costs of privatisation, the family controlling shareholder
might first increase their shareholding at a preferential share price through insider
trading before the public disclosure of the privatisation plan, which helps them reduce
the premium payment to minority shareholders in the subsequent privatisation scheme.
Ultimately, the family controlling shareholders publicly announce their privatisation
plan and squeeze out minority shareholders by taking the firm private. Hence, minority
shareholders are expropriated by the family controlling shareholder when the firm is
taken private (Du et.al., in press).
The fact that minority shareholders are expropriated by Asian family controlling
shareholders shows that minority shareholders of Asian family firms are often viewed
as outsiders. Personal connections and relationships are everything in Asian businesses
(Backman, 2001). The concept of minority shareholder protection is alien to most
Asian businesses particularly in developing countries. Thus, Asian family controlling
shareholders from emerging markets have a strong incentive to engage in minority
shareholder expropriation (Backman, 2001). Although stock market abuses by family
owners and negative perception of minority shareholders could encourage minority
shareholder expropriation in family firms, this problem can also be attributed to the
altruistic behaviours of family owners.

100
3.3.6 Altruism of Family Owners
Since, family-controlled firms are often run by the family controlling shareholder and
his selected family members, there is a likelihood of altruistic behaviours within family
controlling shareholders (Buchanan, 1975). He argues that in family firms, control over
the firm‘s resources makes it possible for family controlling shareholders to be
unusually generous to their family members who serve in the management of the firm.
For example, the family controlling shareholder could provide family members with
secure employment and perquisites and privileges that they would not otherwise receive
(Gersick, Hampton and Lansberg, 1997; Ward, 1987). Hendry (2002) argues that family
firms are vulnerable to honest incompetence and shortage of expertise because they
often have a self-imposed personnel selection criterion that provides preferential
treatment or exclusive consideration to family stakeholders. Generally, the altruistic
behaviour of family owners is detrimental to the interests of minority shareholders due
to the benefits and privileges given to family members, thus, contributing to the agency
problem of self-control. The agency problem of self-control refer to the attempts of
individuals or families to maximise their welfare (in this case, their altruistic
behaviours) which can lead to a loss of control and cause them to take actions that do
not advance the common (economic) good (such as the interests of minority
shareholders) (Schulze, Lubatkin and Dino, 2002). This altruistic behaviour of family
owners may also lead to reduction in firm monitoring.

101
3.3.7 Lack of Firm Monitoring
Schulze, Lubatkin and Dino (2003) argue that altruism reduces the family controlling
shareholder‘s ability to effectively monitor and discipline family agents. Altruism
systematically biases the family owner‘s perceptions and hence, the information that
they filter and process about the family members that are employed. Altruism reduces
the effectiveness of a family controlling shareholder‘s monitoring function because
family agents tend to free ride on the controlling shareholder whenever the
responsibilities of the family controlling shareholder and family agent overlap
(Lindbeck and Weibull, 1988). The family owner‘s ability to discipline family agents is
compromised by both the owner‘s altruism and by the consequences that such actions
might have on familial relationships within the firm and the extended family outside the
firm (Donovan, 1995). Dharwadkar et.al. (2000) further argues that since the family
agents are representing the controlling shareholders, they are able to circumvent the
traditional monitoring functions such as board of directors, resulting in lack of firm
monitoring (Liu et.al., 2010). The lack of firm monitoring as a result of family owners‘
altruism and close relationship between the family members and the owner, encourage
opportunistic behaviours of controlling shareholders. In addition to lack of firm
monitoring, opportunistic behaviours by family owners also could be encouraged by
information asymmetry between family owners and non-family shareholders
(Villalonga and Amit, 2010).

102
3.3.8 Information Asymmetry
Information asymmetry may also encourage family owners to engage in minority
shareholder expropriation. This can be prevalent among family firms in industries
where there is a large information asymmetry between family owners and non-family
owners (Villalonga and Amit, 2010). Using a sample of 8,104 firms from different
industries in USA, Villalonga and Amit (2010) find that family firms with lower
transparency in certain industries performed poorer compared to those with higher
transparency in other particular industries. They also find that firms with lower
transparency are associated with higher family control. Both these findings indicate the
likelihood of expropriation by family owners in particular industries when there is
information asymmetry between them and non-family owners. The rationale for these
findings is that family owners within a particular industry who possess information
advantage compared to non-family owners, have a high tendency to take advantage of
this information differences to fulfil their expropriation objectives. Although the study
by Villalonga and Amit (2010) is conducted in USA, their findings show that even in
developed markets such as the USA with strong investor protection; information
asymmetry between family owners and non-family owners could encourage
opportunistic behaviours of the family owners. In emerging markets with lower
investor protection, the likelihood of this scenario occurring is even higher.
Aside from information asymmetry between family owners and non-family owners, the
higher prevalence of the principal-principal conflict in family firms can also be
attributed to the non-dilution of the family owner‘s private benefits of control among
other blockholders in the firm.

103
3.3.9 Undiluted Private Benefits of Control
Villalonga and Amit (2006) argue that the private benefits of family controlling
shareholders are undiluted even though there are other blockholders in the firm such as
institutional investors, individual investors, etc. On the other hand, if the controlling
shareholder is a non-family owner, the dilution of private benefits of control will occur
among the non-family owner and other blockholders. Hence, family owners may
possess a higher incentive to expropriate wealth from minority shareholders compared
to non-family owners because the former‘s private benefits cannot be diluted among
other blockholders. This argument implies that Agency Problem Type II might be more
prevalent in family firms compared to non-family firms (Setia-Atmaja, Tanewski and
Skully, 2009).
Part of the undiluted private benefits of control which encourage minority shareholder
expropriation in family firms may include opportunistic investment by family owners.
3.3.10 Opportunistic Investment
The personalised authority structures of family firms provide huge latitude to family
owners in allocating their investments and this is another factor which encourages
minority shareholder expropriation in family firms (Carney, 2005). Carney (2005)
defines opportunistic investment as the ability to allocate organisational resources
without regard to internal and external processes of accountability. Controlling
shareholders may analyse their investment decisions on the back of an envelope or
utilise heuristic methods or mental calculus rather than a careful and exact accounting
calculation (Redding, 1990). This approach to analysis encourages fast decision making
and provides advantages in pursuing fleeting opportunities where time is of the essence
and in situations where it is ―better to be always first than always right‖ (Williamson,
1997, p.55).

104
Controlling shareholders possess larger latitude to allocate resources on the basis of
‗animal spirits‘ or ‗gut feel‘ and to pursue opportunities which can only be rationalised
by particularistic or intuitive criteria. Accountable only to themselves, controlling
shareholders are free to donate, hide, liquidate and generally shift assets into and out of
unfavourable environments; hence, opportunistic investment provides them the ability
to expropriate minority shareholders. This liberty is an advantage in environments
characterised by corruption and weak property rights such as those in emerging markets
(Carney, 2005).
In contrast to the factors that encourage minority shareholder expropriation, reputational
effects play a positive role in influencing family firms to treat minority shareholders
well rather than expropriating them.
3.3.11 Reputational Effects in Family Firms
One of the pioneering studies on reputational effects in emerging markets is by Gomes
(2000). In a multi-period model, Gomes (2000) argues that a family can build a
reputation for treating minority shareholders well by retaining large shareholdings and
voluntarily bearing the cost of under-diversification. This represents a credible
commitment because the family will repeatedly need to raise capital and any
expropriation will be penalized by discounts of its future stock offerings. The Gomes
model predicts that the reputational effect is actually more intense when cash-flow and
control rights are separated. A non-expropriating controlling family derives payoff
mainly from future sales of shares. The ability to subsequently sell the shares without
losing control improves the credibility of the family‘s initial ownership retention signal.
Based upon the Gomes model, family controlling shareholders possess the incentives to
preserve its corporate reputation due to their need to raise external capital. Any

105
minority shareholder expropriation that takes place will discount future stock offerings.
Hence, they have the tendency to treat minority shareholders well.
Khanna and Palepu (2000) argue that reputational effects of treating minority
shareholders well enable family business groups in emerging markets to obtain
credibility for new business ventures among suppliers and customers. Family firms also
can have superior access to foreign capital and technology if they possess a good
reputation in treating minority shareholders well. Therefore, these benefits encourage
family controlling shareholders not to engage in minority shareholder expropriation.
Khanna and Yafeh (2007) further reiterate that family controlling shareholders in
emerging markets have the incentives to preserve corporate reputation by risk sharing.
The risk sharing is conducted by providing assistance to poorly performing companies
within the family business group. This feature reduces the default risk of group-
affiliated companies. This risk sharing is viewed positively by minority shareholders as
it portrays an image to them that the firm is taking care of their interests. Therefore, the
engagement by family controlling shareholders in risk sharing within their business
groups, enhances the interests of minority shareholders.
In Malaysia, reputational effects could possibly have a positive influence on the
treatment of minority shareholders in family firms. This could occur in the aftermath of
the Transmile case. In the Transmile case, the firm‘s revenue was inflated in the
financial statement (Securities Commission, 2011c). The aftermath of this incident
have possible reputational effects on family firms because investors‘ confidence was
shattered after the incident (Song, 2010). This reputational effect is particularly
prevalent in large family business groups where family controlling shareholders possess
very high ownership stakes. This is because Transmile is a subsidiary of the Kuok
Group of Companies and this family business group is an established family business
106
conglomerate in Malaysia. The dent in the reputation of Transmile provides incentives
for other large family owners to improve their reputation. The reputational effects
operate in the following manner. As the shareholding of family controlling shareholders
increases, they possess higher ownership of their firms. Consequently, they possess
higher incentives to preserve their reputation considering the Transmile negative
publicity. Low reputation can affect them and their family members in terms of their
future job prospects and raising external capital for their firms (Gomez, 1999; Loy,
2010). Thus, when the shareholding of family controlling shareholders increases, the
reputational concerns help align their incentives to those of minority shareholders.
The Transmile experience not only affects the family controlling shareholders but their
independent directors as well (Oh, 2011). Independent directors particularly in family
firms, would like to preserve their corporate reputation (Abdullah et.al., 2010; Watts
and Zimmerman, 1978) because poor reputation can lower their job prospects as
independent directors with non-family firms (Othman and Rahman, 2010).
Consequently, as their tenure increases, independent directors in family firms may fully
utilise their knowledge and experience gained to improve firm performance in order to
maintain the company‘s reputation.
Despite the possible reputational effects on family firms in emerging markets, these
effects are considered a poor substitute for weaknesses in the institutional structures
such as poor minority shareholder rights protection (Peng and Jiang, 2010). The reason
is that in these markets, even reputable firms expropriate particularly during periods of
economic recessions (Johnson et.al., 2000a). However, this line of reasoning is
incomplete because it does not take into consideration the effect of corporate
governance fiascos such as the Transmile case in Malaysia, which could have a strong
reputational impact on the corporate governance of family firms. For that reason, the

107
assertion that reputational effect is a poor substitute for institutional deficiencies may
not be valid.
One of the methods of minority shareholder expropriation which reputational effect can
help to reduce is through related party transactions (RPTs).
3.4 RELATED PARTY TRANSACTIONS (RPTs)
Related party transactions (RPTs) are diverse complex business transactions between a
company and its managers, directors or principal owners (Gordon, Henry and Pahlia,
2004b). RPTs are defined as transactions entered into by the listed issuer or its
subsidiaries which involves the interest, direct or indirect of a related party (Bursa
Malaysia, Listing Requirements, Part E, Section 10.02 para k). A related party can be a
subsidiary, joint venture partner, a family member or a company affiliated with any of
the related individuals within the firm (Gordon et.al., 2004b, 2004c). RPTs can be
classified by three categories (Cheung et.al., 2006). Table 3.2 illustrate these three
different categories of RPTs.

108
Table 3.2: Classifications of Related Party Transactions (RPTs)
Type of connected
transaction
Description
Panel A: Transactions that are a priori likely to result in expropriation of the listed firm’s minority shareholders
Asset acquisitions Transactions that involve the acquisition of tangible or intangible assets by the listed company from a connected person or from a
private company majority-controlled by this person.
Asset sales Transactions that involve the sale of tangible or intangible assets by the listed company to a connected person or to a private
company majority-controlled by this person.
Equity sales Transactions that involve the sale of equity stake in the listed company to a connected person or a private company majority-
controlled by this person.
Trading relationships Transactions that involve the trade of goods and services between the listed company and a private company majority-controlled
by a connected person. They can be purchases by the listed company or sales or both.
Cash payments Transactions that involve direct cash payments by the listed company to a connected person or to a company controlled by this
person or to a subsidiary (including loans and cash assistance) and the provision of cash guarantees by the listed company for debts
owed by the connected person or by the companies controlled by this person.
Panel B: Transactions likely to benefit the listed firm’s minority shareholders
Cash receipts Transactions that involve direct cash assistance or loans provided by the connected person to the listed company.
Subsidiary relationships Transactions between a listed company and one of its subsidiaries. They could involve acquisitions or sales of equity stakes or
assets and trading relationships.
Panel C: Transactions that could have strategic rationales and perhaps are not classified as expropriation
Takeover offers and joint
ventures
Cases in which the listed company receives a takeover offer by another publicly listed company that holds a toehold, and cases in
which the listed company forms a joint venture or strategic alliance with another company that already holds a stake in the listed
company.
Joint venture stake
acquisitions
Transactions that involve acquisitions by the listed company from a third party of a stake in a joint venture in which the company
participates as a joint venture partner. The connected person is the third party in his or her capacity as subsidiary shareholder.
Joint venture stake sales Transactions that involve the sale by the listed company to a third party of a stake in a joint venture in which the company
participates as a joint venture partner. The connected person is the third party in his or her capacity as subsidiary shareholder.
Source: Cheung et.al. (2006)

109
Panel A lists the transactions that are likely to result in expropriation whereas
transactions listed in Panel B and C are unlikely to be used for expropriation. Based
upon these classifications, it is the transactions listed in Panel A which raise concerns as
these transactions can be detrimental to the interests of minority shareholders.
Aside from these classifications, there are two opposing views on RPTs held by
scholars. The ‗efficient transactions‘ view argue that RPTs promote better co-
ordination and feedback between related parties and the firm because information flows
faster, information reliability is higher, contracting efficiency increases and holdup
problems are reduced15
(Ryngaert and Thomas, 2007). RPTs can also be more cost
effective and cost efficient to firms compared to transactions with unrelated parties
(Gordon et.al., 2004b, 2004c; Ryngaert and Thomas, 2007). Moreover, these
transactions also fulfil the economic demands of a company by helping to secure in-
depth skills and expertise from related parties as well as providing alternative forms of
compensation to them (Wahab et.al., 2011).
Pizzo (2011) argues that the efficient transaction hypothesis assumes RPTs represent
sound business exchanges, efficiently fulfilling the underlying economic needs of the
firm. These transactions do not harm the interests of shareholders and they constitute
efficient contracting arrangements where there is incomplete information. Pizzo (2011)
further contends that RPTs represent internal dealings, alternative to contractual or
market exchanges, enables the reduction of transactions costs and overcome difficulties
obstructing production which is consistent with the transaction cost theory (Coase,
1937; Williamson, 1985) and supporting evidence has been provided by numerous
studies (Fan and Goyal, 2006). Specifically, in institutional contexts without efficient
capital, labour and product markets such as those in emerging markets; information
15
The holdup problem is a situation where two parties may work most efficiently by cooperating but they are refrained from
doing so due to concerns that they may give the other party increased bargaining power and thereby reducing their own profits (Che and Sakovics, 2008).

110
asymmetry, agency problems and market imperfections increase risks related to firm
activity, while group structures and internal dealings may provide a better allocation of
financial resources, economies of scale, easier access to finance, more opportunities,
increased influence, etc (Pizzo, 2011). Therefore, internal markets may be created with
beneficial effects for the entire group when external funds are scarce and uncertain
(Khanna and Palepu, 1997). Furthermore, the scale and scope of internal markets also
help resolve difficulties related to the impairment of production in emerging markets
(Fisman and Khanna, 2004). It also contributes to profitability, supplementing
inefficient capital markets and reducing transaction costs (Chang and Hong, 2000).
Unfortunately, the ‗efficient transaction‘ view is not considered a persuasive view by
many scholars. Empirical evidence is not always supportive of its premises and the idea
that RPTs always satisfy economic needs is still not accepted by many scholars. RPTs
are often deemed to be harmful to shareholders and lowering confidence in the capital
markets. It is not surprising that the rules affecting RPTs disclosure and monitoring
have been largely influenced by this negative view which is called the ‗conflict of
interest‘ view (Pizzo, 2011).
The ‗conflict of interest‘ view argues that RPTs are detrimental and value decreasing to
shareholders. Under this view, RPTs compromise agents‘ responsibilities to
shareholders or the board of directors‘ monitoring function (Gordon et.al., 2004b,
2004c). This argument is based on the notion of agency costs that arise due to Agency
Problem Type I and II. Gordon et.al. (2004b, 2004c) argue that RPTs are detrimental to
shareholders due to the agency costs which arise as a result of being used as a tool for
expropriation by managers and controlling shareholders. Gordon, Henry, Louwers and
Henry (2007) assert that involvement in RPTs will increase the incentives for directors
to manage their earnings to justify their perquisites or mask their expropriation. They

111
argue that this scenario not only represents expropriation of firm resources but they can
conflict and eliminate the monitoring function of the board of directors.
Pizzo (2011) further argues that RPTs may imply moral hazard and may be carried out
in the interest of directors in order to expropriate wealth from shareholders. The
disadvantages of RPTs are listed in Table 3.3.
The disadvantages of RPTs are often associated with abnormal stock returns (Cheung
et. al., 2006), firms‘ poor performance (Chen and Chien, 2004) or lower firm value
(Gordon et. al., 2004b,c; Jian and Wong, 2004). Claessens and Fan (2002) also argue
that investors discount share prices in order to take into consideration potential agency
issues such as RPTs. The drawbacks as shown in Table 3.3 supports the idea that these
transactions represent conflicts of interest and they are inconsistent with shareholder
wealth maximisation (Emshwiller, 2003).
Within this framework, RPTs are often associated with the misuse of firm resources and
the misrepresentation of private information as well as potential bias in financial
statements, with a negative impact on their reliability and relevance. This creates more
uncertainty and weakens the contractual effectiveness in mitigating agency conflicts
(Pizzo, 2011).

112
Table 3.3: Disadvantages Of Related Party Transactions (RPTs)
No. Disadvantages Of Related Party Transactions (RPTs)
1 RPTs may weaken corporate governance of the firm. RPTs may undermine non-executive directors‘ functions, changing them into affiliated or
―grey‖ directors (Denis and Sarin, 1999; Klein, 2002; Vicknair, Hickman and Carnes, 1993; Weisbach, 1988). Furthermore, weaker corporate
governance makes these transactions more likely to occur and reducing board independence (Kohlbeck and Mayhew, 2004; Gordon et.al.,
2004b,c).
2 RPTs may encourage earnings management. Earnings management is defined as a purposeful intervention in the external financial reporting
process, with the intent of obtaining some private gains (Schipper, 1989). Directors possess the incentives to manage earnings to increase or
legitimise their perquisites or to hide expropriation wealth. RPTs may turn out to be a useful tool for managing earnings (Jian and Wong, 2010;
Aharony, Yuan and Wang, 2005) and operating results for the purposes to avoid delisting, new equity issue placement, etc (Jian and Wong,
2004; Ming and Wong, 2003).
3 RPTs also encourage tunnelling such as wealth transfers out of a company for the benefit of shareholders with a controlling interest (Johnson
et.al., 2000a). A company may pay a related party above market prices or pay market prices for goods or services of inferior quality. Transfer
of assets and profits, although common in developed markets, becomes more prevalent and frequent in emerging economies where external
markets are insufficient or corporate governance rules are lacking and presumably, less effective (Jian and Wong, 2004; Jiang et.al., 2010).
4 RPTs encourage employment of relatives in family firms. A director can be appointed or promoted owing to his family influence over the
firm.
5 RPTs are considered unreliable compared to arm‘s length transactions.
Source: Pizzo (2011)

113
Figure 3.2 provides a brief explanation of the efficient transactions and the conflict of
interest view on RPTs.
Theoretical
Framework
RPTs
Interpretations
Regulatory
Implications
Figure 3.2: Traditional Views on RPTs
Source: Pizzo (2011)
Conflict Of Interest View Efficient Transactions
View
Self-Dealing
Transactions
Sound Economic
Exchanges
Detailed on-going
disclosure
Board approval
Ban on some
operations
Periodic disclosure
requirements
Monitoring
mechanisms
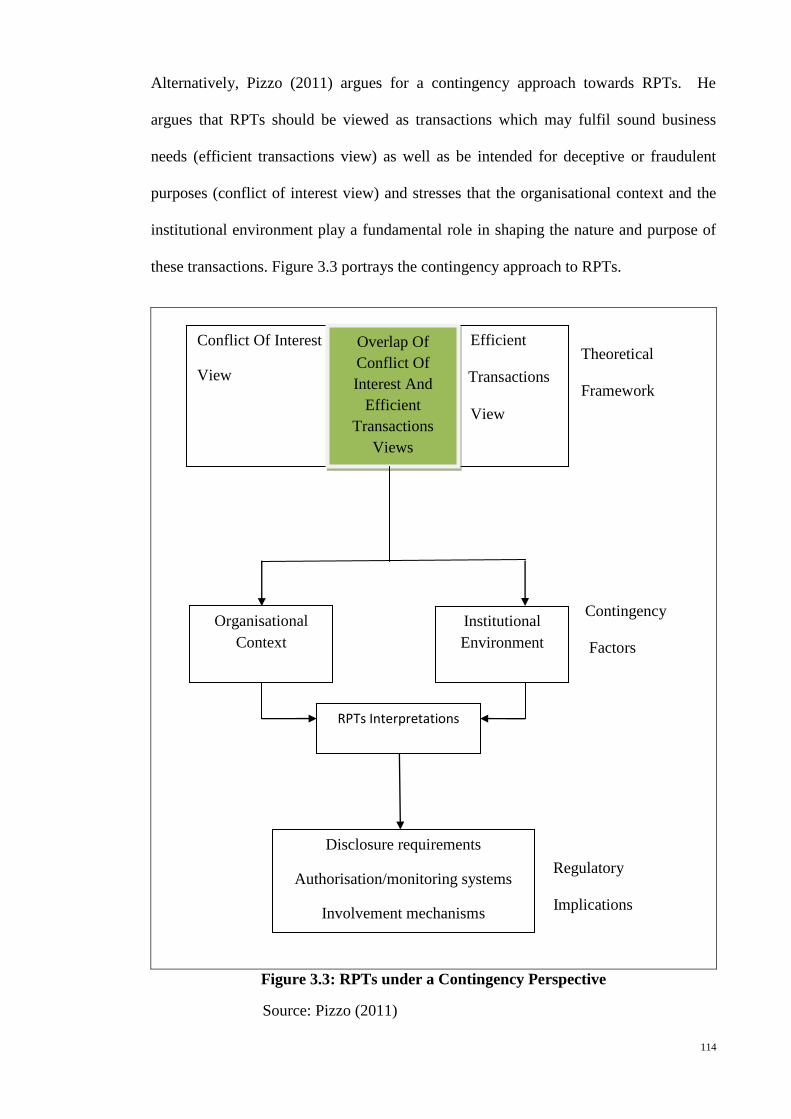
114
Alternatively, Pizzo (2011) argues for a contingency approach towards RPTs. He
argues that RPTs should be viewed as transactions which may fulfil sound business
needs (efficient transactions view) as well as be intended for deceptive or fraudulent
purposes (conflict of interest view) and stresses that the organisational context and the
institutional environment play a fundamental role in shaping the nature and purpose of
these transactions. Figure 3.3 portrays the contingency approach to RPTs.
Theoretical
Framework
Contingency
Factors
Regulatory
Implications
Figure 3.3: RPTs under a Contingency Perspective
Source: Pizzo (2011)
Conflict Of Interest
View
Efficient
T Transactions
View
Overlap Of
Conflict Of
Interest And
Efficient
Transactions
Views
Organisational
Context
Institutional
Environment
RPTs Interpretations
Disclosure requirements
Authorisation/monitoring systems
Involvement mechanisms

115
Based upon the contingency approach, it is argued that weak corporate governance
practices (Young et.al., 2008) and poor investor protection (ACGA, 2012b) in emerging
markets ultimately provides a conducive environment for RPTs to be used as an
expropriation tool by controlling shareholders. Hence, in these markets, RPTs are more
likely to be detrimental to the interests of minority shareholders rather than benefiting
them. As a result, a firm value is reduced.
Although, the usage of RPTs is generally considered to have a negative impact on the
interests of minority shareholders, there is still limited empirical evidence which proves
that the usage of specific types of RPTs is detrimental to firm value particularly in
family firms (Jiang et.al., 2010). The type of RPTs that is being referred here is those
transactions classified in Panel A Table 3.2 which include asset acquisitions, asset sales,
equity sales, trading relationships and cash payment to related parties.
The scarcity in these studies is due to the fact that in most corporate governance
research, expropriation is indirectly inferred by separation of ownership and control
rights (ratio of cash-flow rights to control rights) (Claessens et.al., 2002; Krishnamurti
et.al., 2005; Mitton, 2002; among others), dividend rates (Faccio et.al., 2001a; La Porta
et.al., 2000a; among others), price paid for corporate control (Zingales, 1994; Dyck and
Zingales; Nenova, 2003; Atanasov, 2005) and the legal system (Djankov et.al., 2008;
Johnson et.al., 2000a; La Porta et.al., 1998; 2000b; among others).
Claessens et.al (2002) examine 1,301 public-listed firms in eight East Asian firms for
1996 and find that firm value increases with the cash-flow ownership of the controlling
shareholder, consistent with the incentive alignment effect. However, firm value
decreases when the control rights of the largest shareholder exceed its cash-flow
ownership, consistent with the entrenchment effect. Krishnamurti et.al. (2005)
conducted a study on 2,980 East Asian firms between 1998 and 2000 and find that there

116
is no relationship between ratio of cash-flow rights to control rights and a firm value.
Mitton (2002) study 398 firms from Indonesia, South Korea, Malaysia, Philippines and
Thailand between 1997 and 98 and found that lower cash-flow rights to control rights
ratio reduces a firm value.
Faccio et.al. (2001a) analyse 5,897 firms in France, Germany, Hong Kong, Indonesia,
Italy, Japan, Malaysia, Philippines, Singapore, South Korea, Spain, Taiwan, Thailand
and the United Kingdom in terms of their dividend rates between 1992 and 1996. They
find that European firms generally pay higher dividends than Asian firms, suggesting
that expropriation is higher among the latter. La Porta et.al. (2000a) study 4,103 firms
from 33 countries globally in terms of dividend payout between 1989 and 1994 and find
that firms in countries which protect minority shareholders better pay higher dividends.
Zingales (1994) examines all public-listed firms which have both a voting and non-
voting stock in the Milan Stock Exchange, Italy between 1987 and 1990 and finds that
private benefits of control i.e. the price paid for corporate control is worth more than
60% of the value of nonvoting equity. The relatively high private benefits of control
encourage expropriation of minority shareholders. Dyck and Zingales (2004) analyse
the private benefits of control i.e. the price paid for corporate control in 39 countries
globally between 1990 and 2000 and find that these private benefits are smaller in
countries with better investor protection, better tax enforcement and more media
pressure. Nenova (2003) examines the value of corporate voting rights, specifically of
the control block of votes for 661 dual-class firms in 18 countries for 1997 and
discovers that the value of control block votes ranged from -2.88% of firm value in
Hong Kong to 48% of firm value in South Korea. They argue that minority shareholder
expropriation problems will arise if a value of control-block votes has a range up to one-
half of firm market capitalisation. Atanasov (2005) analyse 81 privatisation funds in
Bulgaria for 1996 and find that the price for corporate control is 85% of firm value

117
which suggest a high private benefits of control which encourage minority shareholder
expropriation.
Djankov et.al. (2008) present a new measure of legal protection of minority
shareholders against expropriation by corporate insiders, namely, the anti-self-dealing
index. This index is calculated for 72 countries based on legal rules prevailing in 2003
and focuses on private enforcement mechanisms, such as disclosure, approval and
litigation which govern a specific self-dealing transaction. Johnson et.al. (2000a)
examine 25 emerging markets between 1996 and 1999 and found that the rule of law is
one of the factors which can explain the extent of exchange rate depreciation and stock
market decline in the Asian financial crisis. La Porta et.al. (1998) study 49 countries
globally on the legal rules covering protection of shareholders and creditors, the origin
of these rules and the quality of legal enforcement and found that common-law
countries possess the strongest legal protection of investors and creditors, followed by
German and Scandinavian civil law countries and the French civil law countries had the
weakest protection. La Porta et.al. (2000b) conduct a similar study by describing the
legal differences and the enforcement effectiveness across countries, discuss the
possible origins of these differences, summarise their consequences and assess potential
strategies of corporate governance reform. They argue that the legal approach is a more
fruitful way to understand corporate governance and its reform than the conventional
distinction between bank-centred and market-centred financial systems.
Although these studies analyse and indirectly infer the existence of expropriation, they
do not examine the specific types of transactions that could be used for minority
shareholder expropriation. In addition, the firm value effects of these transactions have
not been widely examined (Jiang et.al., 2010). Basically, the extant literature only
provides limited evidence with respect to these transactions.

118
Cheung et. al. (2006) find that RPTs which are likely to result in expropriation reduces
the cumulative abnormal returns (CARs) in Hong Kong public-listed companies.
Cheung et. al. (2009) and Peng et. al. (2011) also find similar results for companies
listed in the Chinese Stock Exchange. However, they used an event study approach
which is based upon the market reaction (market valuation) to the announcement of
RPTs which are likely to result in expropriation. The time period which they used to
assess the market reaction is within a maximum of twenty days (i.e. maximum ten days
before the announcement and maximum ten days after the announcement). The studies
conducted by Cheung et.al. (2006), Cheung et.al. (2009) and Peng et.al. (2011) contain
certain weaknesses. Their research results do not provide a comprehensive
understanding of the firm value effects. Event studies only deal with changes around a
particular time and are usually conducted within a short timeframe surrounding the
events that occur (MacKinlay, 1997).
In studies related to minority shareholder expropriation, event studies do not provide a
complete picture of the effects of expropriation because a firm value effects should not
be assessed within a short period of time i.e. days. An examination over a longer
period, in terms of years, would be more appropriate because minority shareholder
expropriation can last for years within the firm as shown by the studies of Faccio et.al.
(2001a), Krishnamurti et.al. (2005), La Porta et.al. (2000a), Mitton (2002), among
others.
Therefore, the measurement of the effects of expropriation over a period of several
years, for example, will provide a more comprehensive understanding of the effects of
minority shareholder expropriation. This helps provides a better indication of whether
expropriation by controlling shareholders exists within the firm or not. A regression
which analyse a period of a few years is able to provide a clearer analysis of
expropriation because it emphasises the change of a particular variable over a period of
119
time. Any changes on that variable can be discerned more clearly as the process
involves repeated measurements of that same variable over time (Diggle et.al., 1994;
Rajulton, 2001).
Since, there is a an absence of this kind of studies on RPTs which are likely to result in
expropriation particularly in family firms and that these transactions are likely to be
detrimental to the interests of minority shareholders; this research examines the firm
value effects of RPTs which are likely to result in expropriation using an approach
which analyses a period of a few years (i.e. 3 years) rather than an event study
approach. This enhances the robustness of empirical evidence on RPTs in extant
literature.
In addition, there is insufficient evidence with respect to whether expropriation through
RPTs is more prevalent in Malaysian family firms or non-family firms. So far, only
Munir and Gul (2011) provide some evidence with regards to this issue. However, their
study did not examine those specific RPTs which are likely to result in expropriation.
Furthermore, they examined the period prior to 2007. In periods after 2007, particularly
after the Transmile case, reputational effects as well as enhanced corporate governance
reforms as set out in MCCG 2007 and Bursa Malaysia Listing Requirements 2008 may
have an influence on firms‘ corporate governance practices. Hence, their studies are
limited to a certain extent in terms of the timeframe analysed and their research results
do not reflect changes in the corporate governance environment post 2007. This study
compares the firm value effects of RPTs which are likely to result in expropriation
between family firms and non-family firms post 2007. This is conducted so that an
assessment can be made whether expropriation through RPTs is more prevalent in
family firms or non-family firms within the context post 2007 institutional setting in
Malaysia.
120
With respect to the research gaps highlighted as well as the discussions in the literature,
the following research questions are being examined:
Is there a negative relationship between related party transactions (RPTs) which are
likely to result in expropriation and firm value in Malaysian firms?
If there is a negative relationship between related party transactions (RPTs) which are
likely to result in expropriation and firm value in Malaysian firms, is this negative
relationship stronger in family firms compared to non-family firms?
Since, RPTs are likely to be detrimental to the interests of minority shareholders, board
oversight is important particularly the role of independent directors (Securities
Commission, 2012).
3.5 ROLE OF INDEPENDENT DIRECTORS
Fama (1980) argues that independent directors are professional referees whose task is to
ensure the effectiveness of the firm‘s top management. Gregory (2000) defines an
independent director as one who is capable of performing his duties independently from
the management, controlling shareholders and the corporation. Chapter one, page 5,
para.4 of the Bursa Malaysia Listing Requirements 2012 defines independent directors
as directors who are independent from management and do not have any business or
other relationship which could interfere with the exercise of independent judgment or
the ability to act in the best interests of a firm (Bursa Malaysia, 2012b). The Malaysian
Code of Corporate Governance (MCCG) 2007 Part 2 Para.3 defines independent
directors as persons of calibre, credibility and who have the necessary skills and
experience to bring an independent judgment to bear on issues of strategy, performance
and resources including any appointments and standards of conduct of the firm. Part 2
Para.3 further proposes that independent directors need to comprise at least one-third of
the firm‘s board membership. In addition to the one-third requirement, the Companies

121
Act (1965) also requires independent directors to become members of the audit,
remuneration and also nominations committee. The audit committee is established to
ensure the integrity of financial statements issued by the firm and also to ensure that
there are proper internal checks and controls with respect to financial management. In
the remuneration committee, independent board members must ensure that management
does not over-compensate them. In the nomination committee, the independent
directors are responsible for searching and screening incoming directors and filling
senior appointments. They must ensure that the new directors have sufficient skills,
knowledge and contribute to the diversity of the board.
Considering the various functions that they need to perform, independent directors are
believed to be a crucial part of the internal control and monitoring mechanism of firms
(Sulong and Nor, 2008). Fama and Jensen (1983b) argue that the inclusion of
independent directors increase the board‘s monitoring efficiency and independence
because they possess incentives to develop their reputation as experts in decision
control. Board independence particularly matter in firms held by controlling
shareholders, especially, family firms (Dahya, Dimitrov and McConnell, 2009). Dahya
et.al. (2009) note that an increase in board independence among these firms is
associated with an increase in their market-based performance measure.
There are two conflicting views concerning the effectiveness of board independence,
namely, the agency theory perspective and the managerial hegemony theory perspective
(Abdullah, 2004). The supporters of agency theory believe that having independent
directors provides an effective monitoring tool for the board (Fama and Jensen, 1983a).
On the other hand, managerial hegemony theorists16
question the ability of independent
directors to fulfil their duties when the management dominates and controls the board of
16
Managerial hegemony theorists are theorists who argue that management may pursue their own interests at the expense of
owners (Spear, Conforth and Aiken, 2007).

122
directors (Abdullah, 2004). In Malaysia, due to the dominant role played by controlling
shareholders in selecting directors, it is argued that independent directors may not be
able to perform their duties effectively. This raises the concern about the efficacy of
independent directors (Abdullah, 2004). Ineffective independent directors may not
monitor controlling shareholders‘ expropriation activities.
Consistent with the managerial hegemony theory, one of the reasons why independent
directors failed to be truly independent as expected by shareholders is that there are no
proper plans by the firm‘s board with respect to the tenure of the independent directors.
Independent directors could stay as long as they want once they are hired. The longer
the directors stay on the board; the likelihood of their independence being compromised
is higher (MSWG, 2010; Thillainathan, 1999). For example, the average tenure of
independent directors for family firms in this research is 6.03 years and for non-family
firms is 5.53 years. The length of these periods could possibly affect the ―true
independence‖ of independent directors as they are relatively long. A definite term for
independent directors would be better as it would increase the likelihood that non-
performing directors are not re-elected (Patton and Baker, 1987). Hence, MCCG 2012
Part 3, Para.3.3, recommends that the tenure of independent directors should be limited
to a maximum of nine years (Securities Commission, 2012) due to the potential
negative effects of tenure on directors‘ independence and the fact that a majority of
firms which already recognise this, as well as trends in other countries‘ jurisdictions
(Securities Commission, 2011a).
Since long tenured independent directors are likely to compromise their independence,
the entrenchment and negative firm value effects due to long board tenure is likely to
occur in Malaysia given the relatively mediocre investor protection (ACGA, 2012b) as
well as the voluntary nature of the adoption of the principle to limit the maximum
tenure of independent directors to nine years in MCCG 2012 (Securities Commission,

123
2012). As a consequence of the voluntary adoption, Malaysian firms have no urgency
to comply with this principle as they are only required to state their level of compliance
to the Malaysian Code of Corporate Governance (MCCG) in their annual reports
(Securities Commission, 2012). Hence, they have the tendency to continue to allow
independent directors to have long tenure attachment with the firm so that their
controlling shareholders could influence them as the voluntary nature of codes of
corporate governance may reduce the effectiveness of codes of corporate governance as
a governance tool for firms (Aguilera and Cuervo-Cazurra, 2009).
Despite the possible impact of independent directors‘ tenure on firm value in Malaysia,
conventional wisdom based on agency theory assumes that the more independent the
board, the more effective the board as well as the firm‘s performance. While some
empirical studies support the former link (Dahya, McConnell and Travlos, 2002; Perry
and Shivdasani, 2005; Weisbach, 1988), those studying the latter have produced
inconclusive or negative results (Agrawal and Knoeber, 1996; Bhagat and Black, 1999;
Vafeas and Theodorou, 1998; Weir, Laing and McKnight, 2002). It is important to note
that these earlier studies consider independent directors as a homogenous group. This
approach does not analyse the differences in directors‘ characteristics and the potential
effects of these characteristics on the firm. It is only recently that research has started
unbundling the characteristics of directors and started investigating the link between
individual director characteristics and a firm‘s value. Examples of such analyses
include the investigation of the effects of an independent director‘s tenure. However,
the extant literature provides very limited empirical evidence with respect to this
analysis. Particularly lacking is the evidence on the effects of an independent director‘s
tenure in family firms. Previous studies only provide evidence on the effects of
independent directors‘ tenure on CEO compensation (Vafeas, 2003), timeliness of
corporate internet reporting (Abdelsalam and El-Masry, 2008) and earnings

124
management (Liu and Sun, 2010). However, the evidence is for all types of firms and
not restricted to family firms.
Vafeas (2003) using a sample of 800 firms listed on the 1994 Forbes list finds that
longer tenured independent directors are associated with higher CEO compensation.
He finds that senior independent directors who are members of the firms‘ compensation
committees pay CEOs significantly higher compensation compared with other
positions, particularly in cases where the CEO is most powerful. Vafeas (2003)
concludes that given the opportunity, senior independent directors compromise
shareholder interests by inflating CEO salaries. He argues that the presence of directors
with twenty or more years of service on the board appears to be a sign of CEO
entrenchment.
Abdelsalam and El-Masry (2008) find that for a sample of 44 Irish public-listed
companies, the average tenure of independent directors is positively related to the firm‘s
timeliness of corporate internet reporting. Their studies use independent directors‘
tenure as a proxy for board independence and find that the latter does play a positive
role in influencing the timeliness of corporate internet reporting.
Using a sample of 7,700 US firms for the period 1998 to 2005, Liu and Sun (2010) find
that longer tenured independent directors on the independent audit committees are
negatively associated with earnings management, suggesting that independent audit
committee members with long board tenure possess greater expertise and experience to
effectively oversee financial reporting.
Although these three studies analysed the effects of independent directors‘ tenure, they
did not analyse directly the effects of independent directors‘ tenure on firm value. This
type of analysis provides a more effective and more direct measurement of the influence
of independent directors‘ tenure on minority shareholder expropriation.

125
Therefore, in this study, the relationship between independent directors‘ tenure and firm
value is examined. This would contribute to the corporate governance literature in
evidencing whether this relationship is more prevalent in Malaysian family firms or
non-family firms. Therefore, a comparison of the research results of this relationship
between family firms and non-family firms is conducted.
With respect to the research gaps highlighted as well as the discussions in the literature,
the following research questions are being examined:
Is there a negative relationship between independent directors’ tenure and firm value in
Malaysian firms?
If there is a negative relationship between independent directors’ tenure and firm value
in Malaysian firms, is this negative relationship stronger in family firms compared to
non-family firms?
Since, the tenure of independent directors may affect their impartiality in performing
their duties, other corporate governance mechanisms are needed to mitigate corporate
governance problems. One such mechanism is bank monitoring. Studies that examine
the economic effects of loan announcement agreements between firms and banks
provide empirical evidence regarding the ability of banks to act as good corporate
governance mechanisms in terms of being an external monitor of firms (Byers, Fields
and Fraser, 2008). A point to note is that domestic banks are considered to act as good
monitors (Boot and Thakor, 2000; Fok et. al., 2004).

126
3.6 DOMESTIC BANKING RELATIONSHIP
Generally, in certain countries where the economic system is characterised by bank
financing as external sources of funds, corporate governance is enhanced through direct
ownership or financing mechanisms (Charkham, 1995). One of these countries where
bank financing is extensive is Malaysia. In Malaysia, foreign-owned banks comprise
only 16.7% of the total assets of financial institutions whereas domestic banks comprise
57% of the total assets (Detragiache and Gupta, 2006).
Since bank financing is extensive in emerging markets such as Malaysia, it is expected
that banks play a significant corporate governance role in monitoring their clients. The
objectives of bank monitoring is to reduce the banks‘ credit risk by preventing
borrowers from engaging in opportunistic behaviours before and after the loan is
approved. Prior to the loan approval, borrowers can take opportunistic actions to
indicate higher borrowing capacity, obtain lower interest rates and lower contract costs
(Mishkin and Eakins, 2003). Borrowers have the incentives to manage their earnings to
achieve such objectives. In this instance, earnings management is not only conducted by
managing discretionary accruals in financial statement reporting but also through real
activities (Hermawan and Dina, 2011). After the loan is approved, borrowers still
possess incentives to perform opportunistic actions. One of the reasons is to avoid
defaults due to inability to meet debt covenants. Some covenants are accounting-based
measures, which depends on the borrowers‘ financial performance. Generally,
violations of debt covenants would have a negative effect such as higher interest rates,
obligations for early repayment of loans and additional restrictions on the borrowers‘
activities (Beneish and Press, 1993). Hence, banks have specific interest to reduce the
possibility of borrowers taking such opportunistic actions which can reduce their
repayment capacity.

127
Basically, bank monitoring complements the monitoring function of internal corporate
governance mechanisms of firms (Hermawan and Dina, 2011). Treacy and Carey
(2000) find that major banks in USA use qualitative and quantitative measurements for
evaluating their credit risk. Their study shows that banks examine borrowers‘ risk
factors such as the financial statements reliability, the management quality and the
financial conditions. These findings support the significance of effective bank
monitoring on management actions in order to achieve good corporate governance.
In general, domestic banks are able to act as good monitors due to their business of
issuing relationship loans. The distinctive feature of relationship loans is repeated
borrower-lender interactions. These repeated interactions allow the bank to accumulate
information about borrowers and therefore, enhance firm monitoring (Boot and Thakor,
2000). Although domestic banks can act as good monitors, this monitoring becomes
ineffective when a company deals with many banks as its source of debt financing
(Hermawan and Dina, 2011). This is because each bank might rely on other banks to
perform the monitoring function on their borrowers and does not do the monitoring on
its own (Hermawan and Dina, 2011). This monitoring inefficiency may encourage
opportunistic behaviours on the part of the borrowers such as loan expropriation as debt
provides incentives for expropriation particularly in emerging markets (Faccio et.al.,
2001c). In emerging markets, these opportunistic behaviours are further aggravated by
the availability of bank-directed lending through the domestic banking system (Ang and
Sen, 2011). The prevalence of bank-directed lending in Malaysia (Ang, 2009; Ang and
Sen, 2011; Claessens and Fan, 2002; IMF, 1998; Kroszner, 1998; Kwack, 2000;
Laeven, 1999; Oh, 1998; Perera, 2011; Sharma, 2001; Thillainathan, 1999) may
increase expropriation activities by controlling shareholders. In essence, the
opportunistic behaviours of borrowers (i.e. controlling shareholders of firms) induced

128
by multiple domestic banking relationships may ultimately be detrimental to the
interests of minority shareholders and reduce firm value.
However, these opportunistic behaviours may be reduced due to the credit crunch in
emerging markets such as Malaysia during the global financial crisis (Tong and Wei,
2011). Shortage of liquidity were strongly felt in these markets during this period
(Claessens, Dell‘Ariccia, Igan and Laeven, 2010) due to the reduced bank-lending.
During this crisis, domestic banks experienced a reduction in cross-border lending
which ultimately reduced their own lending capacity (Cetorelli and Goldberg, 2010).
When domestic bank-lending capacity is reduced, controlling shareholders particularly
from family firms have less opportunities to expropriate from the domestic loans which
their firms undertake.
Despite these arguments, the extant corporate governance literature only provides
limited evidence with regards to the impact of the number of banking relationships as
well as the number of domestic banks that the firm engages with and firm value.
Degryse and Ongena (2001) examine all the Norwegian public-listed companies for the
period 1979 to 1995 and reveal that an increase in the number of banking relationships
decreases sales profitability. Castelli, Dwyer and Hasan (2012) investigate a sample of
4,680 Italian manufacturing firms for the period 1998 and 2000 and show that an
increase in the number of banking relationships decreases the return on equity (ROE)
and return on assets (ROA) of those firms. They also find that the decrease in ROE and
ROA is stronger for smaller firms compared to larger firms. On the other hand,
Angelini, Di Salvo and Ferri (1998) study a sample of Italian firms and find that firms
borrowing from a limited number of banks have a positive effect on firm performance.
Although the studies by Degryse and Ongena (2001), Castelli et.al. (2012) and Angelini
et.al. (1998) show the effects of multiple banking relationships on firm value, their
studies did not analyse specifically the effects of the number of domestic banks that the

129
firm engages with on firm value. Instead, their studies were merely focused on the
number of banking relationships in general, without analysing in detail, the effects of
domestic banking relationships on firm value. Fok et.al. (2004) evidence this in their
study of the relationship between the number of domestic banks that the firm engages
with and firm value in Taiwan. Fok et. al. (2004) use a sample of 178 public-listed
firms in Taiwan and find that there is a negative relationship between the number of
domestic bank relationships and firm value before the Asian financial crisis (1994-
1996) and after the Asian financial crisis (1997-1998). Fok et. al. (2004) attribute this
negative relationship to the domestic banks‘ lower operating efficiency compared to that
of foreign banks.
However, Fok et.al‘s. (2004) findings are contextual by nature because the strength of
monitoring in domestic banks is dependent upon its institutional context (Thillainathan,
1999). Therefore, the relationship between the number of domestic banks that the firm
engages and firm value in countries other than Taiwan may differ. Even if it is the
same, the institutional context behind it could be different. Currently, the extant
literature does not provide any evidence on this relationship in Malaysia particularly for
family firms. Malaysia possesses a unique institutional setting which encourages such
analysis to be conducted. The unique institutional setting refers to the existence of
bank-directed lending in the domestic banking system (Ang, 2009; Ang and Sen, 2011;
Economic Planning Unit, 1981, 2001, 2006, 2011). With the presence of bank-directed
lending, loan expropriation is encouraged because debt provides incentives for
expropriation in emerging markets particularly in family firms (Faccio et.al., 2001c). In
Malaysia, loans are also issued without much proper scrutiny (Bhattacharya, 2001;
Laeven, 1999; Perera, 2011; Sharma, 2001; Thillainathan, 1999). Hence, the more
domestic banks are engaged by the firm, the more loans the firm can obtain via bank-
directed lending (IMF, 1998; Kroszner, 1998; Kwack, 2000; Oh, 1998; Perera, 2011;

130
Sharma, 2001; Thillainathan, 1999). Therefore, an increase in the number of domestic
banks that the firm engages with provides more opportunities for loan expropriation by
controlling shareholders particularly from family firms and as a result, it is likely that
the firm value is reduced. This study therefore, examines the effects of the number of
domestic banks that Malaysian firms engage with on firm value.
Furthermore, the extant literature does not provide any evidence with respect to whether
this relationship is more prevalent in Malaysian family firms or non-family firms.
Therefore, a comparison of the research results of this relationship between family firms
and non-family firms is also conducted.
With respect to the research gaps highlighted as well as the discussions in the literature,
the following research questions are being examined:
Is there a negative relationship between the number of domestic banks that the firm
engages with and firm value in Malaysian firms?
If there is a negative relationship between the number of domestic banks that the firm
engages with and firm value in Malaysian firms, is this negative relationship stronger in
family firms compared to non-family firms?
Since, domestic banks may not act as effective monitors in emerging markets; it may be
possible to improve corporate governance by controlling shareholders self initiatives.
This may occur when controlling shareholders‘ ownership increases (Jensen and
Meckling, 1976).
131
3.7 MODERATING ROLE OF CONTROLLING SHAREHOLDERS’
OWNERSHIP
In corporate governance research, it is generally assumed that ownership concentration
leads to better governance because these owners possess higher incentives to monitor
and control the managers (Yoshikawa and Rasheed, 2010). Morck and Yeung (2003)
argue that while this view may be valid in the United States (USA), it is by and large
insufficient, if not in error, with regards to family-controlled business firms in countries
outside USA. They identify at least three specific problems which affect the wealth and
interests of minority shareholders. These are referred to as ―other people‘s money‖,
managerial entrenchment and tunnelling. The ―other people‘s money‖ problem refers to
a situation where a family may possess effective control over a firm with very little
investment in that firm (Yoshikawa and Rasheed, 2010). ‗Managerial entrenchment‘
refers to a decline in firm value which occurs when managerial ownership rises beyond
a certain threshold (Shleifer and Vishny, 1997). ‗Tunnelling‘ refers to self-dealing
within a family-owned business group, whereby through non-market prices the
controlling family transfers profits to firms within the group in which they possess
higher shareholding from firms with lower shareholding (Yoshikawa and Rasheed,
2010).
Family-controlled firms may also encounter two additional agency problems. Firstly,
because of large ownership by family owners, there is no market for corporate control
and hence, the capital market possesses little ability to discipline family owners.
Secondly, there may be a significant difference in the risk preferences of family owners
and minority shareholders. Minority shareholders, especially those who seek financial
gains, typically possess diversified portfolios and hence, would prefer individual firms
to undertake higher levels of risk. Family owners, on the other hand, have most of their
wealth tied up with the firm and hence, are likely to be more risk averse than minority
shareholders (Yoshikawa and Rasheed, 2010).

132
Although ownership concentration may not resolve the principal-principal conflict
especially in emerging markets; there is still limited empirical evidence on this issue.
Past studies have generally examined the role of ownership structure as a form of
corporate governance but they did not specifically examine the moderating role of
controlling shareholder‘s ownership on minority shareholder expropriation. Table 3.4
summarises the past key research on ownership as a form of corporate governance.

133
Table 3.4: Summary of Past Key Research on Ownership Structure as a Form Of Corporate Governance
Owner Type Key Issues Studies Addressing The Issue
Executive ownership
Empirical support for the agency theory benefits of executive ownership has been mixed.
Studies show conflicting evidence on how executive ownership influences risk-taking and goal
alignment.
Dalton, Daily, Certo and Roengpitya (2003);
McGuire and Matta (2003); Rajgopal and
Shevlin (2002), Desai and Dharmapala (2006);
Devers, Cannella, Reilly and Yoder (2007).
Board ownership Board ownership signals long-term earnings potential. Independent directors differ considerably
in their ownership but less empirical research focuses on this group.
Certo, Covin, Daily and Dalton (2001);
Hermalin and Weisbach (2003); Kosnik (1990).
Employee ownership
(non-executive) Creates a social-psychological bond that is linked with effectiveness, satisfaction and
performance.
Blasi, Kruse and Berstein (2003); Jones and
Kato (1995); Welbourne and Gomez-Mejia
(1995); Buchko (1993).
Blockholders Empirical research on individual ownership is focused on insiders, usually ignoring individual
outsiders or lumping them together with institutional shareholders.
Family ownership rarely creates value as these owners seek to protect their socio-emotional
endowment.
Corporate ownership can have negative effect for the target firm.
Empirical research highlights the problems associated with state ownership, such as soft budgets,
decreased innovation, corruption and limited competition.
Multiple blockholders create power-dependencies.
Holderness (2003); Shleifer and Vishny (1997);
Mehran (1995).
Anderson and Reeb (2003); Gomez-Mejia,
Larraza-Kintana and Makri (2003).
Bogert (1996); Rosentein and Rush (1990).
Tihanyi and Hegarty (2007); Megginson and
Netter (2001); Shirley and Walsh (2001).
Maury and Pajuste (2005)
Agent owners Overcome obstacles to governance encountered by other shareholders, but also create a dual
agency relationship.
Pressure-sensitive institutional shareholders are poor governors of firm activity.
Pressure-indeterminate institutional shareholders do not possess a systematic governance role.
Pressure-resistant institutional shareholders possess a strong influence on a wide range of firm
outcomes.
Short-term and long-term institutional shareholders possess different and sometimes competing
interests.
Arthurs, Hoskisson, Buscnitz and Johnson
(2003); Grinstein and Michaely (2005).
Edwards and Hubbard (2000).
Brickley, Lease and Smith (1988).
Tihanyi, Johnson, Hoskisson and Hitt (2003);
David, Hitt and Gimeno (2001).
Connelly, Tihanyi, Certo and Hitt (2010);
David, O‘Brien, Yoshikawa and Delios (2010).
Private equity Venture capitalists may be inactive, active-advice-giving, or hands-on; they may work together
in syndicates.
The influence of business angels and venture capitalists varies with their institutional
environment.
Elango, Fried, Hisrich and Polonchek (1995);
Lockett and Wright (2001).
Bruton, Filatotchev, Chahine and Wright
(2009).
Source: Connelly et.al. (2010)
134
In fact, the extant literature only provides limited empirical evidence on the moderating
effects of different kinds of ownership on minority shareholder expropriation. So far
these studies are limited to Iskandar et.al. (2012) and Yoshikawa and Rasheed (2010).
Iskandar et.al. (2012) conduct a study on a sample of 477 public-listed companies in
Malaysia for the year 2005 and find that foreign and managerial ownership positively
moderates the relationship between free cash-flow and asset utilisation. Asset
utilisation is an indirect indicator of expropriation as low asset utilisation indicates
lower efficiency of asset usage, thus, increasing agency costs. Poor asset utilisation
may increase agency costs as managers do not act in the best interests of minority
shareholders in terms of efficiently utilising the firm‘s assets (Fleming, Heaney and
McCosker, 2005). The presence of free cash-flow may lead to inefficient asset
utilisation as it encourages opportunistic behaviours of managers in using the firm‘s
financial resources (Jensen, 1986). Basically the study by Iskandar et.al. (2012) shows
the significance of the moderating role of foreign and managerial ownership in reducing
expropriation via free cash-flow in Malaysian public-listed firms.
Yoshikawa and Rasheed (2010) analyse the entire population of Over-The-Counter
(OTC) family-controlled firms in Japan between 1998 and 2002 and show that bank
ownership positively moderates the relationship between family directors and dividend
payout. However, they find no conclusive evidence on the moderating effect of foreign
ownership on the relationship between family directors and dividend payout as well as
between family directors and firm value. Dividend payouts are an indirect indicator of
expropriation (Gomes, 2000; Jensen, 1986). Dividend payouts signify a reduction in
agency problems because less discretionary cash-flows are available to family owners
and directors for them to engage with opportunistically. This helps reduce their
expropriation activities (Yoshikawa and Rasheed, 2010). Yoshikawa and Rasheed

135
(2010) findings show that bank ownership plays a significant moderating role in
reducing minority shareholder expropriation in Japanese OTC firms.
Although the studies by Iskandar et.al. (2012) and Yoshikawa and Rasheed (2010) show
the significance of the moderating role of foreign, managerial and bank ownership on
expropriation; they did not analyse the moderating effects of controlling shareholders‘
ownership on the relationship between RPTs, independent directors‘ tenure and the
number of domestic banks that the firm engages with, against the firm value. Therefore,
this study will analyse the moderating role of controlling shareholders‘ ownership on
these relationships.
Furthermore, it is also likely that the positive moderating effect of controlling
shareholders‘ ownership on expropriation is stronger in family firms due to the
corporate reputational effects as predicted previously. Hence, it would be timely to
investigate empirically whether this positive moderating effect is stronger in Malaysian
family firms or non-family firms.
With respect to the research gaps highlighted as well as the discussions in the literature,
the following research questions are being examined:
Is there a positive moderating effect of controlling shareholders’ ownership on the
relationship between related party transactions (RPTs) which are likely to result in
expropriation and firm value in Malaysian firms?
Is there a positive moderating effect of controlling shareholders’ ownership on the
relationship between independent directors’ tenure and firm value in Malaysian firms?
Is there a positive moderating effect of controlling shareholders’ ownership on the
relationship between the number of domestic banks that the firm engages with and firm
value in Malaysian firms?

136
If there is a positive moderating effect of controlling shareholders’ ownership on the
relationship between related party transactions (RPTs) which are likely to result in
expropriation and the firm value in Malaysian firms, is the positive moderating effect
stronger in family firms compared to non-family firms?
If there is a positive moderating effect of controlling shareholders’ ownership on the
relationship between independent directors’ tenure and firm value in Malaysian firms,
is the positive moderating effect stronger in family firms compared to non-family firms?
If there is a positive moderating effect of controlling shareholders’ ownership on the
relationship between the number of domestic banks that the firm engages with and firm
value Malaysian firms, is the positive moderating effect stronger in family firms
compared to non-family firms?
3.8 CONCLUSION
This chapter discusses and synthesises the relevant literature related to minority
shareholder expropriation and family firms in order to identify the research gaps.
Specific focus is given to family firms in terms of their inclination towards
expropriation. Furthermore, the relevant research questions have been identified. The
next chapter will discuss the research paradigm, theoretical framework and hypotheses
development.

137
CHAPTER FOUR
THEORETICAL FRAMEWORK AND HYPOTHESES DEVELOPMENT
4.1 INTRODUCTION
This chapter discusses the research objectives, the research paradigm and how the
research is to be concluded. The rest of the chapter is organised as follows. Section 4.2
discusses the philosophical paradigm used in this research. Section 4.3 discusses the
theoretical framework. Section 4.4 discusses the hypotheses development.
4.2 RESEARCH PARADIGM
The hypotheses developed in the previous sections are based upon the functionalist
research paradigm. The functionalist paradigm assumes that society has a concrete
existence and follows certain orders. These assumptions lead to the existence of an
objective and value-free social science, which can produce true explanatory and
predictive knowledge of the reality out there (Ardalan, 2007). It assumes that scientific
theories can be assessed objectively by reference to empirical evidence (i.e. from the
regression results in this research). It attributes independence to the observer from the
observed. It also assumes there are universal standards of science, which determine
what constitutes an adequate explanation of what is observed (e.g., the findings are
based upon the statistical significance, the coefficients and the coefficient signs of the
research results). Furthermore, it assumes there are external rules and regulations
governing the external world. The goal of the researcher is to find the orders that prevail
within that phenomenon (i.e. finding the coefficient signs, coefficients and the statistical
significance in the research results) (Ardalan, 2007).

138
I believe that corporate governance is a technical matter and focus on this aspect in my
research. The corporate governance principle used is basically based on agency theory.
I contend that corporate governance is based on the existence of potential agency
problems that arise from separation of ownership and control in modern corporations
(Ardalan, 2007). Hence, a functionalist approach would be a better approach to study
corporate governance compared to other approaches (such as interpretative approach,
etc) because there is a dominant theory (i.e. agency theory) which could be used to
explain what is observed (Ardalan, 2007). Generally, the functionalist paradigm has
become dominant in mainstream academic finance, which includes corporate
governance (Ardalan, 2007).
4.3 THEORETICAL FRAMEWORK
In emerging markets, the principal-principal conflict (Agency Problem Type II)
constitutes a main concern particularly among family firms such as those in Malaysia
and this creates the incentives for expropriation by family controlling shareholders
(Morck and Yeung, 2003; Young et.al., 2008). The following justifications explain why
expropriation involves the following variables and how it affects firm value as well as
the moderating effects on the relationship between these variables and their firm value.
In addition, the relevant theories are also discussed.
From the discussions earlier, RPTs can be used by controlling shareholders to tunnel
resources out from the firm. Hence, these transactions are one of the channels of
expropriation and ultimately, it can reduce firm value. Since, RPTs can be used for
tunnelling purposes; the Conflict Of Interest Hypothesis is applicable here as RPTs are
more likely to result in negative effects on firm value. The conflict of interest
hypothesis constitutes part of agency theory as RPTs can be abused by controlling

139
shareholders and this is against the interests of minority shareholders. Another aspect
of agency theory which is involved in this research is its assumptions.
Agency theory assumes that independent directors are able to carry out their tasks in
providing checks and balances to board decision-making in an effective manner without
being influenced by controlling shareholders. This constitutes one of the basic
assumptions of agency theory (Fama and Jensen, 1983b). However, managerial
hegemony theorists argue that this assumption may not hold in emerging markets.
Managerial hegemony theorists argue that minority shareholders and management who
are aligned with the controlling shareholder possess differing interests. However, the
controlling shareholder controls the main levers of power in the firm. As a result, the
controlling shareholder may pursue further own interests at the expense of minority
shareholders (Spear et.al., 2007) by influencing the independent directors for
expropriation purposes which further aggravates Agency Problem Type II. This is likely
to occur especially in emerging market firms with poorer investor protection. Hence,
longer directors‘ tenure will likely reduce firm value in the context of emerging markets
such as Malaysia.
Furthermore, according to agency theory, due to the issue of moral hazards that affect
domestic banks as well as the prevalence of bank-directed lending in the context of the
Malaysian institutional setting; it is postulated that firms that possess more domestic
banks as their principal bankers, engage in more debt expropriation, i.e. more
expropriation of bank loan; which reduces firm value compared to those with less
domestic banks as their principal bankers.

140
Aside from agency theory, the theory of ownership structure is also relevant in this
research. The theory of ownership structure explains how changes in ownership
structure such as changes in ownership concentration, identity of owners, etc affect firm
value and hence, shareholders‘ interests, directly or indirectly (Demsetz and Lehn,
1985). It is postulated that the moderating effects of controlling shareholders‘
ownership on the relationship between RPTs, independent directors‘ tenure and the
number of domestic banks that the firm engages with, and firm value will be positive
for family firms, due to the reputational effects after the Transmile case. This
postulation adds to the theory of ownership structure.
Finally, an assessment whether expropriation as well as the moderating effects of
controlling shareholders‘ ownership on expropriation, are more prevalent in Malaysian
family firms or non-family firms is conducted. It is postulated that expropriation is
likely to be more prevalent in family firms because according to agency theory,
principal-principal conflict (i.e. minority shareholder expropriation) may be more
prevalent in these types of firms (Fama and Jensen, 1983b; Shleifer and Vishny, 1997).
In addition to that, the positive moderating effects of controlling shareholders‘
ownership on expropriation, is likely to be more prevalent in family firms due to the
corporate reputational effects after the Transmile fiasco. These comparisons provide a
new perspective to agency theory by empirically examining its interplay with corporate
reputational effects and financial crisis in one single study.
Considering these justifications, Figure 4.1 shows the theoretical framework for this
research:

141
Independent and Moderating Variables Dependent Variable
Agency Theory
Agency Theory
The Theory Of Ownership Structure
Moderating Variable
Figure 4.1: Theoretical Framework
Related Party
Transactions
(RPTs) Which
Are Likely To
Result In
Expropriation
Independent
Directors‘
Tenure
The Number of
Domestic Banks
That The Firm
Engages With
With
Controlling
Shareholders‘
Ownership
Concentration
Firm Value
Accounting-based
& Market-based
Firm Value
Measures

142
4.4 HYPOTHESES DEVELOPMENT
4.4.1 Related Party Transactions (RPTs)
Although there are benefits of RPTs as according to the Efficient Transaction
Hypothesis (Gordon et.al., 2004b,c; Ryngaert and Thomas, 2007)17
; the Conflict Of
Interest Hypothesis is more applicable as RPTs are more likely to result in negative
effects towards firm value. This is because these transactions are used by controlling
shareholders for tunnelling purposes (Djankov et.al., 2008).
The ‗conflict of interest‘ hypothesis and the potential for tunnelling is demonstrated in
well-known corporate scandals in the world such as Enron, Adelphia, and Tyco, as
shown in excerpts from the business press below (Gordon, Henry and Pahlia, 2004a) :
―Enron told the world that these [dozens of off balance sheet] partnerships allowed it to
hedge against fluctuations in the value of its investments. Well, hedge, schmedge. It was
the disclosure, in October, that $1.2 billion of its market value had disappeared as a
result of these "related party" transactions with private partnerships caused Enron to
slash its reported earnings since 1997 by almost $600 million. A week later, those pesky
side deals caused Enron to reveal that it was out another $700 million. Investors trust
understandably collapsed, and, presto, Chapter 11‖.
"What Was Enron?' Editorial, Wall Street Journal,
December 12, 2001. A.18 (as cited in Gordon
et.al., 2004a)
17
Ryngaert and Thomas (2007) outlined several potential benefits from related party transactions. The first benefit is coordination
of activities and feedback between contracting parties as it would be worthwhile to have related parties on board of directors as
means to obtain quick feedback on operations. They argue that these benefits arises from the need of fast information from vendors, the available information obtained from related parties are more reliable than from unrelated parties and the due
process of renegotiating contracts could be achieved with less hassle with related parties. Secondly is to promote contract
efficiency facilitated from related parties‘ familiarities with each other. The third potential benefit is mitigation of holdup problems in the contracting process and the facilitation of investment in firm-specific relationships. They argue related parties
have financial incentives to avoid holdup if they have substantial investment in related firms. Ryngaert and Thomas (2007) also
argue on the viewpoint of purely strategic business decision (e.g. advertising strategy) that related parties‘ transactions could be beneficial.

143
Warning that corporate crimes will result in "handcuffs and a jail cell," federal
authorities arrested the founder of Adelphia Communications and two sons Wednesday
on charges they looted the now-bankrupt cable giant and used it as their "personal piggy
bank."
"Government Arrests Founder of Adelphia, Two
Sons." Associated Press Newswires, July 25,
2002 (as cited in Gordon et.al., 2004a).
From 1997 to 2002, the SEC said Mr. Kozlowski improperly borrowed $242 million
from a Tyco program intended to help executives pay taxes on restricted stock grants.
Instead of using the funds for that purpose, Mr. Kozlowski spent the money on yachts,
fine art, estate, jewellery and luxury apartments. Mr. Swartz similarly used $72 million
in loans from the program for personal investments and business ventures, the SEC said.
"Former Tyco Executives Are Charged --- New York
Prosecutors Say Ex-CEO, Finance Officer Ran `Criminal
Enterprise.'" Wall Street Journal, September 13, 2002 (as
cited in Gordon et.al., 2004a).
These scandals provide extreme examples of probable abuses of RPTs by executives
and board members of the firm (Gordon et.al., 2004a). In general, the view that RPTs
represent a conflict of interest is consistent with agency problems argued by Berle and
Means (1932) and Jensen and Meckling (1976). Jensen and Meckling (1976) explain the
agency conflict between a manager and outside shareholders as the manager's incentive
to extract private benefits from the firm for personal consumption, like perquisites. As
such, RPTs present the potential for the expropriation of the firm's resources and hence,
reduces firm value. This is detrimental to the interests of minority shareholders
(Gordon et.al., 2004a).

144
RPTs are basically detrimental to minority shareholders when the expected benefit from
it is less than the value of an unrelated party transaction (Ryngaert and Thomas, 2007).
This could occur as RPTs provide direct opportunities for related parties such as
controlling shareholders to extract cash and other resources from listed companies
through tunnelling activities (Djankov et.al., 2008). Tunnelling refers to the transfer of
resources out of a company to its controlling shareholder (Johnson et.al., 2000b).
Tunnelling comprises two forms.
First, a controlling shareholder can transfer resources from the firm for its private
benefits through self-dealing transactions. Such transactions include outright theft or
fraud; asset sales and contracts which utilise transfer pricing advantages to the
controlling shareholder; excessive executive compensation; loan guarantees;
expropriation of corporate opportunities, etc. Atanasov, Black and Ciccotello (2008)
provide further explanations and examples of these transactions. They point out that
cash-flow tunnelling includes sale of a firm‘s output at below-market prices to another
firm in which the family has significant or complete cash-flow rights, or overpayment
for inputs purchased from such firms. Cash-flow tunnelling may also result in
excessive salaries or perquisites for family members (or insiders). Asset tunnelling
could also occur and it involves the transfer of a firm‘s assets to firms (usually) fully
owned by the families and it can significantly affect a firm‘s long-term ability to
generate cash-flows.
Second, the controlling shareholder can increase his or her share of the firm without
transferring any assets through dilutive share issues, minority freeze-outs, or other
financial transactions that discriminate against minority shareholders (Johnson et.al.,
2000b). Atanasov et.al. (2008) further argues that such form of tunnelling include
equity tunnelling. Equity tunnelling involves actions which benefit the families at the
expense of a reduction in the value of the shares owned by the other investors, e.g. sale

145
of new shares to the families at a below-market price, delisting and taking a firm
private, and the issue of loans to the families which would not have to be repaid if the
associated business venture were unsuccessful.
Djankov et.al. (2008) argue that the first form of tunnelling enables controlling
shareholders to utilise RPTs to expropriate resources from their firms. This can be
easily achieved if the family firm have low cash-flow rights-to-ownership rights ratio
(Johnson et.al., 2000b). Evidence of tunnelling by family owners in emerging markets
has been found in Bulgaria (Atanasov, 2005); China (Gao and Kling, 2008) and India
(Betrand et.al., 2002).
Since RPTs is a tool for tunnelling, Atanasov et.al. (2008) summarises the impact of
tunnelling on firm value in terms of its impact on share value. They assume that
tunnelling is stealing such that, unlike in the case of transfer pricing, there is zero cash-
flow accruing to the firm from which cash-flow or assets are being tunnelled. In the
absence of tunnelling, the value of each share is given by the following:
VNT = (ROA x A) / K
ROA: Return On Assets
A: Stock of Assets
K: Cost of Capital
If now, a proportion δ of the cash-flow is tunnelled away, the value of each share would
be the following:
VCT = [(1- δ) x ROA x A] / K
If, however, π proportion of the assets itself is tunnelled away, and if this act reduces the
ROA by λ percent, then, the value of each share would be as following:

146
VAT = [(1- π) x (1- λ) x ROA x A] / K
One possible reason for the negative firm value effects of RPTs is the assumption that
non-controlling shareholders (i.e., non-affiliated blockholders and minority
shareholders) will anticipate this expropriation and price protect against it (Jensen and
Meckling, 1976). In Malaysia, this is possible as investors could view previous years‘
RPTs that are disclosed in annual reports due to FRS124 mandatory disclosure
requirements. With access to previous years‘ RPTs information, non-affiliated
blockholders and minority shareholders could anticipate what kind of RPTs that
controlling shareholders could use for expropriation purposes for the current year as
well as their estimated transaction value and subsequently price protect against it.
Kohlbeck and Mayhew (2010) argue that in corporations with controlling shareholders
holding less than 100% equity stake, equilibrium of controlling shareholder
opportunism and non-controlling shareholders price protection could exist. Controlling
shareholders benefit from RPTs expropriation while non-controlling shareholders price
protect against the consequences of this expropriation, and neither has reasons to change
their actions (Kohlbeck and Mayhew, 2010). This results in reduction in a firm value
and it is likely to persist as long as it does not become so severe that the market-for-
corporate control is utilised to change the firm‘s ownership (Kohlbeck and Mayhew,
2010).
It is argued that the anticipation of RPTs and the subsequent price protection (i.e. firm
value reduction) occurs in firms which possess significant divergence between voting
and cash-flow rights and those that are closely affiliated to groups (Faccio et.al., 2001a).
Claessens et.al. (2002) find that in East Asia, divergence between cash-flow rights and
voting rights of family firms reduces Tobin‘s Q of the firms. They estimated that a 10
percentage point divergence between cash-flow and voting rights triggered a 6
percentage point discount in the market valuation of a firm. Similarly, the anticipation

147
of RPTs and subsequent price protection also could occur in affiliated Indian firms,
which facilitate tunnelling (Khanna and Palepu, 2000). This occurs as Indian investors
and creditors are aware of the propensity among group-affiliated firms to transfer
financial resources to other group companies which are inefficient and hence incapable
of raising capital on their own, usually in the form of inter-corporate loans. As a result,
insolvency of any of the group of companies results in a significant reduction in access
to investment and credit for all remaining firms in the group (Gopalan, Nanda and Seru,
2007).
As tunnelling facilitates expropriation through RPTs, it is argued that the negative
effects of RPTs on firm value are more severe in family firms compared to non-family
firms. It is also argued that these effects are more profound in family firms with family
members involved in management. The reason is that family controlling shareholders
possess incentives to enhance the interests of their family members within their firms.
This could be achieved through related sales, related lending, loan guarantees and
related borrowings (Yeh, Shu and Su, 2012). For example, loan guarantees can be
provided to family members so that they can obtain financing at a lower interest rate
from the bank. These loan guarantees provide family members with the option of loan
default, thus, leaving the burden of repayment to family controlling shareholders
(Berkman, Cole and Fu, 2009).
Furthermore, related sales or related purchases, which benefit family members could
also take place (Cheung et.al., 2006; Lo, Wong and Firth, 2010). Family members
could purchase assets from their company such as properties or vehicles at a discounted
rate in comparison with the market value. Vice versa, family members could also sell
these assets at inflated prices to the company. Both these RPTs enhance the interests of
family members at the expense of minority shareholders (Cheung et.al., 2006; Lo,
Wong and Firth, 2010). Jian and Wong (2010) further shows that related sales could be
148
used to prop up earnings of private companies controlled by family members, resulting
in negative effects on family firm performance. This could happen in family firms that
engage related sales transactions with its family members.
Considering all the above explanations, the following hypotheses are developed:
H1a: There is a negative relationship between related party transactions (RPTs)(which
are likely to result in expropriation) and firm value in Malaysian firms.
H1b: The negative relationship between related party transactions (RPTs)(that are
likely to result in expropriation) and firm value in Malaysian family firms will be
stronger in family firms compared to non-family firms.
4.4.2 Independent Directors’ Tenure and Firm Value
One of the scepticisms about the ‗true independence‘ of independent directors is with
regards to the effects of their tenure. However, there are conflicting views with respect
to the effect of directors‘ tenure on directors‘ behaviour. The expert‘s hypothesis
suggests that long-term directors‘ engagement is associated with higher experience,
commitment and competence; because it provides them with important knowledge
about the firm and its business environment (Vafeas, 2003). Vance (1983) argues that
forcing directors to retire leads to a waste of talent and experience. Buchanan (1974)
finds that extended tenure enhances organisational commitment and willingness to
expend effort towards company goals. Salancik (1977) suggests organisational
commitment increases with tenure because employees make certain ‗side bets‘ within
the firm (for example, buying company stock). Organisational commitment increases
because seasoned employees are more likely to have developed confidence and
competence in doing their job.

149
Watts and Zimmerman (1978) and Abdullah et. al. (2010) further argue that reputational
effects could have a positive influence on independent directors‘ behaviour. This could
occur after the Transmile fiasco in 2007. Subsequent to the Transmile case,
independent directors of family firms may prefer to increase their productivity as they
want to increase the image and reputation of their firms (Oh, 2011). Poor reputation
will likely reduce their chances of working as independent directors with non-family
firms (Othman and Rahman, 2010). As a result, the longer they work with the firm; the
firms‘ value may increase as they productively contribute their experience and skills
gained to add value to the firm.
However, corporate reputational effect is generally considered a poor substitute for
weaknesses in the institutional setting in emerging markets (Peng and Jiang, 2010).
These weaknesses include poor legal protection of minority shareholders, voluntary
adoption of corporate governance policies, etc. This is because even reputable
companies are shown to expropriate minority shareholders in these markets especially
during periods of economic crisis (Johnson et. al., 2000a).
Nevertheless, this line of reasoning is insufficient as it does not consider the effect of
corporate governance fiascos such as the Transmile case in Malaysia, which indicate a
strong reputational effect on the behaviour of independent directors of family firms.
Hence, the argument that reputational effect is a poor substitute for institutional
deficiencies may not be valid.
On the contrary, Katz (1982) finds that extended tenure reduces intra-group
communication, and isolates groups from key information sources. He finds that the
performance of groups is non-linearly related to tenure, increasing because of a learning
effect initially, and declining thereafter. Lipton and Lorsch (1992) recognise that lead
directors may attempt to usurp some of the CEO‘s functions through time, and
150
therefore, advocate term limits for directors. Vafeas (2003) proposes a management
friendliness hypothesis, suggesting that seasoned directors are more likely to befriend,
and less likely to monitor managers. Over time, directors may be co-opted by
management as directors become less mobile and less employable. This phenomenon is
more likely to occur in firms with more powerful CEOs. Vafeas (2003) further suggests
that the length of board tenure serves as an observable proxy for the extent to which
non-executive directors are affiliated with management.
Anderson et.al. (2004), Lin et.al. (2011b) and Yunos et.al. (2011) further argue that
board independence is likely to be compromised by long-serving independent directors
as these directors may be highly influenced by controlling shareholders or managers
related or aligned to them, to suit their expropriation incentives which result in the
increased social cohesion between the CEO and the independent directors (Westphal,
1999). This particularly applies to firms in emerging markets as firms in these markets
possess high ownership concentration and are mostly family-controlled (Claessens
et.al., 2000a; Morck and Yeung, 2003). Furthermore, studies by Bebchuk, Fried and
Walker (2002) and Bebchuk and Fried (2003) suggest that management may use their
power to influence the nomination process of directors as well. Independent directors
with strong personal ties with the management are more likely to be re-appointed and
survive a longer term. These directors will not operate independently because they
already possess strong personal ties with the management (Canavan, Jones and Potter,
2004). In addition to that, long tenure directors are less mobile and less employable
(Vafeas, 2003). As business operations become more sophisticated and frequently
changing, long tenure directors increasingly find it difficult to keep track of the changes
in technology, financial dealings, and business strategies as compared to their new
counterparts (Bantel and Jackson, 1989; Canavan et.al., 2004). The former also lack
talent to deal with new issues (Canavan et.al., 2004).

151
Moreover, it can be argued that the entrenchment effects of long board tenure could be
higher in family firms compared to non-family firms in the Malaysian capital markets
because family controlling shareholders have the incentives to exert more influence on
the independent directors due to their interest in managing the firm in their own way to
fulfil their private objectives at the expense of minority shareholders (Anderson and
Reeb, 2003).
Hence, the MCCG 2012 Part 3, Para.3.3 recommends that independent directors‘ tenure
be limited to a maximum of nine years. The entrenchment effects of long board tenure
is likely to persist in Malaysia as the adoption of the principle to limit the maximum
tenure of independent directors to nine years as stated in the Malaysian Code of
Corporate Governance (MCCG) 2012 is voluntary. Hence, Malaysian firms possess no
urgency to comply with this principle as they will continue to allow independent
directors to have long tenure attachment with the firm so that their controlling
shareholders could influence them as the directors‘ tenure increases.
Considering the literature on long tenure directors as well as in line with the proposal by
MCCG 2012 to limit the maximum tenure of independent directors to nine years, I
would argue that long tenure directors are more likely not to be beneficial to Malaysian
family firms.
Thus, the following hypotheses are developed:
H2a: There is a negative relationship between independent directors’ tenure and firm
value in Malaysian firms.
H2b: The negative relationship between independent directors’ tenure and firm value in
Malaysian firms will be stronger in family firms compared to non-family firms.

152
4.4.3 The Number of Domestic Banks that the Firm Engages With
In emerging markets, it is argued that controlling shareholders undertake debt such as
bank loans to expropriate minority shareholders rather than to discipline management
(Grullon and Kanatas, 2001; Ellul, Guntay and Lel, 2007; Faccio et.al., 2001b; Harvey
et.al., 2004). The theoretical underpinning of this scenario is as follows. Firms with
concentrated ownership and control in emerging markets usually belong to business
groups where inside shareholders have control rights that are often in excess of their
cash-flow or ownership rights. This is achieved through various types of corporate
control structures such as pyramids and cross-shareholdings (La Porta et.al., 1999).
Under pyramidal control structures, business groups are organised through a chain of
companies with firms higher in the pyramid possessing higher ownership rights
compared to firms lower in the pyramid. The affiliate at the top of the pyramid, in
which a controlling shareholder has direct control, controls another group affiliate next
in the pyramidal chain, which in turn controls another affiliate, etc (Claessens et.al.,
2000a).
According to established literature, in an environment of weak investor protection and
large private benefits of control, such ownership structures enable inside shareholders to
expropriate minority shareholders through the use of unfair priced transactions to divert
or ‗tunnel‘ resources from affiliated companies lower down in the pyramid where the
divergence between control and cash-flow rights are relatively higher than those higher
up the pyramid where the divergence is lower (Bertrand et.al., 2002; Johnson et.al.,
2000b). Under such a scenario, debt such as bank loans, alone can facilitate
expropriation by enabling shareholders to increase their control over group affiliates.
By increasing the proportion of debt relative to equity in the capital structure, insiders
can possess greater control over the resources of group affiliates without having to
commit additional equity (Harris and Raviv, 1988a; Stulz, 1990). This increase in

153
control, transmitting through pyramids as well as cross-shareholdings, in turn can create
more tunnelling opportunities for expropriating minority shareholders. Furthermore, by
undertaking additional bank loans in affiliates where they possess low cash-flow but
high control rights, controlling shareholders can potentially increase the resources that
can be diverted from these affiliates through related lending or transfer pricing to ones
where their cash-flow rights are higher (Ellul et.al., 2007; Faccio et.al., 2001b).
Nevertheless, in an emerging market setting where investor protection is relatively
poorer and debt expropriation has a higher likelihood to occur; it is argued that the
disadvantages of the domestic banking system in this country outweigh its benefits as it
could be used as a tool for expropriation particularly by family controlling shareholders.
The more domestic banks that are engaged by highly concentrated firms such as family
firms; the more opportunities are available for expropriation by the family controlling
shareholders. Therefore, it is expected that an increase in the number of domestic banks
engaged by the family firm will increase the agency costs of the firm, thus, reducing
firm value.
Furthermore, the issue of loan expropriation from bank-directed lending can be argued
to be potentially more severe in family firms compared to non-family firms because
family owners can use the bank-directed loans to enhance their private objectives such
as firm survival at the expense of minority shareholders (Anderson and Reeb, 2003).
This difference is attributed to the failure of the disciplinary effects of debt to impose
higher costs on family controlling shareholders compared to their expropriation benefits
(Ellul et.al., 2007; Faccio et.al., 2001b). Firstly, in family firms, controlling
shareholders usually take up managerial positions and their performance is not
necessarily tied to the debt liabilities of the firm. This is different from professional
managers who generally care about the associated loss of job tenure or reputation as a
result of debt default and insolvency (Sarkar and Sarkar, 2008). Secondly, reputational

154
considerations in family firms with pyramidal ownership and cross-shareholdings can
be intrinsically weak because if an affiliated firm goes bankrupt because of excessive
leverage, it may be difficult to pin accountability on the controlling shareholder
immersed in the complex corporate structure of its firm. Both of these factors
contribute to the failure of the disciplinary effects of debt on family firms and due to
this failure; family controlling shareholders may expropriate the loans obtained from
banks (Sarkar and Sarkar, 2008). Hence, loan expropriation from bank-directed lending
is argued to be potentially more severe in family firms compared to non-family firms.
As a result, the negative impact of the number of domestic banks that the firm engages
with on firm value is argued to be more severe in family firms compared to non-family
firms.
Aside from agency costs of loan expropriation, there are other factors which also
influence firm value within the bank-firm relationship. Domestic banks possess lower
operating efficiency compared to foreign banks, resulting in higher interest costs for
firms and reducing firm value (Fok et.al., 2004). It is argued that this interest cost effect
towards firm value is controlled by leverage (control variable) in the research model of
this study because the larger the amount of loans undertaken by the firm, the higher
their leverage and the larger the interest cost that the firm have to pay to service their
bank loans.
Moreover, multiple banking relationships by the firm also influence a firm value
through the reduction of the firm‘s liquidity risk (Detragiache, Garella and Guiso, 2000)
and costly reduction in information asymmetry (Diamond, 1984). The latter results in
the firm‘s higher financing costs (interest costs) (Diamond, 1984). In addition to that,
bank loans too could have a positive effect on the firm value (Fama, 1985; Yosha,
1995).
155
In the research model of this study, it is argued that the effects of liquidity risk towards
firm value is controlled by firm‘s risk (control variable) because liquidity risk of the
firm is part of the firm‘s idiosyncratic risk which is a component of the firm‘s total
risk18
. The effects of higher bank financing costs (as a result of costly reduction of
information asymmetry) and bank loans towards firm value is controlled by leverage
(control variable) because bank loans are part of the firm‘s leverage and the higher the
amount of bank loans undertaken by the firm, the higher the leverage and the larger the
cost of bank financing for the firm.
Therefore, it is argued that the resulting effect of the number of domestic banks engaged
by the firm towards its firm value can be attributed to the characteristics of the loans
provided by these domestic banks to the firm; which are more likely to be relationship
and bank-directed loans (Fok et.al., 2004) and they are prone to be expropriated by
controlling shareholders particularly from family firms (Ellul et.al., 2007; Faccio et.al.,
2001b; Grullon and Kanatas, 2001; Harvey et.al., 2004).
Thus, the following hypotheses are developed:
H3a: There is a negative relationship between the number of domestic banks that the
firm engages with and a firm value in Malaysian firms.
H3b: The negative relationship between the number of domestic banks that the firm
engages with and firm value in Malaysian firms will be stronger in family firms
compared to non-family firms.
18 Total firm risk constitutes the firm-specific risk (idiosyncratic risk) and the market risk (Beja, 1972; Modigliani and Pogue,
1974; Radcliffe, 1997; Brigham and Ehrhardt, 2002; Howard, 2006; Crundwell, 2008).

156
4.4.4 The Moderating Effects of Controlling Shareholders’ Ownership
The moderating role of ownership concentration on expropriation is a significant issue
to be investigated particularly in emerging markets, due to the prevalence of high
ownership concentration (Claessens et.al., 2000a; Morck and Yeung, 2003). Analysis
of this role requires a prior understanding of the theory of ownership structure. Morck
et.al. (1988) argue that controlling shareholders respond to two opposing forces when
their ownership increases. They argue that the relationship between ownership
concentration and firm value depends on which force dominates over any particular
range of equity ownership by the controlling shareholder (McConnell and Servaes,
1990; Morck et.al., 1988). The opposing forces work in the following way.
As controlling shareholders‘ ownership increases, they are naturally inclined to allocate
their firms‘ resources to their own best interests, which may conflict with the interests
of minority shareholders, hence, the entrenchment effect (McConnell and Servaes,
1990; Morck et.al., 1988). Simultaneously, as controlling shareholders‘ ownerships
increase, their interests are also likely to be more aligned with the interests of minority
shareholders because the former bear higher cost of the non-pecuniary benefits that they
could enjoy from the firm, hence, the incentive alignment effect (Jensen and Meckling,
1976). The first of these forces has a negative effect on firm value, and hence, a
negative moderating effect of ownership concentration on expropriation whereas, the
second has a positive effect, and hence a positive moderating effect of ownership
concentration on firm value effects (McConnell and Servaes, 1990; Morck et.al., 1988).
Morck et.al. (1988) argue that it is not possible to predict which force will dominate at
any level of ownership concentration beforehand. Therefore, the relationship between
firm value and ownership concentration as well as the moderating effects of ownership
concentration on expropriation remains an empirical issue.

157
Until today, this empirical issue has been mostly analysed in developed markets. In
these markets, Amzaleg and Barak (2013), Anderson and Reeb (2003), Arosa, Iturralde
and Maseda (2010), Bhabra, G.S. (2007), Davies, Hillier and McColgan (2005), Emma
and Pedro (2011), McConnell, Servaes and Lins (2008), McConnell and Servaes (1990,
1995), Miguel, Pindado and Torre (2004), Morck et.al. (1988), Setia-Atmaja et.al.
(2009), Short and Keasey (1999), Stulz (1988) and Thomson and Pedersen (2000) found
that this relationship is concave.
Initially, there is a positive effect of ownership concentration on firm value and hence, a
positive moderating effect of ownership on expropriation. This occurs because as
ownership concentration initially increases, the firm‘s owner possesses fewer incentives
to expropriate from the firm (Jensen and Meckling, 1976; Maury, 2006). In this
process, the interests of the owner are aligned with those of minority shareholders. As
ownership concentration increases after a certain point, the entrenchment effect
dominates the owner and he will extract resources from the firm, thus, reducing firm
value and hence, a negative moderating effect of ownership on expropriation. The
reason this occurs is when ownership exceeds a particular threshold, increased
ownership reduces the efficacy of corporate governance mechanisms which limit the
owner‘s expropriation (Shleifer and Vishny, 1997). The resulting concave relationship
shows that there is an optimal ownership structure for the firm (Demsetz, 1983;
McConnell, McKeon and Xu, 2010). This optimal ownership structure is the peak of
the concave curve where firm value is maximised (Demsetz, 1983; McConnell et.al.,
2010).
However, the concavity findings as explained is not the only finding available in the
literature. Aside from the curvilinear (concave) relationships, some scholars such as La
Porta et.al. (2000b) have found a positive relationship between ownership concentration
and firm value (hence, a positive moderating effect of ownership concentration on firm
158
value effects). On the other hand, Loderer and Martin (1997) have found a negative
relationship (hence, a negative moderating effect of ownership concentration on firm
value effects). Moreover, in Asia, Heugens et.al. (2009) specifically argue that there is
no clear cut solution with regards to the costs and benefits of concentrated ownership.
Theoretically compelling arguments can be furnished in favour of each finding
(Heugens et.al., 2009).
In the context of the developing countries particularly in Asia, it is argued that there is a
positive relationship between ownership concentration and firm value (Heugens et.al.,
2009)(hence, a positive moderating effect of ownership concentration on firm value
effects). In institutional setting where markets are underdeveloped such as those in Asia,
investors have no choice but to accept their role as firm monitors, which they can only
exercise effectively by concentrating their equity holdings. Concentrated ownership
provides them both more powerful incentives to become involved in governance, as
well as a means to influence managers by means of direct access strategies and the
threat of using their concentrated voting rights (David, Hitt and Liang, 2007).
Consequently, controlling shareholders can stimulate or even coerce the corporate
leadership to work in their interest (Heugens et.al., 2009). Hence, increased ownership
concentration may possibly allow controlling shareholders to increase their corporate
control and this reduces Agency Problem Type I i.e. the conflict between controlling
shareholders and managers and hence, induce a positive relationship between ownership
concentration and firm value (hence, a positive moderating effect of ownership
concentration on firm value effects).
In addition, in the context of the Malaysian institutional setting and corporate
governance environment, I would further argue that after the Transmile case,
reputational concerns possibly play a role in influencing a positive moderating effect of
family controlling shareholders‘ ownership on expropriation. These reputational effects

159
are particularly prevalent in family owners in large family firms who usually hold high
equity stakes. These family owners would like to improve their reputation after the
Transmile case because Transmile is owned by the Kuok Group of Companies which is
an established family business conglomerate in Malaysia. Large family owners would
like to see that their reputation improved because poor corporate reputation can affect
them and their family members (Gomez, 1999; Loy, 2010). It is argued that the
reputational effects work the following way. As the shareholding of family owners
increases, they possess higher ownership stakes of their firms. Consequently, they have
higher incentives to take care of their reputation by reducing minority shareholder
expropriation. Thus, increased ownership helps align the incentives of family owners to
those of minority shareholders due to the reputational effects (Loy, 2010). In other
words, reputational effects help align the incentives of family owners to those of
minority shareholders and this help reduce Agency Problem Type II i.e. the conflict
between the controlling shareholder and the minority shareholders. Ultimately this
induce a positive moderating effect of controlling shareholders‘ ownership on firm
value effects i.e. a positive moderating effect of controlling shareholders‘ ownership on
the impact of controlling shareholders‘ expropriation on firm value.
Considering both these arguments, it is hypothesised that controlling shareholders‘
ownership is likely to positively moderate the firm value effects of the key variables
analysed in this research.

160
Hence, the following hypotheses are developed:
H4a: There is a positive moderating effect of the controlling shareholder’s ownership
on the relationship between related party transactions (RPTs) that are likely to
result in expropriation and firm value in Malaysian firms.
H4b: The positive moderating effect of the controlling shareholder’s ownership on the
relationship between related party transactions (RPTs) and firm value in
Malaysian firms will be stronger in family firms compared to non-family firms.
H5a: There is a positive moderating effect of the controlling shareholder’s ownership
on the relationship between independent directors’ tenure and firm value in
Malaysian firms.
H5b: The positive moderating effect of the controlling shareholder’s ownership on the
relationship between independent directors’ tenure and firm value in Malaysian
firms will be stronger in family firms compared to non-family firms.
H6a: There is a positive moderating effect of the controlling shareholder’s ownership
on the relationship between the number of domestic banks that the firm engages
with and firm value in Malaysian firms.
H6b: The positive moderating effect of the controlling shareholder’s ownership on the
relationship between the number of domestic banks that the firm engages with
and firm value in Malaysian firms will be stronger in family firms compared to
non-family firms.

161
4.5 CONCLUSION
This chapter discussed the research paradigm, hypotheses development and theoretical
framework. The next chapter will discuss the research models, variables measurements,
sampling design and data analysis methods used.

162
CHAPTER FIVE
RESEARCH DESIGN AND METHODOLOGY
This chapter discusses the various issues related to research design and methodology.
Section 5.1 discusses the research model. Section 5.2 discusses the variable
measurements. Section 5.3 discusses the sampling design and finally, Section 5.4
discusses the data analysis techniques used in this research. Section 5.5 discusses the
assumptions of statistical analysis. Section 5.6 discusses the model selection criteria.
Section 5.7 discusses the relevant statistical issues such as endogeneity, correlation,
multicollinearity and normality. Section 5.8 discusses the robusting testing method.
Section 5.9 concludes.
5.1 RESEARCH MODEL
This research uses panel data analysis that are the pooled ordinary least square (OLS)
regression model and the Fixed Effect Least Square Dummy Variable (LSDV) Model to
empirically test the hypotheses proposed in this research. The pooled ordinary least
square (OLS) and the Fixed Effect Least Square Dummy Variable (LSDV) method used
also control for heteroscedasticity problems in the data. The model for this study is
similar to the model used by Anderson and Reeb (2003), Claessens et.al. (2002) and Xu
and Wang (1999), which do not allow for non-linearity in order to maintain model
parsimony as well as to prevent significant multicollinearity problems from arising
(Gujarati and Porter, 2009). The models for this research are as follows:

163
Family Firm Model
1. Qit = β0 + β1(RPT)it + β2(Tenure)it + β3(Banks)it + β4(OC)it + β5(SIZE)it + β6(RISK)it + β7(LEV)it + β8(IDR)it + β9(NAB)it +
β10(AGE)it + β11(SG)it + β12(RDS)it + β13(CS)it + β14(MS)it + β15(GDP)it + β16(OC)it(RPT)it + β17(OC)it(Tenure)it +
β18(OC)it(Banks)it + µit
2. MBVRit = β0 + β1(RPT)it + β2(Tenure)it + β3(Banks)it + β4(OC)it + β5(SIZE)it + β6(RISK)it + β7(LEV)it + β8(IDR)it +
β9(NAB)it + β10(AGE)it + β11(SG)it + β12(RDS)it + β13(CS)it + β14(MS)it + β15(GDP)it + β16(OC)it(RPT)it +
β17(OC)it(Tenure)it + β18(OC)it(Banks)it + µit
3. ROEit = β0 + β1(RPT)it + β2(Tenure)it + β3(Banks)it + β4(OC)it + β5(SIZE)it + β6(RISK)it + β7(LEV)it + β8(IDR)it +
β9(NAB)it + β10(AGE)it + β11(SG)it + β12(RDS)it + β13(CS)it + β14(MS)it + β15(GDP)it + β16(OC)it(RPT)it +
β17(OC)it(Tenure)it + β18(OC)it(Banks)it + µit
4. ROAit = β0 + β1(RPT)it + β2(Tenure)it + β3(Banks)it + β4(OC)it + β5(SIZE)it + β6(RISK)it + β7(LEV)it + β8(IDR)it +
β9(NAB)it + β10(AGE)it + β11(SG)it + β12(RDS)it + β13(CS)it + β14(MS)it + β15(GDP)it + β16(OC)it(RPT)it +
β17(OC)it(Tenure)it + β18(OC)it(Banks)it + µit
Non-Family Firm Model
5. Qit = β0 + β1(RPT)it + β2(Tenure)it + β3(Banks)it + β4(OC)it + β5(SIZE)it + β6(RISK)it + β7(LEV)it + β8(IDR)it + β9(NAB)it +
β10(AGE)it + β11(SG)it + β12(RDS)it + β13(CS)it + β14(MS)it + β15(GDP)it + β16(OC)it(RPT)it + β17(OC)it(Tenure)it +
β18(OC)it(Banks)it + µit
6. MBVRit = β0 + β1(RPT)it + β2(Tenure)it + β3(Banks)it + β4(OC)it + β5(SIZE)it + β6(RISK)it + β7(LEV)it + β8(IDR)it +
β9(NAB)it + β10(AGE)it + β11(SG)it + β12(RDS)it + β13(CS)it + β14(MS)it + β15(GDP)it + β16(OC)it(RPT)it +
β17(OC)it(Tenure)it + β18(OC)it(Banks)it + µit
7. ROEit = β0 + β1(RPT)it + β2(Tenure)it + β3(Banks)it + β4(OC)it + β5(SIZE)it + β6(RISK)it + β7(LEV)it + β8(IDR)it +
β9(NAB)it + β10(AGE)it + β11(SG)it + β12(RDS)it + β13(CS)it + β14(MS)it + β15(GDP)it + β16(OC)it(RPT)it +
β17(OC)it(Tenure)it + β18(OC)it(Banks)it + µit
8. ROAit = β0 + β1(RPT)it + β2(Tenure)it + β3(Banks)it + β4(OC)it + β5(SIZE)it + β6(RISK)it + β7(LEV)it + β8(IDR)it +
β9(NAB)it + β10(AGE)it + β11(SG)it + β12(RDS)it + β13(CS)it + β14(MS)it + β15(GDP)it + β16(OC)it(RPT)it +
β17(OC)it(Tenure)it + β18(OC)it(Banks)it + µit
Pooled Model (Family And Non-Family Firms)
9. Qit = β0 + β1(RPT)it + β2(Tenure)it + β3(Banks)it + β4(OC)it + β5(SIZE)it + β6(RISK)it + β7(LEV)it + β8(IDR)it + β9(NAB)it +
β10(AGE)it + β11(SG)it + β12(RDS)it + β13(CS)it + β14(MS)it + β15(GDP)it + β16(OC)it(RPT)it + β17(OC)it(Tenure)it +
β18(OC)it(Banks)it + β19FTit + µit
10. MBVRit = β0 + β1(RPT)it + β2(Tenure)it + β3(Banks)it + β4(OC)it + β5(SIZE)it + β6(RISK)it + β7(LEV)it + β8(IDR)it +
β9(NAB)it + β10(AGE)it + β11(SG)it + β12(RDS)it + β13(CS)it + β14(MS)it + β15(GDP)it + β16(OC)it(RPT)it +
β17(OC)it(Tenure)it + β18(OC)it(Banks)it + β19FTit + µit
11. ROEit = β0 + β1(RPT)it + β2(Tenure)it + β3(Banks)it + β4(OC)it + β5(SIZE)it + β6(RISK)it + β7(LEV)it + β8(IDR)it +
β9(NAB)it + β10(AGE)it + β11(SG)it + β12(RDS)it + β13(CS)it + β14(MS)it + β15(GDP)it + β16(OC)it(RPT)it +
β17(OC)it(Tenure)it + β18(OC)it(Banks)it + β19FTit + µit
12. ROAit = β0 + β1(RPT)it + β2(Tenure)it + β3(Banks)it + β4(OC)it + β5(SIZE)it + β6(RISK)it + β7(LEV)it + β8(IDR)it +
β9(NAB)it + β10(AGE)it + β11(SG)it + β12(RDS)it + β13(CS)it + β14(MS)it + β15(GDP)it + β16(OC)it(RPT)it +
β17(OC)it(Tenure)it + β18(OC)it(Banks)it + β19FTit + µit

164
Qit: Performance measured by Tobin‘s Q at time t.
MBVRit : Performance measured by Market-to-Book Value Ratio at time t.
ROEit : Performance measured by Return On Equity at time t.
ROAit : Performance measured by Return On Asset at time t.
RPTit: Amount of Related Party Transactions That Are Likely to Result in
Expropriation at year t divided by Total Related Party Transactions Value at year t.
Tenureit: Average tenure of independent directors in the firm at year t
Banksit: Quantity of domestic banks engaged by the firm at year t
OCit: Controlling shareholders‘ ownership concentration in the firm at year t (%)
(OC)it(RPT)it: Controlling shareholders‘ ownership concentration in the firm at year t
multiplied by the amount of related party transactions that are likely to result in
expropriation ratio at year t.
(OC)it(Tenure)it: Controlling shareholders‘ ownership concentration in the firm at year t
multiplied by average tenure of independent directors in the firm at year t.
(OC)it(Banks)it: Controlling shareholders‘ ownership concentration in the firm at year t
multiplied by quantity of domestic banks engaged by the firm at year t
Control Variables
SIZEit: Firm Size (Ln(Total Assets)) at year t
RISKit: ln(Firm Risk (Standard Deviation of monthly stock returns between 2007-
2009)) at year t
LEVit: ln(Leverage (Long-term Debt/Total Assets)) at year t
165
IDRit: Independent Directors Ratio (No. of independent directors/Board Size) at year t
NABit: Non-affiliated Blockholder Shareholding at year t
AGEit: ln(Age) at year t
SGit: Sales Growth at year t
RDSit : Research and Development Expenditure-to-Sales at year t
CSit: Capital Expenditure-to-Sales at year t
MSit: Marketing and Advertising Expenditure-to-Sales at year t
GDPit19
: Gross Domestic Product at year t
FTit : Firm type dummy variable at year t, 1 for family firms, 0 for non-family firms.
µit: Stochastic error term at year t
5.2 MEASUREMENTS OF DEPENDENT VARIABLE AND INDEPENDENT
VARIABLES
The following are the definitions and measurement of the variables used in this study:
5.2.1 Dependent Variable: Firm value
This study investigates the relationship between related party transactions (RPTs) which
are likely to result in expropriation, independent director‘s tenure and the number of
domestic banks that the firm engages with and firm value. This research also
investigates the moderating effects of controlling shareholders‘ ownership concentration
on these relationships.
19 GDP could only be included in the Pooled OLS Model and not the Fixed Effects Model due to near singular matrix problems as
well.

166
For these reasons, this study utilises financial accounting information, which can be
divided into accounting measures and market-based measures to acquire the empirical
findings on firm values.
5.2.2 Accounting-Based Firm Value Measurement
Financial accounting can be expressed as an area of accounting related with reporting
financial information to interested external parties such as investors, lenders,
management, suppliers, customers and also other users of financial information.
Financial accounting information is the company‘s accounting and external reporting
systems that present the quantitative data relating to the financial position and company
firm value for a specified period. According to Sloan (2001), the company‘s
management must provide financial statements for external audit to verify that all
financial statements are prepared in accordance with the commonly applicable statutory
and professional principles. Furthermore, Sloan (2001) argued that for corporate
governance, accounting data provides a significant information source, which can
reduce the firm‘s agency problems.
The accounting data used to measure firm value can be categorized into operational
analysis, resource management and profitability from the management‘s viewpoint.
However, not all these firm value measures will be implemented in this research. The
selection of firm value measures are based on the ease of natural calculation and their
acceptability to academicians and practitioners (Ibrahim, 2009).
Hence, this study will use two measurement tools on accounting data to measure firm
value of the firm. The first, is profitability measured by return on assets (ROA), which
concerns the management of the organisation who are responsible to monitor the short
and long-term firm value. The other tool is return on equity (ROE) which relates to the
investors‘ perspective who expect something in return for their investment. Both tools
167
have been selected because these measures use profit as the main focus and this is very
important to management and owners of organisations (Ibrahim, 2009). ROA is
measured by Net Income / Total Assets (Anderson and Reeb, 2003; Holderness and
Sheehan, 1988). ROE is measured by Net Income / Total Common Equity (Holderness
and Sheehan, 1988; Rechner and Dalton, 1991).
5.2.3 Market-Based Firm Value Measurement
Most past studies formerly adopted the accounting measures as an indicator of firm
value and placed less attention on the market measures. According to Oswald and
Jahera (1991) and Chakravarthy (1986), academicians and researchers have made an
argument that accounting measures are insufficient as an indicator to evaluate the
efficiency of firm value. Hence, this study will utilise market-based firm value
measures to gauge firm value.
A market-based performance measure is used as the firm value indicator because unlike
accounting-based measures, market-based measures are not influenced by firm-specific
reporting, idiosyncrasies and potential managerial manipulation. The stock of well-
managed firms has been favoured by most investors and is believed to be superior to
stock price performance, which increases market value, and hence, experiences superior
growth and profitability (Antunovich, Laster and Mitnick, 2000). In this research,
Tobin‘s Q is chosen as a market-based measure for firm value because it has been used
extensively among academicians, researchers and practitioners and it is claimed to be
one of the established market measurement tools. Tobin‘s Q is one of the market
measures pioneered by James Tobin who wanted to examine the causal relationship
between q value and investment. He introduced the variable of q as scaled by the ratio
of market value to replacement cost (Brainard and Tobin, 1968; Tobin, 1969, 1978). He
claims that firms possess an incentive to invest if the margin q value exceeds unity,

168
since the new capital investment value will exceed its cost (Lindenberg and Ross,
1981).
In this study, the q value will be used, which is an approximation of Tobin‘s Q that has
been adopted by Chung and Pruitt (1994), Haniffa and Hudaib (2006), Mishra, Randoy
and Jenssen (2001), Perfect and Wiles (1994) and Villalonga and Amit (2006). Other
empirical studies, similar to this research, for example, Anderson and Reeb (2003),
Faccio et.al. (2000c), McConaughy et.al. (1998), McConnell and Servaes (1990), Morck
et.al. (1988), Setia-Atmaja et.al. (2009), Yermack (1996) and others also use the q value
to measure the market value of the firm. Moreover, Khanna and Palepu (2000) and
Cronqvist and Nilsson (2003) also adopt this similar q value measure in their studies to
examine the relationship between shareholder concentration and firm value in India and
corporate ownership structure in Sweden. The q value is measured by the ratio of (Total
Market Value of Equity + Total Book Value of Liabilities)/ (Total Book Value of
Equity + Total Book Value of Liabilities). The higher the q value the better the
market‘s perception of company performance and the more effective the corporate
governance (Anderson and Reeb, 2003).
As an alternative measure to the q value, the market to book value ratio (MBVR) is also
used. MBVR is calculated as the ratio of the product of the number of equity shares and
the closing price of the stock on the last day of the financial year to total equity (Reddy,
Locke and Scrimgeour, 2010; Sarkar and Sarkar, 2000). MBVR is empirically a cleaner
measure than the q value and has been utilised as an alternative to Tobin‘s Q for
emerging market studies (e.g. by Xu and Wang (1997) on China), as well in other
studies (Capon et.al., 1996). This measure is also more aligned to shareholders‘
objectives (Sarkar and Sarkar, 2000). However, it excludes debt. Hence, both the q
value and MBVR are utilised in this research to check for the robustness of the results
to alternative measures of market-based performance.

169
5.2.4 Independent Variables
5.2.4.1 Related Party Transactions (RPTs)
The number of RPTs which are likely to result in expropriation will be measured as per
disclosed in the section of RPTs in the annual report and as according to the definition
of Cheung et.al. (2006). For this research, RPTs which are likely to result in
expropriation is proxied by the following : (1) the acquisition or sale of tangible or
intangible assets by the listed company from or to a connected person or from or to a
private company majority-controlled by this person (2) the sale of equity stake in the
listed company to a connected person or a private company majority-controlled by this
person.
The sum of values of (1) and (2) are divided by the total RPTs value to obtain the ratio.
This ratio is used to reduce the number of outliers in the distribution. In an environment
of highly concentrated ownership structure and high incentives to expropriate such as
this country, it is expected that related party transactions that are likely to result in
expropriation provide opportunities for expropriation and the higher the amount of these
transactions, the lower the firm value.
5.2.4.2 Independent Directors’ Tenure
The tenure of independent directors is measured by adding up the tenure of each
independent director of the firm (each tenure is measured from the year he or she was
appointed as an independent director until the year of the annual report being analysed)
and divided by the number of independent directors in order to obtain the average
value. This measurement indirectly indicates the likelihood of independent directors
being influenced by controlling shareholders and therefore, no longer ‗truly‘
independent. This measurement is used in board independence studies (Abdelsalam and
El-Masry 2008; Vafeas 2003). Since, directors‘ independence are very likely to be

170
compromised as their tenure increases (Anderson et.al., 2004; Lin et.al., 2011b;
Securities Commission, 2011a; Yunos et.al., 2011), it is expected that there is a negative
relationship between independent directors‘ tenure and firm value.
5.2.4.3 Domestic Banks
This value will be calculated based upon data as disclosed in the organisational profile
of the annual report. Domestic banks are defined as banks and other bank-like
institutions (i.e. institutions which take deposits and make loans) in which the majority
shareholding is held by the private sector (incorporated in Malaysia), public sector or
residents of Malaysia. It excludes banks, which are majority owned by foreigners (non-
Malaysians). This definition is similar to the one used by Brownbridge (1998) except
for the inclusion of public sector majority shareholding as part of the definition of
domestic banks, as certain banks in this country are majority owned by the government
such as Maybank and CIMB Bank. As argued in the hypothesis development section,
the higher number of domestic banks that the firm engages provide more opportunities
for firms to engage in loan expropriation, it is expected that the higher number of
domestic banks that the firm engages reduces firm value.
5.2.4.4 Ownership Concentration
This is extracted from the data of the substantial shareholding in the annual report. It is
measured in terms of percentage of total equity held by each controlling shareholder
(Demsetz and Lehn, 1985; Gul, Kim and Qiu, 2010; Maury, 2006; Wruck, 1989). A
controlling shareholder of a firm is defined as an individual or entity who can obtain
enough shares to assure at least 20% of the firm‘s voting rights and the highest
percentage of voting rights inside the firm in comparison with other shareholders
(Chakrabarty, 2009; La Porta et.al., 1999; De Vries and Manfred, 1993). This translates
to at least 20% of cash-flow rights and the highest percentage of cash-flow rights inside

171
the firm, as Malaysian public-listed firms adopt the 1-share-1-vote principle
(Thillainathan, 1999). 20% of voting rights is considered sufficient for effective control
of the firm (Faccio et.al., 2001a; La Porta et.al., 1999).
In the context of Malaysian annual reports, the substantial shareholding (i.e. the highest
shareholding in the firm held by a shareholder) is calculated by summating the direct
and indirect shareholding of that shareholder. These direct and indirect shareholding do
cover (if any) shareholding via nominees or nominee companies as well as holding
companies. There are notes in the annual reports stating who this substantial shareholder
is through the direct shareholding as well as how this substantial shareholder is related
to his or her indirect shareholding (if any).
5.2.5 Control Variables
5.2.5.1 Firm Size
Demsetz and Lehn (1985) argued that firm size is one of the general forces that could
affect firm value. The firm‘s resources are related to the size of the firm. The larger the
size of the company, the larger the company‘s resources of capital, and the bigger is the
market value of the fraction of the ownership of the shareholder. Hence, firm size can
increase firm value. However, the ability of the minority shareholder to intervene in the
operations of the company is reduced when a firm‘s size increases. As a result, firm
size can reduce a firm value. Therefore, firm size is an important control variable to be
included in this research and the expected sign in its relationship with firm value can be
either positive or negative. ‗Firm size‘ in this research is measured by taking the natural
logarithm of the total asset value of the firm as a proxy (Anderson and Reeb, 2003).
The natural logarithm helps to reduce the number of outliers in the distribution.

172
5.2.5.2 Firm Risk
In finance, risk is defined as the probability that the actual return will be different from
the expected return (Van Horne, 1980). The risk that a firm encounters (i.e. the firm‘s
total risk) is comprised of 2 components i.e. systematic risk and unsystematic risk (Beja,
1972; Brigham and Ehrhardt, 2002; Crundwell, 2008; Howard, 2006; Modigliani and
Pogue, 1974; Radcliffe, 1997). Systematic risk is the market risk encountered by the
firm e.g. economic risks, political risks, natural disaster risks, etc., whereas
unsystematic risk is the idiosyncratic or firm-specific risk that is encountered by the
firm i.e. risk that is due to the firm‘s business, financial and organisational strategies
and policies; management style, business model, etc.
The former cannot be diversified away because this is the risk encountered by all firms
in the market whereas the latter can be diversified away by holding a diversified
portfolio of securities or assets in accordance with Modern Portfolio Theory (MPT)
introduced by Harry Markowitz in 1952 and 1959 (Beja, 1972; Brigham and Ehrhardt,
2002; Crundwell, 2008; Howard, 2006; Modigliani and Pogue, 1974; Radcliffe, 1997).
Modern portfolio theory (MPT) states that the investment risk for a particular expected
return of investment can be minimized by carefully selecting the proportions of
various assets or securities to be invested (Markowitz, 1952, 1959; Radcliffe, 1997;
Tom and Buchanan, 2007).
The Capital Asset Pricing Model (CAPM) shows that the expected returns of a
particular stock is directly proportionate to the stock‘s systematic risk, β and the market
risk premium (Mossin, 1966; Sharpe, 1964; Treynor, 1961, 1962, 1999). Empirical
evidence by Chen (2003), Lau, Lee and McInish (2002) and Shum and Tang (2005)
support the CAPM by showing that there is a significant positive relationship between
173
systematic risk, β of a stock20
and its returns. Moreover, Goyal and Santa-Clara (2003),
Huang, Liu, Ghon and Zhang (2010), Malkiel and Xu (2001) and Pukthuanthong-Le
and Visaltanachoti (2009) empirically found that idiosyncratic risk is also positively
related to the firm‘s expected returns. Therefore, it is expected that the total risk of the
firm is positively related with its firm value and ‗firm risk‘ is an important control
variable in gauging firm value effects.
In this study, firm risk (i.e. total risk) is measured by the standard deviation (σ) of daily
stock returns, which is similar to the measurement used by Anderson and Reeb (2003)
and Crundwell (2008) which used the standard deviation (σ) of monthly stock returns.
The only difference is that the standard deviation of daily stock returns is a more
accurate measurement of stock price volatility as compared to the standard deviation of
monthly stock returns because the sample size of the former is larger (Shintani, 2006).
In this study, the standard deviations (σ) of daily stock returns between 2007 and 2009
are measured. The natural logarithm is taken to reduce the number of outliers in the
distribution as taking the logarithm will reduce the dispersion between the values of the
data analysed (Gujarati and Porter, 2009).
5.2.5.3 Leverage
Past study by Singh and Davidson III (2003) has shown that leverage affects firm value.
Furthermore, Helfert (2003) states that the use of debt to asset ratio is important to
lenders and creditors who are concerned about the degree of financial leverage
employed, and the availability of specific residual asset values, which determine the
margin of protection against risk. Therefore, a high debt to asset ratio indicates a
greater risk for the lender. Higher debt means higher interest expense; therefore, net
income will be lower and hence, affecting accounting-based firm value likes ROA and
20 Systematic risk, β, of a stock is defined under the Capital Asset Pricing Model (CAPM) as the amount of market risk that the
stock contributes to a well-diversified market portfolio of stocks (Brigham and Ehrhardt, 2002; Sharpe, 1964).
174
ROE. Higher debt also means higher risk of insolvency; hence, investors will discount
the share price of the firm by selling off its shares (assuming they are risk-averse). This
affect market-based firm value such as stock returns. These discounts due to investor
sell-off (because of higher risk of insolvency); will reduce market-based firm value such
as Tobin‘s Q. In addition, debt-to-asset ratio or ‗firm leverage‘ may be related to
agency costs in large firms, thereby, reducing firm value.
On the other hand, leverage can also be a tool to control the firm‘s financial resources
from being used for unprofitable investment in accordance with Free Cash-flow
Hypothesis (Jensen, 1986). Thus, leverage may also help increase firm value. Leverage
is measured as the ratio of Long-term Debt / Total Assets (Anderson and Reeb, 2003).
Based upon the explanations, the expected sign for the relationship between leverage
and firm value is either positive or negative.
5.2.5.4 Independent Directors
This variable helps control the overall effects of the independent directors. The higher,
the number of independent directors; the better the monitoring of the firm; hence, firm
value is expected to increase with the number of independent directors. However, an
increase in independent directors may increase the board size and this may be less
effective as compared to small boards (Hermalin and Weisbach, 2003). Moreover, if
there are too many independent directors on the board, some independent directors may
become free riders (Hermalin and Weisbach, 2003). Therefore, an increase in the
number of independent directors in the firm could reduce firm value. Independent
directors are measured by the fraction of the independent directors serving on the board
divided by board size (Anderson and Reeb, 2003). Based upon the explanations, the
expected sign for the relationship between independent directors (i.e. the proportion of
independent directors) on the board and firm value is either positive or negative.

175
5.2.5.5 Non-Affiliated Blockholders
Other substantial shareholders such as mutual funds or pension funds etc; may also play
an important role in monitoring and disciplining controlling shareholders and managers.
As such, the controlling shareholder‘s influence in the firm may be substantially lower
in the presence of outside blockholders (Anderson and Reeb, 2003). Hence, it is
expected that the presence of non-affiliated blockholders have a positive effect towards
firm value. The larger their block, the higher the firm value. Bursa Malaysia listing
requirements defines a blockholder as a shareholder with at least 5 percent equity stake
in the firm (Bursa Malaysia, 2012c). Unaffiliated blockholders are defined as an entity
with no relationship with the controlling shareholder or the firm other than their equity
stake (Anderson and Reeb, 2003). The shareholding of these non-affiliated blockholders
is measured in percentage and it is obtained from the analysis of shareholding section
(substantial shareholder subsection) in annual reports. It includes direct and indirect
shareholding.
5.2.5.6 Firm Age
Firm age can influence firm value due to the market knowledge, learning curve, firm
experience, reputation and survival bias (Ibrahim, 2009). Hence, it is expected that
older firms are likely to be more efficient as compared to younger and newer firms.
Thus, it is expected that there is a positive relationship between firm age and firm
performance (Ang, Cole and Lin, 2000; Yammeesri and Lodh, 2004). Firm age is
measured as the natural logarithm of the number of years since the firm‘s inception
(Anderson and Reeb, 2003). The natural logarithm is taken to reduce the number of
outliers in the distribution as taking the logarithm will reduce the dispersion between the
values of the data analysed (Gujarati and Porter, 2009).

176
5.2.5.7 Sales Growth
Sales growth can influence firm value because faster growing companies are likely to
possess higher valuation (Maury and Pajuste, 2005). Sales growth is measured by the
percentage change in sales year-on-year. It is expected that there is a positive
relationship between sales growth and firm value (Maury and Pajuste, 2005).
5.2.5.8 Research and Development (R&D) Expenditure
Research and development (R&D) expenditure can possibly influence firm value
because it provides economic benefits to the firm (Chauvin and Hirschey, 1993).
Empirically, Ben-Zion (1978), Chan, Martin and Kensinger (1990) and Chung, Wright
and Kedia (2003) find that there is a positive relationship between R&D investment and
firm value. Hence, it is expected that R&D expenditure has a positive relationship with
firm value. In this research, R&D expenditure is measured as the ratio of R&D expense
to sales revenue (Chung et.al., 2003).
5.2.5.9 Capital Expenditure
The ‗theory of the firm‘ views investment decisions as one of the fundamental and
central activities of the modern firm. The normative aspect of the theory claims that a
firm‘s resources should be allocated to value-creating positive net present value (NPV)
projects (Bhana, 2008). Nevertheless, the extant literature provides empirical evidence
that firm value is positively influenced by the firm‘s capital expenditure (Bhana, 2008;
McConnell and Muscarella, 1985; Woolridge, 1988). Hence, in this research, it is
expected that capital expenditure is positively related to firm value. Capital expenditure
is measured by the ratio of capital investment to sales revenue (Daley, Mehrotra and
Sivakumar, 1997).

177
5.2.5.10 Marketing and Advertising Expenditure
Srinivasan and Hanssens (2009) argue that investment (expenditure) in marketing and
advertising activities create (intangible) market-based assets, which in turn enhance firm
value. These market-based assets include customer satisfaction, brand equity, customer
equity, channel structure and perceived product quality (Ramaswami, Srivastava and
Bhargava, 2009; Srinivasan and Hanssens, 2009). Empirical evidence found that
marketing and advertising expenditures do enhance firm value (Hirschey and
Weygandt, 1985; O‘Brien, 2003). However, other studies found no significant
relationship with firm value (Connolly, Hirsch and Hirschey, 1986) and negative
relationship with firm value (Jose, Nichols and Stevens, 1986; Han and Manry, 2004).
Hence, it is expected that there is a positive, negative or no significant relationship
between marketing and advertising expenditure and firm value. In this research,
marketing and advertising expenditure is measured by the ratio of marketing and
advertising expense to sales revenue (Anderson, Fornell and Mazvancheryl, 2004;
Montgomery and Wernerfelt, 1988).
5.2.5.11 Gross Domestic Product
De Miguel, Pindado and De La Torre (2004) and Lee and Grewal (2004) argue that
macroeconomic variables such as economic volatility do influence a firm‘s
performance. Economic volatility is measured by change in Gross Domestic Product
(GDP) (Lee and Grewal, 2004). This is measured by annual growth of GDP in
percentage (BNM, 2012). The annual GDP growth rates are obtained from the Central
Bank (Bank Negara)‘s website (BNM, 2012). If the economy is good (i.e. positive
GDP), firm value will increase. Vice versa, if the economy is not good (i.e. negative
GDP), firm value will decrease. Hence, it is expected that there is a significant negative

178
or positive relationship between GDP and firm value depending on the overall strength
of the economy over a certain period of time.
5.3 SAMPLE SELECTION
This research analyses secondary data concerning the types of ultimate owner, financial
information and board statistics for the period 2007 to 2009. The period 2007 to 2009 is
chosen because this research analyses the interplay between agency theory, corporate
reputational effects and the global financial crisis in a single study. All the data are
obtained from companies‘ annual reports as well as from Bloomberg‘s database.
Data of firm value and the number of domestic banks that the firm engages with are
extracted from the balance sheet. The amount of RPTs which are likely to result in
expropriation is extracted from the RPTs disclosure section of the annual report. The
data to calculate average independent directors‘ tenure is obtained from the directors‘
profile section. Data for the controlling shareholder‘s ownership concentration in terms
of shareholding percentage is extracted from the section of substantial shareholding of
the firm in the annual report.
A total of 530 firms which comprise of 379 family firms and 151 non-family firms
listed on the Main Market of Bursa Malaysia are selected as a sample as at 18th
January,
2011. Since this research involves family firms, it is important to have a proper
definition of family firms.
To recap, the definition of family firms in this study utilises the definition of Barnes and
Hershon (1976) whereby a firm is classified as a family firm if an individual or
members of a single family is the controlling shareholder; with at least 20%
shareholding and family involvement in the management of the firm (Cascino et.al.,
2010). Hence, the definition of family firms used in this study is based upon a threshold
of 20% family shareholding as well as family involvement in the management of the

179
firm. This study did not select firms listed on the ACE markets due to differences in the
type of listed firms and listing requirements21
. As a panel data study, it is significant to
ensure that all firms were active for the entire period of study. Therefore, exclusion
criterion were used on the population of listed firms (Cooper and Schindler, 2001).
To be selected in the sample, the company must be active or have survived the entire
period of analysis i.e. from 2007 to 2009. Companies that are newly listed after 31st
December, 2007 or delisted from the Main Market are excluded from the sample.
However, the study includes firms, which changed their companies‘ names during the
study period. In addition, the firm must have completed a full accounting period or 12
months business operations for each year and should be consistent with the same year-
end throughout the 3-year period. Additionally, the study excludes financial related
firms in the stock exchange (48 of them are family firms) since the accounting standards
for income and profits for these firms are very different from other industries (Campbell
and Keys, 2002; Claessens et.al., 1999a,b; Lemmons and Lins, 2003).
Table 5.1 shows how the final sample of family firms and non-family firms from 2007
to 2009 are derived. The non-family firms comprise of state-owned firms, foreign
firms, corporate-owned firms and mixed ultimate ownership firms. State-owned firms
are firms are firms where the largest shareholder is the government or a government-
owned corporation (USGA, 2011). Foreign-owned firms are firms where the largest
shareholder is a foreign individual or a corporation incorporated overseas (Davies and
Lyons, 1991). Corporate-owned firms are firms where the largest shareholder is a local
private corporation or a local institutional investor. Firms with mixed ultimate
ownership are firms with different type of ultimate owners for different years.
21 ACE market mainly comprise of technology firms similar to the NASDAQ in the United States (Bursa Malaysia, 2012a).

180
Table 5.1: Family Firms and Non-Family Firms Sample
Data Description Number of Companies
Family Non-Family Firms
State-Owned Firms Foreign Corporate
-Owned
Mixed Ultimate
Ownership
Total Main Market firms listed on Bursa Malaysia and
could be utilised in the research, as at 31st December, 2007
498 66 75 44 29
Minus : Financial related firms 48 9 2 13 0
Minus : Firms with missing data 3 1 3 1 1
Minus : Firms with less than 20% ownership 38 9 11 11 11
Minus : Family firms with at least 20% family ownership
but no family members involved in management
30 - - - -
Number of Firms available for observation 379 56 59 19 17

181
The full list of family firms and non-family firms used in this study are listed in
Appendix A of this research.
5.4 DATA ANALYSIS METHODS
This research provides univariate statistics (descriptive statistics) and utilises panel data
pooled in ordinary least square (OLS) regression model for data analysis. In addition to
that, the research uses the panel data from the Fixed Effect Least Square Dummy
Variable (LSDV) Model for the purposes of robustness testing22
. The panel data also
use control methods for heteroscedasticity problems in the data. The control function is
the Period SUR function in the E-Views Version 6 software which is used in the data
analysis. Data examination will also be conducted upon the raw data for the purposes of
producing descriptive statistics.
5.5 ASSUMPTIONS OF STATISTICAL ANALYSIS
This study examines the relationship between RPTs which are likely to result in
expropriation, independent directors‘ tenure and the number of domestic banks that the
firm engages with, and firm value. It also examines the moderating effects of
controlling shareholders‘ ownership on these relationships. In order to visualise this
scenario, data was collected from 530 firms comprising 379 family firms and 151 non-
family firms for the period 2007 to 2009 (a three year period). According to Diggle
et.al. (1994), there are important components in analysis, which are exploratory and
confirmatory or empirical analysis. The exploratory analysis involves the techniques
used to explore and see patterns in the data. On the other hand, the confirmatory or
empirical analysis relates to obtaining the evidence to be tested against the hypotheses.
22 Justification based upon the statistical results of the Hausman Test (Gujarati and Porter, 2009; Hausman, 1978).

182
After cleaning and screening the data, the study calculated the data based on panel data
averages for each firm and then averaging across all firms. The univariate analysis and
panel regression analysis are utilised to analyse the data and obtain the results. Prior to
statistical testing, it is important to assess the underlying assumptions of the univariate
analysis and select the model for panel regression analysis. The following sections
explain the major assumptions which have to be met before performing the regression
analysis.
5.5.1 Independence of Observations and Variables
It is important to ensure that the data is independent of one another, which means that
observations or independent variables must not be influenced by other independent
variables (Pallant, 2005). Stevens (1996) argues that it is very serious if this assumption
is violated. He further argues that each study must ensure that all observations are
independent i.e. free from severe correlation and multicollinearity problems. In this
study, correlation analyses and Variance Inflation Factor (VIF) values are used to gauge
the independence of variables analysed. These issues are further discussed in Sections
5.7.2 and 5.7.3.
5.5.2 Normal Distribution, Homoscedasticity and No Serial Correlation
In regression analysis, normality of the distribution of the variables analysed is
important (Gujarati and Porter, 2009). Skewness and kurtosis are two components in
determining normality (Pallant, 2005). The issue of normality is further discussed in
Section 5.7.4.

183
The heteroscedasticity problem refers to the situation where the conditional variance is
not constant between variable x and y. Indeed, the classical linear regression model
assumes that the variance of each disturbance is constant or has the same variance (i.e.
homoscedastic). In the analysis, the study uses the pooled Ordinary Least Square (OLS)
and fixed effect regression model with cross section and time series weighting for
individual and period effect in order to correct the problem of cross-section and time
series heteroscedasticity. The E-Views panel data analysis tool includes this
heteroscedasticity solution which is the Period SUR function in the E-Views Version 6
software that is used in the data analysis. The problem of serial correlation refers to the
possible time series interdependencies in the error terms of the dependent and
independent variables respectively. The classical linear regression model assumes that
there is no serial correlation or auto-correlation between the error terms. The E-Views
panel data analysis tool includes solutions to resolve this serial correlation problem.
The Durbin-Watson (DW) statistic is used to analyse the problem of serial correlation.
If the E-Views panel data regression results produces a DW statistic value of two, this
means that there is perfectly no serial correlation problems in the data (Gujarati and
Porter, 2009). However, if the DW statistic value is not far from two, this indicates that
there are no significant serial correlation problems. Basically, the E-Views panel data
analysis tool used in this study include functions which significantly resolve the
heteroscedasticity and serial correlation problems. The problem of heteroscedasticity
and serial correlation is already controlled by the Period SUR function in E-Views
Version 6 software which is used in the data analysis.
184
5.6 SELECTIONS IN THE POOLED DATA ANALYSIS
The aim of this study is to observe the pattern of outcomes across the study period by
using the pooled data set. The next section explains the selections which are needed in
this pooled data analysis.
5.6.1 Model Selection Criteria
The researcher has to choose which regression model is the best without violating the
assumptions of model selection criteria. This selection applies to the choice between
the Fixed Effects Model and the Random Effects Model as an alternative test to the
Ordinary Least Square (OLS) model. A Fixed Effects Model assumes differences in
intercepts across groups or time periods, whereas a Random Effects Model explores
differences in error variances. A Fixed Effects Model is appropriate if it strongly
believes that the individual or cross-sectional units in the sample are not random
drawing from a larger sample. However, the Random Effects Model is appropriate if
the cross-sectional units in the sample are regarded as random drawing (Gujarati and
Porter, 2009). The Hausman Test in the E-Views software helps in this process of
model selection. The Hausman Test results imply 2 choices. Either only the Fixed
Effects Model is only suitable to be used or it doesn‘t matter whether to use the Fixed
Effects Model or the Random Effects Model. The following hypotheses illustrate this
test (Gujarati and Porter, 2009) :
H0 : The Fixed Effects Model or the Random Effects Model do not differ substantially
and either can be used.
H1 : The Random Effects Model is not suitable to be used and is rejected.

185
The results of the Hausman Test are as following :
Table 5.2: Family Firms Regression Model (Tobin’s Q as dependent variable)
Test Summary Chi-Square
Statistic
Chi-Square
Degrees of
Freedom
Probability
Cross-Section
Random
63.508563 18 0.0000
Table 5.3: Non-Family Firms Regression Model (Tobin’s Q as dependent variable)
Test Summary Chi-Square
Statistic
Chi-Square
Degrees of
Freedom
Probability
Cross-Section
Random
28.103939 17 0.0437
Table 5.4: Pooled (Family and Non-family Firms) Regression Model (Tobin’s Q as
dependent variable).
Test Summary Chi-Square
Statistic
Chi-Square
Degrees of
Freedom
Probability
Cross-Section
Random
71.422737 18 0.0000

186
Based upon the Hausman Test results, H0 is rejected for both family firms regression
model, non-family firms regression model and the pooled regression model at 1% and
5% significance level. Hence, the Random Effects Model is not suitable to be used and
the Fixed Effects Model is utilised for both models. Since, the model with Tobin‘s Q as
dependent variable uses the Fixed Effects Model, other models with MBV, ROE and
ROA as dependent variables also use the Fixed Effects Model for consistency purposes.
5.7 STATISTICAL ISSUES
5.7.1 Endogeneity Issues
Empirical studies relating firm value to ownership concentration potentially suffer from
the problem of endogeneity (Andres, 2008). The observed relation between ownership
and firm value possibly involve reverse causality. High firm value could prompt
controlling shareholders to keep their shares whereas low firm value might be an
incentive to give up control. Moreover, controlling shareholders usually come from
part of the firm‘s board of directors and the rest of the board is usually hired by
shareholders as well. This enables the controlling shareholder to gain insights into the
firm and hence, possess information advantage as compared to other shareholders in
predicting future firm performance. Therefore, there could be a possibility that
ownership concentration by the controlling shareholder could be determined by firm
value (Andres, 2008). However, the argument that firm value determines ownership
concentration is questionable for several reasons. Although controlling shareholders
possess advantageous information about the firms‘ future prospects, it seems
unreasonable to assume that they are able to predict the performance over the decades
(Andres, 2008). Thus, the endogeneity test is performed to test whether this reverse
causality exists or not.

187
The possibility of reverse causality between ownership concentration with firm value
creates the following possible simultaneous equations:
1) Qit = β0 + β1(RPT)it + β2(Tenure)it + β3(Banks)it + β4(OC)it + β5(SIZE)it +
β6(RISK)it + β7(LEV)it + β8(IDR)it + β9(NAB)it + β10(AGE)it + β11(SG)it +
β12(RDS)it + β13(CS)it + β14(MS)it + β15(GDP)it + β16(OC)t(RPT)it +
β17(OC)it(Tenure)it + β18(OC)it(Banks)it + µit
2) OCit = α0 + α1Qit + α2Qi(t+1) + …….. + α3Qi(t+n) + νit
3) MBVit = β0 + β1(RPT)it + β2(Tenure)it + β3(Banks)it + β4(OC)it + β5(SIZE)it +
β6(RISK)it + β7(LEV)it + β8(IDR)it + β9(NAB)it + β10(AGE)it + β11(SG)it +
β12(RDS)it + β13(CS)it + β14(MS)it + β15(GDP)it + β16(OC)t(RPT)it +
β17(OC)it(Tenure)it + β18(OC)it(Banks)it + µit
4) OCit = α0 + α1MBVit + α2MBVi(t+1) + …….. + α3MBVi(t+n) + νit
5) ROEit = β0 + β1(RPT)it + β2(Tenure)it + β3(Banks)it + β4(OC)it + β5(SIZE)it +
β6(RISK)it + β7(LEV)it + β8(IDR)it + β9(NAB)it + β10(AGE)it + β11(SG)it +
β12(RDS)it + β13(CS)it + β14(MS)it + β15(GDP)it + β16(OC)t(RPT)it +
β17(OC)it(Tenure)it + β18(OC)it(Banks)it + µit
6) OCit = α0 + α1ROEit + α2ROEi(t+1) + …….. + α3ROEi(t+n) + νit
7) ROAit = β0 + β1(RPT)it + β2(Tenure)it + β3(Banks)it + β4(OC)it + β5(SIZE)it +
β6(RISK)it + β7(LEV)it + β8(IDR)it + β9(NAB)it + β10(AGE)it + β11(SG)it +
β12(RDS)it + β13(CS)it + β14(MS)it + β15(GDP)it + β16(OC)t(RPT)it +
β17(OC)it(Tenure)it + β18(OC)it(Banks)it + µit
8) OCit = α0 + α1ROAit + α2ROAi(t+1) + …….. + α3ROAi(t+n) + νit
Qit, OCit : Endogenous Variables
The rest of variables: Exogenous Variables
Qit: Performance measured by Tobin‘s Q at year t.

188
MBVit: Performance measured by Market-to-Book Value at year t.
ROEit : Performance measured by Return On Equity at year t.
ROAit : Performance measured by Return On Asset at year t.
RPTit: Amount of RPTs Which Are Likely to Result in Expropriation at year t divided
by Total Related Party Transactions Value at year t.
Tenureit: Average tenure of independent directors in the firm at year t
Banksit: Quantity of domestic banks that the firm engages with at year t
OCit: Controlling shareholders‘ ownership concentration in the firm at year t (%)
(OC)it(RPT)it: Controlling shareholders‘ ownership concentration in the firm at year t
multiplied by the amount of RPTs Which Are Likely To Result in Expropriation ratio at
year t.
(OC)it(Tenure)it: Controlling shareholders‘ ownership concentration in the firm at year t
multiplied by average tenure of independent directors in the firm at year t.
(OC)it(Banks)it: Controlling shareholders‘ ownership concentration in the firm at year t
multiplied by the quantity of domestic banks that the firm engages with at year t.
SIZEit: Firm Size (Ln(Total Assets)) at year t
RISKit: ln(Firm Risk (Standard Deviation of monthly stock returns between 2007-
2009)) at year t
LEVit: ln(Leverage (Long-term Debt/Total Assets)) at year t
IDRit: Independent Directors Ratio (No. of independent directors/Board Size) at year t
NABit: Non-affiliated Blockholder Shareholding at year t

189
AGEit: ln(Age) at year t
SGit: Sales Growth at year t
RDSit: Research and Development Expenditure-to-Sales at year t
CSit: Capital Expenditure-to-Sales at year t
MSit: Marketing and Advertising Expenditure-to-Sales at year t
GDPit: Gross Domestic Product at year t
µit: Stochastic error term at year t
νit: Stochastic error term at time t
n: No. of years
The Hausman Specification Test is performed to test for these endogeneity issues
(Hausman, 1978) for family firms and the pooled model (family firms and non-family
firms). To run the Hausman Test, first, the following simultaneous equations which
exist in this research are identified :
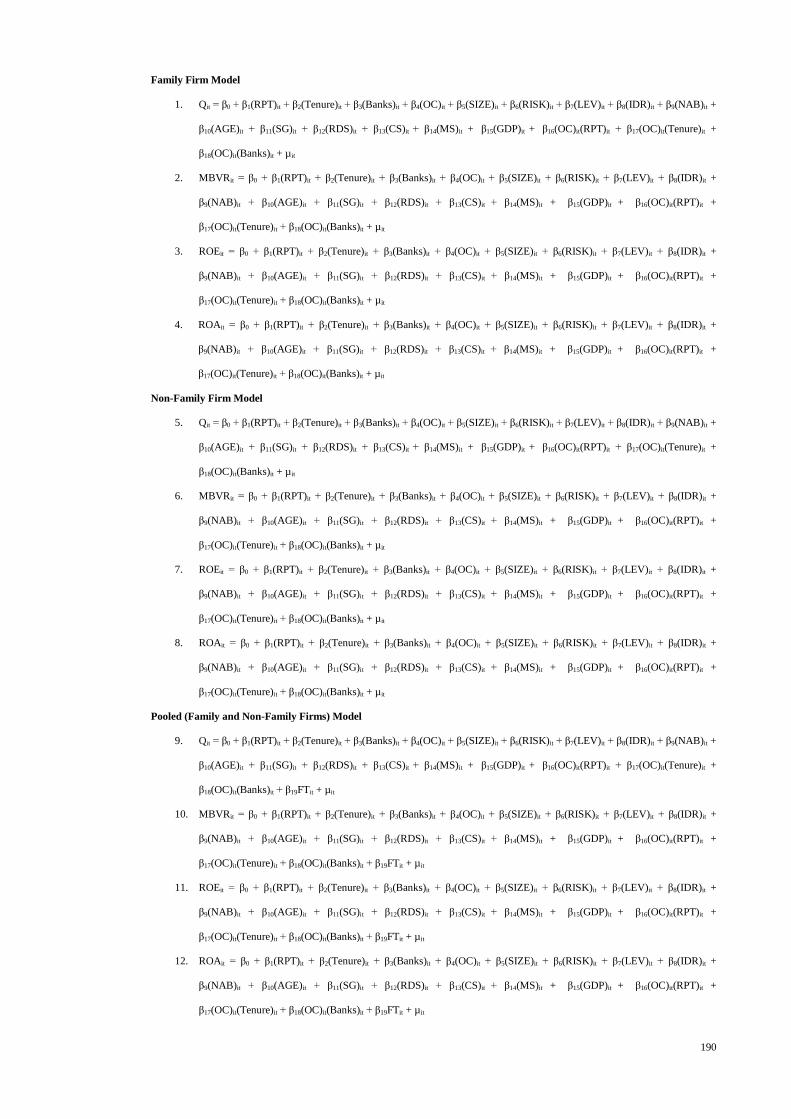
190
Family Firm Model
1. Qit = β0 + β1(RPT)it + β2(Tenure)it + β3(Banks)it + β4(OC)it + β5(SIZE)it + β6(RISK)it + β7(LEV)it + β8(IDR)it + β9(NAB)it +
β10(AGE)it + β11(SG)it + β12(RDS)it + β13(CS)it + β14(MS)it + β15(GDP)it + β16(OC)it(RPT)it + β17(OC)it(Tenure)it +
β18(OC)it(Banks)it + µit
2. MBVRit = β0 + β1(RPT)it + β2(Tenure)it + β3(Banks)it + β4(OC)it + β5(SIZE)it + β6(RISK)it + β7(LEV)it + β8(IDR)it +
β9(NAB)it + β10(AGE)it + β11(SG)it + β12(RDS)it + β13(CS)it + β14(MS)it + β15(GDP)it + β16(OC)it(RPT)it +
β17(OC)it(Tenure)it + β18(OC)it(Banks)it + µit
3. ROEit = β0 + β1(RPT)it + β2(Tenure)it + β3(Banks)it + β4(OC)it + β5(SIZE)it + β6(RISK)it + β7(LEV)it + β8(IDR)it +
β9(NAB)it + β10(AGE)it + β11(SG)it + β12(RDS)it + β13(CS)it + β14(MS)it + β15(GDP)it + β16(OC)it(RPT)it +
β17(OC)it(Tenure)it + β18(OC)it(Banks)it + µit
4. ROAit = β0 + β1(RPT)it + β2(Tenure)it + β3(Banks)it + β4(OC)it + β5(SIZE)it + β6(RISK)it + β7(LEV)it + β8(IDR)it +
β9(NAB)it + β10(AGE)it + β11(SG)it + β12(RDS)it + β13(CS)it + β14(MS)it + β15(GDP)it + β16(OC)it(RPT)it +
β17(OC)it(Tenure)it + β18(OC)it(Banks)it + µit
Non-Family Firm Model
5. Qit = β0 + β1(RPT)it + β2(Tenure)it + β3(Banks)it + β4(OC)it + β5(SIZE)it + β6(RISK)it + β7(LEV)it + β8(IDR)it + β9(NAB)it +
β10(AGE)it + β11(SG)it + β12(RDS)it + β13(CS)it + β14(MS)it + β15(GDP)it + β16(OC)it(RPT)it + β17(OC)it(Tenure)it +
β18(OC)it(Banks)it + µit
6. MBVRit = β0 + β1(RPT)it + β2(Tenure)it + β3(Banks)it + β4(OC)it + β5(SIZE)it + β6(RISK)it + β7(LEV)it + β8(IDR)it +
β9(NAB)it + β10(AGE)it + β11(SG)it + β12(RDS)it + β13(CS)it + β14(MS)it + β15(GDP)it + β16(OC)it(RPT)it +
β17(OC)it(Tenure)it + β18(OC)it(Banks)it + µit
7. ROEit = β0 + β1(RPT)it + β2(Tenure)it + β3(Banks)it + β4(OC)it + β5(SIZE)it + β6(RISK)it + β7(LEV)it + β8(IDR)it +
β9(NAB)it + β10(AGE)it + β11(SG)it + β12(RDS)it + β13(CS)it + β14(MS)it + β15(GDP)it + β16(OC)it(RPT)it +
β17(OC)it(Tenure)it + β18(OC)it(Banks)it + µit
8. ROAit = β0 + β1(RPT)it + β2(Tenure)it + β3(Banks)it + β4(OC)it + β5(SIZE)it + β6(RISK)it + β7(LEV)it + β8(IDR)it +
β9(NAB)it + β10(AGE)it + β11(SG)it + β12(RDS)it + β13(CS)it + β14(MS)it + β15(GDP)it + β16(OC)it(RPT)it +
β17(OC)it(Tenure)it + β18(OC)it(Banks)it + µit
Pooled (Family and Non-Family Firms) Model
9. Qit = β0 + β1(RPT)it + β2(Tenure)it + β3(Banks)it + β4(OC)it + β5(SIZE)it + β6(RISK)it + β7(LEV)it + β8(IDR)it + β9(NAB)it +
β10(AGE)it + β11(SG)it + β12(RDS)it + β13(CS)it + β14(MS)it + β15(GDP)it + β16(OC)it(RPT)it + β17(OC)it(Tenure)it +
β18(OC)it(Banks)it + β19FTit + µit
10. MBVRit = β0 + β1(RPT)it + β2(Tenure)it + β3(Banks)it + β4(OC)it + β5(SIZE)it + β6(RISK)it + β7(LEV)it + β8(IDR)it +
β9(NAB)it + β10(AGE)it + β11(SG)it + β12(RDS)it + β13(CS)it + β14(MS)it + β15(GDP)it + β16(OC)it(RPT)it +
β17(OC)it(Tenure)it + β18(OC)it(Banks)it + β19FTit + µit
11. ROEit = β0 + β1(RPT)it + β2(Tenure)it + β3(Banks)it + β4(OC)it + β5(SIZE)it + β6(RISK)it + β7(LEV)it + β8(IDR)it +
β9(NAB)it + β10(AGE)it + β11(SG)it + β12(RDS)it + β13(CS)it + β14(MS)it + β15(GDP)it + β16(OC)it(RPT)it +
β17(OC)it(Tenure)it + β18(OC)it(Banks)it + β19FTit + µit
12. ROAit = β0 + β1(RPT)it + β2(Tenure)it + β3(Banks)it + β4(OC)it + β5(SIZE)it + β6(RISK)it + β7(LEV)it + β8(IDR)it +
β9(NAB)it + β10(AGE)it + β11(SG)it + β12(RDS)it + β13(CS)it + β14(MS)it + β15(GDP)it + β16(OC)it(RPT)it +
β17(OC)it(Tenure)it + β18(OC)it(Banks)it + β19FTit + µit

191
Ownership Concentration Model (Anderson and Reeb, 2003; Himmelberg,
Hubbard and Pahlia, 1999)
13. OCit = β0 + β1(SIZE)it + β2(SIZE)2
it + β3(RISK)it + µit
Qit: Performance measured by Tobin‘s Q at time t.
MBVRit : Performance measured by Market-to-Book Value Ratio at time t.
ROEit : Performance measured by Return On Equity at time t.
ROAit : Performance measured by Return On Asset at time t.
RPTit: Amount of Related Party Transactions That Are Likely to Result in
Expropriation at year t divided by Total Related Party Transactions Value at year t.
Tenureit: Average tenure of independent directors in the firm at year t
Banksit: Quantity of domestic banks engaged by the firm at year t
OCit: Controlling shareholders‘ ownership concentration in the firm at year t (%)
(OC)it(RPT)it: Controlling shareholders‘ ownership concentration in the firm at year t
multiplied by the amount of related party transactions that are likely to result in
expropriation ratio at year t.
(OC)it(Tenure)it: Controlling shareholders‘ ownership concentration in the firm at year t
multiplied by average tenure of independent directors in the firm at year t.
(OC)it(Banks)it: Controlling shareholders‘ ownership concentration in the firm at year t
multiplied by quantity of domestic banks engaged by the firm at year t

192
Control Variables
SIZEit: Firm Size (Ln(Total Assets)) at year t
(SIZE)2
it : Square of Firm Size (Ln(Total Assets)) at year t
RISKit: ln(Firm Risk (Standard Deviation of monthly stock returns between 2007-
2009)) at year t
LEVit: ln(Leverage (Long-term Debt/Total Assets)) at year t
IDRit: Independent Directors Ratio (No. of independent directors/Board Size) at year t
NABit: Non-affiliated Blockholder Shareholding at year t
AGEit: ln(Age) at year t
SGit: Sales Growth at year t
RDSit : Research and Development Expenditure-to-Sales at year t
CSit: Capital Expenditure-to-Sales at year t
MSit: Marketing and Advertising Expenditure-to-Sales at year t
GDPit : Gross Domestic Product at year t
FTit : Firm type dummy variable at year t, 1 for family firms, 0 for non-family firms.
µit: Stochastic error term at year t
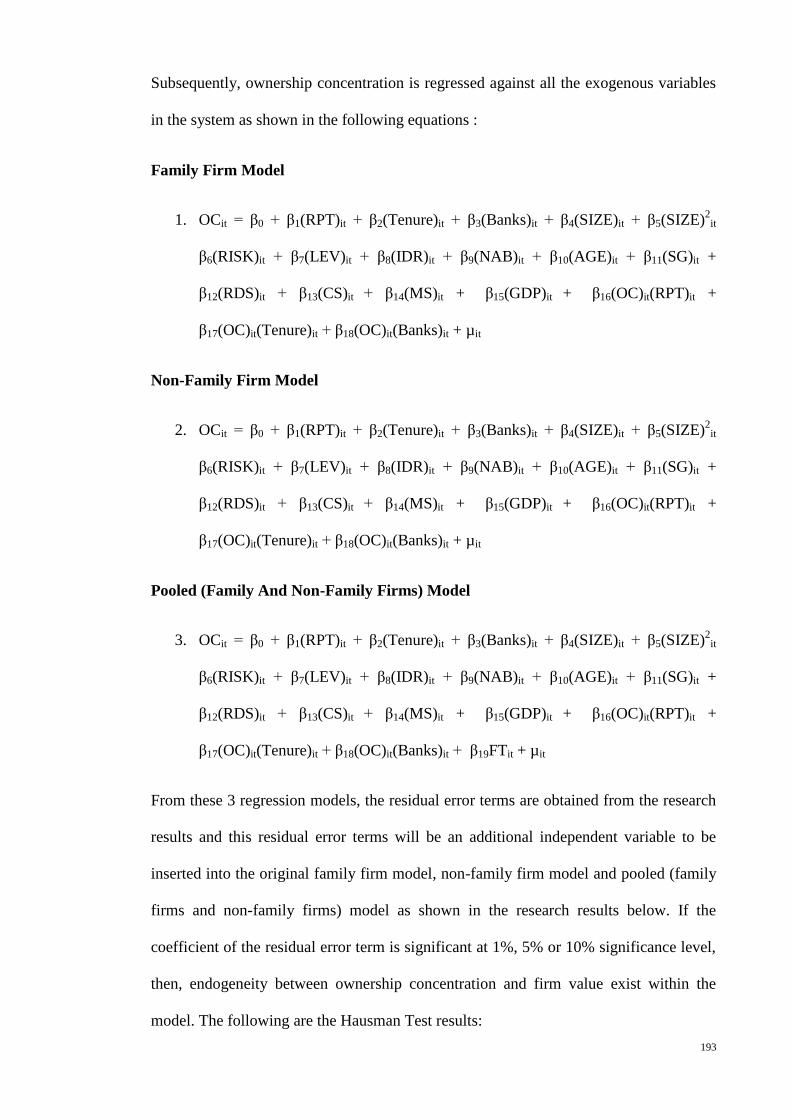
193
Subsequently, ownership concentration is regressed against all the exogenous variables
in the system as shown in the following equations :
Family Firm Model
1. OCit = β0 + β1(RPT)it + β2(Tenure)it + β3(Banks)it + β4(SIZE)it + β5(SIZE)2
it
β6(RISK)it + β7(LEV)it + β8(IDR)it + β9(NAB)it + β10(AGE)it + β11(SG)it +
β12(RDS)it + β13(CS)it + β14(MS)it + β15(GDP)it + β16(OC)it(RPT)it +
β17(OC)it(Tenure)it + β18(OC)it(Banks)it + µit
Non-Family Firm Model
2. OCit = β0 + β1(RPT)it + β2(Tenure)it + β3(Banks)it + β4(SIZE)it + β5(SIZE)2
it
β6(RISK)it + β7(LEV)it + β8(IDR)it + β9(NAB)it + β10(AGE)it + β11(SG)it +
β12(RDS)it + β13(CS)it + β14(MS)it + β15(GDP)it + β16(OC)it(RPT)it +
β17(OC)it(Tenure)it + β18(OC)it(Banks)it + µit
Pooled (Family And Non-Family Firms) Model
3. OCit = β0 + β1(RPT)it + β2(Tenure)it + β3(Banks)it + β4(SIZE)it + β5(SIZE)2
it
β6(RISK)it + β7(LEV)it + β8(IDR)it + β9(NAB)it + β10(AGE)it + β11(SG)it +
β12(RDS)it + β13(CS)it + β14(MS)it + β15(GDP)it + β16(OC)it(RPT)it +
β17(OC)it(Tenure)it + β18(OC)it(Banks)it + β19FTit + µit
From these 3 regression models, the residual error terms are obtained from the research
results and this residual error terms will be an additional independent variable to be
inserted into the original family firm model, non-family firm model and pooled (family
firms and non-family firms) model as shown in the research results below. If the
coefficient of the residual error term is significant at 1%, 5% or 10% significance level,
then, endogeneity between ownership concentration and firm value exist within the
model. The following are the Hausman Test results:

194
Table 5.5: Hausman Test Results To Test For Endogeneity (Family Firms)
Expected
Signs
Independent Variables And
Intercept
Dependent Variable Expected
Signs
Independent Variables
And Intercept
Dependent Variable
Tobin’s Q MBV ROE ROA
Coeff. t-stats Coeff. t-stats Coeff. t-stats Coeff. t-stats
+/- Intercept 0.361772 0.266652 2.267641 0.878473 +/- Intercept -2.088197*** -3.017289 -0.829943*** -3.814889
- Related Party Transactions
That Are Likely to result in
Expropriation Ratio (RPT)
0.348876 0.927835 -0.510859 -0.723507
- Related Party
Transactions That Are
Likely to result in
Expropriation Ratio (RPT) 0.450544** 2.287656 0.188338*** 3.060041
+ Ownership Concentration
(OC) 0.062693 1.523812 -0.015920 -0.205166
+ Ownership Concentration
(OC) 0.050199** 2.347683 0.021062*** 3.161753
- Average Independent
Directors Tenure (Tenure) 0.164605 1.536513 -0.074135 -0.366995
- Average Independent
Directors Tenure (Tenure) 0.160297*** 2.873749 0.058634*** 3.377870
- No. of Local Banks
Engaged by the Firm
(Banks) 0.392699 1.583034 -0.052880 -0.112935
- No. of Local Banks
Engaged by the Firm
(Banks) 0.252603** 1.965891 0.115216*** 2.873980
+ Ln (Firm Risk) 0.145023*** 9.010783 0.155707*** 5.507733 + Ln (Firm Risk) 0.033421*** 3.206322 0.010100*** 3.227492
+/- Leverage (LEV) 0.889480*** 13.53967 0.048349 0.407888 +/- Leverage (LEV) -0.046442 -1.129489 -0.047242*** -3.659139
+/- Firm Size (SIZE) -0.092799*** -3.608554 -0.011377 -0.238828 +/- Firm Size (SIZE) 0.009529 0.668077 0.002910 0.672716
+/- Independent Directors
Ratio (IDR) -0.254094* -1.854782 -0.454091** -1.820631
+/- Independent Directors
Ratio (IDR) -0.110150 -1.396618 -0.056312** -2.316877
+ Non-Affiliated
Blockholders (NAB) -0.000276 -0.463470 -0.003065*** -2.701755
+ Non-Affiliated
Blockholders (NAB) 0.000472 1.538525 0.000263*** 2.740953
+ Ln (Age) -0.029304 -0.700505 -0.004256 -0.049870 + Ln (Age) -0.055773*** -2.810852 -0.022855*** -3.545273
+ Sales Growth (SG) 0.0000405 0.379890 0.000289 1.468652 + Sales Growth (SG) 0.0000729 0.932113 0.0000221 1.190736
+ R&D Expenditure-to-Sales
(RDS) 0.005181 0.549416 -0.005366 -0.289083
+ R&D Expenditure-to-Sales
(RDS) -0.000094 -0.019702 0.000681 0.453935
+ Capital Expenditure-to-
Sales (CS) 0.000348 0.929199 0.000625 0.987198
+ Capital Expenditure-to-
Sales (CS) -0.0000946 -0.283383 -0.0000903 -1.107108
+/- Marketing & Advertising
Expenditure-to-Sales (MS) 0.002378 0.792681 0.007112 1.419872
+/- Marketing & Advertising
Expenditure-to-Sales (MS) 0.000366 0.172214 -0.000526 -0.841882
+/- Gross Domestic Product
(GDP) -0.002755 -1.336969 -0.004996 -1.349592
+/- Gross Domestic Product
(GDP) 0.006327*** 3.168061 0.001352** 2.306059
- OC x RPT -0.007978 -0.858075 0.012984 0.742794 - OC x RPT -0.011502** -2.368434 -0.004854*** -3.190333
- OC x Tenure -0.003638 -1.564768 0.001574 0.358890 - OC x Tenure -0.003292*** -2.725062 -0.001214*** -3.225712
- OC x Banks -0.009301 -1.567213 0.001065 0.095051 - OC x Banks -0.006230** -2.026434 -0.002820*** -2.939852
Residual Error Term (μ) -0.063568 -1.539828 0.010301 0.132358 Residual Error Term -0.044375** -2.065447 -0.019214*** -2.870671
N 379 379 N 379 379
Adjusted R-Squared (%) 19.6937 4.485 Adjusted R-Squared (%) 7.3558 8.654
F-Statistic 15.66228*** 3.807476*** F-Statistic 5.747159*** 6.664348*** * 10% sig.level ** 5% sig.level *** 1% sig.level
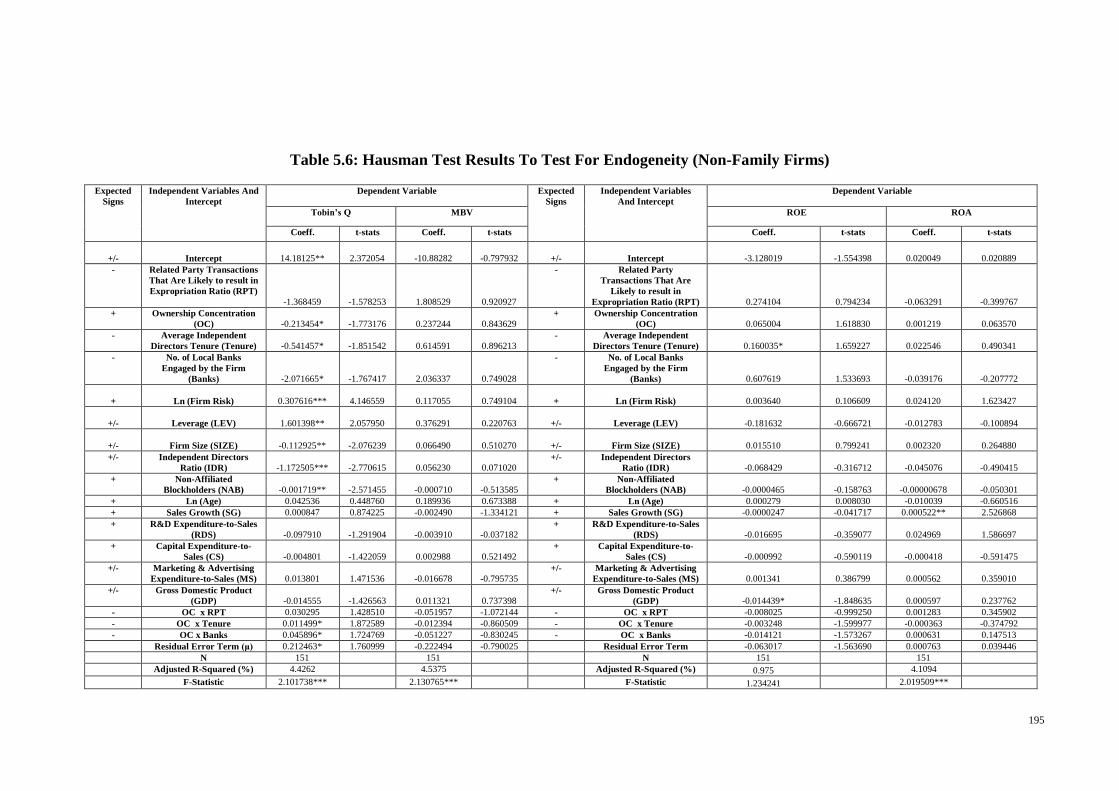
195
Table 5.6: Hausman Test Results To Test For Endogeneity (Non-Family Firms)
Expected
Signs
Independent Variables And
Intercept
Dependent Variable Expected
Signs
Independent Variables
And Intercept
Dependent Variable
Tobin’s Q MBV ROE ROA
Coeff. t-stats Coeff. t-stats Coeff. t-stats Coeff. t-stats
+/- Intercept 14.18125** 2.372054 -10.88282 -0.797932 +/- Intercept -3.128019 -1.554398 0.020049 0.020889
- Related Party Transactions
That Are Likely to result in
Expropriation Ratio (RPT)
-1.368459 -1.578253 1.808529 0.920927
- Related Party
Transactions That Are
Likely to result in
Expropriation Ratio (RPT) 0.274104 0.794234 -0.063291 -0.399767
+ Ownership Concentration
(OC) -0.213454* -1.773176 0.237244 0.843629
+ Ownership Concentration
(OC) 0.065004 1.618830 0.001219 0.063570
- Average Independent
Directors Tenure (Tenure) -0.541457* -1.851542 0.614591 0.896213
- Average Independent
Directors Tenure (Tenure) 0.160035* 1.659227 0.022546 0.490341
- No. of Local Banks
Engaged by the Firm
(Banks) -2.071665* -1.767417 2.036337 0.749028
- No. of Local Banks
Engaged by the Firm
(Banks) 0.607619 1.533693 -0.039176 -0.207772
+ Ln (Firm Risk) 0.307616*** 4.146559 0.117055 0.749104 + Ln (Firm Risk) 0.003640 0.106609 0.024120 1.623427
+/- Leverage (LEV) 1.601398** 2.057950 0.376291 0.220763 +/- Leverage (LEV) -0.181632 -0.666721 -0.012783 -0.100894
+/- Firm Size (SIZE) -0.112925** -2.076239 0.066490 0.510270 +/- Firm Size (SIZE) 0.015510 0.799241 0.002320 0.264880
+/- Independent Directors
Ratio (IDR) -1.172505*** -2.770615 0.056230 0.071020
+/- Independent Directors
Ratio (IDR) -0.068429 -0.316712 -0.045076 -0.490415
+ Non-Affiliated
Blockholders (NAB) -0.001719** -2.571455 -0.000710 -0.513585
+ Non-Affiliated
Blockholders (NAB) -0.0000465 -0.158763 -0.00000678 -0.050301
+ Ln (Age) 0.042536 0.448760 0.189936 0.673388 + Ln (Age) 0.000279 0.008030 -0.010039 -0.660516
+ Sales Growth (SG) 0.000847 0.874225 -0.002490 -1.334121 + Sales Growth (SG) -0.0000247 -0.041717 0.000522** 2.526868
+ R&D Expenditure-to-Sales
(RDS) -0.097910 -1.291904 -0.003910 -0.037182
+ R&D Expenditure-to-Sales
(RDS) -0.016695 -0.359077 0.024969 1.586697
+ Capital Expenditure-to-
Sales (CS) -0.004801 -1.422059 0.002988 0.521492
+ Capital Expenditure-to-
Sales (CS) -0.000992 -0.590119 -0.000418 -0.591475
+/- Marketing & Advertising
Expenditure-to-Sales (MS) 0.013801 1.471536 -0.016678 -0.795735
+/- Marketing & Advertising
Expenditure-to-Sales (MS) 0.001341 0.386799 0.000562 0.359010
+/- Gross Domestic Product
(GDP) -0.014555 -1.426563 0.011321 0.737398
+/- Gross Domestic Product
(GDP) -0.014439* -1.848635 0.000597 0.237762
- OC x RPT 0.030295 1.428510 -0.051957 -1.072144 - OC x RPT -0.008025 -0.999250 0.001283 0.345902
- OC x Tenure 0.011499* 1.872589 -0.012394 -0.860509 - OC x Tenure -0.003248 -1.599977 -0.000363 -0.374792
- OC x Banks 0.045896* 1.724769 -0.051227 -0.830245 - OC x Banks -0.014121 -1.573267 0.000631 0.147513
Residual Error Term (μ) 0.212463* 1.760999 -0.222494 -0.790025 Residual Error Term -0.063017 -1.563690 0.000763 0.039446
N 151 151 N 151 151
Adjusted R-Squared (%) 4.4262 4.5375 Adjusted R-Squared (%) 0.975 4.1094
F-Statistic 2.101738*** 2.130765*** F-Statistic 1.234241 2.019509***

196
Table 5.7: Hausman Test Results To Test For Endogeneity (Pooled Model Of Family Firms And Non-Family Firms)
Expected
Signs
Independent Variables And
Intercept
Dependent Variable Expected
Signs
Independent Variables And
Intercept
Dependent Variable
Tobin’s Q MBV ROE ROA
Coeff. t-stats Coeff. t-stats Coeff. t-stats Coeff. t-stats
+/- Intercept 3.704750** 2.264321 -1.318333 -0.399033 +/- Intercept -1.599306** -2.149192 -0.958144*** -4.026350
- Related Party Transactions
That Are Likely to result in
Expropriation Ratio (RPT) -0.341001 -0.993566 0.191601 0.281939
- Related Party Transactions
That Are Likely to result in
Expropriation Ratio (RPT) 0.278347 1.632414 0.164443*** 3.058607
+ Ownership Concentration
(OC) -0.012910 -0.297630 0.087863 0.998719
+ Ownership Concentration (OC)
0.041213** 2.110099 0.022858*** 3.655618
- Average Independent
Directors Tenure (Tenure) -0.051346 -0.464271 0.207390 0.922325
- Average Independent Directors
Tenure (Tenure) 0.137379*** 2.758968 0.065230*** 4.100468
- No. of Local Banks Engaged
by the Firm (Banks) -0.057942 -0.181758 0.605483 0.938912
- No. of Local Banks Engaged by
the Firm (Banks) 0.237817* 1.650909 0.147809*** 3.203740
+ Ln (Firm Risk) 0.146109*** 8.371234 0.158613*** 6.123022 + Ln (Firm Risk) 0.048391*** 3.764550 0.012285*** 3.284655
+/- Leverage (LEV) 0.843559*** 9.737699 0.163451 1.188322 +/- Leverage (LEV) -0.089763 -1.307647 -0.079035*** -4.181862
+/- Firm Size (SIZE) -0.083941*** -2.991393 -0.038103 -0.662046 +/- Firm Size (SIZE) 0.000738 0.054908 0.001960 0.464084
+/- Independent Directors Ratio
(IDR) -0.407986*** -2.649327 -0.330784 -1.318799
+/- Independent Directors Ratio
(IDR) -0.150465 -1.596708 -0.052667* -1.831683
+ Non-Affiliated Blockholders
(NAB) -0.001047** -2.431232 -0.001689** -1.993916
+ Non-Affiliated Blockholders
(NAB) 0.0000431 0.194051 0.000138** 1.998963
+ Ln (Age) 0.025552 0.660756 -0.011476 -0.113489 + Ln (Age) -0.025567 -1.450835 -0.016174** -2.939374
+ Sales Growth (SG) 0.0000316 0.254192 0.0000544 0.265475 + Sales Growth (SG) 0.0000871 0.708127 0.0000425 1.447240
+ R&D Expenditure-to-Sales
(RDS) -0.000817 -0.066706 -0.015452 -0.622222
+ R&D Expenditure-to-Sales
(RDS) 0.000429 0.061846 0.002444 1.136826
+ Capital Expenditure-to-Sales
(CS) -0.000120 -0.222769 0.000259 0.357830
+ Capital Expenditure-to-Sales
(CS) -0.000341 -0.862055 0.00000553 0.045314
+/- Marketing & Advertising
Expenditure-to-Sales (MS) 0.001738 0.472249 0.001205 0.214460
+/- Marketing & Advertising
Expenditure-to-Sales (MS) 0.001320 0.633715 0.000253 0.385771
+/- Gross Domestic Product
(GDP) -0.003279 -1.081368 -0.003082 -0.772158
+/- Gross Domestic Product (GDP)
0.001160 0.389074 0.001658** 2.019108
- OC x RPT 0.008580 1.019126 -0.004600 -0.275281 - OC x RPT -0.007910* -1.927656 -0.004149*** -3.200916
- OC x Tenure 0.001057 0.447160 -0.004438 -0.922585 - OC x Tenure -0.002717** -2.552863 -0.001321*** -3.884033
- OC x Banks 0.001318 0.175060 -0.015319 -1.006791 - OC x Banks -0.005959* -1.751716 -0.003581*** -3.286005
Firm Type (FT) -0.275415*** -3.309776 -0.402419** -2.177021 Firm Type (FT) 0.062722* 1.698954 0.039572*** 3.361799
Residual Error Term (μ) 0.011144 0.256057 -0.077022 -0.874524 Residual Error Term -0.038130* -1.938837 -0.020645*** -3.277398
N 530 530 N 530 530
Adjusted R-Squared (%) 10.5606 4.2208 Adjusted R-Squared (%) 4.3274 7.242
F-Statistic 10.38108*** 4.501197*** F-Statistic 4.593593*** 7.202952*** * 10% sig.level ** 5% sig.level *** 1% sig.level

197
The Hausman Test results show that in the family firm and pooled (family firms and
non-family firms) regression models, endogeneity exist between ownership
concentration and ROE as well as between ownership concentration and ROA. This is
because the residual error terms in these 2 accounting-based performance measures are
significant at 1% and 10% significance level respectively.
Below are the summary of the results as shown in Table 5.8, 5.9 and 5.10:
Possible Endogeneity between Variables
Table 5.8: Possible Endogeneity in Family Firms Regression Model
Independent Variable Dependent Variable
Ownership Concentration ROE, ROA
Table 5.9: Possible Endogeneity in Non-Family Firms Regression Model
Independent Variable Dependent Variable
Ownership Concentration Tobin‘s Q
Table 5.10: Possible Endogeneity in
Pooled (Family Firms and Non-Family Firms) Regression Model
Independent Variable Dependent Variable
Ownership Concentration ROE, ROA
With endogeneity issues involved in this research, the instrumental variable (IV) is a
suitable variable to be used to eliminate the endogeneity problem (Gujarati and Porter,
2009). This IV is used to substitute the original ownership concentration variable and it
will not have any correlation with the variance of the endogenous variable (i.e. in this
case, firm value), hence, resolving the endogeneity problem (Gujarati and Porter, 2009).
Since, Demsetz and Lehn (1985) argue that ownership is a function of firm size and
risk, the IV utilised in this research is the predicted value of ownership concentration.
This value is obtained by regression of the original ownership concentration values

198
against firm size, the square of firm size and firm risk (Anderson and Reeb, 2003;
Himmelberg et.al., 1999). The following is the IV model utilised:
1. OCFit = β0 + β1SIZEit + β2(SIZE)2
it + RISKit + µit
OCFit: Predicted value of ownership concentration at year t.
SIZEit: Firm Size at year t.
(SIZE)2
it: Square of Firm Size at year t.
RISKit: Natural logarithm of Firm Risk at year t.
µit: Stochastic error term at year t.
The IV (i.e. predicted value of ownership concentration) is subsequently substituted into
the original research model, replacing the prior ownership concentration values and all
the independent variables are regressed against the firm value again.
5.7.2 Correlation Issues
Hinkle, Wiersma and Jurs (2002) propose a rule of thumb for correlation between
variables. Table 5.11 shows their rule of thumb:
Table 5.11: Rule Of Thumb for Interpreting The Size of a Correlation Coefficient
Size Of Correlation Interpretation
0.90 to 1.00 (-0.90 to -1.00) Very high positive (negative) correlation
0.70 to 0.90 (-0.70 to -0.90) High positive (negative) correlation
0.50 to 0.70 (-0.50 to -0.70) Moderate positive (negative) correlation
0.30 to 0.50 (-0.30 to -0.50) Low positive (negative) correlation
0.00 to 0.30 (-0.00 to -0.30) Little if any correlation
Source: Hinkle et.al. (2002)
Table 5.12 shows the correlation matrix for family firms and Table 5.13 shows the
correlation matrix for non-family firms.
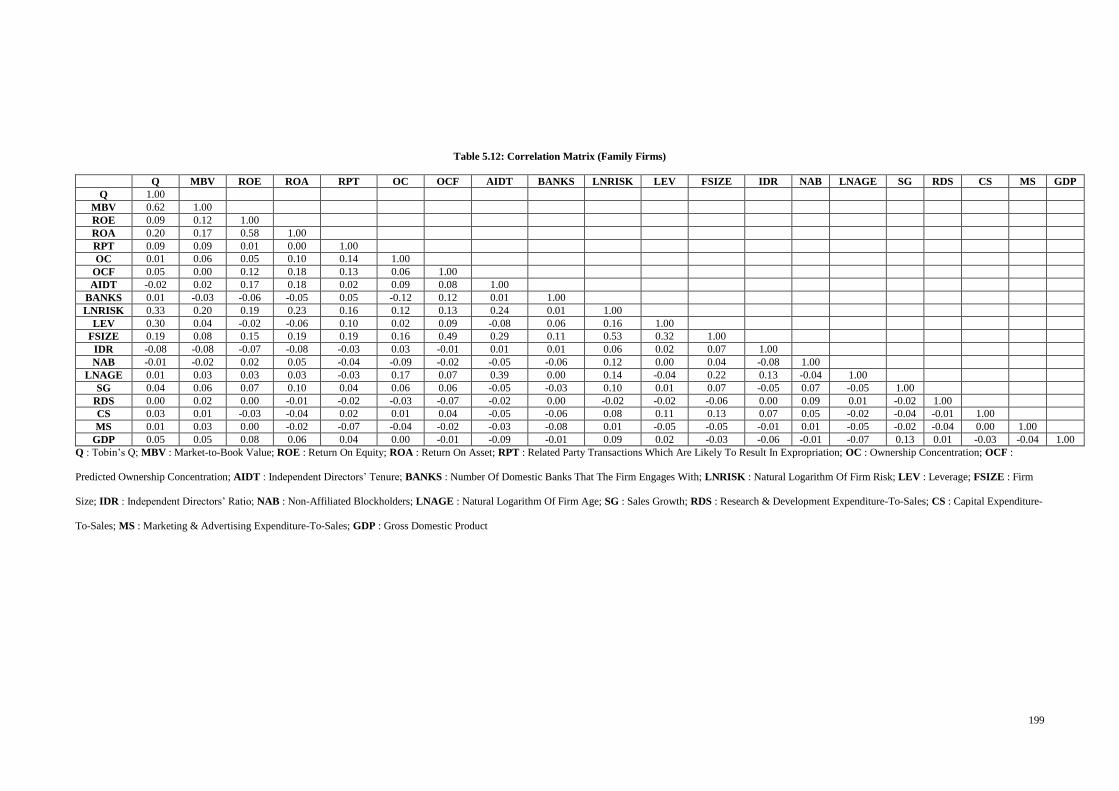
199
Table 5.12: Correlation Matrix (Family Firms)
Q MBV ROE ROA RPT OC OCF AIDT BANKS LNRISK LEV FSIZE IDR NAB LNAGE SG RDS CS MS GDP
Q 1.00
MBV 0.62 1.00
ROE 0.09 0.12 1.00
ROA 0.20 0.17 0.58 1.00
RPT 0.09 0.09 0.01 0.00 1.00
OC 0.01 0.06 0.05 0.10 0.14 1.00
OCF 0.05 0.00 0.12 0.18 0.13 0.06 1.00
AIDT -0.02 0.02 0.17 0.18 0.02 0.09 0.08 1.00
BANKS 0.01 -0.03 -0.06 -0.05 0.05 -0.12 0.12 0.01 1.00
LNRISK 0.33 0.20 0.19 0.23 0.16 0.12 0.13 0.24 0.01 1.00
LEV 0.30 0.04 -0.02 -0.06 0.10 0.02 0.09 -0.08 0.06 0.16 1.00
FSIZE 0.19 0.08 0.15 0.19 0.19 0.16 0.49 0.29 0.11 0.53 0.32 1.00
IDR -0.08 -0.08 -0.07 -0.08 -0.03 0.03 -0.01 0.01 0.01 0.06 0.02 0.07 1.00
NAB -0.01 -0.02 0.02 0.05 -0.04 -0.09 -0.02 -0.05 -0.06 0.12 0.00 0.04 -0.08 1.00
LNAGE 0.01 0.03 0.03 0.03 -0.03 0.17 0.07 0.39 0.00 0.14 -0.04 0.22 0.13 -0.04 1.00
SG 0.04 0.06 0.07 0.10 0.04 0.06 0.06 -0.05 -0.03 0.10 0.01 0.07 -0.05 0.07 -0.05 1.00
RDS 0.00 0.02 0.00 -0.01 -0.02 -0.03 -0.07 -0.02 0.00 -0.02 -0.02 -0.06 0.00 0.09 0.01 -0.02 1.00
CS 0.03 0.01 -0.03 -0.04 0.02 0.01 0.04 -0.05 -0.06 0.08 0.11 0.13 0.07 0.05 -0.02 -0.04 -0.01 1.00
MS 0.01 0.03 0.00 -0.02 -0.07 -0.04 -0.02 -0.03 -0.08 0.01 -0.05 -0.05 -0.01 0.01 -0.05 -0.02 -0.04 0.00 1.00
GDP 0.05 0.05 0.08 0.06 0.04 0.00 -0.01 -0.09 -0.01 0.09 0.02 -0.03 -0.06 -0.01 -0.07 0.13 0.01 -0.03 -0.04 1.00
Q : Tobin‘s Q; MBV : Market-to-Book Value; ROE : Return On Equity; ROA : Return On Asset; RPT : Related Party Transactions Which Are Likely To Result In Expropriation; OC : Ownership Concentration; OCF :
Predicted Ownership Concentration; AIDT : Independent Directors‘ Tenure; BANKS : Number Of Domestic Banks That The Firm Engages With; LNRISK : Natural Logarithm Of Firm Risk; LEV : Leverage; FSIZE : Firm
Size; IDR : Independent Directors‘ Ratio; NAB : Non-Affiliated Blockholders; LNAGE : Natural Logarithm Of Firm Age; SG : Sales Growth; RDS : Research & Development Expenditure-To-Sales; CS : Capital Expenditure-
To-Sales; MS : Marketing & Advertising Expenditure-To-Sales; GDP : Gross Domestic Product

200
Table 5.13: Correlation Matrix (Non-Family Firms)
Q MBV ROE ROA RPT OC OCF AIDT BANKS LNRISK LEV FSIZE IDR NAB LNAGE SG RDS CS MS GDP
Q 1.00
MBV 0.79 1.00
ROE 0.08 0.22 1.00
ROA 0.16 0.05 -0.86 1.00
RPT -0.10 -0.08 0.00 -0.03 1.00
OC 0.04 0.11 0.10 0.02 -0.14 1.00
OCF 0.02 0.21 0.19 -0.07 -0.09 0.34 1.00
AIDT 0.02 0.14 0.07 -0.02 0.20 0.11 0.16 1.00
BANKS -0.07 -0.10 0.00 -0.04 -0.12 -0.21 -0.01 -0.10 1.00
LNRISK 0.35 0.36 0.10 0.06 -0.07 0.23 0.58 0.10 -0.01 1.00
LEV 0.04 0.15 0.04 -0.03 0.00 0.00 0.22 -0.04 0.08 0.01 1.00
FSIZE 0.00 0.13 0.13 -0.05 -0.08 0.28 0.89 0.11 0.03 0.43 0.34 1.00
IDR -0.01 -0.06 -0.01 -0.04 0.01 0.03 -0.07 -0.02 -0.12 -0.03 0.06 -0.04 1.00
NAB -0.10 -0.08 -0.02 0.00 0.15 -0.02 -0.13 0.05 -0.08 -0.06 -0.13 -0.15 -0.05 1.00
LNAGE 0.06 0.11 0.05 -0.03 0.12 0.09 0.17 0.46 0.06 0.17 0.00 0.13 0.10 -0.10 1.00
SG 0.00 0.02 0.10 -0.01 0.03 0.10 0.16 -0.02 -0.03 0.15 0.07 0.10 -0.05 0.04 -0.06 1.00
RDS 0.06 0.01 -0.01 -0.01 -0.04 -0.04 -0.09 -0.05 -0.08 0.02 -0.10 -0.10 0.02 -0.07 -0.06 -0.07 1.00
CS -0.03 -0.01 0.00 -0.02 0.03 -0.03 0.08 -0.06 0.02 -0.03 0.41 0.12 -0.06 -0.07 -0.05 0.11 -0.01 1.00
MS 0.06 0.08 0.04 -0.01 -0.11 0.06 0.01 -0.04 -0.05 -0.01 -0.04 -0.01 0.01 0.04 -0.02 0.10 0.04 -0.05 1.00
GDP -0.01 0.02 -0.05 0.07 0.00 -0.01 0.02 -0.03 -0.01 0.11 -0.02 -0.01 -0.02 -0.01 -0.07 0.16 0.01 -0.05 0.01 1.00
Q : Tobin‘s Q; MBV : Market-to-Book Value; ROE : Return On Equity; ROA : Return On Asset; RPT : Related Party Transactions Which Are Likely To Result In Expropriation; OC : Ownership Concentration; OCF :
Predicted Ownership Concentration; AIDT : Independent Directors‘ Tenure; BANKS : Number Of Domestic Banks That The Firm Engages With; LNRISK : Natural Logarithm Of Firm Risk; LEV : Leverage; FSIZE : Firm
Size; IDR : Independent Directors‘ Ratio; NAB : Non-Affiliated Blockholders; LNAGE : Natural Logarithm Of Firm Age; SG : Sales Growth; RDS : Research & Development Expenditure-To-Sales; CS : Capital Expenditure-
To-Sales; MS : Marketing & Advertising Expenditure-To-Sales; GDP : Gross Domestic Product

201
Except for the correlation between predicted ownership concentration and firm size in
non-family firms with a correlation coefficient of 0.89 (high positive correlation), there
is no high correlation between the dependent variables and the independent variables as
well as between the independent variables in the sample for family firms and non-
family firms.
Due to the high correlation between predicted ownership concentration and firm size in
the sample for non-family firms, the variable firm size is taken out from the regression
of Tobin‘s Q against the independent variables for this sample. The conclusions made
as a result of these correlation analyses are further supported by the Variance Inflation
Factor (VIF) values in the analysis of multicollinearity.
5.7.3 Multicollinearity Issues
Except for predicted ownership concentration in non-family firms, there are no
significant multicollinearity problems between the independent variables in the
proposed research model as all the Variance Inflation Factor (VIF) values are less than
five. VIF values less than five means there are no multicollinearity problems (Gujarati
and Porter, 2009). For the predicted ownership concentration in non-family firms, the
VIF value is 7.053 which is higher than 5. This means that there are significant
multicollinearity problems between predicted ownership concentration and the other
independent variables. Therefore, in order to reduce the multicollinearity problems, the
independent variable firm size is taken out of the model for the regression of Tobin‘s Q
against the independent variables for non-family firms. When firm size is taken out, the
VIF value for predicted ownership concentration is reduced to 1.595; hence,
multicollinearity problems are significantly reduced.

202
Table 5.14 and 5.15 show the VIF values for family firms and non-family firms for each
of the independent variables analysed in this research:
Table 5.14: VIF Values for Family Firms and Non-Family Firms
Family Non-Family
Independent Variables Variance Inflation Factor
(VIF)
RPT 1.038 1.063
Ownership Concentration 1.055 1.098
Independent Directors‘ Tenure 1.228 1.155
Quantity Of Domestic Banks Engaged By
The Firm
1.016 1.030
Firm Risk 1.235 1.216
Leverage 1.08 1.193
Firm Size 1.226 1.164
Independent Directors Ratio 1.054 1.037
Non-affiliated Blockholders 1.047 1.026
Firm Age 1.375 1.175
Sales Growth 1.084 1.114
R&D Expenditure 1.055 1.017
Capital Expenditure 1.061 1.143
Marketing And Advertising Expenditure 1.014 1.018
Gross Domestic Product 1.002 1.002
Table 5.15: VIF Values for Family Firms and Non-Family Firms (With Predicted
Ownership Concentration)
Family Non-Family
Independent Variables Variance Inflation Factor
(VIF)
RPT 1.029 1.048
Predicted Ownership Concentration 1.518 7.053
Independent Directors‘ Tenure 1.229 1.155
Quantity Of Domestic Banks Engaged By
The Firm
1.018 1.019
Firm Risk 1.280 1.752
Leverage 1.084 1.201
Firm Size 1.659 4.650
Independent Directors Ratio 1.056 1.039
Non-affiliated Blockholders 1.034 1.026
Firm Age 1.350 1.179
Sales Growth 1.085 1.140
R&D Expenditure 1.050 1.013
Capital Expenditure 1.061 1.144
Marketing And Advertising Expenditure 1.014 1.018
Gross Domestic Product 1.001 1.001

203
5.7.4 Normality Issues
Skewness and kurtosis are important issues for normality (Hair, Black, Babin, Anderson
and Tatham, 2006). For a normal distribution, the skewness and kurtosis values should
be zero (Hair et.al., 2006). Table 5.16 shows the skewness and kurtosis values of the
dependent and independent variables in this study for family firms whereas Table 5.17
shows the skewness and kurtosis values for non-family firms.

204
Table 5.16: Skewness And Kurtosis Values For Family Firms
Table 5.17: Skewness And Kurtosis Values For Non-Family Firms
Q MBV ROE ROA RPT OC OCF AIDT BANKS LNRISK LEV FSIZE IDR NAB LNAGE SG RDS CS MS GDP
Skewness 5.1 8.7 -17.3 17.2 1.9 0.1 -1.1 0.9 1.4 0.1 1.6 0.6 0.9 2.9 -0.7 3.9 8.6 7.2 4.1 -0.6
Kurtosis 38.4 91.7 345.4 346.5 4.9 2.5 4.8 3.5 8.1 3.2 5.2 3.9 3.7 12.9 3.2 31.3 91.2 79.0 25.2 1.5
Q : Tobin‘s Q; MBV : Market-to-Book Value; ROE : Return On Equity; ROA : Return On Asset; RPT : Related Party Transactions Which Are Likely To Result In
Expropriation; OC : Ownership Concentration; OCF : Predicted Ownership Concentration; AIDT : Independent Directors‘ Tenure; BANKS : Number Of Domestic
Banks That The Firm Engages With; LNRISK : Natural Logarithm Of Firm Risk; LEV : Leverage; FSIZE : Firm Size; IDR : Independent Directors‘ Ratio; NAB :
Non-Affiliated Blockholders; LNAGE : Natural Logarithm Of Firm Age; SG : Sales Growth; RDS : Research & Development Expenditure-To-Sales; CS : Capital
Expenditure-To-Sales; MS : Marketing & Advertising Expenditure-To-Sales; GDP : Gross Domestic Product
Q MBV ROE ROA RPT OC OCF AIDT BANKS LNRISK LEV FSIZE IDR NAB LNAGE SG RDS CS MS GDP
Skewness 5.5 8.5 -3.9 -1.4 0.7 0.5 -1.5 1.5 1.1 0.3 7.2 0.7 0.7 3.1 -0.6 16.9 16.9 12.0 4.7 5.5
Kurtosis 49.6 103.1 124.6 12.7 1.9 2.6 5.5 7.3 4.6 3.1 91.5 3.8 3.2 18.6 3.2 363.6 296.6 197.7 48.9 49.6

205
In the regression analysis, normality of the distribution of the variables analysed is
important (Gujarati and Porter, 2009). Skewness and kurtosis are two components in
determining normality (Pallant, 2005). In this study, most of the variables‘ distribution
is skewed to the left or the right of the curve, for example, sales growth and R&D
expenditures are highly skewed to the right whereas ROE is skewed to the left.
Similarly, some of these variables possess a high positive kurtosis (example, sales
growth , R&D expenditure and capital expenditure) and some a low positive kurtosis
(example, ownership concentration, firm risk and firm age). Both these descriptions
indicate that there is a departure from normality. However, the issue which involves the
variables of non-normal distribution is quite common in research which involves a large
sized sample (Pallant, 2005). In fact, this argument is supported by Norusis (2000) and
Kleinbaum, Kupper, Muller and Nizam (1998) who explain that variance analysis which
is used in regression is not heavily dependent on the assumption of normality since the
data set is large. Consequently, the assumption of normality is not seriously offended in
this research since this study covers a large sample size.
5.8 ROBUSTNESS TEST
Since the 1970s, industrial organisation economics has provided the theoretical basis for
the determinants of a firm‘s performance (Hawawini, Subramaniam and Verdin, 2003).
Porter (1980) argues that the structural characteristics of industries are the primary
determinants of a firm‘s performance. Various studies investigated factors explaining
the consistent differences in performance between industries. The industrial
organization economists‘ preferred framework is the structure-conduct-performance
(SCP) model. This model proposes the existence of a deterministic relationship
between market structure and profitability. Based upon this framework, Mason (1939)
argues that the structural characteristics of an industry constrain the behaviour of its

206
component firms, which in turn led to differences in firm performance within different
industries. Hence, industry effects in this research are controlled.
Hence, as a robustness test, potential industry effects by using the subset of industries
that contain both family and non-family firms are controlled (i.e. industries with 100
percent family or non-family firms are excluded). If industry effects are not controlled,
they can possibly cause bias to the regression results (Anderson and Reeb, 2003)
because they may have an impact towards firm value (Mason, 1939; Porter, 1980).
In this research, industries that contain one hundred percent family firms and non-
family firms respectively are excluded from the analysis. This is because industries,
which are exclusively restricted to only one type of firm, are found in these types of
firms. Hence, this robustness test is applicable to family firms and non-family firms.
Those industries, which are exclusively restricted to only one type of firm, are shown in
Table 5.18:
Table 5.18: Exclusive Industries In Family Firms And Non-Family Firms
Exclusive Industries
Family Firms Non-Family Firms
Gambling, Jewellery, Gaming, Funeral,
Publishing, Travel, Beauty,
Military, Logistics Engineering
Postal Service, Tobacco
The actual robustness test results are shown in the robustness test results in Chapter 6 of
this research.

207
5.9 CONCLUSION
This chapter discussed the various issues related to research methodology such as
research models, variables measurements, sampling design, data analysis methods used,
relevant statistical issues and assumptions, endogeneity issues, model selection criteria
and robustness testing. The next chapter will discuss the research results, descriptive
statistics, hypotheses testing as well as robustness research results.

208
CHAPTER SIX
RESEARCH RESULTS
6.1 INTRODUCTION
This chapter mainly discusses the research results, the hypotheses tested, the descriptive
statistics and endogeneity issues that surfaced in this research. The remainder of this
chapter discusses the assumptions of statistical analysis. The rest of the chapter is
organised as follows. Section 6.2 discusses the R-Squared values and Adjusted R-
Squared values. Section 6.3 discusses the descriptive statistics. Section 6.4 discusses the
research findings. Section 6.5 discusses the robustness test results. Section 6.6 discusses
the hypotheses tested. Section 6.7 summarise the hypotheses. Section 6.8 concludes.
6.2 THE R-SQUARED (R2) AND THE ADJUSTED R-SQUARED (R
2)
VALUES
The R-Squared (R2) statistic measures the success of the regression in predicting the
values of the dependent variable within the sample or can be interpreted as how much of
the variance in the dependent variable is explained by the independent variables. While
the adjusted R2 implies that as the number of independent variables is added to the
model and increases less than R2. Both are goodness of fit measures and as the value of
R2 and the adjusted R
2 are closer to 1, the better is the fit. According to Theil (1978), it
is good to use adjusted R2 rather than R
2 when the numbers of explanatory variables
used in the model are high, as the R2 tends to provide too optimistic a value of the fit of
the regression. Besides, R2 and adjusted R
2 are both reported in most statistical
packages and are used to measure the strength of association between dependent and
independent variables (Malhotra, 2004; Gujarati and Porter, 2009).

209
6.3 DESCRIPTIVE STATISTICS
Table 6.1 and Table 6.2 present the descriptive statistics for the samples used in this
research
Table 6.1 : Descriptive Statistics For Family Firms
Descriptive Statistics For Full Sample
Family Firms
Mean Median Standard
Deviation
Maximum Minimu
m
Tobin’s Q 0.8780 0.7801 0.5226 7.0322 0.0631
ROE 0.0396 0.0688 0.3043 3.0037 -5.3488
ROA 0.0323 0.0386 0.0810 0.4117 -0.6432
Market-to-Book
Value (MBV)
0.8027 0.5849 1.0694 16.2962 -0.3955
Related Party
Transactions Which
Are Likely To Result
In Expropriation
Ratio (RPT)
0.3285 0.1843 0.3528 0.9997 0.0000
Ownership
Concentration
42.1420 41.1800 13.3102 99.1600 20.1800
Predicted Ownership
Concentration
42.0626 42.5332 1.5741 44.0562 34.4134
Average Independent
Directors’ Tenure
6.0354 5.3330 3.8628 31.0000 0.0000
Banks 2.8179 2.0000 1.7385 10.0000 0.0000
Ln(Firm Risk) -2.2835 -2.3327 0.9758 1.2590 -5.3454
Leverage 0.1323 0.0885 0.1831 2.7988 0.0000
Firm Size 19.6350 19.4900 1.2024 24.4960 16.9470
Independent
Directors Ratio
0.4240 0.4000 0.1135 0.8330 0.1820
Non-affiliated
Blockholders
27.2503 14.7600 38.9662 339.2600 0.0000
Ln(Age) 2.9626 3.0910 0.7287 4.6347 0.0000
Sales Growth 14.4226 6.4538 93.2761 2254.7070 -96.8719
R&D Expenditure-
to-Sales
0.1445 0.0000 1.8187 35.6826 0.0000
Capital Expenditure-
to-Sales
9.2843 3.6383 27.2080 561.4003 -37.0511
Marketing and
Advertising
Expenditure-to-Sales
2.3014 0.4010 4.0991 62.0660 0.0000
Gross Domestic
Product
3.2172 4.8075 3.5006 6.4802 1.6360

210
Table 6.2 : Descriptive Statistics For Non-Family Firms
Descriptive Statistics For Full Sample
Non-Family Firms
Mean Median Standard
Deviation
Maximum Minimum
Tobin’s Q 1.0936 0.8798 0.8292 6.3110 0.2731
ROE 0.0493 0.0780 0.6527 1.7116 -5.9661
ROA 0.0520 0.0452 0.3644 3.2424 -1.0180
Market-to-Book
Value (MBV) 1.2166 0.7362 1.7598 12.1718 -0.6780
Related Party
Transactions
Which Are Likely
To Result In
Expropriation
Ratio (RPT) 0.1645 0.0025 0.2997 0.9809 0.0000
Ownership
Concentration 42.2277 42.4463 0.0000 81.2725 16.3125
Predicted
Ownership
Concentration 43.3272 43.9792 16.5626 49.5352 26.4726
Average
Independent
Directors’ Tenure 5.5280 4.7918 4.4702 17.2500 0.1250
Banks 2.4346 2.2500 3.6974 7.2500 0.2500
Ln(Firm Risk) -1.8357 -1.8219 1.4465 0.8043 -4.0945
Leverage 0.1234 0.0848 1.0434 0.5345 0.0000
Firm Size 20.0469 19.9523 0.1277 22.7610 17.0480
Independent
Directors Ratio 0.4381 0.4155 1.2325 0.7708 0.1955
Non-affiliated
Blockholders 53.8517 28.4050 0.1202 338.8500 0.0000
Ln(Age) 2.8587 2.9673 71.7713 4.1134 0.7945
Sales Growth 6.5578 2.6558 0.7562 223.2143 -73.7574
R&D
Expenditure-to-
Sales 0.0523 0.0000 39.7378 2.0030 0.0000
Capital
Expenditure-to-
Sales 6.5516 3.2377 0.2321 115.9097 0.0000
Marketing and
Advertising
Expenditure-to-
Sales 2.9750 0.4210 17.0700 28.9407 0.0000
Gross Domestic
Product 3.2172 4.8075 3.5006 6.4802 1.6360

211
Table 6.3 presents the T-Test results for the test of differences between the variable
values in family firms and non-family firms.
Table 6.3: T-Test Results (2-Tail) To Compare The Variable Values Of Family
Firms And Non-Family Firms
Variable Probability Of T-Test
Tobin‘s Q 2.01068 x 10⁻⁷
***
ROE 0.718450152
ROA 0.154667
Market-to-Book Value
(MBV)
0.000111***
Related Party
Transactions Which Are
Likely To Result In
Expropriation Ratio
(RPT)
1.86 x 10⁻²⁴
***
Ownership
Concentration
4.12 x 10⁻⁶
***
Predicted Ownership
Concentration
4.22 x 10-43
***
Average Independent
Directors‘ Tenure
0.986281
Banks 1.19 x 10⁻⁶
***
Ln(Firm Risk) 6.31 x 10⁻²¹
***
Leverage 0.439746
Firm Size 1.7 x 10⁻¹¹
***
Independent Directors
Ratio
0.499935
Non-affiliated
Blockholders
1.54 x 10⁻¹¹
***
Ln(Age) 0.797917
Sales Growth 0.033909**
R&D Expenditure-to-
Sales
0.268763
Capital Expenditure-to-
Sales
0.158244
Marketing and
Advertising
Expenditure-to-Sales
0.002594***
*10% significance level ** 5% significance level ***1% significance level
212
From the descriptive statistics and the t-test results as shown, it can be concluded that
there is no significant difference in terms of leverage for family firms compared to non-
family firms as the probability of the t-test results (0.439746) is insignificant at 1%, 5%
and 10% level respectively. The result shows that family firms do not appear to have
different level of leverage compared to non-family firms. This is consistent with the
findings by Sraer and Thesmar (2007), Barontini and Caprio (2006), Anderson and
Reeb (2003), Mishra et.al. (2001), Mishra and McConaughy (1999) and Gorriz and
Fumas (1996) but inconsistent with the findings by Croci et.al. (2011) who found that
family-controlled firms raise more debt capital compared to non-family firms. One of
the reasons for this insignificance is possibly due to the effect of the credit crunch
during the global financial crisis which affect both family and non-family firms in
emerging markets such as Malaysia (Tong and Wei, 2011). This credit crunch reduce
the number of loans that firms can take from banks and as a result, both family and non-
family firms have limited debts (leverage). Hence, there is no significant difference in
terms of the level of leverage between family firms and non-family firms.
In addition to that, it can also be concluded that there is no significant difference
between the age of family firms compared to non-family firms because the probability
of the t-test results (0.797917) is insignificant at 1%, 5% and 10% level respectively.
This is consistent with the findings by Ibrahim (2009) who found no significant
difference in age between family and non-family firms in Malaysia. This result also
suggests that Malaysian firms are well established since the Kuala Lumpur Stock
Exchange (KLSE) operated on its own after separating from the Stock Exchange of
Malaysia and Singapore (SEMS) in 1973 (Ibrahim, 2009).
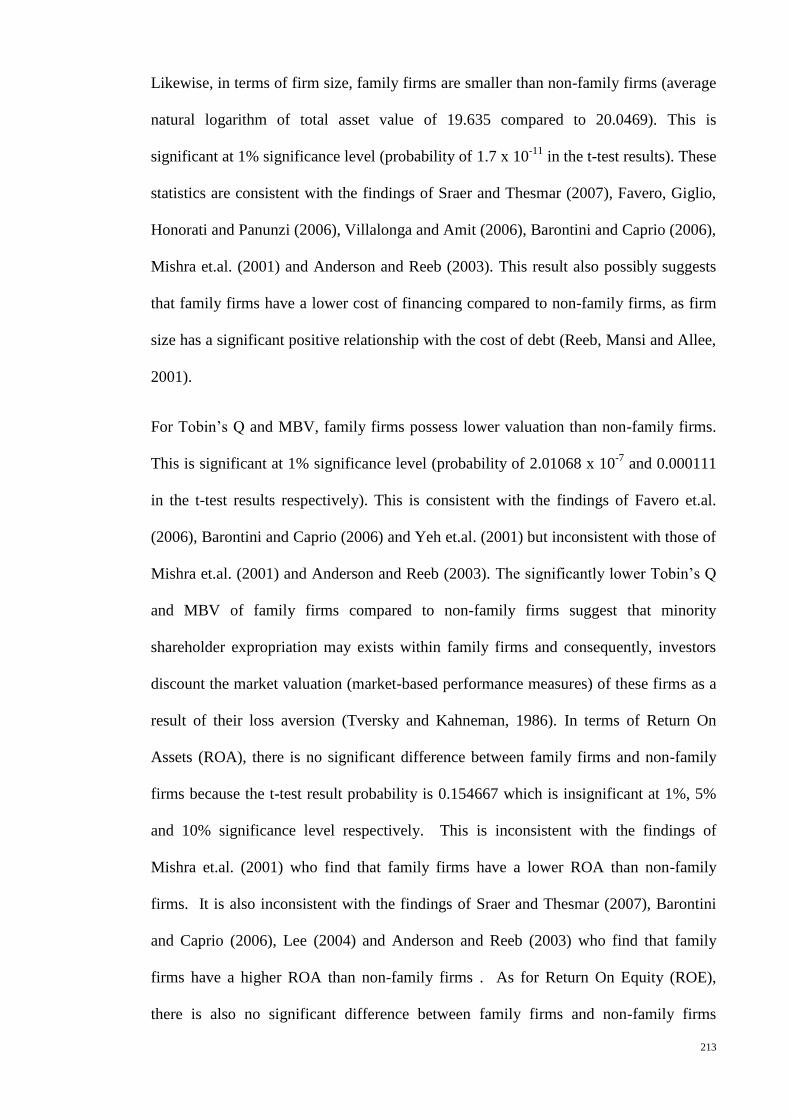
213
Likewise, in terms of firm size, family firms are smaller than non-family firms (average
natural logarithm of total asset value of 19.635 compared to 20.0469). This is
significant at 1% significance level (probability of 1.7 x 10⁻¹¹
in the t-test results). These
statistics are consistent with the findings of Sraer and Thesmar (2007), Favero, Giglio,
Honorati and Panunzi (2006), Villalonga and Amit (2006), Barontini and Caprio (2006),
Mishra et.al. (2001) and Anderson and Reeb (2003). This result also possibly suggests
that family firms have a lower cost of financing compared to non-family firms, as firm
size has a significant positive relationship with the cost of debt (Reeb, Mansi and Allee,
2001).
For Tobin‘s Q and MBV, family firms possess lower valuation than non-family firms.
This is significant at 1% significance level (probability of 2.01068 x 10⁻⁷
and 0.000111
in the t-test results respectively). This is consistent with the findings of Favero et.al.
(2006), Barontini and Caprio (2006) and Yeh et.al. (2001) but inconsistent with those of
Mishra et.al. (2001) and Anderson and Reeb (2003). The significantly lower Tobin‘s Q
and MBV of family firms compared to non-family firms suggest that minority
shareholder expropriation may exists within family firms and consequently, investors
discount the market valuation (market-based performance measures) of these firms as a
result of their loss aversion (Tversky and Kahneman, 1986). In terms of Return On
Assets (ROA), there is no significant difference between family firms and non-family
firms because the t-test result probability is 0.154667 which is insignificant at 1%, 5%
and 10% significance level respectively. This is inconsistent with the findings of
Mishra et.al. (2001) who find that family firms have a lower ROA than non-family
firms. It is also inconsistent with the findings of Sraer and Thesmar (2007), Barontini
and Caprio (2006), Lee (2004) and Anderson and Reeb (2003) who find that family
firms have a higher ROA than non-family firms . As for Return On Equity (ROE),
there is also no significant difference between family firms and non-family firms

214
because the probability of t-test results is 0.718450152 which is insignificant at 1%, 5%
and 10% significance level respectively. This is inconsistent with the findings of Sraer
and Thesmar (2007), Anderson and Reeb (2003) and Gorriz and Fumas (1996) who find
that family firms have a higher ROE than non-family firms. The insignificant difference
for ROE and ROA between family and non-family firms suggest that accounting-based
performance measures may be subject to manipulation by family firms (Prencipe and
Bar-Yosef, 2011) rendering them to be insignificantly different from non-family firms.
In terms of the proportion of independent directors in the firm, there is no significant
difference between family firms and non-family firms because the probability of the t-
test result is 0.499935 which is insignificant at 1%, 5% and 10% significance level
respectively. This result possibly suggests a high interlocking directorship (cross-
directorship) between independent directors in family firms and non-family firms which
reduces the independent director‘s commitment towards a particular firm, hence,
providing an opportunity for controlling shareholders to exert more influence on these
directors in order to expropriate minority shareholders. This result also is inconsistent
with the findings by Ibrahim (2009), Villalonga and Amit (2006), Anderson and Reeb
(2003) and Mishra et.al. (2001) who find that family firms have lower proportion of
independent directors in their firms compared to non-family firms. Furthermore, on
average, the percentage of independent directors in all samples is 43.1%, which means
at least one third (1/3) of directors are non-executive (independent directors). This is in
compliance with the Listing Requirements of Bursa Malaysia (Ibrahim, 2009).
In terms of the average tenure of independent directors, there is no significant difference
between family firms and non-family firms because the t-test result probability is
0.986281 which is insignificant at 1%, 5% and 10% significance level respectively.
This is inconsistent with the findings of Dieleman (2012) and Schulze et.al. (2003) who
find that family firms have longer tenure of independent directors compared to non-
215
family firms. This result also possibly suggests a high interlocking directorship (cross-
directorship) between independent directors in family firms and non-family firms as
explained previously, which result in the insignificant difference.
In terms of RPTs which are likely to result in expropriation, family firms possess higher
amount than non-family firms. The result is also significant at 1% significance level
because the probability of t-test result is 1.86 x 10⁻²⁴
. This is consistent with the finding
of Munir and Gul (2011) which possibly suggests that minority shareholder
expropriation through RPTs may be more prevalent in family firms compared to non-
family firms. Lastly, in terms of the number of domestic banks that the firm engages,
family firms engage with higher number of domestic banks than non-family firms. This
is significant at 1% significance level because the probability of t-test result is 1.19 x
10-6
which also possibly suggests that that minority shareholder expropriation through
the domestic banking channel may be more prevalent in family firms compared to non-
family firms.
6.4 RESEARCH FINDINGS
The following are the actual research results:

216
Table 6.4: Actual Regression Results (Main Results) : Normal OLS Regression Pooled Model (Family Firms)
Expected
Signs
Independent Variables And
Intercept
Dependent Variable Expected
Signs
Independent Variables And
Intercept
Dependent Variable
Tobin’s Q MBV ROE ROA
Coeff. t-stats Coeff. t-stats Coeff. t-stats Coeff. t-stats
+/- Intercept 2.369519*** 6.420699 1.939126*** 2.807097 +/- Intercept -0.354824 -0.534456 -0.440873** -2.134911
- Related Party Transactions
That Are Likely to result in
Expropriation Ratio (RPT) -0.198689* -1.652542 -0.422146** -1.974463
- Related Party Transactions
That Are Likely to result in
Expropriation Ratio (RPT) 0.516853 0.812091 0.118215 0.610946
+ Ownership Concentration
(OC) -0.000453 -0.140789 -0.005677 -0.926907
+ Predicted Ownership
Concentration (OCF) 0.002286 0.137010 0.009287* 1.791445
- Average Independent
Directors Tenure (Tenure) 0.001169 0.080772 -0.047610* -1.757832
- Average Independent Directors
Tenure (Tenure) -0.032256 -0.444672 0.016488 0.753992
- No. of Local Banks Engaged
by the Firm (Banks) 0.014093 0.445018 0.008565 0.142616
- No. of Local Banks Engaged by
the Firm (Banks) -0.224939 -1.286172 -0.013591 -0.259033
+ Ln (Firm Risk) 0.134404*** 9.254627 0.157321*** 6.236005 + Ln (Firm Risk) 0.026814*** 2.680369 0.008637*** 2.929133
+/- Leverage (LEV) 0.894811*** 13.62808 0.046825 0.397282 +/- Leverage (LEV) -0.051418 -1.235410 -0.049596*** -3.805393
+/- Firm Size (SIZE)
-0.064134*** -3.603028 -0.015904 -0.473369 +/- Firm Size (SIZE) 0.020996*** 1.781532 0.006961** 1.995164
+/- Independent Directors Ratio
(IDR) -0.207928 -1.556100 -0.461441* -1.897754
+/- Independent Directors Ratio
(IDR) -0.086217 -1.102435 -0.040820* -1.712406
+ Non-Affiliated Blockholders
(NAB) -0.000891** -2.028292 -0.002965*** -3.540177
+ Non-Affiliated Blockholders
(NAB) 0.0000317 0.134420 0.0000649 0.913116
+ Ln (Age) 0.013963 0.450606 -0.011212 -0.166711 + Ln (Age) -0.016441 -1.218349 -0.006800 -1.504764
+ Sales Growth (SG) 0.000065 0.614829 0.000285 1.462980 + Sales Growth (SG) 0.0000841 1.069717 0.0000312* 1.687339
+ R&D Expenditure-to-Sales
(RDS) 0.004754 0.504556 -0.005314 -0.286459
+ R&D Expenditure-to-Sales
(RDS) 0.000404 0.083260 0.000720 0.479215
+ Capital Expenditure-to-Sales
(CS) 0.000250 0.677411 0.000639 1.026481
+ Capital Expenditure-to-Sales
(CS) -0.000181 -0.538448 -0.000127 -1.570428
+/- Marketing & Advertising
Expenditure-to-Sales (MS) 0.001992 0.666611 0.007173 1.438412
+/- Marketing & Advertising
Expenditure-to-Sales (MS) 0.0000629 0.029205 -0.000718 -1.149163
+/- Gross Domestic Product
(GDP) -0.002867 -1.390598 -0.004971 -1.344521
+/- Gross Domestic Product
(GDP) 0.006022*** 2.973868 0.001254** 2.116662
- OC x RPT 0.005713** 2.131741 0.010767** 2.256633 - OCF x RPT -0.012669 -0.838188 -0.002955 -0.644278
- OC x Tenure -0.000089 -0.295703 0.000998* 1.773421 - OCF x Tenure 0.000972 0.566151 -0.000322 -0.622006
- OC x Banks -0.000238 -0.326688 -0.000406 -0.293887 - OCF x Banks 0.005096 1.236446 0.000242 0.195529
N 379 379 N 379 379
Adjusted R-Squared (%) 19.5837 4.5649 Adjusted R-Squared (%) 5.1093
7.4912
F-Statistic 16.36934*** 4.018787*** F-Statistic 4.398147*** 6.110641*** * 10% sig.level ** 5% sig.level *** 1% sig.level

217
Table 6.5: Actual Regression Results (Main Results) : Normal OLS Regression Fixed Effects Model (Family Firms)
Expected
Signs
Independent Variables And
Intercept
Dependent Variable Expected
Signs
Independent Variables And
Intercept
Dependent Variable
Tobin’s Q MBV ROE ROA
Coeff. t-stats Coeff. t-stats Coeff. t-stats Coeff. t-stats
+/- Intercept 2.363890*** 6.452472 1.825755*** 2.662796 +/- Intercept -0.339265 -0.511053 -0.435943** -2.110675
- Related Party Transactions
That Are Likely to result in
Expropriation Ratio (RPT) -0.202508* -1.706911 -0.469336** -2.233266
- Related Party Transactions
That Are Likely to result in
Expropriation Ratio (RPT) 0.517745 0.813304 0.118155 0.610435
+ Ownership Concentration
(OC) 0.0000467 0.014630 -0.004747 -0.782595
+ Predicted Ownership
Concentration (OCF) 0.002450 0.146814 0.009256* 1.784819
- Average Independent
Directors Tenure (Tenure) 0.003535 0.245440 -0.042014 -1.561480
- Average Independent Directors
Tenure (Tenure) -0.031439 -0.433256 0.016344 0.747055
- No. of Local Banks Engaged
by the Firm (Banks) 0.015970 0.507405 0.010079 0.169449
- No. of Local Banks Engaged by
the Firm (Banks) -0.224343 -1.282432 -0.013738 -0.261720
+ Ln (Firm Risk) 0.132238*** 9.220905 0.155072*** 6.245850 + Ln (Firm Risk) 0.026645*** 2.662668 0.008664*** 2.936636
+/- Leverage (LEV) 0.893023*** 13.80540 0.026543 0.229637 +/- Leverage (LEV) -0.050822 -1.220747 -0.049744*** -3.814554
+/- Firm Size (SIZE) -0.066326*** -3.739557 -0.013646 -0.407697 +/- Firm Size (SIZE) 0.020984* 1.779914 0.006967** 1.996397
+/- Independent Directors Ratio
(IDR) -0.162274 -1.223142 -0.363763 -1.510678
+/- Independent Directors Ratio
(IDR) -0.088793 -1.134489 -0.040227* -1.684573
+ Non-Affiliated Blockholders
(NAB) -0.000815* -1.870934 -0.002815*** -3.401178
+ Non-Affiliated Blockholders
(NAB) 0.0000266 0.112971 0.0000659 0.926996
+ Ln (Age) 0.020166 0.650679 0.009941 0.147741 + Ln (Age) -0.016714 -1.237921 -0.006724 -1.486372
+ Sales Growth (SG) 0.0000713 0.695329 0.000267 1.423681 + Sales Growth (SG) 0.0000825 1.049515 0.0000314* 1.694844
+ R&D Expenditure-to-Sales
(RDS) 0.003967 0.425690 -0.007444 -0.407159
+ R&D Expenditure-to-Sales
(RDS) 0.000454 0.093600 0.000712 0.473521
+ Capital Expenditure-to-Sales
(CS) 0.000254 0.695779 0.000570 0.929265
+ Capital Expenditure-to-Sales
(CS) -0.000183 -0.543920 -0.000127 -1.565549
+/- Marketing & Advertising
Expenditure-to-Sales (MS) 0.001910 0.643804 0.007172 1.450970
+/- Marketing & Advertising
Expenditure-to-Sales (MS) 0.0000695 0.032241 -0.000720 -1.150586
- OC x RPT 0.005776** 2.182495 0.011632** 2.477556 - OCF x RPT -0.012689 -0.839287 -0.002954 -0.643758
- OC x Tenure -0.000110 -0.367365 0.000929* 1.662464 - OCF x Tenure 0.000952 0.554020 -0.000318 -0.614641
- OC x Banks -0.000291 -0.402107 -0.000493 -0.360764 - OCF x Banks 0.005083 1.232901 0.000245 0.198074
N 379 379 N 379 379
Adjusted R-Squared (%)
22.0588
8.8653
Adjusted R-Squared (%)
5.1188
7.4272
F-Statistic 17.92157*** 6.816098*** F-Statistic 4.225585*** 5.796987*** * 10% sig.level ** 5% sig.level *** 1% sig.level

218
Table 6.6: Actual Regression Results (Main Results) : Normal OLS Regression Pooled Model (Non-Family Firms)
Expected
Signs
Independent Variables And
Intercept
Dependent Variable Expected
Signs
Independent Variables And
Intercept
Dependent Variable
Tobin’s Q MBV ROE ROA
Coeff. t-stats Coeff. t-stats Coeff. t-stats Coeff. t-stats
+/- Intercept 3.100880** 2.384321 +/- Intercept -0.201739 -0.074113 0.144871 0.323179 -0.104591 -0.548989
- Related Party Transactions
That Are Likely to result in
Expropriation Ratio (RPT) 2.231071 1.640629
- Related Party Transactions
That Are Likely to result in
Expropriation Ratio (RPT) 0.354976 0.547638 -0.162824 -0.768752 -0.057495 -0.612679
+ Predicted Ownership
Concentration (OCF) -0.028700 -1.026797
+ Ownership Concentration (OC)
0.015463 1.584547 0.001665 0.490670 0.002345 1.611708
- Average Independent
Directors Tenure (Tenure) -0.349182*** -2.771052
- Average Independent Directors
Tenure (Tenure) 0.079759 1.163419 0.011197 0.598668 0.025091*** 3.132329
- No. of Local Banks Engaged
by the Firm (Banks) 0.555555 1.502203
- No. of Local Banks Engaged by
the Firm (Banks) -0.112630 -0.712071 -0.014214 -0.307514 -0.026752 -1.377378
+ Ln (Firm Risk) 0.218367*** 4.703061 + Ln (Firm Risk) 0.228468*** 3.735366 0.046824* 1.807577 0.021009** 2.015505
+/- Leverage (LEV) 0.298807 0.835810 +/- Leverage (LEV) 1.609717*** 3.140328 0.118710 0.680196 -0.019688 -0.274449
+/- Independent Directors Ratio
(IDR) -0.724917** -2.274113 +/- Firm Size (SIZE) 0.056663 0.435070 0.002390 0.130928 0.005760 0.719887
+ Non-Affiliated Blockholders
(NAB) -0.000834 -1.497465
+/- Independent Directors Ratio
(IDR) -0.426762 -0.853299 -0.142149 -0.772503 -0.073997 -0.997818
+ Ln (Age)
0.053165 0.581570
+ Non-Affiliated Blockholders
(NAB) -0.001367 -1.261277 -0.000273 -1.104287 -0.0000114 -0.103425
+ Sales Growth (SG) -0.000560 -0.985805 + Ln (Age) 0.200528 0.711398 -0.000346 -0.010505 -0.008092 -0.577816
+ R&D Expenditure-to-Sales
(RDS) -0.048826 -0.657835
+ Sales Growth (SG)
-0.001083 -1.564894 0.000390 0.770269 0.000540*** 3.417532
+ Capital Expenditure-to-Sales
(CS) -0.000207 -0.081608
+ R&D Expenditure-to-Sales
(RDS) -0.019730 -0.190083 -0.017320 -0.396816 0.016034 1.089810
+/- Marketing & Advertising
Expenditure-to-Sales (MS) 0.006046 0.743380
+ Capital Expenditure-to-Sales
(CS) -0.001028 -0.411025 -0.001966 -1.323947 -0.000390 -0.649562
+/- Gross Domestic Product
(GDP) -0.005029 -0.569562
+/- Marketing & Advertising
Expenditure-to-Sales (MS) -0.010273 -0.540498 0.003275 1.078946 0.000761 0.591598
- OCF x RPT
-0.052470* -1.695910
+/- Gross Domestic Product
(GDP) 0.002017 0.207367 -0.017593** -2.314069 0.000744 0.312012
- OCF x Tenure 0.007589*** 2.859474 - OC x RPT -0.016655 -0.916391 0.002272 0.481165 0.001186 0.573095
- OCF x Banks -0.013014 -1.637064 - OC x Tenure -0.001139 -0.868013 -0.000106 -0.292708 -0.000413*** -2.762952
N 151 - OC x Banks -0.002408 -0.775637 -0.000032 -0.031493 0.000355 0.828131
Adjusted R-Squared (%) 7.999 N 151 151 151
F-Statistic 3.311714*** Adjusted R-Squared (%) 4.4544 0.8235 5.8652
F-Statistic 2.170701*** 1.208500 2.564587*** * 10% sig.level ** 5% sig.level *** 1% sig.level

219
Table 6.7: Actual Regression Results (Main Results) : Normal OLS Regression Fixed Effects Model (Non-Family Firms)
Expected
Signs
Independent Variables And
Intercept
Dependent Variable Expected
Signs
Independent Variables And
Intercept
Dependent Variable
Tobin’s Q MBV ROE ROA
Coeff. t-stats Coeff. t-stats Coeff. t-stats Coeff. t-stats
+/- Intercept 2.558357** 2.011223 +/- Intercept -0.817141 -0.302043 0.089645 0.200751 -0.082442 -0.442867
- Related Party Transactions
That Are Likely to result in
Expropriation Ratio (RPT) 1.804638 1.365384
- Related Party Transactions
That Are Likely to result in
Expropriation Ratio (RPT) 0.154293 0.244269 -0.163082 -0.769007 -0.062057 -0.671888
+ Predicted Ownership
Concentration (OCF) -0.018641 -0.679537
+ Ownership Concentration (OC)
0.018167* 1.912439 0.001670 0.491496 0.002320 1.621396
- Average Independent
Directors Tenure (Tenure) -0.311805** -2.542704
- Average Independent Directors
Tenure (Tenure) 0.078337 1.173956 0.011225 0.599458 0.025464*** 3.232908
- No. of Local Banks Engaged
by the Firm (Banks) 0.650393* 1.785028
- No. of Local Banks Engaged by
the Firm (Banks) -0.054152 -0.346681 -0.014175 -0.306276 -0.026903 -1.409616
+ Ln (Firm Risk) 0.215914*** 4.875897 + Ln (Firm Risk) 0.230107*** 3.900836 0.046839* 1.805948 0.020440** 1.996914
+/- Leverage (LEV) 0.303445 0.874229 +/- Leverage (LEV) 1.583190*** 3.168225 0.118519 0.678284 -0.027891 -0.395502
+/- Independent Directors Ratio
(IDR) -0.736087** -2.432912 +/- Firm Size (SIZE) 0.064804 0.500500 0.002401 0.131348 0.006413 0.815086
+ Non-Affiliated Blockholders
(NAB) -0.000746 -1.402200
+/- Independent Directors Ratio
(IDR) -0.413631 -0.859522 -0.142124 -0.771451 -0.069525 -0.954197
+ Ln (Age)
0.078256 0.854881
+ Non-Affiliated Blockholders
(NAB) -0.001182 -1.128797 -0.000273 -1.102325 -0.0000122 -0.113004
+ Sales Growth (SG) -0.000573 -1.080574 + Ln (Age) 0.300760 1.054437 -0.000329 -0.009974 -0.008749 -0.636227
+ R&D Expenditure-to-Sales
(RDS) -0.029484 -0.426048
+ Sales Growth (SG)
-0.001060 -1.594937 0.000391 0.770615 0.000546*** 3.511185
+ Capital Expenditure-to-Sales
(CS) -0.000712 -0.287661
+ R&D Expenditure-to-Sales
(RDS) 0.011535 0.117226 -0.017277 -0.395335 0.017929 1.239416
+/- Marketing & Advertising
Expenditure-to-Sales (MS) 0.004933 0.613759
+ Capital Expenditure-to-Sales
(CS) -0.001441 -0.586739 -0.001966 -1.322263 -0.000390 -0.660245
- OCF x RPT
-0.043654 -1.451417
+/- Marketing & Advertising
Expenditure-to-Sales (MS) -0.013037 -0.696634 0.003274 1.077304 0.000844 0.667756
- OCF x Tenure 0.006758*** 2.618717 - OC x RPT -0.012488 -0.706335 0.002277 0.481597 0.001323 0.649960
- OCF x Banks -0.014855* -1.895960 - OC x Tenure -0.001152 -0.900616 -0.000106 -0.293815 -0.000417*** -2.839332
N 151 - OC x Banks -0.003148 -1.032677 -0.0000328 -0.032216 0.000351 0.835323
Adjusted R-Squared (%) 11.6274 N 151 151 151
F-Statistic 4.303926*** Adjusted R-Squared (%) 7.3821 0.5962 6.8764
F-Statistic 2.896144*** 1.142681 2.756661*** * 10% sig.level ** 5% sig.level *** 1% sig.level

220
Table 6.8: Actual Regression Results (Main Results) : Normal OLS Regression Pooled Model (Family Firms And Non-Family Firms)
Expected
Signs
Independent Variables And
Intercept
Dependent Variable Expected
Signs
Independent Variables And
Intercept
Dependent Variable
Tobin’s Q MBV ROE ROA
Coeff. t-stats Coeff. t-stats Coeff. t-stats Coeff. t-stats
+/- Intercept 3.295714*** 7.213038 1.461046 1.607214 +/- Intercept -0.482789 -0.890130 0.005854 0.034798
- Related Party Transactions
That Are Likely to result in
Expropriation Ratio (RPT) -0.261851* -1.855436 -0.367914* -1.684581
- Related Party Transactions
That Are Likely to result in
Expropriation Ratio (RPT) 0.604999 1.017361 0.169494 0.949196
+ Ownership Concentration
(OC) -0.001794 -0.545947 0.011140** 2.064864
+ Predicted Ownership
Concentration (OCF) 0.022776* 1.670966 0.004387 1.023092
- Average Independent
Directors Tenure (Tenure) -0.023131 -1.360553 0.012795 0.434102
- Average Independent Directors
Tenure (Tenure) 0.068063 1.243006 -0.008904 -0.513908
- No. of Local Banks Engaged
by the Firm (Banks) 0.023375 0.617698 0.044614 0.692366
- No. of Local Banks Engaged by
the Firm (Banks) -0.184690 -1.323012 -0.106861** -2.440500
+ Ln (Firm Risk) 0.145049*** 8.356504 0.162015*** 6.325004 + Ln (Firm Risk) 0.043691*** 3.307818 0.010996*** 2.839276
+/- Leverage (LEV) 0.839324*** 9.934288 0.203629 1.583910 +/- Leverage (LEV) -0.073548 -1.055979 -0.075601*** -3.924135
+/- Firm Size (SIZE) -0.088450*** -4.150570 -0.005301 -0.122298 +/- Firm Size (SIZE) -0.012875 -0.731565 -0.004763 -0.852987
+/- Independent Directors Ratio
(IDR) -0.404434*** -2.663490 -0.371000 -1.506337
+/- Independent Directors Ratio
(IDR) -0.190531** -2.006651 -0.060297** -2.074642
+ Non-Affiliated Blockholders
(NAB) -0.000983*** -2.805956 -0.002143*** -3.225725
+ Non-Affiliated Blockholders
(NAB) -0.000195 -1.001494 0.00000325 0.053782
+ Ln (Age) 0.022056 0.605873 0.010650 0.108787 + Ln (Age) -0.008842 -0.521779 -0.007372 -1.399589
+ Sales Growth (SG) 0.000025 0.205325 0.0000952 0.476462 + Sales Growth (SG) 0.000124 1.001892 0.0000616** 2.078346
+ R&D Expenditure-to-Sales
(RDS) -0.001003 -0.082079 -0.013630 -0.551515
+ R&D Expenditure-to-Sales
(RDS) 0.001304 0.185055 0.002894 1.324262
+ Capital Expenditure-to-Sales
(CS) -0.000096 -0.181017 0.0000983 0.140562
+ Capital Expenditure-to-Sales
(CS) -0.000420 -1.063279 -0.0000445 -0.360930
+/- Marketing & Advertising
Expenditure-to-Sales (MS) 0.001733 0.471200 0.001309 0.233062
+/- Marketing & Advertising
Expenditure-to-Sales (MS) 0.001412 0.669260 0.000198 0.296649
+/- Gross Domestic Product
(GDP) -0.003091 -1.045226 -0.004272 -1.139570
+/- Gross Domestic Product
(GDP) 0.000432 0.145700 0.001231 1.482685
- OC x RPT 0.006608** 2.082602 0.009279* 1.856278 - OCF x RPT -0.015027 -1.096085 -0.004012 -0.974906
- OC x Tenure 0.000455 1.334643 -0.000270 -0.463133 - OCF x Tenure -0.001312 -1.051498 0.000283 0.718649
- OC x Banks -0.000601 -0.704877 -0.002076 -1.450143 - OCF x Banks 0.003874 1.213513 0.002334** 2.332857
Firm Type -0.260253*** -4.310242 -0.501872*** -3.441964 Firm Type 0.012786 0.475872 0.006682 0.784250
N 530 530 N 530 530
Adjusted R-Squared (%)
10.6119
4.2385
Adjusted R-Squared (%)
3.6629
5.546
F-Statistic 10.92846*** 4.701634*** F-Statistic 4.179829*** 5.910572*** * 10% sig.level ** 5% sig.level *** 1% sig.level

221
Table 6.9: Actual Regression Results (Main Results) : Normal OLS Regression Fixed Effects Model (Family Firms And Non-Family Firms)
Expected
Signs
Independent Variables And
Intercept
Dependent Variable Expected
Signs
Independent Variables And
Intercept
Dependent Variable
Tobin’s Q MBV ROE ROA
Coeff. t-stats Coeff. t-stats Coeff. t-stats Coeff. t-stats
+/- Intercept 3.174151*** 7.048353 1.069257 1.188690 +/- Intercept -0.483561 -0.892161 0.010605 0.063234
- Related Party Transactions
That Are Likely to result in
Expropriation Ratio (RPT) -0.278596** -2.026126 -0.441037** -2.072551
- Related Party Transactions
That Are Likely to result in
Expropriation Ratio (RPT) 0.605793 1.018370 0.168905 0.947398
+ Ownership Concentration
(OC) -0.000493 -0.152875 0.012718** 2.407940
+ Predicted Ownership
Concentration (OCF) 0.022757* 1.669044 0.004553 1.063683
- Average Independent
Directors Tenure (Tenure) -0.019223 -1.148165 0.018644 0.644037
- Average Independent Directors
Tenure (Tenure) 0.067876 1.239168 -0.008353 -0.482999
- No. of Local Banks Engaged
by the Firm (Banks) 0.032371 0.868057 0.055311 0.874687
- No. of Local Banks Engaged by
the Firm (Banks) -0.184726 -1.322852 -0.106268 -2.431422
+ Ln (Firm Risk) 0.142268*** 8.418025 0.161657*** 6.485205 + Ln (Firm Risk) 0.043621*** 3.301168 0.010891 2.816400
+/- Leverage (LEV) 0.829360*** 10.08514 0.175334 1.402214 +/- Leverage (LEV) -0.073392 -1.053379 -0.076633 -3.984099
+/- Firm Size (SIZE) -0.088060*** -4.173744 0.000988 0.022996 +/- Firm Size (SIZE) -0.012876 -0.731402 -0.004736 -0.849781
+/- Independent Directors Ratio
(IDR) -0.359560** -2.421700 -0.274727 -1.142689
+/- Independent Directors Ratio
(IDR) -0.191057** -2.011330 -0.059054 -2.035246
+ Non-Affiliated Blockholders
(NAB) -0.000890*** -2.601723 -0.001945*** -3.005134
+ Non-Affiliated Blockholders
(NAB) -0.000195 -1.003751 0.00000342 0.056680
+ Ln (Age) 0.038367 1.054850 0.087447 0.889467 + Ln (Age) -0.008918 -0.526066 -0.007433 -1.413891
+ Sales Growth (SG) 0.0000313 0.268315 0.0000954 0.497634 + Sales Growth (SG) 0.000124 0.997682 0.0000616 2.080169
+ R&D Expenditure-to-Sales
(RDS) -0.00183 -0.153172 -0.015428 -0.642644
+ R&D Expenditure-to-Sales
(RDS) 0.001310 0.185825 0.002932 1.344516
+ Capital Expenditure-to-Sales
(CS) -0.0000867 -0.167655 0.0000288 0.042256
+ Capital Expenditure-to-Sales
(CS) -0.000420 -1.063282 -0.0000428 -0.347458
+/- Marketing & Advertising
Expenditure-to-Sales (MS) 0.001194 0.329456 0.000851 0.154206
+/- Marketing & Advertising
Expenditure-to-Sales (MS) 0.001415 0.670529 0.000207 0.310870
- OC x RPT 0.006824** 2.203240 0.010718** 2.198332 - OCF x RPT -0.015044 -1.096964 -0.003990 -0.971104
- OC x Tenure 0.000392 1.166304 -0.000348 -0.607104 - OCF x Tenure -0.001308 -1.047769 0.000271 0.689248
- OC x Banks -0.000787 -0.938313 -0.002332* -1.662405 - OCF x Banks 0.003875 1.213373 0.002319 2.322876
Firm Type -0.254476*** -4.230453 -0.492465*** -3.379930 Firm Type 0.012745 0.474181 0.006716 0.789746
N 530 530 N 530 530
Adjusted R-Squared (%)
13.9344
8.6674
Adjusted R-Squared (%)
3.6086
5.6987
F-Statistic 13.86331*** 8.539710*** F-Statistic
3.974338***
5.801235***
* 10% sig.level ** 5% sig.level *** 1% sig.level

222
The following are the summary of the research results for key variables analysed in this
research:
Table 6.10: Summary of Research Results (Key Variables)(Coefficients)(Family
Firms)
Main Variables
Tested
Firm Value
Tobin’s Q Market-to-Book
Value (MBV)
Return On
Equity (ROE)
Return On
Asset (ROA)
Related Party
Transactions
That Are Likely
to result in
Expropriation
Ratio (RPT)
-0.198689*
-0.202508*
-0.422146**
-0.469336**
0.516853
0.517745
0.118215
0.118155
Average
Independent
directors’ tenure
(Tenure)
0.001169
0.003535
-0.04761*
-0.042014
-0.032256
-0.031439
0.016488
0.016344
No. of Domestic
banks Engaged
by the Firm
(Banks)
0.014093
0.01597
0.008565
0.010079
-0.224939
-0.224343
-0.013591
-0.013738
Interaction
Between
Ownership
Concentration
And RPT
0.005713**
0.005776**
0.010767**
0.011632**
-0.012669
-0.012689
-0.002955
-0.002954
Interaction
Between
Ownership
Concentration
And Tenure
-0.000089
-0.00011
0.000998*
0.000929*
0.000972
0.000952
-0.000322
-0.000318
Interaction
Between
Ownership
Concentration
And Banks
-0.000238
-0.000291
-0.000406
-0.000493
0.005096
0.005083
0.000242
0.000245
*10% significance level **5% significance level ***1% significance level
Italic figures represent coefficients of Fixed Effects Model.

223
Table 6.11: Summary of Research Results (Key Variables)(Non-Family Firms)
Main Variables
Tested
Firm Value
Tobin’s Q Market-to-Book
Value (MBV)
Return On
Equity (ROE)
Return On
Asset (ROA)
Related Party
Transactions
That Are Likely
to result in
Expropriation
Ratio (RPT)
2.231071
1.804638
0.354976
0.154293
-0.162824
-0.163082
-0.057495
-0.062057
Average
Independent
directors’ tenure
(Tenure)
-0.349182***
-0.311805***
0.079759
0.078337
0.011197
0.011225
0.025091***
0.025464***
No. of Domestic
banks Engaged
by the Firm
(Banks)
0.555555
0.650393*
-0.11263
-0.054152
-0.014214
-0.014175
-0.026752
-0.026903
Interaction
Between
Ownership
Concentration
And RPT
-0.05247*
-0.043654
-0.016655
-0.012488
0.002272
0.002277
0.001186
0.001323
Interaction
Between
Ownership
Concentration
And Tenure
0.007589***
0.006758***
-0.001139
-0.001152
-0.000106
-0.000106
-0.000413***
-0.000417***
Interaction
Between
Ownership
Concentration
And Banks
-0.013014
-0.014855*
-0.002408
-0.003148
-0.000032
0.0000328
0.000355
0.000351
*10% significance level **5% significance level ***1% significance level
Italic figures represent coefficients of Fixed Effects Model.

224
Table 6.12: Summary of Research Results (Key Variables)(Family Firms And
Non-Family Firms)
Main Variables
Tested
Firm Value
Tobin’s Q Market-to-Book
Value (MBV)
Return On
Equity (ROE)
Return On
Asset (ROA)
Related Party
Transactions
That Are Likely
to result in
Expropriation
Ratio (RPT)
-0.261851*
-0.278596**
-0.367914*
-0.441037**
0.604999
0.605793
0.169494
0.168905
Average
Independent
directors’ tenure
(Tenure)
-0.023131
-0.019223
0.012795
0.018644
0.068063
0.067876
-0.008904
-0.008353
No. of Domestic
banks Engaged
by the Firm
(Banks)
0.23375
0.032371
0.044614
0.055311
-0.18469
-0.184726
-0.106861**
-0.106268
Interaction
Between
Ownership
Concentration
And RPT
0.006608**
0.006824**
0.009279*
0.010718**
-0.015027
-0.015044
-0.004012
-0.00399
Interaction
Between
Ownership
Concentration
And Tenure
0.000455
0.000392
-0.00027
-0.000348
-0.001312
-0.001308
0.000283
0.000271
Interaction
Between
Ownership
Concentration
And Banks
-0.000601
-0.000787
-0.002076
-0.002332*
0.003874
0.003875
0.002334**
0.002319
Firm Type
-0.260253***
-0.254476***
-0.501872***
-0.492465***
0.012786
0.012745
0.006682
0.006716
*10% significance level **5% significance level ***1% significance level
Italic figures represent coefficients of Fixed Effects Model.

225
For family firms analysed in this research, RPTs which are likely to results in
expropriation reduce firm value and it is statistically significant at 5% and 10%
significance level. However, this reduction only affect market-based measures of firm
value only i.e. Tobin‘s Q and MBV. In addition, controlling shareholders‘ ownership
has a statistically significant positive moderating effect on this negative relationship at
5% significance level. However, this significant positive moderating effect also only
affect market-based measures of firm value only i.e. Tobin‘s Q and MBV. For non-
family firms, RPTs which are likely to results in expropriation does not have a
significant relationship with firm value for both market-based and accounting-based
performance measures. However, controlling shareholders‘ ownership have a significant
negative moderating effect on the relationship between RPTs which are likely to results
in expropriation and firm value at 10% significance level. However, this significant
negative moderating effect is also restricted to market-based measures of firm value
only i.e. Tobin‘s Q. For the pooled model (family and non-family firms) analysed in this
research, RPTs which are likely to results in expropriation reduce firm value and it is
statistically significant at 1% and 5% significance level. However, this reduction only
affect market-based measures of firm value only i.e. Tobin‘s Q and MBV. In addition,
controlling shareholders‘ ownership has a statistically significant positive moderating
effect on this negative relationship at 1% and 5% significance level respectively.
However, this significant positive moderating effect also only affect market-based
measures of firm value only i.e. Tobin‘s Q and MBV.
In the family firm model, ownership concentration has a positive relationship with firm
value but it is restricted to accounting-based performance measures only (ROA).
However, in non-family firms, ownership concentration has a positive relationship with
firm value but it is restricted to market-based performance measures only (MBV).
Likewise, in the pooled model (family and non-family firms), ownership concentration

226
has a positive relationship with firm value for both market-based and accounting-based
performance measures (i.e. MBV and ROE).
For family firms analysed in this research, average independent directors‘ tenure
reduces firm value and it is statistically significant at 10% significance level. However,
this reduction only affect market-based measures of firm value only i.e MBV.
Controlling shareholders‘ ownership also has a statistically significant positive
moderating effect on this negative relationship at 10% significance level. However, this
significant positive moderating effect only affect market-based measures of firm value
only i.e. MBV. For non-family firms, there is inconclusive evidence on the relationship
between average independent directors‘ tenure and firm value as there is a significant
negative relationship for market-based performance measures (Tobin‘s Q) at a
significance level of 1% and a significant positive relationship for accounting-based
performance measures (ROA) also at a significance level of 1%. There is also
inconclusive evidence on the moderating effect of controlling shareholders‘ ownership
on this relationship. For market-based performance measures (Tobin‘s Q), there is a
significant positive moderating effect which is significant at 5% significance level
whereas for accounting-based performance measures (ROA), there is a significant
negative moderating effect which is significant at 5% significance level. For the pooled
(family and non-family firms) model, there is no statistical significant relationship
between average independent directors‘ tenure and firm value as well as no significant
moderating effect of controlling shareholders‘ ownership on this relationship.
For family firms analysed in this research, the number of domestic banks that the firm
engages with do not have any statistical significant relationship with firm value.
Controlling shareholders‘ ownership also do not have any statistical significant
moderating effect on this relationship. For non-family firms, there is a significant
positive relationship between the number of domestic banks that the firm engages with

227
and firm value at 10% significance level. In addition, controlling shareholders‘
ownership have a significant negative moderating effect on this relationship at 10%
significance level. However, both this significant positive relationship and significant
negative moderating effect are restricted to market-based performance measures only
(i.e. Tobin‘s Q). For the pooled model (family and non-family firms) results, there is a
statistical significant negative relationship between the number of domestic banks that
the firm engages with and firm value and this is statistically significant at 5%
significance level. However, this reduction only affect accounting-based performance
measures of firm value i.e ROA. For the pooled model (family and non-family firms),
there is also inconclusive evidence on the moderating effect of controlling shareholders‘
ownership on the relationship between the number of domestic banks that the firm
engages with and firm value as there is a statistically significant positive moderating
effect on accounting-based performance measures (i.e. ROA and significant at 5%
significance level) and a statistically significant negative moderating effect on market-
based performance measures (i.e. MBV and significant at 10% significance level).
In the pooled model (family and non-family firms) results, family firms has a lower firm
value as compared with non-family firms and this is statistically significant at 1%
significance level. In addition, in the pooled model (family and non-family firms), the
joint hypotheses of H0 : βRPTs of family firms and βRPTs of non- family firms = 0 is rejected and has a
significant negative relationship as derived from the regression results. Both these
results prove that the negative relationship between RPT and firm value is stronger in
family firms compared to non-family firms. However, this only affect market-based
measures i.e. Tobin‘s Q and MBV. Likewise, in the pooled model (family and non-
family firms), the joint hypotheses of H0 : βOC x RPTs of family firms and βOC x RPTs of non- family
firms = 0 is rejected and has a significant positive moderating effect as derived from the
regression results. Both these results prove that the significant positive moderating

228
effect of controlling shareholders‘ ownership on this relationship is stronger in family
firms compared to non-family firms due to the overall lower firm value of family firms
(i.e. market-based measures of Tobin‘s Q and MBV) which renders a stronger corporate
reputational effects in family firms. On the other hand, the rejection of the joint
hypotheses of H0 : βOC x RPTs of family firms and βOC x RPTs of non- family firms = 0 also shows that it
cannot be proven whether the significant negative moderating effect of non-family
firms‘ controlling shareholders‘ ownership on the relationship between RPT which are
likely to result in expropriation and firm value is stronger in non-family compared to
family firms because the sign of the β is positive, not negative.
Although there is a statistical significant negative relationship between average
independent directors‘ tenure and firm value (i.e. MBV) in family firms and overall,
family firms has a lower firm value (i.e. Tobin‘s Q and MBV) as compared with non-
family firms and this is statistically significant at 1% significance level; these results
cannot prove that the negative relationship between average independent directors‘
tenure and firm value is stronger in family firms compared to non-family firms because
the joint hypotheses in the pooled model (family and non-family firms) i.e. H0 : βtenure of
family firms and βtenure of non- family firms = 0 is not rejected as derived from the regression
results. Although, controlling shareholders‘ ownership also has a statistically significant
positive moderating effect on the negative relationship between average independent
directors‘ tenure and firm value (i.e. MBV) in family firms and overall family firms has
a lower firm value (i.e. Tobin‘s Q and MBV) as compared with non-family firms and
this is statistically significant at 1% significance level; these results cannot prove that
the positive moderating effect of controlling shareholders‘ ownership on the
relationship between average independent directors‘ tenure and firm value is stronger in
family firms compared to non-family firms because the joint hypotheses in the pooled
229
model (family and non-family firms) i.e. H0 : βoc x tenure of family firms and β oc x tenure of non-family
firms = 0 is not rejected as derived from the regression results.
Even though there is a statistically significant positive relationship between the number
of domestic banks that the firm engages with and firm value (i.e. market-based
performance measure Tobin‘s Q) in non-family firms; this result cannot prove that this
positive relationship is stronger in non-family firms compared to family firms because
overall family firms family has a lower firm value as compared with non-family firms
for market-based performance measures and this is statistically significant at 1%
significance level.
Despite the fact that non-family firms‘ controlling shareholders‘ ownership has a
statistically significant negative moderating effect on the relationship between the
number of domestic banks that the firm engages with and firm value (i.e. market-based
measure Tobin‘s Q), this result cannot prove that the significant negative moderating
effect of controlling shareholders‘ ownership on the relationship between the number of
domestic banks that the firm engages with and firm value (i.e. Tobin‘s Q) is stronger in
non-family firms compared to family firms because because the joint hypotheses in the
pooled model (family and non-family firms) i.e. H0 : βoc x banks of family firms and β oc x banks of
non-family firms = 0 is not rejected as derived from the regression results for market-based
performance measures (Tobin‘s Q).
For family firms, non-family firms and the pooled model (family and non-family firms),
firm risk is significantly positively related to firm value for both market-based
performance measures and accounting-based performance measures at 1%, 5% and 10%
significance level respectively. For family firms and the pooled model (family and non-
family firms), leverage has a significant positive relationship with market-based
performance measures (Tobin‘s Q) at 1% significance level but a significant negative

230
relationship with accounting-based performance measures (ROE and ROA) at 1%
significance level. However, for non-family firms, leverage has a significant positive
relationship with market-based performance measures (MBV) at 1% significance level.
In addition, for family firms, firm size has a significant negative relationship with
market-based performance measures (Tobin‘s Q) at 1% significance level but a
significant positive relationship with accounting-based performance measures (ROE
and ROA) at 1% and 10% significance level respectively. For non-family firms, there
is no significant relationship between firm size and firm value for both market-based
and accounting-based performance measures. In the pooled model (family and non-
family firms), firm size has a significant negative relationship with firm value for
market-based performance measures only (Tobin‘s Q) at 1% significance level.
Furthermore, for family firms and the pooled model (family and non-family firms),
independent directors‘ ratio has a significant negative relationship with market-based
performance measures (Tobin‘s Q and MBV) at 1%, 5% and 10% significance level
respectively and accounting-based performance measures (ROE and ROA) at 5% and
10% significance level respectively. However, for non-family firms, independent
directors‘ ratio has a significant negative relationship with market-based performance
measures (Tobin‘s Q) at 5% significance level.
On the other hand, for family firms and the pooled model (family and non-family
firms), non-affiliated blockholders have a siginificant negative relationship with firm
value but only on market-based performance measures only (Tobin‘s Q and MBV) at
1%, 5% and 10% significance level respectively. However, for non-family firms, there
is no significant relationship between non-affiliated blockholders and firm value for
both market-based and accounting-based performance measures.

231
In family firms firms, non-family firms and the pooled model (family and non-family
firms), firm age has no significant relationship with firm value for both market-based
performance measures and accounting-based performance measures.
Likewise, for family firms, non-family firms and the pooled model (family and non-
family firms), sales growth has a significant positive relationship with accounting-based
performance measures (ROA) (significant at 1%, 5% and 10% significance level
respectively) but not market-based performance measures.
Moreover, for both family firms, non-family firms and the pooled model (family and
non-family firms), R&D expenditures, capital expenditures and marketing & advertising
expenditures have no significant relationship with firm value for both market-based
performance measures and accounting-based performance measures.
For family firms, GDP has a significant positive relationship with only accounting-
based performance measures (i.e. ROE and ROA) at 1% and 5% significance level
respectively. For non-family firms, GDP has a significant negative relationship with
only accounting-based performance measures (i.e. ROE) at 5% significance level. For
the pooled model (family and non-family firms), GDP has no significant relationship
with firm value for both market-based and accounting-based performance measures.
6.5 ROBUSTNESS TEST RESULTS
The following are the robustness test results :

232
Table 6.13: Actual Regression Results (Main Results) : Normal OLS Regression Pooled Model (Family Firms)(Without Biased Industries)
Expected
Signs
Independent Variables And
Intercept
Dependent Variable Expected
Signs
Independent Variables And
Intercept
Dependent Variable
Tobin’s Q MBV ROE ROA
Coeff. t-stats Coeff. t-stats Coeff. t-stats Coeff. t-stats
+/- Intercept 2.157508*** 7.131756 1.945428*** 4.044555 +/- Intercept -0.692059 -1.123637 -0.389896* -1.842765
- Related Party Transactions
That Are Likely to result in
Expropriation Ratio (RPT) -0.193345* -1.770699 -0.669589*** -3.925931
- Related Party Transactions
That Are Likely to result in
Expropriation Ratio (RPT) 0.534871 0.887381 0.132284 0.651368
+ Ownership Concentration
(OC) 0.0000844 0.031628 0.000524 0.123300
+ Predicted Ownership
Concentration (OCF) 0.012947 0.834122 0.008429 1.584654
- Average Independent
Directors Tenure (Tenure) 0.003896 0.332643 0.008252 0.440201
- Average Independent Directors
Tenure (Tenure) 0.052924 0.771464 0.009961 0.434426
- No. of Local Banks Engaged
by the Firm (Banks) 0.027722 1.077686 0.012700 0.307384
- No. of Local Banks Engaged by
the Firm (Banks) -0.189101 -1.163092 -0.004254 -0.080106
+ Ln (Firm Risk) 0.138962*** 10.43838 0.232661*** 11.56912 + Ln (Firm Risk) 0.035845*** 3.988312 0.010483*** 3.531986
+/- Leverage (LEV) 0.842825*** 13.84242 -0.073565 -0.804679 +/- Leverage (LEV) -0.088834** -2.442564 -0.053129*** -4.164259
+/- Firm Size (SIZE) -0.054980*** -3.855169 -0.024306 -1.070528 +/- Firm Size (SIZE) 0.016391 1.516394 0.006132* 1.755679
+/- Independent Directors Ratio
(IDR) -0.064726 -0.566519 -0.186983 -1.036772
+/- Independent Directors Ratio
(IDR) -0.041207 -0.581747 -0.024683 -1.042252
+ Non-Affiliated Blockholders
(NAB) -0.000639* -1.818537 -0.001226** -2.197124
+ Non-Affiliated Blockholders
(NAB) -0.00000301 -0.014428 0.0000744 1.074276
+ Ln (Age) -0.002944 -0.125444 -0.042680 -1.123877 + Ln (Age) -0.012594 -1.060119 -0.007221* -1.649897
+ Sales Growth (SG) 0.000059 0.624358 0.000153 1.121389 + Sales Growth (SG) 0.0000622 0.940144 0.0000338* 1.854752
+ R&D Expenditure-to-Sales
(RDS) 0.003570 0.484472 0.003279 0.274986
+ R&D Expenditure-to-Sales
(RDS) 0.000161 0.037631 0.000572 0.395150
+ Capital Expenditure-to-Sales
(CS) 0.000159 0.477877 0.000358 0.703165
+ Capital Expenditure-to-Sales
(CS) -0.0000983 -0.324519 -0.0000962 -1.197563
+/- Marketing & Advertising
Expenditure-to-Sales (MS) 0.000974 0.344478 0.006011 1.370002
+/- Marketing & Advertising
Expenditure-to-Sales (MS) -0.001032 -0.488564 -0.001119* -1.698710
+/- Gross Domestic Product
(GDP) -0.003074 -1.483666 -0.008593*** -2.819077
+/- Gross Domestic Product
(GDP) 0.005440*** 2.689366 0.001318** 2.224062
- OC x RPT 0.005240** 2.149765 0.015583*** 4.093351 - OCF x RPT -0.012728 -0.886908 -0.003288 -0.681081
- OC x Tenure -0.000168 -0.686995 -0.000287 -0.729551 - OCF x Tenure -0.001187 -0.728024 -0.000169 -0.309872
- OC x Banks -0.000574 -0.967062 -0.000666 -0.698301 - OCF x Banks 0.004306 1.120558 0.0000281 0.022375
N 366 366 N 366 366
Adjusted R-Squared (%)
22.1874
11.7085
Adjusted R-Squared (%)
4.9594
7.9436
F-Statistic 18.37767*** 9.081955*** F-Statistic 4.180174*** 6.258943*** * 10% sig.level ** 5% sig.level *** 1% sig.level

233
Table 6.14: Actual Regression Results (Main Results) : Normal OLS Regression Fixed Effects Model (Family Firms)(Without Biased
Industries)
Expected
Signs
Independent Variables And
Intercept
Dependent Variable Expected
Signs
Independent Variables And
Intercept
Dependent Variable
Tobin’s Q MBV ROE ROA
Coeff. t-stats Coeff. t-stats Coeff. t-stats Coeff. t-stats
+/- Intercept 2.146964*** 7.169529 1.904325*** 4.070099 +/- Intercept -0.675941 -1.097481 -0.385437* -1.821258
- Related Party Transactions
That Are Likely to result in
Expropriation Ratio (RPT) -0.192718* -1.786637 -0.658401*** -3.991607
- Related Party Transactions
That Are Likely to result in
Expropriation Ratio (RPT) 0.534608 0.886637 0.132378 0.651565
+ Ownership Concentration
(OC) 0.000555 0.209588 0.001575 0.381595
+ Predicted Ownership
Concentration (OCF) 0.013016 0.838208 0.008415 1.581393
- Average Independent
Directors Tenure (Tenure) 0.006089 0.522608 0.013275 0.724894
- Average Independent Directors
Tenure (Tenure) 0.053097 0.773676 0.009928 0.432799
- No. of Local Banks Engaged
by the Firm (Banks) 0.029613 1.158643 0.015354 0.381174
- No. of Local Banks Engaged by
the Firm (Banks) -0.188701 -1.160223 -0.004347 -0.081817
+ Ln (Firm Risk) 0.135068*** 10.27088 0.215362*** 11.08971 + Ln (Firm Risk) 0.035784*** 3.980020 0.010494*** 3.533842
+/- Leverage (LEV) 0.842490*** 14.04888 -0.084899 -0.967997 +/- Leverage (LEV) -0.088358** -2.428384 -0.053248*** -4.170576
+/- Firm Size (SIZE) -0.055784*** -3.934443 -0.025171 -1.134479 +/- Firm Size (SIZE) 0.016345 1.511567 0.006144* 1.758284
+/- Independent Directors Ratio
(IDR) -0.031515 -0.277998 -0.094390 -0.537869
+/- Independent Directors Ratio
(IDR) -0.042900 -0.605154 -0.024314 -1.025153
+ Non-Affiliated Blockholders
(NAB) -0.000596* -1.709918 -0.001089** -2.013119
+ Non-Affiliated Blockholders
(NAB) -0.00000637 -0.030562 0.0000751 1.082985
+ Ln (Age) -0.000577 -0.024681 -0.038393 -1.037009 + Ln (Age) -0.012767 -1.074039 -0.007176 -1.637946
+ Sales Growth (SG) 0.000064 0.698103 0.000144 1.122938 + Sales Growth (SG) 0.0000614 0.927394 0.0000339* 1.859281
+ R&D Expenditure-to-Sales
(RDS) 0.003116 0.427399 0.002383 0.206725
+ R&D Expenditure-to-Sales
(RDS) 0.000196 0.045873 0.000566 0.390934
+ Capital Expenditure-to-Sales
(CS) 0.000168 0.510746 0.000370 0.747914
+ Capital Expenditure-to-Sales
(CS) -0.000101 -0.331855 -0.0000958 -1.192996
+/- Marketing & Advertising
Expenditure-to-Sales (MS) 0.000782 0.278638 0.005440 1.262256
+/- Marketing & Advertising
Expenditure-to-Sales (MS) -0.001018 -0.481845 -0.001121* -1.701932
- OC x RPT 0.005227** 2.170032 0.015312*** 4.156382 - OCF x RPT -0.012723 -0.886249 -0.003290 -0.681192
- OC x Tenure -0.000194 -0.795902 -0.000340 -0.884398 - OCF x Tenure -0.001192 -0.730663 -0.000168 -0.307998
- OC x Banks -0.000621 -1.053431 -0.000763 -0.820816 - OCF x Banks 0.004297 1.117870 0.0000301 0.023975
N 366 366 N 366 366
Adjusted R-Squared (%)
24.4952
14.9475
Adjusted R-Squared (%)
4.9238
7.8684
F-Statistic 19.73090*** 11.14690*** F-Statistic 3.990046*** 5.930921*** * 10% sig.level ** 5% sig.level *** 1% sig.level

234
Table 6.15: Actual Regression Results (Main Results) : Normal OLS Regression Pooled Model (Non-Family Firms)(Without Biased
Industries)
Expected
Signs
Independent Variables And
Intercept
Dependent Variable Expected
Signs
Independent Variables And
Intercept
Dependent Variable
Tobin’s Q MBV ROE ROA
Coeff. t-stats Coeff. t-stats Coeff. t-stats Coeff. t-stats
+/- Intercept 3.404858*** 3.415677 +/- Intercept 1.572024 1.026971 -0.331505 -0.863109 -0.165750 -0.914228
- Related Party Transactions
That Are Likely to result in
Expropriation Ratio (RPT) 1.819565 1.601227
- Related Party Transactions
That Are Likely to result in
Expropriation Ratio (RPT) 0.366883 0.727820 -0.126330 -0.699294 -0.058315 -0.651407
+ Predicted Ownership
Concentration (OCF) -0.038300* -1.811696
+ Ownership Concentration (OC)
0.014329* 1.792493 0.002560 0.880112 0.002214 1.584924
- Average Independent
Directors Tenure (Tenure) -0.355047*** -3.536711
- Average Independent Directors
Tenure (Tenure) 0.003459 0.066995 0.014211 0.892849 0.024756*** 3.240032
- No. of Local Banks Engaged
by the Firm (Banks) 0.378809 1.396708
- No. of Local Banks Engaged by
the Firm (Banks) 0.080438 0.703963 0.001979 0.050213 -0.025887 -1.396599
+ Ln (Firm Risk) 0.195907*** 4.722977 + Ln (Firm Risk) 0.208071*** 4.069872 0.011104 0.486716 0.013283 1.314976
+/- Leverage (LEV) -0.131805 -0.448695 +/- Leverage (LEV) 0.473489 1.169708 -0.180469 -1.152598 -0.069769 -1.001199
+/- Independent Directors Ratio
(IDR) -0.455181* -1.715354 +/- Firm Size (SIZE) -0.016964 -0.236118 0.019136 1.225000 0.008146 1.067148
+ Non-Affiliated Blockholders
(NAB) -0.000676 -1.555673
+/- Independent Directors Ratio
(IDR) -0.656019 -1.611210 -0.036213 -0.229683 -0.047802 -0.674830
+ Ln (Age)
-0.009343 -0.140205
+ Non-Affiliated Blockholders
(NAB) -0.000688 -0.835949 -0.000187 -0.903338 0.00000568 0.054603
+ Sales Growth (SG) -0.000495 -0.980081 + Ln (Age) -0.041653 -0.326434 -0.016200 -0.585244 -0.013406 -1.010916
+ R&D Expenditure-to-Sales
(RDS) -0.030942 -0.530877
+ Sales Growth (SG)
-0.000299 -0.486960 0.000607 1.306143 0.000540*** 3.517986
+ Capital Expenditure-to-Sales
(CS) 0.000597 0.258292
+ R&D Expenditure-to-Sales
(RDS) 0.023663 0.280236 0.015209 0.407170 0.014482 1.035297
+/- Marketing & Advertising
Expenditure-to-Sales (MS) 0.002044 0.339511
+ Capital Expenditure-to-Sales
(CS) -0.000467 -0.214622 -0.000466 -0.343032 -0.000173 -0.292129
+/- Gross Domestic Product
(GDP) -0.000258 -0.029936
+/- Marketing & Advertising
Expenditure-to-Sales (MS) -0.001274 -0.115286 0.001735 0.676172 0.000417 0.342487
- OCF x RPT
-0.041438 -1.629255
+/- Gross Domestic Product
(GDP) -0.006585 -0.903042 -0.017056** -2.192225 0.001218 0.499393
- OCF x Tenure 0.007638*** 3.586542 - OC x RPT -0.010321 -0.800357 0.002042 0.510267 0.001421 0.721976
- OCF x Banks -0.008232 -1.419086 - OC x Tenure 0.000366 0.384122 -0.000165 -0.535662 -0.000411*** -2.894032
N 148 - OC x Banks -0.002976 -1.248500 -0.0000328 -0.037667 0.000428 1.044239
Adjusted R-Squared (%) 8.6206 N 148 148 148
F-Statistic 3.458360*** Adjusted R-Squared (%) 3.5082 0.3979 5.3562
F-Statistic 1.894793** 1.098317 2.392816*** * 10% sig.level ** 5% sig.level *** 1% sig.level

235
Table 6.16: Actual Regression Results (Main Results) : Normal OLS Regression Fixed Effects Model (Non-Family Firms)(Without Biased
Industries)
Expected
Signs
Independent Variables And
Intercept
Dependent Variable Expected
Signs
Independent Variables And
Intercept
Dependent Variable
Tobin’s Q MBV ROE ROA
Coeff. t-stats Coeff. t-stats Coeff. t-stats Coeff. t-stats
+/- Intercept 3.041131*** 3.144794 +/- Intercept 1.289281 0.850751 -0.385030 -1.006543 -0.138163 -0.782475
- Related Party Transactions
That Are Likely to result in
Expropriation Ratio (RPT) 1.436663 1.310637
- Related Party Transactions
That Are Likely to result in
Expropriation Ratio (RPT) 0.209144 0.424107 -0.126500 -0.699362 -0.063254 -0.720085
+ Predicted Ownership
Concentration (OCF) -0.030209 -1.464234
+ Ownership Concentration (OC)
0.016268** 2.087667 0.002563 0.880064 0.002172 1.585771
- Average Independent
Directors Tenure (Tenure) -0.328330*** -3.366779
- Average Independent Directors
Tenure (Tenure) 0.005357 0.106327 0.014229 0.892877 0.025077*** 3.347849
- No. of Local Banks Engaged
by the Firm (Banks) 0.461942* 1.739589
- No. of Local Banks Engaged by
the Firm (Banks) 0.114866 1.018858 0.002005 0.050789 -0.026168 -1.440812
+ Ln (Firm Risk) 0.192157*** 4.882229 + Ln (Firm Risk) 0.206136*** 4.156592 0.011116 0.486637 0.012839 1.297978
+/- Leverage (LEV) -0.074113 -0.261438 +/- Leverage (LEV) 0.516675 1.306165 -0.180578 -1.151889 -0.076339 -1.117460
+/- Independent Directors Ratio
(IDR) -0.461556* -1.843803 +/- Firm Size (SIZE) -0.014219 -0.199063 0.019140 1.223785 0.008709 1.164035
+ Non-Affiliated Blockholders
(NAB) -0.000596 -1.442026
+/- Independent Directors Ratio
(IDR) -0.645712 -1.640273 -0.036193 -0.229276 -0.043560 -0.627539
+ Ln (Age)
0.004204 0.063491
+ Non-Affiliated Blockholders
(NAB) -0.000558 -0.697886 -0.000187 -0.901780 0.0000044 0.043112
+ Sales Growth (SG) -0.000538 -1.155918 + Ln (Age) -0.008322 -0.065109 -0.016190 -0.584191 -0.014158 -1.090782
+ R&D Expenditure-to-Sales
(RDS) -0.020060 -0.370897
+ Sales Growth (SG)
-0.000325 -0.548401 0.000608 1.305567 0.000546*** 3.615392
+ Capital Expenditure-to-Sales
(CS) -0.0000312 -0.013966
+ R&D Expenditure-to-Sales
(RDS) 0.041939 0.519647 0.015233 0.407294 0.016327 1.189217
+/- Marketing & Advertising
Expenditure-to-Sales (MS) 0.000948 0.159902
+ Capital Expenditure-to-Sales
(CS) -0.001000 -0.469065 -0.000466 -0.342457 -0.000180 -0.310500
- OCF x RPT
-0.033614 -1.369579
+/- Marketing & Advertising
Expenditure-to-Sales (MS) -0.002930 -0.268042 0.001734 0.675041 0.000495 0.414391
- OCF x Tenure 0.007072*** 3.420104 - OC x RPT -0.007102 -0.562889 0.002045 0.510436 0.001566 0.811570
- OCF x Banks -0.009887* -1.739857 - OC x Tenure 0.000327 0.350499 -0.000165 -0.536068 -0.000414*** -2.972885
N 148 - OC x Banks -0.003494 -1.492955 -0.0000333 -0.038198 0.000425 1.059257
Adjusted R-Squared (%) 13.3251 N 148 148 148
F-Statistic 4.783628*** Adjusted R-Squared (%) 7.2298 0.165 6.4873
F-Statistic 2.817067*** 1.038525 2.617487*** * 10% sig.level ** 5% sig.level *** 1% sig.level
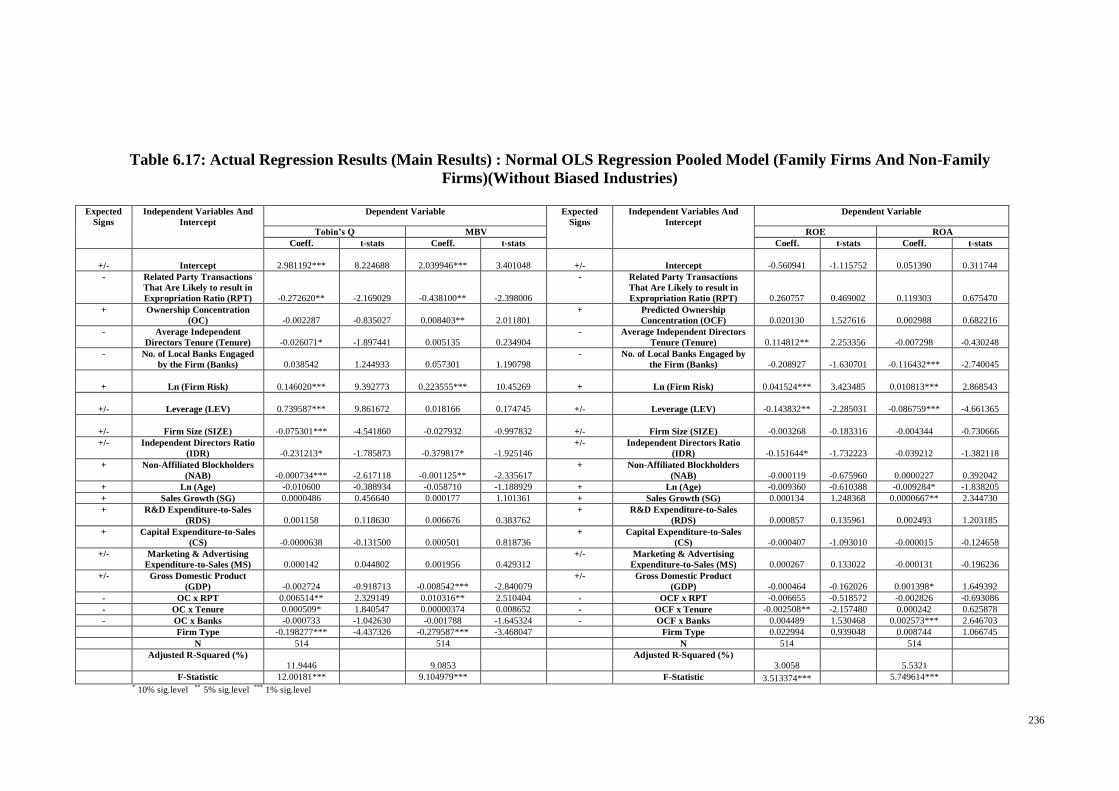
236
Table 6.17: Actual Regression Results (Main Results) : Normal OLS Regression Pooled Model (Family Firms And Non-Family
Firms)(Without Biased Industries)
Expected
Signs
Independent Variables And
Intercept
Dependent Variable Expected
Signs
Independent Variables And
Intercept
Dependent Variable
Tobin’s Q MBV ROE ROA
Coeff. t-stats Coeff. t-stats Coeff. t-stats Coeff. t-stats
+/- Intercept 2.981192*** 8.224688 2.039946*** 3.401048 +/- Intercept -0.560941 -1.115752 0.051390 0.311744
- Related Party Transactions
That Are Likely to result in
Expropriation Ratio (RPT) -0.272620** -2.169029 -0.438100** -2.398006
- Related Party Transactions
That Are Likely to result in
Expropriation Ratio (RPT) 0.260757 0.469002 0.119303 0.675470
+ Ownership Concentration
(OC) -0.002287 -0.835027 0.008403** 2.011801
+ Predicted Ownership
Concentration (OCF) 0.020130 1.527616 0.002988 0.682216
- Average Independent
Directors Tenure (Tenure) -0.026071* -1.897441 0.005135 0.234904
- Average Independent Directors
Tenure (Tenure) 0.114812** 2.253356 -0.007298 -0.430248
- No. of Local Banks Engaged
by the Firm (Banks) 0.038542 1.244933 0.057301 1.190798
- No. of Local Banks Engaged by
the Firm (Banks) -0.208927 -1.630701 -0.116432*** -2.740045
+ Ln (Firm Risk) 0.146020*** 9.392773 0.223555*** 10.45269 + Ln (Firm Risk) 0.041524*** 3.423485 0.010813*** 2.868543
+/- Leverage (LEV) 0.739587*** 9.861672 0.018166 0.174745 +/- Leverage (LEV) -0.143832** -2.285031 -0.086759*** -4.661365
+/- Firm Size (SIZE) -0.075301*** -4.541860 -0.027932 -0.997832 +/- Firm Size (SIZE) -0.003268 -0.183316 -0.004344 -0.730666
+/- Independent Directors Ratio
(IDR) -0.231213* -1.785873 -0.379817* -1.925146
+/- Independent Directors Ratio
(IDR) -0.151644* -1.732223 -0.039212 -1.382118
+ Non-Affiliated Blockholders
(NAB) -0.000734*** -2.617118 -0.001125** -2.335617
+ Non-Affiliated Blockholders
(NAB) -0.000119 -0.675960 0.0000227 0.392042
+ Ln (Age) -0.010600 -0.388934 -0.058710 -1.188929 + Ln (Age) -0.009360 -0.610388 -0.009284* -1.838205
+ Sales Growth (SG) 0.0000486 0.456640 0.000177 1.101361 + Sales Growth (SG) 0.000134 1.248368 0.0000667** 2.344730
+ R&D Expenditure-to-Sales
(RDS) 0.001158 0.118630 0.006676 0.383762
+ R&D Expenditure-to-Sales
(RDS) 0.000857 0.135961 0.002493 1.203185
+ Capital Expenditure-to-Sales
(CS) -0.0000638 -0.131500 0.000501 0.818736
+ Capital Expenditure-to-Sales
(CS) -0.000407 -1.093010 -0.000015 -0.124658
+/- Marketing & Advertising
Expenditure-to-Sales (MS) 0.000142 0.044802 0.001956 0.429312
+/- Marketing & Advertising
Expenditure-to-Sales (MS) 0.000267 0.133022 -0.000131 -0.196236
+/- Gross Domestic Product
(GDP) -0.002724 -0.918713 -0.008542*** -2.840079
+/- Gross Domestic Product
(GDP) -0.000464 -0.162026 0.001398* 1.649392
- OC x RPT 0.006514** 2.329149 0.010316** 2.510404 - OCF x RPT -0.006655 -0.518572 -0.002826 -0.693086
- OC x Tenure 0.000509* 1.840547 0.00000374 0.008652 - OCF x Tenure -0.002508** -2.157480 0.000242 0.625878
- OC x Banks -0.000733 -1.042630 -0.001788 -1.645324 - OCF x Banks 0.004489 1.530468 0.002573*** 2.646703
Firm Type -0.198277*** -4.437326 -0.279587*** -3.468047 Firm Type 0.022994 0.939048 0.008744 1.066745
N 514 514 N 514 514
Adjusted R-Squared (%)
11.9446
9.0853
Adjusted R-Squared (%)
3.0058
5.5321
F-Statistic 12.00181*** 9.104979*** F-Statistic 3.513374*** 5.749614*** * 10% sig.level ** 5% sig.level *** 1% sig.level

237
Table 6.18: Actual Regression Results (Main Results) : Normal OLS Regression Fixed Effects Model (Family Firms And Non-Family
Firms)(Without Biased Industries)
Expected
Signs
Independent Variables And
Intercept
Dependent Variable Expected
Signs
Independent Variables And
Intercept
Dependent Variable
Tobin’s Q MBV ROE ROA
Coeff. t-stats Coeff. t-stats Coeff. t-stats Coeff. t-stats
+/- Intercept 2.903995*** 8.164830 1.949360*** 3.302149 +/- Intercept -0.563796 -1.122211 0.057485 0.349842
- Related Party Transactions
That Are Likely to result in
Expropriation Ratio (RPT) -0.281612** -2.297469 -0.466114*** -2.622057
- Related Party Transactions
That Are Likely to result in
Expropriation Ratio (RPT) 0.260813 0.468949 0.118957 0.674740
+ Ownership Concentration
(OC) -0.001207 -0.448913 0.009321** 2.281885
+ Predicted Ownership
Concentration (OCF) 0.020122 1.526513 0.003141 0.718719
- Average Independent
Directors Tenure (Tenure) -0.022390* -1.654990 0.009568 0.445645
- Average Independent Directors
Tenure (Tenure) 0.114732** 2.251013 -0.006782 -0.400691
- No. of Local Banks Engaged
by the Firm (Banks) 0.046470 1.523250 0.063803 1.350747
- No. of Local Banks Engaged by
the Firm (Banks) -0.208946 -1.630316 -0.115868*** -2.732503
+ Ln (Firm Risk) 0.141202*** 9.324425 0.212159*** 10.22668 + Ln (Firm Risk) 0.041494*** 3.419657 0.010726*** 2.850451
+/- Leverage (LEV) 0.737013*** 10.10117 0.003144 0.031232 +/- Leverage (LEV) -0.143746** -2.282858 -0.087755*** -4.723160
+/- Firm Size (SIZE) -0.074521*** -4.554833 -0.027986 -1.011227 +/- Firm Size (SIZE) -0.003273 -0.183584 -0.004317 -0.727633
+/- Independent Directors Ratio
(IDR) -0.197358 -1.559233 -0.306801 -1.595780
+/- Independent Directors Ratio
(IDR) -0.151872* -1.734117 -0.037856 -1.336869
+ Non-Affiliated Blockholders
(NAB) -0.000680** -2.478526 -0.001015** -2.159969
+ Non-Affiliated Blockholders
(NAB) -0.000119 -0.677024 0.0000227 0.393026
+ Ln (Age) -0.002739 -0.101072 -0.044178 -0.901963 + Ln (Age) -0.009392 -0.612245 -0.009363* -1.858028
+ Sales Growth (SG) 0.0000511 0.501694 0.000164 1.071766 + Sales Growth (SG) 0.000134 1.246344 0.0000666** 2.344668
+ R&D Expenditure-to-Sales
(RDS) 0.000485 0.050826 0.005380 0.317721
+ R&D Expenditure-to-Sales
(RDS) 0.000860 0.136384 0.002528 1.222799
+ Capital Expenditure-to-Sales
(CS) -0.0000537 -0.113596 0.000442 0.741115
+ Capital Expenditure-to-Sales
(CS) -0.000407 -1.093033 -0.0000135 -0.112186
+/- Marketing & Advertising
Expenditure-to-Sales (MS) -0.000437 -0.140583 0.001290 0.288647
+/- Marketing & Advertising
Expenditure-to-Sales (MS) 0.000270 0.134018 -0.000123 -0.183790
- OC x RPT 0.006601** 2.416893 0.010844*** 2.709921 - OCF x RPT -0.006656 -0.518466 -0.002808 -0.690059
- OC x Tenure 0.000456* 1.673050 -0.0000295 -0.069607 - OCF x Tenure -0.002506** -2.155206 0.000231 0.597919
- OC x Banks -0.000898 -1.297621 -0.001942* -1.822713 - OCF x Banks 0.004490 1.530115 0.002559*** 2.638153
Firm Type -0.194178*** -4.381075 -0.280973*** -3.510659 Firm Type 0.022975 0.937952 0.008770 1.072319
N
514
514
N
514
514
Adjusted R-Squared (%)
15.3558
12.7604
Adjusted R-Squared (%)
2.9442
5.7039
F-Statistic 14.97810*** 12.26994*** F-Statistic 3.337329*** 5.660675*** * 10% sig.level ** 5% sig.level *** 1% sig.level

238
The following are the summary of the research results of the robustness test for the key
variables analysed in this research:
Table 6.19: Summary of Research Results (Key Variables)(Coefficients)
(Family Firms)(Without Biased Industries)
Main Variables
Tested
Firm Value
Tobin’s Q Market-to-Book
Value (MBV)
Return On
Equity (ROE)
Return On
Asset
(ROA)
Related Party
Transactions
That Are Likely
to result in
Expropriation
Ratio (RPT)
-0.193345*
-0.192718*
-0.669589***
-0.658401***
0.534871
0.534608
0.132284
0.132378
Average
Independent
directors’ tenure
(Tenure)
0.003896
0.006089
0.008252
0.013275
0.052924
0.053097
0.009961
0.009928
No. of Domestic
banks Engaged
by the Firm
(Banks)
0.027722
0.029613
0.0127
0.015354
-0.189101
-0.188701
-0.004254
-0.004347
Interaction
Between
Ownership
Concentration
And RPT
0.00524**
0.005227**
0.015583***
0.015312***
-0.012728
-0.012723
-0.003288
-0.00329
Interaction
Between
Ownership
Concentration
And Tenure
-0.000168
-0.000194
-0.000287
-0.00034
-0.001187
-0.001192
-0.000169
-0.000168
Interaction
Between
Ownership
Concentration
And Banks
-0.000574
-0.000621
-0.000666
-0.000763
0.004306
0.004297
0.0000281
0.0000301
*10% significance level **5% significance level ***1% significance level
Italic figures represent coefficients of Fixed Effects Model.

239
Table 6.20: Summary of Research Results (Key Variables)(Coefficients)
(Non-Family Firms) (Without Biased Industries)
Main Variables
Tested
Firm Value
Tobin’s Q Market-to-Book
Value (MBV)
Return On
Equity (ROE)
Return On
Asset (ROA)
Related Party
Transactions
That Are Likely
to result in
Expropriation
Ratio (RPT)
1.819565
1.436663
0.366883
0.209144
-0.12633
-0.1265
-0.058315
-0.063254
Average
Independent
directors’ tenure
(Tenure)
-0.355047***
-0.32833***
0.003459
0.005357
0.014211
0.014229
0.024756***
0.025077***
No. of Domestic
banks Engaged
by the Firm
(Banks)
0.378809
0.461942*
0.080438
0.114866
0.001979
0.002005
-0.025887
-0.026168
Interaction
Between
Ownership
Concentration
And RPT
-0.041438
-0.033614
-0.010321
-0.007102
0.002042
0.002045
0.001421
0.001566
Interaction
Between
Ownership
Concentration
And Tenure
0.007638***
0.007072***
0.000366
0.000327
-0.000165
-0.000165
-0.000411***
-0.000414***
Interaction
Between
Ownership
Concentration
And Banks
-0.008232
-0.009887*
-0.002976
-0.003494
-0.0000328
-0.0000333
0.000428
0.000425
*10% significance level **5% significance level ***1% significance level
Italic figures represent coefficients of Fixed Effects Model.

240
Table 6.21: Summary of Research Results (Key Variables)
(Family Firms And Non-Family Firms)(Without Biased Industries)
Main Variables
Tested
Firm Value
Tobin’s Q Market-to-Book
Value (MBV)
Return On
Equity (ROE)
Return On
Asset (ROA)
Related Party
Transactions
That Are Likely
to result in
Expropriation
Ratio (RPT)
-0.27262**
-0.281612**
-0.4381**
-0.466114***
0.260757
0.260813
0.119303
0.118957
Average
Independent
directors’ tenure
(Tenure)
-0.026071*
-0.02239*
0.005135
0.009568
0.114812**
0.114732**
-0.007298
-0.006782
No. of Domestic
banks Engaged
by the Firm
(Banks)
0.038542
0.04647
0.057301
0.063803
-0.208927
-0.208946
-0.116432***
-0.115868***
Interaction
Between
Ownership
Concentration
And RPT
0.006514**
0.006601**
0.010316**
0.010844***
-0.006655
-0.006656
-0.002826
-0.002808
Interaction
Between
Ownership
Concentration
And Tenure
0.000509*
0.000456*
0.00000374
-0.0000295
-0.002508**
-0.002506**
0.000242
0.000231
Interaction
Between
Ownership
Concentration
And Banks
-0.000733
-0.000898
-0.001788
-0.001942*
0.004489
0.00449
0.002573***
0.002559***
Firm Type
-0.198277***
-0.194178***
-0.279587***
-0.280973***
0.022994
0.022975
0.008744
0.00877
*10% significance level **5% significance level ***1% significance level
Italic figures represent coefficients of Fixed Effects Model.
241
For family firms analysed in this research, RPTs which are likely to result in
expropriation reduce firm value and it is statistically significant at 1% and 10%
significance level. However, this reduction only affect market-based measures of firm
value only i.e. Tobin‘s Q and MBV. In addition, controlling shareholders‘ ownership
has a statistically significant positive moderating effect on this negative relationship at
1% and 5% significance level respectively. However, this significant positive
moderating effect also only affect market-based measures of firm value only i.e. Tobin‘s
Q and MBV. For non-family firms, there is no significant relationship between RPTs
which are likely to result in expropriation and firm value for both accounting-based and
market-based performance measures. However, in non-family firms in exclusive
industries or biased industries, there is a significant negative moderating effect of
controlling shareholders‘ ownership on this relationship for market-based performance
measures (Tobin‘s Q). This conclusion is derived by comparing the pre-robustness and
robustness test results for non-family firms. For the pooled model (family and non-
family firms), RPTs which are likely to result in expropriation reduce firm value and it
is statistically significant at 1% and 5% significance level. However, this reduction only
affect market-based measures of firm value only i.e. Tobin‘s Q and MBV. In addition,
controlling shareholders‘ ownership has a statistically significant positive moderating
effect on this negative relationship at 1% and 5% significance level. However, this
significant positive moderating effect also only affect market-based measures of firm
value only i.e. Tobin‘s Q and MBV.
In the family firm model, ownership concentration does not have significant
relationship with firm value for both accounting-based and market-based performance
measures. However, in non-family firms, there are contradictory results on the
relationship between ownership concentration and market-based performance measures.
Ownership concentration has a significant negative relationship with firm value for

242
Tobin‘s Q where as ownership concentration has a significant positive relationship with
MBV. Likewise, in the pooled model (family and non-family firms), ownership
concentration has a positive relationship with firm value for market-based performance
measures only (i.e. MBV).
For family firms analysed in this research, average independent directors‘ tenure has no
significant relationship with firm value. Controlling shareholders‘ ownership also has
no siginificant moderating effect on this relationship. For non-family firms, there is
inconclusive evidence on the relationship between average independent directors‘
tenure and firm value as there is a significant negative relationship for market-based
performance measures (Tobin‘s Q) at a significance level of 1% and a significant
positive relationship for accounting-based performance measures (ROA) also at a
significance level of 1%. There is also inconclusive evidence on the moderating effect
of controlling shareholders‘ ownership on this relationship. For market-based
performance measures (Tobin‘s Q), there is a significant positive moderating effect
which is significant at 5% significance level whereas for accounting-based performance
measures (ROA), there is a significant negative moderating effect which is significant at
5% significance level. For the pooled (family and non-family firms) model, there is
inconclusive evidence with regards to the relationship between average independent
directors‘ tenure and firm value. Average independent directors‘ tenure reduces firm
value for market-based performance measures (i.e. Tobin‘s Q) and this is statistically
significant at 10% significance level whereas it increases firm value for accounting-
based performance measures (i.e. ROE) and this is statistically significant at 5%
significance level. Similarly, for the pooled (family and non-family firms) model, there
is inconclusive evidence with regards to the moderating effect of controlling
shareholders‘ ownership on the relationship between average independent directors‘
tenure and firm value. Controlling shareholders‘ ownership have a significant positive
243
moderating effect on this relationship for market-based performance measures (i.e.
Tobin‘s Q) and this is statistically significant at 10% significance level whereas
controlling shareholders‘ ownership have a significant negative moderating effect on
this relationship for accounting-based performance measures (i.e. ROE) and this is
statistically significant at 5% significance level.
For family firms analysed in this research, the number of domestic banks that the firm
engaged with do not have any statistical significant relationship with firm value.
Controlling shareholders‘ ownership also do not have any statistical significant
moderating effect on this relationship. For non-family firms, there is a significant
positive relationship between the number of domestic banks that the firm engages with
and firm value at 10% significance level. In addition, controlling shareholders‘
ownership have a significant negative moderating effect on this relationship at 10%
significance level. However, both this significant positive relationship and significant
positive negative effect is restricted to market-based performance measures only (i.e.
Tobin‘s Q). For the pooled model (family and non-family firms), there is a statistical
significant negative relationship between the number of domestic banks that the firm
engages with and firm value and this is statistically significant at 1% significance level.
However, this reduction only affect accounting-based performance measures of firm
value i.e ROA. For the pooled model (family and non-family firms), there is also
inconclusive evidence on the moderating effect of controlling shareholders‘ ownership
on the relationship between the number of domestic banks that the firm engages with
and firm value as there is a statistically significant positive moderating effect on
accounting-based performance measures (i.e. ROA and significant at 1% significance
level) and a statistically significant negative moderating effect on market-based
performance measures (i.e. MBV and significant at 10% significance level).

244
In the pooled model (family and non-family firms), family firms has a lower firm value
as compared with non-family firms and this is statistically significant at 1% significance
level. In addition, in the pooled model (family and non-family firms), the joint
hypotheses of H0 : βRPTs of family firms and βRPTs of non- family firms = 0 is rejected and has a
significant negative relationship as derived from the regression results. Both these
results prove that the negative relationship between RPT and firm value is stronger in
family firms compared to non-family firms. However, this only affect market-based
measures i.e. Tobin‘s Q and MBV. Likewise, in the pooled model (family and non-
family firms), the joint hypotheses of H0 : βOC X RPTs of family firms and βOC X RPTs of non- family
firms = 0 is rejected and has a significant positive moderating effect as derived from the
regression results. Both these results prove that the positive moderating effect of
controlling shareholders‘ ownership on this relationship is stronger in family firms
compared to non-family firms due to the overall lower firm value of family firms (i.e.
market-based measures of Tobin‘s Q and MBV) which renders a stronger corporate
reputational effects in family firms.
Even though in non-family firms, average independent directors‘ tenure reduces firm
value for market-based performance measures (i.e. Tobin‘s Q) and this is statistically
significant at 1% significance level; it cannot be proven that this negative relationship is
stronger in non-family firms compared to family firms because overall, in the pooled
model (family and non-family firms), family firms has a lower firm value than non-
family firms and this is statistically significant at 1% significance level. Similarly,
although in non-family firms, average independent directors‘ tenure increases firm
value for accounting-based performance measures (i.e. ROE) and this is statistically
significant at 1% significance level; it cannot be proven that this positive relationship is
stronger in non-family firms compared to family firms because overall, in the pooled
model (family and non-family firms), there is no significant difference between the firm

245
value of family firms and non-family firms. Likewise, although in non-family firms,
controlling shareholders‘ ownership have a significant positive moderating effect on the
relationship between average independent directors‘ tenure and firm value for market-
based performance measures (i.e. Tobin‘s Q) and this is statistically significant at 1%
significance level; it cannot be proven that this moderating effect is stronger in non-
family firms compared to family firms because overall, in the pooled model (family and
non-family firms), family firms has a lower firm value than non-family firms and this is
statistically significant at 1% significance level. A higher firm value for non-family
firms renders a weaker positive moderating effect. Similarly, although in non-family
firms, controlling shareholders‘ ownership have a significant negative moderating effect
on the relationship between average independent directors‘ tenure and firm value for
accounting-based performance measures (i.e. ROA) and this is statistically significant at
1% significance level, it cannot be proven that this negative moderating effect is
stronger in non-family firms compared to family firms because the joint hypotheses in
the pooled model (family and non-family firms) i.e. H0 : βocf x tenure of family firms and β ocf x
tenure of non-family firms = 0 is not rejected as derived from the regression results for market-
based performance measures (ROA).
Even though there is a statistically significant positive relationship between the number
of domestic banks that the firm engages with and firm value (i.e. market-based
performance measure Tobin‘s Q) in non-family firms; this result cannot prove that this
positive relationship is stronger in non-family firms compared to family firms because
the joint hypotheses in the pooled model (family and non-family firms) i.e. H0 : βbanks of
family firms and β banks of non-family firms = 0 is not rejected as derived from the regression results
for market-based performance measures (Tobin‘s Q).

246
Despite the fact that non-family firms‘ controlling shareholders‘ ownership has a
statistically significant negative moderating effect on the relationship between the
number of domestic banks that the firm engages with and firm value (i.e. market-based
measure Tobin‘s Q), this result cannot prove that the negative moderating effect of
controlling shareholders‘ ownership on the relationship between the number of
domestic banks that the firm engages with and firm value (Tobin‘s Q) is stronger in
non-family firms compared to family firms because the joint hypotheses in the pooled
model (family and non-family firms) i.e. H0 : βoc x banks of family firms and β oc x banks of non-family
firms = 0 is not rejected as derived from the regression results for market-based
performance measures (Tobin‘s Q).
For family firms, non-family firms and the pooled model (family and non-family firms),
firm risk is significantly positively related to firm value for both market-based
performance measures and accounting-based performance measures at 1%, 5% and 10%
significance level respectively. For both family firms and the pooled model (family and
non-family firms), leverage has a significant positive relationship with market-based
performance measures (Tobin‘s Q) at 1% significance level but a significant negative
relationship with accounting-based performance measures (ROE and ROA) at 1% and
5% significance level. However, for non-family firms, leverage does not have a
significant relationship with both market-based and accounting-based performance
measures.
In addition, for family firms, firm size has a significant negative relationship with
market-based performance measures (Tobin‘s Q) at 1% significance level but a
significant positive relationship with accounting-based performance measures (ROA) at
10% significance level. In non-family firms, there is no significant relationship between
firm size and firm value for both market-based and accounting-based performance
measures. For the pooled model (family and non-family firms), firm size has a

247
significant negative relationship with market-based performance measure only (Tobin‘s
Q) at 1% significance level. Furthermore, in family firms, independent directors‘ ratio
has no significant relationship with firm value for both market-based and accounting-
based performance measures. However, for non-family firms, independent directors‘
ratio has a significant negative relationship with market-based performance measures
(Tobin‘s Q) at 10% significance level. In the pooled model (family and non-family
firms), independent directors‘ ratio has a significant negative relationship with market-
based performance measures (Tobin‘s Q and MBV) and accounting-based performance
measures (ROE) both at 10% significance level respectively.
On the other hand, for both family firms and the pooled model (family and non-family
firms), non-affiliated blockholders have a siginificant negative relationship with firm
value but only on market-based performance measures only (Tobin‘s Q and MBV) at
1%, 5% and 10% significance level respectively. However, for non-family firms, there
is no significant relationship between non-affiliated blockholders and firm value for
both market-based and accounting-based performance measures.
In family firms and the pooled model (family and non-family firms), firm age has a
significant negative relationship with firm value for accounting-based performance
measures (i.e. ROA) only at 10% significance level but not market-based performance
measures. However, in non-family firms, firm age has no significant relationship with
firm value for both market-based performance measures and accounting-based
performance measures. Likewise, for family firms, non-family firms and the pooled
model (family and non-family firms), sales growth has a significant positive
relationship with accounting-based performance measures (ROA) (significant at 1%,
5% and 10% significance level respectively) but not market-based performance
measures.

248
Moreover, in family firms, marketing & advertising expenditures have a significant
negative relationship with accounting-based performance measures (i.e. ROA) at 10%
significance level but not market-based performance measures. However, for non-
family firms and the pooled model (family and non-family firms); marketing &
advertising expenditures have no significant relationship with firm value for both
market-based performance measures and accounting-based performance measures. In
family firms, non-family firms and the pooled model (family and non-family firms);
R&D expenditures and capital expenditures and have no significant relationship with
firm value for both market-based performance measures and accounting-based
performance measures.
For family firms, GDP has a significant negative relationship with market-based
performance measures (i.e. MBV) at 1% significance level but a significant positive
relationship with accounting-based performance measures (i.e. ROE and ROA) at 1%
and 5% significance level respectively. For non-family firms, GDP has a significant
negative relationship with accounting-based performance measures (i.e. ROE) at 5%
significance level. In the pooled model (family and non-family firms), GDP has a
significant negative relationship with market-based performance measures (i.e. MBV) at
1% significance level but a significant positive relationship with accounting-based
performance measures (i.e. ROA) at 10% significance level.
249
6.6 HYPOTHESES TESTED
The following is a description of the hypotheses being tested as well as the conclusions
that are made:
H1a: There is a negative relationship between related party transactions (RPTs)
which are likely to result in expropriation and a firm value in Malaysian firms.
The research results show that there is a statistically significant negative
relationship between RPTs which are likely to result in expropriation and firm
value (market-based measures i.e. Tobin‘s Q and MBV) for family firms only. It
is significant at 1%, 5% and 10% significance level respectively and this result
is robust against firms in non-exclusive industries (without biased industries).
Therefore, H1a is supported.
H1b: If there is a negative relationship between related party transactions (RPTs)
which are likely to result in expropriation and firm value in Malaysian firms,
this negative relationship is likely to be stronger in family firms compared to
non-family firms.
The research results shows that in family firms, there is a significant negative
relationship between RPTs which are likely to result in expropriation and firm
value only in market-based performance measures i.e. Tobin‘s Q and MBV.
Likewise, in the pooled model (family and non-family firms) results, the joint
hypotheses of H0 : βrpt for family firms and H0 : βrpt for non-family firms = 0 is rejected (for
market-based measures i.e. Tobin‘s Q and MBV) and there is a significant
negative relationship. Furthermore, the pooled model (family and non-family
firms) results shows that family firms has a lower firm value (market-based
measures i.e. Tobin‘s Q and MBV) compared to non-family firms and this is
statistically significant at 1% significance level. These results are robust against

250
firms in non-exclusive industries (without biased industries). All these prove
that the negative relationship between RPT and firm value is stronger in family
firms compared to non-family firms. Hence, H1b is supported.
H2a: There is a negative relationship between independent directors’ tenure and firm
value in Malaysian firms.
The research results show that in family firms within exclusive (biased)
industries, there is a statistically significant negative relationship between
average independent directors‘ tenure and firm value in market-based
performance measures i.e. MBV. This is significant at 10% significance level.
This conclusion is made by comparing the pre-robustness test results of family
firms and the robustness test results of family firms. Therefore, H2a is supported.
H2b: If there is a negative relationship between independent directors’ tenure and
firm value in Malaysian firms, this negative relationship is likely to be stronger
in family firms compared to non-family firms.
It cannot be proven whether the significant negative relationship between
average independent directors‘ tenure and firm value in family firms within
exclusive (biased) industries is stronger in family firms compared to non-family
firms for market-based performance measure i.e. MBV. The reason is that in the
pooled model (family and non-family firms) results (with biased industries), the
joint hypotheses of H0 : βtenure for family firms and H0 : βtenure for non-family firms = 0 is not
rejected for market-based performance measures (i.e. MBV). Therefore, no
conclusion can be made as to whether the negative relationship between average
independent directors‘ tenure and firm value is stronger in family firms or non-
family firms. Hence, H2b is not supported.
251
H3a: There is a negative relationship between the quantity of domestic banks that the
firm engages with and firm value in Malaysian firms.
The research results shows that in non-family firms, there is a statistically
significant positive relationship between the quantity of domestic banks that the
firm engages with and firm value for market-based performance measures
(Tobin‘s Q). This is robust against non-family firms without exclusive or biased
industries. This is significant at 10% significance level. Therefore, H3a is not
supported.
H3b: If there is a negative relationship between the quantity of domestic banks that
the firm engages with and firm value in Malaysian firms, this negative
relationship is likely to be stronger in family firms compared to non-family
firms.
Since H3a is not supported, thus, H3b is not supported.
H4a: There is a positive moderating effect of controlling shareholders’ ownership on
the relationship between related party transactions (RPTs) which are likely to
result in expropriation and firm value in Malaysian firms.
The research results show that for family firms, there is a statistically significant
positive moderating effect of controlling shareholders‘ ownership concentration
on the relationship between RPTs which are likely to result in expropriation and
firm value for market based performance measures i.e. Tobin‘s Q and MBV.
The results are also robust against family firms without exclusive or biased
industries. These results are significant at 1%, 5% and 10% significance level
respectively. Therefore, H4a is supported.

252
H4b : If there is a positive moderating effect of controlling shareholders’ ownership on
the relationship between related party transactions (RPTs) which are likely to
result in expropriation and firm value in Malaysian firms, this positive
moderating effect is likely to be stronger in family firms compared to non-family
firms.
The research results show that there is a statistically significant positive
moderating effect of controlling shareholders‘ ownership concentration on the
relationship between RPTs which are likely to result in expropriation and firm
value for market based performance measures i.e. Tobin‘s Q and MBV in family
firms. In addition, in the pooled model (family and non-family firms), the joint
hypotheses of H0 : βoc x RPTs for family firms and H0 : βoc x RPTs for non-family firms = 0 is
rejected for market-based performance measures (i.e. Tobin‘s Q and MBV).
Likewise, in the pooled model (family and non-family firms), overall, the firm
value (i.e. market based measures of Tobin‘s Q and MBV) is lower in family
firms compared to non-family firms and this is statistically significant at 1%
significance level. Both these results are robust against family firms without
biased or exclusive industries. Basically, these results show that the significant
positive moderating effect of controlling shareholders‘ ownership on the
relationship between RPTs which are likely to result in expropriation and firm
value is stronger in family firms compared to non-family firms. Lower overall
firm value (market-based performance measures i.e. Tobin‘s Q and MBV) in
family firms renders a stronger corporate reputational effects in these firms.
Therefore, H4b is supported.

253
H5a: There is a positive moderating effect of controlling shareholders’ ownership on
the relationship between independent directors’ tenure and firm value in
Malaysian firms.
The research results shows that there is a statistically significant positive
moderating effect of controlling shareholders‘ ownership on the relationship
between average independent directors‘ tenure and firm value for market-based
performance measures (i.e. MBV) within family firms in exclusive or biased
industries. This is statistically significant at 10% significance level. This
conclusion is made after comparing the pre-robustness and robustness test
results for family firms. Therefore, H5a is supported.
H5b: If there is a positive moderating effect of controlling shareholders’ ownership on
the relationship between independent directors’ tenure and firm value in
Malaysian firms, this positive moderating effect is likely to be stronger in family
firms compared to non-family firms.
Even though the research results shows that there is a statistically significant
positive moderating effect of controlling shareholders‘ ownership on the
relationship between average independent directors‘ tenure and firm value for
market-based performance measures (i.e. MBV) within family firms in exclusive
or biased industries; it cannot be proven that this significant positive moderating
effect is stronger in family firms compared to non-family firms because in the
pooled model (family and non-family firms)(with biased industries), the joint
hypotheses of H0 : βoc x tenure for family firms and H0 : βoc x tenure for non-family firms = 0 is
not rejected for market-based performance measures (i.e. MBV). Therefore, no
conclusion can be made as to whether the significant positive moderating effect
of controlling shareholders‘ ownership on the relationship between average
254
independent directors‘ tenure and firm value is stronger in family firms or non-
family firms. Hence, H5b is not supported.
H6a: There is a positive moderating effect of controlling shareholders’ ownership on
the relationship between the quantity of domestic banks that the firm engages
with and firm value in Malaysian firms.
The research results shows that in non-family firms, controlling shareholders‘
ownership has a negative moderating effect on the relationship between the
number of domestic banks that the firm engages with and firm value for market-
based performance measures (Tobin‘s Q). This result is robust against non-
family firms without exclusive or biased industries and is significant at 10%
significance level respectively. Therefore, H6a is not supported.
H6b: If there is a positive moderating effect of controlling shareholders’ ownership on
the relationship between the quantity of domestic banks that the firm engages
with and firm value in Malaysian firms, this positive moderating effect is likely
to be stronger in family firms compared to non-family firms.
Since H6a is not supported, H6b is also not supported.
6.7 SUMMARY OF HYPOTHESES
Table 6.22 summarise the hypotheses being tested in this research as discussed in the
previous section. The summary discuss whether the hypothesis is supported or not; after
controlling for industry effects in the robustness tests:

255
Table 6.22: Summary Of Hypotheses Tested
Hypothesis
Description
Is Hypothesis
Supported?
H1a
There is a negative relationship between related party transactions (RPTs) which are likely to result in expropriation and firm
value in Malaysian firms.
Yes
H1b
If there is a negative relationship between related party transactions (RPTs) which are likely to result in expropriation and
firm value in Malaysian firms, this negative relationship is likely to be stronger in family firms compared to non-family firms.
Yes
H2a There is a negative relationship between independent directors‘ tenure and firm value in Malaysian firms. Yes
H2b
If there is a negative relationship between independent directors‘ tenure and firm value in Malaysian firms, this negative
relationship is likely to be stronger in family firms compared to non-family firms.
No
H3a
There is a negative relationship between the number of domestic banks that the firm engages with and firm value in
Malaysian firms.
No
H3b If there is a negative relationship between the number of domestic banks that the firm engages with and firm value in
Malaysian firms, this negative relationship is likely to be stronger in family firms compared to non-family firms.
No
H4a
There is a positive moderating effect of controlling shareholders‘ ownership on the relationship between related party
transactions (RPTs) which are likely to result in expropriation and firm value in Malaysian firms.
Yes
H4b
If there is a positive moderating effect of controlling shareholders‘ ownership on the relationship between related party
transactions (RPTs) which are likely to result in expropriation and firm value in Malaysian firms, this positive moderating
effect is likely to be stronger in family firms compared to non-family firms.
Yes
H5a
There is a positive moderating effect of controlling shareholders‘ ownership on the relationship between independent
directors‘ tenure and firm value in Malaysian firms.
Yes
H5b If there is a positive moderating effect of controlling shareholders‘ ownership on the relationship between independent
directors‘ tenure and firm value in Malaysian firms, this positive moderating effect is likely to be stronger in family firms
compared to non-family firms.
No
H6a
There is a positive moderating effect of controlling shareholders‘ ownership on the relationship between the number of
domestic banks that the firm engages with and firm value in Malaysian firms.
No
H6b If there is a positive moderating effect of controlling shareholders‘ ownership on the relationship between the number of
domestic banks that the firm engages with and firm value in Malaysian firms, this positive moderating effect is likely to be
stronger in family firms compared to non-family firms.
No

256
6.8 CONCLUSION
This chapter discuss the overall research results including the robustness tests results
and how they are related to the hypotheses being tested. The descriptive statistics are
also discussed. The next chapter will discuss the overview of the findings, implications
of these findings, research significance and limitations in this research as well as
suggestions for future research.

257
CHAPTER SEVEN
DISCUSSION AND CONCLUSION
7.1 INTRODUCTION
This chapter provides conclusions drawn from the research findings and discussions
presented in the previous chapter. This rest of the chapter is organised as follows.
Section 5.2 discusses the overview of the findings based upon the research objectives.
Section 5.3 discusses the implications of findings. Section 5.4 discusses the theoretical
contributions and policy implications. Section 5.5 discusses the research limitations.
Section 5.6 discusses the suggestions for future research and Section 5.7 concludes.
7.2 DISCUSSION: OVERVIEW OF THE FINDINGS
The following are explanations of the findings based on the research objectives of this
study.
7.2.1 Research Objective 1: To Examine Whether There Is A Negative
Relationship Between Related Party Transactions (RPTs) Which Are Likely To
Result In Expropriation, Independent Directors’ Tenure And The Number Of
Domestic Banks That The Firm Engages With, And firm value In Malaysian
Firms.
This study focused on minority shareholder expropriation in Malaysian public-listed
firms. The first research objective is to examine whether there is a significant negative
relationship between RPTs which are likely to result in expropriation, independent
directors‘ tenure and the number of domestic banks that the firm engages with, and firm
value in Malaysian firms.

258
Based on the regression results, it is found that RPTs which are likely to result in
expropriation significantly reduces firm value (market-based measures i.e. Tobin‘s Q
and MBV) in Malaysian family firms only. In non-family firms, there is no significant
relationship between RPTs which are likely to result in expropriation and firm value for
both market-based and accounting-based performance measures. This result is
consistent with the study by Munir and Gul (2011) whereby they found that related
party transactions reduce firm value (i.e. market-based measures) in Malaysian family
firms but not in non-family firms.
For Malaysian family firms in exclusive industries, there is a statistically significant
negative relationship between average independent directors‘ tenure and firm value in
market-based performance measures (i.e. MBV). However, in family firms in non-
exclusive industries or without biased industries, it is found that average independent
directors‘ tenure does not have any statistical significant relationship with firm value for
both market-based performance and accounting-based performance measures. In non-
family firms, there is inconclusive evidence on the relationship between average
independent directors‘ tenure and firm value as there is a significant negative
relationship for market-based performance measures (i.e. Tobin‘s Q) but a significant
positive relationship for accounting-based performance measures (i.e. ROA). All these
results are inconsistent with the findings by Abdelsalam and El-Masry (2008) and Liu
and Sun (2010) who found that longer tenure of independent directors is beneficial to
the interests of minority shareholders.
The research results also shows that there is no significant relationship between the
number of domestic banks that the firm engages with and firm value for both market-
based and accounting-based performance measures in Malaysian family firms.
However, there is a significant positive relationship between the number of domestic
banks that the firm engages with and firm value for market-based performance measures

259
(Tobin‘s Q) in Malaysian non-family firms. These results are inconsistent with the
findings by Fok et.al. (2004) who found that there is a significant negative relationship
between the number of domestic banks that the firm engages with and firm value among
public-listed firms in Taiwan.
7.2.2 Research Objective 2: To Examine Whether, If There Is A Negative
Relationship Between Related Party Transactions (RPTs) Which Are Likely To
Result In Expropriation, Independent Directors’ Tenure And The Number Of
Domestic Banks That The Firm Engages With, And firm value In Malaysian
Firms; This Negative Relationship Is Stronger In Family Firms Compared To
Non-Family Firms.
The second research objective is to examine whether, if there is a significant negative
relationship between RPTs which are likely to result in expropriation, independent
directors‘ tenure and the number of domestic banks that the firm engages with, and firm
value in Malaysian firms; this negative relationship is stronger in family firms
compared to non-family firms.
The regression results show that the significant negative relationship between RPTs
which are likely to result in expropriation against firm value (market-based measures
i.e. Tobin‘s Q and MBV) is more prominent in Malaysian family firms compared to
non-family firms. This finding is similar to the findings by Munir and Gul (2011) who
found that the significant negative relationship between total RPTs and firm value
(market-based measures) is stronger in Malaysian family firms compared to non-family
firms.

260
On the other hand, based upon the research results, it cannot be proven that the
significant negative relationship between average independent directors‘ tenure and firm
value (i.e. market-based performance measures of Tobin‘s Q and MBV and accounting
–based performance measure of ROE) is stronger in family firms or non-family firms.
7.2.3 Research Objective 3: To Examine Whether There Is A Positive
Moderating Effect Of Controlling Shareholders’ Ownership On The Relationship
Between Related Party Transactions (RPTs) Which Are Likely To Result In
Expropriation, Independent Directors’ Tenure And The Number Of Domestic
Banks That The Firm Engages With, And firm value In Malaysian Firms.
The third research objective is to examine whether there is a significant positive
moderating effect of controlling shareholders‘ ownership on the relationship between
RPTs which are likely to result in expropriation, independent directors‘ tenure and the
number of domestic banks that the firm engages with, and firm value in Malaysian
firms.
The regression results show that there is a significant positive moderating effect of
controlling shareholders‘ ownership on the relationship between RPTs which are likely
to result in expropriation and firm value (market-based measures i.e. Tobin‘s Q and
MBV) in Malaysian family firms only. In Malaysian non-family firms, there is a
significant negative moderating effect of controlling shareholders‘ ownership on the
relationship between RPTs which are likely to result in expropriation and firm value for
market-based performance measure only (Tobin‘s Q). In addition, there is also a
significant positive moderating effect of controlling shareholders‘ ownership on the
relationship between independent directors‘ tenure and firm value (on market-based
performance measures i.e. MBV) in Malaysian family firms within exclusive industries
or biased industries only. In Malaysian family firms within non-exclusive industries or

261
without biased industries, there is no significant moderating effect of controlling
shareholders‘ ownership on the relationship between average independent directors‘
tenure and firm value for both market-based and accounting-based performance
measures. On the other hand, in Malaysian non-family firms, there is inconclusive
evidence on the moderating effect of controlling shareholders‘ ownership on the
relationship between average independent directors‘ tenure and firm value. For market-
based performance measures (Tobin‘s Q), there is a significant positive moderating
effect whereas for accounting-based performance measures (ROA), there is a significant
negative moderating effect.
Furthermore, there is no significant moderating effect of controlling shareholders‘
ownership on the relationship between the number of domestic banks that the firm
engages with and firm value for both market-based performance and accounting-based
performance measures in Malaysian family firms. However, for Malaysian non-family
firms, there is a significant negative moderating effect of controlling shareholders‘
ownership on this relationship on market-based performance measure (Tobin‘s Q).

262
7.2.4 Research Objective 4: To Examine Whether, If There Is A Positive
Moderating Effect Of Controlling Shareholders’ Ownership On The Relationship
Between Related Party Transactions (RPTs) Which Are Likely To Result In
Expropriation, Independent Directors’ Tenure And The Number Of Domestic
Banks That The Firm Engages With, And firm value In Malaysian Firms; This
Positive Moderating Effect Is Stronger In Family Firms Compared To Non-Family
Firms.
The fourth research objective is to examine whether, if there is a significant positive
moderating effect of controlling shareholders‘ ownership on the relationship between
RPTs which are likely to result in expropriation, independent directors‘ tenure and the
number of domestic banks that the firm engages with, and firm value in Malaysian
firms; this positive moderating effect is stronger in family firms compared to non-
family firms.
The research results shows that the significant positive moderating effect of controlling
shareholders‘ ownership on the relationship between RPTs which are likely to result in
expropriation and firm value (market-based measures i.e. Tobin‘s Q and MBV) is
stronger in Malaysian family firms compared to non-family firms. However, it cannot
be proven whether the positive moderating effect of controlling shareholders‘ ownership
on the relationship between average independent directors‘ tenure and firm value
(market-based measure i.e. Tobin‘s Q and MBV) is stronger in family firms compared
to non-family firms.
263
7.3 IMPLICATIONS OF FINDINGS
This study examines the effects of RPTs which are likely to result in expropriation,
independent directors‘ tenure and the quantity of domestic banks that the firm engages
with in Malaysian firms and their impact upon firm value and whether these firm value
effects are moderated by the controlling shareholder‘s ownership concentration. A
comparison is also made on whether the resulting negative relationship (if any) and the
resulting positive moderating effect (if any) is stronger in family firms compared to
non-family firms. This comparison is made as the extant literature only provides limited
empirical evidence as to whether expropriation is more prevalent in family firms or non-
family firms in the context of the Malaysian institutional setting.
Basically, the findings in this research expand the findings by Chrisman, Chua, Chang
and Kellermanns (2007) and Schulze et.al. (2001) that agency problems, specifically,
Agency Problem Type II (Principal-principal conflict) is present not only within family
firms but also in non-family firms. For family firms, this is evidenced by the significant
negative relationship between RPTs which are likely to result in expropriation and firm
value as well between average independent directors‘ tenure and firm value in family
firms. For non-family firms, this is evidenced by the significant negative moderating
effect of controlling shareholders‘ ownership on the relationship between RPTs which
are likely to result in expropriation and firm value as well as the significant negative
moderating effect of controlling shareholders‘ ownership on the relationship between
the number of domestic banks that the firm engages with and firm value in non-family
firms.
264
However, the findings also reveal that minority shareholder expropriation through RPTs
is more prominent in Malaysian family firms compared to non-family firms. This
possibly indirectly suggests that Agency Problem Type II (Principal-principal conflict)
is more severe in family firms compared to non-family firms within the Malaysian
context. Hence, attention on minority shareholder expropriation problems particularly
via RPTs in Malaysia ought to focus more on family firms rather than non-family firms.
Additionally, the positive relationship between ownership concentration and firm value
in Malaysian family firms as well as in the pooled model (family and non-family firms)
supports the argument by Heugens et.al. (2009) that increased controlling shareholders‘
ownership increases firm value within Asian emerging markets.
Likewise, there is a significant negative relationship between independent directors‘
tenure and firm value within Malaysian family firms in exclusive industries only. This
significant negative relationship possibly indirectly suggests that Malaysian family
firms in exclusive industries may encounter less market competition and as a result,
their independent directors are less concerned in evaluating the performance of their
CEOs (Young, Stedham and Beekun, 2000). This provide opportunities for family
controlling shareholders to increase their influences on the independent directors as they
serve longer on the board, through their CEOs who are basically hired by them; and
ultimately increase their level of expropriation. This reduces firm value. However, from
the research results, it cannot be proven whether expropriation due to the long tenure of
independent directors is stronger in family firms compared to non-family firms within
the context of the Malaysian institutional setting. Hence, attention on minority
shareholder expropriation problems particularly due to long tenure of independent
directors in Malaysia should focus on family firms as well as non-family firms.

265
Furthermore, the number of domestic banks that the firm engages with increases firm
value in Malaysian non-family firms. On the other hand, there is no significant minority
shareholder expropriation through the domestic banking channel in family firms. The
reason for the result differences could possibly be due to the credit crunch experienced
by emerging markets such as Malaysia during the global financial crisis which reduced
the level of domestic bank lending (Cetorelli and Golberg, 2010; Claessens et.al., 2010;
Tong and Wei, 2011). The findings in this study further suggests that this reduction of
domestic bank lending could possibly be targeted more at family firms compared to
non-family firms. This could occur as family firms may possibly be perceived by
domestic banks as possessing higher credit risks compared to non-family firms for loan
transactions. Non-family firms are perceived to have lower credit risks compared to
family firms possibly because non-family firms such as state-owned firms are very
likely to be bailed out by the government in the event of financial distress (Dewenter
and Malatesta, 2001).
In addition, non-family firms such as foreign-owned firms in Malaysia are mostly
multinationals which possess larger assets in their balance sheets (Grauwe and
Camerman, 2002) to serve as loan collaterals compared to local family firms and thus,
they are perceived to have lower credit risks (Ma, Ma and Tian, 2012) compared to
family firms. As a result of the different credit risk perception on Malaysian family and
non-family firms, domestic bank lending is severely reduced during the credit crunch
towards family firms. Consequently, family controlling shareholders have less
opportunities to expropriate the domestic bank loans that their firms undertake which
result in the insignificant minority shareholder expropriation through the domestic
banking channel in family firms.

266
On the other hand, with little reduction of domestic bank loans to Malaysian non-family
firms, these firms are able to use these loans productively to add value to the firm as
what the results suggested. This shows that generally, controlling shareholders in non-
family firms do not expropriate the domestic loans that their firms undertake but
instead, use it productively to add value to the firm. However, large controlling
shareholders in non-family firms such as state-owned firms or government-linked
companies (GLCs), expropriate the loans that their firms obtained from domestic banks
as the results show that in non-family firms, there is a significant negative moderating
effect of controlling shareholders‘ ownership on the relationship between the number of
domestic banks that the firm engages with and firm value.
Likewise, the results also show that in non-family firms in exclusive industries or biased
industries, there is a significant negative moderating effect of controlling shareholders‘
ownership on the relationship between RPTs which are likely to result in expropriation
and firm value which possibly suggests that in large non-family firms such as state-
owned firms or government-linked companies (GLCs), controlling shareholders
expropriate minority shareholders through the usage of RPTs. It also suggests that in
these large non-family firms; similar to the explanation earlier, due to lower market
competition, independent directors in these firms may be less commited to evaluate the
performance of their CEOs, hence, providing opportunities for controlling shareholders
to expropriate minority shareholders through RPTs. All these findings are consistent
with the findings of Bushman, Piotroski and Smith (2004) and Bushman and Piotroski
(2006) who found that firms with higher state ownership have lower financial reporting
practices which imply that they are likely to be involved in minority shareholder
expropriation.

267
In addition, the significant positive moderating effects of controlling shareholders‘
ownership on the relationship between RPTs which are likely to result in expropriation
and firm value in family firms as well as the significant positive moderating effects of
controlling shareholders‘ ownership on the relationship between average independent
directors‘ tenure and firm value in family firms in exclusive industries only; suggests
the influence of family firm reputational effects in the post-Transmile period in
encouraging large family controlling shareholders to reduce their expropriation of
minority shareholders through RPTs and as well as to reduce their expropriation due to
long tenure of independent directors (for family firms in exclusive industries only).
Furthermore, the significant positive moderating effect of controlling shareholders‘
ownership on the relationship between RPTs which are likely to result in expropriation
and firm value is stronger in family firms compared to non-family firms. This suggests
that the corporate reputational effects due to the Transmile fiasco is stronger in family
firms compared to non-family firms. Since corporate reputational effects is stronger in
family firms compared to non-family firms, it also follows that indirectly, Agency
Problem Type II (Principal-principal conflict) can be considered to be more severe in
family firms compared to non-family firms.
In addition, there are numerous anomalies in the research findings which constitute part
of the limitations of this study. First, in Malaysian family firms, the statistically
significant negative relationship between RPTs which are likely to result in
expropriation and firm value as well as the significant positive moderating effect of
controlling shareholders‘ ownership on this relationship are restricted to market-based
performance measures i.e. Tobin‘s Q and MBV and not accounting-based performance
measures. However, the negative significant moderating effect of controlling
shareholders‘ ownership on this relationship in non-family firms is also only restricted
to market-based performance measure (i.e. Tobin‘s Q).

268
Second, in the family firm in exclusive industries or in biased industries, ownership
concentration has a positive relationship with firm value but it is restricted to
accounting-based performance measures only (ROA). However, in non-family firms in
exclusive industries or in biased industries, ownership concentration has a positive
relationship with firm value but it is restricted to market-based performance measures
only (MBV). On the other hand, in non-family firms in non-exlusive industries or
without biased industries, there are contradictory results on the relationship between
ownership concentration and market-based performance measures. Ownership
concentration has a significant negative relationship with firm value for Tobin‘s Q
where as ownership concentration has a significant positive relationship with MBV.
Likewise, in the pooled model (family and non-family firms) in non-exclusive
industries or without biased industries, ownership concentration has a positive
relationship with firm value for market-based performance measures only (i.e. MBV).
Third, in Malaysian family firms within exclusive or biased industries, the significant
negative relationship between average independent directors‘ tenure and firm value as
well as the positive moderating effect of controlling shareholders‘ ownership on this
relationship are also restricted to market-based performance measures i.e. MBV.
Fourth, in Malaysian non-family firms and in the pooled model (family and non-family
firms), there is inconclusive evidence i.e. contradictory results whereby there is a
significant negative relationship between average independent directors‘ tenure and firm
value for market-based performance measures (i.e. Tobin‘s Q) but a significant positive
relationship between average independent directors‘ tenure and firm value for
accounting-based performance measures (i.e. ROA and ROE).

269
Fifth, in Malaysian non-family firms, the significant positive relationship between the
number of domestic banks that the firm engages with and firm value is restricted for
market-based performance measures (i.e. Tobin‘s Q) whereas in the pooled model
(family and non-family firms), the significant negative relationship between the number
of domestic banks that the firm engages with and firm value is restricted for accounting-
based performance measures (i.e. ROA).
Sixth, in Malaysian non-family firms, the moderating effect of controlling shareholders‘
ownership on the relationship between the number of domestic banks that the firm
engages with and firm value is restricted to market-based performance measures only
(Tobin‘s Q).
Seventh, in the pooled model (family and non-family firms), there are contradictory
results for the moderating effects of controlling shareholders‘ ownership on the
relationship between the number of domestic banks that the firm engages with and firm
value. For the negative moderating effect is on market-based performance measure
(MBV) whereas the positive moderating effect is on accounting-based performance
measure (ROA).
Eigth, in Malaysian family firms and the pooled model (family and non-family firms)
there are contradictory results in the relationship between leverage and firm value
whereby leverage has a significant positive relationship with market-based performance
measures (Tobin‘s Q) but a significant negative relationship with accounting-based
performance measures (ROE and ROA). However, for non-family firms, leverage
increases firm value and this is restricted to market-based performance measures only
(MBV).

270
Nineth, in Malaysian family firms and in the pooled model (family and non-family
firms), there are contradictory results in the relationship between firm size and firm
value whereby there is a significant negative relationship with market-based
performance measures (Tobin‘s Q) but a significant positive relationship with
accounting-based performance measures (ROA).
Tenth, in Malaysian family firms and in the pooled model (family and non-family
firms), non-affiliated blockholders have a siginificant negative relationship with firm
value but it is restricted to market-based performance measures only (Tobin‘s Q and
MBV).
Eleventh, in Malaysian family firms and in the pooled model (family and non-family
firms) in non-exclusive industries or without biased industries, firm age has a significant
negative relationship with firm value but this is restricted to accounting-based
performance measures (i.e. ROA) only.
Twelveth, in Malaysian family firms, non-family firms and in the pooled model (family
and non-family firms), sales growth has a significant positive relationship with firm
value but this is restricted to accounting-based performance measures (ROA) only.
Thirteenth, in Malaysian family firms in non-exclusive industries or without biased
industries, marketing & advertising expenditures have a significant negative
relationship with firm value but this is restricted to accounting-based performance
measures (ROA) only.
Fourteenth, in Malaysian family firms in exclusive industries or with biased industries,
GDP has a significant positive relationship with firm value but this is restricted to only
accounting-based performance measures (i.e. ROE and ROA). However, in Malaysian
family firms in non-exclusive industries or without biased industries; there are
contradictory results in the relationship between GDP and firm value whereby there is a

271
significant negative relationship with market-based performance measures (MBV) but a
significant positive relationship with accounting-based performance measures (ROE
and ROA). Moreover, in non-family firms, the significant negative relationship between
GDP and firm value is restricted to accounting-based performance measures only
(ROE). Likewise, for the pooled model (family and non-family firms), there are
contradictory results in the relationship between GDP and firm value whereby GDP has
a significant negative relationship with market-based performance measures (MBV) but
a significant positive relationship with accounting-based performance measures (ROA).
From the research findings‘ anomalies, the restrictions of the research results to certain
type of performance measures i.e. market-based or accounting-based performance
measures as well as the contradictory research results between accounting-based and
market-based performance measures possibly suggests that the market-based and
accounting-based performance measures have different susceptibility to management
manipulation23
. Generally, market-based performance measures are less susceptible to
management manipulation compared to accounting-based performance measures
(McGuire, Schneeweis and Branch, 1990) possibly because market-based performance
measures reflect shareholder valuation of the firm as well as both current firm
performance and future growth potential (Woo, Willard and Daellenbach, 1992).
In contrast, accounting-based performance measures are more susceptible to
management manipulation (Chakravarthy, 1986; Lubatkin and Shrieves, 1986;
Purkayastha, 2013) because these performance measures are more oriented towards
historical information (Chakravarthy, 1986; Purkayastha, 2013). Generally, accounting-
based performance measures encounter problems related to accounting manipulation,
23
Likewise, the contradictory research results in the market-based performance measures in non-family firms in
non-exclusive or without biased industries on the relationship between ownership concentration and market-based performance measures suggests that the differences could be due to the specification of ownership concentration. This is because for Tobin’s Q, predicted ownership concentration which is a function of firm risk and firm size is used whereas for MBV, ownership concentration is used.

272
asset undervaluation, distortion due to depreciation policies, inventory valuation and
treatment of certain revenue and expenditure items, differences in methods of
consolidating accounts and differences due to lack of standardisation in international
accounting conventions (Chakravarthy, 1986).
As a consequence of these problems, it can be observed in this study that there is a
higher sensitivity of market-based performance measures towards Agency Problem
Type II (principal-principal conflict) as evidenced by the significant negative
relationship between RPTs which are like to result in expropriation and market-based
performance measure (Tobin‘s Q and MBV), the significant negative relationship
between average independent directors‘ tenure and market-based performance measure
(MBV), the significant negative moderating effect of controlling shareholders‘
ownership on the relationship between RPTs which are like to result in expropriation
and market-based performance measure (Tobin‘s Q and MBV) and the significant
negative moderating effect of controlling shareholders‘ ownership on the relationship
between the number of domestic banks that the firm engages with and market-based
performance measure (Tobin‘s Q). The higher sensitivity of market-based performance
measures towards Agency Problem Type II (principal-principal conflict) is consistent
with the finding by Mollah, Farooque and Karim (2012) who find that shareholders in
emerging markets use their discretion where necessary to discount the market valuations
of firms if they have a negative perception of firms‘ performances and they are less
attracted to accounting-based performance measures which are prone to accounting
manipulations.
Likewise, as a result of the problems in accounting-based performance measures, it can
also be observed in this study that there are numerous contradictory significant results
between accounting-based and market-based performance measures. The contradictory
research results in this study will not be taken into consideration as part of the

273
significant findings in this research because the type of research that is conducted in this
study is conclusive research. To confirm the hypotheses that are tested in this research
requires either conclusive evidence in both accounting-based and market-based
performance measures or conclusive evidence which is restricted to only market-based
or accounting-based performance measure (Saunders, Lewis and Thornhill, 2009;
Singh, 2007). Therefore, only conclusive evidences whether they are robust against all
the performance measures utilised in this study or only restricted to one particular
performance measure in this study are accepted as significant findings for this type of
research.
Overall, after considering the limitations of this research; the basic implication of the
findings of this study is that this research indicates that minority shareholder
expropriation does exist within Malaysian family and non-family firms. On the other
hand, reputational effects in the aftermath of the Transmile case help to reduce minority
shareholder expropriation in family firms by encouraging family controlling
shareholders to reduce their expropriation through RPTs and as well as encouraging
them to exert less influence upon independent directors as the latter‘s tenure increases,
thus, reducing their level of expropriation.
Lastly, the research results in this study can possibly dispute the argument by Peng and
Jiang (2010) that reputational effects is a poor substitute for institutional deficiencies
such as low minority shareholder rights protection particularly in emerging markets
such as Malaysia because the research results show that these effects are able to reduce
minority shareholder expropriation.

274
7.4 RESEARCH SIGNIFICANCE
7.4.1 Theoretical Contributions
There are several theoretical contributions of this research.
First, the comparisons conducted in this study with the objectives of assessing whether
expropriation as well as the moderating effects of controlling shareholders‘ ownership
on expropriation, are more prevalent in Malaysian family firms or non-family firms are
necessary because according to agency theory, principal-principal conflict (i.e. minority
shareholder expropriation) may be more prevalent in family firms compared to non-
family firms (Fama and Jensen, 1983b; Shleifer and Vishny, 1997). Furthermore, the
likelihood of this conflict occurring is highest during periods of financial crisis (Jiang
and Peng, 2011; Johnson et.al., 2000a; Mitton, 2002; Young et.al., 2008). However,
corporate reputational effects may also help mitigate this conflict (Gomes, 2000;
Claessens and Fan, 2002; Khanna and Palepu, 2000; Khanna and Yafeh, 2007).
To conduct the comparisons in this research, the periods of analysis chosen is between
2007 and 2009. During this period, two major events affect Malaysia, namely, the
Transmile fiasco in 2007 which induced corporate reputational effects particularly in
family firms (Song, 2010), as well as the global financial crisis which started in 2008.
The comparisons conducted in this study provide a new perspective to agency theory as
the extant literature have not empirically examined the interplay between agency theory
(with respect to principal-principal conflict), corporate reputational effects and financial
crisis within a single analysis i.e. the effects of minority shareholder expropriation on
firm value during a period where corporate reputational effects as well as financial crisis
exist and they may influence this relationship.

275
Since periods of financial crisis aggravates minority shareholder expropriation whereas
corporate reputational effects help mitigate this problem, the existence of these
opposing forces simultaneously may generate a particular outcome on the relationship
between minority shareholder expropriation and firm value. Hence, this provides a new
perspective to agency theory (with respect to principal-principal conflict) as previous
studies have only discussed or examined the interplay between agency theory (with
respect to principal-principal conflict) and corporate reputational effects (i.e. the impact
of corporate reputational effects on minority shareholder expropriation) (Gomes, 2000;
Khanna and Palepu, 2000 and Khanna and Yafeh, 2007) as well as between agency
theory (with respect to principal-principal conflict) and financial crisis (i.e. the extent of
minority shareholder expropriation during periods of financial crisis) (Jiang and Peng,
2011; Johnson et.al., 2000a; Mitton, 2002; Young et.al., 2008). As such, this study
provides a new perspective to agency theory (with respect to principal-principal
conflict) by showing that corporate reputational effects help mitigate minority
shareholder expropriation during periods of financial crisis through the positive
moderating effects of controlling shareholders‘ ownership. In addition to that, the
finding that expropriation through RPTs is more prevalent in emerging market firms
such as Malaysian family firms also supports the contingency approach towards RPTs
as proposed by Pizzo (2011) as discussed in Chapter 3. Consistent with this theory,
expropriation through RPTs is more prevalent in firms located in emerging markets
where the level of investor protection is lower as this encourages expropriation.
Secondly, by examining the relationship between independent directors‘ tenures and
firm value; this research contributes to the corporate governance literature as it
empirically examines certain assumptions of agency theory (with respect to principal-
principal conflict). Based upon agency theory (with respect to principal-principal
conflict), independent directors who are basically outside directors without family or

276
business ties to the firm are presumed to be able to impartially provide checks and
balances to board decision-making as well as to evaluate top management. It is also
assumed that they are less likely to be influenced by the controlling shareholder through
the CEO24
(Fama and Jensen, 1983b). However, whether these assumptions still hold in
emerging markets is yet to be investigated. In this research, the significant negative
relationship between independent directors‘ tenure and firm value in family firms (in
exclusive industries only) shows that the assumptions of agency theory (with respect to
principal-principal conflict) with regards to the effectiveness and ―true independence‘ of
independent directors; do not hold within family firms in exclusive industries in
emerging markets such as Malaysia. This provides a new perspective to agency theory
(with respect to principal-principal conflict), hence, making a theoretical contribution.
This result also proves that the managerial hegemony theory as discussed in Chapter 2
is applicable in the Malaysian context within family firms in exclusive industries. This
is because it is proven that the management of family firms in exclusive industries do
exert their influence upon the independent directors as the latter‘s tenure increases as
shown by the significant negative relationship between average independent directors‘
tenure and firm value in these firms.
Thirdly, by examining the moderating effects of controlling shareholders‘ ownership on
the relationship between RPTs which are likely to result in expropriation, independent
directors‘ tenure as well as the number of domestic banks that the firm engages with,
and firm value; this research extends the existing theory of ownership structure by
providing robust empirical evidence on how controlling shareholders‘ ownership
influences expropriation within firms. The findings that there is a significant positive
moderating effect of controlling shareholders‘ ownership on the relationship between
RPTs which are likely to result in expropriation and firm value as well as between
24
The CEO is usually someone hired by the controlling shareholder and he is supportive of the latter (Peng and Jiang, 2010).
277
average independent directors‘ tenure and firm value in Malaysian family firms shows
that controlling shareholders‘ ownership can indeed mitigate expropriation via RPTs as
well as reduce expropriation due to long tenure of independent directors in family firms.
On the other hand, the findings that there is a significant negative moderating effect of
controlling shareholders‘ ownership on the relationship between RPTs which are likely
to result in expropriation and firm value as well as between the number of domestic
banks that the firm engages with and firm value in Malaysian non-family firms suggest
that large controlling shareholders in non-family firms are likely to be involved in
minority shareholder expropriation. All these findings contribute to the theory of
ownership structure.
Aside from theoretical contributions, there are also policy implications of this research.
7.4.2 Policy Implications
There are several policy implications of this research.
Firstly, the significant negative relationship between RPTs which are likely to result in
expropriation (in family firms) and average independent directors‘ tenure (in family
firms in exclusive industries only) against firm value as well as the significant negative
moderating effect of controlling shareholders‘ ownership on the relationship between
RPTs which are likely to result in expropriation and firm value and between the number
of domestic banks that the firm engages with and firm value in Malaysian non-family
firms; indicate to the Securities Commission (SC) that minority shareholder
expropriation do exist within Malaysian public-listed family and non-family firms. As
such, the SC should re-evaluate Part 8, Para. 8.1-8.3 of the Malaysian Code of
Corporate Governance (MCCG) 2012 so that in the future, it can improve the codes of
corporate governance. Currently, through these provisions, MCCG 2012 does not
include protection of minority shareholder rights. Protection of minority shareholders‘

278
rights would be able to strengthen the relationship between the firm and shareholders as
it encourages minority shareholders to be more proactive in the firm‘s decision-making
(La Porta et.al., 1997, 1998; Qian and Zhao, 2011). This is consistent with the
objectives of Part 8, MCCG 2012. Protection of minority shareholders‘ rights is also
important as it is part of the objectives of the Malaysian Capital Market Master Plan
(CMP) issued in 2001 (Shim, 2006). Hence, if the SC issues codes of corporate
governance in the future, it should include protection of minority shareholder rights as
part of its objectives in improving corporate governance.
Secondly, the significant negative relationship between independent directors‘ tenure
and firm value as found in family firms in exclusive industries only, suggests that the
recommendation in MCCG 201225
which limits the independent directors‘ tenure to a
maximum of nine years is applicable and should be continued. This recommendation
should particularly target family firms in exclusive industries only as shown by the
research results. The reason is because the research results show that long tenure of the
independent directors reduces firm value in this type of family firms.
Thirdly, the Central Bank should evaluate the bank-directed lending policy which is still
prevalent in Malaysia (Ang, 2009; Ang and Sen, 2011) particularly to politically-
connected (Boubakri, Cosset and Saffar, 2009) large non-family firms which have easy
access to bank-directed lending (Ang, 2009; Ang and Sen, 2011), as the results show
that there is a significant negative moderating effect of controlling shareholders‘
ownership on the relationship between the number of domestic banks that the firm
engages with and firm value in non-family firms. Bank-directed lending policies
provide opportunities for controlling shareholders to expropriate the loans they obtain
from the domestic banks, as debt provide incentives for expropriation in emerging
markets (Faccio et.al., 2001c).
25
Part 3, Para.3.3.

279
7.5 LIMITATIONS OF RESEARCH
There are two limitations of this research.
First, the credit crunch which occurs during the global financial crisis in emerging
markets such as Malaysia (Cetorelli and Golberg, 2010; Claessens et.al., 2010; Tong
and Wei, 2011) might be the reason for the existence of insignificant results in family
firms in the relationship between the number of domestic banks that the firm engages
with and firm value as well as the moderating effects of controlling shareholders‘
ownership on this relationship. As explained earlier in this chapter, the credit crunch
could have resulted in the reduction of domestic bank-lending to family firms. Hence,
this reduced the level of domestic loan expropriation by family controlling shareholders
during the period of study. Therefore, it is difficult to obtain significant results in the
analysis of minority shareholder expropriation through the domestic banking channel in
family firms during this period. Similarly, due to the credit crunch, it is also difficult to
achieve significant results in the analysis of the moderating effect of controlling
shareholders‘ ownership on this relationship as there is not much expropriation which
they can reduce through the domestic banking channel as their ownership increase as a
result of corporate reputational effects of the Transmile case. Basically, the credit
crunch have inhibited the achievement of significant results in the relationship between
the number of domestic banks that the firm engages with and firm value in Malaysian
family firms as well as in the moderating effects of controlling shareholders‘ ownership
on this relationship, which, otherwise, could possibly have been achieved.
Second, the significant research results related to the hypotheses as found in this study
are mainly restricted to market-based measures only. This shows that the market-based
performance measures are more sensitive to Agency Problem Type II (principal-
principal conflict). This occurs possibly because accounting-based performance

280
measures in this study may be subject to management manipulation (Chakravarthy,
1986; Lubatkin and Shrieves, 1986; Purkayastha, 2013). Hence, a true and unbiased
comprehensive research results encompassing both market-based and accounting-based
performance measures could not be entirely achieved in this study. Therefore, the
significant results obtained in this study ought to be viewed within the context of the
limitations of the research results whereby the accounting-based performance measures
may be subject to management manipulation which resulted in contradictory research
findings as well as results which are restricted to only one type of performance measure.
Third, there is an element of survivorship bias in this research as firms in the sample are
obtained with the condition that the company have survived the entire period of
analysis. In addition, firms which are listed after 31st December, 2007 or delisted from
the Main Market are excluded from the sample. Hence, this survivorship bias inhibits a
more complete sample from being utilised in this research. If there is no such inhibition,
a better and clearer research results could have been achieved with a larger sample size.
7.6 SUGGESTIONS FOR FUTURE RESEARCH
There are four suggestions for future research.
First, future research could analyse the relationship between the number of domestic
banks that the firm engages with and firm value in Malaysian family firms during a
period without credit crunch. This will provide a clearer picture as to whether minority
shareholder expropriation through the domestic banking channel does occur among
Malaysian family firms. Similarly, a comparison of minority shareholder expropriation
through the domestic banking channel between family and non-family firms during
periods without credit crunch could also provide a clearer picture as to whether
expropriation through the domestic banking channel (if any) is stronger in family firms
or non-family firms.
281
Second, future research could analyse why long tenure of independent directors reduces
firm value only in Malaysian family firms in exclusive industries and not in Malaysian
family firms in non-exclusive industries as well as why controlling shareholders with
high equity stakes in large non-family firms in exclusive industries or biased industries
negatively moderates the firm value effects of RPTs. As explained earlier, this may
possibly be due to lower market competition encountered by these firms in exclusive
industries which result in less job commitment of their independent directors, and
ultimately result in minority shareholder expropriation through RPTs as well as due to
the long tenure of these directors. However, there is still limited direct empirical
evidence on these issues. Future research could provide more empirical evidence on
these issues in an in-depth manner.
Third, future studies on minority shareholder expropriation which analyse firm value
effects should utilise performance measures which are less subject to management
manipulation such as market-based performance measures (McGuire et.al., 1990). This
will reduce the distortions in the research results which could yield a more unbiased
research findings.
Lastly, future research can compare whether minority shareholder expropriation is
higher during the period 2007-2009 (whereby the global financial crisis and the
Transmile corporate reputational effects prevail) or during the pre-2007 period within
the context of the Malaysian institutional setting. This future study is interesting as the
extant literature only provide limited empirical evidence on this issue. Future research
can also examine minority shareholder expropriation using monthly or annual buy and
hold stock returns as part of the market-based performance measures at it is a better
measure of firm value (which is more aligned to shareholder objectives).

282
7.7 CONCLUSION
Basically this chapter discuss the conclusions drawn from the research results from the
previous chapter. It also discuss the implications of the findings, research significance,
limitations as well as suggestions for future research.
With consideration of the limitations of this study, generally, the findings in this
research shows that Agency Problem Type II (principal-principal conflict) exist within
Malaysian family and non-family firms. However, minority shareholder expropriation
through RPTs is found to be more prominent in family firms compared to non-family
firms. In addition, the reduction in firm value due to long tenure of independent
directors within family firms in exclusive industries shows that in this type of firms,
longer tenure of independent directors is detrimental to the interests of minority
shareholders as family controlling shareholders could exert more influence on these
directors as their tenure increase, thus, reducing their true independence and increasing
minority shareholder expropriation.
On the other hand, the positive moderating effect of family controlling shareholders‘
ownership on the relationship between RPTs which are likely to result in expropriation
and firm value as well as between average independent directors‘ tenure and firm value
suggests that family firm reputational effects is able to reduce minority shareholder
expropriation in Malaysian family firms, particularly in the aftermath of the Transmile
fiasco. Vice versa, the negative moderating effects of non-family controlling
shareholders‘ ownership on the relationship between RPTs which are likely to result in
expropriation and firm value and between the number of domestic banks that the firm
engages with and firm value in Malaysian non-family firms; suggests that controlling
shareholders with high equity stakes in large non-family firms might be involved in

283
minority shareholder expropriation through RPTs as well as through the domestic
banking channel.
Hence, all these brings into dispute the argument by Peng and Jiang (2010) that
reputational effects is a poor substitute for institutional deficiencies in emerging markets
such as Malaysia.

284
8.0 REFERENCES
Abdelsalam, O., El-Masry, A. (2008). The impact of board independence and ownership
structure on the timeliness of corporate internet reporting of Irish-listed
companies. Managerial Finance, 34(12), 907-918.
Abdullah, S. N. (2004). Board composition, CEO duality and performance among
Malaysian listed companies. Corporate Governance, 4(4), 47-61.
Abdullah, S. N. (2006). Board structure and ownership in Malaysia: The case of
distressed listed companies. Corporate Governance, 6(5), 582-594.
Abdullah, S. N., Yusof, N. Z. M., & Nor, M. N. M. (2010). Financial restatements and
corporate governance among Malaysian listed companies. Managerial Auditing
Journal, 25(6), 526-552.
ACGA. (2012a). ACGA. Retrieved 2012, 4th November, from http://www.acga-
asia.org/content.cfm?SITE_CONTENT_TYPE_ID=21
ACGA. (2012b). CG watch 2012: Market rankings. Retrieved 4th November, 2012,
from http://www.fide.org.my/file/CGAsia2012.pdf
Agrawal, A., and Knoeber, C. R. (1996). Firm performance and mechanisms to control
agency problems between managers and shareholders. The Journal of Financial
and Quantitative Analysis, 31(3), 377-397.
Aguilera, R. V., and Crespi-Cladera, R. (2012). Firm family firms: Current debates of
corporate governance in family firms. Journal of Family Business Strategy, 3(2),
66-69.
Aguilera, R. V., & Cuervo-Cazurra, A. (2009). Codes of good governance. Corporate
Governance: An International Review, 17(3), 376-387.
Aharony, J., Yuan, H., & Wang, J. (2005). Related party transactions : A "real" means
of earnings management and tunneling during the IPO process in China.
Working Paper. Singapore Management University.
Ahlstrom, D., Chen, S.-J., & Yeh, K. S. (2010). Managing in ethnic Chinese
communities : Culture, institutions and context. Asia Pacific Journal of
Management, 27(3), 341-354.
Ahn, S., & Choi, W. (2009). The role of bank monitoring in corporate governance:
Evidence from borrowers' earnings management behavior. Journal of Banking &
Finance, 33(2), 425-434.
Akerlof, G. A. (1982). Labor contracts as partial gift exchange. The Quarterly Journal
of Economics, 97(4), 543-569.
Alcorn, P. B. (1982). Success and survival in the family-owned firm. New York:
McGraw-Hill.

285
Almeida, H. V., & Wolfenzon, D. (2006). A theory of pyramidal ownership and family
business groups. The Journal of Finance, 61(6), 2637-2680.
Amzaleg, Y., Barak, R. (2013). Ownership concentration and the value effect of related
party transactions (RPTs). Journal of Modern Accounting and Auditing, 9(2),
239-255.
Anderson, E. W., Fornell, C., & Mazvancheryl, S. K. (2004). Customer satisfaction and
shareholder value. Journal of Marketing, 68(4), 172-185.
Anderson, R. C., Mansi, S. A., and Reeb, D. M. (2004). Board characteristics,
accounting report integrity, and the cost of debt. Journal of Accounting and
Economics, 37(3), 315-342.
Anderson, R. C., and Reeb, D. M. (2003). Founding-family ownership and firm
performance: Evidence from the S&P 500. The Journal of Finance, 58(3), 1301-
1328.
Andres, C. (2008). Large shareholders and firm performance--An empirical examination
of founding-family ownership. Journal of Corporate Finance, 14(4), 431-445.
Ang, J. B. (2009). Private investment and financial sector policies in India and
Malaysia. World Development, 37(7), 1261-1273.
Ang, J. S., Cole, R. A., & Lin, J. W. (2000). Agency costs and ownership structure. The
Journal of Finance, 55(1), 81-106.
Ang, J., & Sen, K. (2011). Private saving in India and Malaysia compared: The roles of
financial liberalization and expected pension benefits. Empirical Economics,
41(2), 247-267.
Angelini, P., Di Salvo, R., & Ferri, G. (1998). Availability and cost of credit for small
businesses : Customer relationships and credit co-operatives. Journal of Banking
& Finance, 22(6-8), 925-954.
Antunovich, P., Laster, D., & Mitnick, S. (2000). Are high-quality firms also high-
quality investments? Current Issues in Economics & Finance, 6(1), 1.
Ardalan, K. (2007). Corporate governance: A paradigmatic outlook. International
Journal of Social Economics, 34(8), 506-524.
Ariffin, A. N. B. (2009). Pyramidal ownership structure and agency problem: Theory
and evidence. Integration & Dissemination, 4(March), 9-18.
Arosa, B., Iturralde, T., & Maseda, A. (2010). Ownership structure and firm
performance in non-listed firms: Evidence from Spain. Journal of Family
Business Strategy, 1(2), 88-96.
Arregle, J.-L., Hitt, M. A., Sirmon, D. G., & Very, P. (2007). The development of
organizational social capital: Attributes of family firms. Journal of Management
Studies, 44(1), 73-95.

286
Arthurs, J. D., Hoskisson, R. E., Busenitz, L. W., & Johnson, R. A. (2008). Managerial
agents watching other agents: Multiple agency conflicts regarding underpricing
in IPO firms. Academy of Management Journal, 51(2), 277-294.
Asian Corporate Governance Association (2012). Library - Codes and rules - Malaysia.
Retrieved 10th June, 2012, from http://www.acga-
asia.org/content.cfm?SITE_CONTENT_TYPE_ID=12andCOUNTRY_ID=294
Atanasov, V. (2005). How much value can blockholders tunnel? Evidence from the
Bulgarian mass privatization auctions. Journal of Financial Economics, 76(1),
191-234.
Atanasov, V., Black, B., & Ciccotello, C. S. (2008). Unbundling and measuring
tunnelling. Law and Economics Working Paper No. 117. School of Law,
University of Texas, Austin.
Atanasov, V., Boone, A., and Haushalter, D. (2010). Is there shareholder expropriation
in the United States? An analysis of publicly traded subsidiaries. The Journal of
Financial and Quantitative Analysis, 45(1), 1-26.
Ayoib, C. A., Zuaini, I., & Nor Aziah, A. M. (2003). Corporate governance, ownership
structure and corporate diversification : Evidence from Malaysian listed
companies. Asian Academy of Management Journal 8(2), 67-89.
Azizan, S. S., & Ameer, R. (2012). Shareholder activism in family-controlled firms in
Malaysia. Managerial Auditing Journal, 27(8), 774-794.
Backman, M. (2001). Asian eclipse : Exposing the dark side of business in Asia.
Singapore: John Wiley & Sons.
Bae, K. H., Kang, J. K., & Kim, J. M. (2002). Tunneling or value added? Evidence from
mergers by Korean business groups. The Journal of Finance, 57(6), 2695-2740
Ball, R., Robin, A., & Wu, J. S. (2003). Incentives versus standards: Properties of
accounting income in four East Asian countries. Journal of Accounting and
Economics, 36(1-3), 235-270.
Bantel, K. A., & Jackson, S. E. (1989). Top management and innovations in banking:
Does the composition of the top team make a difference? Strategic Management
Journal, 10(S1), 107.
Barclay, M. J., and Holderness, C. G. (1989). Private benefits from control of public
corporations. Journal of Financial Economics, 25(2), 371-395.
Barnes, L. B., & Hershon, S. A. (1976). Transferring power in the family business.
Harvard Business Review, 54(4), 105-114.
Barontini, R., Caprio, Lorenzo. (2006). The effect of family control on firm value and
performance. Evidence from continental Europe. European Financial
Management, 12(5), 689-723.

287
Barry, B. (2004). The development of organization structure in the family firm. Family
Business Review, 2(3), 293-315.
Barth, E., Gulbrandsen, T., & Schone, P. (2005). Family ownership and productivity:
The role of owner-management. Journal of Corporate Finance, 11(1-2), 107-
127.
Baumol, W. (1959). Business behaviour, value and growth. New York: MacMillan.
Bebchuk, L. A. (1999). A rent-protection theory of corporate ownership and control.
Harvard Law and Economics Discussion Paper. Harvard Law School.
Bebchuk, L. A., & Fried, J. M. (2003). Executive compensation as an agency problem.
The Journal of Economic Perspectives, 17(3), 71-92.
Bebchuk, L. A., Fried, J. M., & Walker, D. I. (2002). Managerial power and rent
extraction in the design of executive compensation. The University of Chicago
Law Review, 69(3), 751-846.
Bebchuk, L., Kraakman, R., Triantis, G. (1999). Stock pyramids, cross-ownership and
dual-class equity: The creation and agency costs of separating control from
cash flow rights (NBER Working Paper 6951). Cambridge: National Bureau of
Economic Research.
Becker, G. S., and Murphy, K. M. (1988). A theory of rational addiction. Journal of
Political Economy, 96(4), 675-700.
Beckhard, R., and Gibb Dyer Jr, W. (1983). Managing continuity in the family-owned
business. Organizational Dynamics, 12(1), 5-12.
Beja, A. (1972). On systematic and unsystematic components of financial risk. The
Journal of Finance, 27(1), 37-45.
Ben-Zion, U. (1978). The investment aspects of non-productive expenditures: An
empirical test. Journal of Economics and Business, 30(3), 224-229.
Beneish, M., & Press, E. (1993). Costs of technical violation of accounting-based debt
covenants. The Accounting Review, 68(2), 233-257.
Benos, E., & Weisbach, M. S. (2004). Private benefits and cross-listings in the United
States. Emerging Markets Review, 5(2), 217-240.
Berglof, E., & Claessens, S. (2006). Enforcement and good corporate governance in
developing countries and transition economies. The World Bank Research
Observer, 21(1), 123-150.
Berkman, H., Cole, R. A., & Fu, L. J. (2009). Expropriation through loan guarantees to
related parties: Evidence from China. Journal of Banking & Finance, 33(1),
141-156.
Bergstrom, T. C. (1989). A fresh look at the Rotten Kid Theorem--and other household
mysteries. Journal of Political Economy, 97(5), 1138-1159.

288
Berle, A. A., Means, G.S. (1932). The modern corporation and private property. New
York: MacMillan.
Bertrand, M., Mehta, P., & Mullainathan, S. (2002). Ferreting out tunneling: An
application to Indian business groups. The Quarterly Journal of Economics,
117(1), 121-148.
Bhabra, B. S. (2007). Insider ownership and firm value in New Zealand. Journal of
Multinational Financial Management, 17(2), 142-154.
Bhagat, S., & Black, B. (1999). The uncertain relationship between board composition
and firm performance. The Business Lawyer, 54(3), 921-963.
Bhana, N. (2008). The market reaction to capital expenditure announcements.
Investment Analysts Journal, 68, 53-64.
Bhattacharya, A. K. (2001). The Asian financial crisis and Malaysian capital controls.
Asia Pacific Business Review, 7(3), 181-193.
Bhaumik, S. K., & Gregoriou, A. (2010). Family ownership, tunnelling and earnings
management : A review of the literature. Journal of Economic Surveys, 24(4),
705-730.
Biggart, N. W., & Hamilton, G. (1992). On the limits of a firm-based theory to explain
business networks and Western bias of neoclassical economics. In N. Nohria &
R. Eccles (Eds.), Networks and organizations. Cambridge, MA.: Harvard
Business School Press.
Bjuggren, C. M., Johansson, D., & Sjogren, H. (2011). A note on employment and gross
domestic product in Swedish family-owned businesses. Family Business Review,
24(4), 362-371.
Blair, M. M. (1995). Ownership and control : Rethinking corporate governance for the
twenty-first century. New York: The Brooking Institution.
Blasi, J., Kruse, D., & Bernstein, A. (2003). In the company of owners : The truth about
stock options and why every employee should have them. Academy of
Management Perspectives, 20(3), 126-127.
Bliss, M. A., and Gul, F. A. (2012). Political connection and cost of debt: Some
Malaysian evidence. Journal of Banking and Finance, 36(5), 1520-1527.
Bloom, N., & Van Reenen, J. (2007). Measuring and explaining management practices
across firms and countries. Quarterly Journal of Economics, 122(4), 1351-1408.
BNM. (2012). Gross Domestic Product by kind of economic activity at constant 2000
prices. Retrieved 20th July, 2012, from
http://www.bnm.gov.my/files/publication/ar/en/2011/zcp07_table_A.01.pdf
Bogert, J. D. (1996). Explaining variance in the performance of long-term corporate
blockholders. Strategic Management Journal, 17(3), 243-249.

289
Boot, A. W. A., & Thakor, A. V. (2000). Can relationship banking survive competition?
The Journal of Finance, 55(2), 679-713.
Boubakri, N., Cosset, J.C., Saffar, W. (2009). Politically-connected firms : An
international event study. Working Paper.
Boubakri, N., Guedhami, O., and Mishra, D. (2010). Family control and the implied
cost of equity: Evidence before and after the Asian financial crisis. Journal of
International Business Studies, 41(3), 451.
Brainard, W. C., & Tobin, J. (1968). Pitfalls in financial model building. The American
Economic Review, 58(2), 99-122.
Brickley, J. A., Lease, R. C., & Smith Jr, C. W. (1988). Ownership structure and voting
on antitakeover amendments. Journal of Financial Economics, 20(January-
March), 267-291.
Brigham, E. F., Ehrhardt, M.C. (2002). Financial management : Theory and practice
(10th ed.): South-Western Thomson Learning.
Brownbridge, M. (1998). Financial distress in local banks in Kenya, Nigeria, Uganda
and Zambia: Causes and implications for regulatory policy. Development Policy
Review, 16(2), 173-188.
Bruton, G. D., Ahlstrom, D., & Wan, J. C. C. (2003). Turnaround in East Asian firms:
Evidence from ethnic overseas Chinese communities. Strategic Management
Journal, 24(6), 519-540.
Bruton, G. D., Filatotchev, I., Chahine, S., & Wright, M. (2009). Governance,
ownership structure, and performance of IPO firms: The impact of different
types of private equity investors and institutional environments. Strategic
Management Journal, 31(5), 491-509.
Buchanan, B. (1974). Building organizational commitment - The socialization of
managers in work organizations Administrative Science Quarterly, 19(4), 533.
Buchanan, J. M. (1975). The samaritan's dilemma. In E.S.Phelps (Ed.), Altruism,
morality and economic theory. New York: Russell Sage Foundation.
Buchko, A. A. (1993). The effects of employee ownership on employee attitudes : An
integrated causal model and path analysis Journal of Management Studies,
30(4), 633-657.
Burkart, M., Panunzi, F., & Shleifer, A. (2003). Family firms. The Journal of Finance,
58(5), 2167-2201.
Bursa Malaysia. (2012a). Listed companies. Retrieved 18th July, 2012, from
http://www.bursamalaysia.com/market/listed-companies/
Bursa Malaysia. (2012b). Listing requirements : Definitions and interpretations.
Retrieved 2nd December, 2012, from
290
http://www.bursamalaysia.com/misc/regulation_rules_main_market_bm_mainc
hapter1.pdf
Bursa Malaysia. (2012c). Listing requirements : Transactions. Retrieved 10th
November, 2012, from
http://www.bursamalaysia.com/misc/regulation_rules_main_market_bm_mainc
hapter10.pdf
Bushman, R. M., & Piotroski, J. D. (2006). Financial reporting incentives for
conservative accounting: The influence of legal and political institutions.
Journal of Accounting and Economics, 42(1-2), 107-148.
Bushman, R. M., Piotroski, J. D., & Smith, A. J. (2004). What determines corporate
transparency? Journal of Accounting Research, 42(2), 207-252.
Byers, S. S., Fields, L. P., and Fraser, D. R. (2008). Are corporate governance and bank
monitoring substitutes: Evidence from the perceived value of bank loans.
Journal of Corporate Finance, 14(4), 475-483.
Campbell, T. L., and Keys, P. Y. (2002). Corporate governance in South Korea: The
chaebol experience. Journal of Corporate Finance, 8(4), 373-391.
Canavan, J., Jones, B., Potter, M.J. (2004). Board tenure : How long is long ? Boards
and Directors, 28(2), 39-42.
Capon, N., Farley, J., Hoening, S. (1996). Toward an integrative explanation of
corporate financial performance. Boston: Kluwer Academic Publishers.
Carney, M. (2005). Corporate governance and competitive advantage in family-
controlled firms. Entrepreneurship: Theory and Practice, 29(3), 249-265.
Carney, R. W., & Child, T. B. (in press). Changes to the ownership and control of East
Asian corporations between 1996 and 2008: The primacy of politics. Journal of
Financial Economics.
Carney, M., Gedajlovic, E. R., Heugens, P. P. M. A. R., Van Essen, M., & Van
Oosterhout, J. (2011). Business group affiliation, performance, context and
strategy : A meta-analysis. Academy of Management Journal, 54(3), 437-460.
Cascino, S., Pugliese, A., Mussolino, D., and Sansone, C. (2010). The influence of
family ownership on the quality of accounting information. Family Business
Review, 23(3), 246-265.
Castelli, A., Dwyer, G. P., & Hasan, I. (2012). Bank relationships and firms' financial
performance: The Italian experience. European Financial Management, 18(1),
28-67.
Certo, S. T., Covin, J. G., Daily, C. M., & Dalton, D. R. (2001). Wealth and the effects
of founder management among IPO-stage new ventures. Strategic Management
Journal, 22(6-7), 641-658.
291
Cetorelli, N., Goldberg, L.S. (2010). Global banks and international shock transmission:
Evidence from the crisis. Working Paper. Federal Reserve Bank of New York.
CFA. (2009). Related party transactions : Cautionary tales for investors in Asia: Asia
Pacific Office of the CFA Institute Centre For Financial Market Integrity.
Chakrabarti, A., Singh, K., & Mahmood, I. (2007). Diversification and performance:
Evidence from East Asian firms. Strategic Management Journal, 28(2), 101-
120.
Chakrabarti, R., Subramanian, K. V., & Tung, F. (2010). Independent directors and firm
value: Evidence from an emerging market. Working Paper.
Chakrabarty, S. (2009). The influence of national culture and institutional voids on
family ownership of large firms: A country level empirical study. Journal of
International Management, 15(1), 32-45.
Chakravarthy, B. S. (1986). Measuring strategic performance. Strategic Management
Journal, 7(5), 437-458.
Champagne, C., & Kryzanowski, L. (2007). Are current syndicated loan alliances
related to past alliances? Journal of Banking & Finance, 31(10), 3145-3161.
Chan, G. K. Y. (2007). The right of access to justice: Judicial discourse in Singapore
and Malaysia. Asian Journal of Comparative Law, 2(1), 1-40.
Chan, S. H., Martin, J. D., and Kensinger, J. W. (1990). Corporate research and
development expenditures and share value. Journal of Financial Economics,
26(2), 255-276.
Chang, S. J. (2003). Ownership Structure, expropriation, and performance of group-
affiliated companies in Korea. The Academy of Management Journal, 46(2),
238-253.
Chang, S. J., and Hong, J. (2000). Economic performance of group-affiliated companies
in Korea: Intragroup resource sharing and internal business transactions. The
Academy of Management Journal, 43(3), 429-448.
Charkham, J. (1995). Keeping good company : A study of corporate governance in five
countries. New York: Oxford University Press.
Chauvin, K. W., and Hirschey, M. (1993). Advertising, R&D expenditures and the
market value of the firm. Financial Management, 22(4), 128-140.
Che, Y. K., & Sakovics, J. (Eds.). (2008) New Palgrave Dictionary of Economics (2nd
ed.).
Chen, V., Li, J., & Shapiro, D. (2011). Are OECD-prescribed 'good corporate
governance practices' really good in an emerging economy? Asia Pacific
Journal of Management, 28(1), 115-138.

292
Chen, M. H. (2003). Risk and return: CAPM and CCAPM. The Quarterly Review of
Economics and Finance, 43(2), 369-393.
Chen, Y. M., & Chien, C.-Y. (2004). Monitoring Mechanism, Corporate Governance
and Related Party Transactions. Working Paper. Rutgers University.
Cheung, Y.-L., Rau, P. R., and Stouraitis, A. (2006). Tunneling, propping, and
expropriation: Evidence from connected party transactions in Hong Kong.
Journal of Financial Economics, 82(2), 343-386.
Cheung Y.L., Jing, L., Lu, T., Rau, P.R., Stouraitis, A. (2009). Tunneling and propping
up: An analysis of related party transactions by Chinese listed companies.
Pacific-Basin Journal, 17(3), 372-393.
Chrisman, J. J., Chua, J. H., Kellermanns, F. W., & Chang, E. P. C. (2007). Are family
managers agents or stewards? An exploratory study in privately held family
firms. Journal of Business Research, 60(10), 1030-1038.
Chua, J. H., Chrisman, J. J., & Sharma, P. (1999). Defining the family business by
behavior. Entrepreneurship: Theory & Practice, 23(4), 19-39.
Chung, H.-M. (2006). Managerial ties, control and deregulation: An investigation of
business groups entering the deregulated banking industry in Taiwan. Asia
Pacific Journal of Management, 23(4), 505-520.
Chung, K. H., and Pruitt, S. W. (1994). A simple approximation of Tobin's q. Financial
Management, 23(3), 70-74.
Chung, K. H., Wright, P., and Kedia, B. (2003). Corporate governance and market
valuation of capital and R&D investments. Review of Financial Economics,
12(2), 161-172.
Churchill, N. C., and Hatten, K. J. (1987). Non-market-based transfers of wealth and
power: A research framework for family businesses. American Journal of Small
Business, 11(3), 51-64.
Clacher, I., Hillier, D., & McColgan, P. (2010). Agency theory : Incomplete contracting
and ownership structure. In H. K. Baker & R. Anderson (Eds.), Corporate
governance : A synthesis of theory, research and practice (Vol. , pp. 141-156).
New Jersey: John Wiley & Sons.
Claessens, S., Dell' Ariccia, G., Igan, D., Laeven, L. (2010). Lessons and policy
implications from the global financial crisis. Working Paper. International
Monetary Fund (IMF).
Claessens, S., Djankov, S., Fan, J. P. H., and Lang, L. H. P. (2002). Disentangling the
incentive and entrenchment effects of large shareholdings. The Journal of
Finance, 57(6), 2741-2771.
Claessens, S., Djankov, S., Fan, J., Lang, L. (1999a). Expropriation of minority
shareholders in East Asia. World Bank Policy Research Paper. World Bank.

293
Claessens, S., Djankov, S., Lang, L. (2000a). The separation of ownership and control
in East Asian corporations. Journal of Financial Economics, 58(1-2), 81-112.
Claessens, S., Djankov, S., Lang, L. (1999b). Who controls East Asian corporations ?
Policy Research Paper. World Bank.
Claessens, S., and Fan, J. P. H. (2002). Corporate governance in Asia: A survey.
International Review of Finance, 3(2), 71.
Claessens, S., Simeon, D., and Xu, L. C. (2000b). Corporate performance in the East
Asian financial crisis. The World Bank Research Observer, 15(1), 23-46.
Claessens, S., and Yurtoglu, B. B. (2012). Corporate governance in emerging markets:
A survey. Emerging Markets Review, 3(2), 71-103.
Coase, R. (1937). The nature of the firm. Economica, 4(16), 386-405.
Companies Act 1965 (Act 125) and subsidiary legislation (2002), (1965 and 2002).
Connelly, B. L., Hoskisson, R. E., Tihanyi, L., and Certo, S. T. (2010). Ownership as a
form of corporate governance. Journal of Management Studies, 47(8), 1561-
1589.
Connelly, B. L., Tihanyi, L., Certo, S. T., & Hitt, M. A. (2010). Marching to the beat of
different drummers: The influence of institutional owners on competitive
actions. Academy of Management Journal, 53(4), 723-742.
Connolly, R. A., Hirsch, B. T., and Hirschey, M. (1986). Union rent seeking, intangible
capital, and market value of the firm. The Review of Economics and Statistics,
68(4), 567-577.
Cooper, D. R., Schindler, P.S. (2001). Business research method (7th ed.). Singapore:
Irwin/McGraw Hill Publications.
Cremers, K. J., & Nair, V. B. (2004). Governance mechanisms and equity prices.
Working Paper. Yale International Center for Finance.
Croci, E., Doukas, J. A., & Gonenc, H. (2011). Family control and financing decisions.
European Financial Management, 17(5), 860-897.
Cronqvist, H., and Nilsson, M. (2003). Agency costs of controlling minority
shareholders. The Journal of Financial and Quantitative Analysis, 38(4), 695-
719.
Crundwell, F. K. (2008). Risk and return In Finance for engineers (pp. 337-365).
London: Springer London.
Cueto, D. C. (2013). Substitutability and complementarity of corporate governance
mechanisms in Latin America. International Review of Economics and Finance,
25(January), 310-325.
294
Dahya, J., Dimitrov, O., and McConnell, J. J. (2009). Does board independence matter
in companies with a controlling shareholder? Journal of Applied Corporate
Finance, 21(1), 67-78.
Dahya, J., Dimitrov, O., and McConnell, J. J. (2008). Dominant shareholders, corporate
boards, and corporate value: A cross-country analysis. Journal of Financial
Economics, 87(1), 73-100.
Dahya, J., McConnell, J. J., & Travlos, N. G. (2002). The Cadbury committee,
corporate performance, and top management turnover. The Journal of Finance,
57(1), 461-483.
Daily, C. M., & Dalton, D. R. (1992). Financial performance of founder-managed
versus professionally managed small corporations. Journal of Small Business
Management, 30(2), 25-25.
Dalton, D. R., Daily, C. M., Certo, S. T., & Roengpitya, R. (2003). Meta-analyses of
financial performance and equity : Fusion or confusion ? Academy of
Management Journal, 46(1), 13-26.
Daily, C. M., & Dollinger, M. J. (1992). An empirical examination of ownership
structure in family and professionally managed firms. Family Business Review,
5(2), 117-136.
Daley, L., Mehrotra, V., and Sivakumar, R. (1997). Corporate focus and value creation
evidence from spinoffs. Journal of Financial Economics, 45(2), 257-281.
Dalton, D. R., & Daily, C. M. (1992). Financial performance of founder-managed
versus professionally managed corporations. Journal of Small Business
Economics, 30(2), 25-34.
Dalton, D. R., Daily, C. M., Certo, S. T., and Roengpitya, R. (2003). Meta-analyses of
financial performance and equity : Fusion or confusion ? Academy of
Management Journal, 46(1), 13-26.
Dalziel, T., White, R. E., & Arthurs, J. D. (2011). Principal costs in initial public
offerings. Journal of Management Studies, 48(6), 1346-1364.
David, P., Hitt, M. A., & Gimeno, J. (2001). The influence of activism by institutional
investors on R&D Academy of Management Journal, 44(1), 144-157.
David, P., Hitt, M.A., Liang, T.W. (2007). The benefits and costs of large block
ownership before and during the East Asian crisis. Working Paper.
David, P., O'Brien, J. P., Yoshikawa, T., & Delios, A. (2010). Do shareholders or
stakeholders appropriate the rents from corporate diversification? The influence
of ownership structure. Academy of Management Journal, 53(3), 636-654.
Davies, J. R., Hillier, D., and McColgan, P. (2005). Ownership structure, managerial
behavior and corporate value. Journal of Corporate Finance, 11(4), 645-660.

295
Davies, S. W., & Lyons, B. R. (1991). Characterising relative performance: The
productivity advantage of foreign owned firms in the UK. Oxford Economic
Papers, 43(4), 584-595.
Davis, G. F., and Useem, M. (2002). Top management, company directors and
corporate control. In A. Pettigrew, Thomas, H. and Whittington, R. (Ed.),
Handbook of Strategy and Management. London: Sage.
Davis, P. (1983). Realizing the potential of the family business. Organizational
Dynamics, 12(1), 47-56.
Degryse, H., & Ongena, S. (2001). Bank relationships and firm profitability. Financial
Management, 30(1), 9-34.
De Cesari, A. (2012). Expropriation of minority shareholders and payout policy. The
British Accounting Review, 44(4), 207-220.
De Miguel, A., Pindado, J., & De La Torre, C. (2004). Ownership structure and firm
value: New evidence from Spain. Strategic Management Journal, 25(12), 1199.
De Vries, K., and Manfred, F. R. (1993). The dynamics of family controlled firms: The
good and the bad news. Organizational Dynamics, 21(3), 59-71.
Demirguc-Kunt, A., & Maksimovic, V. (1998). Law, finance, and firm growth. The
Journal of Finance, 53(6), 2107-2137.
Demsetz, H. (1983). The structure of ownership and the theory of the firm. Journal of
Law and Economics, 26(2), 375-390.
Demsetz, H., and Lehn, K. (1985). The structure of corporate ownership: Causes and
consequences. The Journal of Political Economy, 93(6), 1155-1177.
Dennis, S. A., & Mullineaux, D. J. (2000). Syndicated loans. Journal of Financial
Intermediation, 9(4), 404-426.
Denis, D., Sarin, A. (1999). Ownership and board structures in publicly traded
corporations. Journal of Financial Economics, 52(2), 187-223.
Desai, M. A., & Dharmapala, D. (2006). Corporate tax avoidance and high-powered
incentives. Journal of Financial Economics, 79(1), 145-179.
Detragiache, E., Garella, P., and Guiso, L. (2000). Multiple versus single banking
relationships: Theory and evidence. The Journal of Finance, 55(3), 1133-1161.
Detragiache, E., & Gupta, P. (2006). Foreign banks in emerging market crises:
Evidence from Malaysia. Journal of Financial Stability, 2(3), 217-242.
Devers, C. E., Cannella, A. A., Reilly, G. P., & Yoder, M. E. (2007). Executive
compensation: A multidisciplinary review of recent developments. Journal of
Management, 33(6), 1016-1072.

296
Dewenter, K. L., & Malatesta, P. H. (2001). State-owned and privately owned firms: An
empirical analysis of profitability, leverage, and labor intensity. The American
Economic Review, 91(1), 320-334.
Dharwadkar, R., George, G., and Brandes, P. (2000). Privatization in emerging
economies: An agency theory perspective. The Academy of Management
Review, 25(3), 650-669.
Diamond, D. W. (1984). Financial intermediation and delegated monitoring. The
Review of Economic Studies, 51(3), 393-414.
Diamond, D. (1991). Monitoring and reputation : The choice between bank loans and
privately placed debt. Journal of Political Economy, 99(4), 689-721.
Dieleman, M. (2012). Succesion planning in family firm boards. Retrieved 20th June,
2012, from
http://bschool.nus.edu/Portals/0/images/CGIO/Resources/Family%20Business%
20Succession%20v19032012.pdf
Dieleman, M., & Sachs, W. (2006). Oscillating between a relationship-based and a
market-based model: The Salim Group. Asia Pacific Journal of Management,
23(4), 521-536.
Diggle, P. J., Liang, K.-Y., & Zigger, S. L. (1994). Analysis of longitudinal data.
Oxford: Clarendon Press.
Djankov, S., La Porta, R., Lopez-de-Silanes, F., and Shleifer, A. (2008). The law and
economics of self-dealing. Journal of Financial Economics, 88(3), 430-465.
Doidge, C., Andrew Karolyi, G., and Stulz, R. M. (2007). Why do countries matter so
much for corporate governance? Journal of Financial Economics, 86(1), 1-39.
Donnelley, R. G. (1964). The family business. Harvard Business Review, 42(4), 93-105.
Donovan, K. (1995). Just one tiny share can make a difference : They're battling over
the family fortune and the brother has the upper hand. National Law Journal,
17(42), 12.
Du, J., He, Q., & Yuen, S. W. (in press). Tunneling and the decision to go private:
Evidence from Hong Kong. Pacific-Basin Finance Journal.
Dunn, B. (1995). Success themes in Scottish family enterprises: Philosophies and
practices through the generations. Family Business Review, 8(1), 17-28.
Durnev, A., & Kim, E. H. (2005). To steal or not to steal: Firm attributes, legal
environment, and valuation. The Journal of Finance, 60(3), 1461-1493.
Dyck, A., & Zingales, L. (2004). Private benefits of control: An international
comparison. The Journal of Finance, 59(2), 537-600.
Dyer, W. G., Jr. (1986). Cultural change in family firms : Anticipating and managing
business and family transitions. San Francisco: Jossey-Bass.
297
Dyer, W. G. (1989). Integrating professional management into a family owned business.
Family Business Review, 2(3), 221-235.
Eaton, C., Yuan, L., & Wu, Z. (2002). Reciprocal altruism and the theory of the family
firm. Paper presented at the Second Annual Conference on Theories of the
Family Enterprise : Search for a Paradigm, Philadelphia, PA.
Economic Planning Unit (EPU) (1981). Fourth Malaysia plan. Retrieved. from
http://www.epu.gov.my/fourth.
Economic Planning Unit (EPU) (2001). Eighth Malaysia plan. Retrieved. from
http://www.epu.gov.my/eightmalaysiaplan.
Economic Planning Unit (EPU) (2006). Nineth Malaysia plan. Retrieved. from
http://www.epu.gov.my/ninth.
Economic Planning Unit (EPU) (2011). Tenth Malaysia plan. Retrieved. from
http://www.epu.gov.my/html/themes/epu/html/RMKE10/rmke10_english.html.
Edwards, F. R., & Hubbard, R. G. (2000). The growth of institutional stock ownership :
A promise unfulfilled Journal of Applied Corporate Finance, 13(3), 92-104.
Edwards, J. S. S., & Weichenrieder, A. J. (2004). Ownership concentration and share
valuation. German Economic Review, 5(2), 143-171.
Elango, B., Fried, V. H., Hisrich, R. D., & Polonchek, A. (1995). How venture capital
firms differ. Journal of Business Venturing, 10(2), 157-179.
Ellul, A., Guntay, L., and Lel, U. (2007). External governance and debt agency costs of
family firms. International Finance Discussion Papers Retrieved 15th March,
2012, from http://www.federalreserve.gov/PUBS/ifdp/2007/908/ifdp908.pdf
Emma, G.-M., and Juan Pedro, S. n.-B. (2011). Firm value and ownership structure in
the Spanish capital market. Corporate Governance, 11(1), 41-53.
Emshwiller, J. (2003). Many companies report transactions with top officials. The Wall
Street Journal, 29(December).
Estrin, S., Poukliakova, S., & Shapiro, D. (2009). The performance effects of business
groups in Russia. Journal of Management Studies, 46(3), 393-420.
Faccio, M., Lang, L. H. P., and Young, L. (2001a). Dividends and expropriation. The
American Economic Review, 91(1), 54-78.
Faccio, M., Lang, L.H.P., Young, L. (2001b). Debt and corporate governance. Working
Paper. Chinese University of Hong Kong.
Faccio, M., Lang, L.H.P., Young, L. (2001c). Debt and expropriation. Paper presented
at the European Financial Management Association (EFMA) Lugano Meetings,
Lugano, Switzerland.

298
Fama, E. F. (1980). Agency problems and the theory of the firm. The Journal of
Political Economy, 88(2), 288-307.
Fama, E. F. (1985). What's different about banks? Journal of Monetary Economics,
15(1), 29-39.
Fama, E., Jensen, M. (1983a). Agency problems and residual claims. Journal of Law
and Economics, 26(2), 327-349.
Fama, E. F., and Jensen, M. C. (1983b). Separation of ownership and control. Journal of
Law and Economics, 26(2), 301-325.
Fan, J., & Goyal, V. (2006). On the patterns and wealth effects of vertical mergers. The
Journal of Business, 79(2), 877-902.
Fan, J., Wong, T. J., & Zhang, T. Y. (2005). The emergence of corporate pyramids in
China. Working Paper. Chinese University of Hong Kong.
Fan, J. P. H., Wei, K. C. J., and Xu, X. (2011). Corporate finance and governance in
emerging markets: A selective review and an agenda for future research. Journal
of Corporate Finance, 17(2), 207-214.
Favero, C. A., Giglio, S. W., Honorati, M., & Panunzi, F. (2006). The performance of
Italian family firms. Working Paper No. 127/2006. European Corporate
Governance Institute (ECGI).
Feng, X. N., & Li, X. Y. (2009). The separation of ownership and control rights :
Evidence from China. Economic Science, 2, 84-97.
Ferris, S. P., Kim, K. A., & Kitsabunnarat, P. (2003). The costs (and benefits?) of
diversified business groups: The case of Korean chaebols. Journal of Banking &
Finance, 27(2), 251-273.
File, K. M., Prince, R. A., & Rankin, M. J. (1994). Organizational buying behavior of
the family firm. Family Business Review, 7(3), 263-272.
Financial Reporting Standard 124 (2010).
Finance Committee of Corporate Governance (1999). Report on corporate governance:
Ministry of Finance, Malaysia
Fisman, R., & Khanna, T. (2004). Facilitating development: The role of business
groups. World Development, 32(4), 609-628.
Fleming, G., Heaney, R., & McCosker, R. (2005). Agency costs and ownership
structure in Australia. Pacific-Basin Finance Journal, 13(1), 29-52.
Focarelli, D., and Pozzolo, A. (2000, May). The determinants of cross-border
shareholding : An analysis with bank-level data from OECD countries. Paper
presented at the Federal Reserve Bank of Chicago Bank Structure Conference,
Chicago, Illinois, USA.

299
Fok, R. C. W., Chang, Y.-C., and Lee, W.-T. (2004). Bank relationships and their
effects on firm performance around the Asian Financial crisis: Evidence from
Taiwan. Financial Management, 33(2), 89-112.
Forbes. (2012). Malaysia's 40 richest. Retrieved 13th November, 2012, from
http://www.forbes.com/lists/2012/84/malaysia-billionaires-12_rank.html
Fraser, D. R., Zhang, H., and Derashid, C. (2005). Capital structure and political
patronage: The case of Malaysia. Journal of Banking and Finance, 30(4), 1291-
1308.
French, K. R., and Roll, R. (1986). Stock return variances : The arrival of information
and the reaction of traders. Journal of Financial Economics, 17(1), 5-26.
Friedman, E., & Johnson, S. (1999). Propping and looting in a weak legal environment.
Working Paper. Massachussets Institute of Technology (MIT).
Friedman, E., Johnson, S., Mitton, T. (2003). Propping and tunneling. Journal of
Comparative Economics, 31(4), 732–750.
Fukuyama, F. (1996). Trust : The social virtues and the creation of prosperity. London:
Free Press Paperbacks.
Gama, A. P. M., & Galvao, J. M. M. (2012). Performance, valuation and capital
structure: Survey of family firms. Corporate Governance, 12(2), 199-214.
Gao, L., & Kling, G. (2008). Corporate governance and tunneling: Empirical evidence
from China. Pacific-Basin Finance Journal, 16(5), 591-605.
Gedajlovic, E., & Shapiro, D. M. (2002). Ownership structure and firm profitability in
Japan Academy of Management Journal, 45(3), 565-575.
Gersick, K. E., Hampton, D. M. M., & Lansberg, I. (1997). Generation to generation :
Life cycles of the family business. Cambridge, MA: Harvard Business School
Press.
Ghemawat, P., & Khanna, T. (1998). The nature of diversified business groups: A
research design and two case studies. The Journal of Industrial Economics,
46(1), 35-61.
Gomes, A. (2000). Going public without governance: Managerial reputation effects.
The Journal of Finance, 55(2), 615-646.
Gomez, E. T. (1999). Chinese business in Malaysia : Accumulation, ascendance,
accomodation. Honolulu: University of Hawaii Press.
Gomez, E. (2004). De-essentialising capitalism: Chinese networks and family firms in
Malaysia. NIASnytt(3), 8-10.
Gomez, E. T., Jomo, K.S. (1997). Malaysia's political economy Cambridge: Cambridge
University Press.

300
Gomez-Mejia, L. R., Larraza-Kintana, M., & Makri, M. (2003). The determinants of
executive compensation in family-controlled public corporations. Academy of
Management Journal, 46(2), 226-237.
Gopalan, R., Nanda, V., & Seru, A. (2007). Affiliated firms and financial support:
Evidence from Indian business groups. Journal of Financial Economics, 86(3),
759-795.
Gordon, E. A., Henry, E., Louwers, T. J., & Reed, B. J. (2007). Auditing related party
transactions: A literature overview and research synthesis. Accounting Horizons,
21(1), 81-102.
Gordon, E., Henry, E., & Palia, D. (2004a). Determinants of related party transactions
and their impact on firm value. Working Paper, Rutgers University.
Gordon, E. A., Henry, E., Palia, D. (2004b). Related party transactions: Associations
with corporate governance and firm value. Working Paper. Rutgers University.
Gordon, E. A., Henry, E., and Palia, D. (2004c). Related party transactions and
corporate governance. In Advances in Financial Economics (Vol. 9, pp. 1-29).
Gorriz, C. G., & Fumas, V. S. (1996). Ownership structure and firm performance :
Some empirical evidence from Spain. Managerial And Decision Economics,
17(6), 575-586.
Governance, F. C. O. C. (2001). Malaysian code on corporate governance. Kuala
Lumpur: Malayan Law Journal.
Goyal, A., and Santa-Clara, P. (2003). Idiosyncratic risk matters ! The Journal of
Finance, 58(3), 975-1007.
Grauwe, P. D., Camerman, F. (2002). How big are the big multinational companies?
Review of Business and Economics, XLVII(3), 311-326.
Gregory, H. J. (2000). The globalisation of corporate finance. Retrieved 3rd
November, 2010, from
http://rru.worldbank.org/Documents/PapersLinks/globalisation_of_corporate_go
vernance.pdf
Grinstein, Y., & Michaely, R. (2005). Institutional holdings and payout policy. The
Journal of Finance, 60(3), 1389-1426.
Grossman, S. J., and Hart, O. D. (1988). One share-one vote and the market for
corporate control. Journal of Financial Economics, 20(January-March), 175-
202.
Grossman, S. J., & Hart, O. D. (1980). Takeover bids, the free-rider problem, and the
theory of the corporation. The Bell Journal of Economics, 11(1), 42-64.
Grossman, S. J., and Hart, O. D. (1986). The costs and benefits of ownership: A theory
of vertical and lateral integration. Journal of Political Economy, 94(4), 691-719.
301
Grullon, G., and Kanatas, G. (2001). Managerial incentives, capital structure and firm
value: Evidence from dual class stocks. Working Paper. Rice University, Texas,
USA.
Guillen, M. F. (2000). Business groups in emerging economies: A resource-based view.
Academy of Management Journal, 43(3), 362-380.
Guillen, M. (2001). The limits of convergence: Globalisation and organisational
change in Argentina, South Korea and Spain. Princeton, New Jersey: Princeton
University Press.
Gujarati, D. N., Porter, D.C. (2009). Basic econometrics (5th ed.): McGraw-Hill
Gul, F. A., Kim, J.-B., and Qiu, A. A. (2010). Ownership concentration, foreign
shareholding, audit quality, and stock price synchronicity: Evidence from China.
Journal of Financial Economics, 95(3), 425-442.
Hair, J. F., Black, W., Babin, B. J., Anderson, R. E., & Tatham, R. L. (2006).
Multivariate data analysis (6th ed.). New Jersey: Pearson Prentice Hall.
Hamilton, G., & Biggart, N. W. (1988). Market, culture and authority : A comparative
analysis of management in the Far East. American Journal of Sociology, 94(552-
594).
Han, B. H., and Manry, D. (2004). The value-relevance of R&D and advertising
expenditures: Evidence from Korea. The International Journal of Accounting,
39(2), 155-173.
Haniffa, R. M., & Cooke, T. E. (2002). Culture, corporate governance and disclosure in
Malaysian corporations. Abacus, 38(3), 317-349.
Haniffa, R., and Hudaib, M. (2006). Corporate governance structure and performance of
Malaysian listed companies. Journal of Business Finance and Accounting,
33(7/8), 1034-1062.
Hand, J. R. M., Skantz, T.R. (1999). The market-timing characteristics of equity carve-
outs. Working Paper. University of North Carolina, Chapel Hill, USA.
Harris, M., & Raviv, A. (2008). A theory of board control and size. The Review of
Financial Studies, 21(4), 1797-1832.
Harris, M., and Raviv, A. (1988a). Corporate control contests and capital structure.
Journal of Financial Economics, 20(January-March), 55-86.
Harris, M., and Raviv, A. (1988b). Corporate governance: Voting rights and majority
rules. Journal of Financial Economics, 20(January-March), 203-235.
Hart, O., & Moore, J. (1990). Property rights and the nature of the firm. Journal of
Political Economy, 98(6), 1119.

302
Harvey, C. R., Lins, K. V., and Roper, A. H. (2004). The effect of capital structure
when expected agency costs are extreme. Journal of Financial Economics,
74(1), 3-30.
Hausman, J. A. (1978). Specification tests in econometrics. Econometrica, 46(6), 1251-
1271.
Hawawini, G., Subramanian, V., and Verdin, P. (2003). Is performance driven by
industry-or firm-specific factors? A new look at the evidence. Strategic
Management Journal, 24(1), 1-16.
Helfert, E. A. (2003). Techniques of financial analysis: A guide to value creation (11th
ed.). New York: The McGraw-Hill/Irwin Publication.
Hendry, J. (2002). The principal's other problems: Honest incompetence and the
specification of objectives. Academy of Management Review, 27(1), 98-113.
Hermalin, B. E., & Weisbach, M. S. (2003). Boards of directors as an endogenously
determined institution: A survey of the economic literature. Economic Policy
Review - Federal Reserve Bank of New York, 9(1), 7-26.
Hermawan, A. A., & Dina, A. R. A. (2011). The effect of bank monitoring as an
alternative of corporate governance mechanism on the borrowers’ firm value:
Evidence from Indonesian listed firms. Paper presented at the 24th Australasian
Finance and Banking Conference 2011, The University of New South Wales,
Sydney, Australia.
Heugens, P. M. A. R., Essen, M., & Oosterhout, J. (2009). Meta-analyzing ownership
concentration and firm performance in Asia: Towards a more fine-grained
understanding. Asia Pacific Journal of Management, 26(3), 481-512.
Himmelberg, C. P., Hubbard, R. G., and Palia, D. (1999). Understanding the
determinants of managerial ownership and the link between ownership and
performance. Journal of Financial Economics, 53(3), 353-384.
Hinkle, D., Wiersma, W., & Jurs, S. (2002). Applied statistics for the behavioural
sciences (5th ed.): Wadsworth Publishing.
Hirschey, M., and Weygandt, J. J. (1985). Amortization policy for advertising and
research and development expenditures. Journal of Accounting Research, 23(1),
326-335.
Holderness, C. G. (2003). A survey of blockholders and corporate control. Economic
Policy Review - Federal Reserve Bank of New York, 9(1), 51-63.
Holderness, C. G., and Sheehan, D. P. (1988). The role of majority shareholders in
publicly held corporations: An exploratory analysis. Journal of Financial
Economics, 20(January-March), 317-346.
Holmstrom, B., and Tirole, J. (1993). Market liquidity and performance monitoring. The
Journal of Political Economy, 101(4), 678-709.

303
Hoskisson, R. E., Cannella, A. A., Tihanyi, L., & Faraci, R. (2004). Asset restructuring
and business group affiliation in French civil law countries. Strategic
Management Journal, 25(6), 525-539.
Hoskisson, R. E., Castleton, M. W., & Withers, M. C. (2009). Complementarity in
monitoring and bonding: More intense monitoring leads to higher executive
compensation. Academy of Management Perspectives, 23(2), 57-74.
Hoskisson, R. E., Eden, L., Lau, C. M., & Wright, M. (2000). Strategy in emerging
economies. Academy of Management Journal, 43(3), 249-267.
Howard, M. (2006). Accounting for unsystematic risk. Financial Management,
29(September), 29-31.
Huang, W., Liu, Q., Ghon, R. S., and Zhang, L. (2010). Return reversals, idiosyncratic
risk, and expected returns. Review of Financial Studies, 23(1), 147-168.
Hutchinson, R. (1995). The capital structure and investment decisions of the small
owner-managed firm: Some exploratory issues. Small Business Economics, 7(3),
231-239.
Hwang, B.-H., & Kim, S. (2009). It pays to have friends. Journal of Financial
Economics, 93(1), 138-158.
Ibrahim, H. (2009). Family-ownership and performance: Evidence from Malaysian
public-listed companies. PhD Thesis, University Malaya, Kuala Lumpur.
Ibrahim, H., Samad, F. (2010). Family business and emerging markets: The case of
Malaysia. African Journal of Business Management 4(13), 2586-2595.
IMF. (1998). The Asian crisis : Causes and cures. Finance and Development (June), 18-
21.
Iskandar, T. M., Bukit, R. B., & Sanusi, Z. M. (2012). The moderating effect of
ownership structure on the relationship between free cash flow and asset
utilisation. Asian Academy of Management Journal of Accounting and Finance,
8(1), 69-89.
Isobe, T., Makino, S., & Goerzen, A. (2006). Japanese horizontal keiretsu and the
performance implications of membership. Asia Pacific Journal of Management,
23(4), 453-466.
Jasani, S. (2002). The family & the business international survey report: Grant
Thornton.
Jensen, M. C. (1986). Agency costs of free cash flow, corporate finance, and takeovers.
The American Economic Review, 76(2), 323-329.
Jensen, M. C. (1993). The modern industrial revolution, exit, and the failure of internal
control systems. The Journal of Finance, 48(3), 831-880.

304
Jensen, M., Meckling, W. (1976). Theory of the firm: Managerial behaviour, agency
costs and capital structure. Journal of Financial Economics, 3(4), 305-360.
Jian, M., & Wong, T. J. (2004). Earnings management and tunneling through related
party transactions : Evidence from Chinese corporate groups. Working Paper.
The Chinese University of Hong Kong.
Jian, M., and Wong, T. (2010). Propping through related party transactions. Review of
Accounting Studies, 15(1), 70-105.
Jiang, G., Lee, C. M. C., and Yue, H. (2010). Tunneling through intercorporate loans:
The China experience. Journal of Financial Economics, 98(1), 1-20.
Jiang, Y., and Peng, M. (2011). Principal-principal conflicts during crisis. Asia Pacific
Journal of Management, 28(4), 683-695.
Joh, S. W. (2003). Corporate governance and firm profitability: Evidence from Korea
before the economic crisis. Journal of Financial Economics, 68(2), 287-322.
Johnson, S., Boone, P., Breach, A., Friedman, E. (2000a). Corporate governance in the
Asian financial crisis. Journal of Financial Economics, 58(1-2), 141-186.
Johnson, S., and Mitton, T. (2003). Cronyism and capital controls: Evidence from
Malaysia. Journal of Financial Economics, 67(2), 351-382.
Johnson, S., Porta, R. L., Lopez-de-Silanes, F., and Shleifer, A. (2000b). Tunneling. The
American Economic Review, 90(2), 22-27.
Jones, D. C., & Kato, T. (1995). The productivity effects of employee stock-ownership
plans and bonuses: Evidence from Japanese panel data. The American Economic
Review, 85(3), 391-414.
Jose, M. L., Nichols, L. M., and Stevens, J. L. (1986). Contributions of diversification,
promotion, and R&D to the value of multiproduct firms: A Tobin's q approach.
Financial Management, 15(4), 33-42.
Katz, R. (1982). An investigation into the effects of group longevity. Administrative
Science Quarterly, 27(1), 81-104.
Khanna, T., and Palepu, K. (2000). Is group affiliation profitable in emerging markets?
An analysis of diversified Indian business groups. The Journal of Finance,
55(2), 867-891.
Khanna, T., & Palepu, K. (1997). Why focused strategies may be wrong for emerging
markets. Harvard Business Review, 75(4), 41-51.
Khanna, T., and Rivkin, J. W. (2001). Estimating the performance effects of business
groups in emerging markets. Strategic Management Journal, 22(1), 45-74.
Khanna, T., & Yafeh, Y. (2007). Business groups in emerging markets: Paragons or
parasites? Journal of Economic Literature, 45(2), 331-372.

305
Kim, W. S., & Sorensen, E. H. (1986). Evidence on the impact of the agency costs of
debt on corporate debt policy. The Journal of Financial and Quantitative
Analysis, 21(2), 131-144.
Klein, A. (2002). Audit committee, board of director characteristics, and earnings
management. Journal of Accounting and Economics, 33(3), 375-400.
Kleinbaum, D. G., Kupper, L. L., Muller, K. E., & Nizam, A. (1998). Applied
regression analysis and other multivariate methods (3rd ed.). Pacific Grove:
Duxbury Press
Koh, P. N. (1997). Principles, practice and prospects of corporate governance: The
Malaysian legal framework: Asian Centre for Professional Development Sdn
Bhd.
Kohlbeck, M., and Mayhew, B. W. (2010). Valuation of firms that disclose related party
transactions. Journal of Accounting and Public Policy, 29(2), 115-137.
Kosnik, R. D. (1990). Effects of board demography and directors' incentives on
corporate greenmail decisions Academy of Management Journal, 33(1), 129-
150.
Krishnamurti, C., Sevic, A., and Sevic, Z. (2005). Legal environment, firm-level
corporate governance and expropriation of minority shareholders in Asia.
Economics of Planning, 38(1), 85.
Kroszner, R. S. (1998). On the political economy of banking and financial regulatory
reform in emerging markets. Working Paper. Center for Research in Security
Prices, Graduate School of Business, University of Chicago.
Krueger, A. O. (1974). The political economy of the rent-seeking society. The American
Economic Review, 64(3), 291-303.
Kwack, S. Y. (2000). An empirical analysis of the factors determining the financial
crisis in Asia. Journal of Asian Economics, 11(2), 195-206.
La Porta, R., Lopez-de-Silanes, F., and Shleifer, A. (1999). Corporate ownership around
the world. The Journal of Finance, 54(2), 471-517.
La Porta, R., Lopez-de-Silanes, F., Shleifer, A., and Vishny, R. W. (2000a). Agency
problems and dividend policies around the world. The Journal of Finance,
55(1), 1-33.
La Porta, R., Lopez-de-Silanes, F., Shleifer, A., and Vishny, R. (2000b). Investor
protection and corporate governance. Journal of Financial Economics, 58(1-2),
3-27.
La Porta, R., Lopez-de-Silanes, F., Shleifer, A., and Vishny, R. (2002). Investor
protection and corporate valuation. The Journal of Finance, 57(3), 1147-1170.
La Porta, R., Lopez-de-Silanes, F., Shleifer, A., Vishny, R. (1998). Law and finance.
Journal of Political Economy, 106(6), 1115-1155.

306
La Porta, R., Lopez-de-Silanes, F., Shleifer, A., Vishny, R. (1997). Legal determinants
of external finance. Journal of Finance, 52(3), 1131-1150.
Laeven, L. A. (1999). Risk and efficiency in East Asian banks. World Bank Policy
Research Working Paper Series. World Bank.
Lane, P. J., Cannella, A. A., & Lubatkin, M. H. (1998). Agency problems as
antecedents to unrelated mergers and diversification: Amihud and Lev
reconsidered. Strategic Management Journal, 19(6), 555-578.
Lansberg, I., Perrow, E. L., and Rogolsky, S. (1988). Editors' notes. Family Business
Review, 1(1), 1-8.
Lau, S. T., Lee, C. T., and McInish, T. H. (2002). Stock returns and beta, firms size,
E/P, CF/P, book-to-market, and sales growth: Evidence from Singapore and
Malaysia. Journal of Multinational Financial Management, 12(3), 207-222.
Le Breton-Miller, I., and Miller, D. (2009). Agency vs. stewardship in public family
firms: A social embeddedness reconciliation. Entrepreneurship: Theory and
Practice, 33(6), 1123-1169.
Lee, J. (2006). Family firm performance: Further evidence. Family Business Review,
19(2), 103-114.
Lee, J. (2004). The effects of family ownership and management on firm performance.
SAM Advanced Management Journal, 69(4), 46-53.
Lee, J., & Li, H. (2009). Wealth doesn't last three generations : How family businesses
can maintain prosperity. Singapore: World Scientific Publishing Co. Pte. Ltd.
Lee, R. P., and Grewal, R. (2004). Strategic responses to new technologies and their
impact on firm performance. Journal of Marketing, 68(4), 157-171.
Lee, S. W., & Mullineaux, D. J. (2004). Monitoring, financial distress, and the structure
of commercial lending syndicates. Financial Management, 33(3), 107-130.
Lemmon, M. L., and Lins, K. V. (2003). Ownership structure, corporate governance,
and firm value: Evidence from the East Asian financial crisis. The Journal of
Finance, 58(4), 1445-1468.
Li, M., Ramaswamy, K., & Petitt, B. (2006). Business groups and market failures: A
focus on vertical and horizontal strategies. Asia Pacific Journal of Management,
23(4), 439-452.
Liew, P. K. (2007). Corporate governance reforms in Malaysia: The key leading
players' perspectives. Corporate Governance: An International Review, 15(5),
724-740.
Lin, C.-P., & Chuang, C.-M. (2011). Principal-principal conflicts and IPO pricing in an
emerging economy. Corporate Governance: An International Review, 19(6),
585-600.

307
Lin, K., Piotroski, J.D., Tan, J., Yang, Y.G. (2011b). Exit as voice: The (un)intended
consequence of independent director resignations in an emerging economy.
Working Paper.
Lindbeck, A., & Weibull, J. W. (1988). Altruism and time consistency: The economics
of fait accompli. Journal of Political Economy, 96(6), 1165.
Lindenberg, E. B., and Ross, S. A. (1981). Tobin's q ratio and industrial organization.
The Journal of Business, 54(1), 1-32.
Lins, K. V. (2003). Equity ownership and firm value in emerging markets. The Journal
of Financial and Quantitative Analysis, 38(1), 159-184.
Lipton, M., and Lorsch, J. W. (1992). A modest proposal for improved corporate
governance. The Business Lawyer, 48(1), 59-78.
Liu, Y., Ahlstrom, D., & Yeh, K. S. (2006). The separation of ownership and
management in Taiwan's public companies: An empirical study. International
Business Review, 15(4), 415-435.
Liu, G., Sun, J. (2010). Director tenure and independent audit committee effectiveness.
International Research Journal of Finance and Economics, 51, 176-189.
Liu, W., Yang, H., & Zhang, G. (2010). Does family business excel in firm
performance? An institution-based view. Asia Pacific Journal of Management,
29(4),965-987..
Lo, A. W. Y., Wong, R. M. K., and Firth, M. (2010). Can corporate governance deter
management from manipulating earnings? Evidence from related-party sales
transactions in China. Journal of Corporate Finance, 16(2), 225-235.
Lockett, A., & Wright, M. (2001). The syndication of venture capital investments.
Omega, 29(5), 375-390.
Loderer, C., & Martin, K. (1997). Executive stock ownership and performance tracking
faint traces. Journal of Financial Economics, 45(2), 223-255.
Loy, T. C. J. (2010). Dynasting across cultures: A grounded theory of Malaysian
chinese family firms. Dissertation for Doctor of Philosophy, University of
Minnesota.
Lubatkin, M. H., Lane, P. J., Collin, S., & Very, P. (2005). An embeddedness framing
of governance and opportunism : Towards a cross-nationally accomodating
theory of agency. Journal of Organizational Behavior, 28(1), 43-58.
Lubatkin, M., & Shrieves, R. E. (1986). Towards reconciliation of market performance
measures to strategic management research. Academy of Management Review,
11(3), 497-512.
Ma, L., Ma, S., Tian, G. (2012, 27th August). Founding-family control, information
opacity, and cost of debt: Evidence from China. Paper presented at the 25th

308
Australasian Finance and Banking Conference 2012, University of New South
Wales, Australia.
MacKinlay, A. C. (1997). Event studies in economics and finance. Journal of Economic
Literature, 35(1), 13-39.
MacMillan, K., & Downing, S. (1999). Governance and performance: Goodwill
hunting. Journal of General Management, 24(3), 11-21.
Malhotra, N. K. (2004). Marketing research : An applied orientation (4th ed.). New
Jersey: Pearson Prentice Hall.
Malkiel, B., and Xu, Y. (2001). Idiosyncratic risk and security returns. Paper presented
at the American Finance Association (AFA) 2001 Meetings, New Orleans, USA.
Manzi, J. (2007). A pox on Sarbox. National Review, 59(8), 34-36.
Markowitz, H. (1952). Portfolio selection. The Journal of Finance, 7(1), 77-91.
Markowitz, H. (1959). Portfolio selection : Efficient diversification of investments (1st
ed.). New York, USA: John Wiley and Sons, Inc.
Mason, E. S. (1939). Price and production policies of large-scale enterprise. The
American Economic Review, 29(1), 61-74.
Maury, B. (2006). Family ownership and firm performance: Empirical evidence from
Western European corporations. Journal of Corporate Finance, 12(2), 321-341.
Maury, B., and Pajuste, A. (2005). Multiple large shareholders and firm value. Journal
of Banking & Finance, 29(7), 1813-1834.
Mayer, C. (1990). Financial systems, corporate finance, and economic development. In
R. G. Hubbard (Ed.), Asymmetric information, corporate finance and investment
Chicago: University of Chicago Press.
McConaughy, D. L., Walker, M. C., Henderson Jr, G. V., and Mishra, C. S. (1998).
Founding family controlled firms: Efficiency and value. Review of Financial
Economics, 7(1), 1-19.
McConnell, J. J., McKeon, S. B., and Xu, W. (2010). Corporate governance and
ownership structure. In H. K. Baker and R. Anderson (Eds.), Corporate
governance : A synthesis of theory, research and practice (pp. 303-322).
Hoboken, New Jersey: John Wiley and Sons.
McConnell, J. J., and Muscarella, C. J. (1985). Corporate capital expenditure decisions
and the market value of the firm. Journal of Financial Economics, 14(3), 399-
422
McConnell, J. J., and Servaes, H. (1990). Additional evidence on equity ownership and
corporate value. Journal of Financial Economics, 27(2), 595-612.

309
McConnell, J. J., and Servaes, H. (1995). Equity ownership and the two faces of debt.
Journal of Financial Economics, 39(1), 131-157.
McConnell, J. J., Servaes, H., & Lins, K. V. (2008). Changes in insider ownership and
changes in the market value of the firm. Journal of Corporate Finance, 14(2),
92-106.
McGuire, J., & Matta, E. (2003). CEO stock options : The silent dimension of
ownership Academy of Management Journal, 46(2), 255-265.
McGuire, J. B., Schneeweis, T., & Branch, B. (1990). Perceptions of firm quality: A
cause or result of firm performance. Journal of Management, 16(1), 167-180.
McKinsey. (2000). Investor opinion survey on corporate governance. Survey. The
McKinsey and Company.
Megginson, W. L., & Netter, J. M. (2001). From state to market: A survey of empirical
studies on privatization. Journal of Economic Literature, 39(2), 321-389.
Mehran, H. (1995). Executive compensation structure, ownership, and firm
performance. Journal of Financial Economics, 38(2), 163-184.
Menon, J. (2009). Macroeconomic management amid ethnic diversity: Fifty years of
Malaysian experience. Journal of Asian Economics, 20(1), 25-33.
Ming, J., & Wong, T. J. (2003). Earnings management and tunneling through related
party transactions : Evidence from Chinese corporate groups. Paper presented
at the EFA 2003 Annual Conference.
Mishra, C. S., and McConaughy, D. L. (1999). Founding family control and capital
structure: The risk of loss of control and the aversion to debt. Entrepreneurship:
Theory and Practice, 23(4), 53-64.
Mishra, C. S., Randoy, T., and Jenssen, J. I. (2001). The effect of founding family
influence on firm value and corporate governance. Journal of International
Financial Management and Accounting, 12(3), 235-259.
Mishkin, F., & Eakins, S. (2003). Financial markets and institutions. Boston: Addison
Wesley.
Mitton, T. (2002). A cross-firm analysis of the impact of corporate governance on the
East Asian financial crisis. Journal of Financial Economics, 64(2), 215-241.
Modigliani, F., and Pogue, G. A. (1974). An introduction to risk and return: Concepts
and evidence. Financial Analysts Journal, 30(3), 69-86.
Mollah, S., Farooque, O. A., & Karim, W. (2012). Ownership structure, corporate
governance and firm performance: Evidence from an African emerging market.
Studies in Economics and Finance, 29(4), 301-319.
Monks, R., and Minow, N. (1995). Corporate governance. Cambridge: Basil Blackwell.

310
Montgomery, C. A., and Wernerfelt, B. (1988). Diversification, Ricardian Rents, and
Tobin's q. The Rand Journal of Economics, 19(4), 623-632.
Morck, R., Stangeland, D., Yeung, B. (2001). Inherited wealth, corporate control and
economic growth: The Canadian disease. NBER Working Paper 6814. National
Bureau of Economic Research.
Morck, R., Shleifer, A., and Vishny, R. W. (1988). Management ownership and market
valuation: An empirical analysis. Journal of Financial Economics, 20(January-
March), 293-315.
Morck, R., Wolfenzon, D., and Yeung, B. (2005). Corporate governance, economic
entrenchment, and growth. Journal of Economic Literature, 43(3), 655-720.
Morck, R., Yeung, B. (2003). Agency problems in large family business groups.
Entrepreneurship, Theory and Practice, 27(4), 367-382.
Morck, R., Yeung, B., & Yu, W. (2000). The information content of stock markets:
Why do emerging markets have synchronous stock price movements? Journal of
Financial Economics, 58(1-2), 215-260.
Mossin, J. (1966). Equilibrium in a capital asset market. Econometrica, 34(4), 768-783.
MSWG. (2010, 30th August). AGM/EGM Weekly Watch. STAR. Retrieved 3rd
November, 2010, from
http://biz.thestar.com.my/news/story.asp?file=/2010/8/30/business/6936848&sec
=business
MSWG. (2012). Minority Shareholder Watchdog Group. Retrieved 10th June, 2012,
from http://www.mswg.org.my/web/page.php?pid=36andmenu=sub
Munir, S., Salleh, N.M. (2010, 4th-5th January). Related party transactions, family
ownership and earnings quality: A study of Malaysian firms. Paper presented at
the Proceedings of Journal of Contemporary Accounting and Economics
(JCAE)/ Seoul National University (SNE) Joint Symposium, Seoul National
University, Seoul, South Korea.
Munir, S., and Gul, R. J. (2011). Related party transactions, family firms and firm
performance: Some Malaysian evidence. Paper presented at the Finance and
Corporate Governance Conference, La Trobe University, Victoria, Australia.
Murphy, K. M., Shleifer, A., & Vishny, R. W. (1993). Why is rent-seeking so costly to
growth? The American Economic Review, 83(2), 409-414.
Mursitama, T. (2006). Creating relational rents: The effect of business groups on
affiliated firms' performance in Indonesia. Asia Pacific Journal of Management,
23(4), 537-557.
Myers, S. C., and Majluf, N. S. (1984). Corporate financing and investment decisions
when firms have information that investors do not have. Journal of Financial
Economics, 13(2), 187-221.
311
Nambiar, S. (2011). Trade, investment and reform : Challenges for Malaysia. Journal of
Economic Cooperation And Development, 32(1), 31-54.
Nanda, V. (1991). On the good news in equity carve-outs. The Journal of Finance,
46(5), 1717-1737.
Nenova, T. (2003). The value of corporate voting rights and control : A cross-country
analysis. Journal of Financial Economics, 68(March), 325-351.
Ngui, C. Y. K. (2002). Asian family businesses: From riches to rags ? Malaysian
Business, 2, 27.
North, D. C. (1994). Economic performance through time. The American Economic
Review, 84(3), 359-368.
North, D. C. (1990). Institutions, institutional change and economic performance. New
York: Norton.
Norusis, M. J. (2000). SPSS 10.0 Guide to data analysis. Upper Saddle River: Prentice-
Hall Inc.
OECD. (2011). Corporate governance. Retrieved 1st December, 2012, from
http://www.oecd.org/investment/toolkit/implementingthepfi/corporategovernanc
e/44931152.pdf
OECD. (2009). Guide on fighting abusive related party transactions in Asia.
OECD. (1999). Principles of corporate governance. Paris: Organisation for Economic
Co-operation and Development (OECD).
OECD. (2004). OECD principles of corporate governance. Paris: Organisation For
Economic Co-operation And Development (OECD)
Oh, E. (2011). from
http://www.deloitte.com/view/en_MY/my/mypressroom/myinthenews/myinthen
ews-2011/6b3a31c3a5614310VgnVCM3000001c56f00aRCRD.htm
Oh, S. N. (1998). Towards a sustainable banking sector - Malaysia. from
http://www.adb.org/documents/books/rising_to_the_challenge/malaysia/numal_
bnk.pdf
O'Brien, J. P. (2003). The capital structure implications of pursuing a strategy of
innovation. Strategic Management Journal, 24(5), 415-431.
Oswald, S. L., and Jahera Jr, J. S. (1991). The influence of ownership on performance :
An empirical study. Strategic Management Journal, 12(4), 321-326.
Othman, Z., & Rahman, A. R. (2010). Ethics in Malaysian corporate governance
practices. International Journal of Business And Social Science, 1(3), 1-12.
312
Ow-Yong, K., & Cheah, K. G. (2000). Corporate governance codes : A comparison
between Malaysia and the UK. Corporate Governance : An International
Review, 8(2), 125-132.
Pallant, J. (2005). SPSS survival manual : A step by step guide to data analysis using
SPSS for windows (version 12) (2nd ed.). Sydney: Open University Press :
Ligare Pty Ltd.
Pascoe, J., & Rachagan, S. (2005). Key development in corporate law reform in
Malaysia. Singapore Journal Of Legal Studies, 93-113.
Patton, A., & Baker, J. C. (1987). Why won't directors rock the boat? Harvard Business
Review, 65(6), 10-18.
Peng, M. W. (2003). Institutional transitions and strategic choices. Academy of
Management Review, 28(2), 275-296.
Peng, M. W. (2004). Outside directors and firm performance during institutional
transitions. Strategic Management Journal, 25(5), 453-471.
Peng, M. W., Buck, T., & Filatotchev, I. (2003). Do outside directors and new managers
help improve firm performance? An exploratory study in Russian privatization.
Journal of World Business, 38(4), 348-360.
Peng, M., & Delios, A. (2006). What determines the scope of the firm over time and
around the world? An Asia Pacific perspective. Asia Pacific Journal of
Management, 23(4), 385-405.
Peng, M. W., & Heath, P. S. (1996). The growth of the firm in planned economies in
transition: Institutions, organizations, and strategic choice. Academy of
Management. The Academy of Management Review, 21(2), 492-528.
Peng, M. W., and Jiang, Y. (2010). Institutions behind family ownership and control in
large firms. Journal of Management Studies, 47(2), 253-273.
Peng, M. W., Sun, S., Pinkham, B., & Chen, H. (2009). The institution-based view as a
third leg for a strategy tripod. Academy of Management Perspectives, 23(3), 63-
81.
Peng, M. W., Wang, D., & Jiang, Y. (2008). An institution-based view of international
business strategy : A focus on emerging economies. Journal of International
Business Studies, 39(5), 920-936.
Peng, W. Q., Wei, K. C. J., and Yang, Z. (2011). Tunneling or propping: Evidence from
connected transactions in China. Journal of Corporate Finance, 17(2), 306-325.
Perera, S. (2011). Corporate ownership and control : Corporate governance and
development in Sri Lanka (1st ed. Vol. 6). Singapore: World Scientific
Publishing Co.Pte.Ltd.
Perfect, S. B., and Wiles, K. W. (1994). Alternative constructions of Tobin's q: An
empirical comparison. Journal of Empirical Finance, 1(3-4), 313-341.

313
Perry, T., & Shivdasani, A. (2005). Do boards affect performance? Evidence from
corporate restructuring. The Journal of Business, 78(4), 1403-1432.
Pizzo, M. (2011). Related party transactions under a contingency perspective. Journal
of Management and Governance, June, 1-22.
Porter, M. (1980). Competitive strategy: Techniques for analysing industries and
competitors. New York, USA: Free Press.
Powers, E. A. (2003). Deciphering the motives for equity carve-outs. Journal of
Financial Research, 26(1), 31-50.
Prencipe, A., & Bar-Yosef, S. (2011). Corporate governance and earnings management
in family-controlled companies. Journal of Accounting, Auditing & Finance,
26(2), 199-227.
Pricewaterhouse Coopers. (1998). Corporate governance : Survey of public-listed
companies. Pricewaterhouse Coopers.
Pukthuanthong-Le, K., & Visaltanachoti, N. (2009). Idiosyncratic volatility and stock
returns: A cross country analysis. Applied Financial Economics, 19(16), 1269-
1281
Purkayastha, S. (2013). Impact of macro-economic environment on diversification-
performance relationship : A cross country study of India and Japan. Working
Paper. Indian Council For Research On International Economic Relations.
Qian, M., Pan, H., and Yeung, B. Y. (2011). Expropriation of minority shareholders in
politically connected firms. Paper presented at the Finance and Corporate
Governance Conference 2011, La Trobe University, Victoria, Australia.
Qian, J., & Zhao, S. (2011). Shareholder rights and tunneling: Evidence from a quasi-
natural experiment. Working Paper. Boston College & Shanghai University of
Finance and Economics.
Rachagan, S. (2006). Agency costs in controlled companies. Singapore Journal of Legal
Studies, 264-284.
Radcliffe, R. C. (1997). Investment : Concepts, analysis, strategy. New York: Addison-
Wesley.
Rahman, A. R. (2006). Effective corporate governance (1st ed.). Shah Alam: University
Publication Centre (UPENA), Universiti Teknologi Mara.
Rajan, R. G. (1992). Insiders and outsiders: The choice between informed and arm's-
length debt. The Journal of Finance, 47(4), 1367-1400.
Rajan, R. G., & Zingales, L. (1998). Which capitalism ? Lessons from the East Asian
crisis. Journal of Applied Corporate Finance, 11(3), 40-48.

314
Rajgopal, S., & Shevlin, T. (2002). Empirical evidence on the relation between stock
option compensation and risk taking. Journal of Accounting and Economics,
33(2), 145-171.
Rajulton, F. (2001). The fundamentals of longitudinal research: An overview. Special
Issue on Longitudinal Methodology, Canadian Studies in Population, 28(2),
169-185.
Ramaswami, S.N., K. Srivastava, R., and Bhargava, M. (2009). Market-based
capabilities and financial performance of firms: Insights into marketing's
contribution to firm value. Journal of the Academy of Marketing Science, 37(2),
97-116.
Rechner, P. L., and Dalton, D. R. (1991). CEO duality and organizational performance:
A longitudinal analysis. Strategic Management Journal, 12(2), 155.
Redding, S. G. (1990). The spirit of Chinese capitalism. New York: De Gruyter.
Rediker, K. J., and Seth, A. (1995). Board of directors and substitution effects of
alternative governance mechanisms. Strategic Management Journal, 16(2), 85-
99.
Reddy, K., Locke, S. and Scrimgeour, F. (2010). The efficacy of principle-based
corporate governance practices and firm financial performance: An empirical
investigation. International Journal of Managerial Finance, 6(3), 190-219.
Reeb, D. M., Mansi, S. A., & Allee, J. M. (2001). Firm internationalization and the cost
of debt financing: Evidence from non-provisional publicly traded debt. Journal
of Financial and Quantitative Analysis, 36(03), 395-414.
Riyanto, Y. E., & Toolsema, L. A. (2008). Tunneling and propping: A justification for
pyramidal ownership. Journal of Banking & Finance, 32(10), 2178-2187.
Rizov, M., & Croucher, R. (2009). Human resource management and performance in
European firms. Cambridge Journal of Economics, 33(2), 253-272.
Roll, R. (1988). R2. The Journal of Finance, 43(3), 541-566.
Rosenstein, S., & Rush, D. F. (1990). The stock return performance of corporations that
are partially owned by other corporations. Journal of Financial Research, 13(1),
39.
Ross, S. A. (1977). The determination of financial structure: The incentive-signalling
approach. Bell Journal of Economics, 8(1), 23-40.
Ryngaert, M. D., and Thomas, S. E. (2007). Related party transactions: Their origins
and wealth effects. Working Paper.
Salancik, G. (1977). Commitment and control of organizational behavior and belief. In
New directions in organizational behavior (pp. 1-54). Chicago: St. Claire Press.

315
Salim, M. R. (2009). Company law reform in Malaysia: The role and duties of directors.
International Company And Commercial Law Review, 142, 1-15.
San Martin-Reyna, J. M., and Duran-Encalada, J. A. (2012). The relationship among
family business, corporate governance and firm performance: Evidence from the
Mexican stock exchange. Journal of Family Business Strategy, 3(2), 106-117.
Sarkar, J., Sarkar, S. (2008). Debt and corporate governance in emerging economies:
Evidence from India. Economics of Transition, 16(2), 293-334.
Sarkar, J., and Sarkar, S. (2000). Large shareholder activism in corporate governance in
developing countries: Evidence from India. International Review of Finance,
1(3), 161.
Saunders, M., Lewis, P., Thornhill, A. (2009). Research methods for business students
(5th ed.): Pearson Education.
Schipper, K. (1989). Commentary on earnings management. Accounting Horizons, 3(4),
91-102.
Schulze, W. S., & Gedajlovic, E. R. (2010). Whither family business? Journal of
Management Studies, 47(2), 191-204.
Schulze, W. S., Lubatkin, M. H., Dino, R. N., and Buchholtz, A. K. (2001). Agency
relationships in family firms: Theory and evidence. Organization Science, 12(2),
99-116.
Schulze, W. S., Lubatkin, M. H., & Dino, R. N. (2002). Altruism, agency, and the
competitiveness of family firms. Managerial & Decision Economics, 23(4/5),
247-259.
Schulze, W. S., Lubatkin, M. H., and Dino, R. N. (2003). Exploring the agency
consequences of ownership dispersion among the directors of private family
firms. Academy of Management Journal, 46(2), 179.
Schulze, W. S., Lubatkin, M. H., & Dino, R. N. (2003). Toward a theory of agency and
altruism in family firms. Journal of Business Venturing, 18(4), 473-490.
Searle, P. (1999). The riddle of Malaysian capitalism : Rent-seekers or real capitalists ?
Honolulu: University of Hawaii Press.
Securities Commission (2007). The Malaysian code on corporate governance (Revised
2007). from http://www.sc.com.my/eng/html/cg/cg2007.pdf
Securities Commission (2011a). Corporate governance blueprint 2011. Retrieved 11th
January, 2012, from
http://www.sc.com.my/eng/html/cg/cg2011/pdf/cg_blueprint2011.pdf
Securities Commission (2011b). Corporate governance blueprint 2011 : Frequently
asked questions. Retrieved 10th June, 2012, from
http://www.sc.com.my/main.asp?pageid=1089andmenuid=1009andnewsid=andl
inkid=andtype=

316
Securities Commission (2011c). Former Transmile directors sentenced to jail and fined
for misleading disclosures. Retrieved 14th July, 2012, from
http://www.sc.com.my/main.asp?pageid=379andlinkid=2963andyearno=2011an
dmod=paper
Securities Commission (2012). Malaysian code on corporate governance 2012.
Retrieved 10th June, 2012, from http://www.sc.com.my/eng/html/cg/cg2012.pdf
Setia-Atmaja, L., Tanewski, G. A., & Skully, M. (2009). The role of dividends, debt and
board structure in the governance of family controlled firms. Journal of Business
Finance & Accounting, 36(7-8), 863-898.
Shapiro, S. P. (2005). Agency theory. Annual Review of Sociology, 31, 263-284.
Sharma, K. (2001). The underlying constraints on corporate bond market development
in South East Asia. World Development, 29(8), 1405-1419.
Sharpe, W. F. (1964). Capital asset prices: A theory of market equilibrium under
conditions of risk. The Journal of Finance, 19(3), 425-442.
Shim, D. S. (2006). Governance in the markets: Malaysian perspective. Journal of
Financial Crime, 13(3), 300-322.
Shintani, A. (2006). Sample size estimation and power computation on paired or
skewed continuous data. Retrieved 19th June, 2012, from
http://biostat.mc.vanderbilt.edu/wiki/pub/Main/GCRCNoonWorkshops/SampleS
izeEstimationandPowerComputationonPaired.pdf
Shirley, M. M., & Walsh, P. (2001). Public vs private ownership : The current state of
the debate. World Bank Policy Research Working Paper No. 2420. World Bank
Shleifer, A., Vishny, R.W. (1997). A survey of corporate governance. Journal of
Finance, 52(2), 737-783.
Shleifer, A., & Vishny, R. W. (1989). Management entrenchment: The case of manager-
specific investments. Journal of Financial Economics, 25(1), 123-139.
Shleifer, A., and Wolfenzon, D. (2002). Investor protection and equity markets. Journal
of Financial Economics, 66(1), 3-27.
Short, H., and Keasey, K. (1999). Managerial ownership and the performance of firms:
Evidence from the UK. Journal of Corporate Finance, 5(1), 79-101.
Short, H. (1994). Ownership, control, financial structure and the performance of firms.
Journal of Economic Surveys, 8(3), 203.
Shum, W. C., and Tang, G. Y. N. (2005). Common risk factors in returns in Asian
emerging stock markets. International Business Review, 14(6), 695-717.
Singh, B. (2008, February 16th-29th, 2008). Growing coffers : Aggregate wealth of
Malaysia's 40 richest. Malaysian Business.

317
Singh, K. (2007). Quantitative Social Research Methods. New Delhi, India: SAGE
Publications.
Singh, M., and Davidson III, W. N. (2003). Agency costs, ownership structure and
corporate governance mechanisms. Journal of Banking and Finance, 27(5), 793-
816.
Sloan, R. G. (2001). Financial accounting and corporate governance: A discussion.
Journal of Accounting and Economics, 32(1-3), 335-347.
Soederberg, S. (2003). The promotion of 'Anglo-American' corporate governance in the
South: Who benefits from the new international standard? Third World
Quarterly, 24(1), 7-27.
Song, M. (2010). Remain wary of financial fraud as economy improves. Retrieved 9th
November, 2012, from http://www.theedgemalaysia.com/contact-us/158268-
remain-wary-of-financial-fraud-as-economy-improves.html
Spear, Conforth, & Aiken. (2007). Governance and social enterprise. Paper presented
at the SER Conference, Southbank University, UK.
Sraer, D., and Thesmar, D. (2007). Performance and behavior of family firms :
Evidence from the French stock market. Journal of the European Economic
Association, 5(4), 709-751.
Srinivasan, S., and Hanssens, D. M. (2009). Marketing and firm value: Metrics,
methods, findings, and future directions. Journal of Marketing Research (JMR),
46(3), 293-312.
Stein, J. C. (1997). Internal capital markets and the competition for corporate resources.
The Journal of Finance, 52(1), 111-133.
Stevens, J. (1996). Applied multivariate statistics for the social sciences (3rd ed.).
Mahway, NJ: Lawrence Erlbaum.
Stiglitz, J., & Weiss, A. (1983). Credit rationing in markets with incomplete
information. American Economic Review, 71(3), 393-410.
Storey, D. J. (1994). Understanding the small business sector London: Routledge.
Stulz, R. (1988). Managerial control of voting rights: Financing policies and the market
for corporate control. Journal of Financial Economics, 20(January-March), 25-
54.
Stulz, R. (1990). Managerial discretion and optimal financing policies. Journal of
Financial Economics, 26(1), 3-27.
Sufi, A. (2007). Information asymmetry and financing arrangements: Evidence from
syndicated loans. The Journal of Finance, 62(2), 629-668.
Suhomlinova, O. (2006). Toward a model of organizational co-evolution in transition
economies. Journal of Management Studies, 43(7), 1537-1558.

318
Sulong, Z., Nor, F.M. (2008). Dividends, ownership structure and board governance on
firm value : Empirical evidence from Malaysian listed firms. Malaysian
Accounting Review, 7(2), 55-94.
Tam, O. K., and Tan, M. G.-S. (2007). Ownership, governance and firm performance in
Malaysia. Corporate Governance: An International Review, 15(2), 208-222.
Thaler, R. H., and Shefrin, H. M. (1981). An economic theory of self-control. Journal of
Political Economy, 89(2), 392-406.
Theil, H. (1978). Introductory econometrics. Englewood Cliffs, New Jersey: Prentice-
Hall.
Thillainathan, R. (1999). Corporate governance and restructuring in Malaysia - A
review of markets, mechanisms, agents and the legal infrastructure (World
Bank/OECD survey of corporate governance): World Bank.
Thomsen, S., and Pedersen, T. (2000). Ownership structure and economic performance
in the largest European companies. Strategic Management Journal, 21(6), 689-
705.
Tihanyi, L., & Hegarty, W. H. (2007). Political interests and the emergence of
commercial banking in transition economies. Journal of Management Studies,
44(5), 788-813.
Tihanyi, L., Johnson, R. A., Hoskisson, R. E., & Hitt, M. A. (2003). Institutional
ownership differences and international diversification : The effects of board of
directors and technological opportunity Academy of Management Journal,
46(2), 195-211.
Tobin, J. (1969). A general equilibrium approach to monetary theory. Journal of Money,
Credit and Banking, 1(1), 15-29.
Tobin, J. (1978). Monetary policies and the economy: The transmission mechanism.
Southern Economic Journal, 44(3), 421-431.
Tom, A., and B. Buchanan. 2007. Visual portfolio statistics. Accounting Research
Journal 20 (1):60-68.
Tong, H., & Wei, S.-J. (2011). The composition matters: Capital inflows and liquidity
crunch during a global economic crisis. Review of Financial Studies, 24(6),
2023-2052.
Tosi, J. H. L., & Gomez-Mejia, L. R. (1994). CEO compensation monitoring and firm
performance. Academy of Management Journal, 37(4), 1002-1016.
Treacy, W., & Carey, M. (2000). Credit risk rating at large US banks. Journal of
Banking & Finance, 24(1-2), 167-201.
Treynor, J. L. (1961). Market value, time, and risk. Unpublished manuscript.
319
Treynor, J. L. (1962). Toward a theory of market value of risky assets.Unpublished
manuscript.
Treynor, J. L. (1999). Toward a theory of market value of risky assets. In R. A.
Korajczyk (Ed.), Asset pricing and portfolio performance: Models, strategy and
performance metrics (pp. 15–22). London: Risk Books.
Tversky, A., Kahneman, D. (1986). Rational choice and the framing of decisions.
Journal of Business 59(4), S251-S278.
USGA. (2011). Government corporations: Profiles of existing government corporations:
BiblioGov.
Vafeas, N. (2003). Length of board tenure and outside director independence. Journal of
Business Finance and Accounting, 30(7-8), 1043-1064.
Vafeas, N., and Theodorou, E. (1998). The relationship between board structure and
firm performance in the UK. The British Accounting Review, 30(4), 383-407.
Van Horne, J. C. (1980). Financial management and policy (5th ed.). Englewood Cliffs:
Prentice Hall.
Vance, S. (1983). Corporate leadership: Boards, directors and strategy. New York:
McGraw Hill.
Vicknair, D., Hickman, K., Carnes, K. (1993). A note on audit committee
independence: Evidence from the NYSE on "grey" area directors. Accounting
Horizons, 7, 53-57.
Villalonga, B. n., & Amit, R. (2010). Family control of firms and industries. Financial
Management (Blackwell Publishing Limited), 39(3), 863-904.
Villalonga, B., and Amit, R. (2006). How do family ownership, control and
management affect firm value? Journal of Financial Economics, 80(2), 385-417.
Von Thadden, E. L. (1995). Long term contracts, short term investment and monitoring.
Review of Economic Studies, 62(4), 557-575.
Wahab, E., Haron, H., Char, L. L., and Yahya, S. (2011). Does corporate governance
matter? Evidence from related party transactions in Malaysia. In International
Corporate Governance (Vol. 14, pp. 131-164): Emerald Group Publishing
Limited.
Wahab, E. A. A., How, J. C. Y., and Verhoeven, P. (2007). The impact of the Malaysian
Code on Corporate Governance: Compliance, institutional investors and stock
performance. Journal of Contemporary Accounting and Economics, 3(2), 106-
129.
Wain, B. (2009). Malaysian maverick: Mahathir Mohamad in turbulent times. New
York: Palgrave Macmillan.

320
Wan, W. P. (2005). Country resource environments, firm capabilities, and corporate
diversification strategies. Journal of Management Studies, 42(1), 161-182.
Ward, J. L. (1987). Keeping the family business healthy: How to plan for continuing
growth, profitability and family leadership. San Francisco: Jossey-Bass.
Ward, J. L. (1988). The special role of strategic planning for family businesses. Family
Business Review, 1(2), 105-117.
Watts, R. L., Zimmerman, J.L. (1983). Agency problems, auditing, and the theory of the
firm: Some evidence. Journal of Law and Economics, 26(3), 613-633.
Watts, R. L., & Zimmerman, J. (1978). Auditors and the determination of accounting
standards, an analysis of the lack of independence. Working Paper GPB7806.
University of Rochester, Graduate School of Management.
Weir, C., Laing, D., and McKnight, P. J. (2002). Internal and external governance
mechanisms: Their impact on the performance of large UK public companies.
Journal of Business Finance and Accounting, 29(5-6), 579-611.
Weisbach, M. (1988). Outside directors and CEO turnover. Journal of Financial
Economics, 20(January-March), 431-460.
Welbourne, T. M., & Mejia, L. R. G. (1995). Gainsharing: A critical review and a future
research agenda. Journal of Management, 21(3), 559-609.
Westphal, J. D. (1999). Collaboration in the boardroom: Behavioral and performance
consequences of CEO-board social ties. Academy of Management Journal,
42(1), 7-24.
Wilkinson, B. (1996). Culture, institutions and business in East Asia. Organization
Studies, 17(3), 421-447.
Williamson, O. E. (1985). The economic institutions of capitalism: Firms, markets,
relational contracting. New York: Free Press.
Williamson, P. J. (1997). Asia's new competitive game. Harvard Business Review,
75(5), 55-67.
Wiseman, R. M., & Gomez-Mejia, L. R. (1998). A behavioral agency model of
managerial risk taking. The Academy of Management Review, 23(1), 133-153.
Wiwattanakantang, Y. (2001). Controlling shareholders and corporate value: Evidence
from Thailand. Pacific-Basin Finance Journal, 9(4), 323-362.
Woo, C. Y., Willard, G. E., & Daellenbach, U. S. (1992). Spin-off performance: A case
of overstated expectations? Strategic Management Journal, 13(6), 433-447.
Woodruff, D. M. (1999). Money unmade : Barter and the fate of Russian capitalism.
Ithaca, NY: Cornell University Press.

321
Woolridge, J. R. (1988). Corporate decline and corporare restructuring : Is a myopic
stock market to blame ? Journal of Corporate Finance, 1(1), 26-36.
World Bank. (2005). Corporate governance country assessment : Malaysia.
Washington D.C.: World Bank
Wright, M., Filatotchev, I., Hoskisson, R. E., & Peng, M. W. (2005). Strategy research
in emerging economies: Challenging the conventional wisdom. Journal of
Management Studies, 42(1), 1-33.
Wruck, K. H. (1989). Equity ownership concentration and firm value : Evidence from
private equity financings. Journal of Financial Economics, 23(1), 3-28.
Xu, X., and Wang, Y. (1999). Ownership structure and corporate governance in Chinese
stock companies. China Economic Review, 10(1), 75-98.
Xu, X., Wang, Y. (1997). Ownership structure, corporate governance and corporate
performance : The case of Chinese stock companies. Unpublished Policy
Research Working Paper. World Bank.
Yammeesri, J., Lodh, S.C. (2004). Is family ownership a pain or gain to firm
performance ? The Journal of American Academy of Business, Cambridge,
4(1/2), 263-270.
Yeung, H. W. C. (2006). Change and continuity in Southeast Asian ethnic Chinese
business. Asia Pacific Journal of Management, 23(3), 229-254.
Yeh, Y.-h., Lee, T.-s., and Woidtke, T. (2001). Family control and corporate
governance: Evidence from Taiwan. International Review of Finance, 2(1/2),
21.
Yeh, Y.-H., Shu, P.-G., and Su, Y.-H. (2012). Related-party transactions and corporate
governance: The evidence from the Taiwan stock market. Pacific-Basin Finance
Journal, 20(5), 755-776.
Yermack, D. (1996). Higher market valuation of companies with a small board of
directors. Journal of Financial Economics, 40(2), 185-211.
Yiu, D., Bruton, G. D., & Yuan, L. (2005). Understanding business group performance
in an emerging economy: Acquiring resources and capabilities in order to
prosper. Journal of Management Studies, 42(1), 183-206.
Yosha, O. (1995). Information disclosure costs and the choice of financing source.
Journal of Financial Intermediation, 4(1), 3-20.
Yoshikawa, T., & Rasheed, A. A. (2010). Family control and ownership monitoring in
family-controlled firms in Japan. Journal of Management Studies, 47(2), 274-
295.
Young, G. J., Stedham, Y., & Beekun, R. I. (2000). Boards of directors and the adoption
of a CEO performance evaluation process: Agency — and institutional —
Theory perspectives. Journal of Management Studies, 37(2), 277-296.

322
Young, M. N., Ahlstrom, D., & Bruton, G. (2004). The globalisation of corporate
governance in East Asia : The transnational solution. Management International
Review, 44(2), 31-50.
Young, M. N., Peng, M.W., Ahlstrom, D., Bruton, G.D., Jiang, Y. (2008). Corporate
governance in emerging economies: A review of the principal-principal
perspective. Journal of Management Studies, 45(1), 196-220.
Yunos, R. M., Smith, M., & Ismail, Z. (2010). Accounting conservatism and ownership
concentration. Journal of Business and Policy Research, 5(2), 1-15.
Yunos, R. H., Smith, M., Ismail, Z., Ahmad, S.A. (2011). Inside concentrated owners,
board of directors and accounting conservatism. Paper presented at the Annual
Summit on Business and Entrepreneurial Studies (ASBES 2011), Kuching,
Sarawak, Malaysia.
Zahra, S. A., & Filatotchev, I. (2004). Governance of the entrepreneurial threshold firm:
A knowledge-based perspective. Journal of Management Studies, 41(5), 885-
897.
Zhang, J., & Ma, H. (2009). Adoption of professional management in Chinese family
business: A multilevel analysis of impetuses and impediments. Asia Pacific
Journal of Management, 26(1), 119-139.
Zheng, Z., Anand, J., & Mitchell, W. (2005). A dual networks perspective on inter-
organizational transfer of R&D capabilities: International joint ventures in the
Chinese automotive industry. Journal of Management Studies, 42(1), 127-160.
Zhuang, J., Edwards, D., Capulong, M.V.A.E. (2001). Corporate governance and
finance in East Asia : A study of Indonesia, Republic of Korea, Malaysia,
Philippines and Thailand. Retrieved 29th January, 2011, from
http://adb.org/Documents/Books/Corporate_Governance/Vol1/default.asp
Zingales, L. (1994). The Value of the voting right: A study of the Milan Stock
Exchange experience. The Review of Financial Studies, 7(1), 125-148.
Zulkhibri, M. (2013). Bank-characteristics, lending channel and monetary policy in
emerging markets: Bank-level evidence from Malaysia. Applied Financial
Economics, 23(5), 347-362.

323
9.0 APPENDICES
9.1 APPENDIX A
9.1.1 List Of Public-listed Companies Utilised In This Research
No. Family Firms
1. A-Rank Bhd
2. Abric Bhd
3. Adventa Bhd
4. AHB Bhd
5. Ahmad Zaki Resources Bhd
6. AIC Corporation Bhd
7. Air Asia Bhd
8. Amalgamated Industrial Steel Bhd
9. Analabs Resources Bhd
10. Ann Joo Resources Bhd
11. APB Resources Bhd
12. APM Automotive Bhd
13. APP Industries Bhd
14. Asas Dunia Bhd
15. Asia File Corporation Bhd
16. Asia Pacific Land Bhd
17. Atis Corporation Bhd
18. Atlan Bhd
19. Atur Maju Resources Bhd
20. AutoAir bhd
21. AV Ventures Bhd
22. AandM Realty Bhd
23. Baneng Holding Bhd
24. Baswell Resources Bhd
25. Batu Kawan Bhd
26. BCB Bhd
27. Berjaya Land Bhd
28. Berjaya Sports Toto Bhd
29. Bintai Kinden Bhd
30. BLD Plantation Bhd
31. Bolton Bhd
32. Bonia Bhd
33. BoxPak Bhd
34. BP Plastic Bhd
35. Brem Holdings Bhd
36. Bright Packaging Bhd
37. BSL Corporation Bhd
38. BTM Resources Bhd
39. Cab Cakaran Bhd
40. Canone Bhd
41. CPBIP Bhd
42. CCK Consolidated Bhd

324
No. Family Firms
43. Century Bond Bhd
44. Century Logistic Bhd
45. Cepat Wawasan Bhd
46. Changhuat Corporation Bhd
47. Cheetah Corporation Bhd
48. Choo Bee Metal Bhd
49. Chuan Huat Resources Bhd
50. Classic Scenic Bhd
51. CNAsia Bhd
52. Coastal Contract Bhd
53. Cocoa Land Bhd
54. Comintel Bhd
55. Compugates Bhd
56. Country Heights Bhd
57. Crescendo Corporation Bhd
58. Crest Builder Bhd
59. CYL Corporation Bhd
60. CI Holding Bhd
61. Dataprep Bhd
62. Degem Bhd
63. Deleum Bhd
64. Delloyd Ventures Bhd
65. Dialog Group Bhd
66. DKLS Bhd
67. Dijaya Corporation Bhd
68. Dolomite Corporation Bhd
69. Dominant Enterprise Bhd
70. DPS Bhd
71. Dreamgate Bhd
72. DXN Bhd
73. DBE Resources Bhd
74. Eden Bhd
75. Ekovest Bhd
76. Emas Kiara Bhd
77. Encorp Bhd
78. Eng Kah Bhd
79. Eng Tex Bhd
80. Eonmetall Group Bhd
81. EP Manufacturing Bhd
82. Esthetic International Group Bhd
83. Eupe Bhd
84. Eurospan Bhd
85. Euro Holdings Bhd
86. FACB Industries Bhd
87. Farlim Group Bhd
88. Farms Best Bhd
89. Favelle Favco Bhd
90. Federal Furniture Bhd
91. Fiamma Bhd

325
No. Family Firms
92. Fima Corporation Bhd
93. Fitters Bhd
94. Formis Resources Bhd
95. FurniWeb Bhd
96. FSBM Bhd
97. Freight Management Holding Bhd
98. Gadang Bhd
99. Gefung Bhd
100. General Corporation Bhd
101. Genting Bhd
102. Ge-Shen Corporation Bhd
103. George Kent Bhd
104. Glenealy Plantations Bhd
105. Globetronics Bhd
106. Golden Frontier Bhd
107. Glomac Bhd
108. Goldis Bhd
109. Golsta Bhd
110. Goodway Bhd
111. Gopeng Bhd
112. GR&D Central Enterprise Bhd
113. GR&D Hoover Bhd
114. Green Packet Bhd
115. Guan Chong Bhd
116. Gunung Capital Bhd
117. Guoco Land Bhd
118. Hai-O Enterprise Bhd
119. Haisan Bhd
120. Harbour-Link Bhd
121. Harnlen Bhd
122. Hevea Bhd
123. Hexza Corporation Bhd
124. Hiap Tek Bhd
125. HIL Industries Bhd
126. Hing Yiap Knitting Bhd
127. Hirotako Bhd
128. Hong Leong Industries Bhd
129. Hovid Bhd
130. HPI Industries Bhd
131. Hock Sin Leong Bhd
132. Hock Seng Lee Bhd
133. Huat Lai Bhd
134. Hua Yang Bhd
135. Hume Industries Bhd
136. Hunza Properties Bhd
137. Hup Seng Bhd
138. Hwa Tai Corporation Bhd
139. Hytex Bhd
140. Ibraco Bhd

326
No. Family Firms
141. I-Bhd
142. IGB Bhd
143. Imaspro Bhd
144. Ingress Bhd
145. Integrated Rubber Corporation Bhd
146. Integra Bhd
147. IOI Corporation Bhd
148. Ipmuda Bhd
149. Ireka Corporation Bhd
150. Jadi Corporation Bhd
151. Jasa Kita Bhd
152. Jaycorp Bhd
153. Jaya Tiasa Bhd
154. JMR Corporation Bhd
155. Johan Holdings Bhd
156. Johore Tin Bhd
157. Kamdar Bhd
158. Karabunai Corporation Bhd
159. Kawan Corporation Bhd
160. KBB Resources Bhd
161. Kein Hing International Bhd
162. Kencana Petroleum Bhd
163. Ken Holdings Bhd
164. Khee San Bhd
165. Khind Bhd
166. Kian Joo Bhd
167. Kia Lim Bhd
168. Kim Hin Bhd
169. Kim Loong Bhd
170. Kinsteel Bhd
171. KKB Engineering Bhd
172. KNM Bhd
173. Knusford Bhd
174. Kobay Bhd
175. Komark Bhd
176. Konsortium Logistik Bhd
177. Kossan Bhd
178. Kotra Industries Bhd
179. KPS Consortium Bhd
180. Kretam Holdings Bhd
181. Kriss Asset Bhd
182. KSL Bhd
183. KL Kepong Bhd
184. Kumpulan Europlus Bhd
185. Kumpulan Fima Bhd
186. Kumpulan HandL High Tech Bhd
187. Kumpulan Powernet Bhd
188. Kwantas Corporation Bhd
189. KYM Holdings Bhd
327
No. Family Firms
190. Latexx Bhd
191. Lay Hong Bhd
192. LB Aluminium Bhd
193. LBI Capital Bhd
194. LBS Bina Group Bhd
195. Len Cheong Bhd
196. Lebar Daun Bhd
197. Lee Swee Kiat Bhd
198. Leweko Corporation Bhd
199. Lien Hoe Corporation Bhd
200. LiiHen Bhd
201. Lingui Bhd
202. Lion Corporation Bhd
203. Lion Diversified Bhd
204. Lion Forest Bhd
205. Lion Industries Bhd
206. Lipo Corporation Bhd
207. London Biscuit Bhd
208. Leader Steel Bhd
209. LTKM Bhd
210. Luster Industries Bhd
211. Lysaght Bhd
212. Malaysian AE Model Bhd
213. Magni Bhd
214. Mahajaya Bhd
215. Mah Sing Bhd
216. Malton Bhd
217. Mamee Bhd
218. Malaysian Bulk Carriers Bhd
219. Malaysia Pacific Industries Bhd
220. Mechmar Bhd
221. Melati Ehsan Holdings Bhd
222. Melewar Industrial Group Bhd
223. Metal Reclamation Bhd
224. Metro Kajang Bhd
225. Metronic Bhd
226. Mega First Corporation Bhd
227. MHC Plantation Bhd
228. MHouse Bhd
229. Mieco Bhd
230. Minetech Bhd
231. Mintye Bhd
232. Mitrajaya Bhd
233. MK Land Bhd
234. MTD ACPI Engineering Bhd
235. MTD Capital Bhd
236. Muda Bhd
237. Mudajaya Bhd
238. Muhibah Bhd
328
No. Family Firms
239. MUH Bhd
240. Multivest Bhd
241. Mycron Bhd
242. Narra Industries Bhd
243. New Hoong Fatt Bhd
244. NPC Bhd
245. NTPM Bhd
246. NV Multi Corporation Bhd
247. NWP Bhd
248. Nylex Bhd
249. Ogawa Bhd
250. OFI Industries Bhd
251. OKA Bhd
252. Oriental Bhd
253. Padini Bhd
254. Pahanco Bhd
255. Pantech Bhd
256. Paos Holding Bhd
257. Paramount Bhd
258. Parkson Bhd
259. Patimas Bhd
260. PCCS Bhd
261. Pelangi Publishing Group Bhd
262. Pensonic Bhd
263. Pentamaster Bhd
264. Permaju Bhd
265. Petaling Tin Bhd
266. Picorp Bhd
267. Pintaras Bhd
268. PJ Bumi Bhd
269. PJ Development Bhd
270. PLB Engineering Bhd
271. Poh Kong Bhd
272. Poly Glass Fibre Bhd
273. PPHB Bhd
274. Prestar Bhd
275. Prinsiptek Bhd
276. Pulai Spring Bhd
277. Puncak Niaga Bhd
278. PW Consolidated Bhd
279. Priceworth Wood Products Bhd
280. QL Resources Bhd
281. Quality Concrete Holdings Bhd
282. Ranhill Holdings Bhd
283. Rapid Bhd
284. Rock Chemical Industries Bhd
285. Resin Tech Bhd
286. Reliance Pacific Bhd
287. Rimbunan Sawit Bhd

329
No. Family Firms
288. Riverview Bhd
289. Sapura Crest Bhd
290. Sapura Industrial Bhd
291. Sapura Resources Bhd
292. Satang Holdings Bhd
293. SBC Corporation Bhd
294. Scientex Bhd
295. Scomi Engineering Bhd
296. Scomi Marine Bhd
297. Selangor Dredging Bhd
298. Seacera Bhd
299. See Hup Bhd
300. Sernkou Bhd
301. Shangri-La Bhd
302. SHL Consolidated Bhd
303. Sitt Tat Bhd
304. Seni Jaya Bhd
305. Sino-Huaan Bhd
306. SKB Shutters Bhd
307. SKP Bhd
308. SLP Resources Bhd
309. SMIS Corporation Bhd
310. Sarawak Oil Palm Bhd
311. Selangor Properties Bhd
312. Southern Acid Bhd
313. Southern Steel Bhd
314. Spritzer Bhd
315. Stamford College Bhd
316. Stone Corporation Bhd
317. Subur Bhd
318. Success Bhd
319. Sui Wah Bhd
320. Sumatec Bhd
321. Sunway City Bhd
322. Sunway Holdings Bhd
323. Supermax Bhd
324. Swee Joo Bhd
325. Sarawak Plantations Bhd
326. SYF Bhd 327. Taan Bhd
328. TAFI Industries Bhd
329. Takaso Corporation Bhd
330. Talam Corporation Bhd
331. Taliworks Corporation Bhd
332. Tamadam Bhd
333. Tanco Bhd
334. Tasek Bhd
335. Teck Guan Perdana Bhd
336. Tek Seng Bhd

330
No. Family Firms
337. Tanjung Offshore Bhd
338. Thong Guan Bhd
339. Tiong Nam Logistics Bhd
340. Transocean Bhd
341. Tomei Corporation Bhd
342. Top Glove Corporation Bhd
343. TPC Bhd
344. TRC Bhd
345. Triumphal Bhd
346. TSR Capital Bhd
347. TheStore Corporation Bhd
348. Tradewinds Bhd
349. Tradewinds Corporation Bhd
350. UMS-Neiken Bhd
351. UnimechBhd
352. Unisem Bhd
353. United Bintang Bhd
354. United Kotak Bhd
355. United U-Li Corporation Bhd
356. UPA Press Bhd
357. Voir Industries Bhd
358. VS Industry Bhd
359. Wah Seong Bhd
360. Wang Zheng Bhd
361. Warisan Bhd
362. Watta Holdings Bhd
363. Wawasan TKH Holdings Bhd
364. Weida Bhd
365. Wong Engineering Bhd
366. Woodlandor Holdings Bhd
367. WTK Holdings Bhd
368. WWE Holdings Bhd
369. Xian Leng Holdings Bhd
370. Yee Lee Corporation Bhd
371. Yinson Bhd
372. YLI Holdings Bhd
373. YNH Property Bhd
374. Yong Tai Bhd
375. YTL Cement Bhd
376. YTL Land and Development Bhd
377. YTL Power Corporation Bhd
378. Zecon Bhd
379. Zhulian Bhd

331
No. State-Owned Firms
1. Acoustech Bhd
2. ARK Resources Bhd
3. Astral Asia Bhd
4. Bina Darulaman Bhd
5. Bintulu Port Bhd
6. Boustead Heavy Industries Bhd
7. Chemical Company Of Malaysia Bhd
8. CCM Duopharma Bhd
9. Central Industrial Corporation Bhd
10. Damansara Realty Bhd
11. Eastern Pacific Industries Corporation Bhd
12. Faber Group Bhd
13. Formosa Pronsonic Bhd
14. Golden Pharos Bhd
15. KFC Holdings Bhd
16. KLCC Property Bhd
17. KPJ Healthcare Bhd
18. Kulim (M) Bhd
19. Kumpulan Hartatanah Selangor Bhd
20. Kumpulan Perangsang Selangor Bhd
21. Kurnia Setia Bhd
22. Maju Perak Bhd
23. Malaysia Airline System Bhd
24. Mentiga Bhd
25. MISC Bhd
26. Malaysia Airport Holdings Bhd
27. Malaysian Resources Corporation Bhd
28. NCB Bhd
29. News Straits Times Press (M) Bhd
30. Pasdec Bhd
31. Perbadanan Bekalan Air Pulau Pinang Bhd
32. Pembinaan Limbongan Setia Bhd
33. Perak Corporation Bhd
34. Petronas Dagangan Bhd
35. Petronas Gas Bhd
36. Pharma Niaga Bhd
37. PLUS Expressway Bhd
38. Pos Malaysia Bhd
39. Proton Holdings Bhd
40. QSR BR&D Bhd
41. Silverbird Bhd
42. Sindora Bhd
43. SPK Bhd
44. Suria Capital Bhd
45. TDM Bhd
46. Tebrau Bhd
47. Telekom Bhd
48. Tenaga Nasional Bhd
49. TH Plant Bhd

332
No. State-Owned Firms
50. Time DotCom Bhd
51. Time Engineering Bhd
52. Tracoma Bhd
53. UAC Bhd
54. UMW Holdings Bhd
55. Utusan Melayu Bhd
56. Ya Horng Electronics Bhd
No. Foreign-Owned Firms
1. AEON Corporation Bhd
2. Ajinomoto Bhd
3. Amway Bhd
4. Apex Healthcare Bhd
5. Apollo Food Holdings Bhd
6. British American Tobacco (M) Bhd
7. Carlsberg (M) Bhd
8. Chin Teck Plantations Bhd
9. Cycle and Carriage Bhd
10. Cymao Bhd
11. Daiman Development Bhd
12. Digi.Com Bhd
13. DNP Holdings Bhd
14. Dutch Lady Bhd
15. Eksons Bhd
16. Esso (M) Bhd
17. Evergreen Fireboard Bhd
18. Fraser and Neave Bhd
19. Guiness Anchor (M) Bhd
20. Harrison Holdings Bhd
21. Industronics Bhd
22. IQ Group Bhd
23. JT International Bhd
24. Keck Seng Bhd
25. Kenmark Industrial Corporation Bhd
26. KESM Industries Bhd
27. Kluang Rubber Company Bhd
28. Kuchai Development Bhd
29. LaFarge Cement (M) Bhd
30. Latitude Bhd
31. LCTH Bhd
32. Maxtral Bhd
33. Metech Group Bhd
34. Metrod Bhd

333
No. Foreign-Owned Firms
35. Malaysian Packaging Bhd
36. Malaysian Smelting Corporation Bhd
37. Negeri Sembilan Oil Palms Bhd
38. Nestle (M) Bhd
39. Nikko Electronics (M) Bhd
40. OCI Bhd
41. Panasonic (M) Bhd
42. Perstima Bhd
43. PIE Industrial Bhd
44. PNE PCB Bhd
45. Sungai Bagan Corporation Bhd
46. Shell (M) Bhd
47. Sunchirin Bhd
48. Superlon (M) Bhd
49. Tai Kwong Yokohama (M) Bhd
50. Tawin Bhd
51. Texchem (M) Bhd
52. Tien Wah Press (M) Bhd
53. Titan Chemicals (M) Bhd
54. Tong Her (M) Bhd
55. Uchi Tech Bhd
56. Wellcall Holdings Bhd
57. Yeo Heap Seng (M) Bhd
58. Yi Lai Bhd
59. YSP South East Asia Bhd
No. Corporate-Owned Firms
1. Alam Maritime Resources Bhd
2. Aliran Insan Resources Bhd
3. Amtek Bhd
4. Concrete Engineering Bhd
5. DKSH Bhd
6. Ekowood Bhd
7. Emivest Bhd
8. Fututech Bhd
9. Heitech Padu Bhd
10. IRM Group Bhd
11. Konsortium Transnasional Bhd
12. KUB Bhd
13. MBM Resources Bhd
14. Minho Bhd
15. Mulpha Land Bhd

334
No. Corporate-Owned Firms
16. Plenitude Bhd
17. Star Publications (M) Bhd
18. Unico-Desa Plantations Bhd
19. Zelan Bhd
No. Firms With Mixed Ultimate Ownership For Different Years (Others)
1. Padiberas Nasional Bhd
2. Ramunia Bhd
3. SMPC Corporation Bhd
4. KeyAsic (M) Bhd
5. Loh and Loh Corporation Bhd
6. MUI Properties Bhd
7. Mulpha International Bhd
8. Putrajaya Perdana Bhd
9. UBG Bhd
10. Global Carriers Bhd
11. GSB Group Bhd
12. Petra Energy Bhd
13. SEG Bhd
14. Ekran Bhd
15. Evermaster Group Bhd
16. LCL Corporation Bhd
17. Java (M) Bhd

335
9.2 APPENDIX B
9.2.1 List Of Publications From This Thesis
Symposium
Liew, C. Y., Devi, S. S., & Alfan, E. (2012). Family firms, expropriation and firm value
: Evidence from Malaysia. Paper presented at the Capital Market Behaviour
Symposium, Monash University Malaysia.
Workshop
Liew, C. Y., Devi, S. S., Alfan, E., Munir, S., & Samad, F. (2011). Expropriation-
related variables and firm performance: Evidence From Malaysian family firms. Paper
presented at the The British Accounting and Finance Association, Accounting and
Finance in Emerging Economies SIG Sixth Workshop Programme, University of
Sunderland, UK.
Conference Proceeding
Liew, C. Y., Devi, S. S., Alfan, E., & Samad, F. (2011). Expropriation-related variables
and firm performance: Evidence from Malaysian family firms. Paper presented at the
Malaysian Finance Association Conference Langkawi, Kedah.