family communication structures and parental …
TRANSCRIPT

FAMILY COMMUNICATION STRUCTURES AND PARENTAL
CONTROL OF CHILDREN'S TELEVISION VIEWING
by
PEGGY KINCANNOF JiANGOLO, B.3. in Ed.
A THESIS
IN
MASS COMMUNICATION
Submitted to the Graduate Faculty of Texas Tech University in
Partial Fulfillment of the Requirements for
the Degree of
MASTER OF ARTS
Approved
Accepted
December, 1975

ACKNOWLEDGMENTS
I would like to express my gratitude and deep
appreciation to the members of my committee. Dr. Alexis Tan,
chairman. Dr. Dennis Harp, and Dr. Billy I. Ross, for their
constructive suggestions and support.
1 1
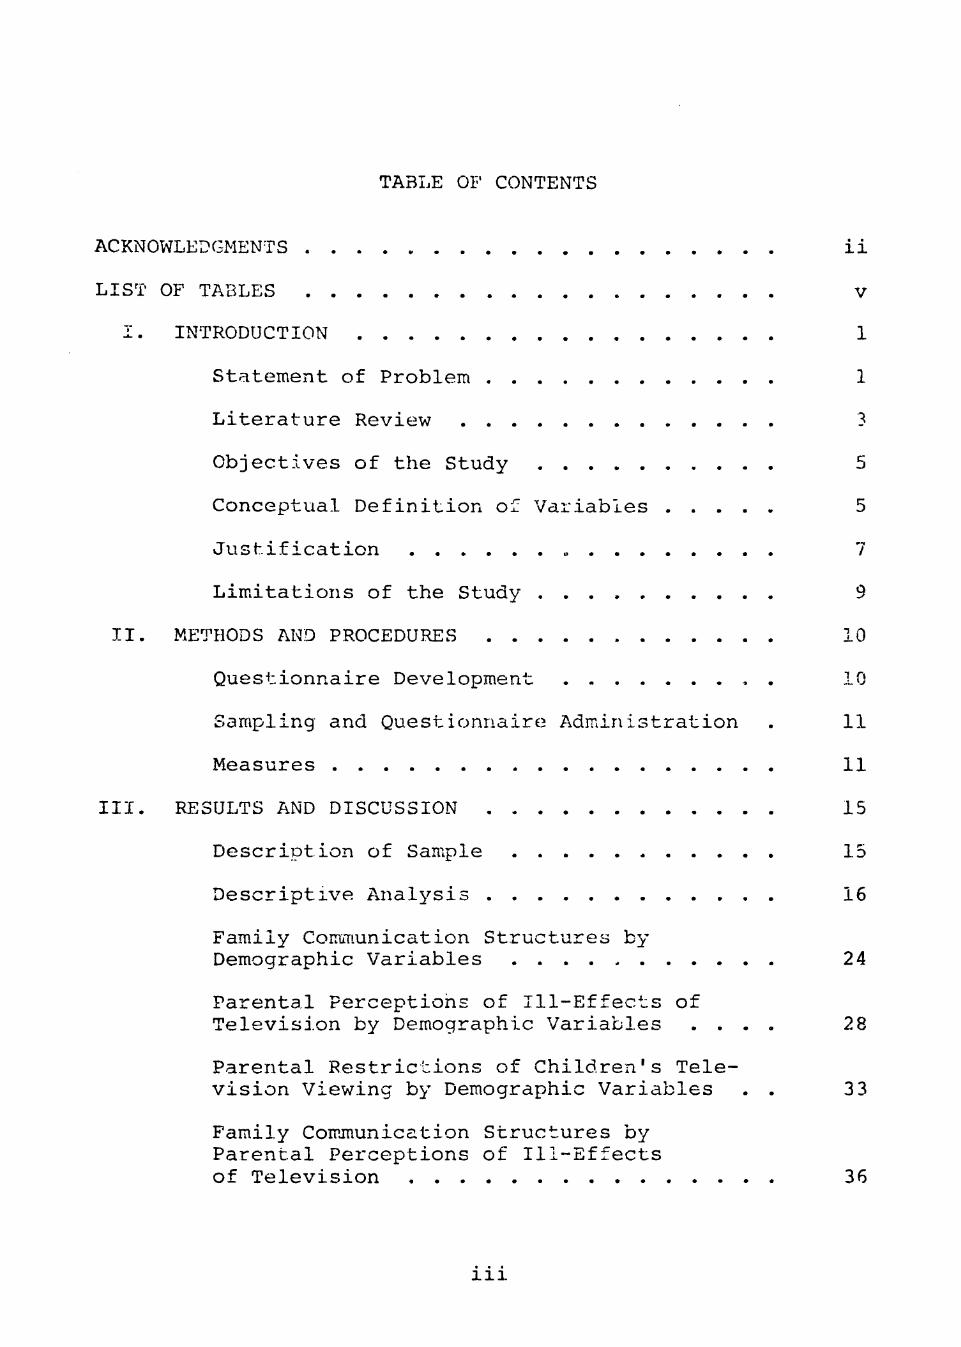
TABLE 01' CONTENTS
ACKNOWLEDGMENTS ii
LIST OF TABLES V
I. INTRODUCTION 1
Statement of Problem 1
Literature Review 3
Objectives of the Study 5
Conceptual Definition of Variables 5
Justification 7
Limitations of the Study 9
II. METHODS AND PROCEDURES 10
Questionnaire Development 10
Sampling and Questionnaires Administration . 11
Measures 11
III. RESULTS AND DISCUSSION 15
Description of Sample 15
Descriptive Analysis 16
Family Communication Structures by Demographic Variables . . . . . 24
Parental perceptions of Ill-Effects of Television by Demographic Variables . . . . 28
Parental Restrictions of Children's Television Viewing by Demographic Variables . . 3 3
Family Comjnunication Structures by Parental Perceptions of Ill-Effects of Television 36
t • •
111

Family Coimnunication Structures by Parental Restrictions of Children's Television Viewing , . . . . 38
Family Coimnunication Structures by Parent Television Viewing Time and by Children's Television Viewing Time 39
Parent Television Viewing Time and Children's Television Viewing Time 41
Parental Perceptions of Ill-Effects of Television by Parental Restrictions of Children's Television Viewing 42
Adherence to Program Advisories by Family Communication Structures, Parental Perceptions of Ill-Effects, and Parental Restrictions of Children's Television Viewing . . . 43
IV. SUMMARY AND CONCLUSIONS 48
Summary of Objectives . 4 8
Summary of Methodology 48
Summary of Data 49
Conclusions 54
Recommendations 57
REFERENCES 60
APPENDIX 62
A. FAMILY VIEWING TELEVISION CODE 63
B. QUESTIONNAIRE 64
IV
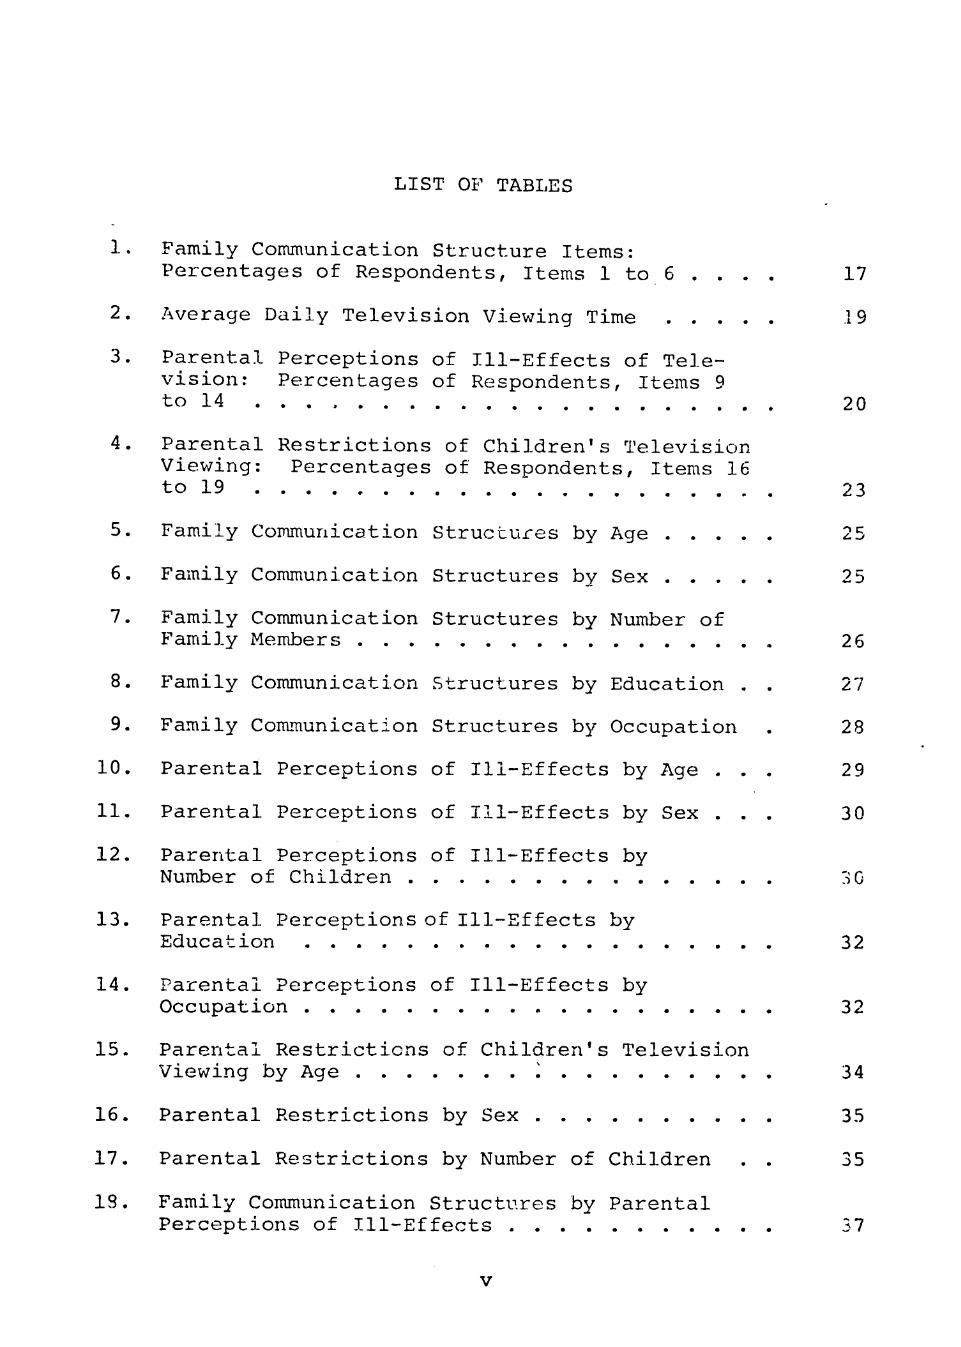
LIST OF TABLES
1. Family Communication Structure Items: Percentages of Respondents, Items 1 to 6 . . . . 17
2. Average Daily Television Viewing Time .19
3. Parental Perceptions of Ill-Effects of Television: Percentages of Respondents, Items 9 to 14 20
4. Parental Restrictions of Children's Television Viewing: Percentages of Respondents, Items 16 to 19 23
5. Family Communication Structures by Age 25
6. Family Commiunication Structures by Sex 25
7. Family Communication Structures by Number of
Family Members 26
8. Family Communication Structures by Education . . 27
9. Family Communication Structures by Occupation . 28
10. Parental Perceptions of Ill-Effects by Age . . . 29
11. Parental Perceptions of Ill-Effects by Sex . . . 30
12. Parental Perceptions of Ill-Effects by Number of Children , 3 0
13. Parental Perceptions of Ill-Effects by Education 32
14. Parental Perceptions of Ill-Effects by Occupation 32
15. Parental Restrictions of Children's Television Viewing by Age I 34
16. Parental Restrictions by Sex 35
17. Parental Restrictions by Number of Children . . 35
IS. Family Communication Structures by Parental Perceptions of Ill-Effects 37
v

19. Family Communication Structures by Parental Restrictions 38
20. Family Conimunication Structures by Parent Television Viewing Time 40
21. Family Comnmnication Structures by Children's Television Viewing Time 41
22. Parental Perceptions of Ill-Effects by Parental Restrictions of Children's Television Viewing . 43
23. Adherence to Program Advisories by Family Communication Structures 4 4
24. Adherence to Program Advisories by Parental Perceptions of Ill-Effects 45
25. Adherence to Program Advisories by Parental Restrictions 46
26. Correlations Between Parent TV Viewing Time, Children's Television Viev/ing Time, Family Communication Structures, Parental Perceptions of Ill-Effects of Television, and Parental Restrictions of Children's TV Viewing 47
VI

CHAPTER I
INTRODUCTION
Statement of Problem
Since the emergence of television in urban America,
trhere has been marked ccncc-rn over the effect of television
programs upon thc3 personality and behavioral development oi
children. In recent years, the most broadbased research to
exam.ine the effect of television on children is that of the
Surgeon General's Scientific Advisory Committee on Tele
vision and Social Behavior. One of the conclusions of a
series of studies commissioned by the commitr.ee was that
some causative relationship does exist" between televised
violence and subsequent behavior within certain subgroups
of children. The committee called for action on the part
of the television industry, the government, responsible
authorities, and the citizens to control violence and bru
tality on television (Liebert, Neale, and Davidson, 197 3).
To date, as a means of self-regulation, the National Asso
ciation of Broadcasters and the three m.ajor television net
works have adopted a policy calling for the first two hours
of network prime time to be devoted to "family viewing"
program.s and recomraending advisories be run on programs
considered inappropriate for family audiences (Broadcasting,
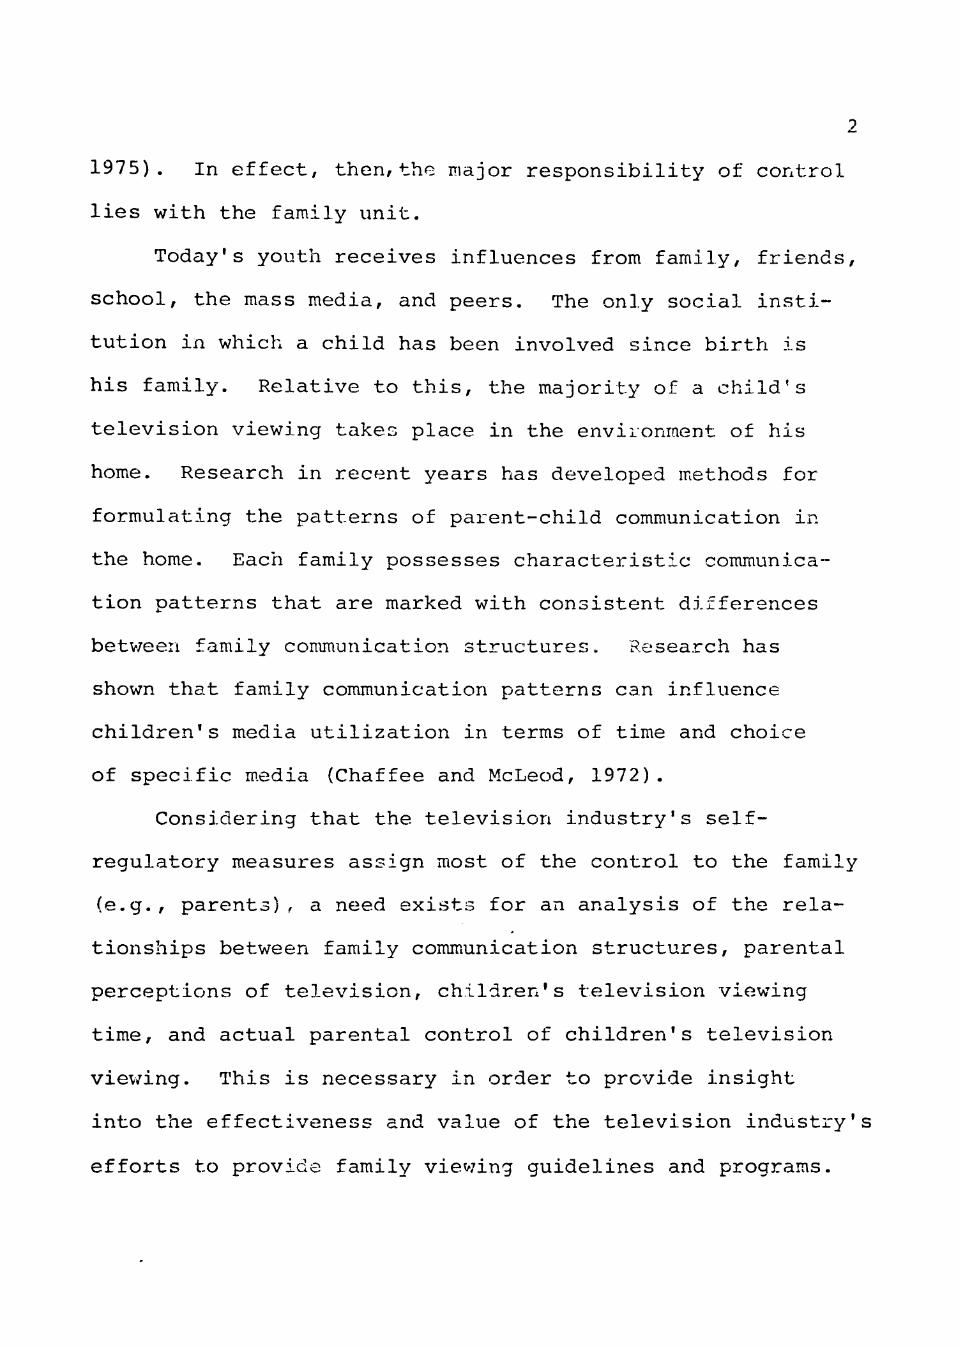
1975). In effect, then, the major responsibility of control
lies with the family unit.
Today's youth receives influences from family, friends,
school, the mass media, and peers. The only social insti
tution in which a child has been involved since birth is
his family. Relative to this, the majority of a child's
television viewing takes place in the environment of his
home. Research in recent years has developed methods for
formulating the patterns of parent-child communication in
the home. Each family possesses characteristic communica
tion patterns that are marked with consistent differences
betv/een family communication structures. Research has
shown that family communication patterns can influence
children's media utilization in terms of time and choice
of specific m.edia (Chaffee and McLeod, 1972) .
Considering that the television industry's self-
regulatory measures assign most of the control to the family
(e.g., parents), a need exists for an analysis of the rela
tionships between family communication structures, parental
perceptions of television, children's television viewing
time, and actual parental control of children's television
viewing. This is necessary in order to provide insight
into the effectiveness and value of the television industry's
efforts to provide family viewing guidelines and programs.

Literature Roview
According to the pioneering work of Wilbur Schranmi in
the field oZ television and its effects on children, com
mercial television is ". . . exciting, emotional, violent,
and anintellectual." The effect of television is an inter
action between characteristics of television and
istics of its users. The child's response to television
depends on the initial relationship of the child and his
family, friends, and school. Children with satisfactory re
lationships with others generally have less need to turn to
television for companionship. However, the more frustrated
the child, the more his aggression v/ill be heightened by
viewing violence and aggression (Schramm, Lyle, and Parker,
1961) .
Recent research has focused on how children are affected
by violence seen on television. Some studies reported by
the Surgeon General's Scientific Advisory Committee on Tele
vision and Social Behavior, for example, revealed that
exposure to televised aggression can contribute to the
aggressive behavior of many normal children.
Other evidence exists indicating some potentially nega
tive influence of television on children. Experiments done
by Robert Snov; (1974) involving realistic or fantasized
violence on television revealed that children can distinguish
between reality and fantasy, and that children are more

sensitive to real violence than that of fantasy. Studies
done with first grade students by Lyle and Hoffman (1971)
and LoSciuto (197.1) revealed that children are at times
frightened by something seen on television and often dream
about things seen on television. Interviews with mothers
of young children conducted by Hess and Goldman (1962) and
Roberts and Baird (1971) revealed a significant percentage
of respondents felt that television was a source of bad
dreams for their children.
Investigations of family communication patterns, al
though originally concerned with developmental antecedents
of individual differences in inoculation against persuasion
(Stone, 1969), have provided some useful insights into
various social behaviors of children. Chaffee, McLeod,
and Wackman (1971), for example, revealed that family com
munication patterns aid in accounting for variations in
children's political socialization, cognitive development,
and mass media use. The Surgeon General's Committee Report
related family communication structures to children's tele
vision viewing. Among significant results were correlations
between parents' television viewing time and younger chil
dren's television viewing time. This strongly suggests a
process of the child "modeling" his viewing behavior after
parental example. Of more significant influence on parent-
child television viewing similarities is the habitual
structure of family communication (Chaffee and McLeod,
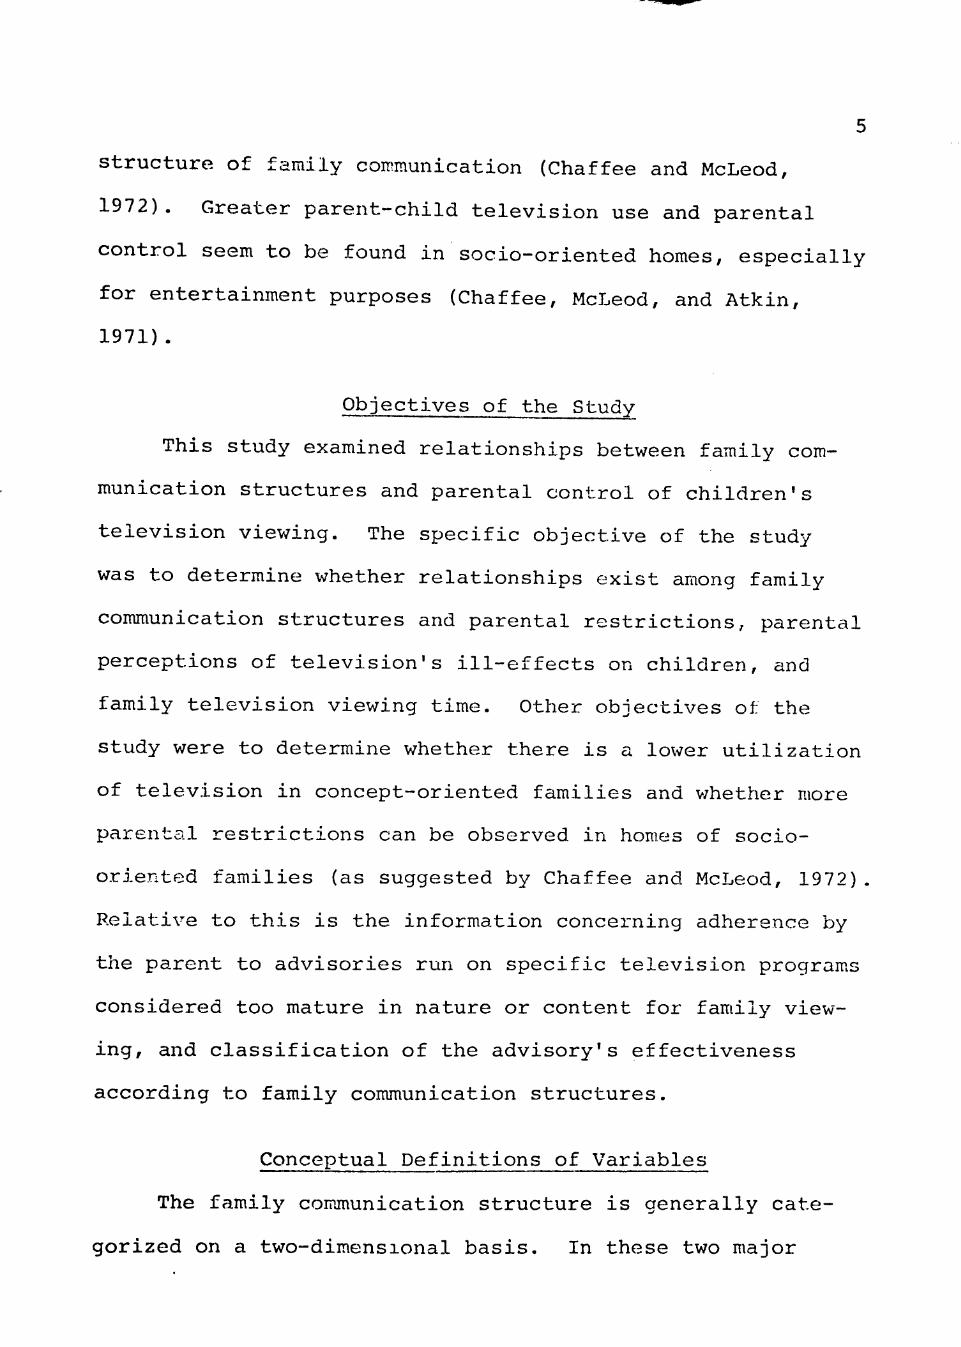
1972). Greater parent-child television use and parental
control seem to be found in socio-oriented homes, especially
for entertainment purposes (Chaffee, McLeod, and Atkin,
1971).
Objectives of the Study
This study examined relationships between family com
munication structures and parental control of children's
television viewing. The specific objective of the study
was to determine whether relationships exist among family
communication structures and parental restrictions, parental
perceptions of television's ill-effects on children, and
family television viewing time. Other objectives of the
study were to determine whether there is a lower utilization
of television in concept-oriented families and v/hether more
parental restrictions can be observed in homes of socio-
oriented families (as suggested by Chaffee and McLeod, 1972).
Relative to this is the information concerning adherence by
the parent to advisories run on specific television program.s
considered too mature in nature or content for family view
ing, and classification of the advisory's effectiveness
according to family communication structures.
Conceptual Definitions of Variables
The family communication structure is generally cate
gorized on a two-dimensional basis. In these two major

6
family structures, the parents may emphasize either, neither,
or both of the two kinds of structural relations. The chil
dren then perceive reality in terms of these structural
constraints. The two dimensions of family communication
structure are "socio-orientation" and "concept-orientation."
In the socio-oriented family, the parent frequently
stresses that the children generally stay away from inter
personal disagreements, avoid social conflict, defer to
elders. In the concept-oriented family, the emphasis is on
expressing one's opinion and considering all sides of an
issue. Stone and Chaffee (197 0) revealed that a socio-
oriented person v/ill tend to yield to a persuasive message
more than a concept-oriented person will yield. Concept-
oriented and socio-oriented patterns generally interact,
producing structural patterns that are not simply the suras
of their functions. However, there are consistent enough
differences to warrant the two-dimensional typology. Theo
retically, it is the structure, not the specific content,
of parent-child communication that the child learns to
generalize. In most studies, family communication struc
tures are discussed in terms of four patterns:
Laissez-faire families. Emphasize neither type of rela
tionship. Children are not prohibited from challenging
parental views, but neither are they exposed to the world of
independent ideas. The child generally receives no guidance

from his parents as parental views fluctuate and are in
definite.
Protective families. Stress sociorelations only. The
child is encouraged to get along with others and is pro
hibited from expressing dissent. The child is given little
opportunity to encounter controversy on which he might base
his own views.
Pluralistic families. Emphasize the exploration of
new ideas and exposure to controversial material. The child
is encouraged to be an independent thinker without fear of
endangering social relations with his parents. This is the
most permissive category of fam.ily communication.
Consensual families. Stress both socio and concept
orientations. The child is exposed to controversy and told
to take part in it. However, he is encouraged to learn and
adopt his parent's ideas and values (Chaffee, McLeod, and
Atkin, 1971).
For purposes in this study, analysis will be limited to the
two major dimensions, concept-oriented and socio-oriented.
Concept-oriented families include laissez-faire and plural
istic structures. Socio-oriented families include consensual
and protective families.
Justification
An investigation of the relevant research concerning
family communication patterns and parental influence on

8
children's television use reveals no recent study relating
the communication patterns and parental control of chil
dren' s television viewing to the most recent self-regulations
of the television industry. Ninety-six percent of all Ameri
can homes contain at least one television set. Of the
seventy million homes in the United States, 67 percent have
at least one television set, and 2 9 percent have two or more
television sets. Twenty percent of American families have
young or adolescent children (Statistical Abstract of the
United States, 1974). Most children watch at least some
television every day, most likely for at least two hours.
Stein and Friedrich (1971) noted the amount of television
viewing increases through elementary years but decreases
through the high school years. Most younger children watch
television in the evening until 9:00 p.m. Children in the
sixth grade watch until after 10:00 p.m. Thus, many older
elementary children watch television through most of the
prime time period (Lyle, 1972).
Watching television appears to be a "cultural universal"
in early adolescence. The period in which the developing
child withdraws from heavy television use in later adoles
cence is also the period in which the child becomes less
and less influenced by his parents (Chaffee and McLeod,
1972). Lyle and Hoffman's (1971) study revealed that about
one-third of the students in the study were aware that their

parents had exerted some type of television viev/ing control
when they were younger. Therefore, this study is concerned
with families with children betvreen the ages of six and
twelve, the ages in v/hich the heaviest television viewing
takes place. This age group experiences more parental
scrutiny of television viewing than that of the older adoles
cent.
The results of this study should aid the television
industry in determining the effectiveness of their self-
im.posed regulations concerning family viewing programs dur
ing prime time periods. Of interest to television adver
tisers would be the communication characteristics of the
two dimensions of family communication and which family
structure experiences the heaviest television viewing.
Generally, this study should provide deeper insight into
the interaction of television and family communication.
Limitations of the Study
The major limitation of this study was the method of
gathering data. Rather than phone interviews, personal
interviews with the parent would have generated possibil
ities for more in-depth questions concerning each variable.
CHAPTER II
METHODS AND PROCEDURES
Questionnaire Development
The questionnaire was initially developed through
studying questionnaires used in previous similar studies
and through consulting with members of the graduate faculty
in the department of Mass Communications, Texas Tech Uni
versity. The first version of the questionnaire was pre
tested on twenty respondents. The results of the pretest
revealed a need for minor revisions. The final version of
the questionnaire was a combination of open-ended questions
and closed questions based on a Likert type scale which
offered four choices for the response. Five general classi
fications of questions were included in the questionnaire
to measure the research variables. Questions were grouped
according to their classification. The five variables mea
sured were: family communication structures, parental per
ceptions of ill-effects of television, parental restrictions
of children's television viewing, parental and children's
television viewing time, and demographic information. The
demographic questions were included in order to establish
randomness in the survey, and to investigate relationships
between certain demographic characteristics (e.g., SES) and
the other variables.
10

11
Sampling and Questionnaire Administration
The unit of analysis was the family with children be
tween the ages of six and twelve. Each family included in
the survey possessed at least one operating television set.
Administration of the questionnaire was conducted by tele
phone. The questionnaire required the response of only
one parent per family. A probability sample of 4 00 tele
phone numbers was gathered from the Lubbock City Directory
by means of a table of random numbers. The telephone survey
was conducted primarily by female interviewers during the
evening hours between 6:00 p.m. and 9:00 p.m. The survey
began in June, 1975, and took approximately four vzeeks to
complete. The first question asked by the interviewer was
if the respondent had children between the ages of six and
twelve. If the response was "No," the interviewer thanked
the respondent, hung up, and chose another name in the
directory by means of the table of random numbers. By this
means, randomness was preserved throughout the survey.
Measures
The measures used in the questionnaire are described
below. The variables measured were the classification of
each family into a two-dimensional structure of family com
munication, parental restrictions of children's television
viewing, parental perceptions of ill-effects evolving from

television, and parent-child television viewing time aver
ages. The parental adherence to advisories run by the tele
vision networks was also measured, along with various demo
graphic information (age of respondent, sex, education,
occupation, family size, and number of functioning television
sets in the home).
Family Communication Patterns. Structure of family com
munication was measured by the response to six questions
based on characteristics of both types of communication pat
terns (see items #.1 to #6, Appendix B) . The measurement
instrument was a four point Likert scale. Each question was
weighted according to which family structure it represented.
The scale was based on previous studies and research done by
Chaffee and McLeod (1972) and Chaffee and Stone (1970). The
mean scores of the six combined items between 2.33 and 3.50
represented the socio-oriented family structures. The mean
scores between 1.0 and 2.17 were representative of the
concept-oriented family structures. These constituted natu
ral breaks in sample responses, using total sample mean
scores as parameters.
Socioeconomic Status. SES was measured by the parent's
response concerning education and occupation of primary fi
nancial supporter of the family. Other demographic variables
measured were sex, age, family size, numiber of children be
tween the ages of six and twelve years of age, and num.ber of

13
functioning television sets per home (see items #22 to #28,
Appendix B).
Television Viewing Time. For both parent and child,
television viewing time was measured by the respondent's
self-estimate of the hours his children spend watching tele
vision per day and the hours he spends watching television
per day (see items #7 and #8, Appendix B). The mean for
this category was determined by the following three-item
scale: 0 to 1 hour—low; 2 to 3 hours—medium; 4 or more
hours--high.
Parental Perceptions of Ill-Effects of Television. 111 •
effects of television perceived by the parent were measured
by seven items relating to the value of television. These
item.s were adopted from Hess and Goldman (1962) . The re
sponses to the seven items (see #9 to #15, Appendix B) were
measured by the four point Likert scale. Those mean scores
between 2.8 4 and 3.30 were representative of the strongest
negative perceptions of parents concerning television and
their children. Measures between 2.17 and 2.83 were repre
sentative of moderate negative perceptions, and mean scores
between 2.16 and 1.0 represented low negative perceptions.
Again, these constituted natural breaks of sample responses
based on total sample mean scores. An open-ended question
was included in this category to allow the parent to con
tribute his opinion of a television program too violent or
14
undesirable for his children between the ages of six and
twelve.
Parental Restrictions of Children's Television Viewing.
Control of the parent over the child's television viewing
was measured by responses to six questions (see items #16
to #21, Appendix B). The question concerning adherence to
television network advisories was included in this category.
A mean score of 3.25 to 4.0 based on the Likert measure was
interpreted as strict parental control. Mean scores of 2.25
to 3.0 represented moderate parental restrictions, and mean
scores of 1.5 to 2.0 represented low parental control. These
scores constituted natural breaks of sample responses based
on total sample mean scores.
CHAPTER III
RESULTS AND DISCUSSION
According to Backstrom and Hursh (1963), 384 valid
responses are required for a 95 percent confidence level
and 5 percent error allowance in a simple random sample.
Thus, 4 00 telephone numbers were selected for the survey.
However, pretesting indicated that 2 64 respondents would
result in comparable accuracy primarily due to the homoge
neity of the population and lower variances for most of
the measures. The homogeneous elements of the population
included: 1) the possession of at least one operating
television set, 2) the respondent being a parent with,
3) at least one child between the ages of six and twelve.
Therefore, the total number of respondents from which in
formation was drawn was 264.
Description of Sam.ple
The age of respondents varied from 21 to 52 years. The
mean age was 32.8. The distribution between female and male
respondents was 53 percent female, 47 percent male. No fam
ily surveyed had more than four children between the ages of
six and twelve. The average number of children per family
was 1.59. Families with one child between the ages of six
and twelve represented 53.3 percent of the sample, families
15

16
with two children, 33 percent, families with three children,
8.7 percent, and families with four children, 3 percent.
The number of family members varied from two to eight. The
average family consisted of four persons. The number of
television sets per home varied from one to five. Those
families possessing one television set consisted of 39.7
percent of the sample; 60.3 percent possessed two or more
sets. The average number of television sets per home v/as
two. Over a third of the respondents (37.5 percent) had a
high school education; 22 percent had attended at least two
years of college, and 19.7 percent had college degrees.
The percentage of those with an education range of grades
six through twelve was 3.7 percent, and 12.1 percent had
post graduate degrees. The occupation of the primary finan
cial supporter of the family was divided into four cate
gories: student (.8 percent), blue collar (39.8 percent),
white collar (33.7 percent), and professional (25.8 percent).
Descriptive Analysis
Family Communication Structures
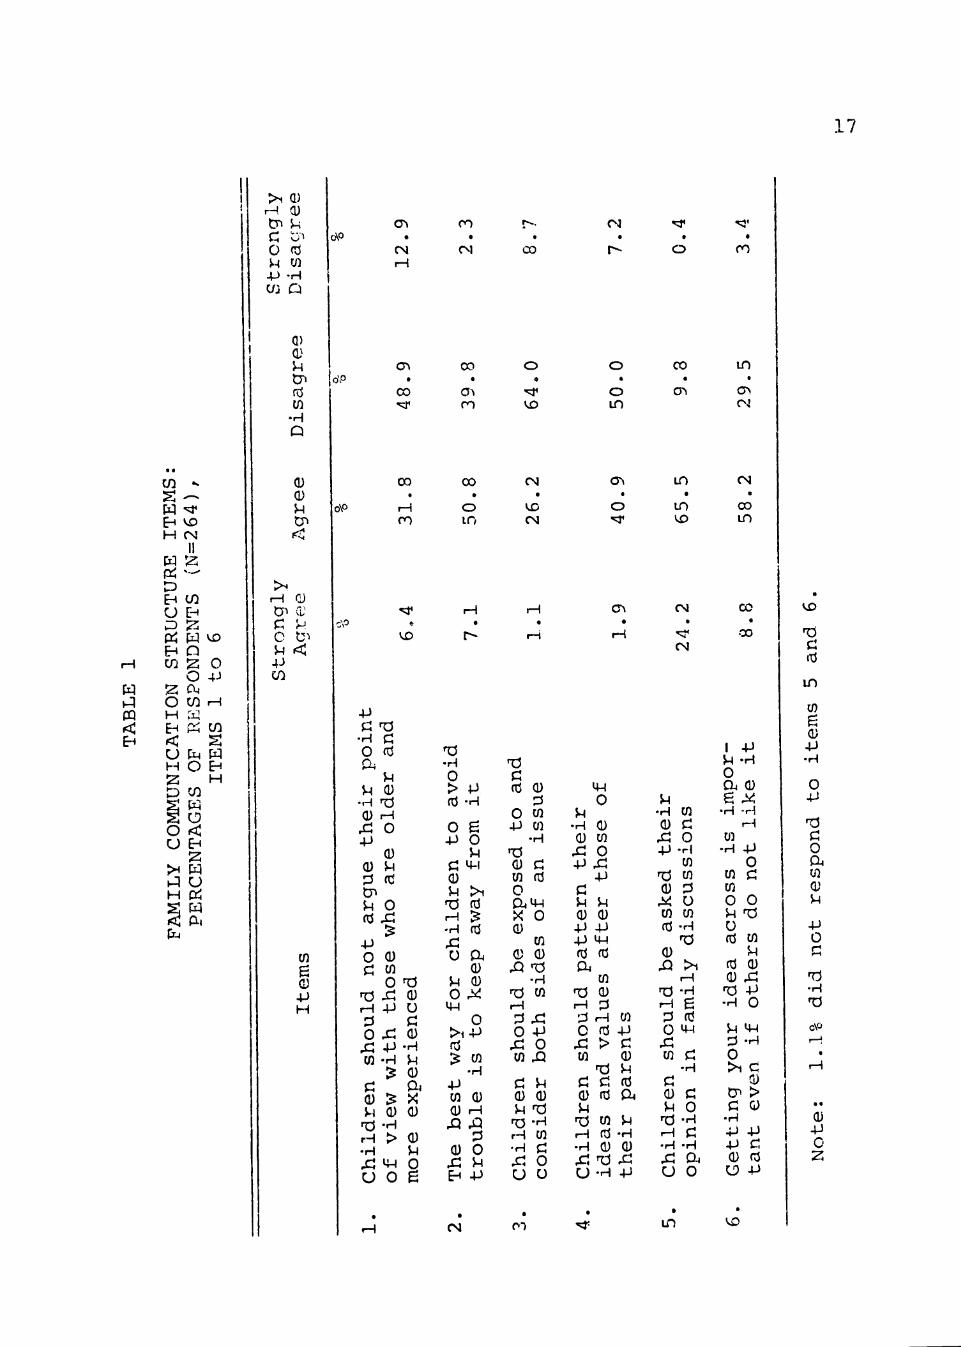
The first six items of the survey concentrated on char
acteristics of family communication structures. As shown in
Table 1, most respondents agreed that children should be
asked their opinion in family discussions (89.7 percent) and
that getting your idea across is important even though others
17
PQ < E-^
H (N II
H ' ^
U EH
P^ H VD
E-t a
O
w
W o 4J
o M
U CM W H O
O U
w s
2;
o EH
H U
EH H
a. s
>. i H
a) (U
tri 5 C 0 u • p
w
0-1 05 W
•H Q
Q) 0) ^ tn fd w
•H Q
0 Q) ^ tn <
rH (1)
tn 0,'
C C
4->
cn S
H
cAO
o\o
O^ •
CM
CO •
(Nl
CO
00
ro
ft
4->
o (d
u •H 0)
4->
S4
<d - p o c;
n3
o CO
T i rH •H
u
J4 (U
o Q)
td
o
tn O .a -p
•p •H
5 15 Q)
• H >
4-1 O
(U U
• H
0)
x 0)
(1) u o
00
00
o m
rH
T3 •rH O > P td -H
O g +J O
U d 4-1 0)
73 td
•H (d
u a U Q) O ,i^ m
o > i - p fd '3: Ul
• H •P CO Q) Q) i H
(U o E-< - P
cs
oo
CM
CN
T5
(d Q) 13
O CO
•rH
CO d
o X o
CO Q) (1) ,Q -d
•H T J CO
O .p Xi o CO Xi
c u U nd
rQ •H rH •rH X
CO
o u u
ci
CM
o
cr>
r-l
4H O
•H (D (D CO
^ O -P X
P
}-< U <D Q)
- P - P 4J M-l fd fd
CO 73 0) .H ;3 •;3 rH CO O fd -P X > CO
T i
0 fd Ot 54
n3 CO iH fd •H CU Q) X'C X U -H 4->
fd
•H
^ t
o
' ^ S -
• ro
o •
o in
CO •
CTi
in t
CJ>
o
in
in
CM
CM
u • H
• p
CO
o r l CO
T d CO (U : 3
u CO CO
fd - H
(1)
Xi >^ rH
rH e :3 (d O >+H
CO
u iH •H
u
•H
o • H
• H
O
C M
00 in
CO
00
I -p U -H O
a o •H -H
r-H CO
• H
CO CO O 54 U fd
fd (1)
• H
-P O
o T3
CO 54 0)
. C P O
54 4H P -H
o
>
L-!
• H •P +J (D
O
C fd 4-»
'd c: id
in
(0
g - P • H
O
O
CO Q) U
P O
• H T3
0) 4J 0

IS
do not like it (67 percent). There was least agreement with
the proposition that children should be exposed to and con
sider both sides of an issue (27.2 percent).. Most respon
dents disagreed with the statement that children should not
argue their point of view with those who are older and more
experienced (48.9 percent). Respondents generally agreed
with the statement that the best way for children to avoid
trouble is to keep away from it (50.8 percent). The respon
dents generally disagreed v/ith the proposition that children
should pattern their ideas and values after those of their
parents (57.2 percent).
The combined mean scores of items one through six were
used as a basis for classifying respondents into the two
major family communication structures, concept-oriented and
socio-oriented. Those respondents classified as concept-
oriented, dealing with ideas and independent thinking, rep
resented 53.8 percent of those surveyed. The respondents
classified as socio-oriented, more concerned with social
relations and conformity, represented 46.2 percent of the
sample.
Television Viewing Time
Table 2 represents daily parental and children tele
vision viewing time, as estimated by the parent. Those
responses representing low daily television viewing

19
represented 31.5 percent of the parents and 18.2 percenr of
the children. Parental television viewing of two to three
hours per day was 54.9 percent. Children viewing television
two to three hours per day was 68.2 percent. A high degree
of daily television viewing takes place in 13.6 percent of
the parents and children. Table 2 also indicates that chil
dren watch more television than their parents.
TABLE 2
AVERAGE DAILY TELEVISION VIEWING TIME
0-1 Hrs
Parent
Children
%
31.5
18.2
2-3 Hrs
o.
54.9
68.2
4+ Hrs
%
13.6
13.6
Parental Perceptions of Ill-Effects of Television
Table 3 shows responses to items measuring parental
perceptions of ill-effects of television on children. As
indicated by the percentages of responses, television does
seem to elicit high parental perceptions of ill-effects con
cerning specific topics. Of interest is item 11 concerning
the educational value of commercial television. Negative
responses to this statement represented 8 0.3 percent of
those surveyed. The mean of item 14, concerning the statement

20
f ^
H
< EH
2 O H W H >
t-^ — W ^ EH VD
CM II
O
Ui EH U
C/D EH
fJ IZ ^ Pi: H rH
Q ^ o O EH
en a\ H H
O EH
U4
I
fa O
o H
H O ^ < a^ EH
u w
Pi
PM
> i <u rH U'
G 54 4J
OJ 5-1 0- rj CO
•H
00 •
o
CM t
•^
r •
V£>
00 •
V£»
C/3 Q
(D U
fd CO
• H Q
(D 0 54
rH (U tJ" (U c: 5^ o 01 54 < -p c^
-p H
CO
o 4J
a rH 54 O ^
(1) X - P
CO
o
o • H
CO • H
> 0)
iH Q) EH
a>
CO 0) 54 (d g
4->
• H +J (D t7>
CO
a)
VX)
r4
fd
o • H • p fd o 13
Q)
Ti i H •H .C O
Q) X 4J
g •H C +i 0 (U -H g CO 0 -H CO >
Q) C r-l 0) <U 54 -P
"^ ^ ^ g •H 0 ^ 54
o ^
C fd
CO •H
c 0 •H CO
•H > (U H O EH
u a OJ p
rH M4 P:
• H
C O
C O
VD
* * •
"^ VD
rH •
VD in
ro «
Ch rH
in •
<Tv CN
VD •
VD r 4
CM •
VD n-l
• ^
• o
ro •
CM
o . - H
54 O CO
MH g <U
O rH rH X X O • H 54 CO a
O 54 cu o CO - H QJ > 5H td
CO CU - H ^
C CO O -
•H C CO Q)
•H 54 > TJ CD rH
tH •H Q) ^
EH U
CM
in o
cri
O > O >H -P 0)
0 P 54 fd o
-p
04 :3
CO g fd 5H
en C O 0) 54 5H O U T S
rH
O X •H U CO
• H 54
> o Q) M4
rH 0) 4J
Q)
td
o
-p CO
o
0) CO <-\ 54 o (d
• H (U > > 1
in CM
ro
VD
ro CN
ro VD
rH VD
VD ^
C7 ro
00
C O
CO *
ro
ro
O 0) O 54 -P TJ
rH
Q) -H
fd U CO > i
g g fd u u CP o o ^H 5H
a) C P o P: TS
•H QJ rH CO -H O
•H 54 > O CO Q) 54
iH > i fd Q) rH fU 4J r4 > l
fd > i 13 CN c: X .H r3 (1) I 2 CO o
^
CM
O
CO g (U p H
O P
T 3 P: o Pu CO 0) !H
p c P:
na •H n3
o\o
•p O IS

21
that many television programs are too sexually oriented for
children six to twelve, was 2.636. This indicates a slight
agreement with this statement (13.5 percent strongly agreed,
43.8 percent agreed, 39.6 percent disagreed, and 3.25 percent
strongly disagreed). However, there was disagreement with
the proposition that most television programs are too vio
lent for children six to twelve, the mean being 2.545. The
percentage of responses for this statement was 9.1 percent
strongly agreed, 40.5 percent agreed, 46.6 percent disagreed,
and 3.8 percent strongly disagreed.
The combined mean scores of items 9 through 14 repre
sented parental perceptions of ill-effects of television on
their children. Results indicated that 20.5 percent of the
respondents can be classified as having low perceptions of
ill-effects of television. A significant percentage of re
spondents can be classified as having a moderate level of
perceived ill-effects of television (71.6 percent). Eight
percent of the respondents had a high perception of television
ill-effects.
Parents were asked an open-ended question permitting
them to identify a specific television program considered
too violent or undesirable for children six to twelve. Sixty
percent of the respondents named the general category of
police stories as too violent or undesirable for their chil
dren. Specific police stories mentioned were "Kojak,"

22
"S.W.A.T.," "Mannix," "Cannon," "The Rookies," "Hawaii
Five-O," and "Police Story." Succeeding police stories was
the general category of television movies (23.5 percent).
Other television programs mentioned were "Hot L Baltimore,"
"Cher," "All in the Family." "Maude," and "Night Stalker."
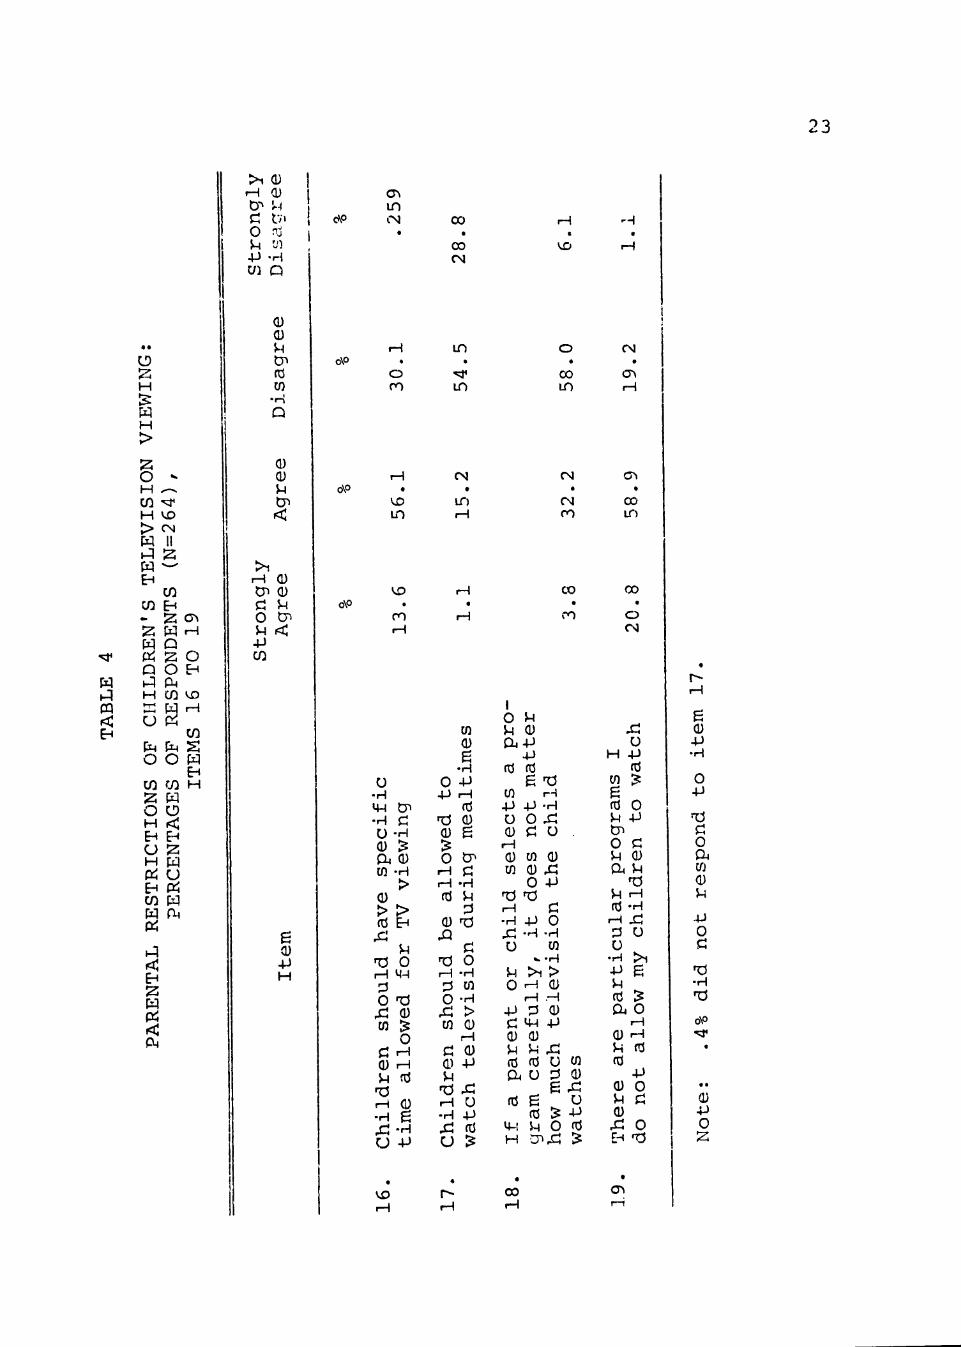
Parentental Restrictions of Children's Television Viewing
Items 16 through 19 m.easured parental restrictions of
children's television viev/ing (see Table 4). An examination
of the specific questions revealed that item 19 ("There are
particular programs I do not allow my children to watch")
produced the most agreement among the respondents (79.7 per
cent) . The statem.ent "Children should have specific time
allowed for television viewing" elicited 56.1 percent agree
ment from respondents. A majority of the respondents (89.9
percent) disagreed v/ith the proposition that children should
be allowed to watch television during mealtimes. Fifty-
eight percent of the respondents disagreed with the state
ment that if a parent or child selects a program carefully,
it does not matter how much television the child watches.
Respondents were also asked about their adherence to
network program advisories. The response to this question
indicates a high level of agreement to the adherence. Almost
74 percent (73.9 percent) of the parents surveyed responded
with "Yes" when asked if they prevent their children from
• « ^
w h^
m < EH
:z; H r-> .5^ w H >
IS o -H ^-^ cn ^ H VD > CN W 11 • ;s w - -EH
W C/) EH
- ^ o> ;2 W rH W Q p:; 2 o Q O H i^ P4 H C/3 VD K W -H U Pd
en CM fa S O O H
EH cn W H 2; w o o H < EH EH O ^ H W P U EH P^ W W W fU P^
iA < EH 2 H Pi < P4
rH 0)
o 5-1 4J • H U) O
(D (U 54
<
rH <D t P (D j : ^ 54 O 54 •P
tP
g -P H
0 (13 54 tr> td CO
o\o r H
« O ro
in •
• ^
in
o •
00 in
<N *
G\ rH
c\o
CJ in CN CO
• 00 CM
r-i
VD
o\o
o\o
t H
• VD in
CM •
IT) i H
VD
ro
U • H vp • H O
P: • H
a. Q) CO
(1) > td X
Ti r4
o X CO
P: 0) 54
•H
u
•H >
> EH
54 O
44
T5
O rH rH fd G)
g - H 4J
CO
g •H
O -P -P H
fd
Q) g
O i H (d
p; H 54 P5
0) T i
PJ Td O iH -H :3 CO O -H
^ > CO CD
a) 4J
54
•H +J
.C fd
rsi
ro
CO
ro
I O 54 54 d) C U P
P fd fd
g 5 CO 4J
r-H p -H
U O ^ Q) C U
CO CO CD O
• H
U
54 O
4J
(1)
fd QA U
VD
fd
H
00
4->
P: o
•H CO
•H ! >
.H 0)
^ U
g
o
4-» •H
rH P3
IP Q) 54 fd
g td 54
CO 0)
X u -p fd
—I
rH
00 i n
o CM
H u - p td
o P
CO g fd 54 tn O C 54 0) &4 5H
54 H fd -H
rH X:
u
g
P! U
• H 4-) 54 td 15
p. o rH
Q) rH 54 fd td
4J <u o 54 p;
X o EH t3
cri
i H
g (U 4J • H
O 4-1
T5 P: o a CO (D 5H
p
o
•H T i
P O 2
24
viewing a program on which an advisory has been run. Respvon-
dents were also asked about the delegation of restrictions on
television viewing in the family. The majority of the par
ents surveyed agreed that the mother was the parent who most
frequently dealt v/ith restrictions on the children (67.8 per
cent agreed, 7.7 percent scrongly agreed). Those respondents
who did not agree to this item varied between 23.4 percent
disagree and 1.1 percent strongly disagree.
For items 16 through 19, mean scores were combined to
arrive at an aggregate score for parental restrictions of
children's television viewing. Twenty-eight percent of the
respondents indicated a high level of parental restrictions.
Moderate parental restrictions represented 6 8.2 percent of
those surveyed, and low parental restrictions, 3.8 percent.
Family Communication Structures by Demographic Variables
As Table 5 indicates, the relationship of family commum-
ication structures and age of respondents was significant
2
(X = 12.69, p<.005). In the concept-oriented category, 49
percent of the respondents were between the ages of 21-29,
37 percent were between ages 30-39, and 14 percent were ages
40-52. In the socio-oriented category, 28 percent of the
respondents were between ages 21-29, 51 percent were between ages 30-39, and 21 percent were between ages 40-52. Thus
younger parents had a stronger tendency to_^e concept-
oriented.

25
TABLE 5
FAMILY COMMUNICATION STRUCTURES BY
Family Communication Structures
Conceptual
Socio
21-29
49%
28%
Age
30-39
37%
51%
AGE
40-52
14%
21%
>
X = 12.69, p<.005
There exists no significant relationship between family
communication structures and sex of the respondent (see
Table 6) . The conceptual family communication structure con
sisted of 43.7 percent male, 56.3 percent female. The socio-
oriented family structure consisted of 50.8 percent male,
49.2 percent female.
TABLE 6
FAMILY COMMUNICATION STRUCTURES BY SEX
Family Communication Structures
Sex
Male Female
Conceptual
Socio
43.7%
50.8%
56.3%
49.2%
X = 1.528 N.S

26
An examination of Table 7 indicates the existence of a
significant relationship between family communication struc
tures and the number of family members (X^ = 16.372, p<.01).
Concept-oriented families consisting of two to four members
was 74.7 percent. Sixty-eight percent of the socio-oriented
families consisted of two to four members. Thirty-two per
cent of the socio-oriented structure consisted of five to
eight family members, as compared to 25.3 percent of the
concept-oriented category. Thus, large families tended to
be more socio-oriented than small families.
TABLE 7
FAMILY COMMUNICATION STRUCTURES BY NUMBER OF FAMILY MEMBERS
Family Number of Family Members Communication Structures 2 3 4 5 6 7 8
Conceptual 4.9% 26.8% 43% 14% 7.8% 2.8% .7%
Socio .8% 31.1% 36.1% 19.7% 10.7% 1.6% 0%
X^ = 16.372, p<.01
No significant relationship was found to exist between
family communication structures and education (see Table 8).
Thirty-nine percent of the concept-oriented participants
possessed a high school education, 20.1 percent had a college
degree, 14.4 percent possessed post graduate degrees. In the

27
socio-oriented group, 35.5 percent possessed a high school
education, 19.1 percent had a college degree, and 9.1 per
cent had post graduate degrees. Of the concept-oriented
participants, 6.4 percent had less than a high school educa
tion. In the socio-oriented structure, 11.8 percent had
less than a high school education.
TABLE 8
FAMILY COMMUNICATION STRUCTURES BY EDUCATION
Family Communication Structures
Conceptual
Socio
2 X^ =-- 3. ,639
Grades 6-12
6.4%
11.8%
N.S.
High School
39%
35.5%
Education
2 Yrs. College
20.1%
24.5%
College Degree
20.1%
19.1%
Post Grad.
14.4%
9.1%
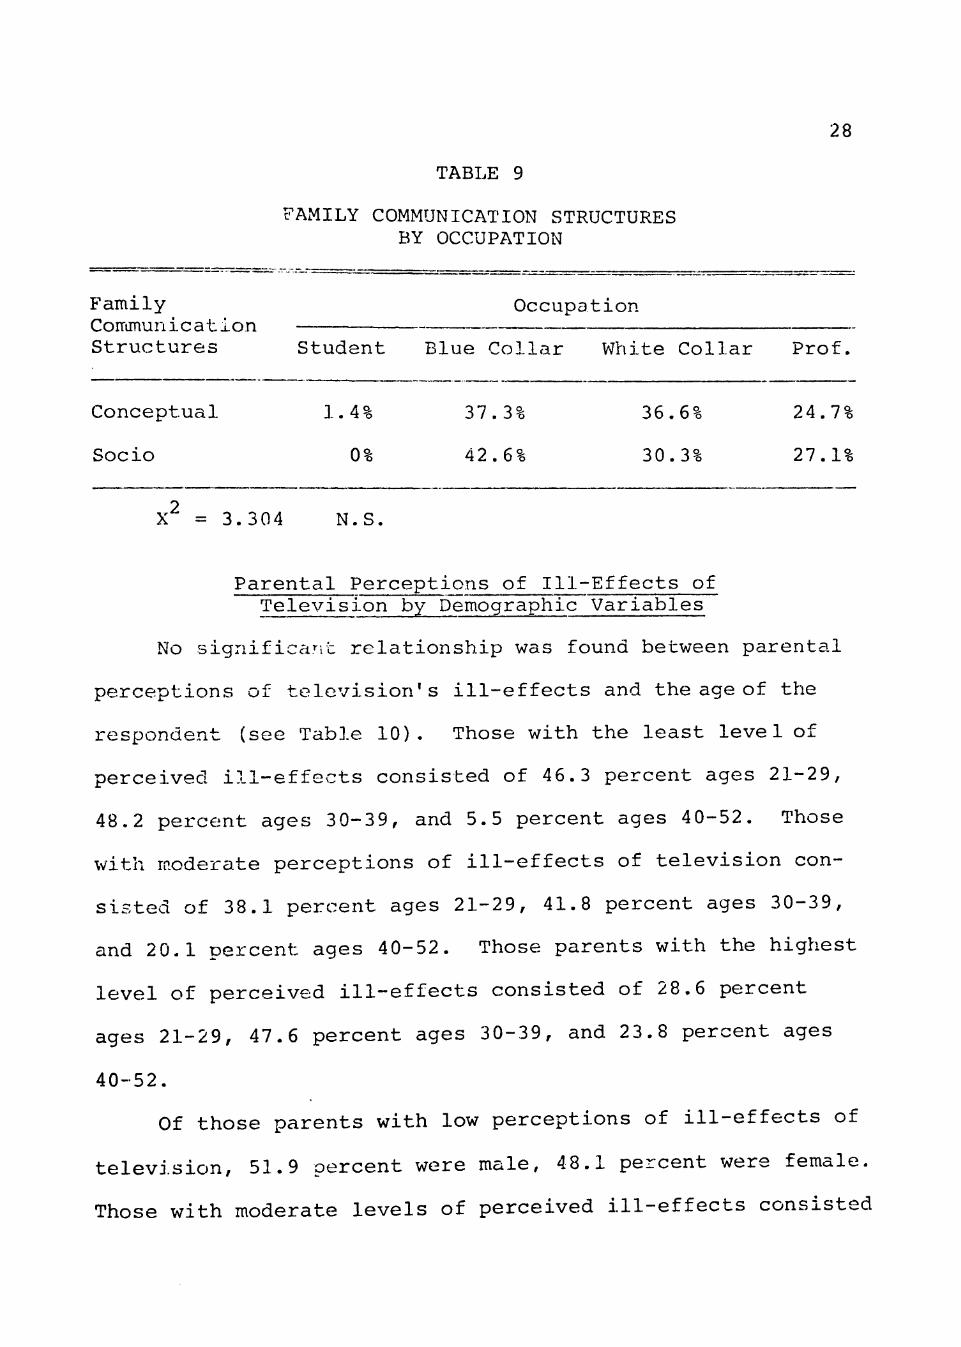
Occupation of the primary financial supporter of the
family and family communication structures were not signifi
cantly related (see Table 9). Of the socio-oriented families,
42.6 percent were classified blue collar, 30.3 percent were
classified white collar, and 27.1 percent were classified as
professional. Concept-oriented families consisted of 1.4 per
cent student, 37.3 percent blue collar, 36.6 percent white
collar, and 24.7 percent professional.
28
TABLE 9
FAMILY COMMUNICATION STRUCTURES BY OCCUPATION
Occupation
Conceptual 1.4
Socio 0%
37.3!
42.6%
36.6%
30.3'
X = 3.304 N.S
Family CoiTimunication Structures Student Blue Collar White Collar Prof.
24.7%
27.1
Parental Perceptions of Ill-Effects of Television by Demographic Variables
No significant relationship was found between parental
perceptions of television's ill-effects and the age of the
respondent (see Table 10). Those with the least level of
perceived ill-effects consisted of 46.3 percent ages 21-29,
48.2 percent ages 30-39, and 5.5 percent ages 40-52. Those
with m.oderate perceptions of ill-effects of television con
sisted of 38.1 percent ages 21-29, 41.8 percent ages 30-39,
and 20.1 percent ages 40-52. Those parents with the highest
level of perceived ill-effects consisted of 28.6 percent
ages 21-29, 47.6 percent ages 30-39, and 23.8 percent ages
40-52.
Of those parents with low perceptions of ill-effects of
television, 51.9 percent were male, 48.1 percent were female.
Those with moderate levels of perceived ill-effects consisted

29
of 45.5 percent male, 54.5 percent female. Those parents
with the highest level of perceived ill-effects consisted
of 47.6 percent m.ale, 52.4 percent female. No significant
relationship was found to exist between parental perceptions
of television's ill-effects and sex of the respondent (see
Table 11).
TABLE 10
PARENTAL PERCEPTION OF ILL-EFFECTS BY AGE
Age
Perceptions 21-29 30-39 40-52
Low 46.3% 48.2% 5.5
Moderate 38.1% 41.8% 20.1
High 28.6% 47.6% 23.8
Q.
X^ = 6.714 N.S.
Table 12 indicates a nonsignificant relationship be
tween parental perceptions of television's ill-effects and
number of children between the ages of six and twelve in
each family. Those parents v/ith one child in this age cate
gory with the least level of perceptions consisted of 64.8
percent. Of those parents who had a moderate degree of
perceived ill-effects, 52.4 percent had only one child in
this age bracket. Of the parents with the highest degree
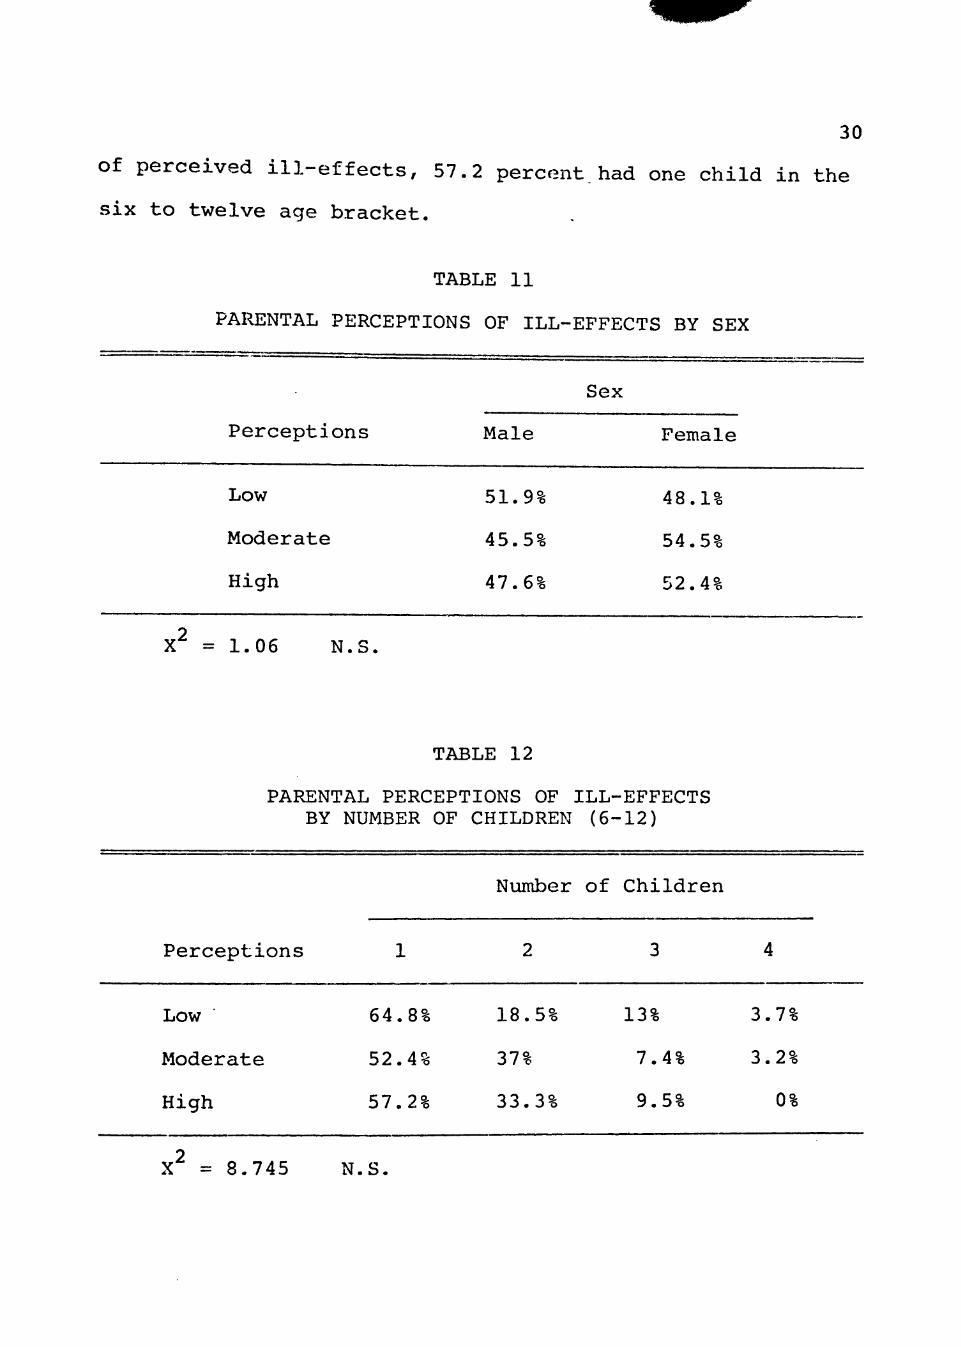
30
of perceived ill-effects, 57.2 percent.had one child in the
six to twelve age bracket.
TABLE 11
PARENTAL PERCEPTIONS OF ILL-EFFECTS BY SEX
Perceptions
Low
Moderate
High
Male
51.9%
45.5%
47.6%
Sex
Female
48.1%
54.5%
52.4%
X = 1.06 N.S.
TABLE 12
PARENTAL PERCEPTIONS OF ILL-EFFECTS BY NUMBER OF CHILDREN (6-12)
Perceptions
Number of Children
Low
Moderate
High
X^ = 8.745 N,
64.8%
52.4%
57.2%
.S.
18.5%
37%
33.3%
13%
7.4%
9.5%
3.7%
3.2
0%

31
The relationship of perceived ill-effects of television
on children by the parent respondent and the education level
of the respondent is significant (X - 23.92, p<.005), as
indicated in Table 13. Those parents with low perceptions
consisted of 33.3 percent high school educated, 22.2 percent
had college degrees, and 16.7 percent had post graduate de
grees. Of those parents with a moderate level of percep
tions, 35.9 percent had a high school education, 23.8 percent
had at least two years of college, and 21.2 percent had a
college degree. Although 61.9 percent of the parents with
the highest level of perceived ill-effects had a high school
education, no parent in this category possessed a college
degree level of education. Post graduate degrees were
possessed by 14.3 percent of the high perception partici
pants. The high category for perceived ill-effects of tele
vision had the highest percentage of participants with an
education level of grades six through twelve (14.3 percent).
Thus, it seems that the less education the parent had, the
more he perceived television to have ill-effects on children.
Table 14 indicates a significant relationship exists
between the occupation of the primary financial supporter of
the family and parental perceptions of ill-effects of tele-o
vision (X == 14.34 8, p<.025). The highest percentage of
each category of perceptions is the blue collar occupation
level: 20 percent, low perceptions of ill-effects; 65.7

32
TABLE 13
PARP^NTAL PERCEPTIONS OF ILL-EFFECTS BY EDUCATION
Perce
Low
Moder
High
ptions
ate
Grades 6-12
7.
8,
14,
.4%
.5%
High School
33.
35,
61,
.3%
.9%
.9%
Education
2 Yrs. College
20.4%
23.8%
9.5%
College Degree
22,
21,
99-
.2%
0%
Post Grad
16.
10.
14.
,7%
,6%
,3%
X = 23.92, p<.005
TABLE 14
PARENTAL PERCEPTIONS OF ILL-EFFECTS BY OCCUPATION
Occupation
Perceptions Student Blue Collar. White Collar Prof,
Low 0% 20 16.85 26.47%
Moderate 100% 65.7% 78.65% 70.58%
High 0% 14.3% 4.49% 2.94%
X = 14.348, p<.025

33
percent, moderate perceptions of ill-effects; and 14.3 per
cent, high perceptions of ill-effects. This would indicar,e
that blue collar workers perceive the most ill-effects from
television; professional and white collar workers perceive
lower levels of ill-effects of television.
Parental Restrictions of Children's Television Viewing by Demographic Variables
Crosstabulation of parental restrictions of children's
television viewing and age of the respondents reveals the
existence of a significant relationship between the two
2
variables (X = 10.23, p<.01; see Table 15). Of those par
ents betv/een the ages of 21-29, 77.7 percent exercised
moderate restrictions on their children's television viewing,
3.9 percent exercised low restrictions, and 18.4 percent
exercised high restrictions. Of those parents between the
ages of 30-39, 60 percent exercised moderate restrictions
on children's television viewing, 6.1 percent utilized low
restrictions, and 33.9 percent utilized high restrictions.
Of those parents between the ages of 40-52, none exercised
low restrictions on their children's television viewing.
Hov;ever, 67.4 percent exercised moderate restrictions and
32.6 percent exercised high restrictions on their children's
television viewing. Thus, although all three age categories
generally seem to exercise moderate restrictions on children's
television viewing, those exercising higher levels of re
strictions are those in the older age brackets.

34
TABLE 15
PARENTAL RESTRICTIONS OF CHILDREN'S TELEVISION VIEWING BY AGE
Parental Restrictions
Age Low Moderate High
2 1 - 2 9 3.9% 77 .7% 18.4%
3 0 - 3 9 6 . 1 % 60.0% 33.9%
4 0 - 5 2 0% 67.4% 32.6%
X^ = 1 0 . 2 3 , p < . 0 1
No significant relationship was found to exist between
parental restrictions and sex of the respondents (see Ta
ble 16). Those parents in the lowest category of parental
restrictions were 36.4 percent male, 63.6 percent female.
Those parents exercising moderate restrictions of children's
television viewing were 47.8 percent male and 52.2 percent
female. The highest category of parental restrictions con
sisted of 46.6 percent male and 53.4 percent female.
Table 17 reveals no significant relationship exists
between parental restrictions and the number of children in
the family between the ages of six and twelve. Seventy-three
percent of those parents exercising low to moderate degrees
of restrictions had one to two children between the ages of
six and twelve in their family; 67.7 percent had three to

TABLE 16
PARENTAL RESTRICTIONS BY SEX
Restrictions
Low
Moderate
High
Sex
Male
36.4%
47.8%
46.6%
Female
63.6%
52.2%
53.4%
35
X = .438 N.S,
TABLE 17
PARENTAL RESTRICTIONS BY NUMBER OF CHILDREN
Number of Children
Restrictions
Low-Moderate High
1-2
3-4
73
67.7%
27%
32.3%
X = 4.62 N.S

36
four children in their home. Of those parents exercising
the highest level of restrictions on their children's
television viewing, 27 percent had one to two children,
32.3 percent had three to four children. Examination of
parental restrictions crosstabulated with the demographic
variables of number of family members, education level, and
occupation of the primary financial supporter of the family
also revealed no significant relationship exists between
these variables.
Family Communication Structures by Parental Perceptions of Ill-
Effects of Television
Results of the crosstabulation of family communication
structures and parental perceptions of ill-effects of tele
vision revealed no significant relationship between the two
variables (see Table 18). The socio-oriented family communi
cation structure and the concept-oriented family structure
both indicate maximum percentage of agreement in the moderate
parental perceptions category (concept-oriented, 68.3 percent;
socio-oriented, 75.4 percent). Only 9 percent of the socio-
oriented structure have high perceptions of ill-effects of
television, 7.1 percent of the concept-oriented structure
possess highly perceived ill-effects.
Although chi-square analysis indicates that the two
variables are independent, evidence of a significant linear

37
TABLE 18
FAMILY COMMUNICATION STRUCTURES BY PARENTAL PERCEPTIONS OF ILL-EFFECTS
Family Communication Structures
Conceptual
Socio
X^ = 2.905 N.S.
Low
24.6%
15.6%
Perceptions
Moderate
68.3%
75.4%
High
7.1%
9%
relationship is provided by correlational analysis (see
Table 26). The zero-order Pearsonian correlation between
family communication structures and parental ill-effects
of television is .285 (p<.001), indicating that concept-
oriented parents have less perceptions of television's ill-
effects than do socio-oriented parents. This trend can also
be discerned in Table 18, which shows that 24.6 percent of
concept-oriented parents had low perceptions of television's
ill-effects, compared to 15.6 percent of socio-oriented
parents.
Although the correlation between the two variables is
modest (r=.285), there is a high degree of certainty that a
linear relationship exists (p<.001). This is a more power
ful test of the linear relationship between two variables than
the chi-square (which summ.arizes data) , and is therefore a
better indicator of concomittant variation (Blalock, 1972).

38
Ilgl^^y Communication Structures by Parental Restrictions of Children's
Television Viewing
An examination of the relationship between family com
munication structures and parental restrictions of children's
television viewing indicates that there is a slight tendency
for socio-oriented families to impose moderate to high re
strictions on children's television viev/ing (see Table 19).
For both conceptual and socio dimensions, parental restric
tions exist to the largest degree in the moderate category
(65.5 percent of the concept-oriented, 71.3 percent of the
socio-oriented). Conceptual families utilizing low restric
tions was 5.9 percent. Socio-oriented families utilizing
lev; restrictions was 3.3 percent. Conceptual families utiliz
ing high restrictions was 29.6 percent, and 25.4 percent of
the socio-oriented families utilized high restrictions.
TABLE 19
FAMILY COMMUNICATION STRUCTURES BY PARENTAL RESTRICTIONS
Family Comniunication Structures
Restrictions
Low Moderate High
Conceptual
Socio
5.9%
3.3%
65 .5%
7 1 . 3 %
29.6%
2 5 . 4 %
X^ = 1 .22 N . S

39
Although the chi-square value for the contingency table
relating these tv/o variables was not significant, correla
tional analysis (see Table 26) provides evidence of a sig
nificant negative linear relationship (r = -.1169, p<.02).
This implies that highly socio-oriented parents utilize a
higher level of restrictions on their children's television
viewing.
Family Communication Structures by Parent Television Viewing Time and by
Children's Television Viewing Time
Family communication structures and parental television
viewing time show no significant relationship when either
chi-square or correlational analysis is used (see Tables 20
and 26). Fifty-five percent of concept-oriented parents
view television on a daily average of two to three hours, as
do socio-oriented parents. Examination of Table 20 reveals
near duplicate percentages in each of the three daily view
ing categories for both concept-oriented and socio-oriented
parents. Those watching an average of 0-1 hours of tele
vision per day in the concept-oriented structure was 31.0
percent, in the socio-oriented structure, 32.0 percent.
Those watching four or more hours of television per day in
the socio structure was 13.0 percent of the participants.
Fourteen percent of the concept-oriented participants watch
four or more hours of television daily.

TABLE 20
40
FAMILY
Family Commun i c at i on Structures
Conceptual
Socio
COMMUNICATION TELEVISION
0-1 Hrs.
31%
32%
STRUCTURES BY VIEWING TIME
PARENT
Parent TV Viewing
2-3 Hrs.
55%
55%
4+ Hrs.
14%
13%
X^ = .15 N.S.
Akin to parental television viev/ing, children's tele
vision viewing time does not show a significant relationship
to family communication structures (see Tables 21 and 26).
Table 21 indicates that 68 percent of the concept-oriented
structure and 69 percent of the socio-oriented structure
view television on a daily average of two to three hours.
Seventeen percent of the concept-oriented structure and
20 percent of the socio-oriented structure view television
one hour or less daily. Fifteen percent of the concept-
oriented structure and 11 percent of the socio-oriented
structure view television four or more hours per day.

41
TABLE 21
FAMILY COMMUNICATION STRUCTURES BY CHILDREN'S TELEVISION VIEWING TIME
Family
Structures
Conceptual
Socio
X^ = 1.357
Parent Tel
Children's TV Viewing
0-1 Hrs. 2-3 Hrs. 4-1- Hrs.
17% 68% 15%
20% 69% 11%
N.S.
evision Viewing Time and Children's Television Viewing Time
A significant linear relationship exists between parent
television viewing time and children's television viewing
time (r = .248, p<.001; see Table 26). This supports find
ings from previous studies that some form of "modeling"
exists between the parent television viewing time and the
children's television viewing time. No significant linear
relationship exists between children's television viewing
and the other variables.
A significant negative linear relationship exists be
tween parental perceptions of ill-effects of television and
parent television viewing time (r= -.1244, p<.022; see
Table 26). This indicates the higher level of perceived
ill-effects elicits less television viewing time by the
parent.

42
Parental Perceptions of Ill-Effects of Television by Parental Restrictions of Children's
Television Viewing
Crosstabulation of parental perceptions of television's
ill-effects and parental restrictions of children's tele
vision viev/ing indicates a slight tendency for parents with
high perceptions of ill-effects to exercise the higher levels
of restrictions on their children's television viewing (see
Tables 22 and 26). The largest percentage of low parental
perceptions utilize low to moderate restrictions on their
children's television viewing (75.9 percent), as do parents
of moderate perceptions (73.5 percent) and parents of high
perceptions (52.4 percent). Of those parents who perceive
the highest ill-effects of television, 46.6 percent utilize
the most restrictions on their children's television view
ing. This is a higher percentage than parents with low or
moderate levels of perceptions and is in accord with pre
dictions. No parents with high perceptions of television's
ill-effects incorporated low restrictions. Those parents
with the lowest level of perceived ill-effects show 24.1
percent incorporate high level of restrictions on their
children's television viewing, as do parents of the moderate
perception category, 26.5 percent.
The correlation between the two variables is .1698
(p<.003), suggesting that there is a positive linear rela
tionship. Parents who have higher perceptions of ill-effects

4 3
of television on their children tend to impose m.ore restric
tions on them.
TABLE 22
PARENTAL PERCEPTIONS OF ILL-EFFECTS BY PARENTAL RESTRICTIONS OF CHILDREN'S TELEVISION VIEWING
Restrictions
Perceptions Low-Moderate High
Low 75.9% 24.1%
Moderate 73.5% 26.5%
High 52.4% 46.6%
X^ = 4.34 3 N.S.
Note: Low and moderate categories were combined because of low frequencies in low restriction category.
Adherence to Program Advisories by Family Communication Structures, Parental Perceptions of Ill-Effects, and
Parental Restrictions of Children's Television Viewing
Crosstabulation of family communication structures and
variable 19, adherence to network program advisories, revealed 2
that a significant relationship does exist (X =6.47, p<.01).
Table 23 indicates that of the concept-oriented parents, 66.2
percent responded negatively to the adherence, 33.8 percent
responded positively. Of the socio-oriented parents, 49.2
responded negatively, 50.8 responded positively. Thus, it

44
seems that concept-oriented families tend to adhere less to
the program advisories than do the socio-oriented families.
TABLE 23
ADHERENCE TO PROGRAM ADVISORIES BY FAMILY COMMUNICATION STRUCTURES
Family Communication Structures
Conceptual
Socio
Adherence to Advisories
No
66.2%
49.2
Yes
33.8
50.8%
X = 6.47, p<.01
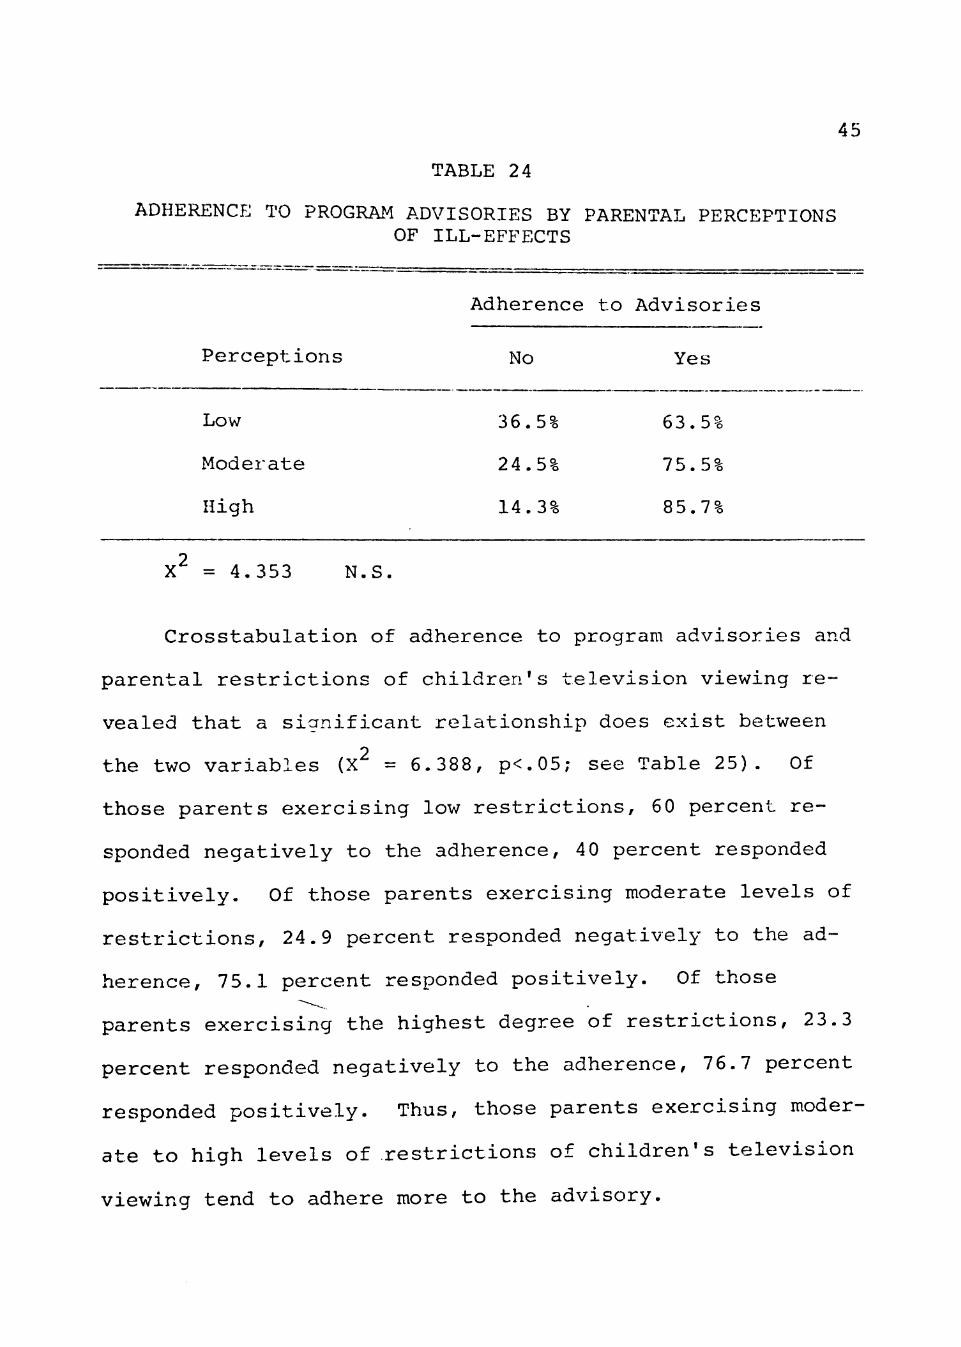
Table 24 indicates no significant relationship was
. • ^ -
found between the adherence to program advisories and
parental perceptions of ill-effects of television. Of those
parents v/ho perceived low ill-effects of television, 36.5
percent responded negatively, 63.5 percent responded posi
tively- Of those parents having moderate levels of perceived
ill-effects, 24.5 percent responded negatively, 75.5 percent
responded positively. Of those parents with the highest per
ceptions of ill-effects of television, 4.3 percent responded
negatively to the adherence, 85.7 responded positively. Al
though no significance was found, there v/as an obvious ten
dency for parents with higher perceptions of television ill-
effects to adhere more to the advisory.
45
TABLE 24
ADHERENCE TO PROGRAM ADVISORIES BY PARENTAL PERCEPTIONS OF ILL-EFFECTS
Adherence to Advisories
Perceptions
Low
Moderate
High
No
36.5%
24.5%
14.3%
Yes
63.5'
75.5%
85.7%
X = 4.353 N.S
Crosstabulation of adherence to program advisories and
parental restrictions of children's television viewing re
vealed that a significant relationship does exist between
the two variables (X = 6.388, p<.05; see Table 25). Of
those parents exercising low restrictions, 60 percent re
sponded negatively to the adherence, 4 0 percent responded
positively. Of those parents exercising moderate levels of
restrictions, 24.9 percent responded negatively to the ad
herence, 75.1 percent responded positively. Of those
parents exercising the highest degree of restrictions, 23.3
percent responded negatively to the adherence, 76.7 percent
responded positively. Thus, those parents exercising moder
ate to high levels of restrictions of children's television
viewing tend to adhere more to the advisory.

46
TABLE 25
ADHERENCE TO PROGRAM ADVISORIES BY PARENTAL RESTRICTIONS
Adherence to Advisories
Restrictions No Yes
Low
Moderate
High
60%
24.9%
23.3%
40
75.1%
76.7
X = 6.388, p<.05

47
VD <N
w
CQ < E H
H
o o 12; w H EH IS: ( J O
w w 2; M l^ H
> P-. ;s I H
> O h^ H ^^ W H > H H > f^ W O W
H CO ^ E-i ^ W
o p:; C/3 H Q - E H 1-^ 12 O . H H W ffi P: U U D Pc: (-:i W W H p^ O
< : • EH
CO
O H E H W
H P^ U E-< < H
P^ P^
IS EH
- m
12 w Pi W P > ^
> EH
EH J5
p: W EH P^ c/5 < :
0^ EH
W ^ p: C P < M S P^ £H <
»-> EH §
pq
O P H
O K^ H H
W H
O >
u w
FH
W PCJ p:J O U
CM
CO a)
o 54 O P^
(U
•H EH
> tH
CO
(U 54
rH •H
•H
•H >
> EH
4J P: <D 54 rd P^
CN r o tH CN O ' ^
• • I V
^ CN CN CM i H O
• • I V
r- vt) in r--O iH
• • I V
o o o
>
EH
4J P: <D 54 (d
0
•H EH
Cr>
• H »> t >
•H
o r-• •
I V
VD VD o i n o - ^
• • I V
r o VD
O rH • •
I V
^ ' r 4 a5 o r«j o
« • V 0.
o o o
• f H
P^ >
EH
CO .-P: <D 54
^ f H
•H
0)
e • H
EH
Cr> C
•H ^ 0
•H
o >
cr> VD rH r^j n4 O
• • 1 V
CU
00 <J\ o-) VD O rH O
• • V CU
O o o
• rH
i n rH 00 o CN O
t •
V 04
o o o
• i H
o o o
CO c o
H -H (d 4J
p; 3; o u 'H 54 rd <D p.! fl4
CO P: o
-H rH 4-> (d O 4J •H
5H 0) 4J 5H CO (d <D P^ P^
C/J p ; o
-H 4J fd
t H Q) 54 5~-) O
4J
O
o «
JJ o H
O 54 P4
P: o CO
• •d
CD P ^
0) 54 (d
CO CD
•H 54 4J P: CD
<D U
4-» O
PS

CHAPTER IV
SUMMARY AND CONCLUSIONS
Summary of Objectives
This study was conducted to analyze the relationships
among family communication structures, parental perceptions
of ill-effects of television, parental restrictions of
children's television viewing, and family television view
ing time. The study sought to determine which family
structure utilized more parental restrictions of their
children's television viewing, and in which family struc
ture lower utilization of television could be found. Rela
tive to parental restrictions, the study was to analyze
the effectiveness of the program advisories self-imposed
by the television industry. Generally, the study was done
to provide deeper insight into the interaction of television
and family communication.
Summary of Methodology
A questionnaire was used as the information instrument.
Administration of the questionnaire was conducted by tele
phone. The telephone survey was conducted on a simple
random sample of 264 parents with at least one child between
the ages of six and tv/elve in their family. The variables
measured in the survey were the classification of each
48
t I'

49
family into a two dimensional structure of family communica
tion, parental restrictions of children's television viewing,
parental perceptions of ill-effects evolving from television,
and parent-child television viewing time averages. The two
dimensions of family communication as defined by previous
studies were socio-oriented and concept-oriented. The socio-
oriented structure emphasizes social harmony and conformity.
The concept-oriented structure emphasizes independent think
ing and exposure to all sides of an issue. Other variables
measured were the parental adherence to program advisories
run by the television industry, and various demographic in
formation (age of respondent, sex, education, occupation,
fam.ily size, and number of functioning television sets in the
home).
The questionnaire was basically a combination of closed
questions and open-ended questions, weighted and measured ac
cording to a Likert scale of measure. Mean scores from com
bined items in the questionnaire provided measures for cate
gories of each variable.
Summary of Data
The conceptual family consisted of 53.8 percent of the
parents surveyed; 46.2 percent of the sample was classified
as socio-oriented. Concerning parental perceptions of
television's ill-effects, a m.ajority of the parents did not
feel that commercial television is of educational value.

50
Most perceived (57.3%) many television programs as too sexu
ally oriented for their children aged six to twelve, yet
many disagreed (50.4%) that there were too many violent
television programs. Sixty percent of the parents respond
ing to the question which called for their opinion of a
television show considered too violent or undesirable for
children aged six to twelve named the general category of
police stories. Parents who perceived moderate ill-effects
of television consisted of 71.6 percent of those surveyed.
Concerning parental restrictions of children's televi
sion viewing, 68.2 percent of the parents exercise moderate i I
restrictions of their children's television viewing, 28 per-i
cent exercise high restrictions. A majority of the parents i
(73.9 percent) said that they do adhere to program adviso-I
I
ries run before specific television programs. However, con- j i
cerning parent-child television viewing time, children J : ;
tended to view more television than did parents.
Significant Relationships
Age of respondent and family communication structures
were found to be significantly related. The younger parent
had a tendency to be more concept-oriented. Family communi
cation structures and number of family members was also
significantly related. The larger families tended to be
more socio-oriented. Family communication structures and

51
sex, educ^ation, and occupation of the primary financial
supporter of the family were not significantly related.
Parental perceptions of television's ill-effects and
the education level of the respondent were significantly
related, as were parental perceptions and occupation of the
primary financial supporter of the family. The lower edu
cated parent had higher perceptions of television's ill-
effects. The blue collar classification had higher levels
of perceived ill-effects than white collar or professional.
Family communication structures and parental perceptions
of ill-effects were significantly related. The concept-
ori.ented parents seem, to have lower perceptions of ill-
effects evolving from television. Mothers of children be
tween the ages of six and twelve had higher levels of per
ceived ill-effects than did the fathers. This supports
earlier research of parental perceptions of television's
ill-effects. Hess and Goldman (1962) and Roberts and Baird
(1971) revealed that mothers do have perceptions of tele
vision's ill-effects as related to children's dreams and
fears.
Parental perceptions and age of the respondent were
not found to be significantly related. Sex and parental
perceptions also revealed no significant relationship. The
number of children between ages six and twelve in the family
and parental perceptions of television's ill-effects were
not significantly related.

52
Restrictions of children's television viewing and sex
of the respondent were not related. Restrictions and number
of children between six and twelve years of age in the family
also were not related. However, restrictions of children's
television viewing and age of the respondent were signifi
cantly related. The higher levels of restrictions were
exercised by those parents in the older age brackets. The
older parent tended to be more restrictive. In comparison,
to family communication structures, the older parent seemed
to be more socio-oriented. Thus, socio-oriented parents
impose more restrictions on their children's television
viewing. This was found to be significant when family com
munication structures was related to parental restrictions.
The existence of this significant relationship supports the
results of studies done by Chaffee and McLeod (1972) in
which they revealed more parental restrictions can be ob
served in socio-oriented homes. Relating to socio-oriented
homes, as previously stated, concept-oriented parents tended
to have lower perceptions of television's ill-effects, imply
ing that socio-oriented parents perceive more ill-effects
evolving from television. Parental restrictions of chil
dren's television viewing and parental perceptions of tele
vision's ill-effects were significantly related. Parents who
have higher perceptions of ill-effects of television (socio-
oriented) impose m.ore restrictions on their children's tele
vision viewing.

53
Parent television viewing time and children's television
viewing time were significantly related. This sapports find
ings from previous research concerning the existence of a
certain amount of "modeling" between the parent television
viewing and the child's television viewing (Chaffee and
McLeod, 1972). Previous studies have shown that there is a
tendency for greater television use in socio-oriented homes
by both the parent and the child (Chaffee, McLeod, and Atkin,
1971). However, this study found no significant relationship
existed between family communication structures and parent-
child television viewing time. A significant negative rela
tionship existed between parental television viewing time
and parental perceptions of television's ill-effects. Higher
perceptions of ill-effects elicit less television viewing.
A significant relationship existed between the adherence
to the program advisories and family communication structures
Socio-oriented parents adhere to the advisories more than
concept-oriented parents. This supports previous relation
ships found significant in this study concerning socio-
oriented parents and parental restrictions and perceptions
of television. This relationship also supports previous
studies which reveal that socio-oriented persons tend to
yield more to persuasive messages (Stone and Chaffee, 1970),
A significant relationship was also found to exist between
parental restrictions of children's television viewing and

54
adherence to the program advisories. Those parents exercis
ing moderate to high levels of restrictions on their chil
dren's television viewing adhered more to the program
advisories than those parents exercising low restrictions.
Conclusions
There were more concept-oriented parents found in the
survey than socio-oriented (53.8 percent, concept-oriented,
46.2 percent, socio-oriented). Socio-oriented parents tended
to have higher levels of perceived ill-effects of television.
Moderate to high perceptions of ill-effects of television
were jjerceived by 84.4 percent of the socio-oriented
parents, as compared to 75.4 percent of the concept-oriented
parents. Socio-oriented parents exercise more parental re
strictions of children's television viewing. Of the socio-
oriented parents, 96.7 percent exercised moderate to high
restrictions on their children's television viewing. Of the
concept-oriented parents, 95.1 percent exercised moderate to
high restrictions. Parents revealed more concern with
sexually-oriented programs than with programs containing a
significant degree of violence. However, police stories were
the most mentioned category of television programs considered
too violent or undesirable for children ages six to twelve.
Restrictions of children's television viewing and per
ceived ill-effects of television react together to produce

55
more restrictions based on higher perceptions of ill-effects.
Of those parents with high perceptions of ill-effects, 46.6
percent exercised high restrictions on their children's
television viewing. Of those parents with moderate per
ceptions of ill-effects, only 25.6 percent exercised high
restrictions; 2 4.1 percent of parents with low perceptions
exercised high restrictions. The mother delegates restric
tions on children's television viewing more than the father
(75.5 percent agreed with this proposition).
Although children watch more television than their
parents, in both concept-oriented homes and socio-oriented
homes, parent and child television viewing is linearly re
lated (r = .284, p<.001). The less time a parent spends
viewing television, the less time a child viev/s television,
and vice versa. A significant negative correlation between
parental perceptions of television's ill-effects and parent
television viewing time suggests that higher perceptions of
television's ill-effects elicit less television viewing by
the parent.
A significant portion of the parents surveyed do adhere
to program advisories (73.9 percent) incorporated by the
television industry. Socio-oriented parents adhere to the
advisories more than concept-oriented parents (socio-oriented,
50.8 percent; concept-oriented, 33.8 percent). Parents exer
cising lov7er restrictions on their children's television
viewing adhere less to the advisories. Forty percent of

56
parents exercising low restrictions adhere to the advisories,
75.1 percent of parents exercising moderate restrictions
adhere to the advisories, and 76.7 percent of parents exer
cising high restrictions adhere to the advisories.
Education and occupation of the parent are significant
factors in the parent's perceptions of television. Those
parents with less education perceived more ill-effects
evolving from television. Blue collar occupation category
possessed higher perceptions of television's ill-effects
(14.3 percent) than did white collar (4.49 percent) or pro
fessional (2.94 percent). Age of the parent is significant
in the structure of the family comraunications and in the
restrictions placed on children's television viewing. The
older parent tended to be more socio-oriented and more
restrictive. The size of the family is significant in
family communication structures. Larger families tended
to be more socio-oriented.
In general, the concept-oriented family is smaller in
size, and the conceptual parent tends to be younger. Of
those parents surveyed, 14 percent of the concept-oriented
category v/ere between ages 40-52, 21 percent of the socio-
oriented category were between ages 40-52. The concept-
oriented parent is less restrictive with children's tele
vision viewing and perceives less ill-effects evolving from
television.

57
gecomme nd a t i on s
£^QI-^J-J!gJ-^^vision Industrv
The television industry might consider the implications
of this study in terms of characteristics of the parents most
likely to impose restrictions on their children's television
viewing. According to this study, the program advisories
tend to be effective and most probably appreciated by the
parent. Relating the conclusions of this study to the self-
imposed family viewing hour of the television industry, the
socio-oriented parent would seem to be more responsible in
screening children's television viewing after 9:00 p.m.
each evening. However, according to the percentages in
this study, there are more concept-oriented families than
socio-oriented families. This implies less restrictions
will evolve from, the individual famdly in controlling chil
dren's television viewing.
The television industry might also observe the tele
vision programs considered by the parents to be undesirable
for their children ages six to twelve. This would be of
benefit in scheduling programs for family viewing.
For Further Research
A need exists to more exactly determine the role and
value of television in the family context. Further study
should examine the characteristics of the two dimensions of

58
family communications more intensely in terms of their atti
tude towards the television industry's self-imposed regula
tions. More definitive measures for the four patterns
included in the two dimensions of family communication
structures would provide more information which could be
applied to further study of the interaction of television
regulations and family communication. Additional information
and study of the socio-oriented family structure would pro
vide a better explanation of higher perceptions of ill-
effects of television and higher restrictions of children's
television viewing found more in socio-oriented families.
This study should be tested in different geographic
locations. The research of this study only relates informa
tion of the communication structures found in families in
Lubbock, Texas.
More research into the influence of demographic vari
ables would provide insight into better understanding the
relationship of communication structures and perceptions
and restrictions of parents and fam.ily in relation to tele
vision viev7ing. The significance of age, education, and
occupation on communication structures, perceptions, and
restrictions of the parents should be studied further and
applied to other media as well.
Parental perceptions of television's ill-effects need
to be further examined to determine the basis of the

59
perceptions. Does more or less exposure to television
elicit higher perceptions of television's ill-effects?
Further research into the relationship of parental percep
tions and restrictions of television should be done and
related to television regulations.
Further research should be done concerning children and
their perceptions of television regulations. Additional in
formation from further research would provide findings in
determining the interaction of the parent and child over
program content. This would aid in determining more effec
tive means of television program regulations.
( (
REFERENCES
Backstrom,C. H. & Hursh, G. D. Survey research. Evanston, 111.: Northwestern University Press, 1963.
Blalock, H. M. Social statistics. New York: McGraw-Hill, 19/2. — '
haffee, S. H., & McLeod, J. M. Adolescent television use in the family context. Television and Social Behavior-A Technical Report to the Surgeon General'^i's'ai'^ntific Myj-sory Committee on Television and Social Behavior,"
Chaffee, S. H. , McLeod, J. M. , & Atkin, C. K. Parental influence on adolescent media use. American Behavioral Scientist, 1971, 14, 323-340. ~
Chaffee, S. H. , McLeod, J. M. , & Wackman, D. B. Family communication patterns and adolescent political participation. In J. Dennis (Ed.), Socialization to politics: A reader. New York: Wiley, 1971.
Kess, R. D., & Goldman, H. Parent's views of the effects of television on their children. Child Development, 1962, 33, 411-426.
Liebert, R. M., Neale, J. M. , & Davidson, E. S. The early window: Effects of television on children and youth. New York: Pergamon Press, Inc., 1973.
LoSciuto, L. A national inventory of television viewing behavior . Television and Social Behavior—A Technical Report to the Surgeon General's Scientific Advisory Committee on_ Television and Social Behavior, 1972, 4, 33-87. • "
Lubbock City Directory, 1974. Dallas: R. L. Polk and Co., 1974.
Lyle, J. Television in daily life: Patterns of use (overview) . Television and Social Behavior—A Technical Report to the Surgeon General's Scientific Advisory Committee on Television and Social Behavior, 1972, 4, 1-32.
60

61
Lyle, J., c Hoffman, H. Children's use of television and other media. Television and Social Behavior—A Tech-^ ^ 2—gg.22, J__ Q the Surgeon General's Scientific Advisory Comm.ittee on Television and Social Behavior, 1972, 4, 129-256. ~~
Roberts, J., & Baird, J. T. Parent ratings of behavior patterns of children in the United States. Vital and Health Statistics, National Center for Health Statistics, Series No. 108, PHS No. 1000.
Schramm, W. , Lyle, J., & Parker, E. B. Television in the lives of our children. Stanford, California: Stanford University Press, 1961.
Snow, R. P. How children interpret t.v. violence in play context. Journalism Quarterly, 1974, 51, 13-19.
Stein, A. , & Friedrich, L. Television content and young children's behavior. Television and Social Behavior--A Technical Report to the Surgeon General's Scientific Advisory Committee on Television and Social Behavior, 1972, 2, 202-317.
Stone, V. A. Individual differences and inoculation against persuasion. Journalism Quarterly, 1969, 46, 267-273.
Stone, V. A. , & Chaffee, S. H. Family communication patterns and source-message communication. Journalism Quarterly, 1970, 47, 239-246.
U.S. Bureau of the Census, Statistical abstract of the United States: 1974 (95th ed.), Washington, D.C., 1974.
Wholesomeness to be the rule at 7-9 p.m. Broadcasting, February 10, 1975, pp. 31-34.
61

APPENDIX
A. Family Viewing Television Code
B. Questionnaire
62

63
APPENDIX A: FAMILY VIEWING TELEVISION CODE
The following is the "family viev/ing" television code
adopted by the National Association of Broadcasters tele
vision code review board:
The 'family viewing' standard. Following is the language that the National Association of Broadcasters television code review board has recommended for insertion in the code at the end of the section headed "Principles Governing Program Content":
"Additionally, entertainment programing inappropriate for viewing by a general family audience should not be broadcast during the first hour of network entertainment programing in prime time and in the immediately preceding hour. In the occasional case when an entertainment program, in this time period is deemed to be inappropriate for such an audience, advisories should be used to alert viev/ers. Advisories should also be used when programs in later prime-time periods contain material that might be disturbing to significant segments of the audience.
"These advisories should be presented in audio and video form at the beginning of the program and when deemed appropriate at a later point in the program. Advisories should also be used responsibly in promotional material in advance of the program. When using an advisory, the broadcaster should attem.pt to notify publishers of television program listings."

64
APPENDIX B: QUESTIONNAIRE
The following is a questionnaire for a survey concerning :^glgX^J.Qn viewing and children in your family. We would appreciate your honest response to'the questions. Your name will not be recorded; please do not include it on the questionnaire. Thank you for your tim.e in taking part in this survey. (In answering the questions concerning children, please remember we are only concerned with ages 6-12.)
In guiding your children, please indicate your feelings on the following statements:
1. Children should not argue their point of view with those who are older and more experienced.
a. strongly agree c. disagree b. agree d. strongly disagree
2. The best way for children to avoid trouble is to keep away from it
a. strongly agree c. disagree b. agree d. strongly disagree
3. Children should be exposed to and consider both sides of an issue.
a. strongly agree c. disagree b. agree d. strongly disagree
4. Children should pattern their ideas and values after those of their parents.
a. strongly agree c. disagree b. agree d. strongly disagree
5. Children should be asked their opinion in family discussions.
a. strongly agree c. disagree b. agree d. strongly disagree
6. Getting your idea across is important even if others do not like it.
a. strongly agree c. disagree b. agree d. strongly disagree
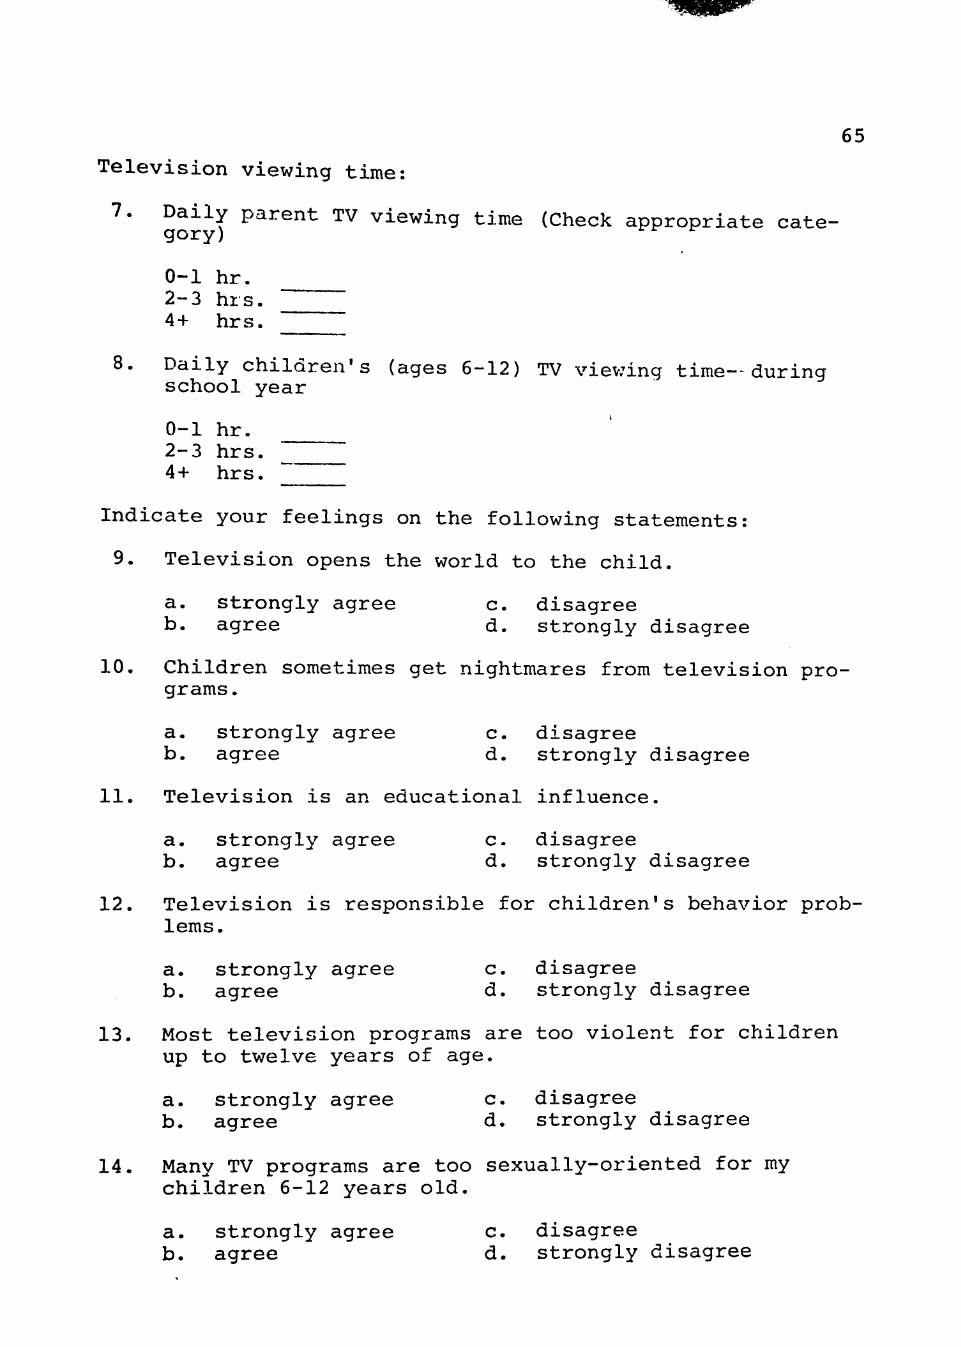
65
Television viewing time:
7. Daily parent TV viewing time (Check appropriate cate-
0-1 hr. 2-3 hrs. 4-f hrs.
8. Daily c h i l d r e n ' s (ages 6-12) TV viev7ing time-^ during school year
0-1 h r . 2-3 h r s . 4-f- h r s .
Indicate your feelings on the following statements:
9. Television opens the world to the child.
a. strongly agree c. disagree b. agree d. strongly disagree
10. Children sometimes get nightmares from television programs.
a. strongly agree c. disagree
b. agree d. strongly disagree
11. Television is an educational influence.
a. strongly agree c. disagree b. agree d. strongly disagree
12. Television is responsible for children's behavior problems.
a. strongly agree c. disagree b. agree d. strongly disagree
13. Most television programs are too violent for children up to twelve years of age.
a. strongly agree c. disagree b. agree d. strongly disagree
14. Many TV programs are too sexually-oriented for my children 6-12 years old.
a. strongly agree c. disagree b. agree d. strongly disagree
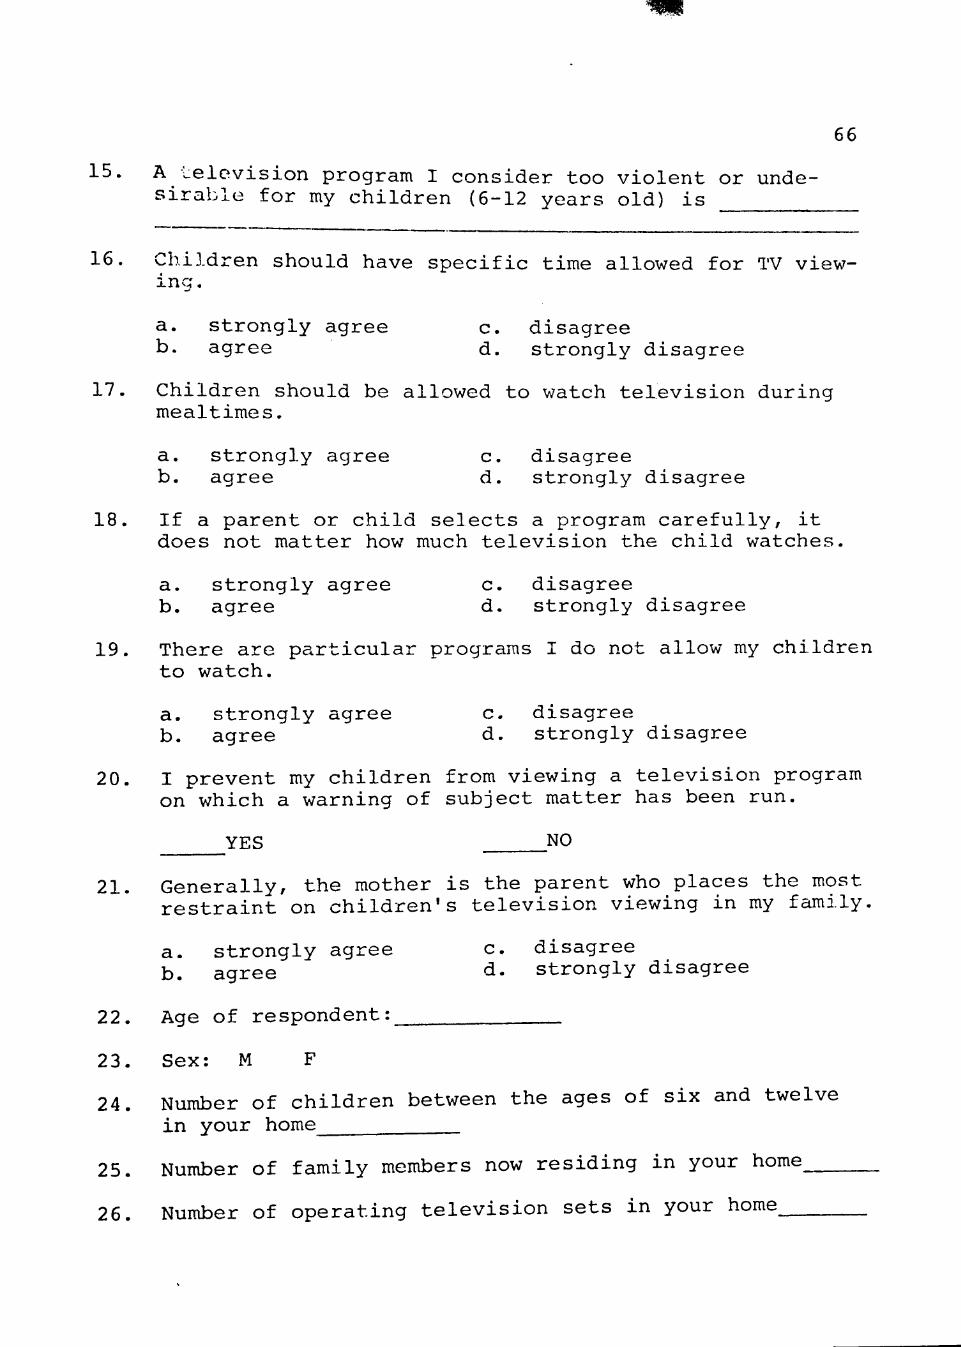
66
15. A television program I consider too violent or undesirable for my children (6-12 years old) is
16. Children should have specific time allowed for TV viewing.
a. strongly agree b. agree
c. disagree d. strongly disagree
17. Children should be allowed to watch television during mealtimes.
a. strongly agree b. agree
c. disagree d. strongly disagree
18. If a parent or child selects a program carefully, it does not matter how much television the child watches
a. strongly agree b. agree
c. disagree d. strongly disagree
19. There are particular programs I do not allow my children to watch.
a. strongly agree b. agree
c. disagree d. strongly disagree
20. I prevent my children from viewing a television program on which a warning of subject matter has been run.
YES NO
21. Generally, the mother is the parent who places the mcDst restraint on children's television viewing in my family
a. strongly agree b. agree
c. disagree d. strongly disagree
22. Age of respondent:
23. Sex: M F
24. Number of children between the ages of six and twelve in your home_
25. Number of family members now residing in your home
26. Number of operating television sets in your home

67
27. Education (Check the appropriate category according to most recent)
a. Grades 6-12 b. High school diploma ^ZI c. 2 yrs. of college d. College degree e. Post graduate degree
28. Occupation of primary financial supporter of your family
