family businesses contribution to the us economy v
TRANSCRIPT
Update 2021: Family Businesses’
Contribution to the U.S. Economy
prepared by
Torsten M. Pieper, Ph.D.
University of North Carolina at Charlotte Department of Management 9201 University City Blvd
Charlotte, NC 28223-0001, USA Phone: (704) 687-7575
Franz W. Kellermanns, Ph.D.
University of North Carolina at Charlotte Department of Management 9201 University City Blvd
Charlotte, NC 28223-0001, USA &
WHU (Otto Beisheim School of Management) D- 56179 Vallendar, Germany
Phone: (704) 687-1421 [email protected]
Joseph H. Astrachan, Ph.D.1
Kennesaw State University [email protected]
1 Emeritus professor

1
Update 2021: Family Businesses’ Contribution to the U.S. Economy
Table of Contents Abstract 2
Introduction 3
Developments since the 2003 study and main challenges 4
Quantifying family business in 2020 5
Data collection and structure 6
Comparing the datasets 7
Quantifying the bull’s eye rings 8
The broad ring 8
The middle ring 9
The narrow ring 10
Estimators 11
Results 12
Number of family businesses and business tax returns 12
Percentage of workforce 13
Contribution to GDP 14
Summary of results 15
Outlook 16
References 17
Appendices 19
Appendix 1: Questionnaire 19
Appendix 2: Further information about data collection 22
Appendix 3. Frequency of responses per employment class 23
Appendix 4: Further analysis on regressions. 24
Appendix 5. Models using previous paper’s definitions for middle ring (INT) 27
Appendix 6. Bull’s eye with intentions as part of the middle ring definition 29

2
Update 2021: Family Businesses’ Contribution to the U.S. Economy
Abstract
In 1996 and 2003, a groundbreaking study of the impact of family businesses on the U.S. economy and society was conducted that helped shape policy including elements of the Contract with America, changes in estate tax laws, and the inclusion of the idea of family business in many aspects of government policy and legislation. Led by a team of internationally renowned academic researchers, including one member of the original studies, the present report provides an update and further assessment of the economic impact of family businesses. Conceiving family businesses along a continuum of definitions, ranging from narrow, to medium, to broad, depending on the level of family influence on the business, the findings provide nuanced insights into their contributions to employment and economic activity. Regardless of the definition used, family businesses are key pillars of the U.S. economy and essential to economic and social prosperity. The insights provide decision makers, regulators and legislators with data, scientific arguments and justifications to craft policy and take measures in this remarkable time of change and economic and societal progress.

3
Introduction In a seminal article, Shanker and Astrachan (1996) established the foundation to assess the impact of family firms on the U.S. economy. The authors updated their framework in 2003 (Astrachan & Shanker, 2003), which has since become one of the most cited articles regarding the impact of family businesses on the overall economy (1,413 Google Scholar cites as of January 26, 2021), so much so that the results are often presented by the media without attribution. The work’s continued popularity is a testament to the validity and usefulness of their framework. However, 17 years is a long time since it was last updated. Accordingly, we revisited the framework to assess if the estimators for family and non-family firms (hereafter referred to as estimators) accurately reflect the distribution of family and non-family firms in the overall population of business organizations in the United States in 2020, and updated family businesses’ contribution to the U.S. economy using the most recently available government data. Specifically, we improved the original findings of Astrachan and Shanker (2003) on the basis of more recent and higher quality data and enhanced the conceptualization of family business under the guidance of one of the original contributors (Dr. Astrachan), who co-authored the present study. In keeping with the 2003 work, we conceptualized family businesses along three definitions (narrow, middle and broad), which depend on the degree of family involvement in the business and assessed their respective contribution to the U.S. economy. As compared with the early 2000s we now have a much stronger empirical base due to heighted research interest in family firms, which generally show that family firms outperform their non-family counterparts (e.g., Anderson & Reeb, 2003; Wagner, Block, Miller, Schens, & Xi, 2015). Yet even with the increased interest in family business, no data bases are available in the U.S. that reliably indicate the distribution of family businesses across different firm sizes. Accordingly, the present update relies in part on empirical data collected specifically for this purpose. Drawing on these data, we calculated estimates of the distribution of family and non-family businesses in the United States and of the impact of family businesses on the U.S. economy. The fact that the federal government still does not collect information on family businesses in a separate category is curious given the estate tax and pass-through income tax implications for families of current tax policy. Our primary contributions are twofold: First, we contribute to the current literature by assessing the impact of family businesses on the U.S. economy. Second, we support policymakers and practitioners in assessing policy implications for family businesses, by highlighting family business impact and importance on the overall U.S. economy.

4
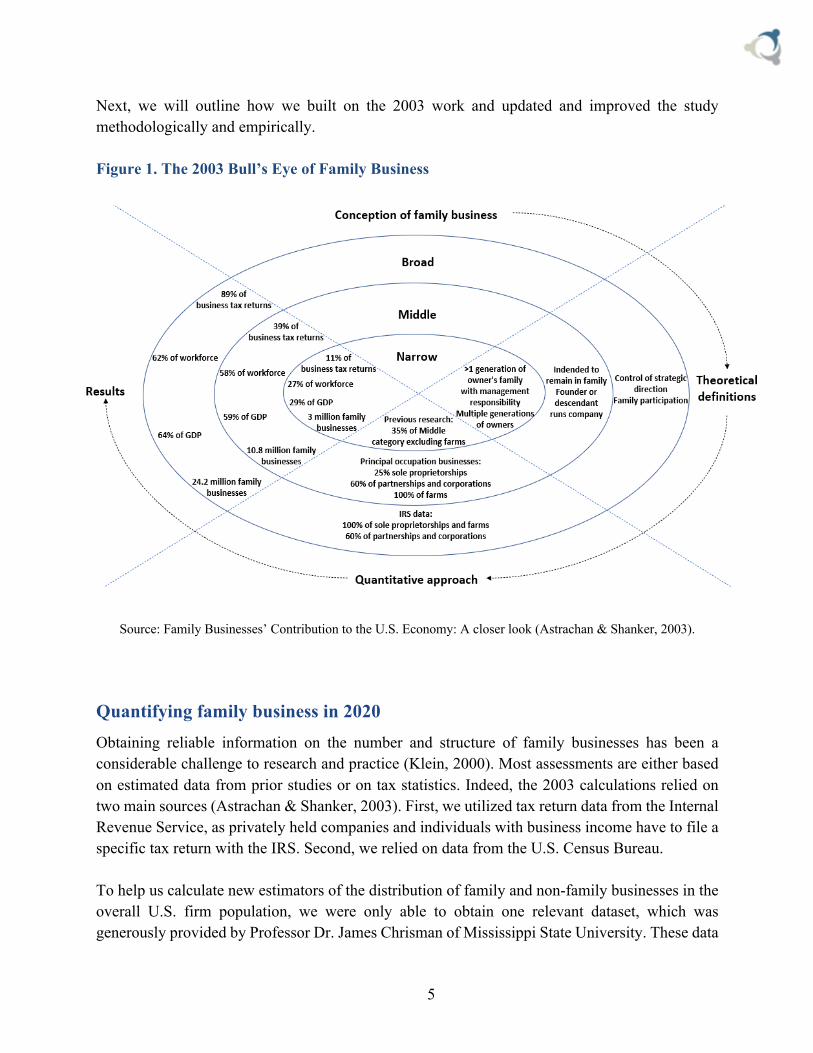
Developments since the 2003 study and main challenges It is beyond question that family businesses have a significant influence on the U.S. economy. However, quantifying their impact is a complex task. This is based on the ultimate challenge of finding a concise, measurable, commonly agreed definition of the term ‘family business’ (Astrachan & Shanker, 2003). In 1996, Shanker and Astrachan proposed a framework for assessing the economic impact of family businesses, which they revised and improved in 2003, based on new governmental data (Astrachan & Shanker, 2003; Shanker & Astrachan, 1996). With over 1,000 citations for their 2003 article, their work is considered seminal in the field. The high relevance can be attributed to the selected scope for the framework. Instead of limiting themselves to a narrow definition of family business, Astrachan and Shanker (2003) took an approach that reflected diversity of family firm definitions within what they labelled “the bull’s eye” framework. As a result, the authors enabled comparability across a wide range of family businesses. However, Astrachan and Shanker (2003) stressed that further accurate quantitative verification of these results would be necessary. Indeed, the debate of family firm heterogeneity continues to this day (e.g., Daspit, Chrisman, Sharma, Pearson, & Mahto, 2018; Memili & Dibrell, 2019; Stanley, Hernández-Linares, López-Fernández , & Kellermanns, 2019). Many measurement approaches to assess family firm uniqueness have been proposed over the years, such as F-PEC (Klein, Astrachan, & Smyrnios, 2005), Familiness (Frank, Kessler, Rusch, Suess-Reyes, & Weismeier-Sammer, 2017), SEW-I (Debicki, Kellermanns, Chrisman, Pearson, & Spencer, 2016). For the present study, we decided to utilize Astrachan and Shanker’s (2003) bull’s eye operationalization not only because it allows comparison of our updated findings to the 2003 study, but also because it has strong intuitive appeal to practitioners not familiar with the academic literature. We describe the bull’s eye approach, portrayed in Figure 1, in more detail below. The bull’s eye consists of three concentric circles, moving from a broad conception of family business in the outer circle to a medium conception in the middle circle and finally to a more exclusive (narrow) conceptualization in the inner circle. The level of inclusiveness depends on the perceived degree of the family’s past, current, and future involvement in the business. In the outer ring, some family participation is assumed, along with the family having control over the business’s strategic direction. In the middle ring, the founder or descendent leads the company and there is the intention to keep the company in the family. In the center of the bull’s eye are those family businesses with multiple generations of owners and more than one generation of the owning family with management responsibility. Figure 1 also summarizes the conceptions of family business, their theoretical definitions, quantitative approach and results of the 2003 Astrachan and Shanker article.
5
Next, we will outline how we built on the 2003 work and updated and improved the study methodologically and empirically.
Source: Family Businesses’ Contribution to the U.S. Economy: A closer look (Astrachan & Shanker, 2003).
Quantifying family business in 2020 Obtaining reliable information on the number and structure of family businesses has been a considerable challenge to research and practice (Klein, 2000). Most assessments are either based on estimated data from prior studies or on tax statistics. Indeed, the 2003 calculations relied on two main sources (Astrachan & Shanker, 2003). First, we utilized tax return data from the Internal Revenue Service, as privately held companies and individuals with business income have to file a specific tax return with the IRS. Second, we relied on data from the U.S. Census Bureau. To help us calculate new estimators of the distribution of family and non-family businesses in the overall U.S. firm population, we were only able to obtain one relevant dataset, which was generously provided by Professor Dr. James Chrisman of Mississippi State University. These data
Figure 1. The 2003 Bull’s Eye of Family Business
6
were derived from a Small Business Development Center (SDBC) program across the United States from 2003 to 2009. The surveys sampled SBDC clients one year after receiving assistance. The SBDC allowed a limited number of questions to differentiate family and non-family businesses, as well as additional data for publication purposes (e.g., Chrisman, Chua, & Kellermanns, 2009). The overwhelming majority of respondents in this sample had 100 employees or less, thus not entirely suitable for our purposes, but beneficial for the validation of our result as further explained below. Overall, the SBDC data comprised 27,679 usable respondents over 7 years and is the largest comparison group for small businesses in the United States, which allows for the differentiation of family and non-family firms. The data further facilitated a differentiation in micro businesses with less than ten employees and small businesses with less than 100 employees. Yet, since the SBDC dataset was not fully representative of the U.S. firm population and was already somewhat dated, we deemed it necessary to collect our own data to establish the most current and methodologically sound estimates for assessing the proportion of family businesses among the overall population of U.S. firms and to gauge their impact on the U.S. economy. Thus, we decided that a priori sampling was necessary to achieve the most objective estimators for the current study.
Data collection and structure To obtain updated estimates, we designed an online survey consisting of three modules: a short general company data section, a section on ownership, and a section on family influence on business and governance (see Appendix 1 for further details). Between September and November of 2020, a questionnaire was sent out to 12,500 randomly selected (family and non-family) business contacts purchased from Data Axle, formerly Infogroup. The selection of firms was based on a random sample separated by employment classes, closely resembling the categorization system used by the Statistics of U.S. Businesses (SUSB) of the United States Census Bureau (i.e., less than 100 employees, 100 to 499 employees, etc.) (United States Census Bureau, 2012). For the detailed classification, please refer to Appendix 2. The initial response rate was remarkably low at 0.6%, but a series of email reminders increased the response rate to 2.9%. The low response rate could have been caused by fatigue of potential respondents from external communications due to the upcoming presidential elections at the time of data collection. As the number of responses was not ideal, alternative survey methods were pursued to supplement the initial results. We first utilized an approach by phone (which proved to be only marginally effective) and then conducted online business intelligence research. In combination, these efforts yielded a satisfactory sample size of 774 responses on which to build our subsequent analyses. After the elimination of incomplete data, 694 out of 774 records remained for our estimator calculation (see Appendix 3). The following variables are used in the analysis and results section:
7
● Percentage of the company owned by one family (FO) ● Intention for business to remain in family (INT) ● Existence of multiple generations of owners (MGO) ● Existence of multiple family members in significant management positions (FM) ● Presence of members of the family on the board of directors (FBP) ● Leadership of the company by a family member (CEOFam)
In contrast to the 2003 study, we could not use the intention variable (INT) throughout our entire analysis as we were unable to collect data on this variable via our data collection efforts beyond the survey. Therefore, we adjusted the quantitative definitions of the middle and narrow rings of the bull’s eye in the analysis section accordingly (see footnote 2, Appendix 5 and Appendix 6 for operationalization with intention. In the next section, we analyze the differences between the SDBC dataset and our survey to establish the general validity of our results.
Comparing the datasets In order to test the validity of our sample, we compared our newly collected data with the SDBC dataset. As the SDBC data mainly contain firms under 100 employees, we compared the SBDC data with the responses of surveyed companies smaller than 100 employees in our dataset. We established the distribution of family firms and non-family firms based on three somewhat overlapping variables in the databases:
● Percentage of company owned by a family (FO-SDBC) ● Number of Family members in management (FMM-SDBC) ● Intention for business to remain in family (INT-SDBC)
While FO-SDBC and INT-SDBC have the same definition as FO and INT in our dataset, FMM-SDBC is a count of the total number of family members with a management position in the company in the SBDC dataset. To make this variable comparable to our dataset, at least one of three variables in our survey dataset – existence of multiple family members in significant management positions (FM), presence of members of the family on the board of directors (FBP) or company being run by a family member (CEOFam) would have to be larger than zero (e.g., at least one family member would have to be present on the board).

8
Table 1. Results Yielded by SDBC and Survey Dataset
Compared models SDBC Data Survey Definition 1: Percentage of companies where a family owns at least 50% of the company's shares
84% 87%
Definition 2: Percentage of companies where a family owns at least 50% of the company's shares, while intention to keep business in the family exists and at least one family member has management responsibility
36% 30%
The datasets (Table 1) yielded similar percentages of family companies for both family firm definitions. This suggests that the estimators obtained by our current study have sufficient validity to robustly estimate the impact of family firms to the U.S. economy. In the next section, we describe how we calculated the percentages of family and non-family firms for each ring of the bull’s eye.
Quantifying the bull’s eye rings The bull’s eye considers three different conceptualizations of family firms: broad, middle and narrow (Astrachan & Shanker, 2003; Shanker & Astrachan, 1996). Each conceptualization is outlined in more detail below. The broad ring
The updated broad ring implies either full strategic control of the company, or partial strategic control paired with a proven participation of the family in the company. This definition is slightly more inclusive than previous definitions, ensuring the broad ring includes companies where a family is involved in the business while boasting at the very least partial control of its strategic direction. To quantify full strategic control of the company, we used a minimum percentage of the company owned by one family (FO), of 51%. The second part of the theoretical definition was quantified by including companies with family ownership between 5 and 50 percent, when found in combination with any of the other aforementioned variables (MGO, FM, FBP, CEOFam), i.e, the presence of at least one family member in the business. The 5 percent threshold for the lower bound of family ownership follows generally accepted research practice (e.g., Anderson & Reeb, 2003) and parallels the earlier study. To obtain data points for our estimator construction we utilized a regression analysis (see Appendix 4 for details). The “blue dots” in Figure 2 show our actual data points, while the curve

9
portrayed in the figure shows the regression estimates. The shaded areas show confidence intervals, which get wider at the tail-end of the curve, as less data are available. The regression estimates allow for a more careful estimation of the family firm impact than our raw data could have provided.
The middle ring
Due to the lack of sufficient responses, it was not possible to reliably use intention for business to remain in the family as an estimation variable for the middle conceptualization of family business. As such, we adjusted the middle ring utilizing the above-mentioned statistical technique.2 Instead of utilizing intentions, we used the existence of multiple generations of family owners, as the most proximate variable for intentions. Yet, this variable is more restrictive and thus more conservative than intention for business to remain in the family, as it excludes companies whose shares are concentrated in the hands of one family member. Consequently, a tightening effect can be observed in the middle ring, when compared to the 2003 analysis by Astrachan and Shanker.
2 Despite the missing data, we re-estimated the middle and narrow ring models in Appendix 5. While the estimators are not as robust as the analysis presented in the general write-up, the estimated economic impact is similar. Appendix 6 summarizes the result in the bull’s eye figure.
Figure 2. Probability of a company belonging to the broad ring, given its number of employees
10
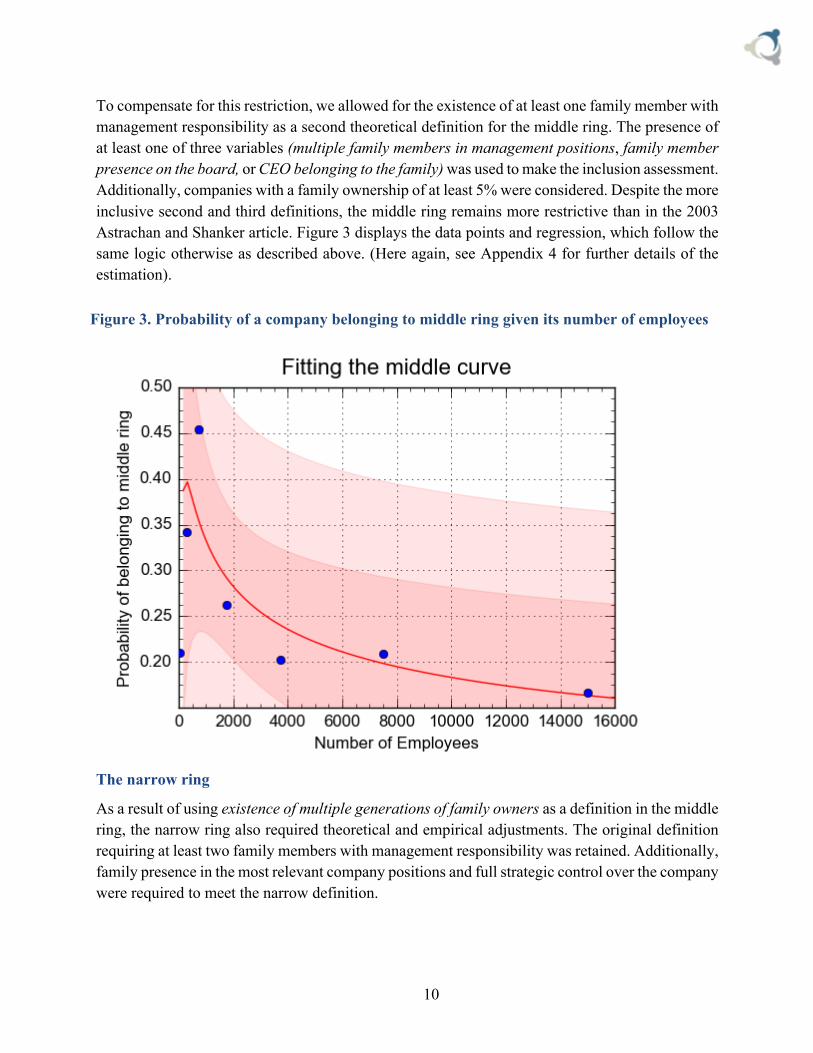
To compensate for this restriction, we allowed for the existence of at least one family member with management responsibility as a second theoretical definition for the middle ring. The presence of at least one of three variables (multiple family members in management positions, family member presence on the board, or CEO belonging to the family) was used to make the inclusion assessment. Additionally, companies with a family ownership of at least 5% were considered. Despite the more inclusive second and third definitions, the middle ring remains more restrictive than in the 2003 Astrachan and Shanker article. Figure 3 displays the data points and regression, which follow the same logic otherwise as described above. (Here again, see Appendix 4 for further details of the estimation).
The narrow ring
As a result of using existence of multiple generations of family owners as a definition in the middle ring, the narrow ring also required theoretical and empirical adjustments. The original definition requiring at least two family members with management responsibility was retained. Additionally, family presence in the most relevant company positions and full strategic control over the company were required to meet the narrow definition.
Figure 3. Probability of a company belonging to middle ring given its number of employees
11
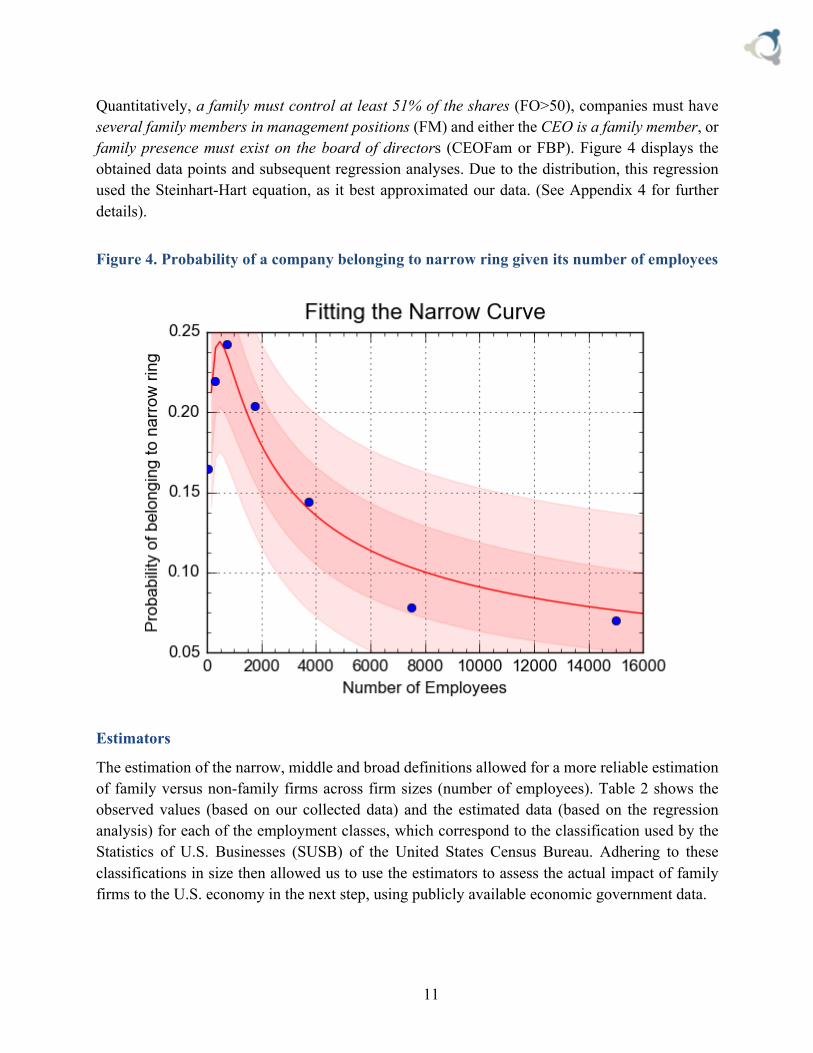
Quantitatively, a family must control at least 51% of the shares (FO>50), companies must have several family members in management positions (FM) and either the CEO is a family member, or family presence must exist on the board of directors (CEOFam or FBP). Figure 4 displays the obtained data points and subsequent regression analyses. Due to the distribution, this regression used the Steinhart-Hart equation, as it best approximated our data. (See Appendix 4 for further details).
Estimators
The estimation of the narrow, middle and broad definitions allowed for a more reliable estimation of family versus non-family firms across firm sizes (number of employees). Table 2 shows the observed values (based on our collected data) and the estimated data (based on the regression analysis) for each of the employment classes, which correspond to the classification used by the Statistics of U.S. Businesses (SUSB) of the United States Census Bureau. Adhering to these classifications in size then allowed us to use the estimators to assess the actual impact of family firms to the U.S. economy in the next step, using publicly available economic government data.
Figure 4. Probability of a company belonging to narrow ring given its number of employees

12
Table 2. Observed Values and Estimator Values for the Bull’s Eye Rings
Employment class\Models
Observed Values
(Broad)
Estimator Values
(Broad)
Observed Values
(Middle)
Estimator Values
(Middle)
Observed Values
(Narrow)
Estimator Values
(Narrow)
Less than 100 employees 0.8816 0.8699 0.2105 0.2023 0.1645 0.1488 100-499 employees 0.7397 0.7812 0.3425 0.3982 0.2192 0.2386 500-999 employees 0.7273 0.6742 0.4545 0.3530 0.2424 0.2349 1,000-2,499 employees 0.5146 0.5404 0.2621 0.2922 0.2039 0.1883 2,500-4,999 employees 0.4135 0.4203 0.2019 0.2399 0.1442 0.1394 5,000-9,999 employees 0.3478 0.3341 0.2087 0.1984 0.0783 0.1031 More than 10,000 employees 0.2719 0.2760 0.1667 0.1634 0.0702 0.0764
Results Using the estimators calculated in the previous section, we proceeded with the assessment of the impact of family businesses on the U.S. economy. For each ring, we calculated the contribution of family businesses to Gross Domestic Product (GDP), workforce employed by family businesses, the percentage of business tax returns made by family businesses, and the total number of existing family businesses, maintaining comparability with the 2003 Astrachan and Shanker study. All findings are summarized in Figure 5. Number of family businesses and business tax returns
To calculate the number of family businesses and the percentage of business tax returns made by family businesses, we drew information from two sources. Using the Statistics of U.S. Businesses by Employment Size (United States Census Bureau, 2012), we obtained the percentage of businesses in each employment class. The Internal Revenue Service (IRS) provided information on tax returns. There are two relevant types of tax returns that can be filed: individual tax and business tax. Within business tax returns, there are three legal forms of organization which we had to take into account in our analysis: Sole Proprietorships, Partnerships and Corporations. Please note that small farms (agricultural firms) are generally classified in individual tax income returns. As these entities generally have strong family involvement, they are also part of our analysis. See Table 3 and Table 4 for an overview of legal forms and work-force distribution that were used for our subsequent analysis. Using the percentage of businesses per employment class obtained through the U.S. Census Bureau data, we distributed the number of Sole Proprietorships, Partnerships and Corporations between the employment classes. We subsequently combined the results with the estimators calculated for each employment class to obtain the final impact for each of the bull’s eye rings.

13
Specifically, the broad ring of the bull’s eye was estimated to contain 32.4 million family businesses, representing 87% of all business tax returns in the United States. In the middle ring, there are 9.1 million family businesses, accounting for 25% of business tax returns. Our narrowest ring encompasses 7.2 million family businesses, totaling 19% of business tax returns3.
Table 3. 2015 Total IRS Business Tax Returns by Legal Form of Organization
Type of tax return Number of tax returns %
Total 36,994,324 100
Sole Proprietorships 25,226,245 68
Partnerships 3,715,187 10
Corporations 6,119,565 17
Farms 1,933,327 5
Source: US Department of Treasury - Internal Revenue Service (2015).
Percentage of workforce
To quantify the contribution of family businesses to employment, we obtained the ratio of paid employees per employment class from the U.S. Census Bureau. These data could be directly combined with the estimators obtained in the previous section to calculate the percentage of workforce for each ring. In the broadest ring, family businesses are responsible for employing 59% of private sector workforce, accounting for 83.3 million jobs. Family businesses in the middle ring account for 23% of the U.S. workforce or 32.6 million jobs. In the last and narrowest ring, family businesses employ 14% of the U.S. workforce or 20 million jobs.
3 As sole proprietors often operate multiple businesses and file multiple tax returns, we provide an alternative form of calculating the number of family businesses in each ring. We derived the number of non-employer businesses from the U.S. Census Bureau Non-Employer Statistics (2015) and number of employer businesses from the U.S. Census Bureau - Statistics of U.S. Businesses (2012). We then combined these data with IRS data to obtain a total family business count of 26.4 million for the broad ring, 7.4 million for the middle ring and 5.8 million for the narrow ring.

14
Table 4. 2019 Division of Workforce
US Workforce in 2019 No. of Employees (thousands) %
Total Workforce 162,796 100 Private (Non-farm) 137,899 83 Private (Farm) 2,304 1 Government 22,593 15 Source: US Department of Labor - Bureau of Labor statistics (2019).
Contribution to GDP
In a final step, we estimated the family firm impact on the Real Gross Domestic Product (GDP). We drew information from the Bureau of Economic Analysis (U.S. Small Business Administration, 2019), as well as from the U.S. Census Bureau by employment class. Table 5 summarizes the data. Table 5. 2019 Estimated Real Gross Domestic Product by Sector
Gross Domestic Product by Sector GDP (billions of $) % Total 21,433 100 Private industries (non-farm) 14,158 66 Private industries (farm) 175 1 Government (Federal, State and Local) 7,100 33 Source: Government Receipts and Expenditures - Bureau of Economic Analysis (2019); US Department of Commerce - Bureau of Economic Analysis (2019).
In our broadest ring, family businesses contribute 54% of private sector GDP, or 7.7 trillion USD. Family businesses in the middle ring contribute 23% of private sector GDP, or 3.2 trillion USD. Finally, family businesses in the narrow ring contribute 14% of private sector GDP, or 2 trillion USD.
15
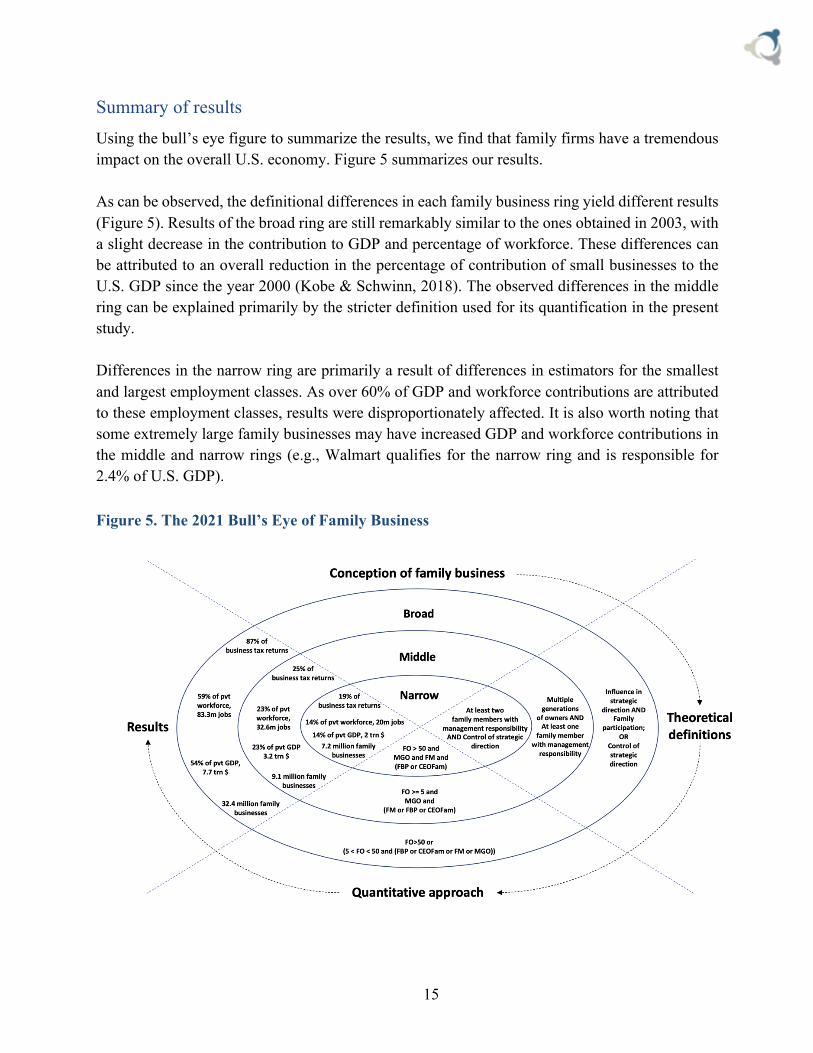
Summary of results Using the bull’s eye figure to summarize the results, we find that family firms have a tremendous impact on the overall U.S. economy. Figure 5 summarizes our results. As can be observed, the definitional differences in each family business ring yield different results (Figure 5). Results of the broad ring are still remarkably similar to the ones obtained in 2003, with a slight decrease in the contribution to GDP and percentage of workforce. These differences can be attributed to an overall reduction in the percentage of contribution of small businesses to the U.S. GDP since the year 2000 (Kobe & Schwinn, 2018). The observed differences in the middle ring can be explained primarily by the stricter definition used for its quantification in the present study. Differences in the narrow ring are primarily a result of differences in estimators for the smallest and largest employment classes. As over 60% of GDP and workforce contributions are attributed to these employment classes, results were disproportionately affected. It is also worth noting that some extremely large family businesses may have increased GDP and workforce contributions in the middle and narrow rings (e.g., Walmart qualifies for the narrow ring and is responsible for 2.4% of U.S. GDP).
Figure 5. The 2021 Bull’s Eye of Family Business

16
While there is continuing debate about the appropriateness of one family business definition over another, we do not presume to make a statement on whether one ring or another of the bull’s eye more accurately reflects the true impact of family businesses on the U.S. economy. We merely want to raise awareness that the obtained values vary based on the family business definition used. Yet, each of the bull’s eye rings (definitions) shows a significant impact of family businesses on the U.S. economy. Policy recommendations should take into account the different definitions.
Outlook Family business research in the U.S. and around the world has increased dramatically over time, as the importance of family firms continues to become more and more salient to business school faculty and key decision makers in both industry and politics (Debicki, Matherne, Kellermanns, & Chrisman, 2009). However, with the exception of the study by Astrachan and Shanker (2003), on which we based our current analysis, the actual impact of family businesses on the U.S. economy has been neglected and an up-to-date basis for solid policy decisions has been missing. Our current study addresses and closes this gap and is the first in almost 20 years to explore the impact of family firms on the U.S. economy. We conclude that regardless of the definition used family firms are essential to the prosperity of the United States. Virtually all countries (in both the developed and developing parts of the world) have a significant presence of family firms in their respective economies (see also IFERA (International Family Enterprise Research Academy), 2003; La Porta, Lopez-de-Silanes, & Shleifer, 1999). Thus, in addition to further validate our estimators with a larger sample, we call on the research community to provide up-to-date estimates of family firms world-wide which would allow researchers, practitioners and policymakers to assess the global impact of family firms beyond sometimes questionable estimates and anecdotal evidence currently available. In the light of the current Covid-19 pandemic, the relevance of this call for future research becomes urgent. The entire world is in the midst of a health and economic crisis that has the potential to lead to extreme policy decisions. Family firms and family researchers (e.g., De Massis & Rondi, 2020) have to adapt to these new realities. A critical reflection on how family businesses are, can, and will be active agents in the resolution of the crisis is unquestionably relevant (e.g. Amore, Pelucco, & Quarato, 2020; De Massis & Rondi, 2020). In this regard, please see also best practice recommendation for family firms in times of Covid-19 (Astrachan et al., 2020). Accordingly, this study provides a critical foundation for assessing the impact that policy decisions (e.g., estate taxes, income taxes, etc.) might have on family firms, which are key pillars of the U.S. economy and should also become a key focus on the federal level in the effort of bringing the country back on track and dampening the economic consequences of Covid-19.

17
References Akaike, H. (1974). A new look at the statistical model identification. IEEE Transactions on
Automatic Control, 19(6): 716-723. Amore, M. D., Pelucco, V., & Quarato, F. (2020). Family Ownership During the Covid-19
Pandemic. CEPR Discussion Paper No. DP14759: https://ssrn.com/abstract=3603991. Anderson, R., & Reeb, D. (2003). Founding-family ownership and firm performance: Evidence
from S&P 500. The Journal of Finance, 58(3): 1301-1327. Astrachan, J., Binz, C., Botero, I. C., Graves, C., Keyt, A., Kotlar, J., Pieper, T., Rüsen, T. A., &
Vazquez, P. (2020). https://ifera.org/crossing-the-crisis/: last accessed on 01/14/2021. Astrachan, J., & Shanker, M. (2003). Family businesses' contribution to the U.S. economy: A
closer look. Family Business Review, 16(3): 211-219. Chrisman, J. J., Chua, J. H., & Kellermanns, F. W. (2009). Priorities, resource stocks, and
performance in family and non-family firms. Entrepreneurship Theory and Practice, 33(3): 739-760.
Daspit, J. J., Chrisman, J. J., Sharma, P., Pearson, A. W., & Mahto, R. V. (2018). Governance as a source of family firm heterogeneity. Journal of Business Research, 84: 293-300.
De Massis, A., & Rondi, E. (2020). Covid‐19 and the Future of Family Business Research. Journal of Management Studies, 57(8): 1727-1731.
Debicki, B., Kellermanns, F. W., Chrisman, J., Pearson, A. W., & Spencer, B. (2016). Development of a socioemotional wealth importance (SEWi) scale for family firm research. Journal of Family Business Strategy, 7(1): 47-57.
Debicki, B. J., Matherne, C. F., Kellermanns, F. W., & Chrisman, J. J. (2009). Family business research in the new millennium: An overview of the who, the where, the what, and the why. Family Business Review, 22(2): 151-166.
Frank, H., Kessler, A., Rusch, T., Suess-Reyes, J., & Weismeier-Sammer, D. (2017). Capturing the familiness of family businesses: Development of the family influence familiness scale (FIFS). Entrepreneurship Theory and Practice, 41(5): 709-742.
Government Receipts and Expenditures - Bureau of Economic Analysis. (2019). https://www.bea.gov/data/government/receipts-and-expenditures. last accessed 01/14/2021.
IFERA (International Family Enterprise Research Academy). (2003). Family businesses dominate. Family Business Review, 16(4): 235-240.
Klein, S. B. (2000). Family Businesses in Germany: Significance and Structure. Family Business Review, 13: 157-181.
Klein, S. B., Astrachan, J. H., & Smyrnios, K. X. (2005). The F-PEC scale of family influence: Construction, validation, and further implication for theory. Entrepreneurship: Theory & Practice, 29(3): 321-339.
Kobe, K., & Schwinn, R. (2018). Small Business GDP 1998–2014. U.S. Small Business Administration, SBAHQ-15-M-0146.
La Porta, R., Lopez-de-Silanes, F., & Shleifer, A. (1999). Corporate ownership around the world. The Journal of Finance, 54: 471-517.
Memili, E., & Dibrell, C. C. E. (2019). (Eds.) The Palgrave handbook of heterogeneity among family firms. Cham, Switzerland: Palgrave Macmillan.
18
Shanker, M. C., & Astrachan, J. H. (1996). Myths and realities: Family businesses contribution to the US Economy- A framework for assessing family business statistics. Family Business Review, 9: 107-123.
Stanley, L., Hernández-Linares, R., López-Fernández , M. C., & Kellermanns, F. W. (2019). A taxonomy of family firms and entrepreneurial orientation. Family Business Review, 32(2): 174-194.
United States Census Bureau. (2012). https://www.census.gov/data/tables/2012/econ/susb/2012-susb-annual.html. last accessed 01/14/2021.
U.S. Census Bureau Non-Employer Statistics. (2015). https://www.census.gov/programs-surveys/nonemployer-statistics/data/tables.2015.html: last accessed 01/14/2021.
US Department of Commerce - Bureau of Economic Analysis. (2019). https://www.bea.gov/data/gdp/gdp-industry. last accessed 01/14/2021.
US Department of Labor - Bureau of Labor statistics. (2019). https://www.bls.gov/emp/tables/employment-by-major-industry-sector.htm: last accessed 01/14/2021.
US Department of Treasury - Internal Revenue Service. (2015). https://www.irs.gov/statistics/soi-tax-stats-integrated-business-data: last accessed 01/14/2021.
Wagner, D., Block, J. H., Miller, D., Schens, C., & Xi, G. (2015). A meta-analysis of the financial performance of family firms: Another attempt. Journal of Family Business Strategy, 6(1): 3-13.

19
Appendices Appendix 1: Questionnaire To minimize the number of unfinished responses, we created a logical tree in which respondents only need to answer questions relevant for their specific case. Logical tree of questionnaire.
Module 1:
The focus of this module was to establish general company information. The module focused on the following indicators: the primary position of surveyed individuals on the company, if the company is listed on the stock exchange, number of employees by IRS bracket and age. Below we review the questions in more detail. Question 1: What is your primary position in the company? The intent of this question was to establish the level of information available to the surveyed individual. Question 2: Is the company publicly listed? Having information on whether the companies were listed on the stock exchange helped identify differences between listed and non-listed companies regarding their family business status via online search as publicly listed companies are required to disclose far more ownership and management information than private firms. We reviewed and corrected some responses to this

20
question, as it became apparent that the question was misinterpreted by some of the surveyed individuals. Question 3: How many full-time employees does the company have? We added this question to increase the quality of data in the employment classes. While we could have taken the employment bracket information from the dataset we acquired, there was a risk of using outdated information, especially while in periods of economic uncertainty where companies tend to restructure more often. Question 4: When was the company founded? By establishing the age of the company, we obtained yet another indicator for potential analysis in comparison to the family business bull’s eye. However, as we had more direct data on family involvement over time, this proxy was not used in our analysis.
Module 2:
This was a key module in our survey. It focused on determining if a family controlled a significant enough percentage of the company to classify as a family business. Below we review the questions in more detail. Question 5: Is the CEO a family member? The intent of this question was twofold. The first one was to establish if the surveyed individual viewed the company as a family business (one of the answer options was “Not a family business”). The second one was to establish if a family member had control over the strategic direction of the company. Question 6: What percentage of the company is owned by a family? This question was used to make the distinction between possible family businesses and companies which were not family businesses. A 5% threshold was selected to separate companies that could potentially be family businesses (in conjunction with other factors) and companies that are not family businesses. At first sight, 5% might seem a low threshold to consider, but is generally accepted in scholarly research (e.g., Anderson & Reeb, 2003).
Module 3:
This module focused on the influence of the family on corporate governance. Below we review the questions in more detail. Question 7: Does the company have a board? This question was meant to establish the existence of a board of directors in the company, as well as presence of the family on the board. This answer was used in conjunction with question 5 to determine the family’s control of the strategic direction of the company.

21
Question 8: What percentage of the board is composed of family members? This question was used to establish the degree of control the family had in the board of directors. Question 9: Are there multiple family generations in top management positions? This question was designed to quantify the key factor in the narrow circle of the bull’s eye, whether more than one member of the company owner(s) family had management responsibilities. Question 10: Do multiple family generations have shares in the company? This question was designed to quantify the key factor in the narrow circle of the bull’s eye, whether multiple generations of the same family owned the company. Question 11: On a scale from 1-10, what is the likelihood that the company will be handed over to the next generation? This question was used to answer the key factor in the middle circle of the bull’s eye, to what extent the company was intended to remain in the owning family. Question 12: Does the company have a board? This question was a variation of question 7 with fewer options, in that it was only asked to companies in which no family controlled at least 5% of the company shares. It was used only to establish the presence of a board of directors in these companies. Question 13: Would you like to receive the study once it is published? This question was meant to provide a small token of gratitude to the respondents that participated in the study by providing them with the results of their contribution upon their request.
22
Appendix 2: Further information about data collection Employment classes:
- Less than 100 employees - 100 to 499 employees - 500 to 999 employees - 1000 to 2,499 employees - 2,500 to 4,999 employees - 5,000 to 9,999 employees - More than 10,000 employees
Sampling the sample: To reduce the risk of response bias, two samples of 150 contacts were extracted from the dataset to test different approaches of communication: a family-business specific email and neutral email. There was no noticeable difference in the ratio of family/non-family businesses responding to or opening either version of the email. However, the response rate was relatively low (2%) and therefore results were marginally conclusive.
23
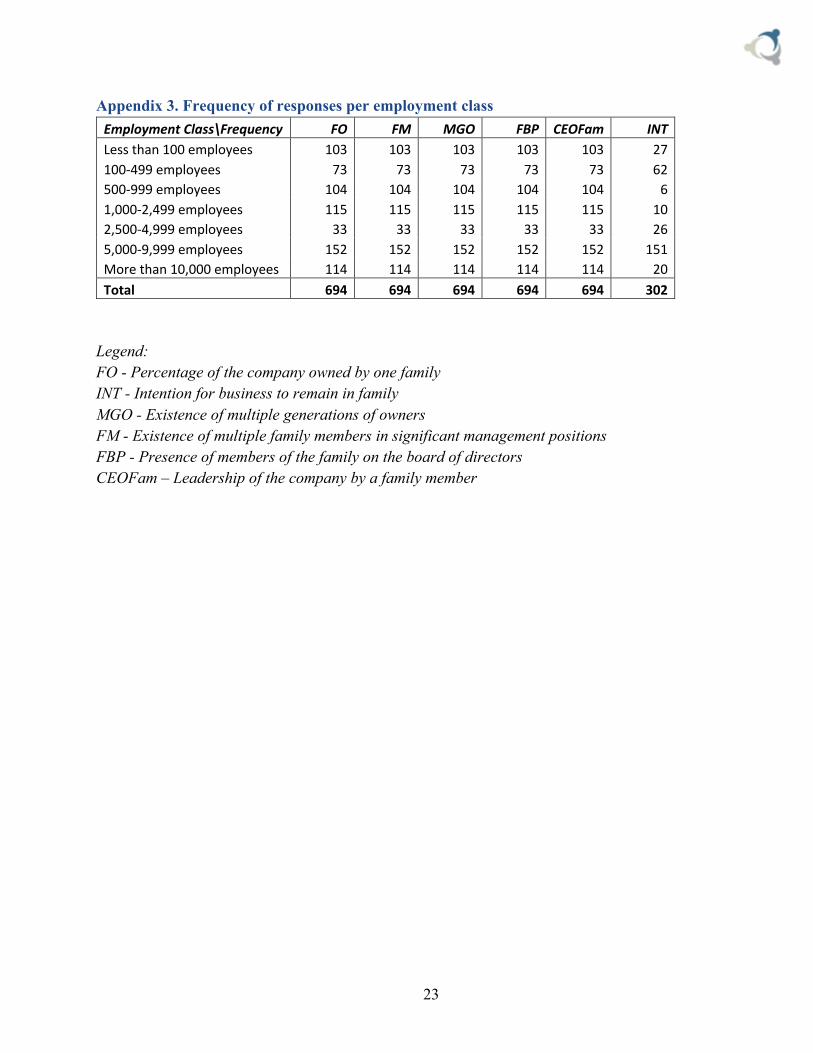
Appendix 3. Frequency of responses per employment class Employment Class\Frequency FO FM MGO FBP CEOFam INT Less than 100 employees 103 103 103 103 103 27 100-499 employees 73 73 73 73 73 62 500-999 employees 104 104 104 104 104 6 1,000-2,499 employees 115 115 115 115 115 10 2,500-4,999 employees 33 33 33 33 33 26 5,000-9,999 employees 152 152 152 152 152 151 More than 10,000 employees 114 114 114 114 114 20 Total 694 694 694 694 694 302
Legend: FO - Percentage of the company owned by one family INT - Intention for business to remain in family MGO - Existence of multiple generations of owners FM - Existence of multiple family members in significant management positions FBP - Presence of members of the family on the board of directors CEOFam – Leadership of the company by a family member
24
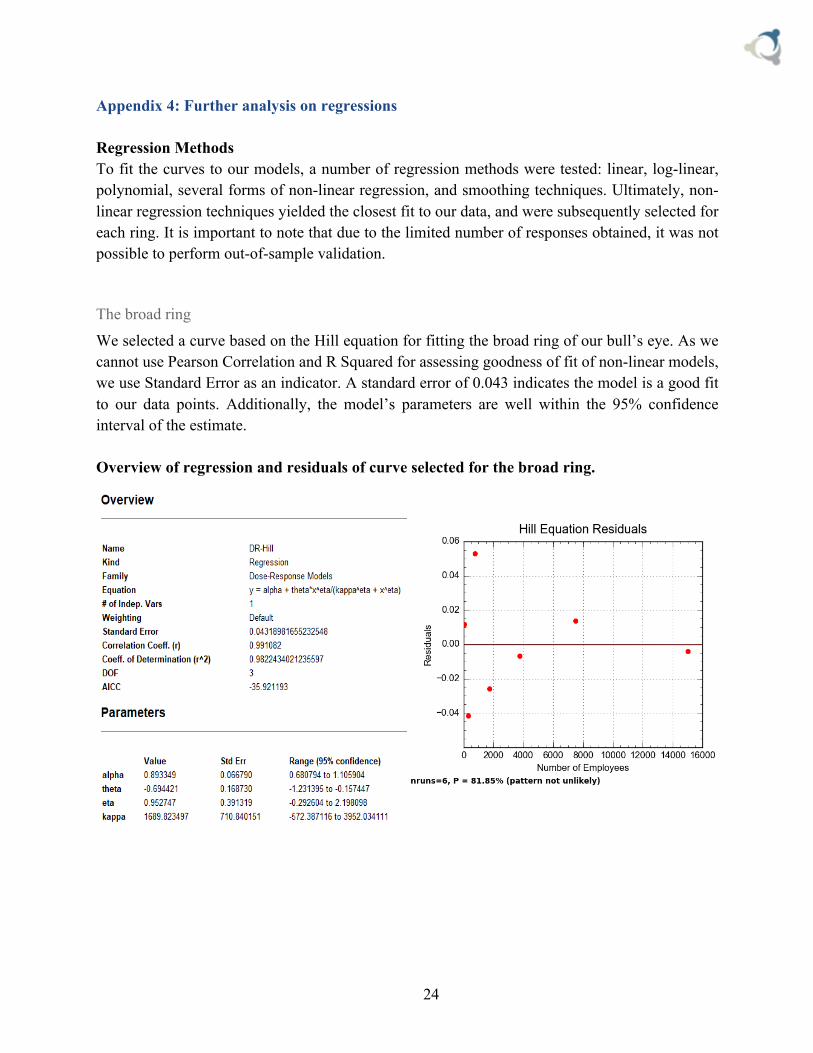
Appendix 4: Further analysis on regressions Regression Methods To fit the curves to our models, a number of regression methods were tested: linear, log-linear, polynomial, several forms of non-linear regression, and smoothing techniques. Ultimately, non-linear regression techniques yielded the closest fit to our data, and were subsequently selected for each ring. It is important to note that due to the limited number of responses obtained, it was not possible to perform out-of-sample validation.
The broad ring
We selected a curve based on the Hill equation for fitting the broad ring of our bull’s eye. As we cannot use Pearson Correlation and R Squared for assessing goodness of fit of non-linear models, we use Standard Error as an indicator. A standard error of 0.043 indicates the model is a good fit to our data points. Additionally, the model’s parameters are well within the 95% confidence interval of the estimate. Overview of regression and residuals of curve selected for the broad ring.
25
While the Akaike Information Criterion (Akaike, 1974) indicates this curve is not the best choice among our tested models (albeit a close second), the subsequent residual analysis was more favorable towards this curve, leading to our final choice for the broad ring.
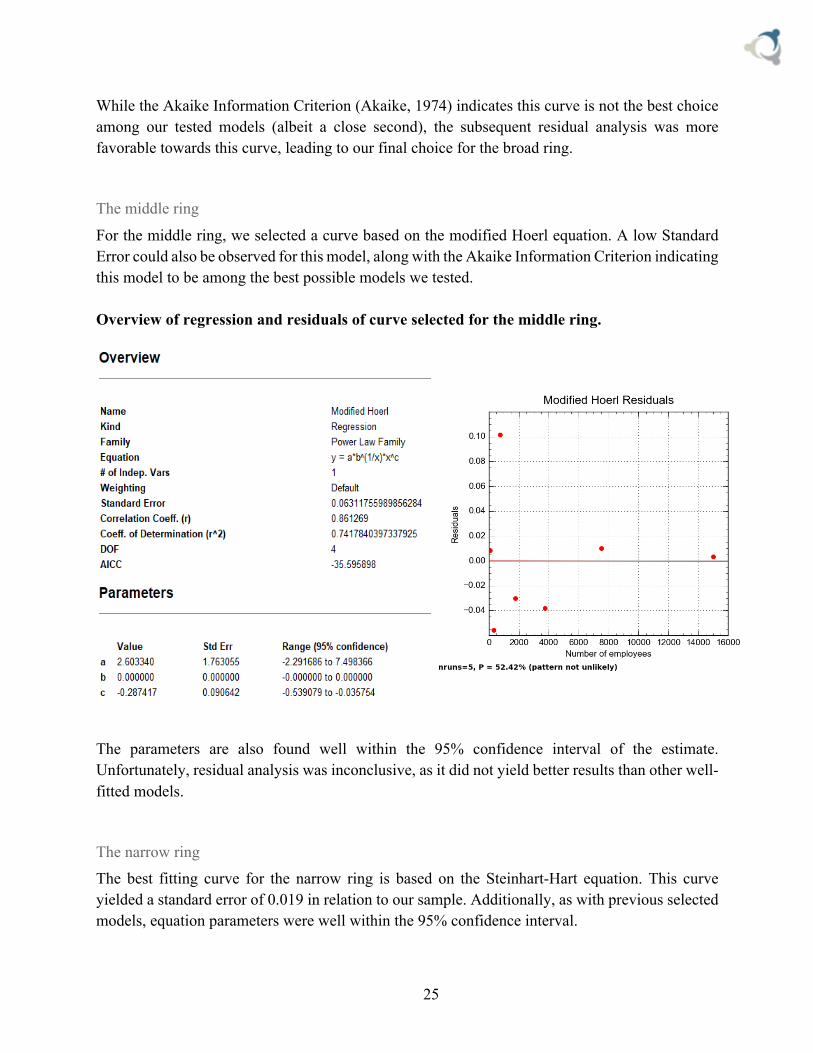
The middle ring
For the middle ring, we selected a curve based on the modified Hoerl equation. A low Standard Error could also be observed for this model, along with the Akaike Information Criterion indicating this model to be among the best possible models we tested. Overview of regression and residuals of curve selected for the middle ring.
The parameters are also found well within the 95% confidence interval of the estimate. Unfortunately, residual analysis was inconclusive, as it did not yield better results than other well-fitted models.
The narrow ring
The best fitting curve for the narrow ring is based on the Steinhart-Hart equation. This curve yielded a standard error of 0.019 in relation to our sample. Additionally, as with previous selected models, equation parameters were well within the 95% confidence interval.

26
Overview of regression and residuals of curve selected for the narrow ring.
The Akaike Information Criterion indicated the curve to be among the best we tested. Finally, residual analysis did not allow us to further distinguish the competing models. As we know that business volume from very large businesses is likely to impact results of the highest employee class for GDP and employment, we considered, among our best fitted models, a model with a slightly heavier tail.

27
Appendix 5. Models using previous paper’s definitions for middle ring (INT) The theoretical definitions behind the previous paper’s middle ring were the existence of intention for business to remain in the family and the CEO being a family member. This led to the direct usage of the INT and CEOFam variables to quantify this middle ring. Selected middle ring curve using intention

28
Overview of regression and residuals of curve selected for the middle ring using intention.
The best fitting curve for the middle ring using intention was based on a model using a variation of a rational equation. This curve yielded a standard error of 0.1. Additionally, equation parameters are well within the 95% confidence interval and residuals were random. Using this model, we calculated the estimator results based on the probability value generated by the mean of each employment class. Observed and Estimator values for the middle ring using intention.
Employment class\Models Observed
values (Middle)
Estimator values
(Middle) Less than 100 employees 0.4967 0.4849 100-499 employees 0.5000 0.5563 500-999 employees 0.7308 0.6262 1,000-2,499 employees 0.5556 0.6636 2,500-4,999 employees 0.6667 0.6112 5,000-9,999 employees 0.5000 0.4841 More than 10,000 employees 0.3000 0.3295

29
Appendix 6. Bull’s eye with intentions as part of the middle ring definition Using the obtained estimators, the middle ring using intention includes 49% of business tax returns, 19 million companies, 47% of private workforce and 47% of private sector GDP. Bull’s eye using middle ring with intention.