faithful representation hujibschool.huji.ac.il/.upload/seminars/faithful representation...
TRANSCRIPT
1
Faithful Representation
Efrat Shust School of Business Administration
Hebrew University of Jerusalem [email protected]
Dan Weiss
Faculty of Management Tel Aviv University
This version: October 2014
PRELIMINALRY DRAFT, PLEASE DO NOT QUOTE
ABSTRACT
Statement of Financial Accounting Concepts No. 8 challenges accounting research to
provide techniques for empirically measuring faithful representation apart from
relevance, that is, to disentangle between the two characteristics of useful financial
information. Addressing this call, we introduce a new comprehensive and context-free
metric for measuring faithful representation. Using this metric, we find that low levels
of faithful representation only marginally influence the value relevance of financial
information. However, investors find low level of faithful representation to be value-
decreasing. The evidence suggests that the two fundamental characteristics of useful
financial information are independent, with a marginal mutual impact. Additional
findings indicate that non-recurring accounting estimates (e.g., restructuring costs, in-
process research and development) impede the faithful representation more than
recurring estimates (e.g., depreciation, doubtful receivables).
Keywords: faithful representation, usefulness of financial information, value
relevance, accounting estimates.
JEL classification: M41; G14.

2
Faithful Representation
1. Introduction
The purpose of financial reporting is to provide useful information to users of
financial statements. While reliability of information reported in financial statements
has been a one of the two fundamental characteristics of useful financial information,
Statement of Financial Accounting Concepts No. 8 (SFAC 8, 2010) replaced the term
reliability with the term faithful representation. SFAC 8 limits the scope of faithful
representation: accounting information is to be “complete, neutral, and free from
error” (SFAC 8, QC12). While reliability was a broad concept, SFAC 8 does not
consider prudence (conservatism), substance over form, and verifiability as aspects of
faithful representation. Moreover, SFAC 8 challenges accounting research: “studies
have not yet provided techniques for empirically measuring faithful representation
apart from relevance.” (SFAS 8, BC3.30).
Addressing this call, we introduce a metric for empirically measuring faithful
representation of information in financial statements, apart from relevance. The metric
is context-free and based on observable incidents that capture complete, neutral, and
error-free information. We utilize the metric for (i) exploring sources of weak faithful
representation of accounting information, and, (ii) examining the impact of low versus
high levels of faithful representation on the value relevance of accounting
information.
Results based on about 39,000 firm-year observations from 2002 till 2012 indicate
that intensive use of accounting estimates diminishes faithful representation of
financial statements. Particularly, non-recurring accounting estimates (e.g.,
restructuring costs, in-process research and development) impede the faithful
3
representation more than recurring estimates (e.g., depreciation, doubtful receivables).
Additionally, low levels of faithful representation were found in small firms, loss
firms, young firms and volatile firms.
Testing the impact of faithful representation of accounting information on its
value relevance, we find that low levels of faithful representation only marginally
influence its value relevance. Interestingly, low levels of faithful representation
insignificantly affect value relevance in a sub-sample of loss firms as well as in sub-
sample of profit firms. However, low level of faithful representation is associated with
lower stock return of about 3% per year. That is, investors find low level of faithful
representation to be value-decreasing. Overall, the results suggest that investors assign
marginal weight to the level of faithful representation when they incorporate
accounting information into stock prices.
The study makes three contributions. First, the findings contributes by addressing
the standard-setters’ call for an empirical measurement of faithful representation apart
from relevance. The evidence suggests that the two fundamental characteristics of
useful financial information, faithful representation and relevance, are independent,
with a marginal mutual impact. Specifically, investors only marginally differentiate
between the value relevance of accounting information with low versus high level of
faithful representation. Yet, investors appreciate faithful representation and assign
higher value to firms that faithfully represent their financial statements.
Second, the negative impact of accounting estimates on faithful representation
highlights another meaningful aspect of faithful representation by offering guidance to
standard-setters. Particularly, the findings show that non-recurring accounting
estimates are more harmful than recurring estimates. These findings suggest that
reporting non-recurring estimates in financial statements hinders their faithful

4
representation. Therefore, particular attention should be given to requirements to
report non-recurring accounting estimates due to their negative impact on the
usefulness of financial statements. Moreover, standard-setters may consider requiring
firms to report the realization of accounting estimates in future periods.
Third, we introduce a new measure of faithful representation of accounting
information, apart from value relevance. The measure is based on observable
incidents formerly associated in the literature with low levels of completeness,
neutrality or with erroneous accounting information, as directed by SFAS 8. Overall,
a context-free measure allows for further investigation of various aspects of faithful
representation of accounting information.
The remainder of the essay proceeds as follows: Section 2 discusses faithful
representation and related literature, Section 3 introduces the new reliability measure,
Section 4 presents characteristics of low faithful representation firms and section 5
explores accounting estimates as determinants of low faithful representation. Section
6 disentangles between faithful representation and value relevance and Section 7
concludes.
2. Faithful Representation
SFAC 8 highlights the two fundamental qualitative characteristics of useful
financial information: relevance and faithful representation. While relevance has
attracted much attention in the literature, faithful representation is a new concept,
which replaces 'reliability' used by the superseded Statement of Financial Accounting
Concepts No. 2 (SFAC 2) (FASB 1989). The FASB clarifies, in the basis for
conclusions section, that there is a lack of a common understanding of the term
‘reliability’. Some focus on verifiability or free from material error, while others,

5
focus more on neutrality.1 Taking a different path, others think that reliability refers
primarily to the precision of accounting information. Overall, it seems that
‘reliability’ means different things to different people. Attempts to clarify the term
‘reliability’ were proven unsuccessful (SFAC 8, p. 27, BC3.24). Therefore, the FASB
utilized a new term, faithful representation. Accordingly, the FASB determined that
"To be a perfectly faithful representation, a depiction would be complete, neutral, and
free from error."2,3
As observed by the FASB, prior academic studies present different perceptions of
reliability, some of them are inconsistent with the new definition of faithful
representation in SFAC 8. Choi, Collings and Johnson (1997) view reliability as
precision, i.e., the ratio of noise variance to the total variance of the observed
accounting measure. In the context of option-like characteristics embedded in bonds,
Barth, Landsman and Rendleman (1998) interpret reliability as the robustness of
financial statement amounts to estimation order. Kothari, Laguerre and Leone (2002)
note in the context of R&D expenditures that the definition of reliability can be
broaden to include uncertainty of future benefits.4 Taking a different perspective,
Cotter and Richardson (2002) define reliability ex-post, in terms of reversals of
recognized value increases. These views of reliability were consistent with SFAC 2,
but do not seem to capture the essence of faithful representation as defined in SFAC
8.
1 Con 2 listed representational faithfulness, verifiability, and neutrality as aspects of reliability. 2 See p. 17, QC12 3 Interestingly, CON8 avoids discussing trade-offs between the characteristics of useful financial information. Previously, CON 2 (p. 15) stated that "Although financial information must be both relevant and reliable to be useful, information may possess both characteristics to varying degrees. It may be possible to trade relevance for reliability or vice versa, though not to the point of dispensing with one of them altogether." Conversely, CON 8 does not address such trade-off. 4 They also report that most readers of their study interpret uncertainty of future benefits to be synonymous with reliability.

6
On the other hand, vast literature associates the lack of reliability with the amount
of manipulation exercised by management on financial reporting (e.g., Dietrich,
Harris and Muller 2001; Dye and Sridhar 2004; Kallapur and Kwan 2004).
Manipulations introduce bias, which hurts the neutrality of accounting information as
required for faithful representation. Also, some of these studies note that errors in the
reporting process. Errors generate specious financial reports, in contrast with the
requirement for faithful representation of accounting information. Therefore,
manipulations and errors undermine faithful representation as defined by SFAC 8.
The elusive nature of reliability as described in SFAC 2 may have hindered the
evolvement of a widely accepted measure to capture it. Various studies employ
context-specific metrics of reliability tailored to the research question tested in each
study. For example, Dietrich et al. (2001) examine the reliability of investment
property fair value estimates using actual selling prices; Cotter and Richardson (2002)
analyze the reliability of asset revaluation using the amount of subsequent years’
reversals of upward revaluations; Kallapur and Kwan (2004) test the reliability of
recognized brand assets using their market capitalization rates. Barth et al. (1998)
investigate reliability of option-like characteristics embedded in bonds using variation
of estimated values obtained through different measurement methods and
comparisons of estimates to available benchmarks. Overall, these studies offer several
measures of reliability, each applicable to a limited setting and to a specific notion of
relatability. More importantly, these metrics were designed to capture reliability as in
SFAC 2, not faithful representation as in SFAC 8. Therefore, none of these measures
enables a general and context-free and examination of faithful representation.
A context-free examination of faithful representation is important since this
characteristic relates to financial statements, above and beyond specific items. To

7
demonstrate that, we consider a firm that has ineffective controls over financial
reporting due to lack of qualified accounting personnel. It is questionable, at best,
whether the financial statements of such firm, in their entirety, provide useful
accounting information. Yet, this shortcoming cannot be related directly to a specific
item. Consequently, it is likely that users of such statements attribute them low
faithful representation, without attaching it to one item or another. This example
points out the need for a context-free measure of faithful representation of financial
statements, which capture the extent to which the accounting information reported in
financial statements is complete, neutral and free from error, as required by SFAC 8.
Finally, SFAC 8 suggests imposing on any faithful representation measure another
requirement – disentangle the measurement of relevance from the measurement of
faithful representation. SFAC 8 addresses existing empirical research and emphasizes
that: "Empirical accounting researchers have accumulated considerable evidence
supporting relevant and faithfully represented financial information through
correlation with changes in the market prices of entities’ equity or debt instruments.
However, such studies have not provided techniques for empirically measuring
faithful representation apart from relevance."5 Addressing this call, the next section
introduces a measure of faithful representation apart from relevance, hence allow
disentanglement between these two characteristics.
Summing up, a measure of faithful representation needs (i) to be compatible with
the definition in SFAC 8; i.e., complete, neutral and free from error, (ii) to be context-
free, and (iii) to allow for a distinction between faithful representation and value
relevance of accounting information. The next sections introduce such measure.
5 See p. 28, BC3.30.

8
3. Measuring Faithful Representation
To construct a measure of faithful representation, we build on prior literature that
acknowledges certain indicators suggesting impaired completeness, neutrality and
erroneous financial statements though not directly in the context of reliability
analysis.6 Notably, many of these studies explore relationship between managerial
incentives, earnings manipulation and fraudulent behavior.
The first indicator is restatements, constituting direct evidence that previously
issued financial statements were problematic. Specifically, as Palmrose, Richardson
and Scholz (2004 p. 61) note, "Various provisions of the Securities Acts require
companies to correct inaccurate, incomplete, or misleading disclosures ...
management has a duty to correct statements made in any filing if the statements are
later discovered to have been false and misleading from the outset . . The company,
the SEC, an independent auditor or a combination thereof can identify the need for a
restatement." Hence, a restatement attests that financial statements were not
complete, neutral and free from errors.
The second indicator is ineffective internal controls over financial reporting. The
Public Company Accounting Oversight Board (PCAOB) states in Auditing Standard
No. 5 (2007) that “Effective internal control over financial reporting provides
reasonable assurance regarding the reliability of financial reporting . . . . If one or
more material weaknesses exist, the company’s internal control over financial
reporting cannot be considered effective.” Accordingly, ineffective controls disclosed
6 Since prior literature uses the traditional term 'reliability', we also use this term when referring to literature. Due to the closeness between these terms, we generally do not distinguish between reliability and faithful representation, unless said otherwise.

9
under the Sarbanes-Oxley Act (SOX) suggest impaired faithful representation (see
also Ashbaugh-Skaife et al. 2007; Ogneva, Subramanyam and Raghunandan 2007).
Third, literature suggests that a change of auditor increases the likelihood that
financial statements contain errors. Stice (1991) notes that a new auditor has a lower
ability to detect material misstatements in his audit process since he lacks familiarity
with the client. Hence, the risk of audit failure and subsequent litigation is higher
during an initial engagement than in subsequent years. Johnson, Khurana and
Reynolds (2002) also maintain that a great deal of the knowledge necessary to the
audit (such as knowledge of the client’s accounting system and internal control
structure) is client-specific. Thus, less client-specific knowledge in the early years of
an engagement may result in a lower likelihood of detecting material misstatements,
and the probability of erroneous or incomplete financial statements is higher.
The fourth indicator is a qualified, disclaimed, or adverse audit opinion. The
auditor’s failure or reluctance to produce an unqualified opinion indicates
disagreement with the financial statements issued by the firm. The lack of auditor
confirmation suggests damaged faithful representation (Lev and Thiagarajan 1993;
Butler, Leone and Willenborg 2004). Admittedly, qualified, disclaimed and adverse
audit opinions are rare. Nevertheless, we include this indicator in the faithful
representation measure for completeness of this measure.
The fifth and last indicator is just meeting/beating earnings benchmarks. Prior
literature hypothesizes and finds that firms slightly beating benchmarks are more
likely to have managed earnings (see Roychowdhury 2006; Cohen, Dey and Lys
2008; Jiang 2008; Cohen, Darrough, Huang and Zach 2011; Zang 2012). When
earnings manipulation takes place, financial information does not fulfill the

10
requirement to be neutral, as SFAC 8 articulates: "neutral depiction is not slanted,
weighted, emphasized, deemphasized, or otherwise manipulated to increase the
probability that financial information will be received favorably or unfavorably by
users.”7 Therefore, faithful representation of such financial statements is damaged.
Each of the five indicators suggests that financial statements are incomplete,
biased, erroneous or suffer from all three weaknesses. Therefore, these indicators
signal impaired faithful representation as in SFAC 8. Moreover, all these indicators
are context-free, making them an ultimate basis for a general faithful representation
measure.
The Proposed Faithful Representation Measure - FRSCORE
We introduce a comprehensive faithful representation measure (FR), which is aimed
to capture faithful representation of financial statements; i.e., complete, neutral, and
free from error accounting information. FR is based on the five adverse FR indicators
detailed above, and counts for each firm-year the number of indicators recorded out of
the following:
Filing of a restatement (RESTATE) – FRSCORE builds on information known
to investors. Thus, we record whether a restatement of earlier financial
statements was filed for firm i on year t.
Material weakness in internal controls over financial reporting (MW), disclosed
either under Section 302 or under Section 404 of the Sarbanes-Oxley Act.
Change of auditor (CHANGE).
Auditor adverse, qualified or no opinion (OPINION).
7 See p. 18, QC14.
11
Just meeting/beating earnings benchmarks (MBE) – We employ the three
earnings benchmarks frequently used in the literature: zero, last year’s earnings
per share (EPS) and analyst forecast consensus (Roychowdhury 2006; Cohen,
Dey and Lys 2008; Jiang 2008; Cohen, Darrough, Huang and Zach 2011; Zang
2012). These three benchmarks are used alternatively, i.e., meeting or slightly
beating either of them indicates manipulation, hence impaired faithful
representation.8
Focusing on a context-free measure, for every firm-year, FRSCORE counts the
number of adverse indicators recorded out of the five indicators listed above. That is,
FRSCORE=0 indicates the highest faithful representation of financial statements,
while FRSCORE=5 indicates the lowest faithful representation of financial
statements. This simple procedure avoids complex and controversial weighting of the
relative impacts of different indices. FRSCORE is context-free, transparent and easily
reproducible.9
FRSCORE is an appealing measure of faithful representation for a number of
reasons: (i) it captures the characteristics of faithful representation; i.e., complete,
neutral and free from error, as stated in SFAC 8, (ii) FRSCORE is a context-free
metric, and, (iii) FRSCORE is based on observable events formerly associated in the
literature with either low levels of completeness, neutrality or with erroneous
accounting information, (iv) FRSCORE does not rely on accounting policies and
8 Following Cohen et al. (2008) and Zang (2012), suspects of just beating/meeting the zero benchmark are defined as firm-years with earnings before extraordinary items over lagged assets between 0 and 0.005. Suspects of just beating/meeting last-year earnings are firm-years with change in basic EPS excluding extraordinary items from last year between zero and two cents; and suspects of just beating/meeting analyst forecast consensus are firm-years with actual EPS less the analyst forecast consensus outstanding prior to the earnings announcement date between zero and one cent. 9 Our reasoning is similar to Lev and Thiagarajan (1993) and Gompers, Ishii and Metrick (2003).
12
choices, and, (v) FRSCORE is based on real incidents and does not use high
accruals.10
Notably, FRSCORE allows testing value relevance apart from faithful
representation because all its components are context-free and unrelated to accounting
policies and choices. Therefore, FRSCORE does not reflect the contents of the
financial statements and the extent to which they are value relevant. As a result,
FRSCORE is a measure of faithful representation, not of value relevance. Therefore,
it enables us to disentangle the effect of faithful representation from the effect of
value relevance, as called for by SFAC 8.
To compute FRSCORE, we utilized data on its five components. Restatements
were extracted from the AuditAnalytics database, where each restatement is attributed
to the year in which the restatement was announced. Data on material weaknesses
over internal controls reported under SOX (Section 302 or Section 404 reports) were
also taken from the AuditAnalytics database. We considered a firm as having
ineffective controls if it disclosed one material weakness or more in internal controls
under either of these sections. Data on change of auditor and auditor opinion were
obtained from Compustat, as well as data necessary to identify firm-years just
meeting/beating earnings benchmarks (zero and last year’s EPS). Data on the third
benchmark, consensus analyst forecasts, is extracted from the Institutional Brokers’
Estimate System (I/B/E/S). The consensus earnings forecast was calculated as the
mean of all forecasts announced in the month preceding that of the earnings
announcement. We compare earnings forecast to actual earnings taken from the
I/B/E/S, since this data is more likely than the Compustat data to be consistent with
10 Accruals are value relevant, so accrual-based measures do not enable disentangling between faithful representation and value relevance.

13
the forecast in terms of the treatment of extraordinary items and special items. Table 1
depicts all the utilized variables.
[Table 1 about here]
We obtained financial data from the Compustat industrial annual file and stock
return information from the CRSP monthly file. The initial sample consisted of all
nonfinancial firms on Compustat from 2002 till 2012 with available total assets and
market value data, a total of 57,169 firm-years. Our sample period begins in 2002
since this is the earliest year for which we can obtain data on material weaknesses
over internal controls reported under SOX. Observations with revenues lower than ten
million dollars or with share prices below one dollar were deleted from the sample to
eliminate economically marginal firms (as in Lev et al. 2010). We also required firms
to have at least two consecutive years of available data, in order to allow for deflation
of variables, and sufficient CRSP stock return data. We do not limit the applicability
of FRSCORE to observations with available I/B/E/S data. Thus, when I/B/E/S data is
unavailable we utilize earning per share or change in earnings per share. These
requirements reduced the sample size to 38,718 firm-year observations.
Table 2 reports descriptive statistics of FRSCORE. The mean value of FRSCORE
is 0.325 and, as expected, the distribution of FRSCORE is skewed to the right. As for
the components of FRSCORE, being indicator variables their means represent
frequency in the sample. The most frequent indicators of low faithful representation
are restatements (RESTATE) recording a mean of 0.150, and meeting/beating
earnings benchmarks (MBE), with a mean of 0.105. Less frequent are change of
auditor (CHANGE) and ineffective internal controls over financial reporting (MW),
recording means of 0.083 and 0.069, respectively. Lastly, the occurrence of auditor

14
adverse, qualified or no opinion (OPINION) is rare, reflected by a mean of about
0.001. These frequencies are generally consistent with findings of prior literature
(Butler, Leone and Willenborg 2004; Kim and Park 2006; Ashbaugh-Skaife, Collins,
Kinney and Lafond 2008; Ashbaugh-Skaife, Collins, Kinney and Lafond 2009; Zang
2012)
[Table 2 about here]
4. Characteristics of low FR firms
In this section, we explore the characteristics of low FR firms, that is, firms
recording high FRSCORE values. We begin our analysis by classifying the entire
sample to three categories based on FRSCORE values. The first category consists of
all observations where FRSCORE equals zero (approx. 73% of the sample). Absent of
any adverse indicator, these observations have high level of faithful representation.
The second category includes observations with FRSCORE equals to one, denoting
impaired faithful representation due to a single adverse indicator (approx. 23% of the
sample). Finally, the third category consists of observations with FRSCORE value
higher than one reflecting the lowest faithful representation (roughly 5% of the
sample).
Panel A of Table 3 reports descriptive statistics for each category. As expected,
mean market value is strictly decreasing across categories, from $5,415 million for the
first category (FRSCORE=0) to $1,963 million for the third one (FRSCORE=2+).
Hence, smaller firms have, on average, higher FRSCORE (p-value<0.01), indicating
lower level of faithful representation, in line with prior studies (e.g., Doyle, Ge and
McVay 2007; Ashbaugh-Skaife, Collins, Kinney and Lafond 2007; Larcker,
Richardson and Tuna 2007).
15
Similarly, mean age is strictly decreasing across categories, from 21.6 for the first
category (FRSCORE=0) to 18.5 for the third one (FRSCORE=2+). Hence, younger
firms have, on average, higher FRSCORE (p-value<0.01), indicating lower level of
faithful representation. This finding is also consistent with prior studies (e.g., Doyle,
Ge and McVay 2007).
Turning to profitability, we find that mean profitability is strictly decreasing
across categories, from 0.006 for the first category (FRSCORE=0) to -0.025 for the
third one (FRSCORE=2+). Correspondingly, the fraction of losses firms out of all
observations in the category increases from 0.268 for the first category to 0.360 to the
third one. For both mean profitability and fraction of losing firms, the differences are
significant (p-value<0.01), suggesting that losses firms have, on average, higher
FRSCORE indicating lower level of faithful representation, in line with prior studies
(e.g., Kinney and McDaniel 1989; DeFond and Jiambalvo 1991; Krishnan 2005;
Doyle, Ge and McVay 2007; Ashbaugh-Skaife, Collins, Kinney and Lafond 2007).
Lastly, we examine cash flow volatility, defined as standard deviation of cash
flows from operations over the preceding five years. As Panel A of Table 3
demonstrates, mean cash flow volatility is strictly increasing across categories, from
0.129 for the first category (FRSCORE=0) to 0.151 for the third one (FRSCORE=2+).
Hence, volatile firms have, on average, higher FRSCORE (p-value<0.01), indicating
lower level of faithful representation, as prior studies suggest (e.g., Graham, Harvey
and Rajgopal 2005).
[Table 3 about here]
To confirm out findings, we test the opposite way - whether small, young, losses
and volatile firms have, on average, high values of FRSCORE. For this purpose, we
16
construct four pairs of portfolios. The first set is small firms (market value is below
sample median) versus large firms (market value above median); The second one is
young firms (age is below sample median) versus old firms (age above median); the
third one is profit versus losses firms; and the fourth set is volatile firms (volatility of
cash flows from operations is above median) versus stable firms (volatility is below
median). Next, we calculate mean FRSCORE value and the faction of firms recording
FRSCORE>0 (indicating impaired faithful representation) for each of the portfolios.
Panel B of Table 3 reports the results. As expected, mean value of FRSCORE for
small firms is 0.380, higher than that for large firms, 0.271 (p-value<0.01).
Correspondingly, the fraction of small firms with FRSCORE>0 is 0.312, higher than
the fraction of 0.234 recorded by large firms (p-value<0.01). Likewise, mean value of
FRSCORE for young firms is 0.356, higher than that for old firms, 0.295 (p-
value<0.01). Additionally, the fraction of young firms with FRSCORE>0 is 0.296,
compared to 0.250 for old firms (p-value<0.01). Mean value of FRSCORE (fraction
of firms recording FRSCORE>0) for losses firms is 0.359 (0.290), higher than that for
profits firms 0.312 (0.266) (p-value<0.01). Finally, Mean value of FRSCORE
(fraction of firms recording FRSCORE>0) for volatile firms is 0.348 (0.286), higher
than that for stable firms, 0.293 (0.250) (p-value<0.01). Again, these findings confirm
that small, young, losing, and volatile firms tend to have high FRSCORE values
compared to other firms, suggesting low level of faithful representation.
Subsequently, we explore the industry composition of low FR versus high FR
firms. Focusing on significant industries in the economy, we compute mean
FRSCORE and the fraction of firms recording FRSCORE>0 for each two-digit
industries having at least 1,000 observations in the sample. As Panel B of Table 4
demonstrates, business services (SIC 73) firms have the lowest faithful representation,

17
where mean FRSCORE of this industry is 0.394 and 0.321 of its firms report impaired
faithful representation, i.e., FRSCORE>0. It should be noted that approx. 80% of the
firms in SIC 73 engage, in fact, in computer programming, data processing and other
computer related services. Communications (SIC 48) and electronic and other
electrical equipment and components (SIC 36) follow, each recording mean
FRSCORE of 0.349. Interestingly, Chemicals and allied products (SIC 28) firms have
the highest faithful representation, where the mean FRSCORE of this industry is
0.263 and 0.227 of its firms report impaired faithful representation, i.e.,
FRSCORE>0.
[Table 4 about here]
5. Accounting Estimates as Determinants of Faithful Representation
In this section we examine the role of accounting estimates as determinants of low
faithful representation. Prior studies argue that accounting estimates impair reliability
of financial statements due to mistakes or manipulations in generating such estimates.
As Lev, Li and Sougiannis (2010, p. 780) point out, "accounting estimates . . .
introduce a considerable and unknown degree of noise, and perhaps bias, to financial
information, detracting from their usefulness. . . Add to the above objective
difficulties in generating reliable estimates the expected and frequently documented
susceptibility of accounting estimates to managerial manipulation; and the consequent
adverse impact of estimates on the usefulness of financial information becomes
apparent." Accordingly, some studies investigating whether accounting estimates lead
to impaired reliability (Choi, Collings and Johnson 1997; Barth, Landsman and
Rendleman 1998; Dietrich, Harris and Muller 2001; Cotter and Richardson 2002;
Kallapur and Kwan 2004). While these studies examined reliability of one specific
18
estimate each time, we set out to test how the intensity of accounting estimates
included in financial statements affects their overall faithful representation.
To capture the intensity of using accounting estimates, we compile a list of
meaningful accounting estimates. For this purpose, we employ the ten accounting
estimates utilized in Lev et al. (2010, p. 800), which are “important estimates
underlying financial information.” These estimates are: change in inventory,
depreciation and amortization, deferred taxes, pension expense, post-retirement
benefits, doubtful receivables, restructuring costs, in-process research and
development, stock compensation expense, and asset write-downs. Additionally, we
include goodwill impairment in our list of accounting estimates. Goodwill impairment
is an apparent estimate since it relies on numerous assumptions and predictions
regarding future market conditions and competition, expected sales and expenses,
probabilities of different scenarios and discount rate.11 To verify the importance and
prevalence of the eleven accounting estimates included in our list, we compare them
to ‘critical accounting estimates’ disclosures in annual reports for 2012 of all Dow
Jones Industrial firms (as of July 2013). This comparison confirms that our list
includes all frequently used critical accounting estimates.12
Next, we compute the intensity of accounting estimates (ESTIMATE_INTESITY)
for each firm-year as the number of estimates recorded in the financial statements out
of the eleven in our list. Hence, ESTIMATE_INTENSITY can take values between
11 See, for example, Coca-Cola 10-K for 2004 addressing goodwill impairment tests: “We use a variety of methodologies in conducting these impairment assessments including cash flow analyses, estimates of sales proceeds and independent appraisals. Where applicable, we use an appropriate discount rate, based on the Company’s cost of capital rate or location-specific economic factors.” 12 The most frequent one is goodwill impairment, reported as a critical accounting estimate by 28 out of the 30 firms included in the index. Income taxes follow, reported as critical by 22 firms. Pension and other post-retirement benefits, and impairment of fixed assets are each reported by 19 firms. Additional frequent critical estimates are doubtful receivables (11 firms) business combinations (nine firms) and stock-based compensation (eight firms). All the prevalent critical accounting estimates are included in the list of estimates utilized by Lev et al. (2010) with the exception of goodwill impairment.
19
zero and eleven. We test the impact of estimates on faithful representation using a
cross-sectional regression model, in which the dependent variable is FRSCORE and
the explanatory variables are ESTIMATE_INTENSITY and controls, as follows (see
variable definitions in Table 1):
(1A) __
1098765
43211
ttttttt
ttttt
BIGGROWTHSEGFCFMVBVSTDCFOLOSSAGESIZEINTENSITYESTIMATEFRSCORE
Following prior research, the model incorporates controls for various causes of
low faithful representation, such as firm characteristics (size, age, book-to-market),
financial performance (losses, cash flow volatility, free cash flow, growth),
complexity (number of segments) and auditor (one of the Big-4 auditing firms or
not).13 The model also controls for annual and industry fixed effects, and standard
errors are clustered by firm.
To check robustness, we also substitute estimate intensity (the number of
estimates) with the sum of absolute values of accounting estimates reported by firm i
in year t deflated by market value of equity at the beginning of the year (EST_SUM).
This alternative variable reflects the magnitude of estimates. Hence, we estimate the
following regression model:
(1B) __
1098765
43211
ttttttt
ttttt
BIGGROWTHSEGFCFMVBVSTDCFOLOSSAGESIZESUMESTIMATEFRSCORE
Panel A of Table 5 reports estimation results of models (1A) and (1B). The
coefficient of ESTIMATE_INTENSITY in model (1A) is positive and significant,
0.016 (p-value<0.01), suggesting that estimate intensity increases FRSCORE, hence
13 See Erickson, Hanlon and Maydew (2006), Ashbaugh-Skaife et al. (2007), Doyle, Ge and McVay (2007), Larcker, Richardson and Tuna (2007), Cohen et al. (2008), Romanus, Maher and Fleming (2008).
20
damages faithful representation. Equally, the coefficient of ESTIMATE_SUM in
model (1B) is 0.043 (p-value=0.066), supporting the association between accounting
estimates and low faithful representation. Notably, the signs of control variables are in
line with prior literature. The results indicate that financial reporting relying heavily
on accounting estimates is associated with lower FR, consistent with the premise and
prior research.
[Table 5 about here]
As an additional robustness check, we analyze two matched portfolios differing in
the number of estimates reported by the firm. The first portfolio includes firm-years
reporting only a small number of estimates – four or less out of the eleven accounting
estimates ("LOW-EST"). Conversely, the second portfolio consists of firm-years
whose financial reporting relies heavily on estimates, defined as observations
reporting seven or more estimates ("HIGH-EST").14 To minimize the effect of firm
characteristics, we construct the portfolios by matching firms from the two
populations, so that each observation in LOW-EST portfolio has a corresponding
observation in HIGH-EST portfolio, from the same year and four-digit SIC industry
and whose total assets are within 20% of that of the matched firm.15 This procedure
yields two portfolios containing 1,064 firm-years each.
Subsequently, we compare FR between portfolios. Specifically, we measure
FRSCORE values and the fraction of firms recording FRSCORE>0. Results are
reported in Panel B of Table 5. First, mean FRSCORE for HIGH-EST is 0.342,
14 Approx. 29% of the sample observations report four estimates or less; approx. 24% of the observations report seven estimates or more. 15 We construct matched portfolios since firm's characteristics can affect its FR, hence distort our results. For example, size is associated with better FR, as demonstrated above. Yet, size is also highly correlated with the number of estimates, so we need to take caution that HIGH-EST does not include a significantly bigger firms than LOW-EST.
21
significantly higher than the mean of 0.290 recorded for LOW-EST. Second, the
fraction of firms reporting FRSCORE>0 is 0.282 for HIGH-EST, compared to 0.248
for LOW-EST. Again, the difference is significant. This evidence is consistent with
the results of models (1A) and (1B).
Next, we take a closer look into accounting estimates by classifying them into
two groups: recurring and non-recurring. Recurring estimates are consistently
reported by the firm on a periodic basis. This group includes change in inventory,
depreciation and amortization, deferred taxes, pension expense, post-retirement
benefits and doubtful receivables. The routine of reporting these accounting estimates
enhances the expertise and competency of the involved personnel in the firm and of
the auditors. Second, periodical reporting enables verification – a comparison of past
accounting estimates to actual realizations and an examination of the way in which
estimation errors evolve over time. Thus, verifiability of these accounting estimates
and the ability to control and audit them are likely to lessen the damage they cause to
faithful representation. Conversely, non-recurring estimates are event-dependent,
hence they are not reported by the firm in each period. This group includes
restructuring costs, in-process research and development, stock compensation
expense, asset write-down and goodwill impairment. Little or no history of these
estimates makes control and audit difficult. As a result, the firm and the auditor find it
hard to develop sufficient competency to report them properly and to verify them in
later periods. Therefore, non-recurring estimates are expected to impede faithful
representation severely.
To capture the impact of recurring estimates on faithful representation, we
substitute the explanatory variable estimate intensity (ESTIMATE_INTENSITY)
included in model (1A) with REC_EST_NUM, equal to the number of recurring

22
estimates recorded by firm i in year t out of the six recurring accounting estimates
listed above. The regression model is as follows:
(1C) _
__
1098765
43211
ttttttt
ttttt
BIGGROWTHSEGFCFMVBVSTDCFO
LOSSAGESIZENUMESTRECFRSCORE
Similarly, we capture the impact of non-recurring estimates on faithful
representation by a regression model encompassing REC_EST_NUM, equal to the
number of non-recurring estimates recorded by firm i in year t out of the five non-
recurring accounting estimates listed above. The regression model is as follows:
(1D) _
__
1098765
43211
ttttttt
ttttt
BIGGROWTHSEGFCFMVBVSTDCFO
LOSSAGESIZENUMESTNRECFRSCORE
Finally, we estimate a regression model that includes both groups of accounting
estimates (REC_EST and NREC_EST):
(1E)
_
____
1110
987654
3211
ttt
tttttt
tttt
BIGGROWTH
SEGFCFMVBVSTDCFOLOSSAGE
SIZENUMESTNRECNUMESTRECFRSCORE
All models control for annual and industry fixed effects. Standard errors are
clustered by firm.
Panel C of Table 5 reports results. Estimating model (1C), we find a positive and
significant coefficient of 0.008 (p-value=0.072) on recurring estimates
(REC_EST_NUM), indicating that recurring estimates are associated with higher
FRSCORE values. However, estimation of model (1D) yields a considerably higher
coefficient of 0.029 (p-value<0.01) on non-recurring estimates (NREC_EST_NUM).
This finding suggest that the impact of non-recurring accounting estimates on faithful
representation is approx. four times the impact of recurring estimates. Moreover,
when including both recurring and non-recurring estimates in the regression mode
23
(model (1E)), estimation yields a positive and significant coefficient only for non-
recurring estimates (NREC_EST_NUM), whereas the coefficient on recurring
estimates (REC_EST_NUM) becomes insignificant. This evidence stresses out the
important role of non-recurring estimates as a determinant of low faithful
representation.
6. Disentangling between Faithful Representation and Value Relevance
CON 8 accentuates that prior empirical research has shown relationships between
accounting information and changes in the market prices. Hence, the evidence
captures the impact of earnings information (value-relevance) together with the
impact of faithful representation on stock prices. However, this research has not
provided insofar a distinction between the two effects.
Indeed, extant literature investigates the relation between various financial
information and changes in market prices, i.e., returns. The purpose of its vast
majority is to examine value relevance of specific items, alternative disclosure
formats or different sets of accounting rules. The conventional test in these studies is a
regression of stock returns on earnings, where "an accounting amount is defined as
value relevant if it has a predicted association with equity market values" (Barth,
Beaver and Landsman 2001, p. 79).16 Thus, research utilizes these regressions to test
relevance alone, although these tests are, in fact, "joint tests of relevance and
reliability" (Barth, Beaver and Landsman 2001, p. 81). Therefore, as CON 8 states,
the disentanglement between the effects of faithful representation and value relevance
remains an open question.
The distinction between value relevance and faithful representation is essential for
16 Prior studies employ several specifications of the relation between earnings and returns, differing in the definitions of earnings and returns variables.

24
a better grasp of the relation between earnings and returns. If, for example, two firms
report information with similar value relevance, but one of them has a low level of
faithful representation and the other has a high level of faithful representation. We
expect them to demonstrate different market returns.17 Thus, to measure value
relevance correctly, the standard regressions of returns on earnings need to
incorporate faithful representation as well.
We extend the conventional value relevance model (Amir, Harris and Venuti
1993; Amir and Lev 1993; Lev Thigarajan 1993; Harris, Lang and Moller 1994; Barth
and Clinch 1998; Francis and Schipper 1999; Lev and Zarowin 1999; Ali and Hwang
2000; Weiss, Naik and Tsai 2008) to allow for a distinction between value relevance
and FR. Our integrated value relevance and faithful representation model uses
FRSCORE as a proxy for the level of faithful representation, building on its being
context free, hence unrelated to value relevance. Specifically, we examine (i) the
direct impact of faithful representation, measured by FRSCORE, on stock returns,
and, (ii) the impact of faithful representation, measured by FRSCORE, on the extent
of value relevance of the reported information, captured by the familiar ERC.
Accordingly, we estimate the following integrated value relevance and faithful
representation model:
(2) 3211 tttttt FRSCOREEFRSCOREERET
Variable definitions are in Table 1. In this model, β1 captures the conventional
value relevance, β2 encapsulates the direct effect of FRSCORE on stock returns,
17 In similar vein, prior studies suggest that market response to earnings surprise is positively associated with the perceived credibility (a close notion to FR) of the earnings report (Teoh and Wong 1993; Anderson and Yohn 2002; Francis and Ke 2006). Yet, these studies focused on market response to surprises rather than value relevance of recorded earnings.

25
independent of reported earnings; and β3 denotes the interaction between the two, i.e.,
the impact of FRSCORE on the level of value relevance of reported earnings.
Since some prior studies include in the regression model both level of earnings
and the change in earnings, we also estimate a second specification of the regression
model as follows:
(3) 5
43211
ttt
tttttt
FRSCOREEFRSCOREEFRSCOREEERET
In model (2), value relevance of earnings is captured by the sum of β2 and β4, the
coefficients on the level and change of earnings (Lev and Zarowin 1999). β3 stands
for the direct effect of FRSCORE on stock returns, and the sum of β4 and β5 denotes
the impact of FRSCORE on the level of value relevance of reported earnings.
Following prior studies, we use two alternative variables of stock returns. First,
we follow vast value relevance studies in using raw stock returns (e.g., Amir, Harris
and Venuti 1993; Harris, Lang and Moller 1994; Barth and Clinch 1998; Lev and
Zarowin 1999). Second, we use market-adjusted stock returns, similarly to numerous
other value relevance studies (e.g., Amir and Lev 1993; Francis and Schipper 1999;
Ali and Hwang 2000; Weiss, Naik and Tsai 2008). The idea is to verify that the
findings are independent on the measurement of stock returns. In estimating models
(1) and (2), we employ standard errors clustering as in Petersen (2009) and control for
annual fixed effect.
Estimation results are reported in Table 6. Panel A presents estimation using raw
returns (models (2A) and (3A)) and Panel B presents estimation using market adjusted
returns (models (2B) and (3B)). Both specifications of model (1) yield a positive and
significant coefficient on ΔERN, denoting value relevance of earnings, consistent

26
with findings of prior literature. More importantly, the coefficient on FRSCORE is
negative and significant: -0.031 in model (2A) and -0.028 in model (2B), with p-value
lower than 0.001 in both cases. This result indicates that stock returns respond
negatively to low faithful representation (reflected by high FRSCORE values).
Interestingly, the coefficient on the interaction between ΔERN and FRSCORE is
insignificant for both models (2A) and (2B), with p-values of 0.482 and 0.398,
respectively. This finding suggests that faithful representation and the value relevance
of accounting information are independent effects, where each has a significant
independent impact on stock prices.
Estimation of models (3), in both specifications, reveals similar results. The sum
of the coefficients on ERN and ΔERN is positive and significant in both cases, as
expected. The coefficient on FRSCORE is, again, negative and significant: -0.028 in
model (3A) and -0.026 in model (3B), with p-value lower than 0.001 in both cases. As
for the interaction variables, the sum of β4 and β5 is equal to 0.023 in model (3A) and
0.021 in model (3A), both insignificant (p-values of 0.151 and 0.149, respectively).
Again, the evidence suggests that faithful representation and the value relevance of
accounting information are independent effects.
[Table 6 about here]
In conclusion, our results indicate that low levels of faithful representation
undermine stock performance, and that faithful representation and the value relevance
of accounting information are independent effects.
We check that our results are not derived from auto-correlation using differences
in FRSCORE. We substitute FRSCORE in models (2) and (3) with ΔFRSCORE,
defined as the difference between FRSCORE in year t and FRSCORE in year t-1.

27
Panels B1 report estimation results based on raw returns and Panel B2 reports similar
results based on market-adjusted results. In both cases, the findings support main
results, where the coefficient on FRSCORE is negative and significant and the
coefficients on the interaction between FRSCORE and ΔERN and the interaction
between FRSCORE and ERN are insignificant.
[Table 7 about here]
For additional robustness, we confirm that our findings are not derived by a single
dominant indicator, out of the five comprising FRSCORE. We do that by repeating
estimation of model (2) using each indicator separately. That is, we estimate five
versions of model (2), where each one of them employs one component of FRSCORE
as a proxy for FR. Hence, this set of regressions incorporates faithful representation
using either (1) filing of a restatement, (2) material weakness in internal controls over
financial reporting, (3) change of auditor, (4) auditor adverse, qualified or no opinion,
or (5) just meeting/beating earnings benchmarks. The general formulation of these
versions is as follows:
)(1 C3211 tttttt COMPECOMPERET
Where COMP stands for the relevant component for each version. As before, we
estimate all regressions using two alternative variables of stock returns, raw or market
adjusted returns, therefore have a total number of ten regressions.
Table 8 reports estimation results of all five versions. Evidently, ΔERN is positive
and significant in all ten regressions. More importantly, the coefficient on the FR
variable is negative and significant for four out of the five indicator components

28
(filing of a restatement, ineffective internal controls over financial reporting, auditor
adverse, qualified or no opinion, and just meeting/beating earnings benchmarks). As
for the fifth component (change of auditor), the coefficient is also negative yet
insignificant. These findings are consistent for the two alternative stock return
variables. Additionally, in all versions the interaction between ΔERN and the relevant
component is insignificant. Overall, the results indicate a similar effect of all
FRSCORE components on the relation between earnings and returns, each with its
relative strength. This evidence provides additional support for our main results and
reconfirm the validity of the proposed measure.
[Table 8 about here]
Profit versus Loss firms
To gain further insights on the separate impact of reported earnings versus faithful
representation onstock prices, we replicate the analysis in two sub-samples: profit
firms and loss firms. Prior studies report that value relevance in loss firms is lower
than in profitable firms (Hayn 1995; Lipe, Bryant and Widener 1998; Franzen and
Radhakrishnan 2009). Other studies demondtrate that losses are associated with
indicators of low faithful representation (Kinney and McDaniel 1989; Ge and McVay
2005; Krishnan 2005; Chin and Chi 2009). Our earlier findings also reveal that loss
firms have, on average, higher FRSCORE than profit firms, suggesting lower faithful
representation for loss firms.
As demonstrated above, the level of faithful representation does not affect the
relation between returns and earnings. We estimate the integrated value relevance
and faithful representation model for capturing a differential value relevance between
profit and loss firms controlled for the level of faithful representation,. This regression
29
model encapsulates the value relevance effect apart from the level of faithful
representation. Particularly, we examine whether the lower value relevance reported
by prior literature to loss firms survives after disentangling the impact of faithful
representation. Additionally, we compare the magnitude of the faithful representation
effect on stock performance between profit and loss firms. We estimate the following
two regression models:
(4) 765
43211
tttttttt
tttttt
LOSSFRSCOREEFRSCOREELOSSFRSCOREFRSCORELOSSEELOSSRET
(5) 1110
9876
543211
tאtttt
ttאttttא
ttttאttא
LOSSFRSCOREEFRSCOREELOSSFRSCOREEFRSCOREELOSSFRSCOREFRSCORE
LOSSEELOSSEELOSSRET
where LOSS is a dummy variable equal to one for loss firm-years and zero for
profit firm-years. Definitions of other variables are in Table 1.
As before, we estimate each of the two models in two specifications, utilizing
either raw or market adjusted returns. We also employ standard errors clustering as in
Petersen (2009) and control for annual fixed effect.
Results are reported in Table 9. Panel A presents estimation using raw returns
(models (4A) and (5A)) and Panel B presents estimation using market adjusted returns
(models (4B) and (5B)). Analyzing estimation results of models (4A) and (4B), we
note that the coefficient on ΔERN is positive and significant in both models, in line
with prior studies. Testing the differential value relevance of loss firms, we find that
the coefficient on the interaction variable ΔERN*LOSS is negative and significant for
both models, equal to -0.370 for model (4A) and -0.325 for model (4B). In both cases,
p-value is lower than 0.001 in both cases.
Estimation results of model (5) yield similar results. First, we confirm that the

30
sum of the coefficients on ERN and ΔERN is positive and significant. Then, testing
the differential value relevance of loss versus profit firms, we find that the cumulative
coefficients on the interaction variables, ERN*LOSS and ΔERN*LOSS, are negative
and significant, summing up to -2.349 in model (5A), generating an enormous
difference between cumulative coefficients for profit firms (2.168) and for loss firms
(0.195). Similarly, in model (5B) the cumulative coefficient on the interaction
variables is -1.998, representing an equally large difference between the cumulative
coefficients for profit firms (2.247) and for loss firms (0.164).18 Evidently, the
differences in both cases are significant with p-value lower than 0.001. These findings
support the conclusion that the lower value relevance of losses compared to profits
survives when controlling for faithful representation. Overall, since the models
control for FRSCORE, this finding indicates that losses are indeed less value relevant
than profits.
[Table 9 about here]
Turning to the impact of faithful representation on stock prices, the FRSCORE
coefficient in model 3A is -0.015, negative and significant (p-value=0.004) for profit
firms, but significantly more negative, -0.015-0.036=-0.051 for loss firms (p-
value=0.001). The FRSCORE coefficient in model 4A is insignificant (p-
value=0.487) for profit firms, but significantly negative, -0.004, for loss firms (p-
value=0.010). Overall, low faithful representation has greater effect on loss firms than
on profit firms. The results emphasize the damaging impact of low faithful
representation on performance for loss firms. Moreover, the results suggest that the
negative response to faithful representation stem mostly from loss firms
Notably, the coefficient on ΔERN*FRSCORE, and the matching interaction with
18 Lipe, Bryant and Widener (1998) exploring ERC of profits firms compared to ERC of all firms also find substantial differences, suggesting ERC of loss firms is considerably lower than ERC of profit firms.
31
LOSS in both models 3a and 4a are insignificant. This result is consistent with the
insignificant effect of the interaction between ΔERN and FRSCORE shown earlier in
models (1) and (2).
Taken as a whole, the evidence sheds light on two aspects of the impact of faithful
representation on stock prices. First, value relevance of loss firms is lower than of
profit firms, even after controlling for the effect of lower faithful representation.
Second, faithful representation has a more negative impact on stock returns for loss
firms than for profit firms. This may suggest that investors are more suspicious of loss
firms, fearing that low faithful representation covers even worse financial
performance than revealed in their reporting.
7. Concluding Remarks
We introduce a metric for empirically measuring faithful representation of
information in financial statements, apart from relevance. The metric is context-free
and based on observable incidents that capture complete, neutral, and error-free
information. We utilize the metric for (i) exploring sources of weak faithful
representation of accounting information, and , (ii) examining the impact of low
versus high levels of faithful representation on the value relevance of accounting
information.
Results indicate that intensive use of non-recurring accounting estimates
diminishes faithful representation of financial statements. Additionally, low levels of
faithful representation were found in small firms, loss firms, young firms and volatile
firms. Testing the impact of faithful representation of accounting information on its
value relevance, we find that low levels of faithful representation only marginally
32
influence its value relevance. However, low level of faithful representation is
associated with lower stock return. Overall, the results suggest that investors assign
marginal weight to the level of faithful representation when they incorporate
accounting information into stock prices.
The study makes three contributions. First, the findings contributes by
addressing the standard-setters’ call for an empirical measurement of faithful
representation apart from relevance. Second, the negative impact of accounting
estimates on faithful representation highlights another meaningful aspect of faithful
representation by offering guidance to standard-setters. Particular attention should be
given to requirements to report non-recurring accounting estimates due to their
negative impact on the usefulness of financial statements. Moreover, standard-setters
may consider requiring firms to report the realization of accounting estimates in future
periods. Third, we introduce a new measure of faithful representation of accounting
information, apart from value relevance. The measure is based on observable
incidents formerly associated in the literature with low levels of completeness,
neutrality or with erroneous accounting information, as directed by SFAS 8. Overall,
a context-free measure allows for further investigation of various aspects of faithful
representation of accounting information.

33
REFERENCES
Aboody, D., and B. Lev. 1998. The value relevance of intangibles: The case of software capitalization. Journal of Accounting Research 36: 161–191.
Aboody, D., M. E. Barth, and R. Kasznik. 1999. Revaluations of fixed assets and future firm performance: Evidence from the UK. Journal of Accounting and Economics 26 (1-3): 149–178.
Amir, E. 1993. The The market valuation of accounting information: Case of other benefits postretirement than pensions. The Accounting Review 68 (4): 703–724.
Amir, E. 1996. The effect of accounting aggregation on the value-relevance of financial disclosures: the case of SFAS No. 106. The Accounting Review 71 (106): 573–590.
Amir, E., T. S. Harris, and E. K. Venuti. 1993. A comparison of the value-relevance of U. S. versus Non-U. S. GAAP accounting measures using Form 20-F reconciliations. Journal of Accounting Research 31: 230-264.
Amir, E., and B. Lev. 1996. Value-relevance of non-financial information: The wireless communications industry. Journal of Accounting and Economics 22: 3–30.
Ashbaugh-Skaife, H., D. W. Collins, and W. R. Kinney. 2007. The discovery and reporting of internal control deficiencies prior to SOX-mandated audits. Journal of Accounting and Economics 44 (1-2): 166–192.
Barth, M. E. 1991. Relative measurement errors among alternative pension asset and liability measures. The Accounting Review 66 (3): 433–463.
Barth, M. E. 1994. Value accounting: Evidence from investment securities and the market valuation of banks. The Accounting Review 69 (1): 1–25.
Barth, M. E., W. H. Beaver, and W. R. Landsman. 1992. The market valuation implications of net periodic pension cost components. Journal of Accounting and Economics 15 (1): 27–62.
Barth, M. E., W. H. Beaver, W. R. Landsman. 1996. Value-relevance of banks’ fair value disclosures under SFAS No . 107. The Accounting Review 71 (107): 513–537.
Barth, M. E., and G. Clinch. 1998. Revalued financial, tangible , and intangible assets: Associations with share prices and non-market-based value estimates. Journal of Accounting Research 36: 199-233.
34
Barth, M. E., W. R. Landsman, and R. J. Rendleman. 1998. Option pricing-based bond value estimates and a fundamental components approach to account for corporate debt. The Accounting Review 73 (1): 73–102.
Bronson, S. N., C. E. Hogan, M. F. Johnson, and K. Ramesh. 2011. The unintended consequences of PCAOB auditing Standard Nos. 2 and 3 on the reliability of preliminary earnings releases. Journal of Accounting and Economics 51 (1-2): 95–114.
Butler, M., A. J. Leone, and M. Willenborg. 2004. An empirical analysis of auditor reporting and its association with abnormal accruals. Journal of Accounting and Economics 37 (2): 139–165.
Choi, B. (Ben), D. W. Collins, and W. B. Johnson. 1997. Valuation implications of reliability differences: The case of nonpension postretirement obligations. The Accounting Review 72 (3): 351–383.
Cohen, D. A., A. Dey, and T. Z. Lys. 2008. Real and accrual-based earnings management in the pre- and post-Sarbanes-Oxley periods. The Accounting Review 83 (3): 757–787.
Cohen, D. A., M. N. Darrough, R. Huang, and T. Zach. 2011. Warranty reserve: contingent liability, information signal, or earnings management tool? The Accounting Review 86 (2): 569–604.
Cotter, J., and S. Richardson. 2002. Reliability of asset revaluations: The impact of appraiser independence. Review of Accounting Studies 7: 435–457.
Dietrich, J. R., M. S. Harris, and K. A. Muller III. 2001. The reliability of investment property fair value estimates. Journal of Accounting and Economics 30: 125–158.
Doyle, J., W. Ge, and S. McVay. 2007. Determinants of weaknesses in internal control over financial reporting. Journal of Accounting and Economics 44 (1-2): 193–223.
Efendi, J., A. Srivastava, and E. P. Swanson. 2007. Why do corporate managers misstate financial statements? The role of option compensation and other factors. Journal of Financial Economics 85 (3): 667–708.
Erickson, M., M. Hanlon, and E. L. Maydew. 2006. Is there a link between executive equity incentives and accounting fraud? Journal of Accounting Research 44 (1): 113–143.
Financial Accounting Standards Board (FASB). 1980. Qualitative characteristics of accounting information. Statement of Financial Accounting Concepts No. 2. Norwalk, CT: FASB. [

35
Financial Accounting Standards Board (FASB). 2001. Goodwill and other intangible assets, Statement of Financial Accounting Standards No. 142. Norwalk, CT: FASB.
Financial Accounting Standards Board (FASB). 2010. Conceptual framework for financial reporting. Statement of Financial Accounting Concepts No. 8. Norwalk, CT: FASB.
Francis, J., and K. Schipper. 1999. Have financial statements lost their relevance? Journal of Accounting Research 37 (2): 319–352.
Gompers, P., J. Ishii, and A. Metrick. 2003. Corporate governance and equity prices. The Quarterly Journal of Economics 118 (1): 107–156.
Jiang, J. (Xuefeng). 2008. Beating earnings benchmarks and the cost of debt. The Accounting Review 83 (2): 377–416.
Johnson, V. E., I. K. Khurana, and J. K. Reynolds. 2002. Audit-firm tenure and the quality of financial reports. Contemporary Accounting Research 19 (4): 637–660.
Kallapur, S., and S. Y. S. Kwan. 2004. The value relevance and reliability of brand assets recognized by U.K. Firms. The Accounting Review 79 (1): 151–172.
Kothari, S. P., T. E. Laguerre, and A. J. Leone. 2002. Capitalization versus expensing: Evidence on the uncertainty of future earnings from capital expenditures versus R&D outlays. Review of Accounting Studies 7: 355–382.
Larcker, D. F., S. A. Richardson, and I. Tuna. 2007. Corporate governance, accounting outcomes, and organizational performance. The Accounting Review 82 (4): 963–1008.
Lev, B., S. Li, and T. Sougiannis. 2010. The usefulness of accounting estimates for predicting cash flows and earnings. Review of Accounting Studies 15 (4): 779–807.
Lev, B., and T. Sougiannis. 1996. The capitalization, amortization and value-relevance of R&D. Journal of Accounting and Economics 21: 107–138.
Lev, B., and S. R. Thiagarajan. 1993. Fundamental information analysis. Journal of Accounting Research 31 (2): 190–215.Maines, L. A., and J. M. Wahlen. 2006. The nature of accounting information reliability: Inferences from archival and experimental research. Accounting Horizons 20 (4): 399–425.
Muller III, K. a. 1999. An examination of the voluntary recognition of acquired brand names in the United Kingdom. Journal of Accounting and Economics 26 (1-3): 179–191.

36
Ogneva, M., K. R. Subramanyam, and K. Raghunandan. 2007.Internal control weakness and cost of equity: Evidence from SOX Section 404 disclosures. The Accounting Review 82 (5): 1255–1297.
Petersen, M. A. 2009. Estimating standard errors in finance panel data sets: Comparing approaches. Review of Financial Studies 22 (1): 435–480.
Public Company Accounting Oversight Board (PCAOB). 2007. An Audit of Internal Control Over Financial Reporting That Is Integrated with An Audit of Financial Statements. Auditing Standard No. 5. Washington D.C.: PCAOB.
Richardson, S. A., R. G. Sloan, M. T. Soliman, and İ. Tuna. 2005. Accrual reliability, earnings persistence and stock prices. Journal of Accounting and Economics 39 (3): 437–485.
Romanus, R. N., J. J. Maher, and D. M. Fleming. 2008. Auditor industry specialization, auditor changes, and accounting restatements. Accounting Horizons 22 (4): 389–413.
Roychowdhury, S. 2006. Earnings management through real activities manipulation. Journal of Accounting and Economics 42 (3): 335–370.
Schipper, K. 2003. Principles-based accounting standards. Accounting Horizons 17 (1): 61–72.
Sloan, R. G. 1999. Evaluating the reliability of current value estimates. Journal of Accounting and Economics 26 (1-3): 193–200.
St. Pierre, K., and J. A. Anderson. 1984. An analysis of the factors associated with lawsuits against public accountants. The Accounting Review 59 (2): 242–263.
Stice, J. D. 1991. Using financial information to identify pre-engagement factors associated with lawsuits against auditors. The Accounting Review 66 (3): 516–533.
Zang, A. Y. 2012. Evidence on the trade-off between real activities manipulation and accrual-based earnings management. The Accounting Review 87 (2): 675–703.

37
TABLE 1 Variable Definitions
Variable
(firm subscript omitted)
Description
(Compustat data items in brackets)
AGE = The natural logarithm of the number of years firm i has been publicly traded.
BIG = A dummy variable equal to one if the firm auditing firm i in year t is one of the Big-4 audit firms, zero otherwise.
BV_MV = The ratio between firm i’s book value of equity (CEQt) and market value of equity (PRCC_Ft * CSHOt).
CHANGE = A dummy variable equal to one if firm i changed auditor in year t, zero otherwise.
ERN = Earnings before extraordinary items scaled by market value of equity at the beginning of year t (IBt / (PRCC_Ft-1 * CSHOt-1)).
∆ERN = Change in ERN, equal to ERNt – ERNt-1
ESTIMATE_INTENSITY = The number of accounting estimates firm i recorded in year t out of the following eleven: change in inventory, depreciation and amortization, deferred taxes, pension expense, post-retirement benefits, doubtful receivables, restructuring costs, in-process research and development, stock compensation expense, asset write-down and goodwill impairment.
ESTIMATE_SUM = The sum of absolute values firm i recorded in year t under the following eleven accounting estimates: change in inventory, depreciation and amortization, deferred taxes, pension expense, post-retirement benefits, doubtful receivables, restructuring costs, in-process research and development, stock compensation expense, asset write-down and goodwill impairment. The sum is deflated by market value of equity at the beginning of year t (MVEt-1).
FCF = Firm i’s free cash flow, calculated as the difference between operating cash flow (OANCFt) and average capital expenditure (CAPXt) over years t and t-1, deflated by total assets at the beginning of year t (ATt-1).
FRSCORE = An inverse reliability measure, counting the reliability indicators recorded out of the following:

38
(1) restatement, (2) disclosing of material weaknesses in internal controls, (3) change of auditor, (4) qualified, adverse or no auditor opinion, and (5) just meeting/beating earnings benchmark.
GROWTH = The percentage change in firm i’s sales (SALEt) from year t-1 to year t.
LOSS = A dummy variable equal to one if firm i in year t recorded negative earnings before extraordinary items, zero otherwise.
MBE = A dummy variable equal to one if firm i just meet/beat at least one of three earnings benchmarks in year t, zero otherwise.
Suspects just beating/meeting the zero benchmark are defined as firm-years with earnings before extraordinary items over lagged assets (IBt / ATt-1) between 0 and 0.005.
Suspects just beating/meeting last-year earnings are firm-years with change in basic EPS excluding extraordinary items from last year (EPSPXt-EPSPXt-1) between 0 and 2 cents.
Suspects just beating/meeting analyst forecast consensus are firm-years with actual EPS less the analyst forecast consensus outstanding prior to the earnings announcement date between 0 and 1cent.
ME = A dummy variable equal to one if firm i reports ineffective controls under Section 302 or Section 404 in year t, zero otherwise.
MVE = Firm i's market value of equity in millions of dollars in year t, calculated as the product of the fiscal year-end closing share price (PRCC_Ft) and common shares outstanding (CSHOt).
NREC_EST_NUM = The number of non-recurring estimates firm i recorded in year t out of the following five: restructuring costs, in-process research and development, stock compensation expense, asset write-down and goodwill impairment.
OPINION = A dummy variable equal to one if auditor of firm i issued a qualified, adverse or no opinion in year t (AUOP equals 2, 3 or 5), zero otherwise.
REC_EST_NUM = The number of recurring estimates firm i recorded in year t out of the following six: change in inventory, depreciation and amortization, deferred taxes, pension expense, post-retirement benefits and doubtful receivables.
39
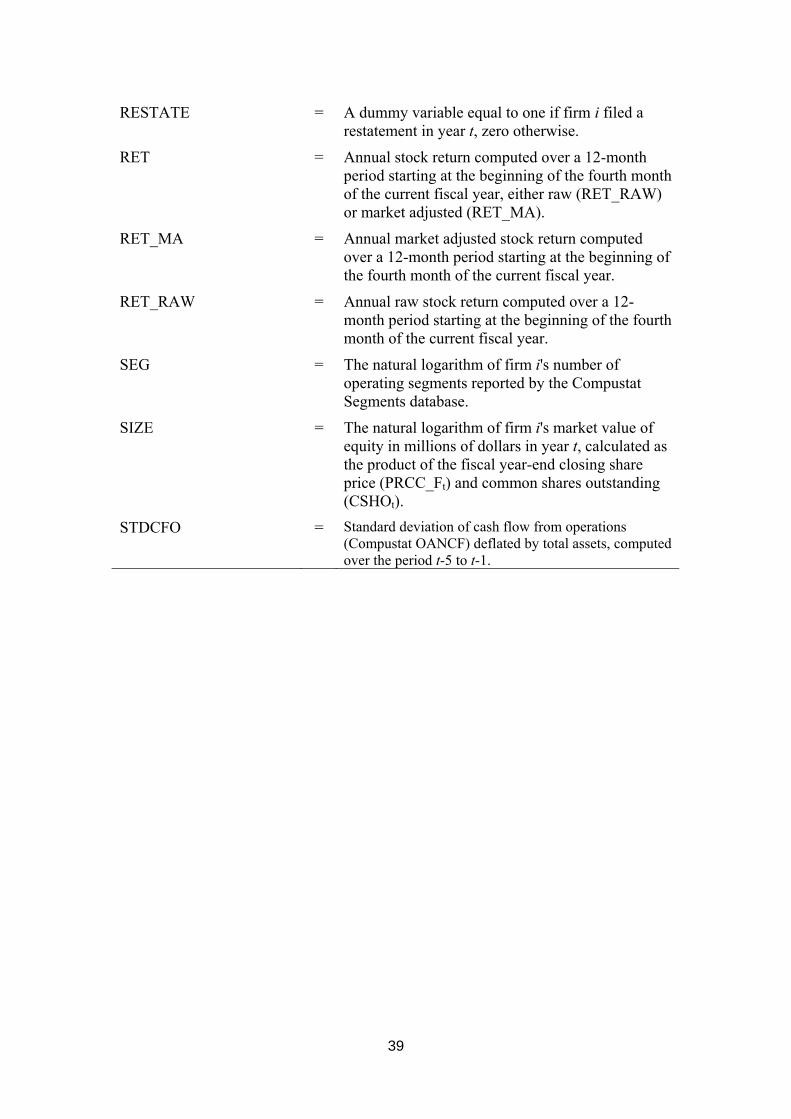
RESTATE = A dummy variable equal to one if firm i filed a restatement in year t, zero otherwise.
RET = Annual stock return computed over a 12-month period starting at the beginning of the fourth month of the current fiscal year, either raw (RET_RAW) or market adjusted (RET_MA).
RET_MA = Annual market adjusted stock return computed over a 12-month period starting at the beginning of the fourth month of the current fiscal year.
RET_RAW = Annual raw stock return computed over a 12-month period starting at the beginning of the fourth month of the current fiscal year.
SEG = The natural logarithm of firm i's number of operating segments reported by the Compustat Segments database.
SIZE = The natural logarithm of firm i's market value of equity in millions of dollars in year t, calculated as the product of the fiscal year-end closing share price (PRCC_Ft) and common shares outstanding (CSHOt).
STDCFO = Standard deviation of cash flow from operations (Compustat OANCF) deflated by total assets, computed over the period t-5 to t-1.

40
TABLE 2 Descriptive Statistics of FRSCORE and its COMPONENTS
Variable N Mean Std Dev Skewness
FRSCORE 38,718 0.325 0.580 1.799RESTATE 38,718 0.150 0.357 1.956MW 38,718 0.069 0.253 3.402CHANGE 38,718 0.083 0.275 3.030MBE 38,718 0.105 0.306 2.580OPINION 38,718 0.001 0.018 56.778
The table presents descriptive statistics of FRSCORE and its components.
Definitions of all variables are in Table 1.

41
TABLE 3 The Relation between FRSCORE and Firm Characteristics
Panel A – Descriptive statistics for FRSCORE categories
Obs. MVE AGE ERN % LOSS STDCFO RET_RAW RET_MA BV_MV FRSCORE=0 28,156 5,415.090 21.558 0.006 0.268 0.129 0.207 0.089 0.603FRSCORE=1 8,753 3,741.820 19.817 -0.004 0.279 0.142 0.162 0.062 0.617FRSCORE>=2 1,809 1,963.030 18.544 -0.025 0.360 0.151 0.105 0.018 0.638
Difference (2-0) -3,452.060 -3.014 -0.032 0.092 0.023 -0.102 -0.071 0.035p-value <0.001 <0.001 <0.001 <0.001 <0.001 <0.001 <0.001 0.015
.

42
Panel B – FRSCORE – portfolio comparisons
Obs. Mean FRSCORE % FRSCORE>0
Small 19,359 0.380 0.312Large 19,359 0.271 0.234Small-Large 0.109 0.078P-value <0.001 <0.001
Young 19,618 0.356 0.296Old 19,100 0.295 0.250Young-Old 0.061 0.046P-value <0.001 <0.001
Loss 10,647 0.359 0.290Profit 28,071 0.312 0.266Loss-Profit 0.047 0.024P-value <0.001 <0.001
Volatile 15,527 0.348 0.286Stable 15,526 0.293 0.250Volatile-Stable 0.055 0.036P-value <0.001 <0.001
Panel A presents descriptive statistics for three FRSCORE categories: the first category consists of all observations where FRSCORE equals zero, the second category includes observations with FRSCORE equals to one, and the third category consists of observations with FRSCORE value higher than one. Panel B presents mean FRSCORE values and % of observations recording FRSCORE>0 for four pairs of portfolios: Small (all firm-years whose market value is below sample median) vs. Large (all firm-
years whose market value is above sample median). Young (all firm-years whose age is below sample median) vs. Old (all firm-years
whose age is above sample median). Loss (all firm-years recording losses) vs. Profit (all firm-years recording profits). Volatile (all firm-years earnings whose volatility is below sample median) vs. Stable
(all firm-years whose earnings volatility is below sample median).
Definitions of all variables are in Table 1.

43
TABLE 4 Industries with Lowest Levels of Faithful Representation (Highest values of FRSCORE)
Industry SIC Code Description Obs. Mean FRSCORE % FRSCORE>0 73 Business services 4,781 0.394 0.321 48 Communications 1,658 0.349 0.284 36 Electronic and other electrical equipment and components 3,541 0.349 0.290 35 Industrial and commercial machinery and computer equipment 2,256 0.331 0.279 38 Measuring, analyzing and controlling instruments 2,514 0.323 0.278 49 Electrical, gas and sanitary services 1,615 0.323 0.279 13 Oil and gas extraction 1,546 0.283 0.236 28 Chemicals and allied products 3,091 0.278 0.239
This panel presents mean FRSCORE values and frequency of low faithful representation of accounting information (FRSCORE>0) of two-SIC code industries with at least 1,000 firm-year observations.

44
TABLE 5 Accounting Estimates as Determinants of FRSCORE
Panel A – regression analysis
Model 1A Model 1B Coef p-value Coef p-value
Intercept 0.633 <0.001 0.654 <0.001 ESTIMATE_INTENSITY 0.016 <0.001ESTIMATE_ SUM 0.043 0.066 SIZE -0.014 <0.001 -0.011 <0.001 AGE -0.040 <0.001 -0.033 <0.001 LOSS 0.003 0.727 0.004 0.716 STDCFO 0.031 0.135 0.024 0.253 BV_MV 0.006 0.513 0.007 0.503 FCF -0.101 <0.001 -0.099 <0.001 SEG 0.029 <0.001 0.033 <0.001 GROWTH -0.021 0.096 -0.028 0.026 BIG -0.142 <0.001 -0.139 <0.001
R2 0.056 0.055Obs. 31,018 31,018
Panel B – Matched portfolios analysis
Portfolio Obs. Mean FRSCORE % FRSCORE>0
High EST (EST >= 7) 1,064 0.342 0.282 Low EST (EST <= 4) 1,064 0.290 0.248
High EST-Low EST 0.053 0.034 P-value 0.034 0.077
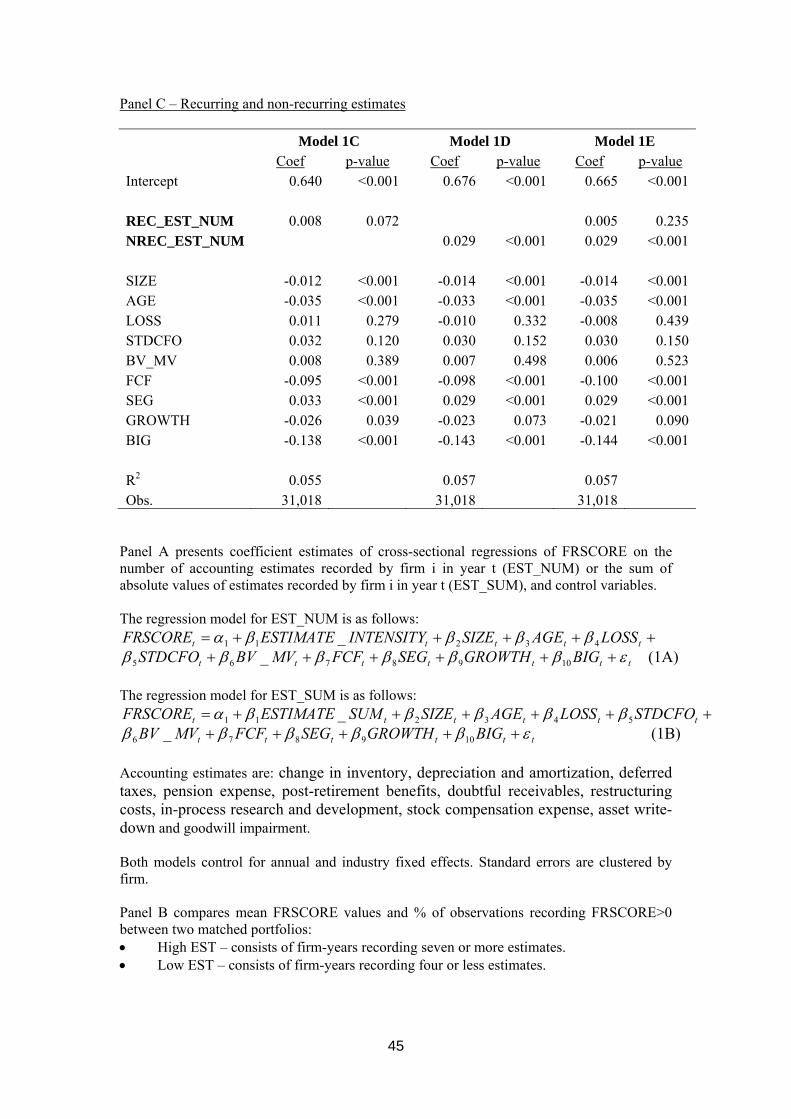
45
Panel C – Recurring and non-recurring estimates
Model 1C Model 1D Model 1E Coef p-value Coef p-value Coef p-value
Intercept 0.640 <0.001 0.676 <0.001 0.665 <0.001 REC_EST_NUM 0.008 0.072 0.005 0.235NREC_EST_NUM 0.029 <0.001 0.029 <0.001 SIZE -0.012 <0.001 -0.014 <0.001 -0.014 <0.001AGE -0.035 <0.001 -0.033 <0.001 -0.035 <0.001LOSS 0.011 0.279 -0.010 0.332 -0.008 0.439STDCFO 0.032 0.120 0.030 0.152 0.030 0.150BV_MV 0.008 0.389 0.007 0.498 0.006 0.523FCF -0.095 <0.001 -0.098 <0.001 -0.100 <0.001SEG 0.033 <0.001 0.029 <0.001 0.029 <0.001GROWTH -0.026 0.039 -0.023 0.073 -0.021 0.090BIG -0.138 <0.001 -0.143 <0.001 -0.144 <0.001
R2 0.055 0.057 0.057 Obs. 31,018 31,018 31,018
Panel A presents coefficient estimates of cross-sectional regressions of FRSCORE on the number of accounting estimates recorded by firm i in year t (EST_NUM) or the sum of absolute values of estimates recorded by firm i in year t (EST_SUM), and control variables. The regression model for EST_NUM is as follows:
(1A) __
1098765
43211
ttttttt
ttttt
BIGGROWTHSEGFCFMVBVSTDCFOLOSSAGESIZEINTENSITYESTIMATEFRSCORE
The regression model for EST_SUM is as follows:
(1B) __
109876
543211
tttttt
tttttt
BIGGROWTHSEGFCFMVBVSTDCFOLOSSAGESIZESUMESTIMATEFRSCORE
Accounting estimates are: change in inventory, depreciation and amortization, deferred taxes, pension expense, post-retirement benefits, doubtful receivables, restructuring costs, in-process research and development, stock compensation expense, asset write-down and goodwill impairment. Both models control for annual and industry fixed effects. Standard errors are clustered by firm. Panel B compares mean FRSCORE values and % of observations recording FRSCORE>0 between two matched portfolios: High EST – consists of firm-years recording seven or more estimates. Low EST – consists of firm-years recording four or less estimates.

46
Each observation in High EST portfolio has a corresponding observation in Low EST portfolio, from the same year and four-digit SIC industry and whose total assets are within 30% of that of the matched firm. Panel C presents coefficient estimates of cross-sectional regressions of FRSCORE on the number of recurring accounting estimates recorded by firm i in year t (REC_EST_NUM) or the number of non-recurring accounting estimates recorded by firm i in year t (NREC_EST_NUM), and control variables. Recurring estimates are change in inventory, depreciation and amortization, deferred taxes, pension expense, post-retirement benefits and doubtful receivables. Non-recurring estimates are restructuring costs, in-process research and development, stock compensation expense, asset write-down and goodwill impairment. The regression model for REC_EST_NUM is as follows:
(1C) _
__
1098765
43211
ttttttt
ttttt
BIGGROWTHSEGFCFMVBVSTDCFO
LOSSAGESIZENUMESTRECFRSCORE
The regression model for NREC_EST_NUM is as follows:
(1D) _
__
1098765
43211
ttttttt
ttttt
BIGGROWTHSEGFCFMVBVSTDCFO
LOSSAGESIZENUMESTNRECFRSCORE
Finally, both REC_EST and NREC_EST are included in the model:
(1E)
_
____
1110
987654
3211
ttt
tttttt
tttt
BIGGROWTH
SEGFCFMVBVSTDCFOLOSSAGE
SIZENUMESTNRECNUMESTRECFRSCORE
All models control for annual and industry fixed effects. Standard errors are clustered by firm.
Definitions of all variables are in Table 1.
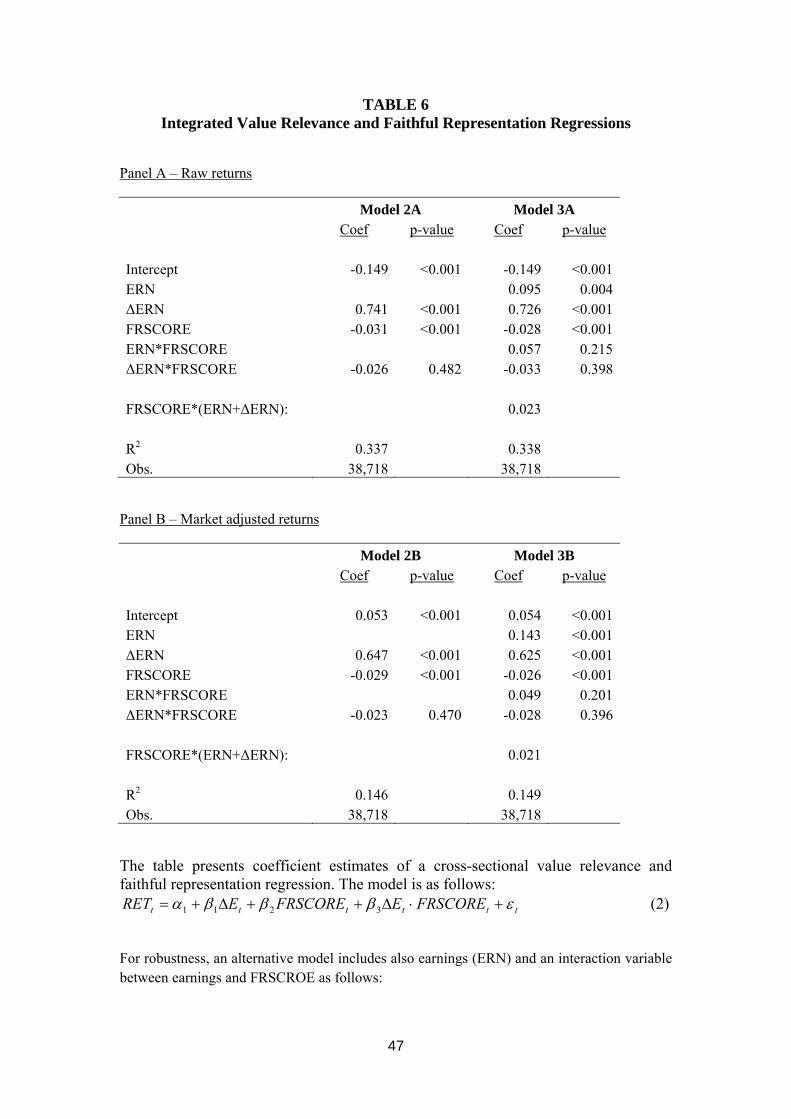
47
TABLE 6 Integrated Value Relevance and Faithful Representation Regressions
Panel A – Raw returns
Model 2A Model 3A Coef p-value Coef p-value
Intercept -0.149 <0.001 -0.149 <0.001 ERN 0.095 0.004 ΔERN 0.741 <0.001 0.726 <0.001 FRSCORE -0.031 <0.001 -0.028 <0.001 ERN*FRSCORE 0.057 0.215 ΔERN*FRSCORE -0.026 0.482 -0.033 0.398
FRSCORE*(ERN+ΔERN): 0.023
R2 0.337 0.338Obs. 38,718 38,718
Panel B – Market adjusted returns
Model 2B Model 3B Coef p-value Coef p-value
Intercept 0.053 <0.001 0.054 <0.001 ERN 0.143 <0.001 ΔERN 0.647 <0.001 0.625 <0.001 FRSCORE -0.029 <0.001 -0.026 <0.001 ERN*FRSCORE 0.049 0.201 ΔERN*FRSCORE -0.023 0.470 -0.028 0.396
FRSCORE*(ERN+ΔERN): 0.021
R2 0.146 0.149Obs. 38,718 38,718
The table presents coefficient estimates of a cross-sectional value relevance and faithful representation regression. The model is as follows:
(2) 3211 tttttt FRSCOREEFRSCOREERET
For robustness, an alternative model includes also earnings (ERN) and an interaction variable between earnings and FRSCROE as follows:

48
(3) 5
43211
ttt
tttttt
FRSCOREE
FRSCOREEFRSCOREEERET
Both models control for annual and industry fixed effects. Standard errors are clustered by firm.
Panel A report results obtained using raw returns and Panel B report results obtained using market adjusted returns.
Definitions of all variables are in Table 1.

49
TABLE 7 Persistence of FRSCORE and Robustness Check Using Difference in FRSCORE
Panel A
Variable Correlation between Variablet and Variablet-1 FRSCORE 0.206 RESTATE 0.053 MW 0.426 CHANGE 0.082 MBE 0.121 OPINION 0.261
Panel B1 – Re-estimation Using Difference in FRSCORE, Raw Returns
Model 2C Model 3C Coef p-value Coef p-value
Intercept 0.016 0.927 0.013 0.943 ERN 0.059 0.059 ΔERN 0.772 <0.001 0.762 <0.001 ΔFRSCORE -0.023 <0.001 -0.022 <0.001 ERN*ΔFRSCORE 0.018 0.678 ΔERN*ΔFRSCORE -0.012 0.704 -0.014 0.667
R2 0.338 0.338Obs. 34,753 34,753
Panel B2 – Re-estimation Using Difference in FRSCORE, Market adjusted returns
Model 2D Model 3D Coef p-value Coef p-value
Intercept 0.259 0.205 0.253 0.214 ERN 0.105 <0.001 ΔERN 0.659 <0.001 0.642 <0.001 ΔFRSCORE -0.019 <0.001 -0.018 <0.001 ERN*ΔFRSCORE 0.030 0.396 ΔERN*ΔFRSCORE -0.012 0.661 -0.015 0.578
R2 0.154 0.156Obs. 34,753 34,753
Panel A reports the correlation between FRSCOREt and FRSCOREt-1 as well as the correlation between each component of FRSCORE in time t and same component in time t-1.

50
Panel B1 and B2 repeat estimation of model (2) and model (3) substituting FRSCORE with the change in FRSCORE from time t-1 to time t. Panel B1 report results obtained using raw returns and Panel B2 report results obtained using market adjusted returns.
Definitions of all variables are in Table 1.

51
TABLE 8 Integrated Value Relevance and Faithful Representation Regressions Using Components of FRSCORE
Panel A – Raw returns
Model 4A1 Model 4B1 Model 4C1 Model 4D1 Model 4E1 RESTATE MW CHANGE MBE OPINION Coef p-value Coef p-value Coef p-value Coef p-value Coef p-value
Intercept -0.162 <0.001 -0.162 <0.001 -0.161 <0.001 -0.158 <0.001 -0.162 <0.001ΔERN 0.737 <0.001 0.733 <0.001 0.738 <0.001 0.728 <0.001 0.731 <0.001COMP -0.027 0.013 -0.084 <0.001 -0.004 0.722 -0.032 <0.001 -0.222 0.001ΔERN *COMP -0.061 0.453 -0.022 0.781 -0.055 0.442 0.044 0.672 -0.905 0.081
R2 0.336 0.337 0.336 0.336 0.336Obs. 38,718 38,718 38,718 38,718 38,718
Panel B – Market adjusted returns
Model 4A2 Model 4B2 Model 4C2 Model 4D2 Model 4E2 RESTATE MW CHANGE MBE OPINION Coef p-value Coef p-value Coef p-value Coef p-value Coef p-value
Intercept 0.041 <0.001 0.041 <0.001 0.042 <0.001 0.044 <0.001 0.041 <0.001ΔERN 0.646 <0.001 0.638 <0.001 0.644 <0.001 0.636 <0.001 0.638 <0.001COMP -0.030 0.001 -0.079 <0.001 -0.005 0.588 -0.025 0.000 -0.233 0.002ΔERN *COMP -0.078 0.254 0.008 0.898 -0.045 0.468 0.032 0.705 -0.847 0.152
R2 0.145 0.146 0.145 0.145 0.145Obs. 38,718 38,718 38,718 38,718 38,718

52
The table presents estimation of model (2) substituting FRSCORE with each of its components (COMP) separately. The general formulation is as follows
(4) 3211 tttttt COMPECOMPERET
Where COMP is either:
Filing of a restatement (RESTATE). Material weakness in internal controls over financial reporting (MW). Change of auditor (CHANGE). Just meet/bear earnings target (MBE). Auditor adverse, qualified or no opinion (OPINION).
All models control for annual and industry fixed effects. Standard errors are clustered by firm.
Panel A report results obtained using raw returns and Panel B report results obtained using market adjusted returns.
Definitions of all variables are in Table 1.

53
TABLE 9 Integrated Value Relevance and Faithful Representation Regressions - Profit vs.
Loss Firms
Panel A – Raw returns
Model 5A Model 6A Coef p-value Coef p-value
Intercept -0.137 <0.001 -0.268 <0.001 LOSS -0.063 <0.001 -0.006 0.581 ERN 1.935 <0.001 ERN*LOSS -2.349 <0.001 ΔERN 0.957 <0.001 0.572 <0.001 ΔERN*LOSS -0.370 <0.001 0.037 0.529 FRSCORE -0.017 0.001 0.007 0.421 FRSCORE* LOSS -0.031 0.005 -0.042 0.005 ERN*FRSCORE -0.145 0.323 ERN* FRSCORE* LOSS 0.224 0.154 ΔERN*FRSCORE -0.091 0.149 -0.011 0.869 ΔERN *FRSCORE*LOSS 0.086 0.280 0.001 0.993
ERN+ΔERN: Profits 2.508Losses 0.196
FRSCORE: Profits -0.017 0.007Losses -0.048 -0.035
FRSCORE*(ERN+ΔERN): Profits -0.155Losses 0.070
R2 0.343 0.365Obs. 38,718 38,718

54
Panel B – Market adjusted returns
Model 5B Model 6B Coef p-value Coef p-value
Intercept 0.073 <0.001 -0.040 <0.001 LOSS -0.083 <0.001 -0.028 0.003 ERN 1.669 <0.001 ERN_LOSS -1.998 <0.001 ΔERN 0.831 <0.001 0.499 <0.001 ΔERN*LOSS -0.325 <0.001 0.026 0.598 FRSCORE -0.017 <0.001 0.001 0.936 LOSS*FRSCORE -0.024 0.009 -0.031 0.016 ERN*FRSCORE -0.062 0.622 ERN*LOSS*FRSCORE 0.131 0.330 ΔERN*FRSCORE -0.081 0.120 -0.023 0.672 ΔERN*LOSS*FRSCORE 0.080 0.231 0.017 0.806
ERN+ΔERN: Profits 2.168Losses 0.195
FRSCORE: Profits -0.081 0.001Losses -0.001 -0.030
FRSCORE*(ERN+ΔERN): Profits -0.084Losses 0.063
R2 0.158 0.185Obs. 38,718 38,718
Table 9 presents coefficient estimates of cross-sectional value relevance and faithful representation regressions distinguishing between profit and loss firms using a dummy variable denoting losing firms (LOSS), as follows:
(5) 765
43211
tttttttt
tttttt
LOSSFRSCOREEFRSCOREELOSSFRSCORE
FRSCORELOSSEELOSSRET
For robustness, an alternative model distinguishes between profit and loss firms based on model (3) as follows:

55
(6) 1110
9876
543211
tאtttt
ttאttttא
ttttאttא
LOSSFRSCOREEFRSCOREE
LOSSFRSCOREEFRSCOREELOSSFRSCOREFRSCORE
LOSSEELOSSEELOSSRET
Both models control for annual and industry fixed effects. Standard errors are clustered by firm.
Panel A report results obtained using raw returns and Panel B report results obtained using market adjusted returns.
Definitions of all variables are in Table 1.