fairness, nature and communities
TRANSCRIPT
Fairness, nature and communities:addressing climate change in Cambridgeshireand Peterborough
October 2021
1
2
Cambridgeshire & Peterborough Independent Commission on Climate Preface
It is a pleasure to introduce this �rst full report of the Cambridgeshire and Peterborough Independent Commission on Climate Change, extending and updating the recommendations in our interim report published in March. The views and recommendations in this report are those of the Commission. We were delighted when the Combined Authority accepted the recommendations in our interim report this summer, and we look forward to discussing our new recommendations with the Mayor and his team.
This year has delivered a stark warning of the impacts of climate change, around 200 lives lost in �ooding in Germany, people drowned in their basements in New York, �ooding in London at the beginning and end of the summer and wild�res, �oods and droughts across many parts of the world. The climate is changing and already impacting how we live our lives. Reducing our greenhouse gas emissions to zero globally by around mid-century will be critical to keeping the climate impacts at levels we have a chance of being able to adapt to – if we don’t achieve this the impacts will become very severe. Reducing our emissions is critical, but even achieving the net zero target means we have more adaptation to do. The last ten years have been the hottest on record. Every decade between now and 2050 will break that record as the hottest decade.
Many of the risks to the UK from climate change are particularly acute in Cambridgeshire and Peterborough: the risk of �ooding, very high summer temperatures, water shortages, and damage to the natural carbon stores in the deep peat of the Fens. We all need to act, and we must act now, to avoid the most damaging aspects of climate change. If we act in the right way we can also deliver bene�ts and opportunities, including new jobs in low carbon industries, safer and more comfortable homes and workplaces with lower energy bills, better air quality and more greenspace and access to nature, improving our health and well-being.
The Commission’s mission is to provide independent advice to local government, the broader public sector and business on setting and meeting carbon reduction targets for Cambridgeshire and Peterborough and on preparing for climate change. We also make recommendations to central Government, for example on the important role that local authorities have to play in addressing climate change, and the additional devolved funding and powers that they need to be able to do this.
Tackling the climate crisis requires large changes across our societies and economies, at local, national and global levels. We need actions from governments and businesses, but there are important ways in which individuals, families and communities in the region can contribute positively to this change.
Since the interim report was published we have had the opportunity to consult extensively with people and organisations across the region. It has been inspiring to hear the views and ideas of residents and community organisations about the kind of transition to net zero that they want to see, and what would feel fair in terms of how we get there. We have incorporated the outcomes of this consultation into the relevant chapters of the report, as well as including a new chapter on what a Just Transition feels like for the region.
Preface
3
Cambridgeshire & Peterborough Independent Commission on Climate Preface
In this full report we have expanded our recommendations to include business and industry; nature and water; waste; and adapting to climate change. Where there have been signi�cant changes since our original report we have provided a commentary in that chapter.
Our work highlighted a strong desire amongst residents to get involved in responding to climate change, and wanting guidance on what they might do. Our March report included a chapter aimed at residents with advice on some simple changes everyone can make, and sources of additional advice, which is now available on online.
When invited by the Mayor of the Combined Authority to chair the Commission I was excited by the prospect of drawing on Cambridgeshire and Peterborough’s outstanding academics, the practical expertise of our farmers and businesses, and our community’s commitment to a sustainable future. This has proven to be the case. The work of the Commission has been greatly assisted by the response to our public call for evidence, our consultation activities and the support of businesses and other organisations.
I am very grateful to all of the Commissioners for their time, their input and their guidance. They have shown dedication in getting to the heart of the issues, and commitment to ensuring that our recommendations will both address climate change and deliver wider societal bene�ts. The Commissioners recognise that fairness must be at the core of our approach. I thank them all for their e�orts. Work by the University of Cambridge has given us an excellent insight in potential risks, and work by the University of Leeds has enabled us to consider the costs of di�erent actions. The Management Board and Secretariat have provided support throughout. In addition, the work of Adrian Gault in supporting the Commissioners and pulling together the report has been invaluable and tireless.
The whole team would like to thank the many people who have met us, who have made comments and have helped create this report.
This is the report of the Commission and I hope that the work of the Commission will continue to inform, inspire and assist Cambridgeshire and Peterborough’s councillors, residents and businesses to ensure this area can deliver a net zero carbon future and become an even better, greener place to live and work for everyone.
Dame Julia King
4
Cambridgeshire & Peterborough Independent Commission on Climate Commission
Baroness Brown of Cambridge, Dame Julia KingChair of the Cambridgeshire & Peterborough Independent Commission on ClimateBaroness Brown currently serves as Chair of the Carbon Trust; previously Vice Chair of the Committee on Climate Change and currently Chair of the Adaptation Sub-Committee; and Council member of Innovate UK. She sits on the Government’s Hydrogen Advisory Council. She was a non-executive director of the Green Investment Bank, she led the King Review on decarbonising transport (2008), and was the UK’s Low Carbon Business Ambassador from 2008 – 2018.
Richard AstleChairman of Natural Cambridgeshire.Natural Cambridgeshire brings together businesses, local authorities, the health sector, farming, wildlife, and environmental organisations. Richard is also the Managing Director of Athene Communications, a provider of strategic advice on communication and engagement at board and senior management level. Richard is a former recipient of the Institute of Public Relations Sword of Excellence for Public A�airs. Before Athene, Richard has a career in the British Foreign O�ce, serving in the Moscow Embassy.
Professor Laura Diaz AnadonProfessor Laura Diaz Anadon holds the chaired Professorship of Climate Change Policy at the University of Cambridge and is Director of the Centre for Environment, Energy and Natural Resource Governance (C-EENRG) and Bye-Fellow at Peterhouse.Laura is also Research Associate at the Harvard Kennedy School at Harvard University. She is a Lead Author in the 6th Assessment Report of the Intergovernmental Panel on Climate Change Working Group III on Climate Change Mitigation and a member of the Carbon Trust Breakthrough Ideas Steering Group. In June 2018 she was awarded the XVII Fundacion Banco Sabadell Prize for Economic Research for the best young Spanish economist.
Greg ArcherUK Director of the international environmental organisation Transport and Environment.Greg is also a member of the board of the environmental organisation ECOS; and runs a consultancy, Gaian Ltd. He has over 25 years’ experience researching and developing solutions to the environmental impacts of transport. Since 2019, Greg has run the UK o�ce of T&E successfully working to secure the 2030 ban on sales of new conventional cars. From 2012, he was based in Brussels as T&E’s Vehicles Director successfully campaigning for strong car CO2 regulations that have stimulated the shift to electric cars.
Commission

5
Cambridgeshire & Peterborough Independent Commission on Climate Commission
Dame Polly Courtice, DBE, LVODame Polly Courtice was the Founder Director of the Univer-sity of Cambridge Institute for Sustainability Leadership (1988 – 2021) and is a Non-Executive Director of Anglian Water Services Ltd.Polly is a Director of the Jupiter Green Investment Trust, and Board Advisor to BSI. She serves on a number of environmental and sustainabil-ity advisory boards of companies, including AstraZeneca and Nespresso, and is on the judging panel for the Queens Award for Sustainable Development.
Russell PicotRussell is Chair of the Trustee board of the HSBC Bank (UK) Pension Fund and Deputy Chair of Universities Superannua-tion Scheme Limited. Russell was a co-chair of the FSB’s Enhanced Disclosure Task Force and is a Special Advisor to the Financial Stability Board’s Climate-related Financial Disclosures Task Force, chaired by Michael Bloomberg. He has supported the HRH The Prince of Wales Accounting for Sustainability project since its inception in 2004, and he is a Senior Associate at the Cambridge Institute of Sustainability Leadership. Russell holds an MA in Mathematics from Cambridge and is a chartered accountant.
Rhiannon OsborneRhiannon Osborne is a medical student, climate activist and researcher in global health equity.Her work focuses on the intersection between climate action, health inequalities, community mobilisation and economics. She is currently the co-chair of Students for Global Health's climate change and health working group; a scholar with the Healthcare Leadership Academy; an organiser with Health for a Green New Deal; and a coordinator at the People's Health Movement. Over the last 3 years she has worked for the Department for International Development, ActionAid, Medecins Sans Frontieres , and the Centre for Infectious Disease Research Zambia on issues ranging from public health emergencies to land rights.
The Very Revd. Mark BonneyDean of Ely since 2012.Mark Bonney was previously a Canon Residentiary and Treasurer of Salisbury Cathedral for eight years, after sixteen years of service in St. Albans diocese.
6
Cambridgeshire & Peterborough Independent Commission on Climate Commission
Dr Emily Shuckburgh OBEDr Emily Shuckburgh is a Director of Cambridge Zero at the University of Cambridge and Reader in Environmental Data Science at the Department of Computer Science andTechnology.Emily is a mathematician and climate scientist and a Fellow of Darwin College, a Fellow of the Cambridge Institute for Sustainability Leadership, an Associate Fellow of the Centre of Science and Policy and a Fellow of the British Antarctic Survey. She also leads the UKRI Centre for Doctoral Training on the Application of AI to the study of Environmental Risks (AI4ER).
Lynne Sullivan OBEAn architect and member of the CLC Green Construction Board, Lynne Sullivan is the Chair of the Good Homes Alliance and Board member of the Passivhaus Trust and the Active Building Centre. Lynne was RIBA's Ambassador on Climate Change, representing RIBA at COP21 in Paris and chairing their Sustainable Futures Group 2014-2017. Lynne has authored and chaired a number of policy review and research projects on building performance and sustainability for UK governments and others, including 'A Low Carbon Building Standards Strategy for Scotland'.
Ben SzreterBen Szreter is a Policy Advisor at the Behavioural Insights Team, where he applies behavioural insights to inform policy and improve public services.Ben previously worked as the Chief Executive of Cambridge United Community Trust and as a parliamentary researcher in Westminster. He was also part of a team who jointly won the inaugural IPPR Economics Prize in 2019 with their contribution 'Incentivising an Ethical Economics.' He is on the Commission in a personal capacity.
John Shropshire OBEJohn Shropshire OBE is the Chairman of G's Fresh, an international farming to marketing business with farms and production facilities located throughout the UK, Spain, Central Europe, USA and Senegal.The global headquarters is in Barway, East Cambridgeshire. John was a Commissioner on the Cambridgeshire & Peterborough Independent Economic Review (CPIER).

7
Cambridgeshire & Peterborough Independent Commission on Climate Acknowledgements
AcknowledgementsMany people have contributed to the development of this report. The Commission would like to particularly acknowledge the support of the following people: Adrian Gault as our advisor and chief writer; Professor Ian Leslie, Paul Raynes, Steve Cox, Andrew Limb, Jane Paterson-Todd, as our management group; Adrian Cannard, Francesca Houston, Lauren Magilton, Rachael Cooper and colleagues from the Combined Authority; Dr Ethan D. Aines, Dr Charles Simpson, Dr Amy Munro-Faure for the Cambridge Zero Risk report; Beverley Duckworth for leading the civil society engagement events; Stephen Frost, Becca Massey-Chase (both IPPR) and Dr Laurie Friday for developing and running the Cambridgeshire Fens Panel; Aled Jones, Tom Hennessy, Charles Cotton, Anne Bailey and Nitin Patel for contributions to the development of Chapter 6, Business and Industry; Matthew Hunt, Daniel Johns, and Hannah Ward for contributions to Chapter 7 on adaptation, nature and water; Louisa Pratt, Megan Hudson, Matthew Bullock, Brian Eversham, James Green, Catherine Weightman and Rob Wise for contributions to the development of Chapter 9 on emissions from peat; Andrew Sudmant, Amelia Duncan, Professor Andy Gouldson, ESRC Place Based Climate Action Network, University of Leeds; Sheryl French, Professor David Newbery and Professor John Miles.
The Commission would also like to thank all the people who have met us, who responded to questions, made comments and have helped create this report, and in particular the members of the Cambridgeshire Fens Panel and of civil society groups, who contributed so much to development of our thinking in relation to requirements for a just transition across Cambridgeshire and Peterborough.
8
Executive Summary
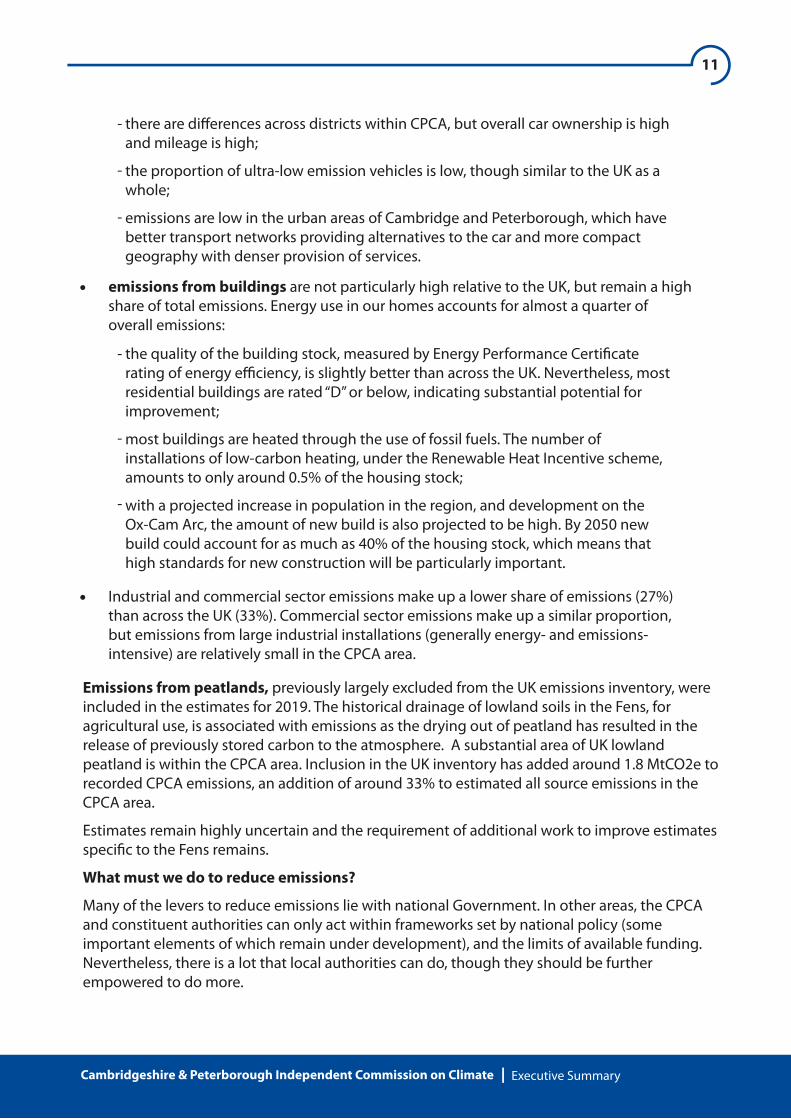
Greenhouse gas emissions in the Combined Authority region are high. In the Cambridgeshire and Peterborough Combined Authority (CPCA) area, emissions are almost 25% higher per person than the UK average, excluding the emissions from peat.1 When we include the emissions from peatland we have only about 6 years remaining before we will have exhausted all of our ‘allowed’ share of emissions to 2050, if we are to play an equal part in delivering the UK’s critical Net Zero target.
The region is at high risk from the changing climate. Many of the risks to the UK from climate change are particularly acute in this region: �ooding, high summer temperatures, water shortages, and damage to the natural carbon stores in the deep peat of the Fens. Heat wave summers like 2018 will be the norm by 2050 even if we are on a global path to Net Zero. If we are heading to a temperature rise closer to 3°C, winter rainfall could be 50% higher and summer rainfall 60% lower by the end of the century. We would regularly see summer temperatures reaching 40°C. Sea level rise could reach 1metre or more. These impacts2 will a�ect homes, public buildings, businesses, towns and cities, and farming in the Fens. We need both to reduce our emissions to minimise the impacts and also to prepare for them.
Urgent action is needed – well before the six years is up. We need action both to reduce emissions in line with UK targets and to prepare for the impacts of climate change, which will be signi�cant even if we are on track globally for the Paris agreement ambition of keeping close to 1.5oC and well below 2oC of warming by the end of the century. If we cannot deliver this ambition, the impacts of climate change become much more severe.
The scale of the task ahead is huge. But if we are all part of the transformation: national government, local government, local communities, businesses and individuals, we can make the changes that are needed. In the CPCA area we have over 350,000 existing homes that will need to be converted to low carbon heating, and every new build (growing in number with developments like the Ox-Cam Arc) must be net zero. All the cars in the region (more than 500,000 currently) will need to be zero emissions by 2050.
The transformation will need signi�cant investment. The Climate Change Committee estimates that investment in green infrastructure nationally will need to rise from about £10bn to £50bn annually (an increase of about 10% in our national infrastructure spend) to deliver the decarbonisation of our electricity systems, our industries, our transport and our homes. Work for this report has estimated a requirement of around £700m annually through the 2020s in the CPCA area. Some of the funding will be public investment, much of it will be private and we will need to look at ways we can attract investment into the region to ensure we can deliver the changes required. The CPCA borrowing powers could be an important lever to support investment.
The transition must be delivered in a way that is fair, is good for nature, and does not leave marginalised communities behind. For climate action to be e�ective, both to reduce emissions and to prepare for climate impacts, it must be taken forward in ways that people feel are fair. Achieving a Just Transition will recognise that not everyone has contributed to climate change equally, either globally or locally, and not everyone has the same capacity to adapt and mitigate the e�ects at the individual, community and organisational level.
1 Emissions from peatlands are uncertain and will need further measures to be tackled, but add around 33% to CPCA area emissions.
2 CCC (2020), The Sixth Carbon Budget – The UK’s path to Net Zero.
Cambridgeshire & Peterborough Independent Commission on Climate Executive Summary

9
Addressing climate change can deliver multiple bene�ts. How we deliver the investments and the changes that are needed, ensuring fairness is core to the approach, will be very important. Appropriate design of climate policy, using required investment the right way, can bring many bene�ts: more and better green space, a thriving natural world, better insulated and better ventilated homes, cleaner air, high quality job opportunities in the growing green economy, resilient supply of decarbonised energy, better public transport, improved health and well-being.
Local government and the CPCA has a key role to play. Whilst many of the levers are in national Government hands, local government has a very important role. Local government powers in transport, planning and borrowing are critical in driving the transformation. Local action will be needed in areas such as planning, home renovation, nature-based interventions, waste management, communication and engagement to support behaviour change, and ensuring that national schemes and support can be used to maximum e�ect and leveraged to accelerate the transition locally. To deliver this ambitious programme at the speed required, the CPCA will need an appropriate level of dedicated resources.
Business needs to step up. Businesses within the region should look to prioritise actions towards achieving net zero, reducing their own emissions and collaborating and playing a leadership role with others. Being active in the green economy will be essential for a thriving economy, with growing investment in green technologies in the UK and globally. Whilst the area is strong in terms of innovation and early-stage companies, there is not yet an obvious envirotech cluster, though many of the requirements to support this are present: one of the world’s top universities, with research laboratories and technical consultancies; angel and venture capital investors; networking and mentoring organisations. Leveraging the region’s strengths in IT, biotech, advanced manufacturing and agriculture, there is signi�cant potential for the region to become a leader in developing, manufacturing and/or deploying some of the key technologies and busi-nesses important for climate change mitigation and adaptation.
Our region can show leadership. Through coordination of the key stakeholders, we can grow our impact on a national and an international level by harnessing our world-leading intellectual assets. We have outstanding universities, research institutes and colleges which can be centres for low carbon innovation, new approaches to adapting to climate change, and training for the new skills required. We have world-leading knowledge intensive industries. We have a nationally important farming community in the Fens who can lead the way in showing how to manage lowland peat to reduce emissions, help double nature3 and produce healthy food. The region can be a focus for demonstration and trials of new technologies and new ways of doing things, something we can all be involved in and be proud of.
The region’s residents are keen to play their part. Surveys we conducted in the development of our interim report in March showed that local people want to act and want to be engaged. This has been con�rmed in recent consultations – both a Cambridgeshire Fens Panel looking at how our actions can be fair, and discussions with civil society representatives from across the area. Residents see that everyone has a part to play. For their own choices, they want to see policy designed to make the sustainable choice easier and they want clear and trustworthy information. They want meaningful community engagement on the issues, both to help galvanise action and also to design those actions more appropriately for local circumstances. But they also want to see council and business action, with nature prioritised alongside climate, and a leading role for the area nationally. Grassroots citizen engagement on climate change needs to be a priority for the future.
Cambridgeshire & Peterborough Independent Commission on Climate Executive Summary
3 Natural Cambridgeshire (2019), Doubling Nature: A Vision for the Natural Future of Cambridgeshire & Peterborough in 2050.

10
Background to this report
This is the �rst full report of the Cambridgeshire and Peterborough Independent Commission on Climate, providing advice on what is needed to deliver change locally.
In March, we provided an overview of sources and levels of emissions in the CPCA and risks from climate change. We looked in greater depth at emissions attached to transport, buildings, energy, and peat. These are all areas of particular concern locally: transport because our emissions are well above the national average; housing because of the rapid projected growth in the region; energy because of the key role of electri�cation in decarbonising transport and buildings; and peat because of its importance both as a major contributor to local emissions and to our agricultural economy.
In our work since March we have focussed on other important areas including waste, water, business and industry, and the role of nature in helping us to adapt to and mitigate the impacts of climate change.
Perhaps most importantly, since it bears on the success of our actions across society as a whole, we have further looked at what a fair transition to net zero would look like for people in the area, and how that can be pursued. In order to understand this better, we have engaged with a panel of Cambridgeshire Fens residents, and with civil society groups from across Cambridgeshire and Peterborough. The results of those deliberations and consultations are presented in Chapter 3, A Just Transition (with sector-speci�c outputs picked up in sector chapters). They also feed through to further recommendations that we make to help drive climate actions in the area, in ways that are fair and maintain community engagement.
We bring together, in this report, our interim �ndings from March, with brief updates for policy developments since then, and the new work that we have conducted. We have updated emissions estimates for the region to allow for the most recent 2019 data. We provide a combined set of recommendations (Table 1), some of which the Combined Authority has begun to implement.4
The sources of emissions in CPCA
From the latest national data estimated at local authority level, total CO2 emissions in the CPCA area in 2019 were 7200ktCO2. This includes peatland emissions which, though uncertain, must be tackled and are a particular issue for farming in the fenlands.
For purposes of comparison with emissions nationally it is useful to look at emissions excluding those from peatlands (which could otherwise distort comparisons). On this basis, overall emissions in 2019, were around 5300ktCO2. This is around 6.22t per capita in the CPCA area, almost 25% above the per capita �gure across the UK as a whole (5.00).5
There are di�erences in the make-up of emissions:
Cambridgeshire & Peterborough Independent Commission on Climate Executive Summary
4 In June 2021 the Board of the Combined Authority voted to act on all our interim recommendations.
5 When emissions from peat are included, the �gure rises to 63% above the UK per capita average.
emissions from surface transport are high: 2.7tCO2 per capita in the CPCA area as against 1.9tCO2 per capita in the UK. They have been rising in recent years, and are high across cars, vans and HGVs. Some of these emissions re�ect through tra�c, for example on the A14, A1(M) and M11, but this is not enough to explain the relatively high level of trans-port emissions overall:
11
Cambridgeshire & Peterborough Independent Commission on Climate Executive Summary
emissions from buildings are not particularly high relative to the UK, but remain a high share of total emissions. Energy use in our homes accounts for almost a quarter of overall emissions:
there are di�erences across districts within CPCA, but overall car ownership is high and mileage is high;
the proportion of ultra-low emission vehicles is low, though similar to the UK as a whole;
emissions are low in the urban areas of Cambridge and Peterborough, which have better transport networks providing alternatives to the car and more compact geography with denser provision of services.
-
-
-
the quality of the building stock, measured by Energy Performance Certi�cate rating of energy e�ciency, is slightly better than across the UK. Nevertheless, most residential buildings are rated “D” or below, indicating substantial potential for improvement;
most buildings are heated through the use of fossil fuels. The number of installations of low-carbon heating, under the Renewable Heat Incentive scheme, amounts to only around 0.5% of the housing stock;
with a projected increase in population in the region, and development on the Ox-Cam Arc, the amount of new build is also projected to be high. By 2050 new build could account for as much as 40% of the housing stock, which means that high standards for new construction will be particularly important.
-
-
-
Industrial and commercial sector emissions make up a lower share of emissions (27%) than across the UK (33%). Commercial sector emissions make up a similar proportion, but emissions from large industrial installations (generally energy- and emissions-intensive) are relatively small in the CPCA area.
Emissions from peatlands, previously largely excluded from the UK emissions inventory, were included in the estimates for 2019. The historical drainage of lowland soils in the Fens, for agricultural use, is associated with emissions as the drying out of peatland has resulted in the release of previously stored carbon to the atmosphere. A substantial area of UK lowland peatland is within the CPCA area. Inclusion in the UK inventory has added around 1.8 MtCO2e to recorded CPCA emissions, an addition of around 33% to estimated all source emissions in the CPCA area.
Estimates remain highly uncertain and the requirement of additional work to improve estimates speci�c to the Fens remains.
What must we do to reduce emissions?
Many of the levers to reduce emissions lie with national Government. In other areas, the CPCA and constituent authorities can only act within frameworks set by national policy (some important elements of which remain under development), and the limits of available funding. Nevertheless, there is a lot that local authorities can do, though they should be further empowered to do more.

12
Cambridgeshire & Peterborough Independent Commission on Climate Executive Summary
the CPCA should create:
a Climate Cabinet chaired by the Leader of the Combined Authority, including councils and other key regional stakeholders;
a funded delivery team within CPCA, to coordinate, champion and facilitate action;a green investment team;
a climate action plan, including a �nancial plan, with agreed targets and monitoring.
-
-
-
the CPCA should rapidly assess the current sources and availability of funding (such as Green bonds or other instruments to accelerate housing retro�t, nature-based solutions and peat restoration) and develop an ambitious funding plan.
the CPCA and constituent authorities should commit immediately to (i) undertake a climate change assessment of new initiatives and policies, and (ii) ensure all procurement is compatible with delivering net zero and climate resilience;
the CPCA and constituent authorities should develop a local area energy plan, identifying heat zones and retro�t priorities for buildings, and aligned with plans for transport that support electri�cation and zero carbon vehicles.
the CPCA should develop and lead a plan for engagement and behaviour change with local people and businesses. This should cover the need for action and provide information on options and the choices that have to be made at local level.
Overarching policy
CPCA and local authority leadership will be particularly important and is supported by our consultations with local people. Substantial funding for the upfront investments that are required will also be needed (some of which will come from the private sector, including individuals and householders within CPCA, some from the public sector). To this end we recommend that:
The Combined Authority has been positive in its response (Box 1). It has accepted all the recommendations we made in March. Implementation is now key.

13
Cambridgeshire & Peterborough Independent Commission on Climate Executive Summary
the Local Transport Plan, renamed to the Local Transport and Connectivity Plan, is to be refreshed to include a greater emphasis on digital improvements;
the Combined Authority’s own operations are to be net zero by 2030;
funding has been agreed to support the work of a Fenland Peat Committee, aiming to improve estimates of emissions from peatlands, and to help develop ‘whole farm’ land use policies for sustainable farming in the Fens
Box 1: Combined Authority response to our March 2021 recommendations
At a meeting in June, the Combined Authority Board voted to act on the recommendations of the CPICC March report, covering transport, buildings, energy and peat, as well as the overarching recommendations.
This has included the setting up of a Climate Working Group, chaired by the Mayor (the Climate Cabinet recommended by the Commission), to take action forward and ensure an e�ective local response.
Work has begun on the development of an Action Plan for the initial set of recommendations.
Amongst speci�c actions:
A Just Transition
Climate action must be designed to bene�t our communities and help overcome the other challenges we face as a region. Based on the work of the Cambridgeshire Fens Panel and our other consultations we have developed a set of principles (Box 2) that we recommend should be considered in relation to the climate assessment of policy developed by the CPCA and constituent authorities.

14
Cambridgeshire & Peterborough Independent Commission on Climate Executive Summary
Do no harm. Where possible, we must end activities which are actively doing harm to the environment, for example by emitting lots of greenhouse gases, destroying or degrading natural habitats. People and organisations should do as little harm as possible and aim to do good for the environment. Bold ideas and leadership. We need strong action, especially in the areas where our emissions are high, with funding to support climate initiatives. Local politicians, governments and businesses should be leading by example. Sustainability should be considered for everything. All aspects of decision making should consider emissions and sustainability, for example development in transport planning.Ensure clear, inclusive, meaningful communication with citizens, businesses and civil society across the region on climate change and related issues, including the scale of the crisis, up to date information about action locally, and guidance.Sustainable choices must be a�ordable, convenient and safe. Where possible, the best option for people should be the one that is most environmentally bene�cial, and people must be provided with practical support to make good decisions. Local decision making. While retaining a joined-up approach across the region, decision making should be as local as possible with local accountability and responsibility. It should build on local strengths. People must be able to participate in decision making, design options and be part of the change. Protecting those on the lowest incomes. Those who are already struggling must not be burdened by climate action. Their needs must be taken into account, as should those of other groups who could be disadvantaged by changes, such as disabled people. The bene�ts of climate action must reach left behind communities.Embrace the natural world and environment. People want and bene�t from access to nature, green space and biodiversity. We should respect and value nature and the environment as we are all interconnected. As well as monitoring our progress on climate action and emis-sions, we should measure and value not just economic metrics but include new ways of meas-uring the wellbeing of people and nature. Fairness locally, nationally and internationally. We must take into account the global consequences of local decisions, as well as impacts on the rest of the country. Everyone has a part to play. It is not just the responsibility of the local government but also of local people and businesses – we all need to get involved. People want to be enabled to be involved and it should be easy for them to play their part. Key to this is funding, support and facilitation for community-based climate initiatives and grassroots approaches to implementing climate policy. Polluters should pay. Companies and other organisations that create pollution locally should incur a �nancial cost (or demonstrate how they are investing to change practices, for example in farming). Payments should be used to subsidise and incentivise greener initiatives. People and organisations creating the most emissions and who have the most money and power should lead the way.
Box 2: Principles of a Just Transition
1.
2.
3.
4.
5.
6.
7.
8.
9.
10.
11.
15
Cambridgeshire & Peterborough Independent Commission on Climate Executive Summary
the rollout of electric vehicle charging infrastructure, which provides a ‘right to charge’ for residents, workers and visitors to the region. This should start with bringing those districts with low provision up towards the levels of the best;
a transition towards zero emission bus and taxi �eets by 2030;
measures to reduce car miles driven, including improvements to public transport, trials of on-demand electric buses and infrastructure for walking and cycling;
exclusion of diesel vans and trucks from urban centres by 2030.
all new buildings to be net zero ready by 2023 and designed for a changing climate. This is an earlier date than proposed for implementation of the Government Future Homes Standard, but recognises the high level of new build in the area – if these buildings are not built to the highest standards now, they will require more expensive retro�t later on;
new developments must be sited in locations where land use is appropriate and resources are su�cient; where low-carbon transport infrastructure is available; to contribute to the doubling nature agenda; and be delivered with low emissions and low risks from climate change;
home retro�t will need to be rolled out across the building stock. Every building will need a renovation plan (a green building passport), starting, by 2025, with buildings currently below EPC “C”.
the CPCA should embrace the full range of economic and business opportunities arising from the transition to net zero. It should encourage and support the development by stakeholders of a bold vision for what the CPCA area economy should strive towards by 2030 and 2050 to meet climate goals.
the forthcoming regional skills strategy should have a strong green “core” – every future job must be a green job.
net zero awareness raising and advice services for businesses must be expanded.
the CPCA should develop a regional “Race to Zero” – a Mayor’s Low Carbon Business Charter - encouraging local organisations and businesses to sign up to pathways to net zero emissions.
the Fenland Peat Committee should continue work to inform and develop “whole farm” land use policies aimed at achieving climate change mitigation and biodiversity enhancement in the Fens, and to help establish an agreed set of numbers for emissions from deep, shallow and wasted peat soils.
Transport
Buildings
Business and Industry:
Peatlands:
Sectoral action
Priorities for sectoral action include:

16
Cambridgeshire & Peterborough Independent Commission on Climate Executive Summary
our surveys of public opinion clearly showed the priority that local people attach to the natural world. Nature recovery programmes, including tree planting and wetland creation/restoration have an important role to play in helping to address the impact of climate change and engaging communities and businesses.
the CPCA has an opportunity to accelerate the doubling nature agenda, which will help deliver multiple bene�ts, not least in terms of health and wellbeing. Recognising the public support and interest in the natural world, the CPCA should actively prioritise the delivery of this agenda, setting an example on publicly owned land, providing �nancial support for the work of the local nature partnership and supporting the establishment of a doubling nature fund, designed to aggregate sources of funding that can help communities, landowners and businesses take action to help nature recover quickly.
The waste management strategy for the area is out-of-date and should be revisited as a matter of urgency. Plans should include the development, by June 2022, of a communication programme with the public for waste reduction, waste separation and recycling, building on existing activities, including a consistent approach to waste management across the region.
There should be targets, across the CPCA area, for at least a 37% reduction in residual waste by 2030 and for recycling of household waste at 65% by 2030.
Preparations need to be made now for the separate collection of recyclable and compostable materials.
New EfW plants should only go ahead with public agreement, and on the basis that the economic case stands up in the light of ambitious targets for waste reduction, resource e�ciency and recycling, and with the requirement for CCS to be �tted from the outset.
Existing EfW waste plant should be retro�tted with CCS by 2035.
Nature
Waste:
Bene�ts from these actions
If we take these actions, we can put ourselves on track to play our part in meeting the UK’s emission reduction targets, and help prepare for the impacts of climate change to which we are already committed.
But there is a wider set of bene�ts to our communities. Many of the measures we need to take for climate reasons also bring other bene�ts with them. This was widely recognised in the engagements we had with residents and civil society groups in the development of this report. There is a strong desire from local people to be a part of the climate action that is required. They recognise the challenges we face, but also see many of the issues facing the region as linked, with potential for climate actions to help tackle these issues, with bene�ts to our communities:
Measures to reduce emissions in our urban areas will improve air quality and health;
Measures to improve the energy e�ciency of our homes and buildings, aside from reducing energy bills, can make our homes more comfortable, reducing risks of heat and cold related illness and deaths;

17
Cambridgeshire & Peterborough Independent Commission on Climate Executive Summary
Making sure our homes are prepared for increased risks of extreme weather and impacts of �ooding will help keep our communities safe;
Investing in high quality low carbon public transport that connects people to services, jobs and opportunities, will improve prosperity and well-being;
Making active transport, including cycling and walking, more accessible will help to improve health;
Moving towards sustainable agriculture practices, with measures to reduce food waste and inform food choices, can support long-term agricultural production, improve access to good quality local food sources and improve health;
Investing in nature, including increasing biodiversity and green space, will take CO2 out of the atmosphere as trees and plants grow, will help reduce heat in our urban areas, provide shade to our buildings, reduce risks of �ooding and improve physical and mental wellbeing.
The CPCA area has been growing fast, and has ambitions for further sustainable growth as we recover from the COVID-19 pandemic. There are nevertheless big disparities in levels of income between and within districts. Investing in climate-friendly technology, revamping old and high-emitting infrastructure and greening our communities, will create opportunities for skills, training and employment to people living, working and studying in our region.
People have told us that the area should be a leader in taking action. And they attach high weight to the need to improve information and education on climate change; to measures to in�uence behaviour; and strong leadership from local government. At the same time, there is recognition that all have a role to play - there must be a strong emphasis on community engagement, recognition of local circumstances and support for community action. We hope that the assessment in this report and the recommendations we provide can help guide our delivery on these ambitions.
Future role of the Commission
We will work with the CPCA and constituent authorities, to the extent that they desire, to help develop the action plan and �nancing plan to take these recommendations forward.
Beyond this, we recommend a continuing role for the Commission in providing:
annual progress monitoring across the Combined Authority and Councils;
annual review of relevant policy and legislation and the local response;
advice to the Combined Authority and Councils in response to concerns, or when requested;
one or two “deep dives” into relevant issues for the region, looking to ensure complementarity with the activity of the Combined Authority’s Climate Working Group;
a more substantive review of progress every three years, the next coming towards the end of 2024.
We look forward to such a continuing role.

18
Cambridgeshire & Peterborough Independent Commission on Climate Executive Summary
The CPCA should create: a Climate Cabinet chaired by the Leader of the Combined Authority – including councils and key regional stakeholders (Note: the Combined Authority has set up a Climate Working Group in acceptance of this recommendation) a funded delivery team in CPCA to coordinate, champion and facilitate action a green investment team a climate action plan, including a �nance plan, with agreed targets for emissions, actions and monitoring an independent monitor: maintaining the CPICC as an independent body to monitor and report on progress annually.
A climate change assessment should be undertaken and taken into account for every CPCA and Council policy, development, procurement, action.
All CPCA and Council operations should be net zero by 2030, underpinned by a regional Science Based Targets (SBTi)-type action plan.
The CPCA should rapidly assess the current sources and availability of funding for green opportunities (such as Green bonds or other instruments to accelerate housing retro�t, nature-based solutions and peat restoration) and develop an ambitious funding plan including the use of its borrowing powers.
The CPCA should develop and lead a plan for engagement and behaviour change with local people and businesses. This should cover the need for action and provide information on options and the choices that have to be made at local level.
The CPCA and its constituent Local Authorities should adopt a leadership role in accelerating the achievement of the Doubling Nature ambition, speci�cally to create or to conserve habitats such as woodland, grassland or wetlands that can store or absorb carbon; and setting an example on land that they own or control.
The CPCA should review training and upskilling plans to ensure that these are designed to support the scale and nature of the required transition, maximise high quality job opportunities in the region and contribute to reducing inequalities and deprivation.
Recommendations
1.
2.
3.
4.
OVER-ARCHING
5.
6.
7.
19
Cambridgeshire & Peterborough Independent Commission on Climate Executive Summary
The CPCA should commission work to understand the �tness of the innovation ecosystem across the region to support the emerging net-zero-aligned agritech and nascent clean tech sectors: Mapping the elements and processes that are in place that enable the region’s success in biotech and information technology sectors in taking ideas to full commercially viable delivery, to see how these can be applied to support low carbon innovation, including: - generation and communication of ideas - the role of multiple paths of funding across the innovation process from di�erent types of funders and investors - company evolution and scale up (including simple organic growth) - the roles of universities, networks, technical consultancies, incubators and accelerators, angel investors, institutional investors, regional and national policy and the regulatory environment Understanding the di�erences in all of the above amongst the sectors, and indeed the wide spectrum within the clean tech sector
Articulating the gaps that exist within the regional innovation ecosystem that could impair the success of net-zero-aligned agritech and cleantech sectors, and making recommendations for �lling them to unlock the potential of the subsectors in which the region has or can develop world leading know how and businesses.
The CPCA should actively broker, and where appropriate, invest in, the creation of demonstration projects for the decarbonisation and resilience of the built environment, both in residential and commercial buildings. These demonstrators will require working with businesses, developers, estate owners, universities, and the �nance sector across the region. This should take a portfolio approach so that, ideally, there is a demonstrator for each distinct category of estate/built environment with signi�cant presence in the region. The balance between the scale, number and type of project, and the funding and expertise available, should be driven by the objective to develop locally relevant know-how, learning, business models, and awareness.
For Central Government:
Central Government should provide greater clarity about how costs in the transition will be met, including increased devolved funding for local authorities, and over what time periods and under what terms and conditions.
Provide increased powers for local authorities to require higher standards in planning, buildings and transport
Devolve more responsibility and funding to local authorities to deliver transport and buildings decarbonisation.
For Central Government and Ofwat:
To provide for the investment to allow intercompany trading and water infrastructure improvements by 2025 to enhance water supply, including eliminating Cambridge's dependence on the ground water aquifer.
Recommendations
8.
9.
10.
11.
12.
13.

20
Cambridgeshire & Peterborough Independent Commission on Climate Executive Summary
Recommendations
A JUST TRANSITION
Further to the recommendation in our interim report that “A climate change assessment should be undertaken and taken into account for every CPCA and Council policy, development, procurement, action” (Recommendation 2), we recommend that:
The principles outlined in this chapter (Box 3.2) should, as far as practical, form part of this climate assessment tool and local governments should adopt these principles for policy-making and strategy development, recognising that there may be instances where national statute, guidance or regulation impacts on the extent to which this is achievable.
Further to our recommendation in our interim report “The CPCA should develop and lead a plan for engagement and behaviour change with local people and businesses. This should cover the need for action and provide information on options and the choices that have to be made at local level” (Recommendation 5), we recommend that:
As part of this plan the CPCA should: Convene a ‘climate and inclusion’ working group with a remit to reach, engage and represent the views of groups who are often left out of climate and policy discussions, including minority ethnic groups, low-income communities, young people, people with disabilities. Membership should be drawn from these communities and in order to make participation fully accessible, payment for time should be made available to those who need it. Establish regular participative democracy activities, such as Citizen’s Assemblies, to aid CPCA decision making on key topics related to climate policy; and support and encourage county and local councils who wish to hold assemblies or other meaningful engagement events on key climate and policy decisions. Provide reliable, up to date and accessible information on climate and nature, in particular covering actions that people can take, to all communities in the region, including: - Facilitate citizen’s advice initiatives in each CPCA area, in partnership with the local authority and local civil society, to advise residents on di�erent climate issues and how they can take action - Develop a network of local climate and nature champions who work to deliver climate information, inform and educate people about new schemes etc. Implement community led and community-based communications and engagement work, including engaging schools and young people, and other groups.
As part of delivering the targets set out in these recommendations, the CPCA and local councils should support the activity of community based and grassroots initiatives that help local people lead delivery alongside government, businesses and other actors.
In relation to adaptation issues, the distributional impact of climate change should be given increased focus within local risk assessment and design of policy responses.
1.
2.
3.
4.
21
Cambridgeshire & Peterborough Independent Commission on Climate Executive Summary
A complete phase-out of the use of cars running on fossil fuels by 2050 within CPCA The CPCA, and constituent authorities, should by 2022 develop a plan for the rollout of charging infrastructure, with an initial focus on bringing the lowest district levels of provision up towards those of the best, and providing a ‘right to charge’ to residents, workers and visitors All new residential and non-residential developments with parking provision (and those under going extensive refurbishment) should be equipped with charging points.
All buses and taxis operated within the CPCA area, and Council owned and contracted vehicles, should be zero emissions by 2030. Each Council should make its own commitments, re�ecting the make-up and age of existing vehicles, but we recommend the following dates: The bus �eet on routes subsidised or franchised by the CPCA should be zero emission by 2025, and the authority should work to facilitate such a shift on all routes by 2030 Target 30% of taxis to be zero emission by 2025 and 100% by 2030, achieved through license conditions Council �eet to be 100% zero emission by 2030, with procurement rules used immediately to promote EV uptake.
Reduction in car miles driven by 15% to 2030 relative to baseline: Major new developments (>1000 homes) should be connected to neighbouring towns and trans port hubs through shared, public transport and/or safe cycling routes 100% of homes and businesses to have access to superfast broadband by 2023 CPCA to undertake a trial of electric on-demand buses to increase accessibility and connectivity Development and implementation of the Strategic Bus Review to prioritise a�ordability and reliability of services CPCA to work with major employers, employment hubs and Liftshare to encourage car-sharing, public transport, walking and cycling for commuting, and Councils to take a lead in respect of their own employees CPCA, with relevant authorities, to explore options to improve cycling infrastructure both within urban areas, and to encourage the use of e-bikes for longer trips to and from market towns and cities Alternatives to road investment to be prioritised for appraisal and investment – from active travel and public transport options, to opportunities for light rail and bus rapid transit or options to enhance rail connections.
Diesel vans and trucks to be excluded from urban centres by 2030 and local zero emission options pursued: At least 3 freight consolidation centres to be established outside of major urban areas with onward zero emission deliveries Home deliveries should only be made by zero emission vehicles, including cargo bikes, by 2030 UK Power Networks to develop tools and fast-track services to assist companies wishing to convert �eets of vans and trucks to electric to rapidly ascertain grid connection upgrade requirements and costs for charging CPCA to undertake a trial of electri�cation of short-haul freight from farm to warehouse.
Recommendations
1.
2.
3.
4.
TRANSPORT

22
Cambridgeshire & Peterborough Independent Commission on Climate Executive Summary
The CPCA and constituent authorities should support local area energy planning that identi�es heat zones for buildings (e.g. suitability for district heating or community networks) and retro�t priorities. Develop local energy plans, working with stakeholders, to have a key role in preparing for the decarbonisation of heat in buildings: identify which heat and energy e�ciency options and national policies apply in particular areas; consider zoning areas for speci�c heating solutions; are the basis for communications to build community understanding.
All new buildings are net zero ready by 2023 at the latest and designed for a changing climate. Adopt a net zero ready standard for new homes (requiring “world-leading” energy e�ciency and low-carbon heating in new homes) by 2023, and adopt a similar standard for non-domestic buildings; All new residential and non-residential developments with parking provision should be equipped with charging points; All planning applications to require over-heating calculations and mitigation measures, and testing against climate projections to 2050; New buildings should meet tighter water e�ciency standards of 110l/person/day at most, and preferably lower; All new build must have e�ective ventilation in use and safeguard indoor air quality; All new build to incorporate sustainable urban drainage systems; Where appropriate, new build to incorporate property level �ood resilience measures; The CPCA and constituent authorities should develop guidance to address embodied emissions (for example, a template for embodied emissions similar to the GLA), with targets strengthening over time, to enable the carbon footprint of development to be assessed.
New developments must be considered within a spatial strategy that prioritises sustainable development, low emissions and low risks from climate change. New developments to be sited to minimise emissions implications, including through making them attractive for walking and cycling, and access to wider transport infrastructure; All new build must have access to green space and nature; Developers must identify biodiversity assets and potential to enhance these as part of the development and future management of the site.
Recommendations
1.
2.
3.
BUILDINGS

23
Cambridgeshire & Peterborough Independent Commission on Climate Executive Summary
All existing buildings achieve high energy e�ciency standards, and be heated from low-carbon sources Every building should, starting by 2025 with those below EPC “C”, have a renovation plan (digital green passport, extended to include water e�ciency, cooling measures and property level �ood resilience measures where appropriate), setting out a clear pathway to full decarbonisation; Home retro�t will need to be rolled out across the building stock, incorporating passive cooling measures as well as energy e�ciency, water e�ciency and heat decarbonisation. The CPCA should take a lead in encouraging home-owners to move towards net zero, including by �nding innovative ways to encourage behaviour change and support �nancing; The CPCA and constituent authorities should prioritise achievement of net zero emissions for social housing. Digital green passports could be piloted in social housing �rst; Electric charging points required for buildings with parking provision undergoing extensive renovation; Make full use, in the short-term to 2021-22, of Green Homes Grant funding, especially in relation to “no regrets” energy e�ciency improvements, and in the medium-term of successor funding schemes available from central Government;
Performance is actively monitored and standards fully enforced Performance measurement must re�ect real-world energy use; Resources for enforcement of energy performance standards and minimum private rented standards must be prioritised.
CPCA and local authority own estate is net zero by 2030 at the latest. Public sector estate should by 2025 have a plan to achieve best practice energy use; Energy use and emissions on public sector estate should be monitored and reported.
Recommendations
4.
5.
6.
24
Cambridgeshire & Peterborough Independent Commission on Climate Executive Summary
The CPCA should embrace the full range of economic and business opportunities arising from the transition to net zero. It should encourage and support the development by stakeholders of a bold vision for what the CPCA area economy should strive towards by 2030 and 2050 to meet climate goals, and communicate this vision. This vision should: Include the development of emission pathways for the key industrial sectors within the area (where they are not well covered by sectoral pathways developed at national level). This will require additional data collection, since regional emissions by industry sector are not readily available; be underpinned by actions, including a prominent convening role, communication of the vision, aligned local planning and funding, public procurement and measurement of progress through development and tracking of KPIs; be co-developed with industry, led by the Business Board, in an inclusive fashion, bringing together stakeholders across the whole region, sectors, business types and sizes, and including commitment to the measurement and reporting of emissions.
Develop a green skills and innovation strategy: the forthcoming regional skills strategy should have a strong green “core” – every future job must be a green job. The strategy should be informed by a quanti�ed assessment of what the measures required for a net zero transition mean for skills requirements in the region. The strategy should: link skills to projected measures required for net zero (such as EV penetration, buildings energy e�ciency retro�ts, and sustainable agriculture practices) as well as taking into account wider demands (e.g. green literacy, project management, entrepreneurship) for all businesses to be green be informed by (and kept updated by) a business forward-look (over the next 5 -10 years) of net-zero skills demands, to which training providers can respond link research and innovation strengths (in areas such as IT, AI, robotics, sensors, materials, agriculture, low carbon buildings, zero carbon energy etc) to the green future in all regional areas of economic strength (such as agriculture, logistics and construction) identify innovation opportunities across all three of the region’s economies and ensure that networking, expertise, leadership, policy clarity and funding are in place to link research, solutions and skills to opportunities and needs to grow new businesses and jobs; look at developing links between sectors through networking and other initiatives to catalyse cross-fertilization between sectors and technologies to deliver decarbonisation aim to attract green demonstrations to the region, through partnerships, �nancing and local procurement options; encourage the inclusion of net zero into all parts of education system, starting with primary and secondary schools, ensuring it is embedded in the curriculum and in school careers advisory services.
Recommendations
BUSINESS AND INDUSTRY
1.
2.
25
Cambridgeshire & Peterborough Independent Commission on Climate Executive Summary
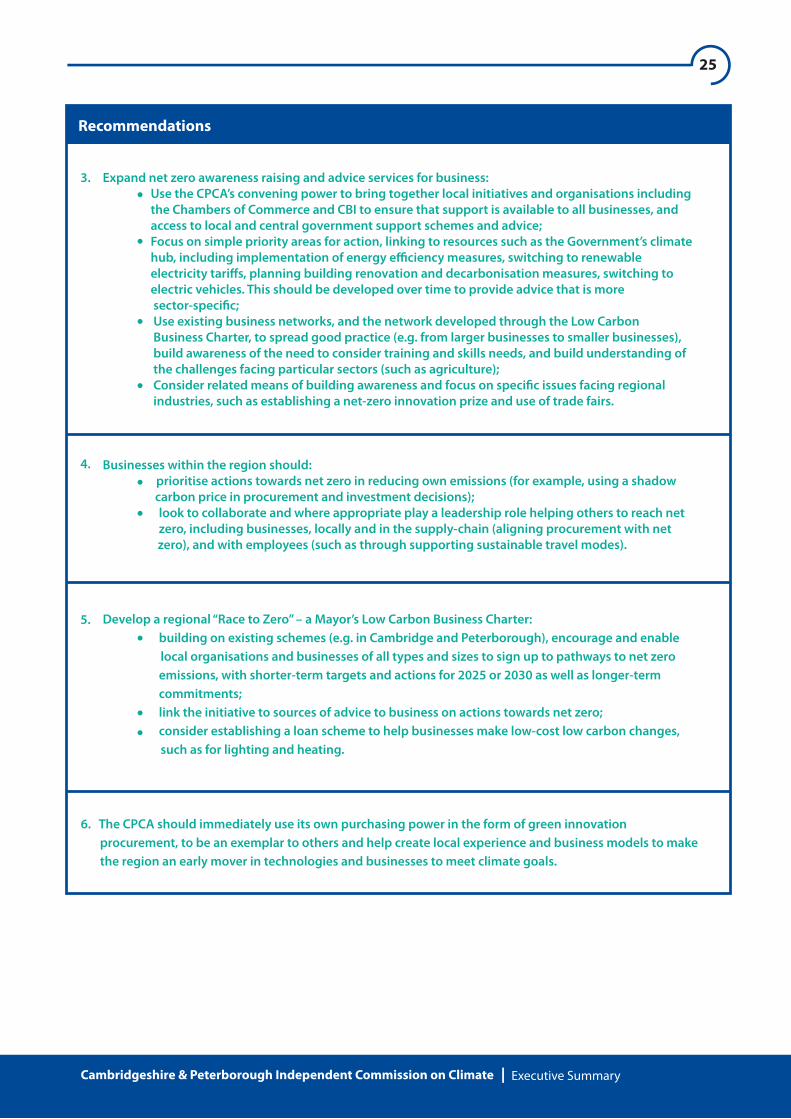
Expand net zero awareness raising and advice services for business: Use the CPCA’s convening power to bring together local initiatives and organisations including the Chambers of Commerce and CBI to ensure that support is available to all businesses, and access to local and central government support schemes and advice; Focus on simple priority areas for action, linking to resources such as the Government’s climate hub, including implementation of energy e�ciency measures, switching to renewable electricity tari�s, planning building renovation and decarbonisation measures, switching to electric vehicles. This should be developed over time to provide advice that is more sector-speci�c; Use existing business networks, and the network developed through the Low Carbon Business Charter, to spread good practice (e.g. from larger businesses to smaller businesses), build awareness of the need to consider training and skills needs, and build understanding of the challenges facing particular sectors (such as agriculture); Consider related means of building awareness and focus on speci�c issues facing regional industries, such as establishing a net-zero innovation prize and use of trade fairs.
Businesses within the region should: prioritise actions towards net zero in reducing own emissions (for example, using a shadow carbon price in procurement and investment decisions); look to collaborate and where appropriate play a leadership role helping others to reach net zero, including businesses, locally and in the supply-chain (aligning procurement with net zero), and with employees (such as through supporting sustainable travel modes).
Develop a regional “Race to Zero” – a Mayor’s Low Carbon Business Charter: building on existing schemes (e.g. in Cambridge and Peterborough), encourage and enable local organisations and businesses of all types and sizes to sign up to pathways to net zero emissions, with shorter-term targets and actions for 2025 or 2030 as well as longer-term commitments; link the initiative to sources of advice to business on actions towards net zero; consider establishing a loan scheme to help businesses make low-cost low carbon changes, such as for lighting and heating.
6. The CPCA should immediately use its own purchasing power in the form of green innovation procurement, to be an exemplar to others and help create local experience and business models to make the region an early mover in technologies and businesses to meet climate goals.
Recommendations
3.
4.
5.

26
Cambridgeshire & Peterborough Independent Commission on Climate Executive Summary
Recommendations
ADAPTATION
through the establishment of a multi-million pound ‘Doubling Nature Fund’ that can operate a portfolio of funding models to �nance habitat creation and nature recovery across public, private and third sector investment
through the development of a high-level spatial and landscape framework that ensures we create su�cient space for environmental recovery and integrated water management across the CPCA area, planning for future environmental gains that allow for large-scale natural capital solutions to help with the adaptation agenda
the introduction of transition measures for landowners and farmers to avoid delays ahead of the roll out of Environmental Land Management Schemes
to consider the case for adopting biodiversity net gain targets that are higher than the proposed mandatory minimum, recognising that the area is one of the most nature depleted in the country and therefore needs to kick-start its recovery faster than other areas
creating and fostering community-led nature recovery programmes in both rural and urban areas, that help communities adapt to climate change and particularly the local impact of severe weather events
1.
2.
3.
4.
5.
The CPCA should work with partners to signi�cantly accelerate the delivery of the doubling nature ambition, recognising the contributions that large-scale nature recovery can make to climate change adaptation, including
Encourage place-based approaches to climate change adaptation such as the joint Anglian Water, Environment Agency and Water Resources East ‘Future Fens’ initiative
Call on government to support new land management/farming techniques
Call on government to reform the Water Industry National Environment Programme, and broadening the Peatland and Woodland Codes to bring in sequestration opportunities within wetlands, inter-tidal habitat and minera soils
Local Resilience Forum to undertake a regular review of risks of interconnected / cascade failures as a result of climate incidents and develop mitigation plan as a response. To review climate risks to public buildings and public spaces.

27
Cambridgeshire & Peterborough Independent Commission on Climate Executive Summary
Recommendations
6. Consider demonstration projects for public and commercial premises, linked where possible to nature-based solutions e.g. building shading and adjacent surfaces, green roofs/walls, porous surface drainage and local green space. Prioritise at-risk locations when considering building retro�t programmes.
CPCA and partners to address the lack of public awareness and preparedness of extreme heat and water events including:
Building awareness of need for property-level resilience measures. Local public engagement campaign(s) that link climate impacts to nature, river health and need for water conservation and carbon sequestration Promote the actions that can be taken individually to help people and communities prepare Clarifying responsibilities of di�erent parties / property owners Explore the potential for grant-based scheme to increase action.
7.

28
Cambridgeshire & Peterborough Independent Commission on Climate Executive Summary
Develop a local area energy plan, in close collaboration with interested stakeholders, including distribution companies, consumers and large energy users.
To the extent than there is interest in options for hydrogen production within CPCA, prioritise consideration of potential for hydrogen production from surplus generation.
Urgently develop and make proposals on distribution network investment ahead of need. (Note: Ofgem issued business plan guidance in April)
Urgently provide clarity on revised arrangements for network access (connection charges) which enable local decarbonisation projects. (Note: Ofgem consulted on “minded to” positions in June)
Advise areas on where hydrogen is likely to be available in the gas grid as soon as possible.
Look to streamline, simplify and provide longer-term horizons for schemes funding local energy projects.
Recommendations
1.
2.
3.
4.
ENERGY
5.
6.
For CPCA and constituent authorities:
For Ofgem:
For Government:
The CPCA should establish and provide funding, estimated of the order of £50,000 a year, to support the operation of a CPICC Fenland Peat Committee, initially for a period of 5 years, with a remit to inform and develop ‘whole farm’ land use policies aimed at achieving climate change mitigation, adaptation and biodiversity enhancement in the Fens, and to help establish an agreed set of numbers for GHG emissions for deep, shallow and wasted peat soils.
Up-front funding should come from CPCA, and also be sought from Defra, NERC and other sources, to support the work of the Fenland Peat Committee but also more widely, for: -On the ground research to �ll in the current gaps in the scienti�c evidence -Development of best practice guidance -Provision of farming advisers to support farmers in the transition.
Cambridgeshire County Council and Peterborough City Council should work to develop the role of County farms as leaders and exemplars in the transition.
The CPCA should establish a process to consult on and develop a vision and strategy which takes account of economic impact and goes beyond the single issue of peat emissions, taking a leadership role at the forefront of national action. This will need strong enagement with local communities, particularly farming.
Recommendations
1.
2.
3.
4.
PEAT

29
Cambridgeshire & Peterborough Independent Commission on Climate Executive Summary
The waste management strategy for the area is out-of-date and should be revisited as a matter of urgency. Plans should include the development, by June 2022, of a communication programme with the public for waste reduction, waste separation and recycling, building on existing activities.
The CPCA, Cambridgeshire County Council and Peterborough City Council, should collect data to enable the annual estimation and publication of estimates of emissions from waste collection and disposal services.
The Government should provide clarity as soon as possible on the provision of resources to local authorities to deliver changes required by the Environment Bill, including help with dealing with contractual revisions.
Roll-out of zero carbon collection vehicles should start in urban areas, as existing vehicles need replace-ment, aiming for full replacement by 2030. This will be aided by Government development of a national framework for the procurement of zero carbon collection vehicles, providing information on suppliers who can meet requirements (in the same way it currently has such a framework for diesel vehicles).
There should be a target, across the CPCA area, for at least a 37% reduction in residual waste by 2030. Reduction in the amount of waste should also be supported by: encouragement of the replication of good practice examples of re-use and repair activities across the area; measures to encourage repair cafes should be considered. separate food waste collection: preparations should continue with a view to introduction as soon as possible. use of procurement contracts by the CPCA and constituent authorities to specify stringent waste reduction and recycling targets of any local authority funded building work; the use of planning powers should be explored, to pursue these waste objectives in respect of building work more generally. development of procurement policies to exclude single-use plastics, reduce excess packaging and specify recycled content.
Recommendations
1.
2.
3.
4.
WASTEOverarching
5.
Reduction and re-use
30
Cambridgeshire & Peterborough Independent Commission on Climate Executive Summary
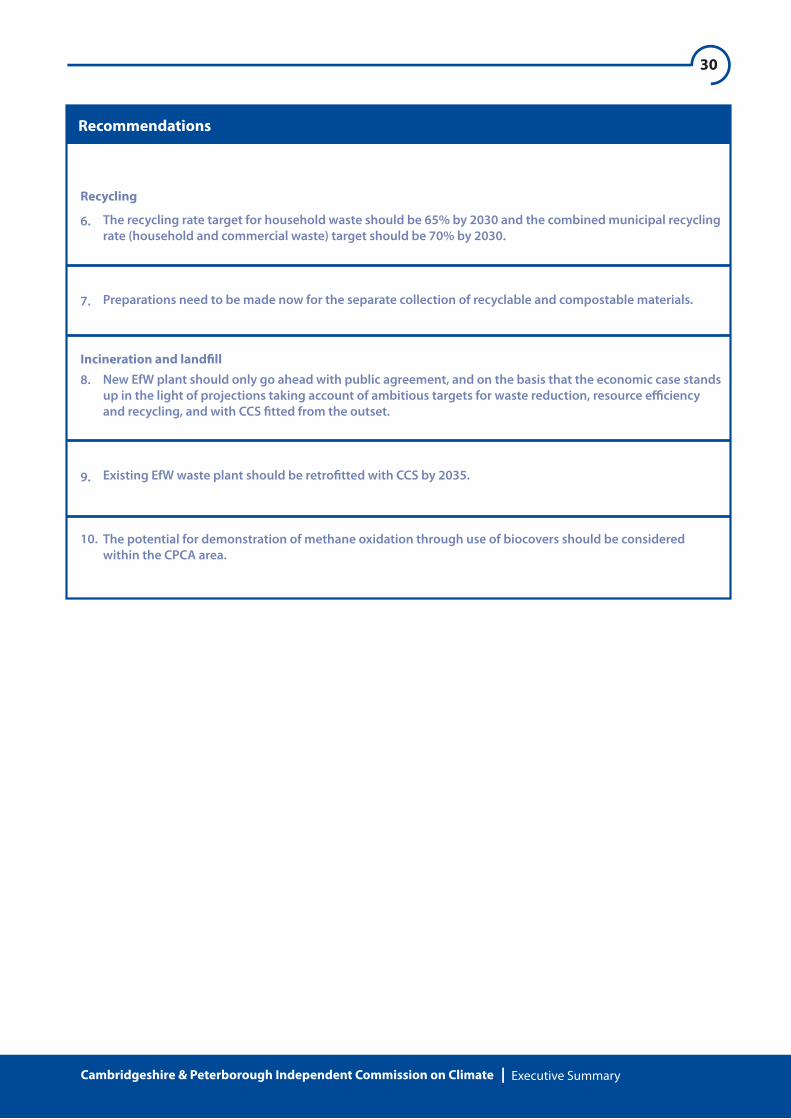
The recycling rate target for household waste should be 65% by 2030 and the combined municipal recycling rate (household and commercial waste) target should be 70% by 2030.
Preparations need to be made now for the separate collection of recyclable and compostable materials.
New EfW plant should only go ahead with public agreement, and on the basis that the economic case stands up in the light of projections taking account of ambitious targets for waste reduction, resource e�ciency and recycling, and with CCS �tted from the outset.
Existing EfW waste plant should be retro�tted with CCS by 2035.
The potential for demonstration of methane oxidation through use of biocovers should be considered within the CPCA area.
Recommendations
6.
7.
8.
9.
Recycling
10.
Incineration and land�ll
Cambridgeshire & Peterborough Independent Commission on Climate Contents
Executive Summary
Chapter 1 Overview
Chapter 2 Overarching
Chapter 3 A Just Transition
Chapter 4 Transport
Chapter 5 Buildings
Chapter 6 Business andIndustry
Chapter 7 Adaptation,Nature and Water
Chapter 8 Energy
Chapter 9 Peat
Chapter 10 Waste
8.32.48.65.87.
114.144.176.
Contents
31
192.198.215.
32
Cambridgeshire & Peterborough Independent Commission on Climate Overview
Overview
Greenhouse gas emissions in the Combined Authority region are high. We estimated, in our March report based on 2018 data, that emissions in the Cambridgeshire and Peterborough Combined Authority (CPCA) area were approximately 25% higher per person than the UK average. Taking out the e�ect of de�nitional changes to the inventory, the most recently available data, for 2019, con�rms that assessment.
At this level of emissions, we have only about 6 years remaining before we will have exhausted all of our 'allowed' share of emissions to 2050, if we are to play an equal part in delivering the UK's critical Net Zero target.
Urgent action is needed - well before the six years is up. We need action both to get us on track to reducing emissions in line with UK targets and to prepare for the impacts of climate change, which will be signi�cant even if we are on track globally for the Paris Agreement ambition of keeping close to 1.5 degrees C and well below 2 degrees C of warming by the end of the century. If we cannot deliver this ambition, the impacts of climate change become much more severe.
Of the 7 constituent authorities making up the Cambridgeshire and Peterborough Combined Authority (CPCA), (Figure 1.1), 5 have declared Climate Emergencies (Cambridgeshire County Council, Cambridge City Council, Peterborough City Council, South Cambridgeshire District Council and East Cambridgeshire District Council). Most are working towards net zero emissions by 2050, though with sub-targets along the way. Peterborough City Council has gone furthest in ambition – aiming for its own activities to be net zero by 2030, and to help Peterborough become a net zero city by 2030. All, whether or not they have declared a Climate Emergency, are working to reduce emissions.
The CPCA has committed to reaching net zero emissions across the area by 2050. Key to achieving this, and to preparing for the impacts of climate change, will be to put in place and follow through on a set of actions across the economy, and to communicate and in�uence others to change behaviour and take action.
The CPCA set up the Cambridgeshire and Peterborough Independent Commission on Climate (CPICC) to advise on these issues, speci�cally to:
1 Full Commission terms of reference available at http://cambridgeshirepeterborough-ca-gov-uk-6985942.hs-sites.com/cpicc-who-we-are
“provide independent advice to business and the public sector in the area of setting and meeting carbon reduction targets for Cambridgeshire and Peterborough and preparing for climate change, and to make recommendations”.1
We provided a �rst report towards meeting that remit, with a preliminary set of recommendations, in March 2021.
In that report we concentrated our e�orts on particular sources of emissions, which are a priority for the area – transport, buildings and peatlands, and we included some recommendations on the energy system because of the critical role it plays in the decarbonisation of both heat and transport. We also drew out for the Combined Authority and constituent authorities a series of recommendations of a cross-cutting nature.
In June 2021 the Board of the Combined Authority voted to act on all recommendations. In this report, we add assessments and recommendations related to emissions from business and industry (Chapter 6), and waste (Chapter 10). We also look in more detail at issues connected to adaptation, nature and water (Chapter 7).
Introduction

33
Cambridgeshire & Peterborough Independent Commission on Climate Overview
Figure 1.1 Cambridgeshire and Peterborough Combined Authority (CPCA)
- the climate risks facing the region;
- the sources of emissions in CPCA;
- the role of local authorities;
- our approach;
- the public engagement that has informed our work.
In many ways, however, the most substantive addition re�ects the engagement activities we have pursued in recent months with people in the region.
As part of our e�orts to engage before our March report we launched an on-line survey, to which we had an excellent response (section below). But we were keen to take this further, in particular to explore what a just transition would look like for residents of the area. We engaged with a panel of Cambridgeshire fens residents, and with civil society groups from across Cambridgeshire and Peterborough.
The results of those deliberations and consultations are presented in Chapter 3, A Just Transition (with sector-speci�c outputs picked up in sector chapters). They also feed through to further recommendations that we make to help take through climate actions in the area, in ways that are fair and maintain community engagement.
In this chapter we set out in 5 sections the background to the climate change risks facing the region and the approach to the analysis which is set out more fully in later chapters:
34
Cambridgeshire & Peterborough Independent Commission on Climate Overview
Even with ambitious global action to reduce emissions and keep global temperature rise to 1.5-2°C above pre-industrial levels, further climate change is inevitable, with impacts for the UK. Without more concerted actions, global temperature could rise by 3°C or more, with more extreme impacts. Water demands, for example, will increasingly exceed available resource (Figure 1.3).
Climate change will be felt di�erently in di�erent countries, but also in di�erent parts of each country. In the UK we cannot assume that climate hazards are an issue only for others overseas. The nature and scale of the risks, even if we are on a global path to no more than 1.5°C of warming by the end of the century, indicate considerable impacts that will be experienced by local people. Climate change is having impacts today, and will have growing impacts in future (Box 1.1).
We commissioned work from Cambridge Zero, Cambridge University for this report,2 to assess what kind of impacts we can expect in the Cambridgeshire and Peterborough area. This is a preliminary assessment, but it highlights key impacts and risks if actions are not taken globally to reduce emissions. Overall, it �nds that many of the risks to the UK identi�ed in the most recent UK Climate Change Risk Assessment3 apply also to the region – risks to the natural environment, to infrastructure, to people and the built environment, to business and industry. But there are certain of these risks that are likely to be particularly severe in our region – from �ooding, overheating in the summer months, water shortages, and damage to natural carbon stores in the deep peat of the Fens (Box 1.2).
It is clear that we need to take local actions to prepare for further impacts, and also to play our part in reducing emissions and preventing the most severe impacts that would otherwise occur.
In Chapter 7 we look further at these risks and also consider what they imply for the adequacy of current adaptation plans across the region, and the need for further adaptation measures.
2 CZ (2021, Aines, E.D., Simpson, C., Munro-Faure, A., Shuckburgh, E., Preliminary report on climate risk in the Cambridgeshire and Peterborough region, 2020-2099, Cambridge Zero, University of Cambridge.
3 CCRA (2017), UK Climate Change Risk Assessment 2017.
The climate risks facing the region
The UK climate is changing. Average annual temperature is over 1°C higher today than in the pre-industrial period. Hottest daytime temperature has been rising (Figure 1.2).The chances of experiencing a hot summer like that in 2018 have doubled in recent decades and are now around 10-20% a year. A 2018 summer will be typical by 2050.

35
Cambridgeshire & Peterborough Independent Commission on Climate Overview
Source: Christidis et al, Nature Communications (2020)
Trend (oC decade-1)
Figure 1.2: Increase in hottest daytime temperatures, 1960 - 2019
Source: HR Wallingford (2015), Updated projections of water availability in the UK, for the Adaptation sub-Committee of the CCC.
o: non-signi�cant trends
Figure 1.3: Projected water abstraction demand as % of available resource, 2080s
Notes: For a 3.5°C, low population growth, high adaptation scenario.Further measures, such as more ambitious demand reductions for households and industry, and water resource management planning will be required to deal with increased risks of shortages.
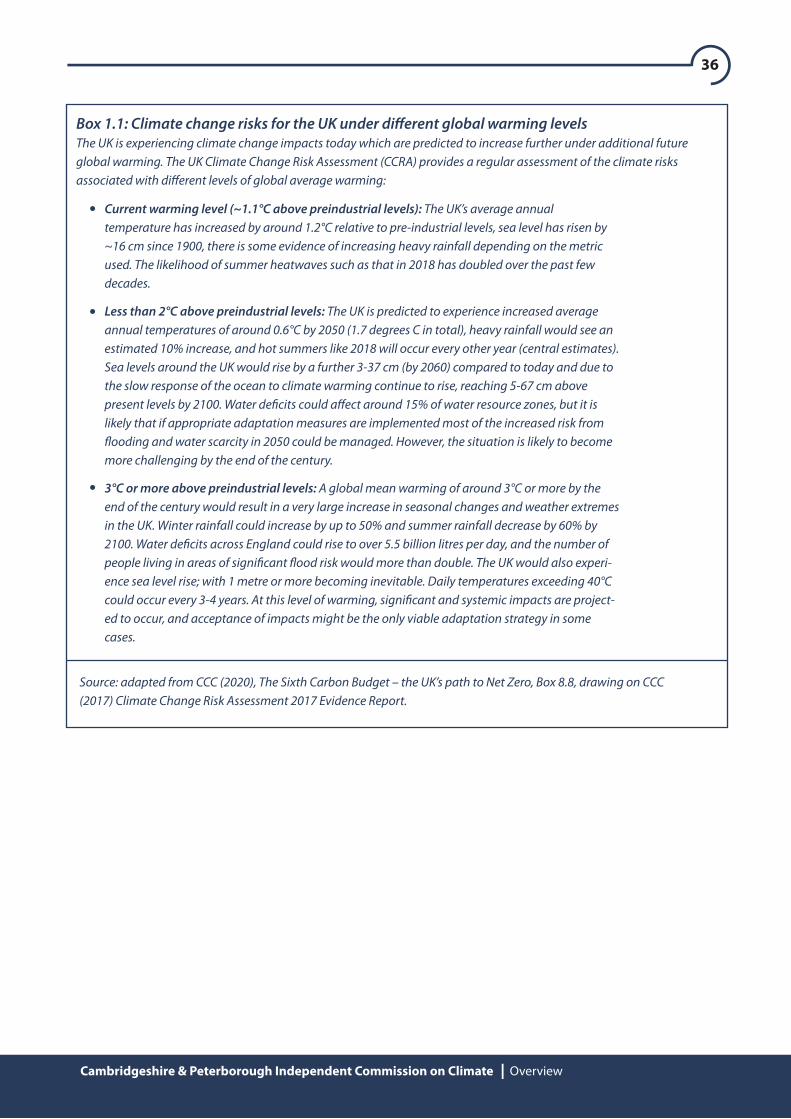
36
Cambridgeshire & Peterborough Independent Commission on Climate Overview
Box 1.1: Climate change risks for the UK under di�erent global warming levelsThe UK is experiencing climate change impacts today which are predicted to increase further under additional future global warming. The UK Climate Change Risk Assessment (CCRA) provides a regular assessment of the climate risks associated with di�erent levels of global average warming:
Current warming level (~1.1°C above preindustrial levels): The UK’s average annual temperature has increased by around 1.2°C relative to pre-industrial levels, sea level has risen by ~16 cm since 1900, there is some evidence of increasing heavy rainfall depending on the metric used. The likelihood of summer heatwaves such as that in 2018 has doubled over the past few decades.
Less than 2°C above preindustrial levels: The UK is predicted to experience increased average annual temperatures of around 0.6°C by 2050 (1.7 degrees C in total), heavy rainfall would see an estimated 10% increase, and hot summers like 2018 will occur every other year (central estimates). Sea levels around the UK would rise by a further 3-37 cm (by 2060) compared to today and due to the slow response of the ocean to climate warming continue to rise, reaching 5-67 cm above present levels by 2100. Water de�cits could a�ect around 15% of water resource zones, but it is likely that if appropriate adaptation measures are implemented most of the increased risk from �ooding and water scarcity in 2050 could be managed. However, the situation is likely to become more challenging by the end of the century.
3°C or more above preindustrial levels: A global mean warming of around 3°C or more by the end of the century would result in a very large increase in seasonal changes and weather extremes in the UK. Winter rainfall could increase by up to 50% and summer rainfall decrease by 60% by 2100. Water de�cits across England could rise to over 5.5 billion litres per day, and the number of people living in areas of signi�cant �ood risk would more than double. The UK would also experi-ence sea level rise; with 1 metre or more becoming inevitable. Daily temperatures exceeding 40°C could occur every 3-4 years. At this level of warming, signi�cant and systemic impacts are project-ed to occur, and acceptance of impacts might be the only viable adaptation strategy in some cases.
Source: adapted from CCC (2020), The Sixth Carbon Budget – the UK’s path to Net Zero, Box 8.8, drawing on CCC (2017) Climate Change Risk Assessment 2017 Evidence Report.

37
Cambridgeshire & Peterborough Independent Commission on Climate Overview
Maximum temperature across the region over the summer is likely to be above 36°C in 1 year out of 20 by mid-century. Temperatures in some locations will be higher than average: for example, in the record-breaking summer of 2019 when the Cambridge Botanical Gardens weather station recorded a temperature of 38.7°C, the maximum temperature averaged across the region was 34°C. Furthermore, there is uncertainty associated with these projections, and real temperatures may be signi�cantly higher.
Summers are likely to be drier and winters milder, with potential to be much wetter. In general, rainfall will be lower from May to September, but higher and more intense from November to March.
Box 1.2: Climate change risks facing the Cambridgeshire and Peterborough region
Of 53 national risks identi�ed by CCRA (2017) – to the natural environment, to infrastructure, to people and the built environment, and to business and industry – at least 42 are likely to be experienced locally.
Over the period to the end of the century, the most severe risks facing the region will relate to more extreme summer temperatures and changes on the character of seasonal and annual precipitation.
Changes to the climate
Even under a stringent emission reduction pathway (RCP 2.6), likely to keep global temperature rise below 2°C by 2100:
These changes would be greater in higher emission pathways.
What does this mean for risks?
By the end of the century, based on current locations and not allowing for future development, nearly 1 in 10 homes and 1 in 4 agricultural and industrial production facilities could face river �ooding. Communities, farms and industry in the areas of Wisbech, Whittlesey, Huntingdon, St Ives and the eastern edge of Peterborough face the highest risk (Figure B1.2).
With an increase in short periods of intense rainfall, surface water �ooding from runo� in urban and paved areas is also likely to impact a signi�cantly higher proportion of the built environment.
The region may face tidal �ooding from storm surges, particularly at high tide if the Ouse and/or Nene rivers are already in �ood.
Risks to the health of the population from overheating in buildings, in the summer months in particular, will increase.
Hotter and drier summers will increase the stress on water resources, impacting people, farming, industry, biodiversity and the quality of the natural environment.
Lowland peat may degrade more quickly with warmer, drier summers. This would add to emissions and reduce the sustainability of some areas for agricultural use.

38
Cambridgeshire & Peterborough Independent Commission on Climate Overview
Heat-map detailing 1-in-100 (1% annual chance) and 1-in-1000 (0.1% annual chance) risk of �ooding for the Cambridgeshire & Peterborough region. Warmer colours indicate greater density of buildings with exposure to �ood risk. End of century �ood risk has been represented without recourse to further adaptation. Contains Ordnance Survey data ©Crown Copyright and database right 2020 (Digimap License). Contains public sector information licensed under the Open Government Licence v3.0 (Flood Map for Planning (Rivers and Sea) – Flood Zone 2 & Flood Zone 3 Nov. 2020) ©Environment Agency copyright and/or database right 2020. All rights reserved.
Source: CZ (2021), Aines, E.D., Simpson, C., Munro-Faure, A., Shuckburgh, E., Preliminary report on climate change in the Cambridgeshire & Peterborough region, 2020-2099, Cambridge Zero, University of Cambridge.
Figure B1.2: Flood risk Cambridgeshire and Peterborough, today and 2100
Notes: Representative Concentration Pathways (RCP) are pathways adopted by the Intergovernmental Panel on Climate change (IPCC) which describe possible climate futures based on di�erent future atmospheric greenhouse gas concentrations.
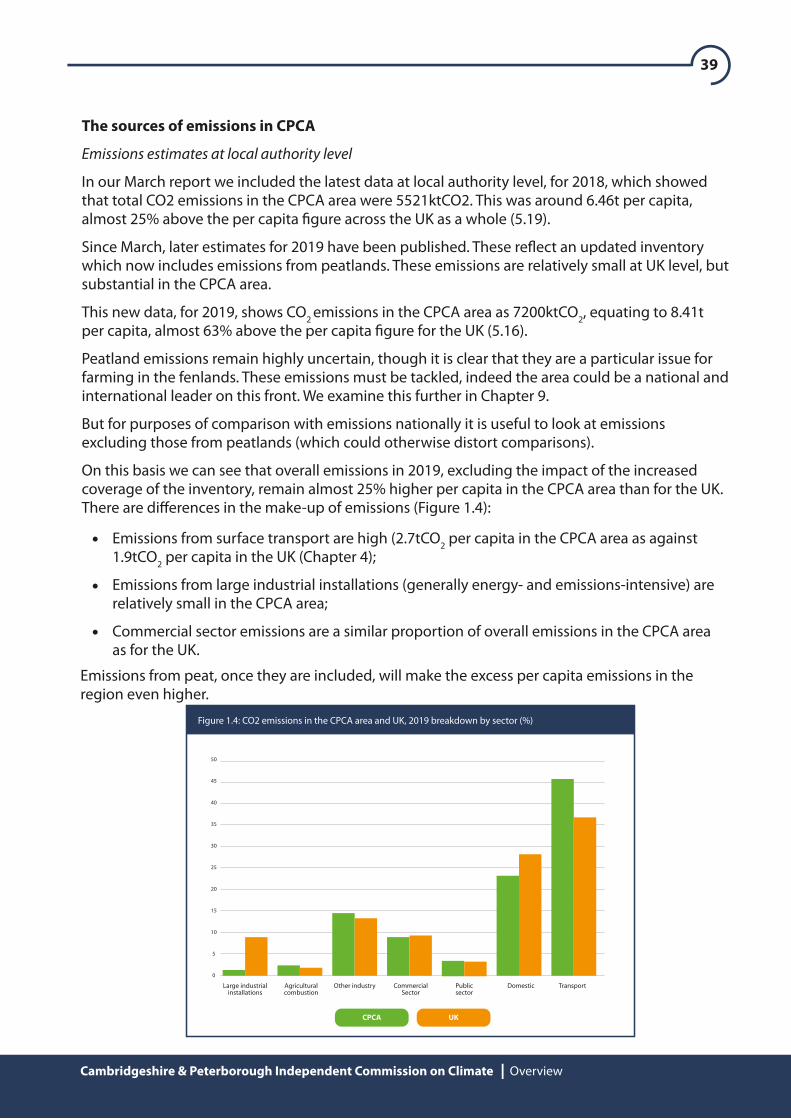
39
Cambridgeshire & Peterborough Independent Commission on Climate Overview
The sources of emissions in CPCA
Emissions estimates at local authority level
In our March report we included the latest data at local authority level, for 2018, which showed that total CO2 emissions in the CPCA area were 5521ktCO2. This was around 6.46t per capita, almost 25% above the per capita �gure across the UK as a whole (5.19).
Since March, later estimates for 2019 have been published. These re�ect an updated inventory which now includes emissions from peatlands. These emissions are relatively small at UK level, but substantial in the CPCA area.
This new data, for 2019, shows CO2 emissions in the CPCA area as 7200ktCO2, equating to 8.41t per capita, almost 63% above the per capita �gure for the UK (5.16).
Peatland emissions remain highly uncertain, though it is clear that they are a particular issue for farming in the fenlands. These emissions must be tackled, indeed the area could be a national and international leader on this front. We examine this further in Chapter 9.
But for purposes of comparison with emissions nationally it is useful to look at emissions excluding those from peatlands (which could otherwise distort comparisons).
On this basis we can see that overall emissions in 2019, excluding the impact of the increased coverage of the inventory, remain almost 25% higher per capita in the CPCA area than for the UK. There are di�erences in the make-up of emissions (Figure 1.4):
Emissions from surface transport are high (2.7tCO2 per capita in the CPCA area as against 1.9tCO2 per capita in the UK (Chapter 4);
Emissions from large industrial installations (generally energy- and emissions-intensive) are relatively small in the CPCA area;
Commercial sector emissions are a similar proportion of overall emissions in the CPCA area as for the UK.
50
45
40
35
30
25
20
15
10
5
0
CPCA UK
Figure 1.4: CO2 emissions in the CPCA area and UK, 2019 breakdown by sector (%)
Large industrialinstallations
Agriculturalcombustion
Other industry Domestic TransportCommercialSector
Publicsector
Emissions from peat, once they are included, will make the excess per capita emissions in the region even higher.

40
Cambridgeshire & Peterborough Independent Commission on Climate Overview
Signi�cance of exclusions for CPCA
The exclusion of emissions from peatlands has been addressed in the 2019 inventory, though these emissions remain uncertain.
UK greenhouse gas emissions, 2018451.5 MtCO2e
UK IAS emissions, 201844.6 MtCO2e
CO2 emissions365.7 MtCO2
Other GGEs85.7 MtCO2e
CO2 emissions estimated at localauthority level, UK
344.8 MtCO2
CO2 emissions not estimatedat local authority level
20.8 MtCO2
CPCA area CO2 emissions5.521 MtCO2
Rest of UK CO2emissions estimated
at local authority level339.3 MtCO2
Figure 1.5: CPCA emissions of CO2, 2018, and relationship to national emissions
Other signi�cant issues for CPCA relate to non-CO2 emissions:
Agriculture accounts for around 46% of non-CO2 emissions at UK level. Most of this is for livestock, which is probably a relatively small share of agricultural emissions in CPCA. But almost one third re�ects N2O emissions from use of fertilisers and is likely to be signi�cant in CPCA;
Not all emissions at national level are estimated at local level (Figure 1.5). Principal exclusions (2018) from the local dataset are:
CO2 emissions from domestic shipping, domestic aviation and military transport. Overall, alongside a few small methodological di�erences, this means that around 6% of UK CO2 emissions are not allocated to local areas;
CO2 emissions from international aviation and shipping (44.6MtCO2e) are reported as a memo item to the UNFCCC, but excluded from these �gures;
Non-CO2 greenhouse gases are not broken down to local authority level. These totalled 85.7MtCO2e in 2018, 19.0% of total UK emissions.
Exclusions from the local dataset

41
Cambridgeshire & Peterborough Independent Commission on Climate Overview
Waste management is responsible for around 24% of non-CO2 emissions nationally, and likely to be signi�cant in CPCA.
There will be scope to in�uence these emissions through local actions.
Consumption emissions
Our assessment is largely on the basis of emissions estimates on a “production” basis – that is emissions that occur within the region. This is the basis of available data and consistent with the approach to emissions accounting internationally.
There are other ways that emissions can be looked at – that is to give responsibility for emissions caused during the production of goods and services, wherever they occur, to the �nal consumer – in this case to consumers within CPCA. On this basis, for example, emissions in the generation of electricity brought into the region for consumption, or the production of manufactured goods such as cars, would be assigned to CPCA. Estimation of emissions on this basis is more di�cult, and we have not attempted it here. The ability of CPCA and constituent authorities to in�uence these emissions from production elsewhere is likely to be much reduced compared to emissions within CPCA. This is not to say that this is not an important area for further exploration, particularly where there are things that local consumers may wish to do to alter consumption habits with potential to reduce emissions – buying locally made products for example.
The role of local authorities
Much of the emission reduction achieved in the UK to date has been through central Government policy, working through a relatively small number of actors. This has been the case, for example, with the continuing switch away from fossil fuels towards renewables for the generation of electricity.
Increasingly, however, emissions reduction will need to be achieved from the decisions and actions of a range of people, communities, civil society actors and businesses. The CCC estimates that almost 60% of required emissions cuts now depend on decisions taken at local and individual level.
Local authorities have direct control – through their operations and buildings – of only a small proportion of emissions in their area, typically a few percent. As trusted sources of information and advice, however, through their control of local planning and other policies, and their powers to borrow and raise income, they have in�uence on much more.
The layers of local authority in�uence and control are described and illustrated in the CCC’s recent sixth carbon budget advice (Box 1.3). These powers of place-shaping, engagement and bringing people together will be crucial to decisions on how we decarbonise our buildings (through energy e�ciency and low-carbon heat), how we travel and provide infrastructure for electri�cation of transport. Indeed, local authorities have a wide range of functions (over 700), many of which are set out by law. These are split depending on type of council or the Combined Authority.

42
Cambridgeshire & Peterborough Independent Commission on Climate Overview
Box 1.3: Local authority control and in�uence over emissions and preparing for a changingclimate
an overarching role to support the economic, health and social wellbeing of communities;
planning powers over buildings and transport;
enforcement of building regulations;
powers to ensure that buildings meet basic energy e�ciency standards;
duties to prevent homelessness and prevent hazards in housing;
duties to manage risks including climate change risks such as �ooding;
duties and powers to protect the environment, wildlife and heritage;
duties to collect and dispose of waste;
borrowing and investment powers.
Source: CCC (2020), Local Authorities and the Sixth Carbon Budget.
Figure B1.3: How local authorities control and in�uence emissions
Key local authority powers and duties relate to:

43
Cambridgeshire & Peterborough Independent Commission on Climate Overview
Our approach
The focus of our work is to consider the actions that need to be taken to reduce emissions and to prepare for the impacts of climate change. But in taking this forward we have from the outset recognised both that this is a systems problem with many interacting parts, and the need to incorporate wider social and environmental issues in our work, and consider how we can improve the lives of our communities through climate action.4 There are particular challenges attached to recovery from COVID-19, but these issues – of biodiversity loss, economic opportunity, health and inequality – are long-standing. Unless we take account of the requirement for a “just transition”, our climate recommendations are unlikely to gain the acceptance they need to succeed.
Our thinking is illustrated (Figure 1.6) by consideration of a range of factors which can be positively impacted by measures to reduce emissions and improve resilience:
4 Indeed, it is included in our terms of reference that we should “take account of a long-term vision of sustainable development. [Its] recommendations will therefore consider the interrelated impacts on society, the economy, and the natural environment (including water and soils). It will examine how existing inequalities can be reduced, and assess whether its recommendations have di�erential impacts”.
Clean and plentiful water: by managing our water systems in a more sustainable way that recognises the need to adapt to the changing climate we can continue to supply clean and plentiful water in the region;
Clean energy: by changing the way we heat our homes and power our transport, as well as generate electricity, so that this is done from renewable and zero carbon sources, we can reduce greenhouse gas emissions, improve air quality and reduce dependence on imported fossil fuels;
In some cases di�erent types of authorities can undertake similar things (for example looking after street lights), or might own and manage similar sites (for example recreational space or car parks). These functions are funded through a mix of Council Tax, government grants and income raised.
The Cambridgeshire and Peterborough Combined Authority is made up of eight partners (the seven councils and the Business Board), along with the directed elected Mayor of the Combined Authority. Through the Combined Authority Cambridgeshire and Peterborough is receiving additional funding to deliver new a�ordable, rented and shared-ownership homes over a �ve-year period, plus infrastructure funding over 30 years to boost growth in the region, and annual funding to support adult skills training. The CPCA is the Transport Authority (setting strategic transport policy and a multi-year transport budget). It is also the accountable body for the Business Board, which provides a business perspective and manages government funds to support economic growth.
Cambridgeshire County Council and Peterborough City Council have key responsibilities for social care, public health, highways, schools, libraries, waste management, and �ood risk plans.
The District Councils (including Peterborough) have key responsibilities for planning, housing, environmental health, leisure, and waste collection. Some areas might also have a Parish/Town Council who look after a range of local matters, including community buildings, allotments, some street lights, bus shelters (they can also receive a proportion of the Council Tax).
There are a range of other public or regulated organisations that also have a great in�uence on our area. These include Highways England (motorways and major highways), the rail industry, the NHS, the energy and water companies, and standards setting bodies.

44
Cambridgeshire & Peterborough Independent Commission on Climate Overview
Clean air: through switching away from fossil fuels for our cars and vans and reducing the demand for car and van use, and reducing fossil fuel use for heating buildings, we can signi�cantly reduce air pollution in our region, with bene�ts for health, including reduced asthma in children;
Healthy food: supporting farming to produce lower emission foods, such as fruits and vegetables, that are grown locally will help ensure availability and a�ordability of healthy foods, whilst reducing food miles and associated emissions .
Safe and comfortable homes: aside from reducing energy bills, improving the thermal e�ciency of our homes and buildings can reduce overheating and indoor air quality issues that lead to risks of heat and cold related illness and deaths. Making sure our homes are prepared for increased risks of extreme weather and impacts of �ooding will help keep our communities safe;
Skills, jobs and growth: investing in climate-friendly technology, revamping old and high-emitting infrastructure and greening our communities, will create opportunities for skills, training and employment to people living, working and studying in our region;
Clean, integrated transport: investing in high quality low carbon public transport that connects people to services, jobs and opportunities, will improve prosperity and well-being. Making active transport, including cycling and walking, more accessible will help to improve health and reduce risks of cardiovascular disease, obesity and diabetes;
Inclusive and resilient communities: by improving air quality, ensuring provision of low-cost renewables and healthy food, providing access to green spaces and better public transport, improving the safety and comfort of our homes, and linking to transport infrastructure, we can create more inclusive and resilient communities, and contribute to a reduction in regional inequalities;
Physical and mental health: many of the measures we take can improve our physical and mental health. Improved air quality reduces coronary heart disease, strokes, asthma and lung cancer; green spaces are increasingly appreciated for their health bene�ts (physical and mental); there is evidence that active travel can reduce type 2 diabetes, dementia, heart disease and cancer;
Thriving nature, growing greenspaces: investing in nature, including increasing biodiversity and green space, will help reduce heat in our urban areas, provide shade to our buildings, reduce risks of �ooding and improve physical and mental wellbeing.

45
Cambridgeshire & Peterborough Independent Commission on Climate Overview
There is also now considerable spare capacity in the economy, and evidence that many measures consistent with a green recovery, such as work to retro�t our homes or restore peatlands, would be good for the UK economic recovery as well.
CCC assessment con�rms that there are signi�cant co-bene�ts in these areas.5 They can be di�cult to quantify, but undoubtedly o�set some, if not all, the costs of achieving emission reduction targets. Just how and to what extent these co-bene�ts accrue depends on how climate policies are designed and put into e�ect. An expert advisory group to the CCC on health issues advises that the biggest driver of health outcomes in the UK is economic inequality – it is essential, therefore, that policies to reduce emissions and prepare for climate change embed fairness and do not place burdens on those least able to pay.
There are related issues as to how these bene�ts are a�ected by COVID-19. The response to the pandemic has led to changes in behaviour, some of which are potentially bene�cial for climate change – the potential for more home-working to reduce travel for example. There have also been negative impacts, such as reduced use of public transport and signi�cantly increased domestic water use. Survey evidence also indicates a high value placed on nature and greenspace that may be long-lasting, and certainly people say that they want higher value to be placed on these bene�ts post-pandemic.
Just how much of the observed change will prove to be permanent is impossible to say. But there is potential for policy to build on the positive behaviour changes that have been observed and to work with communities to consider how they would like to rebuild from the pandemic sustainably.
5 There are potential negative impacts as well. Switching to electric vehicles, for example, could increase congestion if per mile costs of travel are reduced. But the CCC concludes that co-bene�ts overwhelmingly outweigh the negatives.
Figure 1.6: Climate stability in a thriving and resilent region
Image Credit: Anais Osborne

46
Cambridgeshire & Peterborough Independent Commission on Climate Overview
Public engagement
As part of our e�orts to engage with the public, in the run-up to our March report we launchedan on-line survey, open to residents and businesses in the CPCA area. We had 890 responses direct from members of the public, and we supplemented this with a further 331 responses secured through a survey company, making a total of 1221 respondents.6
There were 34 survey questions in total – some providing for multiple-choice answers, some allowing for qualitative responses.
We expected some di�erences between the two sets of respondents, and this is con�rmed by examination of the answers. The direct respondents had their own motivations to respond to the survey – we might expect them to be more environmentally conscious and possibly more likely to have already taken actions of their own and to support further actions to limit climate change. The responses recruited through the survey company (the “targeted” responses) received a small fee for participation – they are possibly more re�ective of the attitudes of the general population, although we hesitate to say that either set of responses are representative of the general population.7
In relation to general or cross-cutting issues raised in the survey:
6 We chose to use a survey company, which made a small payment to respondents, to try to ensure a wider sample of people and to understand di�erences to those who would proactively respond to our online survey. 7 We picked up very few older respondents in the “paid for” survey – only 4% were retired; 16% were in full-time or part-time education.8 Note that this was self-reported and real knowledge was not tested in the survey.
a high proportion of respondents said that they understood the impacts of climate change on Cambridgeshire and Peterborough (83% of the direct respondents; 64% of the targeted respondents; and 78% overall);8
a high proportion felt that the area should be a leader in taking further action (92% of the direct respondents; 81% of the targeted respondents 89% overall);
most agreed with the topics identi�ed by the Commission as areas to focus on (e.g. transport, air quality, energy supply, planning of homes, o�ces and infrastructure) But the single issue receiving the highest score for consideration from both types of respondent was “nature”;
in relation to taking personal action, a high proportion of respondents said they were likely to change the things they buy to take climate change into account (83% of direct respondents; 70% of targeted respondents; and 79% overall);
in terms of activities identi�ed as priorities for the Commission to focus on, the highest weight was given to improving information and education on climate change; in�uencing behaviour; and strong leadership from local government. On this issue, the targeted group placed even more emphasis on the need for more education and information than the direct respondents – perhaps recognising that more of the direct respondents have been reached already.

47
Cambridgeshire & Peterborough Independent Commission on Climate Overview
Box 1.4: The Business Sustainability Challenge
Opportunity Peterborough’s Skills Service, in partnership with Peterborough Environment City Trust, have launched a Business Sustainability Challenge for schools within Peterborough and the East of England.
The Business Sustainability Challenge is a “Solve the Problem” activity, using situations from real businesses that relate to reducing carbon footprints. In an “Apprentice style” bid, students will be given a choice of several di�erent challenges to address. They are then given an opportunity to go away, research the issue, and prepare a solution, which they pitch back.
The winning idea/concept will be chosen by a panel comprising experts from the business sector and �eld of sustainability.
More information, and an invitation to participate, can be found at https://theinspireseries.net/inspire-sustainability/
These are interesting �ndings. In relation to education, there are good examples within CPCA currently (Box 1.4), but it seems important to review what more can be done.
The responses have similarities to results that have been received nationally when views have been sought – whether through public surveys or climate assemblies: strong support for national leadership; for more information provision and education; and a willingness to engage on the issues and to consider personal actions.
For this report we have re�ected further on what a just transition means for people in the area. We have bene�ted from further engagements with local residents in the Cambridgeshire fens and civil society groups (Chapter 3).
Next steps
The Board of the Combined Authority agreed in June to act on all the recommendations from our March report. It will now have to consider its response to the full set of recommendations in this report.
We will work with the CPCA and constituent authorities, to the extent that they desire, to help develop the action plan and �nancing plan to take these recommendations forward.
Beyond this, we recommend a continuing role for the Commission in providing:
annual progress monitoring across the Combined Authority and councils;
annual review of relevant policy and legislation and the local response;
advice to the Combined Authority and Councils in response to concerns, or when requested;
one or two “deep dives” into relevant issues for the region, looking to ensure complementarity with the activity of the Combined Authority’s Climate Working Group;
a more substantive review of progress every three years, the next coming towards the second half of 2024.
Such a continuing role will require secretariat support and a budget for research and analysis.

48
Cambridgeshire & Peterborough Independent Commission on Climate Overarching
The CPCA should create:
A Climate Cabinet chaired by the Leader of the Combined Authority – including councils and key regional stakeholders, such as the water and energy sectors, the Environment Agency, education, healthcare and local employers
A funded delivery team in CPCA to coordinate, champion and facilitate action
A green investment team
A climate action plan, including a �nance plan, with agreed targets for emissions, actions and monitoring
An independent monitor: maintaining the CPICC as an independent body to monitor and report on progress annually.
A climate change assessment should be undertaken and taken into account for every CPCA and Council policy, development, procurement, action.
All CPCA and Council operations should be net zero by 2030, underpinned by a regional Science Based Targets (SBTi)-type action plan.
The CPCA should rapidly assess the current sources and availability of funding for green opportunities (such as Green bonds or other instruments to accelerate housing retro�t, nature-based solutions and peat restoration) and develop an ambitious funding plan, including the use of its borrowing powers
The CPCA should develop and lead a plan for engagement with local people and businesses. This should cover the need for action and provide information on options and the choices that have to be made at local level.
The CPCA and its constituent Local Authorities and public sector partners should adopt a leadership role in accelerating the achievement of the Doubling Nature ambition, speci�cally to create or to conserve habitats such as woodland, grassland or wetlands that can store or absorb carbon; and setting an example on land that they own or control.
The CPCA should review training and upskilling plans to ensure that these are designed to support the scale and nature of the required transition, maximise high quality job opportunities in the region and contribute to reducing inequalities and deprivation.
The CPCA should commission work to understand the �tness of the innovation ecosystem across the region to support the emerging net zero-aligned agritech and nascent clean-tech sectors:
Recommendations
We make the following recommendations.
1.
2.
3.
4.
5.
6.
7.
Overarching
8.
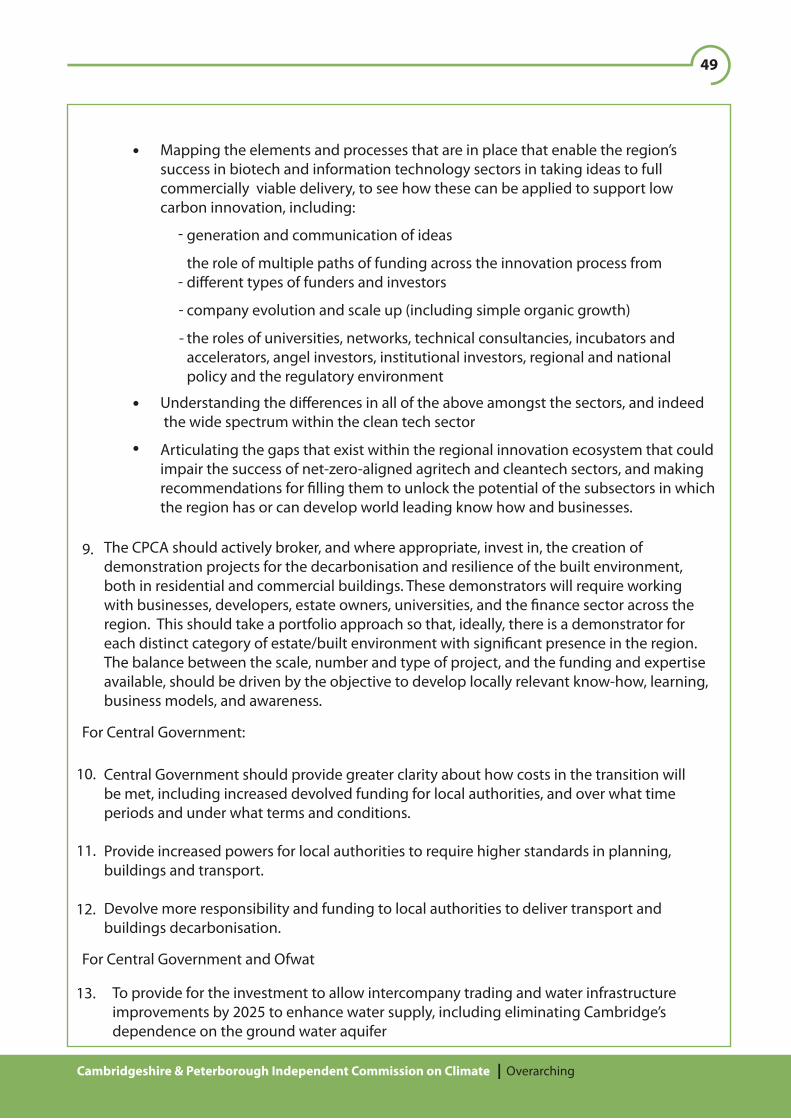
49
Cambridgeshire & Peterborough Independent Commission on Climate Overarching
Mapping the elements and processes that are in place that enable the region’s success in biotech and information technology sectors in taking ideas to full commercially viable delivery, to see how these can be applied to support low carbon innovation, including:
9.
generation and communication of ideas
the role of multiple paths of funding across the innovation process from di�erent types of funders and investors
company evolution and scale up (including simple organic growth)
the roles of universities, networks, technical consultancies, incubators and accelerators, angel investors, institutional investors, regional and national policy and the regulatory environment
-
-
-
-
Understanding the di�erences in all of the above amongst the sectors, and indeed the wide spectrum within the clean tech sector
Articulating the gaps that exist within the regional innovation ecosystem that could impair the success of net-zero-aligned agritech and cleantech sectors, and making recommendations for �lling them to unlock the potential of the subsectors in which the region has or can develop world leading know how and businesses.
The CPCA should actively broker, and where appropriate, invest in, the creation of demonstration projects for the decarbonisation and resilience of the built environment, both in residential and commercial buildings. These demonstrators will require working with businesses, developers, estate owners, universities, and the �nance sector across the region. This should take a portfolio approach so that, ideally, there is a demonstrator for each distinct category of estate/built environment with signi�cant presence in the region. The balance between the scale, number and type of project, and the funding and expertise available, should be driven by the objective to develop locally relevant know-how, learning, business models, and awareness.
For Central Government:
Central Government should provide greater clarity about how costs in the transition will be met, including increased devolved funding for local authorities, and over what time periods and under what terms and conditions.
Provide increased powers for local authorities to require higher standards in planning, buildings and transport.
Devolve more responsibility and funding to local authorities to deliver transport and buildings decarbonisation.
10.
11.
12.
For Central Government and Ofwat
To provide for the investment to allow intercompany trading and water infrastructure improvements by 2025 to enhance water supply, including eliminating Cambridge’s dependence on the ground water aquifer
13.
50
Cambridgeshire & Peterborough Independent Commission on Climate Overarching
Issues attached to water and to the need for nature to be at the heart of the agenda are considered in Chapter 7, Adaptation, nature and water;
The need to review training and upskilling is addressed in Chapter 6, Business;
Issues attached to net zero innovation and demonstration are considered in Chapter 6, Business.
Update on our March report
In our March report we recommended that a Climate Cabinet should be established by the CPCA, to ensure climate actions are taken forward. Amongst its work we included development of a climate action plan.
The Combined Authority Board has accepted this recommendation and approved the creation of a “Climate Working Group” to oversee and help deliver progress. It has begun work on development of an action plan for the set of recommendations we made in March.
We drew attention to the need for the Government to clarify the role of local authorities in achieving net zero, including that they have the skills and capacity required. This need was further endorsed by a recent (July 2021) NAO report, “Local government and net zero in England”. This indicates serious weaknesses in central government’s approach to working with local authorities, stemming from a lack of clarity over roles, piecemeal funding and di�use responsibilities. This remains to be addressed.
Other issues, on which we began consideration in this Chapter in March, are taken further in new chapters in this report:

51
Cambridgeshire & Peterborough Independent Commission on Climate Overarching
Introduction
Delivering net zero across the CPCA area and adapting to climate change, will require changes across the economy. Mapping out what is required inevitably means getting into detail for di�erent sectors, and is the focus of the sector chapters which follow. But pulling this together into a coherent strategy overall also needs cross-cutting actions. These are the focus of this chapter.
Regional coordination and facilitation
Wider research1 shows that capacity to tackle emissions reduction and increase resilience, apply for funding, and manage schemes is very limited in most local authorities. It is clear, however, that for local authorities to make progress, there is a need to embed climate actions across all functions, policies and service areas.
1 For example, by the Climate Change Committee feeding into its sixth carbon budget recommendations.
52
Cambridgeshire & Peterborough Independent Commission on Climate Overarching
Develop an action plan, with indicators of progress and monitoring against these indicators, allowing for adjustment of plans where necessary.
Support local area energy and water planning that: identi�es heat zones for buildings and building retro�t priorities; is aligned with plans for transport that support electri�cation and zero carbon vehicles, as well as modal shift and integrated public transport; is developed in collaboration with local network providers. Such planning requires robust methodologies to model future demand, as well as processes for the involvement of local people and businesses to obtain local acceptance and delivery.
Allow planning of new developments to be properly informed by criteria for site selection (including connectivity, land suitability and natural capital), made transparent with local people in the consultation process.
Maximise participation in national schemes. There have been and are a large number of funding pots made available from central Government for various schemes. We should like to see these streamlined and made available on timetables that provide more time for local development of applications and implementation over more strategic periods (that support, for example, the development of supply chains). However, for the opportunities that do arise, a central team to help coordinate bids and delivery would increase the likelihood of success and provide support for smaller authorities.
Provide specialist support in relation to procurement issues and policy design, drawing on schemes that have worked well elsewhere, for example, region-wide procurement of low carbon waste and recycling services to get better value and provide more consistent messages to the local population.
Promote wider communications and engagement, with the public and business. A national e�ort is required, but local support will allow this to be tailored for local circumstances and in support of delivery.
Local funding mechanisms will also be needed. But each local authority in the region is unlikely on their own to be able to develop, or a�ord, the specialist �nance expertise increasingly required, for example to issue bonds. The CPCA borrowing powers could also be used to great e�ect to leverage additional funds.
Implement regional education and training initiatives to develop local skills for the needs and opportunities from delivering net zero and increasing resilience, for example in building management and retro�t.
1 For example, by the Climate Change Committee feeding into its sixth carbon budget recommendations.
Whilst we have seen examples of good practice in individual authorities in the region, we see opportunities for learning across the authorities and for more e�ective action with support and coordination from the CPCA.
Delivering the actions required, at the scale and urgency needed, will require regional coordination and facilitation, in order to:
We therefore recommend the creation of:
A Climate Cabinet chaired by the Leader of the Combined Authority – including councils and key regional stakeholders such as the water, energy sectors and the Environment Agency, education, healthcare and local employers

53
Cambridgeshire & Peterborough Independent Commission on Climate Overarching
This is not a one size �ts all recommendation. There are di�erent conditions within the constituent authorities of the CPCA, which require �exibility in response. Some of these areas work well together currently on speci�c issues. There are other local bodies, such as the Greater Cambridge Partnership or Peterborough Ahead, that have responsibilities and interests for speci�c areas. But a clustering of support and expertise should reduce duplication of e�ort across authorities, improve coordination and allow for more e�ective delivery.
Delivering a CPCA-wide contribution to net zero also requires that the CPCA and constituent authorities demonstrate leadership in their own policy and procurement decisions.
In the same way as national level guidance (e.g. Green Book appraisal guidance) needs to focus more strongly on carbon reduction and co-bene�ts of climate actions, so local appraisal and business cases must be net zero consistent and take account of current and projected climate impacts. Again, there are examples of emerging good practice - Cambridgeshire County Council is, we understand, developing an approach to incorporate carbon costs into appraisal by use of a “shadow” carbon price. Such approaches need to be consistently and widely applied.
We therefore consider that a climate change assessment should be undertaken and taken into account for every CPCA and Council policy, development, procurement, action.
Clearly, the CPCA and local authorities must also take responsibility for their own emissions – covering areas including the energy e�ciency and heat sources of public buildings; use of public buildings as anchor loads for low carbon heat networks; procurement of renewable electricity; upgrading street lighting to LEDs; switching vehicle �eets to EVs. Existing plans must be updated to ensure consistency with achievement of net zero.
All CPCA and Council operations should be net zero by 2030, underpinned by a Science Based Target (SBTi)-type action plan.
Procurement can also be an important power. Procured goods and services can make up 70-80% of a council’s total carbon footprint, due to use of contractors for waste collection, construction, social services and facilities management. Procurement rules should therefore be used to minimise the environmental impact of goods, services and works procured, including the reduction of greenhouse gas emissions. Regional coordination or negotiation of procurement contracts can bring better value and more consistent net zero compatible services.
Finance
Achieving net zero will entail signi�cant up-front costs, whether incurred by the public sector, private sector or by individuals, even though much of this cost will be o�set by ongoing savings in fuel costs, and other bene�ts. There is also an opportunity, in the immediate term, for required investment to support economic recovery from COVID-19.
A funded delivery team in CPCA to coordinate, facilitate and support action
A green investment team
A climate action plan, including a �nance plan (which we return to below), with agreed targets and monitoring
An independent monitor: maintaining the CPICC as an independent body to monitor and report on progress annually.

54
Cambridgeshire & Peterborough Independent Commission on Climate Overarching
In aggregate, for the UK on a path to net zero, the CCC estimates annual housing investment costs around £9bn annually in 2028. A substantial part of that cost, around £6-7.5bn, is potentially met through existing and developing policy (o�setting energy savings, continuation and assumed development of existing Government programmes, and pass through of some costs to the private sector through regulatory requirements). Even on these assumptions, however, there is an up-front cost and a funding gap (£1.5-3bn in 2028, and rising in the 2030s as heat decarbonisation extends further).
The NAO has recently identi�ed4 that the Government needs to clarify the role of local authorities in achieving net zero, including ensuring that they have the skills and capacity required.
A �rst requirement, therefore, is that central Government provides greater clarity about how costs in the transition will be met, and over what time periods and under what terms and conditions. This will undoubtedly need to include increased funding for local authorities. The �nal report of the Treasury Net Zero Review, due later this year, is an opportunity to address this.
For the UK as a whole, the CCC estimates net costs of the transition at less than 1% of GDP over the period 2020-2050. It suggests that annual UK low-carbon investment will have to increase from around £10bn in 2020 to around £50bn by 2030. The roadmap work by PCAN for this report (Box 2.1) suggests annual investment of perhaps £0.7bn in the CPCA area through the 2020s.2 Not all of this is additional to spend required in the baseline, and some (an estimated £0.5bn annually by 2030) will be o�set by reduced energy bills. Nevertheless, there is a signi�cant up-front cost.
Much of the investment cost will be met by the private sector, both business and households. Good policy design, at national and local level, can help that happen. But a funding gap remains.
One of the biggest areas for which funding will be required relates to retro�t of the housing stock, covering energy e�ciency measures and the decarbonisation of heat. The CCC estimates an average retro�t cost per home of around £10,000. For a housing stock of around 370,000 that-would imply a total cost in CPCA around £3.7bn (£185-370m annually, spread over 10-20 years).3
Some industry modelling suggests higher average costs.
2 This excludes consideration of the agriculture sector and peatlands.
3 The PCAN (2021) report has a rather higher estimate of investment cost, for the housing sector, rising to £5.4bn, but this includes additional costs for new build and there are likely to be other de�nitional di�erences.
4 NAO (2020), Achieving net zero.
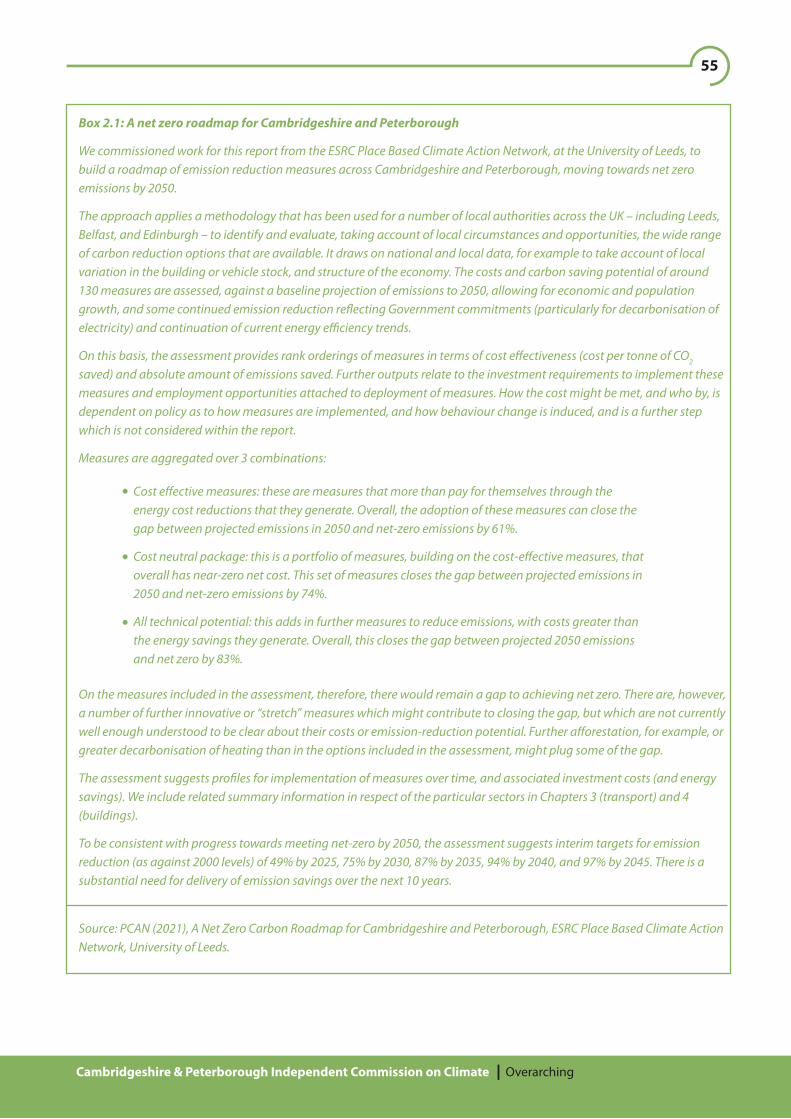
55
Cambridgeshire & Peterborough Independent Commission on Climate Overarching
Box 2.1: A net zero roadmap for Cambridgeshire and Peterborough
We commissioned work for this report from the ESRC Place Based Climate Action Network, at the University of Leeds, to build a roadmap of emission reduction measures across Cambridgeshire and Peterborough, moving towards net zero emissions by 2050.
The approach applies a methodology that has been used for a number of local authorities across the UK – including Leeds, Belfast, and Edinburgh – to identify and evaluate, taking account of local circumstances and opportunities, the wide range of carbon reduction options that are available. It draws on national and local data, for example to take account of local variation in the building or vehicle stock, and structure of the economy. The costs and carbon saving potential of around 130 measures are assessed, against a baseline projection of emissions to 2050, allowing for economic and population growth, and some continued emission reduction re�ecting Government commitments (particularly for decarbonisation of electricity) and continuation of current energy e�ciency trends.
On this basis, the assessment provides rank orderings of measures in terms of cost e�ectiveness (cost per tonne of CO2
saved) and absolute amount of emissions saved. Further outputs relate to the investment requirements to implement these measures and employment opportunities attached to deployment of measures. How the cost might be met, and who by, is dependent on policy as to how measures are implemented, and how behaviour change is induced, and is a further step which is not considered within the report.
Measures are aggregated over 3 combinations:
Cost e�ective measures: these are measures that more than pay for themselves through the energy cost reductions that they generate. Overall, the adoption of these measures can close the gap between projected emissions in 2050 and net-zero emissions by 61%.
Cost neutral package: this is a portfolio of measures, building on the cost-e�ective measures, that overall has near-zero net cost. This set of measures closes the gap between projected emissions in 2050 and net-zero emissions by 74%.
All technical potential: this adds in further measures to reduce emissions, with costs greater than the energy savings they generate. Overall, this closes the gap between projected 2050 emissions and net zero by 83%.
On the measures included in the assessment, therefore, there would remain a gap to achieving net zero. There are, however, a number of further innovative or “stretch” measures which might contribute to closing the gap, but which are not currently well enough understood to be clear about their costs or emission-reduction potential. Further a�orestation, for example, or greater decarbonisation of heating than in the options included in the assessment, might plug some of the gap.
The assessment suggests pro�les for implementation of measures over time, and associated investment costs (and energy savings). We include related summary information in respect of the particular sectors in Chapters 3 (transport) and 4 (buildings).
To be consistent with progress towards meeting net-zero by 2050, the assessment suggests interim targets for emission reduction (as against 2000 levels) of 49% by 2025, 75% by 2030, 87% by 2035, 94% by 2040, and 97% by 2045. There is a substantial need for delivery of emission savings over the next 10 years.
Source: PCAN (2021), A Net Zero Carbon Roadmap for Cambridgeshire and Peterborough, ESRC Place Based Climate Action Network, University of Leeds.
56
Cambridgeshire & Peterborough Independent Commission on Climate Overarching
Bigger �nancial vehicles: More substantial investment programmes are beginning to develop. The Green Finance Institute is working with the GLA on a London Futures Fund. The Bristol City LEAP (Chapter 4, Box 4.6) will establish a joint venture between the City Council and a strategic partner to deliver an investment programme of more than £1bn covering smart energy, energy e�ciency, heat pumps, and district heating. These programmes may allow some economies of scale in project design and management.
-
-
5 Cambridge City Council, Cambridge County Council, East Cambridgeshire, Fenland and South Cambridgeshire have successfully applied for funds under Phase 1Bof this scheme.
Project �nance: for smaller-scale projects �nance may be available through a variety of routes:
Various pots of funding may be made available from Central Government, for bidding into. Currently, for example, there is the Green Homes Grant Local Authority Delivery Scheme5 and the Heat Network Delivery Unit, although at least the former should be reformed to be better aligned with the timescales involved in delivering such projects.
More innovative options are emerging. West Berkshire Council recently became the �rst to issue a Community Municipal Investment Bond, raising £1m from around 600 investors, around 20% from the local area. This will �nance projects including solar, LED lighting and cycling routes. Other Councils are looking to issue Bonds;
Greater Manchester has established an Environment Fund, aiming to blend public and private sector funding through a charitable vehicle. It envisages leveraged private funding from corporate organisations and institutions that either wish or are required to address their negative environmental impacts. An anticipated £5m annual turnover, growing over time, should be available to �nance new habitats, tree planting and peat restoration.
-
The CPCA also needs to develop its own �nancing plan. We will develop our advice on this over the coming months, but our initial assessment suggests a need to develop thinking in two di�erent areas, relating to speci�c, smaller-scale project �nance, and to bigger �nancial vehicles:
The Public Works Loans Board, operated by the UK Debt Management O�ce on behalf of HM Treasury, provides loans to local authorities for capital projects. Concessionary rates are available for lending to support high value for money infrastructure projects, or (the Certainty Rate) loans to principal local authorities (which has been used by CPCA in the past) providing information on their plans for long-term borrowing and associated capital spending;
CPCA should seek to understand the range of possible sources of �nance, including private placement and the public debt markets, the terms on which it could access these sources, and the processes required (which could include the need, for example, to have a credit rating, with its attendant costs and resourcing implications). This is particularly important given how new the authority is and that it currently has neither a signi�cant balance sheet nor income streams to directly support the acquisition of large amounts of new debt.
The UK Government has recently announced the formation of a new UK Infrastructure Bank, to co-invest alongside the private sector and to provide local and mayoral authorities with advice on developing and funding infrastructure projects. The CPCA should monitor progress in establishing the bank with a view to engaging with it at an early stage to understand how it may provide support.
57
Cambridgeshire & Peterborough Independent Commission on Climate Overarching
Group-buying schemes have developed in recent years. Solar Together, for example, which has been used by Cambridgeshire County Council, o�ers a route for homeowners and SMEs to purchase solar panels or battery storage. The greater buying-power from bringing purchasers together allows procurement at lower cost.
New bundling packages from energy suppliers can be expected to come to market. Tari�s rewarding householders and businesses for surplus energy exported back to the grid are available. Wider packages supporting installation of heat pumps, or electric vehicle charging, are beginning to develop. There are expectations that the greater scale of renovation associated with “whole-house” packages for energy e�ciency and heat decarbonisation (linked to digital green passports) will further allow new �nancing mechanisms to emerge. Companies like Octopus Energy are currently in the lead in this kind of thinking.
A recent Scottish Government consultation6 has also referenced the Danish "Heat as a Service" model, where consumers adopt heat pumps as part of a subscription model.
The Government is seeking to develop new vehicles for private funding through the recently launched Natural Environment Investment Readiness Fund (NEIRF). Delivered through the Environment Agency, this will provide grants of up to £10,000 to environmental groups, local authorities, businesses and other organisations to help develop nature projects to a point where they can attract private investment. Projects aimed at provision of new woodlands, restoration of peatlands, provision of habitats for wildlife and green space for the public and carbon sequestration are eligible. The aim is to develop new funding models, for a pipeline of projects for the private sector to invest in. The CPCA and constituent authorities should explore what use might be made of this fund, which could promote wider learning and opportunity.
These developments are at early stages. There will be learning from the process. But in the immediate term there is a need for local authorities to build understanding of the options and of the �nance sector, and consider how best to accelerate the transition – in part through investments for which local authorities are in the lead (such as social housing), in part through enabling and encouraging �nance from other sources.
6 SG (2021), Heat in buildings strategy - achieving net zero emissions consultation, February 2021, Scottish Government.
Local authorities have a much bigger role than public investment. It will be crucial to catalyse private sector investment, through promotion of new and emerging �nancing routes, and public engagement activities. For example:
58
Cambridgeshire & Peterborough Independent Commission on Climate Overarching
Given the wide-ranging nature of the net-zero programme, this is a complex technical task and will require dedicated resources and suitably knowledgeable specialist input. As a �rst step, we recommend that a brain-storming session is held with external input from a technical consultant and senior institutional investor with deep experience of both the practical and �nancial aspects of such projects. This should accelerate the pace and e�ciency of delivery and potentially open up areas where the CPCA could pioneer new approaches.
One of the attractions of the Community Municipal Investment Bond route pioneered in West Berkshire, is the potential to generate local engagement and buy-in. There may be other ways to do this.
The Cambridge University Science and Policy Exchange (CUSPE) has been looking at the potential to develop a carbon o�setting initiative within Cambridgeshire (a Cambridgeshire Decarbonisation Fund). The intention would be that businesses that have set, or are interested in setting, long-term Carbon-neutral (or Carbon negative) targets would be provided opportunities to invest in local emission reducing projects in the transition to achieving their targets. They would thereby “o�set” some of their emissions and potentially improve their own image with the local community.
The project is currently engaging with local businesses to gauge their interest and whether this would be tied to investment in the Fund overall or to speci�c projects. Those projects might range from “Avoidance” (e.g. a zero emission housing development), to “Reduction” (e.g. buildings retro�t), to “Sequestration” (e.g. tree-planting).
There is a question about whether local authorities should support this kind of initiative. It would not have to be limited to business – potentially contributions to such a fund could be open to householders, who might also wish to o�set their own emissions and contribute to local emission reduction schemes (with potential for bene�ts beyond carbon emission reduction).
Key to this is (and CUSPE does recognise the concern) is that emission reductions achieved through this route must be additional to what would otherwise be achieved, and must not disincentivise actions by the contributors to reduce their own emissions. It is for this reason that the CCC has recommended that the UK should aim to meet net zero and the sixth carbon budget without the use of carbon emissions credits. Longer term it has indicated that should also be the goal for local authorities:
There would be considerable duplication and ine�ciencies in each of the constituent local authorities of the CPCA doing all of this, so the CPCA should rapidly assess the current sources and availability of funding for green opportunities (such as Green bonds or other instruments to accelerate housing retro�t, nature-based solutions and peat restoration) and develop an ambitious funding plan, including the use of its borrowing powers. One of the prime considerations in developing this plan should be to consider fairness, to ensure that decarbonisation is taken forward across all communities, but that �nance is secured most from those who can a�ord to pay.
The �nancing plan will need to be comprehensive and include a clear articulation of the business model at each phase of development, particularly if private sector funding is being sought.
Credits might have some value in the transition provided this is in addition to taking all possible actions to reduce emissions.
Local authorities should prioritise emissions reductions over o�sets so that by 2030, o�sets are only used for areas where emissions are unavoidable due to the lack of technical alternatives.
59
Cambridgeshire & Peterborough Independent Commission on Climate Overarching
Nature at the heart of the agenda
Nature-based solutions will play a key role in adapting to and mitigating climate change. The use of nature-based interventions is not an alternative to major systemic reduction of emissions across all sectors. As advised by the Natural Capital Committee7, however, when delivered e�ectively these interventions can deliver carbon reductions at lower cost than engineered solutions, whilst enhancing the stock of natural assets and the ecosystem services they provide – making nature more resilient and making life better for people.
Consistent with the requirements of net zero, building back from the COVID-19 pandemic also requires a focus on nature. CCC advice8 has recommended a focus on tree planting, peatland restoration and green infrastructure.
There is considerable public support for such measures:
7 NCC (2020), Advice on using nature based interventions to reach net zero greenhouse gas emissions by 2050.
8 CCC(2020), Building a resilient recovery from the COVID-19 crisis, letter to Prime Minister, May 2020; CCC(2020), Progress Report.
The importance of green space has been highlighted by COVID-19. A majority of the public now say that they appreciate green space more since social distancing (53%) and that protecting local green spaces should be a higher priority when lockdown ends (63%). A report for the RSPB found that 89% of the public agreed that increasing the amount of accessible nature-rich green space will help improve people’s general heath, wellbeing and happiness.
There is evidence of high levels of support in our own area. Respondents to our public survey indicated that nature should be given the highest priority as an area for the Commission to focus on. In a Natural Cambridgeshire Survey in the summer of 2020, 67% of respondents said that investment in nature recovery should be a priority post COVID-19, and 95% agreed that local authorities in Cambridgeshire and Peterborough should actively work to increase the number and area of accessible nature rich areas.
There is a clear case for CPCA to prioritise actions to maintain and increase tree cover; maintain and increase soil carbon (including through peatland restoration); improve wildlife/diversity; manage freshwaters and wetlands; and increase public access to nature. It should also be recognised that Cambridgeshire and Peterborough are amongst the most nature depleted areas of the country, so the opportunities to make a di�erence are very real. The evolving regime of environmental subsidies for landowners and tenant farmers also o�ers potential to accelerate delivery of these ambitions.
In terms of what this means for CPCA, Natural Cambridgeshire has set out an ambition to “Double Nature” across the region – a doubling in the area of rich wildlife and greenspace. In pursuit of this ambition it has described 6 landscape scale projects – as yet not fully funded - to promote nature recovery (Box 2.2), delivering wetland restoration, creation of grasslands and tree planting.
There are also many actions that individuals and communities can take to play their own part and to seek to incorporate doubling nature in local plans. The partners within Natural Cambridgeshire have already launched one pilot local-led nature recovery programme, in the countryside west of
Beyond 2030, o�sets should transition to permanent removals, which must demonstrate additionality and promote sustainable development.
These are essential principles should CPCA be interested in further developing the o�set proposal.

60
Cambridgeshire & Peterborough Independent Commission on Climate Overarching
Box 2.2: Landscape scale projects promoted by Natural Cambridgeshire
Natural Cambridgeshire has identi�ed 6 landscapes that it believes should be prioritised for nature recovery, working with landowners, tenant farmers and local communities. These have been chosen because of the potential for the creation of signi�cant areas of new woodland, wetland and meadows, as well as the opportunity to enhance access to nature for recreation and health purposes. They are:
John Clare Countryside
Connected Fens
Cambridge Nature Network
Ouse Valley
Nene Valley
Cambridgeshire West Hundreds.
More detail can be found at https://naturalcambridgeshire.org.uk/docs/doubling-nature-landscape-led-approach.pdf
Box 2.3: Community nature recovery programmes
A community led nature recovery programme is already underway in the John Clare Countryside, https://langdyke.org.uk/projects/john-clare-vision/ where 16 parishes are working together to develop resident-led plans for creating new habitats for nature. Over forty projects have been identi�ed, including pond and wild�ower meadows creation, and tree and hedgerow planting. Through a combination of grants and parish council contributions, £26,000 has been allocated for their delivery. This pilot is attracting attention due to its success in engaging communities in actions that will in aggregate create signi�cant habitats for nature, improve public access and help capture carbon.
Natural Cambridgeshire would like to roll out similar schemes across the CPCA area and is actively seeking funding to enable this.
Within the CPCA area, large amounts of land that could be instrumental in helping take forward these initiatives are in public ownership. This includes land belonging to the Forestry Commission, Environment Agency, Drainage Boards, Homes England, schools, local authorities and health bodies. There is also a number of large-scale infrastructure schemes, including road building, railways and housing developments, that should be required to deliver signi�cant biodiversity gains and support carbon capture. The CPCA should create a partnership of public sector bodies to develop and take forward recommendations for how these areas of land and infrastructure projects could help deliver the doubling nature ambition through land-management programmes that help in climate change adaptation and mitigation.
We recommend that the CPCA and its constituent Local Authorities and public sector partners should adopt a leadership role in accelerating the achievement of the Doubling Nature ambition, speci�cally to create or to conserve habitats such as woodland, grassland or wetlands that can store or absorb carbon; and setting an example on land that they own or control.
Peterborough, and would like to roll out similar projects across the CPCA area in 2021 and 2022, including in urban areas. These initiatives have the potential to engage residents in a positive and “hands-on” way, helping them to recognise the urgency of the climate change agenda and to take actions themselves (Box 2.3).

61
Cambridgeshire & Peterborough Independent Commission on Climate Overarching
Education and skills
Consistent with a move towards a low-carbon economy, Government projections suggest that employment and GVA growth will be faster in the low-carbon and renewable energy sector (LCRES) than for the economy as a whole.
A recent report by Ecuity Consulting for the Local Government Association9 has looked at where these jobs might be located. For England as a whole it projects growth in LCRES jobs from 185,000 whole-time equivalent (WTE) in 2018 to 694,000 in 2030 and 1.18m in 2050. Of these, it suggests that 11,000 might be in CPCA in 2030 (Figure 2.1) and 20,000 in 2050. Of course, these are not precise forecasts. They are subject to a high degree of uncertainty, but they are indicative of the potential for substantial growth if demand materialises and if regions are geared up to the provision of education and skills that underpin these jobs.
40
35
30
25
20
15
10
5
0
CPCA England
Figure 2.1: Projections of green economy jobs, CPCA and England, 2030, % by sub-sector(Total green economy jobs; England = 694,000; CPCA = 11,000)
Low-carbonelectricity
Low-carbonheat
Alternativefuels
Energy-e�ciency
Low-carbonservices
Low emissionvehicles
Note: these are direct jobs, not including jobs in other sectors supported by the LCRES.Source: Ecuity (2020)
9 Ecuity (2020), Local green jobs – accelerating a sustainable economic recovery, Ecuity Consulting report for the Local Government Association.
10 CPIER (2018), Cambridgeshire and Peterborough Independent Economic Review.
For CPCA many of these jobs are likely to be in installation and maintenance rather than manufacturing. But there is potential also to build on sectors of relative industrial strength, which may also link in to the low-carbon agenda. The Cambridgeshire and Peterborough Independent Economic Review (CPIER)10, for example, has identi�ed advanced manufacturing and materials, life sciences, IT and digital services, education, and professional services as areas of strength. Agritech and the skills to underpin sustainable farming is another. There is a small but growing Cleantech sector in Cambridge.
62
Cambridgeshire & Peterborough Independent Commission on Climate Overarching
An assessment by the Centre for Economic Performance at LSE11 has focused on where short-term areas of strength might be for jobs growth, typically in construction and installation, as the economy recovers from the COVID-19 pandemic. It �nds that energy e�ciency in buildings, renewables and EV infrastructure are potential high growth areas for at least parts of the CPCA area.
There are likely to be areas of low-carbon growth market beyond those immediately identi�ed above – requirements for adaptation or in application of digital skills, for example. An earlier review of the evidence base relating to skills has identi�ed key specialisms important (as contributors to employment) in the local authorities within CPCA. Some of these are areas with potential for low-carbon jobs: for example, IT and life sciences in Cambridge; advanced manufacturing in East Cambridgeshire; life sciences in South Cambridgeshire; Construction and utilities in Fenland and Huntingdonshire; Advanced manufacturing, transport and travel in Peterborough.
Much of what is required for the development of skills should be delivered by the private sector. But recent surveys have indicated that many perceive skills gaps for decarbonisation in their occupation or profession. The CPCA and local authorities have considerable roles in promoting and enabling the shift:
11 CEP (2020), Jobs for a Strong and Sustainable Recovery from Covid-19 – Sam Unsworth et al, CEP, Granthan Research Institute, LSE, October 2020.
identifying the broad areas of sectoral growth, liaising with and bringing together local employers, supply chains and providers of education to ensure that plans for necessary upskilling and reskilling are in place;
identifying sources of funding for skills and retraining from public sources, such as the UK Shared Prosperity Fund, and private investment;
ensuring that training programmes provide routes to recognised skills with certi�cation that provides con�dence to industry and consumers;
leading by example, in investments and purchasing that help develop low-carbon supply chains and champion low-carbon technologies, and de�ning standards – for example in relation to new build – that provide certainty about what is required.
There are major opportunities in relation to building retro�t, EV technologies and other low-carbon areas. The new Peterborough University is to be employment-focused, with a curriculum designed to meet local employment needs. That suggests a strong focus on the demands of the growing low-carbon sector.
There is also potential to link a low-carbon skills and training strategy to local deprivation and to the distinctive labour markets within CPCA. Deprivation is most pronounced in northern areas of CPCA – Peterborough, Wisbech and parts of Fenland. Peterborough and the surrounding area has a relatively high unemployment rate. Fenland has a poorer labour market performance related to accessibility to jobs and training. Both Peterborough and Fenland rank poorly, across England, on indicators of educational, skills and training, which are key factors contributing to deprivation.
The CPCA should review training and upskilling plans to ensure that these are designed to support the scale and nature of the required transition.

63
Cambridgeshire & Peterborough Independent Commission on Climate Overarching
Innovation and demonstration
As identi�ed above, businesses in CPCA area have strengths in agritech, advanced manufacturing and materials, life sciences, IT and digital services, education, and professional services. There is a small but growing Cleantech sector in Cambridge.
The CPIER also identi�es Cambridge as a centre for innovation – the highest number of patent applications relative to population of any city in the UK. Peterborough also ranks very high on this measure (13th in the UK).
Low-carbon markets, in the UK and globally, should grow rapidly given the commitment to net zero. The academic and business strengths in the area ought to mean that the CPCA area has the potential to be a substantial leader in development of the new technologies required in the transition. But it is not clear to us that the early-stage innovation evident in CPCA area is translating to substantial businesses (in terms of market or employment) within CPCA area.
The CPCA should commission work to understand the �tness of the innovation ecosystem across the region to support the emerging net-zero-aligned agritech and nascent clean tech sectors:
Mapping the elements and processes that are in place that enable the region’s success in biotech and information technology sectors in taking ideas to full commercially viable delivery, to see how these can work for net zero technologies, including:
generation and communication of ideas
the role of multiple paths of funding across the innovation process from di�erent types of funders and investors
company evolution and scale up (including simple organic growth)
the roles of universities, networks, technical consultancies, incubators and accelerators, angel investors, institutional investors, regional and national policy and the regulatory environment
-
-
-
-
Understanding the di�erences in all of the above amongst the sectors, and indeed the wide spectrum within the clean tech sector
Articulating the gaps that exist within the regional innovation ecosystem that could impair the success of net-zero-aligned agritech and cleantech sectors, and making recommendations for �lling them to unlock the potential of the subsectors in which the region has or can develop world leading know how and businesses.
The CPCA should actively broker, and where appropriate, invest in, the creation of demonstration projects for the decarbonisation and resilience of the built environment, both in residential and commercial buildings. These demonstrators will require working with businesses, developers, estate owners, universities, and the �nance sector across the region. This should take a portfolio approach so that, ideally, there is a demonstrator for each distinct category of estate/built environment with signi�cant presence in the region. The balance between the scale, number and type of project, and the funding and expertise available, should be driven by the objective to develop locally relevant know-how, learning, business models, and awareness.
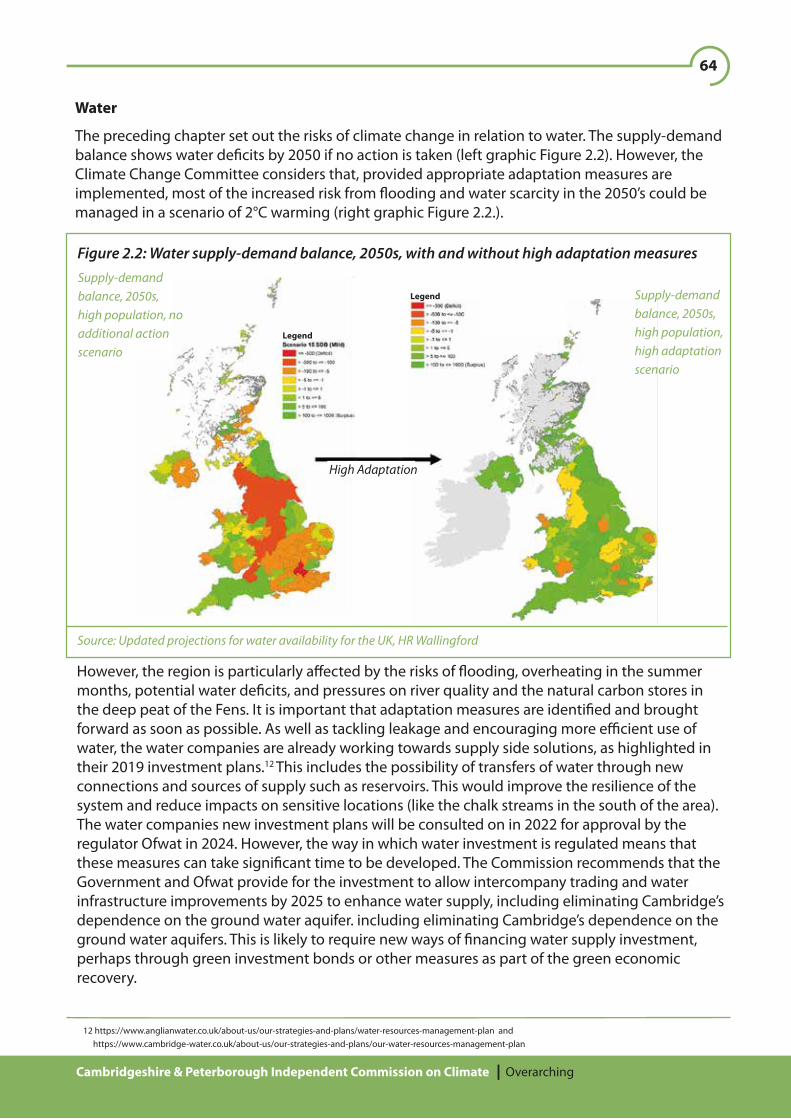
64
Cambridgeshire & Peterborough Independent Commission on Climate Overarching
Water
The preceding chapter set out the risks of climate change in relation to water. The supply-demand balance shows water de�cits by 2050 if no action is taken (left graphic Figure 2.2). However, the Climate Change Committee considers that, provided appropriate adaptation measures are implemented, most of the increased risk from �ooding and water scarcity in the 2050’s could be managed in a scenario of 2°C warming (right graphic Figure 2.2.).
Source: Updated projections for water availability for the UK, HR Wallingford
High Adaptation
Legend
Legend
Supply-demandbalance, 2050s,high population, high adaptationscenario
Supply-demandbalance, 2050s,high population, noadditional actionscenario
However, the region is particularly a�ected by the risks of �ooding, overheating in the summer months, potential water de�cits, and pressures on river quality and the natural carbon stores in the deep peat of the Fens. It is important that adaptation measures are identi�ed and brought forward as soon as possible. As well as tackling leakage and encouraging more e�cient use of water, the water companies are already working towards supply side solutions, as highlighted in their 2019 investment plans.12 This includes the possibility of transfers of water through new connections and sources of supply such as reservoirs. This would improve the resilience of the system and reduce impacts on sensitive locations (like the chalk streams in the south of the area). The water companies new investment plans will be consulted on in 2022 for approval by the regulator Ofwat in 2024. However, the way in which water investment is regulated means that these measures can take signi�cant time to be developed. The Commission recommends that the Government and Ofwat provide for the investment to allow intercompany trading and water infrastructure improvements by 2025 to enhance water supply, including eliminating Cambridge’s dependence on the ground water aquifer. including eliminating Cambridge’s dependence on the ground water aquifers. This is likely to require new ways of �nancing water supply investment, perhaps through green investment bonds or other measures as part of the green economic recovery.
12 https://www.anglianwater.co.uk/about-us/our-strategies-and-plans/water-resources-management-plan and https://www.cambridge-water.co.uk/about-us/our-strategies-and-plans/our-water-resources-management-plan
Figure 2.2: Water supply-demand balance, 2050s, with and without high adaptation measures
65
The principles outlined in this chapter (Box 3.2) should, as far as possible, form part of this climate assessment tool and local governments should adopt these principles for policy-making and strategy development, recognising that there may be instances where national statute, guidance or regulation impacts on the extent to which this is achievable.
A Just Transition
Cambridgeshire & Peterborough Independent Commission on Climate A Just Transition
Recommendations
1.
2.
3.
-
-
-
-
Further to the recommendation in our interim report that “A climate change assessment should be undertaken and taken into account for every CPCA and Council policy, development, procurement, action” (Recommendation 2), we recommend that:
Further to our recommendation in our interim report “The CPCA should develop and lead a plan for engagement and behaviour change with local people and businesses. This should cover the need for action and provide information on options and the choices that have to be made at local level” (Recommendation 5), we recommend that:
As part of this plan the CPCA should:
Convene a ‘climate and inclusion’ working group with a remit to reach, engage and represent the views of groups who are often left out of climate and policy discussions, including minority ethnic groups, low-income communities, young people, people with disabilities. Membership should be drawn from these communities and in order to make participation fully accessible, payment for time should be made available to those who need it.
Establish regular participative democracy activities, such as Citizen’s Assemblies, to aid CPCA decision making on key topics related to climate policy; and support and encourage county and local councils who wish to hold assemblies or other meaningful engagement events on key climate and policy decisions.
Provide reliable, up to date and accessible information on climate and nature, in particular covering actions that people can take, to all communities in the region, including:
Facilitate citizen’s advice initiatives in each CPCA area, in partnership with the local authority and local civil society, to advise residents on di�erent climate issues and how they can take action
Develop a network of local climate and nature champions who work to deliver climate information, inform and educate people about new schemes etc.
As part of delivering the targets set out in these recommendations, the CPCA and local councils should support the activity of community based and grassroots initiatives that help local people lead delivery alongside government, businesses and other actors.
In relation to adaptation issues, the distributional impact of climate change should be given increased focus within local risk assessment and design of policy responses.
4.
-
Implement community-led and community-based communications and engagement work, including engaging schools and young people, and other groups.
-
66
Cambridgeshire & Peterborough Independent Commission on Climate A Just Transition
Introduction
It is clear that for climate action to be e�ective, both to reduce emissions and to prepare for climate impacts, it must be taken forward in ways that people feel are fair. Overall estimates of the costs of action, for example by CCC, show that these are manageable. And they are, of course, less than the costs we face from the impacts of climate change if we do not take action. But without explicitly addressing where the costs and bene�ts in the transition fall, there is no guarantee that the distribution will be fair.
Just Transitions recognise that not everyone has contributed to climate change equally, either globally or locally, and not everyone has the same capacity to adapt and mitigate the e�ects at the individual, community and organisational level.
With appropriate design of climate policy, we can help to address some of the challenges facing our communities - economic inequality, the need for good jobs, lack of access to green space, and access to a�ordable and high-quality transport.
The Just Transition Commission in Scotland1 has been a leader in considering the issues. It has described its work as guided by the requirement that:
“The imperative of a just transition is that Governments design policies in a way that ensures the bene�ts of climate change action are shared widely, while the costs do not unfairly burden those least able to pay, or whose livelihoods are directly or indirectly at risk as the economy shifts and changes”.
That seems to us a pretty good statement of the requirement,2 with the addition that in design-ing and implementing the work we need to reduce our emissions an emphasis must be placed on the need for community involvement.
“A successful transition means that people must be at the heart of the policymaking process, and those most a�ected by change must be the ones to shape it” (IPPR Environmental Justice Commission, July 2021)3
Areas of climate policy, such as transport, housing and work, impact the everyday lives of all of us, and citizens have a vital part to play in shaping the way we tackle climate change. Without widespread public support, it is also unlikely that we will take the necessary actions in time to achieve net zero by 2050. Inequity, or perceived inequity, will put that support at risk.
The scale of the task is huge, and there is an urgency to our response (Chapter 1). But there is also an opportunity to be seized. We will only succeed if we prioritise investment in our communities and involving people in the decisions and actions.
How we wrote this chapter
It was clear from the public survey that we conducted to input to our preliminary report, that there is a strong desire for engagement from people in the area (Chapter 1). Outputs from the Climate Assembly UK and activities, including local panels, in other areas of the country, reinforce this willingness to be involved and potential for learning from local engagement.
1 JTC (2021), A national mission for a fairer, greener Scotland, Just Transition Commission, March 2021.2 with the clari�cation that the reference to Government encompasses local as well as national government3 IPPR (2021), Fairness and Opportunity, A People-Powered Plan for the Green Transition, Final report of the IPPR Environmental Justice Commission, July 2021.
67
Cambridgeshire & Peterborough Independent Commission on Climate A Just Transition
A Just Transition should put communities at the centre of decision-making, and the Commis-sion felt it was important to embody this principle in the way we developed this chapter and recommendations. We have conducted 2 main activities:
4 17 residents were brought together over a weekend, online, for around 10 hours of deliberation. Thy heard from a range of speakers, providing information and context for their discussion. A full report of the process and their conclusions will be published by IPPR.
Cambridgeshire Fens Climate Panel: the issues facing the fens are in many ways unique. There is a much-cherished landscape and heritage, intimately connected to agriculture. Whilst local emissions of greenhouse gases are high, there are multiple issues related to deprivation in the area. Local engagement on actions to reduce emissions, whilst protecting the way of life and helping tackle local concerns is therefore crucial. We convened a panel of local residents, over the two days of a weekend, led independently by the Institute for Public Policy Research (IPPR), to consider the question, “How can responses to the nature and climate crises be fair for people in the Cambridgeshire Fens”?4 They made recommendations on principles that should lie behind local action and explored actions, particularly in relation to transport, and to farming, food and how we use land;
Civil society consultation: We conducted 5 consultation events, again with an independent facilitator, with civil society representatives from East Cambridgeshire, South Cambridgeshire, Cambridge, Peterborough and Huntingdonshire. Each consultation lasted 3.5 hours and numbers of participants varied from around 10 to more than 30. The participants considered principles for a just transition, barriers to actions and what can be done to address those barriers, with particular emphasis on issues around housing, transport, employment and food and water.
We also sought advice and input from o�cers at di�erent councils on their experiences of tackling inequality and climate change through local policy making.
We are deeply grateful for everyone who gave their time, energy and thoughts to this process.
The value of engagement has been con�rmed by these events. The ideas, concerns and expectations that have been expressed have added considerably to our learning, and it has been a privilege for the Commission to hear the views of people across the local area. The strong desire for people to be a part of climate action and policymaking has been evident, and we hope that grassroots citizen engagement on climate change will be a priority for local authorities.
The content of these engagements has been used to inform the chapter and its recommendations. We summarise below the general issues and overarching ideas identi�ed by the participants. Where barriers and actions were identi�ed speci�c to particular sectors, these are covered in the relevant chapter (Chapter 4 Transport, Chapter 5 Buildings, Chapter 6 Business, Chapter 7 Adaptation, nature and water). The summary outputs from the civil society consultations and the Fens panel will be available on our website.
We hope that these consultations are not the end but the start of meaningful engagement with communities across the region about climate change.

68
Cambridgeshire & Peterborough Independent Commission on Climate A Just Transition
5 See, for example, CCF (2021), Cambridgeshire’s Vital Signs 2021, Cambridgeshire Community Foundation.6 32,844 Lower-layer Super Output Areas (LSOAs) across England, averaging around 1,500 people, 650 households.
Background
Aspects of economic inequality across the region
Climate change mitigation and adaptation are issues which intersect closely with all aspects of inequality in the region. There are other resources that provide excellent summaries of inequality in our area,5 and local authorities are substantially focused on these issues. In developing climate policy, we must acknowledge the di�erent aspects of inequality and quality of life across the region.
The Index of Multiple Deprivation (IMD) is a summary measure of deprivation estimated for almost 33,000 areas (LSOAs)6 across England. It combines information relating to seven components (domains of deprivation, including income, education and housing), into a single index (Box 3.1).
Combining the IMD measure across local authorities, Peterborough and Fenland rank relatively high for deprivation across all local authorities in England (Figure 3.1).
Box 3.1: Components of the Index of Multiple Deprivation
Source: Peterborough City Council, Peterborough Annual Public Health Report 2019

69
Cambridgeshire & Peterborough Independent Commission on Climate A Just Transition
Pete
rbor
ough
Figure 3.1: CPCA district ranking on average Index of Multiple Deprivation across England, 2015
Cam
brid
ge
Fenl
and
Hun
ting
dons
hire
East
Cam
brid
gesh
ire
0 20 40 60 80 100 120 140 160 180 200 220 240 260 280 300 317
Sout
hCa
mbr
idge
shir
e
Most Deprived Least Deprived
Note: There are 317 local authorities across England. The ranking shows the position of each CPCA district within these 317 local authorities, where 1 is the most deprived and 317 the least deprived.
Across the CPCA area as a whole, 62 LSOAs are in the 20% most deprived nationally – 3 in Cambridge, 2 in Huntingdonshire, 11 in Fenland and 46 in Peterborough. Deprivation is strongest in the north of the area, in parts of Peterborough and parts of Cambridge (Figure 3.2).

70
Cambridgeshire & Peterborough Independent Commission on Climate A Just Transition
Indices of Multiple Deprivation 2019:National Decile for Overall Deprivation byLower Super Output Area (LSOA)
© Crown copyright and database rights 2019 OS 100023205
Source: Cambridgeshire Insight, www.cambridgeshireinsight.org.uk
Figure 3.2: Indices of Multiple Deprivation (IMD) across the CPCA area
71
Cambridgeshire & Peterborough Independent Commission on Climate A Just Transition
7 Centre for Cities, Cities Outlook 2018
Overall, the worst-scoring domain across the CPCA area is for housing, which includes measures of a�ordability. Around 65% of the LSOAs in CPCA are in the lowest half of the national distribution. But there are signi�cant variations in better and worse components of the IMD by district:
Cambridge: the most deprived domain is “Living Environment”, which concerns the quality of the indoor and outside environment. Cambridge scores well, overall, on education and on income and employment. But this disguises signi�cant variation within the city – on other measures of income and wealth, Cambridge has been ranked the least equal city in the UK;7
South Cambridgeshire: the least deprived area within CPCA. The lowest scoring domain is “Housing”; the best “Health”;
East Cambridgeshire: the lowest scoring domain is “Housing”; scores particularly well on “Health” and “Crime”
Huntingdonshire: the majority of LSOAs (56%) fall in the lowest 50% nationally for “Housing”. All other domains have a majority in the top half nationally;
Fenland: lowest scoring domains relate to “Education” and “Health”; it scores relatively well on “Living Environment” and “Crime”;
Peterborough: for “Crime” and “Education” 28% of LSOAs rank in the lowest 10% nationally; scores well on “Living Environment”, otherwise mostly in lowest half of distribution nationally.
There are further excellent sources that describe the data more fully, and give greater consideration to underlying causes - reports for example, by Cambridgeshire Insight, and annual public health reports by Cambridgeshire CC and Peterborough CC.
Fuel poverty
How our homes are built, heated and insulated is a key component of climate action. As such, the levels of fuel poverty in the region, which could potentially be reduced with targeted retro�tting programmes, are highly relevant.
More than 13% of households in the CPCA area (47,000 households) are estimated to be in fuel poverty. This is similar to the England average, but numbers are relatively high in Fenland, Peterborough, Cambridge and East Cambridgeshire (Figure 3.3). Housing quality also varies substantially (Chapter 5). These issues were signi�cant concerns for people who attended our consultations. Climate action which helps to provide comfortable, quality homes for people across the region will be essential for both reducing emissions and improving wellbeing.
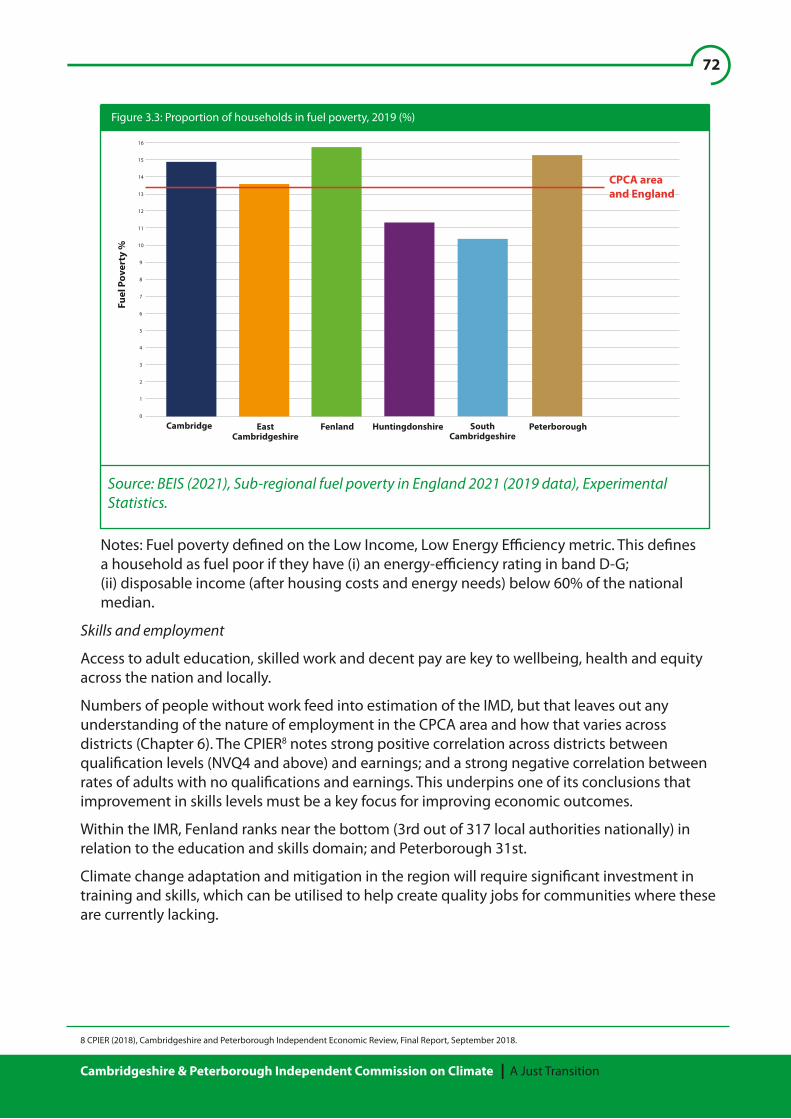
72
Cambridgeshire & Peterborough Independent Commission on Climate A Just Transition
8 CPIER (2018), Cambridgeshire and Peterborough Independent Economic Review, Final Report, September 2018.
16
15
14
13
12
11
10
9
8
7
6
5
4
3
2
1
0
Figure 3.3: Proportion of households in fuel poverty, 2019 (%)
Fuel
Pov
erty
%
Cambridge EastCambridgeshire
Fenland Huntingdonshire SouthCambridgeshire
Peterborough
CPCA areaand England
Notes: Fuel poverty de�ned on the Low Income, Low Energy E�ciency metric. This de�nes a household as fuel poor if they have (i) an energy-e�ciency rating in band D-G; (ii) disposable income (after housing costs and energy needs) below 60% of the national median.
Source: BEIS (2021), Sub-regional fuel poverty in England 2021 (2019 data), ExperimentalStatistics.
Skills and employment
Access to adult education, skilled work and decent pay are key to wellbeing, health and equity across the nation and locally.
Numbers of people without work feed into estimation of the IMD, but that leaves out any understanding of the nature of employment in the CPCA area and how that varies across districts (Chapter 6). The CPIER8 notes strong positive correlation across districts between quali�cation levels (NVQ4 and above) and earnings; and a strong negative correlation between rates of adults with no quali�cations and earnings. This underpins one of its conclusions that improvement in skills levels must be a key focus for improving economic outcomes.
Within the IMR, Fenland ranks near the bottom (3rd out of 317 local authorities nationally) in relation to the education and skills domain; and Peterborough 31st.
Climate change adaptation and mitigation in the region will require signi�cant investment in training and skills, which can be utilised to help create quality jobs for communities where these are currently lacking.
73
Cambridgeshire & Peterborough Independent Commission on Climate A Just Transition
9 Sourced from CCF (2021), Cambridgeshire’s Vital Signs 2021, Cambridgeshire Community Foundation.10 PHE (2014), Local action on health inequalities: improving access to green spaces, Public Health England.11 EA (2021), Social deprivation and the likelihood of �ooding, Environment Agency, January 2021.12 CCCRA3 (2021), Health and Social Care Brie�ng, Findings from the third UK Climate Change Risk Assessment Evidence Report 2021.
Transport
Many people, particularly in more rural areas, can feel isolated because of the poor quality and a�ordability of public transport. Accessible public and active transport are a key part of reducing transport emissions. They are also a key contributor to quality of life, the ability to access good work, the connectedness of communities and physical activity.
Nature and green space
Cambridgeshire has a low level of woodland cover and one of the lowest percentages of land designated for nature. It ranks a little better for access to green space, with a high share of homes having gardens and more parks than the national average. However, Peterborough and East Cambridgeshire rank in the lowest quarter of districts for access to parks and open space.9
There is also evidence that people living in deprived areas tend to have least access to good quality green space. 10
Health
Health inequalities are directly related to issues such as housing, access to nature and incomes. The relatively deprived areas of Fenland and Peterborough have higher rates of preventable mortality, lower life expectancy and more deaths from respiratory illness than other areas of Cambridgeshire. For the health domain within the IMD Fenland ranks 55th lowest of 317 districts nationally, and Peterborough 65th lowest.
The bene�ts to mental and physical health of well-designed climate policies have the potential to be substantial.
Impacts of climate change
Climate change will a�ect every part of UK society and the natural environment. However, the impacts are likely to vary for di�erent groups, with potential for this to worsen inequality unless actively mitigated. The distributional impacts of climate change should be given increased focus within local risk assessments and design of policy responses.
There is signi�cant overlap between existing inequality and vulnerability to climate risks:
Though recent investment has reduced this inequality, people from areas classed as more deprived face disproportionately more �ood risk than those living in less deprived areas.11 Flooding has profound impacts on those who experience it. Aside from damage to property, there is growing evidence of impacts on mental health and wellbeing, and disrupted access to employment, education, health and other services;
Lower income households are less likely to have contents insurance, so where �ooding is experienced, costs can be high;
Over-heating risks (with impacts on health and energy expenditures) will tend to be higher for the more vulnerable and in poorer quality housing. Vulnerable people being exposed to high temperatures in hospitals, care homes and receiving home-based care is of particular concern;12

74
Cambridgeshire & Peterborough Independent Commission on Climate A Just Transition
13 Nature (2021), Vol 597, 30 September 2011, https://www.nature.com/articles/d41586-021-02582-8
There is considerable uncertainty about impacts on food prices, but some studies project increases of 20% by 2050. Food costs make up a higher proportion of the income of lower income households, and a signi�cant number of households in the region are already living in food poverty.
The impacts of climate change will also be keenly felt by young people, who will spend a signi�cant proportion of their lives living through the consequences of climate and environmental degradation. Many young people are currently su�ering from climate anxiety.13
Intergenerational fairness is thus a very important part of a Just Transition.
Di�erential contributions to climate change
The UK has high historical emissions re�ecting its position as the birthplace of the industrial revolution. Today it has high “consumption” emissions attached to imports of goods and services, particularly manufactured goods from countries such as China and India. Even as we focus our attention on local actions, both are reasons that have been suggested for the UK to go further than others in reducing emissions.
As one of the highest emitting regions in the UK, we have a key responsibility in helping the country as a whole to meet its climate targets.
Within this people with highest incomes have the highest carbon footprints (Figure 3.4). On average, households in the top income decile have a carbon footprint more than double that of the lowest decile. The income of the highest decile is on average more than eight times greater than the lowest decile. Relative to income, therefore, the carbon footprint is high for those with lower incomes. This re�ects that housing and utility spend makes up a higher proportion of income at the lower end of the distribution. Transport emissions rise much more signi�cantly with income.
Figure 3.4: Average greenhouse gas footprint by income decile
Source: HMT (2020), Net Zero Review, Interim report, HM Treasury, December 2020.
Note: deciles of net equivalised household income

75
Cambridgeshire & Peterborough Independent Commission on Climate A Just Transition
13 Nature (2021), Vol 597, 30 September 2011, https://www.nature.com/articles/d41586-021-02582-8
A Just Transition for Cambridgeshire and Peterborough
Hopes for the future of the region
An important part of change is imagining what the future could look like if we collectively took action on the issues we care about. We asked participants in all consultations to think about what the region would look like for them, in a future where we had tackled the climate crisis in a fair and just way (Figure 3.5). Many participants took pride in their local areas, and had strong positive visions for how we can invest in our communities through climate action.
Whilst it is the responsibility of all of us to play a part in tackling climate change, if we are to do this fairly, we should also acknowledge that contributions to climate change are not equal, and that those who are currently the worst o� are contributing the least to creating the problem.
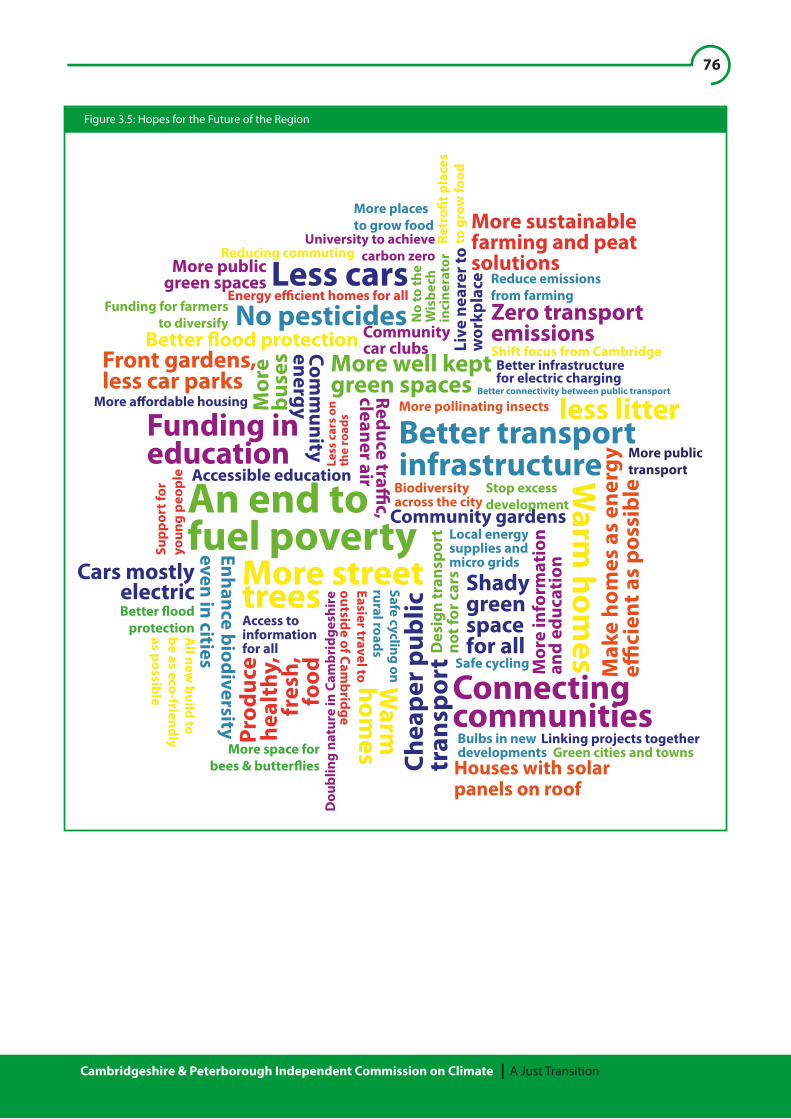
76
Cambridgeshire & Peterborough Independent Commission on Climate A Just Transition
Warm
homes
Better �oodprotection
Supp
ort f
oryo
ung
peop
le
Shift focus from Cambridge
less litter
Accessible education Warm
homes
Comm
unityenergy
Linking projects together
Mor
e in
form
atio
nan
d ed
ucat
ion
Communitycar clubs
Chea
per p
ublic
tran
spor
t
Better infrastructurefor electric charging
Better connectivity between public transport
More space forbees & butter�ies
Easier travel tooutside of Cam
bridgeLi
ve n
eare
r to
wor
kpla
ce
More a�ordable housing
Less carsM
ore
buse
s
Community gardens
Reduce tra�c,
cleaner air
Biodiversityacross the city
All new
build tobe as eco-friendlyas possible
Mak
e ho
mes
as
ener
gye�
cien
t as
poss
ible
More publicgreen spaces
Dou
blin
g na
ture
in C
ambr
idge
shir
e
More sustainablefarming and peatsolutions
More pollinating insects
Front gardens,less car parks
Houses with solarpanels on roof
Cars mostlyelectric
Less
car
s on
the
road
s
Access toinformationfor all
Enhance biodiversityeven in cities
University to achievecarbon zero
Bulbs in newdevelopments
More streettrees
Local energysupplies andmicro grids
Retr
o�t p
lace
sto
gro
w fo
od
More placesto grow food
Better transportinfrastructure
Prod
uce
heal
thy,
fres
h,fo
odReduce emissionsfrom farming
No pesticides
Green cities and towns
Zero transportemissions
Shadygreenspacefor all
Funding ineducation
Funding for farmersto diversify
Safe cycling
More publictransport
Reducing commuting
Energy e�cient homes for all
Des
ign
tran
spor
tno
t for
car
s
Better �ood protection
Connectingcommunities
More well keptgreen spaces
An end tofuel poverty
Stop excessdevelopment
No
to th
eW
isbe
chin
cine
rato
r
Safe cycling onrural roads
Figure 3.5: Hopes for the Future of the Region
77
Cambridgeshire & Peterborough Independent Commission on Climate A Just Transition
The challenges of making change
We asked people to consider what might prevent the recommendations of the Commission, and climate action more generally, being implemented in the region and being implemented in a fair way. The insights provided direction for the discussion of principles and ideas for solutions.
One of the greatest concerns of the people consulted was the will to implement big changes – both at a personal level but also in local government and businesses. All groups re�ected that people and organisations often do not understand the true depth and magnitude of the climate and nature crises:
Participants from Cambridge and Peterborough raised concerns about people fearing change, perhaps re�ecting a lack of positive and meaningful communication. Participants from Peterborough felt that it can sometimes be overwhelming and disempowering to learn about such a huge issue, especially when it isn’t clear what you need to do yourself. Cambridge attendees felt that it can be especially paralysing when we individualise actions, rather than talking about community and what we can do together.
Participants from South Cambridgeshire suggested a lack of proper community communication as a reason, whilst Huntingdon participants felt that climate action is too often presented as radical when in reality not acting would be the radical thing to do.
Participants in a few authorities were concerned by the scale of system change required in just a few years given the typical pace at which change occurs, although many also re�ected that COVID-19 has shown us just how quickly we can change our behaviours.
“We need leadership and good communication with people”(South Cambridgeshire participant)
In some consultations, particularly East Cambridgeshire, Peterborough and the Fens panel, people felt strongly that poverty and inequality in the region were barriers to climate action. Many people across the region are struggling with low wages, unemployment, social isolation, mental health problems, disabilities and more, which makes it very challenging to engage in climate action, even though these communities are most at risk from the impacts of climate change and can bene�t from climate action. Inequality between regions and di�erent contexts in urban and rural environments was raised as a key consideration in most consultations.
“There is a hierarchy of needs. And one of the �rst needs is for security and safety. So some of the goals won’t work unless we have this �rst step in place.” (Fens panel participant)
“People are relying on food banks – how can we include them and improve their lives?” (East Cambridgeshire participant)
The East Cambridgeshire consultation, and the Fens panel, raised the issue of the lack of inclusion of low-income communities, ethnic minorities and people with physical and mental disabilities in climate discussions and decision making. This makes it harder for many sections of the population to feel empowered to participate. The Fens panel recognised that we are not all starting from the same level, and di�erent communities have di�erent needs if they are to be involved:

78
Cambridgeshire & Peterborough Independent Commission on Climate A Just Transition
“It’s a common misconception that equality means the same; equality doesn’t mean the same. It means looking at the needs of people and giving them the right opportunity linked to their needs” (Fens panel participant)
Whilst ensuring those on low incomes and other potentially vulnerable groups are not burdened, all groups felt that other actors in the region were not being adequately held to account for their role in causing climate change. Addressing the activities of those who are contributing the most to climate change, in particular those also bene�tting �nancially from these activities, was a priority amongst the consultees. Participants in the Fens panel felt that those who have contributed the most “shouldn’t get away with it”.
“Corporate interests should not be put above environmental” (Huntingdon participant)
Whilst all participants recognised the need to act on climate, some felt concerned about where the money was going to come from to implement required changes, especially in the light of the tight budgets of local government and public services. There was also a recognition that local authorities are trying to tackle multiple issues including COVID-19, economic recovery and housing. This emphasises the importance of a substantial �nancing plan to invest in the climate policies needed in the region and designing climate policy that can help to tackle the other challenges facing the region.
Across many of the groups, people realised that a lot of our ability to tackle the crisis locally rested on strong national action. Whilst we can take a lead locally, the lack of su�cient �nancing, regulatory clarity and strategy at the national level is a challenge for local leadership. People were keen to see the region play a part in encouraging the national government to do more in di�erent policy areas, especially around retro�t and housing.
In several consultations, there was a sense that we too often consider economic growth and pro�t over the wellbeing of people and planet. Participants in a number of the consultations raised concerns over consumerism and a “throw-away culture”:
“In my opinion, the crises are fundamentally driven by global economic systems that demand in�nite growth in a world with �nite resources…the solutions require both local and global change.” (Fens panel participant)
“We need the whole economy to move to a circular economy approach”(Huntingdonshire participant)
In the South Cambridgeshire, East Cambridgeshire and Cambridge consultations people felt that a joined-up approach or strategy across the region was lacking. They felt a clear roadmap that communities and local authorities can build on would be useful, and some participants felt that it is often unclear who is responsible for what.
The need to adapt to the unavoidable impacts of climate change and to create resilience within the region was raised as a challenge as some people felt unsure how to do that and what the future would look like.
Despite these challenges, many participants were hopeful for what we can do together in the region and how we can rise to the challenge of tackling climate change. The passion of people in the local area for nature, farming, water and community came across strongly.
“There is will, let’s �nd the way” – (Huntingdonshire participant)

79
Cambridgeshire & Peterborough Independent Commission on Climate A Just Transition
Principles for action
One of the outputs of the Cambridgeshire Fens panel was a list of principles to consider when developing policy and measures. Whilst the other consultations were not asked to �nalise principles in the same way, there was a lot of related discussion. The ideas that came out of all groups were remarkably consistent.
There was a general realisation that we need to make climate action part of solving our other challenges. This need to look broadly is re�ected in the principles. Climate action should bring bene�ts to communities and help us overcome the other challenges we face as a region. All groups recognised that climate change is also related to wealth inequalities, health, wellbeing and all aspects of our everyday lives.
“many of these problems are linked, not separate”; we should focus on “coming up with a solution that tackles the problems that are speci�c to this area” (Fens panel participant)
Starting from the proposal by the Fens panel, we have developed a combined set of principles (Box 3.2). This is our interpretation and development of what emerged, but the speci�c outputs from the Fens panel and the wider consultations will be separately available.14
14 Materials will be made available through our website
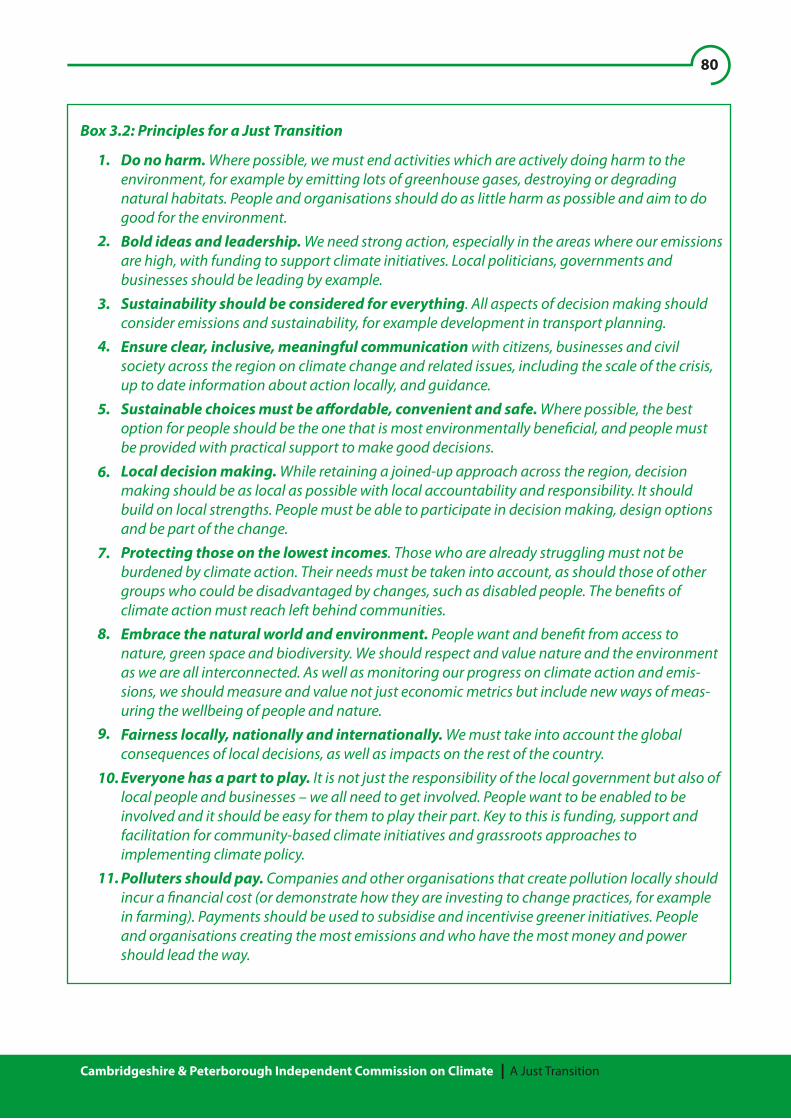
80
Cambridgeshire & Peterborough Independent Commission on Climate A Just Transition
Do no harm. Where possible, we must end activities which are actively doing harm to the environment, for example by emitting lots of greenhouse gases, destroying or degrading natural habitats. People and organisations should do as little harm as possible and aim to do good for the environment. Bold ideas and leadership. We need strong action, especially in the areas where our emissions are high, with funding to support climate initiatives. Local politicians, governments and businesses should be leading by example. Sustainability should be considered for everything. All aspects of decision making should consider emissions and sustainability, for example development in transport planning.Ensure clear, inclusive, meaningful communication with citizens, businesses and civil society across the region on climate change and related issues, including the scale of the crisis, up to date information about action locally, and guidance.Sustainable choices must be a�ordable, convenient and safe. Where possible, the best option for people should be the one that is most environmentally bene�cial, and people must be provided with practical support to make good decisions. Local decision making. While retaining a joined-up approach across the region, decision making should be as local as possible with local accountability and responsibility. It should build on local strengths. People must be able to participate in decision making, design options and be part of the change. Protecting those on the lowest incomes. Those who are already struggling must not be burdened by climate action. Their needs must be taken into account, as should those of other groups who could be disadvantaged by changes, such as disabled people. The bene�ts of climate action must reach left behind communities.Embrace the natural world and environment. People want and bene�t from access to nature, green space and biodiversity. We should respect and value nature and the environment as we are all interconnected. As well as monitoring our progress on climate action and emis-sions, we should measure and value not just economic metrics but include new ways of meas-uring the wellbeing of people and nature. Fairness locally, nationally and internationally. We must take into account the global consequences of local decisions, as well as impacts on the rest of the country. Everyone has a part to play. It is not just the responsibility of the local government but also of local people and businesses – we all need to get involved. People want to be enabled to be involved and it should be easy for them to play their part. Key to this is funding, support and facilitation for community-based climate initiatives and grassroots approaches to implementing climate policy. Polluters should pay. Companies and other organisations that create pollution locally should incur a �nancial cost (or demonstrate how they are investing to change practices, for example in farming). Payments should be used to subsidise and incentivise greener initiatives. People and organisations creating the most emissions and who have the most money and power should lead the way.
Box 3.2: Principles for a Just Transition
1.
2.
3.
4.
5.
6.
7.
8.
9.
10.
11.

81
Cambridgeshire & Peterborough Independent Commission on Climate A Just Transition
The discussion at our events and the principles that have emerged have a lot in common with outputs from this kind of exercise and experience elsewhere. There was perhaps more emphasis on landscape and the issues facing farming, transport in rural areas, and the potential for a rural-urban divide. But the commonalities are very strong.
Shaped by the insights and priorities of jurors across four citizen’s juries held across the UK in 2020-21, the IPPR Environmental Justice Commission suggests 6 shifts in approach required for a successful transition, each of which has elements in common with what emerged from our local engagements:
From a problem to be mitigated to an opportunity to be seized: whilst recognising challenges of the transition, all communities also pointed to huge potential in drawing from their assets, skills and talents. They perceived multiple bene�ts, from decent jobs, to lower energy bills and public health bene�ts, to burgeoning wildlife and a healthier planet;
From fairness as an afterthought to fairness as a foundation: delivering in a fair way is seen as crucial to securing the legitimacy and e�cacy of the transition, and to building enduring support;
From being done to people to being done with and by them: an approach moving from one that is centralised and remote to one that is owned and informed by the public;
From silos and individuals to a whole-economy and all-society approach: there has been too much emphasis on what individuals must do, rather than creating the context that makes it easier for people to make the right choice.
From top-down alone to national leadership with local ownership and delivery: leadership is needed, but it must be designed around empowered localities, who own and deliver tailored solutions;
From climate alone to climate and nature together: the nature crisis is of equal importance and intimately linked to the climate crisis. The importance that people place on nature and access to green space is not re�ected in our national conversation.
Making the principles into a reality
Participants had a variety of suggestions to help take the principles forward, and help tackle some of the barriers:
Do no harm. All consultations included concerns about plans in the region which partici-pants felt were harmful to the environment and often local communities. These included excessive house building to inadequate standards, the proposed incinerator in Wisbech, and East-West Rail plans not being electri�ed. Participants were keen to see public money and public decisions doing public good, and for funding and permissions to stop going towards activities which are environmentally damaging. Sustainability should be considered for everything. Participants felt that every aspect of planning and other local policy must think about sustainability, from housing to local access to services. Ideas included assessment of all policies, procurements and investments from a sustainability perspective. This aligns with a recommendation in our March report - A climate change assessment should be undertaken and taken into account for every CPCA and Council policy, development, procurement, action.

82
Cambridgeshire & Peterborough Independent Commission on Climate A Just Transition
The sustainable choices must be a�ordable, convenient and safe. People were keen to see changes that enabled people to make better choices for the environment, by making these options easy, safe and a�ordable. This is particularly important for issues such as changes to transport, how homes are heated and diets. Whilst everyone needs to change their behaviour and engage in change, doing the sustainable thing should be the least expensive and easiest thing. This involves both carrot and stick - making environmentally positive things easier to do and polluting activities harder to do, not just for individuals but also for businesses and other local stakeholders. Many participants wanted to ensure that the approach was not solely punitive – incentivisation of environmentally friendly behav-iours, potentially followed by disincentives, would work best.
“It starts with listening more to people. People often have solutions themselves, but when they feel things are imposed upon them, they think “this isn’t fair!” (Fens panel quote)
Everyone has a part to play. Part of knowing how to play your part is knowing what to do and being enabled to do so. Giving opportunities to make a di�erence, even if only small, can lead people to want to do more.
All groups voiced concern that there was a lack of reliable, trust-worthy information on issues such as retro�t, transport and other key climate areas. In addition, �nding out how to participate in schemes and access funding needs to be simpler. Providing easy access to the information people need to participate is essential.
A few groups suggested something like Citizen’s Advice Hubs in local areas to support people through changes such as retro�t, or to �nd more information about actions they could take and how they can get involved locally. Funding for community advice schemes to support people and communities to take climate friendly actions, was popular amongst most groups.
A number of groups wanted to see support for more grass-roots local community initiatives to tackle climate change and more of a bottom-up approach to deliver our goals.
The Fens panel in particular, and other groups, felt that bringing on board local stakeholders who have a key role to play, such as farmers, was essential.
Several groups raised how important it is to involve workers in the change that impacts them – companies should work with their employees to do this.
All groups felt that there was strong ‘people power’ and local expertise, for example in community groups, which should be harnessed for climate action.
-
-
-
-
-
-
Ensure clear, inclusive, two-way and meaningful communication. All of the groups felt that communication strategies needed to be broadened to include deeper and more meaningful communication with people that enabled dialogue, bringing people together and providing clear information. Key to engagement is making people feel it applies to them, that they are shaping something that will impact them and feel that their input will be respected.

83
Cambridgeshire & Peterborough Independent Commission on Climate A Just Transition
“education is key…I think it probably is the most important thing: communica-tion” (Fens panel participant)
People were keen to see regular communication in the community, facilitated by things like road shows, going out into parishes and village halls, and funding local groups to take forward community engagement in ways suitable to their area. Other ideas included working with local media on climate communication and integrating information into everyday life such as on the side of buses, high streets, newspapers and radio. Multiple groups were keen to see the development of climate and nature champions to support information getting to communities.
All groups had a strong desire to engage young people, from school age and beyond, so that they know their future matters and how they can get involved. People felt that we should listen to the voices and ideas of young people and utilise their energy.
Many groups felt it was important to make sure that all communities are being reached and that communication is able to include minority groups, people on lower incomes, people with disabilities, people in food or fuel poverty, people in insecure work or who are unemployed, people whose jobs might be a�ected, and others not often engaged in local policy or climate dialogues. We need to communicate with everyone and leave no one behind, and this may involve �nancial support to enable more people to take part.
The need to communicate progress and hold people accountable was also mentioned. This includes transparency about funding and investment decisions, but also about timeframes for action so that communities know what to expect, can engage and can hold decision makers to account.
Many participants felt it was important to highlight not just the need to take action but the bene�ts of taking action and how it can improve lives locally, emphasising what we value as a community and the positive gains possible.
Other groups emphasised the need to use communication to help communities create a vision of their own future in the short, medium and long term and work towards it together.
-
-
-
-
-
-
Local decision making. There was a general feeling that the priorities and engagement of local people was important in all initiatives, ensuring that as well as listening to all voices we help people to design local solutions together. Each locality has di�erent issues and di�erent people that need to be considered.
All groups voiced support for more active democracy initiatives such as regular Citizen’s Assemblies with people able to deliberate over options, design their own projects, provide feedback, feel listened to and empowered to take action.
-
Local decision making is key, but there still needs to be joined up approaches across local areas. Some processes are more e�cient at a larger scale, for example, and areas can achieve more by working together to increase purchasing power. In some groups, the need for integrated planning and working together, rather than working in silos was seen as key to climate action.
-

84
Cambridgeshire & Peterborough Independent Commission on Climate A Just Transition
“people need to feel that…their opinions will be respected, and they will get feedback on their suggestions, even if it is not positive” (Fens climate panel participant)
The Fens panel felt it was important to make the most of councillors and existing institutions - supporting them to make the best decisions they can, engaging more with local policies and decision making, and learning from other areas to develop our approaches, including those who are using direct democracy such as the Fens panel.
People must always have the opportunity to provide feedback with transparency about how their input was used and why. The time and energy of those participating must be respected and the outputs used meaningfully.
The Fens panel in particular felt it was important to make consultations regular and joined up, bringing them together to ensure links between issues are clear and the work supports each other. There are lots of consultations in the region, but this can be overwhelming and did not always feel meaningful to participants. Across consultations people were keen to see that consultation and engagement is used a catalyst for climate action, not something that slows it down.
-
-
-
Actions must be fair locally, nationally and internationally. Concerns included a desire not to reduce our emissions locally by relying more on food from other parts of the world, or potentially exacerbating issues elsewhere by taking water from other regions of the UK. The Cambridge based consultation expressed concern not to o�shore emissions to other countries but to take local responsibility, considering international justice and fairness to future generations. There was a strong desire in all groups not to focus just on the cities, but to value and invest in our rural communities, tackling social and economic inequalities between regions.
We had a number of responses from local councils to our request for views and evidence, re�ect-ing their experiences of tackling inequality and climate change through local policy making. These were, in general, individual responses of o�cers, rather than representing collective views. They had much in common with views expressed by participants in the Fens panel and other consultations, with particular emphases – unsurprisingly - on issues where local powers are perceived to have the potential to make the greatest di�erence (e.g. planning powers to improve building standards; enforcement in relation to the private rented sectors) and the need to engage young people (Box 3.3).

85
Cambridgeshire & Peterborough Independent Commission on Climate A Just Transition
costs of retro�tting energy-e�ciency and low-carbon options, especially for lower-income households and those in fuel poverty;
cost and accessibility of public transport;
adequacy of new-build standards;
enforcement of MEES standards for private-rented accommodation;
inter-generational issues, given that younger people and future generations will face the worst consequences of climate change, depending on the actions we take today.
experience with the Well-being of Future Generations Act in Wales. This requires public bodies to think about the long-term impact of their actions and work more closely with communities and with each other;
a selective licensing approach used by Peterborough City Council, which requires all properties within the area to be licensed if they are to be privately rented, and rated at least EPC E (plans for this scheme post-October are being consulted on);
Cambridge City Council building new homes to Passivhaus standard, subject to feasibility and funding; targeting net zero standards for Council homes built from 2030, and investing to bring existing Council homes up to at least EPC C.
Box 3.3: Local council o�cer views
We sent local Councils a questionnaire, asking for inputs on the equity-related challenges facing their area, and suggestions for helping to take forward a just transition.
Issues that featured relatively prominently in responses included:
Examples of actions with potential wider application included:
Other examples are picked up in sector chapters.
Re�ections on the process
The processes of consultation used in the writing of this chapter were both informative and enjoyable. Participants shared meaningful contributions, and we appreciated the opportunity for deeper engagement and discussion, especially since the climate crisis can be a challenging topic of discussion. We were alerted to issues we had not considered, and gained insight into which previous recommendations most resonated with local people.
We were encouraged by the energy and enthusiasm that people have to get involved with action locally.
“I have felt inspired. It has shown me more people are likeminded and are desperate to help. Since the panel, I’ve also looked into a few avenues as to how I can serve the community and further support this important cause”(Fens panel participant)

86
Cambridgeshire & Peterborough Independent Commission on Climate A Just Transition
In future we can improve on some aspects of public engagement work. For example, the Fens panel provided �nancial support to participate and was held over a weekend, which made it more accessible than the civil society consultations. We only had a relatively short period of time to cover a very large issue, and this meant that some key areas such as what costs would be acceptable to people were not fully covered.
Overall, the outputs showed signi�cant consensus across di�erent groups and substantial agreement with previous research and surveys. They provided valuable content for all parts of the report and indicate how important deliberative democracy is to climate policy.
Climate policy, whilst based �rmly on science and research, is also something which touches the everyday lives of all people, from housing to transport to food. The residents of this region are experts in their own lives and communities, and we hope that this report re�ects how much we value their knowledge, insights and suggestions.
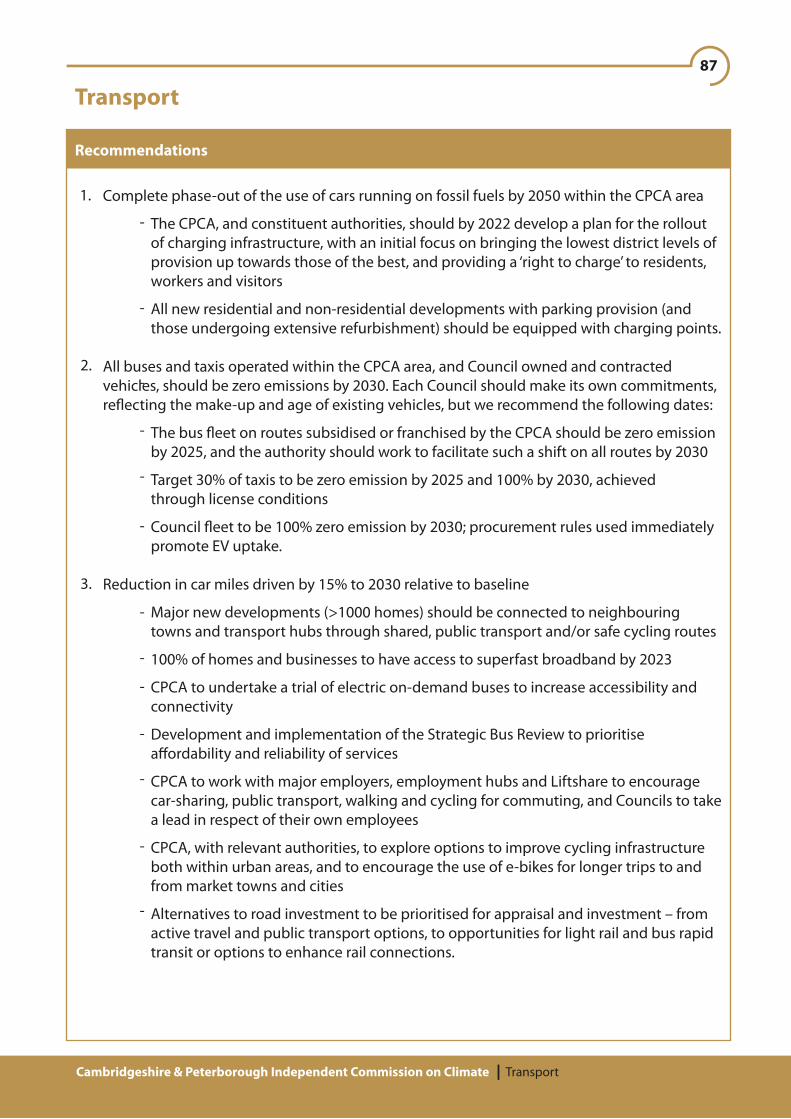
87
Complete phase-out of the use of cars running on fossil fuels by 2050 within the CPCA area
The CPCA, and constituent authorities, should by 2022 develop a plan for the rollout of charging infrastructure, with an initial focus on bringing the lowest district levels of provision up towards those of the best, and providing a ‘right to charge’ to residents, workers and visitors
All new residential and non-residential developments with parking provision (and those undergoing extensive refurbishment) should be equipped with charging points.
All buses and taxis operated within the CPCA area, and Council owned and contracted vehicles, should be zero emissions by 2030. Each Council should make its own commitments, re�ecting the make-up and age of existing vehicles, but we recommend the following dates:
The bus �eet on routes subsidised or franchised by the CPCA should be zero emission by 2025, and the authority should work to facilitate such a shift on all routes by 2030
Target 30% of taxis to be zero emission by 2025 and 100% by 2030, achieved through license conditions
Council �eet to be 100% zero emission by 2030; procurement rules used immediately promote EV uptake.
Reduction in car miles driven by 15% to 2030 relative to baseline
Major new developments (>1000 homes) should be connected to neighbouring towns and transport hubs through shared, public transport and/or safe cycling routes
100% of homes and businesses to have access to superfast broadband by 2023
CPCA to undertake a trial of electric on-demand buses to increase accessibility and connectivity
Development and implementation of the Strategic Bus Review to prioritise a�ordability and reliability of services
CPCA to work with major employers, employment hubs and Liftshare to encourage car-sharing, public transport, walking and cycling for commuting, and Councils to take a lead in respect of their own employees
CPCA, with relevant authorities, to explore options to improve cycling infrastructure both within urban areas, and to encourage the use of e-bikes for longer trips to and from market towns and cities
Alternatives to road investment to be prioritised for appraisal and investment – from active travel and public transport options, to opportunities for light rail and bus rapid transit or options to enhance rail connections.
Transport
Cambridgeshire & Peterborough Independent Commission on Climate Transport
Recommendations
1.
2.
3.
-
-
-
-
-
-
-
-
-
-
-
-
-
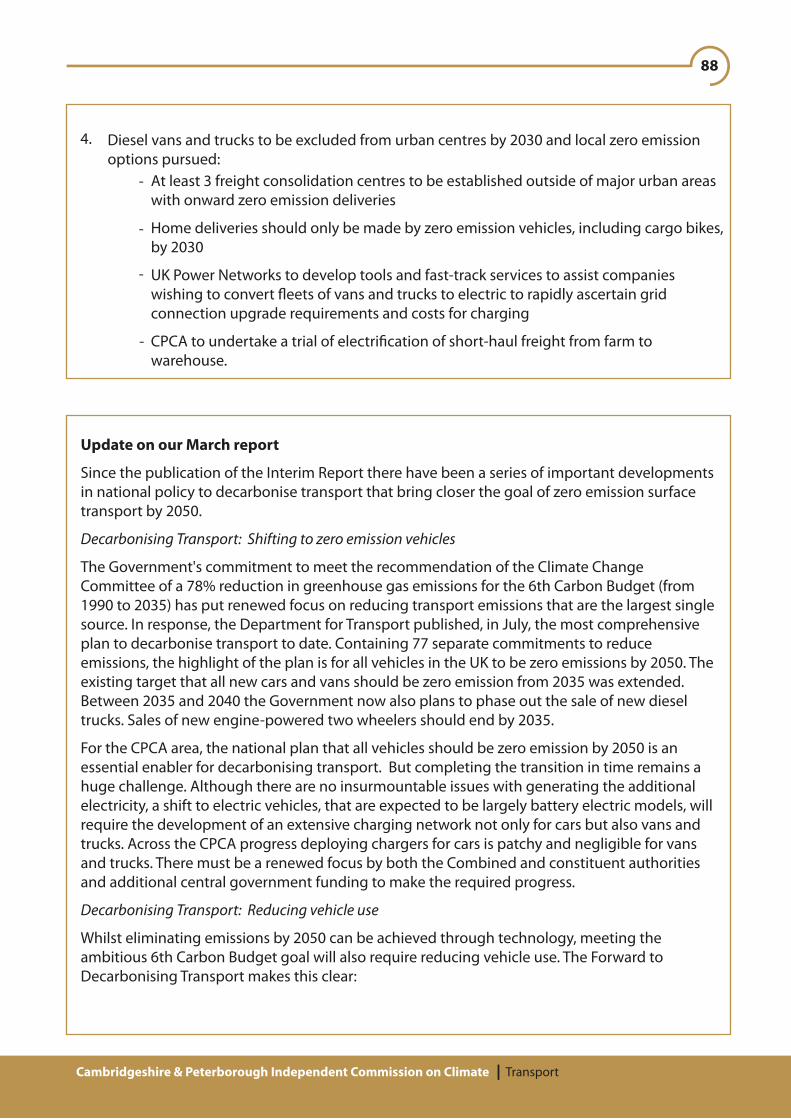
88
At least 3 freight consolidation centres to be established outside of major urban areas with onward zero emission deliveries
Home deliveries should only be made by zero emission vehicles, including cargo bikes, by 2030
UK Power Networks to develop tools and fast-track services to assist companies wishing to convert �eets of vans and trucks to electric to rapidly ascertain grid connection upgrade requirements and costs for charging
CPCA to undertake a trial of electri�cation of short-haul freight from farm to warehouse.
Cambridgeshire & Peterborough Independent Commission on Climate Transport
-
-
Diesel vans and trucks to be excluded from urban centres by 2030 and local zero emission options pursued:
-
-
4.
Update on our March report
Since the publication of the Interim Report there have been a series of important developments in national policy to decarbonise transport that bring closer the goal of zero emission surface transport by 2050.
Decarbonising Transport: Shifting to zero emission vehicles
The Government's commitment to meet the recommendation of the Climate Change Committee of a 78% reduction in greenhouse gas emissions for the 6th Carbon Budget (from 1990 to 2035) has put renewed focus on reducing transport emissions that are the largest single source. In response, the Department for Transport published, in July, the most comprehensive plan to decarbonise transport to date. Containing 77 separate commitments to reduce emissions, the highlight of the plan is for all vehicles in the UK to be zero emissions by 2050. The existing target that all new cars and vans should be zero emission from 2035 was extended. Between 2035 and 2040 the Government now also plans to phase out the sale of new diesel trucks. Sales of new engine-powered two wheelers should end by 2035.
For the CPCA area, the national plan that all vehicles should be zero emission by 2050 is an essential enabler for decarbonising transport. But completing the transition in time remains a huge challenge. Although there are no insurmountable issues with generating the additional electricity, a shift to electric vehicles, that are expected to be largely battery electric models, will require the development of an extensive charging network not only for cars but also vans and trucks. Across the CPCA progress deploying chargers for cars is patchy and negligible for vans and trucks. There must be a renewed focus by both the Combined and constituent authorities and additional central government funding to make the required progress.
Decarbonising Transport: Reducing vehicle use
Whilst eliminating emissions by 2050 can be achieved through technology, meeting the ambitious 6th Carbon Budget goal will also require reducing vehicle use. The Forward to Decarbonising Transport makes this clear:
89
Cambridgeshire & Peterborough Independent Commission on Climate Transport
Our Interim Report was critical of CPCA plans to reduce car use. Without action, the planned growth in housing and employment across the region will be accompanied by a huge increase in car use and road building that is entirely incompatible with meeting the region's climate goals. The Commission is therefore delighted that its recommendation to review and revise the Local Transport and Connectivity Plan is being taken forward and we look forward to its outcome in 2022.
Bus Back Better Strategy
In the Interim Report the Commission put considerable emphasis on steps to improve bus services. Since then, the Government has produced its Bus Back Better Strategy and laid out its aspiration for simple, cheap �at fares that you can pay with a contactless card. The Strategy emphasises the need for a network that feels like a network, with easy-to-understand services, consistent high standards and comprehensive information at the touch of a phone. There are also plans for green buses running faster and more reliably in special lanes. Crucially the Strategy emphasises the need for councils, who control the roads, and bus operators to work together.
Public transport in much of the CPCA region is inadequate and without improving services there is little prospect of attracting drivers out of their cars and onto buses. The Government has asked the CPCA and its authorities to step up and work with the bus industry to improve services - it is a challenge it should take up with urgency. Linked to this, it is promising that the Authority has been put through to the next round of the Government’s Zero Emission Bus Regional Areas Scheme (ZEBRA), seeking funds for up to 30 zero emission buses.
Cycling and walking investment
In March, the Government also announced its planned Cycling and walking investment strategy 2. The intention is, following the Comprehensive Spending Review, to produce a second 4-year statutory cycling and walking investment strategy (CWIS 2) including a multi-year funding settlement. New funds are still awaited but if the Government is good to its word the CPCA should seize the opportunity that should be created to encourage more active travel through better infrastructure.
Great British Railways
The announcement of Great Britain Railways, in May, marks a key change in the management of rail services throughout the CPCA area. A new public body will integrate the railways, owning the infrastructure, collecting fare revenue, running and planning the network, and setting most fares and timetables. It is far too soon to know the implications for rail services across the region but the decision to build the new South Cambridge station is certainly one step in the right direction.
“For most of us, changing how we travel may be a blend, not a binary – it's about using cars less, not giving them up completely. You'll still keep a car for some journeys – or maybe borrow one from a car club – but you'll also have an electric bike to get you to the station, perhaps take it on the train and ride it o� the other end, doing the door-to-door journey in a di�erent way. If your commute isn't possible at all by public transport, you might instead use a new app to �nd someone in the same industrial estate you can share a car with, cutting costs and parking hassle. Some big employers are already doing this to save hundreds of car journeys a day.”

90
Cambridgeshire & Peterborough Independent Commission on Climate Transport
In conclusion
National plans to decarbonise transport remain a work in progress, but there have been important steps forward. Progress must be accelerated, and high-level targets must be complemented by new regulations and funding to enable these to be met. But recent national policy developments undoubtedly create new opportunities for the CPCA that it is beginning to gasp.
Sources:
https://www.gov.uk/government/news/uk-enshrines-new-target-in-law-to-slash-emissions-by-78-by-2035 ; DfT (2021), Decarbonising Transport: A Better, Greener Britain, July 2021; DfT (2021), Bus Back Better: national bus strategy for England, March 2021; https://www.gov.uk/govern-ment/speeches/cycling-and-walking-investment-strategy-2 ; DfT (2021), Great British Railways, May 2021.
Transport – A Just Transition
In our engagements with the Fens panel and with civil society groups from across Cambridgeshire and Peterborough (Chapter 3), we asked people what might prevent climate actions being implemented in a fair way. We summarise here some of the key issues raised in relation to transport, and suggestions for how they might be tackled.
Many of the issues are picked up by our existing recommendations, for which there was strong support, though some felt they could be more ambitious.
Barriers and challenges identi�ed
All groups re�ected that individual car use is currently the easiest option for most people - other options often do not meet needs in terms of a�ordability, convenience (for both travel times and duration), reliability and comfort. For some urban participants there was a concern that many people may struggle to imagine the multiple ways our area would bene�t if our cities were less reliant on cars - making the prospects of change daunting. Some attendees in Huntingdon felt that transport choices are deeply embedded, and people needed help and education to change their habits. The need to make non-car travel more attractive to people came across strongly in all consultations.
“People are so disadvantaged in places that are farther out. Bus services have been cut down. Elderly people can’t cycle, so there is an even greater need for buses” (Fens panel participant)
“People are unlikely to choose a more expensive and time-consuming option on a regular basis, particularly when many people have busy lives and combine working with family life, looking after children etc” (Fens panel participant)
The lack of connection between villages and towns outside of city centres was a major concern for several groups. Fens panel participants felt that too often transport discussions are “removed from the reality of rural living”. Whilst it can be challenging to implement alternatives to cars in more rural areas, most people felt this was achievable and worthwhile even if it required deep reform to services and substantial investment. Rural communities were keen to see new and innovative transport models trialled.

91
Cambridgeshire & Peterborough Independent Commission on Climate Transport
Concerns were raised about the lack of public control over bus services, and the con�ict between pro�table routes and serving the needs of all areas of the region. Participants in Peterborough, South Cambridgeshire and East Cambridgeshire were especially concerned about this and Transport for London was mentioned frequently as an exemplar public ownership model.
In terms of cycling infrastructure, groups in Peterborough and the Fens felt more segregated, safer bike lanes were needed, along with better lighting, secure bike parking in city centres and cycling connections between di�erent towns. The Fens panel and others felt even in rural areas bikes or e-bikes could play an important part in increasing accessibility where “everything is so dispersed.”
There was a widespread feeling that current transport and local plans are reinforcing car dependence, locked in to an unhelpful cycle of predicting more travel and providing more roads rather than integrating more sustainable travel. Many participants were concerned about public services, utilities and employment centres being concentrated further away from people. Several groups felt that there is a lack of an integrated transport plan looking across di�erent areas, as well as a lack of coordination between regions.
“That question of supply and demand is already understood with roads - it's known that the more you build roads to increase capacity, the more people use them - so you can never provide "enough". This has already in�uenced road building, so maybe we should use the same principle with cycle infrastructure (i.e. if you build it, people will use it)?” (Fens panel participant)
All groups recognised that transport decarbonisation requires reducing the amount of car journeys taken and replacing fossil fuel vehicles with electric vehicles. The importance of cars for people with disabilities, and those living in rural areas was highlighted, and the Fens panel highlighted the need to consider the most vulnerable in the design of transport schemes. Groups in Cambridge felt that the bene�ts of EVs, such as reduced cost over their lifetime and better reliability, were not communicated enough. Groups including the Fens panel were conscious not to over-rely on electric vehicles, and to ensure fairness in terms of accessibility to required infrastructure.
“A car sharing scheme would be amazing, cars usually spend 95% of their time parked. It would also mean that each time you drove there was a direct �nancial cost to consider whether it was better to walk or cycle” (Peterborough participant)
Attendees at some events felt that big employers were not su�ciently supporting the infrastructure for sta� to get to work sustainability. The loss of shops, jobs and opportunities from local town centres was a concern for all groups, especially considering the fact that the poorest often live furthest from their jobs.

92
Cambridgeshire & Peterborough Independent Commission on Climate Transport
Ideas identi�ed by participants
Cycling -New developments, businesses and road improvements should have cycle routes -Support safe active travel during school hours e.g., the school streets scheme
Cars and EVs -Encourage EV sharing and EV hiring schemes, perhaps via the local authority, although car sharing schemes may not be as suitable in more rural locations and other options could be explored -Consider disincentives for petrol and diesel car use, designed with local communities, such as parking or other charges, to nudge people away from the car -Invest in on-street EV charging for those without driveways -Promote education about the bene�ts of EVs
Bus reform -Investigate options for public ownership / de-privatisation of local bus services -Invest in making public transport a�ordable and even free for some with particular needs -Investigate options for better integrated and connected public transport routes and services, e.g. travel hubs in di�erent areas, coordination between di�erent modes of transport -Invest in better connections for the villages and towns outside the cities -Redesign bus routes and try out new models of bus route design such as demand responsive buses, citizen’s committees to decide routes, use of electric shuttle buses, dynamic routes, and support for community transport schemes
Planning and development -Design for more local services with less travel distance, aiming for 20-minute communities and joining up communities with good transport links -Invest in transport infrastructure at all levels, including smaller community initiatives, not just the big-ticket investments -Help to incorporate biodiversity into sustainable travel e.g. bus stop greenery, shading for cycle paths (which also makes them more resilient to rising temperatures) -Invest in ensuring existing roads have accompanying cycle paths and pedestrian areas where appropriate -Have fewer parking spaces and replace them with bike spaces and nature

93
Cambridgeshire & Peterborough Independent Commission on Climate Transport
Summary
The CPCA area transport emissions were 2449ktCO2e in 2018, 44% of all CO2 emissions. This covers emissions from surface transport – cars, vans, HGV and rail. It is a signi�cantly higher share than in the UK as a whole (37%).
Emissions from surface transport in the CPCA area have been rising in recent years and in 2018 were 12% above their level in 2012. This is a greater level of increase than in the UK as a whole, where emissions rose 4% over the same period
Reaching net-zero across the UK by 2050 requires that transport emissions are reduced close to zero. Options to deliver this have been identi�ed. The Committee on Climate Change’s Balanced Pathway1 gets very close to zero emissions in 2050.
Many of the levers to achieve this – such as vehicle emissions standards – are at national level. But there is much that the CPCA and local actors can do as well, particularly around development of the charging network for electric vehicles (EVs); improving public transport; active travel measures to reduce demand and switch to cleaner modes (public transport, walking and cycling); improving the ease of working from or near to home; and management of deliveries in urban areas.
There are range of other bene�ts from taking these actions – Improved air quality and higher rates of walking and cycling (active travel) will be good for our health; better public transport can help meet transport needs and improve connectedness by linking people up to jobs, opportunities and services.
Transport in the Combined Authority Area
Overall transport emissions
Transport emissions across the Combined Authority were 2449 ktCO2 in 2018, around 2.9tCO2 per head of population. This is 50% higher than the average across the UK as a whole (1.9tCO2 per head) and re�ects relatively high level of tra�c for each of cars, vans and HGVs:
1 CCC (2020), The Sixth Carbon Budget, The UK’s path to Net Zero.
Car mileage in 2019 was around one-third higher than would be expected purely on the basis of population.
A small part of emissions, around 3%, are from rail. Given this small share, the main focus in this chapter will be on road emissions, though there are opportunities for light rail and enhanced rail connections which we consider.
With economic growth and population growth, tra�c is expected to rise further. Without policy intervention, the number of daily journeys in the region is projected to increase by around 20% from 2015 to 2031. Aside from carbon emissions, this has implications for a number of other concerns, including air quality and congestion:
Light van mileage in 2019 was 38% higher than expected based on population.
HGV mileage in 2019 was more than double the level expected purely on population.

94
Cambridgeshire & Peterborough Independent Commission on Climate Transport
The area within the Cambridge ring road was designated an air quality management area in 2004, mainly re�ecting high transport emissions. There have been some improvements in air quality since, but parts of the City continue to experience emissions above legal limits. Projected tra�c growth, without actions to tackle this, will increase the need for actions to address poor air quality;
Congestion is already a concern on speci�c routes.2 Average speed on major roads entering Cambridge during the rush hour is less than 60% of the “free �ow” speed. Car journey times in the afternoon peak could increase by up to 18% by 2041, particularly in Cambridge, East Cambridgeshire and South Cambridgeshire. Congestion will increase on the A47 between Peterborough and Wisbech, and in other urban areas, particularly Ely, Wisbech and Huntingdon.
2 The Cambridgeshire and Peterborough Local Transport Plan, Figures 1.3 and 1.4.
Actions to reduce emissions are likely, therefore, to have considerably wider bene�ts. But this also emphasises the importance of understanding why emissions are high in the �rst place.
Why are transport emissions high in CPCA?
In line with the high level of HGV mileage, the share of road transport emissions from HGVs is a little higher in the CPCA area than the UK as a whole (Figures 3.1). In general, however, the shares by vehicle type are not very di�erent, con�rming that high emissions are a re�ection of factors across both private car use and movement of freight.
65
60
55
50
45
40
35
30
25
20
15
10
5
0
Cars HGVs LGVs Buses Motorcycles
CPCA UK
Figure 3.1: Shares of road transport greenhouse gas emissions, CPCA and UK, 2017 (%)
Sources: CUSPE (2019), Net Zero Cambridgeshire; Final UK greenhouse gas emissions national statistics, 2017.

95
Cambridgeshire & Peterborough Independent Commission on Climate Transport
With the exception of Cambridge – which has particularly low emissions – CPCA districts rank badly for car emissions when compared with districts of similar characteristics (Box 3.1);
Emissions on minor roads are relatively high in all CPCA districts, again with the exception of Cambridge (Table 3.1).
Relatively high emissions in Huntingdonshire and South Cambridgeshire (Figure 3.2) may be partially a re�ection of tra�c on major A-roads that pass through these districts and the region (some HGV emissions, in particular, will re�ect strategic connectivity of the A14, A1(M) and M11, including freight to the ports of Harwich, Ipswich and Felixstowe on the East Coast). Through tra�c cannot, however, fully explain the high transport emissions in these districts nor in CPCA as a whole:
All road transport A-roads and minor roads Minor roads only
Peterborough
Cambridge
East Cambridgeshire
Fenland
Huntingdonshire
South Cambridgeshire
246 316 325
26 26 41
325 368 316
174 257 324
363 372 342
361 375 262
Table 3.1: Local authority rank for road transport emissions per head, UK, 2018 (383 authorities, 1=lowest; 383=highest)
5
4.5
4
3.5
3
2.5
2
1.5
1
0.5
0
Peterborough
Figure 3.2: Transport emissions across the CPCA, 2018
CPCA
UK
Cambridge EastCambridgeshire
Fenland Huntingdon SouthCambridgeshire
Emis
sion
s (t
CO2) p
er h
ead

96
Cambridgeshire & Peterborough Independent Commission on Climate Transport
Box 3.1: Car emissions by LA district in England
Analysis by Walker (2020) uses 2011 MOT data to compare car emissions across LAs in England. Districts are classi�ed by ONS indicators of prosperity/deprivation and rurality/urbanity, so that comparisons are made across groups of broadly similar characteristics. On this basis, South Cambridgeshire, East Cambridgeshire and Huntingdonshire are all found to have relatively high emissions within their group.
Source: Walker, R (2020), Transport carbon emissions variation by LA districts in England: Analysis of MOT date, Decarbon8 working paper 2.1.
Grouping Ranking for car emissionsper head
Peterborough
Cambridge
East Cambridgeshire
Fenland
South Cambridgeshire A�uent England 9th highest (of 51)
Town & Country Living 5th highest (of 64)
Town & Country Living
Town & Country Living
Business, Education andHeritage Centres
Urban Settlements
Huntingdonshire 12th highest (of 64)
Mid-ranking, but noted to have high emissions relative todeprivation level
5th lowest (of 29)
Mid-ranking (of 54)
Other factors, whether linked to need or a�uence, must play a big part in the observed high level of emissions:
Car ownership is high. The number of licensed cars was 620 per 1000 population across the CPCA at the end of 2019, compared with an average 495 for the UK as a whole;
Emissions in Cambridge and Peterborough are relatively low. These urban areas bene�t from better transport networks, with alternatives to the car. They also have more compact geography, with denser provision of services.
There is variation across districts, but a substantial part of the population is rural, with 43% living in market towns and 20% in rural settlements and villages, where car dependency is
Relative to population, the number of licensed cars is low in Cambridge, but above the national average in the other 5 districts within the CPCA;
The data are somewhat old now (Census 2011) but the proportion of households with a car is low in the urban areas of Cambridge (66%) and Peterborough (75%), but higher than 80% across the rest of the CPCA;
58% of the population of Cambridge and Peterborough are within 30 minutes of a major employment centre by public transport, but many in rural areas have longer journey times which makes access to jobs and services more di�cult without a car;3
-
-
-
3 See, for example, Local Transport Plan, Figure 1.6, which illustrates accessibility across CPCA.

97
Cambridgeshire & Peterborough Independent Commission on Climate Transport
Around 80% of employed residents of East Cambridgeshire and Fenland travel to work by car, van or motorcycle, possibly with relatively long journeys; as against below 40% in Cambridge.4
-
Recent trends
Emissions from surface transport in the CPCA area have been rising in recent years and in 2018 were 12% above their level in 2012. This is a greater level of increase than in the UK as a whole, where emissions rose 4% over the same period (Figure 3.3). Increases in vehicle-miles driven have outweighed the improved e�ciency of vehicles, with uptake of ultra-low emission vehicles still low:
Demand has increased steadily over the period. Since 2012 vehicle-miles driven have increased in CPCA area by 15% for cars, 34% for LGVs and 20% for HGVs (as compared with GB increases of 13%, 32% and 11% respectively).
The e�ciency and carbon-intensity of new cars and vans has improved under EU Directives. But petrol and diesel have remained the predominant source of fuel.
Across Cambridgeshire the number of Ultra-low emission vehicles (ULEVs)5 at the end of Q2 2020 is a similar proportion of the car stock as for the UK as a whole (just less than 1%);
This proportion is relatively high in Cambridge (1.3%) and South Cambridgeshire (1.2%), but low in Fenland (0.3%);
A high number of ULEVs are registered in Peterborough (7.4% of the car stock), but this number is dominated by vehicles owned by companies with a registered address in Peterborough – this does not necessarily re�ect that the vehicle is used there.
-
-
-
4 Travel to Work dataset, 2011 Census.
5 ULEVs are vehicles emitting less than 75gCO2/km.
Figure 3.3: Index of surface transport emissions for CPCA and UK (2005=100)
2005 2006 2007 2008 2009 2010 2011 2012 2013 2014 2015 2016 2017 2018
110
100
90
80
70
60
50
40
30
20
10
0
CPCA UK

98
Cambridgeshire & Peterborough Independent Commission on Climate Transport
6 CPCA (2020), The Cambridgeshire & Peterborough Local Transport Plan.
The Cambridgeshire and Peterborough Local Transport Plan (LTP)6 records that public transport is good in urban areas, but acknowledges that wider links within and across the Combined Authority area can be poor (note that data are for periods before the COVID-19 pandemic):
In common with trends across England as a whole, bus use has fallen signi�cantly in recent years – relative to population, passenger journeys fell by 21% from 2009-10 to 2019-20 in Cambridgeshire and 28% in Peterborough (down 18% across England).
A broadly similar proportion of bus mileage is on routes supported by the local authority as across England – 10% in Cambridgeshire and 12% in Peterborough, in 2019-20, as compared with 12% in England (outside London). Given the high rural population in CPCA a higher proportion of supported routes might have been expected.
The LTP vision is to “deliver a world-class transport network for Cambridgeshire and Peterborough that supports sustainable growth and opportunity for all”. In respect of the environment, it includes the goal to “protect and enhance our environment and implement measures to achieve net zero carbon”. There are supplementary documents in relation to delivery and policies which outline projects and measures on which progress will be important to review.
Whilst there are speci�c good examples, progress on emission reduction measures to date is limited and requires further development in order to become a coherent strategy across the area.
Provision of an adequate charging infrastructure for electric vehicles (EVs) is key to providing con�dence to incentivise their purchase. Across the CPCA as a whole, 172 standard public charging devices have been installed at October 2020, and 43 rapid charging devices. Relative to population, however, this is below the national average (Figures 3.4a and 3.4b). There is also big variation within CPCA. Provision in South Cambridgeshire is above national average; provision in Fenland is the lowest in the country. Funds have been available from the on-street residential charge-point scheme since 2018-19, but none of the districts within CPCA have received funding from this source up to 2020-21.
Plans in Greater Cambridge are relatively ambitious (Box 3.2). A feasibility study for a Clean Air Zone has also been conducted, funded by the Greater Cambridge Partnership with the participation of Cambridgeshire County Council. Feedback was sought in 2019, but plans currently appear stalled, though the COVID-19 pandemic will undoubtedly have made consideration more di�cult in 2020.
The Local Transport Plan commits to the provision of Local Cycling and Walking Infrastructure Plans (LCWIPs) to provide evidence for infrastructure investment.
The level of cycling in Cambridge is very high. More than a quarter of journeys to work are undertaken by bike – the highest share in the country.
-
Peterborough has a good network of cycling lanes, and has plans for an expanded network. The City Council was successful in 2019 in securing technical support from the Department for Transport to produce a LCWIP, and this will be released for public consultation shortly. The City Council has also been taking schemes forward with local schools to encourage cycling and active travel (Box 3.3).
-
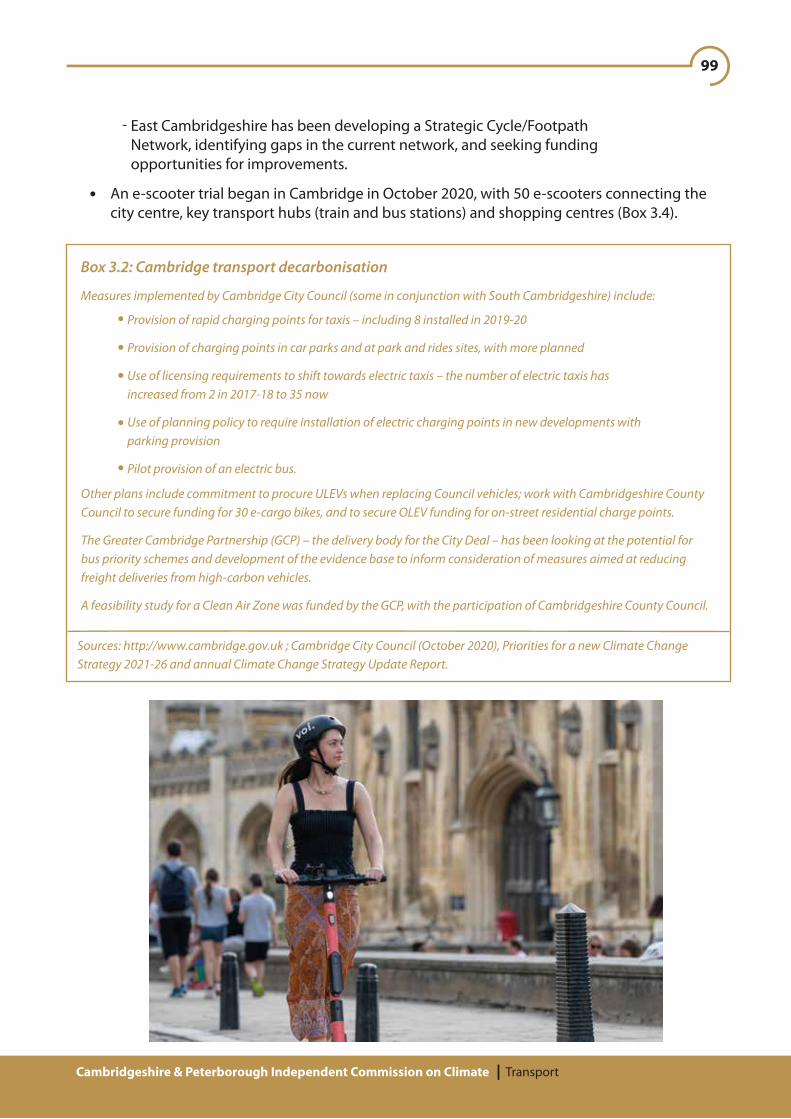
99
Cambridgeshire & Peterborough Independent Commission on Climate Transport
East Cambridgeshire has been developing a Strategic Cycle/Footpath Network, identifying gaps in the current network, and seeking funding opportunities for improvements.
-
An e-scooter trial began in Cambridge in October 2020, with 50 e-scooters connecting the city centre, key transport hubs (train and bus stations) and shopping centres (Box 3.4).
Box 3.2: Cambridge transport decarbonisation
Measures implemented by Cambridge City Council (some in conjunction with South Cambridgeshire) include:
Provision of rapid charging points for taxis – including 8 installed in 2019-20
Provision of charging points in car parks and at park and rides sites, with more planned
Use of licensing requirements to shift towards electric taxis – the number of electric taxis has increased from 2 in 2017-18 to 35 now
Use of planning policy to require installation of electric charging points in new developments with parking provision
Pilot provision of an electric bus.
Other plans include commitment to procure ULEVs when replacing Council vehicles; work with Cambridgeshire County Council to secure funding for 30 e-cargo bikes, and to secure OLEV funding for on-street residential charge points.
The Greater Cambridge Partnership (GCP) – the delivery body for the City Deal – has been looking at the potential for bus priority schemes and development of the evidence base to inform consideration of measures aimed at reducing freight deliveries from high-carbon vehicles.
A feasibility study for a Clean Air Zone was funded by the GCP, with the participation of Cambridgeshire County Council.
Sources: http://www.cambridge.gov.uk ; Cambridge City Council (October 2020), Priorities for a new Climate Change Strategy 2021-26 and annual Climate Change Strategy Update Report.
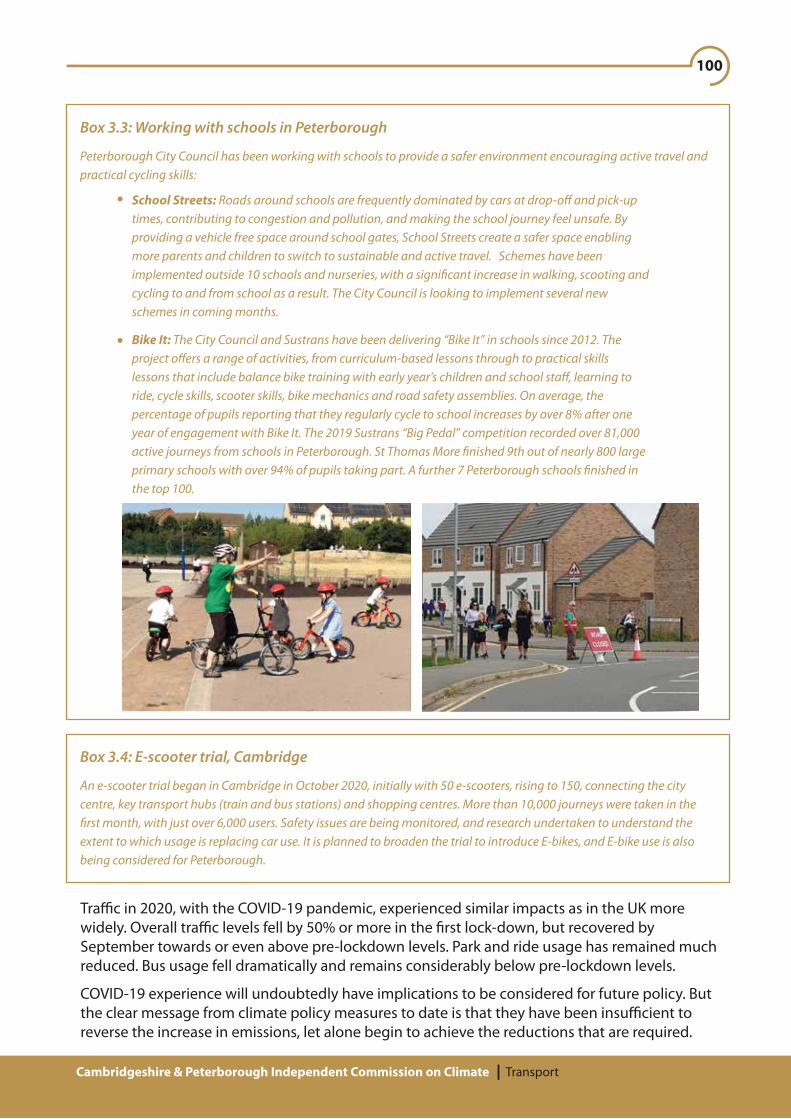
100
Cambridgeshire & Peterborough Independent Commission on Climate Transport
Box 3.3: Working with schools in Peterborough
Peterborough City Council has been working with schools to provide a safer environment encouraging active travel and practical cycling skills:
School Streets: Roads around schools are frequently dominated by cars at drop-o� and pick-up times, contributing to congestion and pollution, and making the school journey feel unsafe. By providing a vehicle free space around school gates, School Streets create a safer space enabling more parents and children to switch to sustainable and active travel. Schemes have been implemented outside 10 schools and nurseries, with a signi�cant increase in walking, scooting and cycling to and from school as a result. The City Council is looking to implement several new schemes in coming months.
Bike It: The City Council and Sustrans have been delivering “Bike It” in schools since 2012. The project o�ers a range of activities, from curriculum-based lessons through to practical skills lessons that include balance bike training with early year’s children and school sta�, learning to ride, cycle skills, scooter skills, bike mechanics and road safety assemblies. On average, the percentage of pupils reporting that they regularly cycle to school increases by over 8% after one year of engagement with Bike It. The 2019 Sustrans “Big Pedal” competition recorded over 81,000 active journeys from schools in Peterborough. St Thomas More �nished 9th out of nearly 800 large primary schools with over 94% of pupils taking part. A further 7 Peterborough schools �nished in the top 100.
Box 3.4: E-scooter trial, Cambridge
An e-scooter trial began in Cambridge in October 2020, initially with 50 e-scooters, rising to 150, connecting the city centre, key transport hubs (train and bus stations) and shopping centres. More than 10,000 journeys were taken in the �rst month, with just over 6,000 users. Safety issues are being monitored, and research undertaken to understand the extent to which usage is replacing car use. It is planned to broaden the trial to introduce E-bikes, and E-bike use is also being considered for Peterborough.
Tra�c in 2020, with the COVID-19 pandemic, experienced similar impacts as in the UK more widely. Overall tra�c levels fell by 50% or more in the �rst lock-down, but recovered by September towards or even above pre-lockdown levels. Park and ride usage has remained much reduced. Bus usage fell dramatically and remains considerably below pre-lockdown levels.
COVID-19 experience will undoubtedly have implications to be considered for future policy. But the clear message from climate policy measures to date is that they have been insu�cient to reverse the increase in emissions, let alone begin to achieve the reductions that are required.
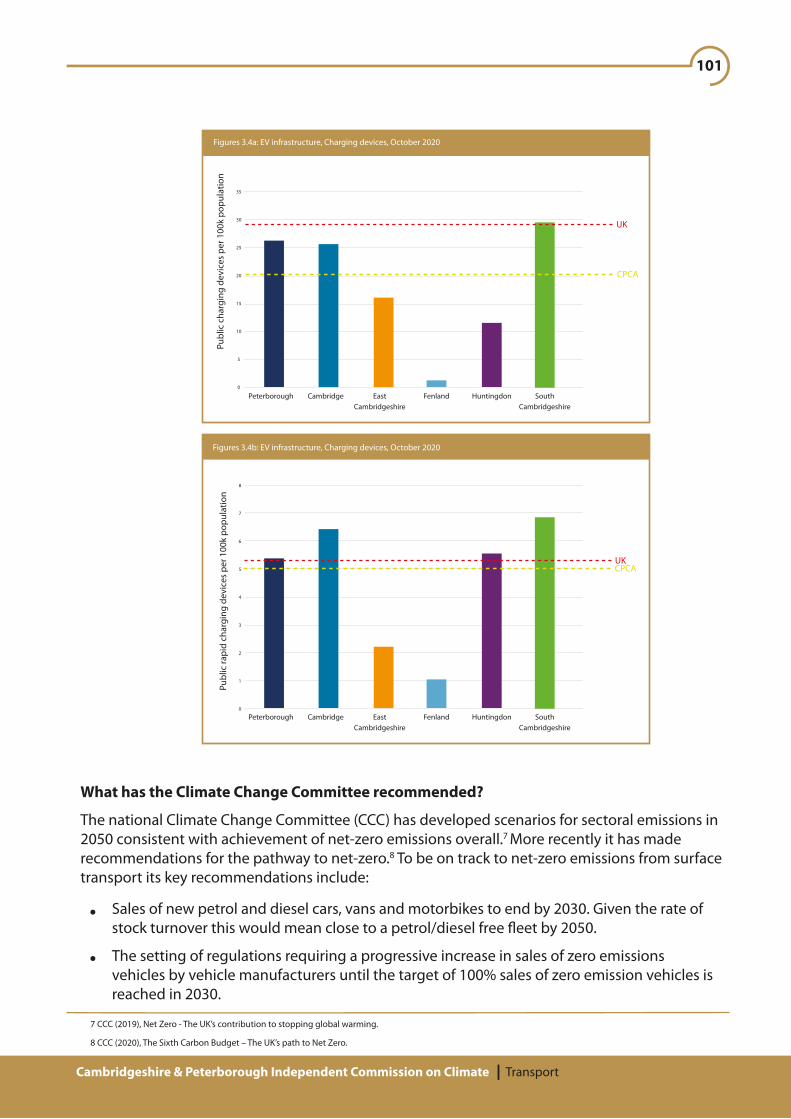
101
Cambridgeshire & Peterborough Independent Commission on Climate Transport
7 CCC (2019), Net Zero - The UK’s contribution to stopping global warming.
8 CCC (2020), The Sixth Carbon Budget – The UK’s path to Net Zero.
35
30
25
20
15
10
5
0
Peterborough
Figures 3.4a: EV infrastructure, Charging devices, October 2020
CPCA
UK
Cambridge EastCambridgeshire
Fenland Huntingdon SouthCambridgeshire
Publ
ic c
harg
ing
devi
ces
per 1
00k
popu
latio
n
8
7
6
5
4
3
2
1
0
Peterborough
Figures 3.4b: EV infrastructure, Charging devices, October 2020
CPCAUK
Cambridge EastCambridgeshire
Fenland Huntingdon SouthCambridgeshire
Publ
ic ra
pid
char
ging
dev
ices
per
100
k po
pula
tion
What has the Climate Change Committee recommended?
The national Climate Change Committee (CCC) has developed scenarios for sectoral emissions in 2050 consistent with achievement of net-zero emissions overall.7 More recently it has made recommendations for the pathway to net-zero.8 To be on track to net-zero emissions from surface transport its key recommendations include:
Sales of new petrol and diesel cars, vans and motorbikes to end by 2030. Given the rate of stock turnover this would mean close to a petrol/diesel free �eet by 2050.
The setting of regulations requiring a progressive increase in sales of zero emissions vehicles by vehicle manufacturers until the target of 100% sales of zero emission vehicles is reached in 2030.

102
Cambridgeshire & Peterborough Independent Commission on Climate Transport
9 HMG (2020), The Ten Point Plan for a Green Industrial Revolution, November 2020.
The development of charging infrastructure to allow the growth of EVs, consistent with the phase-out of petrol and diesel cars and vans. This should include infrastructure for those without individual o�-street parking.
Investment in walking and cycling infrastructure and strengthening of other schemes to support active travel modes.
Investment in public transport and other measures to reduce car travel demand. These other measures could include incentives for car sharing and mobility as a service, and improved infrastructure connectivity to lock-in positive behaviours that reduce travel demand:
These demand reduction and public transport measures reduce car km driven, against baseline, by 7-16% by 2030;
The CCC notes that the Confederation of Passenger Transport has set a target for all new buses to be ultra-low or zero-emission by 2025; it assumes that all sales of new buses are zero-Carbon by 2035.
-
-
In relation to freight the CCC proposes:
The development and implementation of a strategy to transition to zero- carbon freight, including stronger purchase incentives, infrastructure plans and clean air zones.
Schemes should be implemented and evaluated to reduce HGV and van use in urban areas (e.g. e-cargo bikes and use of urban consolidation centres), to reduce tra�c and improve safety of active travel.
Zero-emission HGVs should be trialled to establish the most suitable and cost-e�ective technology for UK. Evaluate existing and increase support for HGV logistics improvement schemes. Incentives to buy more e�cient and zero-carbon HGVs should be increased.
-
-
-
Government policy
The UK Government recognises that policies are not currently in place to deliver net-zero emissions, but has set out substantial ambition for transport within its recent 10-Point Plan: 9
Electric vehicles: an end to the sale of new petrol and diesel cars and vans by 2030, with all vehicles required to have signi�cant zero-emission capability by 2030, and 100% zero- emissions from 2035.
Funding of £1.3bn to accelerate the roll-out of charging infrastructure – rapid charge points on motorways and major roads, and on-street charge points near homes and workplaces.
Continued funding to 2022-23 of purchase incentives through the Plug-in Car and Van grant.
-
-

103
Cambridgeshire & Peterborough Independent Commission on Climate Transport
10 CCC (2019), Net Zero – Technical Report.
11 CCC (2020), The Sixth Carbon Budget – Methodology Report.
12 CUSPE (2019), Net Zero Cambridgeshire.
A consultation on the phase out date for sales of new diesel HGVs, with £300m funding next year for trials of hydrogen and other zero-emission lorries.
Increased funding for public transport and the provision of active travel infrastructure.
Integrated bus and train networks in more places, with smart ticketing, more frequent services and provision of bus lanes;
Funding for zero emission buses (£120m in 2021-22, su�cient to switch 12% of the local operator bus �eet in England);
More rural on-demand services and restoration of some rail links;
More segregated cycle lanes and low-tra�c neighbourhoods, with a new body Active Travel England, to hold the budget and assess local authority performance.
Over 1,000 miles of cycling and walking networks to be delivered by 2025, with network plans developed and built out in every town and city in England.
-
-
-
-
-
Further elaboration of these commitments and development of policy will be required to deliver net zero ambition. Both a National Bus Strategy and a Transport Decarbonisation Plan are due to be published in 2021.
Evidence base for the emissions reduction requirement to 2050 and assessment of options
In assessing the scale of the challenge for CPCA in moving towards net-zero, and the available options, we have considered evidence from a range of sources. This section summarises some of the key sources.
CCC Net Zero Technical Report / CCC CB6 recommendation
The CCC’s Net Zero Report and Net Zero Technical Report10,published in May 2019, provide an assessment of options to take the UK to net zero emissions by 2050. The Sixth Carbon Budget Report and Methodology Report11 update this analysis, with a focus on the pathway for emissions through the 2020s and to the sixth carbon budget period (2033-37). This includes a pathway for emissions from surface transport – covering vehicle e�ciency, zero-emission vehicles, demand reduction and modal shift.
Net Zero Cambridgeshire (CUSPE) report
The Net Zero Cambridgeshire (CUSPE) report12 considers the make-up of emissions in the CPCA region and provides projections to 2050 for a number of possible scenarios. Re�ecting an increasing population and employment growth, road tra�c is projected – without policy interventions - to increase 30% by 2031. Nevertheless, allowing for the gradual electri�cation of the car and LGV �eets (in line with national measures), a baseline projection shows emissions falling by 43% between 2017 and 2050.
Applying assumptions consistent with the CCC’s Further Ambition scenario, which informed the CCC’s net-zero recommendation to the UK Government, CUSPE’s assessment �nds CPCA area transport emissions are reduced by 96% to 2050. Important to this reduction are provision of an
104
Cambridgeshire & Peterborough Independent Commission on Climate Transport
EV charging infrastructure, local incentives for EV purchase, and measures to reduce demand for car travel.
Local Transport Plan
The Cambridgeshire and Peterborough Local Transport Plan (LTP) re�ects the role of the Combined Authority as Local Transport Authority and sets the policy framework for the development, design and implementation of transport interventions across the area. It provides a vision to “develop a world-class transport network for Cambridgeshire and Peterborough that supports sustainable growth and opportunity for all”.
Beneath this vision the plan includes goals for the economy, for society, and the environment – speci�cally, in the latter case, to “protect and enhance our environment and implement measures to achieve net zero carbon”.
The LTP draws on a wide evidence base and consultation with the public and wider stakeholders. It contains a mix of proposals for public transport, active travel and road improvements. In practice, however, it over-emphasises road building as a transport solution to increasing population and work commuting, with insu�cient emphasis on measures to reduce demand. A considerable number of schemes are suggested, each to be subject to an individual business case if and when taken forward. The LTP does not quantify13 the overall impacts on tra�c and emissions, and so does not include a pathway of how the net zero aspiration is to be met. An overarching transport model would enable this assessment to be undertaken – CPCA should consider investment and development of scenario planning in a refresh of the LTP and in assessing the results from scheme implementation.
Place Based Climate Action Network
We commissioned work on a net zero carbon roadmap for the region from the Place Based Climate Action Network (PCAN)14 (Chapter 2). This found that many emission reduction measures within the surface transport sector are cost-e�ective – they would more than pay for themselves through the energy cost reductions they would generate. Overall, these cost-e�ective measures could close the gap between projected transport emissions in 2050 and net zero by around 77%. This is a bigger reduction than in other sectors of the economy (housing, public and commercial buildings, industry).
Other measures are identi�ed that could close a further 15% of the gap.
Amongst the cost-e�ective options are measures to achieve mode shift (from use of the car to public transport, walking and cycling), and the shift to electric vehicles.
COVID-19 impacts
Under a Restart monitoring programme, the CPCA has been monitoring tra�c levels in response to the COVID-19 pandemic. Bus usage has been in decline for some years, but probably the most striking aspect of transport experience under the pandemic has been the decline in public transport use. In common with policy nationally, measures to restore public con�dence in public transport are likely to be a priority area of focus as – with vaccines – we come out of the pandemic.
14 PCAN (2021), A Net-Zero Carbon Roadmap for Cambridgeshire and Peterborough, Sudmant, A., Duncan A., Gouldson, A., ESRC Place Based Climate Action Network, University of Leeds.
13: Risk appraisal of emissions impact can be found in the LTP Strategic Environmental Assessment - Environmental Report, May 2019

105
Cambridgeshire & Peterborough Independent Commission on Climate Transport
Public engagement
It is essential that emissions reductions are delivered in ways that work for people.
Evidence from public engagement activities suggests that, presented with evidence about the impacts of climate change and options to reduce emissions, people are very willing to engage and to consider, and support, a range of actions (Box 3.5). In relation to transport there is strong support for the switch to electric vehicles, for improved public transport and measures to support active travel. Our own survey results are consistent with this.
There were some di�erences between those who responded direct to our survey, and those recruited (“targeted”) through a survey company:
Both groups tended to be positive about use of residential parking zones and zones used to limit vehicle access. But the targeted respondents were much less positive about tolls or other motoring charges;
High numbers expected their next car to be an electric or low-carbon vehicle. But this was lower amongst the target respondents (41%) than the direct respondents (60%);
Both groups were strongly in favour of measures to consolidate deliveries.
The di�erences are likely to re�ect that those who responded directly to our survey are weighted towards those who are most committed to act. In general, however, responses to our survey provided strong support for action and indicate a willingness to consider a wide range of options, though there may still be more work to do to convince more people of the bene�ts of EVs and the need to switch (many respondents highlighted cost as an issue, so this may change as the EV market expands and costs become more competitive).
106
Cambridgeshire & Peterborough Independent Commission on Climate Transport
Box 3.5: Evidence from public engagement
The Climate Assembly UK was commissioned in 2020 to examine the question, “How should the UK meet its target of net zero greenhouse gas emissions by 2050?”. The Assembly did not consider freight, but key aspects of their advice in relation to surface transport included:
An emphasis on a shift to EVs and to improved public transport, rather than restrictions on travel and lifestyles (with large reductions in car use).
Speci�c recommendations to ban the sale of new petrol, diesel and hybrid cars by 2030-35, and to reduce car use by an average 2-5% per decade.
Broad desires to ensure solutions are accessible and a�ordable to all sections of society, and to help create signi�cant change at the level of the individual, through education and appropriate incentives.
A Greater Cambridge Citizen’s Assembly was convened in 2019, to develop recommendations on how to reduce congestion, improve air quality and provide better public transport. The Assembly was made up of 53 randomly selected residents from Greater Cambridge and the wider travel to work area.
Outcomes commanding the highest support from assembly members were to:
Provide a�ordable public transport
Provide fast and reliable public transport
Be environmental and zero carbon
Restrict the city centre to only clean and electric vehicles
Be people centred – prioritise pedestrians and cyclists
Manage as one consolidated system
Enable interconnection.
Speci�c supporting measures attracting support included: franchising of buses; use of electric bikes; a lollipop bus service with low emission EVs; explore the viability of long-distance buses using the Park and Ride; establishment of a heavy-duty depot outside Cambridge, with last-mile delivery through electric van/pedal power.
Individual measures attracted a range of views, but there was in general a high level of support for action and ambition. Key messages developed by the assembly included recommendations for decision-makers to “be brave, be bold and take action” and that” improvements in public transport need to come �rst”.
The CPICC Survey included a number of transport-related questions. A high proportion of respondents (88% of direct respondents; 85% of targeted respondents) viewed transport as an important area for the Commission to focus on. Measures attracting most support were improved quality of public transport (43% of direct respondents; 51% of targeted respondents) and encouragement of active travel (34% of direct respondents; 28% of targeted respondents).
Speci�c measures attracted varying levels of support. The balance of respondents supporting or tending to support consideration of measures was as follows:

107
Cambridgeshire & Peterborough Independent Commission on Climate Transport
The targeted respondents were considerably less favourably inclined to measures including an element of �nancial charge than the direct respondents. They were more positive about residential parking zones. Both groups were very positive about measures requiring consolidation of deliveries.
Opinions were more favourable to options involving road user charging if the money raised would be invested back to improve public transport or cycling and walking infrastructure.
A high number of direct respondents (60%) were planning to switch to an EV or low-carbon vehicle on their next purchase (and 9% already owned an EV). Support was lower amongst the targeted respondents – 41% thought their next vehicle would be low-carbon and 4% already own an EV, leaving 55% not likely to switch at present. The biggest barrier to switching, for both groups, was cost. But almost one third of each group also felt that there was a lack of access to charging where they lived and park.
Sources: Climate Assembly UK – The Path to Net Zero (September 2020); Greater Cambridge Citizen’s Assembly on Congestion, Air Quality and Public Transport, Report and Recommendations (November 2019), Greater Cambridge Partnership, Involve Foundation, Sortition Partnership; CPICC.
Balance supporting (+ve)or against (-ve) consideration
Direct respondents
Requiring deliveries to begathered (thereby reducingvan and lorry trips)
Charging to travel within a zone
Increased parking costs
Road tolls
Limiting vehicle access to a zone
- 4% - 36%
+ 22% - 8%
+ 53% +32%
- 14% -56%
+ 19% +27%
+ 67% +54%
Balance supporting(+ve) or against (-ve)consideration
Targeted respondents
Measure
Residential parking zones
Key areas for action
Many of the actions required to deliver net zero transport are for national Government. But this still leaves the CPCA and local authorities with substantial powers and in�uence in many areas.
Electric vehicles
There is evidence that the provision of charging infrastructure has an impact in inducing EV demand.15 Clearly, to support the switch to electric vehicles envisaged by national policy, a substantial infrastructure will be required. The CUSPE report suggests the need, consistent with net zero, for 60 rapid chargers near main roads and 3500 public chargers in towns and cities in the region, a 20-fold increase on today.
15 Morton, C, Anable, J, Yeboah, G and Cottrill, C (2018), The Spatial Pattern of Demand in the Early Market for EVs: Evidence from the UK, Journal of Transport Geography.

108
Cambridgeshire & Peterborough Independent Commission on Climate Transport
Currently, the level of provision of electric vehicle charging points varies signi�cantly within the CPCA area and overall is below national average. The CPCA has plans to develop an Electric Vehicle Strategy. Developing the public charging network should be core to this strategy – much of this will be on-street, but also at sites such as car parks and park and ride. The early ambition for this strategy should be to bring the areas in the CPCA region with below average provision, such as Fenland and Huntingdonshire, up to the levels of the best. We have written to the CPCA and constituent authorities to emphasise the importance of this charging network and seek commitments to extend provision.
Cambridge is currently trialling the provision of an electric bus. Switching to electric buses should be expected to become the norm. The Government has announced funding to accelerate the switch (£120m in 2021-22 to fund at least 4,000 zero emission buses nationally, around 12% of the local operator �eet in England). The authorities in CPCA should aim to be in the vanguard, and – in conjunction with the electricity network provider and Ofgem - develop plans and a timeline for this transition. We have, for example, seen proposals for Cambridge beginning with electri�cation of the buses from the park and ride sites (Box 3.6) – use of opportunity charging at the start and end of the route reducing the peak demand on the grid. It is not for us to specify details of how the transition is best achieved, but the end-point of a fully decarbonised bus �eet should now be the accepted goal.
The planning system can also prioritise provision of charging points. The Government has consulted on potential requirements for new-build, but not yet announced conclusions. In the meantime, planning authorities in the CPCA should not hold back - Cambridge City Council has introduced requirements for new residential and non-residential developments that should, at minimum, be replicated more widely. It will be lower cost to progress such measures now than have to retro�t later.
Box 3.6: An example scheme for park and ride bus electri�cation in Cambridge
A case study for bus and road freight electri�cation in Cambridge has been proposed by Nicolaides et al (2018).
Previous assessments of bus and freight electri�cation have assumed overnight charging at depots. This requires large, expensive on-board batteries, which run-down their charge over the course of the day. There are also implications for the electricity supply network, which may need upgrading to meet considerable charging demand.
Nicolaides at al provide cost estimates for an alternative “opportunity charging” option, starting with provision of charging infrastructure at either end of a Park and Ride bus route. With the bus topping up its battery at these points, a much smaller battery is required and peak demand on electricity supply much reduced. Overall costs are estimated much lower.
It is suggested that the principle of opportunity charging could be extended to freight deliveries, and to refuse vehicles, with top-up charging at key locations on routes (e.g. at depots, bus stops, or when unloading at major stores).
Source: Nicolaides, D, Cebon, D, Miles, J, An urban charging infrastructure for electric and freight operations: A case study for Cambridge, UK, IEEE System Journal, August 2018.
109
Cambridgeshire & Peterborough Independent Commission on Climate Transport
Cambridge has been developing understanding of the case for a Clean Air Zone, primarily aimed at meeting targets for Air Quality and reductions in tra�c. As it returns to consider such plans, design measures which would incentivise the use of electric vehicles should be examined – such as higher levels of access. There is supporting evidence from experience with the London congestion charge that exemption for EVs increased levels of adoption;
The CPCA and local business organisations should promote the use of the salary sacri�ce scheme for EV purchase (Box 3.7). Cambridge Ahead is known to have brought the scheme to the attention of its members. The tax relief provided through this scheme makes a signi�cant di�erence to purchase costs (a 32% saving for a basic rate taxpayer).
We do not rule out that hydrogen may provide an option for decarbonisation of some vehicles, particularly buses on longer routes and long-haul lorries. But what hydrogen is available is likely to be costly and have limited availability locally, and should therefore be reserved for uses which are otherwise the most di�cult to decarbonise. Electri�cation must currently be regarded as the priority.
Public transport
As well as use of electric cars and buses, it is important to increase the capacity for ‘modal shift’ – where less people are using their cars and public transport is an a�ordable, reliable and feasible option for many of our citizens. In order to do this, the public transport available must be green, but also a�ordable, reliable and meet peoples’ needs.
The strengths and weakness of public transport provision in the area are widely recognised. In the major cities of Cambridge and Peterborough, the bus networks are relatively good, and extend to direct links with neighbouring towns. Outside these cities, however, the network is weak with poor access to key services and amenities.
Box 3.7: EV Salary Sacri�ce Scheme
The salary sacri�ce scheme allows the cost of a qualifying EV to be met from salary before tax, thereby providing a considerable saving to the employee (32% for a basic rate taxpayer and 42% for a higher rate taxpayer.
The employer has to be willing to set up the scheme – in e�ect, the employer leases the car from a supplier, and the employee leases it from the employer. The monthly payment made by the employee covers road tax, insurance, breakdown cover and servicing costs as well as the lease.
Prior to April 2020 the EV would have been taxed as a bene�t on kind, removing much of the �nancial gain. Under the current scheme, from April 2020, the bene�t in kind tax has been reduced to zero (and will be only 1% in 2021-22 and 2% in 2022-23).
The �nancial gain is therefore very considerable.
In relation to purchase incentives for EVs, the Government has committed to continuation of the Plug-in Car and Van grants for at least another couple of years. Whilst the up-front cost of an EV is likely to remain above that of the conventional alternative for some time,16 we can soon expect to see the lifetime costs of EVs approach parity with that of conventional fossil-fuelled vehicles. Local measures to help incentivise EV purchase and use could supplement national measures:
16 The CCC expects price parity by 2030.

110
Cambridgeshire & Peterborough Independent Commission on Climate Transport
From the perspective of the user, the key to transforming public transport for the better lies in cost competitiveness with use of the car, but also in making the service more convenient – a relible service; knowing where the vehicle is and when it can be expected; being able to book and pay for a service easily (for most, this is likely to mean with a hand-held device). It will also, post-COVID-19, have to feel safe again.
An improved public transport network has the potential to induce mode shift away from cars, with bene�ts in reduced greenhouse gas emissions. If the public transport provision shifts further away from fossil fuelled vehicles towards low-carbon vehicles, this bene�t can be further increased. The case for public transport investment, however, rests on wider arguments than mode shift: accessibility/opportunities; air quality improvement; congestion reduction; and economic growth. It is particularly important that public transport plans ensure a�ordability, and that more deprived communities are thereby able to access services and opportunities.
The Strategic Bus Review will need to take a holistic view of these bene�ts. Part of this consideration, however, should be to look at the opportunities for an expansion of on-demand provision. Many rural routes are currently subsidised. There is potential to shift this subsidy towards provision of on-demand services, with bene�ts in terms of convenience and service quality to users, and emissions savings from the use of electric vehicles. Provided average vehicle occupancy can be maintained at reasonable levels there is potential for savings in subsidy payments once services become established.
One option that could be actively considered is an on-demand service connecting isolated locations with traditional bus services operating along the main roads connecting major towns. This could be complemented by secure bicycle parking at bus stops on linking routes, to enable people to use bikes or e-bikes to connect with bus services. Making buses more accessible will make bus services more attractive and could also induce some mode shift away from cars (and cost savings for the user).
The CPCA is currently exploring the possibility of a pilot on-demand service in Huntingdonshire, to run on top of existing services. This seems an appropriate next step.
Other options for autonomous public transport systems are being developed. The most signi�cant of these currently is the proposed Cambridgeshire Autonomous Metro (CAM),17 connecting St Neots, Alconbury, Mildenhall and Haverhill with Cambridge, and including tunnels beneath Cambridge city centre. This aims to deliver high quality public transport with electric vehicles, and active travel links to feed the wider area into the service. It would also connect through the major new developments already allocated in Local Plans, supporting economic growth and the delivery of future new jobs, with connections to new homes and to key railway stations.
In the long-term, it has been suggested that the CAM network could be expanded beyond the current proposal. The wider use of autonomous mass transit systems has been explored in a paper for the Greater Cambridge Partnership.18 This suggests that such systems have potential to be signi�cantly lower cost than rail, and that the Cambridge guided busway (north and south sections) could be the starting point for further demonstrations and development.
17 https://cam-metro.co.uk/
18CPIER (2018), Cambridgeshire & Peterborough Independent Economic Review, Final Report.

111
Cambridgeshire & Peterborough Independent Commission on Climate Transport
The Cambridge and Peterborough Independent Economic Review (CPIER) identi�ed a package of infrastructure projects, including for transport, as the single most important priority to alleviate what it called “the growing pains of the Greater Cambridge area”. There is a welcome commitment in the LTP that all new public transport and highway infrastructure should be designed to include parallel walking and cycling corridors. However, in assessing needs to cope with a growing population, it is important to recognise that physical infrastructure (roads) may not always be the answer. It is proven that road-building programmes, in the long-run, attract more tra�c, adding to the congestion and other costs they were designed to alleviate.All proposed road projects should consider if the objectives, particularly where proposed to meet rising demands, could be met in other ways – through measures to reduce demand, such as broadband, or to meet demand in other ways, such as public transport and active travel.There is a need to reallocate road space to bus and cycle lanes to encourage more use of these modes.
The Government’s 10-Point Plan includes provision for expanded infrastructure related to cycling and walking. It envisages increased provision of segregated cycle lanes and low-tra�c neighbourhoods. A new body, Active Travel England, will hold the budget and assess local authority performance.
Our survey responses indicate strong support for active travel measures. There is a need to build on the existing and planned cycling infrastructure in Cambridge and Peterborough, and consider how this can usefully be extended. Linking up other areas, towns and villages has potential for signi�cant community and health bene�ts, but requires investment to ensure safe routes, segregated from motor vehicles, whilst able to cope safely with electric bikes and potentially electric scooters as well.
We have also seen over the past year, in the response to COVID-19, the high value that people put on nature and green spaces for their well-being, and the bene�ts that can come from increased home-working:
Active travel and reducing the demand for travel
The area is a growth location. The LTP sets out infrastructure improvements that are underway, focused on road, rail and other public transport projects. It has a heavy reliance on additional road building to meet projected future demand and it is important that there is a change of emphasis to reducing the demand for travel - to minimise the need for further infrastructure.
Schemes like the CAM could play a role in improving connectivity and encouraging the shift away from car use, providing they are part of a holistic approach to encouraging the use of public transport and active travel through the location of essential services and the location and layout of new development. A substantial part of the case for such schemes is around the contribution to the economy of the region. If they go forward then construction should aim to minimise impacts on emissions, and the operations must be designed to be zero carbon.
Home working is not suitable for all jobs, but increased priority should now be given to measures that will help maintain and encourage this shift, where it is wanted by employees, through improved broadband coverage for example.
Digital and mobile connectivity, as well as green space and public transport links, should be key priorities in considering the siting and design of new developments.
112
Cambridgeshire & Peterborough Independent Commission on Climate Transport
19 Transport Systems Catapult (2018), Consolidating public sector logistics operations.
The greatest contribution to decarbonisation will be through the decarbonisation of the vehicles themselves, HGVs and LGVs. In relation to this, it is signi�cant that the Government recently announced, as part of its 10-Point Plan, that it would consult on a phase-out date for the sale of new diesel HGVs. This adds to the existing commitment, now brought forward to 2030, to end the sale of new fossil-fuelled vans.
The scale of emissions attached to the movement of freight in the CPCA area gives the area an interest in moving faster. There are also a number of wider bene�ts to such actions, from improved air quality and health, and reduced congestion. The presence of the logistics and distribution industries may also give CPCA an in�uence and leverage in encouraging actions by others.
We have therefore been keen to look at potential for measures that could be taken locally.
There is potential for development of consolidation centres, to receive goods brought in by heavy vehicles, and transferring these to electric vehicles – or even cargo bikes - for the �nal few miles to the purchaser. An important element in their success is likely to be an understanding amongst their users of how their costs and bene�ts will be shared (for example, the opportunity to combine loads of di�erent carriers for �nal delivery can lead to better utilised trucks). Experience is limited, but trials reported by the Transport System Catapult19 have suggested cost-e�ective reduction in vehicle movements of 50-85%. Cambridge and Peterborough could be useful locations for wider trials.
Use of electric vans for last mile delivery will be dependent on the provision of convenient fast charging facilities in urban areas, allowing vans to charge quickly and conveniently during the day. It will also require charging for vans at night, so a�ordable grid connections for depots or the provision of kerbside charging for vans located at drivers home overnight will be important. The use of electric HGVs will also necessitate charging at depots and distribution centres. The costs of grid connections for this infrastructure can be prohibitively expensive and solutions need to be developed at a national government level (Chapter 2). It would be helpful for the local Distribution Network Operator (DNO – UK Power Networks) to develop tools to assist charge point operators identify where there is capacity in the local electricity grid to which new charging can be connected (and thereby minimise these costs).
Freight
It is clear from the tra�c and emissions data for CPCA that the area has a strong interest in freight decarbonisation. Indeed, the logistics and distribution industries are important within the local economy:
wholesale and retail distribution are substantial contributors to output in Fenland and South Cambridgeshire;
with connections to ports on the east coast and to the A1, Peterborough is close to the location of substantial distribution centres.
113
Cambridgeshire & Peterborough Independent Commission on Climate Transport
To the extent that there is an initial cost, much of this will be met by the private sector, with Government contributions towards the cost of infrastructure. In making the transition, however, it is important that di�erent areas are treated fairly and not left behind. There is an argument, inevitably, for infrastructure development to be concentrated initially in more a�uent and denser urban areas, where EV demand may begin higher. Government policy, however, is for the sale of new petrol and diesel car and vans to end by 2030. The required infrastructure needs to be in place across the entire region, and the levelling up agenda also calls for towns and villages in rural areas to be part of this network as soon as possible. An initial focus on bringing areas with lower levels of provision up towards the levels of the best is justi�ed.
Beyond these economic impacts there are a range of synergies with other issues such that actions to reduce our emissions should have substantial co-bene�ts:
development of the public transport network, and extension into schemes such as on- demand buses, will help connect people, so our communities are more inclusive, with enhanced links to jobs, training opportunities and services, such as hospitals;
transport as a service model, such as car sharing, can be lower cost;
switching away from fossil fuels will produce physical and mental health bene�ts from improved air quality in our urban areas and from greater active travel;
The region should explore opportunities in relation to short-haul freight, such as the movement of agricultural products from farm to warehouse or distribution centre. Opportunity charging of the kind proposed for electric buses, with charging at the warehouse, could be a suitable option for electric lorries making trips of up to 100 miles.
What does it mean if we take these actions?
There will be an upfront cost to the switch towards electric vehicles, re�ecting the higher initial cost of the vehicles and the development of electric charging infrastructure. This will, however, produce cost savings in future years, as EV purchase costs move towards parity with conventionally fuelled vehicles and lower running costs then dominate the comparison. Longer-term this is a switch that will both reduce emissions and reduce costs.
This is an assessment that is shared by the PCAN analysis that suggests an investment requirement, across the region, of £1.4 billion over the next couple of decades, but indicates that much of this is cost-e�ective and will pay for itself in energy savings (even before allowing for the emission reduction and other bene�ts).
there is potential to direct new investment into walking and cycling to more deprived areas, where existing air quality may be worse and health bene�ts highest;
measures to expand public transport and to consolidate deliveries will reduce congestion;
the planning of new developments to link into public transport and incentivise active travel, alongside access to nature and greenspace, will improve health and increase inclusion.
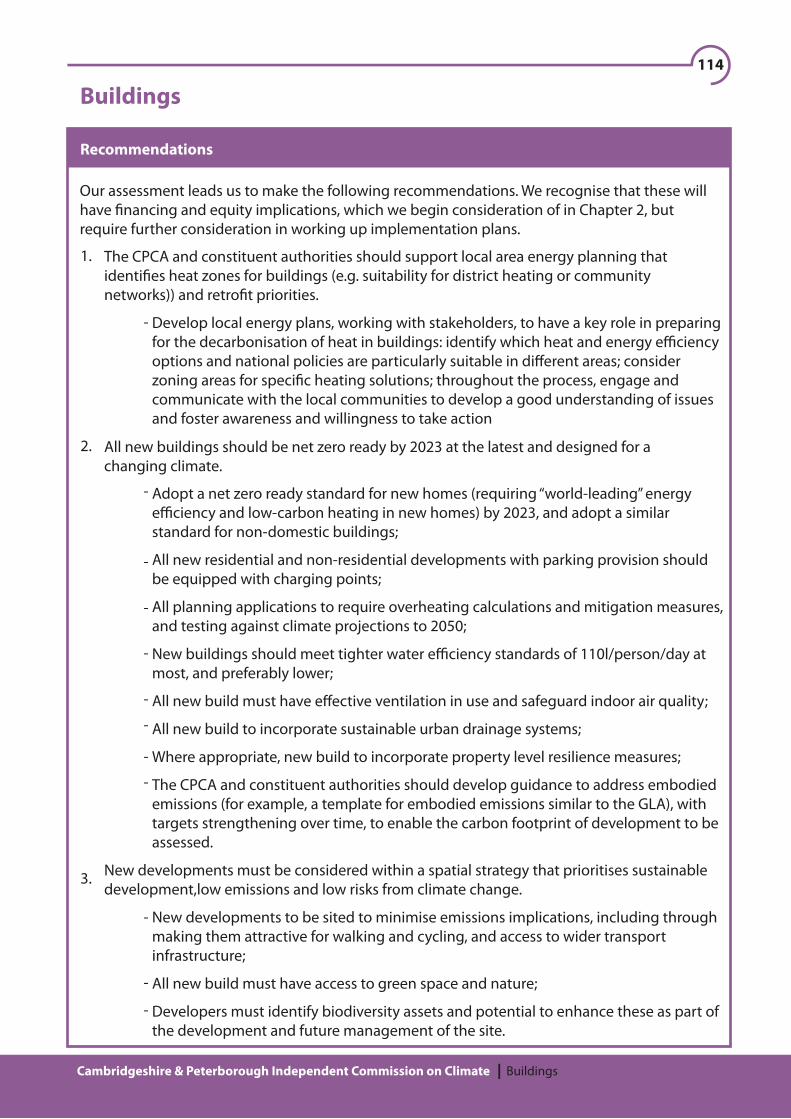
114
Cambridgeshire & Peterborough Independent Commission on Climate Buildings
The CPCA and constituent authorities should support local area energy planning that identi�es heat zones for buildings (e.g. suitability for district heating or community networks)) and retro�t priorities.
Develop local energy plans, working with stakeholders, to have a key role in preparing for the decarbonisation of heat in buildings: identify which heat and energy e�ciency options and national policies are particularly suitable in di�erent areas; consider zoning areas for speci�c heating solutions; throughout the process, engage and communicate with the local communities to develop a good understanding of issues and foster awareness and willingness to take action
Adopt a net zero ready standard for new homes (requiring “world-leading” energy e�ciency and low-carbon heating in new homes) by 2023, and adopt a similar standard for non-domestic buildings;
All new residential and non-residential developments with parking provision should be equipped with charging points;
All planning applications to require overheating calculations and mitigation measures, and testing against climate projections to 2050;
New buildings should meet tighter water e�ciency standards of 110l/person/day at most, and preferably lower;
All new build must have e�ective ventilation in use and safeguard indoor air quality;
All new build to incorporate sustainable urban drainage systems;
Where appropriate, new build to incorporate property level resilience measures;
The CPCA and constituent authorities should develop guidance to address embodied emissions (for example, a template for embodied emissions similar to the GLA), with targets strengthening over time, to enable the carbon footprint of development to be assessed.
New developments must be considered within a spatial strategy that prioritises sustainable development,low emissions and low risks from climate change.
New developments to be sited to minimise emissions implications, including through making them attractive for walking and cycling, and access to wider transport infrastructure;
All new build must have access to green space and nature;
Developers must identify biodiversity assets and potential to enhance these as part of the development and future management of the site.
Buildings
Recommendations
Our assessment leads us to make the following recommendations. We recognise that these will have �nancing and equity implications, which we begin consideration of in Chapter 2, but require further consideration in working up implementation plans.
1.
2.
3.
-
-
-
-
-
-
-
-
-
-
-
-
All new buildings should be net zero ready by 2023 at the latest and designed for a changing climate.

115
Cambridgeshire & Peterborough Independent Commission on Climate Buildings
Every building should, starting by 2025 with those below EPC "C", have a renovation plan (digital green passport, extended to include water e�ciency, incorporating passive cooling measures and property level �ood resilience measures where appropriate), setting out a clear pathway to full decarbonisation;
Home retro�t will need to be rolled out across the building stock, incorporating cooling measures as well as energy e�ciency, water e�ciency and heat decarbonisation. The CPCA should take a lead in encouraging home-owners to move towards net zero, including by �nding innovative ways to encourage behaviour change and support �nancing;
The CPCA and constituent authorities should prioritise achievement of net zero emissions for social housing. Digital green passports could be piloted in social housing �rst;
Electric charging points required for buildings with parking provision undergoing extensive renovation
Make full use, in the short-term to 2021-22, of Green Homes Grant funding, especially in relation to “no regrets” energy e�ciency improvements, and in the medium-term of successor funding schemes available from central Government;
Performance is actively monitored and standards fully enforced
Performance measurement must re�ect real-world energy use;
Resources for enforcement of energy performance standards and minimum private rented standards must be prioritised.
CPCA and local authority own estate is net zero by 2030 at the latest.
Public sector estate should by 2025 have a plan to achieve best practice energy use
Energy use and emissions on public sector estate should be monitored and reported.
5.
6.
All existing buildings achieve high energy e�ciency standards, and are heated from low-carbon sources
4.
-
-
-
-
-
-
-
-
-
Update on our March report
There has been a number of developments since our March report. Our recommendations remain as previously advised, though new information sources may help implementation.
A summary is provided at the end of the chapter.
116
Cambridgeshire & Peterborough Independent Commission on Climate Buildings
Buildings – a just transition
In our engagements with the Fens panel and with civil society groups from acrossCambridgeshire and Peterborough (Chapter 3), we asked people what might prevent climate actions being implemented in a fair way. We summarise here some of the key issues raised in relation to housing, and suggestions for how they might be tackled.
Many of the issues are picked up by our existing recommendations.
Barriers and challenges identi�ed
Living in homes that are cold, di�cult or expensive to heat has signi�cant repercussions for the wellbeing of our communities, and disproportionately a�ects people on low incomes. The impacts include risk of respiratory infections, excess winter deaths and mental health impacts, especially for older residents.
All consultations raised the concern that retro�tting your house and changing the way it is heated is complicated. People don’t have enough information and guidance available to be con�dent in doing this, in particular trusted sources of advice which are independent. Access to reliable, up to date knowledge, advice and options was a key priority across the consultations.
Many participants were concerned that planning policy and regulation were not strong enough and being watered down to lower environmental standards. Others raised the issue of a lack of skilled inspectors and the need to better enforce existing standards. All groups were keen to see strict environmental standards on new buildings and changes to planning policy that re�ected the ‘do no harm’ principle. Participants in Peterborough were concerned that without better enforcement on new builds, the costs of retro�t would be passed onto residents a few years later.
Overall, most people were keen to see local planning authorities take stronger action on ensuring that building activities are not harming the environment, and that developers who play a positive role should be rewarded. However, most groups also recognised that national planning policy would also need to change.
Some participants, especially in East Cambridgeshire, expressed a concern about the lack of social housing in the region. Others raised the issue of how to maintain existing buildings, rather than focussing too much on new homes.
Access to �nance to undertake home changes was also raised as a key issue, in particular for those on low incomes who would often bene�t greatly from improved insultation and changes to heating. It isn’t clear how interested households could access support if they can’t �nance the upfront costs.
East Cambridgeshire residents pointed out that for many people across the region in fuel poverty, spending a large amount of their income on energy, help with retro�t would be valuable. The Fens climate panel also raised concerns about fuel poverty and the need for warm homes for all.
“We need access to knowledge, information and options” (Huntingdonshire participant)
“New developments are not yet eco-friendly” (Peterborough participant)“How can we make sure that new homes are both green and a�ordable?” (South Cambridgeshire participant)
“The scale needed for retro�t is massive” and we should provide “funding for low-in-come households and those without the upfront money to spend” (Peterborough participants)
117
Cambridgeshire & Peterborough Independent Commission on Climate Buildings
In some consultations, particularly in Peterborough, the issue of how to retro�t homes in the rented sector came up very strongly. The responsibility on landlords to ensure their properties are up to environmental standards was a key area of concern, in particular the enforcement of existing regulations but also questions around whether these regulations are strong enough.
In Huntingdonshire and Cambridge, attendees raised concerns that existing building plans are not ready for the climate emergency, with some newbuild in �ood prone areas, lack of clarity on who is responsible for �ood protection, and a lack of use of natural solutions to ensure housing resilience.
Ideas identi�ed by participants
Provide independent, reliable, up to date information and advice on retro�t locally including how to access �nancing, lists of suppliers and traders, and advice on the appropriate changes for di�erent houses.
Develop a plan for retro�t in the rented sector, which could include -Better regulation and enforcement of existing standards for landlords -Awards and accreditation schemes for energy e�cient rented homes
Stricter standards and enforcement on new builds. Be �rmer on developers to meet climate requirements, implement thorough inspection and reward those who are doing it. This will require changes to planning rules across the region.
Work to solve the housing crisis without contributing to the climate crisis by building eco-social housing and working with housing associations.
Investigate if changes to taxation, such as council tax, could be used to help �nance these changes, whilst keeping into account equity and fairness.
Invest in retro�tting council and social housing.
Help people access existing �nance to make retro�tting happen and make more �nance available for people who can’t a�ord the upfront costs, in particular targeting support for low-income households and those in fuel poverty.
Undertake feasibility studies for community heating schemes, retro�t of district heating, and community energy projects for local areas. Help communities who are interested in making changes to their energy supply understand how to do it.
Identify areas suitable for retro�t of district then implement a package of support and engagement to make it happen.
Participants from East Cambridgeshire re�ected that many people don’t know why they should invest in home improvements and what the bene�ts are to them, not just to the environment. Many participants also felt that trying to do these things alone can feel daunting, and that a sense of community action would help encourage people who can a�ord retro�tting to do it.
Some participants re�ected that this is especially challenging due to the lack of stable national policy framework. In addition to �nancing for retro�t, some participants raised questions about the ongoing costs of clean energy options. Participants from Cambridge expressed concern that new gas lines are being built, further solidifying reliance on fossil fuels.

118
Cambridgeshire & Peterborough Independent Commission on Climate Buildings
CPCA emissions from energy use in domestic buildings were 1193ktCO2 in 2018, 21.6% of all CO2 emissions. This is a lower share than across the UK (28.0%). This covers emissions for space heating and for hot water, as well as emissions attached to the generation of electricity for heating and appliances.
There are also emissions associated with use of buildings in the commercial, industry and public sectors. These are smaller than emissions from domestic buildings, but must also be addressed.
Around 73% of CO2 emissions from domestic buildings are direct emissions attached to the use of gas, principally, and oil; 27% are indirect emissions attached to the generation of electricity used in buildings. Our main focus is on these direct emissions. These were 14% lower in 2018 than 2005, but not falling at a rate consistent with meeting future targets.
Reaching net-zero across the UK by 2050 requires buildings emissions reduced very close to zero. Options to deliver this have been identi�ed. The Climate Change Committee’s latest scenarios are based on pathways to zero emissions from buildings in 2050.
Many of the levers to achieve this – such as buildings standards – are at national level. But within a national framework for emissions reduction, there is likely to be signi�cant variation in the balance of solutions across regions. There remains much that the CPCA and constituent authorities can do to identify and apply appropriate options.
Summary
Implement education and awareness campaigns locally, working with people and local groups and building community involvement. This could include - Creation of spaces and discussion opportunities locally for people to be made aware of the di�erent options, show examples of what has been done and learn from others. This is particularly important as part of local planning for retro�t. - Raise awareness of the long-term bene�ts of retro�t and use local examples, success stories and demonstrators.
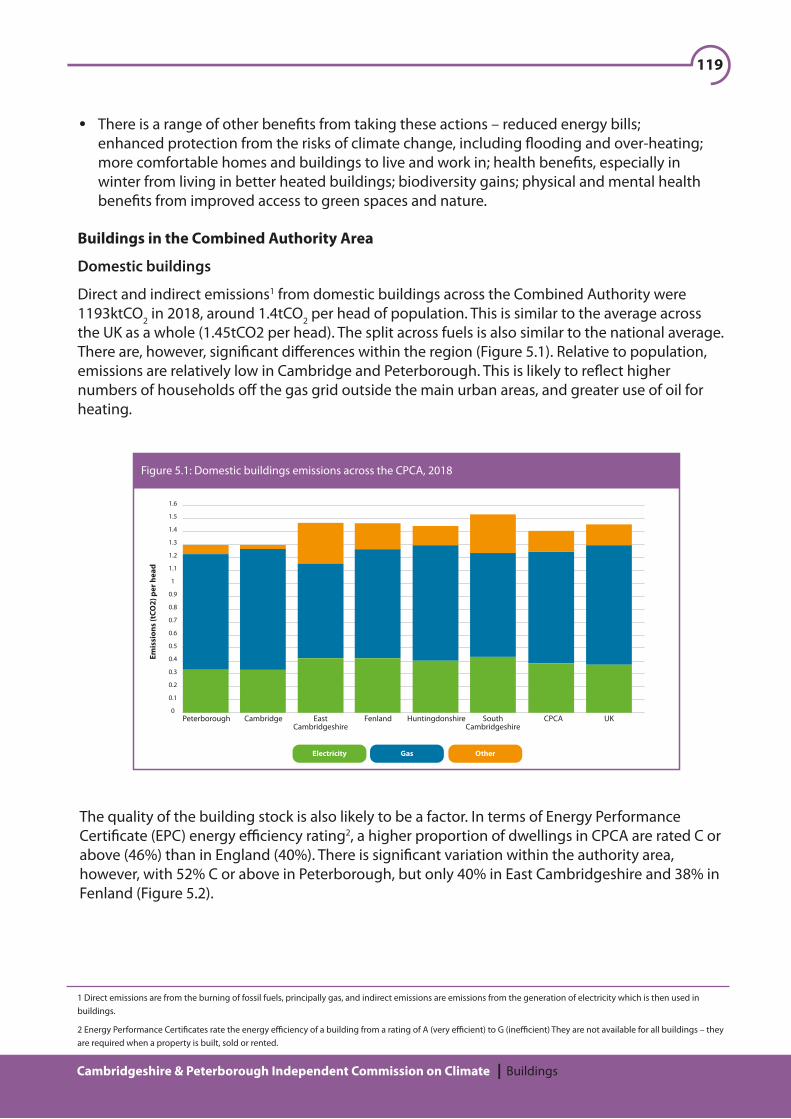
119
Cambridgeshire & Peterborough Independent Commission on Climate Buildings
There is a range of other bene�ts from taking these actions – reduced energy bills; enhanced protection from the risks of climate change, including �ooding and over-heating; more comfortable homes and buildings to live and work in; health bene�ts, especially in winter from living in better heated buildings; biodiversity gains; physical and mental health bene�ts from improved access to green spaces and nature.
Buildings in the Combined Authority Area
Domestic buildings
Direct and indirect emissions1 from domestic buildings across the Combined Authority were 1193ktCO2 in 2018, around 1.4tCO2 per head of population. This is similar to the average across the UK as a whole (1.45tCO2 per head). The split across fuels is also similar to the national average. There are, however, signi�cant di�erences within the region (Figure 5.1). Relative to population, emissions are relatively low in Cambridge and Peterborough. This is likely to re�ect higher numbers of households o� the gas grid outside the main urban areas, and greater use of oil for heating.
Figure 5.1: Domestic buildings emissions across the CPCA, 2018
Peterborough Cambridge EastCambridgeshire
Fenland Huntingdonshire SouthCambridgeshire
CPCA UK
1.6
1.5
1.4
1.3
1.2
1.1
1
0.9
0.8
0.7
0.6
0.5
0.4
0.3
0.2
0.1
0
Electricity
Emis
sion
s (t
CO2)
per
hea
d
Gas Other
1 Direct emissions are from the burning of fossil fuels, principally gas, and indirect emissions are emissions from the generation of electricity which is then used in buildings.
2 Energy Performance Certi�cates rate the energy e�ciency of a building from a rating of A (very e�cient) to G (ine�cient) They are not available for all buildings – they are required when a property is built, sold or rented.
The quality of the building stock is also likely to be a factor. In terms of Energy Performance Certi�cate (EPC) energy e�ciency rating2, a higher proportion of dwellings in CPCA are rated C or above (46%) than in England (40%). There is signi�cant variation within the authority area, however, with 52% C or above in Peterborough, but only 40% in East Cambridgeshire and 38% in Fenland (Figure 5.2).

120
Cambridgeshire & Peterborough Independent Commission on Climate Buildings
Figure 5.2: EPCs by energy e�ciency rating across the CPCA (% of EPCs issued 2008Q4 – 2020Q2)
A B C D E F G
Peterborough Cambridge EastCambridgeshire
Fenland Huntingdonshire SouthCambridgeshire
CPCA England
105
100
95
90
85
80
75
70
65
60
55
50
45
40
35
30
25
20
15
10
5
0
Information on the breakdown of ownership or tenancy type is quite dated, but appears very similar as for England as a whole (Figure 5.3), though the social rented stock rented direct from local authorities is relatively low.
Indirect emissions from electricity use in CPCA have fallen in line with the decarbonisation of power generation across the UK and the greater e�ciency of appliances. Direct emissions from burning fossil fuels were 14% lower in the CPCA area in 2018 than in 2005, but there is year to year variation in emissions depending on temperatures. The reduction over that period was a little below that for England as a whole (-20%), which may partly re�ect relatively higher population growth in CPCA.
45
40
35
30
25
20
15
10
5
0
CPCA England
Figure 5.3: Ownership and tenancy across the CPCA and England, 2011, %
Ownedoutright
Owned withmortgage
Shared ownership(part owned,part rented)
Privaterented
Social rented(Council)
Social rented (other)
Rent-free

121
Cambridgeshire & Peterborough Independent Commission on Climate Buildings
There has been an increase in the proportion of buildings rated at EPC C or above, but not at a rate to achieve Government targets for 2030 or 2035;
Around 4,000 new homes are being built annually in the CPCA area. These are not net-zero emission homes, but will tend to have better energy performance than the existing stock. Indeed, EPC ratings for new dwellings (new build and conversions) are relatively good for CPCA. For new dwellings in 2019, 92% were rated A or B, as against 83% across England;
Relative to population, the number of installations under the Renewable Heat Incentive (1,613 since April 20143) is a little above the national average. Nevertheless, this amounts to only around ½ % of the housing stock.
There are some good examples of new developments or schemes, for example at Marmalade Lane, Cambridge (Box 5.1) The Combined Authority has also recently announced the provision of start-up grants to support community-led housing projects. But the underlying picture remains that considerable further actions will be needed to reduce emissions consistent with net zero.
3 Data as at end September 2020.
Non-residential buildings
We do not have good data on emissions from non-residential buildings. At local authority level, these are included within national statistics in the wider category of the industry and commercial sector, which includes industrial processes.
The scale of emissions is not so large as for domestic buildings. For the UK, direct emissions from energy use in commercial buildings are around 18% and in public buildings around 12% of domestic buildings.
There are a total of 13,701 non-residential buildings with EPCs across CPCA. The distribution of these by Energy Performance Rating (Figure 5.4) is very similar to that across England as a whole – over 60% are below EPC C.
It is a cohousing development where residents have a stake in common areas – including a “common house” with kitchen, areas to socialise in, meeting rooms, and a separate small gym – and contribute to their management;
The homes, built to the Trivselhus Climate Shield building system, are highly energy e�cient. They are precision made in wood from sustainably managed forests and have a small environmental footprint;
All properties have mechanical ventilation and heat recovery (MVHR) to deliver clean air whilst reducing heat loss, and renewable energy from air source heat pumps;
The Lane is a child-friendly, car-free street running through the development. Car parking is kept to the periphery. The location is close to the Cambridgeshire Guided Busway and cycle ways. All residents have access to secure cycle parking.
Box 5.1: Recent developments
Marmalade Lane, Cambridge is an award-winning sustainable neighbourhood of 42 newly built homes, built to close-to-Passivhaus standards, with community facilities and shared gardens:
Source: Marmalade Lane – Cambridge’s �rst cohousing community, https://marmaladelane.co.uk
Progress in moving towards low/zero carbon options has been slow:
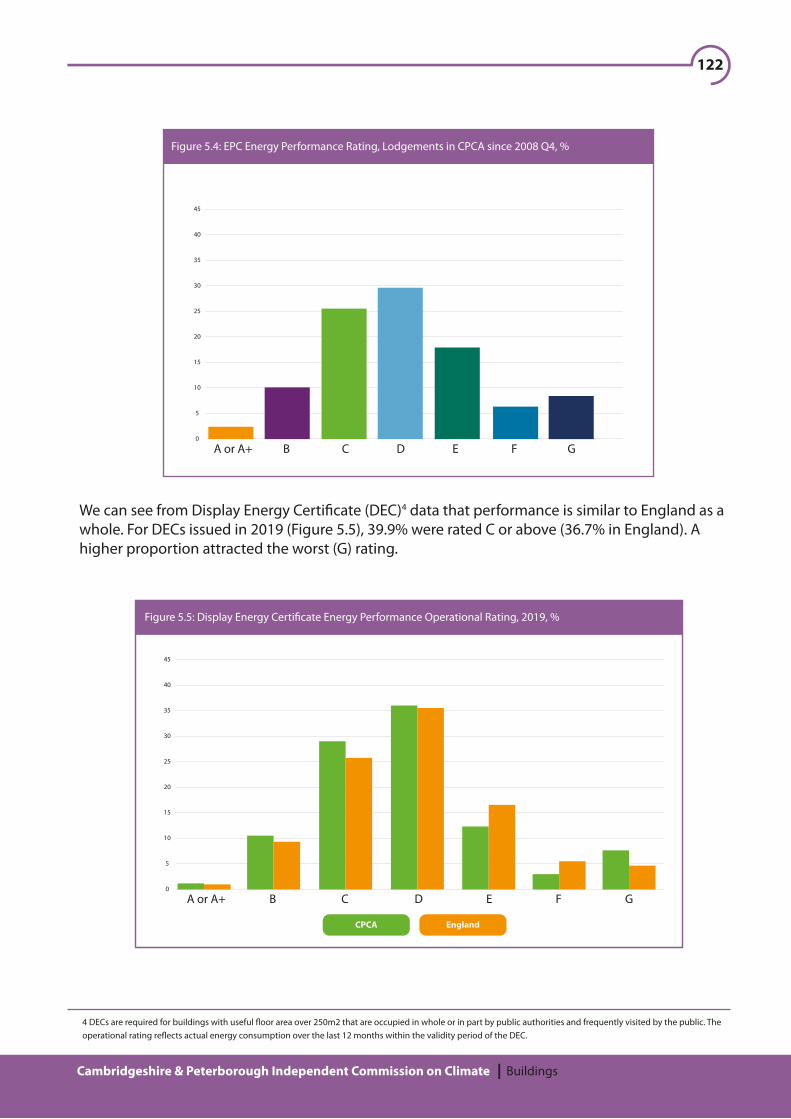
122
Cambridgeshire & Peterborough Independent Commission on Climate Buildings
4 DECs are required for buildings with useful �oor area over 250m2 that are occupied in whole or in part by public authorities and frequently visited by the public. The operational rating re�ects actual energy consumption over the last 12 months within the validity period of the DEC.
45
40
35
30
25
20
15
10
5
0
A or A+ B C D E F G
CPCA England
Figure 5.5: Display Energy Certi�cate Energy Performance Operational Rating, 2019, %
Figure 5.4: EPC Energy Performance Rating, Lodgements in CPCA since 2008 Q4, %
45
40
35
30
25
20
15
10
5
0
A or A+ B C D E F G
We can see from Display Energy Certi�cate (DEC)4 data that performance is similar to England as a whole. For DECs issued in 2019 (Figure 5.5), 39.9% were rated C or above (36.7% in England). A higher proportion attracted the worst (G) rating.

123
Cambridgeshire & Peterborough Independent Commission on Climate Buildings
Water: Guidance in Greater Cambridge (Cambridge City Council and South Cambridgeshire) stipulates a minimum water e�ciency standard for new residential developments of 110l/per person/per day, and registers a desire for developments to go further. Non-residential developments are expected to show improvements of 55% over baseline water consumption (Cambridge) or 25% (South Cambridgeshire). The latter can probably be met by e�ciency measures; the former is likely also to require water harvesting or recycling.
Overheating: nationally, evidence suggests that around 20% of homes experience overheating in the current climate. The issue is not addressed in current building standards, nationally though there are plans to do so. Guidance in Greater Cambridge recommends that thermal modelling be undertaken to understand the performance of proposed new developments, with buildings designed and built to meet CIBSE’s latest overheating standards, and consideration given to future climate scenarios. References to further guidance include that provided by the Good Homes Alliance.8
Water supply: the East of England is a water-stressed region, with growing water demand. With changes in the character of summer precipitation and increased summer temperatures, the region may experience seasonally lower river and aquifer levels than in past years.
Overheating: the region will face increased overheating issues, particularly in the summer months, likely to be associated with health issues, higher excess deaths, and reduced productivity. Even under a stringent mitigation scenario7 maximum summer air temperatures across the region are likely to exceed an average 36°C in 1 year out of 20 by the middle of the century. Temperatures in some locations will be higher than the average across the region.
Current actions to address these risks include:
Building of new homes is generally steered away from the highest �ood risk zones. Nationally there is low uptake of low-regret actions to reduce �ooding impacts, such as property and �ood resilience measures.
Flood risk: large parts of the area are vulnerable to �ooding – nearly 40% of the land is below sea level and much of the Fens is in �ood zone 3.6 Changes in seasonal and annual precipitation mean that without further measures to address these risks:
Adaptation
Work commissioned for this report5 has examined the key climate change risks facing the region:
Nearly 1 in 10 homes and nearly 1 in 4 agricultural and industrial production facilities may face �ooding risk from rivers by the end of the century;
The region may face tidal �ooding from storm surges, particularly at high tide if the Ouse and/or Nene rivers are already in �ood.
-
-
5 CZ (2021), Aines, E.D., Simpson, C., Munro-Faure, A., Shuckburgh, E., Preliminary report on climate risk in the Cambridgeshire & Peterborough region, 2020-2099, Cambridge Zero: University of Cambridge.
6 Flood zone de�nitions are set out in National Planning Policy Guidance. Land in �ood zone 3 has a 1 in 100 or greater annual probability of river �ooding, or 1 in 200 or greater annual probability of �ooding from the sea.
7 RCP2.6: an emissions pathway likely to keep global temperature rise below 2 degrees C by 2100.
8 Good Homes Alliance (2019), Tool and guidance for identifying and mitigating early stage overheating risks in new homes.
124
Cambridgeshire & Peterborough Independent Commission on Climate Buildings
In delivery terms, this means:
E�ciency of existing buildings:
By 2028, rented homes achieve EPC C, such that all practicable lofts and cavities are insulated, alongside other low-regret measures, with solid wall insulation deployed where this supports low-carbon heat and wider (social) bene�ts.
Homes with mortgages (a little under half of all owner occupied homes) achieve EPC C by 2033, such that all practicable lofts and cavities are insulated, alongside other low-regret measures, with solid wall insulation deployed where this supports low-carbon heat and wider (social) bene�ts. This is achieved through standards for lenders.
By 2028, no dwellings can be sold unless they meet a minimum EPC C standard.
Expand the roll-out of low-carbon heat networks in heat dense areas like cities, using anchor loads such as hospitals and schools;
Prepare, through a set of trials, for a potential role of hydrogen in heat.
What has the Climate Change Committee recommended?
The national Climate Change Committee (CCC) has developed scenarios for sectoral emissions in 2050 consistent with achievement of net zero emissions overall.9 More recently it has made recommendations for the pathway to net zero.10
To be on track to near zero emissions from buildings by 2050, the CCC’s balanced pathway has 4 priorities over the next decade or so:
Deliver on the Government’s energy e�ciency plans to upgrade all buildings to EPC C over the next 10-15 years;
Scale up the market for heat pumps, as a critical technology for decarbonising space heating;
Box 5.2: Cambridgeshire and Peterborough Future Parks Accelerator
The Future Parks Accelerator (FPA) project is a collaboration between the 7 local authorities of Cambridgeshire and Peterborough and the Local Nature Partnership, including Natural Cambridgeshire.
Scheme objectives include to map existing open space, develop long-term plans for its management, and identify sustainable long-term funding and governance models for new and existing parks. The scheme emphasises community engagement, and will look to provide skills and training to develop our green spaces.
The project has £700,000 funding from MHCLG, the National Lottery Heritage Fund and the National Trust. The Cambridgeshire and Peterborough project was chosen for funding in 2019 from more than 80 projects submitted by councils and communities across the UK.
9 CCC (2019), Net Zero – The UK’s contribution to stopping global warming.
10 CCC (2020), The Sixth Carbon Budget – The UK’s path to net zero.
-
-
-
Green Spaces: the Future Parks Accelerator Project (Box 5.2) is a good example of a collaborative project with potential gains for public amenity and health, biodiversity and reduced overheating.
125
Cambridgeshire & Peterborough Independent Commission on Climate Buildings
Heating for existing buildings:
By 2028, all heating system sales o� the gas grid are low-carbon (with exemptions for any buildings in zones designated for low-carbon district heat).
By 2033 (or earlier, 2030, for public buildings) all heating system sales are low-carbon (with exemptions for any buildings in zones designated for low-carbon district heat or hydrogen).
New build:
By 2025, at the latest, all buildings are built with ultra-high levels of energy e�ciency and low-carbon heating (e.g. heat pumps or low-carbon heat networks).
In policy terms, this leads CCC to recommend:
Heat and Buildings Strategy (due from the Government soon): an ambitious heat strategy which sets the direction for the next decade, with clear signals of the phase out date of fossil heating and commitment to funding. This must include a clear set of standards; plans to introduce green building passports; and a role for area-based energy plans.
Standards for existing buildings:
Bring forward the date to reach EPC C in social homes to 2028, in line with the Private Rented Sector (PRS) proposals, and �nalise the delivery mechanism.
Implement PRS proposals.
For non-residential buildings, energy e�ciency improvements in the commercial sector are made by 2030 to meet the Government’s target of reducing business and industrial energy consumption by 20%, and by 2032 in the public sector, to meet the target to reduce public sector energy consumption by 50% (against levels in 2017).
-
-
-
Implement improvements to the EPC framework, including ensuing they drive the energy e�ciency measures that are needed.
Develop options to cover the regulatory policy gap for owner-occupied homes, looking at trigger points at the point of sale and through mortgages.
Publish proposals for standards to phase out fossil fuels, and in-use standards in commercial buildings.
-
-
-
-
New build standards:
Implement a strong set of standards – with robust enforcement – that ensure buildings are designed for a changing climate and deliver high levels of energy e�ciency, alongside low carbon heat.
Publish a robust de�nition of the Future Homes Standard and legislate in advance of 2023, for implementation by 2025 at the latest.
-
-
-
-

126
Cambridgeshire & Peterborough Independent Commission on Climate Buildings
In relation to adaptation, the CCC has also recommended:
Introduction of a new standard or regulation to ensure that overheating risk is assessed at the design stage of new-build homes or renovations. This should ensure that passive cooling measures are prioritised over active cooling
A national target for increasing the area of urban greenspace
Review new build regulation standards to allow local authorities to set more ambitious standards for water consumption, especially in current and future water-stressed areas
Resources and support for local authorities to ensure measures are being put in place to increase the area of greenspace and the area of permeable surfacing in all urban areas
A statutory consultee be put in place for assessing new developments in areas of surface water �ood risk.
What is Government policy?
The UK Government recognises that policies are not currently in place to deliver net-zero emissions, but has set out some policies, is consulting on others and has set out strengthened ambition within its 10-Point Plan:
The Government aims to improve EPCs in private rented homes to a rating of C by 2028, in fuel poor homes by 2030, and in other (owner occupied) homes by 2035
The Minimum Energy E�ciency Standard (MEES) took e�ect in April 2018 and sets a minimum energy e�ciency standard of Band E for properties let out by residential and commercial landlords, to be met - subject to cost limits - by April 2023.
The Green Homes Grant scheme has been extended for a further year (to end-March 2022). This provides grants for householders to cover up to two-thirds of the cost of insulation or low carbon heating improvements (maximum value £5000) or 100% of cost for those in receipt of a qualifying means-tested bene�t. An element of funding is also available to local authorities to support low-income households through the Green Homes Grant Local Authority Delivery Scheme – a second round of this scheme closed for applications in December 2020, but a further £300m is to be allocated through Local Energy Hubs in 2021.
The Government has recently announced its response to consultation on a Future Homes Standard, with CO2 emissions 75-80% lower than current standards.
It has committed to set a level of performance standard meaning that new homes will not be built with fossil fuel heating, and that homes built to the standard will be “zero-carbon ready” – with high energy e�ciency such that further energy e�ciency retro�t will not be required for them to be zero-carbon as electricity decarbonises.
To meet the “zero-carbon ready” pledge it is widely believed that the standard will have to go further than levels previously suggested by the Government, but consultation on the technical standard will not begin until 2023.
-
-
127
Cambridgeshire & Peterborough Independent Commission on Climate Buildings
Performance-based ventilation standards are to be implemented.
Implementation in new build will be from 2025.
Local authorities will retain, in the short-term at least, powers to set local energy e�ciency standards for new homes that go beyond the national level.
It is proposed, following consultation, to introduce a Future Buildings Standard for new non-residential buildings from 2025;
It is proposed that all non-residential private-rented buildings should, where cost-e�ective, meet EPC B by April 2030.
The Renewable Heat Incentive (RHI) is to be replaced from April 2022 with a Clean Heat Grant for households and small non-domestic buildings. Subject to the budget and time-limited nature of the proposal (so far), this would enable the installation the installation of heat pumps and in limited circumstances biomass.
A Renewable Heat Strategy is to be published. In the meantime, the 10-Point Plan has indicated a target for 600,000 heat pump installations by 2028, and there is a commitment to phase-out installation of high-carbon fossil fuel heating (coal and oil) in homes o� the gas grid in the 2020s.
An over-heating mitigation requirement in Building Regulations is to be introduced for new homes.
The main regulatory policy gaps relate to e�ciency standards for 15.5m owner occupiers (of which over 65% are below EPC C), owner occupied commercial buildings, and plans for phasing out natural gas heating.
-
-
-
11 These bullets draw on the UK Green Building Council Retro�t Playbook, but there are many similar assessments.
The role of local and combined authorities
Emissions reductions in the UK to date have been mainly driven by reductions in emissions from the power sector. Much of that has happened without the need for signi�cant public engagement – a supportive policy framework has allowed generation companies to make the low-carbon investments in renewables and switch away from coal and gas.
Improving the e�ciency of our building stock and switching to zero-carbon heating presents a substantial and di�erent challenge. Millions of households will need to make decisions to allow changes within their own homes, whether investments in energy e�ciency or to change to low-carbon heating. Co-ordination of actions will help to bring down costs and will be required to take forward some of those measures (such as district heating). Public engagement and support will be essential to making progress.
A national policy framework to support decarbonisation of buildings is required, and provide resources where required to supplement private funding. But policy will need to be �exible to allow di�erent choices according to local circumstances. Local authorities are well-placed to help drive the changes that are required:11
Facilitation – convenor to bring people and groups together to help develop and implement retro�t programmes and local energy planning;

128
Cambridgeshire & Peterborough Independent Commission on Climate Buildings
12 This is necessarily selective. Some of the evidence is locally focused; some is national with potential application locally.
13 CCC (2019), Net Zero – Technical Report.
14 CCC (2020), The Sixth Carbon Budget – Methodology Report.
15 CUSPE (2019), Net Zero Cambridgeshire, October 2019.
Understanding – local authorities have and can further develop understanding of the quality of the building stock in their area, the social and economic characteristics of the occupiers, and viability of di�erent options in di�erent areas;
Communication – provision of information to residents and business on the bene�ts of e�ciency improvements, on low-carbon heating options, and use of accredited installers and suppliers;
Coordination – local authorities can take a central role in coordinating action. They can set up or support “one stop shops” to support residents on their retro�t journey. They can liaise with �nance providers and look to pilot new �nancing mechanisms;
Being a “trusted partner” – research shows that local authorities are consistently more “trusted” than national government and other stakeholders. They can use this status to help build community consensus, particularly where that is needed on plans for heat decarbonisation;
Supporting the growth of local skills and supply chain. Local authorities can take a leading role in supporting skills providers to ensure that local supply chains gear up to deliver. They can work with the supply chain to promote accreditation.
As developers and in delivering retro�t on social housing. Local authorities can take a lead on delivery for their own social housing and own estate more widely, and working with other social housing providers.
The evidence base for emission reduction requirements to 2050 and assessment of options
In assessing the scale of the challenge for CPCA in moving towards net zero, and the available options, we have considered evidence from a range of sources. This section summarises some of the key sources12.
CCC Net Zero Technical Report / CCC CB6 recommendation
The CCC’s Net Zero Report and Net Zero Technical report13 provide an assessment of options to take the UK to net zero emissions by 2050. The Sixth Carbon Budget Report and Methodology Report14 update this analysis, with a focus on the pathway for emissions through the 2020s and to the sixth carbon budget period (2033-37). This includes a pathway for emissions from buildings – covering energy e�ciency and low-carbon options for heat.
Net Zero Cambridgeshire (CUSPE) report
The Net Zero Cambridgeshire (CUSPE) report considers the make-up of emissions in the CPCA region and provides projections to 2050 for a number of possible scenarios. Re�ecting an increasing population, signi�cant new build is projected.
In a scenario where all new homes are built to the highest energy e�ciency standards from 2020 and existing homes are retro�tted to EPC “C” over the 10 years to 2030, emissions are reduced by around 50% by 2050.
129
Cambridgeshire & Peterborough Independent Commission on Climate Buildings
This illustrates the critical need for appropriate energy e�ciency measures to be deployed in existing buildings, in conjunction with e�cient non-fossil heating technologies. Applying assumptions consistent with the CCC’s Further Ambition scenario, which informed the CCC’s net zero recommendation to the UK Government, CUSPE’s assessment – including that all but 10% of homes move o� the gas grid - �nds CPCA emissions from the domestic building stock fall around 92% by 2050.
16 PCAN (2021), A Net-Zero Carbon Roadmap for Cambridgeshire and Peterborough, Sudmant, A., Duncan A., Gouldson, A., ESRC Place Based Climate Action Network, University of Leeds.
Place Based Climate Action Network
We commissioned work on a net zero carbon roadmap for the region from the Place Based Climate Action Network (PCAN)16 (Chapter 2). This found that many emission reduction measures within the buildings sectors are cost-e�ective – they would more than pay for themselves through the energy cost reductions they would generate.
Overall, for housing these cost-e�ective measures could close the gap between projected emissions in 2050 and net zero by around 53%. For public and commercial buildings, they could close the gap by around 39%. Other measures are identi�ed that could close the gap for housing by a further 25% and for public and commercial buildings, also by a further 25%. These measures would have higher up-front costs, not fully paid back in energy savings, but would have emission reduction and other bene�ts.
Amongst the cost-e�ective options are insulation, draught-proo�ng and (some) heat pump installations in domestic buildings; and fabric, lighting and heating improvement measures in public and retail buildings. The highest emission savings come from improved insulation and installation of heat pumps in domestic buildings. The report provides indicators for the rates of installation needed over time to meet the estimated emission reductions – ranging in homes, for example, from 3,000 cavity wall insulations to 15,000 heat pump installations a year.
Carbon Neutral Cambridge
Recent analysis by Carbon Neutral Cambridge (Box 5.3) suggests signi�cant numbers of homes across CPCA would bene�t from basic energy e�ciency measures – 31,000 homes with roof insulation below 20% of recommended levels; 31,000 homes with uninsulated or partially insulated cavity walls.

130
Cambridgeshire & Peterborough Independent Commission on Climate Buildings
60
55
50
45
40
35
30
25
20
15
10
5
0
Table B5.1: Proportion of EPCs at C or above (%)
Peterborough Cambridge EastCambridgeshire
Fenland Huntingdonshire SouthCambridgeshire
EPCs issued April 2010 – March 2015 EPCs issued April 2015 – March 2020
60
55
50
45
40
35
30
25
20
15
10
5
0
Table B5.2: Homes with inadequate levels of insulation
Peterborough Cambridge EastCambridgeshire
Fenland Huntingdonshire SouthCambridgeshire
Homes (000) with roof insulationbelow recommended level
Homes (000) with uninsulated orpartially insulated cavity walls
CPCA
175
170
165
Box 5.3: Hot Numbers – energy upgrade opportunities in the CPCA
The “Hot Numbers” report by Carbon Neutral Cambridge (CNC) uses EPC data to quantify the scale of improvement needed to meet EPC C by 2035.It shows an increase in the proportion of EPCs at C or above over the last decade, but that there remain around 130,000 homes across CPCA that need improvement to reach EPC C.
The report identi�es around 175,000 homes with roof insulation below recommended levels (of which 31,000 are below 20% of the recommended level) and 31,000 homes with uninsulated or only partially insulated cavity walls.
Source: CNC (2020), Hot Numbers: an overview of home energy upgrade opportunities in the CPCA.

131
Cambridgeshire & Peterborough Independent Commission on Climate Buildings
Adaptation
We draw on work by Cambridge Zero, published with this report.17 This examines climate change risks facing the region (summarised above).
Public engagement
Evidence suggests that relatively small numbers of people identify heating their homes as a major contributor to emissions, and few are familiar with low-Carbon options as a means of moving away from fossil fuels for home heating.18Faced with information about options, however, they are very willing to engage (Box 5.4).
17 CZ (2021).
18 e.g. Eftec (2020), Heating our homes in a Net Zero Future: Understanding what matters to consumers, Eftec, ICS, for National Grid.
Box 5.4: Public engagement – buildings
The Climate Assembly UK has shed light on public support for di�erent heating solutions and priorities:
In relation to low-Carbon heating, Assembly Members supported the use of hydrogen, heat pumps and district heating. They stressed the importance of local areas being able to choose the options best suited to their needs. Most supported a ban on new gas boilers coming in around 2030 to 2035;
For home retro�ts, they emphasised the need to minimise disruption to the home, put in place support for costs, and o�er �exibility and choice to householders.
A high proportion of respondents to the CPICC Survey (76% of direct respondents; 58% of targeted respondents) viewed buildings as an important area for the Commission to focus on. A high proportion (71% of direct respondents; 64% targeted) said that they would be prepared to change how they heat their home.
More than half of the direct respondents (53%) agreed that they were currently considering a switch to a low-Carbon energy system. They were clearly a group with high motivation to consider change.
The proportion amongst the targeted respondents was considerably lower (26%). Many, however, said they would be encouraged to switch by grant funding towards the cost (70% of direct respondents and 79% of targeted respondents). Others might be motivated as part of a community scheme (35% and 24% respectively), or clear online advice (23% and 33% respectively).
Respondents were keen to see new homes located on public transport routes.
Our own survey provides support for this conclusion as well, though there were di�erences between those who responded direct to our survey and those recruited (“targeted”) through a survey company:
both groups regarded buildings as an important area of focus, but more of the direct respondents (76%) than the targeted (58%);
high numbers said they would be prepared to change how they heat their homes (71% of the direct respondents; 64% of the targeted). This still leaves a signi�cant minority who need to be reached;
132
Cambridgeshire & Peterborough Independent Commission on Climate Buildings
fairly high numbers, particularly in the direct group, were actively considering switching to low-carbon heating. Amongst those who were not, particularly in the targeted group, many said that they could be motivated to do so by �nancial support. Others might be encouraged by community schemes or online advice.
These results suggest that well designed policies, including those that can reduce the potential hassle of arranging installation, have the potential to motivate householders towards consideration of low-carbon heating options.
We had a range of discussions with others, including UK Power Networks (UKPN), the local electricity network operator, who are working to understand implications for the grid of rising power demand attached to the growth in EV ownership and use of heat pumps.
Key areas for action
There is a growing consensus on the actions that need to be taken to shift buildings towards net zero (Box 5.5).
For retro�t of existing buildings the essential elements of the approach (developed further for CPCA in the section below) are to:
Adopt a whole house approach: understand that a package of measures will be necessary and this package – covering improved energy e�ciency and heat decarbonisation - must be appropriate for the individual building. Whilst a piecemeal approach to application of measures is likely to be inadequate, there are some low-regret or known cost-e�ective measures, to include cavity wall insulation and loft insulation, which should be implemented immediately.
Develop the evidence base to provide in-depth understanding of the nature and quality of the building stock. In considering adoption of measures, it is useful to link this with understanding of the socio-economic characteristics of the residents (in terms, for example, of fuel poverty and ability to pay for measures). This can then inform understanding of the whole house measures that are needed and the potential for zoning areas for particular solutions.
Provide advice in the form of a digital Green Building Passport, which covers the measures required for the building, how quality assurance on measures and installation can be achieved, (e.g. accredited installers), and potentially information on funding sources. This passport rests with the building, transferable with changes in owner. It can be updated as speci�c measures are implemented, and record impacts, such as on energy bills.
Encourage householders and landlords to take action, through policy at key trigger points (such as when buildings are renovated or sold) and a rising trajectory of standards. Depending on how the policy framework develops, a time could be reached when actions become mandatory, but progress in advance of that will help to build supply chains.
Consider the need for development of skills in relation to assessment of need for and delivery of energy e�ciency measures and installation, maintenance and control of new heating systems.

133
Cambridgeshire & Peterborough Independent Commission on Climate Buildings
Box 5.5: Components of an approach to decarbonising homes
Heat and energy-e�ciency zoning
The Association of Decentralised Energy (ADE) has set out the case to adopt a “zoning” approach to specify a local area for active deployment of particular solutions. The method has also been developed in advice to Ofgem by the Centre for Sustainable Energy (CSE) and Energy Systems Catapult (ESC).
The case for “zoning” rests on there being no single solution for heat decarbonisation, but that speci�c options (including heat networks from a low-carbon source, heat pumps, biomass, hydrogen) may be more economic and work better at scale in speci�c areas.
The key elements of a zoning approach are to consider the circumstances and opportunities speci�c to the area – to include quality of the building stock and heat density; local resources, such as waste heat; wider energy demands such as electricity for electric vehicles; what these system issues mean for the practicality of di�erent options; feedback from local stakeholders based on provision of information and consultation (to ensure resulting plans are seen as informed and legitimate). Having gone through this process, the aim would be to designate an area for active deployment of an appropriate solution.
Deployment of that option could then be progressed through national and local policy – which might extend to deadlines for ending installations of fossil fuel options, use of planning and building regulations, funding. Domestic consumers might not be required to take up a particular solution, but the barriers to the preferred zonal solution would be removed so that it becomes the easy way forward.
Association for Decentralised Energy: Getting (retro) �t for net zero: an approach for existing homes
This ADE paper emphasises the need for a whole-house approach, and a move away from piecemeal measures of the past. It suggests that:
Retro�t targets must re�ect the diversity of the stock, through scaling up local area energy planning and the use of green building passports
Whole house strategies and deep retro�t are needed. This does not mean all the work must be undertaken in one step, but the building assessment should set out a long-term plan
There are low regret actions (such as improved insulation) which make sense to get on with. Some zones might also be prioritised for action – for example, where electricity network issues have been identi�ed, so it will be useful to reduce peak demands, or to help tackle fuel poverty.
A zoning and whole house approach is likely to encourage the development of new more attractive �nance options.
Construction Leadership Council (CLC)
The CLC has launched a consultation document for a national retro�t strategy. This calls for an integrated approach to transforming the energy and water needs of our homes – through design, installation and customer care:
Building renovation plans (passports) for each house
Skills training
Area-based delivery programmes to build capacity, with QA and evaluation to ensure standards, grow consumer con�dence and open up �nancing opportunities.
Sources: ADE (2020), Heat and Energy E�ciency Zoning: A framework for net zero for new and existing buildings; CSE/ESC (2020), Local Area Energy Planning: The Method, Final Review Draft, For Ofgem, July 2020; ADE (2020), Getting (retro)�t for net zero: An approach for existing homes; CLC (2020), Greening Our Existing Homes, National retro�t strategy, A consultative document, Construction Leadership Council.

134
Cambridgeshire & Peterborough Independent Commission on Climate Buildings
For new build, it makes no sense to construct buildings now to standards that are inconsistent with net zero or the impacts of a changing climate, and will require retro�t later. New developments should also be planned to link into low-carbon district heating where available.
It is also widely recognised that there is a need to move towards standards based on measured energy use or emissions. Flaws in the EPC regime are widely recognised. Veri�cation and enforcement processes will also need to be strengthened:
The Green Construction Board,19 amongst others, has recommended that buildings design should move towards predicted performance of energy use, and that contracted energy performance targets must aim at the delivery of real (i.e. in-use) performance, covering regulated (e.g. heating and hot water) and unregulated (electric appliance) use.
The Better Buildings Partnership has similarly called for “Design for Performance”, based on operational performance and reporting, moving away from a current “design for compliance” culture based on theoretical norms.
19 GCB (2019), Buildings Mission 2030.
The importance of engagement
It is important to recognise that progress will depend on the decisions and concomitant behaviour of a large number of householders and property owners. Their willingness to act will depend on a range of factors: understanding of the need for change; availability of information on options to improve energy e�ciency and change heating systems; availability of funding; con�dence in the market and easy access to skilled assessors and installers to undertake the work. Unless these factors are addressed the perceived “hassle” of making change will act as a barrier to the necessary actions. To a signi�cant extent, therefore, retro�tting and heat decarbonisation are behavioural policy problems, and lessons from behavioural science as well as traditional policy levers need to be explored and developed.
In looking to deliver retro�t and heat decarbonisation, it will be very important to design programmes that address these behavioural barriers. This suggests approaches that:
Are as far as possible “whole house” and consider energy e�ciency, low-Carbon heating, ventilation and cooling in an integrated way, and focus on real-world performance. This is where measures like the digital Green Passport have attractions, possibly extended from the current focus on mitigation measures to include adaptation and water use (water meters, for example). This does not mean that all measures have to be taken at the same time; they can be staged, but in a way that progresses towards a speci�ed outcome;
Simple but highly visible information must be provided to decision-makers. The need for change – the need for and bene�ts from decarbonisation – must be communicated widely. This should not simply focus on environmental gains, but on the other bene�ts that are salient when people make choices. Information on speci�c options and applicability to the speci�c circumstances of the householder or property owner must be clear. Installers must be trusted, potentially aided by certi�cation schemes. Guidance could be provided on the available schemes and funding routes.

135
Cambridgeshire & Peterborough Independent Commission on Climate Buildings
O�ers should be made at timely moments that are likely to have most impact in encourag-ing take-up. In many cases this means alignment with “trigger points” such as when houses are being sold, or renovated for other reasons. But there is also evidence that area-wide programmes can be e�ective – street-by-street programmes where people see their neighbours taking action could improve sign-up by creating a sense of a social norm;
Local leadership from local authorities in relation to their own buildings, and from high-pro�le businesses. The many individuals who need to take action are much less likely to engage if they do not see their “leaders” walking the talk.
More generally, Central Government and local authorities need to be consistent in their approach. This points to the need for a stable policy approach, with incentives, messages and direction of travel sustained over time.
Putting this into practice
A number of authorities are pressing ahead with decarbonisation plans (Box 5.6). There will be opportunities to learn from these kind of examples.
What does this mean for the CPCA?
From the available evidence, the quality of the building stock in CPCA is, in relation to energy e�ciency, marginally better than across England as a whole. But there remains substantial scope and need for improvement, even in relation to standard measures including cavity wall and loft insulation. These measures are generally cost-e�ective, with a payback within a few years, and should be taken forward as soon as is practical.
Whilst we strongly favour the “whole house” approach, looking for a joined-up approach consistent with the circumstances of the speci�c building, options for heat decarbonisation such as heat pumps will work e�ectively and at reasonable cost in an energy-e�cient building. Where there are basic measures outstanding which can improve energy e�ciency (and reduce energy bills), it makes sense to get on with them.
In relation to heat decarbonisation, in common with the country as a whole, most houses are on the gas grid. Where they are not, many – particularly in more rural areas – make use of oil for heating. Switching to low-carbon heating will be a huge challenge.
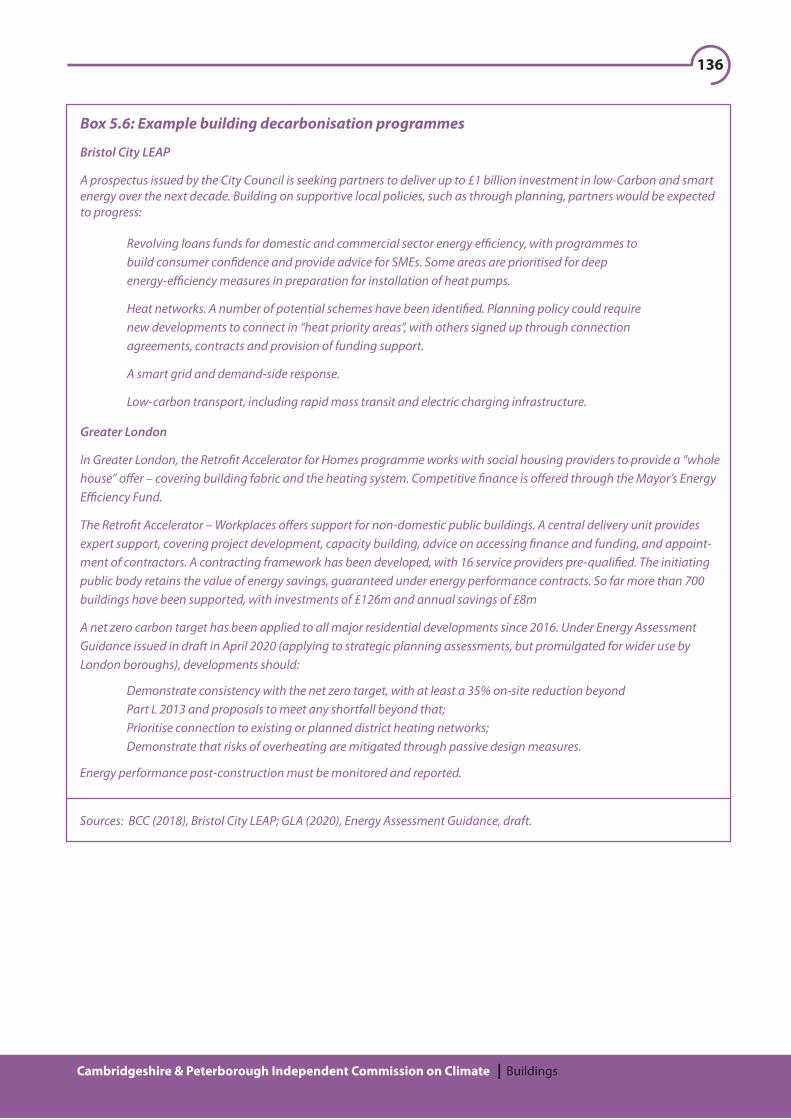
136
Cambridgeshire & Peterborough Independent Commission on Climate Buildings
Revolving loans funds for domestic and commercial sector energy e�ciency, with programmes to build consumer con�dence and provide advice for SMEs. Some areas are prioritised for deep energy-e�ciency measures in preparation for installation of heat pumps.
Heat networks. A number of potential schemes have been identi�ed. Planning policy could require new developments to connect in “heat priority areas”, with others signed up through connection agreements, contracts and provision of funding support.
A smart grid and demand-side response.
Low-carbon transport, including rapid mass transit and electric charging infrastructure.
Box 5.6: Example building decarbonisation programmes
Bristol City LEAP
A prospectus issued by the City Council is seeking partners to deliver up to £1 billion investment in low-Carbon and smart energy over the next decade. Building on supportive local policies, such as through planning, partners would be expected to progress:
Greater London
In Greater London, the Retro�t Accelerator for Homes programme works with social housing providers to provide a “whole house” o�er – covering building fabric and the heating system. Competitive �nance is o�ered through the Mayor’s Energy E�ciency Fund.
The Retro�t Accelerator – Workplaces o�ers support for non-domestic public buildings. A central delivery unit provides expert support, covering project development, capacity building, advice on accessing �nance and funding, and appoint-ment of contractors. A contracting framework has been developed, with 16 service providers pre-quali�ed. The initiating public body retains the value of energy savings, guaranteed under energy performance contracts. So far more than 700 buildings have been supported, with investments of £126m and annual savings of £8m
A net zero carbon target has been applied to all major residential developments since 2016. Under Energy Assessment Guidance issued in draft in April 2020 (applying to strategic planning assessments, but promulgated for wider use by London boroughs), developments should:
Demonstrate consistency with the net zero target, with at least a 35% on-site reduction beyond Part L 2013 and proposals to meet any shortfall beyond that;Prioritise connection to existing or planned district heating networks;Demonstrate that risks of overheating are mitigated through passive design measures.
Energy performance post-construction must be monitored and reported.
Sources: BCC (2018), Bristol City LEAP; GLA (2020), Energy Assessment Guidance, draft.
137
Cambridgeshire & Peterborough Independent Commission on Climate Buildings
Generally potential will be concentrated in heat dense areas, more likely in bigger towns and cities.
There is likely to be some potential for district heating from low-carbon sources:
Some potential has been previously identi�ed,20 linked to Anglia Ruskin campus and to Cambridge University buildings, but the historic city centre makes development di�cult. There is now a district heating spine for new development in north west Cambridge, linked to Cambridge University, with 700 homes connected initially and potential for more to be added. Where schemes like this are gas-based, a pathway will be needed to switch them to zero-carbon sources;
Peterborough is looking to a new smart energy hub as a means of meeting rising energy demand. An existing energy from waste plant could supply a heat network. The Peterborough Integrated Renewables Infrastructure (PIRI) project, led by the City Council, is currently developing options, encompassing the electricity network and potential for electric vehicle charging as well. It aims to deliver a signi�cant reduction in emissions as well as cutting energy bills. This is potentially a major scheme, with lessons for other cities too.
-
-
The development at Swa�ham Prior (Box 5.7) suggests there is potential for community schemes. A majority of the householders in Swa�ham Prior have signed up for the project, which o�ers potential reduction in energy bills, and signi�cant emissions savings in moving away from oil-�red heating. The scheme has taken more than 3 years to develop, but demonstrates the role that local actors can have in galvanizing action, and progress that can be made with local Council support.
District heating potential should be explored further, but the main decarbonisation option is likely to be electri�cation through the adoption of heat pumps:
Installation of heat pumps may be initially prioritised o� the gas grid and in new-build, where they are most cost-e�ective. This will also help to build supply-chains for wider adoption in later years in buildings currently on the gas grid;
Installation of hybrid heat pumps21 on the gas grid is an option. These are not zero-carbon. Unless hydrogen is available to replace natural gas, they are not the long-term answer (and, as indicated below, we think hydrogen for heating should not be planned for as an appropriate long-term option for CPCA). But hybrid heat pump use as a transitional option should produce signi�cant emissions savings, and help build supply-chains for a full heat pump transition.
More energy e�cient buildings, required for heat pumps, could also help to support load ‘spreading’ to avoid excessive peak load scenarios for a future grid.
21 In a hybrid heat pump, the heat pump meets the bulk of heat demand, but the gas boiler is retained and is there to provide heat on the coldest winter days.
20 AECOM (2011), Cambridge City Centre District Heating. The potential identi�ed was for a gas CHP scheme; viability would need to be considered for a low-Carbon option.
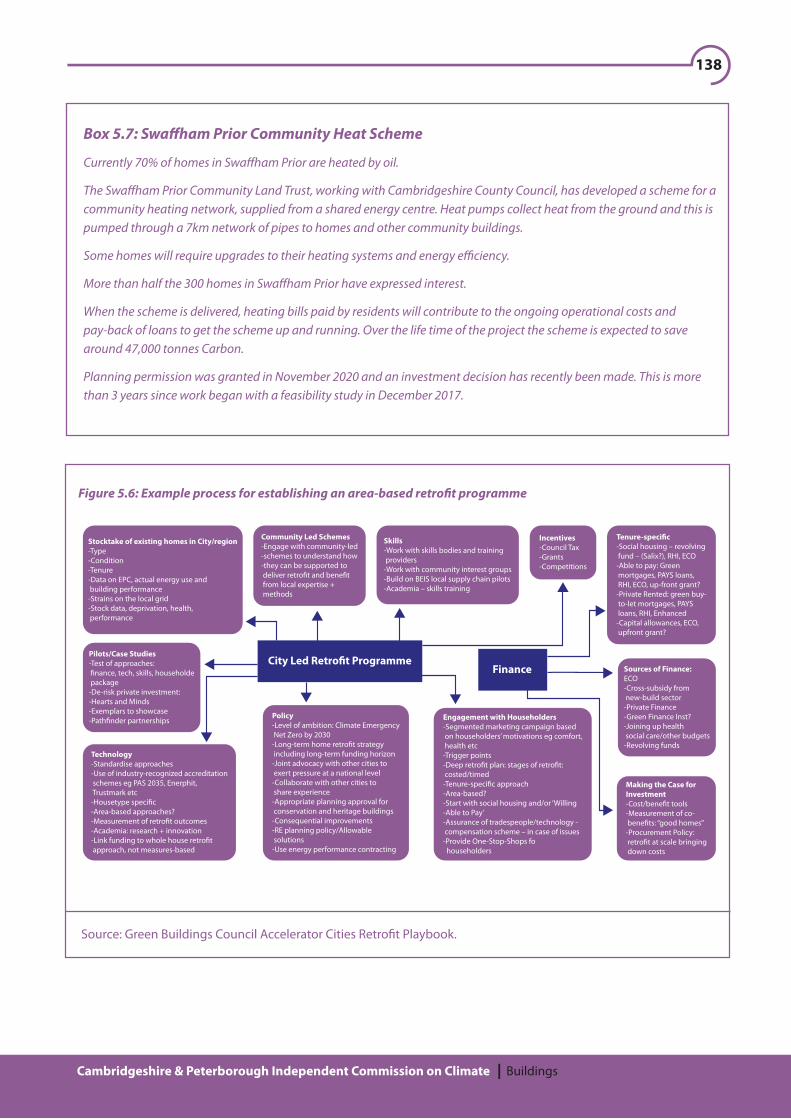
138
Cambridgeshire & Peterborough Independent Commission on Climate Buildings
Box 5.7: Swa�ham Prior Community Heat Scheme
Currently 70% of homes in Swa�ham Prior are heated by oil.
The Swa�ham Prior Community Land Trust, working with Cambridgeshire County Council, has developed a scheme for a community heating network, supplied from a shared energy centre. Heat pumps collect heat from the ground and this is pumped through a 7km network of pipes to homes and other community buildings.
Some homes will require upgrades to their heating systems and energy e�ciency.
More than half the 300 homes in Swa�ham Prior have expressed interest.
When the scheme is delivered, heating bills paid by residents will contribute to the ongoing operational costs and pay-back of loans to get the scheme up and running. Over the life time of the project the scheme is expected to save around 47,000 tonnes Carbon.
Planning permission was granted in November 2020 and an investment decision has recently been made. This is more than 3 years since work began with a feasibility study in December 2017.
Stocktake of existing homes in City/region-Type-Condition-Tenure-Data on EPC, actual energy use and building performance-Strains on the local grid-Stock data, deprivation, health, performance
Community Led Schemes-Engage with community-led-schemes to understand how-they can be supported to deliver retro�t and bene�t from local expertise + methods
Skills-Work with skills bodies and training providers-Work with community interest groups-Build on BEIS local supply chain pilots-Academia – skills training
Incentives-Council Tax-Grants-Competitions
Tenure-speci�c-Social housing – revolving fund – (Salix?), RHI, ECO-Able to pay: Green mortgages, PAYS loans, RHI, ECO, up-front grant?-Private Rented: green buy- to-let mortgages, PAYS loans, RHI, Enhanced-Capital allowances, ECO, upfront grant?
Pilots/Case Studies-Test of approaches: �nance, tech, skills, householde package-De-risk private investment:-Hearts and Minds-Exemplars to showcase-Path�nder partnerships
Sources of Finance:ECO-Cross-subsidy from new-build sector-Private Finance-Green Finance Inst?-Joining up health social care/other budgets-Revolving funds
Technology-Standardise approaches-Use of industry-recognized accreditation schemes eg PAS 2035, Enerphit, Trustmark etc-Housetype speci�c-Area-based approaches?-Measurement of retro�t outcomes-Academia: research + innovation-Link funding to whole house retro�t approach, not measures-based
Policy-Level of ambition: Climate Emergency Net Zero by 2030-Long-term home retro�t strategy including long-term funding horizon-Joint advocacy with other cities to exert pressure at a national level-Collaborate with other cities to share experience-Appropriate planning approval for conservation and heritage buildings-Consequential improvements-RE planning policy/Allowable solutions-Use energy performance contracting
Engagement with Householders-Segmented marketing campaign based on householders’ motivations eg comfort, health etc-Trigger points-Deep retro�t plan: stages of retro�t: costed/timed-Tenure-speci�c approach-Area-based?-Start with social housing and/or ‘Willing-Able to Pay’-Assurance of tradespeople/technology - compensation scheme – in case of issues-Provide One-Stop-Shops fo householders
Making the Case forInvestment-Cost/bene�t tools-Measurement of co- bene�ts: “good homes”-Procurement Policy: retro�t at scale bringing down costs
City Led Retro�t ProgrammeFinance
Figure 5.6: Example process for establishing an area-based retro�t programme
Source: Green Buildings Council Accelerator Cities Retro�t Playbook.

139
Cambridgeshire & Peterborough Independent Commission on Climate Buildings
“Solar Together”, used by Cambridgeshire County Council, o�ering solar panels to householders with purchasing savings achieved through bulk purchase.
-
The switch over of the gas grid to hydrogen has been identi�ed as an option. Full hydrogen conversion would be a substantial supply-side challenge given the cost and energy requirement to produce hydrogen. It is possible that hydrogen might be an option in some places in the longer-term. We agree with the CCC recommendation that BEIS and Ofgem should undertake work to identify priority candidate areas for hydrogen, and areas unlikely to be suitable. This will help to inform development and network investments. But we currently see no reason to think CPCA would be a priority for limited supplies (the CCC only has limited use of hydrogen for heating in its scenarios, and this is after 2030 and near to industrial clusters). To the extent that hydrogen is available it may be better prioritised for other uses than heating our homes. Our conclusion is that we need to make progress with other options.
Against this background, important next steps for CPCA are to:
Develop local energy plans and understanding of the stock. The need is to move beyond a project-by-project approach to systematic area-based programmes for retro�t and delivery of low-carbon energy.
These plans need to be developed with the engagement of others with strong interests, such as UKPN, �ood authorities and water companies.
Marrying up housing stock data with information on the income/deprivation levels will help inform roll out and �nancing plans.
Plans will need to develop consistent with developments in the national policy framework. But identi�cation of areas for low-carbon district heating would enable buildings in these areas to be exempted from any national ban on fossil fuel boilers, so that they only need to transition once. In areas not designated for hydrogen (which is likely to have a limited role in CPCA) or heat networks, future standards phasing out the installation of gas appliances will allow low-carbon heating, primarily through heat pumps, to become widespread.
Develop a �nancing plan (as covered in Chapter 2). There is no single pot for funding. A substantial element of �nance will come through the private sector (householders, landlords and owners of non-residential buildings). Some funding will be available from central Government. In the short-term this includes the Green Homes Grant. The CPCA and other authorities should aim to make full use of the local authority element of this funding and encourage its use by householders for basic measures. Beyond this there is funding from the RHI and likely funding from successor schemes. The scale of any gap needs to be identi�ed, and potential funding routes explored.
Develop plans for public engagement. Local energy plans will provide a focus for meaningful engagement.
Develop an enhanced central level of expertise with skills to help constituent authorities deliver investment and �nance and support procurement strategies. There may be lessons to learn from strategies used elsewhere, including:
-
-
-
Appointment of partners to take forward energy e�ciency and renewable energy schemes. Bouygues, for example, have been appointed by Cambridge City Council and Cambridgeshire County Council, and will guarantee energy savings (subject to new equipment being managed within de�ned limits).
-
140
Cambridgeshire & Peterborough Independent Commission on Climate Buildings
Lead by example – the CPCA and local authority own estate and social housing should be priorities for action.
Develop veri�cation and enforcement plans, based on performance
requirements for energy and ventilation need to be co-ordinated. If this is not done, homes with airtight fabric but poor ventilation could be at risk of over-heating and poor indoor air quality. Home upgrade measures might include shading measures, such as high speci�cation blinds or external shading; and ventilation measures such as extractor fans, mechanical extract ventilation (MEV) and mechanical extract ventilation and heat recovery (MVHR).
Retro�t programmes should include water e�ciency measures (e.g. low-�ow showers, low-�ow taps).
The overall process is well illustrated in an organogram (Figure 5.6) sourced from the Green Buildings Council Accelerator Cities Retro�t Playbook.
The high level of new build expected and being planned for within CPCA makes strong standards for new build even more important. If new homes are built at the rate currently in local plans then they could make up as approaching 40% of the stock in 2050. Development of the Oxford-Cambridge Arc will be a signi�cant contributor to this growth. The Government has committed to set high standards for this development, including for carbon emissions, water management and green space - these will need to be delivered.
Homes built with gas boilers in advance of the Future Homes Standard coming in will have to replace that boiler at a future date. There are examples of authorities within CPCA adopting planning standards higher than national requirements (Greater Cambridge). Pending adoption nationally of a standard unequivocally consistent with net zero it will be useful if that potential is retained, and CPCA should adopt more widely the highest possible standards or future-proo�ng requirements as soon as possible. London Energy Transformation Initiative (LETI) or RIBA 2030 Climate Challenge standards provide suitable models.
Adaptation
In relation to new developments:
Assessment of overheating risk should be included within the planning process. Developers should be required to assess factors such as site location, hard surface adjacency, building layout and green space availability, and mitigate as appropriate. This could include passive and active cooling measures. Provision of urban greenspace, as well as having amenity and health bene�ts, can also help mitigate the urban heat island e�ect, reduce overheating risk and has potential for biodiversity net gain.
SuDS should be required in all developments. Where they are currently built in this is frequently through “grey” measures (e.g. underground retention systems), and not “green” SuDS (e.g. rain gardens, grassed areas, swales, and ponds). Green SuDS have substantially higher bene�ts (for water quality, biodiversity, amenity and health) and should be strongly preferred in guidance (for new build and retro�t).
Key to progress will be to ensure that, in relation to retro�t, adaptation measures are considered as part of the whole house package:
141
Cambridgeshire & Peterborough Independent Commission on Climate Buildings
Consideration should be given to setting more ambitious standards for water consumption in new build regulations.
What does it mean if we take these actions?
Delivery on these recommendations should help put CPCA on track to net-zero, with substantial reductions in emissions.
There will be some up-front costs.
The PCAN analysis for this report suggests an investment requirement, across the region, of £5.4 billion over the next couple of decades for all the housing measures it has assessed, of which £2.3 billion would more than paid back in reduced energy costs. For public and commercial buildings, the overall investment requirement is around £3 billion, of which approaching £2 billion would be cost-e�ective in reduced energy bills.
Mechanisms to provide and incentivise provision of this funding require further consideration. Some of the cost will fall to the public sector, and some to households and business. The PCAN work suggests that substantial progress is possible through a package of measures that overall is cost neutral in impact.
Aside from emissions reduction, this investment will also then provide substantial wider bene�ts:
Our homes and buildings should be safer and more comfortable to live and work in. They should be better for our health and more a�ordable to run:
Health. Close to one-third of excess winter deaths are currently attributable to living in a cold home. Respiratory infections and circulatory disease are also associated with poorly heated homes.
Energy e�ciency measures should mean lower energy bills. There should be particular bene�ts to lower income households and those in fuel poverty, who spend more on heating relative to income than higher income households, mainly because of more energy-ine�cient homes
Overheating risks can be reduced and indoor air quality improved.
Improved water e�ciency should reduce bills (with some impact in reducing energy usage as well).
Improved �ood resilience from property level measures and SuDS.
-
-
-
-
Increased green spaces and green SuDS have a range of bene�ts: helping to maintain water quality and supply; helping to reduce surface water �ooding; supporting biodiversity; having amenity value; health bene�ts; providing space for walking and cycling. Those living in deprived areas tend to have amongst the lowest access to good quality green spaces, so there is potential through appropriate targeting to address this inequality.
New developments planned for good bus provision, and active travel, can help people feel connected to their community.
Requirements to retro�t our buildings and switch to low-carbon heating should provide many new training and job opportunities in the local area.
-
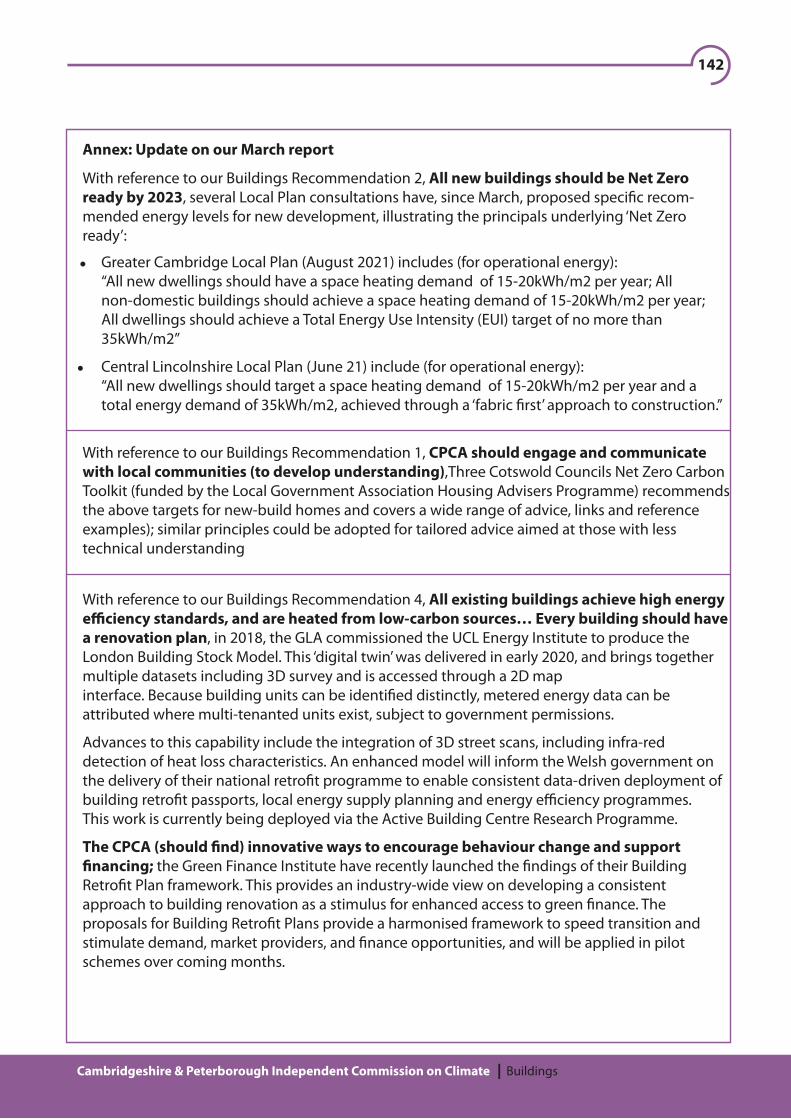
142
Cambridgeshire & Peterborough Independent Commission on Climate Buildings
With reference to our Buildings Recommendation 2, All new buildings should be Net Zero ready by 2023, several Local Plan consultations have, since March, proposed speci�c recom-mended energy levels for new development, illustrating the principals underlying ‘Net Zero ready’:
With reference to our Buildings Recommendation 1, CPCA should engage and communicate with local communities (to develop understanding),Three Cotswold Councils Net Zero Carbon Toolkit (funded by the Local Government Association Housing Advisers Programme) recommends the above targets for new-build homes and covers a wide range of advice, links and reference examples); similar principles could be adopted for tailored advice aimed at those with less technical understanding
With reference to our Buildings Recommendation 4, All existing buildings achieve high energy e�ciency standards, and are heated from low-carbon sources… Every building should have a renovation plan, in 2018, the GLA commissioned the UCL Energy Institute to produce the London Building Stock Model. This ‘digital twin’ was delivered in early 2020, and brings together multiple datasets including 3D survey and is accessed through a 2D map interface. Because building units can be identi�ed distinctly, metered energy data can be attributed where multi-tenanted units exist, subject to government permissions.
Advances to this capability include the integration of 3D street scans, including infra-red detection of heat loss characteristics. An enhanced model will inform the Welsh government on the delivery of their national retro�t programme to enable consistent data-driven deployment of building retro�t passports, local energy supply planning and energy e�ciency programmes.This work is currently being deployed via the Active Building Centre Research Programme.
The CPCA (should �nd) innovative ways to encourage behaviour change and support �nancing; the Green Finance Institute have recently launched the �ndings of their Building Retro�t Plan framework. This provides an industry-wide view on developing a consistent approach to building renovation as a stimulus for enhanced access to green �nance. The proposals for Building Retro�t Plans provide a harmonised framework to speed transition and stimulate demand, market providers, and �nance opportunities, and will be applied in pilot schemes over coming months.
Annex: Update on our March report
Greater Cambridge Local Plan (August 2021) includes (for operational energy):“All new dwellings should have a space heating demand of 15-20kWh/m2 per year; All non-domestic buildings should achieve a space heating demand of 15-20kWh/m2 per year; All dwellings should achieve a Total Energy Use Intensity (EUI) target of no more than 35kWh/m2”
Central Lincolnshire Local Plan (June 21) include (for operational energy):“All new dwellings should target a space heating demand of 15-20kWh/m2 per year and a total energy demand of 35kWh/m2, achieved through a ‘fabric �rst’ approach to construction.”

143
Cambridgeshire & Peterborough Independent Commission on Climate Buildings
In relation to Embodied Carbon, the UN’s Industrial Deep Decarbonisation Initiative (IDDI) campaigns to begin disclosure of embodied carbon in construction projects starting no later than 2023, aspiring to a 30- 50% reduction in embodied carbon in public projects by 2030, on a path to near 100% reduction by 2050; a World Green Building Council commitment for 2030 requires all new buildings, infrastructure and renovations to have at least 40% less embodied carbon, urging cities and regions to adopt embodied carbon strategies to achieve this.
Current RIBA/LETI benchmark limits are aligned and have formed inputs into Net Zero model trajectories for the UKGBC sectoral road map, but recognise there is currently large variation in inputs to Life Cycle Analysis. Current 2030 targets are around 500-600kgCO2e/m2 GIA, and include two scopes for ‘Upfront’ (construction) carbon, and total Embodied Carbon.
An aligned industry proposal for ‘Part Z’ building regulations suggests whole-life carbon emissions to be assessed and reported for the building and any other parts of the project where Building Regulations apply; initially for ‘upfront carbon’ in products and construction, with emissions to include in-use products, construction plus end of life. Calculations at design stage will be based on generic element/material values, and post construction records based on �nal material quantities and relevant Environmental Product Declarations.
Sources:
https://consultations.greatercambridgeplanning.org/greater-cambridge-local-plan-�rst-proposals
Central Lincolnshire Local Plan Review – Draft Local Plan Consultation - Central Lincolnshire Planning Policy Consultations (inconsult.uk)
https://www.cotswold.gov.uk/media/05couqdd/netzero-carbon-toolkit.pdf
London Building Stock Model | London City Hall
green�nanceinstitute.co.uk/green-�nance-institute-launches-uk-framework-for -building - renovations-plans/
https://www.unido.org/IDDI
Embodied carbon call to action report | World Green Building Council (worldgbc.org)
Carbon Alignment | LETI
AD-Z+Proposal+20-07-2021+rev0.pdf (squarespace.com)
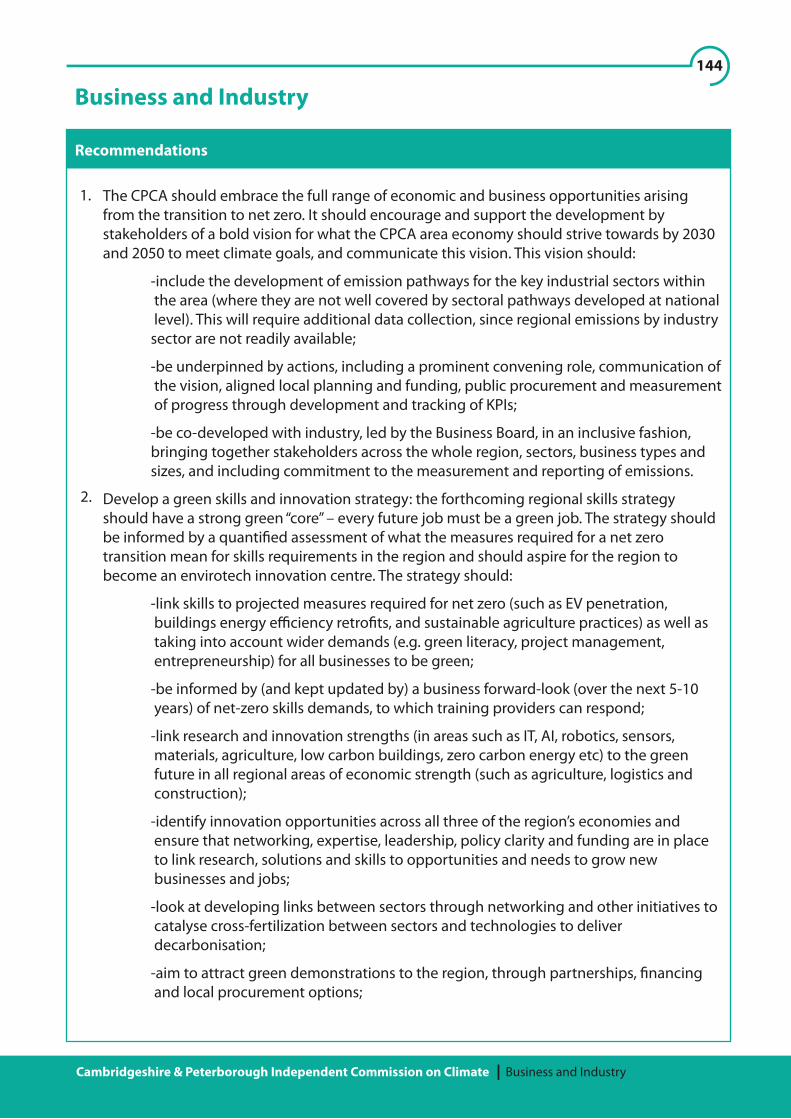
144
The CPCA should embrace the full range of economic and business opportunities arising from the transition to net zero. It should encourage and support the development by stakeholders of a bold vision for what the CPCA area economy should strive towards by 2030 and 2050 to meet climate goals, and communicate this vision. This vision should:
-include the development of emission pathways for the key industrial sectors within the area (where they are not well covered by sectoral pathways developed at national level). This will require additional data collection, since regional emissions by industry sector are not readily available;
-be underpinned by actions, including a prominent convening role, communication of the vision, aligned local planning and funding, public procurement and measurement of progress through development and tracking of KPIs;
-be co-developed with industry, led by the Business Board, in an inclusive fashion, bringing together stakeholders across the whole region, sectors, business types and sizes, and including commitment to the measurement and reporting of emissions.
Develop a green skills and innovation strategy: the forthcoming regional skills strategy should have a strong green “core” – every future job must be a green job. The strategy should be informed by a quanti�ed assessment of what the measures required for a net zero transition mean for skills requirements in the region and should aspire for the region to become an envirotech innovation centre. The strategy should:
-link skills to projected measures required for net zero (such as EV penetration, buildings energy e�ciency retro�ts, and sustainable agriculture practices) as well as taking into account wider demands (e.g. green literacy, project management, entrepreneurship) for all businesses to be green;
-be informed by (and kept updated by) a business forward-look (over the next 5-10 years) of net-zero skills demands, to which training providers can respond;
-link research and innovation strengths (in areas such as IT, AI, robotics, sensors, materials, agriculture, low carbon buildings, zero carbon energy etc) to the green future in all regional areas of economic strength (such as agriculture, logistics and construction);
-identify innovation opportunities across all three of the region’s economies and ensure that networking, expertise, leadership, policy clarity and funding are in place to link research, solutions and skills to opportunities and needs to grow new businesses and jobs;
-look at developing links between sectors through networking and other initiatives to catalyse cross-fertilization between sectors and technologies to deliver decarbonisation;
-aim to attract green demonstrations to the region, through partnerships, �nancing and local procurement options;
Business and Industry
Cambridgeshire & Peterborough Independent Commission on Climate Business and Industry
Recommendations
1.
2.

145
Cambridgeshire & Peterborough Independent Commission on Climate Business and Industry
-encourage the inclusion of net zero into all parts of education system, starting with primary and secondary schools, ensuring it is embedded in the curriculum and in school careers advisory services.
Expand net zero awareness raising and advice services for business:
-use the CPCA’s convening power to bring together local initiatives and organisations, including the Chambers of Commerce and CBI, to ensure that support is available to all businesses, and access to local and central government support schemes and advice;
-focus on simple priority areas for action, linking to resources such as the Government’s climate hub, including implementation of energy e�ciency measures, switching to renewable electricity tari�s, planning building renovation and decarbonisation measures, switching to electric vehicles. This should be developed over time to provide advice that is more sector-speci�c;
-use existing business networks, and the network developed through the Low Carbon Business Charter, to spread good practice (e.g. from larger businesses to smaller businesses), build awareness of the need to consider training and skills needs, and build understanding of the challenges facing particular sectors (such as agriculture);
-consider related means of building awareness and focus on speci�c issues facing regional industries, such as establishing a net-zero innovation prize and use of trade fairs.
Businesses within the region should:
-prioritise actions towards net zero in reducing own emissions (for example, using a shadow carbon price in procurement and investment decisions);
-look to collaborate and where appropriate play a leadership role helping others to reach net zero, including businesses, locally and in the supply-chain (aligning procurement with net zero), and with employees (such as through supporting sustain able travel modes).
Develop a regional “Race to Zero” – a Mayor’s Low Carbon Business Charter:
-building on existing schemes (e.g. in Cambridge and Peterborough), encourage and enable local organisations and businesses of all types and sizes to sign up to pathways to net zero emissions, with shorter-term targets and actions for 2025 or 2030 as well as longer-term commitments;
-link the initiative to sources of advice to business on actions towards net zero;
-consider establishing a loan scheme to help businesses make low-cost low carbon changes, such as for lighting and heating.
The CPCA should immediately use its own purchasing power in the form of green innovation procurement, to be an exemplar to others and help create local experience and business models to make the region an early mover in technologies and businesses to meet climate goals.
3.
4.
5.
6.
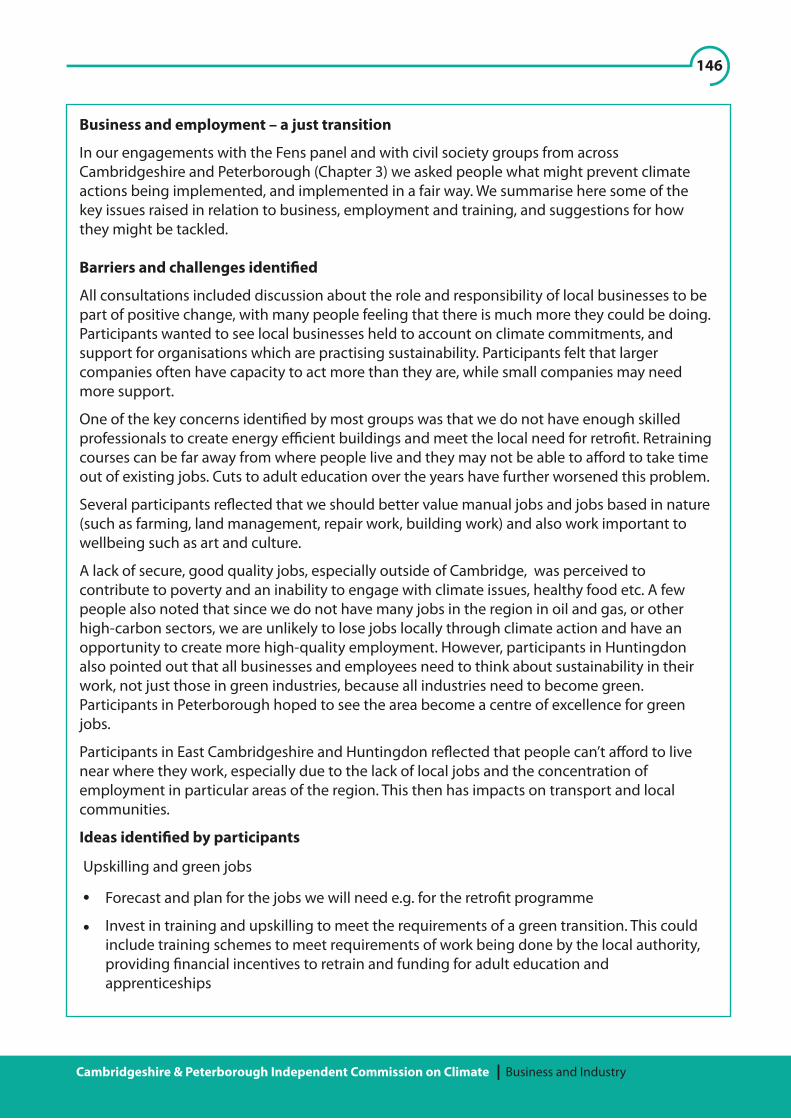
146
Cambridgeshire & Peterborough Independent Commission on Climate Business and Industry
Business and employment – a just transition
In our engagements with the Fens panel and with civil society groups from across Cambridgeshire and Peterborough (Chapter 3) we asked people what might prevent climate actions being implemented, and implemented in a fair way. We summarise here some of the key issues raised in relation to business, employment and training, and suggestions for how they might be tackled.
Barriers and challenges identi�ed
All consultations included discussion about the role and responsibility of local businesses to be part of positive change, with many people feeling that there is much more they could be doing.Participants wanted to see local businesses held to account on climate commitments, and support for organisations which are practising sustainability. Participants felt that larger companies often have capacity to act more than they are, while small companies may need more support.
One of the key concerns identi�ed by most groups was that we do not have enough skilled professionals to create energy e�cient buildings and meet the local need for retro�t. Retraining courses can be far away from where people live and they may not be able to a�ord to take time out of existing jobs. Cuts to adult education over the years have further worsened this problem.
Several participants re�ected that we should better value manual jobs and jobs based in nature (such as farming, land management, repair work, building work) and also work important to wellbeing such as art and culture.
A lack of secure, good quality jobs, especially outside of Cambridge, was perceived to contribute to poverty and an inability to engage with climate issues, healthy food etc. A few people also noted that since we do not have many jobs in the region in oil and gas, or other high-carbon sectors, we are unlikely to lose jobs locally through climate action and have an opportunity to create more high-quality employment. However, participants in Huntingdon also pointed out that all businesses and employees need to think about sustainability in their work, not just those in green industries, because all industries need to become green. Participants in Peterborough hoped to see the area become a centre of excellence for green jobs.
Participants in East Cambridgeshire and Huntingdon re�ected that people can’t a�ord to live near where they work, especially due to the lack of local jobs and the concentration of employment in particular areas of the region. This then has impacts on transport and local communities.
Ideas identi�ed by participants
Forecast and plan for the jobs we will need e.g. for the retro�t programme
Invest in training and upskilling to meet the requirements of a green transition. This could include training schemes to meet requirements of work being done by the local authority, providing �nancial incentives to retrain and funding for adult education and apprenticeships
Upskilling and green jobs
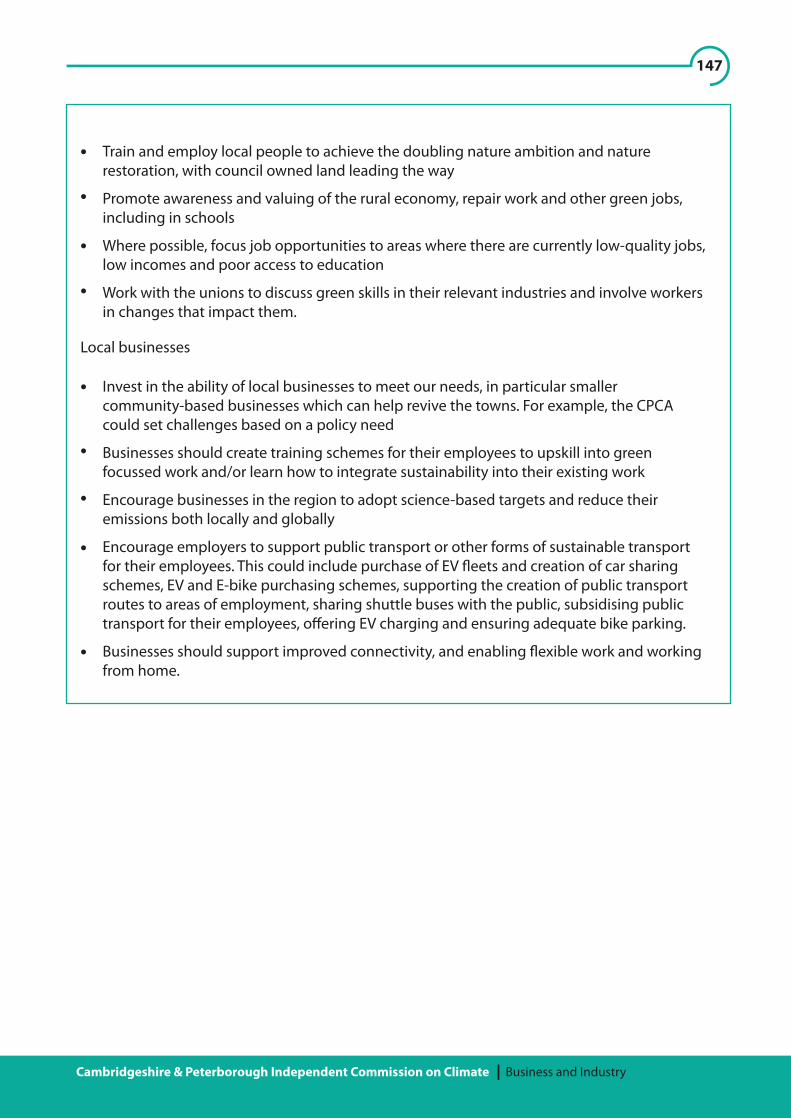
147
Cambridgeshire & Peterborough Independent Commission on Climate Business and Industry
Train and employ local people to achieve the doubling nature ambition and nature restoration, with council owned land leading the way
Promote awareness and valuing of the rural economy, repair work and other green jobs, including in schools
Where possible, focus job opportunities to areas where there are currently low-quality jobs, low incomes and poor access to education
Work with the unions to discuss green skills in their relevant industries and involve workers in changes that impact them.
Local businesses
Invest in the ability of local businesses to meet our needs, in particular smaller community-based businesses which can help revive the towns. For example, the CPCA could set challenges based on a policy need
Businesses should create training schemes for their employees to upskill into green focussed work and/or learn how to integrate sustainability into their existing work
Encourage businesses in the region to adopt science-based targets and reduce their emissions both locally and globally
Encourage employers to support public transport or other forms of sustainable transport for their employees. This could include purchase of EV �eets and creation of car sharing schemes, EV and E-bike purchasing schemes, supporting the creation of public transport routes to areas of employment, sharing shuttle buses with the public, subsidising public transport for their employees, o�ering EV charging and ensuring adequate bike parking.
Businesses should support improved connectivity, and enabling �exible work and working from home.
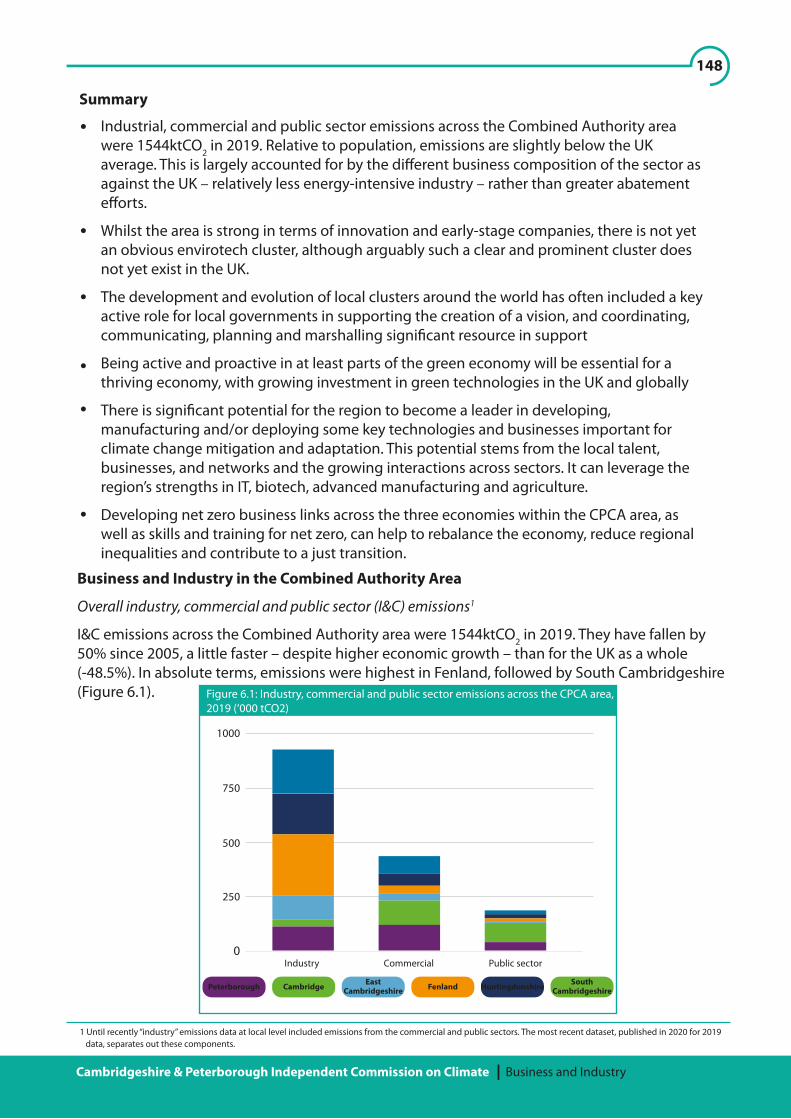
148
Cambridgeshire & Peterborough Independent Commission on Climate Business and Industry
Industrial, commercial and public sector emissions across the Combined Authority area were 1544ktCO2 in 2019. Relative to population, emissions are slightly below the UK average. This is largely accounted for by the di�erent business composition of the sector as against the UK – relatively less energy-intensive industry – rather than greater abatement e�orts.
Whilst the area is strong in terms of innovation and early-stage companies, there is not yet an obvious envirotech cluster, although arguably such a clear and prominent cluster does not yet exist in the UK.
The development and evolution of local clusters around the world has often included a key active role for local governments in supporting the creation of a vision, and coordinating, communicating, planning and marshalling signi�cant resource in support
Being active and proactive in at least parts of the green economy will be essential for a thriving economy, with growing investment in green technologies in the UK and globally
There is signi�cant potential for the region to become a leader in developing, manufacturing and/or deploying some key technologies and businesses important for climate change mitigation and adaptation. This potential stems from the local talent, businesses, and networks and the growing interactions across sectors. It can leverage the region’s strengths in IT, biotech, advanced manufacturing and agriculture.
Developing net zero business links across the three economies within the CPCA area, as well as skills and training for net zero, can help to rebalance the economy, reduce regional inequalities and contribute to a just transition.
Summary
Business and Industry in the Combined Authority Area
Overall industry, commercial and public sector (I&C) emissions1
I&C emissions across the Combined Authority area were 1544ktCO2 in 2019. They have fallen by 50% since 2005, a little faster – despite higher economic growth – than for the UK as a whole (-48.5%). In absolute terms, emissions were highest in Fenland, followed by South Cambridgeshire (Figure 6.1). Figure 6.1: Industry, commercial and public sector emissions across the CPCA area,
2019 (‘000 tCO2)
Industry Commercial Public sector
250
500
750
1000
0
1 Until recently “industry” emissions data at local level included emissions from the commercial and public sectors. The most recent dataset, published in 2020 for 2019 data, separates out these components.
Peterborough Cambridge EastCambridgeshire Fenland Huntingdonshire South
Cambridgeshire

149
Cambridgeshire & Peterborough Independent Commission on Climate Business and Industry
2 CPIER (2018), Cambridgeshire and Peterborough Independent Economic Review, Final Report, September 2018.
Relative to population, emissions in 2019 were around 1.8tCO2 per head of population, around 5% lower than the UK average (1.9tCO2 per head). This is largely accounted for by the di�erent composition of the sector as against the UK – relatively less energy-intensive industry (emissions from large industrial installations are only 0.09tCO2/head in the CPCA area, as against 0.47tCO2/head in the UK). Nevertheless, there is considerable variation in emissions within the area (Figure 6.2).
Figure 6.2: Industry emissions (tCO2) per head, across the CPCA area, 2019
Industry Commercial Public sector
1
2
3
4
UKCPCA
The Greater Cambridge area: prosperous; attracts international businesses; high skills and wages;
Around Peterborough: signi�cant industrial activities, but many residents feel untouched by the economic success of the Greater Cambridge area;
The agricultural area and market towns of the Fens: the most challenged economically; many market towns struggling to attract and retain young people; struggling to maintain distinctive high-value industries.
The CPIER report2, and follow-up analyses, have identi�ed three economies within the area:
The relatively low share of industry emissions within the I&C total for the CPCA area suggests that there is relatively strong potential to reduce emissions as the power sector decarbonises (emissions attached to the generation of electricity account for 38% of I&C emissions as against 29% for the UK).
Peterborough CambridgeEast
Cambridgeshire Fenland HuntingdonSouth
Cambridgeshire
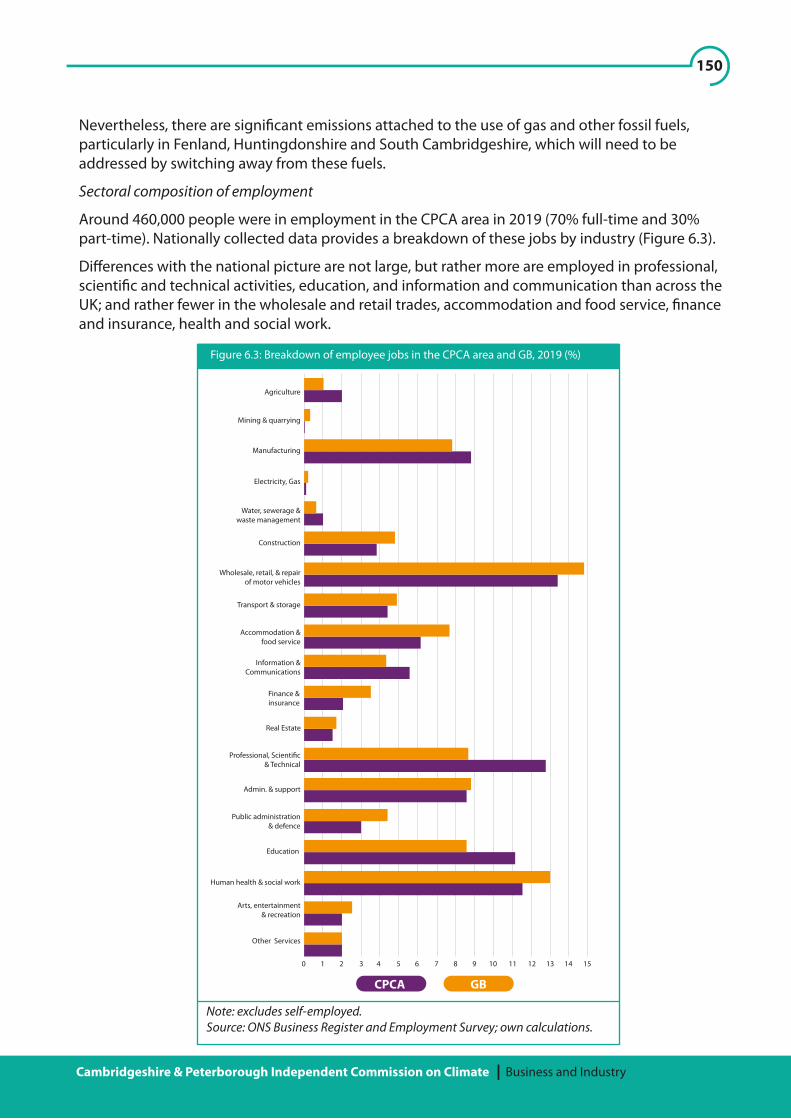
150
Cambridgeshire & Peterborough Independent Commission on Climate Business and Industry
Nevertheless, there are signi�cant emissions attached to the use of gas and other fossil fuels, particularly in Fenland, Huntingdonshire and South Cambridgeshire, which will need to be addressed by switching away from these fuels.
Sectoral composition of employment
Around 460,000 people were in employment in the CPCA area in 2019 (70% full-time and 30% part-time). Nationally collected data provides a breakdown of these jobs by industry (Figure 6.3).
Di�erences with the national picture are not large, but rather more are employed in professional, scienti�c and technical activities, education, and information and communication than across the UK; and rather fewer in the wholesale and retail trades, accommodation and food service, �nance and insurance, health and social work.
Agriculture
Mining & quarrying
Manufacturing
Electricity, Gas
Water, sewerage &waste management
Construction
Wholesale, retail, & repairof motor vehicles
Transport & storage
Accommodation &food service
Information &Communications
Finance &insurance
Real Estate
Professional, Scienti�c& Technical
Admin. & support
Public administration& defence
Education
Human health & social work
Arts, entertainment& recreation
Other Services
1 2 3 4 5 6 7 8 9 10 11 12 13 14 150
Figure 6.3: Breakdown of employee jobs in the CPCA area and GB, 2019 (%)
CPCA GB
Note: excludes self-employed.Source: ONS Business Register and Employment Survey; own calculations.

151
Cambridgeshire & Peterborough Independent Commission on Climate Business and Industry
These di�erences are broadly consistent with the relative levels of emissions across districts within CPCA. In addition, as previously mentioned, there are stark di�erences between the economic structure of di�erent parts of the CPCA area (e.g. between Cambridge and Peterborough), and incremental strategies could lead to increases in the opportunity gap across areas.3 The sectoral pattern also suggests di�erent opportunities attached to the transition to net zero emissions: for example, new skills will be required in the motor trades, which are relatively highly concentrated in Peterborough; the transition to sustainable farming methods will be relatively important in Fenlands and East Cambridgeshire; construction activity is high across the CPCA area, but employment – and the associated need for reskilling – is relatively high in Huntingdonshire and South Cambridgeshire.
The importance of knowledge intensive (KI) industries
Knowledge intensive industries have been a strong source of growth in recent years within the CPCA area, and have been identi�ed as a potential strong source of future growth.
Cambridge Cluster Insights4 provides disaggregated data on employment and company numbers which provide further insight than possible from O�ce for National Statistics (ONS) data. In relation to knowledge intensive industries (Box 6.1) this indicates that around 72,000 people were employed in these sectors in 2019-20, making up over 20% of total employment in the region. As a source of employment these jobs are concentrated in Cambridge and South Cambridgeshire, where the life sciences cluster is generally acknowledged as world-leading, but with strong pockets of high-tech manufacturing in Peterborough and to a lesser extent in East Cambridgeshire and Huntingdonshire (Figure 6.4).
This data also show di�erences within the CPCA area:
Relatively high shares of employment in agriculture in Fenland (5%) and East Cambridgeshire (4%);
Relatively high manufacturing employment in Fenland (16%), East Cambridgeshire (12%), Huntingdonshire (15%) and South Cambridgeshire (12%);
Relatively high employment in professional, scienti�c and technical trades in South Cambridgeshire (26%) and Cambridge (16%);
Relatively high employment in Peterborough in business administration and support services (13%) and retail (11%).
4 https://www.cambridgeahead.co.uk/cambridge-cluster-insights/
Box 6.1: Knowledge-intensive industries
Information technology and telecoms: computer consultancy; data processing and hosting; software development and publishing; high-tech manufacturing – IT; IT and computer services; other IT; telecoms activities; tv and video production; recording, publishing and broadcasting; information services.
Life sciences and healthcare: high-tech manufacturing – life sciences; medical instruments; biotechnology R&D; other life science.
High-tech manufacturing
Knowledge intensive services: engineering and science consultancy; R&D and technical testing; R&D social sciences; environmental consulting; KIS professional business services.
3 See also, Mealy, P., Coyle, D, To them that hath: economic complexity and local industrial strategy in the UK, Int Tax Public Finance (2021).

152
Cambridgeshire & Peterborough Independent Commission on Climate Business and Industry
The primary sectors account for a signi�cant proportion of turnover in East Cambridgeshire and Fenland. Food processing and packaging industries are located in the Fens;
The National Institute of Agricultural Botany (NIAB) is headquartered in Cambridge, with an innovation hub at Soham. This is a crop science and research organisation, concerned with the application of genetics, soil science and precision agronomy to improve yields and the resilience of crop production;
Companies such as Dogtooth (developing robots to pick soft fruit), Aponic (developing vertical farming) and many others are located in the area.
Figure 6.4: Employment in knowledge intensive sectors, 2019-20
42
40
38
36
34
32
30
28
26
24
22
20
18
16
14
12
10
8
6
4
2
0
Informationtechnology & telecoms Life science & healthcare High-tech manufacturing KI services
Note: De�nitional di�erences across surveys are such that overall employee numbers do not align with those in ONS data. But the Cambridge Cluster Insights data provides an indication of where, within the CPCA area, these KI jobs are located.Source: Cambridge Cluster Insights
CPCA
Agritech
The region is also home to an agritech cluster, underpinned by agricultural strengths, based on the development of science, research and innovation to improve agricultural methods:
Peterborough CambridgeEast
Cambridgeshire Fenland HuntingdonshireSouth
Cambridgeshire

153
Cambridgeshire & Peterborough Independent Commission on Climate Business and Industry
national leaders in a number of horticultural and arable crops, encompassing small and large producers, with links to international markets and capacity to invest;
research and technical capabilities in engineering and plant sciences, with potential to address multi-disciplinary innovation challenges;
a critical mass of intermediaries, so that farmers are only “one step away” from new knowledge.
It also identi�ed challenges attached to the wide range of activities in the region, such that research agendas and outputs are not always aligned with business opportunities. It suggested that improved knowledge exchange, building on what Agri-TechE has achieved, would help to address this.
Business size
Small and medium enterprises (SMEs) can face particular di�culties in terms of resources and expertise to adjust to market developments and seize innovation opportunities. Understanding the implications of climate change for the business, actions required to respond, and opportunities to exploit, may not be recognised as immediate priorities. In addition, this may require upfront resource.
Of 37,000 enterprises in the CPCA area6, around 33,000 (89%) are micro-businesses with fewer than 10 employees. This is very similar to the proportion across England as a whole (Figure 6.5).
Figure 6.5: Enterprises by employment size band, 2020, %
Engl
and
CPCA
20 40 60 800
Micro (1-9
100 120
Small (10-49) Medium (50-249) Large (250+)
There is an existing network, Agri-TechE, with around 300 members which connects farmers, researchers and investors.
A paper by the University of Cambridge for BIS5 (now BEIS) identi�ed that this network provides a strong set of industrial and innovation capabilities, underpinned by:
5 Policy Links (2016), Making “smart specialisation” smarter, an industrial innovation system approach: the case of agri-tech east, report for BIS, Policy Links, CSTI, University of Cambridge.
6 Inter Departmental Business Register (ONS), 2020.
154
Cambridgeshire & Peterborough Independent Commission on Climate Business and Industry
Impact of COVID-19
The emissions data for the I&C sector used here, and the sectoral breakdowns of employment, date from before the COVID-19 pandemic. Clearly the pandemic has had huge impacts on business and employment, and these impacts have not been uniform across sectors. Recovery plans have to take account of these di�erential impacts, but the long-run requirement to reduce emissions across all sectors remains.
The Local Economic Recovery Strategy (LERS), published in March 2021, aims to promote recovery out of COVID-19. It looks to balance the promotion of growth in previously identi�ed priority sectors (life sciences; digital and AI; advanced manufacturing and materials; agritech) with the need to support the recovery of sectors hardest hit in the pandemic (including retail; hospitality and leisure; construction; education). Within this it identi�es a mission to “build back better and greener by accelerating high tech jobs and cluster growth, focusing on green, digital and net zero technologies”. In terms of actions (Box 6.2) there are a number of promising initiatives, though the link from these to the requirements of a green economy and net zero is not always apparent.
Investment in a Business Growth Service to deliver rebound and coaching services;
A new Inward Investment Service to attract new companies to the area;
3 new life sciences and transport technology accelerators;
Capital grant and start-up advice;
New manufacturing and agritech innovation launch pads;
Investment in housing market innovation;
Continued and accelerated delivery of transport programmes;
Investment in Cambridgeshire Active Travel schemes.
Box 6.2: The Local Economic Recovery Strategy (LERS)
The LERS envisages 3 phases of recovery out of COVID-19: a response phase (2021) managing the impacts of the pandemic and providing support; a recover and rebound phase (2021-2022/23), with the economy re-opening; a renewal and future growth phase (2023 and beyond).
In the renewal phase, objectives include: Peterborough to be a leading centre for net zero technologies and advanced manufacturing; the Greater Cambridge area consolidated as a global centre for science and technology (life sciences); a strengthening of the region as a UK centre for agritech.Funded actions include:
Source: CPCA (2021), Cambridgeshire and Peterborough Local Economic Recovery Strategy, March 2021.
A range of other interventions for the longer-term are proposed but currently without funding.
155
Cambridgeshire & Peterborough Independent Commission on Climate Business and Industry
Skills and training
A recent report of the Cambridgeshire and Peterborough Skills Advisory Panel7 recognises areas of local industrial strength. It looks to identify skills gaps and recognises lower skills levels and higher deprivation in the north of the CPCA area:
7 Cambridgeshire and Peterborough Skills Advisory Panel (2021), Cambridgeshire and Peterborough Local Skills Report, March 2021.8 https://www.cambridgenetwork.co.uk/directories/cambridge-cluster/sectors 9 CCC (2019), Net Zero - The UK’s contribution to stopping global warming.10 CCC (2020), The Sixth Carbon Budget – The UK’s path to Net Zero.
industrial strengths are recognised in the growth sectors of agritech; life sciences; IT and digital; manufacturing, advanced manufacturing and materials; logistics and distribution; education and professional services;
two further priority sectors are identi�ed in health and social care, and construction;
an extensive network of further education providers is identi�ed, focused on the delivery of vocational quali�cations and training, and a bridge to higher education;
within indicators of multiple deprivation, Fenland and Peterborough rank poorly for levels of education and skills.
The needs of the green economy, and the contribution that the CPCA could make to meeting these needs, is not addressed. Interviews with stakeholders, however, indicate that these industrial strengths, combined with the right policies, training and networking, can help to foster net zero innovation, advance net zero goals and promote economic opportunity.
Business networks
Business networks are strong in the Cambridge area. “Cambridge Network” suggests 63 networking groups at the last count, plus more special interest groups and strategic research initiatives from the University of Cambridge.8 There are also membership organisations such as Cambridge Ahead and Opportunity Peterborough. These provide a supportive environment for the growth of business, tech-based business in particular, linking companies and new starts with investors, incubators, universities and consultancies. But these are not net zero focused, presenting an opportunity for additional activities to help businesses reduce their own emissions and be successful early movers.
What has the Climate Change Committee recommended?
The national Climate Change Committee (CCC) has developed scenarios for sectoral emissions in 2050 consistent with achievement of net zero emissions overall.9 More recently it has made recommendations for the pathway to net-zero.10 To be on track to net-zero emissions from I&C its key recommendations include:
an overarching Industrial Decarbonisation Strategy from Government which aligns with achievement of net zero, providing a stable and fair framework within which businesses can plan. Amongst other requirements, this should include details of funding mechanisms; support for innovation and demonstrations of new low/zero-carbon technologies; policy development in relation to resource e�ciency, energy e�ciency and material substitution; and infrastructure plans (e.g. for hydrogen, CO2 transport and electricity networks);
increased business commitment to disclosure and reporting standards. The Task Force on Climate-Related Financial Disclosure (TCFD), for example, has set out corporate reporting approaches. A recent survey of (larger) FTSE100 companies has suggested that 99% are measuring and reporting emissions, and 67% have set emission reduction targets. All UK companies, particularly medium and large, should be doing this.

156
Cambridgeshire & Peterborough Independent Commission on Climate Business and Industry
immediate business actions to reduce emissions (Box 6.3);
use of o�sets to be minimised and standards, where they are used, to prioritise the permanence of removals. O�sets are not an alternative to reducing emissions as far as possible. By 2050 the CCC envisage o�sets should only be required for a few sectors (relating to residual emissions after Carbon Capture and Storage (CCS); wastewater treatment; legacy land�ll; and essential �ights).
Development of CCS clusters
Develop carbon-intensity measurement standards for products and production
Disclose carbon-intensity and lifecycle emissions of products and production
Demonstration of new fuel-switching and CCS technologies, including o�-road mobile machinery
Minimum standards for resource e�ciency
Low-emissions technology deployment
Build up Supply-chain and worker net-zero skills.
Box 6.3: Actions for UK business
Manufacturing and construction:
Source: CCC (2020), The role of business in delivering the UK’s net zero ambition.
Buildings:
Maximise energy e�ciency
Renewable electricity
Supply of heat focused on heat pumps and local heat networks
Use of passive cooling
Assess and disclose embodied carbon
Use of timber in buildings and products.
Surface transport:
Incentivise customer and employee mode shift
Passenger vehicles and van �eets to full electric
HGV use to biofuel or electric (in the short term) and hydrogen or electric (long-term)
Provision of electric charging at workplaces and retail
Improved freight logistics and driver training
Disclosure of product life-cycle emissions.
157
Cambridgeshire & Peterborough Independent Commission on Climate Business and Industry
Energy Savings Opportunity Scheme (ESOS): large businesses must carry out an energy assessment audit every 4 years, covering energy use in buildings, industrial processes and transport to identify cost-e�ective energy saving measures (though there is no regulatory requirement to implement the opportunities identi�ed);
Streamlined Energy and Carbon Reporting (SECR): implemented in April 2019, businesses in scope need to disclose their energy and carbon emissions. Making such disclosures is in line with the TCFD recommendations, providing important information to potential investors and customers. An estimated 11,900 companies incorporated in the UK are covered, far more than under previous reporting requirements.
Government policy
Government policy is set out, most recently, in the Industrial Decarbonisation Strategy, published in March 2021. The overall ambition is for industry emissions to be reduced by two-thirds by 2035 and at least 90% by 2050.
Existing policy includes:
There are a number of themes to the new strategy:
Support for the development of markets for low-carbon products:
Voluntary standards (accrediting products as lower carbon than the norm) will be considered for key inputs to industrial products. It is possible that mandatory standards (upper limits on emissions) could be introduced in some sectors;
Labelling systems for intermediary products, and possibly for consumer products showing embodied emissions, will be developed;
All contracting authorities will be required to have regard to priorities set out in a public procurement policy statement, to include tackling climate change.
-
-
-
Energy and resource e�ciency:
The installation of energy management systems will be supported. It is recognised that this can be challenging for some companies, particularly SMEs – companies with limited resources may be able to take a phased approach to implementation, and means of support for associated capital and operational costs will be considered;
Means of support (such as audit programmes, standards advice, higher funding) for energy e�ciency technologies at small, less energy-intensive sites will be reviewed;
A communications plan to make industry aware of available support for energy e�ciency will be developed;
Policy approaches in the Resource and Waste Strategy will be developed (see Chapter 10).
-
-
-
-
158
Cambridgeshire & Peterborough Independent Commission on Climate Business and Industry
Net Zero Innovation Portfolios: a £1bn fund has been announced to accelerate the com-mercialisation of low-carbon technologies, systems and business models. Priority areas include energy storage and �exibility, bioenergy, hydrogen, homes, advanced carbon capture, usage and greenhouse gas removal (GGR), and industrial fuel switching. A number of competitions for available funding have launched in 2021.
Policy in relation to commercial and public sector buildings is covered in Chapter 5.
Evidence base for emissions reduction requirement to 2050 and assessment of options
In assessing the scale of the challenge for CPCA in moving towards net zero, and the available options, we have considered evidence from a range of sources. This section summarises some of the key sources.
CCC Net Zero Technical Report / CCC CB6 recommendation
The CCC’s Net Zero Report and Net Zero Technical Report,11 published in May 2019, provide an assessment of options to take the UK to net zero emissions by 2050. The Sixth Carbon Budget Report and Methodology Report12 update this analysis, with a focus on the pathway for emissions through the 2020s and to the sixth carbon budget period (2033-37). This includes a pathway for manufacturing and construction emissions, falling 90% on 2018 levels by 2040.
Net Zero Cambridgeshire (CUSPE) report
The Net Zero Cambridgeshire (CUSPE) report13 considers the make-up of emissions in the CPCA region and provides projections to 2050 for a number of possible scenarios.
Almost half of I&C emissions are indirect emissions from the consumption of electricity generated from fossil fuels. Applying assumptions consistent with the CCC’s Further Ambition scenario, which informs the CCC net zero recommendation, these emissions are projected to fall by 90% on 2017 levels by 2050.
Reduction of direct emissions, mainly from use of gas, will require a switch to low-carbon heating. Small residual amounts of emissions will need CCS and a�orestation to reach net zero.
Place-Based Climate Action Network (PCAN)
We commissioned work on a net zero carbon roadmap for the region from the Place-Based Climate Action Network (PCAN).14 Results for public and commercial buildings are reported in Chapter 5. For industrial emissions this found that some emission reduction measures are cost-e�ective - they would more than pay for themselves through the energy cost reductions they would generate – but less than in other sectors (transport and buildings). Overall, these cost-e�ective measures could close the gap between projected industry emissions in 2050 and net zero by around 11%. A cost-neutral package could close another 10% of the gap.
This emphasises the role of policy and further technology innovation in supporting deployment, and consequent learning and supply-chain development, that will reduce the cost of measures that would currently not pay for themselves.
11 CCC (2019), Net Zero – Technical Report.
12 CCC (2020), The Sixth Carbon Budget – Methodology Report.
13 CUSPE (2019), Net Zero Cambridgeshire.
14 PCAN (2021), A Net-Zero Carbon Roadmap for Cambridgeshire and Peterborough, Sudmant, A., Duncan, A., Gouldson, A., ESRC Place Based Climate Action Network, University of Leeds.

159
Cambridgeshire & Peterborough Independent Commission on Climate Business and Industry
The Cambridgeshire and Peterborough Independent Economic Review (CPIER)
The CPIER report,15 published in 2018, was commissioned by the CPCA from the Cambridgeshire and Peterborough Independent Economic Commission. It examined the make-up of the economy within the CPCA area, identifying the success that has been achieved, but also the scale of spatial inequality that exists. Rather than one uni�ed economy, it identi�ed three quite di�erent ones: the Greater Cambridge area; Peterborough and surrounding area; and the agricultural areas and market towns broadly de�ned as the Fens. The report made recommendations for how productivity and economic growth can be enhanced, strengthening linkages across the areas, whilst enhancing the lives of people living and working in the area.
The Cambridgeshire and Peterborough Local Industrial Strategy (LIS)
The LIS16 identi�es 3 priorities for the area:
15 CPIER (2018), Cambridgeshire and Peterborough Independent Economic Review, Final Report, September 2018.
16 HMG (2019), Cambridgeshire and Peterborough Local Industrial Strategy, July 2019.
improving the long-term capacity for growth in the Greater Cambridge area by supporting the foundations of productivity (housing, transport, better connecting the Cambridge cluster), supporting innovation and attracting international companies;
increasing the sustainability and broadening the base of local growth, through identi�cation of opportunities and addressing bottlenecks.
building clusters and networks, identifying opportunities for high growth companies.
The Cambridgeshire and Peterborough Local Economic Recovery Strategy (LERS)
The LERS was published in March 2021 (see section above, and Box 6.2).
Stakeholder engagement
We also spoke with a range of expert stakeholders, from the �nance sector, industry associations and training providers.
160
Cambridgeshire & Peterborough Independent Commission on Climate Business and Industry
Key areas for action
Much of the policy development and support needed for the I&C sectors to move to net zero is for national Government. As has been indicated by the CCC, and others, much more is required. There is also, however, much for local authorities and the CPCA to lead and contribute. We focus on 3 main issues:
17 For example, Dechezlepretre, A., Martin, R., Mohnen, M., (2017), Knowledge spillovers from clean and dirty technologies, Grantham Research Institute on Climate Change and Environment, Working Paper No. 135.
Developing zero-carbon industries
Skills and training requirements
Business engagement and leadership
Developing zero-carbon industries
In our March report we made a recommendation to the CPCA that it should:
“commission work to understand the �tness of the innovation ecosystem across the region to support the emerging net-zero aligned agritech and nascent clean tech sectors”.
In subsequent work we have further explored the potential for “green industries” in the CPCA area, and the factors that, if present, can help to allow the development of successful clusters. Some of this learning draws from experience in the growth of the Cambridge cluster, some from wider experience. We have also (section below) given further consideration to needs for training and skills.
There is good evidence17 that, on top of private returns, knowledge spillovers for clean innovation are higher than for conventional technologies. These spillovers, as well as climate bene�ts, provide a strong justi�cation for government support. There is also evidence (mostly US based) that public sector support for clean start-ups and small businesses in the energy space can have substantial further bene�ts for innovation and the attraction of private support.18
It is also clear that R&D spend and innovation activity is very strong in the CPCA area. Cambridge has the highest number of patent applications relative to population of any city in the UK; Peterborough also ranks very high (13th). This is linked to the strength of the knowledge-based industries.
However, at least in terms of traditional “green” industries – meaning technologies like wind and ocean renewables, electric vehicles, and energy e�ciency in our buildings – clean innovation is not disproportionately located in the region (Box 6.4). Whilst the area is strong in terms of innova-tion and early-stage companies, there is not yet an obvious envirotech cluster. Our interviews, however, suggest that important ingredients to enable this are present.
18 See Doblinger, C, Surana, K and Diaz Anadon, L (2019), Government as partners: The role of alliances in US. cleantech startup innovation, Research Policy 48; and Howell, S.T, (2017), Financing Innovation: Evidence from R&D Grants, American Economic Review, Vol 107, No. 4, April 2017.

161
Cambridgeshire & Peterborough Independent Commission on Climate Business and Industry
This is, of course, a moving picture and it might be possible that such industries could be attracted to the area. There is evidence, from examining experience with the growth of successful clusters and the wider literature (Box 6.6) of the factors that are helpful in encouraging the development of innovation clusters. There is local experience, in the rapid growth of knowledge intensive businesses in and around Cambridge to draw on (the “Cambridge Phenomenon”, Box 6.7).
Box 6.5: Innovation for a strong and sustainable recovery
Martin et al (2020) use patent data to identify areas where the UK has comparative advantage in innovation, highlighting technologies relevant to 2 key challenges – net zero and the COVID-19 pandemic.
Research and innovation activity is highly concentrated in a “Golden Triangle” between Oxford, Cambridge and London. This includes a high share of “Covid-related” innovation, re�ecting strength in biomedical sciences.
But clean innovation in technologies such as renewable energy and zero-carbon vehicles, is found to be disproportionately higher in Yorkshire and the East and West Midlands. Indeed, some areas with a relatively low share of total innovation have high shares in such clean innovation. Support for innovation in these clean technologies could help the “levelling up” agenda.
The authors suggest, given high societal returns but behavioural barriers to adoption of new technologies, policy intervention is required to support the shift to clean technologies. But locally appropriate policy should also be informed by analysis of innovative strengths.
Source: Martin, R., Unsworth, S., Valero, A., Verhoeven, D. (2020), Innovation for a strong and sustainable recovery, CEP, LSE.
162
Cambridgeshire & Peterborough Independent Commission on Climate Business and Industry
entrepreneurial activities: entrepreneurs able to identify the potential of new knowledge and turn this into business opportunities;
knowledge development: through R&D investment, and patents;
knowledge di�usion: through networks, engaging others including businesses, the public sector and the markets;
the guidance of search: identi�cation of opportunities aided by Government targets and observation of market or societal preferences;
market formation: identi�cation of opportunities to enter the market, for example through niche markets, or taking advantage of new environmental standards or incentives;
resource mobilisation: use of R&D funds established by government or industry;
creation of legitimacy: development of new coalitions with a stake in the new technology, willing and able to be advocates.
Box 6.5: Key requirements for innovation systems
The central idea behind the systems approach to thinking about innovation is that innovation and the di�usion of technology is not just a function of the individual �rm, but also of existing institutions and structures. Current prevailing technologies have gone through processes of improvement (in cost and performance), customer acceptance and understanding, and the development of markets and regulatory regimes in ways designed for them to work. They can therefore be hard to displace.
Key requirements of innovation systems that help drive innovation and technology di�usion are:
Source: M.P. Hekkert, R.A.A. Suurs, S.O. Negro, S. Kuhlmann, R.E.H.M. Smits (2007), Functions of Innovation Systems: a new approach for analysing technological change, Technological Forecasting and Social Change, 74.
Presence of these requirements can interact and strengthen the components and system as a whole.
163
Cambridgeshire & Peterborough Independent Commission on Climate Business and Industry
scienti�c breakthroughs establishing Cambridge as a leader in IT and computing;
the founding of several technology consultancies;
changes in University of Cambridge and local authority attitudes towards industrial development, paving the way for more academic collaboration with the private sector;
developments at the University of Cambridge providing support for start-ups spun out of academic research;
growing availability of capital from investors in start-up and scale-up, mainly in technology and the internet;
a growing culture of collaboration and network organisations, bringing business and academics together
Box 6.6: The Cambridge Phenomenon
The “Cambridge Phenomenon” is the name given to the rapid growth of knowledge intensive (KI) businesses in and around Cambridge since 1960. There are now more than 30 science parks in the area, including Europe’s largest healthcare and medical research centre (The Cambridge Biomedical Campus).
The growth did not arise from an ordered and planned process. Rather, a number of factors came together to foster the success:
Source: Caselli, G, Cosh, A, Tyler, P (2021), The Cambridge Phenomenon: an innovation system built on public private partnership, Innovation and Impact, 2021.
In 1985 there were around 300 high-tech businesses in Cambridge; in 2019-20 more than 5000.The components of success become mutually reinforcing, spurring innovation and growth. This does not mean that they can be simply replicated in other �elds. Nor does it mean that they are immutable for the KI sector once in place. Others, such as the CPIER report, have identi�ed potential constraints on further growth, particularly around housing and transport links.
Our own discussions with local experts provide a consensus view that successful industrial clusters develop from a strong research base, with spill-outs and growth of companies from that research, developing into industrial companies and national/international companies attracted to acquire interests in the area.
It is not so simple as the linear process suggested by that outline, with much research oninnovation ecosystems pointing to the non-linear nature of innovation. But keys to success include the cooperation and competition enabled by networks, knowledge-sharing and emerging market opportunities. This drives technical advance; cost reductions that �ow from targeted research, knowledge from other areas and deployment; the in�ow of specialist sta�; and the development and build-up of training and other support services.
Many of these requirements are present in the CPCA region: one of the world’s top universities, with research laboratories and technical consultancies; angel and venture capital investors; networking and mentoring organisations. So it is possible, with policy and support directed at the demands of the net zero transition, that there could be some success in developing net zero aligned businesses and industries.

164
Cambridgeshire & Peterborough Independent Commission on Climate Business and Industry
However, evidence suggests that development of successful clusters tend to be supply-driven. It would be di�cult to pick a speci�c low carbon industrial growth opportunity and determine that this should be an area to pursue:
the low carbon sector is made up of a wide variety of di�erent industries (di�erent renewables; new build, energy e�ciency retro�t; heat pumps; electric vehicles; etc);
time scales from innovation to market can be long (particularly in energy supply, less so in digital enablers or small-scale “plug-in” devices);
there is considerable market power in the energy and food sectors, concentrated in large supply businesses and supermarkets. Innovative small businesses may �nd it di�cult to �nd a market or to obtain contracts as service providers to incumbents (new technologies for existing services are usually higher cost, even though they can become competitive over time).
But there are considerable low carbon interactions with agriculture, Iife sciences, IT and digital, and construction, amongst other sectors. Building on local industrial strengths, it may be more useful to think beyond “low carbon” industry to consider technologies in industries that would not immediately be characterised as “low carbon”, but which could signi�cantly contribute to the net zero transition. Such an approach would build on University of Cambridge recommendations on industrial specialization to the Government in a 2016 report (Box 6.7) and emphasise the building of links between sectors already with strengths in the CPCA area (Box 6.8) – agritech, the knowledge intensive sectors, and construction.
165
Cambridgeshire & Peterborough Independent Commission on Climate Business and Industry
Characterisation of the activities, actors and institutions which contribute, in the region, to value creation;
Consideration of the dynamics of modern industry and technology which link innovation and activity across sectors (rather than being limited by consideration within traditional boundaries set by industrial classi�cations);
Consideration of what is distinctive and competitive about existing regional capabilities, identifying practical priorities for specialisation (possibly limited in number) that emerge from this.
Box 6.7: Developing regional specialisation
A University of Cambridge report for the Government in 2016, with an agritech case study, suggests a policy approach to regional specialisation which focuses on:
This approach does not easily lead to the identi�cation of speci�c “winners”, but possibly to the promotion of enabling technologies that can transfer and add value between related sectors.
Source: Policy Links (2016), Making “smart specialisation” smarter, an industrial innovation system approach: the case of agritech east, report for BIS, Policy Links, CSTI, University of Cambridge.
Digitalisation of the net zero transition means the collection of quality data on emissions and energy use, using that data to create innovative solutions and bring down emissions
Digital technologies can help promote a low-carbon shift, enabling people to adopt “greener” lifestyles, from how they travel to how they heat their homes
It has been estimated that digital technologies already in the �eld could help reduce UK emissions by up to 15%
Box 6.8: Building on local strengths
Digital and IT
- Use of the internet and video-conferencing allowing more working from home
- Real time transport information so drivers can choose less congested routes
- Robotics and precision farming improving agricultural yields
- Improved local weather forecasting improving the protection of crops
- Digital twinning allowing real-time factory simulation to help optimise operations
- Use of virtual and augmented-reality to allow architects to digitally experience a space and improve plans before construction
- Smart systems allowing homes with smart meters, batteries, PV and EVs to be integrated into a �exible, decentralised grid
- Support to “mobility as a service”
- Improved logistics through consolidation of demand and route planning
- Heating and cooling in buildings responding to data to control and improve energy use
166
Cambridgeshire & Peterborough Independent Commission on Climate Business and Industry
A joint venture between the Combined Authority and Peterborough-based business Photocentric (which specialises in innovative 3D printing) will deliver a Manufacturing and Materials R&D Centre on the ARU Peterborough campus. The building will house established and start-up companies, hosting development work helping to create new manufacturing techniques for the low-carbon economy;
Research at the Institute for Manufacturing (IfM) at the University of Cambridge aims to help companies develop new products and services, including new materials, digital manufacturing technologies and data analytics.
Modelling by the Faraday Institute suggests potential in the UK for 7 gigafactories with over 24,000 jobs in battery manufacturing (and more in the supply-chain). It suggests that production operators and equipment technicians requiring level 2-3 quali�cations in courses such as Advanced Manufacturing Engineering, could account for three-quarters of the workforce. The R&D facility at ARU Peterborough will include battery developments;
The new Whittle Laboratory in Cambridge aims to radically reduce aerospace technology development times, moving towards a zero-carbon future for aviation (with potential impacts well beyond aviation).
Box 6.8: Building on local strengths continued...
Advanced manufacturing and materials
Life sciences
Some of the biggest pharmaceutical companies, with locations in the region, have pledged to become net-zero. Moving operations to be carbon-neutral will mean things like: using renewable energy; switching to zero emission vehicles; working with suppliers to reduce their environmental impacts; using sustainable materials in packaging; reducing waste and water use.
There is potential for industry leaders to share experience and lessons with other businesses within and outside the sector
Drawing on the digital industry, digital twins could be used to help design new buildings, and in health treatment hypotheses and the design, testing and development of therapeutic products
The NHS in England has set targets for the emissions that it controls directly to reach net zero by 2040, with an 80% reduction by 2028 to 2032. The “Delivering a Net Zero NHS” report outlines trajectories to net zero and the interventions required. It would be excellent to see the Cambridge University Hospitals NHS Foundation Trust a leader in implementation.
Agritech
Agritech is very much focused on meeting the needs of net zero;
Research and activity at the Innovation Hub, based near Soham, managed by NIAB and facilitated by funding from the Eastern Agritech Growth Initiative, include: waste reduction and reduction of �eld losses; waste management: packing, processing and alternative uses; increasing value for new products from waste streams; identifying opportunities to recycle waste or generate energy or co-products.
There are a number of associated businesses at the Innovation Hub, including Aponic, developing vertical farming using 90% less water than traditional farming, and Entomics/Better Origin, using insects to turn food waste into animal feed and fertilizer.

167
Cambridgeshire & Peterborough Independent Commission on Climate Business and Industry
But it is possible to envisage much stronger linkages between the generation of ideas and innovation of the Greater Cambridge areas, the manufacturing capability of the Peterborough area, and the application within the Fens.
The Policy Links report for BIS, in 2016, suggested market opportunities could arise in relation to high quality combinable crops for speci�c food and industrial uses; forti�cation of fresh produce for improved nutrition; crop modelling and remote sensing; process automation; and water management.
There could be potential to support a demonstration farm and further innovation hub, possibly in the north of the area, considering technologies beyond those at Soham (e.g. carbon sinks through sustainable agriculture practices, solar).
Box 6.8: Building on local strengths continued...
Agritech continued...
Sources: Royal Society (2020), Digital Technology and the planet; innovationhubuk.co.uk; Enterprise East Cambridgeshire; NHS (2020), Delivering a Net Zero NHS.
This places increased emphasis on knowledge exchange – the translation of research and knowledge generation into production. One of our interviewees referred to the requirement as one of developing a “neural network” of related companies, rather than a cluster. This becomes self-reinforcing, and would help address the scale-up challenge whereby the area demonstrates some low-carbon innovation but limited commercialisation.
Links with the �nance sector should be further developed within this network. A particular weakness in relation to agriculture has been identi�ed.19 Institutional investors tend to lack technical knowledge of nature-based solutions; banks generally have low expertise to support the provision of �nance for sustainable agriculture practices.
In practical terms, CPCA should:
support the development of net zero links between sectors, to increase awareness of requirements and potential for cross-fertilisation. Innovations in knowledge intensive industry may have potential applications outside the immediate source of innovation. The CPCA has an important convening role - without bringing sectors and companies together these may go unrecognised;
review the measures within the Local Economic Recovery Strategy (LERS) to ensure consistency with net zero;
support demonstrations of new low carbon technologies, particularly in relation to applications from the knowledge intensive and agritech sectors, and in relation to construction;
consider setting of targets to address speci�c net zero issues or technologies. Competitions to address speci�c issues of particular concern, or bene�ts, to the area could incentivise application of the innovation and research base.
19 Transforming UK Agriculture - The Pollination Group, April 2021.

168
Cambridgeshire & Peterborough Independent Commission on Climate Business and Industry
Skills and training requirements
The CPCA is beginning to shape its funding of adult skills with a view to the needs and opportunities of a net zero transition. On top of baseline Adult Education Budget (AEB) funding of £9.94m in 2021-22, £1m has been allocated for Growth Cases aimed at:
high value and priority quali�cations at level 3 in “Growth Sectors”: advanced manufacturing; agritech; life sciences; and digital and arti�cial intelligence;
skills development at levels 2 and 3 to support the green economy transition in construction (including retro�t, heating, solar and heat pump installation); energy assessors and co-ordinators; and electric vehicle maintenance.
In thinking about training and skills requirements for net zero, it would be easy to focus on jobs within the Environmental Goods and Services sector. It is clear that there will be a need for increased numbers of trained workers in areas including: home heating and energy e�ciency retro�t; electric vehicles – installation of charging points and vehicle maintenance; renewable energy.
However, there is a much wider requirement. As identi�ed locally by the ARU (Box 6.9), all jobs need to shift to be “green”. In terms of skills requirements, this means an even greater emphasis on STEM skills (related to systems thinking, mitigation and adaptation), digital skills (important for EVs, logistics, heating controls, the smart grid), project management and entrepreneurial skills (driving the required transition).
Box 6.9: Skills for net zero outside the “Environmental Goods and Services” Sector
Research by the ARU, covering Cambridgeshire and Peterborough, identi�es that skills to support a net zero transition will be required across a wide range of businesses. A focus only on sectors directly engaged in the provision of environmental goods and services (EGS) will under-state the shift in requirement.
The study was based on interviews with businesses outside the EGS sector. The results suggested variation in skills requirements, but a widespread belief that all sectors will need to become greener, requiring skills for a green economy. That might, for example, mean moving towards environmentally friendly packaging, lower emission processes, and choosing low carbon inputs.
The �ndings support a need for education and training providers to “green” all curricula, not simply add new courses for speci�c green jobs.
Source: ARU (2021), Green skills – understanding the skills that will be required by local organisations to help support a low carbon post-COVID19 transition to a cleaner, fairer economy and society in Cambridgeshire and Peterborough, ARU, Global Sustainability Institute.
169
Cambridgeshire & Peterborough Independent Commission on Climate Business and Industry
There is an opportunity in a planned refresh of the Skills Strategy for the area, due later this year, to consider and prioritise the needs of the net zero transition. There are important building blocks already:
the network of local colleges has the potential to be a driver of recovery in meeting the needs of net zero;
in relation to green energy, the Gas Centre at Cambridge Regional College is transitioning to a Green Energy Centre. A new CPCA-funded hub for construction skills is being developed at Huntingdon;
there are opportunities linked to the development of a new university at ARU-Peterborough (Box 6.10). The curriculum will have a focus on local needs and on requirements including environmental sustainability;
the CPCA has stated an intention to look at further education assets as a “system” to serve business and communities, rather than competing providers;
devolved budget responsibility to the Combined Authority for training and further education gives additional �exibility to drive the transition.
a manufacturing and materials R&D centre, fostering collaboration and innovation in a range of materials technologies, including 3D printing, sustainable plastics, and new ways to manufacture batteries;
a Living Lab, supporting students studying in STEM �elds and engaging people on science and technology. Exhibitions and facilities will explore green technologies, such as vertical farming, renewable energy and green vehicles.
Box 6.10: ARU-Peterborough
The new university, ARU-Peterborough, will be employment-focused, with a curriculum designed for local employment needs. The university is working closely with partners and employers to secure placements for students and link quali�cations to jobs, making it more likely that graduates stay in the region.
There is the opportunity for the needs of the net zero economy to be central to these plans.
Current plans, for the phase of the project starting in September 2022, include courses in agri-food technology, environmental management and degree apprenticeships in life sciences, environment, food and agriculture.
Future plans will include:
building design to maximise use of sustainable materials and renewable energy, and connectivity via cycle paths;
“private wire” connections from the Council’s Energy Recovery Facility in Fengate to build a low-carbon energy infrastructure to sites across Peterborough, including the University.
The project is focused on regeneration of a current dilapidated mixed brown�eld site, and economic growth addressing persistent local skills de�cits which are a key contributor to observed deprivation. Aside from a curriculum linking to net zero, and showcasing of green technologies, design of the development includes net zero elements:

170
Cambridgeshire & Peterborough Independent Commission on Climate Business and Industry
We recommend that net zero should be a cross-cutting theme for the development of the Skills Strategy. To do this e�ectively requires recognition of the range of training and education needs of net zero:
the CPCA should commission a quanti�ed assessment of training needs for net zero. This should consider the implications of the transition for numbers of measures to be deployed (such as building energy-e�ciency retro�ts, installation of heat pumps, numbers of electric vehicles). Working from these projections, it should be possible to derive estimates of required numbers of installers, or service engineers, and from this, implications for numbers going into training or re-training. Such estimates have been made nationally – local projections would add necessary detail;
training providers need con�dence in the direction of policy before they put substantial resources into the development of new training courses, and recruitment or training of trainers:
national policy commitments need to be clear. As indicated by the results of the Energy Barometer 2021,20 the “push” of a skills strategy will only work alongside the “pull” of stable energy policy. Currently there are many details, around heat decarbonisation and energy e�ciency for example, that remain to be speci�ed;
the Department for Education is moving towards plan-led funding for grant providers. An element of pump-priming is required and greater certainty of funding for periods beyond 1 year will help investment in growth of capacity in net zero training. The CPCA intends to work towards a Three-Year Plan-Led Funding Model for climate-related skills from around 2022/23. It would be helpful to move towards extended funding commitments as soon as possible, and give consideration to periods greater than 3 years.
levels of awareness with employers of the requirements of net zero need to be raised, allowing for feedback on skills and training demands (see next section);
-
-
encourage the building of net zero into all parts of the education system, starting with schools which should teach a broad awareness of the transition and enhance careers guidance through in-house and third-party school careers advisory services.
20 EI (2021), Energy Barometer 2021, Energy Institute.
21 As of June 2021, 223 UK companies have signed up to the science based targets initiative (SBTi) – www.sciencebasedtargets.org . As of March 2021, one third of UKs largest companies had made pledges under the UNFCCC Race to Zero Campaign.
Business engagement and leadership
Many UK companies have committed to science-based targets21 or net zero emissions by 2050 or sooner, consistent with the ambitions of the Paris Agreement. This includes a number of companies with headquarters or signi�cant presence in the CPCA area (e.g. Johnson Matthey, Marshalls, Cambridge Healthcare Research, Glaxosmithkline, Arm Holdings, AstraZeneca, Hilton Food Group, and companies with o�ces in the region such as PWC, KPMG, Deloitte, EY).
Larger businesses tend to be best placed in this regard. But most businesses in the area are small. SMEs make up around 99% of all companies. They will have an essential role in achieving the net zero transition, with particular importance in sectors including construction and transport:
-

171
Cambridgeshire & Peterborough Independent Commission on Climate Business and Industry
nationally, nearly one-�fth of SMEs are in the construction sector, often as suppliers or sub-contractors to large �rms. They will be essential to the transformation of our homes and buildings in relation to energy e�ciency, heating and resilience;
within the transport sector, SMEs are frequently suppliers to bigger contractors, and will have essential roles in relation to expansion of the electric charging infrastructure, and the greening of our buses and taxis.
22 BCC (2021), Net Zero Survey, British Chambers of Commerce, August 2021.23 Make UK (2021), Demystifying net zero.
Compared with larger businesses, however, awareness of net zero and the implications for operations and investment is generally low. A recent British Chambers of Commerce (BCC) survey22 �nds that whilst half respondents acknowledged customer concerns about the environment, actions were lagging:
the vast majority of small businesses have not yet put in place targets to reduce their emis-sions;
only 11% measure their carbon footprint.
Immediate day to day concerns for keeping the business running, particularly in current circumstances of Covid-19, generally take precedence.
It is essential therefore to consider mechanisms to reach and support SMEs. Some of this is for national policy and lending policies of �nancial institutions. But local initiatives can play a substantial role.
One means of fostering business support has been through the launch of business charters, asking companies to sign up to commitments to reduce emissions, and establishing networks to share knowledge and expertise.
the launch by Cambridge Carbon Footprint, supported by Cambridge City Council, of the Cambridge Climate Change Charter, aimed at individuals and companies. Businesses that sign up are asked to commit to actions in respect of measuring and reporting emissions; decarbonisation of operations; and leadership (through things like supporting events or sharing experience). They can also access guidance and information on actions they can take to save energy and reduce emissions;
Peterborough’s Climate Commitment: an initiative currently being developed by Peterborough Climate Change Partnership. This will invite local businesses to sign up to the ambition to achieve a net-zero city by 2030. It is likely to focus on the need for businesses to understand their environmental impact, monitor their processes to ensure they are reducing those impacts, and take actions to reduce emissions, improve the natural environment and reduce consumption of resources.
There are local initiatives:
There are also many business networks in the area.
Nevertheless, from our discussions with local business leaders, it seems that there is a lack of knowledge about where to go for advice related to the net zero transition. Make UK has come to similar conclusions,23 suggesting that central Government needs to look beyond the large sources of industrial emissions, to engage with the large number of small and medium companies (Box 6.11).

172
Cambridgeshire & Peterborough Independent Commission on Climate Business and Industry
Low-cost process e�ciency improvements, like LED lighting with motor sensors;
Simple behaviour changes, such as idling machines being switched o�;
Savings from immediate measures placed in a “green fund”, for reinvestment in higher cost measures.
Box 6.11: Make UK report: Demystifying net zero
Make UK has found a major shift in attitudes of its members over the last year or so, with many intending to set net zero targets. It is working on a roadmap to help manufacturing plan for net zero, but has identi�ed a number of measures to build on, such as:
The Make UK report recommends that the Government work with manufacturers, not just in high-emitting clusters. Without this, a risk of SME disengagement is identi�ed, particularly with SMEs uncertain which funding pots are availa-ble to them. Possible measures suggested to address this include reduction in minimum grant sizes under the Industrial Energy Transformation Fund; and streamlined national funding for smaller projects
Source: Make UK (2021), Demystifying Net Zero.
There are signs that the Government is beginning to recognise the requirement. As part of the global “Race to Zero” campaign and in advance of COP 26, a new digital platform on the climate hub for business, backed by the Government, was recently launched.24 This is aimed at SMEs and asks them to sign up to an emissions reduction commitment. It provides example of actions to reduce emissions – with a degree of speci�city depending on the sector of the business (general, manufacturing, agriculture, retail, or technology) – and promises further tools to help understand emissions and measures. Usefully, there is an emphasis on the business case for actions – for example, in reduced costs through greater energy e�ciency.
Business organisations, too, are responding to the perceived need. The CBI has recently set out a guide on practical steps for business to start on the road to net zero. The BCC has launched an online hub, with O2, for �rms to �nd out how to measure their carbon footprint, set targets and develop an overall strategy for net zero.
These are excellent resources, but we are concerned that they remain insu�ciently known.
There are also local resources aimed at engaging with SMEs to support them understand what net zero means, the potential actions and where to start (Box 6.12).
24 https://businessclimatehub.org/uk/
173
Cambridgeshire & Peterborough Independent Commission on Climate Business and Industry
The requirement for public companies and large pension schemes to disclose under TCFD, as well as current initiatives in the run-up to COP16, have created increased focus in business on net zero commitments and transition planning. There is now an opportunity to build on this and the existing local actions.
This suggests a role for the CPCA and local authorities in taking a leadership role in communicating with local business and encouraging action:
to engage the corporate and �nancial sectors at the highest level (including chairs, non-executive directors and senior executives), together with government, academics and others;
to encourage scholarship in legal, regulatory, �nancial and other levers that will enable the scaling-up of action across the corporate sector.
Box 6.12: Local resources for SME engagement
There are a number of existing sources of help and advice to SMEs, providing an expert base on which to build. These include:
The Cambridge Institute for Sustainability Leadership (CISL)
The CISL o�ers Accelerator programmes to businesses, usually over 6 weeks, with priority given to businesses based in the Greater Cambridgeshire and Peterborough area.
Each Accelerator programme is designed around 1 or more of 10 sustainability themes: net zero; water and sanitation; land use; food and agritech; the built environment; circular business models; mobility, logistics and air quality; innovative materials and supply-chains; biodiversity and nature; health, wellbeing and biotechnology; sustainable �ntech and edtech.
For example, the Accelerator to net zero programme mixes online learning and mentoring. It aims to support established SMEs with high potential for enabling the net zero transition, particularly with novel technology-based products. Help is aimed at means of accelerating growth and making products and operations more sustainable. Priority areas include renewable energy, distribution and storage, and demand-reduction. But there are similar programmes for manufacturing, innovators in the built environment and sustainable fashion.
Hughes Hall Centre for Climate Engagement
The Hughes Hall Centre for Climate Engagement was established to increase awareness of climate change mitigation and adaptation on the boards of private companies, and the need for urgent action:
The Centre provides general guidance and toolkits of assistance to boards and non-executive directors.
Cambridge Cleantech
Cambridge Cleantech aims to connect innovators, corporates, academics, SMEs and investors for a smarter, more sustainable future. It is a membership organisation aiming, for example, to summarise available sources of grant funding, run pitching and investment days helping to bring innovators and potential funders together, and provide other opportunities to connect small business and larger corporates.
It currently has over 300 members, ranging from academia, large industry to high-growth start-ups.
174
Cambridgeshire & Peterborough Independent Commission on Climate Business and Industry
Launch an area-wide Low Carbon Business Charter, building on existing schemes and linking to sources of advice on actions towards net zero;
Expand net zero awareness raising and advice services for business: including promotion of the existing national initiatives to help SMEs understand the measures they can take (and potential sources of support) and their own opportunities in the transition;
Promotion of local workshops provided through initiatives such as through the Cambridge Institute for Sustainable Leadership (CISL);
Encouragement of existing local networks to spread knowledge and actions for net zero, and to promote the sharing of experience of larger companies with smaller businesses and with supply chains:
Engage with existing networks such as Cambridge Cleantech, Cambridge Ahead and Opportunity Peterborough to raise the need to prepare for the impacts of climate change, and to promote low-cost immediate actions;
Engage with larger local businesses to act as champions;
Begin a conversation with larger businesses on how they can tackle their Scope 3 emissions, including through engaging with their suppliers (which should help SMEs reduce their own emissions)
-
-
-
Develop the use by local government of powers in relation, for example, to procurement and building standards, and the opportunities for local businesses that these provide.
What does it mean if we take these actions?
There will be an up-front cost to measures in industry and business to put us on track to net zero. The work by the Place-Based Climate Action Network (PCAN) for this report �nds that some emission reduction measures are cost-e�ective - they would more than pay for themselves through the energy cost reductions they would generate – but these are not enough to put us on the required path.
However, it is also clear, from the work of the CCC and others, that a green recovery out of COVID-19 has potential to boost economic growth (on top of the other environmental bene�ts it would bring).
Building on the industrial strengths of the CPCA area, in innovation and knowledge intensive sectors, there is also potential for local leadership to provide a boost to longer-term economic growth, and to the provision of good quality, high skilled employment.
It is clear from our engagement with local people that there is an expectation that businesses in the area should be doing more to prioritise net zero, and that they should be engaging further with their employees and the public. More businesses are recognising that this makes good business sense. But there are also actions that could be taken, on �exible working and employee travel plans for example, that will have wider bene�ts for the environment and the way we live our lives.
Developing net zero business links across the three economies within the CPCA area, as well as skills and training for net zero, can help to rebalance the economy, reduce regional inequalities and contribute to a just transition.
175

176
Cambridgeshire & Peterborough Independent Commission on Climate Adaptation
through the establishment of a multi-million pound ‘Doubling Nature Fund’ that can operate a portfolio of funding models to �nance habitat creation and nature recovery across public, private and third sector investment
through the development of a high-level spatial and landscape framework that ensures we create su�cient space for environmental recovery and integrated water management across the CPCA area, planning for future environmental gains that allow for large-scale natural capital solutions to help with the adaptation agenda
the introduction of transition measures for landowners and farmers to avoid delays ahead of the roll out of Environmental Land Management Schemes
to consider the case for adopting biodiversity net gain targets that are higher than the proposed mandatory minimum, recognising that the area is one of the most nature depleted in the country and therefore needs to kick-start its recovery faster than other areas
creating and fostering community-led nature recovery programmes in both rural and urban areas, that help communities adapt to climate change and particularly the local impact of severe weather events
Recommendations
1.
2.
3.
4.
5.
6.
Adaptation
The CPCA should work with partners to signi�cantly accelerate the delivery of the doubling nature ambition, recognising the contributions that large-scale nature recovery can make to climate change adaptation, including
Encourage place-based approaches to climate change adaptation such as the joint Anglian Water, Environment Agency and Water Resources East ‘Future Fens’ initiative
Call on government to support new land management/farming techniques
Call on government to reform the Water Industry National Environment Programme, and broadening the Peatland and Woodland Codes to bring in sequestration opportunities within wetlands, inter-tidal habitat and mineral soils
Local Resilience Forum to undertake a regular review of risks of interconnected / cascade failures as a result of climate incidents and develop mitigation plan as a response. To review climate risks to public buildings and public spaces.
Consider demonstration projects for public and commercial premises, linked where possible to nature-based solutions e.g. building shading and adjacent surfaces, green roofs/walls, porous surface drainage and local green space. Prioritise at-risk locations when considering building retro�t programmes.

177
Cambridgeshire & Peterborough Independent Commission on Climate Adaptation
Building awareness of need for property-level resilience measures.
Local public engagement campaign(s) that link climate impacts to nature, river health and need for water conservation and carbon sequestration
Promote the actions that can be taken individually to help people and communities prepare
Clarifying responsibilities of di�erent parties / property owners
Explore the potential for grant-based scheme to increase action.
CPCA and partners to address the lack of public awareness and preparedness of extreme heat and water events including:
7.
178
Cambridgeshire & Peterborough Independent Commission on Climate Adaptation
Adaptation, nature and water – a just transition
In our engagements with the Fens panel and with civil society groups from acrossCambridgeshire and Peterborough (Chapter 3) we asked people what might prevent climate actions being implemented, and implemented in a fair way. We summarise here some of the key issues raised in relation to adaptation, nature and water, and the participants’ suggestions for how they might be tackled.
Barriers and challenges identi�ed
Across all the engagements, there was concern about a lack of awareness about the need to adapt to the changing climate. Most of the attention was felt to be on reducing emissions rather than the equally important task of adapting to more extreme weather events the area will face. Participants raised the challenge of how adaptation would be �nanced and the impact on those on low incomes. Across all consultations, there was concern about a lack of awareness, responsibility and �nancing for �ood protection, and the fact that this is likely to impact most those on low incomes.
Participants felt that there was a lack of accessible green space for nature and people, and that we do not value natural spaces enough. Drawing on the lockdown experience many participants re�ected on the importance of these spaces for mental health and general wellbeing. They were concerned that deprived communities often lacked access to nature the most. They saw barriers in the price of land and current approaches to land use. Participants, particularly in Cambridge City and Peterborough, also felt there was not enough space or opportunity for people to access nature and learn things like how to grow food.
“Rewilding! We should create natural habitats and communicate about the importance of this” – (Huntingdonshire participant)
This also contributes to people feeling disconnected from the rural economy of the region, and the Fens panel were concerned about the disconnect between the importance of agriculture and village life. Participants often discussed how important the relationship is between food production in the Fens and water security. The Fens panel also discussed how important it was to them that the natural landscape of the fens, and the wildlife within it, was protected. They were concerned about species becoming extinct within the fens and the loss of habitats. Participants from Huntingdon re�ected that we need to recognise more the mutual dependence of water and food security.
Participants were concerned about the licensing of water extraction as means to supply water because of the environment impacts, especially as demand would rise through planned development. Cambridge City participants re�ected that we should try to avoid taking water from other areas and impacting their water security. Many people felt that water regulations are not being adequately enforced. Other attendees, for example in East Cambs, felt that we should communicate better about the level of water stress on the region, how the current level of water use is unsustainable but not talked about enough. Meanwhile, there is not enough investment in rain-water harvesting infrastructure, a concern for the Huntingdon participants.
“People don’t know how bad the water situation is” – (East Cambridgeshire participant)
179
Cambridgeshire & Peterborough Independent Commission on Climate Adaptation
Attendees at the East Cambs, Huntingdon and Cambridge City events talked about the ‘rights of rivers’ and the need to look more at the degradation of precious chalk streams and rivers.
Ideas suggested by participants
Encourage farmers and landowners to participate in community access schemes where local people can engage with the land and the process of food generation
Allow communities green space to plant edible trees, community orchards and fruit trees or biodiverse plants e.g. guerrilla gardening
Implement the doubling nature ambition, with council owned land leading the waySupport community farming initiatives and growing space for local residents
Water collection / storage in new build, LA buildings and businesses in particular, water security assessment for new builds and developers
Infrastructure to support water e�ciency, water storage and water recycling for old homes as well as new, especially when changes or building work already occurring
Investment in water management in the Fens and engage all relevant actors in the regionEncourage the installation of smart water meters
Education for people and businesses about the issue of water security and how they can help
Council buildings to lead the way and improve water collection and storage in their facilities
Engagement of communities at risk of �ooding and appropriate defences, clear designation of responsibility for planning for �ood risk, investment in drainage systems
Working with water companies to improve sustainability of water extractionPlan for the Fens water security
Even with future reductions in emissions, the climate will be a�ected by greenhouse gases already in the atmosphere. Making sure the area is ready for and resilient to those changes is equally as important a task as mitigating emissions.
Nationally, key risks have been identi�ed but there is slow national progress on the delivery of speci�c measures to adapt to these
Cambridgeshire and Peterborough will need to consider, adapt and deliver mitigation to all of these risks (and maximise positive opportunities), but locally the area needs to pay special attention to water supply (drought) and �ooding issues and the impact of extreme heat events
Nature-based solutions and integrated water management must play a major role in this adaptation, and can deliver many co-bene�ts
Summary
180
Cambridgeshire & Peterborough Independent Commission on Climate Adaptation
Valuing our natural ecosystems, supporting nature recovery and understanding the interrelationships will support their role in successful adaptation to a changing climate
There needs to be a constant process of reviewing and improving our resilience to likely events
There is signi�cant appetite amongst local communities and residents to take action to combat climate change through community led nature recovery programmes – we must harness this enthusiasm and foster local action.
Adaptation, nature and water in the Combined Authority Area
Why link adaptation, nature and water?
Adapting to a changing climate means being prepared for the consequences of global warming, and the predicted impacts. This can be the widely reported risks, such as �ooding, sea level rise, drought, extreme heat events and wild�res. It can also be other aspects such as changes to wildlife habitats, new pests and diseases, global social and economic pressures, or opportunities such as tourism or agriculture. In the Cambridgeshire and Peterborough context, the Commission has found that so many of the issues are connected through the use of land and water (our high-quality farmland, river catchments, water supply, public green space, where growth goes) that the Commission felt there was a bene�t to considering them together in this Chapter. The area has great opportunities to deliver nature-led solutions (both for mitigation and adaptation) with many co-bene�ts compared to alternative engineered solutions.
There is a crisis facing habitats, plants and species with a signi�cant reduction in UK biodiversity over a long period. So, whilst the Commission’s remit and focus is on climate change mitigation and adaptation, we have nevertheless drawn up our recommendations aware of that context and the natural environment recovery aspirations of the Government’s 25 Year Environment Plan. In our initial report we set out our recommendation on the achievement of the Doubling Nature ambition (Chapter 2). Improvements to natural ecosystems go hand in hand with adapting to climate change.
What has the Climate Change Committee recommended?
The national Climate Change Committee (CCC) has a sub-committee dedicated to considering and reporting on adaptation issues. It assesses risks and opportunities from climate change, including to business, infrastructure, housing, the natural environment, our health and risks from the impacts of climate change internationally. It provides a biennial assessment of progress in adapting to climate change to Parliament. The latest report was in 2021, where it stated that: “the government has made historic climate promises in the past year, for which it deserves credit. However, it has been too slow to follow these with delivery. This de�ning year for the UK’s climate credentials has been marred by uncertainty and delay to a host of new climate strategies. Those that have emerged have too often missed the mark. With every month of inaction, it is harder for the UK to get on track”.
The Committee’s latest UK Climate Risk Assessment assessed 61 speci�c risks and opportunities and each one given an urgency score. Of the 61, more action is needed in England to address 34

181
Cambridgeshire & Peterborough Independent Commission on Climate Adaptation
Bring forward proposed plans to address overheating risk in homes through Building Regulations.
Make the Government’s next round of Adaptation Reporting mandatory for all infrastructure sectors.
Build a strong emergency resilience capability for the UK against climate shocks, learning from the COVID-19 response.
Implement a public engagement programme on climate change adaptation.
of them. Yet the Committee found only �ve of 34 sectors assessed have shown notable progress in the past two years, and no sector is yet scoring highly in lowering its level of risk. It provides 50 recommendations, including:
Figure 7.1 The Adaptation Committee’s scoring of adaptation priorities (2021)

182
Cambridgeshire & Peterborough Independent Commission on Climate Adaptation
Government policy
Government policy is set out across its di�erent Departments. Resilience is a statutory duty placed upon public agencies, with the requirement to regular review risks.
Policy in relation to buildings is covered in Chapter 5.
Evidence base for adaptation issues to 2050 and assessment of options
In assessing the scale of the challenge for CPCA in adaptation, nature and water, we have considered evidence from a range of sources. This section summarises some of the key sources.
CCC Independent Assessment of UK Climate Risk
The CCC’s Independent Assessment of UK Climate Risk Report, published in June 2021, sets out the priority climate change risks and opportunities for the UK. The report draws on an extensive programme of analysis, consultation and consideration by the Committee involving over 450 people, 130 organisations and more than 1,500 pages of evidence and analysis. A dedicated website www.ukclimaterisk.org hosts all of the outputs from the UK Climate Risk Independent Assessment (CCRA3).
Preliminary report on climate risk in the Cambridgeshire & Peterborough region, 2020-2099
The Preliminary report on climate risk in the Cambridgeshire & Peterborough region, 2020-2099 was produced by CUSPE.2 It focuses on future overheating and changes in seasonal rainfall patterns, and provides a preliminary overview of some of the major risks associated with these changes across the Cambridgeshire & Peterborough region. Insight into the changing regional climate is provided through the UK Climate Projection 2018 (UKCP18) data and associated products and research
Place-Based Climate Action Network (PCAN)
We commissioned work on a net zero carbon roadmap for the region from the Place-Based Climate Action Network (PCAN).3 This identi�ed the need for o�setting unavoidable residual emissions (after all possible methods of mitigation were used) and highlighted the role that nature-based solutions could play in that.
Key areas for action
Aspects of adaptation are addressed in other Chapters as part of the speci�c recommendations to that theme. These are summarised as follows:
A funding plan for green investment
Doubling nature, including demonstration projects
All buildings to be designed for a changing climate
Digital green buildings ‘passports’ – covering cooling, water e�ciency,property-level �ood resilience – retro�t measures for Net Zero
3 PCAN (2021), A Net-Zero Carbon Roadmap for Cambridgeshire and Peterborough, Sudmant, A., Duncan, A., Gouldson, A., ESRC Place Based Climate Action Network, University of Leeds.
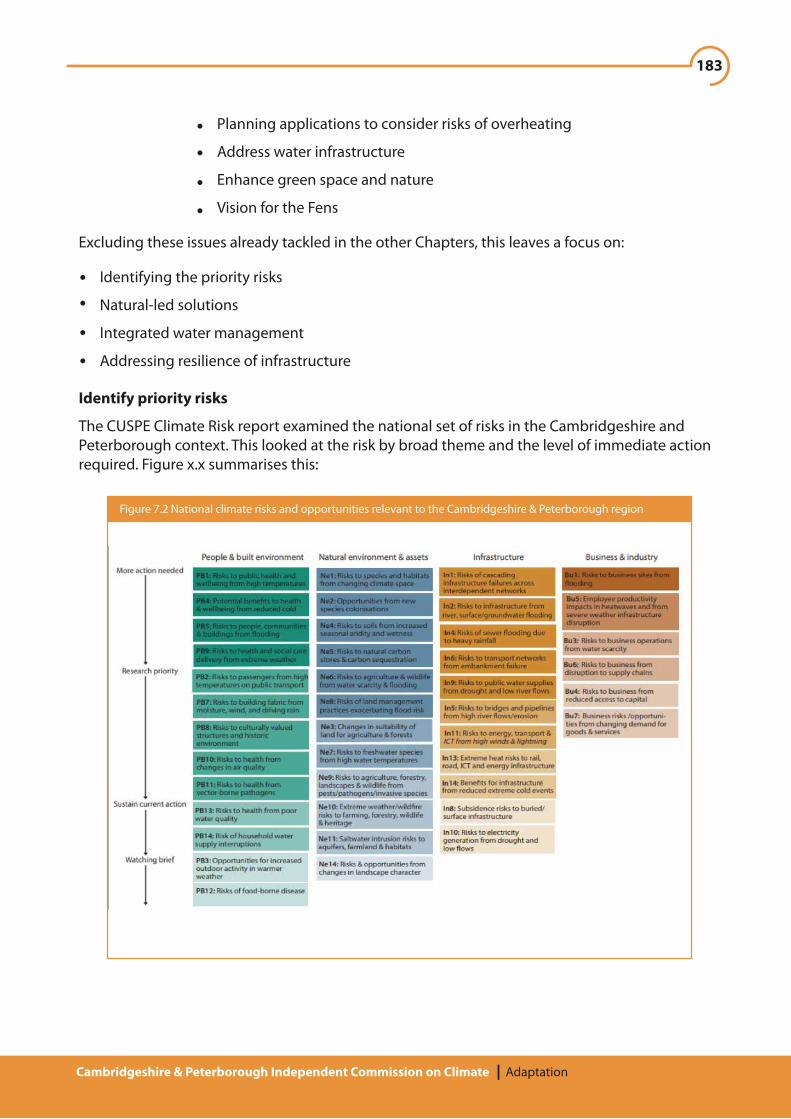
183
Cambridgeshire & Peterborough Independent Commission on Climate Adaptation
Identifying the priority risks
Natural-led solutions
Integrated water management
Addressing resilience of infrastructure
Excluding these issues already tackled in the other Chapters, this leaves a focus on:
Identify priority risks
The CUSPE Climate Risk report examined the national set of risks in the Cambridgeshire and Peterborough context. This looked at the risk by broad theme and the level of immediate action required. Figure x.x summarises this:
Planning applications to consider risks of overheating
Address water infrastructure
Enhance green space and nature
Vision for the Fens
Figure 7.2 National climate risks and opportunities relevant to the Cambridgeshire & Peterborough region
184
Cambridgeshire & Peterborough Independent Commission on Climate Adaptation
Flooding (all types)
Overheating
Water supply and treatment
Agricultural and biodiversity change
Higher risks for CPCA area:
In the future we can expect to see more severe climate related incidents across the Cambridgeshire and Peterborough region. These incidents—which may include increased incidents of �ooding that place a greater number of people at risk, increased overheating, a higher chance of extremely hot summers, and the risk of interdependent infrastructure failures cascading during a severe climate-related emergency—need to be assessed irrespective of whether or not the area or the UK meets its net zero targets. This highlights the importance of robust adaptation and resilience planning.
The LRF has a number of natural hazard related risk assessments, such as �ooding, drought, heatwave, storms, space weather, and these are reviewed on a regular basis depending on risk score and have links to plans that to deal with each. With climate change issues impacting over a longer time period it will be important to consider the role of longer-term, proactive adaptation measures. Risk assessments will need to test a range of climate scenarios, including both a 2oC global increase and a 4oC increase as well as taking into account low probability high impact events at the ends of the distribution. The government also consulted in 2021 on the development of a new National Resilience Strategy.
Communicating climate-related risks to the public, and how residents and business can take adaptation action themselves, is a critical need. More action needs to be taken to inform the public about the limits of emergency responses to some climate-related emergencies such as �ooding, particularly in the �rst few hours of a signi�cant event. More action is also needed to recognise the increasing likelihood of extreme heat events, and adapting private and public buildings, infrastructure and systems to cope in such events.
The Local Resilience Forum to regularly review risk of interconnected / cascade failures as a result of climate incidents and develop mitigation plan as a response
The Local Resilience forum to review risks to public buildings and public spaces.
Consider demonstration projects for public and commercial premises, linked where possible to nature-based solutions e.g. building shading and adjacent surfaces, green roofs/walls, porous surface drainage and local green space. Prioritise at-risk locations when considering building retro �t programmes.
Address the lack of public awareness and preparedness of extreme heat and water events. Build awareness of need for property-level resilience measures. Local public engagement campaign(s) that link climate impacts to nature, river health and need for water conservation and carbon sequestration, to promote actions that can be taken individually to help people and communities prepare. Clarifying responsibilities of di�erent parties / property owners interaction. Potential for grant-based scheme to increase action.

185
Cambridgeshire & Peterborough Independent Commission on Climate Adaptation
Natural-led solutions
The Overarching Chapter sets out our recommendation on Doubling Nature. Alongside climate change, which is the remit of the Commission, there is the crisis facing the UK’s natural environment and the loss of biodiversity over previous decades:
Species and habitat variety have declined, dramatically in some case. Recent environmental stewardship schemes, the development of protected or voluntary sites for wildlife (of which there are notable examples in the Cambridgeshire and Peterborough area), and changes to agricultural practice have seen some improvements, but not at the pace required. However, many adaptation measures that can reduce climate-related risks are also ideally suited to coming forward as ‘nature-led’ solutions that can boost nature recovery. This can be at the property level (e.g. trees providing shading in the summer), through site-scale (such as Sustainable Urban Drainage Systems SUDs) to landscape-scale interventions (woodlands that slow �ood waters, or alternative crops). Properly designed and maintained, these adaptation measures can o�er signi�cant co-bene�ts for nature – and other bene�ts such as reducing pollution or promoting wellbeing.
For example the Forestry Commission and Natural England have both carried out studies to calculate the quantitative bene�ts of green space: A single large tree can transpire 450 litres of water per day, making urban trees an e�ective way of reducing temperatures. Street trees and green roofs can reduce runo� by 50% in the immediate area.4
The UK is one of the most nature depleted countries in the world (ranking 189 out of 218 countries) and in terms of natural habitats, Cambridgeshire has one of the lowest proportions of priority habitats in England (less than 10%), with one of the lowest percentages of land designated for nature and the second lowest woodland cover at 4.8%. It also has one of the lowest percentages of open access land and accessible natural greenspaces, a de�cit that has been exacerbated by rapid economic and population growth’ - (Wildlife Trusts BCN)
“An estimated £2.1 billion in health costs could be saved each year if everyone in England had good access to nature” (RSPB Recovering Together 2 report 2020)
Box 7.1: Chalk Streams and drought
Biodiversity, particularly in the region's chalk streams, could be impacted by drought combined with warmer conditions. These streams are major centres of biodiversity, home to many nationally rare and threatened species. Fed by chalk aquifers, healthy chalk streams are crystal-clear and maintain water temperatures around 10º C year-round. Many species found in them are highly sensitive to �uctuations in temperature, sediment, and pollution (Hawksley & Mungovan, 2020). Habitat destruction through higher temperatures and lower �ows could destroy these populations.
4 Natural England: Economic Bene�ts of Greenspace (2014).
186
Cambridgeshire & Peterborough Independent Commission on Climate Adaptation
A key recommendation is therefore to prioritise nature-led solutions as part of both the adaptation and mitigation response, so that this also helps deliver the Doubling Nature ambition. By working with nature there is also the opportunity to reduce emissions that might be generated through implementation of alternative ‘hard’ infrastructure.
One of the key barriers to nature-based solutions is when their multiple bene�ts are not fully recognised in the case for investment (which might rely on a narrower range of economic considerations depending on the source of funding). The Commission recommends that use is made of a ‘natural capital’ approach which seeks to formalise those wider bene�ts. The natural capital approach to valuing nature in terms of natural assets and the goods and services they create is helping local authorities like Greater Manchester Combined Authority to produce Natural Capital Investment Plans to direct public spending and attract private investment in nature.
Another barrier to e�ective nature-led adaptation measures can be a lack of coordination. Lots of fragmented delivery may not give su�cient scale. Conversely, making linkages between schemes serves to magnify the bene�ts. This is also true for the recovery of biodiversity, and the government is seeking to embed that concept through a new requirement for local areas to produce Local Nature Recovery Strategies (in the Environment Bill). Building on the recommendation in the Peat Chapter about coordinating the di�erent strategies, it is proposed that the area should develop a high-level framework as a single strategy that looks at the use and management of land across the CPCA area at a landscape scale. This strategy can build on the work of Natural Cambridgeshire in its Vision for Nature which identi�ed six priority landscape areas for early intervention, and the Future Parks Accelerator project that has looked at the potential of parks and public open spaces.
Using the proposed strategy for context, and to see the implementation of more natural-led solutions, the Commission recommends the establishment of a ‘Fund for Nature’ to pump prime activity. This can look to a portfolio of funding models for nature across public, private and third-sector funding. This can range from local nature and adaptation projects (such as villages increasing tree cover or ponds as storage) through to larger-scale interventions. The government also intends to mandate that developments provide a net gain in biodiversity, which will see more biodiversity within developments and also potentially a growing ‘market’ for suitable natural projects where an external location is needed.
There is a link back to our just transition recommendations in tackling the barriers that di�erent groups of residents face as national research shows those from ethnic minority backgrounds, low-income areas or disabled people are among the most likely to miss out on the bene�ts of nature.
Many of the landscape-scale interventions (reducing �ood risk, promoting di�erent agriculture use) will depend on landowners and the agriculture sector. The NFU has set out the route map for how farming intends to move to net zero. However, changes to promote natural-led adaptation require a wide package of support. This can be support for new land management/-farming techniques; incentivising returns (for example expanding the Peatland and Woodland Codes to create a ‘Land Carbon Code’ to bring in sequestration opportunities within wetlands, inter-tidal habitat and mineral soils). There needs to be transition measures are needed for farmers, especially to encourage action as the government phases out direct payments and introduces the new system that rewards farmers and land managers while delivering additional public goods that improve the environment.
187
Cambridgeshire & Peterborough Independent Commission on Climate Adaptation
In practical terms, we recommend that
The CPCA should work with partners to signi�cantly accelerate the delivery of the doubling nature ambitions, recognising the contributions that large-scale nature recovery can make to climate change adaptation, including
through the establishment of a multi-million pound ‘Doubling Nature Fund’ that can operate a portfolio of funding models to �nance habitat creation and nature recovery across public, private and third sector investment
through the development of a high-level spatial and landscape framework that ensures we create su�cient space for environmental recovery and integrated water management cross the CPCA area, planning for future environmental gains that allow for large-scale natural capital solutions to help with the adaptation agenda
the introduction of transition measures for landowners and farmers to avoid delay ahead of the roll out of Environmental Land Management Schemes
considering the case for adopting biodiversity net gain targets that are higher than the proposed mandatory minimum, recognising that the area is one of the most nature depleted in the country and therefore needs to kick-start its recovery faster than other areas
creating and fostering community led nature recovery programmes in both rural and urban areas, that help communities adapt to climate change and particularly the local impact of severe weather events
calling on government to support new land management and farming techniques, broadening the Peatland and Woodland Codes to bring in sequestration opportunities within wetlands, inter tidal habitats and mineral soils.
-
-
-
-
-
-
Integrated water management
Water issues are a key focus for adaptation measures in the Cambridgeshire and Peterborough area, because of its landscape and weather. Wetter winters and more intensive rainfall will increase the risks and incidents of �ooding (which could be surface water not able to drain, rivers over�owing or ground water rises), whilst sea-level rise and storms put pressure on the coastal �ooding defences and drainage (tidal reach on rivers extends into the area). Conversely, with Cambridgeshire and Peterborough being in the drier parts of the UK for summer rainfall, then hotter summers and increased risk of extreme heat events will a�ect water supply and river quality.

188
Cambridgeshire & Peterborough Independent Commission on Climate Adaptation
Box 7.2: Future Fens Integrated Adaptation
Anglian Water, the Environment Agency and Water Resources East have developed the ‘Future Fens’ initiative with the Association of Drainage Authorities. This seeks to address the climate change risks to the Fenland region in an integrated way, and in doing so, unlock investment in infrastructure and economic development to address social inequalities. The principal climate risks being managed will be rising sea levels and increasing �ood risk, together with threats to water security. The approach will integrate �ood risk management and new sources of water storage and transfer together in ways that deliver nature restoration and carbon sequestration bene�ts.
Box 7.3: Great Ouse Fens.
Under their responsibilities the Environment Agency have been promoting partnership work on the �ood infrastructure and the challenges of climate resilience within the Fens. Within the National Flood & Coastal Erosion Risk Management Strategy, the Fens is the only local place within the country to have its own measure. Much of the Fens lies below sea level. Consequently, �ood and land drainage infrastructure in the Fens is crucial in enabling surrounding agricultural land, businesses, communities, habitats and species to prosper. ‘Future Fens – Flood Risk Management’ is a programme of activity that has been put in place to consider what the future �ood risk management choices for the Great Ouse Fens area should be, as part of the broader ‘Future Fens’ integrated adaptation strategy.
Flooding
The �ooding experienced across the River Great Ouse catchment over Winter 2020/21 tested the Fens �ood infrastructure, highlighted the vulnerability of communities particularly on the Fen edges and reinforced the importance of taking a strategic approach to climate resilience in a catchment with growth ambitions. The Environment Agency has a suite of strategic �ood evidence that they are developing in collaboration with partners across the Cambridgeshire and Peterborough area. Work is sponsored and/or co-funded by the relevant Regional Flood and Coastal Committee (RFCC). The RFCCs’ raise local �ood income via Local Authorities and Internal Drainage Boards to lever in government funding and other investment to respond to the �ood resilience challenges. As the risk of �ooding increases due to climate change, then additional funding will be required (on top of resources already needed to maintain existing assets) – this is unlikely to be raised through local �ood income and requires new ways of resourcing.
Many organisations have responsibilities connected to water. This includes water quality, the health of our rivers, the drainage of the Fens, public water supply, commercial and agriculture use of water, waste water treatment and surface water drainage. Tackling the risk of �ooding is split across di�erent types of �ooding/area, and across a variety of organisations. Residents and individual landowners also have responsibilities on their land (although often they can be unaware of this).
Some of the options to address Cambridgeshire and Peterborough’s climate challenge on water issues will likely lie with river catchments beyond its local government boundaries, so forming links and mutually bene�cial relationships both within and across boundaries will be essential.
189
Cambridgeshire & Peterborough Independent Commission on Climate Adaptation
One of the consequences of increasing incidents of �ooding, whether �ash �ooding or surface water �ooding from a localised downpour, or high volume of water passing down through the various catchments, is that properties and infrastructure in higher risk locations need to have considered appropriate adaptions (for example raising important infrastructure higher o� the ground). However, there is limited evidence of property owners actively adapting. In many cases this can be a lack of knowledge about the risks, especially where they have increased over time. Or it might re�ect a con�dence in the �ood resilience measures or a lack of resources to undertake changes. This is an issue for local action.
It is also important that new build developments are also suitably adapted, if there are potential risks either now or in the future caused by climate change, particularly �ooding.
National planning policy, implemented by all the planning authorities in the area, directs new development away from the highest risk �ood locations unless exceptional circumstances apply. It also encourages the use of SUDs as described in the Buildings chapter. Research mapping the location of new homes the decade to 2018 estimated that 6% of new homes (2700) were built in areas of �ood risk in the CPCA area. These might represent legacy planning permissions permitted under previous policies and it is not possible to estimate what resilience measures have been engineered into the developments. However, more recent analysis of Environment Agency objection letters to planning applications for the period 2016 to 20215 record less than 10 dwellings across the CPCA area where permission was granted against the EA advice on �ooding matters.
5 https://www.gov.uk/government/publications/environment-agency-objections-to-planning-on-the-basis-of-�ood-risk

190
Cambridgeshire & Peterborough Independent Commission on Climate Adaptation
6 https://www.greatercambridgeplanning.org/media/1391/gclp-strategic-spatial-options-assessment-integrated-water-management-study-nov2020.pdf
Box 7.4: New homes in �ood risk zones
Analysis by Rozer and Surminski found that over the decade to 2018, more than 120,000 new homes in England and Wales have been built in areas of �ood risk. They also found that a disproportionately high number of these new homes have been built in struggling or declining neighbourhoods. Their analysis suggests that this was similar within the CPCA area. Their analysis does not show what resilience measures might have been engineered into these buildings or their surroundings to reduce the �ood risk):
Source: Rozer, V and Surminski, S, (2021), Current and future �ood risk of new build homes across di�erent socio-economic neighbourhoods in England and Wales, Environmental Research Letters, 16, 054021; and data supplied.
New build homes
New build homes in �ood risk zones
Proportion of New build homesbuilt in �ood risk zones
Total Built for neighbourhood types: “Ageing manual labour” or “Increasing struggling”
41995 6790
542
8.0%
2689
6.4%
Table B7.1: Data from Rozer and Surminski on location of new build homes in CPCA area, 2008-18
The proportion of recent new build homes at medium-to-high risk of �ooding (a 1% or higher annual risk of �ooding; or 0.5% chance for sea �ooding) will increase to 2050, assuming no future change in structural �ood protection, as the impacts of climate change grow.It is likely that socio-economic characteristics of neighbourhoods are also linked to community resilience (ability to take measures to reduce risks to property or to recover from �ooding).
Notes: the neighbourhood types are based on de�nitions developed by Patias, Rowe and Cavazzi. The category “Ageing manual labour” re�ects areas transitioning from blue collar families to an older striving type; the category “Increasing struggling” re�ects areas transitioning from council renting to struggling home-owners.
Water supply
The e�ects of heat waves may be most keenly felt when coupled with the e�ects of drought. As the UKCP 18 climate data show both hotter and drier summers, management of water resources will become more di�cult in upcoming years. As the urban footprint grows in Cambridgeshire & Peterborough, a greater number of people will depend upon water resources. As an example, the evidence base for the review of the Greater Cambridge Local Plan (planning growth to 2040) identi�es water supply as a barrier to higher levels of growth without further investment.6

191
Cambridgeshire & Peterborough Independent Commission on Climate Adaptation
Box 7.5: River �ows and the demand for water
Abstraction in Cambridge reduces water levels in the River Cam by around half its average natural �ow (Adams, 2020). The potential for greater future abstraction coupled with lower summer rainfall may negatively impact people, industry, and biodiversity and the quality of the natural environment.
The government has put in place a new mechanism to integrate planning on water supply. A Regional Water Plan is in preparation by Water Resources East focusing on:
1. Demand management – leakage and Per Capita Consumption (PCC) reduction with multi-sector water e�ciency measures.
2. Large infrastructure options (e.g. reservoirs, transfers, desalination,e�uent re-use) >10 Ml/d that have a whole regional, or national signi�cance.
3. ‘Local’ non-water company and smaller (<10 Ml/d) water company infrastructure projects and schemes which requires the specialist, sub-regional knowledge of WRE members.
4. Supporting, facilitating or overseeing water innovations and exemplars in Eastern England which push the ‘art of the possible’.
The Regional Water Plan will set the context for the investment to be made by water companies and has a key role in the area’s adapting to the water supply impacts of climate change.
In practical terms, the area should:
Accelerate the delivery of integrated water management and nature-led solutions
Address the lack of public awareness and preparedness of �ooding or summer drought conditions.
Build awareness of need for property-level resilience measures.
Local public engagement campaign(s) that link climate impacts to nature, river health and need for water conservation and carbon sequestration
Promote actions that can be taken individually to help people and communities prepare.
Clarifying responsibilities of di�erent parties / property owners for maintenance of their water infrastructure.

192
Cambridgeshire & Peterborough Independent Commission on Climate Energy
Develop a local area energy plan, in close collaboration with interested stakeholders, including distribution companies, consumers and large energy users.
To the extent than there is interest in options for hydrogen production within CPCA, prioritise consideration of potential for hydrogen production from surplus generation for uses without more suitable and cost-e�ective low-carbon energy sources
Urgently develop and make proposals on distribution network investment ahead of need
Urgently provide clarity on revised arrangements for network access (connection charges) to facilitate local decarbonisation projects.
Energy
Recommendations
We make the following recommendations.
For CPCA and constituent authorities:
1.
2.
3.
4.
For Ofgem:
For Government:
Advise areas on where hydrogen is likely to be available in the gas grid as soon as possible.
Look to streamline, simplify and provide longer-term horizons for schemes funding local energy projects.
5.
6.
Update on our March report
We made recommendations to Ofgem in our March report, relating to the need to develop proposals on distribution network investment ahead of need, and to provide clarity on revised arrangements for network access (connection charges) to facilitate local decarbonisation projects.
There has been progress on these issues.
In relation to the next electricity distribution price control (RIIO-ED2), Ofgem issued business plan guidance in April 2021. This includes guidance on planning under uncertainty of demand, and requires DNOs, in establishing future scenarios, to engage local stakeholders to help understand decarbonisation pathways. The guidance requires DNOs to distinguish investments likely to be required across di�erent pathways, and those required only under speci�c circumstances. It provides for uncertainty mechanisms to allow �ex in investment if circumstances warrant this.
In relation to grid access charges, Ofgem consulted on “minded to” positions in June 2021. Helpfully, Ofgem proposes reducing the required contribution to reinforcement for new generation and removing this completely for demand.
193
Cambridgeshire & Peterborough Independent Commission on Climate Overarching
DNOs should �rst consider the extent to which �exibility measures (including energy e�ciency and demand-side response) can provide a more economic outcome than network reinforcement;
A baseline allowance would provide for strategic investment to take place, where identi�ed and agreed to go ahead;
Uncertainty mechanisms could allow for investment plans to �ex above that strategic level, to meet “a level of reasonably anticipated demand”. This would recognise that uncertainties in demand are substantial, and provide a route – provided impacts on costs to consumers can be controlled – to further spend.
The earlier these plans can be �nalised, the easier it will be to develop investment plans. Mechanisms to allow �exibility in investment could be particularly important in the CPCA region, where uncertain population projections add to the uncertainties over the growth in electricity demand attached to the low carbon transition.
of projections are considered, and that these are reviewed with a range of stakeholders, including CPCA and constituent councils. Ideally they should form part of an agreed regional energy strategy.
Linked to this, the next electricity distribution price controls (RIIO-ED2) starts in April 2023. Ofgem has announced that updated business plan guidance will be issued, setting out net zero pathways that Distribution Network Operators (DNOs) should take into account in developing their investment plans. It is considering an approach whereby:
Introduction
One of the keys to meeting net zero across the UK will be the expansion and decarbonisation of the power sector. The CCC’s balanced pathway has electricity generation expanding from 300TWh today to 460TWh in 2035 and 610Twh in 2050. The near-zero electricity system to achieve this has small additional costs for consumers in 2035 and savings by 2050, re�ecting the addition of low-cost renewables.
The policy framework to allow for this expansion is largely set at national level. There will be scope for expanded renewable generation in the CPCA area, through additional solar and onshore wind, but this is not a topic we have explored in detail for this report.
There are however a number of linked issues.
Network infrastructure
The electricity distribution network in CPCA is close to capacity in some areas, particularly around Cambridge. This is already a constraint on growth of low-carbon generation (ranging from solar farms to installation of solar panels on school roofs).1 The need for network upgrades will rise further as take-up of electric vehicles and heat pumps increases.
There is uncertainty about the scale of this additional demand. UKPN is currently developing projections for the CPCA area. These projections, linking in to the locations of rising demand, will then feed into consideration of investment needs for the network. It is important that a range of
1 CPIER (2018).
194
Cambridgeshire & Peterborough Independent Commission on Climate Energy
We heard about some of these issues in relation to development of the district heating project at Swa�ham Prior (Chapter 5, Box 5.7). In this case, establishing a connection cost with UKPN has been problematic. In the end, an option for a private wire from a solar farm to provide power for community heat pumps has been developed. This has also helped the business case for the project in establishing a �rm price for the electricity to be supplied, rather than facing uncertainty over the price available from the Grid.
Whether the private wire is the most e�cient solution for the scheme is not clear. It also does not remove potential future liability for UKPN (and the wider community) for the development. Were the private wire or the heat network to fail, for example, it seems likely that the connected households would revert to electricity use for heating, a potential spike in demand with issues for the local network as to how it would cope.
Greater clarity on connection costs, and how they should be met, is urgently required. This is important for the development of community schemes, like that at Swa�ham Prior, but upgrade costs could be a barrier for low-carbon schemes more widely, such as provision of EV charging points.
In relation to electricity transmission, Ofgem has recently recommended the creation of an independent body to help lead the transition to net zero at lowest cost to consumers.3 It has recommended that this independent system operator should be fully independent from the network owner, in order to avoid potential ownership con�icts of interest and to meet the regulatory challenge that would otherwise exist from attempting to align the commercial
Funding from Central Government
2 a share of network reinforcement costs below £200/kW and all costs above £200/kW.
3 Ofgem (2021), Review of GB energy system operation.
We recognise the need to protect the consumer, who ultimately pays for network enhancement. But it is essential that investment plans take a long-term view. Over-sizing the network, “future proo�ng” for uncertain long-term projections, is likely to be low-regret and considerably lower cost than an outcome requiring two rounds of reinforcement.
We encourage Ofgem to make progress in developing its proposals on distribution network investment as soon as possible.
Connecting to the grid
When new customers require connection to the grid, they are currently required to pay for the costs of their connection and for network reinforcement costs where these are required.2 An economic logic for this approach can be adduced – it protects other consumers from having to cross-subsidise the cost of assets for which they are not a user; it encourages new users to locate where there is available capacity, and to consider smart measures to minimise their demands.
However, it can place a very substantial cost on the marginal user (especially where other new users might come on in future), and it might encourage them to develop alternative plans with lower social bene�ts.
There is a particular issue here with community investments. Energy schemes for local communities are by their nature location-speci�c – moving somewhere else, to a less constrained area, is not an option. Such schemes may also be established with strong social objectives in mind (helping to tackle fuel poverty and deprivation; bringing communities together), and are unlikely to have easy access to substantial �nance to cover upfront costs (even if the project can in theory repay them over the lifetime of the project).

195
Cambridgeshire & Peterborough Independent Commission on Climate Energy
Using power that would otherwise be surplus;
Providing frequency management services.
This may also point to locations in areas where grid constraints limit the amount of power that can be transferred from one part of the system to another.
There is limited use of hydrogen, in these scenarios, in buildings and surface transport. This re�ects that use of electricity or gas to produce hydrogen is a relatively ine�cient use of power, particularly when that electricity can be used directly for decarbonisation of these sectors.
To the extent that hydrogen is used in some areas in the gas grid to replace natural gas for heating in buildings, it is unlikely that CPCA would be a priority for this use. This is likely to be more suited to areas closer to industrial clusters, for the production of hydrogen from methane reformation with carbon capture and storage (CCS), or from electrolysis associated with addressing curtailment of generation from o�shore wind farms. Further clari�cation on this issue is needed, however, to feed into local planning. We have already noted (Chapter 5) that it would be helpful for BEIS and Ofgem to consider this further and issue guidance on the areas most (and least) likely to be suitable for hydrogen use.
We do not rule out that there could be potential for some production of hydrogen from electricity within CPCA. In general, this is likely to be quite costly, but it may be economic where electrolysers can be located where they can help to manage variable supply (from wind or solar) on the electricity distribution system:
interests of shareholders with consumer interests. There are similar potential con�icts in relation to the distribution network that need to be resolved.
Ofgem is conducting a Signi�cant Code Review (SCR) of network access and forward-looking charge arrangements. A “minded-to” decision on what can be done to help (ranging from, for example, socialising connection costs to allowing investment ahead of need in the price control) is expected later in 2021. Again, we urge Ofgem to provide clarity as soon as possible.
A further issue raised in connection with the development at Swa�ham Prior relates to the di�culty of raising �nance to develop the proposal. In the end, funding has been secured from a variety of “pots” – the Rural Community Energy Fund, the BEIS Heat Network Investment Project Fund, provision of land and match funding from the Council, and the CPCA. Each of these is welcome. But the process from initial feasibility study in 2017 to an approved investment decision has been lengthy, with many steps in achieving each element of funding along the way. This links to issues identi�ed in Chapter 2. Funding for local energy projects - whether energy e�ciency, district heating or other heat decarbonisation - needs to be provided on timetables long enough to support the development of supply chains and con�dence in delivery. There is a need for central Government to provide for more stream-lined and facilitative processes.
Hydrogen
CCC scenarios for net zero have signi�cant use of hydrogen in 2050. They show growth in hydrogen demand over the period 2030-2045, principally for use in manufacturing, shipping and back-up power generation. These roles re�ect an emphasis on using hydrogen where it has highest value and where electri�cation is not a feasible option.
Funding from Central Government
196
Cambridgeshire & Peterborough Independent Commission on Climate Energy
Where there is generation that would otherwise be curtailed, cost projections by CCC suggest that hydrogen from a PEM electrolyser would move closer to cost competitiveness with hydrogen from gas reformation plus CCS. Such production is unlikely to lend itself to use for heat in buildings – without storage – since winter heat demand does not align with solar generation. But hydrogen production for use in surface transport – buses or HGVs – might be more practical.
Cambridgeshire County Council is alive to the possibility of hydrogen production from surplus electricity. Indeed, more generally it has formed an Energy Investment Unit to explore options to maximise the use of its own assets to produce low-carbon energy for local use, with a number of projects (principally solar with electricity sold back to the grid) already developed. We do not think the economic potential will be large, but the considerations above suggest that options for production of hydrogen from electricity are worth exploring for the speci�c circumstances where they might be economic. Such opportunities may arise in future as more renewables generation comes onto the system – the low cost of variable renewables make it attractive to “over build” capacity, which may then produce surplus generation at certain points of the year.
Local Area Energy Planning
We have covered the need for local area energy planning in Chapters 2 and 5, with recommendations to CPCA and constituent authorities to expand the system-wide consideration of options.
To ensure that this is taken forward e�ectively, it is essential that this happens with the active involvement of network operators, for gas, electricity and heat. Planning needs to re�ect agreed sets of projections and understanding of priorities for network investment. UKPN will have a good view of where constraints currently exist and how these will be impacted by growing demand. CPCA and local authorities will have good sight of local requirements for net zero, and the national and local policy measures to be adopted in the transition, thereby impacting on demand.
197

198
The CPCA should establish and provide funding, estimated of the order of £50,000 a year, to support the operation of a CPICC Fenland Peat Committee, initially for a period of 5 years, with a remit to inform and develop ‘whole farm’ land use policies aimed at achieving climate change mitigation, adaptation and biodiversity enhancement in the Fens, and to help establish an agreed set of numbers for GHG emissions for deep, shallow and wasted peat soils.
Up-front funding should come from CPCA, and also be sought from Defra, NERC and other sources, to support the work of the Fenland Peat Committee but also more widely, for:
-On the ground research to �ll in the current gaps in the scienti�c evidence
-Development of best practice guidance
-Provision of farming advisers to support farmers in the transition.
Cambridgeshire County Council and Peterborough City Council should work to develop the role of County farms as leaders and exemplars in the transition.
The CPCA should establish a process to consult on and develop a vision and strategy which takes account of economic impact and goes beyond the single issue of peat emissions, taking a leadership role at the forefront of national action. This will need strong enagement with local communities, particularly farming.
Peat
Cambridgeshire & Peterborough Independent Commission on Climate Peat
Recommendations
1.
2.
3.
4.
Update on our March report
Emissions estimates
We noted in our March report that emissions from peatlands were currently excluded from the UK inventory. Since then the inventory has been revised to include new estimates of peatland emissions, consistent with the 2013 IPCC Wetlands Supplement.
This revision has added considerably to estimated emissions for the CPCA area as recorded in the inventory
in our March report, we indicated that a best estimate of emissions from cropland on peat in the CPCA area was around 2.6MtCO2e/year, adding around 45% to estimate emissions from all sources;
the published inventory shows an increase a little below that level, from 0.4mtCO2e (2018 inventory) to 2.2MtCO2e (2019 inventory), adding around 33% to estimated all source emissions in the CPCA area.
Estimates remain highly uncertain and the requirement of additional work to improve estimates speci�c to the Fens remains.

199
Cambridgeshire & Peterborough Independent Commission on Climate Peat
Fenland Peat Committee
We recommended, in our March report, the establishment of a Fenland Peat Committee, with a remit to inform and develop “whole farm” land use policies, and to help establish an improved set of estimates for emissions for deep, shallow and wasted peat.
The CPCA accepted that recommendation and committed to provide funding of £50,000 annually.
The Committee has begun work, including membership from leading conservation groups, NIAB, Cambridge, Cran�eld and Bangor Universities, as well as local farmers.
Initial work has included a number of site visits, a pilot mapping exercise on 10,000ha of fenland, �ux tower measurement of emissions (with agreement to set up 2 further �ux towers to add further data), and the beginning of evaluation of economic and social impacts.
Peatlands and farming – a just transition
In our engagements with the fens panel and with civil society groups from across Cambridgeshire and Peterborough (Chapter 3), we asked people what might prevent climate actions being implemented, and implemented in a fair way.
Land use, food security, nature and farming were were major topics raised in the consultations. Indeed, access to sustainable, a�ordable food was frequently raised as an issue and many people were deeply concerned about the levels of food poverty in the region and high reliance on foodbanks. The Fens panel, and other groups, felt that changing our relationship with food and understanding the relationship between farming and the environment were key.We summarise here some of the key issues raised in relation to farming in the Fens. Other aspects of the consultations are covered in Chapter 7 Adaptation, nature and water.
The rural nature of much of the region and the importance of farming to many residents was re�ected strongly in the consultations. People felt strongly that we should do more to value our rural economy and farming community and connect local food production with our communities.
“Farmers are often dealing with a problem rather than causing it and shouldn't be punished for having to manage challenging land - such as dealing with peat. They should be supported to reduce natural carbon emissions. There is more they can do to improve their practices but if you take income away from them then they won't have the money to invest in improving things” (Output from Fens panel).
Barriers and challenges identi�ed
Many participants re�ected on the challenges facing farming in the region, including the peat content of the soil, the threats to farming from changes in the climate, and the relationship with water security. The Fens panel re�ected that the land use issue in the region is very complex.
Whilst farming has high emissions, food production is essential and important for the local economy, so how to tackle this issue presented challenges for participants, especially when current �nancial incentives and subsidies are not well aligned with promoting sustainable agriculture.
Participants in the Fens panel raised a bigger concern about why producing good, sustainable food wasn’t the most pro�table option.

200
Cambridgeshire & Peterborough Independent Commission on Climate Peat
However, the Fens panel and other groups felt that cutting emissions will cost farmers and that initially they will need help to avoid the cost being passed onto consumers. Small farmers in particular should be proactively supported. The Fens panel felt that farmers need engagement and further information and that those working on the land should also have a role in the decision making that will a�ect them.
“At work, I’m a teacher … and I don’t treat every child in my class the same. They’ve all got di�erent needs. And I think it’s the same in the country really. That every council, every district, has a di�erent need and so they need a di�erent amount of investment.” (Fens panel participant)
Participants in Cambridge re�ected that it wouldn’t be fair to ‘o�shore’ our emissions by importing food from abroad instead of growing it locally. However, participants across the region felt that for all farming across the world it was important to move towards farming methods which work in harmony with nature such as agroecology, soil restoration and regenerative farming. This is especially important for shallow and degraded peat, but also for non-peat soils.
“There is a lack of local agroecological and regenerative food and farming systems.” We need a “commercially viable way to move to more regenerative and sustainable agriculture” (Cambridge participant)
Develop a land use framework which considers sustainable farming, community spaces and biodiversity
How we grow our food - County farms should lead the way in supporting a transition to more sustainable farming practises such as regenerative farming - Engage with farmers and help to move towards more sustainable practices. People were keen to see farmers supported to be champions, trained in di�erent ways of farming and not blamed for the land that they manage - Support farmers, in particular small farmers, who might not have the �nancial leeway to transition to di�erent forms of farming alone, with loans and other �nancial support - Provide �nancial compensation to farmers for ecosystem services where appropriate and prioritise subsidies for climate friendly agriculture - Support farming initiatives such as the great Fen project and paludiculture - Avoid using valuable farming land for biofuels
Ideas identi�ed by participants
In addition, groups expressed concern that “our future food supply is in danger” and raised the question of “how do we become resilient” and “protect the food produced in the Fens from climate change?” The relationship between water stress and agriculture, which requires a lot of water, including in the management of deep peat, was also a concern.
In many consultations, there was excitement in the potential for the region to continue producing food, whilst being a key player in the move towards sustainable agriculture.
“Because so much of the land around here is agricultural land it means that is one of the things that is causing a lot of our carbon emissions at the moment; but it also means we have the potential to have quite a big impact if we do something to address that” (Fens panel participant)
201
Cambridgeshire & Peterborough Independent Commission on Climate Peat
The issue, given the scale, is an acute one for the region. Leadership in the area has potential to be nationally signi�cant.
Introduction
The current UK emissions inventory includes 1.5MtCO2e annual emissions from peatlands. Within the next couple of years, however, the coverage of the inventory is likely to be extended, possibly raising recorded peatland emissions by 17-21MtCO2e1, though there are large margins of error around this estimate2. This would add around 4% to overall reported UK emissions.
Whether or not within the inventory, these emissions are of great signi�cance for CPCA since the Fens contains around 23% of the area of lowland peat in England and Wales.3
Establish a Cambridgeshire Fenlands Peat Committee to begin the work needed to deliver objectives and to support the work of Defra’s Lowland Peat Taskforce and Lowland Peat Strategy.
Develop best practice guidance for regenerative farming and peat restoration.
-
-
Build the evidence base by improving the mapping of Fenland peat by soil type (peat depth, amount of mineral content) and increase the accuracy of emissions measurements from di�ering soil types and crop rotations.
-
Climate change is likely to lead to higher summer temperatures and greater periods of drought. Without actions to address these impacts, they are likely to lead to increased loss of peat and higher emissions.
Key requirements locally are to:
Develop a “whole system” vision and action plan for the future of the Fens, looking for wide buy-in of the many actors and stakeholders with an interest.
-
Emissions from peatland are currently largely excluded from the emissions inventory. There is substantial uncertainty in estimates, but inclusion could add a further 45% to overall CPCA area estimated emissions.
Sustainable agriculture practices and restoration are needed to tackle this.
For the UK as a whole, the CCC central scenario consistent with net zero includes the sustainable management and re-wetting of 60% of lowland peat by 2050.
It is unclear where the Fenlands �t within this, and there has likely been some previous over-estimation of emissions and peatland extent in the Fens. However, the Fens includes almost a quarter of the lowland peat area in England and Wales. Choice of appropriate options is dependent on the nature and extent of peatland soil, which is currently not well understood. Work is underway, nationally, which should help improve our understanding of the level of emissions and the costs and bene�ts of alternative practices.
Summary
1 CCC (2020), The Sixth Carbon Budget – The UK’s path to Net Zero
2 The Climate Change Committee quotes a con�dence interval for overall UK peatland emissions from less than 10MtCO2e to more than 40MtCO2e annually. Burton and Hodgson (1987), Lowland Peat Survey of England and Wales
3 Burton and Hodgson (1987), Lowland Peat Survey of England and Wales
202
Cambridgeshire & Peterborough Independent Commission on Climate Peat
This does not distinguish between true peat (deep and shallow) and wasted peat. However, the CPCA share of lowland peat emissions will be relatively high – the historical drainage of lowland soils in the Fens, for agricultural use, is associated with emissions as the drying out of peatland has resulted in the release of previously stored carbon to the atmosphere, and the loss of dissolved organic carbon to streams and other water bodies.
Whether the CPCA share of overall emissions is higher or lower than its share of peatland area is uncertain. There are di�erences in emissions as between deep, shallow and wasted peat which are still poorly understood. Current rates of loss of peat and levels of emissions are uncertain.
Based on the emissions factors and peat areas used in Evans et al (2017)4 a best estimate of emissions from cropland on peat in the CPCA area, subject to considerable uncertainty, is around 2.6MtCO2e/year.5 That would add around 45% to emissions from all sources. Measures to reduce these emissions are critical to success in reaching net zero overall.
Although comprising less than 4% of England’s farmed area, the Fens contributes more than 7% of UK agricultural production (worth £1.23bn), and a third of vegetable production. CPIER data showed the Fens as contributing 8% of the CPCA economy. Across the farming food chain it provides employment in CPCA to nearly 44,000 sta�, of whom over 17,000 work in agriculture and its input suppliers, and 26,000 in food processing and distribution.
CPIER data also show Fenland communities have markedly worse levels of educational and health outcomes, which may make them poorly-equipped to deal with the impacts of rapid economic change.6
So measures must be considered carefully, both in terms of cost-e�ectiveness and their social, and cultural impacts.
It is also critical that the underlying data on emissions are better understood. There are a number of signi�cant uncertainties and complexities around the current data:
The estimates of emissions are based on limited recent studies on emissions, applied to underlying mapping data collected thirty to forty years ago;
There are important distinctions to be made between emissions from di�erent peats(Box 9.1), which will in turn impact on mitigation options.
The extent of shallow and wasted shallow peat in the Fens is now very much greater than the area of deep peat. A very high share of wasted peatland in England is in the CPCA area (approaching 40%), but less than 5% of the deep peat area.
In the absence of good data, emissions estimates tend to be based on a combined estimate for cropland farming on peatland – across wasted and deep peat – of around 37tCO2e/year/ha. But there are reasons – and emerging �ux tower data - to suggest that, per hectare, wasted peat emissions might be lower than from deep peat
It is clear that the emission rate, per hectare, is complex, impacted by factors including water levels and land use. Attempts at accurate measurement are only now underway.
-
-
-
4 Evans et al (2017), Implementation of an Emissions Inventory for UK Peatlands, A Report to the Department for Business, Energy and Industrial Strategy.
5 The Net Zero Cambridgeshire (CUSPE) report estimated CPCA emissions from peatland at around 4-5.5 MtCO2e annually, but this estimate is based on a mis-estimation of the peatland area.
6 CPIER (2018) and NFU (2019), Delivering for Britain – Food and Farming in the Fens.
203
Cambridgeshire & Peterborough Independent Commission on Climate Peat
This means that peatland restoration has a role in areas of remaining deep peat, and to preserve carbon stocks. But in terms of scale, reduction (and potentially even reversal) of emissions through regenerative farming measures on areas of wasted peat are likely to be a priority, with restoration of these soils, in practical terms, unrealisable.
We do not have an up-to-date detailed map of the location of these di�erent peats. Individual farms may have pockets of deep peat and of wasted peat. Each farm will have to identify the solutions best for them, but understanding the practicality and overall cost of restoration and di�erent management practices is made more complex by these variations in conditions.
There are emissions attached to farming wherever it is carried out. Actions are needed to minimise these emissions in all areas, taking account of the conditions in each area. But if food production shifts from the Fens, there will be emissions attached to that food production elsewhere. So whilst peat emissions are of great signi�cance, the relative e�ciency of production in the Fens, lower use of arti�cial nitrogen fertilisers, and di�erences in water use and leaching must also be taken into account.
Nevertheless, these Fenland emissions are substantial. While work continues to improve understanding of scale, and of di�erent land management practices, we must not allow existing uncertainties to be an excuse for inaction. There are good practice examples (covered below) and we know enough to progress a number of actions that make sense now. We will be able to build on those actions as improved information and the Defra peat strategy (due later in 2021) emerge.
Indeed, there is potential for emerging evidence from the Fens area to in�uence that national strategy and its implementation. It should also support the NFU commitment for UK agriculture to achieve net zero by 2040.7
7 CCC (2020), The Sixth Carbon Budget – The UK’s path to Net Zero

204
Cambridgeshire & Peterborough Independent Commission on Climate Peat
What is happening locally?
There is growing farming awareness of the scale of the issue attached to peat emissions and degradation of farmland, and the need to address this. Some are beginning to take action:
Regenerative farming techniques are being used by an increasing number of Fenland farmers, such as Hannah Darby at Sawtry Fen and G’s. At G’s, for example, husbandry techniques include cover crops, grazing livestock, managing water levels and application of liquid digestate from an anaerobic plant back onto the land. Less productive areas of farm-land have been taken out of production in favour of permanent woodland, hedgerows and wetlands. Levelling of deep peat land has allowed a sub-irrigation system to accurately control the level of the water table, reducing peat oxidation in the summer months.
The Great Fen Paludiculture (wet-farming) Trial (Box 9.2) is trialling the growth of wetland crops. Initial results from elsewhere suggest good economic potential for growth of sphagnum.
Peatland restoration, mainly small-scale, has been undertaken by conservation partners at a number of sites. Approaches have varied from detailed intervention at RSPB sites to a rewilding approach at Wicken Fen (Box 9.3).
Box 9.1: De�nitionsDeep peat: peat depth of 40cm and over
Shallow peat: peat depth of 10-40cm
Wasted peat: deep peat that has been substantially degraded following years of drainage and cultivation, so that the peat is more dominated by underlying mineral materials. The soil organic matter could be as low as a healthy mineral soil outside of the Fens.
Active peatlands: areas where peat is currently forming and accumulating; likely to be areas with vegetation cover and largely unmodi�ed hydrology. With favourable management, where near-surface water levels have been restored, degraded areas may be returned to an active state.
Based on soil survey data from 1987 the area of peat soils in the Fens exceeding 40cm depth - some of this outside the CPCA area - was an estimated 158,700 ha. A large part of this deep peat soil, an estimated 107,000 ha, is likely to be wasted peat, leaving 51,700 non-wasted deep peat. Later estimates (Cran�eld University (2013)) put this area of deep peat at 33,500 ha.
Estimates by Evans suggest around 14,500 ha of deep peat area within CPCA, and 69,700 ha wasted peat, not all of this in agricultural use.
It is estimated that the amount of carbon stored in the peats in the East Anglian fens is around 37Mt of Carbon, declining owing to wasting, and down from around 53Mt at the time of the Lowland Peat Survey.
Sources: Natural England; Cran�eld University (2013), Restoration of Fen Peatland under Climate Change, report to Committee on Climate Change; Scottish Natural Heritage (2014), Scotland’s peatland – de�nitions and information resources, report 701.
205
Cambridgeshire & Peterborough Independent Commission on Climate Peat
The National Institute of Agricultural Botany (NIAB), which researches plant genetics and disease, has headquarters in Cambridge, a research station at Park Farm, near Histon, and an Innovation Hub near Soham. Applied research at NIAB could have a direct bearing on Fenland farming in relation to sustainability, productivity, the development of paludiculture crops and responses to the impacts of climate change.
Overall, however, the response remains patchy. At this stage, without signi�cant e�orts to extend best practice, the scale of actions undertaken is unlikely to be su�cient to avoid signi�cant further loss of peat and substantial further emissions.
Climate Change Committee (CCC) recommendations
In its recent report on the UK pathway to net zero emissions8, the CCC sets out its expectation that at the current rate of degradation (10mm/p.a. or more) most remaining peats will be wasted over the next 30-100 years. It sets out the bene�ts of well-functioning peatlands for the accumulation of carbon, provision of cultural services (such as recreation) and provision of wildlife habitats supporting diversity.
Further, the CCC notes that warmer and drier conditions in future are likely to increase the rate of carbon loss from degraded peatlands, suggesting that delaying action to reverse degradation will lead to increased costs when actions are taken. The CCC is currently developing an evidence report, due to be published in summer 2021, on the risks from climate change.9 One of the assessments feeding into this work10 indicates that higher summer temperatures can lead to drying and dessication of peat, leading to increased decomposition, damage to vegetation such as sphagnum cover, damage to soil structure and exposure of bare peat and erosion. In turn this may lead to increased emissions. Degraded peatlands (e.g. with lowered water tables that retain some sphagnum cover) may be most at risk and therefore a high priority for adaptation measures.
8 CCC (2020), The Sixth Carbon Budget – The UK’s path to Net Zero
9 To inform the Government’s third Climate Change Risk Assessment.
10 UKCEP (2020), Climate driven threshold e�ects in the natural environment, Report to the Climate Change Committee, May 2020.
Cambridgeshire County Council owns around 200 tenanted farms and Peterborough City Council also has 2 farms, covering a combined area over 14,000ha, of which a signi�cant proportion are on peat and wasted peat soils. A Monitor Farm to test and share best practice is being developed. The Cambridgeshire Council has committed to updating tenants with information as understanding of good practice and wetland farming develops.
Fens for the Future Partnership is a group of public, private and voluntary sector organisations with a broad aim to develop a partnership approach to landscape-scale conservation in the Fens. The vision is to see sustainable wetland restored, re-created and reconnected for the bene�t of people, wildlife, natural and historic heritage and the rural economy. Membership has broadened from environmental organisations to include strengthened links to the agricultural and business communities. Partners currently include the Environment Agency, Natural England, Peterborough City Council, Cambridgeshire County Council, the National Trust, RSPB, Anglia Ruskin University, the UK Centre for Ecology and Hydrology and the NFU.
206
Cambridgeshire & Peterborough Independent Commission on Climate Peat
40% of lowland cropland is re-wetted (25% to near natural condition; 15% to paludiculture)
35% of lowland cropland is sustainably managed (i.e. water table management)
50% of lowland grassland is re-wetted.
The CCC includes scenarios for lowland peatland to 2050 consistent with achievement of net zero across the UK as a whole. Its balanced pathway scenario includes the re-wetting and sustainable management of 60% of lowland peat by 2050:
Government position
The intention under the Environmental Land Management (ELM) scheme is to pay farmers for the provision of public goods. The Government’s 10-Point Plan has reiterated that funding for peatland restoration will be included within this. The scheme is also likely to support the adoption of a greater range of regenerative agriculture techniques.
The Government’s Green Recovery Challenge Fund, aiming to help recovery from the COVID-19 pandemic, has also provided funding for nature conservation and restoration projects across England. A �rst round of this scheme closed for applications in October 2020, but a second £40m round has been announced and is due to open early in 2021.
A policy discussion document on a potential England Peat Strategy was published in June 2020. This included a commitment to restore 35,000 ha of peatland where economic to do so, and proposed wider aims to bring all peatland into good condition, restoration management or more sustainable management by 2040, and to secure peatlands’ carbon store. A comprehensive England Peat Strategy is due to be published soon.
Work for our report similarly records that lowland peat may degrade more quickly with warmer summers.11
11 CZ (2021), Aines, E.D., Simpson, C., Munro-Faure, A., Shuckburgh, E., 2021, Preliminary report on climate risk in the Cambridgeshire & Peterborough region, 2020-2099, Cambridge Zero: University of Cambridge.
Box 9.2: The Great Fen Paludiculture Trial
The Great Fen paludiculture trial is a 2-year project (initially running from April 2019 to March 2021) trialling the growth of selected wetland crops (including bulrush (typha), reed (phragmites), a cereal crop (glyceria), watercress and sphagnum. As well as food and �avouring, the di�erent crops have potential applications in industry and medicine.The site of the trial, on the Great Fen between Peterborough and Huntingdon, is only 4ha and limited to testing the growth of crops to harvesting. To be considered a viable option for farming, substantial further work will be required in �eld-scale trials, to consider harvesting and processing practicalities and to grow markets.
Box 9.3: The Wicken Fen Vision
Wicken Fen is a National Trust nature reserve near Cambridge. Based on rewilding principles, the Wicken Fen Vision is a 100-year plan, through the progressive rewetting of land and restoration of natural processes (such as wild grazing), to create a diverse landscape with habitats for a variety of wildlife and access and recreation opportunities for people.

207
Cambridgeshire & Peterborough Independent Commission on Climate Peat
In other cases, managerial options, such as managing water tables or seasonal re-wetting in the winter months, could reduce emissions from peatland remaining in production.
Grassland, coping better with summer �ooding events (summer storms), may play a role in some places.
The resilience of peat soils to erosion and to climate change when managed appropriately is not widely understood.
Uptake of more carbon friendly regenerative techniques requires challenging conventional commercial norms.
The cost of carbon, because it is not borne by the operator, is not factored into decisions. This needs to be addressed by a national policy framework. A Cran�eld University study12
has found, once carbon costs are included, there are signi�cant net bene�ts for restoration and conservation over continuing with practices unchanged (and other environmental and ecosystem bene�ts are likely to add further to that). But so long as carbon costs are not included, the economics of di�erent options do not re�ect the real costs.
Farmers’ business models and farming practices are likely to need to change. But tenancy agreements may constrain what is possible in the short-and medium-term.
In relation to water resources, spatial policies are developing through Water Resources East (WRE). But the hydrology of the area is not necessarily well understood in detail, favouring continuation of the status quo:
12 Cran�eld University (2013), Restoration of Fen Peatland under Climate Change, report to Adaptation Sub-Committee of CCC.
Barriers to action
There are a number of barriers to action:
Status quo. The skills and knowledge to manage land di�erently (whether through regenerative techniques, paludiculture or seasonal re-wetting) are growing, but still in short supply. Whilst land remains productive in current use, and faced with uncertain implications of change - uncertain markets, lack of information and advice, potential investment requirements – action is easy to postpone. The fact there is no single answer makes the decision-making process substantially more complex:
Restoration of peatlands, through frequent, possibly long-duration �ooding, is relevant to remaining areas of deep peat. It has a high cost in lost agricultural production. Variability in conditions also means that costs of restoration are hard to estimate;
A Lowland Agricultural Peat Task Force has also been established, to examine how lowland agricultural peatland can be better managed to safeguard productive agriculture as well as contribute to the net zero target. This task force, bringing together farmers, water management stakeholders, academics and conservationists, will be supported by 4 regional sub-groups, including one for the East of England. It is to report to the Government in 2022.
-
-
-
-
-

208
Cambridgeshire & Peterborough Independent Commission on Climate Peat
What is needed
There is an urgent need for action to address peatland emissions in the CPCA area and to engage with the Lowland Agricultural Peat Task Force on behalf of the Fenland farming and conservation communities. Where restoration and regenerative farming practices can be adopted, we are keen that these go ahead. Farmers will learn from examples and best practice elsewhere. At the same time, if widespread adoption of new practices is to happen, the complexities of emissions from di�erent peatland soils and the appropriateness and practicalities of di�erent options need to be better understood. The actions needed are therefore not simple. We group them in 3 categories: improving the evidence base; identifying best practice; local leadership – though we believe that our recommendation for the establishment of a Fenland Peat Committee can have a role on each.
Improving the evidence base
Continued work is needed to gain a better understanding of the nature and quantity of peat emissions; to identify the areas most vulnerable to peat loss; to identify peat soils suitable for wet farming; to further research and demonstrate wetland crops; to understand the role of grass, wetland crops and to develop markets.
In relation to emissions, the CCC has set out estimates of emissions for areas of lowland peat remaining in agricultural use (Box 9.4) and estimates for the costs of restoration (Box 9.5). The CCC highlights the considerable uncertainties in peatland emissions, re�ecting a lack of robust data relating to the condition, location and extent of peatland under di�erent land use types. There is a need to con�rm the appropriateness of these values for the Fenlands and to understand better how these vary according to local conditions. It would also be helpful to establish the di�erence in emissions, taking a whole farm systems approach, between farming on peat and wasted peat soils as against true mineral soils, taking into account emissions from all activities and inputs (e.g. nitrates, water use and nutrient leaching).
Within an Internal Drainage Board (IDB) district, the water level cannot be changed to allow change in farming practice for one farmer if that is to the detriment of another. It may then be necessary (but hard) to show no-detriment, or farmers will need to move together.
The impact of re-wetting on water availability and how this ties in with the impacts of climate change need to be better understood. Seasonal re-wetting may also be constrained by the need to keep land permanently drained for continued �ood management and for mitigation against summer thunderstorms which could become more prevalent as a result of climate change.
Whilst there is an increasing focus on water supply issues (the East of England is classed as a water-stressed region), there is currently only one reservoir in the Combined Authority area (Grafham Water), with all other supplies from groundwater sources. Construction of more farm reservoirs may well be an economic proposition and help provide rewetting solutions in suitable areas.
A particular focus for action must be the relatively small number of IDBs which hold a large proportion of the remaining carbon store. Estimates by Cran�eld University13 suggest that more than half of the remaining peatland Carbon store is located in just 5 IDBs (Southery and District (14%); Whittlesey (13%); Holmewood and District (13%); Hundred Foot Washes (7.5%); Middle Fen and Mere (5%), much of which is in the CPCA area.
-
-
-
13 Cran�eld University (2011), Holman, IP, Kechavarzi, C, A revised estimate of peat reserves and loss in the East Anglian Fens, report commissioned by the RSPB.
209
Cambridgeshire & Peterborough Independent Commission on Climate Peat
Work is underway, or planned, which should improve our understanding:
A BEIS commissioned project is underway to improve quanti�cation of the area of wasted peat in England. This is led by Chris Evans from CEH and Bangor University. Field measurements will inform the derivation of new emission factors. The project is due to run until 2023, but preliminary estimates are expected later in 2021;
Box 9.4: Climate Change Committee estimates of peatland emission rates
The CCC’s sixth carbon budget report includes estimates for emission from lowland cropland peat:
Current lowland cropland: around 39.5tCO2e/ha
Sustainable management, lowland cropland peat under dynamic water-table management (seasonal re-wetting): the water-table is raised to 10cm below the peat surface in winter when no crops are in the ground, and drained to 40-100cm below the surface in the growing season. Assuming an average water table depth of 50cm across the year, emissions fall by around a half, to around 18tCO2e/ha
Sustainable management, lowland cropland under a permanently raised water table: to an average 40cm below the peat surface. Emissions fall to around 16tCO2e/ha
Paludiculture: emissions could fall by as much as 90% to 3.6tCO2e/ha.
Source: CCC(2020), The Sixth Carbon Budget – The UK’s path to Net Zero.
Box 9.5: Costs of restoring lowland peat
An indicative central cost estimate is £2,500/ha, but this is within a wide range of £800 to £5,500/ha. Low end �gures are indicative of light intervention such as the reseeding of arable land to allow for low levels of grazing
Median cost �gures could involve the use of machinery such as bulldozers to move soil and re-landscape, clearing of ditches and planting of sphagnum
High end �gures could include additional costs of woodland and scrub removal, and submersible electric pumps to keep the water table high
There are also ongoing maintenance costs that can include water pumping, ecological surveys and the cutting of grass for silage if the land is not grazed.
Any compensation for previous use is not in these �gures.
There is relatively little data on the upfront costs of restoration. The CCC uses data from a wetland conservation centre in Norfolk and a water and land management company that carries out restoration works:
-
-
-
Source: CCC (2020), The Sixth Carbon Budget – Methodology Report.
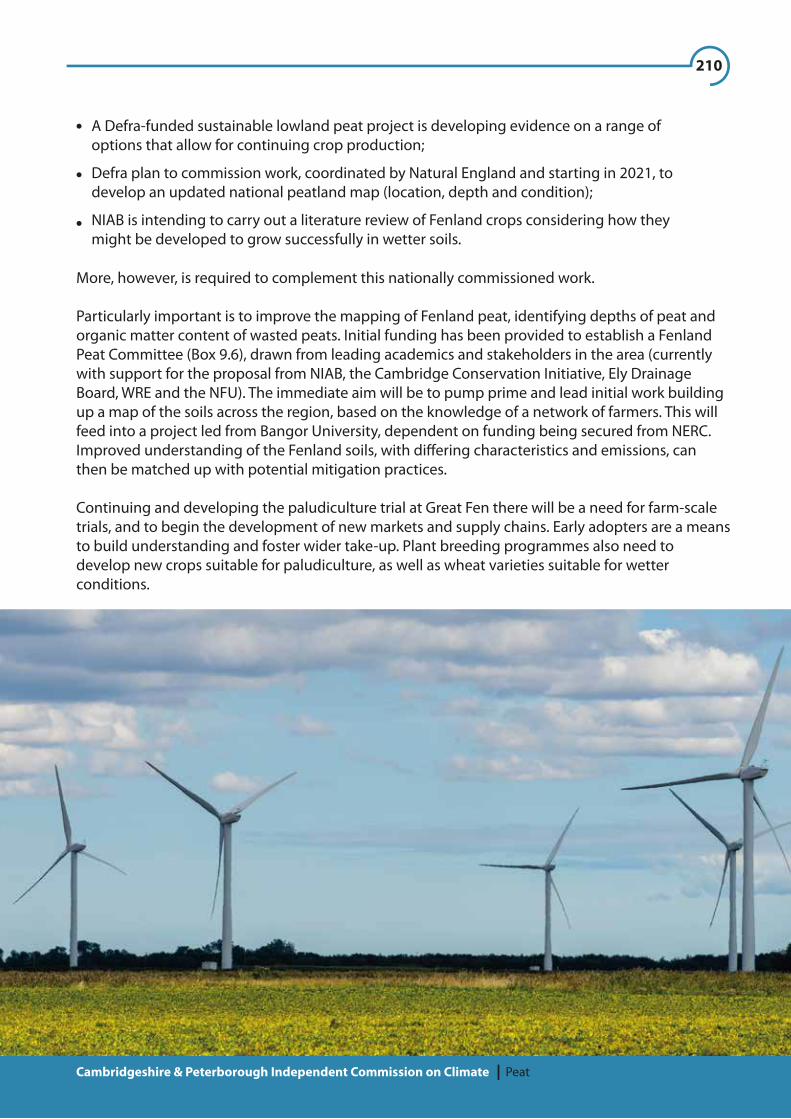
210
Cambridgeshire & Peterborough Independent Commission on Climate Peat
More, however, is required to complement this nationally commissioned work.
Particularly important is to improve the mapping of Fenland peat, identifying depths of peat and organic matter content of wasted peats. Initial funding has been provided to establish a Fenland Peat Committee (Box 9.6), drawn from leading academics and stakeholders in the area (currently with support for the proposal from NIAB, the Cambridge Conservation Initiative, Ely Drainage Board, WRE and the NFU). The immediate aim will be to pump prime and lead initial work building up a map of the soils across the region, based on the knowledge of a network of farmers. This will feed into a project led from Bangor University, dependent on funding being secured from NERC. Improved understanding of the Fenland soils, with di�ering characteristics and emissions, can then be matched up with potential mitigation practices.
Continuing and developing the paludiculture trial at Great Fen there will be a need for farm-scale trials, and to begin the development of new markets and supply chains. Early adopters are a means to build understanding and foster wider take-up. Plant breeding programmes also need to develop new crops suitable for paludiculture, as well as wheat varieties suitable for wetter conditions.
A Defra-funded sustainable lowland peat project is developing evidence on a range of options that allow for continuing crop production;
Defra plan to commission work, coordinated by Natural England and starting in 2021, to develop an updated national peatland map (location, depth and condition);
NIAB is intending to carry out a literature review of Fenland crops considering how they might be developed to grow successfully in wetter soils.
211
Cambridgeshire & Peterborough Independent Commission on Climate Peat
Identifying best practice and policy support
Building on the successful adoption of regenerative farming practices at speci�c locations and emerging evidence from paludiculture trials, there is a need to develop understanding of best practice and to communicate this information more widely to farmers.
Restoration may be e�ective in some settings, but will not be practical and economic everywhere. In other situations, we need to embed changes to management practices which reduce damage to peat and reduce emissions. We can outline the kind of practices that make sense (Box 9.7). This should be developed more fully, drawing on inputs from interested stakeholders, to include the NFU, Natural England, conservation groups and water companies. It can also be informed by work currently underway, through Defra, which is seeking the views of farmers on the practicality of around 30 mitigation actions, results from which should be emerging in the next few weeks.
A process for funding and taking this work forward needs to be established. We consider that this should be a priority for Defra funding. It links to work that Defra is already undertaking to consider best practice, as part of developing the lowland part of the England Peat Strategy. The
Box 9.6: The CPICC Fenland Peat Committee – proposed Terms of Reference
The Committee aims to inform and develop ‘whole farm’ land use policies aimed at achieving climate change mitigation and biodiversity enhancement in the Fens, and to help establish an agreed set of numbers for GHG emissions for deep, shallow and wasted peat soils.The Committee will:
1. Coordinate and provide expert “on the ground” farming engagement with hydrological and other scienti�c advisers in the Eastern Region to interact with Defra’s LAPTF and Defra’s and BEIS’s Lowland Peat 2 research programme (LLP2)
2. Undertake surveys and mapping of the location by types of peat soils to better de�ne the areas where greenhouse gas emissions are occurring at elevated levels and establish best practice for how these emissions are accurately measured
3. Evaluate locally the farming practice mitigations being proposed by the LLP2 programme, and in particular the opportunities and/or constraints for:
i. regenerative agriculture across the fens; and
ii. raising water tables within and across the seasons in areas of remaining deep peat
4. Work with local scienti�c and crop development resources to review opportunities in paludiculture and other plant adaptations
5. Consider, at farm level, the contributions that regenerative and nature friendly farming techniques and, at a landscape level, the contribution a Nature Recovery Network and the Doubling Nature ambition could make to emissions mitigation
6. Work to improve the clarity of what ELMS will fund – aiming to ensure that speci�c actions for sequestering carbon and for farming on peat and regenerative farming are incorporated – and to explore the potential for other funding mechanisms such as development of a robust system for carbon credits
7. Establish methods of monitoring the economic and social impacts of the proposed changes on Fenland farming, the wider Fenland economy, and Fenland communities

212
Cambridgeshire & Peterborough Independent Commission on Climate Peat
point here is not to replicate that work, but to work with the Lowland Agricultural Peat Task Force to develop practical solutions that reduce emissions, are economically feasible, support the required agricultural transition, and link with the future ELM system.14
Box 9.7: Stabilisation practices
Regenerative Farming – Some examples appropriate for shallow and wasted peats
A. Living root policy – the land constantly has a crop in it; whether it is a cover crop or a key commercial crop. This signi�cantly reduces the threat of soil erosion. Similarly, the cover crops sequester carbon and develop a mycorrhizal fungi network at the roots. This fungi network plays an important part in maintaining the carbon pool. Instead of harvesting the cover crop, it is grazed which generates natural manure that enriches the soil and encourages the crop to regenerate or it is mulched and ploughed into the soil pro�le.
B. Diversi�cation of crops – the cover crop can be made up of a 5-way mix (mustard, vetch, black oat, phacelia and tillage radish) within the rotation of the principal crops
C. No or reduced tilling – Reducing ploughing leads to the ground being less damaged and for the natural soil ecosystems to develop. This also ensures that the fungi networks are able to remain intact throughout the cropping cycles. Additionally, the reduction in tilling increases soil aggregate stability and promotes the formation of recalcitrant soil organic matter fractions within stabilized micro- and macroaggregate structures so protecting the soil organic matter (SOM) and as a result the soil organic carbon (SOC).
D. No arti�cial inputs – By removing the use of nitrogen, the oxidisation process slows down considerably. Option to add organic by-products from an anaerobic digester plant as potential alternative.
E. Precision farming – Introduction of variable rate application of nutrient and water, and use of drip irrigation so controlling the amount of water used and targeting its application
F. Fallow years – Resting �elds in production for a year and putting it down to grass. This holds the carbon in the ground and allows for more carbon to be captured each time the �elds are mown or grazed. These activities also allow for the regrowth of the grass; in so doing improving the e�ciency of water and nutrient use by the grass, increasing the carbon capture into the soil and reducing, potentially reversing, the organic matter decomposition rate.
G. Livestock – Incorporating grazing of livestock into the rotation. This adds nutrients to the soil
Deep peats
A. High value agricultural land a. Practice water table control techniques that reduce CO2 output, conserve the remaining peat, conserve water and eliminate the CO2 output associated with conventional irrigation methods.
b. Incorporate regenerative farming practices listed above
B. Low value agricultural land
a.Potential to cultivate sphagnum moss, alternative fodder crops, bioenergy crops or construction materials suited to higher water tables
b. Return to native wetland vegetation.
c. Incorporate solar panels into a wetland habitat.
14 LAPTF objectives announced in December 2020.

213
Cambridgeshire & Peterborough Independent Commission on Climate Peat
There is also a need for development of a higher-level strategy. The vision for the area needs to recognise the livelihoods that are currently dependent on agriculture in the Fens, and the high level of outputs from that production. It needs to recognise that continuing as at present is not sustainable, and that without change in the long-term local livelihoods will be at risk. The challenge is to develop the vision for a new economic identity for the area, consistent with environmental sustainability and reduced emissions.
The Independent Climate Commission recommends that the CPCA establishes a process to consult
Local leadership
There are pockets of good practice, but nothing like an agreed vision and strategy for lowland peat in the Fens. Where major projects are taken forward this is currently almost always dependent on speci�c individuals or organisations taking a lead – sometimes coming together with others, but on an ad hoc basis for that particular project. This needs to change.
With appropriate funding the Fenland Peat Committee we have proposed could have an immediate role, helping to marry up scienti�c knowledge with the practicalities of farming, conservation and maintenance of Fen landscapes:
Provision of expert advice, alongside farmer-to-farmer engagement. The Fenland Peat Committee can use its multiple stakeholders to map out knowledge exchange programmes. These can build on the work that the Cambridge science community has already contributed via NIAB, Agri-Tech East and Government programmes such as Catchment Sensitive Farming and facilitation funds for Nature Friendly Farming. They will also help to inform recommendations for the structure of the new ELMS, designed to support carbon-friendly farming.
Engagement with County farms. With the support of Cambridgeshire County Council and Peterborough City Council, the County farms could be a good place to start in terms of developing good practice, information gathering and sharing, and working in clusters to address water management issues. County farms could also, as opportunities allow, shift selection of tenants towards those more open to adoption of new sustainable farming practices.
Engagement with the Internal Drainage Boards (IDBs) and water companies. The role of IDBs needs to shift towards holding water within the system, pumping water to where it is needed for irrigation, to keep wetlands wet and for public usage. They must work to develop understanding of the feasibility of rewetting di�erent areas:
Opportunities for raising summer water tables in areas of remaining deep peat.
Given the catchment focus of IDBs, clusters of interested farmers will need to be encouraged to work together on new proposals for water level management.
Rising water demand attached to growth in Cambridge may further improve the case for investment in water management in the Fens, where the infrastructure is ageing.
-
-
-

214
Cambridgeshire & Peterborough Independent Commission on Climate Peat
and develop such a strategy. Properly constituted, with broad farming, conservation and scienti�c membership, the Fenland Peat Committee could help to develop a wider “whole system” vision and strategy, which goes beyond the single issue of farming’s peat emissions. The Fens Biosphere proposal (Box 9.8) and a Nature Recovery Network could be a part of this. Whatever approach is adopted, to be e�ective and in�uential in tackling peatland emissions it will need to have a strong focus on engagement with farming in relation to sustainable farming practices and build on the work of conservation groups.
If these proposals are taken forward, the CPCA area can be at the forefront of national action. Indeed, there is potential for this to be internationally signi�cant.
Box 9.8: Fens UNESCO Biosphere proposal
A number of partners (including Natural Cambridgeshire, Fens for the Future), are developing a proposal to UNESCO, to be made in 2021, to designate the Fens as a Biosphere Zone. This would aim to build on the identity of the Fens as a unique area with a strong natural and cultural heritage linked to its rich peaty soils, waterways and wetlands, and network of historic cities, market towns and villages. Such a designation would recognise this value and an area of excellence in approaches to conservation and sustainable development.
In practical terms, the intention would be to use the Biosphere “brand” to develop a shared vision for the future of the Fens:
to attract new investment to grow and diversify the economy;
to bene�t local communities and reduce social inequalities;
to protect and invest in natural and cultural capital.
Within this, the intention is that the Biosphere would help develop understanding of how issues such as loss of peat and carbon emissions can be addressed, support community programmes to use resources wisely and reduce emissions, and showcase best practice in sustainable farming.
Source: Fens Biosphere: Big Skies, Big Vision, a brief for local authorities (www.fensbiosphere.org.uk)
215
Cambridgeshire & Peterborough Independent Commission on Climate Waste
The waste management strategy for the area is out-of-date and should be revisited as a matter of urgency. Plans should include the development, by June 2022, of a communication programme with the public for waste reduction, waste separation and recycling, building on existing activities.
The CPCA, Cambridgeshire County Council and Peterborough City Council, should collect data to enable the annual estimation and publication of estimates of emissions from waste collection and disposal services.
The Government should provide clarity as soon as possible on the provision of resources to local authorities to deliver changes required by the Environment Bill, including help with dealing with contractual revisions.
Roll-out of zero carbon collection vehicles should start in urban areas, as existing vehicles need replacement, aiming for full replacement by 2030. This will be aided by Government development of a national framework for the procurement of zero carbon collection vehicles, providing information on suppliers who can meet requirements (in the same way it currently has such a framework for diesel vehicles).
Recommendations
Overarching
1.
2.
3.
4.
5.
Waste
Reduction and re-useThere should be a target, across the CPCA area, for at least a 37% reduction in residual waste by 2030. Reduction in the amount of waste should also be supported by:
encouragement of the replication of good practice examples of re-use and repair activities across the area, e.g. measures to encourage repair cafes should be considered.
separate food waste collection- preparations should continue with a view to introduction as soon as possible.
use of procurement contracts by the CPCA and constituent authorities to specify stringent waste reduction and recycling targets of any local authority funded building work; the use of planning powers should be explored, to pursue these waste objectives in respect of building work more generally.
development of procurement policies to exclude single-use plastics, reduce excess packaging and specify recycled content.
The recycling rate target for household waste should be 65% by 2030 and the combined municipal recycling rate (household and commercial waste) target should be 70% by 2030.
Preparations need to be made now for the separate collection of recyclable and compostable materials.
New EfW plant should only go ahead with public agreement, and on the basis that the economic case stands up in the light of projections taking account of ambitious targets for waste reduction, resource e�ciency and recycling, and with CCS �tted from the outset.
Recycling
6.
7.
8.
Incineration and land�ll

216
Cambridgeshire & Peterborough Independent Commission on Climate Waste
9. Existing EfW waste plant should be retro�tted with CCS by 2035.
The potential for demonstration of methane oxidation through use of biocovers should be considered within the CPCA area.
10.
SummaryWaste emissions cannot be entirely eliminated. National policy measures will be important for emission reduction, but authorities in the CPCA area have key roles
Recycling rates for household waste collected across the CPCA area vary by district, but overall are above levels achieved in England
This performance is good, but there is substantial scope for improvement. Targets for reduced waste and higher recycling should be set for 2030
Implementation of requirements for increased separate collection of waste streams – under the national Resources and Waste Strategy – o�er potential to support increased recycling and reduced waste.
Achieving the bene�ts of separate collection will require the understanding and commitment of residents. The CPCA and constituent authorities must play a lead role in communicating the case for change and making the use of new services as consistent and easy as possible
Waste – a just transition
In our engagements with the Fens panel and with civil society groups from across Cambridgeshire and Peterborough (Chapter 3), we asked people what might prevent climate actions being implemented, and implemented in a fair way.
We did not explicitly raise “waste” as a focus of those discussions, but the need for a transition to a circular economy was mentioned by a number of participants.
Food waste, from households, supermarkets and business, was a concern for many participants, frequently raised as part of a wider issue concerning access to healthy, fresh and local food.
“Food waste is a real problem in this country (I think about a third of the food that is bought is wasted), so tackling that could allow us to use lower-intensity farming methods” (Fens panel participant)
Many participants also re�ected that understanding, awareness and willingness to move towards more sustainable and plant-based diets was a challenge, as people often don’t know what to cook. The Fens panel re�ected that it is still not clear enough for people on where they should shop and what to buy, especially at di�erent times of year, to make environmentally friendly purchases.
Ideas identi�ed by participants
Support local food distribution networks linking local food production, community farming and/or surplus food (e.g. from supermarkets) to people who need it, especially those living in food poverty
Change procurement in local government, businesses, schools, to procure more local, sustainable and plant-based food
Promote education of the carbon footprint of di�erent foods and seasonal produce.

217
Cambridgeshire & Peterborough Independent Commission on Climate Waste
Waste services and emissions in the Combined Authority Area
Overall emissions from waste
Waste emissions are predominantly methane, arising from the decomposition of biodegradable waste in land�ll sites in the absence of oxygen. Emissions also arise from the incineration of wastes, wastewater treatment (see Chapter 7) and biological treatment (mainly from composting and anaerobic digestion).
Nationally, waste accounted for 6% of total UK greenhouse gas emissions in 2018. Emissions have fallen by 63% since 1990, though they have plateaued recently, as recycling has levelled o� and emissions from Energy from Waste (EfW) plants have increased.
Emissions data for the CPCA area are not easily available. Non-CO2 emissions data are not routinely disaggregated to local authority level. CUSPE estimates1 suggest current waste management emissions of 107ktCO2e annually, but this would be only around 2% of overall CPCA area emissions, much lower than the UK share so we have reservations about the comparability of these �gures.
The CPCA, Cambridgeshire County Council and Peterborough City Council, should collect data to enable the annual estimation and publication of estimates of emissions from waste collection and disposal services.
Management of local authority collected waste
Across England as a whole, the proportion of waste disposal through incineration at energy from waste plants (EfW) has been rising. In 2019-20 EfW accounted for almost 45% of local authority collected waste.
Within the CPCA area the picture is very di�erent between Peterborough and Cambridgeshire County Council (which is the disposal authority for the 5 Cambridgeshire local authorities). For waste remaining after recycling and composting, Peterborough relies heavily on EfW, whereas Cambridgeshire relies on land�ll (Figure 10.1).
1 CUSPE (2019), Net Zero Cambridgeshire.
60
55
50
45
40
35
30
25
20
15
10
5
0
Pete
rbor
ough
Figure 10.1: Management of LA collected waste, 2019-20
Cam
brid
geCo
unty
Cou
ncil
Was
te %
CPCA
Are
a
Engl
and
Land�ll
Pete
rbor
ough
Cam
brid
geCo
unty
Cou
ncil
CPCA
Are
a
Engl
and
Incineration with EfW
Pete
rbor
ough
Cam
brid
geCo
unty
Cou
ncil
CPCA
Are
a
Engl
and
Recycled/ Composted
Pete
rbor
ough
Cam
brid
geCo
unty
Cou
ncil
CPCA
Are
a
Engl
and
Other
Source: Local Authority Collected Waste Statistics, Table 2, Management of LA Collected Waste, 2014-15 to 2019-20.
Notes: Other includes incineration without EfW, and waste treated-disposed through other unspeci�ed treatment processes as well as process and moisture loss
For residual waste requiring disposal, actions will be required to tackle emissions from incineration.

218
Cambridgeshire & Peterborough Independent Commission on Climate Waste
Recycling
For household waste, the recycling rate across Cambridgeshire is signi�cantly above the national average, though with substantial variation across the districts. The recycling rate for Peterborough is close to the England average (Figure 10.2).
60
55
50
45
40
35
30
25
20
15
10
5
0
Figure 10.2: Household waste recycling rate (%) 2019-20
Recy
clin
g Ra
te %
Greater Cambridge (Cambridge City and
South Cambridgeshire)
EastCambridgeshire
Fenland Huntingdon Cambridgeshire County Council
Peterborough England
Note: includes re-use and compostingSource: Local Authority Collected Waste Statistics, Table 3, Selected Waste Indicators, 2010-11 to 2019-20.
Cambridge is a centre for the use of Repair Cafes, aiming to link people with things to repair with people able to �x them (Box 10.1);
The Circular Peterborough initiative (Box 10.2) aims to apply circular economy principles – to promote use only of what we need, to maximise asset utilisation, and to eliminate waste – at a City level;
Peterborough Environment City Trust (PECT) is a Peterborough-based environment charity promoting sustainable practices. Amongst its portfolio of projects are “Cool Food”, helping households reduce their carbon emissions through small changes to shopping and eating habits, and “BLUEPRINT”, promoting the circular economy and increased household recycling.
Though this performance is good, there is scope for improvement. The 10 local authorities with the highest recycling rates in England achieve more than 60.5%.
There are good examples of local initiatives aimed at reducing waste and improving use of resources:
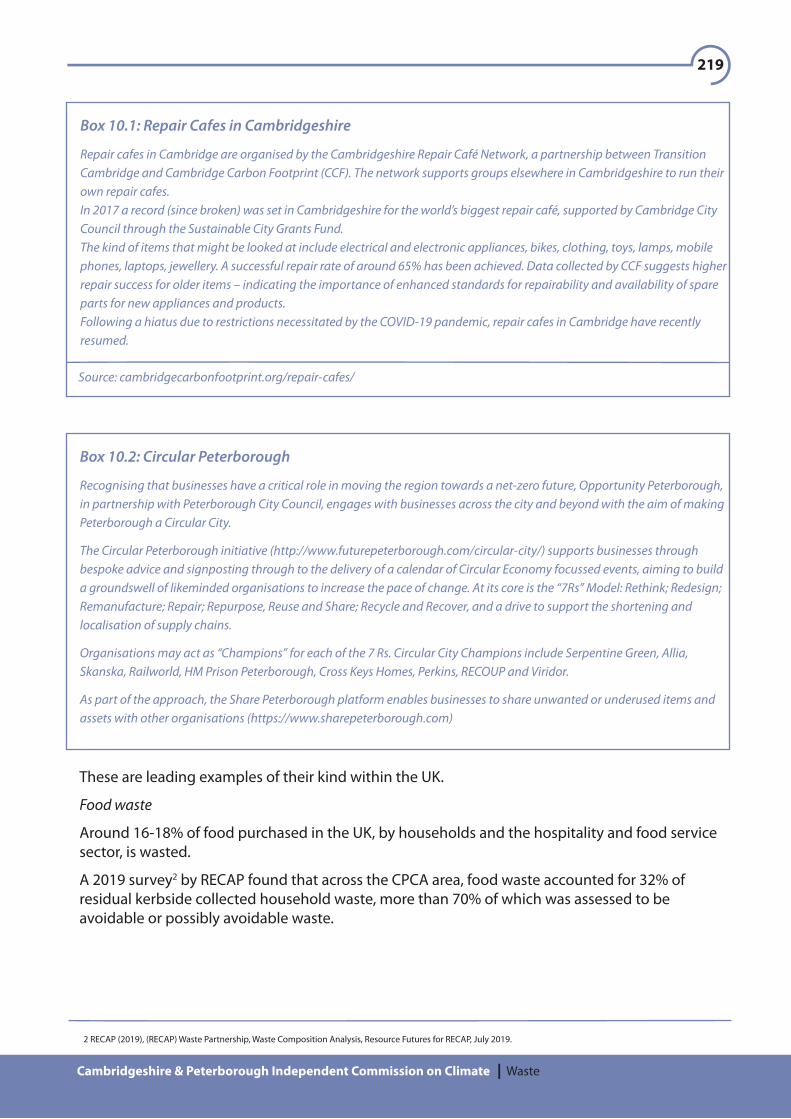
219
Cambridgeshire & Peterborough Independent Commission on Climate Waste
Box 10.1: Repair Cafes in Cambridgeshire
Repair cafes in Cambridge are organised by the Cambridgeshire Repair Café Network, a partnership between Transition Cambridge and Cambridge Carbon Footprint (CCF). The network supports groups elsewhere in Cambridgeshire to run their own repair cafes.In 2017 a record (since broken) was set in Cambridgeshire for the world’s biggest repair café, supported by Cambridge City Council through the Sustainable City Grants Fund.The kind of items that might be looked at include electrical and electronic appliances, bikes, clothing, toys, lamps, mobile phones, laptops, jewellery. A successful repair rate of around 65% has been achieved. Data collected by CCF suggests higher repair success for older items – indicating the importance of enhanced standards for repairability and availability of spare parts for new appliances and products.Following a hiatus due to restrictions necessitated by the COVID-19 pandemic, repair cafes in Cambridge have recently resumed.
Source: cambridgecarbonfootprint.org/repair-cafes/
Box 10.2: Circular Peterborough
Recognising that businesses have a critical role in moving the region towards a net-zero future, Opportunity Peterborough, in partnership with Peterborough City Council, engages with businesses across the city and beyond with the aim of making Peterborough a Circular City.
The Circular Peterborough initiative (http://www.futurepeterborough.com/circular-city/) supports businesses through bespoke advice and signposting through to the delivery of a calendar of Circular Economy focussed events, aiming to build a groundswell of likeminded organisations to increase the pace of change. At its core is the “7Rs” Model: Rethink; Redesign; Remanufacture; Repair; Repurpose, Reuse and Share; Recycle and Recover, and a drive to support the shortening and localisation of supply chains.
Organisations may act as “Champions” for each of the 7 Rs. Circular City Champions include Serpentine Green, Allia, Skanska, Railworld, HM Prison Peterborough, Cross Keys Homes, Perkins, RECOUP and Viridor.
As part of the approach, the Share Peterborough platform enables businesses to share unwanted or underused items and assets with other organisations (https://www.sharepeterborough.com)
These are leading examples of their kind within the UK.
Food waste
Around 16-18% of food purchased in the UK, by households and the hospitality and food service sector, is wasted.
A 2019 survey2 by RECAP found that across the CPCA area, food waste accounted for 32% of residual kerbside collected household waste, more than 70% of which was assessed to be avoidable or possibly avoidable waste.
2 RECAP (2019), (RECAP) Waste Partnership, Waste Composition Analysis, Resource Futures for RECAP, July 2019.
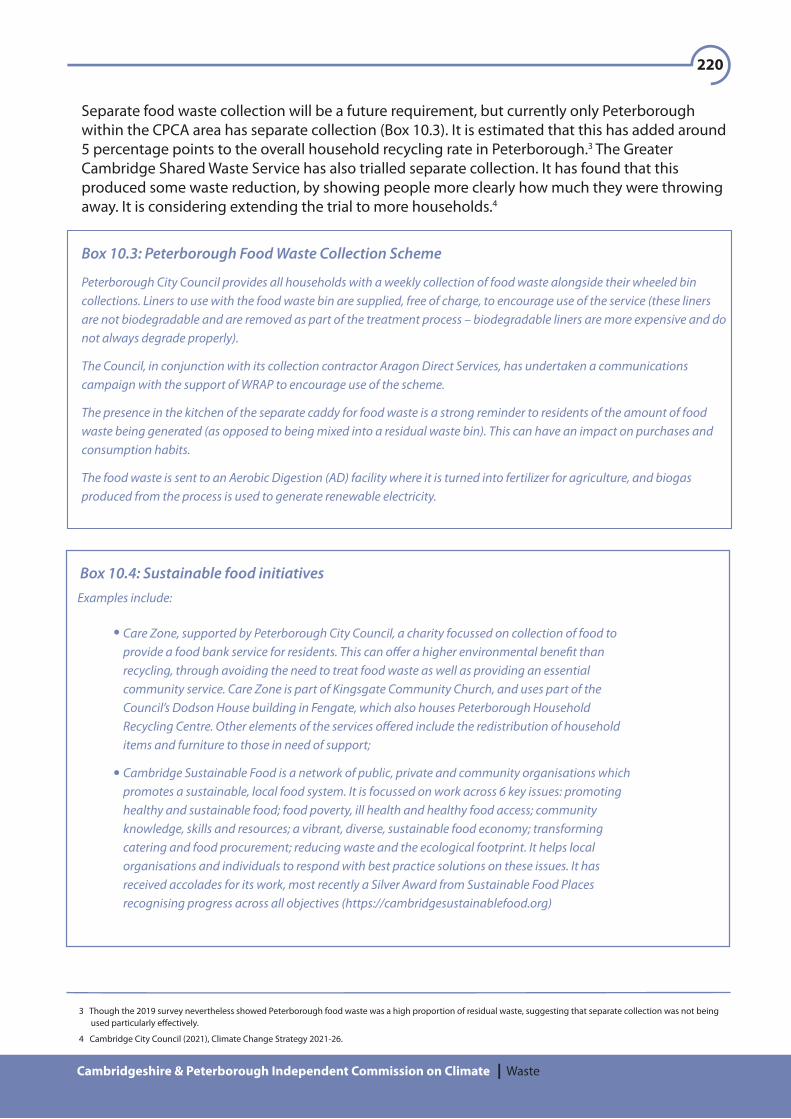
220
Cambridgeshire & Peterborough Independent Commission on Climate Waste
Separate food waste collection will be a future requirement, but currently only Peterborough within the CPCA area has separate collection (Box 10.3). It is estimated that this has added around 5 percentage points to the overall household recycling rate in Peterborough.3 The Greater Cambridge Shared Waste Service has also trialled separate collection. It has found that this produced some waste reduction, by showing people more clearly how much they were throwing away. It is considering extending the trial to more households.4
Box 10.3: Peterborough Food Waste Collection Scheme
Peterborough City Council provides all households with a weekly collection of food waste alongside their wheeled bin collections. Liners to use with the food waste bin are supplied, free of charge, to encourage use of the service (these linersare not biodegradable and are removed as part of the treatment process – biodegradable liners are more expensive and do not always degrade properly).
The Council, in conjunction with its collection contractor Aragon Direct Services, has undertaken a communications campaign with the support of WRAP to encourage use of the scheme.
The presence in the kitchen of the separate caddy for food waste is a strong reminder to residents of the amount of food waste being generated (as opposed to being mixed into a residual waste bin). This can have an impact on purchases and consumption habits.
The food waste is sent to an Aerobic Digestion (AD) facility where it is turned into fertilizer for agriculture, and biogas produced from the process is used to generate renewable electricity.
Box 10.4: Sustainable food initiatives
Care Zone, supported by Peterborough City Council, a charity focussed on collection of food to provide a food bank service for residents. This can o�er a higher environmental bene�t than recycling, through avoiding the need to treat food waste as well as providing an essential community service. Care Zone is part of Kingsgate Community Church, and uses part of the Council’s Dodson House building in Fengate, which also houses Peterborough Household Recycling Centre. Other elements of the services o�ered include the redistribution of household items and furniture to those in need of support;
Cambridge Sustainable Food is a network of public, private and community organisations which promotes a sustainable, local food system. It is focussed on work across 6 key issues: promoting healthy and sustainable food; food poverty, ill health and healthy food access; community knowledge, skills and resources; a vibrant, diverse, sustainable food economy; transforming catering and food procurement; reducing waste and the ecological footprint. It helps local organisations and individuals to respond with best practice solutions on these issues. It has received accolades for its work, most recently a Silver Award from Sustainable Food Places recognising progress across all objectives (https://cambridgesustainablefood.org)
Examples include:
3 Though the 2019 survey nevertheless showed Peterborough food waste was a high proportion of residual waste, suggesting that separate collection was not being used particularly e�ectively.
4 Cambridge City Council (2021), Climate Change Strategy 2021-26.
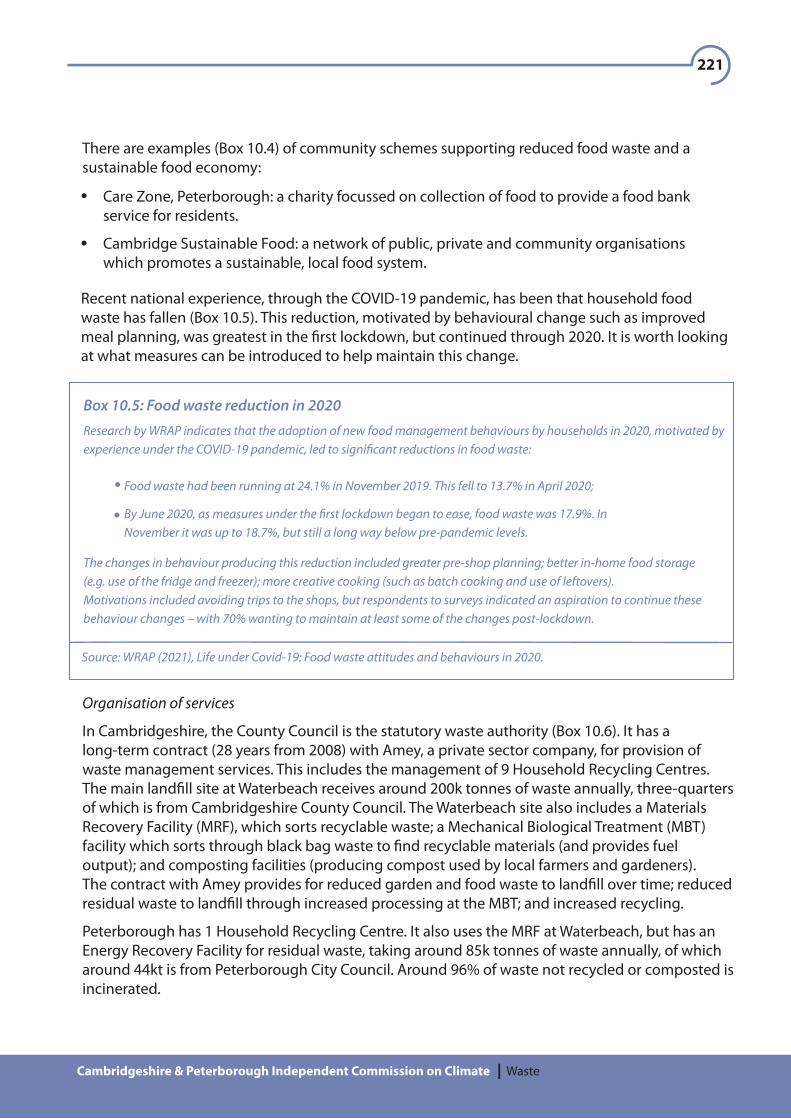
221
Cambridgeshire & Peterborough Independent Commission on Climate Waste
Care Zone, Peterborough: a charity focussed on collection of food to provide a food bank service for residents.
Cambridge Sustainable Food: a network of public, private and community organisations which promotes a sustainable, local food system.
Recent national experience, through the COVID-19 pandemic, has been that household food waste has fallen (Box 10.5). This reduction, motivated by behavioural change such as improved meal planning, was greatest in the �rst lockdown, but continued through 2020. It is worth looking at what measures can be introduced to help maintain this change.
Organisation of services
In Cambridgeshire, the County Council is the statutory waste authority (Box 10.6). It has a long-term contract (28 years from 2008) with Amey, a private sector company, for provision of waste management services. This includes the management of 9 Household Recycling Centres.The main land�ll site at Waterbeach receives around 200k tonnes of waste annually, three-quarters of which is from Cambridgeshire County Council. The Waterbeach site also includes a Materials Recovery Facility (MRF), which sorts recyclable waste; a Mechanical Biological Treatment (MBT) facility which sorts through black bag waste to �nd recyclable materials (and provides fuel output); and composting facilities (producing compost used by local farmers and gardeners).The contract with Amey provides for reduced garden and food waste to land�ll over time; reduced residual waste to land�ll through increased processing at the MBT; and increased recycling.
Peterborough has 1 Household Recycling Centre. It also uses the MRF at Waterbeach, but has an Energy Recovery Facility for residual waste, taking around 85k tonnes of waste annually, of which around 44kt is from Peterborough City Council. Around 96% of waste not recycled or composted is incinerated.
Box 10.5: Food waste reduction in 2020
Food waste had been running at 24.1% in November 2019. This fell to 13.7% in April 2020;
By June 2020, as measures under the �rst lockdown began to ease, food waste was 17.9%. In November it was up to 18.7%, but still a long way below pre-pandemic levels.
Research by WRAP indicates that the adoption of new food management behaviours by households in 2020, motivated by experience under the COVID-19 pandemic, led to signi�cant reductions in food waste:
The changes in behaviour producing this reduction included greater pre-shop planning; better in-home food storage (e.g. use of the fridge and freezer); more creative cooking (such as batch cooking and use of leftovers). Motivations included avoiding trips to the shops, but respondents to surveys indicated an aspiration to continue these behaviour changes – with 70% wanting to maintain at least some of the changes post-lockdown.
Source: WRAP (2021), Life under Covid-19: Food waste attitudes and behaviours in 2020.
There are examples (Box 10.4) of community schemes supporting reduced food waste and a sustainable food economy:

222
Cambridgeshire & Peterborough Independent Commission on Climate Waste
5 RECAP (2008), Joint Municipal Waste Management Strategy for Cambridgeshire and Peterborough 2008-2022.
Box 10.6: Cambridgeshire County Council waste management
deal with Cambridgeshire waste within Cambridgeshire;
keep products, equipment and infrastructure in use longer;
reduce the transport of waste;
increase the productivity of waste resources;
increase opportunities of the repurposing of waste into new products.
Cambridgeshire County Council is the statutory waste authority for Cambridgeshire.
Circular economy principles are key to the County Council strategy in relation to waste. The aim is to:
Source: Cambridgeshire County Council (2020), Climate Change and Environment Strategy
Peterborough is alone amongst the authorities within CPCA in having separate food waste collection. This is sent to Anaerobic Digestion (AD), producing a nutrient rich fertiliser for agricultural use, and biogas for electricity generation. In the other authorities, food waste may be collected with garden waste and goes to the In-Vessel Composter at Waterbeach, but relatively little is collected in this way (most goes in with general black bag waste to the MBT).
The Cambridgeshire and Peterborough Waste Partnership (RECAP) brings together the County Council, the 5 District and City Councils within Cambridgeshire, and Peterborough City Council. This is based on a voluntary agreement aimed at facilitating close working to improve waste management services. It is not a decision-making body and does not supersede the speci�c responsibilities of the County Council and Peterborough City Council as Waste Disposal Authorities, and the district and city councils as Waste Collection Authorities.
Each district and city council has its own arrangements in place for household (kerbside) collections, and for services to local businesses (with Cambridge and South Cambridgeshire combined in the Greater Cambridge Shared Waste Service).
The RECAP strategy, set out for the period 2008-2022, is now very dated. It includes a target for 55-65% of household waste to be recycled or composted by 2020. Its website indicates that 52.47% was achieved in 2018-19.

223
Cambridgeshire & Peterborough Independent Commission on Climate Waste
What has the Climate Change Committee (CCC) recommended?
The CCC balanced pathway, consistent with economy-wide achievement of net zero emissions by 2050, includes waste reductions and increased recycling:
a 33% reduction in non-food waste by 2037;
a 52% reduction in (per capita) food waste by 2030, 61% reduction by 2050;
an increase in the re-use and recycling rate for household waste from 45% currently to 50% in 2025 and 56% by 2050;
an increase in combined (household and commercial) re-use and recycling rate from 52% currently to 68% in 2030, maintained at around this level to 2050.
Overall, waste emissions in this scenario fall by around 78% to 2050. It is not possible to achieve zero emissions from the sector, re�ecting residual emissions from wastewater treatment, composting and land�ll; inability to capture all (5%) EfW emissions; and that some clinical and chemical waste incineration remains.
The overall strategy (Box 10.7) to achieve these emissions reductions requires a move away from disposal at land�ll and EfW towards a reduction in waste arisings, and collection of separated resources for reuse and recycling. For business and the economy more widely, the emphasis is on a step change towards a circular economy, with minimisation of waste through design, increased product lifespans and a focus on repair and re-use.
Accelerate investment plans for LAs to put in place universal municipal waste recycling collections, along with downstream recycling, composting & AD facilitiesPolicies to support 68% recycling rate by 2030Mandatory business food waste reporting by 2022
Ban biodegradable waste 2025Must be su�cient recycling, composting & AD treatment capacity before 2025 to avoid signi�cant increase in EfWBan all waste to land�ll 2040Policies and funding for increased methane capture & oxidation
Decarbonisation should be an Ofwat core principle, supporting water utilities ambition for net zero by 2030Roll out advanced ADFund demonstration of novel treatment processesIncentivise industrial wastewater plants to reduce process emissions
Examine impact of waste reduction and recycling targets on need & utilisation of EfW plantsGuidance to align LA waste contracts and planning policy to these targetsNew waste conversion plants must be built with CCS or CCS readyRetro�t CCS from late 2020s and complete by 2050
Waste reduction & recycling
Wastewater
Land�ll
Energy from waste
Box 10.7: CCC policy requirement to reduce waste emissions (England)

224
Cambridgeshire & Peterborough Independent Commission on Climate Waste
Government policy
Government policy has been set out in a series of announcements and consultations.The Circular Economy Package (August 2020) identi�es steps for waste reduction, and long-term targets for recycling. Where they are separately collected, it bans certain materials from land�ll (plastic, metals, glass, paper) unless having gone through treatment, land�ll is the best environmental outcome.
Consultation on a Waste Prevention Programme for England (March 2021) includes proposals for Extended Producer Responsibility for several key waste streams; new product standards and product information to re�ect how recyclable and repairable a product us; and a plastics tax and new charges on certain single-use plastic items.
The Environment Bill contains provisions to deliver the 2018 Resources and Waste Strategy:
More consistent recycling collections from households and businesses, starting 2023, covering food waste, plastics, paper and card, metal packaging and glass, and garden waste from households. Separate collection of food waste will be required, and other separate collection where possible.
Producer responsibility on packaging will be extended – the more recyclable the packaging the smaller the fee that will be paid;
A deposit return scheme for drinks containers is to be introduced;
A municipal recycling rate of 65% is to be targeted for 2035, with less than 10% municipal waste to land�ll.
The Industrial Decarbonisation Strategy (March 2021) recognises that there are barriers to energy and resource e�ciency in industry that need to be addressed – awareness and prioritisation given risks to disrupting operations; access to expertise and advice; �nancial incentives to adopt circular solutions. The Strategy indicates that the introduction of low-carbon product standards and labelling will be explored; and sets up a new £30m UKRI Circular Economy Research Programme to work with industry to develop new resource e�ciency approaches.
The Government has also committed to mandatory food waste reporting by business.
Weaknesses in the Government’s policy position re�ect lack of urgency in timetables and the limited ambition for some measures:
The Resources and Waste Strategy needs acceleration, and greater ambition for e�ciency in manufacturing and construction;
Materials collection proposals in the Environment Bill will need secondary legislation before they become mandatory. The Extended Producer Responsibility Schemes are not expected to start for a number of years.
Investment plans to allow municipal waste recycling collections, along with downstream recycling, composting and AD facilities, need acceleration;
The commitment to end the land�lling of food waste should be extended to allbiodegradable waste;
Growing emissions from EfW need to be addressed. Measures to reduce waste to land�ll are welcome, but without strategic investment in recycling and re-use, waste will be increasingly diverted to incineration with EfW.
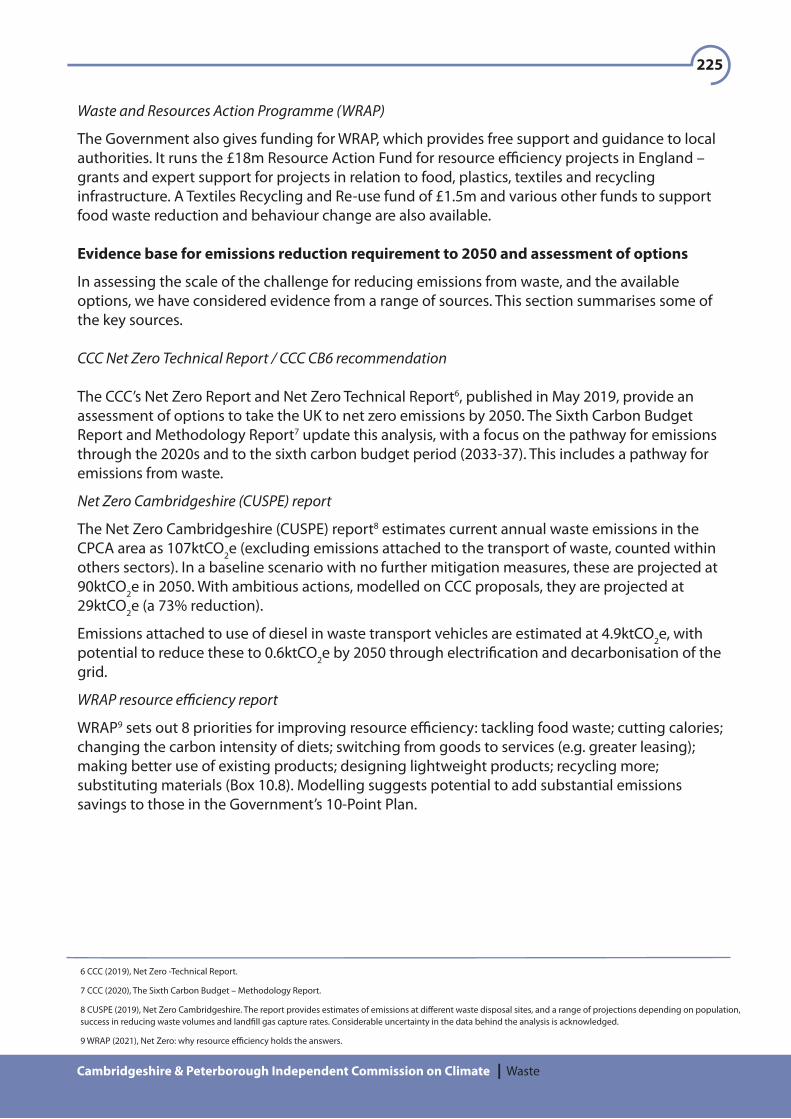
225
Cambridgeshire & Peterborough Independent Commission on Climate Waste
Waste and Resources Action Programme (WRAP)
The Government also gives funding for WRAP, which provides free support and guidance to local authorities. It runs the £18m Resource Action Fund for resource e�ciency projects in England – grants and expert support for projects in relation to food, plastics, textiles and recycling infrastructure. A Textiles Recycling and Re-use fund of £1.5m and various other funds to support food waste reduction and behaviour change are also available.
Evidence base for emissions reduction requirement to 2050 and assessment of options
In assessing the scale of the challenge for reducing emissions from waste, and the available options, we have considered evidence from a range of sources. This section summarises some of the key sources.
CCC Net Zero Technical Report / CCC CB6 recommendation
The CCC’s Net Zero Report and Net Zero Technical Report6, published in May 2019, provide an assessment of options to take the UK to net zero emissions by 2050. The Sixth Carbon Budget Report and Methodology Report7 update this analysis, with a focus on the pathway for emissions through the 2020s and to the sixth carbon budget period (2033-37). This includes a pathway for emissions from waste.
Net Zero Cambridgeshire (CUSPE) report
The Net Zero Cambridgeshire (CUSPE) report8 estimates current annual waste emissions in the CPCA area as 107ktCO2e (excluding emissions attached to the transport of waste, counted within others sectors). In a baseline scenario with no further mitigation measures, these are projected at 90ktCO2e in 2050. With ambitious actions, modelled on CCC proposals, they are projected at 29ktCO2e (a 73% reduction).
Emissions attached to use of diesel in waste transport vehicles are estimated at 4.9ktCO2e, with potential to reduce these to 0.6ktCO2e by 2050 through electri�cation and decarbonisation of the grid.
WRAP resource e�ciency report
WRAP9 sets out 8 priorities for improving resource e�ciency: tackling food waste; cutting calories; changing the carbon intensity of diets; switching from goods to services (e.g. greater leasing); making better use of existing products; designing lightweight products; recycling more; substituting materials (Box 10.8). Modelling suggests potential to add substantial emissions savings to those in the Government’s 10-Point Plan.
6 CCC (2019), Net Zero -Technical Report.
7 CCC (2020), The Sixth Carbon Budget – Methodology Report.
8 CUSPE (2019), Net Zero Cambridgeshire. The report provides estimates of emissions at di�erent waste disposal sites, and a range of projections depending on population, success in reducing waste volumes and land�ll gas capture rates. Considerable uncertainty in the data behind the analysis is acknowledged.
9 WRAP (2021), Net Zero: why resource e�ciency holds the answers.
226
Cambridgeshire & Peterborough Independent Commission on Climate Waste
National Food Strategy
The recently published National Food Strategy10 includes some coverage of food waste and related recommendations to Government.
Over one quarter of the food grown in the UK is never eaten. Just under one-third of that is wasted before it leaves the farm gate. Of the waste beyond the farm gate, around 70% is the responsibility of households, 18% manufacturers, 10% the hospitality and food industries, and 2% retailers.
The report notes that the UK is committed to a reduction in food waste of 50% below 2007 levels by 2030 (of which around half has been achieved so far), but that the CCC targets a 60% reduction by 2050.
Recommendations include: mandatory annual reporting by large food companies (over 250 employees) of sales and amount of food waste; and trial of a “Community Eatwell” programme, to support those on lower incomes to improve diets.
The Government has yet to respond.
10 NFS (2021), National Food Strategy – Independent Review, July 2021.
Box 10.8: Resource e�ciency priorities
Tackling food waste: through mandatory food waste reporting, support for collaborative business action and citizen behaviour change; and food businesses committing to halve food waste by 2030;
Cutting calories and carbon: a reduction in average calorie intake from 2900/day currently to 2500;
Changing the carbon intensity of food: the carbon footprint of the UK food and drink sector is estimated at around 30% of UK territorial emissions. Measures to reduce this include the improved measurement of supply-chain emissions, and campaigns aimed at behaviour change to increase lower carbon foods in our diets;
Switching from goods to services: through increased leasing (of cars and clothing for example), and product-speci�c Extended Producer Responsibility;
Better use of existing products: extended life of products through reuse, repair and remanufacturing;
Design of lightweight products: for example, for vehicles and construction;
Recycle more: greater reprocessing of wastes in the UK could save 16mtCO2e, create 60,000 jobs and add £8bn to GVA;
Substituting materials: introduce standards for the whole life carbon footprint of buildings and infrastructure, and use of building regulations, planning policy and public procurement to increase use of wood and other biomaterials.
Work by WRAP and the Centre for Research into Energy Demand Solutions (CREDS) suggests 8 priorities:
Source: WRAP (2021), Why resource e�ciency holds the answers.

227
Cambridgeshire & Peterborough Independent Commission on Climate Waste
Key areas for action
There is a substantial challenge for local authorities to achieve reductions in waste and increased recycling consistent with net zero ambition. Recycling rates have plateaued in recent years, though there is scope to increase them further.
Achieving the bene�ts of consistent separate waste collection and the diversion of biodegradable waste from land�ll needs planning for, and investment in enhanced collection and recycling facilities.
Waste disposal should follow the hierarchy: reduction; reuse, recycling, composting and AD, before incineration and land�ll. We cover these areas below, but there are some overarching issues to consider �rst.
Overarching
The RECAP Waste Management Strategy is very dated. Given the net zero ambition, policy developments and new data, it should be revisited and an updated strategy developed as soon as possible.
The County Council is tied into a long-term contract for waste management, that almost certainly contains provisions that would not be entered into today if starting from a clean slate. It is possible, for example, that volumes of waste to the MBT facility at Waterbeach will not reach the levels guaranteed by the contract. The Government has acknowledged that changes required by the Environment Bill waste and resources strategy are likely to impose costs on local authorities. Costs are likely to include costs from amending current contract provisions. The Government should provide clarity as a matter of urgency on the provision of resources to local authorities consequent on required changes.
In taking forward a new resources and waste strategy, taking account of the new requirements of the Waste Prevention Programme and Environment Bill, we expect that RECAP will look to as much consistency across the constituent authorities as possible. That seems sensible. We understand that options to combine further the collection and disposal authorities – in e�ect, to give RECAP a decision-making role – have previously been considered and rejected. Whether there are savings and enhanced e�ectiveness from such a move should be kept under review.
It is clear that waste collection will need to move to zero carbon vehicles. Trials have begun in some areas, including the purchase of 1 electric vehicle by the Greater Cambridge Waste Service (which is considering the purchase of 2 more). There is considerable local authority interest in taking this further, but also concern about costs and suitability in more rural areas, where greater range is required.
Purchase of high speci�cation electric vehicles for waste collection is an issue for local authorities across England. It would make sense for the Government to develop a national framework for the procurement of such vehicles, providing information on suppliers who can meet requirements, in the same way it currently has such a framework for diesel vehicles.
Pending such a framework, introduction of zero carbon vehicles should be planned for as existing vehicles need replacing, but it will make sense to begin roll-out with vehicles used in urban areas.

228
Cambridgeshire & Peterborough Independent Commission on Climate Waste
Grant funding from central Government has been provided elsewhere to support this transition11 and the availability of funding through such sources should be kept under review.
Achievement across the CPCA area of waste reductions and increased recycling is dependent on public behaviour. There will be a need for the CPCA and constituent authorities to take a lead in communicating the case for change with the public, building on existing activities. The Climate Change Strategy in Cambridge,12 for example, notes the gap between the national recycling rate recommended by the CCC for 2030 (70%) and the current level achieved in Greater Cambridge (51% in 2019). It acknowledges potential to improve, but says that this will need buy-in from residents. Extended communications e�orts across the CPCA area should include:
improving understanding of what can be recycled and reducing the contamination of waste streams;
supporting planning of healthy meals with reduced waste;
promoting the use and extension of community schemes for re-use and repair (building on the examples of good practice within the area currently).
Without building up these activities, it is unlikely that the full bene�ts of separate collection will be realised. The bene�ts of action should stress the potential for cost savings from reducing waste, as well as the environmental case.
Reduction and re-use
The success of the Cambridge Repair Cafes is indicative of a public demand for repair and re-use that is currently, largely, unmet. The CPCA and constituent authorities should consider how this kind of example could be replicated throughout the region. Measures to encourage repair cafes should be considered (for example, zero business rates), and the CPCA should engage with further education providers to review development of courses on appliance repair.
Speci�c consideration should be given to measures to reduce food waste and construction waste.
Food waste
Separate food waste collection will be required by the Environment Bill, but currently – other than trials in Greater Cambridge - there is no such separate collection within Cambridgeshire.
Separate food waste collection will take this waste out of the black bag stream going to the MBT at Waterbeach. This could threaten the viability of the MBT, so is one of the contractual changes with �nancial implications which will need to be covered. Options for dealing with the food waste are:
11 Under the Hydrogen for Transport Programme, for example, plans were announced in September 2020 to support a green hydrogen refuelling station and hydrogen-powered refuse vehicles in Glasgow. The �rst vehicle is expected to be delivered in January 2022, with 19 operational by October 2022, the largest �eet of its type globally.
12 Cambridge City Council (2021), Climate Change Strategy 2021-26.
13 Open windrow composting is used for processing garden waste in either an open air environment or within large covered areas, where the material can break down in the presence of oxygen.
to collect separately but mix back in with garden waste at the In-Vessel Composter;
fund a new anaerobic digester facility (and consider open windrow composting13 for
garden waste, rather than the In-Vessel Composter).
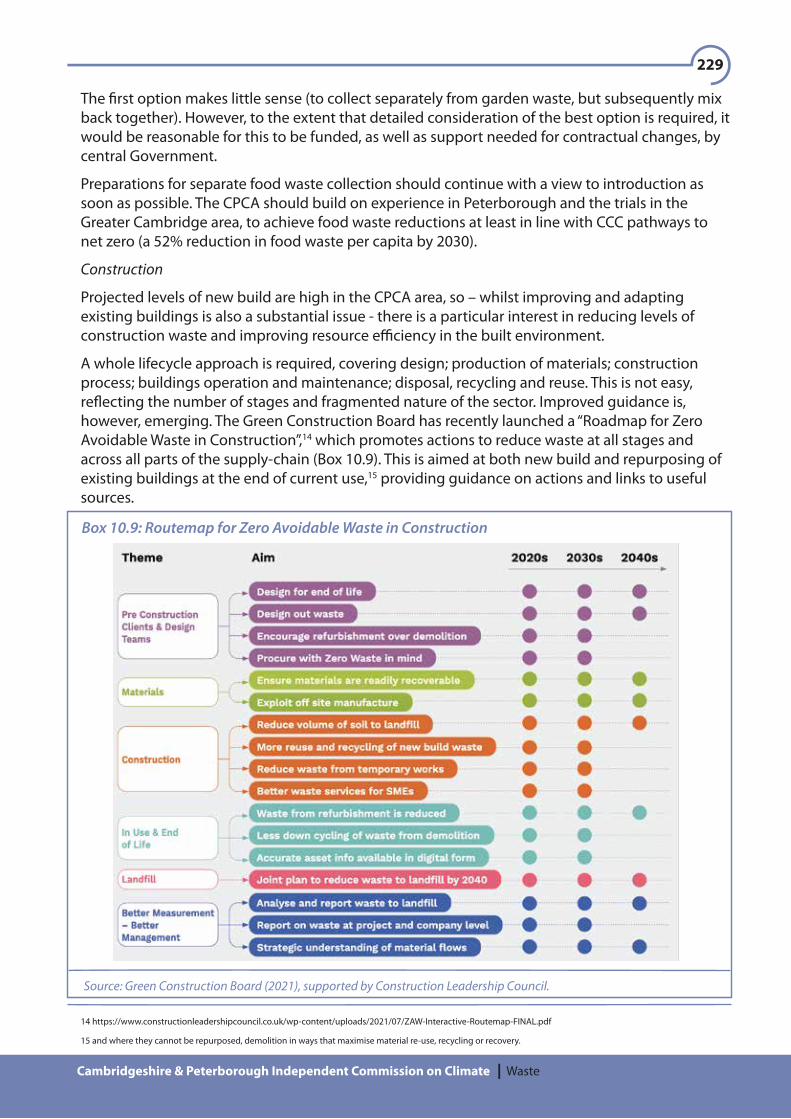
229
Cambridgeshire & Peterborough Independent Commission on Climate Waste
The �rst option makes little sense (to collect separately from garden waste, but subsequently mix back together). However, to the extent that detailed consideration of the best option is required, it would be reasonable for this to be funded, as well as support needed for contractual changes, by central Government.
Preparations for separate food waste collection should continue with a view to introduction as soon as possible. The CPCA should build on experience in Peterborough and the trials in the Greater Cambridge area, to achieve food waste reductions at least in line with CCC pathways to net zero (a 52% reduction in food waste per capita by 2030).
Construction
Projected levels of new build are high in the CPCA area, so – whilst improving and adapting existing buildings is also a substantial issue - there is a particular interest in reducing levels of construction waste and improving resource e�ciency in the built environment.
A whole lifecycle approach is required, covering design; production of materials; construction process; buildings operation and maintenance; disposal, recycling and reuse. This is not easy, re�ecting the number of stages and fragmented nature of the sector. Improved guidance is, however, emerging. The Green Construction Board has recently launched a “Roadmap for Zero Avoidable Waste in Construction”,14 which promotes actions to reduce waste at all stages and across all parts of the supply-chain (Box 10.9). This is aimed at both new build and repurposing of existing buildings at the end of current use,15 providing guidance on actions and links to useful sources.
14 https://www.constructionleadershipcouncil.co.uk/wp-content/uploads/2021/07/ZAW-Interactive-Routemap-FINAL.pdf
15 and where they cannot be repurposed, demolition in ways that maximise material re-use, recycling or recovery.
Box 10.9: Routemap for Zero Avoidable Waste in Construction
Source: Green Construction Board (2021), supported by Construction Leadership Council.
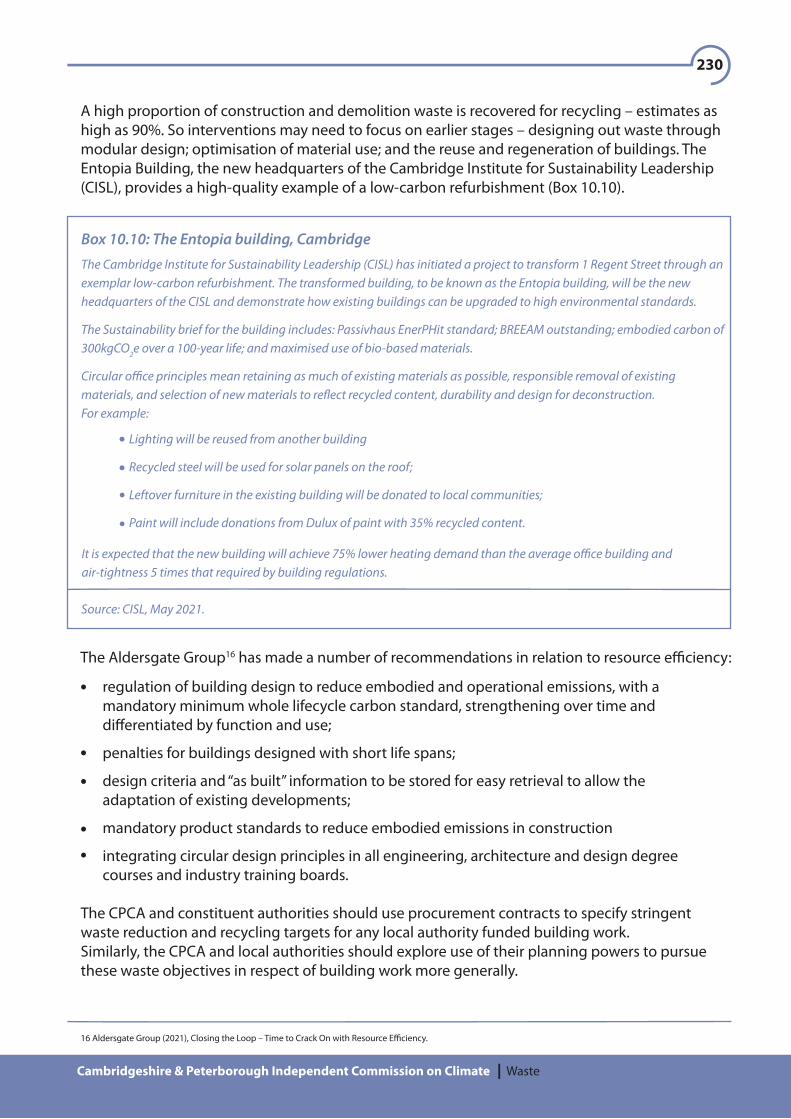
230
Cambridgeshire & Peterborough Independent Commission on Climate Waste
A high proportion of construction and demolition waste is recovered for recycling – estimates as high as 90%. So interventions may need to focus on earlier stages – designing out waste through modular design; optimisation of material use; and the reuse and regeneration of buildings. The Entopia Building, the new headquarters of the Cambridge Institute for Sustainability Leadership (CISL), provides a high-quality example of a low-carbon refurbishment (Box 10.10).
regulation of building design to reduce embodied and operational emissions, with a mandatory minimum whole lifecycle carbon standard, strengthening over time and di�erentiated by function and use;
penalties for buildings designed with short life spans;
design criteria and “as built” information to be stored for easy retrieval to allow the adaptation of existing developments;
mandatory product standards to reduce embodied emissions in construction
integrating circular design principles in all engineering, architecture and design degree courses and industry training boards.
16 Aldersgate Group (2021), Closing the Loop – Time to Crack On with Resource E�ciency.
Box 10.10: The Entopia building, Cambridge
Lighting will be reused from another building
Recycled steel will be used for solar panels on the roof;
Leftover furniture in the existing building will be donated to local communities;
Paint will include donations from Dulux of paint with 35% recycled content.
The Cambridge Institute for Sustainability Leadership (CISL) has initiated a project to transform 1 Regent Street through an exemplar low-carbon refurbishment. The transformed building, to be known as the Entopia building, will be the new headquarters of the CISL and demonstrate how existing buildings can be upgraded to high environmental standards.
The Sustainability brief for the building includes: Passivhaus EnerPHit standard; BREEAM outstanding; embodied carbon of 300kgCO2e over a 100-year life; and maximised use of bio-based materials.
Circular o�ce principles mean retaining as much of existing materials as possible, responsible removal of existing materials, and selection of new materials to re�ect recycled content, durability and design for deconstruction. For example:
Source: CISL, May 2021.
It is expected that the new building will achieve 75% lower heating demand than the average o�ce building and air-tightness 5 times that required by building regulations.
The Aldersgate Group16 has made a number of recommendations in relation to resource e�ciency:
The CPCA and constituent authorities should use procurement contracts to specify stringent waste reduction and recycling targets for any local authority funded building work. Similarly, the CPCA and local authorities should explore use of their planning powers to pursue these waste objectives in respect of building work more generally.

231
Cambridgeshire & Peterborough Independent Commission on Climate Waste
17 Aldersgate Group (2021), Closing the Loop – Time to Crack On with Resource E�ciency.
18 There are examples of this already. Cambridge City Council encourages the use of sustainable food principles in catering contracts and food procurement.
Recycling, composting and AD
Recycling rates for household waste in Cambridgeshire are signi�cantly above the England average. In Peterborough they are close to the average. The current RECAP strategy set a target of 55-65% by 2020. We consider that an appropriate target should now be set at the top end of that range, 65% by 2030. This would be a little above the level targeted by the CCC at national level, but broadly in line with the very best local authority rates achieved currently.
In relation to combined levels of recycling across household and non-household waste, the CCC suggests that the average rate across England will need to increase from around 52% currently to 68% in 2030. The Government’s Resources and Waste Strategy/Circular Economy Package targets 74% non-household municipal recycling by 2035. Given that CPCA currently achieves better than the England average for household recycling, it would be appropriate for the CPCA to aim for at least 70% for this combined recycling rates by 2030.
There is a need to prepare for the separate collection of recyclable and compostable materials from 2023.
The CPCA and constituent authorities have an important role in leading by example. The Aldersgate Group17 has proposed that the Government should develop criteria for public procurement to drive demand for products with high resource e�ciency standards (building, for example, on the European Commission Green Public Procurement framework, which covers products including textiles, food and furniture). Even in the absence of this, local authorities should consider development of procurement policies to exclude single-use plastics, reduce excess packaging and specify recycled content. Contracts for public sector catering could be directed at contractors committed to minimise waste.18
Anaerobic digestion is likely the best option for food waste that cannot be prevented. This is used by disposal authorities currently, and there are private sector examples to emulate (Box 10.11).
Box 10.11: Anaerobic Digestion (AD) plant at Ely
Shropshire Energy UK Ltd owns AD plant situated at Plantation farm, near Littleport – a Combined Heat and Power (CHP) plant with generation capacity of 3MW.
The plant is used primarily to meet the heat and power demand of the Littleport Mushroom Farm, with any surplus energy exported to the grid. Without powering the Mushroom Farm, the AD site has the capacity to export 2.4GW to the grid, enough to power around 4,500 homes annually.
The plant is primarily fed with forage maize, grown by Cambs Farms Growers, part of the G’s Group. Cambs Farm Growers use regenerative agriculture techniques based on principles of cover cropping, grazing of sheep, limited to no soil disturbance and reduced or no arti�cial fertilisers, to produce pro�table energy crops with a limited carbon footprint. Maize consumption for the plant is around 40,000t per year. Any supplementary or additional feedstocks for the AD plant are waste/out of grade radishes from the Littleport packhouse, waste beer and rice bran (both as occasional feed).
232
Cambridgeshire & Peterborough Independent Commission on Climate Waste
Incineration and land�ll
Increasing emissions from EfW plants is a national issue – it is di�cult to see how targets for emission reduction can be achieved if this trend continues. Within Cambridgeshire, private sector providers have and are considering potential for new EfW plant. Planning permission for EfW at Waterbeach was recently refused, but a proposal for an EfW CHP plant at Wisbech is being developed by MVV Environment Ltd. Local authorities are statutory consultees for the proposal, but the decision will be for the Secretary of State for Business, Energy and Industrial Strategy.
The building of new EfW plant is a sensitive issue for local residents. Concern about the prospective new incinerator was expressed at a number of the consultations we held to explore issues attached to a just transition (Chapter 3). The Sustainability Appraisal Scoping Report for the Oxford-Cambridge Arc,19 despite noting that waste management and disposal capacity across the Arc is su�cient for the current and projected populations, suggests that there is potential for new EfW plants that deliver CHP. That case needs to be fully tested, against ambitious scenarios, consistent with national and CPCA ambitions for net zero, which take account of what can be achieved in terms of waste reduction, resource e�ciency and increased recycling.
Carbon capture and storage (CCS) �tted at EfW plant could capture 90-95% of �ue gas CO2. The CCC net zero scenarios envisage that all existing EfW plant is �tted with CCS by 2050, with roll-out starting in the late 2020s. Existing EfW plant in the CPCA area must be �tted with CCS on this timeline. If there is any new EfW plant it should be �tted with CCS from the outset.
CCC scenarios include the use of biocovers at land�ll sites to increase methane oxidation. The potential for demonstration of methane oxidation through use of biocovers should be considered within the CPCA area.
What does it mean if we take these actions?
Taking actions to reduce emissions from waste generation and management in the CPCA area has potential wider bene�ts. These include:
measures to reduce food waste can produce food cost savings, with health bene�ts attached also to improved diet and meal planning;
moving towards a circular economy has implications for resource e�ciency and improved materials use, with e�ciency and cost savings and bene�ts for the natural environment;
improved co-ordination of services across authorities and reduced waste generation, has cost saving potential in waste collection services. Alongside the value of recycled materials, savings can help reduce the possible cost of enhanced separate waste collection.
19 HMG (2021), Oxford-Cambridge Arc Spatial Framework: Sustainability Appraisal Scoping Report.