fairfax county, virginia · 1 includes inventory outside submarket areas, 1980-2000 only. 2 ln some...
TRANSCRIPT

REAL ESTATE REPORTREAL ESTATE REPORTMidyear 2007
Fairfax County, Virginia
AT A GLANCEOffice MarketInventory: 106,327,368 s.f.Vacancy Rates Direct: 8.5% w/Sublet: 10.2% Absorption Gross: 4,624,760 s.f. Relet: 3,505,967 s.f. Sublet: 509,197 s.f. New: 609,596 s.f.Construction: 4,672,153 s.f.Delivered: 1,573,164 s.f. Demolished: 300,597 s.f.
Industrial/Flex MarketInventory: 38,662,732 s.f.Vacancy Rates Direct: 7.2% w/Sublet: 8.0%Absorption Gross: 1,195,875 s.f. Relet: 926,181 s.f. Sublet: 114,731 s.f. New: 154,963 s.f.Construction: 67,011 s.f.Delivered: 199,469 s.f.
Hotel MarketHotels: 86Rooms: 15,641Construction: 3 properties/ 434 rooms
INSIDEOffice MarketCountywide trends 2–11 Leasing activity 3–6 Building sales 7 Construction activity 8–9Submarket trends 10
Commercial Condominium Market 11
Industrial/Flex MarketCountywide trends 12–15 Construction activity 13 Leasing activity 14–15 Building sales 15Submarket trends 16
Hotel Market 17
Using This Report Glossary 18Submarket map 18
FCEDA Resources 19
Large Blocks of Space
Long & Foster’s new headquarters in Chantilly—285,000 square feet scheduled for March 2008 delivery.
• The number of office buildings with large blocks of available office space increased for the first time in nearly five years. There were 39 buildings countywide with 50,000 square feet (s.f.) or more of available contiguous space at midyear 2007, up from 34 buildings at the close of 2006.
• Ten of the 34 properties available at yearend 2006 were removed due to leasing activity that occurred during the first half of 2007. Fifteen new buildings were added to the midyear total, includ-ing seven office buildings that delivered during the first half of the year.
• The majority of large blocks of available space fall into the 50,000- to 150,000-square-foot range. Tenants searching for blocks of space over 150,000 s.f. are limited to eight buildings in the county. Of those, only two buildings offer space in excess of 200,000 s.f.
• Large blocks of office space could be found in 10 of the county’s 22 office submarkets at midyear 2007. Five submarkets had at least one building containing 150,000 s.f. or more of available space. As expected, Reston (nine buildings) and Tysons Corner (eight buildings) led all submarkets with nearly 44 percent of all buildings in the county with 50,000 s.f. or more of available space. The Chantilly (seven buildings) and Dulles (six buildings) submarkets experienced an increase in large blocks of space due in large part to new building deliveries during the first half of 2007. At midyear, five new office buildings had delivered in the Chantilly submarket and two had delivered in the Dulles submarket. Three of these seven buildings were over 150,000 s.f.
• The increase in the number of large blocks of available office space is expected to continue well into 2008, based on current office construction activity. At midyear 2007, there were nine office buildings with 100,000 s.f. or more of available space due to deliver by yearend 2007 and an additional 11 buildings total-ing roughly 2 million s.f. due to deliver during 2008. It is highly unlikely that all of the 18 build-ings currently under construction will deliver without at least some preleasing prior to completion.
• The upside to the increase in the number of large blocks of space is that the county has a wider variety of new space options throughout the county to offer potential relocation and expansion prospects.
Large Blocks of Available Office Space (s.f.)Number of Blocks Available by Reporting Period
18
58
44312
36Fairfax County
50,000–99,999
100,000–199,999
200,000+
6280
5645
2836
2626
2936
2615
Yearend 2001
Yearend 2002
Yearend 2003
Yearend 2004
Yearend 2005
Yearend 2006
Midyear 2007
24
9
34
19
14
39
19

2 Real Estate Report—Midyear 2007 © Fairfax County Economic Development Authority
Direct Standing Vacancy Total New Relet Total Direct New Relet Year Inventory Rate (%) Leased Leased Leased Available Available Available
1980 20,567,000 1.7 1,400,000 N/A N/A 343,086 279,539 63,547 1981 27,900,000 2.9 2,623,579 1,486,919 146,046 810,950 439,406 371,544 1982 30,750,000 4.5 2,639,313 1,193,946 451,186 1,374,534 866,906 507,628 1983 32,100,000 2.9 2,312,379 1,414,951 360,211 933,012 366,792 566,220 1984 35,100,000 7.3 3,318,178 1,706,050 562,293 2,558,566 2,018,716 539,850 1985 42,800,000 9.4 5,107,357 3,719,570 440,487 4,036,662 3,283,319 753,343 1986 48,700,000 9.4 5,889,741 3,908,799 339,682 4,555,065 3,119,637 1,435,428 1987 53,616,000 8.8 5,475,880 3,651,588 942,557 4,701,055 3,087,638 1,613,417 1988 58,073,000 10.8 5,014,401 3,046,598 1,004,913 6,263,547 3,818,738 2,444,809 1989 63,575,000 15.2 5,973,710 3,224,384 1,353,114 9,645,834 4,227,527 5,418,307 1990 67,139,000 18.3 5,006,377 2,202,932 2,424,145 12,255,516 5,118,433 7,137,083 1991 72,702,000 16.8 5,535,950 2,374,087 3,141,863 12,185,419 3,829,149 8,356,270 1992 73,056,000 14.8 4,854,778 1,433,064 3,421,714 10,788,508 2,652,612 8,135,896 1993 74,397,000 12.4 5,272,604 1,393,415 3,879,189 9,201,590 1,409,847 7,791,743 1994 75,562,432 9.9 6,306,117 1,290,152 5,015,965 7,490,605 651,098 6,839,507 1995 76,074,620 8.5 5,261,893 498,137 4,763,756 6,458,580 308,062 6,150,518 1996 78,265,573 6.2 7,040,085 1,316,827 5,723,258 4,908,932 77,775 4,831,157 1997 79,617,676 4.3 6,196,885 1,959,447 4,237,438 3,390,293 19,177 3,371,116 1998 82,088,287 4.1 6,991,158 3,810,783 3,180,375 3,392,909 531,855 2,861,054 1999 88,375,053 4.8 9,264,808 5,910,855 3,353,953 4,238,492 1,340,336 2,898,156 2000 93,563,753 3.5 12,750,968 6,918,762 5,832,206 3,236,371 1,007,213 2,229,158 2001 97,602,908 6.4 5,174,234 2,606,024 2,568,210 6,281,688 2,312,291 3,969,397 2002 100,912,347 12.1 7,648,790 1,022,910 2,631,385 12,176,938 3,291,394 8,885,544 2003 101,507,385 11.2 10,570,315 1,788,402 4,898,701 11,393,801 1,870,915 9,522,886 2004 102,117,697 8.6 10,969,819 1,762,757 6,028,830 8,764,801 919,191 7,845,610 2005 103,520,646 7.8 9,659,060 537,974 5,920,239 8,054,510 1,053,457 7,001,053 2006 105,054,801 7.7 10,805,683 2,249,86 7,569,360 8,115,057 1,155,235 6,959,822 2007 106,327,368 8.5 4,624,760 609,596 3,505,967 9,069,214 1,839,134 7,230,080
Office Market Countywide Trends Midyear 2007
Office Space Trends: 1980–2007 (Square Feet)
1 2
1 Includes inventory outside submarket areas, 1980-2000 only.2 ln some years, total leasing reflects the preleasing of buildings under construction and about to be constructed, as well as new and relet space.3 As of June 30, 2007.
• The countywide office inventory topped 106.3 mil-lion square feet (s.f.) at midyear. Adjustments to the inventory were made due to the addition of nearly 1.6 million s.f. of new office space and the removal of roughly 300,000 s.f. of space that was demolished during the reporting period.
• The direct vacancy rate increased for the second straight reporting period to 8.5 percent, up from 7.7 percent at year’s end. The overall vacancy rate, including sublet space, jumped nearly a point from 9.2 percent at yearend to 10.2 percent at midyear.
• Gross absorption increased slightly during the first half of 2007 to 4.6 million s.f., up from 4.5 million s.f. recorded during the last half of 2006. Absorption of relet space was mostly unchanged at 3.5 million s.f. or roughly 76 percent of all leasing activity. Sublet absorp-tion increased by 58 percent to just over 500,000 s.f., or 11 percent of all leasing activity. Absorption of new space declined by nearly 10 percent to 607,000 s.f.
• Available office space, including sublet space, topped 10.8 million s.f. at midyear, up from 9.7 million s.f. at the close of 2006. The amount of available office space increased in all categories during the first six months of 2007.
• As expected, leasing activity remained sluggish during the first quarter of the year and picked up pace near midyear. If this trend continues, expect an active third quarter of leasing activity. New office deliveries during the first half doubled from the previous reporting period and are expected to increase during the last half of of the year. Lease rates remained stable for the most part, increasing slightly in some markets in class A office space. The vacancy rate is expected to increase by year’s end due in large part to the increase in new space deliveries, but should stabilize in early 2008.
Countywide Office Space Trends: 1980–2007Inventory and Vacancy Rates
1980
1981
1982
1983
1984
1985
1986
1987
1988
1989
1990
1991
1992
1993
1994
1995
1996
1997
1998
1999
2000
2001
2002
2003
2004
2005
2006
2007
(as
of Ju
ne 3
0)
110 mil
100 mil
90 mil
80 mil
70 mil
60 mil
50 mil
40 mil
30 mil
20 mil
10 mil
00
5
10
15
20
SquareFeet
VacancyRate (%)
Vacancy rate includes sublet space (figures available for 2001–2007 only)
3

© Fairfax County Economic Development Authority Real Estate Report—Midyear 2007 3
Office Leasing Activity, First Half 2007
Tenant Building Address Submarket Square Feet
Abdul Communications 7023 Professional Building 7023-7025 Little River Turnpike Annandale 1,180Abraxas Campus South 1875 Campus Commons Drive Reston 6,083Agent Logic Westwood 2 8603 Westwood Center Drive Tysons Corner 13,672Agilex Technologies Parkstone Place 5155 Parkstone Drive Chantilly 76,391Allstate Insurance One Monument Place 12150 Monument Drive Fairfax Center 3,190Alltech Title 7023 Professional Building 7023-7025 Little River Turnpike Annandale 1,740Altura ParkEast Corporate Center 1 14150 Park East Circle Chantilly 4,506America Funding 1749 Old Meadow Road Tysons Corner 4,752American College of Radiology Audubon 2 1892 Preston White Drive Reston 16,948American Home Mortgage Sunrise Plaza 1 12355 Sunrise Valley Drive Reston 4,098American Mortgage Center Brookfield Corporate Center 1 4500 Daly Drive Chantilly 1,710American Press, LLC Centennial Plaza 2-A 8381 Old Courthouse Road Tysons Corner 1,390AOC Solutions, Inc. Glenview I 14151 Newbrook Drive Chantilly 2,270Apple, Inc. Two Fountain Square 11921 Freedom Drive Reston 22,678Applied Computing Technologies Springfield Corporate Center 6225 Brandon Avenue Springfield 3,730Applied Systems Research, Inc. One Monument Place 12150 Monument Drive Fairfax Center 4,200Arc Management 8150 Leesburg Pike Tysons Corner 1,330Archwood Mortgage Oakwood Center 11781 Lee-Jackson Highway Fairfax Center 2,725ArcTech Corporate Pointe 1 14100 Park Meadow Drive Chantilly 9,185Artax McIlvaine Building 6201 Leesburg Pike Seven Corners 1,200Auto Desk 8201 Greensboro Drive Tysons Corner 6,939Barbeion East 1 1943 Isaac Newton Square Reston 12,473Barrier Investments 1451 Dolley Madison Boulevard McLean/Great Falls 2,136Boeing Logistics Fairfax Ridge 11242 Waples Mill Road Fairfax Center 37,818Booz Allen Hamilton Metro Park 5 6363 Walker Lane Franconia 4,723Boulevard Café Greensboro Park 8180 Greensboro Drive Tysons Corner 2,892Brillient Corp. Reston Business Park 11417 Sunset Hills Road Reston 1,645C&F Mortgage Fair Lakes 1 12500 Fair Lakes Circle Fairfax Center 4,535CAI West Building 7600A Leesburg Pike Tysons Corner 3,490Cambridge Systems Corp. Glenview II 14155 Newbrook Drive Chantilly 20,000Capital Hospice 6565 Arlington Boulevard Seven Corners 2,862Capital Office Solutions Tycon 3 8229 Boone Boulevard Tysons Corner 4,510Carbon Thompson Development Three Dulles Tech Center 13650 Dulles Technology Drive Dulles 4,578Centennial Contractors Enterprises, Inc. Tysons Tower I 8500 Leesburg Pike Tysons Corner 1,685Center for Equal Opportunity Crescent Plaza 7700-7704 Leesburg Pike Tysons Corner 1,110Cerner Corp. Courthouse Centre 1953 Gallows Road Tysons Corner 10,103Charlie Company, LLC Cascades East 12007 Sunrise Valley Drive Reston 1,756Chevy Chase Bank Brookfield Corporate Center 2 4506 Daly Drive Chantilly 9,620Childrens Hospital 6565 Arlington Boulevard Seven Corners 12,013Circuit City Forbes Building 8001 Forbes Place Springfield 3,281
Office Market Countywide Trends Midyear 2007
Major Lease Transactions Top 10 Office Lease Deals in First Half 2007 (Square Feet)
113,000
104,883
100,000
100,000
91,000
85,000
76,391
55,000
50,000
Northrop Grumman/TASC / Chantilly
XO Communications / Dulles
Proxicom / Reston
Inphonic / Reston
EMC Corp. / Tysons Corner
Serco / Reston
Agilex Technologies / Chantilly
Navy Federal Credit Union / Herndon
DRS Technologies, Inc. / Herndon
College of Radiology / Reston
60,582
• During the first half of 2007, overall office leasing activity experienced a meager 2.4 percent increase over the previous reporting period. Although leasing activity appears to have cooled over the past year, the six-month totals are off by only 8.6 percent from the five-year average of 5 million square feet (s.f.) of activity per period.
• Ten deals topped 50,000 s.f., including four that exceed-ed 100,000 s.f. While the top 10 deals occurred in five separate submarkets, the majority were concentrated in the western part of the county. Nine of the top ten deals took place in the Chantilly, Dulles, Herndon and Reston submarkets. Deals of 50,000 s.f. or more have been slowly moving west due to the increased avail-ability of large blocks of space there.
• While the federal government and government-related contractors still play a key role in overall leasing activity, the information technology and telecommunications sectors dominated major lease transactions, capturing five of the top 10 deals during the first half of 2007. The most notable defense-related deal took place at Westfields, where Northrup Grumman/TASC preleased 113,000 s.f. and broke ground on TASC V.
• The submarkets in the western portion of the county—Reston, Chantilly and Dulles in particular—should see the bulk of the larger deals in the near future. At midyear, 56 percent of the existing available space (more than 50,000 s.f.) was located in these three submarkets. That percent-age is expected to increase by year’s end when nine new buildings—each totaling over 100,000 s.f.—are scheduled to deliver.

4 Real Estate Report—Midyear 2007 © Fairfax County Economic Development Authority
Office Market Countywide Trends Midyear 2007
Tenant Building Address Submarket Square Feet
Citizant, Inc. Wynwood Ph. 1 Bldg. A 5180 Parkstone Drive Chantilly 21,295Clearspring Warren Building 8000 Westpark Drive Tysons Corner 7,590College of Radiology 11180 Sunrise Valley Drive Reston 50,000Comprehensive Health Services, Inc. Parkridge Center 3 10701 Parkridge Boulevard Reston 44,800Compucom Reston/Herndon Centre 1 131 Elden Street Herndon 1,756Continental Security 5350 Shawnee Road Springfield 4,200COPT Property Management North Tower 1751 Pinnacle Drive Tysons Corner 1,120Cor Concepts 8201 Greensboro Drive Tysons Corner 1,667Council of Landscape Architectural Reg. Board Fairfax Executive Park 3949 Pender Drive Fairfax Center 2,360Cranial Technologies, Inc. Woodburn Medical Park 1 3299 Woodburn Road Merrifield 6,500Cravers, Mathews & Smith Towers Crescent/A 8000 Towers Crescent Drive Tysons Corner 5,000Crawford & Co. One Monument Place 12150 Monument Drive Fairfax Center 16,624Cricket Technologies Reston Office Campus 12310 Pinecrest Road Reston 2,990Degnon Associates Old McLean Village 6720-6732 Old McLean Village Drive McLean/Great Falls 1,960Dr. Kaplan Grant Building 1651 Old Meadow Road Tysons Corner 5,832DRS Technologies, Inc. Monument III @ Worldgate 12930 Worldgate Drive Herndon 55,000DTRI Executive Center 2 1835 Alexander Bell Drive Reston 20,027Early, Cassidy & Shilling 1840 Michael Faraday Drive Reston 3,608East West Holdings, LLC Tysons Pond 2 1604 Spring Hill Road Tysons Corner 25,000Ebix Corporate Oaks 2 607 Herndon Parkway Herndon 13,303eKohs, Inc. Herndon Corporate Center Bldg. A 1175 Herndon Parkway Herndon 2,781EMC Corp. Westpark Corporate Center II 8444 Westpark Drive Tysons Corner 91,000English School South Building 2812 Old Lee Highway Merrifield 2,500Equity Vision Mortgage The Ponds at Lafayette 1 4229 Lafayette Center Drive Chantilly 1,350Fairfax Radiological Center Dunn Loring Center 2722-2724 Merrilee Drive Merrifield 5,100FCW Government Technology Group 3141 Fairview Park Drive Merrifield 9,899Federal Home Loan Bank SoMA - East Building 1818 Library Street Reston 26,000Ferris, Baker, Watts, Inc. Tysons Executive Plaza 2 2010 Corporate Ridge Tysons Corner 5,000Gap Solutions Tall Oaks Professional Building 12054 North Shore Drive Reston 7,500General Dynamics CFC Building 2201 Cooperative Way Dulles 20,000Genex Solutions Annandale Square 4314-4324 Evergreen Lane Annandale 1,100Geologics Corp. Poplar Run Office Park 5 5285 Shawnee Road Springfield 8,700Global Education Center Centrelee Bldg. 3 14637 Lee Highway Centreville 2,500GO Member Monroe Business Center 4 580 Herndon Parkway Herndon 2,292Goldstone Technologies Westwood 2 8603 Westwood Center Drive Tysons Corner 3,170GSA Poplar Run Office Park 5 5285 Shawnee Road Springfield 20,690GSA One Skyline Place 5205 Leesburg Pike Baileys Crossroads 13,016GSA Albemarle Point Building 3 14426 Albemarle Point Place Chantilly 9,950GSA One Skyline Place 5205 Leesburg Pike Baileys Crossroads 1,964Haley & Aldrich Park Place 1 7926 Jones Branch Drive Tysons Corner 5,776Hartford Fire Insurance Poplar Run Office Park 5 5285 Shawnee Road Springfield 9,590Haynes Whaley Associates Campus Commons 4 1881 Campus Commons Drive Reston 8,193Haynes Whaley Associates 1943 Isaac Newton Square Reston 6,039Hollar & Co. Plaza America II 11710 Plaza America Drive Reston 3,055Home Properties Tycon 3 8229 Boone Boulevard Tysons Corner 7,886Honeywell Campus at Dulles Tech 6 13655 Dulles Technology Drive Dulles 2,250Hopwood Financial Services Elysce Building 10135 Colvin Run Road Great Falls 2,010HSP Direct Dulles Corporate Center 1 13755 Sunrise Valley Drive Dulles 2,460HydroGeologic, Inc. Sunset Corporate Plaza 1 11107 Sunset Hills Road Reston 33,294IJC Virginia, LLC 8201 Greensboro Drive Tysons Corner 1,280InfinityQS International One RidgeView 14900 Conference Center Drive Chantilly 12,054Innolog North Tower 1751 Pinnacle Drive Tysons Corner 15,725INOVA Pediatric Center Woodburn Medical Park 1 3299 Woodburn Road Merrifield 4,910INOVA Physical Therapy Tycon 1 8320 Old Courthouse Road Tysons Corner 2,920Inovative Workflow Engineering Westwood 2 8603 Westwood Center Drive Tysons Corner 1,810Inphonic 11190 Sunrise Valley Drive Reston 100,000Inphonic Reston Quadrangle 11130 Sunrise Valley Drive Reston 29,180IXI Corp. Lancaster Building 7927 Jones Branch Drive Tysons Corner 18,231Jackson Lewis Westwood Tower 8614 Westwood Center Drive Tysons Corner 17,940Janus Metro Park 5 6363 Walker Lane Franconia 5,513JPI Apartment Development 8300 Greensboro Drive Tysons Corner 21,963Juniper Networks Plaza Ridge I 2251 Corporate Park Drive Dulles 10,000K12, Inc. South Pointe II 2300 Corporate Park Drive Dulles 6,930Keller Williams Realty Metro Park 3 6354 Walker Lane Franconia 6,122Keller Williams Realty 8521 Leesburg Pike Tysons Corner 4,130Knac Holdings Lewinsville Office Building 7601 Lewinsville Road Tysons Corner 2,800L-3 Communications Corp. Independence Center 2 15040 Conference Center Drive Chantilly 28,960LaborLogix, Inc. 11720 Sunrise Valley Drive Reston 11,442Lanpher Wilson Reston Association Building 1930 Isaac Newton Square Reston 4,913LCC International, Inc. Atrium Building 7900A Westpark Drive Tysons Corner 24,343LeapFrog Solutions Oakton Corporate Center 3 10467 White Granite Drive Oakton 4,528LJT & Associates Van Buren Business Park 4 512 Herndon Parkway Herndon 2,200Mascot Books Crossroads of Dulles D 1033 Sterling Road Herndon 1,500

© Fairfax County Economic Development Authority Real Estate Report—Midyear 2007 5
Tenant Building Address Submarket Square Feet
McAfee Park North 2355 Dulles Corner Boulevard Dulles 9,011McMunn Associates Presidents Plaza 2 198 Van Buren Street Herndon 8,847Medical Depot Beacon Hill Office Building 6911 Richmond Highway Richmond Highway 1,500Merlin International Centennial Plaza 2-A 8381 Old Courthouse Road Tysons Corner 4,631Metron One Fountain Square 11911 Freedom Drive Reston 2,050MHM Services, Inc. The Concourse East 1593 Spring Hill Road Tysons Corner 37,150Miles & Stockbridge, PC North Tower 1751 Pinnacle Drive Tysons Corner 2,362Mobile Posse Johnson Building 1 7600 Colshire Drive Tysons Corner 2,180Molinaro Kroger, Inc. Towers Crescent/A 8000 Towers Crescent Drive Tysons Corner 16,840Mortgage Asset Research Institute Atrium at Worldgate 205 Van Buren Street Herndon 9,292Mortgage Electronic Registration System (MERS) SoMA – East Building 1818 Library Street Reston 25,000Mortgage Investments Group Providence Building 6521 Arlington Boulevard Seven Corners 13,600MPOWERMEDIA Access National Bank Building 1800 Robert Fulton Drive Reston 4,156MS Center of Greater Washington Tycon 1 8320 Old Courthouse Road Tysons Corner 3,600MSGI One Skyline Place 5205 Leesburg Pike Baileys Crossroads 6,489Mulvanny Architecture Westpark Corporate Center 1 8484 Westpark Drive Tysons Corner 11,924Navigation Arts Shenandoah Building 7901 Jones Branch Drive Tysons Corner 13,910Navy Federal Credit Union Worldgate Plaza II 12851 Worldgate Drive Herndon 60,582netForensics SCS Engineers Building 11260 Roger Bacon Drive Reston 2,900NetStar-1, Inc. Five Skyline Place 5111 Leesburg Pike Baileys Crossroads 11,820Network Appliance Greensboro Corporate Center 2 8405 Greensboro Drive Tysons Corner 5,380New Market Investors, LLC Westwood 2 8603 Westwood Center Drive Tysons Corner 1,270NHC Johnson Building 1 7600 Colshire Drive Tysons Corner 16,831NICB Hyatt Plaza 1 12701 Fair Lakes Circle Fairfax Center 2,210NII Holdings SoMA – West Building 1875 Explorer Street Reston 26,000Niksoft Systems Corp. Fairway Executive Center 1984 Isaac Newton Square Reston 4,150NJVC, LLC Westwood Tower 8614 Westwood Center Drive Tysons Corner 12,693Northrop Grumman Greenwood Plaza Building 12015 Lee-Jackson Highway Fairfax Center 41,924Northrop Grumman Lincoln Building 1700 Old Meadow Road Tysons Corner 14,730Northrop Grumman 2340 Dulles Corner Boulevard Dulles 8,554Northrop Grumman/TASC TASC V 4807 Stonecroft Boulevard Chantilly 113,000Online Resources Meadows 4 4795 Meadow Wood Lane Chantilly 21,689Philip Leopold Poplar Run Office Park 5 5285 Shawnee Road Springfield 6,340Powers, Brown Architecture Towers Crescent/A 8000 Towers Crescent Drive Tysons Corner 2,991Powersolv, Inc. Oakbranch Plaza 1801 Robert Fulton Drive Reston 1,530Prime Axis Two Reston Overlook 12021 Sunset Hills Road Reston 2,340Prime Pay ParkEast Corporate Center 1 14150 Parkeast Circle Chantilly 4,845Prospective, Inc. SoMA – West Building 1875 Explorer Street Reston 26,000Prosperity Pharmacy 3026 Javier Road Merrifield 3,400Proxicom 11180 Sunrise Valley Drive Reston 100,000Proxicom Campus West 1902 Campus Commons Drive Reston 20,114Real Networks Morino Institute 11600 Sunrise Valley Drive Reston 36,000Reality Mobile, LLC Dulles Gateway I 13921 Park Center Drive Dulles 4,620Red Mortgage Capital One Fountain Square 11911 Freedom Drive Reston 10,212Regency Centers, LP Tysons International Plaza 2 1919 Gallows Road Tysons Corner 15,577RemedyTemp, Inc. Greensboro Park 8200 Greensboro Drive Tysons Corner 3,945Richards Construction 11411-11425 Isaac Newton Square Reston 9,770Rock Creek Productions Herndon Corporate Center Bldg. A 1175 Herndon Parkway Herndon 1,766Roselle Alternative Care USAA Building 8550 Arlington Boulevard Merrifield 6,720RS Information Brunswick Building 7921 Jones Branch Drive Tysons Corner 1,742Sage Communications Tycon 3 8229 Boone Boulevard Tysons Corner 6,060Sage Software SpaceNet Building 1750 Old Meadow Road Tysons Corner 30,074Sager, Inc. 7023 Professional Building 7023-7025 Little River Turnpike Annandale 1,150SAIC Four Skyline Place 5113 Leesburg Pike Baileys Crossroads 3,295Salesforce.com Morino Institute 11600 Sunrise Valley Drive Reston 3,700SAVVIS Park North 2355 Dulles Corner Boulevard Dulles 48,351Seabury Airline Planning Group Tysons International Plaza 2 1919 Gallows Road Tysons Corner 6,292Secure It Campus West 1902 Campus Commons Drive Reston 5,770Serco SoMA – East Building 1818 Library Street Reston 85,000SETA Corp. Two Skyline Place 5203 Leesburg Pike Baileys Crossroads 17,797Sharp Travel Washington 7023 Professional Building 7023-7025 Little River Turnpike Annandale 1,380Siemens One Monument Place 12150 Monument Drive Fairfax Center 2,301Sitefusion Tysons Dulles Plaza 2 1430 Spring Hill Road Tysons Corner 2,418Smart Choice Settlements Merrion Square 7353 McWhorter Place Annandale 3,200Smith Micro Monroe Business Center 6 590 Herndon Parkway Herndon 3,708Solers, Inc. One RidgeView 14900 Conference Center Drive Chantilly 13,861Solutions Made Simple, Inc. 11720 Sunrise Valley Drive Reston 3,493Sourcefire Tysons International Plaza 2 1919 Gallows Road Tysons Corner 7,290Spatial Data Analytics Corp. (SPADAC) Brunswick Building 7921 Jones Branch Drive Tysons Corner 35,079Sphere of Influence 8150 Leesburg Pike Tysons Corner 3,478STMC Tycon 5 8230 Old Courthouse Road Tysons Corner 2,795Supply Chain Fairfax Executive Park 3959 Pender Drive Fairfax Center 1,623Surety, LLC Reston Plaza 2 12020 Sunrise Valley Drive Reston 4,842
Office Market Countywide Trends Midyear 2007
6 Real Estate Report—Midyear 2007 © Fairfax County Economic Development Authority
Office Market Countywide Trends Midyear 2007
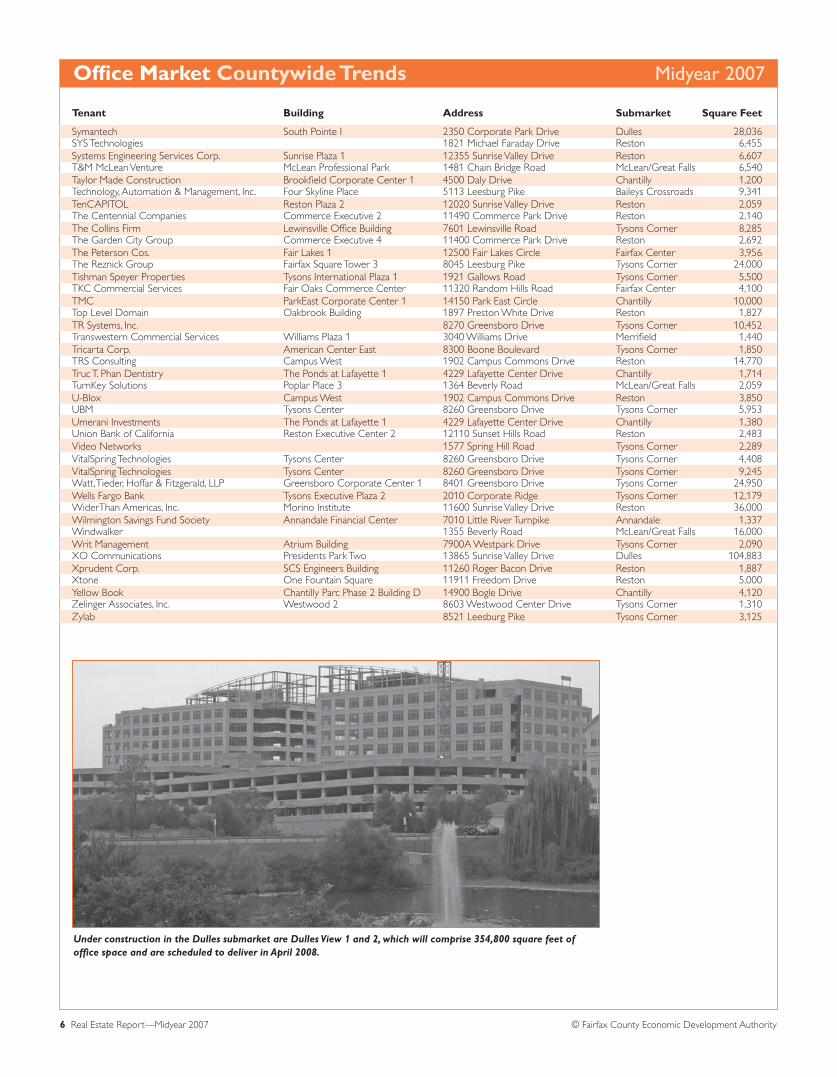
Under construction in the Dulles submarket are Dulles View 1 and 2, which will comprise 354,800 square feet of office space and are scheduled to deliver in April 2008.
Tenant Building Address Submarket Square Feet
Symantech South Pointe I 2350 Corporate Park Drive Dulles 28,036SYS Technologies 1821 Michael Faraday Drive Reston 6,455Systems Engineering Services Corp. Sunrise Plaza 1 12355 Sunrise Valley Drive Reston 6,607T&M McLean Venture McLean Professional Park 1481 Chain Bridge Road McLean/Great Falls 6,540Taylor Made Construction Brookfield Corporate Center 1 4500 Daly Drive Chantilly 1,200Technology, Automation & Management, Inc. Four Skyline Place 5113 Leesburg Pike Baileys Crossroads 9,341TenCAPITOL Reston Plaza 2 12020 Sunrise Valley Drive Reston 2,059The Centennial Companies Commerce Executive 2 11490 Commerce Park Drive Reston 2,140The Collins Firm Lewinsville Office Building 7601 Lewinsville Road Tysons Corner 8,285The Garden City Group Commerce Executive 4 11400 Commerce Park Drive Reston 2,692The Peterson Cos. Fair Lakes 1 12500 Fair Lakes Circle Fairfax Center 3,956The Reznick Group Fairfax Square Tower 3 8045 Leesburg Pike Tysons Corner 24,000Tishman Speyer Properties Tysons International Plaza 1 1921 Gallows Road Tysons Corner 5,500TKC Commercial Services Fair Oaks Commerce Center 11320 Random Hills Road Fairfax Center 4,100TMC ParkEast Corporate Center 1 14150 Park East Circle Chantilly 10,000Top Level Domain Oakbrook Building 1897 Preston White Drive Reston 1,827TR Systems, Inc. 8270 Greensboro Drive Tysons Corner 10,452Transwestern Commercial Services Williams Plaza 1 3040 Williams Drive Merrifield 1,440Tricarta Corp. American Center East 8300 Boone Boulevard Tysons Corner 1,850TRS Consulting Campus West 1902 Campus Commons Drive Reston 14,770Truc T. Phan Dentistry The Ponds at Lafayette 1 4229 Lafayette Center Drive Chantilly 1,714TurnKey Solutions Poplar Place 3 1364 Beverly Road McLean/Great Falls 2,059U-Blox Campus West 1902 Campus Commons Drive Reston 3,850UBM Tysons Center 8260 Greensboro Drive Tysons Corner 5,953Umerani Investments The Ponds at Lafayette 1 4229 Lafayette Center Drive Chantilly 1,380Union Bank of California Reston Executive Center 2 12110 Sunset Hills Road Reston 2,483Video Networks 1577 Spring Hill Road Tysons Corner 2,289VitalSpring Technologies Tysons Center 8260 Greensboro Drive Tysons Corner 4,408VitalSpring Technologies Tysons Center 8260 Greensboro Drive Tysons Corner 9,245Watt, Tieder, Hoffar & Fitzgerald, LLP Greensboro Corporate Center 1 8401 Greensboro Drive Tysons Corner 24,950Wells Fargo Bank Tysons Executive Plaza 2 2010 Corporate Ridge Tysons Corner 12,179WiderThan Americas, Inc. Morino Institute 11600 Sunrise Valley Drive Reston 36,000Wilmington Savings Fund Society Annandale Financial Center 7010 Little River Turnpike Annandale 1,337Windwalker 1355 Beverly Road McLean/Great Falls 16,000Writ Management Atrium Building 7900A Westpark Drive Tysons Corner 2,090XO Communications Presidents Park Two 13865 Sunrise Valley Drive Dulles 104,883Xprudent Corp. SCS Engineers Building 11260 Roger Bacon Drive Reston 1,887Xtone One Fountain Square 11911 Freedom Drive Reston 5,000Yellow Book Chantilly Parc Phase 2 Building D 14900 Bogle Drive Chantilly 4,120Zelinger Associates, Inc. Westwood 2 8603 Westwood Center Drive Tysons Corner 1,310Zylab 8521 Leesburg Pike Tysons Corner 3,125

© Fairfax County Economic Development Authority Real Estate Report—Midyear 2007 7
Office Building Sales, First Half 2007 Building Address Submarket Sale Price Square Feet $/S.F.
Beauregard Square B 6301 Little River Turnpike Annandale $10,994,086 43,779 $251.13Beauregard Square A 6303 Little River Turnpike Annandale $7,055,914 28,097 $251.13Litton TASC I 4801 Stonecroft Boulevard Chantilly $62,700,000 250,000 $250.80Avion Lakeside D 14555 Avion Parkway Chantilly $14,500,000 60,996 $237.72Avion Lakeside A 14585 Avion Parkway Chantilly $12,200,000 60,996 $200.01Northridge I 13221 Woodland Park Road Dulles $33,700,000 129,167 $260.90Lincoln Park II - Building B 3076 Centreville Road Dulles $22,000,000 101,952 $215.79Crown Ridge @ Fair Oaks 4035 Ridge Top Road Fairfax Center $62,300,000 196,297 $317.38Centerpointe II 4000 Legato Road Fairfax Center $57,750,000 214,652 $269.04Centerpointe I 4050 Legato Road Fairfax Center $57,750,000 214,652 $269.04Fair Oaks Plaza 11350 Random Hills Road Fairfax Center $51,000,000 190,206 $268.13Bridgewater Corporate Center 11325 Random Hills Road Fairfax Center $50,940,000 211,752 $240.56Pender Mill 1 3930 Pender Drive Fairfax Center $12,450,000 72,087 $172.71Building K 5911 Kingstowne Village Parkway Franconia $52,943,261 158,280 $334.49One Kingstowne Towne Center 5971 Kingstowne Village Parkway Franconia $51,106,100 162,037 $315.40Elysce Building 10135 Colvin Run Road Great Falls $5,900,000 17,868 $330.20Monument II at Worldgate 12950 Worldgate Drive Herndon $78,200,000 211,996 $368.87Worldgate Plaza IV 12801 Worldgate Drive Herndon $27,250,000 83,605 $325.94Worldgate Plaza III 12825 Worldgate Drive Herndon $27,250,000 83,605 $325.94Worldgate Plaza II 12851 Worldgate Drive Herndon $27,248,696 83,601 $325.94Worldgate Plaza I 12901 Worldgate Drive Herndon $27,248,696 83,601 $325.94Monument III @ Worldgate 12930 Worldgate Drive Herndon $54,850,000 202,001 $271.53Reston Town Center SW Block 1820 Discovery Street Reston $25,478,282 50,599 $503.53Two Fountain Square 11921 Freedom Drive Reston $117,722,561 233,793 $503.53One Fountain Square 11911 Freedom Drive Reston $128,546,513 255,289 $503.53XO Communications HQ 11111 Sunset Hills Road Reston $73,934,108 222,444 $332.37Lake Fairfax Business Center 8 1768 Business Center Drive Reston $27,500,000 98,575 $278.98Reston Plaza 1 12030 Sunrise Valley Drive Reston $13,485,447 51,609 $261.30Reston Plaza 2 12020 Sunrise Valley Drive Reston $21,014,553 80,423 $261.30Lake Fairfax Business Center 4 1761 Business Center Drive Reston $17,000,000 95,691 $177.66Rucker Office 6320 Castle Place Seven Corners $1,950,000 10,760 $181.23 7223 Lee Highway Seven Corners $1,100,000 6,480 $169.75E.J. RandolPh. II 8255 Greensboro Drive Tysons Corner $55,101,328 131,406 $419.32E.J. RandolPh. I 8251 Greensboro Drive Tysons Corner $75,274,035 179,514 $419.32John Marshall I 8281 Greensboro Drive Tysons Corner $106,984,826 266,590 $401.31John Marshall III 8285 Greensboro Drive Tysons Corner $79,858,380 198,995 $401.31American Center West 8330 Boone Boulevard Tysons Corner $59,979,823 170,000 $352.82American Center East 8300 Boone Boulevard Tysons Corner $59,979,823 170,000 $352.82Cedar Hill 3 2216 Gallows Road Tysons Corner $18,109,046 58,351 $310.35Cedar Hill 1 2222 Gallows Road Tysons Corner $14,590,954 47,015 $310.35 8100 Oak Street Tysons Corner $4,575,000 15,302 $298.98Kettler & Scott Building 8081 Wolftrap Road Tysons Corner $7,020,594 24,644 $284.88Tysons Pond 2 1604 Spring Hill Road Tysons Corner $15,500,000 66,106 $234.47Tysons Pond 1 1600 Spring Hill Road Tysons Corner $10,200,000 60,666 $168.13Carper Office Building 125 Church Street NE Vienna $1,790,885 7,458 $240.13
Major Sale Transactions
Office Market Countywide Trends Midyear 2007
• Office building sales in the county have remained steady over the past 18 months, averaging 44 sales per reporting period. During the first half of 2007, 45 properties changed ownership in 11 submarkets countywide. The aggregate value of all sales during the first half of the year topped $1.7 billion, up from $1.5 billion at yearend 2006.
• The median value of buildings sold during the first half of the year was $285 per square foot (s.f.), up from $249 per s.f. at yearend 2006. The average price per s.f. at midyear totaled $325, an increase of 26 percent from the yearend 2006 total of $257 per s.f.
• The first half of the year was characterized by a number of multi-building and portfolio sales. By far, the largest transaction to occur during this period involved the sale of the former Equity Office Property portfolio to Beacon Capital Partners. The portion of the deal that involved buildings located in the county included 11 office buildings totaling over 2 million s.f., and valued at approximately $817 million. This one transaction represents 47 percent of the aggregate value of all sales during the first half of 2007.
• Tysons Corner and Reston were the two most active submarkets in terms of buildings sales during the first half. Twenty of the 45 transactions countywide occurred in these two submarkets. Fairfax Center continued to experience a high level of activity, as well, with six transactions—bringing the total number of sales in this area to 16 over the past 12 months and making it the most active submarket in the county during this period.
Notable Office Building Sales in First Half 2007(Price Per Square Foot)
Reston Town Center / Reston
Two Fountain Square / Reston
One Fountain Square / Reston
E.J. Randolph II / Tysons Corner
E.J. Randolph I / Tysons Corner
John Marshall I / Tysons Corner
John Marshall III / Tysons Corner
Monument II at Worldgate / Herndon
American Center West / Tysons Corner
American Center East / Tysons Corner
$503.53
$503.53
$503.53
$401.31
$368.87
$352.82
$419.32
$419.32
$401.31
$352.82

8 Real Estate Report—Midyear 2007 © Fairfax County Economic Development Authority
Office Space Under Construction, First Half 2007 Building/Project Name Address Submarket Square Feet Lead Tenant(s) Delivery
Commonwealth Centre 1 14370 Newbrook Drive Chantilly 156,160 Speculative September 2007Eclipse @ Westfields Headquarters 14501 George Carter Way Chantilly 285,000 Long & Foster March 2008Mission Ridge 1 15020 Conference Center Drive Chantilly 156,040 Speculative August 2007Mission Ridge 2 15030 Conference Center Drive Chantilly 151,946 Speculative August 2007Stonegate II 15052 Conference Center Drive Chantilly 144,996 Lockheed Martin August 2007TASC V 4807 Stonecroft Boulevard Chantilly 113,000 Northrop Grumman/TASC May 2008South Lake at Dulles Corner 13820 Sunrise Valley Drive Dulles 267,300 Speculative October 2007Dulles Station West 2300 Dulles Station Dulles 185,000 Speculative August 2007Dulles Station East 2303 Dulles Station Dulles 180,000 Speculative February 2008Overlook Tower 1 2550 Waser Terrace Dulles 217,000 Speculative December 2007Dulles View 1 2551 Dulles View Drive Dulles 177,401 Speculative April 2008Dulles View 2 2553 Dulles View Drive Dulles 177,401 Speculative June 2008Lincoln Park II – Building C 3072 Centreville Road Dulles 96,920 Speculative April 2008Lincoln Park II – Building A 3074 Centreville Road Dulles 96,920 Speculative April 2008Public Safety & Transportation Operations Center 4890 Alliance Drive Fairfax Center 147,000 PSTOC June 2008Premier Office Building 2815 Old Lee Highway Merrifield 21,574 Condo August 2007 3120 Fairview Park Drive Merrifield 184,000 Speculative June 2008Parkridge 6 10750 Parkridge Boulevard Reston 203,675 Speculative/Condo Reston Eastpointe 11091 Sunset Hills Road Reston 176,923 Speculative January 2008SoMA – Center Building 11950 Democracy Drive Reston 176,000 Speculative December 2007Two Reston Crescent 12000 Sunrise Valley Drive Reston 185,000 Speculative July 2008SoMA – East Building 1818 Library Street Reston 230,000 Serco, MERS, FHL Bank December 2007SoMA – West Building 1875 Explorer Street Reston 230,000 NII Holdings, Rolls Royce December 2007Liberty Crossing Phase 2 1505 Tysons McLean Boulevard Tysons Corner 400,000 GSA March 2008Park Place II 7930 Jones Branch Drive Tysons Corner 312,897 Speculative December 2008
Construction Activity
Office Market Countywide Trends Midyear 2007
• New construction activity fell off slightly during the first six months of 2007, following on the heels of one of the busiest development cycles in recent memory. At midyear, 25 buildings totaling nearly 4.7 million square feet (s.f.) were under construction—down from 31 buildings and 5.8 million s.f. at yearend 2006. This represents the first decline in new construction activity since yearend 2005.
• Only four new office buildings broke ground during the first six months of 2007 compared to 15 new starts dur-ing the last six months of 2006. New construction in the first half of 2007 was spread throughout six submarkets, with most of the activity—77 percent—occurring in the Dulles (1.4 million s.f.), Reston (1.2 million s.f.) and Chan-tilly (1 million s.f.) submarkets.
• At midyear, 18 of the 25 buildings under construction were speculative projects. These 18 buildings represent roughly 3.1 million s.f. or 67 percent of all space under construction at midyear.
• The amount of new office space delivered in the county increased for the first time in more than a year. Following two consecutive periods of decline, new office space deliveries more than doubled during the first half of 2007 compared to the previous reporting period. Approximately 1.6 million s.f. of new office space had delivered by midyear compared to 759,000 s.f. during the last half of 2006—a trend that is expected to continue through midyear 2008. Eleven new build-ings totaling 1.9 million s.f. are scheduled for delivery by the end of 2007, with an additional 11 buildings totaling 2 million s.f. slated to deliver by midyear 2008. The remaining three buildings totaling roughly 700,000 s.f. are projected to deliver during the last half of 2008.
• Although new deliveries will continue to increase through midyear 2008, construction activity in general is expected to decline, as evidenced by the decrease in the number of new starts during the first half of this year. A number of new projects are planned and permitted, but speculative development is expected to decline significantly. The majority of new starts will in all likelihood be limited to build-to-suit or preleased projects, at least until much of the new speculative space entering the market is absorbed.
New Office Building Deliveries by Year
1981
1982
1983
1984
1985
1986
1987
1988
1989
1990
1991
1992
1993
1994
1995
1996
1997
1998
1999
2000
2001
2002
2003
2004
2005
2006
2007
(as
of Ju
ne 3
0)
Sq. Ft.
0
1 mil
2 mil
3 mil
4 mil
5 mil
6 mil
7 mil
8 mil

© Fairfax County Economic Development Authority Real Estate Report—Midyear 2007 9
Office Building Deliveries, First Half 2007
Building/Project Name Address Submarket Square Feet Lead Tenant(s) Delivery
Lacy Square 5981-5985 Columbia Pike Baileys Crossroads 14,310 Condo February 2007 Penrose Center 14426 Penrose Place Chantilly 150,384 Speculative March 2007 Plaza East II 14291 Park Meadow Drive Chantilly 123,966 Speculative June 2007 Plaza East I 14295 Park Meadow Drive Chantilly 123,966 Speculative June 2007 Independence Center 2 15040 Conference Center Drive Chantilly 115,418 Speculative January 2007 Stoneleigh II 4840 Westfields Boulevard Chantilly 112,395 Speculative May 2007 Dulles Discovery 1 Sully Road Dulles 375,000 GSA June 2007 Lincoln Park III – Building A 13857 McLearen Road Dulles 208,000 Speculative June 2007 Woodland Pointe 2260 Woodland Pointe Avenue Dulles 185,790 Speculative June 2007 Reston Square 11790 Sunrise Valley Drive Reston 153,355 Whitney, Bradley, Brown May 2007 Tall Oaks Professional Building 12054 North Shore Drive Reston 10,580 Condo February 2007
Office Market Countywide Trends Midyear 2007
We can tell you everything there is to know about doing business . . . within certain limits.Within the boundaries of Fairfax County, we are the authority on business information.
Our free services will help you take advantage of the unlimited possibilities in Fairfax County. We have comprehensive, up-to-date data on labor force and trends, taxes, utilities, real estate, housing and meeting accommodations—along with scores of other facts and figures to help businesses grow and prosper. We can help you locate the perfect office or industrial space for your new or growing business. If you need help understanding the county's regulatory and zoning policies and procedures, we can help there, too. So if you or your clients are interested in locating, relocating or expanding your business operation in Fairfax County, inquire in strict confidence to:
Fairfax County Economic Development Authority8300 Boone Boulevard, Suite 450, Vienna, Virginia 22182Phone 703-790-0600 • Fax 703-893-1269 E-mail: [email protected]
www.FairfaxCountyEDA.org

10 Real Estate Report—Midyear 2007 © Fairfax County Economic Development Authority
Direct w/Sublet Annandale 8.8% ▼ 9.3% ▼ Baileys Crossroads 2.6% ▼ 2.8% ▼ Burke 1.2% ▼ 1.5% ▼ Centreville 18.4% ▼ 20.5% ▼ Chantilly 11.4% ▼ 11.9% ▼ Dulles 12.6% ▼ 14.7% ▼ Fairfax Center/Oakton 6.4% — 11.0% ▼ Herndon (Town) 11.6% ▼ 13.1% ▼ McLean/Great Falls 2.3% — 2.5% ▼ Merrifield 4.7% ▼ 6.3% ▼ Newington/Lorton 0.3% ▼ 0.3% ▼ Reston 8.6% ▼ 10.3% ▼ Richmond Highway 16.0% ▼ 17.5% ▼ Seven Corners 28.3% ▼ 28.5% ▼ Springfield/Franconia 9.5% ▼ 10.2% ▼ Tysons Corner 8.7% ▼ 10.4% ▼ Vienna 3.7% — 3.9% ▼ Fairfax County 8.5% ▼ 10.2% ▼
Relet Lease Rates New Lease Rates* Sublet Lease RatesAnnandale $21.00–$26.50 $30.50 $21.50–$24.00 NNNBaileys Crossroads $22.50–$33.00 $21.00 N $26.00 Burke $18.50 NNN NA NACentreville $20.00 NNN–$32.00 NNN $19.50 NN–$34.50 $30.00 Chantilly $17.00–$28.00 $23.00–$32.50 $12.00 NNN–$24.00Dulles $22.00–$32.50 $28.50–$38.00 $21.50–$25.50Fairfax Center/Oakton $23.00–$32.00 $32.00 $15.00–$32.00Herndon (Town) $17.00 NN–$29.50 $33.00 NNN–$35.00 $13.00–$23.50McLean/Great Falls $20.50–$35.00 NA $18.25–$32.00Merrifield $21.00–$39.50 $25.00–$39.75 $16.00–$30.00Newington/Lorton $20.00 NA NAReston $23.00–$48.00 $19.75–$48.00 $15.00–$37.00Richmond Highway $14.00–$26.50 $18.00 NNN $19.75–$26.00Seven Corners $23.50–$27.50 NA $25.00–$27.50 Springfield/Franconia $18.00–$35.50 $34.50–$35.50 $22.00–$32.00Tysons Corner $18.00–$45.00 $43.00–$45.00 $16.00–$37.00Vienna $23.00–$33.00 NA NA
Absorption Available Construction Activity Inventory Total Relet New* Sublet Total Relet New Sublet Underway Delivered Annandale 1,819,053 52,777 48,554 — 4,223 169,634 136,657 24,095 8,882 — — Baileys Crossroads 3,225,775 98,218 74,994 9,310 13,914 88,958 80,056 5,000 3,902 — 14,310 Burke 527,834 9,681 9,681 — — 8,145 8,145 — — — — Centreville 981,928 16,268 13,029 1,272 1,967 201,522 64,107 116,103 21,312 — — Chantilly 9,664,171 726,760 434,493 237,725 54,542 1,151,852 426,688 672,686 52,478 1,007,142 626,129 Dulles 7,708,429 370,377 265,494 104,883 — 1,135,731 477,617 490,373 167,741 1,397,942 768,790 Fairfax Center/Oakton 9,415,637 315,498 284,043 7,396 24,059 1,038,171 386,636 218,612 432,923 147,000 — Herndon (Town) 5,686,766 331,550 187,668 58,288 85,594 744,897 513,636 147,367 83,894 — — McLean/Great Falls 4,239,118 93,273 93,273 — — 104,239 95,720 — 8,519 — — Merrifield 9,829,915 208,588 163,965 4,752 39,871 616,753 456,454 3,752 156,547 205,574 — Newington/Lorton 551,309 6,104 6,104 — — 1,896 1,896 — — — — Reston 18,225,505 869,087 604,023 141,358 123,706 1,879,995 1,560,962 7,500 311,533 1,201,598 163,935 Richmond Highway 1,044,644 13,581 13,581 — — 183,271 163,472 4,000 15,799 — — Seven Corners 1,022,086 65,143 65,143 — — 290,877 289,359 — 1,518 — — Springfield/Franconia 4,217,488 170,514 142,114 25,580 2,820 432,192 264,008 137,401 30,783 — — Tysons Corner 25,635,814 1,249,083 1,071,550 19,032 158,501 2,671,227 2,215,988 6,245 448,994 712,897 — Vienna 2,531,896 28,258 28,258 — — 99,003 88,679 6,000 4,324 — — Fairfax County 106,327,368 4,624,760 3,505,967 609,596 509,197 10,818,363 7,230,080 1,839,134 1,749,149 4,672,153 1,573,164
* Includes buildings under construction
Office Market Submarket Trends Midyear 2007
Office Space Inventory by Submarket (Square Feet)
Office Lease Rates by Submarket (Per Square Foot)
* Includes buildings under construction
NOTE: The lease rates listed above are based on quoted rates of property available on June 30, 2007. It is important to note that this is just a snapshot of quoted rates at a given point in time and that all rates are subject to change.
For an explanation of lease rates, see glossary on page 16.
Office Vacancy Rate by Submarket, First Half 2007
• Inventory increased in four of the county’s 17 submarkets during the first six months of 2007. The Dulles submarket grew by 11 percent, add-ing roughly 769,000 square feet (s.f.), which represents 49 percent of all new deliveries countywide during the first half. Chantilly (626,000 s.f.), Reston (164,000 s.f.) and Baileys Crossroads (14,000 s.f.) also added space. At midyear, six submarkets had space under construction. The lion’s share of new development activity occurred in the submarkets located in the western portion of the county—specifically Chantilly, Reston and Dulles, which accounted for more than 77 percent of all new office development at midyear.
• For the second straight reporting period, the majority of submarkets in the county experienced an increase in both the direct and overall vacancy rate. The direct vacancy rate was up in four of the five largest office markets and the overall vacancy rate was up in all five of the county’s largest submarkets. Ten of the county’s 17 submarkets had double-digit overall vacancy rates at midyear, compared with seven at the close of 2006.
• Absorption increased slightly during the first half of 2007. Nine submarkets experienced an increase in activity during this period, including three of the top five submarkets. The county’s two largest submarkets, Tysons Corner and Reston, accounted for roughly 46 percent of all leasing activity during the first half of the year. The three most active submarkets in construction activity—Chantilly, Reston and Dulles—led all submar-kets in new space absorption, with 79 percent of all new space leasing occurring in these three submarkets.
• The amount of available new space shot up 59 percent during the first six months of the year. Nearly 38 percent of available space countywide is located in the Tysons Corner and Reston submarkets, while 63 percent of all new available space is located in the Chantilly and Dulles sub-markets. Sublet availability increased for the first time in nearly five years. Fifty percent of the available sublet space is in the Tysons Corner and Fairfax Center submarkets.

© Fairfax County Economic Development Authority Real Estate Report—Midyear 2007 11
Commercial Condominium Market Countywide Trends Midyear 2007
Commercial Condominium Sales Commercial Condominium SalesNumber of Units Sold
Notes
• The number of commercial condominiums sold decreased for the first time in more than a year. Condo sales were off by 13 percent from the previous report-ing period. This decline was not entirely unexpected, as existing inventory has decreased over the past five years, and new development has failed to keep pace with demand. Much of the new condo inventory that has come onto to the market in the past three years has been in the form of older office buildings that have been converted to condominiums.
• The demand for office condo space continues to drive the sales market. Seventy-eight percent of all units sold during the first half were office condos, 15 percent were industrial in nature and the remaining 7 percent were dedicated for medical use.
• Centreville led all markets with 24 percent of total sales, followed by Chantilly with 17 percent and Annandale with 14 percent. The Centreville, Chantilly and Annan-dale submarkets have been the top three submarkets in condo sales for the past year. Condo sales in Centreville have been driven by new office condo develop-ment, while sales in the Chantilly market have been primarily industrial/flex condos. Sales in the Annandale submarket have consisted almost entirely of office buildings converted to condo use.
• Barring a second-half boom in activity, overall yearly condo sales totals should experience a downturn for the first time in six years. New condo deliveries totaled approximately 25,000 square feet (s.f.) in the first half of 2007, down from 209,000 s.f. in the previous reporting period. Inter-est rates remain favorable. However, the lack of available existing inventory in conjunction with a dramatic decrease in new development will likely dampen the condo market even further during the last half of 2007.
Commonwealth Centre 1 in Chantilly will offer167,000 square feet of office space and is scheduled for October 2007 delivery.
135
1382000
2001
2002
2003
2004
2005
2006
2007(as of June 30)
151
165
231
278
345
460

12 Real Estate Report—Midyear 2007 © Fairfax County Economic Development Authority
Industrial/Flex Space Trends: 1980–2006 (Square Feet) Direct Standing Vacancy Total New Relet Total Direct New Relet Year Inventory Rate (%) Leased Leased Leased Available Available Available
1980 14,700,000 N/A N/A N/A N/A N/A N/A N/A 1981 16,300,000 3.7 1,000,000 N/A N/A 600,000 N/A N/A 1982 17,700,000 6.6 374,000 221,000 153,000 1,168,000 600,000 568,000 1983 18,700,000 3.1 2,016,294 1,292,439 723,855 583,996 260,931 323,065 1984 20,222,000 7.3 1,965,768 1,579,182 386,586 1,469,874 1,337,698 132,176 1985 21,600,000 6.9 2,745,936 2,416,694 329,242 1,487,269 1,360,339 126,930 1986 23,400,000 6.8 1,602,344 1,383,489 218,855 1,588,646 1,011,771 576,875 1987 24,400,000 6.5 1,733,854 1,374,025 359,829 1,741,092 1,316,991 424,101 1988 28,200,000 7.9 2,111,453 1,745,037 366,416 2,478,591 1,229,409 1,179,182 1989 31,400,000 8.5 2,641,674 1,674,048 967,626 2,774,996 1,306,948 1,468,048 1990 32,600,000 10.6 1,438,935 642,668 796,267 3,661,729 1,669,505 1,992,224 1991 34,200,000 13.4 1,311,695 410,296 901,339 4,648,621 1,914,470 2,734,151 1992 35,000,000 12.7 1,310,223 867,837 1,310,223 4,439,335 902,275 3,537,060 1993 35,800,000 11.0 2,004,260 416,541 1,587,719 3,947,894 580,301 3,367,593 1994 34,961,029 9.8 2,501,403 496,630 2,004,773 3,433,339 285,565 3,147,774 1995 34,961,029 8.0 2,204,196 235,790 1,968,406 2,797,486 58,568 2,738,918 1996 35,336,217 8.6 2,538,099 520,888 2,017,211 3,073,832 81,494 2,992,338 1997 35,745,785 6.1 1,972,636 44,942 1,927,694 2,161,158 41,552 2,119,606 1998 36,299,193 5.4 1,802,105 522,744 1,279,361 1,956,663 169,439 1,787,224 1999 36,444,226 3.1 1,909,050 206,439 1,702,611 1,132,003 0 1,132,003 2000 37,060,795 3.6 2,057,616 348,563 1,709,053 1,338,932 273,984 1,064,948 2001 36,174,673 4.6 1,197,055 308,512 888,543 1,652,959 575,583 1,077,376 2002 36,478,391 7.3 1,201,307 108,340 771,892 2,658,738 547,120 2,111,618 2003 36,723,384 7.9 2,032,569 360,524 1,157,445 2,913,787 246,861 2,666, 926 2004 37,268,392 6.3 2,590,855 516,423 1,663,986 2,361,600 149,435 2,212,165 2005 37,698,795 6.2 2,183,318 151,235 1,774,350 2,326,169 237,700 2,088,469 2006 38,463,263 7.0 2,933,878 733,316 2,102,139 2,681,311 393,982 2,287,329 2007 38,662,732 7.2 1,195,875 154,963 926,181 2,789,173 380,229 2,408,944
1 Includes inventory outside submarket areas, 1980-2000 only.2 ln some years, total leasing reflects the preleasing of buildings under construction and about to be constructed, as well as new and relet space.3 As of June 30, 2007.
1 2
Industrial/Flex Market Countywide Trends Midyear 2007
• At midyear 2007, the industrial/flex inventory in-creased to almost 38.7 million square feet (s.f.), with the addition of five new buildings totaling nearly 200,000 s.f. during the first half of the year.
• The vacancy rate experienced only a slight increase during the first half of the year. The direct vacancy rate rose to 7.2 percent from 7 percent at yearend.The overall vacancy rate, including sublet space, increased to 7.9 percent, up from 7.8 percent. The increase in the vacancy rate can be directly attrib-uted to the decrease in overall leasing activity.
• Leasing activity decreased for the second consecutive reporting period, closing at 1.2 million s.f., down near-ly 16 percent from the previous reporting period. Following a record year of activity in 2006, absorption totals have leveled off, but are still expected to top 2 million s.f. for a fifth consecutive year in 2007.
• The amount of available space increased only slightly during the first half of 2007. Relet is the only class of space that experienced an increase during this period. Both new and sublet totals declined at midyear, compared to the previous six-month period. The relet portion of the available space inventory should continue to dominate in the foreseeable future due in large part to a slowdown in new industrial/flex construction.
• The industrial/flex market has stabilized over the past year after experiencing a mini-boom of sorts in new construction activity, as well as record leasing activity during the first half of 2006. New construction starts have declined considerably during the past six months due to a drop in demand for industrial/flex space. Although the industrial/flex market has softened in terms of new construction and leasing compared to record 2006 levels, it is important to note that that the current levels of activity are more closely aligned to activity historically achieved in this market.
Countywide Industrial/Flex Space Trends: 1980–2007Inventory and Vacancy Rates
1980
1981
1982
1983
1984
1985
1986
1987
1988
1989
1990
1991
1992
1993
1994
1995
1996
1997
1998
1999
2000
2001
2002
2003
2004
2005
2006
2007
(as
of Ju
ne 3
0)
SquareFeet
VacancyRate (%)
0
5 mil
10 mil
15 mil
20 mil
25 mil
30 mil
35 mil
40 mil
0
3
6
9
12
15
3

© Fairfax County Economic Development Authority Real Estate Report—Midyear 2007 13
Industrial/Flex Building Deliveries, First Half 2007
Building/Project Name Address Submarket Square Feet Lead Tenant(s) Delivery
Northridge at Westfields – Bldg. VII 15002 Northridge Drive Chantilly 27,870 Speculative January 2007 Northridge at Westfields – Bldg. VI 15004 Northridge Drive Chantilly 39,088 Speculative January 2007 Northridge at Westfields – Bldg. V 15006 Northridge Drive Chantilly 39,088 Speculative February 2007 Miller’s Office Products 8600 Cinder Bed Road Newington/Lorton 63,330 Miller’s Office Products February 2007 Del Ray Glass 6621-6631 Richmond Highway Richmond Highway 30,093 Del Ray Glass February 2007
Industrial/Flex Space Under Construction, First Half 2007
Building/Project Name Address Submarket Square Feet Lead Tenant(s) Delivery
Premium Distributors Truck Wash 15000 Northridge Drive Chantilly 10,000 Premium Distributors September 2007 Towerview Commerce Center 13849 Park Center Drive Dulles 57,011 Condo September 2007
Industrial/Flex Market Countywide Trends Midyear 2007
Construction Activity Industrial/Flex Building Deliveries by Year
1990
1991
1992
1993
1994
1995
1996
1997
1998
1999
2000
2001
2002
2003
2004
2005
2006
2007
(as
of Ju
ne 3
0)
Sq. Ft.
0
300,000
600,000
900,000
1,200,000
1,500,000
• Construction activity in the industrial/flex market decreased in the first half of 2007. Two buildings totaling 67,000 square feet (s.f.) were under construction at midyear, compared with eight buildings totaling 273,000 s.f. at yearend 2006. The two projects under construction at midyear are located in the Chantilly and Dulles submarkets. No new projects broke ground during the first half of 2007.
• Deliveries of new industrial/flex space increased from 32,000 s.f. in one building at the close of 2006 to 199,000 s.f. in five buildings at midyear 2007. The yearend delivery total is expected to decline to 67,000 s.f. with no new deliveries scheduled for the first half of 2008.
• Industrial/flex construction has come to a screeching halt. No new projects are due to break ground by the end of 2007. This means no new industrial/flex deliveries through at least the fourth quarter of 2008 or beyond, based on activity during the first quarter of 2008.
Under construction in Dulles is the Towerview Commerce Center, which will offer 57,000 square feet of industrial/flex space and is scheduled for December 2007 delivery.

14 Real Estate Report—Midyear 2007 © Fairfax County Economic Development Authority
Industrial/Flex Leasing Activity, First Half 2007
Tenant Building Address Submarket Square Feet
Atlantic Co. Newington Park Center 6 8538 Terminal Road Newington 3,000ATS, Inc. 2800A-N Dorr Avenue Merrifield 1,550Audiovisual Actions Presentation Build America 5 5641 General Washington Drive Springfield 3,600Bart & Associates, Inc. Gateway 95 Business Park 2 8560 Cinder Bed Road Newington/Lorton 13,760Beltway Vending Company Fullerton 2 7608 Fullerton Road Newington/Lorton 3,200Busso Music Shell Park Center 5712 General Washington Drive Springfield 3,808Capital Lighting & Supply, Inc. 8430 Terminal Road 8430-8444 Terminal Road Newington 107,209Capitol-Baum Office Furniture Co., Inc. Shirley Industrial Centre 6619-6631 Iron Place Springfield 6,212Commercial Waterproofing, Inc. 7950 Woodruff Court Springfield 5,000Continental Building Maintenance Westech 1 14310 Sullyfield Circle Chantilly 5,000Custom Shade 5910-5918 Farrington Avenue Franconia 12,900Employment Services, Inc. Plaza 500 6295 Edsall Road Franconia 12,834Euro Stone Craft Renaissance Park @ Dulles 5 13870-13912 Park Center Road Dulles 15,840First Transit Alexandria Corporate Park 6315 Bren Mar Drive Springfield 25,000French Connection, LLC Prosperity Association Warehouse 2930-2942 Prosperity Avenue Merrifield 5,375Frozen Ropes Training Center Sully Square 3 4080 Walney Road Chantilly 13,673GSA Sugarland Business Park Ph. 2 397 Herndon Parkway Herndon 5,145InFu Science PS Business Parks at Lafayette B 4115 Pleasant Valley Road Chantilly 6,094Inline Sports Avion Park – Bldg. B 3935 Avion Court Chantilly 63,000Integrity Tile & Stone Alban Business Center 8400-8404 Alban Road Newington/Lorton 14,760Iron Mountain Chantilly Distribution Center 2 3900 Stonecroft Boulevard Chantilly 22,000Islamic Saudi Academy Newington Park Center 5 8536 Terminal Road Newington 5,905J.M.’s Custom Auto Detailing 2807-2809 Dorr Avenue Merrifield 4,075K 1 Bread & Bakery Markey Commerce Center 2 4445-4449 Brookfield Corporate Drive Chantilly 4,500L-3 Communications Gateway 95 Business Park 5A 8530 Cinder Bed Road Newington/Lorton 5,670LECG Sugarland West Business Center Ph. 2 360 Herndon Parkway Herndon 16,644Lockheed Martin Gunston Commerce Center B4 10505 Furnace Road Newington/Lorton 6,468Maaco 7661 Fullerton Road Newington/Lorton 11,400MAC Aerospace MAC Aerospace 14558 Lee Road Chantilly 11,000McCall Handling Flint Lee South 1 14701 Flint Lee Road Chantilly 10,540Microbiotest Backlick Center South 2 Bldg. 2 8245 Backlick Road Newington/Lorton 1,410MVLE Fullerton Square 7420 Fullerton Road Newington/Lorton 8,096NAPA Auto Parts Shirley Industrial Centre 6619-6631 Iron Place Springfield 6,000New German Performance Newington Park Center 4 8534 Terminal Road Newington 3,131Northrop Grumman 4260-4264 Entre Court Chantilly 25,600NOYAN – USA Avion Park – Bldg. B 3935 Avion Court Chantilly 10,043Play N’ Learn Westfax Business Center B 4100-4144 Westfax Drive Chantilly 13,200Play N’ Learn West Fairfax Commerce Center 14500 Lee Road Chantilly 5,000Progress Pharmacy Dulles South 3 14130 Sullyfield Circle Chantilly 12,402Quince Imaging Renaissance Park @ Dulles 4 2800-2818 Towerview Road Dulles 17,181Rarco Contracting Bren Mar Center 5706 General Washington Drive Springfield 3,630Red Peg Industrial, Inc. Northern VA Industrial 3 7301-7327 Lockport Place Newington/Lorton 4,640Richards Construction, Inc. Gunston Center Condominiums 10595 Furnace Road Newington/Lorton 9,770Scrapbooks Plus West Fairfax Commerce Center 14502 Lee Road Chantilly 3,750
Industrial/Flex Market Countywide Trends Midyear 2007
Major Lease Transactions• Overall leasing activity in the industrial flex market de-
clined by 16 percent from the previous reporting period. Absorption totaled 1.2 million square feet (s.f.), down from 1.4 million s.f. at the close of 2006.
• Overall leasing activity was off only slightly during the first half of 2007, but the number of large deals fell off signifi-cantly. During the last half of 2006, every lease in the top 10 industrial/flex deals topped 30,000 s.f. In the first six months of 2007, however, there were only two transac-tions over 30,000 s.f. and one deal over 100,000 s.f.
• The top 10 deals were spread throughout five differ-ent submarkets. For the second consecutive reporting period, Chantilly led all submarkets with four of the top 10 deals.
• The number of large-scale industrial/flex leases is expected to decrease due to the lack of available large blocks of space and a decline in any new construction. Most of large transactions in the near future are likely to be renewal deals.
Top 10 Industrial/Flex Lease Deals in First Half 2007 (Square Feet)
107,209
63,000
25,600
25,000
22,000
17,181
16,644
15,840
15,518
14,760
Capital Lighting & Supply, Inc. / Newington/Lorton
Inline Sports / Chantilly
Northrop Grumman / Chantilly
First Transit / Springfield/Franconia
Iron Mountain / Chantilly
Quince Imaging / Dulles
LECG / Herndon
Euro Stone Craft / Dulles
WRB Communications, Inc. / Chantilly
Integrity Tile & Stone / Newington/Lorton

© Fairfax County Economic Development Authority Real Estate Report—Midyear 2007 15
Industrial/Flex Leasing Activity, First Half 2007
Tenant Building Address Submarket Square Feet
Securitas Systems Fairtech @ Lafayette A 4200 Technology Court Chantilly 4,400Snowden River Corp. Alexandria Corporate Park 6315 Bren Mar Drive Springfield 6,500Springfield Auto Care Newington Park Center 2 8535 Terminal Road Newington 14,674Thore Mechanical Newington Park Center 6 8538 Terminal Road Newington 3,134U.S. Social Security Administration Plaza 500 6295 Edsall Road Franconia 13,202VA Trading Newington Park Center 4 8534 Terminal Road Newington 2,950Webb Gentech Services, LLC Lockport Business Center 7207 Lockport Place Newington/Lorton 2,250WRB Communications, Inc. Beaumont @ Lafayette D 4200 Lafayette Center Drive Chantilly 15,518
Industrial/Flex Building Sales, First Half 2007 Building Address Submarket Sale Price Square Feet $/S.F.
Westfax Business Center C 4155 Westfax Drive Chantilly $3,958,767 30,800 $128.53 Westfax Business Center A 4101 Westfax Drive Chantilly $11,750,318 95,200 $123.43 Westfax Business Center E 4001-4005 Westfax Drive Chantilly $16,880,552 139,330 $121.16 Westfax Business Center D 4007 Westfax Drive Chantilly $1,386,015 11,440 $121.16 Westfax Business Center F 4102-4152 Pepsi Place Chantilly $14,921,414 124,920 $119.45 Westfax Business Center B 4100-4144 Westfax Drive Chantilly $10,593,847 89,600 $118.23 Aal-Matic Transmission Center 11611 Lee Highway Fairfax Center $6,000,000 4,128 $1,453.49 8817 TelegraPh. Road Lorton $2,100,000 9,392 $223.59 7200 Fullerton Road Newington $12,571,918 75,000 $167.63 7644 Dynatech Court Newington $3,541,185 33,240 $106.53 3149 Draper Drive Oakton $5,300,000 25,462 $208.15 Delta Electronics 5730 General Washington Drive Springfield $6,752,832 33,280 $202.91 Springfield Ctr Business Park 3 6605 Springfield Center Drive Springfield $12,000,000 68,851 $174.29 Springfield Ctr Business Park 4 6601 Springfield Center Drive Springfield $4,522,000 26,496 $170.67 5405-5407 Port Royal Road Springfield $4,400,000 32,276 $136.32 Ray’s Auto Body 316 Dominion Road NE Vienna $1,275,000 6,452 $197.61
Industrial/Flex Market Countywide Trends Midyear 2007
Major Sale Transactions• Sales of industrial/flex buildings rebounded dramatically
during the first half of 2007, following a significant down-turn during the last half of 2006. Sixteen buildings changed ownership during the first half, compared to only five during the previous reporting period. The aggregate value of sales totaled about $112 million—nearly three times the amount recorded during the last half of 2006.
• The median sales price of buildings sold during the first half of 2007 was $136 per square foot (s.f.), up from $112 per s.f. at yearend 2006. The average sales price at midyear stood at $140 per s.f, up from $107 per s.f. at yearend 2006.
Notable Industrial/Flex Building Sales in First Half 2007 (Price Per Square Foot)
Aal-Matic Transmission Center / Fairfax Center/Oakton
8817 Telegraph Road / Newington/Lorton
3149 Draper Drive / Fairfax Center/Oakton
Delta Electronics / Springfield/Franconia
Ray’s Auto Body / Vienna
$1,453.49
$197.61
$202.91
$223.59
$208.15
MAC Aerospace leased 11,000 square feet of space at 14558 Lee Road, Chantilly.

16 Real Estate Report—Midyear 2007 © Fairfax County Economic Development Authority
Direct w/Sublet Annandale 0.0% — 0.0% — Baileys Crossroads 9.2% ▼ 9.2% ▼ Burke 4.5% ▼ 4.5% ▼ Chantilly 12.4% ▼ 12.9% ▼ Dulles 10.6% ▼ 12.1% ▼ Fairfax Center/Oakton 0.0% — 0.0% — Herndon (Town) 10.8% ▼ 10.8% ▼ McLean/Great Falls 0.0% — 0.0% — Merrifield 2.2% ▼ 2.4% ▼ Newington/Lorton 7.2% ▼ 7.9% — Reston 5.3% — 5.5% — Richmond Highway 0.0% — 0.0% — Seven Corners 0.0% — 0.0% — Springfield/Franconia 3.9% ▼ 5.2% ▼ Tysons Corner 6.9% ▼ 7.9% ▼ Vienna 7.7% ▼ 7.7% ▼ Fairfax County 7.2% ▼ 7.9% ▼
Absorption Available Construction Activity Inventory Total Relet New* Sublet Total Relet New Sublet Underway Delivered Annandale 91,450 — — — — — — — — — Baileys Crossroads 318,502 — — — — 29,350 29,350 — — — — Burke 239,924 9,595 9,595 — — 10,771 10,771 — — — — Chantilly 9,319,820 333,757 293,542 40,215 — 1,199,390 1,044,694 106,046 48,650 10,000 106,046 Dulles 1,581,175 47,360 47,360 — 190,800 166,942 23,858 57,011 — Fairfax Center/Oakton 43,660 — — — — — — — — — — Herndon (Town) 1,154,782 64,614 64,614 — — 124,101 124,101 — — — — McLean/Great Falls 9,390 — — — — Merrifield 2,762,547 42,874 39,774 3,100 66,540 59,542 6,998 — — Newington/Lorton 10,332,228 305,355 251,670 21,168 32,517 813,467 466,504 274,183 72,780 — 63,330 Reston 465,775 — — — — 25,604 24,804 800 — — Richmond Highway 79,366 — — — 30,093 Seven Corners 35,706 — — — — Springfield/Franconia 10,703,053 372,218 199,524 93,580 79,114 499,738 373,661 — 126,077 — — Tysons Corner 1,072,874 13,650 13,650 84,408 73,575 10,833 — — Vienna 452,480 6,452 6,452 35,000 35,000 — — Fairfax County 38,662,732 1,195,875 926,181 154,963 114,731 3,079,169 2,408,944 380,229 289,996 67,011 199,469
Relet Lease Rates New Lease Rates* Sublet Lease Rates Annandale NA NA NA Baileys Crossroads $8.00 MG–$17.50 NNN NA NA Burke $11.75 IG–$15.00 IG NA NA Chantilly $6.95 NNN–$21.50 $16.00 NNN $5.50 NNN–$12.50 IG Dulles $7.50 NNN–$8.50 NNN NA $7.50 NNN–$10.75 IG Fairfax Center/Oakton NA NA NA Herndon (Town) $8.50 NNN–$17.00 NNN NA NA McLean/Great Falls NA NA NA Merrifield $12.00 NNN–$19.25 NNN NA $18.00 NNN Newington/Lorton $7.00 NNN–$18.50 NNN $9.50 NNN–$16.00 NNN $7.50 NNN–$15.75 NNN Reston $16.00 NNN–$18.50 NNN NA NA Richmond Highway NA NA NA Seven Corners NA NA NA Springfield/Franconia $8.50 NNN–$20.00 NNN NA $9.25 NNN Tysons Corner $15.00 IG–$20.00 IG NA NA Vienna $15.00 NNN NA NA
Industrial/Flex Market Submarket Trends Midyear 2007
Industrial/Flex Space Inventory by Submarket (Square Feet)
* Includes buildings under construction
Industrial/Flex Vacancy Rate by Submarket, First Half 2007Industrial/Flex Lease Rates by Submarket (Per Square Foot)
* Includes buildings under construction
NOTE: The lease rates listed above are based on quoted rates of property available on June 30, 2007. It is important to note that this is just a snapshot of quoted rates at a given point in time and that all rates are subject to change.
For an explanation of lease rates, see glossary on page 18.
• At midyear 2007, three of the county’s 16 industrial/flex submarkets had experienced an increase in inventory. Three of five new buildings were located in the Chantilly submarket. The Newington/Lorton and the Richmond Highway submarkets added one building each. The Chan-tilly and Dulles submarkets each had buildings under construction at midyear due to deliver by yearend 2007. Approximately 79 percent of the county inventory is located in the top three submarkets: Springfield/Franconia, Newington/Lorton and Chantilly.
• The overall vacancy rate countywide increased by less than one-tenth of a percentage point. The direct vacancy rate increased in six of the 16 industrial flex submarkets, decreased in four and remained unchanged in six. The overall rate increased in five submarkets, decreased in four and was unchanged in seven. Of the top three submarkets, only Chantilly experienced an increase in overall rates.
• As expected, the majority of leasing activity was concentrated in the county’s three largest industrial/flex submarkets. The Sprinfield/Fran-conia, Chantilly and Newington/Lorton each topped 300,000 square feet (s.f.) of leasing activity during the first half of 2007. The top three submarkets accounted for 85 percent of all leasing activity countywide. Herndon was the only other submarket to top 50,000 s.f. of activity during the first half of the year.
• For each of the reporting periods for the past three years, Chantilly has led all submarkets in available space. The county’s third largest indus-trial/flex submarket also has been the fastest-growing over the same period. Roughly 39 percent of all available space and nearly 43 percent of all relet space at midyear was in the Chantilly submarket. The Springfield/Newington submarket led all markets in available new space with 60 percent of the total. Approximately 82 percent of all available space at midyear was located in the top three submarkets.

© Fairfax County Economic Development Authority Real Estate Report—Midyear 2007 17
Hotels by Submarket
Properties Rooms Square Feet Annandale — — — Baileys Crossroads 2 235 131,556 Burke — — — Centreville 2 231 131,098 Chantilly 14 1,956 1,215,286 Dulles 6 1,270 1,041,525 Fairfax Center/Oakton 9 1,490 927,198 Herndon (Town) 9 1,467 895,251 McLean/Great Falls 1 143 103,646 Merrifield 5 996 637,849 Newington/Lorton 1 129 62,172 Reston 3 965 714,495 Richmond Highway 6 707 338,073 Seven Corners 3 337 191,812 Springfield/Franconia 10 1,709 873,207 Tysons Corner 14 3,888 2,578,229 Vienna 1 115 39,312 Fairfax County 86 15,641 9,880,709
Hotel Market Countywide Trends Midyear 2007
Hotel Activity• At midyear 2007, the hotel inventory stood at 86 hotels with 15,641 rooms
totaling almost 9.9 million square feet (s.f.). The hotel inventory remained unchanged from yearend 2006, except for a small increase in the number of rooms due to renovations.
• The Westin Tysons Corner completed its renovation and conversion from a Doubletree Hotel Tysons Corner during the first half of 2007. This is the first Westin hotel to deliver in Fairfax County. Another is under construction in Reston and a third is planned for Dulles.
• No hotels broke ground or delivered during the first half of 2007. However, three were under construction in three different submarkets—Reston, Rich-mond Highway and Springfield. The hotel pipeline continues to flow with proj-ects; several developers are finalizing their site plans and permitting processes.
• Renovation activity carried over from the previous half. The Holiday Inn Tysons Corner is undergoing a multi-million dollar renovation and conversion to a Crowne Plaza. All three renovations and conversions, including the Hyatt Place (former AmeriSuites) in Chantilly and the Hampton Inn Alexandria–Old Town South on Richmond Highway, are scheduled for delivery during the second half of 2007.
• Hotel sales activity was brisk during the reporting period. Four existing hotels and two development sites approved for hotels sold during the first half of 2007. Notable sales included the Fairview Park Marriott in Merrifield, which sold for $108.5 million, or almost $275,000 per room, and the Hyatt Fair Lakes in Fairfax Center, which sold for $73 million, or $231,000 per room.
The Westin Reston International Center is scheduled for February 2008 delivery.
Hotel Submarket Rooms Square Feet Delivery Hampton Inn Herndon Herndon 96 75,000 October 2007 Westin Reston International Center Reston 175 100,000 February 2008 Marriott Residence Inn Springfield Springfield 163 108,000 January 2008
Hotels Under Construction, First Half 2007
Hotel Submarket Rooms Delivery Hyatt Place/AmeriSuites Chantilly 124 October 2007 Hampton Inn Alexandria–Old Town South Richmond Highway 57 November 2007 Crowne Plaza/Holiday Inn Tysons Corner 316 October 2007
Hotels Under Renovation, First Half 2007
All Hotel Sales by Submarket
Building Address Submarket Sale Price Square Feet $/S.F. $/RoomFairfield Inn by Marriott 3960 Corsair Court Chantilly $12,891,126 41,849 $308.04 $149,897Hyatt Fair Lakes 12777 Fair Lakes Circle Fairfax Center $73,000,000 241,778 $301.93 $231,013Fairview Park Marriott 3111 Fairview Park Drive South Merrifield $108,500,000 308,062 $352.20 $274,684Best Western Mount Vernon 8751 Richmond Highway Richmond Highway $7,540,000 75,050 $100.47 $57,121Holiday Inn Express Springfield 6401 Brandon Avenue Springfield $12,000,000 98,722 $121.55 $61,856

18 Real Estate Report—Midyear 2007 © Fairfax County Economic Development Authority
Using This Report Glossary & Submarket Map
GlossaryAbsorption
Total—The sum of all reported transac-tions, including new, relet, sublet and pre-leasing. This figure is the total of all leasing activity within the previous six months.
Relet—Previously occupied space leased.
New—Newly constructed space leased.
Sublet—Leased space, via an existing ten-ant and not the landlord.
Deliveries
Buildings for which a certificate of occu-pancy has been issued. This figure is for the previous six months only.
Inventory
Office—The total amount of existing rentable square feet. All buildings, including commercial condominiums, owner-occupied properties and single-tenant buildings are included.
Industrial/Flex—The total amount of existing rentable square feet. All buildings, including commercial condominiums, owner-occupied properties and single- tenant buildings are included.
Hotel—The total building area of all hotels with 75 or more rooms.
Leases
Full Service (FS) Leases: Sometimes referred to as Gross Rent. This rate includes operating expenses, CAM, real estate taxes and insurance for which the landlord is respon-sible. A tenant may pay for increases in these costs over a base year, which is stipulated in a lease. Most common for office leases.
Industrial Gross (IG): Base rent includes insurance and real estate taxes with tenant responsible for increases over this base year. Tenant is also responsible for the CAM charge.
Modified Gross (MG): Similar to a full service lease, but some base services are not included. Typically, maintenance, janitorial and utilities are excluded. Covered expenses are controlled by either a base year or an expense stop. Most common in medical office buildings or single-story, multi-tenant buildings.
Net Leases: The tenant is responsible for some or all of the operating expenses, such as real estate taxes, insurance, utilities and CAM charges. Most common for industrial/flex leases. The primary types of Net Leases are:
• Net (N): In addition to rent, tenant typi-cally pays for utilities.
• Double Net (NN): In addition to rent, tenant typically pays for utilities and cleaning.
• Triple Net (NNN): Sometimes referred to as a Pure Net Lease, in which the tenant is responsible for all or almost all of the operating expenses, such as utilities, CAM, real estate taxes and insurance.
Space Available
Total—Sum of relet, new and sublet avail-able space.
Relet—Previously occupied available space.
New—Newly constructed available space.
WASHINGTON,D.C.
BurkeSpringfield
Annandale
Reston
TysonsCorner
City ofFairfax
TOWN OF CLIFTON
McLean
CITY OFALEXANDRIA
7
28
MARYLAND
GreatFalls
Chantilly
Centreville
7
Mount Vernon
3
1 2
ARLINGTONCOUNTY
RONALD REAGANWASHINGTON
NATIONAL AIRPORT
Fairfax
Merrifield
Franconia
5
4
15
3
Town ofVienna
Town ofHerndon
Dulles
50
50
2929
1
City ofFalls Church
14
236
WASHINGTON DULLESINTERNATIONAL
AIRPORT267
123
5
FORTBELVOIR
1
PRINCE WILLIAMCOUNTY
LOUDOUN
C
OUNTY
4
8
Oakton
County Parkway
123
1
BaileysCrossroads
2
SevenCorners
Richmond Hwy 1395
495 395
10
Newington
Lorton
16
66
6
FairfaxCenter
Dulles Airport Access & Toll Road
4
5
1 2 3
495
66
7
17
912
11
Fairfax County Submarket Map
12
13
5
4
9
15
3
7
11
14
8
17
1
2
10
16
6 Dulles (formerly Oak Hill/Herndon)
Sublet—Available space, via an existing tenant and not the landlord. May or may not be occupied.
Under Construction
Buildings where construction has begun as evidenced by site work such as excavation or foundation placement. Site grading and demolition of existing structures do not meet these criteria. This figure is for the previous six months only.
Vacancy Rates
Direct—The direct vacancy rate is total direct available space divided by the inventory. Direct
available space consists of space, new or relet, that is available directly through the landlord and not a third party such as an existing tenant. Buildings under construction are not included in this figure.
Sublet—The sublet vacancy rate is the aggre-gate of direct available space plus sublet avail-able space available divided by the inventory. As such, the sublet vacancy rate will always be equal to or higher than the direct vacancy rate. Buildings under construction are not included in this figure.

© Fairfax County Economic Development Authority Real Estate Report—Midyear 2007 19
WASHINGTON,D.C.
BurkeSpringfield
Annandale
Reston
TysonsCorner
City ofFairfax
TOWN OF CLIFTON
McLean
CITY OFALEXANDRIA
7
28
MARYLAND
GreatFalls
Chantilly
Centreville
7
Mount Vernon
3
1 2
ARLINGTONCOUNTY
RONALD REAGANWASHINGTON
NATIONAL AIRPORT
Fairfax
Merrifield
Franconia
5
4
15
3
Town ofVienna
Town ofHerndon
Dulles
50
50
2929
1
City ofFalls Church
14
236
WASHINGTON DULLESINTERNATIONAL
AIRPORT267
123
5
FORTBELVOIR
1
PRINCE WILLIAMCOUNTY
LOUDOUN
C
OUNTY
4
8
Oakton
County Parkway
123
1
BaileysCrossroads
2
SevenCorners
Richmond Hwy 1395
495 395
10
Newington
Lorton
16
66
6
FairfaxCenter
Dulles Airport Access & Toll Road
4
5
1 2 3
495
66
7
17
912
11
In addition to the Real Estate Report, the Fairfax County Economic Development Authority (FCEDA) has numerous resources available to assist those looking for information about Fairfax County. Publications range from an annual overview of the FCEDA’s work to a guide to doing business in the county. All the publications are free and most can be downloaded from the FCEDA’s Web site at www.FairfaxCountyEDA.org. Contact the FCEDA office at 703-790-0600 or [email protected] for printed copies.
FCEDA Resources
Overview BrochureDescribes aspects that make Fairfax County a prime location for both domestic and international businesses, including proximity to Wash-ington, D.C., fiscal standing, business environment, Washington Dulles International Airport, labor force, educational system and quality of life. Hard copy and Web versions available.
Small Business Information
Business VenturesQuarterly newsletter covering news of interest to small, minority- and woman-owned businesses. Hard copy and Web versions available.
Small Business Calendar of Events Web version only.
Summary ReportsOverviews, fact sheets and lists providing information on the follow-ing topics, as compiled by the FCEDA. Hard copy and Web versions available.
• Associations
• Bioscience Resources
• Chambers of Commerce
• Colleges and Universities
• Education
• Employment Services
• Embassy Contacts
• Emerging Markets
• Executive Suites
• Fairfax County Fact Sheet
• FCEDA Headquarters Fact Sheet
• Foreign-Owned Firms
• Government Procurement
• Procurement for Emerging Markets
• Incubators
• Largest Employers
• Local and State Taxes
• Technology Firms
• Venture Capital
• Wages
Annual ReportDetailed summary of the FCEDA’s activity and Fairfax County’s busi-ness growth during the previous year—including economic indicators, marketing results and real estate trends. Available in hard copy and on the FCEDA’s Web site.
Area Business ReportsDemographic information and other statistics summarized for seven geographic submarkets in Fairfax County. Hard copy and Web ver-sions available. Areas covered include:
• Annandale–Baileys Crossroads–Seven Corners
• Herndon (Town of)
• Merrifield
• Reston
• Richmond Highway Corridor–Southeast Fairfax
• Springfield–Interstate 95 Corridor
• Tysons Corner
• Western Fairfax
Fairfax County Profile Summarizes topics of interest to businesses. Hard copy and Web versions available. Sections include:
• Fairfax County Overview
• Business Community
• Technology
• Demographics
• Education
• Quality of Life
• Health and Community Services
• Transportation
Doing Business in Fairfax CountySummarizes government regulations and provides guidelines and ref-erence information on starting and operating a business in the county. Hard copy and Web versions available.
Fairfax County LeaderQuarterly newsletter containing recent announcements, county sta-tistics, profiles on local firms and FCEDA programs and services. Hard copy and Web versions.
©2007 Fairfax County Economic Development Authority (FCEDA). The data presented here have been compiled from information provided by commercial real estate owners, developers, brokers, local periodicals, private businesses and public agencies. Statistics contained within are extremely fluid and subject to change without notice. The accep-tance and use of this report by any individual or group is with the understanding that the Fairfax County Economic Development Authority makes no warranties, expressed or implied, regarding the accuracy, completeness and reliability of the data contained within. It is the responsibility of the user to verify its completeness and accuracy.
This free survey is published biannually and copies of prior surveys dating from 1980 are available. For more information, call Curt Hoffman at 703-790-0600.

Fairfax County Economic Development Authority8300 Boone Boulevard, Suite 450Vienna, Virginia 22182-2633
Presorted StandardU.S. Postage
PAIDPermit No. 6353
Merrifield, VA 22116
8300 Boone Boulevard, Suite 450, Vienna, Virginia 22182Phone 703-790-0600 • Fax 703-893-1269 • E-mail [email protected] • URL www.FairfaxCountyEDA.org
The Fairfax County Economic Development Authority is an independent authority created under state law, operating under the direction of seven Commissioners appointed by the Fairfax County Board of Supervisors. Its activities are funded by Fairfax County.
COUNTY BOARD OF SUPERVISORS Gerald E. Connolly, Chairman • Sharon Bulova, Vice Chairman
Joan DuBois • Michael R. Frey • Penelope A. Gross • Gerry W. Hyland • Catherine M. Hudgins • Dana Kauffman • Elaine McConnell • Linda Q. Smyth
ECONOMIC DEVELOPMENT AUTHORITY COMMISSIONERSSteven Davis, Chairman
Michael S. Horwatt, Vice ChairmanRon Johnson • Mike Lewis • Ann Rodriguez • Sudhakar Shenoy • William Soza
ECONOMIC DEVELOPMENT AUTHORITY STAFFGerald L. Gordon, President and Chief Executive Officer
Robin Fenner, Vice President, ManagementAlan Fogg, Vice President, Communications
Catherine W. Riley, Vice President of Marketing and Director, International MarketingBarbara Cohen, Director, Administration
Anita Grazer, Director, National MarketingIvy G. Richards, Director, Market Research & Real Estate
Karen Smaw, Director, Small and Minority Business Development
REAL ESTATE REPORT PRODUCTION TEAMCurt Hoffman, Content
Christian Koschil, ResearchVicki Serraino, Graphic Design
The Fairfax County Economic Development Authority (FCEDA) assists businesses interested in locating, relocating, or expanding their commercial office or industrial operations in Fairfax County. FCEDA’s services are free and confidential.
November 2007