failure data-driven selective node-level duplication to...
TRANSCRIPT
D.J.K. Mewhort et al. (Eds.): HPCS 2009, LNCS 5976, pp. 304–322, 2010. © Springer-Verlag Berlin Heidelberg 2010
Failure Data-Driven Selective Node-Level Duplication to Improve MTTF in High Performance Computing
Systems
Nithin Nakka and Alok Choudhary
Department of Electrical Engineering and Computer Science Northwestern University
2145 Sheridan Rd, Tech Inst. Bldg., EECS Dept., Evanston IL 60201 {nakka,choudhar}@eecs.northwestern.edu
Abstract. This paper presents our analysis of the failure behavior of large scale systems using the failure logs collected by Los Alamos National Laboratory on 22 of their computing clusters.We note that not all nodes show similar failure behavior in the systems. Our objective, therefore, was to arrive at an ordering of nodes to be incrementally (one by one) selected for duplication so as to achieve a target MTTF for the system after duplicating the least number of nodes. We arrived at a model for the fault coverage provided by duplicating each node and ordered the nodes according to coverage provided by each node. As compared to traditional approach of randomly choosing nodes for duplication, our model‐driven approach provides improvements ranging from 82% to 1700% depending on the improvement in MTTF that is targeted and the failure distri-bution of the nodes in the system.
Keywords: Fault-tolerance, Mean Time To Failure, Duplication, Partial Duplication.
1 Introduction
Computers are being employed increasingly in highly mission- and life-critical and long-running applications. In this scenario, there is a corresponding demand for high reliability and availability of the systems. Since failures are inevitable in a system, the best use of the bad bargain is to employ fault-detection and recovery techniques to meet the requirements. Mean Time to Failure (MTTF) (commonly also referred to as Mean Time Between Failures (MTBF)) is an important well-accepted measure for the reliability of a system. MTTF is the time elapsed, on an average, between any two failures in the component being studied.
Broadly speaking, two types of applications demand high reliability – (i) those which can be stopped and their state captured at a suitable point and their execution resumed at a later point in time from the captured state, also called the checkpointed state, (ii) those programs that cannot be interrupted and need to execute for a mini-mum amount of time, till the application (or the mission) is completed. Most long-running scientific applications are examples of applications in the former category.

Failure Data-Driven Selective Node-Level Duplication to Improve MTTF 305
They require efficient mechanisms to take checkpoints of the entire state of the appli-cation at a suitable point, and effective techniques to detect failures so as to roll back execution to the checkpointed state. For applications in the latter category, such as systems and software for flight, or spacecraft control, a time for the length of the mis-sion (or mission time) is pre-determined and appropriate fault-tolerance techniques need to be deployed to ensure that the entire system does not fail within the mission time. The mission time of a flight system directly determines the length of its travel and is a highly critical decision point.
The MTTF of a system is an estimate of the time for which the system can be ex-pected to work without any failures. Therefore, for applications that can be check-pointed MTTF could be used to determine the checkpointing interval, within which the application’s state must be checkpointed. This would ensure that the checkpoint state itself is not corrupted and hence by rolling back to this state on detecting a fail-ure the application will continue correct execution. For applications of the latter cate-gory, the MTTF can be used to determine the mission time, before which the system executes without any failure.
Understanding the failure behavior of a system can greatly benefit the design of fault-tolerance and reliability techniques for that as well as other systems with similar characteristics and thereby increasing their MTTF. Failure and repair logs are a valu-able source of field failure information. The extent to which the logs aid in reliable design depends on the granularity at which the logging is performed. System level logs could assist in system-wide techniques such as global synchronous checkpointing etc. However, logging at a finer granularity, like that at the node-level, improves the effectiveness of techniques applied at the node level. An important observation that we make in this paper is that, “All nodes in a system are not equal” (either by func-tionality or by failure behavior). We attempt to take into account the logical (in the network configuration) locations of a node in the system, in reconciling its observed failure behavior.
Node-level reliability information also helps in designing and deploying techniques such as duplication selectively to the most critical portions of the system. This de-creases setup, maintenance and performance costs for the system. Furthermore, with a framework for selective fault-tolerance in place the techniques could be customized to meet the specific reliability requirements of the application. In this paper we show how node-level duplication can be customized to meet an application’s target MTTF.
The key contributions of this work are:
1. Analysis of node-level failures and their correlation with system and network con-figuration.
2. Data-driven estimation of the coverage provided for selective duplication of nodes in the system.
3. A methodology for selecting an optimal or near-optimal subset of the nodes that need to be duplicated to achieve the MTTF requirements of the application.
Description of Systems under Study and Data Sets Los Alamos National Laboratory has collected and published data regarding the fail-ure and usage of 22 of their supercomputing clusters. This data was previously ana-lyzed by Schroeder et. al. from CMU to study the statistics of the data in terms of the root cause of the failures, mean time between failures and the mean time to repair.

306 N. Nakka and A. Choudhary
Table 1 provides the details of the systems. In the “Production Time” column the range of times specifies the node installation to decommissioning times. A value of “N/A” indicates that the nodes in the system have been installed before the observa-tion period began. For these machines, we consider the beginning of the observation period (November 1996) as the starting date for calculating the production time. For some machines, multiple ranges of production times have been provided. This is because the systems have been upgraded during the observation period and each pro-duction time range corresponds to set of nodes within the system. For the sake of simplicity, for all such machines, we consider the production time to be the longest range among the specified ranges.
The failure data for a single system includes the following fields:
System: The number of the system under study (as referred to by Los Alamos Laboratory)
machine type: The type of the system (smp, cluster, numa) number of nodes: The number of nodes in the system number of processors per node: Some systems are heterogenous in that they contain
nodes with different number of processors per node number of processors total: Total number of processors in the system
= , where for a system, is the number of node types in the system,
is the number of nodes of type and is the number of processors in a node of
type . node number starting with zero: This node numbering is provided by Los Alamos
so as to maintain consistency among all systems in terms of node numbering for eas-ier comparison of systems.
install date: Date that the node was installed in the system. Since the systems under study were upgraded during the period of study, this field can vary for nodes within a system
production date: Date, after the installation date, where the node has been tested for initial burn-in effects and known operational failures, so that the node could be used to run production applications.
decommission date: Date that the node was removed from the system. field replacable unit type: Whether on a failure the repair procedure involves re-
placing the entire unit or a portion of it. memory: the amount of memory on the node node purpose: The function of the node in the overall system: (i) compute, (ii)
front end, (iii) graphics or a combination of the three such as graphics.fe (both graph-ics and front end).
Problem Started (mm/dd/yy hh:mm): The time of occurrence of the failure event. This is logged by an automated fault detection engine.
Problem Fixed (mm/dd/yy hh:mm): The time at which the failure was repaired and the system restored. This is logged by the administrators and repair staff.
Down Time: The time elapsed between the occurrence of the problem and restora-tion of the system.

Failure Data-Driven Selective Node-Level Duplication to Improve MTTF 307
The root cause for the failures is classified in the following categories: (i) Facili-ties, (ii) Hardware, (iii) Human Error, (iv) Network, (v) Undetermined, or, (vi) Soft-ware.
Table 1. Characteristics of Systems under study
SystemType Category
SystemNumber
Numnodes
# procsin node
# procsNetworkTopology
ProductionTime
Remarks
A smp 7 1 8 8Not
ApplicableN/A – 12/99
B smp 24 1 32 32Not
ApplicableN/A – 12/03
C smp 22 1 4 4Not
ApplicableN/A – 04/03
D cluster 8 164 2 328GigaBit
Ethernet Tree04/01 – 11/05u12/02 – 11/05
cluster 20 256 4 1024 12/01 – 11/05cluster 21 128 4 512 09/01 – 01/02cluster 18 1024 4 4096 05/02 – 11/05cluster 19 1024 4 4096
Dual railfat tree
10/02 – 11/05cluster 3 128 4 512 09/03 – 11/05cluster 4 128 4 512 09/03 – 11/05cluster 5 128 4 512 09/03 – 11/05
E
cluster 6 32 4 128
Single railfat tree
09/03 – 11/05cluster 14 128 2 256 09/03 – 11/05cluster 9 256 2 512 09/03 – 11/05cluster 10 256 2 512 09/03 – 11/05cluster 11 256 2 512 09/03 – 11/05cluster 13 256 2 512 09/03 – 11/05
F
cluster 12 512 2 1024
Single railfat tree
09/03 – 11/0503/05 – 06/05
Most jobsrun on onlyone 256node
segment
cluster 16 16 128 2048 12/96 – 09/02
cluster 2 49 128, 80 615201/97 – 11/0506/05 – 11/05
G
cluster 23 5 128, 32 544
Multi railfat tree 10/98 – 12/04
01/98 – 12/0411/02 – 11/0511/05 – 12/04
H numa 15 1 256 256 11/04 – 11/05
2 Related Work
There has been significant study over the past few decades on analyzing failure logs from large-scale computers to understand the failure behavior of such systems and possibly use the knowledge in improving system design. Plank et. al. 0 derive an op-timal checkpointing interval for an application using the failures logs obtained from networks of workstations. They derive the failure rate of the machines using the time between failures observed in the logs. In another study, Nath et. al. 0 study real-world
308 N. Nakka and A. Choudhary
failure traces to recommend design principles that can be used to tolerate correlated failures. Particularly they have used it in recommending data placement strategies for correlated failures.
Prior work in analyzing failure rates tried to arrive at reasonable curves that fit the failure distribution of the systems 0-0. Schroeder and Gibson 0 have presented the characteristics of the failure data that has been used in this study as well. However, a limitation of these studies is that they do not evaluate how system design choices could be affected by the failure characteristics that they have derived from the data. In this work we specific attempt to understand the failure behavior and use that knowl-edge in the design of an optimal node-level duplication strategy with the aim of in-creasing the overall availability of the system at the least cost.
There is also interesting research work in understanding the correlations between system parameters and failure rate. Sahoo et. al. 0 show that the workload of the sys-tem is closely correlated with its failure rate, whereas Iyer 0 and Castillo 0 bring out the correlation between workload intensity and the failure rate. In our study we study the dependency of failure rate on network configuration, which in turn determines the workload characteristics of the system. For example, a fat tree topology necessitates higher communication and computation bandwidth and load at the higher levels of the tree structure.
Oliner and Stearley 0 have analyzed system logs from five supercomputers and critically evaluate the interpretations of system administrators from patterns observed in the logs. They propose a filtering algorithm to identify alerts from system logs. They also recommend enhancements to the logging procedures so as to include in-formation crucial in identifying alerts from non-alerts.
Lan et. al. 00 have proposed a machine-learning based automatic diagnosis and prognosis engine for failures through their analysis of the logs on Blue Gene/L sys-tems deployed at multiple locations. Their goal is to feed the knowledge inferred from the logs to checkpointing and migration tools 00 to reduce the overall application completion time.
Oliner et. al. 0 derive failure distributions from multiple supercomputing systems and propose novel job-scheduling algorithms that take into account the occurrence of fail-ures in the system. They evaluated the impact of this on the average bounded slowdown, average response time and system utilization. In our study we have utilized failure and repair time distributions to propose a novel node-level duplication strategy. The metric of evaluation used is the mean time to failure (MTTF) of the system.
Duplication, both at the system- and node- level has been a topic of active and ex-tensive research in the micro-architecture and fault –tolerant computing areas. Error Detection Using Duplicated Instructions (EDDI) 0 duplicates original instructions in the program but with different registers and variables. Duplication at the application level increases the code size of the application in memory. More importantly, it reduces the instruction supply bandwidth from the memory to the processor. Error Detection by Diverse Data and Duplicated Instructions (ED4I) 0 is a software-implemented hardware fault tolerance technique in which two “different” programs with the same functionality are executed, but with different data sets, and their outputs are compared. The “different” programs are generated by multiplying all variables and constants in the original program by a diversity factor k.

Failure Data-Driven Selective Node-Level Duplication to Improve MTTF 309
In the realm of commercial processors the IBM G5 processor 0 has extra I- and E- units to provide duplicate execution of instructions. To support duplicate execution, the G5 is restricted to a single-issue processor and incurs 35% hardware overhead.
In experimental research, simultaneous multithreading (SMT) 0 and the chip mul-tiprocessor (CMP) architectures have been ideal bases for space and time redundant fault-tolerant designs because of their inherent redundancy. In simultaneously and redundantly threaded (SRT) processor, only instructions whose side effects are visible beyond the boundaries of the processor core are checked 0-0. This was subsequently extended in SRTR to include recovery 0. Another fault-tolerant architecture is pro-posed in the DIVA design 00. DIVA comprises an aggressive out-of-order superscalar processor along with a simple in-order checker processor. Microprocessor-based in-trospection (MBI) 0 achieves time redundancy by scheduling the redundant execution of a program during idle cycles in which a long-latency cache miss is being serviced. SRTR 0 and MBI 0 have reported up to 30% performance overhead, which are close to the overhead observed for Full Duplication (FullRep) in our experiments. These results counter the widely-used belief that full duplication at the processor-level in-curs little or no performance overhead.
SLICK 0 is an SRT-based approach to provide partial replication of an application. The goals of this approach are similar to ours. However, unlike this approach we do not rely on a multi-threaded architecture for the replication. Instead, this paper pre-sents modifications to a general superscalar processor to support partial or selective replication of the application.
As for research and production systems employing system-level duplication, the space mission to land on the moon used a TMR enhanced computer system 0. The TANDEM, now HP, Integrity S2 computer system 0 provided reliability through the concept of full duplication at the hardware level. The AT&T No.5 ESS tele-communications switch 0, 0 uses duplication in its administrative module consisting of the 3B20S processor, an I/O processor, and an automatic message accounting unit, to provide high reliability and availability. The JPL STAR computer 0 system for space applications primarily used hardware subsystem fault-tolerant techniques, such as functional unit redundancy, voting, power-spare switching, coding, and self-checks.
3 Failure Rate Correlation with Network Configuration
The failure data for each system is analyzed independently. The data set contains the data for all the systems in a monolithic fashion. Therefore, the data is split based on the system number. For data for a specific system, using the nodenumz field, which gives the number of the failed node, the failures for each node are aggregated and the number of failures for each node calculated. This data provides an ordering of the nodes based on the number of failures experienced by the node within the observation period. The number of failures per node also provides insights into the correlation between the node’s failure behavior and the logical location of the node in the sys-tem’s network configuration.

310 N. Nakka and A. Choudhary
Fig. 1. Number of failures for nodes in System 18
Fig. 2. Number of failures for nodes in System 19

Failure Data-Driven Selective Node-Level Duplication to Improve MTTF 311
As mentioned before, the nodes of a particular system show variability in the fail-ure rate. This could partly be explained by the network configuration of the distrib-uted system.
Fig. 1 and Fig. 2 show the failure behavior of individual nodes in System 18 and 19. The figure shows that the peaks of failures are at nodes with numbers that are multiples of 32, with a few exceptions. The exception in the failures of other nodes could be due to their specific workload characteristics or due to the inherent failure susceptibility of that node. On discussion with the system administrators, it was re-vealed that these systems are configured such that every 32nd node serves as an NFS root for the other 31 nodes in the group and is running NFS root type services, making its workload considerably higher than the rest.
4 Approach
This section describes our approach for analyzing the data and building a model used for selective node-level duplication. The records for a single node are ordered accord-ing to the time of occurrence of the failure, as given by the “Prob Started field”. The time elapsed between the start of one failure and the consecutive failure in this or-dered list gives the time between these two failures. Following this procedure the times between failure for each pair of failures for the node are calculated. The average of all these times is used as an estimate for the mean time between failures or the mean time to failure (MTTF) for the node. Time To Failure (TTF) for a fault
1)()( −−== iii startedprobstartedprobTTFi . Therefore,
n
dateinstallsystemstartedprob
n
TTFMTTF n
n
ii )()( −==
∑ OR
MTTF is calculated as:
Eq. 1
The period of study of a system is its production time, defined elsewhere as the time between its installation and its decommissioning or the end of the observation period, whichever occurs first.
The “Downtime” field provides the time required by the administrators to fix the failure and bring the system back to its original state. It can be calculated as the dif-ference between the “Prob Ended” and “Prob Started” fields. This is the repair time for this failure. Averaging this field over all the records for a single node provides an estimate for the mean time to repair (MTTR) for this node. Time To Repair (TTR) for
a failure iii startedprobfixedprobTTRi )()( −== . Therefore, Mean Time To
Repair is given by

312 N. Nakka and A. Choudhary
n
TTRMTTR
n
ii∑
=
4.1 Introducing Node-Level Duplication
From the previous analysis procedures, the MTTF and the MTTR for a node have been estimated. Now, we introduce a methodology to understand the effect on node failure if we augment it with a spare node. Fig. 3 shows the states through which a duplicated node transitions on failure and repair events. When both the original and the spare node are working correctly the system is in state “2”. It is assumed that, af-ter a failure is detected in the node, the system has the reconfiguration capability to fail over to the spare node instantaneously. Computation therefore continues uninter-ruptedly. This state of the node is represented by state “1” in the figure. In the mean time, the original node is repaired. The roles of the spare node and original node are switched. If no other failure occurs in the node, before the original node is repaired, then the original node assumes the role of the spare node, while the computation con-tinues on the spare node. Essentially, the system is brought back to its pristine, fault-free state (State “2” in the figure). However, if the next failure for the node occurs within the mean time to repair for that node, then it is not possible to continue compu-tation on that node. The node reaches state “0”. We declare that duplication cannot cover this second failure. There are other possible transitions between these states, shown as dotted lines in Fig. 3. They are (i) State “0” to “2”: When both the original and spare nodes are repaired and the node returns to its normal state. (ii) State “0” to “1”: When one of the failed nodes (the original or the spare) is repaired and computa-tion continues on this node. (iii) State “2” to “0”: When both nodes fail at the same time. However, it is to be noted that for the analysis based on the data these transi-tions need not be considered. There would not be a transition from State “2” to “0” since the data represent failures only in one single node and would not therefore have
2 1
0
1st failure
Failure of original node
Mean time to repair for Node
Fig. 3. State transition diagram for node failure with duplication

Failure Data-Driven Selective Node-Level Duplication to Improve MTTF 313
two simultaneous failures. The purpose of the analysis (aided by the state transition diagram) is to decide whether a particular failure can be covered by duplication or not. Once the node reaches State “0” it is declared that the failure cannot be covered by duplication. Therefore, outward transitions from State “0” (to States “1” and “2”) are not considered.
Based on this analysis, conducted for each node individually, we evaluate all the failures that are covered by duplication. This analysis provides an estimate of the nodes that benefit the most (have the maximum reduction in the number of failures) when they are duplicated.
The next part of the study is used to achieve application requirements of MTTF. To estimate the improvement in MTTF using node-level duplication, the nodes are or-dered in terms of the reduction in number of failures when they are duplicated. In short, we will refer to this sorting criterion as the duplication coverage of the node. For a system without duplication the MTTF is calculated as the ratio between the total period of observation for the system and the number of failures observed as in the original data. Now, we pick the node with the highest duplication coverage. The MTTF for the system is recalculated as the total observation period for the system divided by the remaining number of failures in the system. Since the total observation period is constant, the MTTF is inversely proportional to the number of failures re-maining in the system. Next, we pick the node with the next highest duplication cov-erage and recalculate the MTTF. Progressively, we include nodes in the order of their duplication coverage and calculate the MTTF. The duplication of nodes is continued until the MTTF requirements of the application are met.
4.2 Effect of Duplication on System Reliability
The node-level failure information is interpolated by selectively applying duplication to nodes that are most sensitive to errors. Depending on its execution profile, or on the frequency of its checkpointing support, the application demands a certain mean time to failure from the system so as to reduce the amount of wasted computation in the event of a failure. We study how the MTTF of the system is affected by incrementally adding dual redundancy to the nodes in the system.
In this study we consider node-level duplication as a fault-tolerance technique em-ployed to increase the MTTF of a system. For each node that is duplicated, using the analysis mentioned in Section 0, some or all of the failures for that node are covered. This decreases the total number of failures in the system, thereby increasing the MTTF of the system using Eq. 1. If no information about the failure rate of nodes is available, all nodes would be assumed to fail uniformly and therefore the nodes to be duplicated would be picked at random one after another. We refer to this as the Tradi-tional approach. However, with the failure rate analysis of the data we have derived a model for the coverage provided by duplication at the node-level and an ordering for the nodes based on the improvement in coverage by duplicating that node. Using this model, we may be able to improve the choice of nodes to be duplicated. This is the “Model-driven” approach to selecting nodes for incremental duplication.
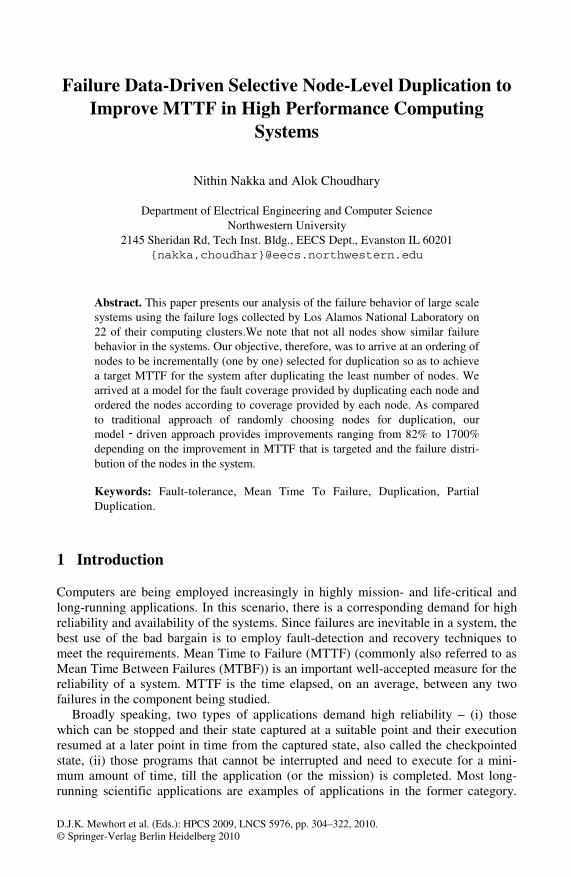
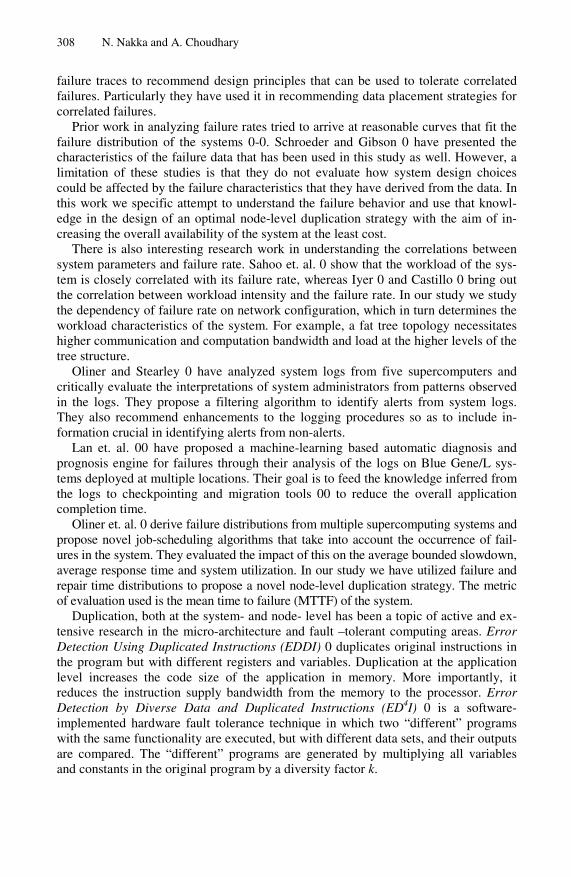
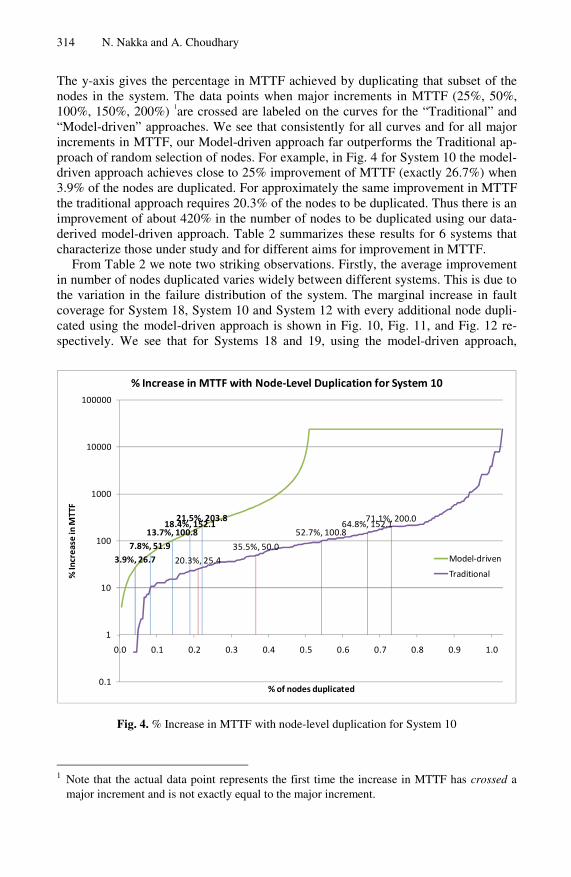
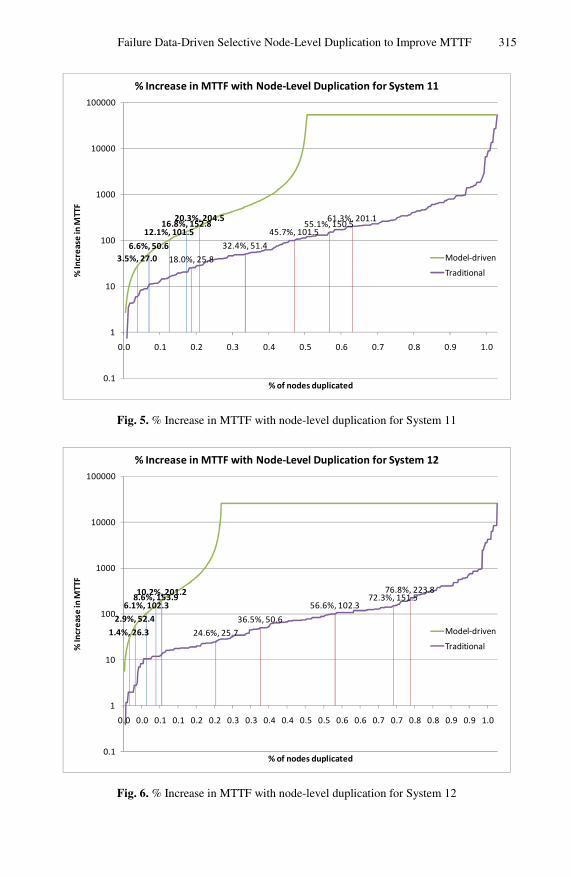
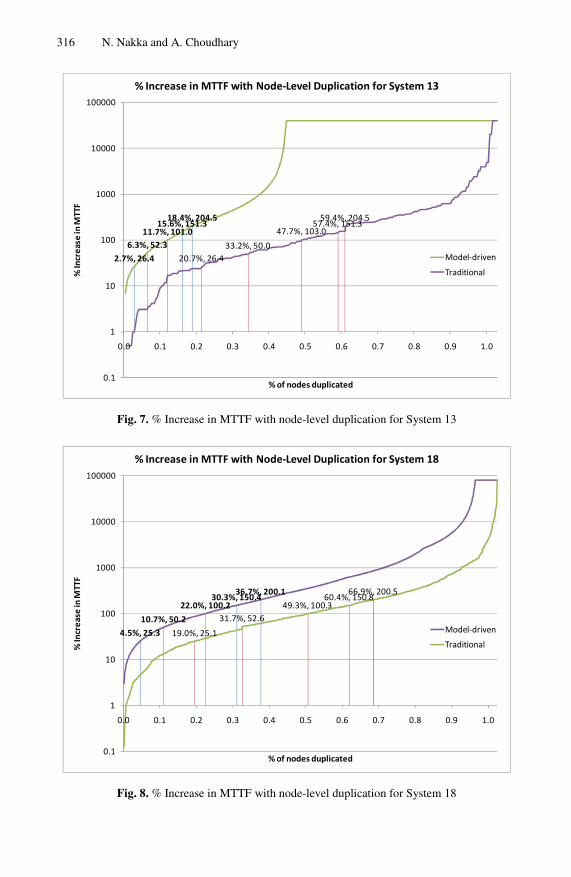
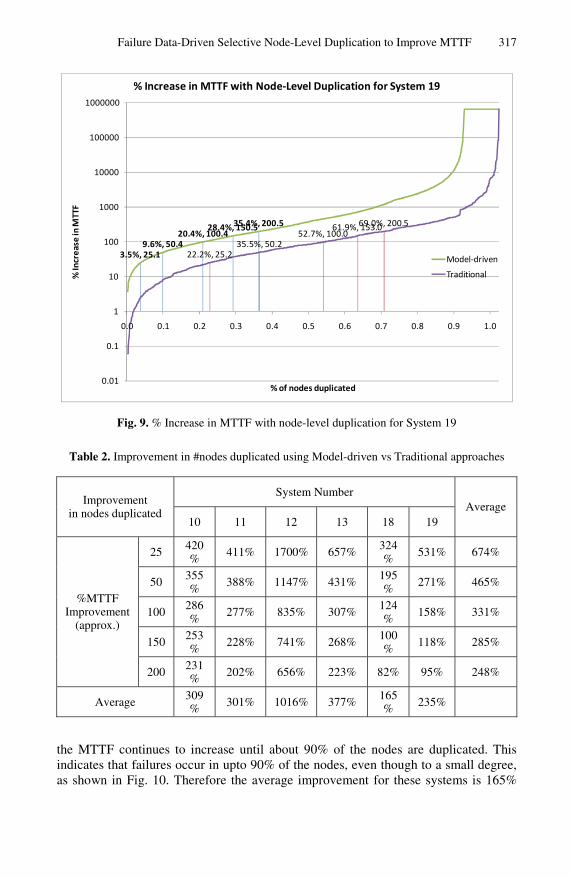
Fig. 4 through Fig. 9 compare the cumulative increase in MTTF due to incremental node duplication for Systems 10, 11, 12, 13, 18, and 19 respectively, for these two approaches. The x-axis represents the percentage of nodes that have been duplicated.
314 N. Nakka and A. Choudhary
The y-axis gives the percentage in MTTF achieved by duplicating that subset of the nodes in the system. The data points when major increments in MTTF (25%, 50%, 100%, 150%, 200%) 1are crossed are labeled on the curves for the “Traditional” and “Model-driven” approaches. We see that consistently for all curves and for all major increments in MTTF, our Model-driven approach far outperforms the Traditional ap-proach of random selection of nodes. For example, in Fig. 4 for System 10 the model-driven approach achieves close to 25% improvement of MTTF (exactly 26.7%) when 3.9% of the nodes are duplicated. For approximately the same improvement in MTTF the traditional approach requires 20.3% of the nodes to be duplicated. Thus there is an improvement of about 420% in the number of nodes to be duplicated using our data-derived model-driven approach. Table 2 summarizes these results for 6 systems that characterize those under study and for different aims for improvement in MTTF.
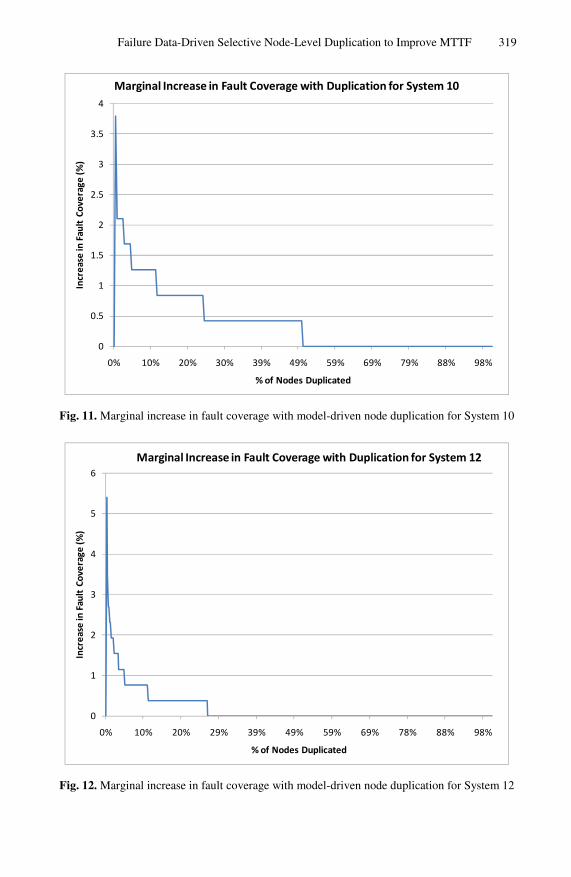
From Table 2 we note two striking observations. Firstly, the average improvement in number of nodes duplicated varies widely between different systems. This is due to the variation in the failure distribution of the system. The marginal increase in fault coverage for System 18, System 10 and System 12 with every additional node dupli-cated using the model-driven approach is shown in Fig. 10, Fig. 11, and Fig. 12 re-spectively. We see that for Systems 18 and 19, using the model-driven approach,
3.9%, 26.77.8%, 51.9
13.7%, 100.818.4%, 152.1
21.5%, 203.8
20.3%, 25.4
35.5%, 50.0
52.7%, 100.864.8%, 152.1
71.1%, 200.0
0.1
1
10
100
1000
10000
100000
0.0 0.1 0.2 0.3 0.4 0.5 0.6 0.7 0.8 0.9 1.0
% In
crea
se in
MTT
F
% of nodes duplicated
% Increase in MTTF with Node-Level Duplication for System 10
Model-driven
Traditional
Fig. 4. % Increase in MTTF with node-level duplication for System 10
1 Note that the actual data point represents the first time the increase in MTTF has crossed a
major increment and is not exactly equal to the major increment.
Failure Data-Driven Selective Node-Level Duplication to Improve MTTF 315
3.5%, 27.06.6%, 50.6
12.1%, 101.516.8%, 152.8
20.3%, 204.5
18.0%, 25.8
32.4%, 51.4
45.7%, 101.555.1%, 150.5
61.3%, 201.1
0.1
1
10
100
1000
10000
100000
0.0 0.1 0.2 0.3 0.4 0.5 0.6 0.7 0.8 0.9 1.0
% In
crea
se in
MTT
F
% of nodes duplicated
% Increase in MTTF with Node-Level Duplication for System 11
Model-driven
Traditional
Fig. 5. % Increase in MTTF with node-level duplication for System 11
1.4%, 26.3
2.9%, 52.4
6.1%, 102.38.6%, 153.910.2%, 201.2
24.6%, 25.7
36.5%, 50.6
56.6%, 102.372.3%, 151.5
76.8%, 223.8
0.1
1
10
100
1000
10000
100000
0.0 0.0 0.1 0.1 0.2 0.2 0.3 0.3 0.4 0.4 0.5 0.5 0.6 0.6 0.7 0.7 0.8 0.8 0.9 0.9 1.0
% In
crea
se in
MTT
F
% of nodes duplicated
% Increase in MTTF with Node-Level Duplication for System 12
Model-driven
Traditional
Fig. 6. % Increase in MTTF with node-level duplication for System 12
316 N. Nakka and A. Choudhary
2.7%, 26.4
6.3%, 52.311.7%, 101.0
15.6%, 151.318.4%, 204.5
20.7%, 26.433.2%, 50.0
47.7%, 103.057.4%, 151.3
59.4%, 204.5
0.1
1
10
100
1000
10000
100000
0.0 0.1 0.2 0.3 0.4 0.5 0.6 0.7 0.8 0.9 1.0
% In
crea
se in
MTT
F
% of nodes duplicated
% Increase in MTTF with Node-Level Duplication for System 13
Model-driven
Traditional
Fig. 7. % Increase in MTTF with node-level duplication for System 13
4.5%, 25.3
10.7%, 50.2
22.0%, 100.230.3%, 150.4
36.7%, 200.1
19.0%, 25.1
31.7%, 52.649.3%, 100.3
60.4%, 150.866.9%, 200.5
0.1
1
10
100
1000
10000
100000
0.0 0.1 0.2 0.3 0.4 0.5 0.6 0.7 0.8 0.9 1.0
% In
crea
se in
MTT
F
% of nodes duplicated
% Increase in MTTF with Node-Level Duplication for System 18
Model-driven
Traditional
Fig. 8. % Increase in MTTF with node-level duplication for System 18
Failure Data-Driven Selective Node-Level Duplication to Improve MTTF 317
3.5%, 25.19.6%, 50.4
20.4%, 100.428.4%, 150.535.4%, 200.5
22.2%, 25.235.5%, 50.2
52.7%, 100.061.9%, 153.069.0%, 200.5
0.01
0.1
1
10
100
1000
10000
100000
1000000
0.0 0.1 0.2 0.3 0.4 0.5 0.6 0.7 0.8 0.9 1.0
% In
crea
se in
MTT
F
% of nodes duplicated
% Increase in MTTF with Node-Level Duplication for System 19
Model-driven
Traditional
Fig. 9. % Increase in MTTF with node-level duplication for System 19
Table 2. Improvement in #nodes duplicated using Model-driven vs Traditional approaches
System Number Improvement
in nodes duplicated 10 11 12 13 18 19
Average
25 420%
411% 1700% 657% 324%
531% 674%
50 355%
388% 1147% 431% 195%
271% 465%
100 286%
277% 835% 307% 124%
158% 331%
150 253%
228% 741% 268% 100%
118% 285%
%MTTF Improvement
(approx.)
200 231% 202% 656% 223% 82% 95% 248%
Average 309% 301% 1016% 377%
165% 235%
the MTTF continues to increase until about 90% of the nodes are duplicated. This indicates that failures occur in upto 90% of the nodes, even though to a small degree, as shown in Fig. 10. Therefore the average improvement for these systems is 165%

318 N. Nakka and A. Choudhary
and 235% respectively. For Systems 10, 11 and 13, it is seen that failures occur in only about 50% of the nodes (please see Fig. 11), thus there is an initial rapid im-provement in MTTF using the model-driven approach as compared to the traditional approach. The average improvement for these systems ranges between 300 to 375%. For System 12, failures are concentrated in only upto 25% of the nodes, as shown in Fig. 12. Therefore, the improvement is even more stark and rapid, thereby showing an average improvement of about 1000%.
0
0.5
1
1.5
2
2.5
3
3.5
0% 10% 20% 29% 39% 49% 59% 68% 78% 88% 98%
Incr
ease
in F
ault
Cove
rage
(%)
% of Nodes Duplicated
Marginal Increase in Fault Coverage with Duplication for System 18
Fig. 10. Marginal increase in fault coverage with model-driven node duplication for System 18
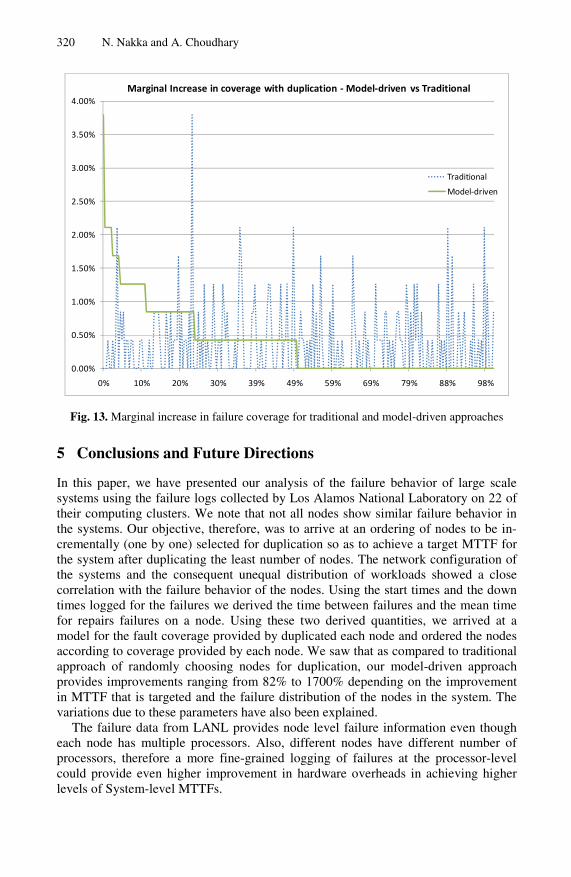
Secondly, the improvement achieved in the nodes to be duplicated decreases as we try to achieve higher increments in MTTF. In other words, the gain in number of nodes duplicated for 25% improvement in MTTF is higher than that for 50% im-provement in MTTF, which in turn is greater than that for a 100% improvement in MTTF and so on. This supports intuition since the model-driven approach is essen-tially greedy. It attempts to pick the node that provides the next best improvement in MTTF (or failure coverage). Therefore, the marginal increase in failure coverage for every additional node that is duplicated decreases monotonically. However, for a ran-dom selection of nodes, it is possible that nodes selected at later stages for duplication have a higher increment in the failure coverage than that of nodes selected in the ear-lier picks. These two trends are depicted in Fig. 13.
Failure Data-Driven Selective Node-Level Duplication to Improve MTTF 319
0
0.5
1
1.5
2
2.5
3
3.5
4
0% 10% 20% 30% 39% 49% 59% 69% 79% 88% 98%
Incr
ease
in F
ault
Cove
rage
(%)
% of Nodes Duplicated
Marginal Increase in Fault Coverage with Duplication for System 10
Fig. 11. Marginal increase in fault coverage with model-driven node duplication for System 10
0
1
2
3
4
5
6
0% 10% 20% 29% 39% 49% 59% 69% 78% 88% 98%
Incr
ease
in F
ault
Cove
rage
(%)
% of Nodes Duplicated
Marginal Increase in Fault Coverage with Duplication for System 12
Fig. 12. Marginal increase in fault coverage with model-driven node duplication for System 12
320 N. Nakka and A. Choudhary
0.00%
0.50%
1.00%
1.50%
2.00%
2.50%
3.00%
3.50%
4.00%
0% 10% 20% 30% 39% 49% 59% 69% 79% 88% 98%
Marginal Increase in coverage with duplication - Model-driven vs Traditional
Traditional
Model-driven
Fig. 13. Marginal increase in failure coverage for traditional and model-driven approaches
5 Conclusions and Future Directions
In this paper, we have presented our analysis of the failure behavior of large scale systems using the failure logs collected by Los Alamos National Laboratory on 22 of their computing clusters. We note that not all nodes show similar failure behavior in the systems. Our objective, therefore, was to arrive at an ordering of nodes to be in-crementally (one by one) selected for duplication so as to achieve a target MTTF for the system after duplicating the least number of nodes. The network configuration of the systems and the consequent unequal distribution of workloads showed a close correlation with the failure behavior of the nodes. Using the start times and the down times logged for the failures we derived the time between failures and the mean time for repairs failures on a node. Using these two derived quantities, we arrived at a model for the fault coverage provided by duplicated each node and ordered the nodes according to coverage provided by each node. We saw that as compared to traditional approach of randomly choosing nodes for duplication, our model-driven approach provides improvements ranging from 82% to 1700% depending on the improvement in MTTF that is targeted and the failure distribution of the nodes in the system. The variations due to these parameters have also been explained.
The failure data from LANL provides node level failure information even though each node has multiple processors. Also, different nodes have different number of processors, therefore a more fine-grained logging of failures at the processor-level could provide even higher improvement in hardware overheads in achieving higher levels of System-level MTTFs.

Failure Data-Driven Selective Node-Level Duplication to Improve MTTF 321
Acknowledgments. This work was supported in part by NSF OCI-0956311, NSF HECURA CCF-0621443, NSF SDCI OCI-0724599, NSF CNS-0830927, NSF IIS-0905205, and DOE SCIDAC-2: Scientific Data Management Center for Enabling Technologies (CET) grant DE-FC02-07ER25808, DOE FASTOS award number DE-FG02-08ER25848. We are very thankful to Gary Grider, John Bent, John Nunez and Satsangat Khalsa from Los Alamos National Laboratory (LANL) for their guidance and providing key insights into the data.
References
1. Plank, J.S., Elwasif, W.R.: Experimental assessment of workstation failures and their im-pact on checkpointing systems. In: Proceedings of Fault Tolerant Computing Systems, FTCS 1998 (1998)
2. Nath, S., Yu, H., Gibbons, P.B., Seshan, S.: Subtleties in tolerating correlated failures. In: Proceedings of the Symposium On Networked Systems Design and Implementation, NSDI 2006 (2006)
3. Heath, T., Martin, R.P., Nguyen, T.D.: Improving cluster availability using workstation validation. In: Proceedings of ACM SIGMETRICS (2002)
4. Long, D., Muir, A., Golding, R.: A longitudinal survey of internet host reliability. In: Pro-ceedings of the 14th Intl. Symposium on Reliable Distributed Systems (1995)
5. Nurmi, D., Brevik, J., Wolski, R.: Modeling machine availability in enterprise and wide-area distributed computing environments. In: Cunha, J.C., Medeiros, P.D. (eds.) Euro-Par 2005. LNCS, vol. 3648, pp. 432–441. Springer, Heidelberg (2005)
6. Sahoo, R.K., Sivasubramaniam, A., Squillante, M.S., Zhang, Y.: Failure data analysis of a large-scale heterogeneous server environment. In: Proceedings of Dependable Systems and Networks (June 2004)
7. Tang, D., Iyer, R.K., Subramani, S.S.: Failure analysis and modelling of a VAX cluster system. In: Fault Tolerant Computing Systems (1990)
8. Xu, J., Kalbarczyk, Z., Iyer, R.K.: Networked Windows NT system field failure data analysis. In: Proc. of the Pacific Rim International Symposium on Dependable Computing (1999)
9. Schroeder, B., Gibson, G.: A large-scale study of failures in high-performance-computing systems. In: Proceedings of the International Conference on Dependable Systems and Networks (DSN), Philadelphia, PA (June 2006)
10. Iyer, R.K., Rossetti, D.J., Hsueh, M.C.: Measurement and modeling of computer reliability as affected by system activity. ACM Transactions on Computing Systems 4(3) (1986)
11. Castillo, X., Siewiorek, D.: Workload, performance, and reliability of digital computing systems. In: 11th International Conference on Fault Tolerant Computing Systems (1981)
12. Oliner, A.J., Stearley, J.: What Supercomputers Say: A Study of Five System Logs. In: Proceedings of the International Conference on Dependable Systems and Networks (DSN), Edinburgh, UK, June 2007, pp. 575–584 (2007)
13. Lan, Z., Li, Y., Gujrati, P., Zheng, Z., Thakur, R., White, J.: A Fault Diagnosis and Prog-nosis Service for TeraGrid Clusters. In: Proceedings of TeraGrid 2007 (2007)
14. Gujrati, P., Li, Y., Lan, Z., Thakur, R., White, J.: Exploring Meta-learning to Improve Failure Prediction in Supercomputing Clusters. In: Proceedings of International Confer-ence on Parallel Processing, ICPP (2007)
15. Li, Y., Lan, Z.: Using Adaptive Fault Tolerance to Improve Application Robustness on the TeraGrid. In: Proceedings of TeraGrid 2007 (2007)
322 N. Nakka and A. Choudhary
16. Lan, Z., Li, Y.: Adaptive Fault Management of Parallel Applications for High Performance Computing. IEEE Transactions on Computers 57(12), 1647–1660 (2008)
17. Oliner, A.J., Sahoo, R.K., Moreira, J.E., Gupta, M., Sivasubramaniam, A.: Fault-aware job scheduling for Bluegene/L systems. In: Proceedings of the 18th International Parallel and Distributed Processing Symposium, IPDPS (2004)
18. Weaver, C., Austin, T.: A fault tolerant approach to microprocessor design. In: Proceed-ings of the International Conference on Dependable Systems and Networks, July 2001, pp. 411–420 (2001)
19. Austin, T.: DIVA: A reliable substrate for deep submicron microarchitecture design. In: Proceedings of the Thirty-Second International Symposium on Microarchitecture, Novem-ber 1999, pp. 196–207 (1999)
20. Vijaykumar, T., Pomeranz, I., Cheng, K.: Transient fault recovery using simultaneous mul-tithreading. In: Proceedings of the Twenty-Ninth Annual International Symposium on Computer Architecture, May 2002, pp. 87–98 (2002)
21. Oh, N., Shirvani, P.P., McCluskey, E.J.: Error detection by duplicated instructions in su-perscalar processors. IEEE Transactions on Reliability 51(1), 63–75 (2002)
22. Oh, N., Mitra, S., McCluskey, E.J.: ED4I: Error Detection by Diverse Data and Duplicated Instructions. IEEE Transactions on Computers 51(2), 180–199 (2002)
23. Slegel, T., et al.: IBM’s S/390 G5 microprocessor design. IEEE Micro 19(2), 12–23 (1999) 24. Tullsen, D.M., Eggers, S.J., Levy, H.M.: Simultaneous multithreading: Maximizing on-
chip performance. In: Proceedings of the Twenty-Second International Symposium on Computer Architecture, June 1995, pp. 392–403 (1995)
25. Rotenberg, E.: AR-SMT: A microarchitectural approach to fault tolerance in microproces-sors. In: Proceedings of the Twenty-Ninth International Symposium on Fault-Tolerant Computing Systems, June 1999, pp. 84–91 (1999)
26. Sundaramoorthy, K., Purser, Z., Rotenberg, E.: Slipstream processors: Improving both per-formance and fault tolerance. In: Proceedings of the Thirty-Third International Symposium on Microarchitecture, December 2000, pp. 269–280 (2000)
27. Reinhardt, S.K., Mukherjee, S.S.: Transient fault detection via simultaneous multithread-ing. In: Proceedings of the Twenty-Seventh International Symposium on Computer Archi-tecture, June 2000, pp. 25–36 (2000)
28. Qureshi, M.A., Mutlu, O., Patt, Y.N.: Microarchitecture-based introspection: A technique for transient-fault tolerance in microprocessors. In: Proceedings of International Confer-ence on Dependable Systems and Networks, June 2005, pp. 434–443 (2005)
29. Parashar, A., Sivasubramaniam, A., Gurumurthi, S.: SlicK: slice-based locality exploita-tion for efficient redundant multithreading. In: Proceedings of the 12th Intl., conference on ASPLOS (2006)
30. Cooper, A.E., Chow, W.T.: Development of on-board space computer systems. IBM Jour-nal of Research and Development 20(1), 5–19 (1976)
31. Jewett, D.: Integrity S2: A fault-tolerant Unix platform. In: Digest of Papers Fault-Tolerant Computing: The Twenty-First International Symposium, Montreal, Canada, June 25-27, pp. 512–519 (1991)
32. AT&T 5ESSTM from top to bottom, http://www.morehouse.org/hin/ess/ess05.htm
33. AT&T Technical Staff. The 5ESS switching system. The AT&T Technical Journal 64(6), Part 2 (July-August 1985)
34. Avizienis, A.: Arithmetic error codes: Cost and effectiveness studies for Application in digital system design. IEEE Transactions on Computers 20(11), 1332–1331 (1971)