failure analysis & test procedure #1 rev
TRANSCRIPT
FAILURE ANALYSIS & TEST PROCEDURE #1

TOPIC
• Visual examination
• Identification analysis
• Microstructural analysis
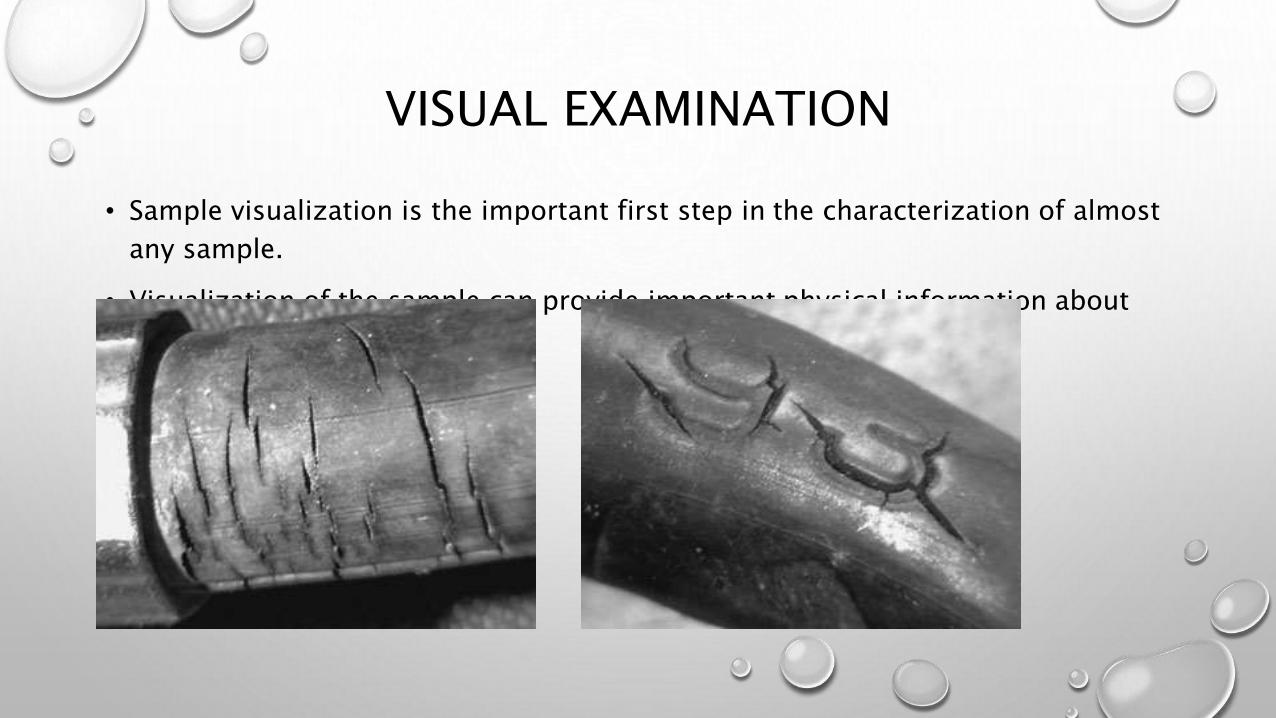
VISUAL EXAMINATION
• Sample visualization is the important first step in the characterization of almost
any sample.
• Visualization of the sample can provide important physical information about
the sample.

• Mechanical failure in polymer materials caused by :
• Excessive deformation
• Ductile failure
• Brittle failure
• Crazing
• Excessive deformation
• Very large deformations are possible in low-modulus polymers are able to
accommodate large strains before failure.
• Such deformations could occur without fracture design features and other
considerations might only tolerate deformations to a prescribed ceiling value.
• The case in rubbery thermoplastics, such as flexible PVC or EVA, for pressurized
tubing.

• Ductile failure
• Encountered in materials that are able to undergo large-scale irreversible plastic
deformation under loading, known as yielding, before fracturing.
• Yielding marks the onset of failure setting the upper limit to stress in service to be
below the yield point is common practice.
• Estimate loading conditions likely to cause yielding (yield criteria), in order to
design components with a view to avoid it in service.

• Brittle failure
• This is a type of failure involves low strains accompanied by negligible permanent
deformation and is frequently characterized by "clean" fracture surfaces.
• It occurs in components that contain geometrical discontinuities that act as stress
concentrations. Contrary to ductile failures plastic deformation provides a warning
signal for the ultimate fracture,
• Brittle failures can occur without prior warning, except for the formation of crazes,
as in glassy thermoplastics.
• Because of this design specifications based on fracture strength data tend to be
conservative (e.g., will incorporate very large safety margins) with respect to the
maximum stress levels allowed relative to the strength.

• Crazing
• Crazing is a phenomenon that often occurs in glassy polymers before yielding, i.e.
for deformation at temperatures below the glass transition.
• It occurs at a strain level which is below the level required for brittle fracture and
although undesirable, this type of "failure" is not catastrophic.
• Crazing is often observed in highly strained regions during bending.
• Crazes are made up of microcavities whose surfaces are joined by highly oriented, or
fibrillar, material.
• They are initiated near structural discontinuities, such as impurities, and are collectively
visible at the strained surface because they become large enough to reflect light.
• Crazes are not cracks and can continue to sustain loads after they are formed.
• However, they can transform into cracks via the breakage of the fibrils.
IDENTIFICATION ANALYSISFOURIER TRANSFORM INFRARED (FTIR)
DIFFERENTIAL SCANNING CALORIMETER (DSC)
THERMOGRAVIMETRY ANALYZER (TGA)
MOLECULAR WEIGHT

FTIR
• The most important techniques used to identify polymeric materials.
• It is based on the interaction between matter and electromagmetic radiation of
wavelengths in the infrared region (13300 – 20 cm-1).
FTIR TECHNIQUES
• Transmission
• Very simple FTIR technique.
• For solid and liquid samples.
• Attenuated Total Reflectance (ATR)
• The IR radiation is reflected in a high refractive index crystal.
• The ATR technique is very useful for the analysis of liquids, coextruded films,
laminations, coatings, diagnose of blooming problems, metallic depositions, and
surface chemical analysis.
FTIR TECHNIQUES
• Photoacoustic Spectroscopy (PAS)
• The PAS technique is an advantageous technique because it is not necessary to
prepare the sample.
• It is non-destructive.
• Diffused Reflectance Infrared Fourier Transform Spectroscopy (DRIFTS)
• Very useful technique for powders because preparation is not required.
• It is appropriate for matte or rough surface.
FTIR TECHNIQUES – TRANSMISSION
SOLID SAMPLES
• IR transparent powder
• Mull
• Cast film
• Pressed film
• Free-standing film
LIQUID SAMPLES
• IR transparent powder

IR TRANSPARENT POWDER
Material IR spectral range(cm-1)
Reflactive index(at 2000 cm-1)
KBr 40000 to 400 1.52
KCl 40000 to 500 1.46
CsI 40000 to 200 1.74
KRS-5 20000 to 250 2.45
Polyethylene 625 to 33 -
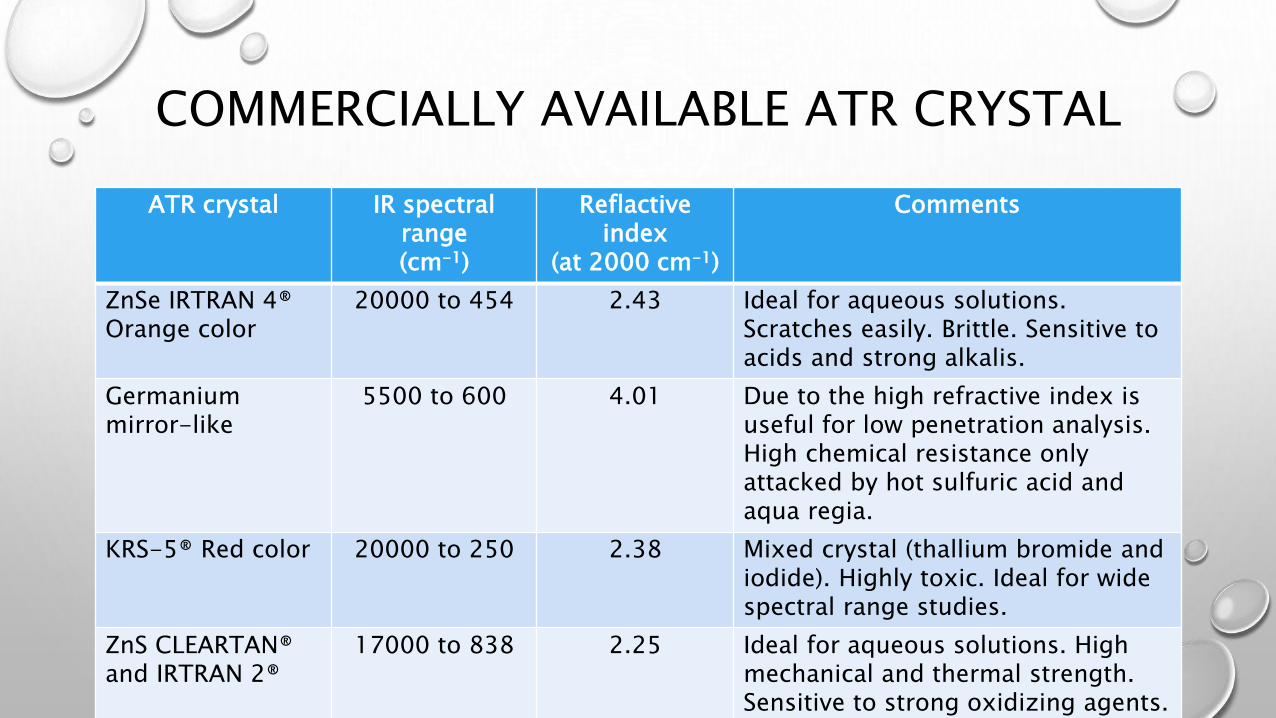
COMMERCIALLY AVAILABLE ATR CRYSTAL
ATR crystal IR spectralrange(cm-1)
Reflactiveindex
(at 2000 cm-1)
Comments
ZnSe IRTRAN 4® Orange color
20000 to 454 2.43 Ideal for aqueous solutions. Scratches easily. Brittle. Sensitive to acids and strong alkalis.
Germaniummirror-like
5500 to 600 4.01 Due to the high refractive index is useful for low penetration analysis. High chemical resistance only attacked by hot sulfuric acid and aqua regia.
KRS-5® Red color 20000 to 250 2.38 Mixed crystal (thallium bromide and iodide). Highly toxic. Ideal for wide spectral range studies.
ZnS CLEARTAN® and IRTRAN 2®
17000 to 838 2.25 Ideal for aqueous solutions. High mechanical and thermal strength. Sensitive to strong oxidizing agents.
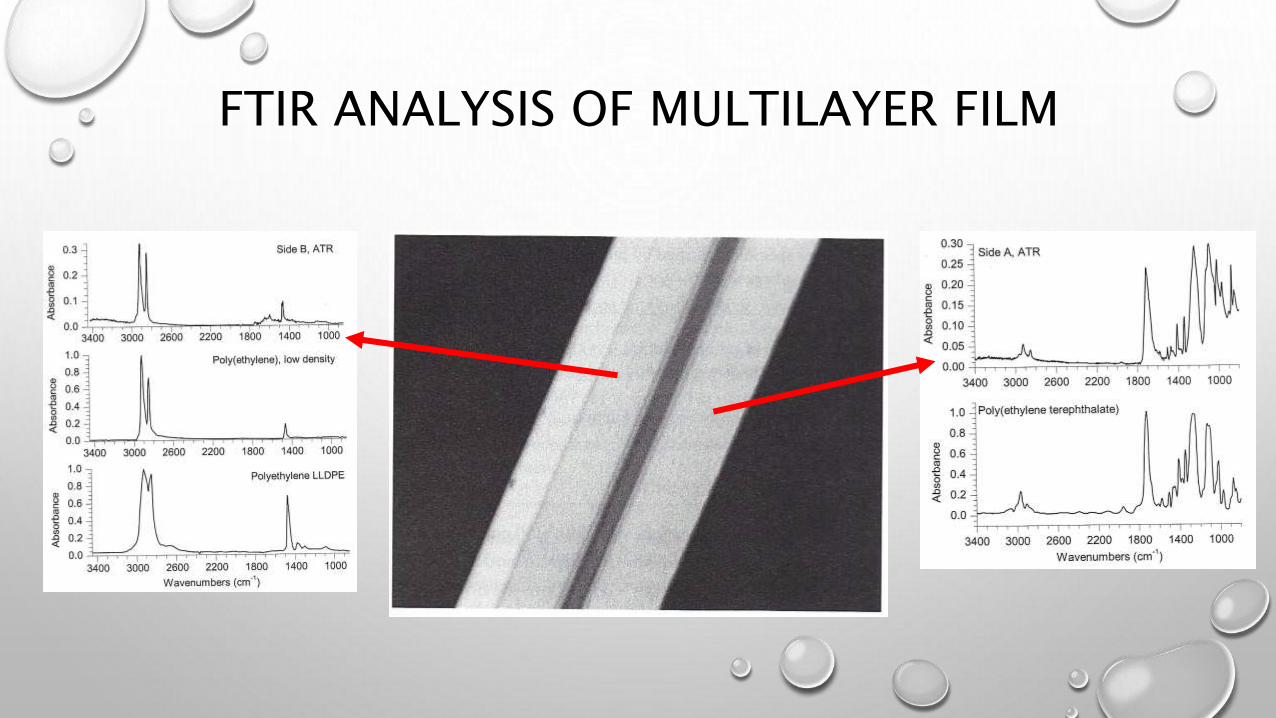
FTIR ANALYSIS OF MULTILAYER FILM
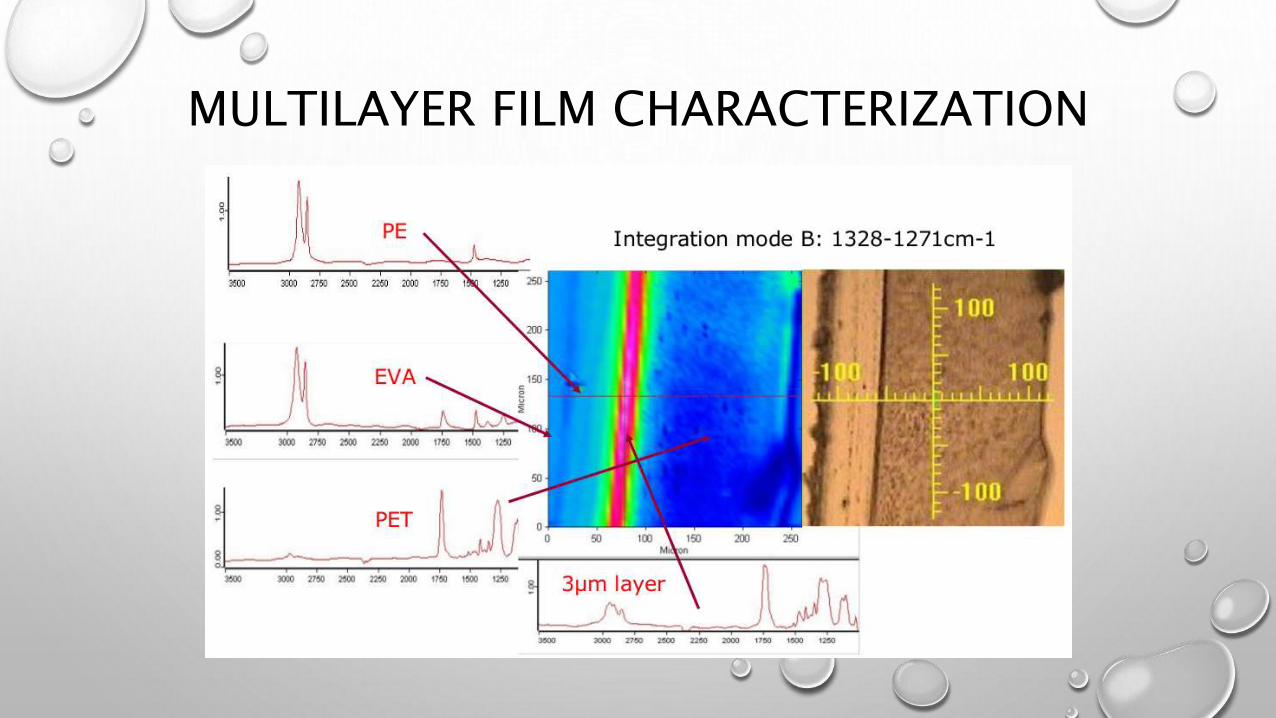
MULTILAYER FILM CHARACTERIZATION
DSC
• DSC is a thermal technique that measures the enthalpy changes, coupled with
diverse physical and chemical events.
• DSC can measure glass transition temperature, melting point, crystallization,
crosslinking, chemical decomposition.
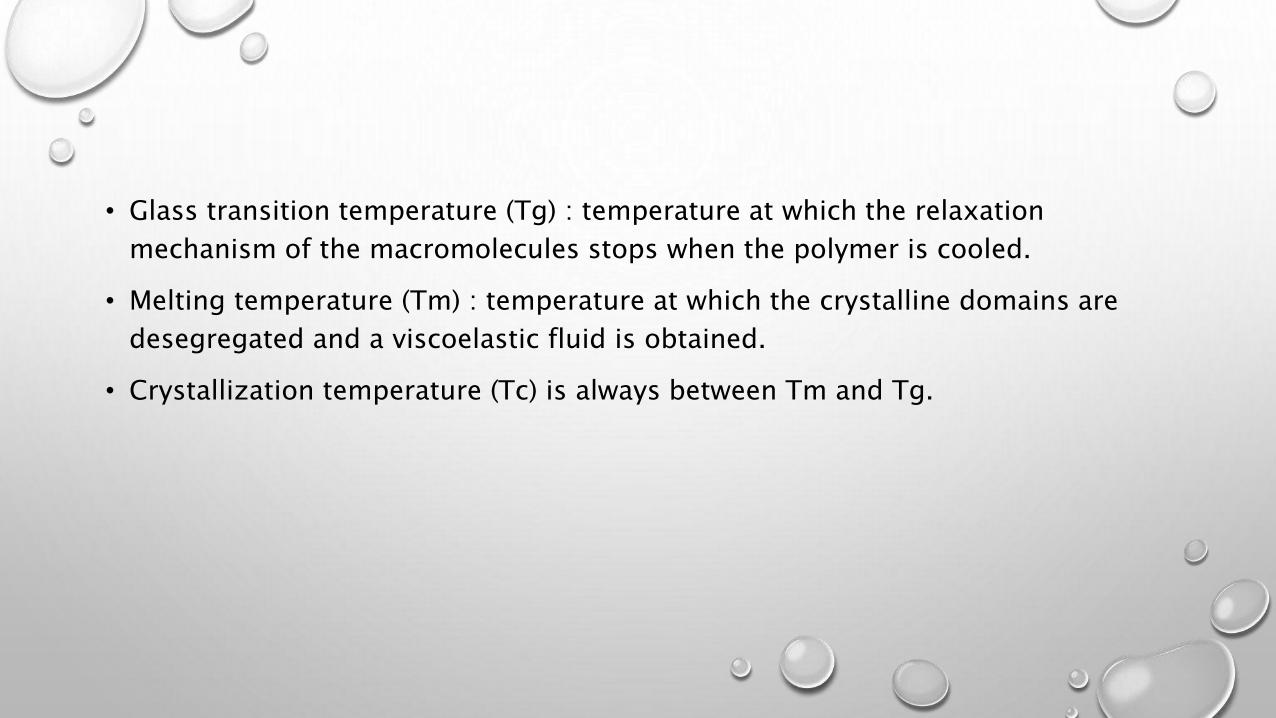
• Glass transition temperature (Tg) : temperature at which the relaxation
mechanism of the macromolecules stops when the polymer is cooled.
• Melting temperature (Tm) : temperature at which the crystalline domains are
desegregated and a viscoelastic fluid is obtained.
• Crystallization temperature (Tc) is always between Tm and Tg.
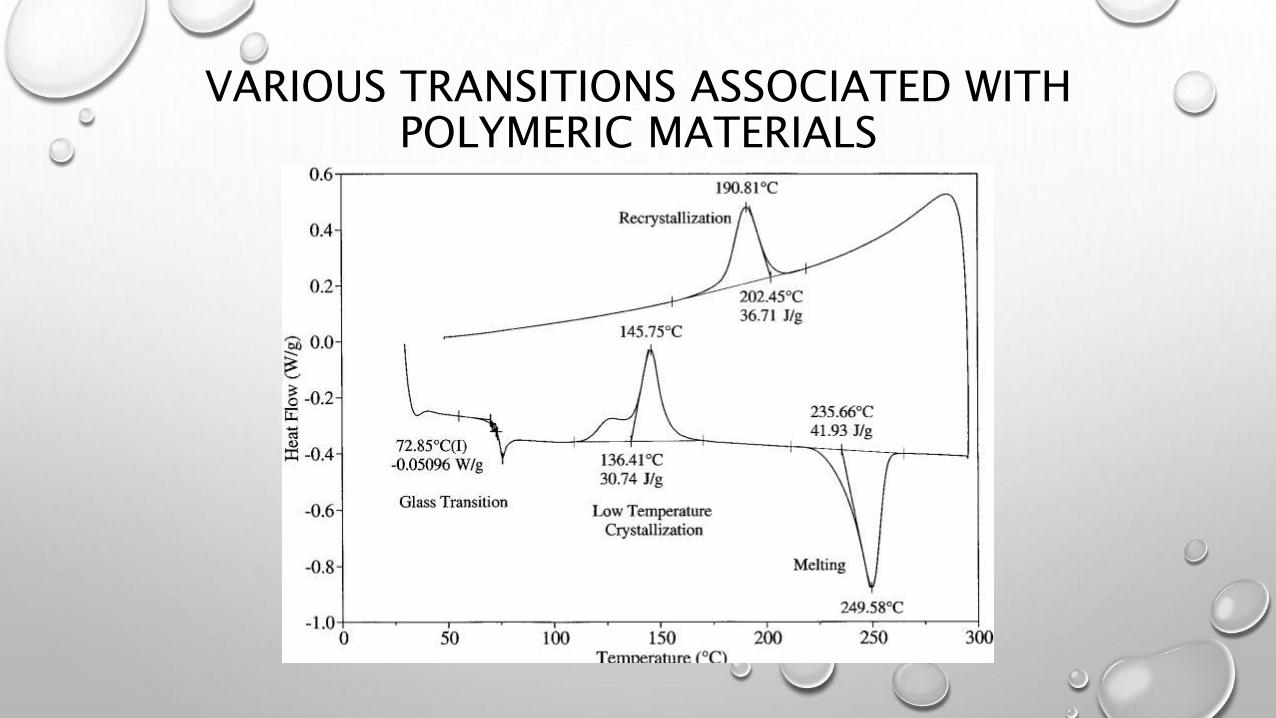
VARIOUS TRANSITIONS ASSOCIATED WITH POLYMERIC MATERIALS

GLASS TRANSITION TEMPERATURE OF SOME POLYMERS
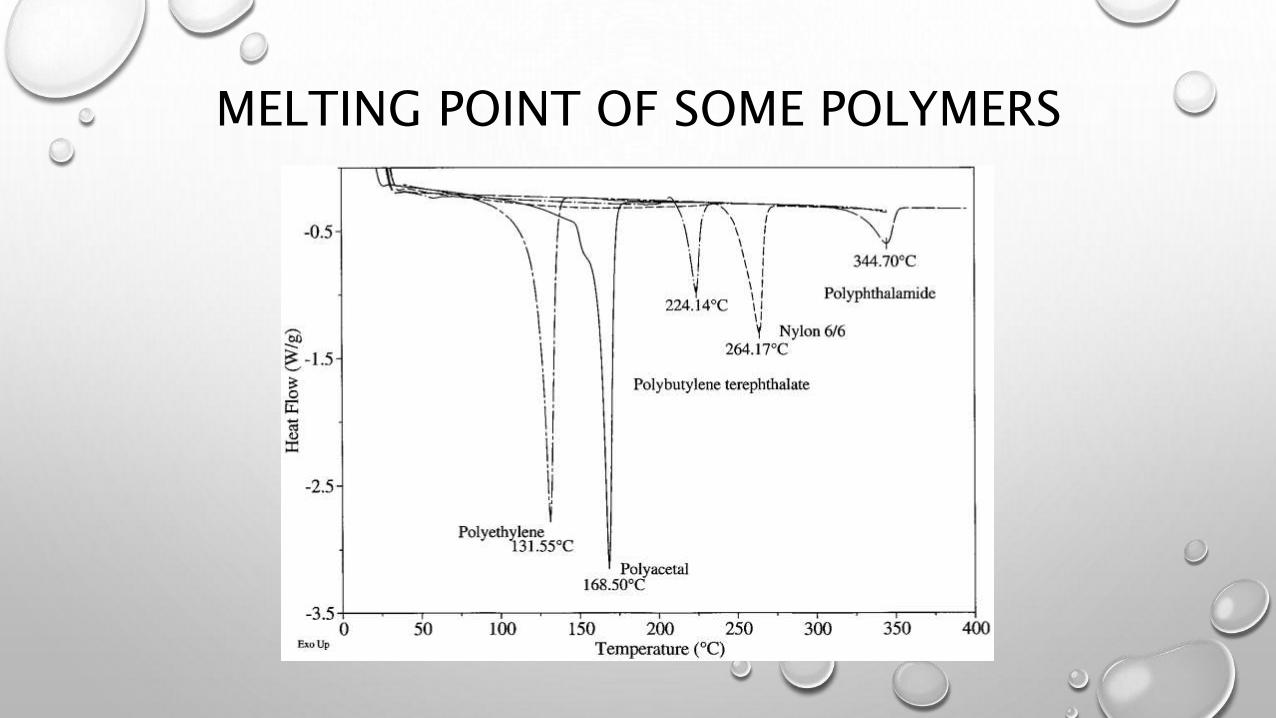
MELTING POINT OF SOME POLYMERS
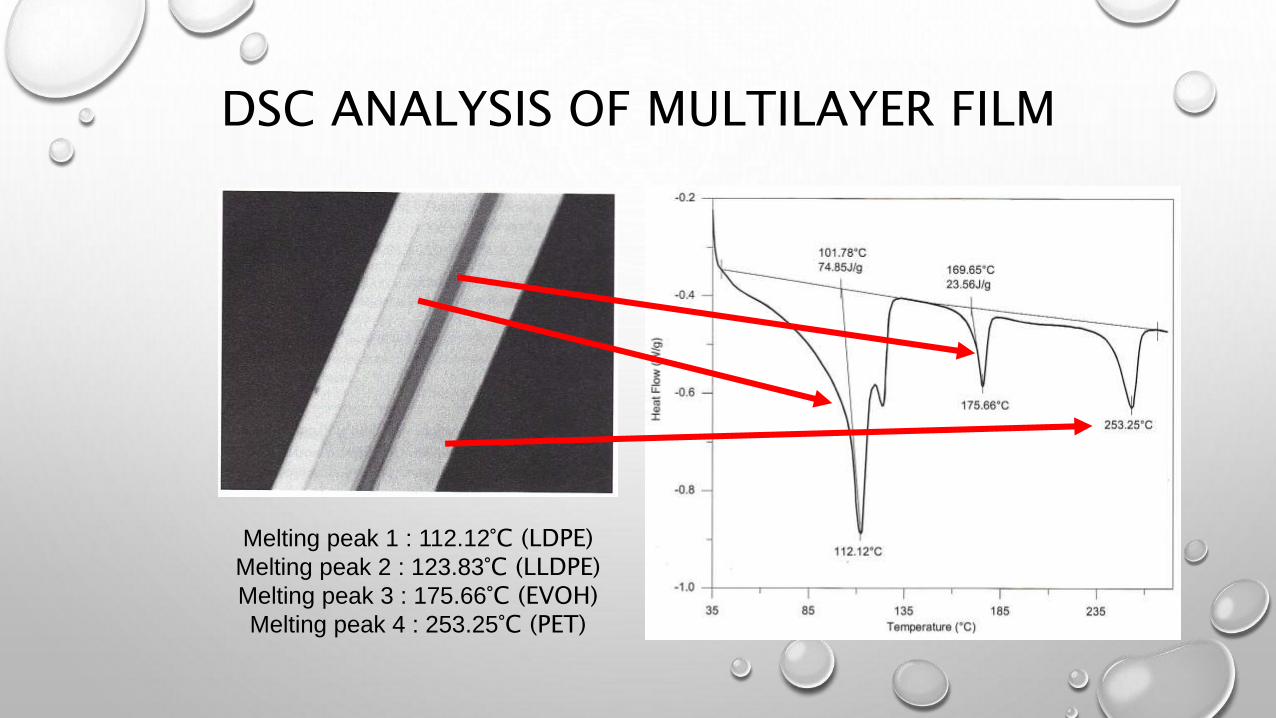
DSC ANALYSIS OF MULTILAYER FILM
Melting peak 1 : 112.12°C (LDPE)Melting peak 2 : 123.83°C (LLDPE)Melting peak 3 : 175.66°C (EVOH)Melting peak 4 : 253.25°C (PET)
TGA
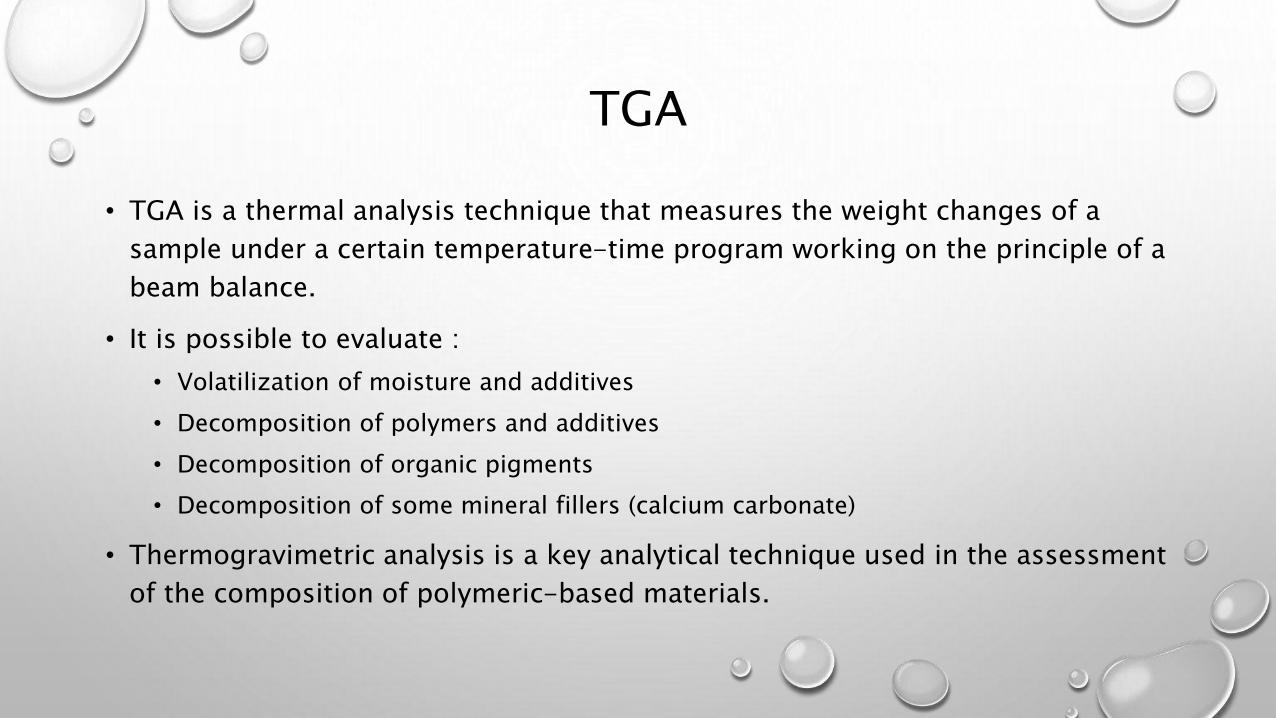
• TGA is a thermal analysis technique that measures the weight changes of a
sample under a certain temperature-time program working on the principle of a
beam balance.
• It is possible to evaluate :
• Volatilization of moisture and additives
• Decomposition of polymers and additives
• Decomposition of organic pigments
• Decomposition of some mineral fillers (calcium carbonate)
• Thermogravimetric analysis is a key analytical technique used in the assessment
of the composition of polymeric-based materials.
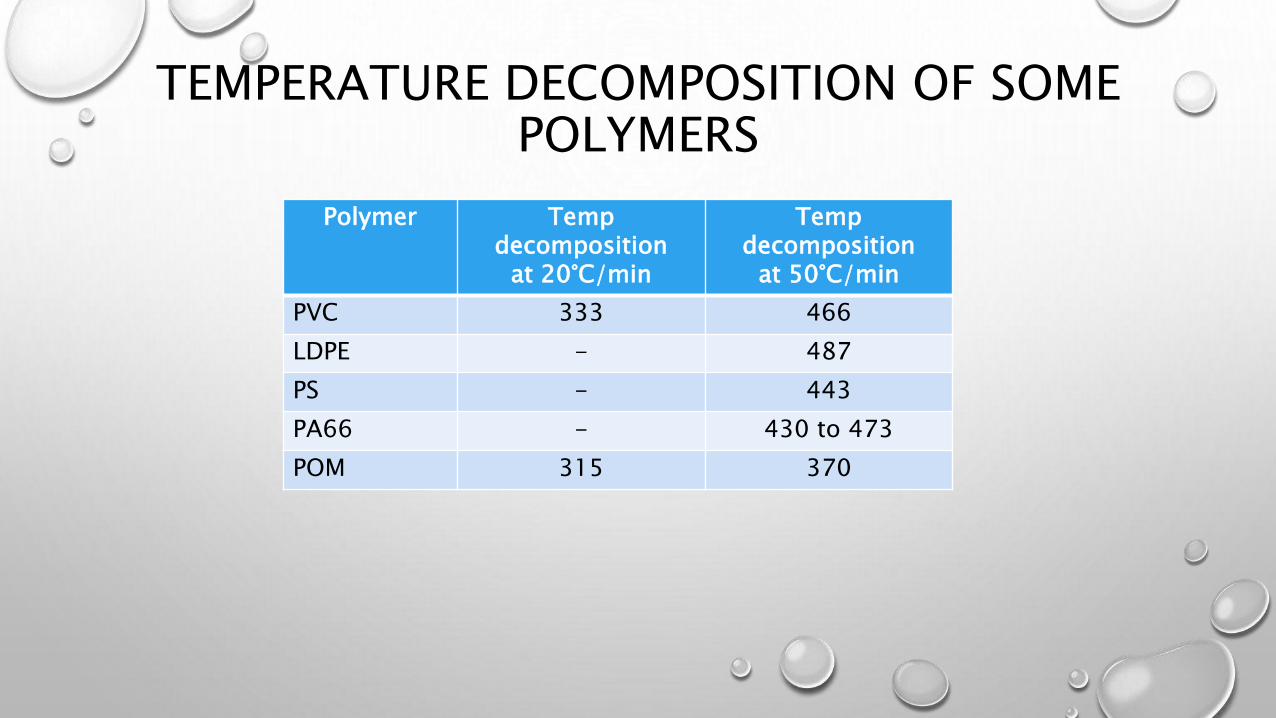
TEMPERATURE DECOMPOSITION OF SOME POLYMERS
Polymer Tempdecomposition
at 20°C/min
Tempdecomposition
at 50°C/min
PVC 333 466
LDPE - 487
PS - 443
PA66 - 430 to 473
POM 315 370
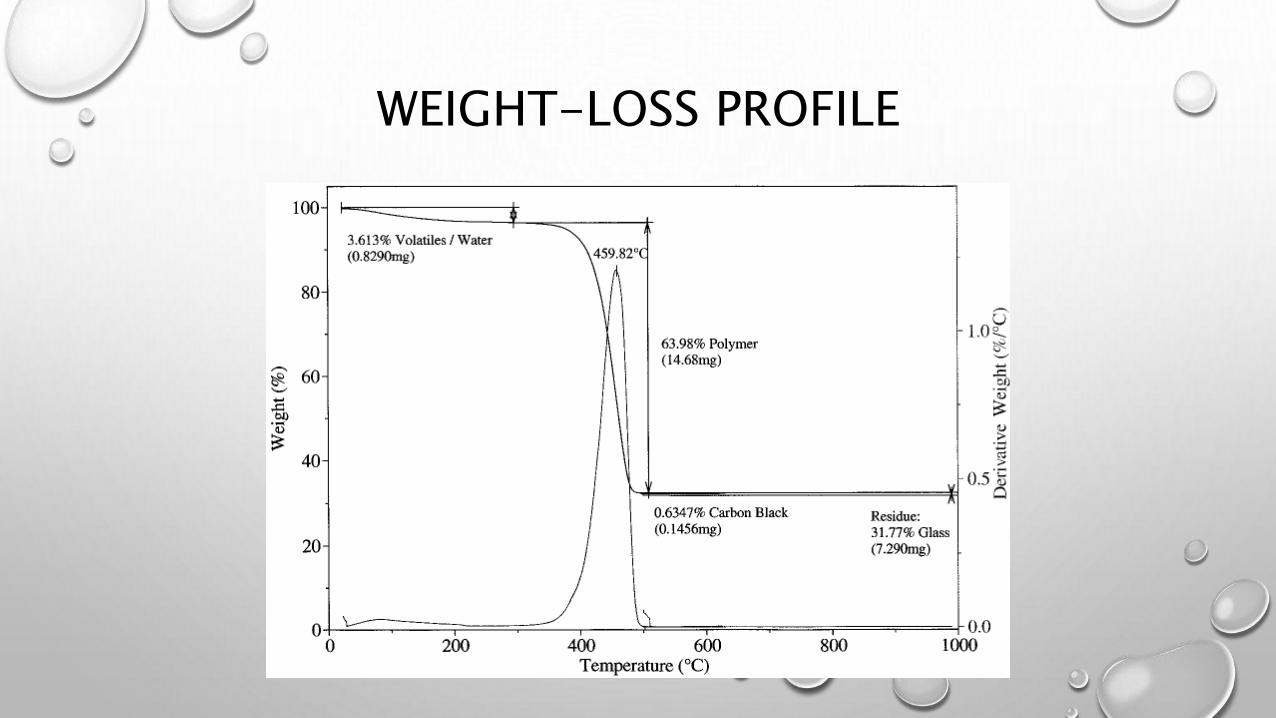
WEIGHT-LOSS PROFILE

MOLECULAR WEIGHT
• Molecular weight and molecular weight distribution are probably the most
important properties for characterizing plastics.
• These parameters have a significant impact on the entirety of characteristics of
a plastic resin, including mechanical, physical, and chemical resistance
properties.
• Changes can result in molecular weight decreases through such mechanisms as
chain scission, oxidation, and hydrolysis, or as increases through destructive
cross linking.
• Changes in molecular weight can occur throughout the material life cycle and
can significantly impact the performance of the molded part.
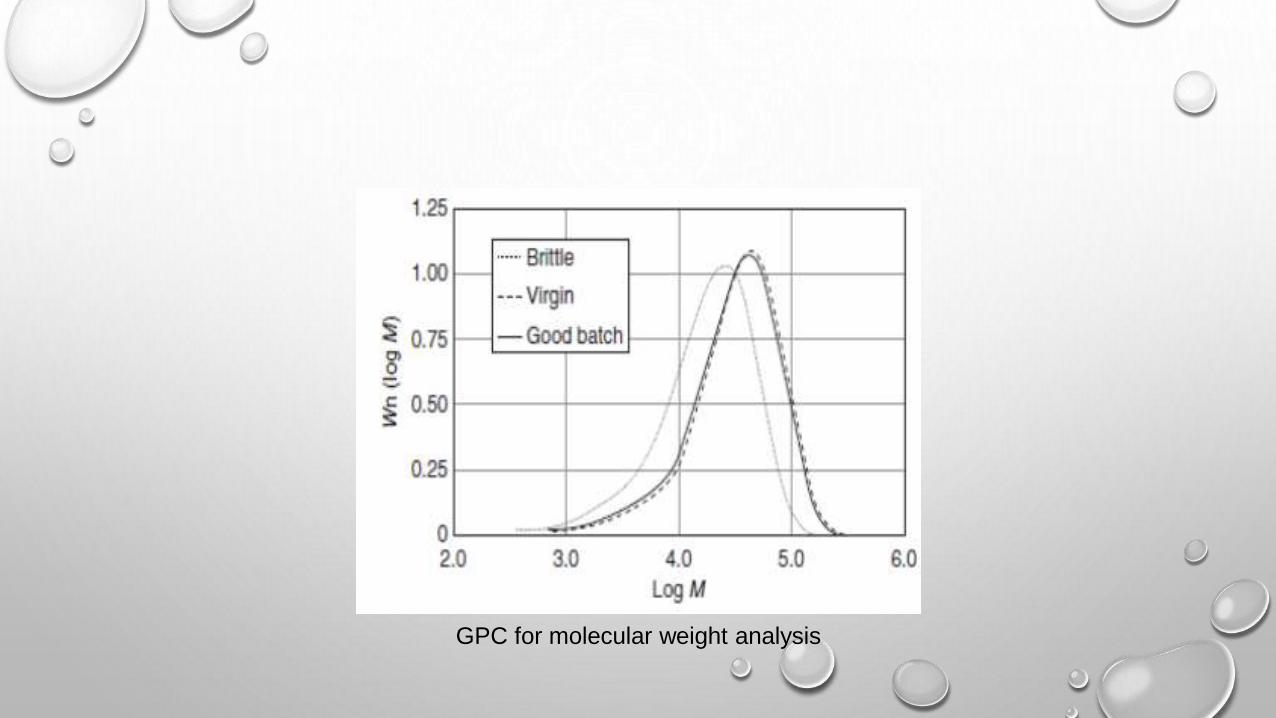
GPC for molecular weight analysis
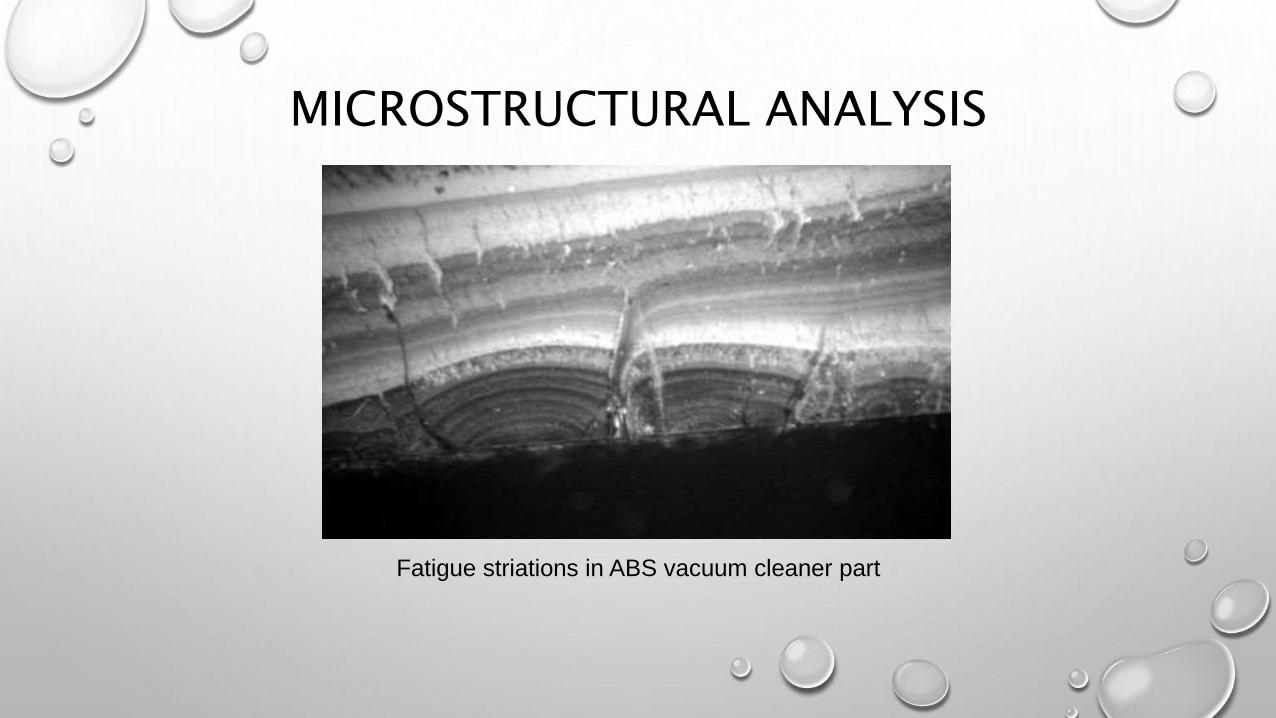
MICROSTRUCTURAL ANALYSIS
Fatigue striations in ABS vacuum cleaner part
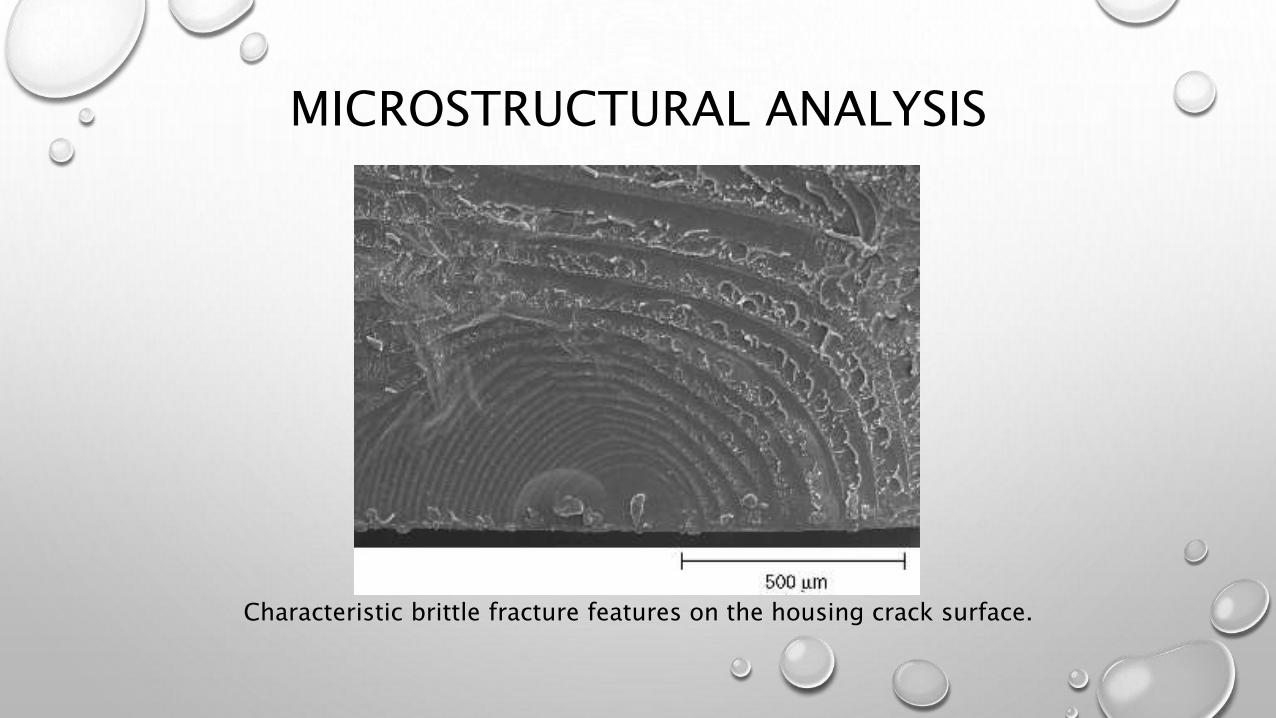
MICROSTRUCTURAL ANALYSIS
Characteristic brittle fracture features on the housing crack surface.