faculty satisfaction and student outcomes in the online learning environment
DESCRIPTION
This study considers faculty satisfaction with online teaching and the impact that satisfaction potentially has on student outcomes.TRANSCRIPT
To The University of Wyoming:
The members of the Committee approve the dissertation of Barbara Gail
Niklason presented on March 8, 2012.
Dr. Doris U. Bolliger, Chairperson
Dr. Elizabeth Simpson, External Department Member
Dr. John Cochenour
Dr. Cliff Harbour
Dr. Kathleen Sitzman
APPROVED:
Dr. Mary Alice Bruce, Department Head, Professional Studies
Dr. Kay A. Persichitte, Dean, College of Education

1
Niklason, B. Gail, Faculty satisfaction and student outcomes in the online learning
environment, Ed.D., Department of Professional Studies, May, 2012
A modified survey instrument, designed to measure faculty satisfaction with the online
learning environment, was administered to the online faculty at a large, public institution of
higher education in the western United States. The survey was administered in support of this
study’s first research question; what is the general level of satisfaction with online teaching and
learning at this institution? The findings indicated that the level of satisfaction was generally
moderate (3.74 on a 5 point scale) though pockets of less satisfaction were detected.
A focused analysis of the six subscales that comprised the survey was conducted. Of the
six subscales; student-to-student interaction, teacher-to-student interaction, course
design/develop/teach, institutional support, attitudes, and affordances; affordances recorded the
highest satisfaction level while student-to-student interaction recorded the lowest. Further
analysis was done based upon several areas of faculty demographic including, home college, age,
gender, and experience with online teaching. Highly significant differences were found between
home colleges and age groups of the responding faculty.
The second part of the study involved gathering student outcomes, specifically the rate of
successful completion of online courses taught by the responding faculty during the two
semesters of study; Fall 2010 and Spring 2011. Those outcomes were analyzed for overall rates
of successful completion, defined as the percent of students registered for a course who
completed the course with a grade of ‘C-‘ or better, as well as analyzed by college within which
the course was taught. The College of Health Professions had the highest average rate of
successful completion, 90.45%, while the College of Science had the lowest average rate of
successful completion, 72.66%. Differences between colleges were statistically significant.

2
Finally, efforts were focused on determining the nature of the relationship between
faculty satisfaction with the online learning environment and rates of successful online course
completion. A small, but positive and significant correlation was found. When similar analyses
were conducted between each of the subscales and the average rate of student success, small but
significant correlations were seen. The student-to-student interaction subscale indicated the
highest correlation with student outcomes of the five significant outcomes.
The findings of this study have implications for professional development efforts for
online instructors. First, helping instructors understand the relationship between their satisfaction
and their students’ outcomes is important. Secondly, ensuring that online instructors know the
potential for student-to-student interaction in an online course and giving them the tools and
knowledge to implement those interactions, is key. The study has implications for institutional
policy around online learning, in particular around areas of student readiness to be successful in
their online learning efforts and in the consideration of requiring professional development for
online faculty.

FACULTY SATISFACTION AND STUDENT OUTCOMES
in the ONLINE LEARNING ENVIRONMENT
by
B. Gail Niklason
A dissertation submitted to the University of Wyoming
in partial fulfillment of the requirements
for the degree of
DOCTOR OF EDUCATION
in
EDUCATION
Laramie, Wyoming
May, 2012

ii
Acknowledgements
I have thoroughly enjoyed my journey through the University of Wyoming’s
Instructional Technology program. I appreciate the support of my chair, Dr. Doris Bolliger, and
the commitment of the faculty of both the ITEC and Adult Learning programs; I learned much in
your classes.
I want to thank Dr. Kathleen Sitzman for her support and encouragement; Kathy has been
a wonderful mentor and a good friend. I look forward to continuing to work with her and to be
inspired by her.
Most importantly, I want to express thanks to my three sons, Erik, Jack, and Ian. Their
support and willingness to ‘fend for themselves’ more often than not during these past years
while I have been pursuing my degree are so greatly appreciated. Thank you for being interested
in my progress and in my pursuit. I truly hope that your educational endeavors are as fulfilling
and fruitful as mine have been.

iii
Table of Contents
List of Tables ................................................................................. Error! Bookmark not defined.
List of Figures ................................................................................................................................. v
Chapter 1 - Introduction to the Study ............................................................................................. 1
Chapter 2 - Literature Review ...................................................................................................... 13
Chapter 3 - Methodology .............................................................................................................. 44
Chapter 4- Results ......................................................................................................................... 54
Chapter 5 - Discussion and Recommendations ............................................................................ 82
References ................................................................................................................................... 955
Appendix A……………………………………………………………………………………………………………...…107
Appendix B………………………………………………………………………………………………………………....111
Appendix C…………………………………………………………………………………………………………………112
Appendix D…………………………………………………………………………………………………………………113
Appendix E………………………………………………………………………………………….……………………...114
Appendix F………………………………………………………………………………………….……………………...115
Appendix G………………………………………………………………………………………….……………….……..116

iv
LIST OF TABLES
Table 1. Online Faculty Characteristics: Age and Gender…………………………..…….55
Table 2. Online Faculty Characteristics: College Represented and Years of Online
Teaching Experience…………………..…………………………………………55
Table 3. Items, means, standard deviations for questions 1 – 36………………………….59
Table 4. Mean Scores by Subscale………………………………………………………...62
Table 5. Overall Faculty Satisfaction by College……………………………...………… 63
Table 6. Faculty Satisfaction by Subscale by College…………………………………….63
Table 7. Faculty Satisfaction by Subscale by Gender…………………………………….65
Table 8. Faculty Satisfaction by Subscale by Age………………………………………..66
Table 9. Faculty Satisfaction by Subscale by Experience………………………………...68
Table 10. Overview of means comparison by factor……………………………………….69
Table 11. Rate of Successful Completion of Online Courses……………………………....71
Table 12. Significant Difference between College Rates of Successful Completion………73
Table 13. Mean Rate of Successful Completion by College……………………………….74
Table 14. Significant Difference between Faculty Age-group Rates of Successful
Completion……………………………………………………………………….75
Table 15. Mean Rate of Successful Completion by Years of Online Teaching
Experience………………………………………………………………………..76
Table 16. Correlation between Mean Rate of Student Success and Faculty Satisfaction
Subscales…………………………………………………………………………79

v
LIST OF FIGURES
Figure 1. Attitudes and variables that potentially impact student outcome.………………...4
Figure 2. Pillars of effective online learning …………………………….………...………33
Figure 3. Histogram of faculty satisfaction overall…………………………………….......61
Figure 4. Rate of successful completion of online courses…………………………….......71

1
Chapter 1 - Introduction to the Study
Online learning is challenging the status quo at many institutions of higher education in
the United States. Indeed, evidence of the embracement of online education is provided through
the analysis of online enrollment trends over the last decade. From the Sloan Consortium,
through their annual surveys of online learning, compelling evidence of this growth has been
documented since 2002. From a recent survey (Allen & Seaman, 2010) it appears that almost
30% of students in higher education take at least one online course during their program of study
and that the annual growth rate of online enrollment is estimated to be 21.1% as of fall, 2009.
The current economic downturn has increased demand for both online courses and programs; it
is expected that this trend will continue.
As institutions invest in online learning, often as a critical component of their strategic
planning (Allen & Seaman, 2010), the importance of partnering closely with the institutional
faculty should not be underestimated. The quality of online offerings are affected by both the
faculty and the institution (Meyer, 2002) and the need to understand how individual qualities of
the faculty, such as age and motivation, as well as issues of policy and satisfaction impact online
learning is critical. It is not a stretch to suggest that the members of the faculty who are satisfied
teaching online are more likely to continue teaching online.
The focus of this research was to develop a better understanding of the level of
satisfaction among online faculty at one public institution of higher education, and to see what
sort of relationship exists between satisfaction and student success in online courses.
2
Background
The percentage of adults in the United States aged 25-34 who have completed at least an
associate’s degree is 39%; this figure translates into a 12th place ranking world-wide. In his 2009
State of the Union address, President Barack Obama expressed concern with this ranking and
proposed that by 2020 the U.S. ranking return to first position (The Whitehouse, 2009). Since
this call-to-action at the national level in 2009 several states have jumped on the degree
completion bandwagon as well. Individual states are responding with state-level initiatives to
buoy the education level of their citizens. The state of Utah, for example, would like to see 55%
of the workforce having earned an associate’s degree or higher by the year 2020 (Utah System of
Higher Education, 2010).
The state of Utah presents an excellent example of both a predicted need and a call-to-
action to address that need. According to a 2010 study by the Georgetown University Center of
Education and Workforce, by 2020 66% of the jobs in the state of Utah will require education
beyond high school and 55% of those jobs will require at least an associate’s degree (Utah
System of Higher Education, 2010). To achieve this goal the state is seeking input on ways to
increase both capacity and degree or program completion within higher education.
A significant challenge, however, is presented by the fact that in the wake of the current
economic recession state budgets have been woefully underfunded. By necessity cutbacks are
passed on to state funded higher education institutions that are paradoxically faced with
economy-driven increases in enrollment at the same time.
The Emergence of Online Education
Recent trends in the increased availability of online learning opportunities as well as
growth in the number of students who take online courses have caught the attention of legislators
3
and higher education administrators in Utah, as well as other states. The potential for online
education to increase the capacity of higher education institutions demanded by the 2020
objective is exciting. Online learning provides higher education access to adults who previously
could not be accommodated due to time constraints imposed by work and family as well as
constraints of proximity to an institution (Abel, 2005). Abel also points out that instead of
increasing physical capacity through the addition of new buildings, institutions are able to
accommodate additional students through technology-mediated instruction.
Yet, despite growth in online enrollments in higher education of 21% during 2009, in
comparison to less than 2% growth in the overall student population in higher education (Allen
& Seaman, 2010), online learning continues to come under scrutiny. According to Allen and
Seaman’s 2010 report on online education in the United States, a sizeable minority of higher
education chief academic officers still considers online education to be inferior to traditional,
face-to-face education. While a propensity exists to compare online and face-to-face, traditional
courses one against the other, it is extremely difficult to do so effectively. Howell, Laws, and
Lindsay (2004) point to the need to move beyond comparisons to evaluate success and
completion within the scope of online and distance education given the situational characteristics
of the distance student.
Conceptual Framework
Given the potential for online learning to support the higher education needs of the
United States over the next decade, it is critical that institutions offering online courses and
programs develop a keen understanding of how to enable success of online students.
The construct of student outcomes, even with the operational definition of ‘successful
completion’, is a complex phenomenon. In an attempt to organize the different variables that

4
could impact student outcomes, a conceptual framework has been developed for this study that
provides a way to systematically approach research into this issue. The framework was derived
from two models: Menchaka and Bekele’s (2008) “Model of success and success factors in
Internet-supported learning environments” and Osika and Camin’s (2002) “Concentric model for
evaluating distance learning programs”. Both focus on the interplay of many factors in creating
an online learning environment. Factors relevant to student outcomes were selected from these
models and put together to develop the framework used for this study. The framework suggests
the complexity that encompasses student outcomes while also suggesting three primary areas of
focus: (a) student-related, (b), institution-related, and (c) instructor-related (see Figure 1).
Figure 1. Attitudes and variables that potentially impact student outcomes
Students, for example, display a variety of attitudes about online learning. They may
view it as easier or less rigorous and therefore worthy of less effort. Online students may
manifest characteristics that contribute to lower outcomes such as working part or full-time, or
other time constraints that compete for the students’ time and attention. Institutional factors may
also contribute to online student outcomes. For example, if online learning does not play a

5
significant role in the mission of the university, it is possible that the institution does not provide
adequate support for online students and faculty, or adequate resources may not be allocated
towards the online efforts. Technology and infrastructure are specific institutional factors that
play a role in the online learning experience. If the technology used to support online learning is
not reliable and consistently available, online students and their eventual outcomes may suffer.
Finally, faculty-related factors such as attitude about and experience with online learning
represent a third area that has potential to impact online learning outcomes, both positively and
negatively. For example, do online instructors really embrace the modality or are they being
forced or coerced to teach online? Research has shown that there is a strong relationship between
faculty satisfaction with online teaching and learning and student outcomes (Hartman, Dzubian,
& Moskal, 2000). Faculty attitude towards online learning has also been shown to be experience-
related (Ulmer, Watson, & Derby, 2007). Professional development opportunities, geared
towards helping online instructors better understand the challenges and the potential of online
learning have a positive effect on faculty satisfaction with online learning (Lee, 2001).
Problem Statement
This study focuses on faculty-related issues in the online learning environment. The
problem to be addressed by this study is the effect faculty satisfaction with online teaching and
learning might have on the outcomes, specifically rates of successful completion, of online
students at a large, public institution of higher education.
Weber State University, the institution of study, is a public, regional university in
northern Utah. The university has a teaching focus and offers associate, bachelor, and selected
master’s degrees through seven colleges. Established in 1889 the institution has grown to over
23,000 students as of the fall, 2010 semester. In 1997 Weber State University began to consider

6
the feasibility of online courses and in 1998 the first online courses were offered. By the fall,
2010 semester online enrollments accounted for 17% of total enrollment. While there are only
four full programs online, through the College of Health Professions and the Bachelor of
Integrated Studies program, students have approximately 250 online courses from which to
choose. Students are able to satisfy all of their general education requirements online, if they
choose to do so.
Purpose of This Study
The purpose of this quantitative study was two-fold. The initial focus of this research
study was to measure the level of satisfaction with online teaching of the online faculty at Weber
State University. This part of the study made use of a validated survey instrument developed in
2010 by two colleagues of the researcher. Secondly, results of that survey were combined with
course data that indicated the rate of successful completion of online courses taught by this same
faculty. The goal of this phase of the study was to develop a better understanding of the
relationship between faculty satisfaction with the online learning environment and student
success in online courses.
Various factors exist that help to describe and define the faculty experience of online
education. These include perception of and satisfaction with online teaching and learning,
experience, professional development focused on online teaching, and perhaps other
demographic factors such as age, gender, or department/college in which the faculty teaches. A
consideration of these factors helps to frame the question to be answered by this study.
Specifically, what affect do these factors have on learning outcomes of online students? Are
there measurable aspects of these factors that can be correlated to higher or lower rates of
successful completion of online students?

7
Research Questions and Hypotheses
There are four questions to be answered by this study.
1. What is the general level of satisfaction with online teaching at this institution?
2. What are the mean rates of successful completion (defined as a grade of C- and above) of
online courses at the institution of study?
3. What is the nature of the relationship between faculty satisfaction with online teaching and
learning and rates of successful online course completion?
4. What is the nature of the relationship between any of the subscales of faculty satisfaction and
rates of successful online course completion?
The first two questions are descriptive in nature. The third and fourth questions, however,
are inferential and speculation of the results can be qualified by the development of appropriate
hypotheses. The following hypotheses were examined in this study:
1. A significant correlation exists between the measured level of online faculty satisfaction and
rates of completion of that faculty’s online students. For example, the higher a faculty rates on
faculty satisfaction with online teaching and learning, the higher the rate of successful
completion of that faculty’s online students.
2. Alternatively, the associated null hypothesis indicates that any correlation that exists between
the measured level of online faculty satisfaction and rates of completion of that faculty’s online
students is non-significant.
3. A significant correlation exists between each of the measured subscales of faculty satisfaction
with online teaching and learning; student-to-student interaction, student-to-instructor
interaction, issues of design, development, and teaching, institutional support, attitudes, and
affordances; and rates of completion of that faculty’s online students.

8
4. Alternatively, the associated null hypothesis indicates that any correlation that exists between
the measured subscales of faculty satisfaction with online teaching and learning, and rates of
completion of that faculty’s online students is non-significant.
Study Significance
A report published by the Chronicle of Higher Education focusing on the college of 2020,
provides evidence that institutions of higher education must embrace online learning in order to
meet the changing demands of students (Parry, 2009). The traditional demographic of college
students, 18 to 25 year old, single, and full-time, will have changed considerably by the year
2020. The new demographic of college students will be older and perhaps married with children,
more likely to be a member of a minority group, and work part or full-time. Successful
institutions will be those that can offer coursework and degree programs in a variety of formats
with a high degree of flexibility in order to meet fluctuating market needs (Van Der Werf &
Sabatier, 2009).
Members of the faculty play a key role in the success of any institution of higher
education. If it can be determined that faculty attitude towards and experience with online
learning are correlated to student outcomes, then professional development programs can be
developed for online faculty that help support the development of positive attitude towards
online learning. Those responsible for hiring online faculty may be able to use the survey
instrument to determine whether a specific instructor is a good fit for the assignment of online
teaching. Finally, helping online faculty develop an awareness of how their attitudes can
potentially impact student outcomes may encourage those teaching online to carefully consider
their approach to online teaching and request the training and institutional support that is needed.

9
Study Limitations and Delimitations
There were several limitations inherent in this study. First, students self-select into online
courses and while there are many reasons for their choices, this study did not address that issue.
Surveys introduce other limitations. Responses were voluntary and the data were self-reported.
Asking already busy faculty to take time to answer a survey often presents a challenge and could
possibly have resulted in lower-than-expected returns. This study was limited to one institution.
This fact suggests that caution should be used in generalizing the results to other higher
education institutions.
Many factors play a role in student outcomes in both traditional and online courses; it is a
complex issue. The concept map shown previously suggests that there are factors and
characteristics of the students and of faculty that impact outcomes as well as institutional factors.
This study focused specifically on faculty-related factors and the role they play in student
outcomes. Further study may be called for that focuses on the role of student and institutional-
related factors in the outcomes of students in online courses.
Methodology
This study was a two-phased, quantitative study. Phase 1 focused on the collection and
analysis of survey data. A survey designed to measure faculty satisfaction with online teaching
and learning was distributed to all instructors who taught online at the institution during the Fall
2010 and Spring 2011 semesters. The survey yielded seven measures of faculty satisfaction with
the online learning environment: a student-to-student interaction subscale, an instructor-to-
student interaction subscale, a course-design, development, teaching subscale, an institutional-
support subscale, an attitudes subscale, an affordances subscale, and an overall satisfaction score.
During the second phase of the study, course completion rates were collected about the online

10
courses taught by the faculty who completed the survey. Those data were first analyzed using
descriptive statistics. Course completion data were then combined with the appropriate faculty
satisfaction data and analyzed using inferential methods. Chapter 3 of this paper provides
additional information about the study methodology.
Researcher’s Role and Motivation
Online courses at Weber State University (WSU) are taught through a partnership
between the University’s Continuing Education (CE) division and each of seven colleges and the
library. The CE unit financially sponsors most online courses, while individual department chairs
are responsible for providing instructors for online course. CE also provides the course
management system through which online courses are delivered, faculty training in how to use
the online tools, professional development that supports best practices in online teaching and
continuous improvement of courses, instructional design support, student support, and finally, a
secure testing system that includes a proctor support system. At the time of the study, the
researcher filled the role of Associate Dean of CE with oversight responsibility for this
operation. This represented a professional investment in the online program at WSU. The
researcher was formally tasked with monitoring the ongoing health of the online program as well
as overseeing the provision of professional development opportunities for online faculty. As
such, it was determined that a quantitative study would be the best way to develop an objective
understanding of the depth and breadth of the perceived problem. The researcher is a strong
supporter of online teaching and learning and also has experience as an online instructor and an
online student. This level of involvement in online teaching and learning by the researcher has
the potential to introduce a bias in favor of the online learning environment, but care was taken
to report objectively, accurately, and fairly.

11
Findings of the study, if significant, may be used to develop, modify, and improve
professional development programs for online faculty. Significant findings will be shared with
college deans and department chairs responsible for selecting faculty to teach online courses.
Looking forward, this quantitative study may also provide focus for a later qualitative study that
will allow for more in-depth understanding of the faculty role in online student learning
outcomes.
Terminology
Online learning is commonly defined as any course in which 80% or more of the content
is delivered via the Internet (Simonson, Smaldino, Albright, & Zvacek, 2009). However, at the
institution of study, a course can be considered an online course only if there are no face-to-face
meeting requirements, in other words, 100% of content is delivered via the Internet.
Face-to-face, traditional learning encompasses courses taught in the traditional
classroom with varying techniques, but often focusing on the instructor-delivered lecture. More
and more, these courses are enhanced with online tools, but there is no reduction in scheduled
‘seat time’.
Distance Learning or distance education is a term often used interchangeably with online
learning. For purposes of this study, however, distance learning is a broader term that includes
any course in which the student and faculty are separated by time and/or location. This can
include courses taught synchronously with IVC (Internet Video Conferencing) and online
courses taught as independent study.
No Significant Difference (NSD). This term refers to the large body of research collected
and compiled by Thomas Russell (1999). The term suggests the overwhelming findings that the

12
systems used to deliver content; radio, audiotape, television, computer, Internet, etc., do not
impact learning outcomes.
Online Learning Environment (OLE), includes the notion of online teaching, the notion
of online learning, as well as the infrastructure put in place to support these activities.
Student outcome is a broad term that encompasses both what a student learns and how
well a student learns. For the purpose of this study, student outcome references how well a
student achieves prescribed goals and outcomes and is operationalized as successful completion.
Successful completion is a measure of student success. For the purposes of this study
successful completion is defined as the percentage of students who complete a course with a
grade of ‘C-’ or better. The percentage was calculated as (the number of students completing the
course with at least a C-/the total number of students enrolled in the course).

13
Chapter 2 – Literature Review
Introduction
The objective of this literature review is to provide the reader with a picture of the
context within which this study will be presented. The review begins with a broad overview of
distance education with a focus on the evolving nature of the field. The emergence of online
learning, as a unique manifestation of distance education is considered next, followed by a
section focusing on the theory that supports online learning. The theory is essentially a
convergence of distant education theory and adult learning theory and helps to ground this study.
Because no study of online learning can completely avoid the propensity towards comparison of
the online versus traditional classroom, a portion of the literature review will focus on the “no
significant difference” phenomenon. Finally, consideration will be given to the areas of faculty
satisfaction, student satisfaction, and student outcomes in the online learning environment (OLE)
as the intersection of these topics is a primary focus of the study.
Distance Education – An Overview
Distance education is defined as formal, institutionally based learning that is
characterized by the separation of instructor and student in time and location (Gunawardena &
McIsaac, 1996). Distance education, particularly in the last two decades, is further characterized
by the use of interactive communication technologies that are used to connect student to teacher,
student to student, and student to content and resources (Schlosser & Simonson, 2009; Simonson
et al., 2009). Moore and Kearsley (2005) suggest that distance education is further defined by the
use of deliberate course design and selection of instructional techniques.
Both Taylor (1995) and Moore and Kearsley (2005) describe the evolution of distance
education from a generational perspective. While each evolving generation can be considered

14
separately, there is considerable overlap between the generations of distance education. In fact,
distance education today is characterized by a combination of generational approaches and
technologies. A generational framework is useful because it aligns with the evolution of
information and communication technologies over the last 50 to 60 years.
First generation distance education. The U.S. Postal System provided the infrastructure
for early correspondence study, considered by Moore and Kearsley to be the first generation of
distance education. Several formal correspondence programs were developed including the
department of correspondence study at the University of Chicago in 1890 (Simonson et al., 2009)
and the Chautauqua Correspondence College in 1881 (Moore & Kearsley, 2005). Characterized
by the exchange of lessons, guided readings, and homework between an instructor and an
individual student via the U.S. Mail, correspondence study was developed to provide access to
education to those who otherwise did not have access. Women in particular, but also men who
did not live in the vicinity of an institution took great advantage of correspondence study to
achieve their educational objectives. William Rainey Harper, the first president of the University
of Chicago, was confident of the role of correspondence study to provide education at least as
good and perhaps superior to the education that could be obtained in the classroom (Simonson et
al., 2009).
By 1930 correspondence study was serving about two million students (Bittner &
Mallory, 1993) and by 1968 approximately three millions students (MacKenzie, Christensen, &
Rigby, 1968). During this time span courses became less vocationally focused and more
academically focused. Indeed, correspondence study courses were often used by traditional, on-
campus students to resolve scheduling conflicts. Also referred to as home study or independent
study, correspondence courses began to move from print-based format to an electronic format by

15
the early 2000s. These and other technological developments in the field of distance education
were reflected in the 1982 decision by the International Council for Correspondence Education
to change its name to the International Council for Distance Education (Gunawardena &
McIsaac, 1996).
Second generation distance education. The second generation of distance education
was defined by the use of radio and television. While radio technologies did not do much to
advance the field of distance education, educational television was successful in doing so. Due in
large part to contributions from the Ford Foundation, in the form of grants to encourage the
development of educational broadcasting, educational television became a fixture of distance
education during the 1950s and ‘60s. Programs were developed and delivered through the
auspices of the Corporation for Public Broadcasting (CPB), Instructional Television Fixed
Services (ITFS), and independent cable television and telecourse producers (Moore & Kearsley,
2005). By the mid-1980s around 200 college courses had been produced and delivered either
independently or with support of the CPB. The Adult Learning Service of the CPB, with support
from the Annenberg Foundation oversaw the development of many university-level telecourses
that were used at schools throughout the country. Many high-quality, innovative courses have
been developed through these cooperative efforts.
Third generation distance education. The third generation of distance education, as
defined by Moore and Kearsley (2005), represented advances in processes and general thinking
about distance education, rather than advances in technology. The University of Wisconsin at
Madison’s Articulated Instructional Media Project (AIM), directed by Charles Wedemeyer,
established the idea of a systematic course design process that brought together a team of
instructional designers, technology specialists, and content experts (Wedemeyer & Najem,

16
1969). Wedemeyer’s work and travel led him to a meeting with administrators from Oxford
University in England to discuss and flesh out the idea of an open university (Moore & Kearsley,
2005).
The British Open University incorporated technologies, primarily the 2nd generation
technologies – television and radio, to support and extend print based instruction with an
emphasis on systematically and well-designed courses (Gunawardena & McIsaac, 1996).
Developed as an entity independent of established, traditional universities, the British Open
University has been a very successful endeavor and has addressed the need in Great Britain to
provide higher education access to individuals not served by the more traditional institutions.
Both the systematic aspect and the aspect of openness have spread to other countries, including
China, India, Turkey, Korea and others. Curiously absent from the list is the United States. A
branch of the British Open University was established in the U.S. in 1999, but closed in 2002 due
to lack of revenue and enrollments (Casey, 2008). Most likely, the distributed nature of the
control of higher education in the U.S. contributed to this failure; state-level university systems
were already in place and a national-level institution was not embraced (Moore & Kearsley,
2005).
Fourth generation distance education. Teleconferencing, supported by an evolving set
of communication technologies represents the fourth generation of distance education. Initially
enabled through satellite technology, distance education through teleconferencing was supported
by the development of several consortia established in the 1980s to allow for sharing of courses
between institutions. Both the National University Teleconferencing Network (NUTN) and the
National Technological University (NTU) provided a means to pool expertise and resources to
deliver courses and full degrees to prospective students (Moore & Kearsley, 2005).

17
As the field of teleconferencing matured, greater capability was evident. From one-way
live video through satellite, to two-way audio with one-way video, to two-way audio and video,
constantly improving, real-time interaction became an expectation. Two-way audio/video to the
desktop through the Internet is now possible and has the advantage of reducing overall costs
(Simonson et al., 2009). Use of the Internet and the desktop computer eliminates the need for
special high-end equipment. As institutions and corporations expand the bandwidth capabilities
of their organizations, high quality audio and video to the desktop can serve both academic and
administration needs.
Statewide teleconference education networks were established in several states during the
1980s and 1990s. Oklahoma, Kentucky, Alaska, Texas, and Utah were among the states that
developed courses and partnerships to augment primarily K-12 education. Several states extend
this support and infrastructure to higher education customers as well.
Fifth generation distance education. The advent of the Internet and the proliferation of
low-cost computers paved the way for the fifth generation of distance education. As the network
infrastructure that supports the Internet became more fully and broadly developed, the World
Wide Web, an application that sits within the Internet provided a means to share documents
between users separated by time, distance, and location. Easy-to-use web interfaces, called web
browsers, allowed those without any technical computing skills to access, create, and upload
content. By 2002, 66% of American adults were accessing the Internet (Greenspan, 2002).
Web-based programs became evident at several institutions of higher education in the
1990s. The availability of these programs mushroomed so that by the beginning of the new
century, 84.1% of public universities and 53.8% of private universities offered courses via the
Web (Green, 2001). This proliferation was a catalyst for the rethinking of distance education
18
(Moore & Kearsley, 2005). Web technologies continued to evolve and were able to support the
convergence of text, audio, and video, helping to fuel continued growth and interest in online
learning. By 2009 online learning accounted for 29.3% of total enrollments in higher education
(Allen & Seaman, 2010).
The emergence of online learning. The early 2000s saw a convergence of various
factors that yielded essentially a perfect storm for online learning. The growing global need for
an educated workforce prompted the need for independent learning opportunities for working
adults. At the same time advances in digital technologies including increased capacity and reach
of the Internet, buoyed by Y2K investment, faster and cheaper desktop computing and the
increasing sophistication of communication applications provided an affordable infrastructure for
the growth of online learning. Over the next eight years enrollments in online learning at degree-
granting postsecondary institutions would grow at an annual rate that varied from a low of 9.7%
in 2006 to a high of 36.5% in 2005. The average annual growth rate of online learning between
2002 and 2009 was 17.29%, far outpacing the growth of traditional higher education enrollments
(Allen & Seaman, 2010).
Distance Education Theory
As distance education has evolved to accommodate new information and communication
technologies so too has the theory that supports distance education evolved. Theory is critical to
the field of distance education because it provides a means of legitimizing the field. Additionally,
by emphasizing theory it is less likely that distance education will be relegated to the periphery
of education (Keegan, 1988).
Grounding a study of online learning in theory lends credibility to the study findings.
Having a body of theory that supports distance education helps practitioners make decisions

19
about methods, media, and support as well as other areas with a degree of confidence that
wouldn’t exist without theory (Keegan, 1995). According to Holmberg (1988) theory provides
indications of essential characteristics of effective distance education and provides a means
against which efforts in distance education can be gauged.
Theory provides a structure for developing and testing hypotheses within the field of
distance education. Holmberg (1988) points out that the iterative process of hypothesizing,
testing, and ultimately refuting or supporting various hypotheses helps to pave the way to
practical methodological application of that theory. Subsequent decisions about distance
education, be they instructional, administrative, political, or social, can be made with confidence
when made from a theoretical basis (Keegan, 1995). Finally, theory allows for some level of
explanation and prediction when used as a basis for the development of distance education
resources (Keegan).
This section of the literature review will provide an overview of various theories that
have been used to define and guide the field of distance education. The development of distance
education theory has been supported by three approaches: learner autonomy and independence,
the industrialization of teaching and learning, and a final approach that combines theories of
interaction and communication (Keegan, 1986). In recent years new theories have been emerging
in response to the infusion of new telecommunication technologies into distance education
(Simonson, Schlosser, & Hanson, 1999). Emerging theory is guided by the idea of equivalency
of the learning experiences no matter how instruction is delivered, by the concept of social
presence, and by a concern for the sociocultural context in which distance learning takes place
(Gunawardena & McIsaac, 1996).
20
Industrialization. Peters (1988) saw distance education as a complement to the industrial
and technology age and intimated that distance education could only be successful if industrial
techniques were applied to both the development and the delivery of instruction at a distance. In
developing his economic and industrial theory of distance education he emphasized the need for
planning and organization from the onset. Great economies of scale could be achieved through
the use of a rationalized and mechanized, assembly-line approach to distance education. Though
costs would be high, quality would be as well and costs could be amortized over the large
distribution of the material developed. Garrison (2000) and Moore and Kearsley (2005) both
indicated that Peters’ theory was more an organizational theory than a theory of teaching or
learning. We can see evidence for Peters’ approach in many of the for-profit institutions in place
today where both standardization and mechanization are tenets of their success. Peters saw
industrialization as a means of transforming the traditional university into an institution of self-
study and distance teaching (Garrison, 2000). This theory generated a debate around the
variables of independence and interaction. Because interaction tended to be more resource-
intensive, and therefore expensive independence was seen as a more cost-effective approach to
distance education (Gunawardena & McIsaac, 1996). Recent technologies have provided a
means of including interaction at a low cost, making the debate less of a resource issue
(Garrison, 2000).
Autonomy and independence. Wedemeyer’s theory of independent study emphasized
the independence of the distance learner (1981). He supported the use of technology as a means
to implement student independence. Wedemeyer’s ideas were some of the earliest that
acknowledged the greater responsibility of the student in the learning process. He encouraged a
mix of both media and method within a course that had the potential to be more effective for the

21
student and that would relieve the instructor of many of the custodial-type duties that were
apparent in traditional correspondence study. Wedemeyer suggested that providing a self-paced
learning environment allowed students the autonomy needed to be successful and allowed
students to leverage their individual differences in learning preferences. Finally, Wedemeyer
identified the relationship that developed between the teacher and the student as a key to success
in the independent study paradigm.
Moore presented another theory of independent study in the early 1970s that incorporated
two variables: learner autonomy and distance between teacher and learner (Simonson et al.,
2009). In 1986, Moore used the term transactional distance to describe the concept of distance
between teacher and learner (Gunawardena & McIsaac, 1996). Transactional distance is a
balancing of the amount of structure and the amount of dialog that is present in a course and is a
term of relativity. A course where structure is high and dialog between teacher and student is low
has high transactional distance. As structure decreases, that is, as the student gains more control
over the learning process, and dialog between teacher and student increases, transactional
distance is reduced (Moore & Kearsley, 2005).
Interaction and communication. Holmberg (1983) placed significance in the interaction
between teacher and learner by stating that an emotional involvement contributed to learning
pleasure, which in turn supported student motivation to learn. By 1995 Holmberg had developed
an eight-part theory of guided didactic conversation for distance education that had roots in
communication theory. First he recognized that distance education served a heterogeneous
group of students who could not or chose not to participate in traditional face-to-face learning
and that distance education was a means to support both student freedom of choice and
independence. Holmberg (2005) showed evidence that distance education could support deep
22
learning and could support various modes of learning including behaviorist, cognitive, and
constructivist. Holmberg further emphasized the importance of the learner-teacher dialog
through his suggestion that it was actually a fundamental characteristic of distance education
(Simonson et al., 2009).
Interaction is a critical component of effective distance education programs
(Gunawardena & McIsaac, 1996). Moore (1989) differentiated between three types of
interaction: learner-content, learner-instructor, and learner-learner. Together these modes of
interaction provide intellectual support, support for social negotiation of meaning and knowledge
construction as well as support for feedback and motivation mechanisms. Anderson and Garrison
(1998) similarly described three types of interaction that can be found to varying degrees in
distance education courses: student-teacher, student-student, and student-content. In an attempt
to determine what the appropriate mix of these interaction types might be so that deep and
meaningful learning occurred, Anderson (2003) developed a theorem of equivalency of
interaction. In essence, Anderson’s theory suggests that as long as one type of interaction is
present at a high level, a diminished presence or even absence of the other types of interaction
will not reduce the educational experience. He provides a caveat, however, that a high level of
presence of at least two of the interaction types will lead to a more satisfying learning
experience.
Equivalency – an emerging theory. Simonson et al. (1999) proposed that learning
experiences of distance learning students should be equivalent to those of students in the
traditional classroom. The proposal, and subsequent theory of equivalency, has been developed
in response to the impact new telecommunication technologies are having on the field of distance
education. Distance education can be supported with a variety of technologies in synchronous or

23
asynchronous environments. Students can be across the country or down the street and they may
be traditional students or non-traditional. Simonson (1995) had earlier stated that students should
expect learning experiences that are able to accommodate their specific situations. He felt that
the more similar the learning experience was for distance students, as compared to students in the
traditional classroom, the more similar would be the learning outcomes of the students.
Equivalency theory has been supported by several subsequent studies (Ferguson & DeFelice,
2010; Lapsley, Kulik, Moody, & Arbaugh, 2008). Lapsley et al. particularly targeted online
learning in their comparative study with a specific focus on testing equivalency theory. Their
findings supported equivalency theory provided GPA was controlled for in the analysis.
The ever-changing technologies that support distance education, and online learning
specifically, present a challenge for the establishment of theory. While theory can provide a
degree of prediction within the field and therefore help shape practice, practice itself contributes
to the ongoing development of theory (Spector, 2008). This iterative nature of practice and
theory along with a constantly changing technology environment necessitates an adaptive
approach to theory development.
Online learning, as a subset of distance education, appears to be an area of expected,
continued growth in higher education (Allen & Seaman, 2010). As technological innovation
continues to alter the landscape of online learning, the theory that supports it will need to evolve
alongside the innovation.
Adult Learning Theory
Adult learning theories are particularly applicable to online and distance education as
these modes of instruction appeal to the adult learner (Simonson et al., 2009). Andragogy, self-
directed learning, transformational learning, and various theories of adult motivation to learn are

24
adult learning approaches or theories that help to support good online course design and
management. As well, these theories can provide insight into the reasons students are successful
or unsuccessful in the online learning environment.
Adult learners bring experiences, focus, and a variety of motivations to the learning
environment. Knowles recognized this as he developed the practice of andragogy and many have
come to see that practice as a theory of distance education (Simonson et al., 2009). He purported
that as people mature they shift from being a dependent personality towards becoming a more
self-directed individual. At the same time they accumulate experiences that contribute to a body
of knowledge that can be shared and developed. Adult motivation shifts from an external focus
to an internal focus and adult learners tend to be focused on learning as a means to solve a
problem or a perceived lack of knowledge (Merriam, Caffarella, & Baumgartner, 2007).
Day and Baskett (1982) proposed that andragogy could be thought of as an educational
ideology. Knowles himself acknowledged the question of whether andragogy was actually a
theory of adult learning, and suggested that it should be considered, together with pedagogy, as a
continuum between teacher-directed learning and student-directed learning (Merriam, 2001a).
The appropriate approach is not based solely upon the learner, but also upon the situation or
context of the learning. Online learning, by its nature, is well served by a student-directed,
andragogical approach where abilities, maturity, and life experiences can be leveraged in the
teaching and learning process (Nevins, n.d.).
As she does with andragogy, Merriam (2001b) considers self-directed learning to be a
pillar of adult learning theory. Emerging as a field of study around the same times as andragogy,
self-directed learning considers the learner, the content of the learning, as well as the nature of
the learning that is to take place. Grow’s (1994) model of staged self-directed learning (SSDL),
25
for example, encourages instructors to develop instructional strategies that match students’ self-
identified levels of readiness. Naturally, student readiness within a given course may vary
widely, so the use of scaffolding – or the provisioning of various levels of structure in the
learning environment (Dabbagh, 2003) becomes important. The key is to provide each student
with the appropriate amount of structure; that which best suits their level of self-directed
readiness.
Merriam et al. (2007) point to the need to acknowledge and foster self-directed learning
in the context of the online learning environment. There is speculation that the ability to be a
self-directed learner positively correlates to student success in online learning. Kerka (1999)
suggests that students who have grown up with access to the Web – often termed digital natives
– may be developing an orientation of self-directed learning with that exposure. Kerka cautions
that self-directed learning should be considered as a “multi-faceted concept” (p. 2), and not with
a single definition. This will help to promote the continued study of self-directed learning as a
means to support the diversity of multicultural learning preferences enabled by access to the
Web.
Based upon the ideas of Mezirow and first introduced in 1978, transformational learning
focuses on how adults make sense of their life experiences. Transformational learning is a result
of a dramatic, fundamental change in the way individuals see themselves and the world in which
they live. It combines a mental construction of experience, inner meaning, and reflection
(Merriam et al., 2007).
The four main components of transformational learning are (1) experience, (2) critical
reflection, (3) reflective discourse, and (4) action. Mezirow suggested that learning occurs
through a linear process of moving through the components. Later research by Taylor shows the

26
process to be much less linear and more individualistic (Mezirow, 1991). The process becomes
fluid and recursive as the individual works to consider, reflect, resolve, reflect more, put into
action some change, and consider again, for example.
Proponents of transformational learning see it as a form of lifelong personal
development. Daloz saw education itself as a transformational journey and emphasized the
importance of dialog and storytelling as individuals work to expand their worldviews (Merriam
et al., 2007). Freire focused on transformational learning as part of a larger framework of radical
social change. He promoted transformational learning as a means of emancipation and as a way
to acknowledge social inequities while championing liberation. According to Merriam et al.,
(2007) this is in contrast to Mezirow’s focus on cognitive aspects of transformation though both
Mezirow and Freire see transformational learning as an aspect of constructivism. They don’t see
knowledge as an entity to be gotten, but as a creation that results from interpretations and
reinterpretations based upon new experience (Baumgartner, 2001).
Considerations of context and experience resonate with andragogy, self-directed learning,
and transformational learning. As more instruction moves to the online environment, designers
would do well to incorporate principals of these theories into their course design. Additionally, a
thorough understanding of the techniques and approaches that enhance adult motivation to learn
can aid in the development of effective online learning environments.
Adult learning theory applies to both the on-campus and the online learning experience.
As will be shown in the next section, which looks at the no significant difference phenomenon,
while there is a propensity to compare the experiences and outcomes of the on-campus and
online learning experience each can be effective when created and conducted using sound
principals of instructional design backed by supported theory.

27
No Significant Difference
Much has been written around the No Significant Difference (NSD) phenomenon, a
phrase popularized by Russell in his 1999 compilation of comparative media studies. This
section will focus on the NSD literature of the last decade that looked primarily at comparing
online learning to learning in the traditional classroom. One goal of this literature review is to
develop a better understanding of the types of studies that have been conducted and the nature of
the conclusions reached in those studies. Specific attention will be given to recent studies that
have actually found online learning to be more effective in terms of student outcomes than
traditional classroom learning. Finally, a discussion of the criticism that surrounds many of the
studies that compare online learning with traditional classroom learning will be provided along
with a consideration of what the criticism implies for the direction of this study.
Outcomes and experiences of students in traditional, face-to-face coursework have
established a de facto benchmark against which outcomes and experiences of coursework
delivered in nontraditional ways are compared. There are likely many reasons for conducting
comparisons, but surely ‘quality of experience’ is paramount (Shachar & Neumann, 2010). It
seems that a flurry of comparative studies is done anytime a new medium for delivering
education is introduced. From the radio of the 1930s to the Internet of the new century, media
come into vogue accompanied by hopes of transformation for education. Online and distance
learning are changing the landscape of education and while some see the technologies that
support these new ways of learning as progressive, others see them as a threat to the traditions of
academe.
In an often-referenced 1983 article that focused on research conducted on learning and
media, Clark emphasized the idea that media used for teaching have no impact on student

28
learning. New media are often greeted with great expectation for their potential to transform
education. We witnessed this hope with movies and film, radio, and computers. The recent
debut of Apple’s iPad and the enthusiastic embrace by some in academia provide evidence that
this trend continues. Headlines on the web such as “Will the iPad and Similar Technology
Revolutionize Learning?” (Lenz, 2010) point to the resilient belief that media, and technology in
particular, have a direct impact on student learning.
Russell’s (1999) compilation of studies around the No Significant Difference (NSD)
phenomenon further supports the idea that the medium used to deliver learning does not have a
direct impact on that learning. Providing evidence from studies that employed a variety of media,
including traditional correspondence learning, instructional radio, motion pictures, instructional
television, instructional video, and early computer mediated instruction, Russell shows that
students learn equally well in any of the environments.
Russell (1999) states emphatically:
The fact is that the findings of comparative studies are absolutely
conclusive; one can bank on them. No matter how it is produced, how it is
delivered, whether or not it is interactive, low-tech or high-tech, students
learn equally well with each technology and learn as well as their on-
campus, face-to-face counterparts even though students would rather be on
campus with the instructor if that were a real choice. (p. xviii)
Later research considered by Russell, from 1996 through 1998, focused on the use of
computers and the Internet. As distance learning evolved to take advantage of these technologies
the focus of NSD studies shifted to online teaching and learning. A plethora of studies have been
completed since the last publication of Russell’s book in 1999 that continue to support the NSD
29
phenomenon. In fact, some researchers go so far as to indicate that it has become a “foregone
conclusion that there is no significant difference in student learning outcomes between face-to-
face versus online delivery modes” (Larson & Sung, 2009, p. 31). In an attempt to better
understand the focus of more recent research, a review of several studies that have been
completed since 2001 is presented.
Many studies in the last decade have provided a comparison between a single online
course (ONL) and its on campus equivalent (ONC). The advantage of this approach to a
comparison study is that care can be taken to control some independent variables. Neuhauser
(2002) reported on two sections of Principles of Management that she taught. She wanted to
determine whether significant differences in learning activities, learning preferences/styles,
student perceptions of the course, computer familiarity, and finally, test scores, and final grades
were apparent. Significant differences were not detected in any of the areas and Neuhauser
concluded that this research was supportive of the notion that online learning is as effective as
traditional, face-to-face learning. Another interesting finding of this study was that even though
students self-selected into either the ONL or ONC sections, there were no significant differences
in student demographics between the sections.
Another study that looked at students who had self-selected into either the ONL or the
ONC section of a teacher education conceptual methods course also found no significant
difference in the resulting student demographics (Caywood & Duckett, 2003). The outcomes of
three tests were compared between the two groups as well as the quantitative student teaching
ratings of the groups, and again, no significant difference in outcomes was detected. Jennings
and Bayless (2003) came to similar conclusions in terms of final outcomes and student
demographics, that is, no significant differences were detected. Further, this study reviewed the

30
cumulative GPAs of students in both the ONL and the ONC sections prior to the course and
found no significant difference between them, suggesting that prior knowledge of students was
not a factor in the final grades of those students. Numerous other studies have been completed
that showed similar, no significant difference results between online and traditional, on-campus
courses (Brown & Kulikowich, 2004; Dell, Low, & Wilker, 2010; Parsons-Pollard, Lacks, &
Grant, 2010; Warren & Holloman, 2005).
Summers, Waigandt, and Whittaker (2005) found no significant difference between the
final grades of ONL and ONC introductory undergraduate statistics students, but did find a
significant difference in student satisfaction between the two modalities. Despite similar grade
outcomes, ONL students expressed less satisfaction overall with the learning experience than
ONC students. This study serves as a good reminder of the limitations inherent when
comparisons focus only on final grades, that is, there are other dimensions that might be
important to consider.
A recent compilation of studies provides even more compelling support for the efficacy
of online teaching and learning. Shachar and Neumann (2010) provide evidence of a trend
towards students in online courses actually outperforming students in traditional courses. A
meta-analysis of comparison studies conducted between 1990 and 2009 was completed that
considered the results of 125 studies and calculated a common standardized metric called an
effect size for each of the studies. The mean of those pooled effect sizes was then calculated to
derive an estimated effect size for the entire study. Amazingly, the findings show that online and
distance learning students outperformed their counterparts in traditional courses and that the
trend became more positive over time. This meta-analysis used ‘final course grade’ as the
dependent variable for all 125 of the studies included, with the notation that “grades are the

31
measure of choice in numerous studies in higher education to assess learning and the course
impact on the cognitive development of the student in the subject-matter” (p. 320).
Some of the studies that compared outcomes between ONL and ONC courses found
lower outcomes for ONL students (Russell, 1999; Shachar & Neumann, 2010; Tallent-Runnels et
al., 2006). Some of the comparative studies were criticized for not providing better control of
alternative explanations of differing outcomes (United States Department of Education, 2009).
But overwhelmingly, comparative studies have shown that online instruction is at least as
effective as traditional instruction in terms of student learning outcomes.
Howell, Laws, and Lindsay (2004) urge caution in the use of comparison studies when
researching course completion. They equate most of the comparisons to apple and orange
analyses due in large part to the inability of researchers to use random selection of subjects in
their studies. That is, comparative studies report on classes into which students self-select. That
self-selection introduces complexities that are not adequately controlled for in most studies.
Howell et al., suggest that the inconsistencies that are apparent when traditional (classroom) and
nontraditional (distance or online) are compared can be avoided with a focus on measuring
completion among classes in the same delivery format. This strategy in turn encourages a shift in
focus towards research that identifies tactics for improving completion and retention of online
students.
If we take the NSD research at face value we can be confident that when significant
differences in student outcomes between comparable online and face-to-face courses do occur,
the teaching medium is not suspect. Moore and Kearsley (2005) in fact, urge researchers to move
beyond the realm of no significant difference to consider studies within the medium of online
32
learning. They suggest that research in the OLE focus on determining what characteristics or
approaches promote successful completion of online endeavors.
The question that might be asked, then, is where do we look to determine the source of
low rates of successful completion of online courses? Wiley (2002) tells us, without reservation,
that ongoing differences in learning outcomes are due to the instructional approach taken by the
instructor. Understanding that student demographics help to explain some of the challenges faced
by online students (Howell, Laws & Lindsay, 2004), Wiley’s suggestion that effects of faculty
should also be considered provides the next area of focus.
Faculty Satisfaction with the Online Learning Environment
The Sloan-C Organization, a consortium of institutions and organizations committed to
quality online education, outlines five pillars of effective online learning (Moore, 2009). The
pillars are student satisfaction, learning effectiveness, cost effectiveness and institutional
commitment (recently renamed as ‘scale’), access, and faculty satisfaction, and are very much
inter-related (see Figure 2). Faculty and student satisfaction, for example, play a role in learning
effectiveness and vice-versa. As well, issues of institutional commitment or scale impact access
and learning effectiveness. System theory supports the notion that change made to one part of a
system affects all other parts of the system (Maguire, 2009).

33
Taking the idea of faculty satisfaction with the OLE as a multi-faceted phenomenon
further, this review will focus on three aspects of that premise: extrinsic and intrinsic factors
associated directly with faculty, student-related factors, and institutional-related factors. Bolliger
and Wasilik (2009), Menchaca and Bekele (2008), and Osika and Camin (2002) provide support
for these areas of focus.
A study of general faculty satisfaction, not exclusive to OLE faculty, by Ambrose,
Huston, and Norman (2005), provides an interesting framework from which to consider
satisfaction in the OLE. The study found both internal, intangible factors and external, tangible
factors can impact a faculty member’s decision to stay at or leave an institution. Many studies of
faculty satisfaction in the OLE present findings using a similar dichotomy. Factors tend to be
classified as intrinsic versus extrinsic, motivating versus inhibiting, and/or promoting satisfaction
versus promoting dissatisfaction (Clay, 1999; Cook, Ley, Crawford, & Warner, 2009; Giannoni
& Tesone, 2003; Schifter, 2000).
Cook et al. (2009) classified factors as intrinsic or extrinsic and investigated the impact
those factors had in contributing to the motivation or inhibition of experienced online faculty to
continue teaching in the OLE. Intrinsic factors included desire to help students, opportunity to try
something new, intellectual challenge, personal motivation to use technology, overall job
Figure 2. Pillars of effective online learning (Sloan Consortium, 2010)
34
satisfaction, the ability to reach a broader student audience, and the opportunity to improve
teaching. Extrinsic factors included release time, support and encouragement from institution
administrators and departmental colleagues, merit pay, monetary support, technical support
provided by the institution, workload concerns, and quality concerns. Overall, this study
indicated that intrinsic factors positively contribute to ongoing and increased motivation to
participate in the OLE while failure to adequately address extrinsic factors can be found to
contribute to greater inhibition to participate in the OLE.
Giannoni and Tesone (2003) used a similar classification. Intrinsic factors identified
included personal satisfaction, teaching development, professional prestige, intellectual
challenge, and recognition. Identified extrinsic factors included release time, technical support,
monetary issues, job security, and promotion. Their findings indicate that a mix of both intrinsic
and extrinsic factors contribute to faculty satisfaction with the OLE.
Clay (1999) determined that intellectual challenge, opportunity to develop new ideas, the
opportunity to work with more motivated students, release time, and the availability of support
services were all factors that contributed to faculty motivation to participate in the OLE. At the
same time increased workload, lack of technical and administrative support, and the negative
attitudes of colleagues inhibited faculty from participating in the OLE.
Schifter (2000) designated factors related to the OLE as inhibiting or motivating. Ideally,
the removal of inhibiting factors such as concern about workload, concern about loss of prestige,
or lack of distance education training would greatly enhance the appeal of teaching online. She
points out, however, that in the likely absence of the ability to eliminate all inhibiting factors the
effort to at least acknowledge those issues as legitimate would be a positive step forward. This is
further validated in Cook et al. (2009).

35
Several studies illustrate the impact of faculty satisfaction with the online learning
environment on student outcomes. Hartman et al. (2000) suggest a co-linear relationship exists
between student outcomes and faculty satisfaction with online learning and that each impacts the
other. The authors point out in the review of their study that faculty satisfaction is influenced by
a number of environmental factors including infrastructure, faculty development opportunities,
faculty support and recognition, as well as institutionalization of online learning. Their
conclusion, that faculty satisfaction drives student outcomes, and vice-versa, that student
outcomes drive faculty satisfaction provides a unique perspective on the inter-relatedness of
factors within the online learning environment.
Bolliger and Wasilik (2009) report that a positive correlation exists between faculty
satisfaction with online learning and student performance, which implies that a faculty
dissatisfied with online learning may in some way contribute to lower student outcomes. Bolliger
and Wasilik developed a survey tool, the Online Faculty Satisfaction Survey (OFSS) that can be
used to determine faculty satisfaction with online teaching and learning in terms of student-
related, instructor-related, and institutional-related factors. A valid, reliable measurement
instrument, as this tool was deemed to be, provides the ability to survey faculty and use the
findings in conjunction with other measures such as student outcomes. This has the potential to
provide further validation and support for the idea that faculty satisfaction with online teaching
and learning can impact the outcomes of the students taught by these members of the faculty.
Ulmer et al. (2007), developed a survey instrument that attempts to measure faculty
perception of the comparative value and efficacy of distance education, as well as the perception
of status of distance teaching. Though no attempt was made to correlate the survey results with
student outcomes, the authors suggest that would be a likely next step. The study did show that

36
instructors who have experience with distance education have a better perception of it than those
who have not had that experience. This suggests that experience may also play a role in overall
faculty satisfaction with online and distance learning. The point is made that a successful
distance education program is reliant upon a dedicated and committed distance faculty. A
positive perception of distance education and satisfaction with the distance-learning environment
are likely contributors to that success.
Faculty satisfaction is a complex idea; it is an interaction of conditions related to the
students, the institution, the department and even an instructor’s own experiences and attitudes.
Developing a deeper understanding of the aspects of faculty satisfaction that have the potential to
positively and negatively impact student outcomes will be very useful when creating professional
development programs for online faculty. Faculty who feel well-supported by their institutions,
who have, for example, adequate technical and pedagogical support, and adequate professional
development opportunities are reported to be more satisfied with online teaching overall (Tabata
& Johnsrud, 2008).
Student Satisfaction
It would be remiss to consider faculty satisfaction in the OLE without also considering
student satisfaction. The interaction between faculty satisfaction and student satisfaction is both
complex and recursive; each impacts the other. Student satisfaction is a critical consideration
because it has been shown that students who are more satisfied with their online courses are
more likely to complete them, thus contributing positively to overall successful completion
(Swan, 2001). Menchaca and Bekele (2008) were able to show a positive correlation between
student satisfaction with their online educational experiences and their willingness to continue
taking online courses at the same institution. Jackson, Jones, and Rodriguez (2010) substantiated

37
similar findings while pointing out the importance of student satisfaction to student retention in
online programs. Indeed, student satisfaction and success are excellent indicators of online
program quality (Sampson, Leonard, Ballenger, & Coleman, 2010).
Numerous studies have been conducted to determine factors associated with student
satisfaction in the OLE. A study by Ortiz-Rodriguez, Tieg, Irani, Roberts, and Rhoades (2005)
revealed that four factors could be linked to student satisfaction: communication and timely
feedback, good course design with rich media, administrative issues such as good software, and
good support. Similarly, Evans (2009) was able to determine that faculty involvement,
curriculum, student engagement, and flexibility were factors that significantly contributed to
student satisfaction.
Of special interest to this study is the frequency with which faculty-related factors have
been shown to contribute to student satisfaction with the OLE. Bolliger and Martindale (2004)
demonstrated that the instructor is the main predictor of student satisfaction. Of note, 64.48% of
the variability in measured student satisfaction was found to be due to instructor/instruction
factors. Strong relationships have been found between timeliness/accessibility of the instructor
and student satisfaction. Clearly stated expectations by the instructor as well as instructor
enthusiasm have been shown to have a positive correlation with students’ perceived value of the
online course (Jackson et al., 2010). Swan (2001) reported that students who had high levels of
perceived interaction with the instructor also had high levels of satisfaction with the course.
Those same students also reported higher levels of learning. Instructor feedback was determined
to be the most significant transaction in support of quality communication in online courses
(Ortiz-Rodriguez et al., 2005).

38
It is evident that aspects of student satisfaction in the OLE, and by extension, successful
completion by students in the OLE are tied to faculty-related issues. Hartman et al. (2000)
uncovered a strong relationship between faculty satisfaction and student outcomes. This is an
excellent indication that most members of the faculty are motivated by, and feel rewarded by
student success in their online learning endeavors (Meyer, 2002). Frederickson, Pickett, Shea,
Pelz and Swan (2000, p.258) confirmed this idea; “Those who felt that their on-line students did
better also felt significantly more satisfied with on-line teaching.” Working to better understand
this relationship has potential for improving professional development programs geared towards
online instructors and improving the overall quality of online programs.
Review of Factors Contributing to Faculty Satisfaction
Considering the varied factors that influence faculty satisfaction with the OLE six
significant themes emerge from the literature. An overarching theme of interaction; interaction
amongst students and interaction between students and instructor; is evident. A theme that
focuses on the mechanics of online learning, that is, the planning, designing, and delivering of
online instruction becomes apparent. The nature of the institutional support provided to and
perceived by the online faculty, in both breadth and depth of support describes a fourth theme.
Finally, instructor attitudes towards online teaching as well as views of the affordances provided
by the OLE substantiate the fifth and sixth themes of online faculty satisfaction. Each of these
themes has been framed by the previous discussion, but a focused look at each element will help
to define the parameters of the survey used for this study.
Interaction is seen by some to be not just an important aspect of online learning, but the
core of online learning (Simmons, Jones, & Silver, 2004). The ability for students to
communicate and interact with other students, as well as with the course instructor is seen as

39
instrumental to the online environment (Frederickson et al., 2000; Hartman et al., 2000).
Interaction is seen as a means of encouraging critical thinking and problem solving (ADEC,
n.d.).
Student-to-student interaction. Online courses are often characterized by a requirement
for students to actively participate through online discussions or chats (Anderson & Haddad,
2005). More active involvement may also be required; students may be asked to comment on or
peer review each other’s projects, offering suggestions for improvement which has the potential
to generate both mutual support and learning (Simmons et al., 2004). Pointedly, Wasilik and
Bolliger (2009) found that lack of student involvement in the online course contributed to overall
dissatisfaction with the experience. Wasilik and Bolliger also determined that high levels of
interaction and the sharing of resources between students are considered to be positive aspects by
the online instructors.
Faculty-to-student interaction. Active communication with students contributes
positively to online faculty satisfaction (Bolliger & Wasilik, 2009). Moore and Kearsley (2005)
support this idea as well, indicating that the faculty-to-student interaction is essential in teaching
and learning online. This interaction allows faculty to fulfill their responsibility for providing
feedback and building effective intervention to improve online student performance. It also
provides the primary means of responding to student needs and questions. As well, faculty who
are more satisfied with online teaching report a “high level of interaction with online students”
(Wasilik & Bolliger, 2009, p. 177) as contributing to that satisfaction than do faculty who are
less satisfied with online teaching.
Course design, development, and teaching. The time required to design, develop, and
teach an online course can contribute to faculty satisfaction with online teaching in both positive

40
and negative ways. While some found online teaching to take less time than teaching an
equivalent face-to-face course (DiBiase, 2000), others found it to be more time consuming
(Conceição, 2006; Visser, 2002). Overall, workload – including preparation, time for design and
development, and time for teaching – were faculty concerns that have the potential to impact
faculty satisfaction with online teaching (Betts, 1998; O’Quinn & Corry, 2002).
Assessment is an important component of an online course (Simmons et al., 2004), and
online course tools provide multiple means to assess in both formative and summative ways. The
availability of these tools and the know-how to use them contribute to faculty satisfaction.
Consequently, the lack of viable tools for assessment may contribute negatively.
Several aspects of online teaching impact faculty satisfaction. For example, when student
performance in the OLE is better, faculty satisfaction is higher (Frederickson et al., 2000).
Student motivation and issues of conflict resolution within the OLE contribute to satisfaction as
does the instructor’s perceived quality of the online experience he or she is delivering (Betts,
1998; Bower, 2001; Wasilik & Bolliger, 2009).
Institutional support. Milheim (2001) indicates that “one of the most important issues (.
. .) is the overall institutional support for the development and implementation of distance
education” (p. 538). Concerns that should be addressed by the institution include those of release
time (Betts, 1998; O’Quinn & Cory, 2002), compensation (Bower, 2001; Milheim, 2001;
Simonson et al., 2009), technical support (Betts ; O’Quinn & Cory), training (O’Quinn & Corry),
and reliable technology (ADEC, n.d.; Betts, 1998; Fredericksen et al., 2000). In general,
institutional policy – encompassing all of the topics indicated – bears a significant weight in
terms of faculty satisfaction with online teaching.

41
Instructor attitudes. The degree to which an online instructor looks forward to teaching
online in the future is an indication of their level of satisfaction with the OLE (Wasilik &
Bolliger, 2009). Many factors contribute to this attitude, but of note are issues of technology-
related problems (Arvan & Musumeci, 2000; Wasilik & Bolliger), the intellectual challenge
presented by the OLE (Betts, 1998; Panda & Mishra, 2007), the professional development
opportunities that online teaching provide (ADEC, n.d.; Bower, 2001; Hartman et al., 2000;
Palloff & Pratt, 2001), and the potential to promote positive student outcomes (Sloan
Consortium, 2006). Students present additional sources of frustration and joy, both of which
contribute to instructor attitude towards the OLE. Faculty can become frustrated when students
are not prepared to learn online and have poor time management, technology, or written
communication skills. As well, unrealistic expectations that students have regarding instructor
availability can lead to frustration (Wasilik & Bolliger). On the other hand, some online faculty
indicate the enjoyment they derive learning from students and describe their online teaching
experiences as “’stimulating’, ‘invigorating’, ‘exciting’, ‘rewarding’, ‘satisfying’, ‘gratifying’,
and ‘empowering’” (Conceição, 2006, p. 40). Positive online teaching experiences contribute to
overall job satisfaction (Betts, 1998).
Affordances. The OLE presents affordances to both faculty and students, both of which
can contribute to faculty satisfaction. Instructors gain scheduling flexibility with online teaching
while students gain flexibility in course access (Wasilik & Bolliger, 2009), which provides
opportunities for students they might not otherwise have. The likelihood of attracting a more
diverse student population is a positive aspect of the OLE (ADEC, n.d.; Betts, 1998; Rockwell,
Schauer, Fritz, & Marx, 1999; Wasilik & Bolliger). The OLE also presents faculty with

42
opportunity to integrate a variety of resources into an online course and provide students with
easy access to those materials (Bolliger & Wasilik).
Summary
Online learning is a relatively new player in higher education that has a rich history in
distance education. This review included an overview of that history as well as a consideration of
the theory that supports distance education and online learning. The large numbers of studies that
overwhelmingly show no significant differences in student outcomes between online and
traditional courses, and especially the more recent findings that online students are
outperforming traditional students (Shachar & Neumann, 2010), are reassuring to administrators
of online and distance learning programs. Yet this focus on comparison studies is likely
misleading. Howell and Laws (2004), point to a need to focus evaluation on “the last crop of
apples with the current crop… all within the same institutional orchard” (p. 250). They
encourage a move away from comparison studies to a focus on identifying and encouraging best
practices within the OLE.
The online learning environment is complex. Student-related, institutional-related, and
faculty-related factors all play a role in contributing to the complexity. Though that complexity
creates challenge, that challenge cannot be an excuse to forgo the work required to better
understand the environment and how those factors impact the online learning experience. Clark
(1983, 1994) alluded to this complexity by suggesting that observed differences between online
and face-to-face learning outcomes can be attributed to a vast array of variables and
interpretation of those differences becomes virtually impossible. Reducing the complexity by
singling out specific factors is one step towards providing better online experiences for students
and instructors. This study will focus on faculty-related factors, particularly faculty satisfaction

43
with the online learning environment, to try and better understand how faculty may influence
student outcomes. The study should be viewed as part of a more comprehensive evaluation of
online learning.
The next chapter outlines the methodologies that were employed in the study. The
methodologies were chosen with the goal of developing an understanding of the relationship
between faculty-related factors within the online learning environment and the construct of
student outcomes, operationally defined as the rate of successful online course completion.

44
Chapter 3 - Methodology
Introduction
This chapter describes the methodology employed for the research study. First, the
rationale for using a quantitative approach will be shared along with an overview of the research
design. A description of the population studied and the specific sampling techniques used will be
described, followed by a review of the instruments used to collect data. The plan undertaken for
data collection and analysis will be discussed. The chapter will conclude with a discussion of
validity and reliability as well as ethical considerations and study limitations.
Correlational research is a quantitative methodology that seeks to examine the strength
and direction of relationships between two or more variables (Ary, Jacobs, Razavieh & Sorensen,
2006). One objective of this study was to determine the extent of the correlation between faculty
satisfaction with the online learning environment and successful course completion of online
students. A quantitative approach to the study opened the door to projecting the findings to a
larger population of online teachers and learners. Additionally, a quantitative approach provided
a means to aggregate faculty and student data from across multiple disciplines and subjects
which, in turn, increased the breadth of the study.
A survey was the source of primary data for the study; a measure of faculty satisfaction.
An institutional report, the Completion Report, was the source of secondary data for the study;
the rate of successful online course completion. For the purposes of this study successful
completion was defined as the percent of students who complete an online course with a grade of
‘C-‘or better. It should be noted that students self-select into online courses and almost always
have the option of selecting a face-to-face course instead of the online version. This was a non-
experimental study in which variables of study were defined, but not manipulated. The rate of

45
course completion was the dependent variable, the faculty satisfaction index and relevant sub-
indices were the independent variables.
Access to Online Faculty
As the Associate Dean of Continuing Education, with oversight responsibilities for online
faculty development, the researcher had ready access to the population of online faculty at the
institution. This established relationship supported the study in a positive way, at least in terms
of response rate to the survey. The findings of the study were of particular interest to the
researcher because of the potential to inform and direct ongoing professional development for
online faculty at Weber State University.
Sampling - Source of Participants and Rationale for Selection
Because this study focused on faculty who teach online at a specific institution, a
convenience sample was used that consisted of all online instructors at the institution willing to
respond to the survey, potentially 244 instructors in the course of the 2010/2011 academic year.
The survey and invitation to participate was sent to all online instructors with the goal of getting
as many to participate as possible. Higher participation increases the power of the study and
makes it more likely that findings will be significant (Rudestam & Newton, 2007). In order to
achieve a 95% level of confidence, with a margin of error that does not exceed ±5%, a return of
152 surveys was needed, and indeed 172 were returned. The responding faculties work in one of
seven academic colleges or the library. Their online teaching experience varied, at the time of the
survey, from 1 semester to 13 years and most had participated in formal training in the use of the
learning management system that supports online teaching at the institution.
Instrumentation
Bolliger and Wasilik (2009) developed an Online Faculty Satisfaction Survey (OFSS) in
46
2007 that was designed to help identify and confirm factors that have an influence on faculty
satisfaction in the online learning environment. Bolliger, Inan, and Wasilik (in preparation)
revised and expanded the OFSS after an extensive review of the literature. This careful review
was important because it contributed to both the face validity and content validity of the
instrument (Rudestam &Newton, 2007).
The revised faculty satisfaction instrument contained 42 questions; six demographic
questions and 36 questions that were scored using a 5-point Likert scale. The instrument
included six constructs: (1) student-to-student interaction, (2) teacher-to-student interaction, (3)
considerations of course design/development/teaching, (4) institutional support, (5) attitudes, and
(6) affordances. The instrument underwent expert review to ensure content validity and was
piloted at a western research university to confirm satisfactory reliability.
The validated instrument was then administered to this study’s online faculty. Additional
questions were included in the survey that sought to determine instructors’ pedagogical beliefs.
While this information is not directly relevant to this study, it was gathered for use by the
University of Wyoming researchers in other studies. This study contributed to the ongoing effort
to establish instrument validity (Appendix A).
The survey was used to gather information from online faculty at Weber State University
during the Spring 2011 semester. Faculty response to the survey was then used to arrive at
faculty satisfaction indices related to the six survey subscales previously described, as well as an
overall satisfaction score.
Other Data Sources
At the conclusion of each semester, a ‘Completion Rate Report’ is run for the Provost and
the Dean of each college at the university. This report was developed to tabulate final grade data
47
from the student information system and provides a summary of final grades for every course
taught at the university.
Each line of the report reflects a single course and provides a unique course reference
number (CRN), the modality in which the course was taught (ONL, ONC, Hybrid, Independent
Study, Lab), the total number of students in the course, the total number of ‘A’, ‘B’, ‘C’. ‘D’,
‘F’, ‘I’, ‘CR’, ‘NC’, ‘W’, ‘UW’ grades, average final grade for the class, the percentage of ‘W’,
‘UW’ grades, the percentage of successful completion (all grades ‘C-’ and above), the
percentage of standard completion (all grades ‘D-’ and above), and the percentage of
unsuccessful completion (all ‘F’ and ‘UW’ grades). CR and NC grades are not included in the
average final grade calculation, but are included in the successful and unsuccessful completion
categories (see appendix B for a sample report). ‘W’ grades represent students who withdrew
from a course after the third week of the semester, but before the 12th week. No formal grade
distinction is given to students withdrawing from a course within the first three weeks of the
semester. A ‘UW’ grade represents students who simply stopped attending the class without
official notification. Because a ‘UW’ grade is included in a student’s GPA calculation in the
same way as a failing grade, those grades are tabulated in the ‘unsuccessful’ category.
The data extracted for the study included CRN (which allows for the identification of the
course instructor), number of students enrolled, percent of successful completion, average final
course grade, and department and college of course ownership. These data were harvested only
for those instructors who had both completed the OFSS and had given permission for retrieval of
course grade data for association with their survey results. Only relevant online course data were
retrieved; on-campus and hybrid course data were not be included. The data were placed in a
data set with the following fields:

48
Instructor
Dept
College
Term
CRN (online course identifier)
Number of Students
Average Final Grade
percent of successful completion
percent of official withdraw
percent of unofficial withdraw
Data Collection
Part I – faculty satisfaction data. Faculty satisfaction and relevant demographic data
were gathered from the satisfaction survey previously discussed. All members of the
faculty who taught online during the period of study, August of 2010 through April of 2011
were invited to participate in the study.
Process. The following steps were taken to gather data:
Subjects were identified from the Fall 2010 and Spring 2011 master course schedules for
Weber State University. All faculties who taught an online course during one or both of
those semesters were invited to participate in the study.
The subjects received an e-mail (Appendix C) asking them to complete a web-based
informed consent form (Appendix D) and the web-based survey. Two Word attachments
were included in the e-mail: the cover letter (Appendix E) and the informed consent
form.
49
The cover letter provided potential participants with information about the study
including what specifically was being surveyed (Appendix E). Participants were advised
that while participation was voluntary, the survey was not anonymous so that survey
results could be matched with the appropriate course completion data. Confidentiality of
results, however, was promised.
Participants simply had to click the link to the survey provided in the email to initiate the
instrument. The informed consent was presented as the first question in the survey.
Participants were advised that their consent was given with a ‘Yes’ response to the first
question. Anyone choosing not to give consent was asked to indicate ‘No’ to the first
question and was then directed to ‘stop’ the survey and exit.
The Likert-scale items on the survey range from strongly disagree (1) to strongly agree
(5). The survey encompassed six satisfaction sub-scales: student-to-student interaction;
instructor-to-student interaction; course design/development/teaching; institutional
support; attitudes; and affordance. The survey also included six demographic questions.
Participants were advised that the survey would take approximately 15-20 minutes of the
respondent’s time.
The research took place at Weber State University, Ogden, Utah.
The subjects were able to terminate their participation in the study at any point by exiting
the survey window, if they desired.
The researcher at WSU followed up with non-respondents after one week through e-mail.
Follow-up messages continued until the survey closed on April 30, 2011.
50
Survey results were stored within the survey application, Chi Tester, an assessment
application developed at Weber State University and used widely throughout the
institution.
Results were downloaded into an Excel spreadsheet and then imported into an SPSS data
base. Respondent names were included with the responses at this point, in order to allow
the merging of relevant course completion data, as outlined in part 3, below.
Part 2 – final course grade data. Final course grade data were gathered from a standard
report, the Completion Rate Report that is run at the conclusion of every semester and provided
to the Provost as well as to the Deans of each of the colleges. The report provides a means to
collect and tabulate final course grades for all courses taught at the institution and is organized
by department within college. The report does not include instructor name, but does include a
unique course reference number (CRN) that in conjunction with the term field was used to
associate results with a specific instructor. The Completion Rate Report is not a public
document, but permission for use was obtained from the Office of the Provost. These data were
gathered for the fall 2010 and spring 2011 semesters, only for those members of the faculty who
had returned a useable survey. Based upon those criteria 471 courses were included in the study.
Part 3 – merging survey data and course grade data. The data sets were merged by
faculty name and resulted in a 471 record dataset. Once the dataset was merged, respondents’
names were removed from each record.
Confidentiality and protection of data. The survey was not anonymous because results
of the survey had to be associated with the appropriate course completion data. However, steps
were taken to insure the confidentiality of responses. Data from the faculty satisfaction survey
was shared with researchers at the University of Wyoming, but the shared data did not include

51
any personal identifiers. The researcher at the institution of study, Weber State University,
removed all identifiers prior to sharing the data set. Only the researcher had information that tied
a username to an individual instructor. Individual identities were not relevant to the study.
Compiled data were stored on an external flash drive, with a back-up stored on a
password-protected cloud application, Dropbox, to which only the researcher had access.
Campus-networked computers were used to analyze this data, but the data were never transferred
to or stored on these computers. All generated reports were stored on the flash drive as well, not
on any networked drives or computers. Two backups of the data were maintained at all times,
again on drives or devices external to any networked computers. Collected data were accessed
only by the research team and will be destroyed at the conclusion of study, by the end of 2012.
Data Analysis
The survey data were examined for missing data, outliers, and multicollinearity. In order
to review instrument reliability a Cronbach alpha coefficient was calculated to verify that
internal reliability was still acceptable. The result for the overall scale was high (a = .90).
Reliability results for the subscales attitudes (a = .83), student-to-student interaction (a = .79),
affordances (a = .78), and institutional support (a = .75) were high. Reliability coefficients for
the subscales instructor-to-student interaction (a = .65) and course design (a = .58) were
acceptable.
An overall faculty satisfaction index was calculated for each participant as well as an
index for each of the six subscales. These indices became the independent variables in the next
phase of the study. The values of the indices ranged from 1 to 5 on a continuous scale, with
lower numbers indicating less satisfaction and higher numbers indicating more satisfaction.
Several items on the survey were written with a reverse scale (1 indicating higher satisfaction, 5

52
indicating lower) and were subsequently reverse-coded prior to any other calculations. These
data were then analyzed using standard descriptive statistics. Measures of central tendency and
variability were calculated in order to develop an understanding of the general level of
satisfaction with the online learning environment.
Demographic data gathered in the survey, such as the college in which each instructor has
membership, were introduced into the analysis to provide a more complete picture of faculty
satisfaction with online learning at this institution. For example, looking at faculty satisfaction by
college allowed for a cross-tab analysis that helped determine if a significant difference in
satisfaction is evident between colleges. Similar post-hoc analyses were conducted with other
independent variables including gender, age, and years of online teaching experience.
This type of analysis, in which comparisons are made between subscales that comprise an
overall score, i.e., families of data, can be problematic if not handled conservatively. Whenever
more than one single test of significance is conducted on the same data, familywise error (FWE
is introduced (Hays, 1994). FWE is the probability that any one set of significance tests is a Type
I error. As more of these tests are done there is an increased likelihood that detected significance
is due to chance. To counter FWE, a more conservative post-hoc analysis was conducted on the
data using a Bonferroni test. Bonferroni uses a modified significance level to test hypotheses
which divides the acceptable overall risk of a Type I error, .05% for this study, by the number of
hypotheses tested (Olejnik, Li, Supattathum, & Huberty, 1997). In this study, the six subscales
suggest six hypotheses; therefore the significance level was modified to .05/6, or .00833.
Student success rates were then gathered for the online courses of those members of the
faculty who participated in the study. Success rates were gathered for two semesters yielding 471
combined records of faculty satisfaction scores and student success rates. Descriptive analyses

53
and analysis by factor; college, age, gender, and years of online teaching experience; were
conducted.
In the next phase of the study, the overall faculty satisfaction score, the independent
variable, was analyzed along with the percentages of successful completion, the dependent
variable, to determine the extent of the relationship between faculty satisfaction and student
success. As both the independent and dependent variables were interval variables, a simple
correlation analysis was conducted to determine the extent and strength of the relationship. A
partial correlation analysis was conducted to determine the extent to which factors other than
overall faculty satisfaction contributed to student success results. A regression equation was
calculated in the interest of developing some sort of model for predicting average student success
rate from a faculty satisfaction score. This test assisted in helping to determine how much of the
variance in the dependent variable could be explained by using the regression line for predicting
the value of the dependent variable instead of using the simple mean (Rhea & Parker, 2005).
Finally, the demographic information gathered through the survey was combined with the
satisfaction subscale variables derived from the survey and considered together to determine
their effect on student completion in online courses. A step-wise regression analysis was
conducted on this combined data set to see the extent to which the variation in student
completion rates could be explained.

54
Chapter 4- Results
Introduction
This chapter presents the results of the faculty satisfaction survey as well as analysis of
other data gathered in support of the study. Results of the faculty satisfaction survey include
demographic information about the population of surveyed faculty and results of the statistical
analyses of the survey responses within the context of the four research questions introduced in
the first chapter.
A significance level of .05 is assumed unless otherwise noted; p values are indicated
throughout the statistical analysis.
Faculty Demographic Information
The survey was administered to the entire population of 241 members of the faculty who
had taught an online course during the semesters of study, fall 2010 and spring 2011 at Weber
State University. One hundred seventy two surveys were returned for a response rate of 71%.
Four surveys were discarded because one third of the data were missing, yielding 168 usable
surveys; a useable response rate of 70%. Demographic information collected is provided in
tables 1 and 2.

55
Table 1.
Online Faculty Characteristics: Age and Gender (N = 168)
Characteristic n % of Total
Age
20 - 29 2 1.3
30 - 39 22 13.1
40 - 49 41 24.4
50 - 59 43 25.6
60 + 46 27.4
Non response 14 8.3
Gender
Female 80 47.6
Male 77 45.8
Non Response 11 6.5
Females made up 47.6% of the respondents to the survey (n = 80) while males made up
45.8% of the respondents (n = 77). Eleven respondents (6.5%) chose to not indicate their gender.
While 8.3% of respondents chose not to disclose their age, 53% of those who did were 50
years or older (n = 89). The remaining respondents ranged in age from 26 through 49.
Table 2 shows a breakdown of the faculty respondents by the college in which they teach
and the number of years of online teaching experience each respondent claims.

56
Table 2.
Online Faculty Characteristics: College Represented and Years of Online Teaching Experience
(N=168)
Characteristic n % of Total
Years of Online Teaching
.5 - 1 7 4.2
1.5 – 3 26 15.5
3.5 – 5 33 19.6
5.5 – 10 39 23.2
>10 63 37.5
College Represented
Arts & Humanities 28 16.7
Business 19 11.3
Applied Science 28 16.7
Education 13 7.7
Health Professions 35 20.8
Science 15 8.9
Social Sciences 22 13.1
Library 8 4.8
Over half of the responding faculty members have been teaching online for more than
five years (60.7%, n = 102) and 37.5% (n = 63) have taught more than 10 years. Weber State
began offering online courses in 1998, 13 years prior to this study, so a high number of the
respondents have been teaching online since the modality was made available at the institution.

57
All colleges at the institution and the library were represented in the study with the
College of Health Professions showing the highest percent of total participation at 20.8% (n =
35). The respondents taught a total of 471 online courses during the two semesters of study.
To summarize the demographics, the respondents were evenly split along gender lines,
were generally older, and had extensive online teaching experience. This demographic
information provides context from which to view the responses to the four research questions.
Research Question 1
The participating faculty was asked to respond to 36 questions related to the online
learning environment. The questions, delivered through an online survey tool were grouped in
six subscales, each with a different focus on online teaching. Each subscale addressed a different
aspect of online teaching that has been shown to contribute to overall faculty satisfaction with
teaching in the online learning environment. The collected responses aid in answering the first
research question; what is the general level of faculty satisfaction with online teaching at Weber
State University?
Table 3 displays the question text, mean, and standard deviation of each question in the
survey. A brief overview of each subscale aids in reading the table. The student-to-student
interaction subscale measured the extent to which interaction between students in the online
environment contributed to faculty satisfaction, while the student-to-teacher interaction subscale
measured the contribution of interactions between students and teacher in both types and quality
of interaction. The design-develop-teach subscale considers the impact of concepts such as time
required to design, develop, and teach online courses as well as issues of course quality and
conflict resolution on faculty satisfaction. The institutional support subscale addresses the
contribution of institutional issues such as policy, training, and compensation to faculty

58
satisfaction. The final two subscales – attitude and affordances – consider general faculty
attitudes about online teaching and learning, and how the faculty views the affordances that the
online learning environment provides both students and instructors.

59
Table 3.
Items, means, standard deviations for questions 1 - 36 (N=168) where scores range from 1 =
strongly disagree to 5 = strongly agree
Student-to-student Interaction Subscale
Item M SD
1. My online students share resources with each other within the course 3.48 .972
2. My online students participate enthusiastically. 3.59 .720
3. *My online students are somewhat passive in their interactions. 2.95 .943
4. My online students actively collaborate. 3.01 .957
5. My students appear to be part of an online community. 3.22 .969
6. My students work well together online. 3.12 .888
Subscale 3.23 .635
Instructor-to-student Interaction Subscale
7. My interactions with online students are satisfying. 3.90 .794
8. I like using various online communication tools to interact with my
students. 3.99 .793
9. My online students receive quality feedback. 4.21 .667
10. My students contact me when they have questions. 4.40 .693
11. *I do not get to know my online students well. 2.87 1.073
12. I am accessible to students in online courses. 4.57 .565
Subscale 3.99 .470
Design-develop-teach Subscale
13. *It takes a lot of time to develop an online course. 1.58 .770
14. I am satisfied with how I assess students in online courses. 4.01 .823
15. I am pleased with the quality of student work in online courses. 3.73 .844
16. I am satisfied with students’ motivation in online courses. 3.30 .951
17. I am satisfied with the content quality of my online courses. 4.07 .751
18. I am satisfied with how I handle conflicts in my online courses. 3.96 .695
Subscale 3.44 .462

60
Table 3 cont. Items, means, standard deviations for questions 1 – 36 (N = 168) where the scores range from
1= strongly disagree to 5 = strongly agree
Institutional Support Subscale
Item M SD
19. At my institution, teachers are given sufficient time to design and develop
online courses. 3.30 1.075
20. I have adequate technical support by my institutions. 4.21 .832
21. My needs for training to prepare for teaching online have been met. 4.16 .704
22. My institution provides fair compensation or incentives for teaching online. 3.29 1.111
23. I am satisfied with online teaching policies that have been implemented by
my institution. 3.47 .941
24. My institution provides the necessary technology tools (equipment and
software) for teaching online. 3.94 .920
Subscale 3.73 .627
Attitude Subscale
25. I look forward to teaching online. 4.02 .858
26. I am enthusiastic about teaching online. 3.99 .862
27. Technical problems do not discourage me from teaching online. 4.18 .720
28. I enjoy learning about new technologies that can be used for online
teaching. 4.03 .858
29. *Online teaching is often frustrating. 3.06 1.054
30. I consider online teaching to be fulfilling. 3.65 .923
Subscale 3.82 .652
Affordances Subscale
31. Online courses provide a flexible learning environment. 4.27 .770
32. I am satisfied with the convenience of the online learning environment. 4.26 .701
33. Online teaching allows me to reach a more diverse student population. 4.03 .905
34. I am satisfied that my students can access their online course from almost
anywhere. 4.48 .547
35. Online courses allow students to access a wide range of resources. 4.15 .692
36. In online courses every student has an opportunity to contribute. 4.07 .783
Subscale 4.21 .509
Overall 3.74 .401
Note. * indicates a survey item that was reverse-coded

61
The standard deviations varied between .55 and 1.11 with four items; 11, 19, 22, and 29;
in excess of one standard deviation. The mean overall faculty satisfaction score was 3.74. The
histogram in figure 3 shows a normal distribution of the scores, with a slight negative skew.
Figure 3. Histogram of faculty satisfaction overall.
Mean score and standard deviation for each of the subscales are displayed in table 4,
along with the minimum and maximum scores for each subscale. The student-to-student
interaction scale showed the lowest overall mean score (M = 3.23) while the affordances scales
showed the highest overall mean score (M = 4.21).

62
Table 4.
Mean Scores by Subscale (N=168)
Sub-scale Items Min Score Max Score M SD
Student-to-student interaction 1 – 6 1.17 4.67 3.23 .635
Teacher-to-student interaction 7 – 11 2.50 5.00 3.99 .470
Course Design/Develop/Teach 12 – 17 1.33 4.67 3.44 .462
Institutional Support 18 – 23 2.00 5.00 3.73 .627
Attitudes 24 – 30 1.83 5.00 3.82 .652
Affordance 31 - 36 2.50 5.00 4.21 .509
The faculty survey participants were asked to provide information about their ‘home’
college, gender, age, and their years of experience teaching online. Analyzing the survey results
by each of these factors provides a rich body of contextual information.
Analysis by college. Table 5 displays results of the measured overall level of satisfaction
by college. The college of Social & Behavioral Science registered the lowest level of satisfaction
with a mean score of 3.56 (n = 22) while the College of Health Professions registered the highest
level of satisfaction with a mean score of 3.89 (n = 35). A one-way analysis of variance was
conducted to evaluate the relationship between college membership and overall faculty
satisfaction. The independent variable, college membership, included eight levels; Arts &
Humanities, Business & Economics, Applied Science & Technology, Education, Health
Professions, Science, Social & Behavioral Science, and the Library. The ANOVA result was not
significant, F(7,160) = 1.69, p = .115. Data from the separate colleges can be combined.

63
Table 5. Overall Faculty Satisfaction by College (N = 168)
College n Minimum Maximum M SD
Arts & Humanities 28 2.39 4.56 3.77 .509
Business & Economics 19 3.03 4.28 3.65 .342
Applied Science & Tech. 28 3.00 4.25 3.73 .360
Education 13 3.42 4.42 3.77 .276
Health Professions 35 3.39 4.53 3.89 .314
Science 15 2.61 4.56 3.76 .454
Social & Behavioral Science 22 2.39 4.31 3.56 .483
Library 8 3.25 3.94 3.57 .234
Table 6 displays the mean score and standard deviation for each subscale of the survey,
by college.
Table 6.
Faculty Satisfaction by Subscale by College (N = 168) 1 2 3 4 5 6
College n M SD M SD M SD M SD M SD M SD
Arts & Humanities 28 3.25 .58 4.05 .51 3.49 .70 3.71 .80 3.85 .71 4.29 .59
Business & Economics 19 2.91 .66 3.89 .47 3.36 .35 3.82 .44 3.79 .60 4.11 .49
Appl. Sci. & Tech. 28 3.24 .56 3.92 .44 3.51 .40 3.74 .51 3.72 .70 4.24 .45
Education 13 3.21 .52 3.96 .34 3.58 .31 3.79 .59 3.87 .62 4.19 .41
Health Professions 35 3.56 .57 4.23 .37 3.54 .28 3.57 .58 4.07 .47 4.34 .48
Science 15 3.02 .87 4.09 .38 3.51 .45 3.69 .70 4.04 .52 4.2 .57
Soc. & Beh. Science 22 3.20 .61 3.71 .61 3.16 .50 3.89 .77 3.48 .77 3.96 .53
Library 8 2.88 .49 3.88 .23 3.17 .30 3.73 .54 3.52 .62 4.27 .48
Note. (1 = student-to-student interaction, 2 = student-to-teacher interaction, 3 = design, develop,
teach, 4 = institutional support, 5 = attitude, 6 = affordances)
Because the analysis was run on the six correlated scales, the required probability level
for significance was determined to be .05/6 (Olejnik, Li, Supattathum, & Huberty, 1997). Thus
an analysis showing p < .0083 was considered a highly significant result. Using a Bonferroni

64
calculation is a conservative approach to the comparison of means that reduces the potential for
Type I error. Interesting, but not highly significant differences will also be noted. Analyses
resulting in p values greater than .00833 and less than or equal to .05 will be highlighted as
interesting.
When the subscale responses were analyzed by home college highly significant
differences were detected in the student-to-student interaction and the student-to-teacher
interaction. The design-develop-teach and attitude subscales showed interesting differences, that
is, where p < .05, but not less than .0083.
The College of Health professions showed the highest satisfaction with student-to-student
interaction (3.56), whereas the Library and School of Business showed the lowest satisfaction in
this subscale (2.88 and 2.91, respectively). This difference is highly significant, F(7,160) = 2.84,
p = .008. The home college had a large effect (Cohen’s d = 1.279) between the College of Health
and the Library, and a slightly smaller effect between the College of Health and the School of
Business (Cohen’s d = 1.054).
The difference between means in the student-to-teacher interaction subscale was also
highly significant, F(7,160) = 3.113, p = .004), with the College of Social Science presenting the
lowest mean score, 3.71, and the College of Health Professions presenting the highest mean
score at 4.23. The effect of home college was again large (Cohen’s d=1.031).
Both the design-develop-teach and attitude subscales showed interesting differences
between colleges, F(7,160) = 2.38, p = .024 and F(7,160) = 2.319, p = .028 respectively. In the
design-develop-teach subscale, the highest mean score was seen in the College of Education (M
= 3.58) while the lowest (M = 3.16) was seen in the College of Social Sciences.

65
An interesting difference in attitudes was evident, F(7,160) = 2.32, p = .028. The College
of Health Professions had the highest mean score in the attitude subscale (M = 4.07) while the
College of Social Sciences had the lowest (M = 3.48).
Analysis by gender. Table 7 illustrates the mean score for overall satisfaction and each
subscale by gender (N = 157). Several participants chose to not disclose their gender.
Table 7.
Faculty Satisfaction by Subscale by Gender (N=157) 1 2 3 4 5 6 Overall
Gender n M SD M SD M SD M SD M SD M SD M SD Female 80 3.35 .60 4.03 .51 3.46 .45 3.64 .61 3.85 .65 4.23 .49 3.76 .40
Male 77 3.10 .65 3.94 .44 3.42 .48 3.80 .63 3.79 .67 4.18 .54 3.70 .41
Note. (1 = student-to-student interaction, 2 = student-to-teacher interaction, 3 = design, develop,
teach, 4 = institutional support, 5 = attitude, 6 = affordances)
Females rated higher on overall satisfaction and in all subscales with the exception of
institutional support. However, the only interesting difference of note was found in the student-
to-student interaction subscale, F(1,155) = 6.152, p = .014.
Analysis by age. Table 8 provides a view of the mean overall satisfaction score and each
subscale mean score by age. Participants were grouped into one of six age categories. Not all
survey participants chose to disclose their age (N = 154).

66
Table 8.
Faculty Satisfaction by Subscale by Age (N = 154) 1 2 3 4 5 6 Overall
Age n M SD M SD M SD M SD M SD M SD M SD
20 – 29 2 2.58 .85 4.42 .35 3.5 .47 3.92 1.30 4.5 .24 4.25 .12 3.86 .51
30 – 39 22 3.02 .66 3.76 .56 3.11 .62 3.35 .62 3.46 .66 4.00 .60 3.45 .49
40 – 49 41 3.23 .65 3.94 .52 3.43 .39 3.86 .59 3.73 .72 4.18 .56 3.73 .39
50 – 59 43 3.30 .57 3.99 .43 3.52 .47 3.83 .63 3.94 .63 4.26 .48 3.81 .38
60+ 46 3.24 .64 4.08 .40 3.52 .38 3.69 .56 3.89 .55 4.26 .43 3.78 .33
All 154 3.21 .63 3.98 .48 3.44 .47 3.73 .62 3.81 .65 4.20 .51 3.73 .40
Note. (1 = student-to-student interaction, 2 = student-to-teacher interaction, 3 = design, develop,
teach, 4 = institutional support, 5 = attitude, 6 = affordances)
Faculty belonging to the 30 – 39 year old group consistently showed lower levels of
satisfaction throughout the survey. The only exception to that finding is in the subscale of
student-to-student interaction where the 20 – 29 year old group showed a lower level of
satisfaction than the 30 – 39 year old age group and every other age group. That difference,
however, is not significant.
A highly significant difference in means by age was found in the level of overall
satisfaction, F(4,149) = 3.55, p = .008. The 30 – 39 year old age group had the lowest score (M =
3.45) while the 20 – 29 year old age group had the highest mean score (M = 3.86). A post-hoc
analysis revealed that the highly significant difference was actually between the 30 – 39 year old
age group and the 50 – 59 year old age group (p = .006). Age accounted for 14% of the
variability in scores between these two groups (Cohen’s d = .821).
The design-develop-teach subscale mean score results indicated a highly significant
difference, F(4,149) = 3.043, p = .006. Again, the 30 – 39 year old age group had the lowest
mean score (M = 3.11) while the 50 – 59 year old and 60+ year old groups shared the highest
mean score (M = 3.52). The post-hoc analysis indicated the difference between the 30 – 39 year

67
old group and the 50 – 59 year old group was significant with p = .006, and a p of .005 when the
30 – 39 year old group was compared to the 60+ year old group. Age had a medium effect on the
variability in mean scores between these groups; 12% between the 30 – 39 and 50 – 59 year old
groups and 14% between the 30 – 39 and 60+ year old groups (Cohen’s d = .7452 and Cohen’s d
= .7973, respectively).
Interesting, but not highly significant differences were detected between age groups for
the institutional support subscale. Even though the 20 – 29 year old group scored highest on this
subscale (M = 3.92, n = 2), a post-hoc analysis indicated the significant difference was between
the 30 – 39 year old group (M = 3.35, n = 22) and the 40 – 49 year old group (M = 3.86, n = 41).
The attitude subscale also presented interesting differences in mean scores by age,
F(4,149) = 3.023, p = .02. The 30 – 39 year old group mean was the lowest at 3.46 while the 20
– 29 year old group mean was the highest at 4.5.
Neither highly significant nor interesting differences were detected in the student-to-
student interaction, the student-to-teacher interaction, or the affordances subscales.
Analysis by years of experience of online teaching. Faculty participants were grouped
by their years of experience teaching in the online learning environment. Groups were
differentiated at 0 – 1 years of experience, 1.5 – 3 years of experience, 3.5 – 5 years of
experience, 5.5 – 10 years of experience, and more than 10 years of experience. All survey
participants provided this information (N = 168). Table 9 shows the mean scores for each
subscale by age group.

68
Table 9.
Faculty Satisfaction by Subscale by Experience (n=168)
1 2 3 4 5 6 Overall
Years n M SD M SD M SD M SD M SD M SD M SD
0 – 1 7 3.67 .41 4.36 .24 3.79 .36 3.60 .84 4.05 .46 4.50 .33 3.99 .27
1.5 – 3 26 3.03 .75 3.94 .53 3.31 .62 3.45 .61 3.67 .70 4.05 .71 3.57 .52
3.5 – 5 33 3.25 .62 3.88 .58 3.35 .44 3.71 .64 3.68 .75 4.04 .47 3.65 .40
5.5 – 10 39 3.21 .61 4.00 .42 3.44 .48 3.80 .70 3.85 .68 4.30 .48 3.77 .39
>10 63 3.26 .62 4.02 .42 3.50 .37 3.82 .54 3.92 .56 4.28 .43 3.80 .34
All 168 3.23 .64 3.99 .47 3.44 .46 3.73 .63 3.82 .65 4.21 .51 3.74 .40
Note. (1 = student-to-student interaction, 2 = student-to-teacher interaction, 3 = design, develop,
teach, 4 = institutional support, 5 = attitude, 6 = affordances)
Those participants who had been teaching online one year or less displayed the highest
mean overall satisfaction score (M = 3.99) while those who had been teaching online one and
one half to three years had the lowest mean overall score (M = 3.57). Differences between means
of overall satisfaction, when analyzed by years of online teaching experience, were significant,
F(4,163) = 2.68, p = .034. This overall score is significant at the .05 level.
The only subscale that showed an interesting difference when analyzed by years of online
teaching experience was affordances, F(4,163) = 2.864, p = .025. Those who had taught for one
year or less had the highest mean affordance score (M = 4.5) and those who had taught between
three and one half and five years had the lowest mean affordance score (M = 4.04). The one and
one half to three years of experience group also had a low mean score (M = 4.05).
Table 10 provides a quick overview of noted differences between group means. A single
asterisk indicates a highly significant difference at a .0083 or less level, while two asterisks
indicate an interesting difference at a level between .0083 and .05.

69
Table 10.
Overview of means comparison by factor.
Satisfaction Index By college By age By gender By years of exp.
Overall * **
Student-to-student * **
Student-to-teacher *
Design, Develop, Teach ** *
Institutional Support **
Attitude ** **
Affordances **
Note. * = highly significant at < = .0083; ** = significant at > .0083 < .05
Initial analysis of the faculty survey shows a moderately high level of satisfaction with
the online learning environment at Weber State University (M = 3.74). The mean scores in each
of the subscales that define the idea of faculty satisfaction were no less than 3.23; all ‘above
average’ on a 5-point scale.
Research Question 2
The second research question in this study focused on the mean rates of successful
completion of online courses at the institution of study. During the semesters of study, Fall 2010
and Spring 2011, 776 online course sections were taught at Weber State University; 362 in the
fall and 414 in the spring. Of the total 776 sections, 471 were taught by completers of the faculty
satisfaction survey.
Successful completion has been defined as the percent of students who complete a course
with a grade of ‘C’, ‘B’, ‘A’ (including any modifiers of ‘+’ or ‘-‘) or ‘CR’ which indicates
credit in a credit/no credit course. Because students who achieve a grade of ‘D’ for a course are
often required to repeat the course, especially if the course is a program-level requirement, those

70
scores are not considered successful. Failing grades, grades of ‘W’, grades of ‘UW’, and grades
of ‘NC’ are the other potential grades a student could receive for a course that is not included in
the category of successful completion. Total student counts, upon which percentages of
completion are calculated, are the numbers reported by the institution at the end of the third week
of each semester. These are considered the official institutional counts that are reported to the
State Board of Regents and do not include students who withdraw from courses within the first
three weeks of the semester. Student withdrawals during the first three weeks of the semester are
not relevant to this particular study.
Table 11 shows the mean rate of successful completion of online courses during the
course of this study. The first column shows the successful completion rate of all online courses,
by college, while the second column shows the successful completion rate of all online courses
taught by participants in the faculty satisfaction survey.

71
Table 11.
Rate of Successful Completion of Online Courses
College
n
% Success
All Online
n
% Success
Survey Faculty
Arts & Humanities 114 82.99 79 82.09
Business & Econ. 74 77.57 42 77.12
Appl. Sci. & Tech. 131 82.74 81 82.83
Education 60 81.92 35 79.08
Health Professions 239 90.45 125 91.22
Science 64 72.66 41 69.64
Soc. & Beh. Sci. 86 74.30 51 73.37
Library 28 81.08 17 81.08
Figure 4 displays a histogram of the rate of successful completion for the online sections
taught by participant faculty. It is interesting to note the number of courses with a 100% rate of
successful completion.
Figure 4. Rate of successful completion of online courses

72
Successful completion by college. A one-way analysis of variance was conducted to
evaluate the relationship between rates of successful completion of sections taught by survey
participants and home college of the course and faculty. The result of the ANOVA was
significant, F(7,463) = 18.682, p < .01, however, Levene’s test of homogeneity of variances was
also significant at <.01. This result indicates that the underlying variances at the college level are
not equal between colleges. Under these conditions a univariate analysis of means is not
trustworthy; a nonparametric analysis must be used instead. The analysis was repeated using
Dunnett’s C, a procedure that accounts for unequal variances. The result of that analysis showed
a significant difference, at the 1% level of significance, of rates of successful completion
between colleges, F(7,463) = 18.682, p <.01. The strength of the relationship between home
college and successful completion is strong, as evidenced by the calculated η2 partial effect size.
Home college accounts for 22% of the variance in the dependent variable, rate of successful
completion.
A post-hoc analysis using Dunnett’s C was run to determine which colleges had mean
rates of successful completion that were significantly different from other college means. Table
12 shows the comparisons that were significant.
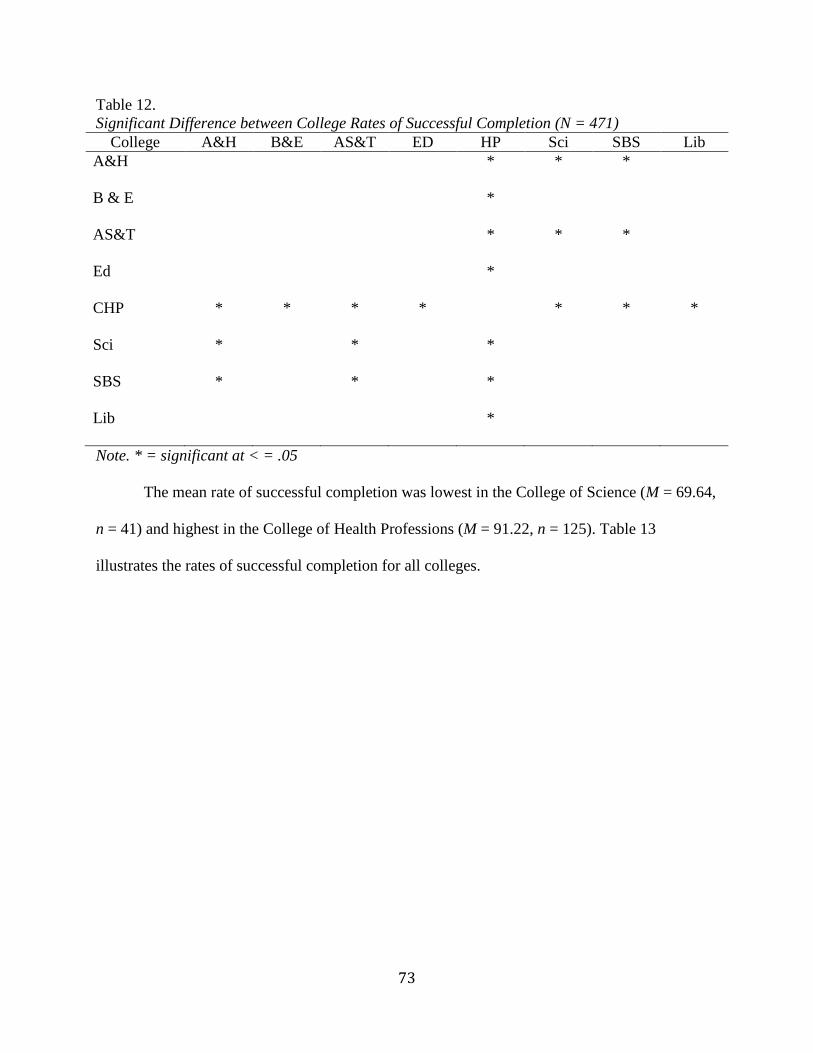
73
Table 12.
Significant Difference between College Rates of Successful Completion (N = 471)
College A&H B&E AS&T ED HP Sci SBS Lib
A&H * * *
B & E *
AS&T * * *
Ed *
CHP * * * * * * *
Sci * * *
SBS * * *
Lib *
Note. * = significant at < = .05
The mean rate of successful completion was lowest in the College of Science (M = 69.64,
n = 41) and highest in the College of Health Professions (M = 91.22, n = 125). Table 13
illustrates the rates of successful completion for all colleges.

74
Table 13.
Mean Rate of Successful Completion by College (N = 471)
College n Minimum Maximum M SD
Arts & Humanities 79 45.50 96.30 82.09 10.34
Business & Economics 42 50.00 100.00 77.12 15.09
Applied Science & Tech. 81 31.80 100.00 82.82 12.04
Education 35 46.90 100.00 79.08 13.04
Health Professions 125 40.00 100.00 91.22 10.73
Science 41 23.70 94.30 69.64 18.53
Social & Behavioral Science 51 38.90 100.00 73.37 16.24
Library 17 60.70 95.50 81.08 10.78
Successful completion by gender. The relationship between student success in online
courses and the gender of the course instructor was not significant, F(1,439) = .661, p = .417.
Online courses taught by female survey participants had a mean success rate of 82.23 (n = 231),
while courses taught by male survey participants had a mean success rate of 81.09 (n = 210).
Successful completion by faculty age. Faculty survey participants were grouped into
one of five age categories; 20 – 29, 30 – 39, 40 – 49, 50 – 59, and 60 or over. The relationship
between student success in online courses and the age group within which the instructor falls was
significant, F(4,426) = 12.755, p < .01. Again, however, Lavene’s test for homogeneity was
significant, indicating unequal variances between the age groups. When the analysis was
conducted using a Dunnett’s C, the significance was confirmed. A post-hoc analysis showed
significant differences in mean rates of online course completion between age categories at the
95% confidence level. See table 14 for information regarding these significant differences.

75
Table 14.
Significant Difference between Faculty Age-group Rates of Successful Completion
Instructor Age 20 – 29 30 – 39 40 – 49 50 – 59 60+
20 – 29 * * * *
30 – 39 * *
40 – 49 * *
50 – 59 *
>= 60 *
Note. * indicates significance at p < .05
The mean success rate of courses taught by faculty in the 20 – 29 year old group was low
(M = 41.4, n = 5), while the highest mean rate of success was found in the 30 – 39 year old group
(M = 85.68, n = 65). The effect of age appears to be very high in this comparison (Cohen’s d =
3.00). Whether this difference is due just to age or to some other external factor will be important
to consider.
Successful completion by years of experience teaching online. Finally, the relationship
between student success in online courses and the years of online teaching experience of the
course instructor was analyzed. Courses were grouped by the years of online teaching experience
of the instructor in one of five categories; one year or less of experience, one and one half to
three years, three and one half to five years, five and one half to ten years, and more than ten
years of experience. This analysis proved not significant, F(4,466) = 1.51, p = .199. The group
with one and one half to three years online teaching experience had the highest mean rate of
successful completion (M = 84.31, n = 76). The lowest mean rate of success was evident in the
courses taught by faculty with three and one half to five years of experience (M = 79.20, n = 80).
Table 15 shows the mean rates of successful completion for all ‘years-experience’ categories.

76
Table 15.
Mean Rate of Successful Completion by Years of Online Teaching Experience (n=471)
Years-experience n Minimum Maximum M SD
.5 – 1 11 36.40 100.00 81.48 18.88
1.5 – 3 76 23.70 100.00 84.31 16.98
3.5 – 5 80 38.90 100.00 79.20 15.23
5.5 – 10 115 31.80 100.00 80.88 15.60
More than 10 189 45.50 100.00 82.74 12.13
Results in support of research question 2 have been presented. The question, meant to
assist in better understanding the overall success rate of students in online courses at Weber State
University was answered based upon the online courses taught by the faculty who participated in
the study survey. Rates of successful completion were provided for all online courses at the
institution and for just the subset of online courses completed by surveyed faculty. The online
courses of surveyed faculty were then analyzed for comparison of means by college, by faculty
gender, by faculty age, and by faculty years-of-online-teaching-experience.
Research Question 3
The study’s third research question sought to develop a better understanding of the nature
of the relationship between faculty satisfaction with online teaching, as measured by the survey,
and the mean rate of successful completion of students in those faculty’s online courses. Course
completion data were gathered for each member of the faculty who participated in the survey, for
the two semesters under study. The 168 participating faculty taught a total of 471 online courses
during the Fall 2010 and Spring 2011 semesters.
A correlation analysis determines both the direction and strength of the relationship
between two variables. A Pearson correlation is used with interval data. Interval data is

77
continuous and interpretable, but has no “natural” zero (Hays, 1994). Both the mean rate of
successful completion of online courses and the scores from the survey are considered interval
data. Some might argue that rate of completion has a natural zero (when no one completes the
course) and would be considered a ratio variable in that case. Pearson correlation is well-suited
to ratio variables.
Because this research question is inferential by design, a hypothesis was developed in
order to test the question. The null hypothesis would indicate that there is no significant
correlation between the measured level of online faculty satisfaction, the independent variable,
and rates of successful completion of that faculty’s online students, the dependent variable. To
test the hypothesis a correlation coefficient was computed between mean rate of student success
and overall faculty satisfaction. The result of the analysis indicated a statistically significant
relationship between these two variables (r = .211, p < .01). In general, the results suggest a
positive relationship between student rates of successful completion and instructor satisfaction
with the online learning environment. The effect, however, is small. Squaring the correlation
coefficient yields an effect size of .045. This indicates that only 4.5% of the variance on the two
variables is in common.
A partial correlation analysis was conducted, controlling for college, gender, years of
experience teaching online, and age. The analysis excluded any cases in which one or more of
the variables were missing, resulting in an N of 429. The resulting correlation was very similar
(r = .210, p < .01) indicating a very small role of those variables on the rate of mean rate of
successful completion of online courses. A step-wise regression analysis was conducted to
confirm this result. All variables except faculty satisfaction were excluded from the analysis,

78
resulting in a regression equation for predicting mean rate of successful completion of online
courses of
Predicted avg. rate of successful completion =
( 8.183 * Faculty Satisfaction) + 50.671 (1)
The results support the hypothesis. The corresponding null hypothesis, that no significant
correlation exists between the independent and dependent variables, can be rejected. Mean rate
of successful completion is related to faculty satisfaction.
Research Question 4
The final research question provided a means to analyze the relationship between the
mean rate of successful completion of online courses of surveyed faculty and the subscales that
comprise the overall faculty satisfaction index. While a positive, but small correlation was found
between overall faculty satisfaction, it is informative to determine the extent to which each of the
subscales (student-to-student interaction, student-to-instructor interaction, design-develop-teach,
institutional support, attitudes, and affordances) contribute to that correlation. Table 16 shows
the correlations between mean rate of student success and each of the six subscales. Again, in
order to control for familywise error, the more conservative Bonferroni significance calculation
of .0083 is used. Only one subscale, institutional support, did not present a highly significant
correlation. These findings mostly support the second hypothesis for the study. That is, a
significant correlation exists between five of the six subscales of the satisfaction survey and the
mean rates of successful completion of those faculty members’ online students.

79
Table 16.
Correlation between Mean Rate of Student Success and Faculty Satisfaction Subscales
SS1 SS2 SS3 SS4 SS5 SS6
Pearson Correlation .304 .201 .159 -.089 .193 .163
Sig. (2-tailed) .000 .000 .001 .053 .000 .000
n 471 471 471 471 471 471
Note. (1 = student-to-student interaction, 2 = student-to-teacher interaction, 3 = design, develop,
teach, 4 = institutional support, 5 = attitude, 6 = affordances)
The largest, significant effect (r
2 = .09) was found between mean rate of student success
and student-to-student interaction.
A step-wise regression analysis, conducted to determine the extent to which scores on the
subscales could predict mean rate of successful course completion, yielded three models that had
significant results. The prediction equation that yielded the highest effect included subscales 1
(student-to-student interaction), 4 (institutional support), and 6 (affordances) (r = .356, r2
= .127):
Predicted mean rate of successful completion =
(SS1 * 7.013) + (SS4 *-4.439) + (SS6 * 3.33) + 61.349 (2)
The three variables above account for 12.7% of the variation in rate of successful
completion.
Chapter Summary
Results of a survey administered to faculty teaching online at Weber State University
during the Fall 2010 and/or Spring 2011 semesters were presented in this chapter. Using
descriptive statistics the survey results were analyzed in support of this study’s first research
question, what is the overall satisfaction of online faculty at Weber State University? As well,
the survey data were analyzed based upon demographic information provided by the survey
participants. Mean rates of overall satisfaction were calculated along with the mean rates of each

80
of the sub-categories that define faculty satisfaction for this study; student-to-student interaction,
student-to-teacher interaction, design-develop-teach factors, institutional support, attitude, and
affordances. Further analysis was conducted on the overall satisfaction and each sub-category
mean rate of satisfaction by demographic grouping; home college of the faculty, gender, age, and
years of online teaching experience. The survey was designed on a 5-point Likert scale with 5
indicating high satisfaction and 1 indicating low satisfaction. The overall level of satisfaction
with the online learning environment at Weber State University is 3.74; a moderately high level.
Sub-category mean rates ranged from a low of 3.23 (student-to-student interaction) to a high of
4.21 (affordances).
Institutional data were gathered in support of the second research question of the study,
what is the mean rate of successful completion of online courses at Weber State University?
Descriptive statistics were used to answer this question for both the online courses of the faculty
survey participants as well as for all online courses taught during the two semesters of study.
While many courses have a 100% rate of successful completion, defined as a grade of ‘C-’ or
better, there exists a wide range of successful completion rates of online courses at the
institution. Completion rates of participating faculty were further analyzed by demographic
information; college, gender, age, and years of online teaching experience, in order to provide a
better understanding of where differences occur. Differences were significant when analyzed by
college and by age, but not significant for years of online teaching experience or gender.
Data supporting the first two research questions were combined into a single data set in
support of the third research question, what is the nature of the relationship between faculty
satisfaction with the online learning environment and mean rate of success of those instructors’
online students? The resulting correlation analysis indicated a small, but significant correlation

81
between these two variables with a correlation coefficient of .21, considered to be between a
small and a moderate relationship in social sciences (Ary et al., 2006).
The same data set was used to address the final research question, what is the nature of
the relationship between the sub-categories of faculty satisfaction? Five of the six sub-categories
proved to have highly significant, positive correlation coefficients, albeit small. The correlation
coefficients ranged from a high of .304, indicating an effect size of 9% for student-to-student
interaction to a low of .159, indicating an effect size of 2.5% for design-develop-teach issues.
Only institutional support proved to not have a significant correlation with the mean rate of
successful completion of online courses.
Finally, a regression analysis was completed in hopes of developing a predictive model
for online student success based upon faculty satisfaction. An analysis was also done controlling
for the demographic variables gender, age, home college, and experience, none of which proved
to be relevant to the equation.
In chapter 5 these findings will be discussed and implications considered.

82
Chapter 5 - Discussion and Recommendations
Study Limitations
A recap of the limitations of this study is useful prior to discussion of the study results
and subsequent recommendations. Limitations place the findings in context and prevent invalid
generalizations beyond that context.
Care was taken to ensure validity of the survey; it was pilot-tested and reviewed by an
expert panel. This measure of internal validity contributes positively to external validity.
The survey that provided base data for this study was conducted at a single university, however.
As well, a convenience sample of current online instructors was asked to participate. Both of
these facts raise concerns of external validity and may reduce the extent to which the findings are
generalizable to other universities.
Setting
This two-phased study sought to determine the level of faculty satisfaction with the
online learning environment at a large, public institution of higher education in northern Utah,
Weber State University (WSU), and to then examine the nature of the relationship between
faculty satisfaction and the mean rate of successful online course completion of students of those
faculties. Major conclusions derived from the survey, as well as implications and
recommendations are provided in this final chapter.
There are some practices and traditions around online teaching and learning at Weber
State University that may have influenced the results of this study. By articulating those practices
and traditions, readers of this study have additional context from which to interpret the findings
and recommendations.

83
Online courses are most often taught in an overload capacity. That is, faculty are
contracted to teach a (generally) 12 credit hour load each semester and any online courses are
taught on top of the contracted load. A few colleges, specifically the College of Applied Sciences
and the College of Health Professions, allow faculty to teach online courses as part of their
contracted load. The decision, whether online courses may be taught in load or not, belongs to
the dean of each college.
Some of the programs that offer online courses come under outside accreditation
standards. These standards often have implications for the online courses and for the faculty who
teach them. For example, NCLEX standards for Nursing require the instructor to include
interaction, between students and between students and the instructor, in all online courses.
Those same standards also require that faculty participate in ongoing professional development
in support of online teaching (K. Sitzman, personal communication, March 8, 2012).
Finally, while some instructors approach their online course design with an eye to student
collaboration others prefer a course design that encourages independent work by students. This is
often a teaching strategy that is also seen in the face-to-face classes of those same instructors.
Research Question 1 Discussion
The first research question for this study asks about the level of satisfaction with the
online learning environment. With an overall score of 3.74 out of 5.00, it appears that the online
faculty is generally satisfied with the online learning environment at WSU. The overall
satisfaction score is comprised of six subscales; student-to-student interaction, student-to-
instructor interaction, issues of course design, development, and teaching, institutional support,
attitude, and affordances. Issues of student-to-student interaction reduce overall satisfaction the
most (M = 3.23) while issues of affordance increase overall satisfaction the most (M = 4.21).

84
Standing alone, the results of the survey at an aggregate level are not all that interesting.
Either longitudinal studies at this institution or a comparative study between institutions would
yield contextual information that would make the current findings more relevant. However, when
the results of the survey are analyzed by participant demographics and by the subscales of the
survey, the findings are quite interesting and significant differences surface. Because of the need
to control for familywise error, as explained in chapter 3, and the need to compensate for that
error with the use of a more stringent significance cut off (.0083 instead of the traditional .05),
we can be very confident that the differences that became evident were not random.
Highly significant results, those that meet the .0083 criteria, were found in both the
student-to-student interaction subscale and the student-to-teacher subscale. The student-to-
student interaction subscale gives a picture of the extent to which instructors design interaction
between students into a course. Higher scores indicate active use of student interaction such as
collaboration, resource sharing, and the general development of a community of learners. Lower
scores indicate courses where students work more independently. The College of Health
Professions showed the highest score for this category (M = 3.56) while the library (M = 2.88)
and the School of Business and Economics (M = 2.91) showed the lowest scores. These results
raise several questions. Are these differences due to the nature of the fields in each college? That
is, are the health professions more collaborative than a library or business profession? Or are the
results due to differences in professional development? Are faculty members in the health
professions more aware of the potential for student-to-student interaction and therefore more
deliberate about incorporating those opportunities into their courses?
The student-to-instructor subscale focuses on the quality, type, and opportunity for
interaction between students and instructor in the online environment. Higher scores are

85
indicative of the use of multiple communication tools as well as high quality and satisfying
interactions. Lower scores are indicative of minimal tool use and low quality interactions
between students and instructor. This subscale again shows the College of Health Professions (M
= 4.23) significantly outscoring other colleges. At the other extreme is the College of Social
Sciences (M = 3.71). The question to be asked, again, is what lies behind this difference? As
indicated previously, most College of Health Professions online students have been through a
rigorous vetting process. Those students are expected to maintain a minimum GPA throughout
their program. Does that standard contribute to a richer, more robust communication between
student and instructor? Or is this again a question of professional development? Are the College
of Health Profession faculty members simply more cognizant of the value of rich interaction and
deliberately build that interaction into their online courses?
Interesting differences, though not highly significant, were found within the
design/develop/teach subscale as well as the attitude subscale. The design/develop/teach
subscale, which focuses on course management, quality, and time invested, yielded the highest
score from the College of Education and lowest scores from the Library and College of Social
Sciences. Attitudes toward the online learning environment were highest among the College of
Health Profession faculty and lowest among the College of Social Science faculty. Further study,
perhaps of a qualitative nature would be helpful to better understand the dynamics and
environment that contribute to these differences.
When survey results were analyzed by age group of the faculty, highly significant results
were found at both the overall satisfaction level and the design/develop/teach subscale. Post-hoc
analyses indicated a highly significant difference between the 30 – 39 year age group and the 50
– 59 year age group in overall satisfaction, and between the 30 – 39 year age group and both the
86
50 – 59 and 60+ age groups on the design/develop/teach subscale. Actually, the 30 – 39 year age
group displayed the lowest mean scores in every category; the overall satisfaction scale and each
of the six subscales.
This finding bears further exploration. It is fairly easy to speculate about these results.
The 30 – 39 year age group is most likely to contain a high percentage of tenure-track faculty
than either older or younger age groups. Tenure-track faculty are often more heavily involved in
service to the University than their post-tenure or non-tenure colleagues, and often have
conflicting demands on their time (Ward & Wolf-Wendel, 2004). This group of faculty is likely
newer to the university and involved in more course preparation while simultaneously pursuing
research endeavors. Time demands on this group of faculty are considerable and this possibly
manifests as lower satisfaction with the online learning environment, which is itself a time-
intensive pursuit. Not surprisingly, the survey question about the time required to develop an
online course yielded by far the most negative response of any item on the survey (1.58 on a 5
point scale).
Focus groups or one-on-one interviews with faculty in the 30 – 39 year age group would
help to confirm this speculation as well as assist in determining what institutional resources
could best help these individuals. For example, are individual instructors in this age group able to
take advantage of instructional designers available for supporting course development? An
interesting, though not highly significant difference was detected between the 30 – 39 year age
group and the 40 – 49 year age group on the institutional support subscale. The 30 – 39 year age
group scored, on average, lower than all other age groups. This compels the question, is the 30 –
39 year age group of faculty taking advantage of institutional resources? If not, why not? Are
new means of support needed, such as providing this group access to graders in support of their

87
online teaching efforts? Determining the kinds of support needed by this age group, in particular,
would be a fruitful focus.
When overall faculty satisfaction scores were analyzed by faculty experience, that is,
years of online teaching experience, significant differences were detected at a p level of .035. As
a reminder, difference in the overall score is considered significant at p < .05, because the overall
score is not subject to familywise error. The least experienced group, those who had taught
online one year or less, reported the highest satisfaction level. It would be interesting to follow
this group over time to determine if their satisfaction scores decline once they gain enough years
of experience to place them in the next category, those with one and one half to three years of
experience. This second group reported the lowest overall satisfaction. One wonders if a pattern
is evident here; initial enthusiasm followed by disenchantment which slowly rebounds with
additional experience. If this pattern appears ongoing it would be helpful to either pull first year
online faculty together as a cohort for professional development and peer support or develop a
mentoring system that matches new online faculty with experienced online faculty. Structured
mentoring programs for faculty new to online teaching have proven effective (Marek, 2009;
Runyon, 2010).
Data were gathered and analyzed in support of research question one; what is the general
level of faculty satisfaction with online teaching at Weber State University. The results are
encouraging; the institution appears to have faculty generally satisfied with the online learning
environment. Findings that warrant further investigation include the significantly different levels
of satisfaction between colleges, the overall lower satisfaction of faculty in the 30 – 39 year age
group, and the dip in satisfaction between faculty in their first year of online teaching and those

88
in the second year. These findings would be even more compelling if replicated either
longitudinally or at a similar institution.
Research Question 2 Discussion
The second research question focused on determining the rate of successful completion of
online students of the faculty participating in the survey. Successful completion was defined for
this study as the percent of students who complete an online course with a grade of ‘C-’ or
higher, or a grade of ‘credit’ in a credit/no-credit option.
Results of the analysis of successful completion by college were eye-opening. The
College of Health Professions produced higher success rates than every other college by a
considerable amount. That college’s success rate of 91.22% was followed by the College of
Applied Sciences success rate of 82.83 %. At the other extreme, the College of Science’s overall
success rate for the semesters of study was 69.64%. The other colleges fell between these
extremes.
A possible contributor to the disparity is the fact that most College of Health Profession
online courses are taken by students who have gone through an admissions vetting. Students
cannot take major classes in Health Professions, online or face-to-face, unless they have been
admitted to one of the college’s majors. Admitted students generally have grade point averages
at or above 3.0 (Y. Simonian, personal communication, January 9, 2012). The only other college
that has a similar admission requirement is the School of Business. That college, however, offers
numerous online courses that can be taken by students not yet admitted to the major.
Clearly there are many factors that impact student success. While it seems an obvious
conclusion that better students are more successful in their online courses, it might be wise for
the institution to consider some sort of GPA minimum, or some other sort of vetting criteria, as a

89
pre-requisite for enrolling in online courses. The Colleges of Science and Social Science, in
particular, might see higher rates of successful online course completion if course access was
limited to students who have previously demonstrated a pattern of success, as evidenced by a
minimum GPA.
Consideration should also be given to the role of faculty preparation in the disparity
between student outcomes in the various colleges. It would be useful to determine if one
college’s faculty have participated in more professional development for online teaching than the
other colleges. Because of demands of accreditation, for example, most College of Health
Professions faculty are required to receive advanced training in online pedagogies before they
are allowed to teach in the online environment (K. Sitzman, personal communication, January
19, 2011). Might this additional training by faculty contribute positively to student success?
A significant difference in successful completion was found when analyzed by the age of
the faculty. In direct contrast to the satisfaction scores, which indicated that the younger, 20 – 29
year age faculty had the highest satisfaction while the 30 – 39 year age faculty had the lowest,
successful completion was lowest in the 20 – 29 year age group and highest in the 30 – 39 year
age group. A closer look at the courses taught by these two groups is clarifying. The younger
group taught developmental math courses exclusively while the 30 – 39 year age group taught
courses across the University. Is the low rate of success of the younger group due to their ages or
some other factor related to developmental math courses? Again, replicating the study either
longitudinally or at other, similar institutions would help answer this question.
Research Question 3 Discussion
Combining faculty satisfaction ratings with course completion data provided the basis for
a correlation analysis. The third research question sought to better understand the relationship

90
between overall faculty satisfaction with the online learning environment and the rates of success
of their online students. As shown in the previous chapter, a small but significant, positive
correlation exists between these two variables. This confirms findings of previous studies
(Bolliger & Wasilik, 2009; Hartman et al., 2000). Student success is related to faculty
satisfaction with online learning at Weber State University. As such, ongoing investment in
faculty satisfaction through ongoing attention to the development of appropriate policy, through
the provisioning of professional development, and through the provisioning of adequate
information technology is warranted.
By far, of all the instructor variables considered in this study; age, gender, experience,
and satisfaction; the instructor’s satisfaction with the online learning environment has the most
impact on student success in an online course. Again, the impact is small, but in a competitive,
academic environment students would be well-suited to find an online instructor who loves
online teaching!
Research Question 4 Discussion
Finally, the fourth research question considered the relationship between each of the
subscales of faculty satisfaction and student success. While most of the subscales, the only
exception being the institutional support subscale, showed statistically significant correlation
with student success, the student-to-student interaction subscale showed the largest correlation.
What is so interesting about this finding is that even though this subscale showed the
highest correlation with student success, of all the subscales, this subscale had the lowest overall
mean in the faculty survey. The components of online teaching that the subscale addresses, ideas
such as student collaboration and resource sharing, student passivity and enthusiasm, and the
general feeling of community, are likely under-utilized or under-supported by the online

91
instructors at WSU. This finding points clearly to the need for additional professional
development sessions that focus on supporting faculty in the development of student-to-student
interactive activities and in the development of community within the online course.
It would also be useful to develop a better understanding of faculty perception of student-
to-student interaction in the online course. For example, are some instructors fearful that by
encouraging collaboration and resource sharing in an online course they may also be
encouraging cheating? This information would be best gathered through one-on-one faculty
interviews. Information gathered through the interviews could be used in developing professional
development activities. It may not be enough to simply direct instructors in ways to develop and
integrate student-to-student interaction and community; misperceptions about the use of these
activities must be addressed as well as acknowledgement that cheating can occur. The
professional development activities could provide support for faculty interested in mitigating and
avoiding circumstances of cheating in the online class.
The student-to-instructor interaction subscale showed the second largest correlation with
student success. Together these two findings support the idea that “. . . courses must be
structured to encourage interaction and collaboration [to promote learning effectiveness]”
(Bourne & Moore, 2000). This finding is also supported by Vygotsky’s theory of social
development which points to the need for social interaction in cognitive development (Wertsch,
1985).

92
Conclusion
Like much research this study introduces at least as many questions as it answers. The
findings of this study point to the need for additional research. The replication of this study at
Weber State University would allow for a longitudinal analysis that would contribute to both
instrument reliability and validity of the findings. Administration of the survey instrument at
other institutions of higher education would contribute to the external validity of this study.
Finally, a qualitative approach to this study, through the use of faculty focus groups and one-on-
one interviews with online faculty would help to better understand differences detected in this
study. In particular, the differences in overall satisfaction, as well as at the subscale level,
detected between age groups of the faculty should be studied along with the vastly differing rates
of successful completion of students in online courses of the various colleges.
Ongoing professional development that focuses on the online learning environment will
continue to be important to the successful delivery of online courses and programs. This study
provides suggestions for that professional development. It is also important that institutional
administrators keep an eye on policy that impacts the online learning environment so that the
policy keeps pace with the ever-changing environment of online learning and is seen as relevant
and supportive of the faculty who teach online.
As online learning continues to gain legitimacy and foothold in institutions of higher
education, understanding what contributes to faculty satisfaction with the online learning
environment which, as determined by this study, in turn contributes to student success in the
online learning environment, is important. While it is reasonable to think that similar findings
would be found in a study of the traditional, face-to-face learning environment the surge in
online course enrollments during the last decade and the expected continued growth (Allen &

93
Seaman, 2011) suggests efforts focused specifically on online learning will be fruitful. Frank
Mayadas, occasionally referred to as the ‘Father of Online Learning’ (Parry, 2009) places faculty
satisfaction at the cross hairs of online program sustainability (Bourne & Moore, 2000). Indeed,
given the ever-growing strategic importance of online learning to the higher education institution
(Allen & Seaman, 2011), faculty satisfaction with the online learning environment must be
nurtured.
Recommendations for future research
Suggestions to replicate this study either longitudinally at Weber State University or at
other, similar institutions have been made. Other research opportunities that look at the same
type of study in different academic environments may also be derived.
Online courses are becoming increasingly evident and strategic at the community college
level. Community colleges are seeing online growth rates that exceed those of 4 year institutions
(Allen & Seaman, 2010). Replicating this study at a community college may be a fruitful effort
by providing both strategic and professional development direction. As well, a replication of this
study at an institution in which online courses are more prevalent at the graduate level than was
the case at Weber State University would be interesting. Are there significant differences in
either satisfaction or outcomes between the graduate and undergraduate faculty and students?
Yet another option is to consider the differences in satisfaction and outcomes between programs
that are defined as professional – health care, engineering, or law, for example – and those that
are not professional.
A study that looks at the integration of student-to-student interactive activities in online
courses and the impact of that integration on student outcomes could prove beneficial. It may be
possible to design a course so that half of the students are presented with student-to-student
94
interaction, collaboration, and resource-sharing opportunities while the other half of students are
required to complete the course in a more independent fashion. Random assignment to one group
or the other would address concerns of research design that are so often present in comparisons
between online and face-to-face courses.
Finally, the survey instrument that was used for this study was derived from an extensive
review of literature from the field of online teaching and learning. A study that made use of
qualitative interviews with faculty involved in the online learning environment in which faculty
were asked about their perspectives on satisfaction with this environment could fill in gaps left
by the literature review. The question that could be answered is whether there exist parameters of
faculty satisfaction that are not yet evident in the research.

95
References
Abel, R. (2005). Implementing best practices in online learning. Educause Quarterly, 28(3), 75-
77.
Allen, I., & Seaman, J. (2010). Learning on demand: Online education in the United States,
2009. Retrieved from
http://sloanconsortium.org/publications/survey/learning_on_demand_sr2010
Allen, I. & Seaman, J. (2011). Going the distance. Online education in the United States, 2011.
Retrieved from http://sloanconsortium.org/publications/survey/going_distance_2011
Ambrose, S., Huston, T., & Norman, M. (2005). A qualitative method for assessing faculty
satisfaction. Research in Higher Education, 46(7), 803–830.
American Distance Education Consortium (ADEC). (n.d.). Quality framework for online
education. Lincoln, NE: Author. Retrieved from
http://www.adec.edu/earmyu/SLOANC~41.html
Anderson, D. M., & Haddad, C. J. (2005). Gender, voices, and learning in online course
environments. Journal of Asynchronous Learning Networks, 9(1), 3-14. Retrieved from
http://sloanconsortium.org/system/files/v9n1_anderson.pdf
Anderson, T. (2003). Getting the mix right again: An updated and theoretical rationale for
interaction. International Review of Research in Open and Distance Learning 4(2).
Retrieved from http://www.irrodl.org/index.php/irrodl/article/view/149/230

96
Anderson, T., & Garrison, D. (1998). Learning in a networked world: New roles and
responsibilities. In C. Gibson (Ed.), Distance learners in higher education (pp. 97-112).
Madison, WI: Atwood Publishing.
Arvan, L., & Musumeci, D. (2000). Instructor attitudes within the SCALE Efficiency Projects.
Journal of Asynchronous Learning Networks, 4(3), 180-195. Retrieved from
http://sloanconsortium.org/jaln/v4n3/instructor-attitudes-within-scale-efficiency-projects
Ary, D., Jacobs, L., Razavieh, A., & Sorenson, C. (2006). Introduction to research in education
(7th ed.). Belmont, CA: Thomson Wadsworth.
Baumgartner, L. (2001). An update on transformational learning. New Directions for Adult &
Continuing Education, 89 (Spring 2001), 15-24.
Betts, K. S. (1998). An institutional overview: Factors influencing faculty participation in
Distance education in postsecondary education in the United States: An institutional
study. Online Journal of Distance Learning Administration, 1(3). Retrieved from
http://www.westga.edu/~distance/Betts13.html
Bittner, W., & Mallory, H. (1933). University teaching by mail: A survey of correspondence
instruction conducted by American universities. New York: Macmillan.
Bollger, D. U., Inan, F. A., & Wasilik, O. (in preparation). Development and validation of the
online instructor satisfaction measure.
Bolliger, D. U., & Wasilik, O. (2009). Factors influencing faculty satisfaction with online
teaching and learning in higher education. Distance Education, 30(1), 103-116.
doi:10.1080/01587910902845949

97
Bower, B. L. (2001). Distance education: Facing the faculty challenge. Online Journal of
Distance Learning Administration, 4(2). Retrieved from
http://www.westga.edu/~distance/ojdla/summer42/bower42.html
Brown, S., & Kulikowich, J. (2004). Teaching statistics from a distance: What have we learned?
International Journal of Instructional Media, 31(1), 19-35.
Casey, C. (2008). A journey to legitimacy: The historical development of distance education
through technology. TechTrends, 52(2), 45-51. doi:10.1007/s11528-008-0135-z
Caywood, K., & Duckett, J. (2003). Online vs. on-campus learning in teacher education. Teacher
Education and Special Education, 26(2), 98-105.
Clark, R. (1983). Reconsidering research on learning from media. Review of Educational
Research, 53(4), 445-459.
Clark, R. (1994). Media will never influence learning. Educational Technology Research and
Development, 42(2), 21-29.
Clay, M. (1999). Development of training and support programs for distance education
instructors. Online Journal of Distance Learning Administration, 2(3). Retrieved from
http://www.westga.edu/~distance/ojdla/fall23/clay23.pdf
Conceição, S. C. O. (2006). Faculty lived experiences in the online environment. Adult
Education Quarterly, 57(1), 26-45.
Cook, R., Ley, K., Crawford, C., & Warner, A. (2009). Motivators and inhibitors for university
faculty in distance and e-learning. British Journal of Educational Technology, 40(1), 149-
163. doi:10.1111/j.1467-8535.2008.00845.x
Dabbagh, N. (2003). Scaffolding: An important teacher competency in online learning.
TechTrends 47(2), 39-44.

98
Dell, C., Low, C., & Wilker, J. (2010). Comparing student achievement in online and face-to-
face class formats. Journal of Online Learning and Teaching, 6(1), 30-42.
DiBiase, D. (2000). Is distance teaching more work or less work? The American Journal of
Distance Education, 14(3), 6-20. doi:10.1080/08923640009527061
Ferguson, J., & DeFelice, A. (2010). Length of online course and student satisfaction, perceived
learning, and academic performance. International Review of Research in Open and
Distance Learning, 11(2), 73-84.
Fredericksen, E., Pickett, A., Shea, P., Pelz, W., & Swan, K. (2000). Factors influencing faculty
satisfaction with asynchronous teaching and learning in the SUNY learning network.
Journal of Asynchronous Learning Networks, 4(3), 245-278. Retrieved from
http://www.sloan-c.org/publications/jaln/v4n3/v4n3_fredericksen.asp
Garrison, R. (2000). Theoretical challenges for distance education in the 21st century: A shift
from structural to transactional issues. International Review of Research in Open and
Distance Learning, 1(1), 1-17.
Giannoni, D., & Tesone, D. (2003). What academic administrators should know to attract senior
level faculty members to online learning environments. Online Journal of Distance
Learning Administration, 6(1). Retrieved from
http://www.westga.edu/~distance/ojdla/spring61/giannoni61.html
Grow, G. (1994). In defense of the staged self-directed learning model. Adult Education
Quarterly 44(2), 155-179.
Gunawardena, C., & McIsaac, M. (1996). Distance Education. In D. Jonassen (Ed.), Handbook
of Research for Educational Communications and Technology (pp. 403-437). New York:
Simon and Shuster Macmillan.

99
Hartman, J., Dziuban, C., & Moskal, P. (2000). Faculty satisfaction in SLNs: A dependent or
independent variable. Journal of Asynchronous Learning Networks, 4(3), 155-179.
Hays, W. (1994). Statistics (5th ed.). Belmont, CA: Thomson Wadsworth.
Holmberg, B. (1983). Guided didactic conversations in distance education. In D. Sewart, D.
Keegan, and B. Holmberg (Eds), Distance education: International perspectives (pp.
114-122). London: Croom Helm.
Holmberg, B. (1986). Growth and structure of distance education. (3rd ed.). London: Croom
Helm.
Holmberg, B. (2005). The evolution, principles and practices of distance education. BIS-Verlag
der Carl von Ossietzky Universität Oldenburg.
Howell, S., Laws, R., & Lindsay, N. (2004). Reevaluating course completion in distance
education: Avoiding the comparison between apples and oranges. Quarterly Review of
Distance Education 5(4), 243-252.
Jackson, L., Jones, S., & Rodriguez, R. (2010). Faculty actions that result in student satisfaction
in online courses. Journal of Asynchronous Learning Networks, 14(4), 78-96.
Jennings, S., & Bayless, M. (2003). Online vs. traditional instruction: A comparison of student
success. The Delta P Epsilon Journal, 45(3), 183-190.
Keegan, D. (1986). The foundations of distance education (2nd ed.). London: Routledge.
Keegan, D. (1988). Problems in defining the field of distance education. The American Journal
of Distance Education, 2(2), 4-11.
Keegan, D. (1995). Distance education technology for the new millennium: Compressed video
teaching. ZIFF Papiere 101. (ERIC Document Reproduction Service No. ED389931).

100
Kerke, S. (1999). Self-directed learning myths and realities, no. 3. (ERIC Document
Reproduction Service No. ED435834). Retrieved from EBSCOHost ERIC database.
Larson, D., & Sung, C. (2009). Comparing student performance: Online versus blended versus
face-to-face. Journal of Asynchronous Learning Networks, 13(1), 31-42.
Lee, J. (2001). Instructional support for distance education and faculty motivation, commitment,
and satisfaction. British Journal of Educational Technology, 32(2), 153-160.
Lenz, B. (2010, June 9). Edutopia. Will the iPad and similar technology revolutionize learning?
[Web log post]. Retrieved from http://www.edutopia.org/blog/ipad-new-technology-
revolutionize-learning
MacKenzie, O., Christensen, E., & Rigby, P. (1968). Correspondence instruction in the United
States. New York: McGraw-Hill.
Maguire, L. (2009). The faculty perspective regarding their role in distance education policy
making. Online Journal of Distance Learning Administration, 12(1). Retrieved from
http://www.westga.edu/~distance/ojdla/spring121/maguire121.html
Marek, K. (2009). Learning to teach online; Creating a culture of support of faculty. Journal of
Education for Library & Information Science, 50(4), 275-292.
Meyer, K. (2002). Quality in distance learning. ASHE-ERIC Higher Education Reports 29(4), 1-
121.
Menchaca, M. P., & Bekele, T. A. (2008). Learner and instructor identified success factors in
distance education. Distance Education, 29(3), 231-252.
doi:10.1080/01587910802395771
Merriam, S. (2001a). Andragogy and self-directed learning: Pillars of adult learning theory. New
Directions for Adult & Continuing Education, 89 (Spring 2001), 3-13.

101
Merriam, S. (2001b). Something old, something new: Adult learning theory for the twenty-first
century. New Directions for Adult & Continuing Education, 89 (Spring 2001), 93-96.
Merriam, S., Caffarella, R., Baumgartner, L. (2007). Learning in adulthood: A comprehensive
guide. (3rd ed.). San Francisco: John Wiley & Sons.
Mezirow, J. (1991). Transformative dimensions of adult learning. San Francisco: Jossey-Bass.
Milheim, W. (2001). Faculty and administrative strategies for the effective implementation of
distance education. British Journal of Educational Technology, 32(5), 535-542.
Moore, J. (2009). A synthesis of Sloan-C effective practices, December 2009. Journal of
Asynchronous Learning Networks, 13(4), 73-94.
Moore, M. (1989). Three types of interaction. The American Journal of Distance Education,
3(2), 1-6.
Moore, M., & Kearsley, G. (2005). Distance education: A systems view (2nd ed.). Oxford:
Pergamon Press.
Neuhauser, C. (2002). Learning style and effectiveness of online and face-to-face instruction.
The American Journal of Distance Education, 16(2), 99-113.
Nevins, J. (n.d.). The andragogic approach. Retrieved from
http://www.jnevins.com/andragogy.htm
Olejnik, S., Tianmin, L., Supattathum, S., & Huberty, C. (1997). Multiple testing and statistical
power with modified Bonferroni procedures. Journal of Educational and Behavioral
Statistics, 22(4), 389-406.
Ortiz-Rodriquez, M., Teig, R., Irani, T., Roberts, T. G., & Rhoades, E. (2005). College students’
perceptions of quality in distance learning. The Quarterly Review of Distance Education,
6(2), 97-105.
102
Osika, E. R., & Camin, D. (2002, August). Concentric model for evaluating Internet-based
distance learning programs. Paper presented at the 18th Annual Conference on Distance
Teaching and Learning, Madison, WI.
Palloff, R. M., & Pratt, K. (2001). Lessons from the cyberspace classroom: The realities of
online teaching. San Francisco: Jossey-Bass.
Parry, M. (2009). Online education, growing fast, eyes the truly ‘big time’. Chronicle of Higher
Education. Retrieved from http://chronicle.com/blogs/wiredcampus/online-education-
growing-fast-eyes-the-truly-big-time/8663
Parson-Pollard, N., Lacks, R., & Grant, P. (2008). A comparative assessment of student learning
outcomes in large online and traditional campus-based introduction to criminal justice
courses. Criminal Justice Studies, 21(3), 239-251.
Peters, O. (1988). Distance teaching and industrial production: A comparative interpretation in
outline. In D. Stewart, D. Keegan, & B. Holmberg (Eds.), Distance education:
International perspectives (pp. 95-113). New York: Routledge.
Rea, L., & Parker, R. (2005). Designing and conducting survey research: A comprehensive
guide. San Francisco, CA: Jossey-Bass.
Rockwell, S. K., Schauer, J., Fritz, S. M., & Marx, D. B. (1999). Incentives and obstacles
influencing higher education faculty and administrators to teach via distance. Online
Journal of Distance Learning Administration, 2(4). Retrieved from
http://www.westga.edu/∼distance/rockwell24.html
Rudestam, K., & Newton, R. (2007). Surviving your dissertation: A comprehensive guide to
content and process. Thousand Oaks, CA: Sage Publication, Inc.

103
Runyon, J. (2010). Faculty mentoring and student engagement are keys to success in virtual
classroom. Community College Week, Spring 2010 Technology Update, 6-7.
Russell, T. L. (1999). The no significant difference phenomenon: A comparative research
annotated bibliography on technology for distance education. Montgomery, AL:
International Distance Education Certification Center.
Sampson, P., Leonard, J., Ballenger, J., & Coleman, J. (2010). Student satisfaction of online
courses for educational leadership. Online Journal of Distance Learning Administration,
13(3). Retrieved from http://www.westga.edu/~distance/ojdla/fall133/sampson-
ballenger133.html
Schifter, C. (2000). Faculty participation in asynchronous learning networks: A case study of
motivating and inhibiting factors. Journal of Asynchronous Learning Networks, 4(1), 15-
22.
Schlosser, L., & Simonson, M. (2009). Distance education: Definitions and glossary of terms.
(3rd ed.). Greenwich, CT: Information Age Publishing.
Shachar, M., & Neumann, Y. (2010). Twenty years of research on the academic performance
differences between traditional and distance learning: Summative meta-analysis and trend
examination. Journal of Online Learning and Teaching, 6(2), 318-334.
Simmons, S., Jones, W., & Silver, S. (2004). Making the transition from face-to-face to
cyberspace. TechTrends, 48(5), 50-85.
Simonson, M. (1995). Does anyone really want to learn at a distance? Tech Trends 40(5), 12.
Simonson, M., Schlosser, C., & Hanson, D. (1999). Theory and distance education: A new
discussion. The American Journal of Distance Education 13(1), 60-75.

104
Simonson, M., Smaldino, S., Albright, M., & Zvacek, S. (2009). Teaching and learning at a
distance: Foundations of distance education (4th ed.). Boston: Allyn & Bacon.
Spector, J. M. (2008). Handbook of research on educational communications and technology.
New York: Lawrence Erlbaum Associates.
Summers, J., Waigandt, A., & Whittaker, T. (2005). A comparison of student achievement and
satisfaction in an online versus a traditional face-to-face statistics class. Innovative
Higher Education, 29(3), 233-250.
Swan, K. (2001). Virtual interaction: Design factors affecting student satisfaction and perceived
learning in asynchronous online courses. Distance Education, 22(2), 306-331.
Taylor, J. (1995). Distance education technologies: The fourth generation. Australian Journal of
Educational Technology, 11(2), 1-7.
Tabata, L., & Johnsrud, L. (2008). The impact of faculty attitudes toward technology, distance
education, and innovation. Research in Higher Education, 49(7), 625-646.
Tallent-Runnels, M., Thomas, J., Lan, W., Cooper, S., Ahern, T., Shaw, M., & Liu, X. (2006).
Teaching courses online: A review of the research. Review of Educational Research,
76(1), 93-105.
Ulmer, L., Watson, L., & Derby, D. (2007). Perceptions of higher education faculty members on
the value of distance education. The Quarterly Review of Distance Education, 8(1), 59-
70.
United States Department of Education, Office of Planning, Evaluation, and Policy
Development. (2009). Evaluation of evidence-based practices in online learning: A meta-
analysis and review of online learning studies. Retrieved from
http://www.ed.gov/about/offices/list/opepd/ppss/reports.html

105
Utah System of Higher Education. (2010). The higheredutah2020 master plan. Retrieved from
http://www.higheredutah2020.org/
Van Der Werf, M., & Sabatier, G. (2009). The college of 2020: Students. Chronicle Research
Services.
Visser, J. A. (2000). Faculty work in developing and teaching Web-based distance courses: A
case study of time and effort. The American Journal of Distance Education, 14(3), 21-32.
doi:10.1080/08923640009527062
Ward, K., & Wolf-Wendel, L. (2004) Academic motherhood: Managing complex roles in
research universities. The Review of Higher Education 27(2), 233-257.
Warren, L., & Holloman, H. (2005). On-line instruction: Are the outcomes the same? Journal of
Instructional Psychology, 32(2), 148-151.
Wasilik, O., & Bolliger, D. U. (2009). Faculty satisfaction in the online environment: An
institutional study. Internet and Higher Education, 12(3/4), 173-178.
doi:10.1016/j.iheduc.2009.05.001
Wedemeyer, C., & Najem, C. (1969). AIM: From concept to reality. The articulated
instructional media program at Wisconsin. Syracuse, NY: Center for the Study of Liberal
Education for Adults, Syracuse University.
Wedemeyer, C. (1981). Learning at the backdoor. Madison, WI: University of Wisconsin Press.
Wertsch, J. (1985). Cultural, communication, and cognition; Vygotskian perspectives.
Cambridge, MA: Cambridge University Press.
The White House, Office of the Press Secretary. (2009, February 24). Address by the president to
the joint sessions of congress. Retrieved from http://www.whitehouse.gov/the-press-
office/remarks-president-barack-obama-address-joint-session-congress

106
Wiley, D. (2002). The Disney debacle: Online instruction versus face-to-face instruction.
TechTrends, 46(2), 72, 55.

107
Appendix A.
Survey Instrument
1. I have received the description of this study in the cover letter, read the procedure described in
the cover letter, and retained a copy for my record.
I voluntarily agree to participate in the research study by Gail Niklason, Doris Bolliger and
Oksana Wasilik which aims to investigate faculty satisfaction and pedagogical beliefs. I
understand that as a participant I will complete an online questionnaire.
The data I provide will be kept under lock and key and will be destroyed at the end of 2012.
Participation is voluntarily, all information will be kept confidential, and only minimal risks are
involved in this study. I can direct any questions about the research study to Gail Niklason at
[email protected] (Ph. 801-626-6091 Doris Bolliger at [email protected] (Ph. 307-766-
2167) and Oksana Wasilik at [email protected]. If you have any questions about your rights as
a research subject, please contact the University of Wyoming IRB Administrator at 307-766-
5320.
Agreement:
I understand participation is voluntary and there are no penalties if I wish to withdraw at any
time. I may exit out of the browser window at any time.
I hereby give Gail Niklason, Doris Bolliger and Oksana Wasilik permission to report responses
to questionnaires anonymously in professional presentations, reports, and manuscripts. I give
consent to participate in the above study, and acknowledge that I have received a copy of this
form.
a. I agree
b. I do not agree (please select the ‘stop’ button at the left to end the survey)
2. My online students share resources with each other within the course.
a. strongly disagree
b. disagree
c. neutral
d. agree
e. strongly agree
(these same distracters are used through question 49)
3. My online students participate enthusiastically.
4. My online students are somewhat passive in their interactions.
5. My online students actively collaborate.
6. My students appear to be part of an online community in the course.

108
7. My students work well together online.
8. My interactions with online students are satisfying.
9. I like using various online communication tools to interact with my students.
10. My online students receive quality feedback.
11. My students contact me when they have questions.
12. I do not get to know my online students well.
13. I am accessible to students in online courses.
14. It takes a lot of time to develop an online course.
15. I am satisfied with how I assess students in online courses.
16. I am pleased with the quality of student work in online courses.
17. I am satisfied with students’ motivation in online courses.
18. I am satisfied with the content quality of my online courses.
19. I am satisfied with how I handle conflicts in my online courses.
20. At my institution, teachers are given sufficient time to design and develop online courses.
21. I have adequate technical support by my institution.
22. My needs for training to prepare for teaching online have been met.
23. My institution provides fair compensation or incentives for teaching online.
24. I am satisfied with online teaching policies that have been implemented by my institution.
25. My institution provides the necessary technology tools (equipment and software) for teaching
online.
26. I look forward to teaching online.
27. Technical problems do not discourage me from teaching online.
28. I enjoy learning about new technologies that can be used for online teaching.

109
29. I am enthusiastic about teaching online.
30. Online teaching is often frustrating.
31. I consider teaching online to be fulfilling.
32. Online courses provide a flexible learning environment.
33. I am satisfied with the convenience of the online learning environment.
34. Online teaching allows me to reach a more diverse student population.
35. I am satisfied that my students can access their online course from almost anywhere.
36. Online courses allow students to access a wide range of resources.
37. In online courses every student has an opportunity to contribute.
38. Teachers should give students choices in their learning.
39. Teachers should let students evaluate their own work.
40. The primary role of teachers is to facilitate student learning.
41. Students should take responsibility for their learning.
42. Effective learning is social.
43. Teachers should develop learning communities in online courses.
44. Textbooks are the best sources for building course content.
45. Teachers should decide what students need to learn.
46. Student learning should be assessed primarily with quizzes and tests.
47. Teachers should know everything about their content area.
48. The primary role of teachers is to deliver course content effectively.
49. Students should complete course activities individually.
50. Students read textbooks, articles, or lecture notes about course content.
a. Never
b. Rarely
c. Occasionally

110
d. Frequently
e. Extensively
(These distracters will be used through question 57.)
51. Students watch or listen to lectures in the form of video or audio.
52. Students complete self-paced tutorials or activities to review content.
53. Students create products, artifacts, or portfolios.
54. Students work on collaborative tasks or projects.
55. Students provide peer feedback and review.
56. Students reflect formally on their learning.
57. Students share their ideas, resources, or products with the class.
58. What department do you teach for? (if more than one, please list primary dept).
59. How many years have you taught online courses?
60. Which of the following professional development programs have you participated in (check
all that apply)?
a. Basic WebCT/Blackboard training
b. Master Online Teaching Certification program
c. non-WSU online-focused training or coursework.
d. other
61. What is your current position at the university?
a. Full-time faculty/professor/instructor
b. Part-time faculty/professor/instructor
c. Adjunct faculty/professor/instructor/tutor
62. What is your age?
63. What is your gender?
a. Male
b. Female

111
Appendix B.

112
Appendix C.
Email message to potential participants:
Dear Professor X,
We would like to administer a survey at Weber State University in order to investigate faculty
satisfaction and pedagogical beliefs. It should take approximately 15-20 minutes to complete the
survey. In order to express our gratitude for your time, you will be entered into a drawing for
one of four $25 gift certificates to the WSU bookstore. Your participation is voluntary and your
responses will be confidential. This study has been approved by the Institutional Review Boards
at the University of Wyoming and Weber State University. For your records, a copy of the cover
letter and informed consent form is attached to this e-mail.
Please click on the link to complete the electronic consent form and survey:
https://chitester.weber.edu/chi.cfm?testID=44036
If you have any questions about this research study, please contact Gail Niklason at Continuing
Education, Ph. (801) 626-6091 or [email protected] at Weber State University. You may
also contact Doris Bolliger at the Department of Professional Studies, Ph. (307) 766-2167 or
[email protected] or Oksana Wasilik at [email protected] at the University of Wyoming.
Thank you for your assistance!
Gail Niklason
Associate Dean, Continuing Education
Attachments: (1) Cover Letter and (2) Informed Consent Form

113
Appendix D.
Letter of Informed Consent
I have received the description of this study in the cover letter, read the procedure described in
the cover letter, and retained a copy for my record.
I voluntarily agree to participate in the research study by Gail Niklason, Doris Bolliger and
Oksana Wasilik which aims to investigate faculty satisfaction and pedagogical beliefs. My
participation includes the completion of a questionnaire which will take approximately 15-20
minutes. I understand that as a participant I will complete an online questionnaire, and that I will
be entered into a drawing for one of four $25 gift certificates to the WSU bookstore.
The data I provide will be kept under lock and key and will be destroyed at the end of 2012.
Faculty responses will be compared with de-identified student data. Participation is voluntarily,
all information will be kept confidential, and only minimal risks are involved in this study.
Minimal risk to the subjects is involved in the proposed research. Individuals may experience
discomfort or embarrassment by answering the survey questions but survey questions are not
invasive. I can direct any questions about the research study to Gail Niklason at
[email protected] (Ph. 801-626-6091 Doris Bolliger at [email protected] (Ph. 307-766-
2167) and Oksana Wasilik at [email protected]. If you have any questions about your rights as
a research subject, please contact the University of Wyoming IRB Administrator at 307-766-
5320.
Agreement:
I understand participation is voluntary and there are no penalties if I wish to withdraw at any
time. I may exit out of the browser window at any time.
I hereby give Gail Niklason, Doris Bolliger and Oksana Wasilik permission to report responses
to questionnaires anonymously in professional presentations, reports, and manuscripts. I give
consent to participate in the above study, and acknowledge that I have received a copy of this
form.
Electronic Signature [on Web-based Survey Version]:
___ I agree
___ I do not agree

114
Appendix E.
Cover Letter
March 26, 2011
Dear Online Instructor:
I am an associate dean at Weber State University (WSU) and am collaborating with two
colleagues Doris Bolliger and Oksana Wasilik at the University of Wyoming (UW) on a research
project. It is the purpose of this research to investigate faculty satisfaction with online teaching
and their pedagogical beliefs, and examine students’ successful completion rates of online
courses at WSU. Because you teach online, we would to invite you to complete an online
questionnaire that will take approximately 15-20 minutes of your time. In order to express our
gratitude for your time, you will be entered into a drawing for one of four $25 gift certificates to
the WSU bookstore.
Responses to the survey are voluntary but not anonymous. You will log into the survey site with
your username and password. All information with which you provide us is strictly confidential,
and you will not be named or identified. Only I will have access to identifying information. I
will remove identifying codes before sharing the data with my collaborators. The data will be
destroyed after we complete our data analyses at the end of 2012.
This research study does not involve any risks or discomforts to you. You give us the permission
to report your responses anonymously in reports and publications by agreeing to participate.
Please read the Informed Consent Form provided on the second page on the Web-based survey
and indicate whether or not you wish to participate in the study. Please be aware of the fact that
you have the right to withdraw your consent and discontinue participation in this project at any
time without penalty. Your withdrawal can be initiated by exiting out of the browser window at
any time.
We greatly appreciate your time and cooperation. If you require further information, please
contact us at [email protected] (801-626-6091), [email protected] (307-766-2167) or
[email protected]. Thank you for assisting us in the investigation of important factors that can
contribute to offering quality programs and courses online.
Sincerely,
Gail Niklason
Associate Dean, Continuing Education
Weber State University
Ogden, UT

115
Appendix F.

116
Appendix G.