faculty of health science department of psychology
TRANSCRIPT

Faculty of Health Science
Department of Psychology
IQ as a Predictor and Moderator of Children’s Mental Health Status
Børge Mathiassen A dissertation for the degree of Philosophiae Doctor – July 2014

Content
Acknowledgements 3 Abstract 4 List of papers 6
Paper I 6
Paper II 6
Paper III 6
Abbreviations 7 Introduction 8
Learning difficulties 8
Mental health disorders and learning difficulties 9
Assessment of the severity of children’s mental health status and symptom load 12
Outcome in mental health services 14
Aims of the dissertation 17 Methods 18
Participants 18
Measures 19
Procedure 21
Statistical analyses 24
Summary of results 27 Paper I 27
Paper II 30
Paper III 33
Discussion 35 Discussion of the main results 35
Reflections on methodological issues 44
Use of the HoNOSCA and CGAS as outcome measures in clinical practice 48
Clinical implications 51
Recommendations for future research 52
Conclusion 53
References 54
2

Acknowledgements
The papers in this dissertation are based on data that were collected in the Child and
Adolescent Mental Health Services North study (CAMHS North study). The CAMHS North
study is a multicentre study in the northern part of Norway. The main financial support for
this dissertation was from the Mental Health Research Program of the Northern Norway
Regional Health Authority. I want to thank all of the employees at the outpatient clinics and
the patients who participated in the data collection.
A special thanks goes to Siv Kvernmo, the project manager of the CAMHS North Study, who
gave me the opportunity to conduct research on the project.
Furthermore, I want to thank Knut Waterloo and Monica Martinussen, who have been my
supervisors. They have helped me with drafts, encouragement, and constructive feedback.
Bjørn Helge Handegård is a statistician with great knowledge of the mental health research
field. I am grateful for his statistical advice.
I would like to thank my friend, colleague, and co-author Per Håkan Brøndo for inspiring
cooperation and discussions. I am grateful that you took over the baton as head of the
Department of Child and Adolescent Mental Health. I am sure that the department has a head
who will lead the department in the challenging future in the best interest of children and
adolescents with mental health problems.
Finally, I wish to thank my wife, Silje, and our two children, Louise and Joakim, for their
support during the years that I worked with this project and for making my life complete.
3

Abstract
Mental health disorders among children and adolescents are a substantial public health
challenge. Access to reliable and valid assessment instruments is an essential part of the
effective and evidence-based practice of helping persons with such problems. The assessment
of mental health problems should be based on information from multiple sources (e.g.,
parents, patients, and teachers). The clinician’s evaluation of a patient’s symptom load and
general function is an important part of the assessment process. This dissertation examined
the intra-rater reliability of the Health of the National Outcome Scales for Children and
Adolescents (HoNOSCA) and the Children’s Global Assessment Scale (CGAS), which are
two clinician rating scales of patients’ symptom load and general function, respectively. The
current dissertation also examined IQ as a predictor and moderator of these scales.
In paper I, the agreement of the HoNOSCA and the CGAS clinician ratings was examined.
Information from a semi-structured web-based interview, the Development and Well-being
Assessment (DAWBA), with 100 youths who were referred to the Department of Child and
Adolescent Mental Health was obtained. From this information, four clinicians independently
rated the HoNOSCA and the CGAS. The single intra-class correlation was .80 for the
HoNOSCA and .76 for the CGAS, and the average intra-class correlation was .94 and 93,
respectively.
In paper II, 132 patients were assessed with the Strength and Difficulties Questionnaire
(SDQ), the HoNOSCA, the CGAS, and the Wechsler Intelligence Scale for Children, Third
Edition (WISC-II). Hierarchical regression analyses were conducted using the HoNOSCA
and CGAS as dependent variables. Demographics, WISC-III IQ scores, and the SDQ were
entered as independent variables. The model with the HoNOSCA as the dependent variable
predicted 25% of the total variance. The WISC-III FSIQ predicted an additional 6% of the
variance. The analyses with the CGAS as the dependent variable produced no significant
results.
In paper III, IQ as a moderator of outcome was examined. The same assessment instruments
that were used in paper II were employed in paper III. The patients were assessed with the
HoNOSCA and the CGAS at three different time points. A linear mixed model analysis was
used to examine whether the WISC-III Full Scale IQ (FSIQ), Performance IQ (PIQ), and
4

Verbal IQ (VIQ) moderated outcomes in general functioning (CGAS) and symptom load
(HoNOSCA). The moderator analysis revealed that the FSIQ × time interaction predicted
changes in the CGAS scores and that the PIQ × time interaction predicted changes in the
HoNOSCA scores. The slopes and intercepts of the HoNOSCA scores covaried negatively
and significantly. The same pattern was not detected for the CGAS scores.
5

List of papers
Paper I. Brøndo, P. H., Mathiassen, B., Martinussen, M., Heiervang, E., Eriksen, M., &
Kvernmo, S. (2012). Agreement on web-based diagnoses of mental health problems in
Norwegian child and adolescent mental health services, Clinical Practice & Epidemiology in
Mental Health, 8, 16-21. doi: 10.2174/1745017901208010016
Paper II. Mathiassen, B., Brøndbo, P. H., Waterloo, K., Martinussen. M., Eriksen, M.,
Hanssen-Bauer, K., & Kvernmo, S. (2012). IQ as a predictor of clinician rated mental health
problems in children and adolescents. British Journal of Clinical Psychology. 51, 185-195.
doi: 10.1111/j.2044-8260.2011.02023.x
Paper III. Mathiassen, B., Brøndbo, P.H., Waterloo, K., Martinussen. M., Eriksen, M.,
Hanssen-Bauer, K., & Kvernmo, S. (2011). IQ as a moderator of outcome in severity of
children’s mental health status after treatment in outpatient clinics, Child and Adolescent
Psychiatry and Mental Health, 6:22. doi: 10.1186/1753-2000-6-22
6
Abbreviations
ADHD = Attention deficit/hyperactivity disorder
AVS = Added Value Score
BCL = Behaviour Checklist
BCS = The Bergen Child Study of Mental Health
CAMHS = Child and Adolescent Mental Health Services
CAPA = Child and Adolescent Psychiatric Assessment
CGAS = Children’s Global Assessment Scale
CORC = Child Outcomes Research Consortium
CR = Cognitive reserve
DAWBA = The Development and Well-Being Assessment
DISC = Diagnostic Interview for Children
DSM-IV = Diagnostic and Statistical Manual of Mental Disorders, Fourth Edition
FSIQ = Full scale IQ
GBO = Goal-based outcomes
GHQ = General Health Questionnaire
HoNOSCA = Health of the National Outcome Scales for Children and Adolescents
ICC = Intra-class correlation
IQ = Intelligence quotient
k = kappa
MRI = Magnetic Resonance Imaging
MTA = Multimodal Treatment of Attention Deficit Hyperactivity Disorder Study
OECD = Organisation for Economic Co-operation and Development
PIQ = Performance IQ
RCI = Reliable change index
SDQ = Strength and Difficulties Questionnaire
SEdiff = Standard error of the difference
VIQ = Verbal IQ
WISC-III = The Wechsler Intelligence Scale for Children, Third Edition
7
Introduction
Children and adolescents with intellectual disabilities have an increased risk of mental health
disorders (Einfeld, Ellis, & Emerson, 2011). It is estimated that this group constitutes 40% of
all children with mental health disorders (Emerson, Einfeld, & Stancliffe, 2010). In most
studies on the effect of treatment, participants with low IQ are excluded. The consequence of
this practice is that knowledge of how to help a substantial proportion of children and
adolescents with mental health disorders is limited. The main research question in the current
dissertation is whether cognitive functioning, as measured using an IQ test, predicts the status
and moderates the outcome in the severity of children´s mental health status, as measured
using two measures of clinician-rated mental health problems in children and adolescents, the
Health of the National Outcome Scales for Children and Adolescents (HoNOSCA) and
Children’s Global Assessment Scale (CGAS). In addition, the inter-rater reliability of the
HoNOSCA and CGAS evaluation is examined.
Learning difficulties
In the research literature, the terms learning disability, learning disorder, generalised learning
disorder, mental retardation (Einfeld et al., 2011), and low IQ (IQ < 85) (Emerson et al.,
2010) are often used interchangeably. In the current dissertation, “learning difficulties” is
used as a common concept for these categories. For all types of learning difficulties, it is
common to attempt to identify the difficulties in acquiring skills that require some type of
cognitive capacity. The assessment of learning difficulties is typically performed using
psychometric tests. In the assessment of learning disorders, the use of the standardised IQ test
is mandatory (WHO, 1993). Additionally, tests of specific skills, adaptive behaviour, and
neuropsychological functioning are commonly employed (Rutter et al., 2011).
IQ is a robust predictor of a wide range of skills and outcomes. For example, IQ predicts the
following aspects of human functioning: school performance, years of education, income, and
8

job performance (Neisser et al., 1996). IQ tests and tests of specific cognitive abilities are
constructed from items that are sorted into factors and indexes. Although tests of cognitive
ability are based on different items and are constructed to assess distinctive cognitive
processes, they intercorrelate at .30, on average (Carrol, 1993). The average correlation
between different IQ tests is approximately .77 (Jensen, 1998). Charles Spearman was the
first to show that the co-variance of different scores can be mathematically predicted by a
general factor (g-factor) (Neisser et al., 1996). The g-factor of cognitive tests can be extracted
using factor analysis, and the correlation between the hypothetical g-factor and psychometric
test results is called the g-factor loading (Jensen, 1998).
Numerous studies have examined individual variations in the g-factor. Neuroimaging studies
have identified brain pathways that are associated with individual differences in g (Deary,
Peke, & Johnson, 2011). Behavioural genetic studies have examined how much of the
variation in a trait can be attributed to genetic and environmental variance, and heritability has
been used to represent the effect size of the variance that is explained by genetic variance
(Plomin, DeFries, McClearn, & Rutter, 1997). The results of a meta-analysis indicated that
50% of the g-factor variance can be explained by individual genetic differences (Devlin,
Daniels, & Roeder, 1997). The heritability of the g-factor is not stable during the life span and
seems to increase linearly from 41% at nine years of age to 66% by the age of 17 (Haworth et
al., 2010).
Mental health disorders and learning difficulties
Mental health disorders are common in the general population and are responsible for 14% of
the global burden of disease (Prince et al., 2007). A study of lifetime prevalence showed that
approximately half of all Americans develop a mental health disorder in their lifetime
(Kessler et al., 2005), and half of these cases begin by the age of 14 years. In a review of the
epidemiology of child and adolescent mental health disorders, the mean prevalence was
estimated to be 12% (Costello, Egger, & Angold, 2005). The Bergen Child Study of Mental
Health (BCS) is the only Norwegian survey of mental health that employed a structured
multi-informant interview (Heiervang et al., 2007). In the BCS, the main screening instrument
was the Strength and Difficulties Questionnaire (SDQ) (Goodman, 2001), and diagnostic
assessments were based on the Development and Well-Being Assessment (DAWBA)
9

(Goodman, Ford, Richards, Gatward, & Meltzer, 2000). The prevalence of mental health
disorders among 8- to 10-year-olds in the BCS has been compared with that of same-aged
children in the British survey from 1999 and 2004, which used the same methodology as the
BCS. The prevalence of DSM-IV disorders was significantly higher in Britain (9%) than in
Norway (6%) (Heiervang, Goodman, & Goodman, 2008).
There is an increased prevalence of mental health disorders among persons with intellectual
disabilities. Einfield et al. (2011) reviewed studies that investigated the prevalence of mental
health disorders among children and adolescents with intellectual disabilities. Nine studies
met the inclusion criteria for the review. The definition of intellectual disability (ID) in the
studies varied. Some studies defined IQ scores under 70 or 80 without any impairment criteria
as an ID, whereas other studies used the child’s primary caregiver or teacher’s report of
learning difficulties or attendance at schools for special education to define ID. In four of the
reviewed studies, children with and without intellectual disabilities were compared (Dekker,
Koot, van der Ende, & Verhulst, 2002; Emerson & Hatton, 2007b; Linna et al., 1999; Rutter,
Tizard, & Whitmore, 1970). These studies reported prevalence rates for children and
adolescents with and without mental disorders in the range of 30% to 50% and 8% to 18%,
respectively. These results indicated that the relative risk of mental health disorders with
intellectual disability ranges from 2.8 to 4.5. In five of the nine studies that Einfield et al.
(2011) reviewed, the association between the severity of the intellectual disability and the risk
of mental health disorders was examined. Four of the studies found no significant correlation
between the severity of the intellectual disability and mental health disorders (Dekker et al.,
2002; Einfeld & Tonge, 1996a, 1996b; Molteno, Molteno, Finchilescu, & Dawes, 2001;
Stromme & Diseth, 2000). In the fifth study (Molteno et al., 2001), the proportions of
children with mental disorders with mild, moderate, severe, and profound intellectual
disability were 21%, 40%, 49%, and 49%, respectively. The results of the Norwegian BSC
study were not included in Einfeld et al.’s (2011) review. In the BSC study, children with
learning difficulties had an OR = 2.54 for DSM-IV mental health disorder (Heiervang et al.,
2007). The prevalence of mental disorders in the BSC study increased gradually from 5%
among children without any learning difficulties to 11%, 26%, 41%, and 66% among children
with learning difficulties with no impact, little impact, moderate impact, and severe impact,
respectively.
10

It is not fully known why children with intellectual disabilities have an increased risk of
mental disorders. Several reasons have been discussed (Emerson & Hatton, 2007b; Goodman,
Simonoff, & Stevenson, 1995). First, learning disorders may impair the children’s ability to
cope with challenging life events. Broad ranges of adverse life events are associated with
disruptive disorders and depressive disorders (Tiet et al., 2001). Among youths who are at a
high risk for adverse life events, the proportion with good adjustment increases gradually
from IQ 85 to IQ 115 (Tiet et al., 1998). In addition, evidence has indicated that low IQ
predicts mental health problems among children in general (Goodman et al., 1995).
Second, there may be a spurious relationship between learning disorders and the increased
risk of mental disorders that is explained by living conditions and socio-economic position.
Studies in Australia, Britain, and the US have found that children who live at a socio-
economic disadvantage have an increased risk of learning disorders (Emerson, 2007). In a
British study, learning disorders were a significant risk factor for conduct disorder (OR = 7.7)
and emotional disorders (OR = 2.0) (Emerson & Hatton, 2007a). Socio-economic position and
household composition explained 23% and 37% of the increased risk of conduct disorder and
emotional disorder, respectively.
Third, studies on behavioural phenotypes (i.e., research that links genes, brain, and behaviour)
have indicated that some syndromes that are associated with learning disorders are vulnerable
to mental disorders (Dykens, 2000). For example, the majority of persons with fragile X,
which is the most common known cause of developmental delay, have symptoms of social
anxiety and autism spectrum disorders.
The cognitive reserve model
In addition to a high risk of adverse life events, socio-economic disadvantage, and
behavioural phenotypes, the cognitive reserve model has been proposed as an explanation for
the relationship between learning disabilities and mental disorders (Barnett, Salomond, Jones,
& Sahakian, 2006). The construct of “cognitive reserve” (CR) has been used to explain the
disjunction between the severity of neurological disease or damage and clinical outcomes
(Stern, 2009). CR is a protective factor and a proxy measure of the brain’s available reserve
capacity to cope with brain damage. Education, occupational attainment, and IQ are examples
of such proxy measures. Investigations of the validity of the cognitive reserve model for
persons with mental health disorders have been limited. Most of the studies that have used IQ
11

as a measure of CR have been conducted with adults. The Dunedin birth cohort study showed
that low IQ in childhood (IQ ≤ 85) increased the risk of developing psychiatric problems at 32
years of age (Koenen et al., 2009). In addition, low IQ predicted comorbidity and the
persistence of psychiatric disease. In a second study on this cohort, low IQ at age five
predicted post-traumatic stress disorder (PTSD) at age 26 among persons who were exposed
to traumatic events (Koenen, Moffit, Poulton, Martin, & Caspi, 2007). Several studies of
military personnel have found similar results (Gale et al., 2008; Macklin et al., 1998). In a
cohort study of Swedish conscripts (N = 50053), low IQ at enrolment (18 to 20 years)
increased the risk of schizophrenia, severe depression, and other non-affective psychoses
during a 27-year follow-up period (Zammit et al., 2004).
Intervention studies commonly use low IQ as an exclusion criterion. For example, in the
Multimodal Treatment of Attention Deficit Hyperactivity Disorder study (MTA Cooperative
Group, 1999), the Treatment for Adolescents with Depression Study (The Treatment for
Adolescents with Depression Team, 2003), and the Child/Adolescent Anxiety Multimodal
Study (Compton et al., 2010), children with IQ < 80 were excluded. In a psychodynamic
psychotherapy study of children’s internalising disorders, the limit for exclusion was IQ < 90
(Muratori, Picchi, Bruni, Patarnello, & Romagnoli, 2003). The prevalence of mental health
disorders in children with IQ scores under 70-80 is in the range of 30% - 50% (Einfield et al.,
(2011). This result indicates that these children constitute a disproportionally high proportion
of all children with mental health disorders. Although developmental factors have been
acknowledged as factors that potentially affect outcomes (Holmbeck, Greenley, & Franks,
2003) and despite the finding that low IQ is a risk factor for mental health disorders, few
studies have investigated whether patients’ IQs moderate the outcome of treatment. Because
children and adolescents with low IQs have systematically been excluded from most outcome
studies, there is limited knowledge on whether they benefit from treatment at outpatient
clinics.
Assessment of the severity of children’s mental health status and symptom load
Both the assessment of mental health disorders and the evaluation of outcomes are dependent
on information from several information sources (American Psychiatric Association, 2000;
WHO, 1993). The Child and Adolescent Mental Health Services (CAMHS) questionnaires
are commonly used to gather information about the patients’ symptoms of mental health
12
disorders and level of impairment from the patients, their parents, and their teachers. In
England, New Zealand, Australia, and the Nordic countries, the Strength and Difficulties
Questionnaire (Goodman, 2001; Obel et al., 2004) is commonly used for this purpose. Two
widely used clinician-rated measures of impairment are the Children´s Global Assessment
Scale (CGAS; Shaffer et al., 1983) and the Health of the National Outcome Scales for
Children and Adolescents (HoNOSCA; Gowers et al., 1999). These scales can be used to
assess both patients’ current mental health status and their outcomes regarding general
functioning and symptom load.
An evidence-based assessment of mental disorders and related difficulties requires the use of
multiple measures and informants (e.g., parents, patients, and teachers) (Kazdin, 2005). The
clinician’s evaluation of the severity of a patient’s general functioning and symptom load is
an important part of this process. The CGAS (Shaffer et al., 1983) and the HoNOSCA
(Gowers et al., 1999) are frequently used for this purpose. The CGAS is a single-factor
measure of the global functioning of children and adolescents, and the HoNOSCA is a broad
measure of behavioural, symptomatic, social, and impairment domains in children and
adolescents. Both the CGAS (Schorre & Vandvik, 2004) and the HoNOSCA (Pirkis et al.,
2005) are frequently used as outcome measures.
Inter-rater reliability of the CGAS and HoNOSCA
Studies that have examined the inter-rater reliability of the HoNOSCA and CGAS have used
intra-class correlations (ICCs) to estimate the agreement between raters. ICC statistics allow
the estimation of the variance that can be explained by the variability among raters (Shrout &
Fleiss, 1979). Most studies of the inter-rater reliability of the CGAS and HoNOSCA have
used short written vignettes rated by different raters (Garralda, Yates, & Higginson, 2000;
Hanssen-Bauer, Gowers, et al., 2007; Hanssen-Bauer, Aalen, Ruud, & Heyerdahl, 2007;
Lundh, Kowalski, Sundberg, Gumpert, & Landèn, 2010). In these studies, the ICC range used
for the total HoNOSCA and CGAS scores was.81-.84 and .71-.93, respectively. In the only
inter-rater HoNOSCA study that did not utilise written vignettes, the raters scored the
HoNOSCA based on case presentations (Gowers et al., 1999). In this study, only the ICCs of
the single items in the total HoNOSCA score were reported. This ICC range was .63-.96.
13

The amount of information that is available and the process that leads to a conclusion with
written vignettes are not comparable to typical clinical practice, in which information from
multiple measures and informants is available to clinicians. Clinical decision-making in a
typical outpatient clinic is a demanding task. Clinicians have a high workload and limited
available time. When assessing a patient, clinicians must obtain an overview of all
information, separate relevant and irrelevant information, and make a decision about
diagnoses, severity of mental health status, and a treatment plan. These differences raise the
question of whether research that is based on vignettes is generalisable to everyday clinical
practice.
Outcome in mental health services
Several meta-analyses, including several hundred outcome studies, of the efficacy of
psychotherapy with children and adolescents (Casey & Berman, 1985; Kazdin, Bass, Ayers &
Rodgers, 1990; Weisz, Weiss, Alicke, & Klotz, 1987; Weisz, Weiss, Han, Granger, &
Morton, 1995) have documented a large significant positive effect, with mean effect sizes in
the range of 0.7 – 0.8.
Efficacy studies are strictly controlled experimental studies. Most of the relevant efficacy
studies have been conducted in samples that have been criticised as being unrepresentative of
usual care (Weisz & Jensen, 1999). Weisz and Jensen (1999) listed the following differences
between the majority of efficacy studies and clinical practice: a) the patients were not clinical
cases, b) homogeneous samples were selected with exclusion and inclusion criteria, c) therapy
addressed a single problem, d) therapists received extensive training and supervision, e) use
of specific techniques, and f) planned, structured and manual guided interventions. Weisz,
Jensen-Doss and Hawley (2006) examined the relevance of this critique in a meta-analysis
that only included studies that compared outcomes in studies that randomly assigned youths
to usual care or an evidence-based treatment. They included 32 studies in the meta-analysis
and found that the mean effect size of evidence-based treatment was 0.3. In this meta-
analysis, Weisz et al. (2006) found large variations in the included studies. Four of the studies
had a large effect size that was in favour of evidence-based treatment, five found medium to
large effect sizes in the same direction, and four of the studies found that usual care was
slightly superior to evidence-based treatment.
14

An evidence-based CAMHS practice consists of both evidence-based interventions and
assessment methods (Kazak et al., 2010). The measurement of outcomes is a part of an
evidence-based assessment practice. Mental health disorders are complex phenomena that
cannot be captured in a single construct. This knowledge should be reflected in the selection
of outcome measures. In a review article, Hunter, Higginson, and Garralda (1996) identified
three domains that can be used to evaluate outcomes, as follows: 1) clinical change
(symptoms, function, well-being, self-esteem, health-related quality of life and social
situation and quality of parenting), 2) compliance and satisfaction, and 3) met and unmet
needs. Numerous psychometric instruments have been developed to assess these domains.
These measures can be categorised as child-, parent- and clinician-rated outcome measures.
In 2008, the Department of Children Schools and Families and the Department of Health in
England appointed a research group to recommend national mental health outcome measures
(Wolpert et al., 2008). The research group systematically searched and reviewed the literature
to identify the best suitable outcome measures. In addition, 250 stakeholders were sent a
questionnaire to gather information concerning which outcome measures were used and the
usefulness of these measures for service planning and monitoring. Based on information from
both the research literature and the stakeholders, the research group recommended the use of
the SDQ, the HoNOSCA, the CGAS and a measure of experience of service to assess the
effectiveness of services. These measures cover some of the content in the three outcome
domains that Hunter et al. (1996) identified.
Sensitivity to detect change
An essential property of outcome measures is the ability to detect change. In a review,
Schorre and Vandvik (2004) identified 26 studies that employed the CGAS to measure
change over time. These studies indicated that the CGAS concurred with change in
functioning due to treatment. In a paper that examined data from the Child Outcomes
Research Consortium (CORC; Wolpert et al., 2012), 16115 episodes of care from 41 CAMHS
in England and Scotland were used to examine the correlation of changes between the CGAS,
the parent SDQ and an idiographic patient-reported goal-based outcomes (GBOs) measure 4-
8 months after the initial assessment. The study found significant correlations among the
clinician-reported outcomes, as measured using the CGAS, parent SDQ (r = -.28) and GBOs
(r = .37 – .39).
15

In a review article, Pirks et al. (2005) examined the HoNOSCAS’s sensitivity to detect
changes. They found that this topic had been studied with three different approaches. The first
approach was to examine whether scores on the HoNOSCA changed over time. Two of the
reviewed studies (Gowers et al., 1999; Gowers, Bailey-Rogers, Shore., & Levine, 2003)
demonstrated a mean reduction of 38% on the HoNOSCA total score over a 3-month period.
The second approach examined whether a change in the HoNOSCA scores corresponded with
other measures. A Danish study on 173 patients from 15 CAMHS sites (Bilenberg, 2003)
found a significant correlation (r = .58) between the change in the HoNOSCA and the Global
Assessment of Psychosocial Disability, which is a clinician-rated global outcome measure,
from initial assessment to follow-up at discharge or after three months. In a study on 248
patients, Geralda, Yates, and Higginson (2000) examined the correlation between change in
the HoNOSCA and the following four measures: the CGAS, the parental SDQ, the Behaviour
Checklist (BCL), and the parental General Health Questionnaire (GHQ). The patients were
assessed with these scales at the initial assessment and at the 6-month follow up. The study
found a moderate correlation (r = .51) between change in the HoNOSCA and CGAS scores
and smaller associations with the BCL (r = .40) and the parental SDQ (r = .32). The
correlation with change in parental GHQ was small (r = .16). In the third approach, the
HoNOSCA’s ability to detect change was validated against the clinician’s global rating of
improvement on a Likert scale. Pirks et al. (2005) identified six such studies, which all
reported close concordance between change in the HoNOSCA score and the clinician’s rating.
Moderators of outcome
Moderator analysis is a method that is used to examine whether specific factors influence the
effect of a treatment. In statistical terms, a moderator is a variable that affects the association
between an independent and dependent variable, and the examination of significant
correlations between predictors and moderators is used to test the moderator hypothesis
(Baron & Kenny, 1986). Examples of factors that moderate the effects of therapy are
comorbidities, parental depression, a family’s need for public assistance, and gender (Lavigne
et al., 2008; Owens et al., 2003).
Developmental factors are recognised as potentially important moderators of psychotherapy;
however, few studies have examined the moderating effect of children’s and adolescents’
cognitive developmental levels (Holmbeck et al., 2003). Despite the finding that low IQ is a
16

risk factor for mental health disorders, only a small number of studies have investigated
whether patients’ IQs moderate the effects of therapy. In a study of cognitive-based treatment
of children with antisocial and aggressive behaviour, low IQs predicted worse outcomes for
girls but not for boys (Kazdin & Crowley, 1997). The Multimodal Treatment Study of
Children with Attention Deficit/Hyperactivity Disorder (MTA) found that among children
with severe ADHD whose parents had depressive symptoms, those with an IQ ≥ 100
responded better to both medical treatment and combined medical and behavioural treatment
than did those with an IQ < 100 (Owens et al., 2003).
IQ as a predictor and moderator of CGAS and HoNOSCA scores
Few studies have examined IQ as a predictor of CGAS and HoNOSCA scores. Among
children admitted to a psychiatric inpatient unit, a moderate association was found between
IQ and CGAS (Green, Shirk, Hanze, & Wanstrath, 1994). In a study that compared the
offspring of depressed and non-depressed parents, low IQ was a predictor of CGAS in the
clinical range (Weissman, Warner, & Fendrich, 1990). The correlation between IQ and the
HoNOSCA was examined in a study of the cognitive performance of youth with
schizophrenia and bipolar disorder at a psychiatric inpatient unit (Pogge et al., 2008). The
Wechsler Intelligence Scale for Children - Third Edition (WISC-III) was used to assess
cognitive performance in this study. The results showed no significant associations between
the IQ scores at admission and the HoNOSCA score at follow-up six years later. To my
knowledge, no study has reported whether patients’ IQ moderates outcomes in general
functioning and symptom load, as measured using the CGAS and HoNOSCA.
Aims of the dissertation
The following main research questions were addressed in this dissertation:
1. Is the inter-rater agreement for severity assessments of children’s mental health
problems – as measured with the CGAS and HoNOSCA using information from the
DAWBA diagnostic interview -- comparable to the findings of studies that used
written vignettes?
2. Is IQ a predictor of the severity of children´s mental health problems, as measured
with the CGAS and HoNOSCA?
17

3. Is IQ a moderator of outcomes in the severity of children’s mental health problems?
Methods
Participants
The data collection of the CAMHS North study was conducted in two phases. The data that
were used in paper I were collected during 2006-2008, and the data that were used in papers II
and III were collected during 2004-2006.
Participants in Paper I
A sample of 100 patients, 58 boys and 42 girls with a mean age of 11.1 years (SD = 3.4), was
randomly selected from the patients who consented to participate in the CAMHS North study.
All patients who were aged 5 to 18 years (n = 1032) and referred for diagnostic assessment in
a CAMHS outpatient clinic from either a general practitioner or the welfare authorities were
invited by mail to participate in the “CAMHS North study”. A total of 286 patients (28%)
consented to participate in the study. The clinical procedures for participants and non-
participants were identical. The mean age of the patients was 11.4 years (SD = 3.4).
For all patients, clinician-assigned diagnoses and severity ratings were recorded based on
information that was collected from parents, teachers, and/or adolescents with the DAWBA
(Goodman et al., 2000).
Participants in Paper II and III
The participants (N = 132) were children and adolescents who were referred to three Child
and Adolescent Mental Health Outpatient Clinics in Northern Norway. The participants’
mean age was 11.5 years (SD = 2.4); 54.5% (n = 72) of the participants were boys, and 45.5%
were girls (n = 60).
18
Measures
The Development and Well-Being Assessment (DAWBA) is a package of interviews and
questionnaires (Goodman et al., 2000). The DAWBA interviews can be administered face-to-
face or via the Internet. The Norwegian web-based version was used. This version contains
modules for diagnoses that are related to separation anxiety, specific phobias, social phobia,
panic attacks and agoraphobia, post-traumatic stress disorder, generalised anxiety,
compulsions and obsessions, depression, deliberate self-harm, attention and activity, awkward
and troublesome behaviour, developmental disorders, eating difficulties, and less common
problems and modules for background information and strengths. The DAWBA consists of
the following three parts: 1) a detailed psychiatric interview for parents that is approximately
50 minutes in length, 2) a youth interview that lasts approximately 30 minutes, and 3) a brief
questionnaire for teachers that lasts approximately 10 minutes. The structured information
from all informants was combined, and computer-generated predictions of the probability of
diagnoses were produced. After reviewing all of the data, a clinician made the final diagnostic
decision. The DAWBA has good discriminative properties between community samples and
clinical samples and between distinctive diagnoses (Goodman et al., 2000). In both Norway
and Great Britain, the DAWBA generates realistic estimates of the prevalence of psychiatric
illness and a high predictive validity when used in public health services (Heiervang et al.,
2007; Meltzer, Gatward, Goodman, & Ford, 2003). Good to excellent inter-rater reliability
has been reported in both British and Norwegian studies, with κ = .86-.91 for any disorder, κ
= .57-.93 for emotional disorder, and κ = .93-1.0 for hyperkinetic or conduct disorder
(Heiervang et al., 2008; Heiervang et al., 2007). Good to excellent agreement has also been
reported between clinical and DAWBA diagnoses without face-to-face contact between the
clinician and the informants, with kappa values ranging from κ = .57 to .76 (Foreman & Ford,
2008; Foreman, Morton, & Ford, 2009). An Italian study reported good agreement between
consensus diagnoses and a clinical expert (Frigerio et al., 2006).
The Wechsler Intelligence Scale for Children - Third Edition (WISC-III), Norwegian version
(Sonnander, Ramund, & Smedler, 1998), is an intelligence test for children aged 6-16 years.
The test consists of 13 subtests, which are combined into the following three IQ scores: Full
Scale IQ (FSIQ), Verbal IQ (VIQ), and Performance IQ (PIQ). Both the split-half and test-
retest reliability of the WISC-III IQ scores are high (rxx > .93) (Wechsler, 1992).
19

The Strengths and Difficulties Questionnaire (SDQ; Goodman, 1997) is a behavioural
screening questionnaire that was designed for children and adolescents aged 3-16 years. It has
been widely used for research in the Nordic countries (Obel et al., 2004). There are separate
SDQ forms for youths, parents, and teachers. In the current study, the parent version was
used. Each form consists of 25 items, which are divided into the following scales: emotional
symptoms, conduct problems, hyperactivity/inattention, peer relationship problems, and
prosocial behaviour.
The Children’s Global Assessment Scale (CGAS; Shaffer et al., 1983) is a rating scale that
measures general functioning in children aged 4-16 years, with a range from 100 (superior
functioning) to 1 (needs constant supervision). The most impaired level of functioning for the
previous month was rated. The CGAS has been evaluated in several studies and is widely
used to assess the severity of mental health problems and outcomes (Rey, Starling, Wever,
Dossetor, & et al., 1995; Schorre & Vandvik, 2004). An intra-class correlation coefficient
(ICC) of .61 was found for the CGAS in a study of inter-rater reliability (Hanssen-Bauer,
Aalen, et al., 2007) among clinicians who worked in Norwegian child and adolescent mental
health services. In a comparable cross-national study (Hanssen-Bauer, Aalen et al., 2007), a
similar ICC was found.
The Health of the Nation Outcome Scales for Children and Adolescents (HoNOSCA; Gowers
et al., 1999) consists of 15 scales that are rated from 0 (no problem) to 4 (severe to very
severe problem). In this study, the first 13 scales were used, and their total score was used to
indicate the overall severity of mental health problems (range 0–52). The HoNOSCA has
been evaluated in several studies and has been found to be easy to use, reliable, valid, and
sensitive to change (Bilenberg, 2003; Brann, Coleman, & Luk, 2001; Garralda & Yates, 2000;
Hanssen-Bauer, Aalen, et al., 2007; Pirkis et al., 2005). In a study of inter-rater reliability
(Hanssen-Bauer, Aalen, et al., 2007) among clinicians who worked in Norwegian child and
adolescent mental health services, an ICC of .81 was found for the HoNOSCA. In a
comparable cross-national study (Hanssen-Bauer, Gowers, et al., 2007), the ICC was .84.
20
Procedure
The Regional Committee for Medical Research Ethics and the Norwegian Social Science
Data Services approved the study.
Written informed consent was obtained before the participants were included in the study. For
participants who were younger than 12 years, their parents gave consent. For participants who
were between 12 and 16 years, written consent was obtained from both the parents and the
adolescents. Participants who were older than 16 years gave consent themselves, according to
Norwegian legislation.
The CAMHS North study was funded by the Northern Norway Regional Health Authority,
the University Hospital of North-Norway, and the Regional Centre for Child and Youth
Mental Health and Child Welfare, Faculty of Health Sciences, University of Tromsø.
Procedure in Paper I
From October 2006 to December 2008, children and adolescents who were referred to the
Child and Adolescent Mental Health Outpatient Clinic at the University Hospital of Northern
Norway were included in the “CAMHS North study”. Parents, teachers, and children who
were above the age of 11 completed the relevant version of the DAWBA using the web-based
interface, which they accessed from home or school after receiving a request with the unique
web link for that child's case. Written information about how to log on and contact
information in case of problems was distributed along with the unique web link. Requests
were distributed by mail to the parents. For participants who were younger than 16 years,
requests to the teachers were distributed via the parents. For participants who were older than
16 years, requests to both parents and teachers were distributed via the participants. A total of
93% of the parents answered the parent questionnaire in the DAWBA, 84% of the adolescents
who were 11 years or older answered the youth questionnaire, and 72% of the teachers
answered the teacher questionnaire. For 87% of the patients, multiple informants completed
the DAWBA questionnaire. For the 13% of patients with only one informant, either the parent
(10%) or the adolescent (3%) questionnaires were completed.
21
Four clinicians independently rated the DAWBA information from a randomly selected
sample of patients who were included in the study. Three of the clinicians were clinical
specialists in neuropsychology and had a minimum of nine years of experience in the field.
The fourth clinician was a specialist in child and adolescent psychiatry with 15 years of
experience in the field.
All four clinicians had completed the online training for the DAWBA (Youthinmind, 2011,
November 17). For the Health of the Nation Outcome Scales for Children and Adolescents
(HoNOSCA) and the Children’s Global Assessment Scale (CGAS), all of the clinicians
completed a one-day training session that included the scoring of vignettes (Hanssen-Bauer,
Aalen, et al., 2007; Hanssen-Bauer, Gowers, et al., 2007). In addition, all of the clinicians
participated in two two-day training sessions. The training sessions included diagnostic
assessment and severity rating of real cases from the clinic, with a focus on agreement and
thresholds for diagnoses. The developer of the instrument, Robert Goodman, formally trained
the clinician who led the training sessions to ensure that the rating thresholds were
comparable to other DAWBA studies.
After completing the training sessions, all four clinicians individually rated the 100 patients
diagnostically according to the ICD-10 (WHO, 1993) and rated clinical severity using the
HoNOSCA and the CGAS, based on information on the DAWBA. To obtain a sufficient
number of cases for the agreement analyses of the ICD-10 diagnoses, they were categorised
as follows:
• Emotional diagnoses: ICD-10 diagnoses related to separation anxiety, specific
phobias, social phobia, panic attacks and agoraphobia, post-traumatic stress disorder,
generalised anxiety, compulsions and obsession, depression, and deliberate self-harm.
• ADHD/hyperkinetic diagnoses: ICD-10 diagnoses related to attention and activity.
• Conduct diagnoses: ICD-10 diagnoses related to awkward and troublesome
behaviour.
• Other diagnoses: ICD diagnoses related to developmental disorders, eating
difficulties, and less common problems.
• Any diagnoses: one or several ICD-10 diagnoses from the categories.
22

• Comorbidity: diagnoses from at least two categories were assigned, without
considering the exclusion rules of the ICD-10.
According to the instructions for DAWBA raters, experienced raters benefit from regular
consensus meetings to discuss difficult cases (Youthinmind, 2011, November 17). A clinical
population enhances the proportion of difficult cases and may call for consensus diagnoses for
comparison when agreement is disputed. All cases with diagnostic disagreement between two
or more raters were discussed until consensus was obtained (n = 25). Previous studies, such as
the British Child and Adolescent Mental Health Survey 1999 (Ford, Goodman, & Meltzer,
2003; Meltzer et al., 2003) and the Bergen Child Study (Heiervang et al., 2007), have used
similar procedures. The Italian preadolescent mental health project (Frigerio et al., 2006), in
which DAWBA consensus diagnoses were compared with the ratings of an independent child
psychiatrist (κ = .71), also utilised similar procedures.
Procedures in Papers II and III
The participants were assessed with the HoNOSCA and CGAS at the following three time
points: in conjunction with an intake session (T0), at the start of treatment (T1), and at a
follow-up assessment (T2). The mean waiting list time (the number of days from T0 to T1)
was 140.5 days (SD = 70.1), and the mean treatment time (the number of days from T1 to T2)
was 179.3 days (SD = 71.4). The WISC-III assessment was performed at T1.
There were some differences in the completion time of the parent SDQ. Specifically, 77.3%
(n = 102) of the questionnaires were completed at T1, and 33.7% (n = 30) were completed at
T0. The examination of whether there were any differences between the questionnaires that
were completed at T0 and T1 and the scales that measured emotional symptoms, conduct
problems, hyperactivity/inattention, peer relationship problems, and prosocial behaviour were
compared using an independent samples t-test. There was a small difference (t(130) = 2.59, p
= .01, r = .22) between the emotional scales that were completed at T0 (M = 4.37, SD = 2.79)
and T1 (M = 3.09, SD = 2.24). There were no significant differences between the other scales.
23
Statistical analyses
Statistical analyses in Paper I
The statistical analyses in paper I were performed using STATA version 11.0. Fleiss’ kappa
was calculated to examine the four clinicians’ agreement for all diagnostic categories. Fleiss’
kappa estimates the overall intra-rater agreement on categorical variables (Leefang, Deeks,
Gatsonis, & Bossuyt, 2008). Agreement in the range κ = .75 to κ = 1.00 was interpreted as
excellent, κ = .60 to κ = .74 as good, κ = .40 to κ = 0.59 as fair, and κ < .40 as poor, as
suggested by Cicchetti and Sparrow (1981).
The intra-class correlation (ICC) between clinicians was computed to assess agreement for the
HoNOSCA and CGAS severity ratings. The model for ICC was an alpha model for
dichotomous data, namely, the two-way mixed type for consistency data (McGraw, 1996;
Shrout & Fleiss, 1979). The ICC was calculated as a “single-measure ICC” and an “average-
measure ICC”, where the former is the reliability of the ratings of one clinician and the latter
is the reliability of the ratings of all four clinicians averaged together. The interpretations of
the ICC values were performed according to Shrout’s (1998) guidelines. Agreement within
the range of .81 to 1.00 was interpreted as substantial, .61 to .80 was moderate, .41 to .60 was
fair, .11 to .40 was slight, and .00 to .10 was virtually no agreement.
Agreement for the diagnostic categories and ICC for the HoNOSCA and CGAS were
calculated for the categories of emotional diagnoses, ADHD/hyperkinetic diagnoses, conduct
diagnoses, other diagnoses, any diagnoses, comorbidity and no diagnosis.
To examine whether the average CGAS and HoNOSCA scores of the diagnostic groups
differed from that of the participants without an ICD-10 diagnosis, an independent t-test was
used. The effect size of the differences was calculated and interpreted according to Cohen’s
(1988) guidelines. Specifically, an effect size of 0.2 = small, 0.5 = moderate, and 0.8 = large.
Statistical analyses in Paper II
All statistical analyses were performed with SPSS version 16.0 (SPSS Inc. Chicago, IL,
24

USA). The difference between boys and girls was investigated using an independent samples
t-test. Six hierarchical regression analyses were conducted to examine how much of the
variance in clinician-rated mental health problems was predicted by the WISC-III IQ scales.
The HoNOSCA was the dependent variable in three of the analyses, and the CGAS was the
dependent variable in the other three analyses. In all of the analyses, the independent variables
were entered in three steps. In step 1, age and gender were entered. In step 2, the WISC-III
scales FSIQ, PIQ, and VIQ were entered in separate analyses. In step 3, the SDQ scales
emotional symptoms, conduct problems, hyperactivity/inattention, peer relationship problems,
and prosocial behaviour were entered.
Age and gender were entered in the first step of the regression models to examine the effect of
IQ after controlling for the effect of these variables (Cohen et al., 1993). IQ was entered in the
next step before entering the SDQ scales. The order of the variables was based on the results
of longitudinal studies, which indicated that low IQ is a risk factor for developing mental
health problems and precedes the development of mental health problems (Koenen et al.,
2007; Koenen et al., 2009). In addition, IQ is a measure that is quite stable during
development (Neisser et al., 1996).
The interpretations of effect sizes followed the guidelines that were suggested by Cohen
(Cohen, 1988). Correlations of r = .10 were interpreted as small, those of r = .30 were
interpreted as medium, and those of r = .50 were interpreted as large.
Statistical analyses in Paper III
All statistical analyses were performed using SPSS version 16.0 (SPSS Inc. Chicago, IL,
USA). Some of the participants who were assessed at the intake session had missing data at
later time points, and there were some differences in assessment time points. Repeated
measures analyses of variance or regression analyses with dummy variables would have
necessitated the exclusion of participants with missing data. Additionally, these statistical
methods assume that all participants are assessed at the same time points. To overcome these
problems, linear mixed model analyses were used (Norusis, 2003). In a repeated measures
design that is analysed with linear mixed model statistics, participants with missing data can
be included in the analysis, the time points of assessment can vary, and the best variance-
25

covariance structure for the data can be specified (Norusis, 2003). The results can be
interpreted in the same way as regression analysis results.
To test whether there were differences between the HoNOSCA and CGAS scores at different
time points, time was treated as a fixed factor. Bonferroni post-hoc comparisons were used to
adjust for multiple comparisons. The effect size of the different time points was examined by
calculating r based on the results of an independent samples t-test. An interpretation of the
effect sizes was performed according to Cohen’s (1998) guidelines. Specifically, the effect
sizes of r = .10 were interpreted as small, r = .30 were interpreted as moderate, and r = .50
were interpreted as large.
The models that examined repeated HoNOSCA and CGAS measures, with the WISC-III IQ
scales as moderator variables, were constructed in a stepwise fashion. To test whether
entering new variables into the model increased the model fit, changes in −2 log likelihood
were used. The differences were examined using chi-squared statistics. The first independent
variable that was entered in the model was time (the three time points), and the next variable
was the WISC-III IQ score. The FSIQ-, PIQ-, and VIQ-time interaction terms were entered as
the final variables in the mixed-model analysis to examine the WISC-III IQ scores as
moderators. The repeated measures of the HoNOSCA and CGAS were entered at level 1 (data
of individual patients) in the model, whereas the WISC-III IQ scales were entered at level 2
(differences between patients). Time and the IQ scales were treated as covariates. An
unstructured covariance structure was used.
26

Summary of results
Paper I. Brøndo, P.H., Mathiassen, B., Martinussen, M., Heiervang, E., Eriksen, M., &
Kvernmo, S. (2012). Agreement on web-based diagnoses of mental health problems in
Norwegian child and adolescent mental health services. Clinical Practice & Epidemiology
in Mental Health, 8, 16-21.
Objective: The use of structured interviews can improve the reliability of diagnostic
assessments of mental health problems. The purpose of this study was to examine the
agreement between clinicians’ ratings of a structured interview within a child and adolescent
mental health outpatient service setting. The agreement between a diagnostic assessment and
the clinicians’ ratings of a patient’s mental health status was examined.
Method: A total of 100 clinically referred youths in the “Child and Adolescent Mental Health
Services North study” were included. Information from multiple informants was obtained
using a semi-structured web-based interview, the Development and Well-Being Assessment
(DAWBA). Based on this information, four experienced clinicians independently rated the
type and severity of mental health problems according to the ICD-10, the Health of the Nation
Outcome Scales for Children and Adolescents (HoNOSCA), and the Children’s Global
Assessment Scale (CGAS).
Results: The raw agreement between the clinicians was 75% for any diagnosis, 77% for
emotional diagnosis, 84% for ADHD, and 84% for conduct diagnosis. Fleiss’ kappa indicated
excellent agreement for conduct diagnosis (κ = .82, n = 19) and good agreement for any
27

diagnosis (κ = .69, n = 70), emotional diagnosis (κ = .70, n = 20), ADHD/Hyperkinetic
diagnosis (κ = .72, n = 6), and comorbidity (κ = .70, n = 24). The group comorbidity consisted
of 14 participants with emotional diagnosis, 16 with ADHD/hyperkinetic diagnosis, 20 with
conduct diagnosis, and four with other diagnosis.
The mean CGAS and HoNOSCA ratings for the total sample and the various diagnostic
categories are presented in table 1. The single measures intra-class correlation for the total
sample was .78 for the HoNOSCA and .74 for the CGAS, and the average intra-class
correlation was .93 (HoNOSCA) and .92 (CGAS).
The results of the comparison of the average CGAS and HoNOSCA scores of the diagnostic
groups with the average scores of participants without an ICD-10 diagnosis are presented in
table 1. All of the differences were significant, and the effect sizes of all of the differences
were large (Cohen’s d = 1.20 – 2.99).
Conclusions: Agreement among the four clinicians and between each clinician and the
consensus diagnoses was good to excellent for all diagnostic categories. Agreement on
severity was moderate but improved to substantial using the averaged rating of the four
clinicians. Experienced clinicians can sufficiently assign reliable diagnoses and assess
severity based on information that is collected using the DAWBA.
28

Table 1. Clinician ratings of severity for the total sample and the diagnostic categories, and the comparison of the mean HoNOSCA and CGAS
scores of the diagnostic groups with those of the participants without a diagnosis.
1Comparison of the mean CGAS and HoNOSCA scores with the mean scores of participants without an ICD-10 diagnosis.
Clinician-rated severity
1Comparison of mean
CGAS scores with no diagnosis
1Comparison of mean
HoNOSCA scores with no diagnosis
n CGAS
M (SD)
HoNOSCA
M (SD)
t (df) Cohens’s d
t(df) Cohens’s d
Total sample 100 56.11 (10.56) 11.09 (5.27) - - - -
Any diagnosis 70 51.26 (7.21) 13.20 (4.54) 9.82 (98), p < 0.00 1.98 7.70 (98), p < 0.00 1.55
Emotional diagnosis 20 53.05 (8.24) 13.24 (4.97) 6.02 (48), p < 0.00 1.74 6.14 (48), p < 0.00 1.77
ADHD/Hyperkinetic
diagnosis
6 54.88 (6.29) 10.71 (3.39) 3.50 (34), p < 0.00 1.20
3.16 (34), p < 0.00 1.08
Conduct diagnosis 19 54.47 (5.23) 10.57 (3.32) 6.08 (47), p < 0.00 1.77 4.64 (47), p < 0.00 1.35
Comorbidity 24 46.27 (5.40) 15.89 (3.93) 10.80 (52), p < 0.00 2.99 10.05 (52), p < 0.00 2.79
Other diagnosis 1 52.75 (-) 12.75 (12.75) - - - -
No diagnosis 30 67.41 (8.27) 6.17 (3.18) - - - -

Paper II. Mathiassen, B., Brøndbo, P.H., Waterloo, K., Martinussen. M., Eriksen, M.,
Hanssen-Bauer, K., & Kvernmo, S. (2012). IQ as a predictor of clinician-rated mental
health problems in children and adolescents. British Journal of Clinical Psychology, 52,
185 – 196.
Objective: Previous studies have indicated that low IQ is a substantial risk factor for
developing mental health problems. Based on these results, we hypothesised that IQ may
predict some of the variance in clinician-rated severity of children's mental health problems,
as measured using the Children's Global Assessment Scale (CGAS) and the Health of the
Nation Outcome Scales for Children and Adolescents (HoNOSCA). The other aims of this
study were to examine differences in the predictive ability of the different IQ scores of the
Wechsler Intelligence Scale for Children, Third Edition (WISC-III) and to examine whether
parent-rated measures of child mental health problems predict CGAS and HoNOSCA scores
after controlling for IQ, age, and gender.
Methods: In this study, 132 patients at three outpatient clinics in Northern Norway were
assessed with the parent version of the Strengths and Difficulties Questionnaire (SDQ), the
HoNOSCA, the CGAS, and the WISC-III. The patients were assessed with the HoNOSCA,
CGAS and parent SDQ at both intake (T0) and at the start of treatment (T1) after being placed
on a waiting list.
At T1, nine HoNOSCA and 25 parent SDQ scores were missing. These scores were replaced
with T0 data. The analyses of missing data are described in Table 2. These analyses were
accomplished by comparing the patients with T1- and replaced T0-data using an independent
t-test. There were no statistically significant differences between T1 and the replaced T0
scores on the HoNOSCA, CGAS, WISC-III, or parent SDQ.
The mean waiting time was 140.5 (SD = 70.1) days. There were no statistically significant
differences in waiting time between the patients with T1 scores on the HoNOSCA and the
parent SDQ and the patients with replaced HoNOSCA (t(130) = 0.53, p = .66) and parent
SDQ (t(130) = 0.42, p = .68) scores from the T0 assessment.
Results: Hierarchical regression analyses were conducted with the HoNOSCA and CGAS as

dependent variables. Demographics, WISC-III IQ scores, and the SDQ were entered as
independent variables.
The mean age of the 132 participants was 11.5 years (SD = 2.9). The girls (n = 60; M = 12.1,
SD = 3.0) were significantly (t(130) = 2.16, p = .03) older than the boys (n = 72; M = 11.0, SD
= 2.8). The boys had a significantly (t(130 = -2.89, p < .00) higher score on the parent SDQ
hyperactivity scale than did the girls. There were no other significant gender differences. The
mean WISC-III FSIQ score was 84.46 (SD = 19.10), and 22.7% (n = 30) of the participants
had a FSIQ < 70.
In the model with the HoNOSCA as the dependent variable, age and gender were entered in
step 1 and predicted 5% of the variance. In step 2, FSIQ, VIQ, and PIQ were entered in
separate regression models and added 6%, 4%, and 7% of the variance, respectively. The
parent-rated SDQ was entered in step 3 and predicted an additional 14% of the variance. The
models with FSIQ, VIQ, and PIQ in step 2 predicted 25%, 23%, and 25%, respectively, of the
HoNOSCA score. The analyses with the CGAS as the dependent variable produced no
significant results.
Conclusion: When a patient has a high HoNOSCA score, an intelligence test should be
considered in addition to an evaluation of mental health symptoms. Future research should
examine whether the HoNOSCA's ability to detect change might be affected by the patient’s
IQ.
31
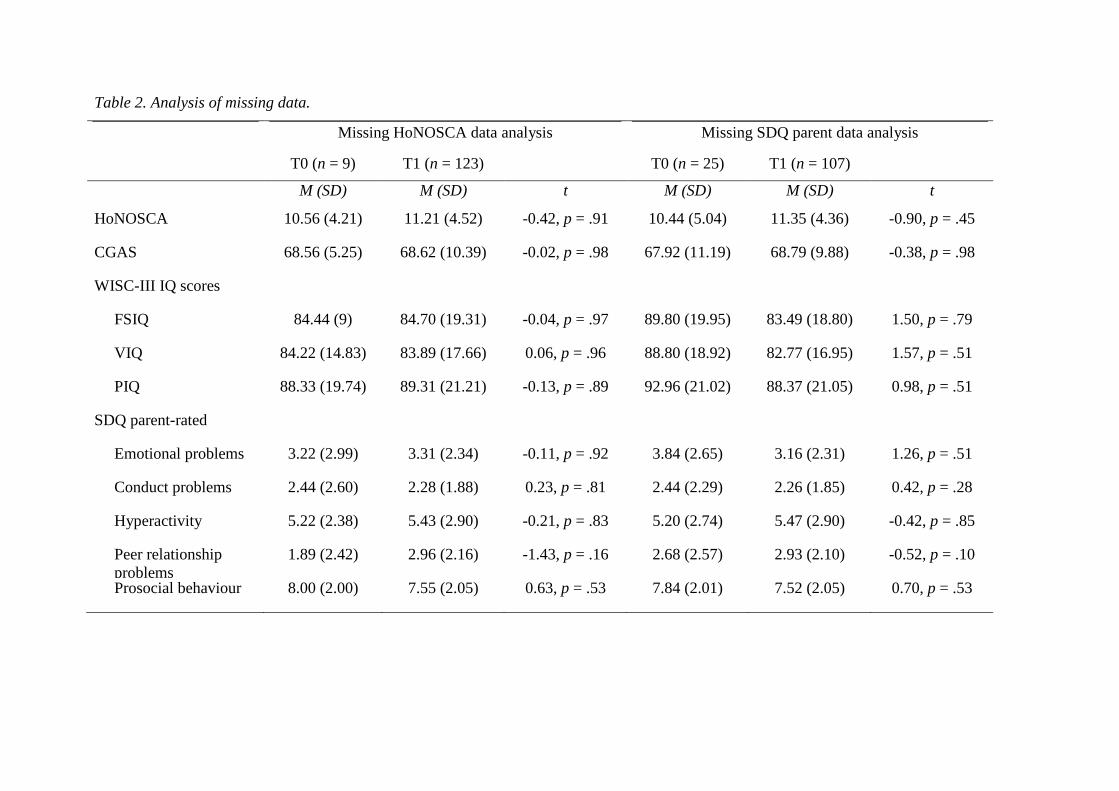
Table 2. Analysis of missing data.
Missing HoNOSCA data analysis Missing SDQ parent data analysis
T0 (n = 9) T1 (n = 123) T0 (n = 25) T1 (n = 107)
M (SD) M (SD) t M (SD) M (SD) t
HoNOSCA 10.56 (4.21) 11.21 (4.52) -0.42, p = .91 10.44 (5.04) 11.35 (4.36) -0.90, p = .45
CGAS 68.56 (5.25) 68.62 (10.39) -0.02, p = .98 67.92 (11.19) 68.79 (9.88) -0.38, p = .98
WISC-III IQ scores
FSIQ 84.44 (9) 84.70 (19.31) -0.04, p = .97 89.80 (19.95) 83.49 (18.80) 1.50, p = .79
VIQ 84.22 (14.83) 83.89 (17.66) 0.06, p = .96 88.80 (18.92) 82.77 (16.95) 1.57, p = .51
PIQ 88.33 (19.74) 89.31 (21.21) -0.13, p = .89 92.96 (21.02) 88.37 (21.05) 0.98, p = .51
SDQ parent-rated
Emotional problems 3.22 (2.99) 3.31 (2.34) -0.11, p = .92 3.84 (2.65) 3.16 (2.31) 1.26, p = .51
Conduct problems 2.44 (2.60) 2.28 (1.88) 0.23, p = .81 2.44 (2.29) 2.26 (1.85) 0.42, p = .28
Hyperactivity 5.22 (2.38) 5.43 (2.90) -0.21, p = .83 5.20 (2.74) 5.47 (2.90) -0.42, p = .85
Peer relationship problems
1.89 (2.42) 2.96 (2.16) -1.43, p = .16 2.68 (2.57) 2.93 (2.10) -0.52, p = .10
Prosocial behaviour 8.00 (2.00) 7.55 (2.05) 0.63, p = .53 7.84 (2.01) 7.52 (2.05) 0.70, p = .53
Paper III. Mathiassen, B., Brøndbo, P.H., Waterloo, K., Martinussen. M., Eriksen, M.,
Hanssen-Bauer, K., & Kvernmo, S. (2011). IQ as a moderator of outcome in severity of
children’s mental health status after treatment in outpatient clinics, Child and
Adolescent Psychiatry and Mental Health, 6:22.
Background: Psychotherapy is an effective treatment for mental health disorders. However,
even with the most efficacious treatment, many patients do not experience improvement.
Moderator analysis can identify the conditions under which treatment is effective and factors
that can attenuate the effects of treatment.
Methods: In this study, a linear mixed model analysis was used to examine whether the Full
Scale IQ (FSIQ), Performance IQ (PIQ), and Verbal IQ (VIQ) on the Wechsler Intelligence
Scale for Children – Third Edition, moderated outcomes in general functioning and symptom
load, as measured with the CGAS and the HoNOSCA. A total of 132 patients who were
treated at three outpatient CAMHS were assessed with the HoNOSCA and the CGAS at
intake (T0), at start of treatment (T1), and 6 months after the start of treatment (T2). The
mean treatment time (number of days from T1 to T2) was 179.3 days (SD = 71.4).
Results: The mean HoNOSCA score for time points T0, T1, and T2 were significantly
different (F(2, 340) = 25.60, p < .01), and time predicted change in the HoNOSCA scores (b
= 2.16, t(112.70 = -8.40, p < .01). The effect size of the change in the HoNOSCA scores
from T0 (M = 12.35, SD = 5.29) to T1 (M = 11.11, SD = 4.42) was non-significant (r = .12;
t(237.78) = 1.95, p = .06), whereas the effect size of the change from T1 to T2 (M = 7.91, SD
= 4.42) was moderate (r = .34, t(209) = 5.17, p < .01). The PIQ × time interaction predicted
changes in the HoNOSCA scores (b = -0.03, t(115.14) = -2.28, p = .02). The slopes and
intercepts of the HoNOSCA scores covaried negatively and significantly (p < .05), indicating
that the patients with the highest HoNOSCA scores at first assessment demonstrated the
largest improvements in outcome.
The mean CGAS score for the time points T0, T1, and T2 were significantly different (F(2,
328) = 16.43, p < .01), and time predicted change in the CGAS scores (b = -3.74, t(104.11 =
6.33, p < .01). The change in the CGAS scores from T0 (M = 67.66, SD = 77.17) to T1 (M =
68.49, SD = 19.22) was non-significant (p = 1.00), whereas the effect size of the change from

T1 to T2 (M = 75.28, SD = 9.53) was moderate (r = .32, t(201) = -4.87, p < .01). The FSIQ ×
time interaction predicted changes in the CGAS scores (b = 0.46, t(107.28) = 1.86, p < .01).
There were no significant variance in slopes (p = .20) or in the covariance between slopes and
intercepts (p = .08).
Conclusions: FISQ and PIQ moderated change in general functioning and symptom load,
respectively. This finding implies that patients with higher IQ scores demonstrated a steeper
improvement slope than did those with lower scores. The patients with the highest initial
symptom loads showed the greatest improvement. This pattern was not found in the
improvement of general functioning.
34

Discussion
The main aim of this dissertation was to examine 1) the intra-rater reliability of the
HoNOSCA and the CGAS and 2) IQ as a predictor and moderator of children’s mental health
problems. Alternative interpretations of the results and methodological reflections are
highlighted. Potential implications for the use of the HoNOSCA and the CGAS as service-
level indicators and in clinical work are discussed.
Discussion of the main results
The clinical reliability of the HoNOSCA and CGAS
The first aim of this dissertation was to examine the agreement between clinician-assigned
severity of mental health problems, as measured using the CGAS and HoNOSCA. The web-
based version of the DAWBA was used to collect severity ratings. As presented in paper I,
the severity ratings were fair to moderate for a single clinician and moderate to substantial
when averaging the ratings of multiple clinicians. The raw agreement for the diagnostic
groups was in the range of 75 - 84%. An examination of the agreement between the clinicians
using Fleiss’ kappa indicated good to excellent (κ = .69 - .82) agreement. The average
HoNOSCA and CGAS scores of the different diagnostic categories were all significantly
lower than the average scores of patients with no diagnosis. The effect sizes of all of the
differences were large. This indicates that the scoring of the HoNOSCA and the CGAS based
on information of the DAWBA is reliable and differentiates between patients with and
without mental health disorders.
Previous studies that have examined the agreement among clinicians have mainly used short
written vignettes. In a study (Lundh et al., 2010) using five single-page, written vignettes to
obtain CGAS ratings in a naturalistic clinical setting, five experts’ ratings were compared
with the ratings of 703 untrained health-care professionals. The vignettes were based on chart
information from patients’ first visits to outpatient units or emergency rooms. The ICC was
0.92 for the experts and 0.73 for the untrained health-care professionals. Thus, the current
study’s single-measure ratings are comparable to those assigned by untrained health-care
professionals from the aforementioned study. Hanssen-Bauer, Aalen, et al. (2007) utilised
both written vignettes and clinical interviews. A total of 169 clinicians rated 10 single-page,
35
written vignettes, each based on clinical descriptions from the CAMHS. Three clinicians also
rated 20 patients as part of the hospital admission procedure. The ICC was .61 for the CGAS
and .81 for the HoNOSCA. The study did not detect any difference in ICC between the
vignettes and clinical interviews. The current paper I results are on par with the HoNOSCA
ICC and are an improvement over the CGAS ICC.
In a typical clinical setting, raters of severity must evaluate and select information from an
extensive amount of information from multiple sources (e.g., caregivers, teachers, and
psychometric tests). Compared with studies that employ written vignettes, the use of the web-
based version of the DAWBA more realistically simulates the scope of information that raters
must evaluate in clinical settings. In papers II and III, the clinician-assigned severity of mental
health problems was measured using the CGAS and HoNOSCA in a typical clinical setting.
Although the DAWBA was not used in papers II and III, the results of paper I indicate that
the agreement among clinicians who work in outpatient clinics is fair to good.
In paper I, the diagnostic assessments were based on information from the DAWBA without
access to the patients’ case records. This is a potential threat to the generalisability of the
results to typical clinical practice. The agreement between the clinical diagnosis and results of
diagnostic interviews was examined in a meta-analysis (Rettew, Alicia, Achenbach, Dumenci,
& Ivanova1, 2009). The results indicated that the kappa values for the diagnostic categories,
which were used in paper I, and specific diagnoses were low to moderate. The 100
participants in paper I were included in a larger study with 286 participants. In this larger
study, the agreement on diagnoses based on the DAWBA and diagnoses from routine clinical
practice were compared (Brøndbo, Mathiassen, Martinussen, Handegård, & Kvernmo, 2013).
The diagnostic categories were equal to the categories that were used in paper I. The raw
agreement was 74 – 90%, and the kappa values were in the range of 0.41 – 0.49. These results
indicated that there is a fair agreement between clinical diagnoses and research diagnoses
based on information from the DAWBA.
The kappa coefficient is a statistical measure that takes the possibility of chance agreement
into account. In study I, the kappa values were in the range of κ = .69 - .82. According to
Cicchetti and Sparrow’s (1981) guidelines, these magnitudes may be considered good to
excellent. These results are on par with similar studies (Basco et al., 2007; Williams, Noël,
Cordes, Ramirez, & Pignone, 2002). Furthermore, compared with the agreement for medical
36
diagnoses, these results are equal or better (Pies, 2007). Although the kappa values in study I
were categorised as acceptable, the raw agreement indicated that the raters disagreed on the
diagnostic evaluations of one in four patients. This result illustrates that the categorisations of
magnitude are arbitrary conventions and that the use of labels such as good and excellent may
mislead readers who do not have detailed knowledge concerning the calculation of kappa
statistics.
The use of diagnostic categories rather than a single diagnosis is a common approach in
research (Rettew et al., 2009). This approach was used in paper I. There are two main
arguments for the use of diagnostic categories. One argument is related to sample size. The
ICD-10 chapter of mental and behavioural disorders consists of 10 main groups (WHO,
1993), and each group includes multiple diagnoses. The number of patients in study I was
insufficient to perform meaningful intra-rater agreement calculations based on the single ICD-
10 diagnosis to categorise mental health problems in children and adolescents. This is a
potential weakness of the study and may lower the clinical validity of the results. The second
argument for using diagnostic categories is related to clinical utility. In a study related to the
ICD-11 chapter of mental and behavioural disorders, the conceptualisation of mental health
disorders of psychiatrists and psychologists from 64 countries were examined (Roberts et al.,
2012). This study found that clinicians tend to categorise disorders in the following three
clusters/dimensions: 1) internalising – externalising, 2) developmental – adult onset, and 3)
functional – organic. The categorisation in study I is similar to the internalising –
externalising dimension. The emotions diagnostic group resembles the internalising
dimension, and the ADHD/Hyperkinetic and the Conduct diagnosis categories fit into the
externalising cluster. This indicates that the kappa values in paper I may be a more realistic
estimation of the diagnostic intra-rater agreement among clinicians who classify mental and
behavioural disorders in their everyday work than are the results of intra-rater agreement
studies on single ICD-10 diagnoses.
IQ as a predictor of clinician-rated mental health problems
The second aim of the dissertation was to examine whether IQ predicted the clinician-rated
severity of mental health problems in children. The results varied for the HoNOSCA and
CGAS as measures of clinician-rated severity. The model with the HoNOSCA as the
dependent variable predicted 25% of the total variance, whereas the model with the CGAS as
37

the dependent variable was not significant. After controlling for age and gender, FSIQ
predicted an additional 6% of the variance in the HoNOSCA score.
In the only previous study of the association between IQ and HoNOSCA, no significant
correlations between these measures were found (Pogge et al., 2008). One possible
explanation for why these results do not match the current results is that the studies differed in
terms of the clinical sample that was surveyed and the time interval between the assessment
with the HoNOSCA and the WISC-III. In the current study, all of the assessments were
conducted at the same time, whereas the assessment with the HoNOSCA in Pogge’s study
(2008) was completed six years after the cognitive evaluation with the WISC-III.
In the current study, there was a large negative correlation (r = -.54) between the CGAS and
HoNOSCA scores. This result corresponds with Yates, Garralda and Higginson’s (1999)
study and indicates substantial overlap between these measures when they are used with
outpatients. Therefore, it is surprising that IQ did not predict CGAS scores. One explanation
for the difference in the prediction of CGAS versus HONOSCA scores by IQ may be that
these measures of clinician-rated mental health problems are constructed differently. The
CGAS consists of one rating scale, whereas the HoNOSCA includes a total of 13 scales. Two
of the scales in the HoNOSCA cover “problems with scholastic or language skills” and
“problems with self-care and independence”. It is well documented that scholastic and
language skills are highly correlated with IQ (Neisser et al., 1996), and problems with self-
care are common among persons with an IQ < 70 (Sparrow, Cicchetti, & Balla, 2005). This
may explain the stronger relationship between IQ and the HoNOSCA compared with the
CGAS. In studies that have examined the association between the CGAS and IQ (Green et al.,
1994; Weissman et al., 1990), moderate correlations between these variables have been
detected. These findings do not correspond to the current study results. Different samples with
different severities of problems may be a possible explanation for the inconsistent results. In
Green’s study (1994), the participants were inpatients, and their mean CGAS was 38.22 (SD =
8.85). The study in paper II was conducted with an outpatient sample with a mean CGAS
score of 68.62 (SD = 10.11). In Weissman and colleagues’ (1990) study, only the offspring of
depressed and non-depressed parents were examined. Differences in psychometric properties
may also explain the different results with the CGAS and the HoNOSCA as dependent
variables. The HoNOSCA has a higher inter-rater reliability than the CGAS (Hanssen-Bauer,
38
Aalen et al., 2007; Hanssen-Bauer, Gowers et al., 2007). Low reliability attenuates the
observed correlations between the measure and other variables.
The current results showed that the WISC-III FISQ and PIQ predicted slightly more of the
variance in the HoNOSCA score than did the VIQ. The analysis of significant discrepancies
in the correlations between the HoNOSCA and the three IQ scores showed no significant
differences. This finding indicates no significant differences in the predictive power of the
FSIQ, PIQ, and VIQ.
The findings showed that parent-rated symptoms predict a considerable part of the variance of
the HoNOSCA score after controlling for age, gender, and IQ. This effect was not found for
the CGAS. Although mental health symptoms in this study did not have an impact on the
CGAS score in the regression analysis, there were small correlations between the CGAS and
the parent-rated SDQ scales in terms of conduct problems, hyperactivity, and prosocial
behaviour. Possible explanations for why these associations were not found in the regression
analysis include an insufficient sample size, resulting in low statistical power, and the finding
that about ¼ of the sample had an IQ below 70. The CGAS has been criticised for not
covering all relevant domains of functioning in children with developmental disabilities
(Wagner et al., 2007). It is possible that the portion of the sample with an IQ under 70 in
paper II primarily has difficulties related to problems that are common among children with
developmental disabilities and that impairment related to psychiatric symptoms is not the
most prominent problem.
The girls were significantly older than the boys, and the boys had more hyperactivity
symptoms than did the girls. These results can be explained by the referral pattern to
Norwegian outpatient CAMHS. National statistics from the Norwegian Directorate of Health
have indicated that among children under the age of 12 years, more boys than girls receive
treatment at CAMHS (Norsk pasientregister, 2014). The opposite pattern has been found in
the 16 – 18 year age group. The national statistics have also indicated that boys are more
frequently referred from primary physicians and the child protective service with
hyperactivity/ADHD-related questions than girls are. Furthermore, boys more often obtain
diagnoses in the ICD-10 category F90 – F98 Behavioural and emotional disorders, with onset
typically occurring in childhood and adolescents, than do girls. Age and gender predicted 5%
of the variance in the HoNOSCA score. For every year increase in age the HoNOSCA score
39
increased. In addition to reflect real age related changes in symptom load, this association
could be explained with the items in the HoNOSCA. The age range of the HoNOSCA is 3-18
years. The HoNOSCA items measuring alcohol, substance/solvent misuse and poor school
attendance, are measuring behaviours that are more likely to be present in the upper age
range, than among preschool children. The b-value of gender was not significant.
The regression model with HoNOSCA as an outcome measure predicted 25% of the variance.
There are several factors that might predict the remaining 75% of unexplained variance. In
paper I, the results indicated that the single rater ICC for HoNOSCA was 0.78. Although this
result indicates good agreement between raters, 22% of the variance in HoNOSCA scores was
explained by variation between raters. It is likely that this result can explain a part of the
unexplained variance in the regression model. In the regression model, the parent SDQ was
used as a measure of mental health symptoms. Study II was conducted in typical outpatient
CAMHS, and clinicians scored the HoNOSCA based on all available clinical information. It
is likely that the clinicians gathered information directly from children, parents, and teachers.
The concordance among parents’, adolescents’ and teachers’ reports of mental health
symptoms in questionnaires has generally been low (Achenbach, McConaughy, & Howell,
1987; Goodman, 2001). It is possible that the children’s and teachers’ reports of symptoms to
the clinicians, information that is not measured in the parent SDQ, explain some of the
unexplained variance in the HoNOSCA score. The HoNOSCA measures symptoms of both
mental health and behaviour disorder. The results of the Bergen Child Study indicated that
family economy and parental education level predicted children’s mental health, as measured
using the teacher, parent and self-report versions of the SDQ (Bøe, Øverland, Lundervold, &
Hysing, 2012). In the current study, information on socio-economic status was not available
to include in the regression model with HoNOSCA as the outcome measure. It is possible that
information on family economy and parental education could have reduced the proportion of
unexplained variance.
IQ as a moderator of clinician-rated outcome in the severity of mental health status
The third aim of the dissertaion was to examine whether IQ moderates changes in symptom
load and general functioning among children and adolescents who are referred to mental
health outpatient clinics. The results indicated that the patients’ symptom loads and general
40

functioning, as measured by the HoNOSCA and CGAS, respectively, improved for the entire
population.
Symptom load showed a decrease from the start of treatment to the six-month follow-up
assessment, and the effect size of this change was moderate. The patients with the highest
initial HoNOSCA scores showed the greatest improvement. This result is consistent with
previous research (Garralda et al., 2000).
The results indicated that PIQ moderated changes in the HoNOSCA from the intake session
to the follow-up assessment, indicating that the improvement slopes for patients with high
PIQ were steeper than those with lower PIQ. There were no gender differences in the
moderating effect of PIQ. FSIQ and VIQ did not moderate the outcome in the HoNOSCA
scores.
General functioning, as measured by the CGAS, improved from the start of treatment to the
six-month follow-up assessment. The effect size of this change was moderate. There was no
significant variance across the participants in the intercept or slope of the change in CGAS
scores across the measurements that were performed at the intake session, the beginning of
treatment, or the six-month follow-up assessment. The results indicated that FSIQ moderated
changes in CGAS scores. This finding implies that the general functioning improvement slope
for patients with high FSIQ was steeper than that for those with lower scores. There were no
gender differences in the moderating effect of FSIQ. PIQ and VIQ did not moderate the
outcome.
In addition to psychometric differences between the HoNOSCA and CGAS scales, distinct
properties of the WISC-III IQ scales may explain the differences in the predictability of
outcomes. In addition to measuring different cognitive abilities, the heritability of the WISC-
III IQ scales is dissimilar. The heritability of the FSIQ, VIQ, and PIQ of early adolescents is
65%, 51%, and 72%, respectively (Von Soelen, 2011). The environment differentially
influences the development of the WISC-III IQ scores. Common environmental influences on
the FSIQ, VIQ, and PIQ of early adolescents are 18%, 26%, and 0%, respectively (Von
Soelen, 2011).
41

Although the CGAS and HoNOSCA measure different aspects of mental health impairment,
there is a large correlation between these measures (Yates et al., 1999). This correlation
indicates that the CGAS and HoNOSCA measure much of the same psychological construct.
In the current study, the different WISC-III IQ scales moderated the outcome in general
functioning and symptom load, as measured with the CGAS and HoNOSCA. This difference
may be explained by the different construction of the HoNOSCA and CGAS. The HoNOSCA
total score is the sum of 13 scales, including one question that is related to scholastic and
language skills, which have a high correlation with IQ (Neisser et al., 1996). In contrast, the
CGAS consists of one scale.
In paper III, the outcomes of patients from three outpatient CAMHS were assessed with the
CGAS and the HoNOSCA. The effect size of the change in mental health status from the start
of treatment to the 6-month follow-up assessment was moderate. This result is on par with the
results of meta-analyses of outcome studies (Casey & Berman, 1985; Kazdin et al., 1990;
Weisz et al., 1987; Weisz et al., 1995). The results of paper III are based on the routine
outcome monitoring of clinicians who work in typical outpatient clinics. In typical practice,
there are no control groups available for the comparison of treatment results. This makes it
challenging to attribute the treatment directly to outcome. When subjects are repeatedly
assessed with the same instrument, extreme scores on the first assessment tend to be followed
by scores that are closer to the mean. This statistical phenomenon is called regression to the
mean (Barnett, van der Pols, & Dobson, 2005). The average initial HoNOSCA and CGAS
score of the participants in study III were in the clinical range. This makes it difficult to rule
out that some of effect size of the outcome could be attributed to regression towards the mean.
When patients are refered to CAMHS there is reason to believe they have experienced that
their mental health problems have reached an intolerable level. It is likely that some patients
seek help from other than their CAMHS health worker in order to cope with the problems. In
a study without a control group it is not possible to rule out that patients help seeking
behaviour may explain partly the outcome.
Mechanisms behind the association between IQ and severity of mental health problems
The results of papers II and III indicate that IQ both predicts and moderates the severity of
mental health problems. The identification of predictors and moderators does not explain the
mechanism behind the relationship between IQ and the severity of children’s mental health
42

problems. In general, the mechanisms that are responsible for the association between low IQ
and the increased risk of mental health disorders are unknown (Koenen et al., 2009). Koenen
and colleagues (2009) proposed four potential mechanisms. Low IQ may (1) be a proxy
measure of neuroanatomical deficits, increasing the vulnerability to some mental health
diseases; (2) reduce the ability to cope with stressful life events; and (3) moderate health-
seeking behaviour and knowledge about mental health problems. Furthermore, (4) there may
be a spurious relation between low IQ and mental health disorders that is explained by, for
example, a common genetic vulnerability. These mechanisms may shed light on the
association between IQ and the severity of mental health problems in children and adolescents
who are referred to CAMHS.
The factors that are associated with individual variation in IQ have been examined using
various approaches. Studies of heritability have indicated that IQ has a high heritability and
that the heritability increases from childhood (30%) to adulthood (80%) (Deary, Penke, &
Johanson, 2010). Neuroimaging techniques have been used to examine the association
between neurobiological factors and individual variation in IQ. In a meta-analysis of the
relationship between Magnetic Resonance Imaging (MRI)-assessed brain volume and IQ, a
moderate association (r = .33) ( McDaniel, 2005) was found. Several studies have examined
whether specific cortical areas correlate with IQ. In a review article, Jung and Haier (2007)
utilised the results of functional and structural imaging studies to propose the parieto-frontal
integration theory of intelligence (P-FIT). According to the P-FIT model, areas in the
dorsolateral prefrontal cortex, the inferior and superior parietal lobes, and the temporal and
occipital lobes are related to individual differences in IQ. This model was evaluated with the
results of brain lesion studies, which were found to correspond with the results of imaging
studies.
The cognitive reserve model (Barnett et al., 2006) postulates that “cognitive reserve” (CR),
operationalised as education, occupational attainment, or IQ, is a proxy measure of brain
reserve capacity (Stern, 2009). In paper II, IQ predicted an additional 6% of the variance in
HoNOSCA scores. Furthermore, in paper III, patients with high PIQ and FSIQ scores
displayed faster improvement in the HoNOSCA and CGAS scores, respectively, than did
patients with lower PIQ and FSIQ scores. Because IQ is associated with brain size
(McDaniel, 2005) and other neuroanatomical and neurophysiological factors (Jung & Haier,
2007), it is possible that the patients with the largest cognitive reserve have a greater capacity
43

to cope with their mental health problems and benefit from the health care that they receive at
outpatient clinics.
Although numerous articles have documented that IQ is a good predictor of a wide range of
skills and outcomes (Neisser et al., 1996), and that individual variation in IQ is associated
with neurobiological factors, we have limited knowledge about what these tests measure. The
g-factor (Jensen, 1998) explains the common variance among different cognitive tests, and IQ
tests have a high g-factor loading. The g-factor may be the best indicator of what IQ tests
measure, and it may be the best answer for the question of why there is an association
between IQ and mental health. It is possible that the g-factor is a resource that provides
patients with different capacities to cope with their mental health problems and to benefit
from the health care that they receive at outpatient clinics.
Reflections on methodological issues
Limitations of the assessment scales
The HoNOSCA and CGAS were used as measures of clinician-rated mental health status in
this dissertaion. These measures have been validated in numerous studies and are widely used
in typical clinical practice. When the results of these measures are interpreted in both research
and clinical practice, it is important to consider their psychometric limitations.
The interpretation of the HoNOSCA and CGAS results in clinical practice and research
without control groups is complicated by the regression towards the mean effect (Barnett et
al., 2005). Because this effect is expected to be strongest for the initial scores at the most
severe end of the scale, individual differences in the improvement scores of patients with
different initial scores can partly be predicted by a statistical phenomenon. If a clinician or a
service detects that the effect size of the improvement of patients with initial moderate mental
health problems is lower than that of patients with severe problems, it is important to evaluate
whether the difference in outcome is a result of the regression towards the mean effect before
questioning the effect of the treatment for patients with moderate mental health problems.
In papers II and III, 22.7% of the sample had an IQ < 70. Neither the HoNOSCA nor the
CGAS have been validated in populations with low IQ. It is possible that the measurement of
other assessment and outcome domains is more relevant for children and adolescents with low
44

IQ than for populations with an IQ within the normal variation. In addition, it is possible that
the sensitivity to detect changes differs in these groups.
The WISC-III. In papers II and III, the WISC-III was used to assess the participants’
cognitive function. The factor structure of the WISC-III has been criticised as being primarily
influenced by David Wechsler’s personal viewpoints and clinical experience. Furthermore, it
has been stated that this factor structure is not in line with the current theoretical models of
cognitive abilities (Kaufmann, Flanegan, Alfonso, & Mascolo, 2006). For instance, the VIQ
and PIQ distinction in the WISC-III was mainly based on clinical tradition (Kaufmann et al.,
2006) rather than a research-based model such as the Catell-Horn-Carrol (CHC) model of
cognitive abilities (Keith & Reynolds, 2010). In the WISC-IV, the VIQ-PIQ distinction was
dropped and replaced with a four-factor structure that corresponds with the CHC model. In
both papers II and III, the WISC-III VIQ and PIQ were included in some of the statistical
models.
The Norwegian WISC-III version was published in 2003 (Assessio Norge AS, 2003). After
the publication of the test, there was a debate in the Norwegian Psychological Association’s
journal Tidsskrift for Norsk Psykologforening concerning the WISC-III norms (Strand, 2005).
Several clinicians experienced that children and adolescents obtained unexpectedly low IQ
scores on the WISC-III. Some of these clinicians suspected that the Swedish norms that were
used in the Norwegian WISC-III version were incorrect. In the BCS study, Lundervold and
Sørensen (2006) used the WISC-III to map cognitive performance in children with ADHD
and included a control group of 113 children from a normal population. The control group’s
mean FSIQ was 93.7 (SD = 15.3), which is lower than expected from the norms. The authors
suggested that the results could be explained by the norms or the selection procedure in the
BCS.
Explanations of some clinicians experience of low WISC-III scores other than errors in the
norms exist. When the Norwegian WISC-III version was published, 25 years had passed since
the Norwegian WISC-R version was published (Undheim, 1978). James Flynn documented
that the IQ in several countries increased over time (Flynn, 2007). He analysed WISC IQ data
in the time period 1947 – 2002 and found that the norms of the WISC subtests included in the
FSIQ, PIQ and VIQ increased by 3, 5 and 2 IQ points per decade, respectively (Flynn, 2007).
Because there were two decades between the publication of the Norwegian WISC-R and
45

WISC-II versions, it is probable that the Flynn effect can explain some of the clinicians’
concerns about the Norwegian WISC-III norms.
The DAWBA. Diagnostic interviews were developed to increase the reliability and validity
of mental health diagnosis (Rettew et al., 2009). The results of paper III indicated that the
intra-rater agreement for the ICD-10 diagnoses with the DAWBA were good. In paper I, all
four clinicians were male health-care professionals with extensive educational and clinical
backgrounds. The similarity between the raters may have affected the agreement. Research on
the raters’ characteristics has yielded mixed results. Hanssen-Bauer, Aalen, et al. (2007) did
not find any clinically significant differences in ICC for the HoNOSCA and CGAS based on
the raters’ professional experience. In contrast, Lundh et al. (2010) found that raters’
characteristics, such as profession, gender, and age, affected the CGAS ratings.
The examination of the validity of the results of diagnostic interviews is challenging. There is
no universal reference or gold standard against which the results can be validated. It is
common to assess the validity by examining the agreement between the diagnosis made from
clinical evaluation and standard diagnostic interviews or by examining the agreement between
the results of different diagnostic interviews.
Several studies have examined the agreement between DAWBA diagnosis and diagnoses in
routine clinical assessment or on the basis of case notes. Goodman, Ford, and Richards (2009)
examined the agreement between the DAWBA and diagnostic assessment based on case notes
in a clinical sample (n = 39). The diagnoses were merged into the categories of hyperkinesis
or ADHD, oppositional or conduct disorders, and emotional disorders. The categories were
rated as absent, possible, or definite. The agreement was examined with Kendall’s tau and
was found to be moderate to good (0.47 – 0.70). Brøndbo et al. (2013) examined the
agreement between routine clinical diagnostic assessment and diagnoses that were assigned
based on information from the DAWBA in a study of 286 patients. The results indicated a fair
agreement (kappa values 0.41 - 0.49) between the two approaches to diagnostic assessment.
A few studies have examined the agreement of diagnoses from the DAWBA with other
diagnostic interviews. Angold et al. (2012) compared the DAWBA with the Diagnostic
Interview for Children (DISC) and the Child and Adolescent Psychiatric Assessment
(CAPA). The participants (N = 646) were randomly assessed using two of the three interviews
46
in counterbalanced order. The kappa analysis indicated poor to fair agreement (0.13 – 0.57)
between the DAWBA and the two other diagnostic interviews. Compared with the CAPA, the
DAWBA generated similar rates of behavioural disorders but fewer cases of emotional
disorders. The DAWBA generated fewer cases of ADHD, oppositional disorders, and anxiety
than did the DISC. In a recent paper from the Bergen Child Study (Posserud et al., 2014),
ADHD diagnoses according to the DAWBA and the Schedule for Affective Disorders and
Schizophrenia for School Aged Children (K-SADS) were compared. The participants (n =
234) in the third phase of the study were assessed with the K-SADS. All participants were
assessed with the DAWBA in the second phase of the study, which was conducted 6 months
to 2 years previously. The agreement between the DAWBA and the K-SADS, as measured
with kappa, was low (0.31). The K-SADS diagnosed 15.6% (n =37) of the participants with
an ADHD diagnosis, whereas the DAWBA diagnosed 6.8% (n = 16) with an ADHD
diagnosis. The two interviews agreed on an ADHD diagnosis for 10 of the children.
Research has indicated a fair to good agreement between the DAWBA and diagnoses
assigned from clinical data. Studies that have examined the agreement between the DAWBA
and other diagnostic interviews have indicated that, in general, the DAWBA generates fewer
diagnoses and has a higher threshold for assigning diagnoses. In the clinical communities, it
is debated whether there is a diagnostic interview that is more valid than the others and can
thus be accepted as the gold standard of mental health disorders. From a philosophy of
science view, it is problematic to acknowledge a specific interview as a gold standard for
other interviews without an objective reference that defines mental health diagnosis. Such an
approach represents a circular definition of mental health disorders, the chosen interview will
become its own gold standard. As long as there is no gold standard, the research on the
validity of diagnostic interviews cannot be used to evaluate whether an interview give the
correct diagnoses of mental health disorders.
Selection bias
The data in this dissertation were collected in typical outpatient clinics, and the patients had to
consent to participate. There is limited information available concerning how many patients
were eligible at the outpatient clinics. Thus, it is difficult to determine whether the sample is
representative. Research on the consequences of non-responders in family studies has
indicated that the results of studies with moderate response rates might be mildly biased
(Vink et al., 2004).
47

The main methodological strength of papers II and III is that they were conducted in typical
outpatient clinics and did not employ low IQ as an exclusion criterion. In mental health
research, most outcome studies have been conducted under controlled experimental
conditions with strict sample control selection (Weisz & Jensen, 1999). This approach limits
the external validity of the results. The methodological strength of this study is also the main
limitation. In paper III, the rate of dropout and missing data was 26.5%. Compared with the
results of a meta-analysis (Wierzbicki & Pekarik, 1993) of 125 studies that revealed a mean
psychotherapy dropout rate of 46.9%, the dropout rate in the current study was low.
Although the dropout rate in the current study was lower than that in most previous studies, it
might have biased the sample due to attrition. Studies that have examined patients who fail to
complete follow-up assessments have indicated that non-completers were initially more
distressed (Stiles et al., 2003) and that patients with the poorest outcome are less likely to
return follow-up questionnaires (Clark, Fairburn, & Wessely, 2008). The analyses of non-
completers in paper III indicated that there were no statistically significant differences at the
intake assessment between patients with and without follow-up data. In a typical outpatient
clinic with an unselected patient population, it is difficult to obtain information about the
reasons for dropout, therapist caseloads, and other potentially relevant factors. This issue
could have been statistically corrected for dropout in paper III if we had collected data on
such factors.
Heterogeneity of the samples
The samples in this dissertation were included without any exclusion criteria. Unscreened
clinical samples are heterogenic on a wide range of variables. These variables may predict,
moderate or mediate the outcome. The results of paper III indicated that IQ moderated
change in general functioning and symptom load. A larger sample would have allowed the
examination of whether these results are valid for different subgroups of the clinical sample.
Use of the HoNOSCA and CGAS as outcome measures in clinical practice
The HoNOSCA and the CGAS are used to evaluate the outcomes of individual patients and as
tools for service-level evaluation. The measures have some methodological limitations. The
consequences of these limitations can be reduced by complementing the outcome measures
with other scales and applying statistical methods to interpret the results.
48

To cover the most important domains in an outcome evaluation, it is necessary to use several
informants and measures (Hunter et al., 1996). This approach was adapted by the Child
Outcomes Research Consortium (CORC). The CORC is a learning collaboration that includes
Scandinavian, Australian and UK CAMHS members (The Child Outcomes Research
Consortium, 2014). The members have agreed on a common protocol for assessment and
outcome measures. In the CORC approach, data are collected from clinicians, parents,
children and teachers. The protocol includes short psychometric scales that cover symptom
level, general function, goal-based outcomes, experience of service, symptom trackers, and
session-by-session measures. The measures are used at the initial assessment and then every
six months until case closure. The CGAS, the HoNOSCA and the parent SDQ are included in
this protocol. The CORC members send their data to the CORC administration and obtain a
report of the analysed data.
The HoNOSCA and CGAS have no norms to guide the interpretation of whether a change in
an individual patient’s scores from the initial assessment to follow-up is clinically significant.
The regression towards the mean effect is expected to account for some of the improvement
of patients with initial scores in the clinical range. In paper I, the results indicated that the
intra-rater reliabilities of the HoNOSCA and the CGAS were good. Although the reliability of
these clinician-rated scales was acceptable, the raters accounted for approximately ¼ of the
variance. Because of these factors, the clinical use of the HoNOSCA and the CGAS in
typical practice is challenging.
The parent SDQ is used in routine outcome monitoring without a control group; however, due
to the above factors, it is difficult to attribute the outcome to the treatment that the patients
have received. Ford, Hutchings, Bywater, Goodman, and Goodman (2009) used longitudinal
epidemiological data from the British Child and Adolescent Mental Health Survey 2004 (n =
7977) to develop an algorithm called the Added Value Score (AVS), which predicts the SDQ
effect size for the difference between a control and the intervention group in a randomised
controlled trial. If the HoNOSCA and the CGAS are used in a large epidemiological study,
similar algorithms can be developed for these instruments.
The reliable change index (RCI) is a statistical approach that can be used to determine
whether an individual patient’s outcome is clinically significant (Evans, Margison, &
49
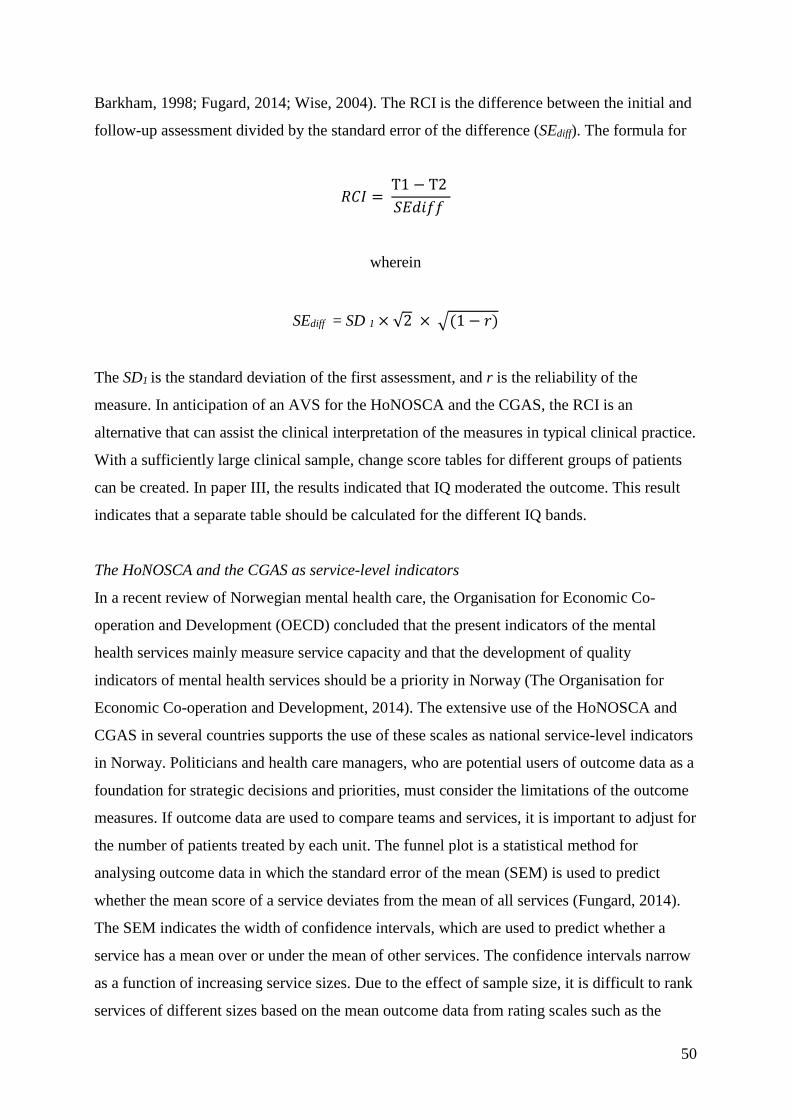
Barkham, 1998; Fugard, 2014; Wise, 2004). The RCI is the difference between the initial and
follow-up assessment divided by the standard error of the difference (SEdiff). The formula for
𝑅𝑅𝑅𝑅𝑅𝑅 = T1 − T2 𝑆𝑆𝑆𝑆𝑑𝑑𝑑𝑑𝑑𝑑𝑑𝑑
wherein
SEdiff = SD 1 × √2 × �(1 − 𝑟𝑟)
The SD1 is the standard deviation of the first assessment, and r is the reliability of the
measure. In anticipation of an AVS for the HoNOSCA and the CGAS, the RCI is an
alternative that can assist the clinical interpretation of the measures in typical clinical practice.
With a sufficiently large clinical sample, change score tables for different groups of patients
can be created. In paper III, the results indicated that IQ moderated the outcome. This result
indicates that a separate table should be calculated for the different IQ bands.
The HoNOSCA and the CGAS as service-level indicators
In a recent review of Norwegian mental health care, the Organisation for Economic Co-
operation and Development (OECD) concluded that the present indicators of the mental
health services mainly measure service capacity and that the development of quality
indicators of mental health services should be a priority in Norway (The Organisation for
Economic Co-operation and Development, 2014). The extensive use of the HoNOSCA and
CGAS in several countries supports the use of these scales as national service-level indicators
in Norway. Politicians and health care managers, who are potential users of outcome data as a
foundation for strategic decisions and priorities, must consider the limitations of the outcome
measures. If outcome data are used to compare teams and services, it is important to adjust for
the number of patients treated by each unit. The funnel plot is a statistical method for
analysing outcome data in which the standard error of the mean (SEM) is used to predict
whether the mean score of a service deviates from the mean of all services (Fungard, 2014).
The SEM indicates the width of confidence intervals, which are used to predict whether a
service has a mean over or under the mean of other services. The confidence intervals narrow
as a function of increasing service sizes. Due to the effect of sample size, it is difficult to rank
services of different sizes based on the mean outcome data from rating scales such as the
50

HoNOSCA and the CGAS. Fugard, Stapely et al. (2014) analysed AVS SDQ outcome data
from 51 UK CAMHS with funnel plots. The results indicated that most services’ mean
outcome data were indistinguishable from the national mean, even if there were substantial
variations in the services’ mean outcome.
Moderators can also complicate the ranking of services. Paper III indicated that IQ moderates
change in general function and symptom load. If the outcome data of services with unequal
proportions of patients with learning disorders are compared, differences in the mean outcome
may be explained by case-mix variance and any variation in the quality of the treatment.
When the outcomes of different services are compared, it is necessary to ensure that only
services with the same patient case-mix are compared.
Clinical implications
A clinical implication of paper I is that a trained, experienced clinician can conduct reliable
ratings of severity, as measured with the HoNOSCA and CGAS, based on the extensive
amount of information that is collected by the DAWBA.
Paper II indicated that IQ-predicted clinician-rated mental health problems (HoNOSCA) may
be important for clinical practice. A high HoNOSCA score indicates that an assessment of
intelligence should be considered in addition to an evaluation of mental health symptoms.
The main clinical implication of paper III is that IQ moderates outcomes, as measured using
the CGAS and HoNOSCA, and that patients with the highest initial HoNOSCA scores show
the greatest improvements. These results are potentially important as background information
when interpreting longitudinal changes in the CGAS and HoNOSCA scores in typical clinical
practice.
Because children and adolescents with low IQ have been systematically excluded from most
outcome studies (MTA Cooperative Group, 1999; The treatment for adolescents with
depression team, 2003; Muratori et al., 2003), there is limited knowledge of whether they
benefit from treatment in outpatient clinics. To ensure that children with low IQs receive
effective help for their mental health problems, it is particularly important to apply systematic
outcome evaluations to this group of children and adolescents to evaluate the effects of
treatment.
51
Recommendations for future research
The CAMHS in Norway are financed by taxes. In Europe, the public is increasingly relying
on private health insurance (Knapp et al., 2007). There is reason to believe that the public’s
willingness to continue financing health care via taxes is influenced by the mental health
services’ ability to yield high-quality care. The Norwegian CAMHS do not have a common
system to measure outcomes and quality of care. Thus, the discipline is vulnerable in the
funding competition in the health care sector. The HoNOSCA and CGAS can be used as
national quality indicators. Politicians and managing directors can utilise the results of quality
indicators in making strategic decision about funding and organisation that may have
substantial consequences for the CAMHS. Service managers and individual clinicians can use
the data of the quality indicators and outcome measures to make decisions that directly
influence the care of individual patients.
The results of this dissertation draw attention to the importance of patients’ cognitive
functioning in the interpretation of outcome data. Future research is needed to identify
additional factors that moderate the outcome in children and adolescents with mental health
disorders in a heterogenic mixed clinical population.
Children and adolescents with learning disorders have a high risk for developing mental
health disorders. In this dissertation, a substantial portion of the population had low IQ scores.
Few studies have examined the validity of the HoNOSCA, CGAS and SDQ in learning
disorder populations. For the quality of care of children and adolescents with comorbid
mental health and learning disorders, clinicians must have access to validated psychometric
instruments. A considerable amount of additional research in this area is needed.
In this dissertation, the WISC-III was used as a measure of cognitive functioning. After the
data collection was completed, the WISC-IV was published. The factor structure of the
WISC-IV differs from that of the WISC-III. It is important to examine the CHC model-based
factor structure of the WISC-IV in future research that examines the predictors and
moderators of mental health problems.
52

Conclusion
This dissertation examined various properties of the HoNOSCA and CGAS in a clinical
population. The findings indicate that clinicians can perform reliable assessments of severity
with the HoNOSCA and CGAS, even when they must select and evaluate information with a
complexity and comprehensiveness similar to clinical practice. The most important findings
are related to IQ as a predictor and moderator of the HoNOSCA and CGAS scores. The
results indicated that IQ predicted clinician-rated mental health problems using the
HoNOSCA, but the same association was not found for the CGAS. IQ also moderated the
outcomes that were measured with the HoNOSCA and CGAS.
The HoNOSCA and CGAS have methodological limitations. However, at present, they are
the best available clinician-rated measures. The effect of the limitations can be reduced with
the use of a multiple informant and measure approach, combined with the application of
appropriate statistical analysis.
53

References
Achenbach, T.M., McConaughy, S.H., & Howell, C.T. (1987). Child/adolescent behavioral
and emotional problems: implications of cross-Informant correlations for situational.
Specificity. Psychological Bulletin, 101, 213 – 232.
American Psychiatric Association. (2000). Diagnostic and statistical manual of mental
disorders (4th ed., text rev.). Washington, DC: Author.
Angold, A., Erkanli, A. Copeland, W., Goodman, R., Fisher, P.W., & Costello, J.E. (2012).
Psychiatric diagnostic interviews for children and adolescents: a comparative study.
Journal of the American Academy of Child & Adolescent Psychiatry, 51, 506-517. doi:
10.1016/j.jaac.2012.02.020
Assessio Norge AS (2003). WISC-III, Norsk versjon, administrasjons veiledning.
Stockholm: Katarina Tryck AB.
Barnett, A.G., van der Pols, J.C., & Dobson, A.J. (2005). Regression to the mean: what it is
and how to deal with it. International Journal of Epidemiology, 34, 215-220.
Barnett, J. H., Salomond, C. H., Jones, P. B., & Sahakian, B. J. (2006). Cognitive
reserve in neuropsychiatry. Psychological Medicine, 36, 1053-1064. doi:
doi:10.1017/S0033291706007501
Baron, R. M. & Kenny, D. A. (1986). The moderator-mediator variable distinction in social
psychological research: Conceptual, strategic, and statistical considerations. Journal of
Personality and Social Psychology, 51, 1173-1182.
Bilenberg, N. (2003). Health of the Nation Outcome Scales for Children and
Adolescents (HoNOSCA): Results of a Danish field trial. European Child &
Adolescent Psychiatry, 12, 298-302. doi: dx.doi.org/10.1007/s00787-003-0343-1
Basco, M.R., Bostic, J.Q., Davies, D., Rush, J., Witte, B. … Barnett, V. (2007). Methods to
improve diagnostic accuracy in a community mental health setting. The American
journal of psychiatry, 157, 1599-1605. doi:10.1176/appi.ajp.157.10.1599
Brann, P., Coleman, G., & Luk, E. (2001). Routine outcome measurement in a child
and adolescent mental health service: An evaluation of HoNOSCA. Australian and
New Zealand Journal of Psychiatry, 35, 370-376. doi: dx.doi.org/10.1046/j.1440-
1614.2001.00890.x
Brøndbo, P.H., Mathiassen, B., Martinussen. M., Handegård, B.H., & Kvernmo, S. (2013).
54

Agreement on diagnoses of mental health problems between an online clinical
assignment and a routine clinical assignment. Journal of Telemedicine and Telecare,
18, 113-119. doi: 10.1258/jtt.2012.120209
Bøe, T., Øverland, S., Lundervold, A.J., & Hysing, M. (2012). Socioeconomic status and
children’s mental health: results from the Bergen Child Study. Social Psychiatry and
Psychiatric Epidemiology, 47, 1557 – 1566.
Carroll, J. B. (1993). Human cognitive abilities: A survey of factor-analytical studies. New
York: Cambridge University Press.
Casey, R.J. & Berman, J.S. (1985). The outcome of psychotherapy with children.
Psychological Bulletin, 98, 388-400. doi: 10.1037/0033-2909.98.2.388
Cicchetti, D.V. & Sparrow, S.A. (1981). Developing criteria for establishing interrater
reliability of specific items: Applications to assessment of adaptive behavior.
American Journal of Mental Deficiency, 86, 127-137.
Clark, D.M., Fairburn, C.G., & Wessely, S. (2008). Psychological treatment outcomes in
routine NHS services: a commentary on Stiles et al. (2007). Psychological Medicine,
38, 629-634.
Cohen, J. W. (1988). Statistical power analysis for the behvioral sciences (2 ed.).
Hillsdale, NJ: Lawrence Erlbaum Associates.
Cohen, P., Cohen, J., Kasen, S., Velez, C. N., Hartmark, C., Johnson, J., . . . Streuning, E. L.
(1993). An epidemiological study of disorders in late childhood and adolescence—I.
Age- and gender specific prevalence. Journal of Child Psychology and Psychiatry, 34,
851–867.
Compton, S. N., Walkup J. T., Albano, A. M., Piacentini, J. C., Birmaher, B., Sherrill, J. T.,
…March, J. S. (2010). Child and Adolescent Psychiatry and Mental Health, 4:1. doi:
10.1186/1753-2000-4-1
Costello, E. J., Egger, H., & Angold, A. (2005). 10-Year research update review:
The epidemiology of child and adolescent psychiatric disorders: I. Methods and public
health burden. Journal of the American Academy of Child and Adolescent Psychiatry,
44, 972-986.
Deary, I. J., Penke, L. & Johnson, W. (2010). The neuroscience of human intelligence
Differences. Nature Reviews Neuroscience, 11, 201-211. doi:10.1038/nrn2793
Dekker, M. C., Koot, H. M., van der Ende, J., & Verhulst, F. C. (2002). Emotional
and behavioral problems in children and adolescents with and without intellectual
disability. Journal of Child Psychology and Psychiatry, 43, 1087-1098.
55

Devlin B., Daniels M., & Roeder K. (1997). The heritability of IQ. Nature, 388, 468-471.
Dykens, E. M. (2000). Annotation: Psychopathology in children with intellectual
disability. Journal of Child Psychology and Psychiatry, 41, 407-417. doi:
10.1111/1469-7610.00626
Einfeld, S. L., Ellis, L. A., & Emerson, E. (2011). Comorbidity of intellectual
disability and mental disorder in children and adolescents: A systematic review.
Journal of Intellectual and Developmental Disability, 36, 137-143. doi:
doi:10.1080/13668250.2011.572548
Einfeld, S. L. & Tonge, B. J. (1996a). Population prevalence of psychopathology in
children and adolescents with intellectual disability: I rationale and methods. Journal
of Intellectual Disability Research, 40, 91-98. doi: 10.1046/j.1365-
2788.1996.767767.x
Einfeld, S. L. & Tonge, B. J. (1996b). Population prevalence of psychopathology in
children and adolescents with intellectual disability: II epidemiological findings.
Journal of Intellectual Disability Research, 40, 99-109. doi: 10.1046/j.1365-
2788.1996.768768.x
Emerson, E. (2007). Poverty and people with intellectual disabilites. Mental Retardation and
Developmental Disabilites Research Reviews, 13, 107-113.
Emerson, E., Einfeld, S., & Stancliffe, R. J. (2010). The mental health of young children with
intellectual disabilities or borderline intellectual functioning. Social Psychiatry and
Psychiatric Epidemiology, 45, 579-587.
Emerson, E., & Hatton, C. (2007a). Contribution of socioeconomic position to health
inequalities of British children and adolescents with intellectual disabilities. American
Journal on Mental Retardation, 112, 140-150.
Emerson, E., & Hatton, C. (2007b). Mental health of children and adolescents with
intellectual disabilities in Britain. British Journal of Psychiatry, 191, 493-499.
Evans, C., Margison, F., & Barkham, M. (1998). The contribution of reliable and clinically
significant change methods to evidence-based mental health. Evidence Based Mental
Health, 1, 70-72.
Flynn, J.R. (2007). What is intelligence? Beyond the Flynn effect. Cambridge: Cambridge
University Press.
Ford, T., Hutchings, J., Bywater, T., Goodman, A., & Goodman, R. (2009). Strengths and
56

Difficulties Questionnaire Added Value Scores: evaluating effectiveness in child
mental health interventions. The British Journal of Psychiatry, 194, 552-558. doi:
10.1192/bjp.bp.108.052373
Foreman, D. M. & Ford, T. (2008). Assessing the diagnostic accuracy of the identification of
hyperkinetic disorders following the introduction of government guidelines in
England. Child and Adolescent Psychiatry and Mental Health, 2. doi:10.1186/1753-
2000-2-32.
Foreman, D. & Marton, S. & Ford, T. (2009). Exploring the clinical utility of the
Development and Well-Being (DAWBA) in the detection of hyperkinetic disorders
and associated diagnoses in clinical practice. Journal of Child Psychology and
Psychiatry, 50, 460-470.
Frigerio, A., Vanzin, L., Pastore, V., Nobile, M., Giorda, R., Marino, C… De Girolamo, G.
(2006). The Italian Preadolescent Mental Health Project (PrISMA): rationale and
methods. International Journal of Methods in Psychiatric Research, 15, 22–35.
doi: 10.1002/mpr.25
Ford, T., Goodman, R., & Meltzer, H. (2003). The British Child and Adolescent
Mental Health Survey 1999: The Prevalence of DSM-IV Disorders. Journal of the
American Academy of Child and Adolescent Psychiatry, 42, 1203-1211.
Fugard, A. (2014). A statistical interlude...understanding uncertainty in mental health
questionnaire data. In Law, D. & Wolpert, M. (editors), Guide to using outcomes and
feedback tools with children, young people and families. Retrieved from
http://www.google.no/url?sa=t&rct=j&q=&esrc=s&frm=1&source=web&cd=4&cad=
rja&uact=8&ved=0CD4QFjAD&url=http%3A%2F%2Fwww.corc.uk.net%2Fwp-
content%2Fuploads%2F2014%2F04%2FGuide-COOP-
Book010414.pdf&ei=40GwU5-3C8ii4gS2woDQDw&usg=AFQjCNGuKGb-
M7icsczMtwG4VUt7AuHHAQ
Fugard, A. J. B., Stapley, E., Ford, T., Law, D., Wolpert, M., & York, A. (2014). Analysing
and reporting UK CAMHS outcomes: an application of funnel plots, submitted.
Retrieved from http://www.andyfugard.info/research
Gale, C. R., Deary, I. J., Boyle, S. H., Barefoot, J., Mortensen, L. H., & Batty, G. D.
(2008). Cognitive ability in early adulthood and risk of specific psychiatric disorders
in middle age: The Vietnam experience study. Archives of General Psychiatry, 65,
1410-1418. doi: 10.1001/archpsyc.65.12.1410
Garralda, E., & Yates, P. (2000). HoNOSCA: Uses and limitations. Child Psychology
57

& Psychiatry Review, 5, 131-132.
Garralda, M. E., Yates, P., & Higginson, I. (2000). Child and adolescent mental health
service use: HoNOSCA as an outcome measure. The British Journal of Psychiatry,
177, 52-58. doi: 10.1192/bjp.177.1.52
Goodman, R. (1997). The Strengths and Difficulties Questionnaire: A research note.
Journal of Child Psychology and Psychiatry, 38, 581-586. doi:
dx.doi.org/10.1111/j.1469-7610.1997.tb01545.x
Goodman, R. (2001). Psychometric Properties of the Strengths and Difficulties
Questionnaire. Journal of the American Academy of Child and Adolescent Psychiatry,
40, 1337 - 1345.
Goodman, R. Ford, T., & Richards, H. (2000). The Development and Well-Being
Assessment: description and initial validation of an integrated assessment of child and
adolescent psychopathology. Journal of Child Psychology and Psychiatry, 41, 645-
655.
Goodman, R., Ford, T., Richards, H., Gatward, R., & Meltzer, H. (2000). The
Development and Well-Being Assessment: Description and initial validation of an
integrated assessment of child and adolescent psychopathology. Journal of Child
Psychology and Psychiatry, 41, 645-655.
Goodman, R., Simonoff, E., & Stevenson, J. (1995). The impact of child IQ, parent
IQ and sibling IQ on child behavioural deviance scores. Journal of Child Psychology
and Psychiatry, 36, 409-425. doi: dx.doi.org/10.1111/j.1469-7610.1995.tb01299.x
Gowers, S., Bailey-Rogers, S.J., Shore, A., & Levine, W. (2003). The Health of the Nation
Outcome Scales for Child & Adolescent Mental Health (HoNOSCA). Child and
Adolescent Mental Health, 2, 50-56. doi: 10.1111/1475-3588.00285
Gowers, S., Harrington, R. C., Whitton, A., Lelliott, P., Beevor, A., Wing, J., &
Jezzard, R. (1999). Brief scale for measuring the outcomes of emotional and
behavioural disorders in children. Health of the Nation Outcome Scales for children
and Adolescents (HoNOSCA). The British journal of psychiatry, 174, 413-416. doi:
10.1192/bjp.174.5.413
Green, B., Shirk, S., Hanze, D., & Wanstrath, J. (1994). The Children's Global
Assessment Scale in clinical practice: An empirical evaluation. Journal of the
American Academy of Child & Adolescent Psychiatry, 33, 1158-1164.
Hanssen-Bauer, K., Gowers, S., Aalen, O. O., Bilenberg, N., Brann, P., Garralda, E., .
58

. . Heyerdahl, S. (2007). Cross-national reliability of clinician-rated outcome measures
in child and adolescent mental health services. Administration and Policy in Mental
Health and Mental Health Services Research, 34, 513-518. doi:
dx.doi.org/10.1007/s10488-007-0135-x
Hanssen-Bauer, K., Aalen, O., Ruud, T., & Heyerdahl, S. (2007). Inter-rater
Reliability of Clinician-rated Outcome Measures in Child and Adolescent Mental
Health Services. Administration and Policy in Mental Health and Mental Health
Services Research, 34, 504-512.
Haworth, C. M. A, Wright, M. J., M Luciano, M., Martin, N. G., de Geus, E. J. C., van
Beijsterveldt, C. E. M., ...Plomin, R. (2010). The heritability of general cognitive
ability increases linearly from childhood to young adulthood. Molecular Psychiatry,
15, 1112-1120. doi:10.1038/mp.2009.55
Heiervang, E., Goodman, A., & Goodman, R. (2008). The Nordic advantage in child
mental health: separating health differences from reporting style in a cross-cultural
comparison of psychopathology. Journal of Child Psychology and Psychiatry, and
Allied Disciplines, 49, 678-685.
Heiervang, E., Stormark, K. M., Lundervold, A. J., Heimann, M., Goodman, R.,
Posserud, M. B., . . . Gillberg, C. (2007). Psychiatric disorders in Norwegian 8- to 10-
year-olds: an epidemiological survey of prevalence, risk factors, and service use.
Journal of the American Academy of Child and Adolescent Psychiatry, 46, 438-447.
Holmbeck, G. N., Greenley, R. N., & Franks, E. A. (2003). Developmental issues and
considerations in research and practice (pp. 28-45). New York, NY: Guilford Press;
US.
Hunter, J., Higginson, I., & Garralda, E. (1996). Systematic literature review: outcome
measures for child and adolescent mental health services. Journal of Public Health,
18, 197-206
Jensen, Arthur, P. (1998). The g factor: the science of mental ability (pp.71 and 91). London:
Praeger Publisher.
Jung & Haier (2007). The parieto-frontal integration theory (p-fit) of intelligence: converging
neuroimaging evidence. Behavioral and Brain Sciences, 30, 135 – 154.
Kaufmann, A.S., Flanegan, D.P., Alfonso, C.V., & Mascolo, J.T. (2006). Review of Wechsler
Intelligence Scale for Children, fourth edition (WISC-IV). Journal of
Psychoeducational Assessment, 24, 278-295. doi: 10.1177/0734282906288389
59

Kazak, A.E., Hoagwood, K., Weisz, J. R., Hood, K., Kratochwill, T.R., Vargas, L.A., &
Banez, G.A. (2010). A meta-systems approach to evidence-based practice for children
and adolescents. American Psychologist, 65, 85-97. doi: 10.1037/a0017784
Kazdin, A. E. (2005). Evidence-based assessment for children and adolescents:
issues in measurement development and clinical pplication. Journal of Clinical Child
& Adolescent Psychology, 34, 548-558. doi: 10.1207/s15374424jccp3403_10
Kazdin, A.E., Bass, D., Ayers, W.A., & Rodgers, A. (1990). Empirical and clinical focus of
child and adolescent psychotherapy research. Journal of Consulting and Clinical
Psychology, 58, 729-740. doi: 10.1037/0022-006X.58.6.729
Kazdin, A. E. & Crowley, M. J. (1997). Moderators of treatment outcome in cognitively
based treatment of antisocial children. Cognitive Therapy and Research, 21, 185-207.
doi: dx.doi.org/10.1023/A:1021832729480
Keith, T.A. & Reynolds, M.R. (2010). Cattell–Horn–Carroll abilities and cognitive tests:
What we've learned from 20 years of research. Psychology in the Schools, 47, 635-
650. doi: 10.1002/pits.20496
Kessler, R. C., Berglund, P., Demler, O., Jin, R., Merikangas, K. R., & Walters, E. E.
(2005). Lifetime prevalence and age-of-onset distributions of DSM-IV disorders in the
national comorbidity survey replication. Archives of General Psychiatry, 62, 593-602.
doi: 10.1001/archpsyc.62.6.593
Knapp, M., McDaid, D., Amaddeo, F., Constantopoulos, A., Oliveira, M.D., ... The Mheen
Group (2007). Financing mental health care in Europe. Journal of Mental Health, 16,
167-180.
Koenen, K. C., Moffit, T. E., Poulton, R., Martin, J., & Caspi, A. (2007). Early
childhood factors associated with the development of post-traumatic stress disorder:
results from a longitudinal birth cohort. Psychological Medicine, 37, 181-192. doi:
10.1017/S0033291706009019
Koenen, K. C., Moffitt, T. E., Roberts, A. L., Martin, L. T., Kubzansky, L.,
Harrington, H., . . . Caspi, A. (2009). Childhood IQ and adult mental disorders: A test
of the cognitive reserve hypothesis. The American Journal of Psychiatry, 166, 50-57.
Lavigne, J. V., LeBailly, S. A., Gouze, K. R., Cicchetti, C., Jessup, B. W., Arend, R., . . .
Binns, H. J. (2008). Predictor and moderator effects in the treatment of oppositional
defiant disorder in pediatric primary care. Journal of Pediatric Psychology, 33, 462-
472.
Leeflang M.M., Deeks J.J., Gatsonis C., & Bossuyt P.M. (2008). Accuracy Working Group.
60

Systematic reviews of diagnostic test accuracy. Annals of Internal Medicine, 149, 889-
897.
Linna, S., Moilanen, I., Ebeling, H., Piha, J., Kumpulainen, K., Tamminen, T., &
Almqvist, F. (1999). Psychiatric symptoms in children with intellectual disability.
European Child & Adolescent Psychiatry, 8, 77-82. doi: 10.1007/pl00010704
Lundervold, A.J. & Sørensen, L. (2008). Kognitiv funksjon hos barn med ADHD,
eksemplifisert med WISC-III resultater. Tidsskrift for Norsk Psykologforening, 45,
1143-1148.
Lundh, A., Kowalski, J., Sundberg, C. J., Gumpert, C., & Landèn, M. (2010).
Children's Global Assessment Scale (CGAS) in a naturalistic clinical setting: Inter-
rater reliability and comparison with expert ratings. Psychiatry Research, 177, 206-
210. doi: 10.1016/j.psychres.2010.02.006
Macklin, M. L., Metzger, L. J., Litz, B. T., Mcnally, R. J., Lasko, N. B., Orr, S. P., &
Pitmann, R. K. (1998). Lower precombat intelligence is a risk factor for posttraumatic
stress disorder. Journal of Consulting and Clinical Psychology, 66, 323-326.
McDaniel, M. A. (2005). Big-brained people are smarter: A meta-analysis of the
relationship between in vivo brain volume and intelligence. Intelligence, 33, 337-346.
doi: 10.1016/j.intell.2004.11.005
McGraw K.O. (1996). Forming inferences about some intraclass correlation
coefficients. Psychological Methods, 1, 30-46.
Meltzer, H., Gatward, R., Goodman, R., & Ford, T. (2003). Mental health of children
and adolescents in Great Britain. International Review of Psychiatry, 15, 185-187. doi:
doi:10.1080/0954026021000046155
Molteno, G., Molteno, C. D., Finchilescu, G., & Dawes, A. R. L. (2001). Behavioural
and emotional problems in children with intellectual disability attending special
schools in Cape Town, South Africa. Journal of Intellectual Disability Research, 45,
515-520. doi: 10.1046/j.1365-2788.2001.00368.x
MTA Cooperative Group (1999). 14-month randomized clinical trial of treatment strategies
for attention deficit hyperactivity disorder. Archives of General Psychiatry, 56, 1073–
1086.
Muratori, F., Picchi, L., Bruni, G., Patarnello, M., & Romagnoli, G. (2003). A two-year
follow-up of psychodynamic psychotherapy for internalizing disorders in children.
Journal of the American Academy of Child & Adolescent Psychiatry, 42, 331-339.
Neisser, U., Boodoo, G., Bouchard, T. J., Jr., Boykin, A. W., Brody, N., Ceci, S. J., . .
61
. Urbina, S. (1996). Intelligence: Knowns and unknowns. American Psychologist, 51,
77-101. doi: 10.1037/0003-066x.51.2.77
Norsk pasientregister (2014). Aktivitetsdata for psykisk helsevern for barn og unge 2013.
Retrieved from http://www.helsedirektoratet.no/publikasjoner/aktivitetsdata-for-
psykisk-helsevern-for-barn-og-unge-2013/Publikasjoner/is-2173-bup-rapport-2013.pd
Norusis, M. J. (2004). SPSS 13.0 Advanced Statistical Procedures Companion.
By: Prentice Hall, Inc.
Obel, C., Heiervang, E., Rodriguez, A., Heyerdahl, S., Smedje, H., Sourander, A., . . .
Olsen, J. (2004). The Strengths and Difficulties Questionnaire in the Nordic countries.
European Child & Adolescent Psychiatry, 13, 32-39. doi: dx.doi.org/10.1007/s00787-
004-2006-2
Owens, E. B., Hinshaw, S. P., Kraemer, H. C., Arnold, L., Abikoff, H. B., Cantwell, D. P., . . .
Wigal, T. (2003). Which treatment for whom for ADHD? Moderators of treatment
response in the MTA. Journal of Consulting and Clinical Psychology, 71, 540-552.
Pies, R. (2007). How “objective” are psychiatric diagnoses? (guess again). Psychiatry
(Edgmont). 4, 18–22.
Pirkis, J. E., Burgess, P. M., Kirk, P. K., Dodson, S., Coombs, T. J., & Williamson,
M. K. (2005). A review of the psychometric properties of the Health of the Nation
Outcome Scales (HoNOS) family of measures. Health & Quality of Life Outcomes, 3:
76.
Plomin, R., DeFries, J.C., McClearn, G.E. & Rutter, M. (1997). Behavioral genetics, third
edition. New York: W.H. Freeman and Company.
Pogge, D. L., Insalaco, B., Bertisch, H., Bilginer, L., Stokes, J., Cornblatt, B. A., &
Harvey, P. D. (2008). Six-year outcomes in first admission adolescent inpatients:
Clinical and cognitive characteristics at admission as predictors. Psychiatry Research,
160, 47-54.
Posserud,M-J., Ullebø, A.K., Plessen, K.J., Stormark, K.M., Gillberg, C., & Lundervold, A.J.
(2014). Influence of assessment instrument on ADHD diagnosis. European Child &
Adolescent Psychiatry, 23, 197-205. doi: 10.1007/s00787-013-0442-6
Prince, M., Patel, V. Saxena, Maj, S. O., Maselko, J., Phillips, M.R., & Rahman, A (2007).
No health without mental health. The Lancet, 370, 859-877.
http://dx.doi.org/10.1016/S0140-6736(07)61238-0.
Rettew, D.C., Alicia D.L., Achenbach, T.M., Dumenci, L., & Ivanova1, M.Y.
62

(2009). Meta-analyses of agreement between diagnoses made from clinical
evaluations and standardized diagnostic interviews. International Journal of Methods
in Psychiatric Research, 18, 169 – 184. doi: 10.1002/mpr.289
Rey, J. M., Starling, J., Wever, C., Dossetor, D. R., & Plapp, J. M. (1995). Inter-rater
reliability of global assessment of functioning in a clinical setting. Journal of Child
Psychology and Psychiatry, 36, 787-792. doi: dx.doi.org/10.1111/j.1469-
7610.1995.tb01329.x
Roberts, M.C., Reed, G.M., Medina-Mora, M.E., Keeley, J.W., Sharan, P., … Saxena, S.
(2012). A global clinicians’ map of mental disorders to improve ICD-11: Analysing
meta-structure to enhance clinical utility. International Review of Psychiatry, 24, 578-
590. doi:10.3109/09540261.2012.736368
Rutter, M., Bishop, D., Pine, D., Scott, S., Stevenson, J. S., Taylor, E. A., & Thapar, A.
(2011). Rutter's child and adolescent psychiatry. By: Wiley-Blackwell
Rutter, M., Tizard, J., & Whitmore, K. (1970). Education, health and behaviour.
London: UK: Longman.
Schorre, B. E. H., & Vandvik, I. H. (2004). Global assessment of psychosocial
functioning in child and adolescent psychiatry: A review of three unidimensional
scales (CGAS, GAP, GAPD). European Child & Adolescent Psychiatry, 13, 273-286.
Shaffer, D., Gould, M. S., Brasic, J., Ambrosini, P., Fisher, P., Bird, H., & Aluwahlia,
S. (1983). A children's global assessment scale (CGAS). Archives of General
Psychiatry, 40, 1228-1231.
Shrout, P. E. (1998). Measurement reliability and agreement in psychiatry.
Statistical Methods in Medical Research, 7, 301-17.
Shrout, P. E. & Fleiss, J. L. (1979). Intraclass correlations: uses in assessing rater
reliability. Psychological Bulletin, 86, 420-428.
Sonnander, S., Ramund, B., & Smedler, A-C. (1998). WISC-III : Svensk versjon.
Stockholm: Psykologiförlaget AB.
Sparrow, S. S., Cicchetti, D. V., & Balla, D. A. (2005). Vineland Adaptive Behavior Scales,
Survey Forms Manual (2nd ed.). Livonian, MN: Pearson Assessments
Stern, Y. (2009). Cognitive reserve. Neuropsychologia, 47, 2015-2028.
Stiles, W.B., Leach, C., Barkham, M., Lucock, M., Iveson, S., ...
Hardy, G.E. (2003). Early sudden gains in psychotherapy under routine clinic
conditions: Practice-based evidence. Journal of Consulting and Clinical Psychology,
71, 14-21. doi: 10.1037/0022-006X.71.1.14
63

Strand, N. (2005). WISC-III skaper uro. Tidsskrift for Norsk Psykologforening, 42, 519-522.
Stromme, P., & Diseth, T. H. (2000). Prevalence of psychiatric diagnoses in children
with mental retardation: Data from a population-based study. Developmental Medicine
& Child Neurology, 42, 266-270.
The Child Outcomes Research Consortium, (2014). Retrieved from http://www.corc.uk.net/
The Organisation for Economic Co-operation and Development (2014). OECD reviews of
health care quality: Norway 2014. Retrieved from http://www.oecd-
ilibrary.org/social-issues-migration-health/oecd-reviews-of-health-care-quality-
norway-2014_9789264208469-en
The treatment for adolescents with depression team, (2003). Treatment for adolescents with
depression study (TADS): rationale, design, and methods. Journal of the American
Academy of Child & Adolescent Psychiatry, 42, 531-542.
Tiet, Q. Q., Bird, H. R., Davies, M., Hoven, C., Cohen, P., Jensen, P. S., & Goodman,
S. (1998). Adverse life events and resilience. Journal of the American Academy of
Child and Adolescent Psychiatry, 37, 1191-1200.
Tiet, Q. Q., Bird, H. R., Hoven, C. W., Moore, R., Wu, P., Wicks, J., . . . Cohen, P.
(2001). Relationship between specific adverse life events and psychiatric disorders.
Journal of Abnormal Child Psychology, 29, 153-164. doi: 10.1023/a:1005288130494
Undheim, J.O. (1978). WISC-R manual. Norwegian norms. Norsk Psykologforening..
Vink, J.M., Willemsen, G., Stubbe, J.H., Middeldorp, C.M.,Rozemarijn S.L., …
Boomsma, D.I. (2004). estimating non-response bias in family studies: application to
mental health and lifestyle. European Journal of Epidemiology, 19, 623-630.
Von Soelen, I. L., Brouwer, R.M., van Leeuwen, M., Khan, R.S., Hulshoff Pol, H.E, &
Boomsma, D.I. (2011). Heritability of verbal and performance intellegence in a
pediatric longitudinal sample. Twin Research and Human Genetics, 14, 119-128. doi:
doi:10.1375/twin.14.2.119
Wagner, A., Lecavalier, L., Arnold, L. E., Aman, M. G., Scahill, L., Stigler, K. A., . . .
Vitiello, B. (2007). Developmental disabilities modification of the Children’s Global
Assessment Scale. Biological Psychiatry, 61, 504–511.
doi:10.1016/j.biopsych.2007.01.001
Wechsler, D. (1992). Wechsler Intelligence Scale for Childern - Third Edition.
London: The Psychological Corporation.
Weissman, M. M., Warner, V., & Fendrich, M. (1990). Applying impairment criteria
64
to children's psychiatric diagnosis. Journal of the American Academy of Child &
Adolescent Psychiatry, 29, 789-795.
Weisz J. R. & Jensen P. S. (1999). Efficacy and Effectiveness of Child and Adolescent
Psychotherapy and Pharmacotherapy. Mental Health Services Research, 3, 125-157.
doi:10.1023/A:1022321812352.
Weisz, J.R., Weiss, B., Alicke, M.D., & Klotz, M.L. (1987). Effectiveness of
psychotherapy with children and adolescents: A meta-analysis for clinicians. Journal
of Consulting and Clinical Psychology, 55, 542-549. doi: 10.1037/0022-
006X.55.4.542
Weisz, J.R., Jensen-Doss, A., & Hawley, K.M. (2006). Evidence-based youth
psychotherapies versus usual clinical care: A meta-analysis of direct comparisons.
American Psychologist, 61, 671-689. doi: 10.1037/0003-066X.61.7.671
Weisz, J.R., Weiss, B., Han, S.S., Granger, D.A., & Morton, T. (1995).
Effects of psychotherapy with children and adolescents revisited: A meta-analysis of
treatment outcome studies. Psychological Bulletin, 117, 450-468. doi: 10.1037/0033-
2909.117.3.450
WHO (1993). The ICD-10 classification of mental and behavioural disorders: diagnostic
criteria for research. Geneva: WHO.
Wierzbicki, M., & Pekarik, G. (1993). A meta-analysis of psychotherapy dropout.
Professional Psychology: Research and Practice, 24, 190–195.
doi:10.1037/0735-7028.24.2.190.
Williams, J.W., Noël P., Cordes, J.A., Ramirez G., & Pignone M. (2002). Is this patient
clinically depressed?. The journal of the American medical association, 287, 1160-
1170. doi:10.1001/jama.287.9.1160.
Wise, E.A. (2004). Methods for analyzing psychotherapy outcomes: a review of clinical
significance, reliable change, and recommendations for future directions. Journal of
Personality Assessment, 82, 50-59.
Wolpert, M., Fonagy, P., Fredrickson, N., Day, C., Rutter, M., Humphery. N., ... Brown., J.
(2008). Review and recommendations for national policy for England for the use of
mental health outcome measures with children and young people (Tender No:
2008/056). Retrieved from The Evidence Based Practice Unit, University College
London website:
http://www.ucl.ac.uk/ebpu/docs/publication_files/outcome_review_report31
Wolpert. M., Ford, T., Trustam, E., Law, D., Deighton, J., Flannery, H., & R.J.B., Fugard
65
(2012). Patient-reported outcomes in child and adolescent mental health services
(CAMHS): Use of idiographic and standardized measures. Journal of Mental Health,
21, 165-173. doi=10.3109%2F09638237.2012.664304
Yates, P., Garralda, M., & Higginson, I. (1999). Paddington Complexity Scale and
Health of the Nation Outcome Scales for children and adolescents. British Journal of
Psychiatry, 174, 417-423.
Youthinmind (2011). DAWBA information for researchers and clinicians
about the Development and Well-Being Assessment. Retrieved November 17, 2011,
from http://www.dawba.info
Zammit, S., Allebeck, P., David, A. S., Dalman, C., Hemmingsson, T., Lundberg, I.,
& Lewis, G. (2004). A longitudinal study of premorbid IQ score and risk of
developing schizophrenia, bipolar disorder, severe depression, and other nonaffective
psychoses. Archives of General Psychiatry, 61, 354-360.
66