faculty of economics and business market hypothesis evidence from...thank you very much, dad, mum,...
TRANSCRIPT
EFFICIENT MARKET HYPOTHESIS: EVIDENCE FROM
ASEAN-5 COUNTRIES
Wong Yeong Der
Bachelor of Finance (Honours)
2011
Faculty of Economics and Business
UN
IVE
RS
IT
IMALAYSIA
SA
RA
WA
K
U N I M AS
Faculty of Economics and Business
EFFICIENT MARKET HYPOTHESIS: EVIDENCE FROM ASEAN-5
COUNTRIES
WONG YEONG DER
This project is submitted in partial fulfillment of
the requirements for the degree of Bachelor of Finance (Honours)
Faculty of Economics and Business
UNIVERSITI MALAYSIA SARAWAK
2011

STATEMENT OF ORIGINALITY
The work described in this Final Year Project, entitled
“Efficient Market Hypothesis: Evidence from ASEAN-5 Countries”
is to the best of the author’s knowledge that of the author except
where due reference is made.
_______________________ _______________________
Date Wong Yeong Der
22659
ABSTRACT
EFFICIENT MARKET HYPOTHESIS: EVIDENCE FROM
ASEAN-5 COUNTRIES
By
Wong Yeong Der
This study applies a number of univariate unit root tests (conventional unit root tests
and Lagrange Multiplier (LM) unit root test with two breaks) for time series data to
determine the efficient market hypothesis (EMH) in five ASEAN countries which
consists of Indonesia, Malaysia, Philippines, Thailand and Singapore. The daily
closing price spanning from January 2, 1997 until December 31, 2010 for each of the
countries is utilized the stationarity tests. The study found that both the conventional
unit root tests and LM unit root test with two breaks failed to reject the random walk
hypothesis. This implies all the tested stock markets are non-stationary and efficient
under weak form hypothesis. On the other hand, the break dates detected
endogenously under LM unit root test occur around the actual market crash date.
ABSTRAK
HIPOTESIS PASARAN CEKAP: BUKTI DARI NEGARA
ASEAN-5
Oleh
Wong Yeong Der
Tujuan kajian ini adalah untuk menguji kepegunan pasaran saham bagi lima negara
dalam ASEAN-5 iaitu Indonesia, Malaysia, Filipina, Thailand and Singapura dengan
menggunakan beberapa ujian kepengunan univariat (ujian kepegunan konvensional
dan ujian kepegunan Lagrange Multiplier (LM) dengan dua tarikh berpecahan) untuk
menentu hipotesis pasaran cekap (EMH) bagi pasaran saham tersebut. Harga tutup
harian mula dari Januari 2, 1007 hingga Disember 31, 2010 diambil bagi kelima-lima
pasaran saham untuk pengujian kepegunaan pasaran saham. Keputusan kajian ini
mendapati bahawa semua ujian kepegunan gagal untuk menolak hipotesis pergerakan
rawak (random walk hypothesis). Dengan ini, kesemua pasaran saham menunjukkan
ketidakpegunan dan cekap dalam hipotesis bentuk lemah. Selain daripada itu, ujian
kepegunan LM menunjukkan tarikh berpecahan adalah belaku berdekatan pada tarikh
pasaran jatuh yang sebenar.

ACKNOWLEDGEMENT
Thousands words of “Thank you very much” to those who helped me upon my
completion of this thesis. First of all, I would undoubtedly like to send my best
gratitude to my supervisor who had been so patient to guide me throughout the whole
thesis starts from the beginning until the end of the last word. His effort of guidance
and helpfulness is very much appreciated.
Next, from deeply of my heart I would like to say thanks to all the staffs and
the lecturer from Faculty of Economics and Business who assisted me while I was in
trouble during the process of thesis completion. Their support pushed me along the
tough road and to the end of the long journey.
Without forgetting, to all my friends, thank you. They are also part of the great
support who deserved to receive my thankfulness. They were willing to sacrifice their
precious time to lend me a hand in providing me a lot of useful information and lead
me through the whole process.
Last but not least, thank you to my family members. I felt really grateful to
have such supportive family in every aspect. Their sincerity of guidance and advice
for me throughout my whole life had successfully lead me went through every harsh
time and no exception for this time too. Thank you very much, dad, mum, bro, and sis.
Before I end this session, I would like to send an infinite thankfulness to all of
you who made success of my thesis. Thank you.
vii
TABLE OF CONTENTS
Pages
LIST OF TABLES x
LIST OF FIGURES xi
CHAPTER ONE: INTRODUCTION
1.0 Introduction 1
1.1 The Historical Development of EMH 2
1.2 Background of ASEAN-5 Stock Markets 8
1.2.1 Bursa Malaysia (KLSE) 8
1.2.2 Jakarta Stock Exchange (JSX) 10
1.2.3 Philippine Stock Exchange (PSE) 11
1.2.4 Singapore Stock Exchange (SGX) 12
1.2.5 Stock Exchange of Thailand (SET) 13
1.3 Problem Statement 14
1.4 Objective of Study 18
1.4.1 General Objective 18
1.4.2 Specific Objective 18
1.5 Significant of the Study 19
1.6 Scope of the Study 21
CHAPTER TWO: LITERATURE REVIEW
2.0 Introduction 22
2.1 Reviews on Unit Root Test 22
viii
2.2 Reviews on Variance Ratio Test 31
2.3 Reviews on Cointegration Test 37
2.4 Reviews on TAR Model 38
2.5 Reviews on other Tests 39
CHAPTER THREE: METHODOLOGY
3.0 Introduction 48
3.1 Stock Market Prediction Theories 49
3.1.1 Efficient Market Hypothesis Model 49
3.1.1.1 Weak Form Efficiency 50
3.1.1.2 Semi Strong Form Efficiency 50
3.1.1.3 Strong Form Efficiency 51
3.1.2 Random Walk Hypothesis 52
3.2 Univariate Unit Root Tests 54
3.2.1 Augmented Dickey-Fuller (ADF) Test 54
3.2.2 Phillips-Perron (PP, 1988) Test 55
3.2.3 Kwiatkowski-Phillips-Schmidt-Shin (KPSS) Test 56
3.2.4 Lagrange Multiplier (LM) Test 57
CHAPTER FOUR: RESULT AND DISCUSSION
4.0 Introduction 60
4.1 Data Description 60
4.2 Univariate Unit Root Tests Results 61
4.3 Lagrange Multiplier Unit Root with Two Structural Breaks 63

ix
CHAPTER FIVE: CONCLUSION
5.0 Introduction 69
5.1 Concluding Remarks 70
5.2 Policy Implication 71
5.3 Limitation of the Study 74
REFERENCES 76
x
LIST OF TABLES
Pages
Table 2.1 Reviews on Unit Root Test 26
Table 2.2 Reviews on Variance Ratio Test 33
Table 2.3 Reviews on Cointegration Test 37
Table 2.4 Reviews on TAR Model 38
Table 2.5 Reviews on other Tests 42
Table 4.1 Univariate Unit Root Tests Results 62
Table 4.2 LM unit root test with two breaks in intercept for Asian-5
Countries Stock Price Indices Based on Model AA 63
Table 4.3 LM unit root test with two breaks in intercept for Asian-5
Countries Stock Price Indices Based on Model CC 65

xi
LIST OF FIGURES
Pages
Figure 1.1 Market Reaction to A Unanticipated Favorable Event 4
Figure 1.2 Market Reaction to an Anticipated Favorable Event 5
Figure 3.1 Efficient Market Hypothesis Model 52
Figure 4.1 Real Stock Price Indices in ASEAN-5 Countries 66
1
CHAPTER ONE
INTRODUCTION
1.0 Introduction
For several decades the prediction of future stock price through the past
behavior of the securities price was being argued until this modern age and still in the
debate. The early paper in 1965 conducted by Eugene F. Fama on this issue had tested
on the behavior of stock market. He claimed the future tend to repeat the past pattern
of the securities market.
The origin of Efficient Market Hypothesis (EMH) can be traced back through
the work of Fama and Paul A. Samuelson during 1960s. Both of the researchers
developed the EMH in different agenda. Samuelson (1965) argued that the change in
price must be unforeknowable when the efficient market is achieved. In his paper,
Fama (1965) had done the earlier study of serial correlations in daily price changes of
30 stocks that comprise the Dow Jones Industrial Average index. The study was
examined on the behavior of stock market prices. He claimed that there is extreme
low positive correlation in daily changes which approaching zero for the practical
purposes.
2
1.1 The Historical Development of EMH
Based on the historical review of the efficient market hypothesis by Sewell
(2008), there are people discussed about efficient market far early before both of the
researchers mentioned above. The efficient markets were clearly pointed up in the
book, „The Stock Markets of London, Paris and New York‟ by George Gibson in late
1880‟s. Gibson gave the statement as „shares become publicly known in an open
market, the value which they acquire may be regarded as the judgment of the best
intelligence concerning them‟ (Gibson, 1889, as cited in Sewell 2008).
Sewell also cited that, in year 1905, the term random walk was introduced by
Karl Pearson, a professor and Fellow of the Royal Society. The efficient market and
random walk is widely discussed since then. In year 1923, Keynes obviously claimed
that EMH effect caused the investors to earn more profits is not because of knowing
better the future market, but rather for risk bearing in the financial market. Another
economist (as cited in Sewell 2008), Frederick MacCauley found that a fluctuation in
stock market was similar with a chance curve which obtained by throwing a dice
(MacCauley, 1925). Cowless (1933) carried a study on the performance of investment
professionals and found that the forecasters were unable to predict stock market.
Amongst all the arguments on the issue of future price prediction that were published
before 1960, only Cowles and Jones (1937) found significant inefficiencies based on
the significant evidence of serial correlation in averaged time series indices of stock
prices. In year 1944, after the year 1933 publication, Cowles explained that
investment professions still cannot predict the future trend of market. According to
Friedman (1953), EMH can be achieved even in the situations where trading

3
strategies of investors are correlated due to arbitrage. Another finding done by
Cootner (1962) said that stock market do not follow random walk. Based on the
spectral analysis performed on market prices one year later, Granger and Morgenstern
(1963) concluded the short-run and long-run movements of the data series shown
contrast result where the former was said to obey the simple random walk hypothesis.
The „business cycles‟ found to be not significant in this aspect (as cited in Sewell
2008).
In 1965, Fama‟s first discussion on efficient market which is famous among
the literature defined an efficient market as:
A market where there are large numbers of rational profit maximizers actively
competing, with each trying to predict future market values of individual
securities, and where important current information is almost freely available
to all participants.
This description is very similar to the microeconomic concept on perfectly
competitive market. In such competitive market, no investor would be able to earn
abnormal profit. If this assumption is true in the stock market, any new information
come to available in the market would reflect in the stock price very quickly.
Fama propounded that there are three levels of efficient market, namely the
weak, semi-strong, and strong form market efficiency. The weak form of efficiency
suggested that the information of security prices is fully reflected in the past price. In
the semi-strong form, the price is adjusted according to the all public information. All
4
information including the private information in the strong form is fully reflected in
the stock price. The efficiency market shows there is no investor would be able to
earn abnormal profit based on information set when the market is efficient for that
particular information set. Abnormal profits refer to the gain from a naive buy-and-
hold strategy. Based on the EMH argument, there is no investor able to consistently
make profit by trading only through naïve buy-and-hold strategy.
Years after the Fama‟s studies, it came to the market efficiency test with the
present of the “event study” methodology. In the new study, researchers take the
event that occurred in different company and during different period into account. The
involvement of the event was to see how it impacts the stock price.
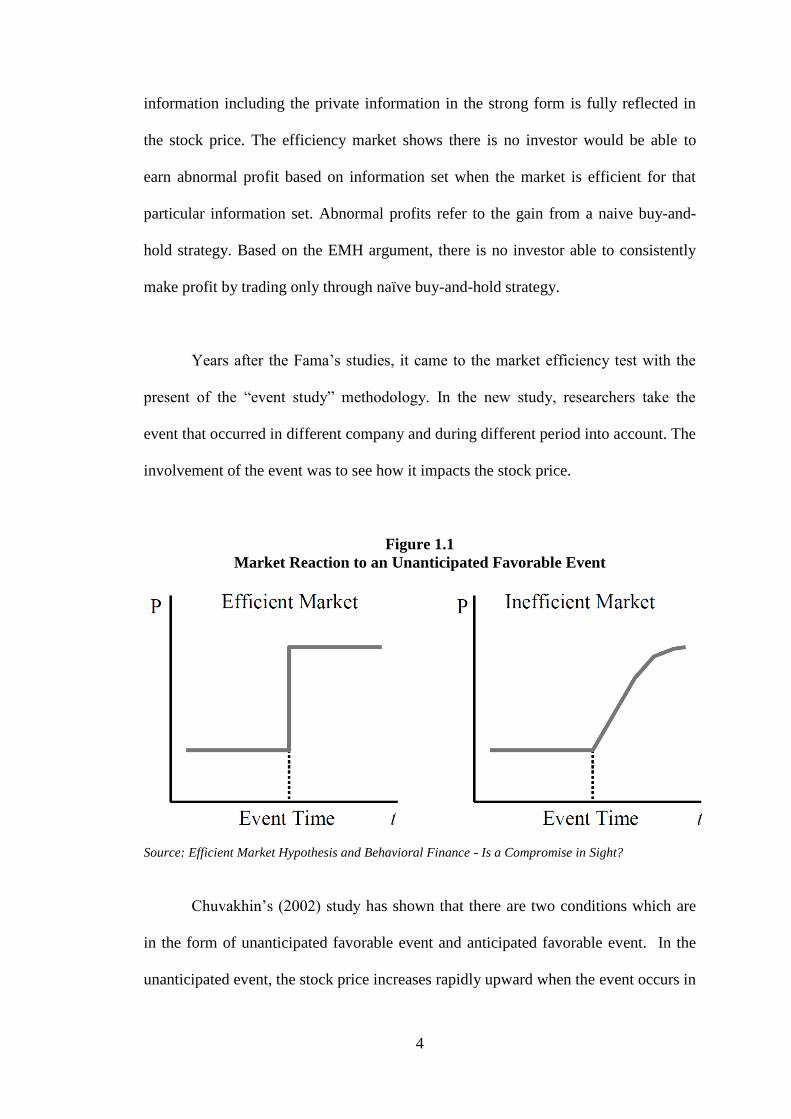
Figure 1.1
Market Reaction to an Unanticipated Favorable Event
Source: Efficient Market Hypothesis and Behavioral Finance - Is a Compromise in Sight?
Chuvakhin‟s (2002) study has shown that there are two conditions which are
in the form of unanticipated favorable event and anticipated favorable event. In the
unanticipated event, the stock price increases rapidly upward when the event occurs in
5
efficient market and subsequently achieve constant price. Oppositely, in the
inefficient market, the stock price would take some time to achieve the same price
with the efficient market after the event.
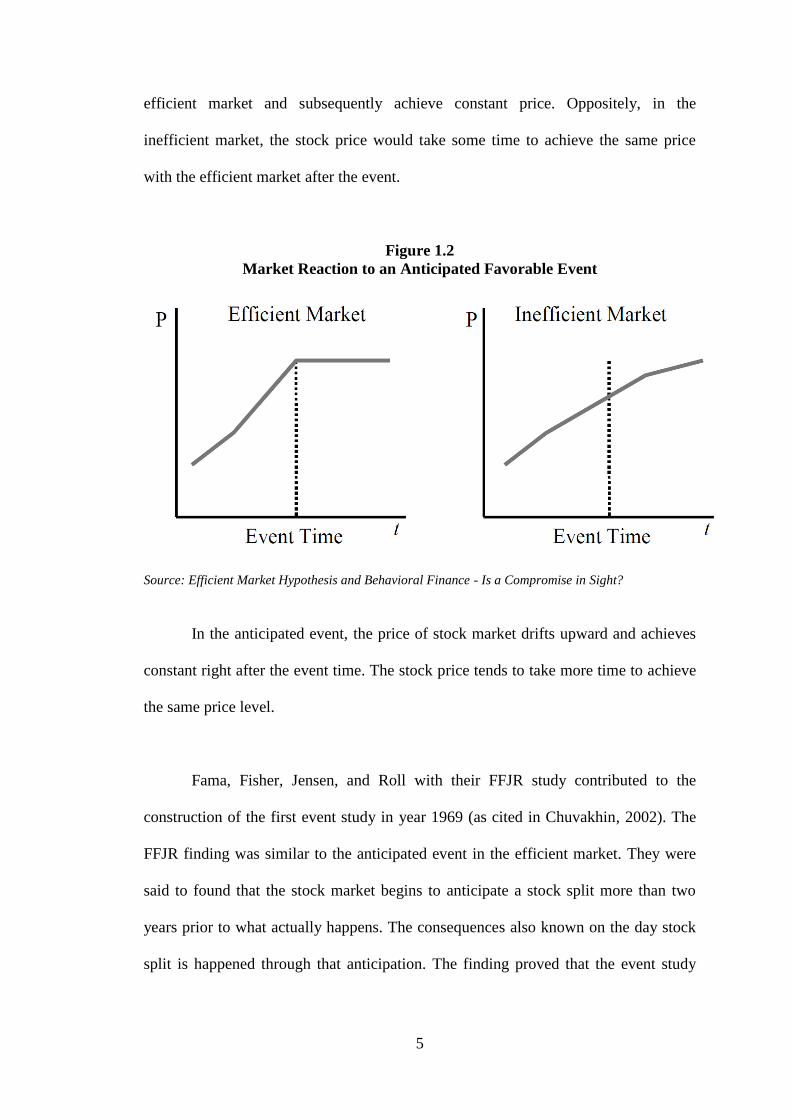
Figure 1.2
Market Reaction to an Anticipated Favorable Event
Source: Efficient Market Hypothesis and Behavioral Finance - Is a Compromise in Sight?
In the anticipated event, the price of stock market drifts upward and achieves
constant right after the event time. The stock price tends to take more time to achieve
the same price level.
Fama, Fisher, Jensen, and Roll with their FFJR study contributed to the
construction of the first event study in year 1969 (as cited in Chuvakhin, 2002). The
FFJR finding was similar to the anticipated event in the efficient market. They were
said to found that the stock market begins to anticipate a stock split more than two
years prior to what actually happens. The consequences also known on the day stock
split is happened through that anticipation. The finding proved that the event study
6
can eventually predict the future stock market trend with the occurrence of particular
event.
The event study technique was further refined by Johnson et al. (1985). The
study was on the analysis of the stock price reaction to sudden executive deaths. Four
of the researchers conclude that the stock price reacts to the unexpected death of CEO.
They found the stock market is bullish as the CEO was the founder of the company.
Rozeff and Kinney (1976) found that stock returns in January are highest
among other months. Similar finding was appeared in year 1981where the stock
prices were reported tend to go down on every Mondays. Gibbons and Hess (1981)
found that the “Monday Effect” were clearly not consistent with the weak-form
market efficiency. They claimed the effect tended to decrease over time. The market
participants took advantage when they discovered this effect. However, their return
also decrease over time consistent with the movement of Monday Effect.
Grossman and Stiglits (1980) shown that the impossibility to perfectly
informational efficient lie in market. Their argument stated that the prices cannot
perfectly reflect the available information because those information is highly in the
cost. They also argued that even if the perfectly reflection of information in the price
come to be true, the high cost would caused the investor who spent high resources on
obtaining it receive no compensation. Thus, „a sensible model of market equilibrium
must leave some incentive for information-gathering‟ especially in security analysis
(Sewell, 2008).
7
Years after that, the EMH testing was then continuously testing on the
different stock markets over different time period, adopting statistical test such as
serial correlation tests, runs test, variance ratio tests, unit root tests and spectral
analysis. Some of the studies were in consistent with EMH and some were not. LeRoy
and Porter (1981) for example, had proven those stock markets are inefficiency due to
the market exhibit excess volatility. Fama and French (1988) also found large
negative autocorrelations for stock portfolio return over a year. The finding which
concluded the impact in the stock price is permanent, which means there is no
repeating pattern in the future stock price and it subsequently the hypothesis of market
efficiency. However, in the research done by Lo and MacKinlay (1988) strongly
rejected the random walk hypothesis for weekly stock market returns using the
variance-ratio test. In the same year, Poterba and Summers (1988) claimed that the
stock return show positive autocorrelation for short period and opposite outcome for
long term period which in contrast with the finding of Granger and Morgenstern
(1963).
The EMH has been extensively grow in the number of studies by researchers
and economists in many other aspects, including the incorporation of non-trade assets
such as human capital, state-dependent preferences, heterogenous investors,
asymmetric information, and transactions cost. However, the main focus of this study
is mainly on the efficiency in stock market on predicting the financial crisis.

8
1.2 Background of ASEAN-5 Stock Markets
There are five main stock markets which similar as in term of the development
in South East Asia (SEA) region. These five stock markets namely Bursa Malaysia
(KLSE) in Malaysia, Jakarta Stock Exchange (JSX) in Indonesia, Philippines Stock
Exchange (PSE) in the Philippines, Singapore Exchange (SGX) in Singapore and
Stock Exchange of Thailand (SET) in Thailand. This section will cover the
background of these five main stock markets.
1.2.1 Bursa Malaysia (KLSE)
Bursa Malaysia (MYX), the stock exchange of Malaysia was previously
named Kuala Lumpur Stock Exchange (KLSE). On April 14, 2004, the name was
changed Bursa Malaysia with the purpose to enhance the competitive position and to
move along with the global trends in the exchange sector.
Back to the year 1930, the first security organization established with the set
up of Singapore Stockbrokers‟ Association in Malaysia. After seven years, it was re-
registered as the Malayan Stockbrokers‟ Association. However, the share of the
organization was still remaining close for the public trading. The Malayan Stock
Exchange came to exist at the year 1960 and the shares began to trade publicly. At the
same year, traditional method which links the trading room between Singapore and
Kuala Lumpur through direct telephone lines was carried out to create a single market
with the same stocks and shares listed at the single price on both boards.
9
The situation sustained for four years and the Stock Exchange of Malaysia was
inaugurated at the year of 1964. Stock Exchange of Malaysia and Singapore (SEMS)
continue function as the stock exchange centre in Malaysia after the secession of
Singapore from Malaysia one year later. In 1973, Stock Exchange of Malaysia and
Singapore was separated into Kuala Lumpur Stock Exchange Berhad and Stock
Exchange of Singapore which lead to the cease of interchangeability of the currency
between both countries. Kuala Lumpur Stock Exchange (KLSE) took over the
operations of the Kuala Lumpur Stock Exchange Berhad in year 1976. KLSE is a
company limited by guarantee.
In the year 2004, KLSE was re-named became Bursa Malaysia Berhad which
the purpose was to enhance competitive position and focusing on the customer-driven
and market-oriented. Bursa Malaysia aimed at improving the product and service
offerings, increasing the liquidity and velocity of share market. The improvement on
efficiency of the business while achieving economies of scale in the operation is also
one of the main objectives.
On 18 March 2005, Bursa Malaysia put it listed on the Main Board of Bursa
Malaysia Securities Berhad. Bursa Malaysia in the present day consists of a Main
Board, a Second Board and MESDAQ with total market capitalization of MYR700
billion (US$189 billion). The main index for Bursa Malaysia is Kuala Lumpur
Composite Index (KLCI).
10
1.2.2 Jakarta Stock Exchange (JSX)
The origin of Jakarta Stock Exchange (JSX) traces back in 1910s which was
started up under the Dutch colonial government. It halted for trading during World
War I and II and reopened again in 1977. The new open stock exchange was under the
management of the Capital Market Executive Agency controlled by Ministry of
Finance.
On July 13, 1992, the bourse was privatized under the Jakarta Exchange Inc.
The change transformed the functions of Bapepam to Capital Market Supervisory
Agency. JSX was once launched a new developed system to boost the management of
trading stocks namely Jakarta Automated Trading System (JATS) on March 22, 1995.
There are two stock market indices in JSX: JSX Composite and Jakarta
Islamic Index (JII). JII was established in the regulation by Islamic Law (Syariah) in
2002 and it currently trading on the 30 corporate stocks on the list.
After five years passed in September 2007, the establishment of Indonesian
Stock Exchange (with the merger between Jakarta Stock Exchange and Surbaya Stock
Exchange) create bigger and stronger stock market in Indonesia which boosts
Indonesia one step ahead.

11
1.2.3 Philippine Stock Exchange (PSE)
The Philippine Stock Exchange was formed with the combination of two large
stock exchanges: Manila Stock Exchange (MSE) and Makati Stock Exchange (MkSE).
On December 23, 1992, the two long separated bourses which traded on the same
stock for the same companies was merged and become the present PSE.
PSE was able to implement its own policies and give out penalties on erring
stock brokers, traders and companies with the granted status – Self-Regulatory
Organization (SRO) by the Philippine Securities and Exchange Commission in year
1998. In 1999, the stock exchange transformed from the non-profit, no stock, and
member governed organization into a revenue-earning corporation lead by president
and board of directors. It was eventually listed itself on the exchange.
With the new implemented classification system, PSE was divided in to eight
indices according to the industry sector: PSE All Shares Index (ALL), PSE
Composite/Industrial Index (CI), PSE Composite Index (PHISIX), PSE Financial
Index (BF), PSE Mining Index (MIN), PSE Oil Index (OIL), PSE Property Index
(PTY) and PSE Small and Medium Enterprise Index (SME).
12
1.2.4 Singapore Stock Exchange (SGX)
Singapore Stock Exchange Limited (SGX), the Asia-Pacific‟s first
demutualised and integrated securities and derivatives exchange was established on 1
December 1999. It was the subsequent of the merger of the two recognized and well
organized financial institution which was namely Stock Exchange of Singapore (SES)
and the Singapore International Monetary Exchange (SIMEX).
SGX is the only controller of Singapore securities exchange and derivatives
exchange and the clearing houses. It offers a comprehensive and efficient
infrastructure for investors to trade financial products and raising capital.
History shows SGX was the first exchange in Asia-Pacific to be listed through
a public offer and private placement on 23 November 2000. MSCI Singapore Free
Index and the Straits Times Index, for instant, both are the component of benchmark
indices on the bourse where it is being listed. SGX is a huge leading securities
exchange which was the Asia earliest fully trading through electronic exchange.
The SGX is divided into SGX Mainboard and the SGX SESDAQ for all the
listing company. This market is well known as a trading platform of variety derivative
securities. This leading stock market was the first exchange in Asia to offer equity
index futures and become the world‟s widest range of Asian index futures.
13
1.2.5 Stock Exchange of Thailand (SET)
The formation of the Stock Exchange of Thailand was in the 1960‟s. The first
five –year National Economic and Social Development Plan was formed at that time
to propose for the improvement of the economic growth and stability and to develop
the populations‟ standard of living. Five years later, the Second National Economic
and Social Development Plan (1967-1971) proposed to develop a well-ordered
securities market in order to enhance the mobility of addition capital for the economic
boost of the country.
The stock market of Thailand transformed twice in the history. The Bangkok
Stock Exchange was the first stock exchange available in the nation. It transformed to
the Securities Exchange of Thailand.
The Bangkok Stock Exchange was once inactive due to the failure in this
privately owned exchange caused by two factors: (1) lack of government support, (2)
limited understanding of investor on equity market. However, the inactive did not go
through a very long period. The stock exchange was reactive as „The Securities
Exchange of Thailand‟ initiated by Government in 1971 with the new enacted of
regulatory framework on operations of finance and securities companies. The
reactivated stock exchange was official began trading on April 30, 1975. The stock
exchange revamped its name to The Stock Exchange of Thailand on January 1, 1991.