faculty of bioscience engineering centre for...
TRANSCRIPT

Faculty of Bioscience Engineering
Centre for Environmental Sanitation
Academic year 2010 – 2011
MULTI-RESIDUE ANALYSIS OF HUMAN PHARMACEUTICALS
IN NAIROBI RIVER BASIN, KENYA
BY
K’OREJE KENNETH OTIENO
Promoters: Prof. dr. ir. Herman Van Langenhove
Prof. dr. ir. Kristof Demeestere
Tutor: Ing. Patrick De Wispelaere
Master‘s dissertation submitted in partial fulfillment of the requirements for the degree of
Master of Science in Environmental Sanitation

i | P a g e
Multi-residue analysis of human pharmaceuticals in Nairobi River basin, Kenya ©2011K’oreje Kenneth
COPYRIGHT
The author and the promoter give the permission to use this thesis for consultation and to copy parts
of it for personal use. Any other use is subject to the Laws of Copyright. Permission to produce any
material contained in this work should be obtained from the author.
©Gent University, August 2011
The author The promoters
K‘OREJE O. Kenneth Prof. dr. ir. H. Van Langenhove Prof. dr. ir. K. Demeestere

ii | P a g e
Multi-residue analysis of human pharmaceuticals in Nairobi River basin, Kenya ©2011K’oreje Kenneth
DEDICATION
This work is dedicated to my late father Joseph Oreje, late brother Patrick Oreje,
late sister Mary Helida, my beloved Mum Silermina Oreje and Sister Wilfrida Oreje

iii | P a g e
Multi-residue analysis of human pharmaceuticals in Nairobi River basin, Kenya ©2011K’oreje Kenneth
ACKNOWLEDGEMENT
To go up the ladder, others hold for one the ladder lest it falls. I take the earliest opportunity to
appreciate all those who held for me the academic ladder to reach the pinnacle. First and foremost,
my sincere and heartfelt gratitude goes to Prof. Herman Van Langenhove who not only accepted my
project proposal but also unconditionally accepted to be my promoter. His intelligent insights will
remain ingrained in my mind for years to come. Many thanks to my co-promoter Prof. Kristof
Demeestre. He was a teacher, a mentor and a counselor. Soft spoken, yet so keen and strict to detail.
His guidance shaped my scientific thinking and critical analysis, without which, my work would
have been invain. Special thanks to Patrick De Wispelaere for his tireless efforts that ensured smooth
running of the experiments. His advice was invaluable asset for the success of this work. I also
appreciate the entire EnVOC for their hospitality. In one way or the other, they made my work a
success.
Secondly, my appreciation to my colleagues at the Kenya Ministry of Water and Irrigation.
Specifically, my sincere thanks to Mrs Kellen Mwangi, Daudi Kamau and Andrew Kinyua for their
assistance during data search. Central Water Laboratory members, Noel Ndeti, Celline Obuya, John
Muasya, and Joram Kihumba deserve a special mention. Your time with me in the lab will remain
cherished. Not to forget Mwaura Murigi Njuguna of WARMA for his sacrifice during my sampling
operation. I give you thumbs up.
Thirdly, I thank the Kenya Medical Supplies Agency and its Director for accepting to release their
data to me unconditionally. Special thanks go Caroline Wambui for her unrelenting effort to ensure
that I got the data I needed even after leaving the country. Your heart of kindness will remain a
blessing to many.
Fourthly, my appreciation to the CES team, Veerle, Isabel and Sylvie for their unending support. You
made my life in Gent worth living. Prof. Mac Van de Hede must be mentioned in a special way. His
life experience stories and academic guidance have brought me this far. My gratitude to VLIR for
offering me the scholarship to study in this dynamic and classic University of Gent.
My gratitude to my marvelous classmates. Each time spent with you was a source of inspiration. My
study group members, Amanual, Susan, Malcom, Efuet, Meseret, Livin and Pascal, I appreciate you
all. I owe my success to your hard work and determination. I give praise to my friends Samson,
Nancy, Kapere, Bernadette and Sheila who always lifted up my spirit when life seemed too hard to
push. You were a great inspiration.
Finally, I thank my entire family for their sacrifice each day to ensure that I achieved my dream in
life. May God reward you handsomely.
And to God be the glory!

iv | P a g e
Multi-residue analysis of human pharmaceuticals in Nairobi River basin, Kenya ©2011K’oreje Kenneth
TABLE OF CONTENT
COPYRIGHT ................................................................................................................................................... i
DEDICATION ................................................................................................................................................ ii
ACKNOWLEDGEMENT ........................................................................................................................... iii
TABLE OF CONTENT ................................................................................................................................. iv
LIST OF TABLES ......................................................................................................................................... vi
LIST OF FIGURES ......................................................................................................................................vii
ABBREVIATIONS AND NOTATIONS .................................................................................................. viii
ABSTRACT ................................................................................................................................................... ix
CHAPTER 1 .................................................................................................................................................... 1
INTRODUCTION .......................................................................................................................................... 1
1.1 Background of the study ........................................................................................................... 1
1.2 Justification of the study ........................................................................................................... 2
CHAPTER 2 .................................................................................................................................................... 4
LITERATURE REVIEW ............................................................................................................................... 4
2.1 Classification and consumption of pharmaceuticals ................................................................. 4
2.1.1 Classification of pharmaceuticals ..................................................................................................... 4
2.1.2 Consumption of pharmaceuticals ..................................................................................................... 6
2.2 Pharmaceuticals in the environment ......................................................................................... 8
2.2.1 Sources of pharmaceutical residues in the aquatic environment................................................... 8
2.2.2 Occurrence of pharmaceuticals in the environment ....................................................................... 9
2.2.3 Fate of pharmaceuticals in the aquatic environment .................................................................... 13
2.2.4 Toxicological and Ecological impacts of pharmaceuticals .......................................................... 14
2.3 Abatement of pharmaceutical pollution .................................................................................. 15
2.3.1 Conventional treatment systems ..................................................................................................... 16
2.3.2 Advanced treatment systems ........................................................................................................... 16
2.4 Analysis of pharmaceuticals in the environment .................................................................... 18
2.4.1 Sample extraction ............................................................................................................................. 18
2.4.2 Separation .......................................................................................................................................... 20
2.4.3 Detection ........................................................................................................................................... 20
2.5 Scope of the study ................................................................................................................... 27

v | P a g e
Multi-residue analysis of human pharmaceuticals in Nairobi River basin, Kenya ©2011K’oreje Kenneth
CHAPTER 3 .................................................................................................................................................. 28
MATERIALS AND METHODS ................................................................................................................. 28
3.1 Chemicals ................................................................................................................................ 28
3.2 Sampling and sample preparation ........................................................................................... 28
3.2.1 Sampling area and sites ................................................................................................................... 28
3.2.2 Sampling period and method .......................................................................................................... 30
3.2.3 Sample preparation and extraction for organic trace analysis ..................................................... 30
3.3 Analysis of physical-chemical parameters.............................................................................. 31
3.4 Instrumental organic trace analysis ......................................................................................... 32
3.4.1 High Performance Liquid Chromatography (HPLC) ................................................................... 32
3.4.2 Mass Spectrometry ........................................................................................................................... 32
CHAPTER 4 .................................................................................................................................................. 35
RESULTS AND DISCUSSION.......................................................................................................... 35
4.1 Water quality of the Nairobi River basin: physical-chemical parameters .............................. 35
4.2 Prioritization of pharmaceutical compounds for trace analysis .............................................. 36
4.3 Trace analysis of human pharmaceuticals in Nairobi River basin .......................................... 42
4.3.1 Screening of priority compounds by HPLC-HRMS ............................................................... 42
4.3.2 Screening and selective target analysis of 14 focus compounds in Nairobi River basin ........ 43
4.3.3 Unequivocal identification and approximative quantification of detected focus compounds..
………………………………………………………………………………………………..48
4.3.4 Discussion ............................................................................................................................... 51
CHAPTER 5 .................................................................................................................................................. 56
CONCLUSION AND RECOMMENDATIONS ....................................................................................... 56
5.1 Conclusion .............................................................................................................................. 56
5.2 Recommendations ................................................................................................................... 56
List of Reference ........................................................................................................................................... 58
Appendix I: Molecular structures of focus compounds ............................................................................ 67
vi | P a g e
Multi-residue analysis of human pharmaceuticals in Nairobi River basin, Kenya ©2011K’oreje Kenneth
LIST OF TABLES
Table 1: Classification of aspirin based on the ATC classification system ............................................... 4
Table 2: Classification of selected antibiotics based on molecular structure ........................................... 5
Table 3: Pharmaceutical consumption patterns in different countries in tons/year. ................................. 6
Table 4: Some PAIs treated using advanced oxidation processes ............................................................ 17
Table 5: Analytical methods for detection of pharmaceutical residues in environmental samples ...... 25
Table 6: Water quality of the Nairobi River basin ..................................................................................... 35
Table 7: Classes and quantity of pharmaceuticals supplied to the hospitals by KEMSA in 2008 ....... 37
Table 8a: List of minor group (subgroup A) .............................................................................................. 40
Table 8b: List of minor group (subgroup B) .............................................................................................. 41
Table 9: List of compounds detected during screening ............................................................................. 43
Table 10: Classification of the focus compounds for escan and MID analysis ...................................... 44
Table 11: Retention time, intensity, delta and STDEV (escan) of detected compounds in the Nairobi
River basin....................................................................................................................................... 47
Table 12: Retention times and peak areas (MID) of detected compounds in the Nairobi River basin
……………………………………………………………………………………………….48
Table 13: Retention time and response factor of the analytical standards .............................................. 49
Table 14: Peak area (response) of external standards during calibration and sample analysis ............ 50
Table 15: Concentration (ng/L) of pharmaceuticals in Nairobi River basin ....................................... 50

vii | P a g e
Multi-residue analysis of human pharmaceuticals in Nairobi River basin, Kenya ©2011K’oreje Kenneth
LIST OF FIGURES
Figure 1: Quantity of drugs ordered and supplied by KEMSA to public health institutions in the
Nairobi region in 2008. ................................................................................................................................... 3
Figure 2a: Outpatient antibiotic use in European countries in 2008 ........................................................ 7
Figure 2b: Antiviral consumption in outpatient settings for 15 participating European countries in
2008 ……......................................................................................................................................................... 7
Figure 3: Possible sources and pathways for pharmaceuticals and personal care products (PPCP) in
the aquatic environment ................................................................................................................................ 9
Figure 4: Ranges of concentrations reported in literature for some of the frequently detected
pharmaceuticals in wastewater effluent (a) and surface water (b) .......................................................... 10
Figure 5: Scheme of sample preparation and instrumental analysis of PAIs in the environment……18
Figure 6: SPE procedure ............................................................................................................................. 19
Figure 7: Schematic diagram of a mass spectrometry system ................................................................. 21
Figure 8: Mechanism of ESI ....................................................................................................................... 21
Figure 9: Schematics of (a) a quadrupole and (b) an ion trap mass analyzers ...………………………22
Figure 10: Schematics of a triple quadrupole configuration ................................................................... 23
Figure 11: Schematics of (a) a magnetic sector analyzer and (b) a time-of-flight analyzer ................ 24
Figure 12: Map of the Nairobi River basin showing the sampling sites ................................................. 29
Figure 13: SPE cartridge sample … ............................................................................................................ 31
Figure 14: SPE extraction set-up ................................................................................................................. 31
Figure 15: Schematic diagram of the HPLC-HRMS sequence ................................................................ 32
Figure 16: Instrumental analysis set-up (AmberLab, UGent) .................................................................. 34
Figure 17: Scheme of selection criteria for focus compounds ................................................................. 42
Figure 18: Sample TIC obtained by the analysis of Group A in MID and escan mode (site 5) ......... 45
Figure 19: Sample XIC for metronidazole in escan and MID mode (Site 5) ..................................... 45
Figure 20: Schematics of compound identification criteria ................................................................ 46
viii | P a g e
Multi-residue analysis of human pharmaceuticals in Nairobi River basin, Kenya ©2011K’oreje Kenneth
ABBREVIATIONS AND NOTATIONS
AOP Advanced Oxidation Processes
ATC Anatomical Therapeutic Chemical System
BCS Biopharmaceutical Classification System
BOD Biological oxygen demand
COD Chemical oxygen demand
DDD Defined Daily Doses
DID Defined Daily Doses per 1000 Inhabitants per day
Escan Electric scan
GDP Gross Domestic Products
HLB Hydrophilic-hydrophobic balance
HRMS High resolution mass spectrometry
KEMSA Kenya Medical Supplies Agency
LC50 Lethal concentration
LOEC Lowest observable effect concentration
MID Multiple ion detection
NGO Non Governmental Organizations
PAI Pharmaceutically active ingredients
PPCP Pharmaceutical and personal care products
SPE Solid-phase extraction
SPME Solid-phase microextraction
TDS Total dissolved solids
tR Retention time
TSS Total suspended solids
WARMA Water Resources Management Authority
WHO World Health Organization
WHOCC World Health Organization Collaborating Centre for Drug Statistics Methodology
WWTP Wastewater treatment plant

ix | P a g e
Abstract
Multi-residue analysis of human pharmaceuticals in Nairobi River basin, Kenya ©2011K’oreje Kenneth
ABSTRACT
Human pharmaceuticals are fast becoming an environmental concern. Their occurrence in the
environment has been reported in many countries especially the Western world. They have been
reported to have eco-, geno- and human toxic effects and thus, their importance as micropollutants
cannot be ignored. However, African countries are still lagging behind in research concerning these
micropollutants. In view of this fact, this dissertation presents on one hand, an overall view of the
water quality and on the other hand, a first study on the occurrence of pharmaceutical residues in the
Nairobi River basin, Kenya.
Physical-chemical parameters of water samples were analyzed. Chemical Oxygen Demand (COD)
and Biological Oxygen Demand (BOD5) values of up to 594 mg/l and 460 mg/l were registered,
respectively. Other parameters analyzed included total suspended solids (480 mg/L), conductivity
(1080 µS/cm) and total dissolved solids (670 mg/L) among others.
Based on the pharmaceutical consumption quantity in the Nairobi region, prioritization criteria for
the selection of target compounds to be analysed has been developed. Initially, 43 priority
compounds were selected, downsized to 14 focus compounds after first screening. These focus
compounds represent six pharmaceutical classes: antibiotics, analgesics/anti-inflammatory drugs,
antiretrovirals, antimalarials, and antipsychotics.
A new multi-residue analytical method based on solid-phase extraction (SPE) and high resolution
magnetic sector mass spectrometry (HRMS) coupled to high performance liquid chromatography
(HPLC) has been developed for determination of the selected human pharmaceuticals in Nairobi
River basin, Kenya. Given the novelty of this HRMS based analytical method, a stepwise structured
methodology for compounds identification has been developed. Compounds are first identified by
analysis in electric scan (escan) mode and then confirmed in a mass selective multiple ion detection
(MID) mode. Based on the HRMS measured parameters (retention times, ion intensity and mass
accuracy), criteria for the identification of detected compounds has been developed. On this basis,
three categories of compounds were defined i.e. positively, probably and indicatively identified
compounds. The former represents compounds that are accurately identified because they met all the
conditions for accurate confirmation. The latter two classes represent compounds which didn‘t meet
all these criteria necessitating unequivocal identification via analytical standards. Five compounds
(nevirapine, paracetamol, sulfamethoxazole, sulfadoxine and trimethoprim) were positively
identified, while two (ibuprofen and zidovudine) were identified as probable compounds and another
five (amoxicillin, efavirenz, carbamazepine, lamivudine and metronidazole) were considered to be
indicatively present. Methyldopa and benzylpenicillin were not identified in all the samples
analysed.
Full confirmation and approximative quantification of the identified pharmaceuticals was achieved
by the analysis of the corresponding analytical standards. All the identified focus compounds in
escan and MID were unequivocally confirmed to be the actual focus compounds except efavirenz
and zidovudine whose retention time couldn‘t match that of the analytical standards.

x | P a g e
Abstract
Multi-residue analysis of human pharmaceuticals in Nairobi River basin, Kenya ©2011K’oreje Kenneth
Quantitatively, sites in the informal settlement and industrial areas showed high detection frequency
and concentrations of the focus compounds. Antibiotics were the most common class of
pharmaceuticals detected being represented by four compounds. Nevirapine was the most ubiquitous
compound being identified in 88% of the sampling sites with a mean concentration of 918 ng/L. The
other compounds which have been detected in the samples include paracetamol (50%, 8.7 µg/L),
metronidazole (63%, 286 ng/L), trimethoprim (75%, 2 µg/L), sulfadoxine (63%, 718 ng/L),
sulfamethoxazole (75%, 8.5 µg/L), lamivudine (75%, 1 µg/L), carbamazepine (75%, 251 ng/L) and
amoxicillin. The WWTP plant effluent contains pharmaceuticals thus adds burden of pharmaceutical
contamination to the Nairobi River.
This study has, for the first time, brought forward qualitative and quantitative data on the occurrence
of pharmaceutical residues in the Kenyan waters through the development of an advanced and
innovative analytical method. It has not only demonstrated that Kenyan rivers are heavily
contaminated with pharmaceutical residues as exemplified by their high concentrations, but has also
revealed the occurrence of new classes of pharmaceuticals (antiretrovirals and antimalarials) in the
environment. These pharmaceuticals are used in large amounts, yet little or no studies have been
done on their occurrence and fate in the environment. The study, therefore, presents a foundation on
which further research work can be developed.

1 | P a g e
Chapter 1: Introduction
Multi-residue analysis of human pharmaceuticals in Nairobi River basin, Kenya ©2011K’oreje Kenneth
CHAPTER 1
INTRODUCTION
1.1 Background of the study
The ever increasing world‘s population has led to increase in demand for human pharmaceuticals in
equal measure. Similarly, new diseases continue to emerge even when health professionals put up
spirited effort to control the old diseases. As a result, new compounds are discovered and registered
everyday to help in combating the diverse kinds of diseases. In the rush to save human life, the fate
and effects of these pharmaceuticals in the environment have taken a backseat for a long time.
Coupled with lack of resources, powerful analytical techniques to study pharmaceutical compounds
in the environment in the past and limited information on their consumption, there had been less
interest in studying their environmental occurrence. However, in the recent past, awareness of
environmental problems and the contribution of these compounds (so called emerging pollutants)
have been increasing. Technological advancement in analytical instruments has not been left behind
either.
Pharmaceutical compounds are complex molecules with different physical-chemical and biological
properties and functionalities which are developed and used because of their more or less specific
biological activity (Kummerer, 2008). They are used to cure diseases, control pathogens and pests,
improve animal growth and production. The occurrence of pharmaceutically active substances
(sometimes referred to as pharmaceutically active ingredients – PAIs) in the environment has
become an important issue in the last few years (Gros et al., 2006). This increased interest emanates
from the concern that these compounds may have negative impacts on ecosystems. These concerns
have been vindicated by several studies which have reported negative effects of some
pharmaceuticals on aquatic organisms (Carlsson et al., 2006; Christen et al., 2010; Morley, 2009;
Zurita et al., 2007). Their presence in drinking water has also raised concern on the risk they pose to
human health. Moreover, pharmaceutical compounds can exert significant geno-, eco- or human
toxic effects, even at low concentrations due to their high biological activity.
Occurrence of these compounds in the aquatic systems has been reported by many researchers
(Alonso et al., 2010; Gros et al., 2006; Kummerer, 2008; Zuccato et al., 2010). Pharmaceuticals
once taken are eliminated from the body either as the parent compound or as biotransformation
products. They are then excreted in urine, feces and sweat which is disposed in domestic sewers and
finally into wastewater treatment plants (WWTPs) or surface water. These studies, however, have
been done in the developed world. In Africa, there is very little information on the occurrence of
drugs in the environment. In Kenya, for instance, to the best of this author‘s knowledge, no such
study has ever been done. This work focuses on the study of the occurrence of pharmaceutical
compounds in Nairobi River basin, Kenya.

2 | P a g e
Chapter 1: Introduction
Multi-residue analysis of human pharmaceuticals in Nairobi River basin, Kenya ©2011K’oreje Kenneth
This work is organized into five chapters. Chapter 1 gives a brief introduction and justification of the
study. Chapter 2 provides a literature review which focuses on (i) the classification and consumption
of pharmaceuticals; (ii) their fate, occurrence, and ecological impacts, (iii) abatement technology to
remove them from the environment; and (iv) analytical technique to detect human pharmaceuticals
in the aquatic environment. The scope of the study is included in this chapter. In chapter 3, materials
and methods used in the study are outlined. Chapter 4 provides the results and discussion, their
interpretation and chapter 5 gives the recommendations and conclusions emanating from the study.
Finally, the last part contains the list of references cited in this work.
1.2 Justification of the study
As environmental awareness increases worldwide, countries are rushing to make policies to address
environmental pollution. Kenya is not left behind in this race. In order to make good and relevant
policies, scientific information is vital. This is not only important for addressing the sources of
pollution but also to prioritize dangerous compounds. Apart from conventional pollutants, emerging
micropollutants (e.g. pesticides, nano-sized particles, human and veterinary drugs, personal care
products) are becoming an important cause of environmental concern. Though there is limited
information on pharmaceutical consumption in Kenya, the Government reported that the public
sector medicine expenditure was US$ 16 million, representing quite a large portion of the
governmental budget. Combined with out of pocket expenditure on medicine by the people, it can be
concluded that the country consumes a lot of human drugs. Therefore, it is imperative that the
occurrence of these compounds in the Kenyan waters is determined for proper monitoring.
Using data from the Kenya Medical Supplies Agency (KEMSA), it was estimated that the drug
consumption was 9.2 g per inhabitant equivalents (I.E) per year in 2008 in the Nairobi region.
However, this represents only 70% of the demand and ordered amount of pharmaceuticals by the
governmental health institutions. This implies that another 30% is acquired from the private health
institution.
Due to many players (e.g. Non Governmental Organizations (NGOs), churches, private medical
practitioners, the government) in the health sector in the country, it is quite difficult to have an
accurate drug consumption rate. This notwithstanding, KEMSA data provides a good indicative
consumption rate. Figure 1 shows the estimated drug consumption in the Nairobi region. With rapid
population growth, the consumption is expected to grow rapidly. Due to poor waste management and
sewerage systems, these compounds are expected to occur in the Nairobi River basin, hence the need
for this study.

3 | P a g e
Chapter 1: Introduction
Multi-residue analysis of human pharmaceuticals in Nairobi River basin, Kenya ©2011K’oreje Kenneth
Figure 1: Quantity of drugs ordered and supplied by KEMSA to public health institutions in the Nairobi
region in 2008.
0
5
10
15
20
25
An
tib
ioti
c
An
alge
sic/
anti
-in
flam
mat
ory
An
tim
alar
ial
An
tire
tro
vira
l (A
RV
)
An
thel
mit
ic
An
tifu
nga
l
An
tip
sych
oti
c
An
tivi
ral
An
tih
ista
min
e
Bet
a b
lock
er
Vit
amin
An
tid
iab
etic
Co
nra
cep
tive
s
An
tiu
lce
r
An
tip
arki
nso
nia
n
An
tiem
eti
c
An
aest
hes
ia
Qu
atit
y (g
) x1
06
Quantity Ordered (g)
Quantity Supplied (g)

4 | P a g e
Chapter 2: Literature review
Multi-residue analysis of human pharmaceuticals in Nairobi River basin, Kenya ©2011K’oreje Kenneth
CHAPTER 2
LITERATURE REVIEW
2.1 Classification and consumption of pharmaceuticals
2.1.1 Classification of pharmaceuticals
Pharmaceutical drugs are classified in a number of ways depending on where and how the drugs are
being used (Thomas, 2006). The classification methods include chemical structure, pharmacological
action including site of action and target system, nature of illness and the body system in which the
drug acts (physiological classification), and route or mode of administration. The method of
classification adopted depends on the purpose of the information. Daughton et al. (2009) noted that
the Biopharmaceutical Classification System (BCS) which categorizes active pharmaceutical
ingredients (API) that are administered orally according to solubility, permeability, absorption and
solubilization of an API across the intestine has been employed by scientists. Gros et al. (2009)
classified pharmaceuticals according to their pharmacological action. Different methods have their
own shortcomings. For instance, classification according to chemical structures may group
compounds with different mode of actions together.
The most elaborate and commonly used classification system is the Anatomical Therapeutic
Chemical (ATC) classification system which is controlled by the World Health Organization
(WHO) Collaborating Centre for Drug Statistics Methodology (WHOCC). In the ATC classification
system, the active substances are divided into different groups according to the organ or system on
which they act and their therapeutic, pharmacological and chemical properties. Drugs are classified
in groups at five different levels. The first level of the code indicates the anatomical main group and
consists of one letter. Drugs are divided into fourteen main groups in this level. The second level
indicates the pharmacological/ therapeutic main group and consists of two digits. The 3rd
and 4th
levels are chemical/pharmacological/therapeutic subgroups and the 5th
level is the chemical
substance (http://www.whocc.no/atc/structure_and_principles/). For example, the complete
classification of aspirin illustrates the structure of the code as shown in Table 1.
Table 1: Classification of aspirin based on the ATC classification system
N Nervous system (1st level, anatomical main group)
N02 Analgesic (2nd
level, therapeutic subgroup)
N02B Other analgesics and antipyretics (3rd
level, pharmacological subgroup)
N02BA Salicylic acid and derivatives (4th
level, chemical subgroup)
N02BA01 Acetylsalicylic acid (5th
level, chemical substance)

5 | P a g e
Chapter 2: Literature review
Multi-residue analysis of human pharmaceuticals in Nairobi River basin, Kenya ©2011K’oreje Kenneth
The Anatomical Therapeutic Chemical (ATC) Classification System is, however, complex and can
have several codes for the same compound e.g. ibuprofen is C01EB16 (cardiac therapy),as well as
G02CC01 (gynaecological), M01AE01 (anti-inflammatory) and M02AA13 (topical products for
joint and muscular pain).
Antibiotics, due to their diversity and mode of action, have the highest number of subgroups based
on their chemical structures (e.g. penicillins, cephalosporins, quinolones, sulfonamides) as shown in
Table 2. However, it can also be based on spectrum of activity, mode of administration, and type of
activity (mechanism of action). Spectrum of activity is based on target specificity e.g. narrow-
spectrum (targets a specific type of bacteria such as gram-positive or gram-negative bacteria) and
broad-spectrum (targets a wide range of bacteria). Activity based classification identifies bactericidal
and bacteriostatic antibiotics. Bactericidal antibiotics kill bacteria by inhibiting metabolism, cell wall
synthesis and nucleic acid function or synthesis. Bacteriostatic antibiotics inhibit bacterial growth by
inhibiting protein synthesis. Antibiotics classification is important in understanding their fate in the
environment and thus inducibility of bacterial resistance which is of environmental concern
(Kummerer, 2004).
Table 2: Classification of selected antibiotics based on molecular structure (Wikipedia)
Antibiotic class Core structure Unique molecular structure
Penicillins Pencylpenicillin: R=C6H5
Phenoxyphenypenicillin: R=C6H5O
Amoxicillin: R=C6H8ON
Ampicillin: R=C6H8N
Meticillin: R=C6H9O2
Oxacillin: R=C10H8ON
Cephalosporins Cefacetril: R1=C3H5O2; R2=C2H2N
Cefradin: R1=CH3; R2=C7H12N
Cefroxadin: R1=CH3O; R2=C7H12N
Cefaclor: R1=Cl; R2=C7H10N
Cefalexin: R1=CH3; R2=C7H10N
Quinolones Ciprofloxacin: R1=H; R2=F; R3=C4H9N2;
R4=H; R5=C3H5
Rosoxacin: R1=H; R2=H; R3=C5H4; R4=H;
R5=C2H5
Sulfonamides
Sulfamethoxazole: R1=C6H6N; R2=H;
R3=C4H4NO
Sulfadoxine: R1=C6H6N; R2=H; R3=C4H4O2
R1
R2
R3
R2
R1
6 | P a g e
Chapter 2: Literature review
Multi-residue analysis of human pharmaceuticals in Nairobi River basin, Kenya ©2011K’oreje Kenneth
2.1.2 Consumption of pharmaceuticals
The pharmaceutical industry has been flourishing over the years as the world‘s population grows and
new diseases emerge. A bigger percentage of the Gross Domestic Products (GDP) of various
countries is directed towards healthcare provision. In Kenya, for example, per capita medicine
expenditure was US$ 11 in 2003 (Ministry of Health, 2004). Global pharmaceutical sales are
projected to grow by 5-7% in 2011 hitting $880 billion compared to 4-5% in 2009 (IMS health,
2010; www: imshealth.com).
In 2005, the pharmaceutical sector value in Kenya was US$ 130 million (Kenya Pharmaceutical
Industry, 2005). These statistics give a rough idea on how much drugs are consumed globally. IMS
notes that USA remains the largest single market followed by Japan and China, respectively. In
2005, USA had 2.32 billion prescriptions (JJemba, 2008). There are no data available for the total
use of pharmaceuticals globally though sale volumes can be used for consumption estimates
(Kummerer, 2008). However, some researchers have reported estimates for different countries which
vary from region to region. These variations can be explained by differences in population and
population structure, geographical site, local legislation and laws, social believes and practices, and
economic factors.
Alder et al. (2010) noted that UK had the highest consumption of β-blockers in Europe at 3.2 g per
capita per annum (cap-1
a-1
) in 2001 while Finland had the lowest consumption (0.1 g cap-1
a-1
).
Cardiovascular drugs were among the top 200 most prescribed drugs in USA in 2005 (JJemba,
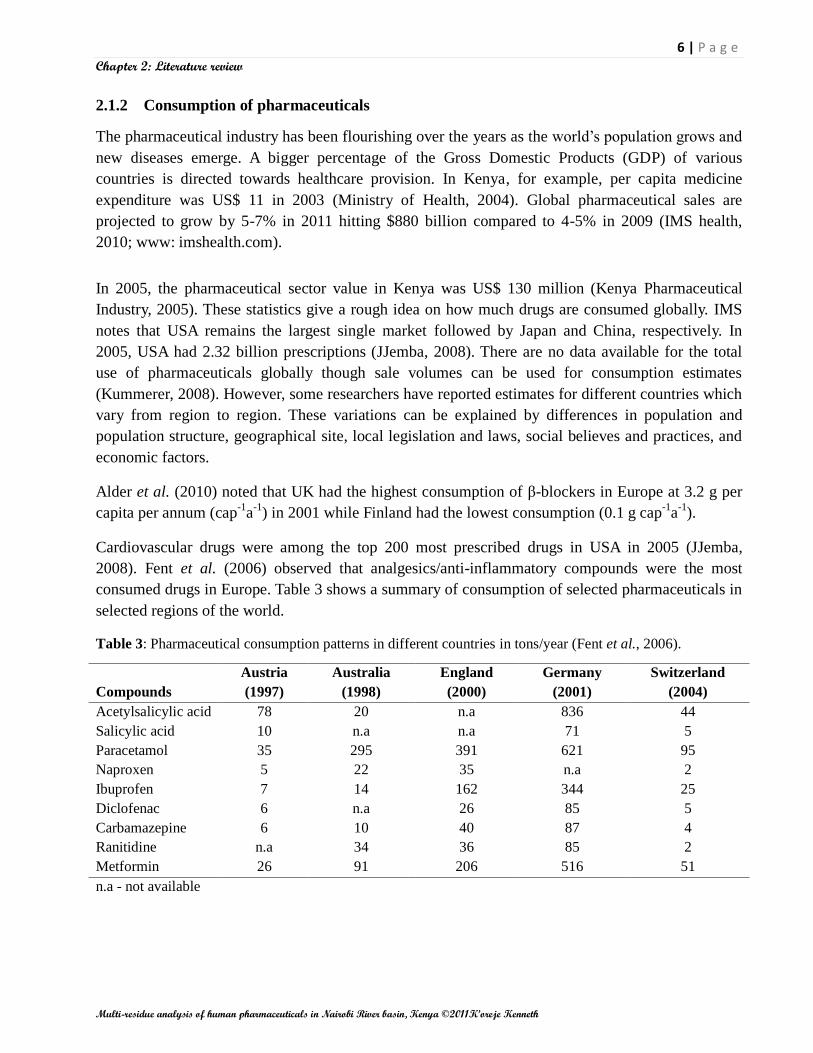
2008). Fent et al. (2006) observed that analgesics/anti-inflammatory compounds were the most
consumed drugs in Europe. Table 3 shows a summary of consumption of selected pharmaceuticals in
selected regions of the world.
Table 3: Pharmaceutical consumption patterns in different countries in tons/year (Fent et al., 2006).
Compounds
Austria
(1997)
Australia
(1998)
England
(2000)
Germany
(2001)
Switzerland
(2004)
Acetylsalicylic acid 78 20 n.a 836 44
Salicylic acid 10 n.a n.a 71 5
Paracetamol 35 295 391 621 95
Naproxen 5 22 35 n.a 2
Ibuprofen 7 14 162 344 25
Diclofenac 6 n.a 26 85 5
Carbamazepine 6 10 40 87 4
Ranitidine n.a 34 36 85 2
Metformin 26 91 206 516 51
n.a - not available

7 | P a g e
Chapter 2: Literature review
Multi-residue analysis of human pharmaceuticals in Nairobi River basin, Kenya ©2011K’oreje Kenneth
Antibiotics consumption was recently estimated between 10,000 and 200,000 tons/year globally
(Zuccato et al., 2010). In Germany, about 302 tons of human antibiotics were discharged
(Kummerer, 2008). This value was higher than that estimated by Zuccato et al. (2010) of 7-14 tons
for annual antibiotic discharge in Italy.
The outpatient consumption of antibiotics for systemic use varied from 9.96 Defined Daily Doses
(DDD) per 1,000 Inhabitants per Day (DID) in the Russian Federation to 45.20 DID in Greece (total
care), with a median use of 19.70 DID (European Surveillance of Antimicrobial Consumption,
2008). Similarly, total outpatient systemic antiviral use in 2008 in 16 European countries varied by a
factor of 25.6 between the country with the highest (1.5 DID in the Netherlands) and the country
with the lowest (0.06 DID in Croatia) use. Figure 2a and 2b show the consumption of antibiotics and
antivirals in selected European countries.
KEY: GR-Greece, CY-Cyprus, IT-Italy, FR-France, BE-Belgium, LU-Luxembourg, LT-Lithuania, SK-Slovakia, HR-Croatia, PT-Portugal, IE-Ireland,
IL-Israel, PL-Poland, IS-Iceland, BGE-Bulgaria, S-Spain, FI-Finland, MT-Malta, CZ-Czech Republic, UK-United Kingdom, DK-Denmark, No-
Norway, HU-Hungary, SL-Slovenia, AT-Austria, SE-Sweden, DE-Germany, EE-Estonia, NL-Netherland, LV-Latvia, RU-Russian Federation
Figure 2a: Outpatient antibiotic use in European countries in 2008 (ESAC, 2008).
KEY: IT-Italy, LU-Luxembourg, SK-Slovakia, HR-Croatia, PT-Portugal, FI-Finland, CZ-Czech Republic,
DK-Denmark, NO-Norway, HU-Hungary, AT-Austria, SE-Sweden, EE-Estonia, NL-Netherland, SL-Slovenia
Figure 2b: Antiviral consumption in outpatient settings for 15 participating European countries in 2008
(ESAC, 2008).

8 | P a g e
Chapter 2: Literature review
Multi-residue analysis of human pharmaceuticals in Nairobi River basin, Kenya ©2011K’oreje Kenneth
2.2 Pharmaceuticals in the environment
2.2.1 Sources of pharmaceutical residues in the aquatic environment
In the recent past, there has been an upsurge in human population growth; the majority has been
reported in the developing countries. With it has come the challenge for healthcare provision. New
diseases have emerged as well as the old ones creating more need for drugs. Due to this increased
production and consumption of pharmaceutical drugs, there has been increasing concern in their fate
and effect in the environment as reports show their presence in the aquatic systems.
The pharmaceuticals find their way into the aquatic systems in various ways (Figure 3). After the
drugs have been taken, they can undergo biotransformation such as conjugation in the body. Some,
however, remain unchanged. The metabolites and unchanged compounds are eliminated from the
body through urine, feces and sweat. The eliminated drugs get into the domestic wastewater system
through excretion in urine or feces. Washing away of excretions through sweat and topically applied
medication during bathing and disposal of unused or expired drugs into the sewers also contributes
to the pharmaceutical drugs load in the domestic wastewater. A survey conducted in the USA showed
that unused or expired medicines are generally disposed of through the trash, toilet and sink rather
than by return to pharmacies (Kotchen et al., 2009).
Effluent from wastewater treatment plants (WWTP) is the main source of pharmaceutical drugs in
the aquatic systems. Most biological wastewater treatments do not completely remove therapeutic
compounds which flow into surface waters and eventually into ground waters (Chang et al., 2011;
De Graaff et al., 2011). A study carried out in Italy (Castiglioni et al., 2004) found out that on
average the efficiency of the WWTPs to remove therapeutic drugs was less than 50%. These findings
buttress rising belief that much of the drugs consumed could be getting into the aquatic systems
through effluent discharges from WWTPs.
Leakage from septic tanks and landfills also contributes to contamination of both ground and surface
water. In Kibera slums, Kenya, for instance, pit latrines are constructed on the river banks which
makes it easy for the fecal matter to leak into the rivers. In some cases, the latrines not only leak but
are also emptied into those rivers once they get filled up.
Surface water run offs carry with it these compounds during rain from the solid waste dump sites and
agricultural lands where sewage sludge has been applied as manure. Pharmaceutical drug
manufacturing facilities have been reported to introduce PAIs into the aquatic system. In Taiwan, the
highest drug contaminations were found in domestic waste streams (37.5%) followed by animal
husbandry (27.9%) and drug production facilities (23.4%) (Lin and Tsai, 2009). Hospital waste
discharges are also sources of PAIs in the environment.
In many countries, sewerage systems and solid waste management is very poor. As a result, there is
direct discharge of raw sewage and industrial wastewater into the surface water. Direct dumping of
wastes into the rivers in developing countries is a common feature.
9 | P a g e
Chapter 2: Literature review
Multi-residue analysis of human pharmaceuticals in Nairobi River basin, Kenya ©2011K’oreje Kenneth
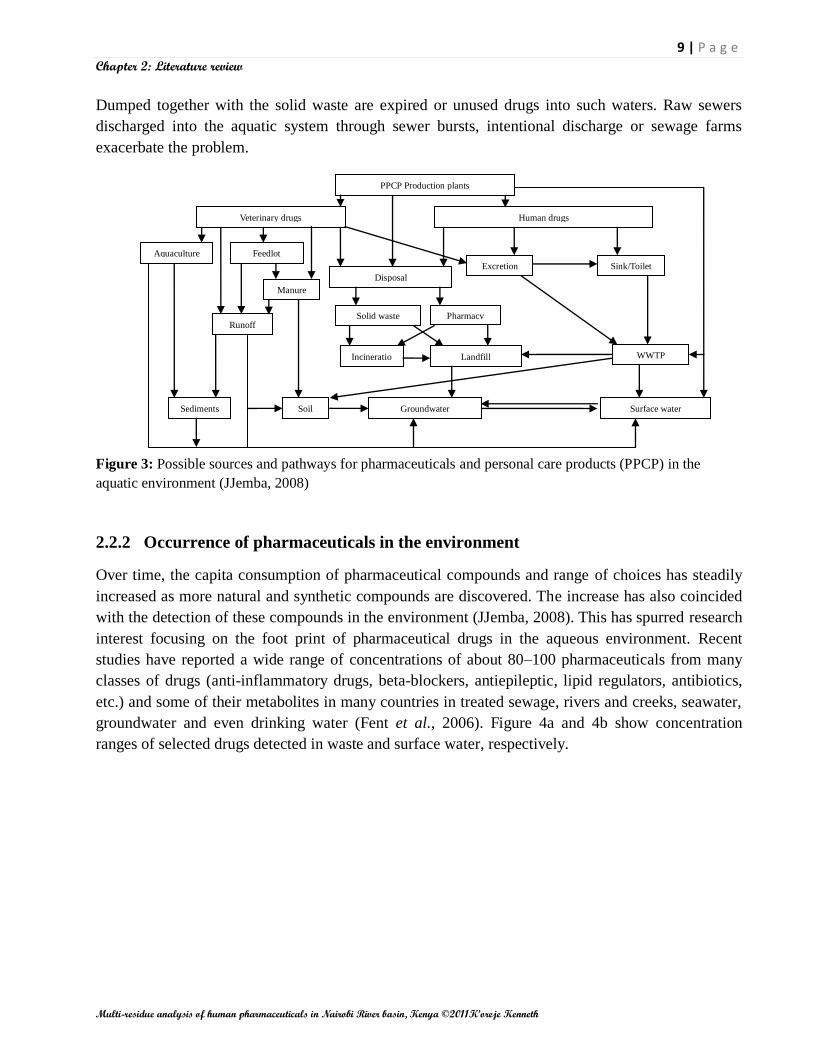
Dumped together with the solid waste are expired or unused drugs into such waters. Raw sewers
discharged into the aquatic system through sewer bursts, intentional discharge or sewage farms
exacerbate the problem.
Figure 3: Possible sources and pathways for pharmaceuticals and personal care products (PPCP) in the
aquatic environment (JJemba, 2008)
2.2.2 Occurrence of pharmaceuticals in the environment
Over time, the capita consumption of pharmaceutical compounds and range of choices has steadily
increased as more natural and synthetic compounds are discovered. The increase has also coincided
with the detection of these compounds in the environment (JJemba, 2008). This has spurred research
interest focusing on the foot print of pharmaceutical drugs in the aqueous environment. Recent
studies have reported a wide range of concentrations of about 80–100 pharmaceuticals from many
classes of drugs (anti-inflammatory drugs, beta-blockers, antiepileptic, lipid regulators, antibiotics,
etc.) and some of their metabolites in many countries in treated sewage, rivers and creeks, seawater,
groundwater and even drinking water (Fent et al., 2006). Figure 4a and 4b show concentration
ranges of selected drugs detected in waste and surface water, respectively.
PPCP Production plants
Veterinary drugs Human drugs
Aquaculture Feedlot
refuse
Manure
Sediments Soil
Disposal
Excretion
Pharmacy
Sink/Toilet
Incineratio
n
Landfill WWTP
Groundwater Surface water
Solid waste Runoff

10 | P a g e
Chapter 2: Literature review
Multi-residue analysis of human pharmaceuticals in Nairobi River basin, Kenya ©2011K’oreje Kenneth
Figure 4: Ranges of concentrations reported in literature for some of the frequently detected pharmaceuticals
in wastewater effluent (a) and surface water (b) (Gros et al., 2006).
Antibiotics
Due to their suspected effect of inducing bacterial resistance in the environment and their diverse
application both in human and animal treatment, antibiotics have attracted intensive research interest
from many scientists who have reported their occurrence in the aquatic environment (Spongberg et
al., 2008; Terzića et al., 2008; Wille et al., 2010; Zhang et al., 2007). For instance, in surface water,
Zuccato et al. (2010) detected amoxicillin, ciprofloxacin, sulfamethoxazole and erythromycin in
concentration levels ranging from 0.8 ng/L to 38 ng/L. However, Nödler et al. (2010) reported a
higher mean concentration level of 93 ng/L for sulfamethoxazole in surface water. Moreover, Gros et
al. (2009) reported antibiotic concentration levels ranging from below detection limit to 109 ng/L in
surface water.
Lin and Tsai (2009) reported maximum concentrations of 7.4 µg/L and 1340 µg/L of
sulfamethoxazole in effluent from hospital and pharmaceutical production facilities, respectively.
Trimethoprim and lincomycin have been reported in effluent with a maximum concentration of 95
µg/L (hospital WWTP) and 44 µg/L (pharmaceutical facility WWTP), respectively (Sim et al.,
2011).
Grujić et al. (2009) detected azithromycin with concentration levels in the range of 25 – 140 ng/L in
ground water, thus giving credence to the belief that pharmaceutical compounds infiltrate the ground
water aquifers.
a b

11 | P a g e
Chapter 2: Literature review
Multi-residue analysis of human pharmaceuticals in Nairobi River basin, Kenya ©2011K’oreje Kenneth
Analgesics and anti-inflammatory drugs
Occurrence of anti-inflammatory drugs and analgesics in wastewater and surface water has been
extensively studied. Concentration levels ranging from few ng/L to several µg/L have been reported
(Camacho-Muñoz et al., 2010; Hao et al., 2006; Kasprzyk-Hordern et al., 2007; Lajeunesse et al.,
2007; Lin and Tsai, 2009; Payan et al., 2010).
Diclofenac has been reported in WWTP effluent ranging from 217 ng/L to 5.1 µg/L (Al-Odaini et al.,
2010; Sebȍk et al., 2008; Stülten et al., 2008). Ketoprufen and ibuprofen have been reported in the
range of 2.2 to 2666 ng/L and 2.4 ng/L to 139 ng/L in effluent; less than 2.4 ng/L to 13.6 ng/L and 2
ng/L to 610 ng/L in surface water, respectively (Araujo et al., 2008; Togola et al., 2007). Moreover,
many researchers have reported paracetamol in surface water registering concentrations of up to 9.2
µg/L (Lin and Tsai., 2009). Wille et al. (2010) reported concentration levels of up to 850 ng/L for
salicylic acid, the deacylated, more active form of acetylsalicylic acid in sea water.
Similarly, maximum concentration of 400 ng/L and 6 ng/L have been reported for phenazone and
diclofenac in drinking water, respectively (Jones et al., 2005). These findings are quite expected as
analgesics and anti-inflammatory drugs are highly consumed all over the world because they are
easily accessible as they can be administered over the counter without prescription.
Antiviral and antiretroviral drugs
There is limited information available on the fate and impact of antiretroviral drugs in the
environment (Germer and Sinar, 2010). However, Prasse et al. (2010) detected acyclovir, lamivudine,
penciclovir, stavudine, zidovudine, nevirapine, oseltamivir and abacavir in domestic wastewater
influent in concentration range of 5 – 1780 ng/L. The study also reported a removal efficiency of 87
– 99% for abacavir, acyclovir, lamivudine, penciclovir, and stavudine in WWTP (activated sludge
system). Nevirapine and oseltamivir concentrations increased after treatment.
In the same study, oseltamivir, acyclovir and zidovudine were detected in river water with
concentrations up to 17, 190 and 170 ng/L, respectively. Since antiretroviral drugs are mostly used in
the treatment of HIV/AIDS related illnesses, their consumption might be higher in the developing
nations where there is high HIV/AIDS prevalence. However, there is little information on their
occurrence as many researchers, most of whom come from the developed nations, focus on
compounds which are highly used in these nations.
Beta-blockers
Beta-blockers have been detected in wastewater, surface water and drinking water ranging from less
than the level of quantification up to µg/L (Camacho-Muñoz et al., 2010; Lin and Tsai, 2009; Miège
et al., 2006; Trenholm et al., 2009). In Europe and North America, for example, β-blockers have
been reported with concentrations ranging from a few ng/L up to 2.2 µg/L in river water (Alder et
al., 2010). Fick et al. (2009) detected 240 ng/L of metoprolol in river water.

12 | P a g e
Chapter 2: Literature review
Multi-residue analysis of human pharmaceuticals in Nairobi River basin, Kenya ©2011K’oreje Kenneth
In domestic wastewater effluent, Alder et al. (2010) detected 1330, 330, 240 and 70 ng/L of atenolol,
sotalol, metoprolol, and propranolol, respectively. Similarly, Bueno et al. (2007) reported atenolol,
sotalol, and propranolol with maximum concentration levels of 4850, 155 and 100 ng/L,
respectively, in domestic wastewater effluent.
Blood lipid regulators
Due to a change in lifestyle and other factors, there has been upsurge of cases of diabetes and related
illnesses. The World Health Organization (WHO) estimates that 220 million people suffer from
diabetes worldwide (http://www.who.int/mediacentre/events/annual/world_diabetes_day/en/). These
figures show that consumption of blood lipid regulating drugs is rising and therefore their occurrence
in the environment can be quite expected. Clofibric acid, gemfibrozil and bezafibrate are the most
reported and studied compounds in aquatic systems (Camacho-Muñoz et al., 2010; Lajeunesse et al.,
2007; Sacher et al., 2008; Terzića et al., 2008).
Scheurer et al. (2009) measured concentration levels ranging from below 100 ng/L up to 1700 ng/L
and from 2 µg/L up to 21 µg/L for metformin in surface water and domestic wastewater effluent,
respectively. Kasprzyk-Hordern et al. (2008) detected clofibric acid, bezafibrate, simvastatin and
pravastatin in a concentration range of less than 0.3 to 128 ng/L in surface water.
Antipsychotic drugs
Several studies have shown the occurrence of psychoactive drugs in wastewater, surface and
drinking water. Carbamazepine has been reported in both surface and wastewater in the USA,
Canada, Europe and Asia (Gros et al., 2009; Kim et al., 2009; Santos et al., 2010; Zhao et al., 2010).
In Dõnana Park (Spain) main watersheds, Camacho-Muñoz et al. (2010) reported carbamazepine
mean concentrations of 1.1 µg/L. Similarly, Nödler et al. (2010) reported 26 ng/L of carbamazepine
in sea water sample. Fluoxetine, nordiazepam, citalopram, oxazepam and venlafaxine with
maximum concentrations of 44, 76, 120, 129 and 387 ng/L, respectively, have been reported in
surface water in Spain (Alonso et al., 2010).
Contraceptives
In the recent years, various researchers have reported the presence of contraceptives in the aquatic
environment. Al-Odaini et al. (2010) detected up to 38 ng/L of levonorgestrel in surface water. In the
same study, concentrations below the detection limit were reported for 17α-ethinylestradiol which is
quite different from findings by Brossa et al. (2005) who reported concentration levels of up to 130
ng/L of 17α-ethinylestradiol in surface water.
A similar study by Chen et al. (2007) reported maximum concentration levels of 38 ng/L of 17α-
ethinylestradiol and 39.1 ng/L of estriol in domestic WWTP effluent, respectively. These values are
closely similar to those reported by Pailler et al. (2009) for effluent.

13 | P a g e
Chapter 2: Literature review
Multi-residue analysis of human pharmaceuticals in Nairobi River basin, Kenya ©2011K’oreje Kenneth
Pedrouzo et al. (2009) reported 35 ng/L of estrone 3-sulphate (conjugated form of estrone) in
effluent. This finding shows that pharmaceutical compounds do not only exist in the aqueous system
in pure forms but also in conjugated forms. Bartelt-Hunt (2011) reported estrone and other steroid
hormones in ground water with concentrations of up to 390 ng/L. Even though their consumption is
not high, their occurrence in the aquatic environment is inevitable due to their low biodegradability
as well as poor removal efficiency by conventional (waste) water treatment techniques.
2.2.3 Fate of pharmaceuticals in the aquatic environment
Several researchers have elaborated on the sources and pathways through which pharmaceuticals
enter into the aquatic environment (Daughton et al., 2009; Kummerer et al., 2004; Li et al., 2008;
Terzića et al., 2008). The compounds can get into the environment as a parent compound, metabolite
or conjugates. Once in the aquatic environment, the compounds are subjected to several processes
that may lead to their eventual elimination. These processes include adsorption, complexation,
photodegradation, biodegradation, deconjugation and hydrolysis.
Adsorption
Pharmaceutically active ingredients (PAIs) can undergo adsorption in WWTPs and the environment.
Gartiser et al. (2007) noted that in WWTPs, elimination by sorption on activated sludge is probably
of high relevance for tetracycline antibiotics. Kummerer (2008) observed that some compounds such
as quinolones or tetracyclines are eliminated by more than 50% by sorption to sewage sludge.
Adsorption depends on physical-chemical properties of the compound as well as the nature of the
sludge and the wastewater.
Complexation
The aquatic environment contains various complexation ions such as calcium. These ions may react
with pharmaceutical compounds forming complexes that are precipitated out of the water column.
Complexation can also increase the sorptivity of such compounds, thus facilitating their removal by
sorption. High amounts of hardness ions in WWTPs may partially explain the removal of
tetracyclines due to formation of complexes (Gartiser et al., 2007).
Photodegradation
Recent studies have shown that photodegradation of pharmaceuticals occurs in the aquatic
environment. It occurs through direct and indirect photolysis. In direct photolysis, a compound
absorbs sunlight which leads to its degradation. During indirect photolysis, compounds react with
species formed as a result of photolysis mainly of dissolved organic matter. Such species include
singlet oxygen; hydroxyl radicals and photoexcited organic matter (Razavi et al., 2011).
Razavi et al. (2011) reported that photodegradation of atorvastatin is a major mechanism in
determining its overall environmental fate. Exposure to sunlight facilitates the decay of
fluoroquinolone antibiotics in the euphotic zone of surface waters (Ge et al., 2010).
14 | P a g e
Chapter 2: Literature review
Multi-residue analysis of human pharmaceuticals in Nairobi River basin, Kenya ©2011K’oreje Kenneth
However, the extent to which any photochemical reaction occurs in natural waters depends on
variables such as the amount of dissolved organic matter, latitude, flow regimes, time of day and
year. Ryan et al. (2011) noted that both direct and indirect photolysis of sulfamethoxazole and
trimethoprim occur in wastewater effluents exposed to sunlight. Bartels and Von Wolf (2008)
concluded that the disappearance of oseltamivir carboxylate in the aquatic environment seems to be
a result of indirect photolysis.
Biodegradation
Biologically mediated processes can also result in the partial transformation or complete
mineralization of PAIs in the aquatic environment (Kummerer, 2008). Chang (2011) observed that
most androgens and progestogens are eliminated from waste water by biodegradation. In a review of
the fate and removal of estrogen compounds from municipal waste water, Racz and Goel (2009)
noted that estrogens are biodegraded through degradation as a carbon source for heterotrophic
bacteria, cometabolism with nitrifying biomass, and/or other cometabolism mechanisms in water.
Deconjugation
Deconjugation is a process by which pharmaceuticals in conjugated form are eclipsed once the
compound is in the aquatic system. This process normally leads to higher concentration of such
compounds in effluent compared to influent. Prasse et al. (2010) attributed the high concentration of
nevirapine and oseltamivir in effluent as compared to their concentration in the influent to their
deconjugation during the treatment.
Hydrolysis
Several compounds undergo hydrolysis in aquatic environment. Bergheim et al. (2010) reported that
penicillin G is readily hydrolysed at 20 0C, but the degradation rate is reduced at 5
0C. These
findings together with high adsorptivity explain why pecillins are rarely reported in surface water
and effluents.
2.2.4 Toxicological and Ecological impacts of pharmaceuticals
With so many new PAIs being registered every year, carrying out environmental impact studies on
each compound has been a challenge. Despite of this limitation, many researchers have recently
embarked on such studies and their findings are startling (Carlsson et al., 2006; Li et al., 2011a;
Mortensen and Arukwe, 2007).
Various reviews have been published on the toxicity and ecotoxicity of PAIs (Fent et al., 2006;
Morley, 2009; Santos et al., 2010) noting that drugs may induce unexpected effects in non
mammalian organisms which may lead to disturbance of the reproductive and hormone systems,
immune depression and neurobehavioral changes. Other effects include the development of resistant
bacteria strains and mutations.
15 | P a g e
Chapter 2: Literature review
Multi-residue analysis of human pharmaceuticals in Nairobi River basin, Kenya ©2011K’oreje Kenneth
The presence of PAIs in the environment also poses risks to humans such as the effect on human
embryonic cells, human blood cells and human breast cancer cells (Razavi et al., 2011).
Antibiotics are believed to induce the development of resistant bacterial strains. Li et al. (2009)
found a significant difference in proportions of multiresistant bacterial strains in upstream and
downstream samples from penicillin production facility. The higher number of resistant strains
downstream could only be explained by the effect of penicillin residues in the wastewater discharged
into the stream.
Quinn et al. (2008) showed that gemfibrozil and ibuprofen were the most toxic pharmaceuticals
among the compounds tested with a Lowest Observable Effect Concentration (LOEC) of 1 mg/L and
a lethal concentration (LC50) value of 22 mg/L to Hydra attenuate. The report noted that these
compounds had chronic effects such as decrease in feeding, substrate attachment and change of
morphology on the Hydra. Taggart et al. (2007) attributed the decline in Indian gyps vulture
populations to diclofenac induced renal failure after scavenging on the carcasses of cows and goats
treated with diclofenac just before their death.
Effects of PAIs in fish have also been reported quite often. Fish most often share drug targets with
humans (Fick et al., 2010) thus can easily be affected by human drugs. Rainbow trout
(Oncorhynchus mykiss) exposed to 1, 27 and 270 µg/L of verapamil showed oxidative stress and
elevated levels of the plasma ammonia concentration, implying that it impaired the detoxification
process of ammonia (Li et al., 2011a). A similar study with carbamazepine showed a 96 hour LC50
of 20 mg/L on rainbow trout (Li et al., 2011b).
Wastewater treatment plants depend on bacteriological activities to operate effectively. Any
disturbance of the microbial communities can hinder their efficiencies greatly. The presence of PAIs
in wastewater has been shown to interfere with the treatment process. Ketoprofen, naproxen,
carbamazepine and gemfibrozil inhibited nitrite production in the ammonia oxidizing bacterium N.
europaea at concentrations of 1 and 10 µM (Wang et al., 2011). It was noted that surviving cells had
reduced activity, suggesting a long term effect on the ammonium oxidizing bacteria function.
Carucci et al. (2006) showed that ranitidine and the antibiotic lincomycin inhibited ammonia
degradation up to 78% in an activated sludge wastewater lab-scale sequencing batch reactor. High
ammonia concentrations in the aquatic system endanger the survival of fish.
2.3 Abatement of pharmaceutical pollution
To control environmental pollution by pharmaceuticals, proper management and utilization of drugs
is vital. Public awareness of the effects of pharmaceuticals on the environment, proper disposal of
unused or expired drugs and good manufacturing practices go a long way in combating the entry of
PAIs into the environment. However, once they enter the aquatic environment, end-of-pipe
techniques have to be employed to get rid of them. Different techniques exist for removal of PAIs
from both wastewater and drinking water.

16 | P a g e
Chapter 2: Literature review
Multi-residue analysis of human pharmaceuticals in Nairobi River basin, Kenya ©2011K’oreje Kenneth
Main treatment methods are physical, chemical and biological techniques. These techniques can be
categorized into two major processes: conventional treatment systems and advanced treatment
processes.
2.3.1 Conventional treatment systems
Conventional treatment systems involve two stages, i.e. primary and secondary treatment. Primary
treatment involves physical removal of larger objects from wastewater before secondary treatment.
PAIs get sorbed onto the primary sludge. This fraction is then disposed together with the sludge.
The water from the primary treatment which contains mainly dissolved solids is then directed to a
secondary treatment where PAIs can be removed mainly through sorption and biodegradation
processes. Depending on the system design, the conditions can be aerobic, anaerobic or alternation
of aerobic and anaerobic. Lagoon (or oxidation pond) systems, fixed films and suspended films are
the main systems employed in secondary treatment (JJemba, 2008).
Though these systems have shown good efficiencies in the removal of some PAIs, other compounds
are not adequately removed. De Graaff et al. (2011) reported that only 29% of centrizine was
removed in an anaerobic-aerobic-anoxic treatment system. In the same study, the aerobic stage
removed 67% of metoprolol while diclofenac showed an increased concentration in the effluent. The
increased concentration shows that diclofenac exists in the aquatic system not only as the parent
compound but also as a conjugated metabolite. The conjugate can be eclipsed, thus releasing a full
compound of diclofenac, explaining its increased concentration in the effluent.
2.3.2 Advanced treatment systems
Several advanced treatment systems have been developed. These include advanced filtration
systems, ultraviolet treatment systems, electrolysis and advanced oxidation treatment systems.
Advanced filtration
Filtration systems are based on the exclusion of contaminants based on size or charge. However,
biodegradation of compounds also takes place as biofilms develop on the filter surface. Filters can be
either granular filters (e.g. granular activated carbon) or membrane filters (e.g. microfiltration (MF),
ultrafiltration (UF), nanofiltration (NF), and reverse osmosis (RO)). Membrane filters are becoming
more promising in removal of micropollutants (JJemba, 2008). However, their application is still
limited due to the high cost of establishment. The pharmaceutical removal efficiency of membrane
filters vary for different PAIs. In a membrane bioreactor (MBR) study, Tambosi et al. (2010)
reported removal efficiencies of >99%, >98%, 86-89%, and 55-64% for acetaminophen, ketobrufen,
naproxen and sulfamethoxazole, respectively.

17 | P a g e
Chapter 2: Literature review
Multi-residue analysis of human pharmaceuticals in Nairobi River basin, Kenya ©2011K’oreje Kenneth
Oxidation and advanced oxidation
Oxidation processes have been used in disinfection of water for a long time. Chlorination and
ozonation are the major processes employed. These oxidation processes have been found to
eliminate PAIs in water by many researchers (De Witte et al., 2008; Benner et al., 2008; Flyborg et
al., 2010; Khan et al., 2010). Acero et al. (2010) demonstrated that elimination of pharmaceuticals in
natural waters and secondary effluent through chlorination process varied from compound to
compound. It was the highest for amoxicillin (50% elimination in 6 minutes) and lower for
metoprolol (50% elimination in days). It was, however, noted that a high dose of chlorine and a wide
variation of pH was needed. A similar trend was reported by Benitez et al. (2009) in ozonation of
metoprolol, naproxen, amoxicillin, and phenacetin.
The need for effective techniques to abate pharmaceutical pollution has lead many researchers to
come up with new methods. Recently, combinations of various oxidation processes enhanced with
catalysts have been advanced. These new techniques known as Advanced Oxidation Processes
(AOPs) have gained interest among scientists and environmentalists. Researchers have reported
good performance of such systems in their recent findings (Trovó et al., 2011; Zhang et al., 2010;
Kim et al., 2009; Yuan et al., 2009; Van Doorslaer et al., 20011).
For instance, Miranda-García et al. (2010) showed that immobilized TiO2 under solar irradiation
removes up to >99% of most of the pharmaceuticals. According to Xu et al. (2009), melatonin
achieved a degradation efficiency of >99% by the UV/H2O2/Fe2+
process compared to 32% by the
UV process alone. It should be noted that other parameters such as degradation products are
important apart from removal efficiency. These processes, however, have drawbacks such as high
energy requirement in photolytic methods, great consumption of chemicals and extra expenses on
the disposal of Fe(OH)3 in Fenton and photo-Fenton processes. Table 4 shows some AOPs applied
for selected PAIs.
Table 4: Some PAIs treated using advanced oxidation processes (Klavarioti et al., 2009)
Compound Advance Oxidation Process % Removal
Diclofenac Photo-Fenton in pilot plant Complete in 100 min
200 mg/L TiO2/Artificial sunlight at 750 W/m2 Complete in 60 min
Sonolysis at 617 kHz, 90 W in the presence of 100 mg/L TiO2 85% in 30 min
Carbamazepine 100 mg/L TiO2/Artificial sunlight 75% in 9 min
10 mg/L H2O2/UV(200–300 nm) 90 % at 853 mJ/cm2
Sulfamethoxazole 100 mg/L TiO2/Artificial sunlight 88 in 360 min
Clofibric acid 0.01 mM Ozone Complete in 20 min
1 M H2O2/UVC (17 W) 90% in 60 min
17β-estradiol 1.5 mg/L Ozone 99% in 1 min
Electrolysis over boron-doped diamond at 25 mA/cm2, Complete in 8 min

18 | P a g e
Chapter 2: Literature review
Multi-residue analysis of human pharmaceuticals in Nairobi River basin, Kenya ©2011K’oreje Kenneth
2.4 Analysis of pharmaceuticals in the environment
Determination of pharmaceuticals in the environment is an integrated procedure involving sampling,
sample preparation, and instrumental analysis (Figure 5). Sampling should be carried out in such a
way that the samples are good representative of the sample area. Sampling techniques and materials
employed should protect target compounds from removal/degradation through processes such as
adsorption and photolysis. Proper storage is necessary as well as treatment before final instrumental
analysis.
Figure 5: Scheme of sample preparation and instrumental analysis of PAIs in the environment (JJemba,
2008)
2.4.1 Sample extraction
Determination of PAIs in environmental samples is challenging owing to their diverse properties and
complex matrix. Developing a single technique to identify these compounds is thus difficult.
Therefore, a combination of techniques is often applied. Before instrumental analysis, PAIs are
extracted from the environmental samples using various techniques. The most commonly employed
technique for liquid samples is sorptive extraction, mainly solid-phase extraction (SPE). Other
techniques include liquid-liquid extraction (LLE). The extraction step is vital for the pre-
concentration and/or clean-up of samples as it improves the sensitivity and selectivity towards the
analytes of interest.
Sample pretreatment (solids) e.g.
grinding, homogenization, etc.
Extraction (using centrifugal forces, Soxhlet
extraction, ultrasonic waves, microwaves, etc.)
the solvent used depends on the target compound.
Clean up using solvent exchange or column chromatography with column
packed with alumina or silica gel.
Concentrate the sample using N2, vacuum
evaporation or rotary evaporation
Derivatization (if necessary)
Analysis using appropriate instrument
Sample pretreatment (liquids)
Filtration (if necessary)
Adjust pH to desired level (based
on target compounds)
Extraction using solid-phase extraction (SPE) or
liquid-liquid extraction (LLE). The solvent used
depends on the compound of interest.

19 | P a g e
Chapter 2: Literature review
Multi-residue analysis of human pharmaceuticals in Nairobi River basin, Kenya ©2011K’oreje Kenneth
2.4.1.1 Solid-phase extraction (SPE)
The solid-phase extraction (SPE) or liquid-solid extraction technique (Figure 6) is based on the
principle that the analytes sorb onto a sorbent material due to their hydrophobic or ion-exchange
properties. Reversed-phase materials such as alkyl-modified silica or poly(styrene-divinylbenzene)
have been employed for extraction. However, the presence of a wide range of pharmaceuticals with
diverse polarities in environmental samples poses challenges to the use of this technique. Thus, new
sorbent materials with both ion-exchange and hydrophobic properties have been developed. An
indepth review of new materials in sorptive extraction has been published (Fontanals et al., 2007).
Hydrophilic-hydrophobic balance (HLB) sorbents are being developed to aid in multi-residue
extraction. Oasis HLB is the most commonly used sorbent in this category due to its ability to
simultaneously extract acidic, neutral and basic polar analytes at a wide range of pH values. It wets
easily and can be allowed to run dry without adversely affecting the extraction efficiency (Al-Odaini
et al., 2010; Grujic et al., 2009; Nödler et al., 2010; Pedrouzo et al., 2009). Oasis HLB had better
recoveries compared to a non-polar C18 sorbent for the majority of the compounds analysed by Gros
et al. (2006). However, this wide range reduces its selectivity and thus increases the presence of
interference compounds in the extract.
Oasis MCX, mixed reversed phase-cation exchange sorbent gave good recoveries for acidic
compounds, whereas recoveries for basic and neutral compounds were poor at pH 7. Mixed-mode
cation- and anion-exchange SPE sorbents in series have been used (Lavén et al., 2009). This
technique enabled separation of acidic, basic and neutral PAIs. It‘s, however, time consuming (Gros
et al., 2006). Solid-phase extraction (SPE) can be automated and used on-line. On-line SPE reduces
solvent consumption, cost and time of extraction (Trenholm et al., 2009). It eases portability and
storage. Other forms of SPE such as solid-phase microextraction (SPME) have been used for anti-
inflammatory drugs. It is simple, solvent free, reliable, flexible, and requires less sample volume
(Araujo et al., 2008).
Figure 6: SPE procedure (Van Langenhove and Demeestre, 2010)

20 | P a g e
Chapter 2: Literature review
Multi-residue analysis of human pharmaceuticals in Nairobi River basin, Kenya ©2011K’oreje Kenneth
2.4.1.2 Liquid-liquid extraction (LLE)
The liquid-liquid extraction technique has been used for a long time. It‘s based on the principle of
organic compounds partitioning between the aqueous sample and an immiscible organic solvent. Its
use in environmental analysis is limited due to the use of large volumes of solvents and analyte loss
due to multistage operation (JJemba, 2008). It‘s prone to contamination, poses disposal challenge for
toxic solvents and tedious. Payan et al. (2010), however, used hollow fibre based liquid-phase
microextration (HF-LPME) for acidic pharmaceuticals and reported reduced solvent consumption,
faster speed, low cost, improved accuracy, selectivity and sensitivity compared to conventional
liquid-liquid extraction.
2.4.2 Separation
Chromatography is the most commonly used separation technique in environmental sample analysis.
Gas chromatography (GC) and liquid chromatography (LC) are the main methods applied. GC has
been used by many researchers (Sebok et al., 2008; Togola et al., 2007; Miège et al., 2006). In GC,
the target compounds are vaporized and eluted in a stream of gas (mobile phase) through a column
where they partition between the liquid stationary phase and the gaseous mobile phase. Though GC
based methods have high selectivity and resolution, good accuracy and precision, wide dynamic
range and high sensitivity; it requires derivatization for most polar compounds which prolongs time
of analysis, and use of toxic derivatizing agents. It‘s prone to wrong results due to incomplete
derivatization and decomposition of thermolabile compounds during analysis (Fatta-Kassinos et al.,
2011).
These drawbacks have lead to an increase in use of LC techniques (Nödler et al., 2010; Prasse et al.,
2010; Zuccato et al., 2010). However, LC coupled to MS is susceptible to matrix effects which may
result in ion suppression leading to reduced sensitivity, linearity, accuracy and precision of the
method (Fatta-Kassinos et al., 2011). Natural organic matter, salts, ion-pairing agents, non-target
contaminants are responsible for ion suppression (Gros et al., 2009). A higher number of surrogate /
internal standards compensates more accurately for matrix effects. Moreover, selective extraction,
sample clean-up and extract dilution can be employed (Gómez et al., 2007; Gros et al., 2006).
However, dilution can lead to a loss of sensitivity (Pailler et al., 2009).
2.4.3 Detection
Due to their complex matrix and the trace concentrations of PAIs, environmental samples require
highly sensitive and selective equipment for detection. Initially, fluorescence and UV spectroscopy
were used. However, these techniques were not suitable for multi-residue analysis. Mass
spectrometry is the most currently used technique for multi-residue analysis. It has high selectivity
and sensitivity as well as confirmation possibilities (Grujic et al., 2009). It can be coupled to HPLC
or GC (Jelic et al., 2011; Luo et al., 2011; Pedrouzo et al., 2009; Wang et al., 2011; Wille et al.,
2010; Zuccato et al., 2010).

21 | P a g e
Chapter 2: Literature review
Multi-residue analysis of human pharmaceuticals in Nairobi River basin, Kenya ©2011K’oreje Kenneth
2.4.3.1 Mass spectrometry
This technique is based on the principle that the sample transformed into gas phase is ionized. The
ions are accelerated into a mass analyzer for separation based on their mass-to-charge (m/z) ratio.
The ions then strike the sensor of a detector which measures their electric charge and amplifies the
weak ionic current. The spectrum from the signals sent by the detector is then displayed on a
computer system (Figure 7) (Hoffman et al, 2002).
Figure 7: Schematic diagram of a mass spectrometry system
Several ionization techniques are used in mass spectrometry. They include electron ionization,
chemical ionization, thermospray ionization, atmospheric pressure chemical ionization, electrospray
ionization and desorption ionization technique. Electrospray ionization (ESI) is the most commonly
used ionization method, particularly for PAIs in aqueous environmental samples. It has higher
sensitivity and less fragmentation than electron impact (Nödler et al., 2010). However, it is prone to
matrix effect which may reduce sensitivity and selectivity as a result of ion suppression or
enhancement. In ESI (Figure 8), tiny droplets of the aqueous sample are formed at the end of a
capillary which is exposed to a strong electric field (3-6 kV). The droplets then pass through a heated
inert gas or capillary to remove solvent molecules. Evaporation of the solvent causes the droplets to
shrink till the repelling coulombic forces nears their cohesive forces. This causes a cascade of
raptures leading to smaller droplets (Hoffman et al., 2002). Ions of the analyte are then liberated.
Figure 8: Mechanism of ESI (Van Langenhove and Demeestre , 2010)
Analyzers
Analyzers are used to filter the ions according to their mass-to-charge ratio before they are led to the
detector. There are different types of analyzers including quadrupole (Q), time-of-flight (TOF),
magnetic sector and ion trap analyzers. The commonly used mass analyzers are quadrupole (Q) and
ion trap (Figure 9).
Inlet: direct probe or
chromatograph Ion Source (Ionizer) Analyzer Detector Computer

22 | P a g e
Chapter 2: Literature review
Multi-residue analysis of human pharmaceuticals in Nairobi River basin, Kenya ©2011K’oreje Kenneth
Quadrupole analyzer
A quadrupole analyzer employs the stability of the trajectories in oscillating electric fields to
separate ions according to their mass-to-charge (m/z) ratio (Hoffman et al, 2002). It consists of four
rods with circular (or ideally hyperbolic) sections arranged in parallel. The opposing rods which are
electrically connected are supplied with direct current (DC) and a radiofrequency (RF). By adjusting
the DC and RF voltages, the ions entering the rods are separated. Ions with specific m/z ratio pass
through the rods while others are neutralized by striking on one of the rods.
Ion trap analyzer
In principle, an ion trap analyzer is similar to a quadrupole. It‘s like a three-dimensional quadrupole
having two end-cap electrodes and annular electrodes. Ions are trapped inside the volume between
the electrodes from where they are expelled to the detector according to their m/z ratio. Both
quadrupole and ion trap have low mass resolution and mass range (2000-4000).
a) b)
Figure 9: Schematics of (a) a quadrupole and (b) an ion trap mass analyzers (Van Langenhove and
Demeestre, 2010)
In mass spectrometry, mass resolution (ability to separate two ion signals from one another (e.g. at
10% height in a mass spectrum)) is critical. Resolution (R) is defined as R=m/Δm = m1/(m1-m2)
with m= mass and Δm= mass difference; m1 and m2 are (m/z) ratios of the first and second ion,
respectively, and m1>m2.
Due to their complex matrix, environmental sample analysis requires instruments with high
selectivity and sensitivity. To achieve this, two approaches are currently employed in mass
spectrometry.
a. Tandem mass spectrometry
This is a hybrid system where different analyzers are combined to achieve the desired result. Triple
quadrupole (QqQ) is the commonly used configuration.

23 | P a g e
Chapter 2: Literature review
Multi-residue analysis of human pharmaceuticals in Nairobi River basin, Kenya ©2011K’oreje Kenneth
A triple quadrupole instrument (Figure 10) consists of two quadrupole mass spectrometers in series
with a non mass resolving quadrupole between them. The first and third quadrupoles act as mass
filters while the middle quadrupole serves as a collision cell. Combinations of Q and TOF (QqTOF),
and combinations of Q and a linear ion trap (QqLIT) have also been reported (Buchberger, 2011).
QqTOF provides more suitable information for confirmation purposes as well as identification of
unknown compounds because of their ability to provide exact mass measurements. QqLIT is
appropriate for both quantification and confirmation (Gros et al., 2009).
Figure 10: Schematics of a triple quadrupole configuration (Van Langenhove and Deemestre, 2010)
The use of tandem mass spectrometry has led to the achievement of low method detection limits
(MDL) and limits of quantification (LOQ), though it may vary as a function of sample matrix and
recovery (Al-Odaini et al., 2010). For instance, Lavén et al. (2009) achieved a MDL of 4.8 ng/L for
enapril in effluent using LC-MS/MS (QqTOF) and serial mixed mode cation- and anion-exchange
SPE, compared to 0.7 ng/L obtained by Gros et al. (2009) using LC-MS/MS (QqLIT) and Oasis
HLB cartridges. It is important to note that the QqQ system is used only in target analysis and
therefore it is not possible to detect the analytes outside the targeted ones (i.e. specified mass).
b. High resolution mass spectrometry
High resolution mass spectrometry has been employed as an innovative alternative to achieve high
selectivity and sensitivity. They are used in full-scan analysis thus has the advantage of being used
for screening. Two types are commonly used. They are the time-of-flight (TOF) and magnetic sector
analyzers (Figure 11).
Time-of-flight (TOF) analyzer
Time-of-flight analyzers are based on the principle of the relationship between the mass of ions and
their velocity at a given kinetic energy. Since ions originating from the same source with the same
energy and accelerated at the same potential arrive at the detector at different times, accurately
measured times can be used to distinguish ions of different mass. This technique has high
transmission efficiency and thus high sensitivity.

24 | P a g e
Chapter 2: Literature review
Multi-residue analysis of human pharmaceuticals in Nairobi River basin, Kenya ©2011K’oreje Kenneth
Magnetic sector analyzer
In a magnetic sector analyzer, the ions enter a magnetic field where they are separated as they are
deflected as a result of a centripetal and centrifugal force. Ions are selected according to their
momentum. Ions of equal energy but different m/z ratio describe different radial trajectories when
passing through the magnetic field.
The magnetic field strength (magnetic scan) or the voltage (electric scan) can be varied so that ions
of different m/z ratios are collected successively by a detector placed at a fixed position behind the
slit (Equation 1). These analyzers have high resolution (up to 60,000) compared to the others.
𝑚
𝑧=
𝐵2. 𝑟2. 𝑒
2𝑉 (1)
with m/z: the ion‘s mass-to-charge ratio, B: magnetic field strength, r: radius of the curvature, e:
elementary charge, V: electrical field voltage
Kaufmann et al (2010) noted that it can be used in trace level detection and quantification of
compounds in challenging matrices. It has higher selectivity and also permits elucidation of
compounds based on exact masses and isotopic patterns.
a) b)
Figure 11: Schematics of (a) a magnetic sector analyzer and (b) a time-of-flight analyzer (www.kore.co.uk)
As shown above, many analytical techniques are employed in the analysis of pharmaceuticals in
aquatic environmental samples. However, high resolution magnetic sector mass spectrometry
(HRMS) has no reported applications for PAI analysis. Table 5 gives a summary of the commonly
used analytical techniques for detection of PAIs in environmental samples.
Ions from source
Monitor
slit Monitor
Mass
filtering
Lens
Energy
focussing
Detector
slit
To detector
Source slit
Double focussing
point
Lens

25 | P a g e
Chapter 2: Literature review
Multi-residue analysis of human pharmaceuticals in Nairobi River basin, Kenya ©2011K’oreje Kenneth
Table 5: Analytical methods for detection of pharmaceutical residues in environmental samples
Number of
compounds
analysed
Pharmaceutical class Matrix Extraction
technique
Separion
method
Detection
method
MS
Ionisation
mode
MS
analyzer
Detection limit
range (ng/L) Reference
8
Analgesics, contraceptives,
antibiotics, stimulants,
antipsychotics
Tap water, surface
water DLLME HPLC UV/VIS _ _ 100 – 55800 (M) Yao et al, 2011
43
Analgesics/anti-inflammatory
drugs, blood lipid regulators,
antibiotics, beta blockers,
psychiatrics, antihistamines
Wastewater SPE (HLB) HPLC MS/MS ESI QqLIT 0.2-25 (M) Jelic et al, 2011
16 Antibiotics Wastewater, surface
water SPE HPLC MS/MS ESI QqLIT 0.02-2.21(M) García-Galán et al, 2011
32 Steroid hormones, antibiotics Ground water,
wastewater SPE (HLB) HPLC MS/MS ESI QqQ 0.001-0.023 (M) Bartelt-Hunt et al, 2011
23 Steroid hormones Wastewater and
surface water SPE (HLB) HPLC MS/MS ESI QqQ 0.02-40 (M) Chang et al, 2011
55
Beta blockers, psychiatric drugs,
hormones, antihistamines,
cardiac agents, metabolites
Surface, drinking &
ground water SPE (HLB) UPLC MS/MS ESI QqLIT 0.01-40 (M)
Huerta-Fontela et al,
2011
24
Antibiotics, stimulants,
psychiatric drugs, anti-
inflammatory drugs
Wastewater SPE (HLB and
MCX) HPLC MS/MS ESI QqQ 1-122 (M) Sim et al, 2011
47
Analgesics/anti-inflammatory
drugs, blood lipid regulators,
antidepressants, antiulcers,
psychiatric drugs, beta blockers
and antibiotics
Wastewater and
surface water
SPE (HLB)
UPLC MS/MS ESI QqQ 0.4-170 (I) Gracia-Lor et al, 2011
16
Antibiotics, hormones,
analgesics, stimulants,
antiepileptics, X-ray contrast
media
Tap and surface water SPE (HLB)
HPLC MS/MS ESI Qtrap 0.1-9.9 (M) Wang et al, 2011
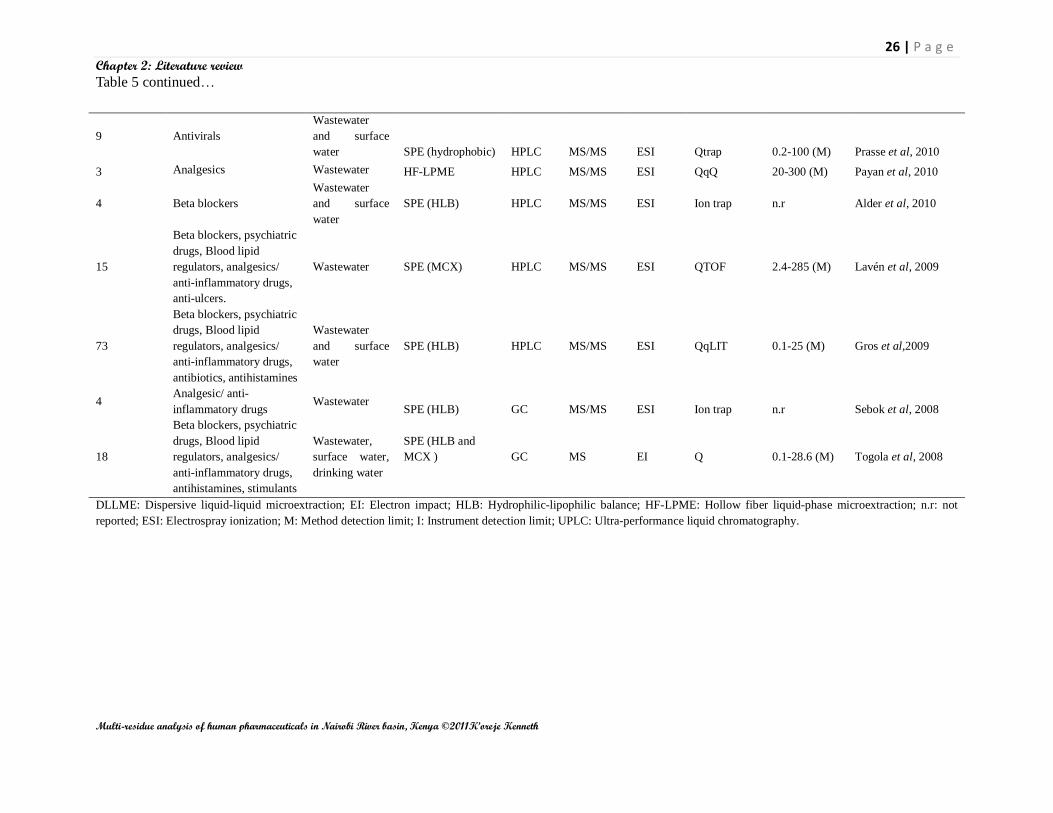
26 | P a g e
Chapter 2: Literature review
Multi-residue analysis of human pharmaceuticals in Nairobi River basin, Kenya ©2011K’oreje Kenneth
Table 5 continued…
9 Antivirals
Wastewater
and surface
water SPE (hydrophobic) HPLC MS/MS ESI Qtrap 0.2-100 (M) Prasse et al, 2010
3 Analgesics Wastewater HF-LPME HPLC MS/MS ESI QqQ 20-300 (M) Payan et al, 2010
4 Beta blockers
Wastewater
and surface
water
SPE (HLB) HPLC MS/MS ESI Ion trap n.r Alder et al, 2010
15
Beta blockers, psychiatric
drugs, Blood lipid
regulators, analgesics/
anti-inflammatory drugs,
anti-ulcers.
Wastewater SPE (MCX) HPLC MS/MS ESI QTOF 2.4-285 (M) Lavén et al, 2009
73
Beta blockers, psychiatric
drugs, Blood lipid
regulators, analgesics/
anti-inflammatory drugs,
antibiotics, antihistamines
Wastewater
and surface
water
SPE (HLB) HPLC MS/MS ESI QqLIT 0.1-25 (M) Gros et al,2009
4 Analgesic/ anti-
inflammatory drugs Wastewater
SPE (HLB) GC MS/MS ESI Ion trap n.r Sebok et al, 2008
18
Beta blockers, psychiatric
drugs, Blood lipid
regulators, analgesics/
anti-inflammatory drugs,
antihistamines, stimulants
Wastewater,
surface water,
drinking water
SPE (HLB and
MCX )
GC MS EI Q 0.1-28.6 (M) Togola et al, 2008
DLLME: Dispersive liquid-liquid microextraction; EI: Electron impact; HLB: Hydrophilic-lipophilic balance; HF-LPME: Hollow fiber liquid-phase microextraction; n.r: not
reported; ESI: Electrospray ionization; M: Method detection limit; I: Instrument detection limit; UPLC: Ultra-performance liquid chromatography.

27 | P a g e
Chapter 2: Literature review
Multi-residue analysis of human pharmaceuticals in Nairobi River basin, Kenya ©2011K’oreje Kenneth
2.5 Scope of the study
Water quality and scarcity of fresh water are environmental issues that gain priority in both policy and
scientific work. Apart from physical-chemical macroparameters giving information on the overall water
quality, there is more and more concern on the occurrence and effects of so-called emerging organic
micropollutants. In this context, residues of human pharmaceuticals have been reported to occur in the
aquatic environment posing risks to ecosystems and human health.
As reports on such occurrences trickle from various countries, Kenya still lags behind in this research
field. Therefore, the overall scope of this thesis was to investigate water quality in a selected area
around Nairobi, Kenya, and to develop and apply an innovative analytical method enabling the
detection of multi-class pharmaceutical residues in the selected Kenyan waters. To the best of the
author‘s knowledge, there is no study/report before on the occurrence of pharmaceutical residues in the
aquatic system of the nation. For this work, the Nairobi River basin was selected as the study area, and
eight specific sampling sites were defined along the main river and its tributaries.
Three specific objectives have been formulated:
A first goal was to obtain an overall view of the general water quality at the selected locations in the
Nairobi River basin. This is in cognizant of the water quality monitoring efforts carried out by the
Water Resource Management Authority (WARMA) of the Kenyan government. Different physical-
chemical parameters like chemical oxygen demand (COD), biological oxygen demand (BOD5), total
suspended and dissolved solids (TSS and TDS), nitrates and nitrites, alkalinity, turbidity, calcium,
magnesium and total hardness, were therefore determined in the collected water samples.
The second goal was to prioritize the target compounds to be focused on for organic micropollutant
analysis. Information on pharmaceutical consumption is scarce in Kenya and there is no analytical
method which has been developed to monitor occurrence of pharmaceuticals in the environment in the
country. A proper methodology had to be developed making use of the available data of the Kenya
Medical Supplies Agency (KEMSA) and based on clear decision criteria to define priority compounds
for trace analysis.
Third, the main scope of this work was to develop an innovative and advanced analytical method
making use of multi-residue extraction and liquid chromatography coupled to high resolution magnetic
sector mass spectrometry. The method had to enable both screening and target analysis possibilities in
order to investigate the occurrence of pharmaceutical residues in the Nairobi River basin. Since no
report on the use of magnetic sector mass spectrometry for this kind of purposes could be found in
literature, all steps of the method including the definition of identification criteria had to be developed
from the beginning. Whereas the initial goal was mainly to provide qualitative data on the occurrence
of selected pharmaceuticals, the use of analytical standards enabled also a first semi-quantitative
calculation of detected concentration levels.

28 | P a g e
Chapter 3: Materials and Methods
Multi-residue analysis of human pharmaceuticals in Nairobi River basin, Kenya ©2011K’oreje Kenneth
CHAPTER 3
MATERIALS AND METHODS
3.1 Chemicals
Acetonitrile, methanol, formic acid, ammonium acetate and deionised water (all HPLC-MS grade) were
purchased from Biosolve, The Netherlands. Hydrochloric acid (37%), sodium hydroxide and Na2EDTA
(disodium ethylene diamine tetra acetic acid) were purchased from Kobian Kenya limited. Analytical
standards (purity 98%) of nevirapine and efavirenz were obtained from Toronto Research Chemicals
(TRC, Canada), while standards (purity >95%) of ibuprofen, paracetamol, sulfadoxine,
sulfamethoxazole, carbamazepine, metronidazole, trimethoprim, lamuvidine, amoxicillin and
zidovudine were purchased from Sigma-Aldrich, Belgium. For quality control, ciprofloxacin (MP
Biomedicals, France), enrofloxacin and levofloxacin (Sigma-Aldrich, Belgium) standards with above
98% purity were used.
3.2 Sampling and sample preparation
3.2.1 Sampling area and sites
The Nairobi River basin is the sampling area of this study and is drained by three main rivers, i.e. the
Nairobi River (ca. 50 km), the Ngong‘ River (ca. 27 km), and the Mathare River (ca. 25 km). The
Nairobi River is the main river, while the Mathare and Ngong‘ Rivers are its tributaries. The three rivers
cut through the Nairobi city and its environments, and finally discharge into the Athi River. The rivers
are exposed to pollution from domestic, industrial, agricultural and hospital and/or clinical waste
discharges.
During the study, seven sampling sites (Figure 12) along the three rivers were chosen, based on their
exposure to pollution sources. As the rivers approach the populated areas of the city, the water quality is
expected to gradually deteriorate downstream. The eighth sampling site was on the effluent discharge
into the river from the Dandora wastewater treatment plant (WWTP). The WWTP uses waste
stabilization pond technology for treatment.

29 | P a g e
Chapter 3: Materials and Methods
Multi-residue analysis of human pharmaceuticals in Nairobi River basin, Kenya ©2011K’oreje Kenneth
Figure 12: Map of the Nairobi River basin showing the sampling sites
Sampling site 1 (Ondiri swamp) is at the source of the Nairobi River. There are few human settlements.
Small-scale farming activities are carried out here. The water is visually clear and transparent.
Sampling site 2 (Outering road, Kariobangi) is characterized by the neigbourhood of partly sewered
residential houses. At this point, the river has gone through the heavily populated estates of Eistleigh,
Gikomba market and Kirinyaga Road, all contributing to domestic waste and industrial pollution (from
informal industries). However, the existence of the vast unutilized land for the Air Force Base gives the
river some time to undergo some self-purification before this point.
Sampling site 3 (Outering road, Riverside) is located within the Mathare informal settlements which is
mainly unsewered. Both clinics and the residents in the area discharge most of their waste into the river.
Sampling site 4 is approximately 300 m downstream from the confluence of the Nairobi River and the
Mathare River. It is also situated after the Dandora waste dump site. Major sources of pollution at this
point are the dump site, domestic sewers, and waste from the surrounding residential estates and
informal settlements upstream.
At sampling site 5, the Ngong‘ river has passed through the industrial area, the Mukuru and the Kibera
slums. Sources of pollution here are most probably the industrial waste discharges and domestic wastes
from the slum dwellers. Hospital waste from hospitals upstream could end up here due to seepage and
surface water run off.
Sampling site 6 is about 100 m downstream the confluence of the Nairobi, Mathare and Ngong‘ rivers.
Main sources of pollution are the domestic and industrial waste discharges from the industries along the
basin. Quarying activities also take place in the area.
6
2 5
3 1 4 8 WWTP
PP 7 6
1:385700

30 | P a g e
Chapter 3: Materials and Methods
Multi-residue analysis of human pharmaceuticals in Nairobi River basin, Kenya ©2011K’oreje Kenneth
Sampling site 7 represents the effluent sample from the Dandora WWTP discharge. The efficiency of
the treatment plant determines the type of pollutants that can be detected in the river.
Sampling site 8 is about 500 m downstream from the effluent discharge point. The area has virtually no
human settlement. Pollution at this point is mainly expected to originate from upstream sources and the
WWTP effluent.
3.2.2 Sampling period and method
Sampling was done within a period of three days, i.e. the 27th
, 28th
and 30th
of July, 2010. All samples
were collected using pre-cleaned 2 L plastic bottles for the determination of the aqueous physical-
chemical parameters, and 1 L white plastic bottles for the organic trace analysis. The grab sampling
technique was used. Water was fetched from approximately 30 cm below the water surface by hand in
shallow areas, while a pre-cleaned plastic bottle with a hanging weight and a handle was used in deeper
sites. The samples were transported to the laboratory in an ice-cooled box and stored in a refrigerator at
4 0C awaiting further treatment within one day.
3.2.3 Sample preparation and extraction for organic trace analysis
Filtration and acidification
The samples were filtered first through a 1.0 µm GF/B Whatmann glass fiber filter (VWR, Belgium),
then through 0.45 µm Whatmann nylon filters (VWR, Belgium) under vacuum. The filtrates were
recollected in pre-cleaned and dry glass reservoirs. The samples were then acidified to pH 2.5 by
addition of concentrated hydrochloric acid (37 wt %) under stirring. The treated samples were kept in a
freezer at -20 0C till extraction was done within 6 days.
Solid-phase extraction (SPE)
The samples were taken out of the freezer and kept in the refrigerator overnight before the extraction.
From each sample, 500 mL was taken; its pH adjusted to 7 using concentrated sodium hydroxide
(NaOH), and 10 mL of a 5% (w/v) Na2EDTA solution was added. Oasis HLB (200 mg, 6 cc) SPE
cartridges were put on the vacuum system, conditioned first using 5 mL of methanol followed by 5 mL
of HPLC grade water (at 23-25 drops/minute) without vacuum. Oasis HLB cartridges (Figure 13) were
chosen due to their ability to simultaneously extract acidic, neutral and basic polar analytes at a wide
range of pH values (see section 2.4.1).
The samples were then loaded at a flow rate of 3-10 mL/min under vacuum. After that, the cartridges
were washed using 5 mL of HPLC grade water followed by vacuum drying for 15-20 minutes. The
cartridges were wrapped into aluminum foil and kept in the freezer at -20 0C till the day before
travelling. Then, they were kept in a refrigerator at 4 0C overnight before the travel date. At the Ghent
University, the cartridges were stored again at -18 0C prior to analyte elution. Figure 14 shows the
extraction set-up.

31 | P a g e
Chapter 3: Materials and Methods
Multi-residue analysis of human pharmaceuticals in Nairobi River basin, Kenya ©2011K’oreje Kenneth
Figure 13: SPE cartridge sample Figure 14: SPE extraction set-up
(Van Langenhove and Demeestere, 2010)
Sample elution and reconstitution
Analytes were eluted with 2 x 5 mL of methanol using IST (International Sorbent Technology)
VacMaster-10 SPE equipment. The elution was carried out dropwise without vacuum. After elution, the
cartridges were dried under vacuum for 20 minutes. The eluted samples were evaporated to dryness at
25 0C with a gentle stream of nitrogen using Turbovap (Caliper Life Sciences) equipment at a pressure
of 5-12.5 psi. Drying was closely monitored to avoid volatilization and irreversible adsorption of the
analytes on the walls of the polypropylene vial. The dry extracts were reconstituted with 2.5 mL of
acetonitrile/water (10/90), vortexed and centrifuged using an EBA 20 centrifuge at 1000 rpm for two
minutes. After that, the reconstituted extracts were transferred into HPLC vials and stored at -18 0C for
further instrumental analysis.
3.3 Analysis of physical-chemical parameters
Physical-chemical parameters of the sampled water were determined according to the methods
developed by APHA (2005). Analyzed parameters included pH, conductivity and temperature (carried
out on site), chemical oxygen demand (COD), biological oxygen demand (BOD5), total suspended
solids (TSS), total dissolved solids (TDS), nitrates, nitrites, alkalinity, turbidity, calcium, magnesium,
total hardness, fluoride and iron.

32 | P a g e
Chapter 3: Materials and Methods
Multi-residue analysis of human pharmaceuticals in Nairobi River basin, Kenya ©2011K’oreje Kenneth
3.4 Instrumental organic trace analysis
3.4.1 High Performance Liquid Chromatography (HPLC)
A Surveyor HPLC system (Thermo Finnigan, San Jose, USA) was used for separation of the analytes.
The analytes were separated on a Phenomenex Luna C18 (2) column (3 μm, 100Å (pore size) - 150 x 2.0
mm). The tray temperature and oven control were set at 15 0C and 35
0C, respectively. A binary mobile
phase consisting of methanol (A) and 0.1% formic acid in water (B) was used. The elution program was
as follows: the column was equilibrated using 10% A and 90% B for 1 minute. The gradient was then
increased rapidly to 20% A and 80% B in 0.05 minutes and held constant for 8.95 minutes. It was then
increased to 30% A and 70% B in 14 minutes, and then to 100% A in 10 minutes. It was kept constant
for 10 minutes, before returning to the starting condition in 1 minute. It was then equilibrated for 20
minutes prior to the next run, thus giving a 65 minutes run time. Partial loop injection was applied and
the injection volume was 10 µL. The mobile phase flow rate was 170 µL/minute.
3.4.2 Mass Spectrometry
To detect the compounds, a Thermo Finnigan double focussing magnetic sector MAT95XP–TRAP high
resolution mass spectrometer (HRMS) (Thermo Finnigan, Bremen, Germany) coupled to the HPLC
instrument was used (Figure 15). Ionization was done by electrospray ionization (ESI) in the positive
mode. The spray voltage was 3 kV. Nitrogen was used as both the auxillary and sheath gas, at settings
of 20 units and 4 bars, respectively. The lens voltage was 106-182 V, and the capillary temperature and
voltage were set at 250 0C and 4-84 V, respectively.
Figure 15: Schematic diagram of the HPLC-HRMS sequence
The instrument was operated in two different modes: (i) electric scan (escan) and (ii) multiple ion
detection (MID), both at a mass resolution of 8,000 (10% valley definition, corresponding to 16,000 at
full width at half maximum (FWHM)).
In the escan mode, a full scan measurement is aimed at. Full scan (all the ions in the spectrum of
interest can be measured) is important for screening because it allows determination of compounds
which were originally not targeted.
HPLC
Waste fraction
PEG 300/200 - solution
Mass spectrometer
Vinj = 10µL
Q = 170 µL/min Q = 170
µL/min Q = 50 µL/min
Q = 130
µL/min
Q = 40
µL/min Q = 10 µL/min

33 | P a g e
Chapter 3: Materials and Methods
Multi-residue analysis of human pharmaceuticals in Nairobi River basin, Kenya ©2011K’oreje Kenneth
In the escan methodology, the instrument is set at the maximum accelerating voltage V (ca. 5 kV) and
the strength of the magnetic field B is adjusted to the value corresponding to the initial mass (m/z) to be
measured (see Equation 1 in Section 2.4.3). In the next step, the accelerating voltage is reduced in a
continuous way, so that all masses in a given m/z interval (if V decreases and B is constant, the
measured m/z increases) are measured one after each other. However, reducing the accelerating voltage
V also leads to a lower kinetic energy of the ions as defined by Ekin = z.e.V (where Ekin: kinetic energy,
V: accelerating voltage, z.e: total charge). Since the instrument is tuned at the maximum accelerating
voltage, this results into a decreased ion intensity. To overcome too pronounced intensity loss, smaller
mass ranges are scanned in different mass windows. The mass range within one mass window is based
on the rule that the highest mass should not be higher than 1.2 times the lowest mass. To ensure a good
mass accuracy, the scan speed is set at ≥ 15 sec/decade.
In the MID mode, instead of the full scan approach, a target analysis of a selected number of predefined
masses is aimed. This makes it the preferred technique for target analysis but not appropriate for
untargeted screening. Therefore, like in escan, the strength of the magnetic field is fixed at a given
value, corresponding to a targeted m/z at the maximum accelerating voltage. Then, the accelerating
voltage is reduced, not continuously like in the escan mode but stepwise, in order to obtain a
consecutive pass of the predefined masses (with a mass width around each targeted m/z depending on
the mass resolution of the instrument) through the mass analyzer. The instrument measures that region
where the ion of interest will appear while all the other regions of the mass spectrum are excluded from
the measurement. This leads to a better (at least one order of magnitude) signal-to-noise (S/N) ratio in
the ion current chromatograms. Therefore, for quantification purposes, the MID approach is used (see
Section 4.3.3). To obtain the best S/N ratio as well as at least 10 data points per chromatographic peak
(typical peak width in the order of 1 minute), the measuring time for each ion (i.e. the time during
which each ion is recorded during one cycle time) was set as close as possible to the maximum of 500
milliseconds. This resulted in a MID cycle time (i.e. the time between two consecutive measurements
of the same ion) between 0.9-2.8 sec.
For accurate mass measurement, polyethylene glycol mixtures with average molecular weights of 200
and 300 g/mol (Acros Organics, Belgium) dissolved in a methanol (0.5% formic acid), were used as
internal reference compounds. They were continuously introduced at a flow rate of 10 µL/minute into
the HPLC eluent before it enters the MS. PEGs provide each escan and MID mass window (mass
window in which the mass calibration takes place) with a specific lock and calibration mass. In every
single escan or MID measurement cycle time, the instrument automatically carries out an electric mass
calibration taking these two reference masses as calibration points. This ensures the most accurate,
selective and sensitive analysis of the target compound. ESI optimization (tuning) was done on a
selected [PEG+H]+ or [PEG+NH4]
+ ion.
In the final analysis of the focus compounds (see Section 4.3.2), their protonated molecular ion [M+H]+
or ammonium adducts [M+NH4]+ were measured. Based on the expected retention times determined
during escan analysis of a limited number of samples (see Section 4.3.1), time windows were defined in
the final detection method of the focus compounds.

34 | P a g e
Chapter 3: Materials and Methods
Multi-residue analysis of human pharmaceuticals in Nairobi River basin, Kenya ©2011K’oreje Kenneth
This means that the total chromatographic run time is divided in different time sections, during which a
specific mass window is measured. In this way, the number of injections (analysis per sample) needed
to obtain measurements in a given m/z range, can be reduced drastically.
Considering the variation in their masses (molar mass range between 151 and 365 g/mol), retention
times and mode of detection (i.e. by the protonated ion or ammonium adduct), the focus compounds
(see Appendix I for molecular structures) were clustered into three subgroups. Subgroup A (containing
lamivudine, metronidazole, paracetamol, methyldopa, zidovudine, sulfamethoxazole, carbamazepine,
and nevirapine) covered a m/z range of 150-284 in 6 time windows. Subgroup B (trimethoprim,
amoxicillin, sulfadoxine and benzylpenicillin) represented the m/z range of 282-372 analyzed in 4 time
windows. All compounds in subgroups A and B were detected as the protonated molecular ion.
Subgroup C (ibuprofen, efavirenz, and zidovudine) covered a m/z range of 211-346 in 3 time windows.
These compounds were detected as the ammonium adduct [M+NH4]+ ion. Peak integration was done
using Xcalibur software.
For quality control, 1 mg/L of ciprofloxacin, levofloxacin and enrofloxacin standards were used at the
beginning and at the end of each MID analytical sequence, to monitor the stability of the instrument.
Figure 16 shows the set-up used for instrumental analysis. Detailed information can be found at the
AMBERLab website (www.Amberlab.UGent.be).
Figure 16: Instrumental analysis set-up (AmberLab, UGent)
HPLC MS

35 | P a g e
Chapter 4: Results and discussion
Multi-residue analysis of human pharmaceuticals in Nairobi River basin, Kenya ©2011K’oreje Kenneth
CHAPTER 4
RESULTS AND DISCUSSION
4.1 Water quality of the Nairobi River basin: physical-chemical parameters
Good water quality is vital not only for a healthy ecosystem but also for human well-being. It is
therefore important to monitor the physical-chemical parameters of water for proper management of
river water quality. On the other hand, physical-chemical parameters may affect the occurrence of
pharmaceuticals in the aquatic systems. Their knowledge may help in explaining the observations made
during the analysis of pharmaceuticals in such systems. For instance, high turbidity inhibits light
penetration in water thus impedes photodegradation of PAIs. Similarly, high concentration of hardness
ion improves removal of PAIs by complexation (Gartiser et al., 2007) while TSS affect removal by
sorption. Moreover, temperature influences hydrolysis and other chemical and biological reactions in
the aquatic systems (Bergheim et al., 2010). pH not only affects the activity of aquatic microorganisms
but also metal speciation which in turn determines complexation and sorption processes. It also
determines the existence state of some PAIs in water i.e. ionic or non-ionic form, thereby influencing
their physical and chemical properties such as polarity.
The analytical results of the physical-chemical parameters in water samples of the Nairobi River basin
in eight sites are presented in Table 6.
Table 6: Water quality of the Nairobi River basin
Units Site 1 Site 2 Site 3 Site 4 Site 5 Site 6 Site 7 Site 8
Kenyan standards
for effluent
Temperature 0C 22.9 21.9 21.9 20.7 22.9 20.7 20.9 20.6 x
pH 7.13 7.74 7.52 7.28 7.67 7.89 7.98 7.94 6.5-8.5
COD O2 mg/L 19 60 594 348 426 271 361 194 50
BOD5 O2 mg/L 4 40 460 240 340 140 210 120 30
BOD5/ COD
0.20 0.67 0.77 0.69 0.80 0.52 0.58 0.62 x
Conductivity µS/cm 240 559 720 662 1080 642 1061 778 x
Total Dissolved Solids(TDS) mg/L 149 347 446 410 670 398 658 482 1200
Total Suspended Solids(TSS) mg/L 20 100 380 480 140 160 80 100 30
Total Alkalinity mg/L 222 294 292 298 370 258 392 276 x
Turbidity NTU 22 210 56 47 115 43 139 88 x
Sulphates (SO42-) mg/L 0 3.4 12.6 34.9 31.7 23.7 22.3 19.1 x
Nitrite (NO2-) mg/L <0.01 <0.01 <0.01 0.02 <0.01 <0.01 0.07 <0.01
100 Nitrates (NO3
-) mg/L 0.5 0.9 0.8 1.2 1.3 0.9 1.1 0.9
Chloride (Cl-) mg/L 37 61 65 59 98 61 100 74 250
Iron (Fe2+) mg/L 0.7 1.3 6.2 5.9 5.4 3.2 0.9 2.1 10
Calcium (Ca2+) mg/L 11.2 28.0 18.4 27.2 37.6 17.6 30.4 32.8 x
Magnesium(Mg2+) mg/L 2.9 8.3 9.2 13.1 23.6 10.2 0.02 10.2 x
Total Hardness mg/L CaCO3 40 104 98 122 190 86 76 124 x
Fluoride (F-) mg/L 0.4 1.2 0.8 1.0 3.9 1.6 2.8 2.2 1.5
*NTU: Nephelometric Turbidity Unit; x: not reported

36 | P a g e
Chapter 4: Results and discussion
Multi-residue analysis of human pharmaceuticals in Nairobi River basin, Kenya ©2011K’oreje Kenneth
The temperature ranged from 20.6 to 22.9 0C. This variation can mainly be explained by differences in
the sampling time of the day. Exposure of the sites to solar radiation and any thermal discharge into the
rivers from industries can also be a factor. The pH fell within the normal pH for natural systems (6.5 –
8.5). The pH of the samples ranged between 7.1 (river) to 8.0 (effluent). The high pH in the effluent
could be due to a reduced amount of carbon dioxide due to photosynthesis by algae and macrophytes,
thus lowering the production of carbonic acid (Babović et al., 2011). The final effluent from waste
stabilization ponds often contains significant concentrations of algae (Shilton and Wamsley, 2005). This
may also explain the increase in pH at site 8 (downstream) compared to site 6 because more algae are
discharged into the river at the effluent of the WWTP. The COD and BOD5 ranged from 19–594 and 4–
460 mg O2/L, respectively. The highest concentrations were recorded at site 3, which could be due to
the high discharge of domestic waste (organic load) by the residents of the informal settlements of
Mathare, where there are neither sewerage systems nor solid waste management systems. There is,
however, a gradual decrease of BOD and COD downstream as the river undergoes self purification and
reduced sources of contamination.
The conductivity ranged from 240 to 1080 µS/cm with the highest conductivity being recorded at site 5.
This corresponded with high concentrations of ions like chloride, iron, calcium, magnesium, fluoride
and sulphate at this site. Indeed, an increase in electric conductivity occurs due to higher anionic
(carbonate, bicarbonate, chloride and nitrite ions) and cationic (calcium and magnesium ions) contents
in water (Babović et al., 2011). Possibly, the ions could be originating from the industrial waste
discharges in the area and domestic waste to some extent. Nitrite and nitrate concentrations were
generally low (<0.1 and <1.5 mg/L, respectively) in all the sampling sites possibly because of minor
agricultural activities in the basin‘s riparian.
Total alkalinity and total hardness were recorded in the range of 222 to 392 mg/L and 40 to 190 mg
CaCO3/L, respectively. High alkalinity and total water hardness may partially abate toxic effects of
heavy metals to water life (Babović et al., 2011). Moreover, high alkalinity ensures good buffering
capacity of a river system. This could explain the general stability of the pH despite the possible effects
of waste discharges. The highest iron concentration was recorded at site 3 (6.2 mg/L). This could be
due to the rusting iron sheet materials used in the construction of the shacks in the Mathare slum.
Generally, all the parameters tested registered the lowest values at site 1 (upstream). This was quite
expected as the area is less exposed to pollution sources, human activities and settlement. From the
results, it is evident that parts of the river are actually more polluted than the WWTP effluent,
especially sites 3, 4, and 5.
It can also be noted that there is a general reduction in the concentrations of the parameters downstream
especially at site 6. This can be attributed to reducing human settlements and activities in the area as
well as river self purification.

37 | P a g e
Chapter 4: Results and discussion
Multi-residue analysis of human pharmaceuticals in Nairobi River basin, Kenya ©2011K’oreje Kenneth
4.2 Prioritization of pharmaceutical compounds for trace analysis
Pharmaceuticals are many and of diverse classes. This poses challenges on their analysis in the
environment. It is imperative that a good system not only considers the quantity of pharmaceuticals
consumed but also class diversity when choosing priority compounds for analysis. Apart from
consumption quantity, probable exposure concentrations in the aquatic systems and effects (risk posed)
can also be employed (Besse and Garric, 2008). However, limited data on such properties has hindered
its application, thereby forcing many researchers to use consumption quantity. Al-Oldaini et al. (2010)
selected target compounds based on top 40 highly used drugs and non prescribed drugs (also called
over the counter) in Malaysia. Gros et al. (2009) selected target compounds based on their occurrence
and ubiquitous occurrence in the aquatic environment as reported in literature. Since drug consumption
varies from country to country, literature-based methods may not be applicable in some areas. For
instance, antimalarials may occur in tropical waters but absent in the temperate regions, thus may not
be reported in literature from Western countries. Therefore, a selection of target compounds in Africa
based on literature alone may ignore important compounds.
In this research, the selection of target compounds was based on the data of the quantity of each
pharmaceutical supplied by the Kenya Medical Supplies Agency (KEMSA) to government hospitals
and clinics in the Nairobi region. The region has a population of approximately 3.2 million. A total of
96 pharmaceuticals (some supplied in combination with one another) were supplied in 2008
representing 28.8 tons/year. Based on these data, the drugs were grouped into 17 different therapeutic
classes (Table 7).
Table 7: Classes and quantity of pharmaceuticals supplied to the hospitals by KEMSA in 2008
Therapeutic
Class Name of compound
QTY supplied
(g) to hospitals
Share (%) of each
class in the total
QTY supplied
Share (%) of each
compound within its
class
Share (%) of each
compound in the total QTY
supplied
Antibiotics
Co-Trimoxazole 7,833,196.60
60.84% 27.24%
Amoxycillin 2,886,715.00
22.42% 10.04%
Metronidazol 743,807.60
5.78% 2.59%
Azithromycim 324,342.50
2.52% 1.13%
Ciprofloxacin 267,235.00
2.08% 0.93%
Benzylpenicillin 218,730.00
1.70% 0.76%
Erythromycin 202,125.00
1.57% 0.70%
Streptomycin 175,000.00
1.36% 0.61%
Doxycycline 137,300.00
1.07% 0.48%
Benzathine 33854.4
0.26% 0.12%
Ceftriaxone 18,808.00
0.15% 0.07%
Ceftriaxone 18,808.00
0.15% 0.00%
Norfloxacin 13,720.00
0.11% 0.05%
Flucloxacil 9,000.00
0.07% 0.03%
Gentamicin 5,558.00
0.04% 0.02%
Tetracycline 3,517.40
0.03% 0.01%
Ofloxacin 2,540.00
0.02% 0.01%
Ampicillin 500.00
0.00% 0.00%
Total 12,875,949.50 44.770%

38 | P a g e
Chapter 4: Results and discussion
Multi-residue analysis of human pharmaceuticals in Nairobi River basin, Kenya ©2011K’oreje Kenneth
Table 7 continued…
Therapeutic
Class Name of compound
QTY
supplied (g)
to hospitals
Share (%) of
each class in
the total QTY
supplied
Share (%) of each
compound within its
class
Share (%) of each compound
in the total QTY supplied
Analgesic, anti-
infammatory
drugs
Paracetamol 4,250,160.00
74.60% 14.78%
Ibuprofen 987,400.00
17.33% 3.43%
Acetylsalicylic Acid (Aspirin) 427,200.00
7.50% 1.49%
Diclofenac 13,345.00
0.23% 0.05%
Hydrocortisone 9,374.15
0.16% 0.03%
Amitriptyline 5,150.00
0.09% 0.02%
Aminophylline 2,439.25
0.04% 0.01%
Prednisolone 1,860.00
0.03% 0.01%
Pethidine 278.00
0.00% 0.00%
Dexamethasone 20.00
0.00% 0.00%
Loperamide 15.00
0.00% 0.00%
Codeine 11.00
0.00% 0.00%
Loperamide 10.00
0.00% 0.00%
Total 5,697,237.60 19.809%
Antimalarials
Artemether- Lumefantrine 4,485,156.48
86.29% 15.59%
Sulfadoxine +Pyrimethamine
627,500.00
12.07% 2.18%
Quinine Sulphate 84,954.00
1.63% 0.30%
Total 5,197,610.48 18.072%
Antiretrovirals
(ARV)
Stavudine+Lamivudine+Nevirapine 1,737,153.60
39.63% 6.04%
Zidovudine+Lamivudine+Nevirapine 1,173,081.00
26.76% 4.08%
Efavirenz 670,153.50
15.29% 2.33%
Lamivudine +Zidovudine 479,790.00
10.95% 1.67%
Stavudine +Lamivudine 296,913.60
6.77% 1.03%
Lamivudine 11,422.80
0.26% 0.04%
Zidovudine 8,956.00
0.20% 0.03%
Nevirapine 2,500.00
0.06% 0.01%
Abacavir (Ziagen) 1,705.68
0.04% 0.01%
Tenofovir 1,593.00
0.04% 0.01%
Lopinavir +Ritonavir 144.00
0.00% 0.00%
Stavudine 85.50
0.00% 0.00%
Total 4,383,498.68 15.241%
Anthelmitics Albendazole 186,800.00
99.84% 0.65%
Praziquantel 300.00
0.16% 0.00%
Total 187,100.00 0.651%
Antifungals
Ketoconazole 87,294.00
56.53% 0.30%
Clotrimazole 32,530.60
21.07% 0.11%
Nystatin 27,288.00
17.67% 0.09%
Fluconazole 6,809.60
4.41% 0.02%
Fluconazole 505.00
0.33% 0.00%
Total 154,427.20 0.537%
Antipsychotics
Chlorpromazine 96,309.30
72.27% 0.33%
Phenobarbitone 12,471.00
9.36% 0.04%
Carbamazepine 10,160.00
7.62% 0.04%
Haloperidol 9,583.00
7.19% 0.03%
Phenytoin Sodium 3,250.00
2.44% 0.01%
Diazepam 930.00
0.70% 0.00%
Risperidone 393.90
0.30% 0.00%
Flupenthixol Decanoate 128.20
0.10% 0.00%
Fluphenazine 45.25
0.03% 0.00%
Total 133,270.65 0.463%
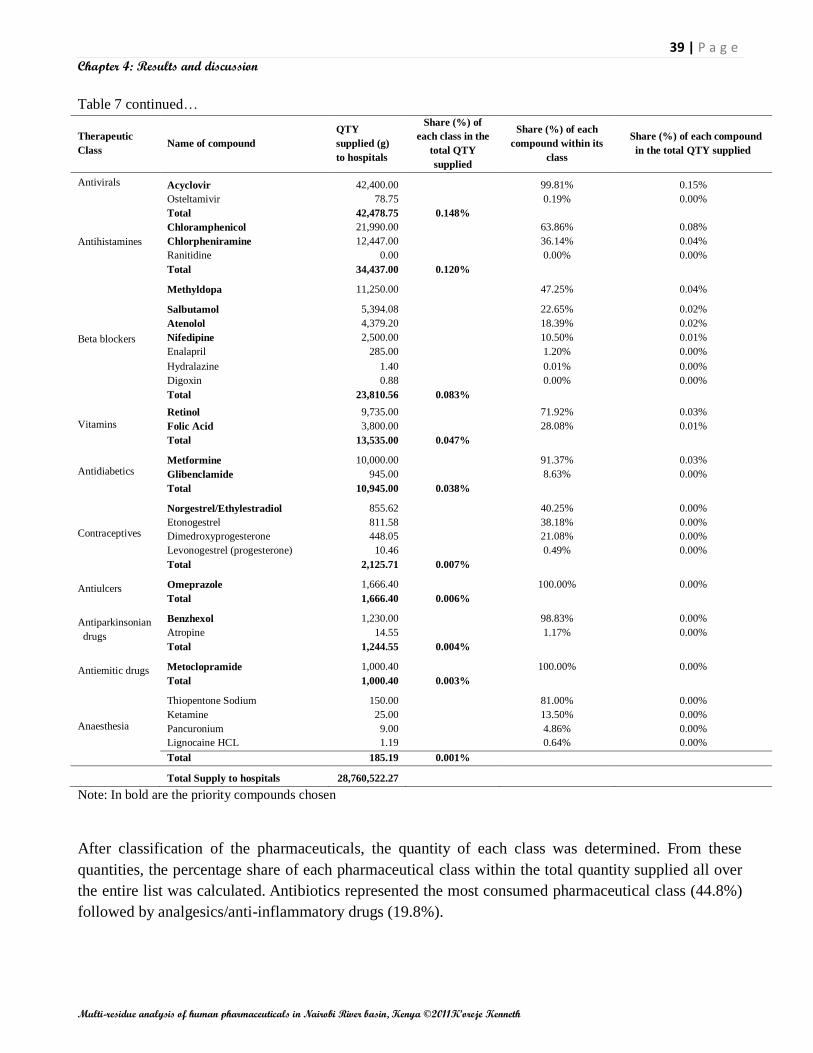
39 | P a g e
Chapter 4: Results and discussion
Multi-residue analysis of human pharmaceuticals in Nairobi River basin, Kenya ©2011K’oreje Kenneth
Note: In bold are the priority compounds chosen
After classification of the pharmaceuticals, the quantity of each class was determined. From these
quantities, the percentage share of each pharmaceutical class within the total quantity supplied all over
the entire list was calculated. Antibiotics represented the most consumed pharmaceutical class (44.8%)
followed by analgesics/anti-inflammatory drugs (19.8%).
Table 7 continued…
Therapeutic
Class Name of compound
QTY
supplied (g)
to hospitals
Share (%) of
each class in the
total QTY
supplied
Share (%) of each
compound within its
class
Share (%) of each compound
in the total QTY supplied
Antivirals
Acyclovir 42,400.00
99.81% 0.15%
Osteltamivir 78.75
0.19% 0.00%
Total 42,478.75 0.148%
Antihistamines
Chloramphenicol 21,990.00
63.86% 0.08%
Chlorpheniramine 12,447.00
36.14% 0.04%
Ranitidine 0.00
0.00% 0.00%
Total 34,437.00 0.120%
Beta blockers
Methyldopa 11,250.00
47.25% 0.04%
Salbutamol 5,394.08
22.65% 0.02%
Atenolol 4,379.20
18.39% 0.02%
Nifedipine 2,500.00
10.50% 0.01%
Enalapril 285.00
1.20% 0.00%
Hydralazine 1.40
0.01% 0.00%
Digoxin 0.88
0.00% 0.00%
Total 23,810.56 0.083%
Vitamins
Retinol 9,735.00
71.92% 0.03%
Folic Acid 3,800.00
28.08% 0.01%
Total 13,535.00 0.047%
Antidiabetics Metformine 10,000.00
91.37% 0.03%
Glibenclamide 945.00
8.63% 0.00%
Total 10,945.00 0.038%
Contraceptives
Norgestrel/Ethylestradiol 855.62
40.25% 0.00%
Etonogestrel 811.58
38.18% 0.00%
Dimedroxyprogesterone 448.05
21.08% 0.00%
Levonogestrel (progesterone) 10.46
0.49% 0.00%
Total 2,125.71 0.007%
Antiulcers Omeprazole 1,666.40
100.00% 0.00%
Total 1,666.40 0.006%
Antiparkinsonian
drugs
Benzhexol 1,230.00
98.83% 0.00%
Atropine 14.55
1.17% 0.00%
Total 1,244.55 0.004%
Antiemitic drugs Metoclopramide 1,000.40
100.00% 0.00%
Total 1,000.40 0.003%
Anaesthesia
Thiopentone Sodium 150.00
81.00% 0.00%
Ketamine 25.00
13.50% 0.00%
Pancuronium 9.00
4.86% 0.00%
Lignocaine HCL 1.19
0.64% 0.00%
Total 185.19 0.001%
Total Supply to hospitals 28,760,522.27

40 | P a g e
Chapter 4: Results and discussion
Multi-residue analysis of human pharmaceuticals in Nairobi River basin, Kenya ©2011K’oreje Kenneth
Antibiotics and analgesics/anti-inflammatory drugs are the most consumed pharmaceutical classes
because of their ease of access (non prescription) and high prevalence of bacterial infections (Fent et
al., 2006, Zuccato et al., 2010).
The percentage share of each pharmaceutical compound within the total supply was also determined.
Co-trimethoxazole (27.7%) was the most consumed drug probably due to its usage in the treatment of
diverse bacterial infections. It was followed by artemether-lumefantrine (15.6%). Promotion of the use
of artemisinin-based combination therapies (ACTs) as the first line drugs for malaria treatment by the
government could explain its high consumption. For each compound, its percentage contribution within
its class was calculated. For instance, paracetamol was the most consumed compound (74.6%) within
the analgesics/anti-inflammatory drugs class.
Based on the percentage share of each pharmaceutical class within the total supply, the classes were
divided into major and minor groups. Each class representing more than 10% of the total drugs supply
were considered as a major group each and were kept individually. Four major groups were noticed: (1)
antibiotics, (2) analgesics/anti-inflammatory drugs, (3) antiretrovirals, and (4) antimalarials. Minor
classes were defined as those representing less than 10% of the total supply, and were merged into two
subgroups. Subgroup A lumped together all classes having a share of 0.1<10%; and subgroup B merged
all classes with a contribution less than 0.1% (Table 8a and 8b).
Table 8a: List of minor group (subgroup A)
Minor group
(0.1%<10%)
QTY supplied (g)
Share (%) of each compound within its
group
Share (%) of each compound in the total QTY
supplied Name of compound
Albendazole 186,800.00 33.86% 0.650%
Chlorpromazine 96,309.30 17.46% 0.335%
Ketoconazole 87,294.00 15.82% 0.304%
Acyclovir 42,400.00 7.69% 0.147%
Clotrimazole 32,530.60 5.90% 0.113%
Nystatin 27,288.00 4.95% 0.095%
Chloramphenicol 21,990.00 3.99% 0.076%
Phenobarbitone 12,471.00 2.26% 0.043%
Chlorpheniramine 12,447.00 2.26% 0.043%
Carbamazepine 10,160.00 1.84% 0.035%
Haloperidol 9,583.00 1.74% 0.033%
Fluconazole 6,809.60 1.23% 0.024%
Phenytoin Sodium 3,250.00 0.59% 0.011%
Diazepam 930.00 0.17% 0.003%
Fluconazole 505.00 0.09% 0.002%
Risperidone 393.90 0.07% 0.001%
Praziquantel 300.00 0.05% 0.001%
Flupenthixol Decanoate 128.20 0.02% 0.000%
Osteltamivir 78.75 0.01% 0.000%
Fluphenazine 45.25 0.01% 0.000%
Mebendazole 0.00 0.00% 0.000%
Phenytoin 0.00 0.00% 0.000%
Ranitidine 0.00 0.00% 0.000%
Total 551,713.60

41 | P a g e
Chapter 4: Results and discussion
Multi-residue analysis of human pharmaceuticals in Nairobi River basin, Kenya ©2011K’oreje Kenneth
Table 8b: List of minor group (subgroup B)
Minor group (<0.1%)
QTY supplied (g)
Share (%) of each compound within its
group
Share (%) of each compound in the total QTY
supplied
Methyldopa 11,250.00 20.64% 0.039%
Metformine 10,000.00 18.34% 0.035%
Retinol 9,735.00 17.86% 0.034%
Salbutamol 5,394.08 9.90% 0.019%
Atenolol 4,379.20 8.03% 0.015%
Folic Acid 3,800.00 6.97% 0.013%
Nifedipine 2,500.00 4.59% 0.009%
Omeprazole 1,426.40 2.62% 0.005%
Benzhexol 1,230.00 2.26% 0.004%
Metoclopramide 1,000.40 1.84% 0.003%
Glibenclamide 945.00 1.73% 0.003%
Norgestrel/Ethylestradiol 855.62 1.57% 0.003%
Etonogestrel 811.58 1.49% 0.003%
Dimedroxyprogesterone 448.05 0.82% 0.002%
Enalapril 285.00 0.52% 0.001%
Omeprazole 240.00 0.44% 0.001%
Thiopentone Sodium 150.00 0.28% 0.001%
Ketamine 25.00 0.05% 0.000%
Atropine 14.55 0.03% 0.000%
Levonogestrel
(progesterone) 10.46 0.02% 0.000%
Pancuronium 9.00 0.02% 0.000%
Hydralazine 1.40 0.00% 0.000%
Lignocaine HCL 1.19 0.00% 0.000%
Digoxin 0.88 0.00% 0.000%
Medroxyprogesterone 0.00 0.00% 0.000%
Total 54,512.81
Within each major group and subgroup A (antihistamines, antivirals, antipsychotics, antifungals,
anthelmitics) and B (antipsychotics, antifungal, Anthelmitics), the percentage contribution of all
individual pharmaceutical compounds was calculated. Compounds making 95% of or the first five
compounds in each class and/or group were considered as priority compounds for screening purposes
(see Section 4.3.1). Cognizant of the fact that some compounds are supplied in combined form in a
drug (e.g. Co-Trimoxazole (trimethoprim/sulfamethoxazole)); the two options were considered for
flexibility and diversity of chosen compounds. The overall procedure to select compounds is
summarized in Figure 17. Based on the data analysis, a total number of 43 (Table 7, in bold) initial
priority compounds were selected for screening.
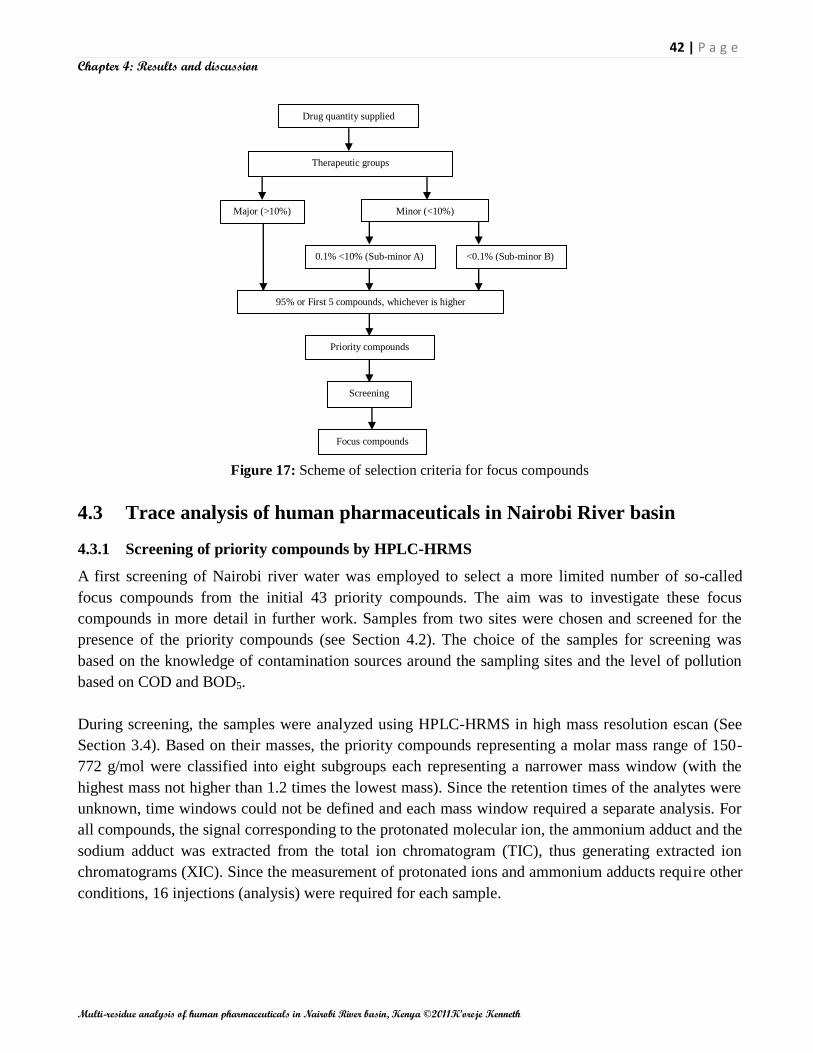
42 | P a g e
Chapter 4: Results and discussion
Multi-residue analysis of human pharmaceuticals in Nairobi River basin, Kenya ©2011K’oreje Kenneth
Drug quantity supplied
Therapeutic groups
Major (>10%) Minor (<10%)
0.1% <10% (Sub-minor A) <0.1% (Sub-minor B)
95% or First 5 compounds, whichever is higher
Priority compounds
Focus compounds
Screening
Figure 17: Scheme of selection criteria for focus compounds
4.3 Trace analysis of human pharmaceuticals in Nairobi River basin
4.3.1 Screening of priority compounds by HPLC-HRMS
A first screening of Nairobi river water was employed to select a more limited number of so-called
focus compounds from the initial 43 priority compounds. The aim was to investigate these focus
compounds in more detail in further work. Samples from two sites were chosen and screened for the
presence of the priority compounds (see Section 4.2). The choice of the samples for screening was
based on the knowledge of contamination sources around the sampling sites and the level of pollution
based on COD and BOD5.
During screening, the samples were analyzed using HPLC-HRMS in high mass resolution escan (See
Section 3.4). Based on their masses, the priority compounds representing a molar mass range of 150-
772 g/mol were classified into eight subgroups each representing a narrower mass window (with the
highest mass not higher than 1.2 times the lowest mass). Since the retention times of the analytes were
unknown, time windows could not be defined and each mass window required a separate analysis. For
all compounds, the signal corresponding to the protonated molecular ion, the ammonium adduct and the
sodium adduct was extracted from the total ion chromatogram (TIC), thus generating extracted ion
chromatograms (XIC). Since the measurement of protonated ions and ammonium adducts require other
conditions, 16 injections (analysis) were required for each sample.

43 | P a g e
Chapter 4: Results and discussion
Multi-residue analysis of human pharmaceuticals in Nairobi River basin, Kenya ©2011K’oreje Kenneth
This explains the importance of having a more limited and reasonable number of focus compounds if
many samples are to be analyzed thus, the need for screening of few samples.
Based on the screening results, the retention times, peak intensity and mass accuracy, expressed as delta
were determined. Delta represents the ratio of the difference between the exact calculated mass
(theoretical value) and the measured mass to the calculated mass, in parts per million (ppm).
Compounds showing a signal with intensity > 40,000 µV and delta < 10 ppm were selected as focus
compounds for further trace analysis. The list of focus compounds is shown in Table 9. It can be noted
that zidovudine was detected both as the protonated ion and the ammonium adduct at different retention
time. Therefore, both ions were incorporated in the list of focus compounds.
Table 9: List of compounds detected during screening
4.3.2 Screening and selective target analysis of 14 focus compounds in Nairobi River basin
Detection and identification of the focus compounds in all collected water samples was done using the
HPLC-HRMS analytical system. Since there were no analytical standards available at the beginning, a
methodology was developed to differentiate in degree of certainty with respect to compound‘s
identification. To do this, two approaches were followed: (i) escan and (ii) MID detection approaches.
The escan is important because it provides mass accuracy (delta) and the ion intensity, while MID is
more selective and sensitive. It provides much better developed chromatographic peaks which provide
the possibility to calculate peak areas as a measure of the compound‘s concentration. Based on their
masses and detection mode (as the protonated molecular ion or as the ammonium adduct), the 14 focus
compounds were divided into 3 subgroups: A, B and C (Table 10), making use of time windows defined
based on the retention times measured during screening (Section 4.3.1). This resulted in a total of 6
analyses per sample (3 escan and 3 MID analyses) to cover the entire group of focus compounds.
Name of compound Ion Retention time Delta (ppm) Intensity (µV)
Sampling site 3 Sampling site 7 Sampling site 3 Sampling site 7
Amoxicillin +H 24.05 -3.578 0.819 77,300 54,100
Benzylpenicillin +H 32.68 -4.655 _ 50,100 _
Carbamazepine +H 35.75 9.911 4.428 40,500 72,900
Efavirenz +NH4 26.49 _ -1.531 _ 52,000
Ibuprofen +NH4 36.59 2.654 3.234 54,500 57,100
Lamivudine +H 3.14 1.869 -0.739 80,100 132,000
Methyldopa +H 17.89 3.630 _ 61,400 _
Metronidazole +H 8.42 1.395 _ 40,900 _
Nevirapine +H 33.39 1.984 2.396 158,000 312,000
Paracetamol +H 8.87 -2.696 _ 599,000 _
Sulfadoxine +H 26.51 -3.890 -5.979 72,400 243,000
Sulfamethoxazole +H 23.35 3.582 3.936 369,000 641,000
Trimethoprim +H 9.48 -3.194 -6.286 570,000 16,000
Zidovudine +H 19.54 1.865 _ 67,100 _
Zidovudine +NH4 31.69 _ -3.332 _ 50,700

44 | P a g e
Chapter 4: Results and discussion
Multi-residue analysis of human pharmaceuticals in Nairobi River basin, Kenya ©2011K’oreje Kenneth
Table 10: Classification of the focus compounds for escan and MID analysis
Compound Time window
Retention
time range Lock-mass Calibration mass [M+H]+ [M+NH4]+
Group A Mass range (151-267)
Lamivudine 1 0-4.0 195.123 239.149 230.05939 -
Metronidazole 2 4.0-11.0 151.096 195.123 172.07167 -
Paracetamol 2 4.0-11.0 151.096 195.123 152.07061 -
Methyldopa 3 11.0-18.5 195.123 239.149 212.09173 -
Zidovudine 4 18.50-34.5 239.149 283.175 268.10403 -
Sulfamethoxazole 4 18.50-34.5 239.149 283.175 254.05939 -
Nevirapine 4 18.50-34.5 239.149 283.175 267.12404 -
Carbamazepine 6 34.5-38.0 195.123 239.149 237.10224 -
Group B Mass range (290-365)
Trimethoprim 1 0-15 283.175 327.201 291.14517 -
Amoxicillin 2 15.0-24.2 327.201 371.228 366.11182 -
Sulfadoxine 3 24.2-27.5 283.175 327.201 311.08085 -
Benzylpenicillin 4 27.5-65.0 327.201 371.228 335.10600 -
Group C: Mass range (206-315)
Efavirenz 1 20-28.0 300.202 344.228 - 333.06122
Zidovudine 2 28.0-36.00 256.175 300.202 - 285.13058
Ibuprofen 3 36.0-40.0 212.149 256.175 - 224.16451
The identification and detection of the compounds was based on four parameters: (i) the retention times
in escan and MID, (ii) the escan ion intensity (µV), (iii) the deviation of the measured mass from the
calculated accurate mass (delta, ppm) and (iv) the standard deviation (STDEV) on the delta (ppm).
First, each compound was isolated from the total ion chromatograms (TIC) (Figure 18) obtained by
both escan and MID analysis, by generating the corresponding extracted ion chromatograms (XIC)
(Figure 19). For peaks having a signal-to-noise (S/N) ratio greater than 3, the retention time, measured
mass and peak intensities (escan) and areas (MID) of each analyte were determined from the XIC. The
delta and standard deviations (STDEV) were then determined. Intensity is an important parameter in
MS as it influences the accuracy of analyte detection. High intensities are good for accurate detections.
Limits of less than 10 ppm (delta) and less than 15 ppm (STDEV) were set for any compound to be
considered as being identified. These limits were based on the experience with the MS instrument in
earlier research and its specifications. Using HPLC-QTOF, Ibáñez et al. (2009) assumed a safe
confirmation if mass accuracies were better than 2mDa (≈7 ppm) and the ion ratio deviations of at least
two ions were between the limits (±15%) established by the European Union.
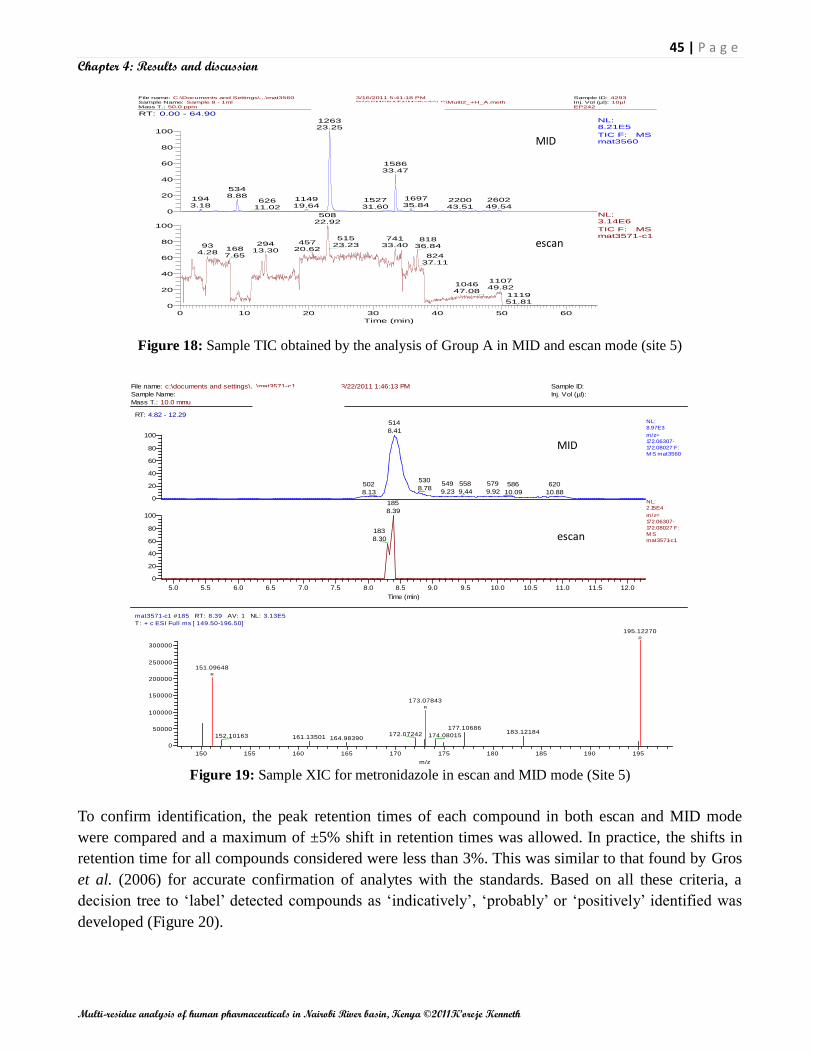
45 | P a g e
Chapter 4: Results and discussion
Multi-residue analysis of human pharmaceuticals in Nairobi River basin, Kenya ©2011K’oreje Kenneth
File name: C:\Documents and Settings\...\mat3560 3/16/2011 5:41:18 PM Sample ID: 4293Sample Name: Sample 8 - 1ml D:\GCMSDATA\Methods\LC\Multi2_+H_A.meth Inj. Vol (µl): 10µlMass T.: 50.0 ppm MID - A - +H EP242
RT: 0.00 - 64.90
0 10 20 30 40 50 60
Time (min)
0
20
40
60
80
100
0
20
40
60
80
100
Relat
ive A
bund
ance
126323.25
158633.47
5348.88 1697
35.841943.18
114919.64
260249.54
220043.51
152731.60
62611.02
50822.92
51523.23
74133.40
81836.84
45720.62
29413.30
934.28
1687.65 824
37.11
110749.82
104647.08
111951.81
NL:8.21E5
TIC F: MS mat3560
NL:3.14E6
TIC F: MS mat3571-c1
mat3560 #2469-2477 RT: 47.54-47.66 AV: 9 NL: 2.97E5T: + c ESI SIM ms [ 150.60-195.62]
155 160 165 170 175 180 185 190 195
m/z
0
50000
100000
150000
200000
250000
Inten
sity
R
R
195.12270
181.04953
MID
escan
File name: c:\documents and settings\...\mat3571-c1 3/22/2011 1:46:13 PM Sample ID:
Sample Name: Inj. Vol (µl):
Mass T.: 10.0 mmu
RT: 4.82 - 12.29
5.0 5.5 6.0 6.5 7.0 7.5 8.0 8.5 9.0 9.5 10.0 10.5 11.0 11.5 12.0
Time (min)
0
20
40
60
80
100
0
20
40
60
80
100
Rela
tive A
bundance
514
8.41
530
8.78549
9.23
558
9.44
579
9.92
620
10.88
586
10.09
502
8.13
185
8.39
183
8.30
NL:
8.97E3
m/z=
172.06307-
172.08027 F:
M S mat3560
NL:
2.15E4
m/z=
172.06307-
172.08027 F:
M S
mat3571-c1
mat3571-c1 #185 RT: 8.39 AV: 1 NL: 3.13E5
T: + c ESI Full ms [ 149.50-196.50]
150 155 160 165 170 175 180 185 190 195
m/z
0
50000
100000
150000
200000
250000
300000
Inte
nsi
ty
R
R
R
195.12270
151.09648
173.07843
177.10686183.12184172.07242 174.08015152.10163 161.13501 164.98390
escan
MID
Figure 18: Sample TIC obtained by the analysis of Group A in MID and escan mode (site 5)
Figure 19: Sample XIC for metronidazole in escan and MID mode (Site 5)
To confirm identification, the peak retention times of each compound in both escan and MID mode
were compared and a maximum of ±5% shift in retention times was allowed. In practice, the shifts in
retention time for all compounds considered were less than 3%. This was similar to that found by Gros
et al. (2006) for accurate confirmation of analytes with the standards. Based on all these criteria, a
decision tree to ‗label‘ detected compounds as ‗indicatively‘, ‗probably‘ or ‗positively‘ identified was
developed (Figure 20).
escan

46 | P a g e
Chapter 4: Results and discussion
Multi-residue analysis of human pharmaceuticals in Nairobi River basin, Kenya ©2011K’oreje Kenneth
Figure 20: Schematics of compound identification criteria
For the positively identified focus compounds, their identification was considered accurate because
their delta fell within the instrument‘s accuracy (<5 ppm) and intensity greater than 100,000 µV, which
is considered good for positive identification. For confirmation of target compounds, the agreement
between the measured and calculated masses within a <5 ppm error level provides an unequivocal
confirmation of the contaminants in the samples (Bueno et al., 2007).
The second category was considered to be probably identified because these compounds having a delta
less than 5 ppm showed the intensities between 50,000 and 100,000 µV.
tR, Escan
Delta and STDEV
Intensity
High resolution escan TIC
Extracted Ion Chromatogram (XIC)
S/N <3 S/N >3
Intensity Escan <50,000 µV or Intensity
Escan >50,000 µV AND delta 5- 10 ppm
Measured mass
Delta >10 ppm or STDEV >15 ppm Delta < 10 ppm AND STDEV <15 ppm ppm
High resolution MID
tR, difference > 5%
Ion peak area, MID
Target compound
Reject
Reject
Reject
tR, difference < 5%
Intensity Escan 50,000 µV – 100,000
µV AND delta < 5 ppm
Intensity Escan > 100,000 µV
AND delta < 5 ppm
Probably identified (b)
Indicatively identified (c) Positively Identified (a)

47 | P a g e
Chapter 4: Results and discussion
Multi-residue analysis of human pharmaceuticals in Nairobi River basin, Kenya ©2011K’oreje Kenneth
The compounds could, therefore, not be accurately considered to be the focus compounds but required
comparison with analytical standards. It is believed that due to their low delta values, there are higher
chances that they could be the focus compounds.
The third category was considered to represent indicatively compounds. They had intensities less than
50,000 µV or higher but delta values higher than 5 (and < 10) ppm, which is considered not good
enough for positive identification. However, instead of outright discard, they can be confirmed by
analysis of analytical standards. They only show weak possibility of the target compounds.
The developed decision tree with abovementioned compound identification criteria was employed to
identify pharmaceuticals in the Nairobi River basin water samples. It is important to notice that this is
the first attempt to determine the occurrence of pharmaceuticals in Kenyan waters. The results of escan
and MID modes are presented in Table 11 and 12, respectively.
Positively identified compounds were paracetamol, sulfamethoxazole, nevirapine, trimethoprim and
sulfadoxine. However, in some sites, these compounds appeared to fall in either of the other two
categories. Similarly, zidovudine and ibuprofen fell in the probably identified focus compounds in some
sites while in others; they appeared to be in the indicative category. Efavirenz, lamivudine,
carbamazepine, metronidazole and amoxicillin were identified as indicative compounds. Most of these
compounds have been detected in wastewater and surface water by other researchers (Al-Oldaini et al.,
2010; Fick et al., 2009; Nödler et al., 2010; Prasse et al., 2010; Zuccato et al., 2010). However, no
studies are found that report detection of efavirenz and sulfadoxine in aquatic systems.
Table 11: Retention time, intensity, delta and STDEV (escan) of detected compounds in the Nairobi River basin
Name of compound tR Site 1 Site 2 Site 3 Site 4
(min) Intensity Delta STDEV Intensity Delta STDEV Intensity Delta STDEV
(µV) (ppm) (ppm) (µV) (ppm) (ppm) (µV) (ppm) (ppm)
Amoxicillin 23.58±0.18 _ 15,000 -4.10 10.17 - - - 12,600 -3.41 5.11
Carbamazepine 35.74±0.02 _ 13,200 20.41 19.68 21,700 25.18 12.72 27,500 17.76 2.87
Efavirenz 25.83±0.00 _ - - - - - - - - -
Ibuprofen 36.66±0.06 _ 51,900 -1.54 19.98 48,500 13.45 8.09 32,700 5.90 4.00
Lamivudine 3.17±0.05 _ - - - 40,200 3.22 5.80 26,500 0.57 3.88
Metronidazole 8.37±0.04 _ 18,000 7.09 8.31 18,600 -12.96 4.64 15,700 -6.04 14.12
Nevirapine 33.37±0.02 _ 63,700 4.83 4.58 537,000 0.56 7.18 217,000 1.68 3.50
Paracetamol 8.84±0.06 _ - - - 362,000 -0.92 4.57 233,000 -0.79 7.45
Sulfadoxine 26.11±0.09 _ - - - 44,200 -2.22 6.16 36,200 -8.94 12.47
Sulfamethoxazole 23.09±0.41 _ - - - 545,000 3.78 5.23 331,000 3.23 2.53
Trimethoprim 9.37±0.07 _ 28,800 -3.06 6.04 364,000 -4.02 3.64 242,000 -2.75 1.55
Zidovudine 19.35±0.09 _ 13,900 -7.39 4.74 47,900 -2.91 7.80 - - --
escan
MID

48 | P a g e
Chapter 4: Results and discussion
Multi-residue analysis of human pharmaceuticals in Nairobi River basin, Kenya ©2011K’oreje Kenneth
Table 11 continued…
Key: yellow: positively identified; red: probably identified; purple: indicatively identified
Table 12: Retention times and peak areas (MID) of detected compounds in the Nairobi River basin
4.3.3 Unequivocal identification and approximative quantification of detected focus
compounds
4.3.3.1 Unequivocal identification of the detected focus compounds
For each of the 12 focus compounds that were ―indicatively‖, ―probably‖ or ―positively‖ identified in at
least one of the water samples, analytical standards were purchased. This is important for their
unequivocal identification as well as quantification. The 12 analytical standards were analysed in
triplicate at a concentration of 1 mg/L via HPLC-HRMS in MID mode. Each analytical standard was
analysed in triplicate. The results are shown in Table 13.
Name of compound Site 5 Site 6 Site 7 Site 8
Intensity Delta STDEV Intensity Delta STDEV Intensity Delta STDEV Intensity Delta STDEV
(µV) (ppm) (ppm) (µV) (ppm) (ppm) (µV) (ppm) (ppm) (µV) (ppm) (ppm)
Amoxicillin 11,900 3.85 13.42 - - - 11,900 -4.51 4.77 - - -
Carbamazepine 26,800 -0.30 13.70 20,800 5.67 9.23 14,700 -6.37 13.76 23,200 11.30 4.51
Efavirenz - - - - - - 28,300 -5.94 8.08 - - -
Ibuprofen 34,000 15.86 0.00 49,100 9.84 12.49 82,500 -1.00 5.53 50,700 6.80 5.93
Lamivudine 21,900 4.30 7.03 44,100 4.35 1.93 40,100 -3.35 11.47 40,600 -2.48 5.54
Metronidazole 13,900 -2.27 6.90 116,000 8.25 7.59 - - - 14,900 -0.41 6.25
Nevirapine 521,000 1.27 6.22 82,300 5.35 5.38 105,000 0.52 6.57 74,500 2.55 3.55
Paracetamol 347,000 0.72 5.89 46,300 0.59 6.99 - - - - - -
Sulfadoxine - - - 11,200 -5.27 13.62 748,000 -1.16 3.25 19,800 -9.93 8.95
Sulfamethoxazole 751,000 6.18 2.80 106,000 -0.08 5.28 243,000 1.73 3.18 136,000 4.83 2.83
Trimethoprim 956,000 -1.96 2.46 123,000 0.96 4.27 5,310 -8.55 8.70 47,400 -1.10 4.12
Zidovudine 24,400 6.71 8.04 22,300 1.57 8.62 - - - 12,600 7.91 12.62
Name of
compound tR (min) Site 1 Site 2 Site 3 Site 4 Site 5 Site 6 Site 7 Site 8
Amoxicillin 23.45±0.03 _ _ 568,516 375,644 185,469 _ 491,737 _
Carbamazepine 35.85±0.01 _ 83,159 _ 286,168 366,348 246,130 282,304 171,955
Efavirenz 25.98±0.00 _ _ _ _ _ _ 117,213 _
Ibuprofen 36.67±0.04 _ _ _ 218,625 _ 434,735 640,170 448,620
Lamivudine 3.21±0.03 _ _ 607,962 538,920 298,817 537,421 502,132 376,336
Metronidazole 8.43±0.01 _ 209,381 _ 162,516 136,649 689,551 _ 176,197
Nevirapine 33.49±0.01 _ 1,139,151 1,860,680 3,652,830 4,731,649 1,213,663 1,730,171 1,271,336
Paracetamol 8.90±0.02 _ _ 5,729,164 3,931,485 1,773,308 657,994 _ _
Sulfadoxine 25.99±0.03 _ _ 1,135,820 1,011,807 _ 204,902 2,543,547 448,517
Sulfamethoxazole 23.24±0.05 _ _ 7,229,743 7,414,097 16,423,693 1,778,740 4,804,985 2,055,733
Trimethoprim 9.39±0.03 _ 1,209,636 7,452,248 5,697,150 16,431,593 2,163,903 _ 728,077
Zidovidine 19.65±0.03 - 157,770 823,719 - 329,771 377,538 - 175,864

49 | P a g e
Chapter 4: Results and discussion
Multi-residue analysis of human pharmaceuticals in Nairobi River basin, Kenya ©2011K’oreje Kenneth
Table 13: Retention time and response factor of the analytical standards
Name of compound Mean retention time (min), n=3 Mean peak area, n=3 Concentartion (mg/L) Response factor
Group A (day 1)
Carbamazepine 35.60±0.02 9,942,970 ±1,625 1.0 9,942,970
Lamivudine 3.02±0.00 4,805,645 ±434,494 1.0 4,805,645
Metronidazole 8.19±0.03 10,018,109 ±1,128,788 1.0 10,018,109
Nevirapine 33.19±0.03 25,300,796 ±1,936,952 1.0 25,300,796
Paracetamol 8.63±0.03 3,651,134±286,789 1.0 3,651,134
Zidovudine _ - - -
Sulfamethoxazole 22.68±0.08 8,092,775 ±416,257 1.0 8,092,775
Group B (day 2)
Trimethoprim 8.91±0.02 37,249,861±784,220 1.0 37,249,861
Amoxicillin 23.25±0.01 5,085± 637 1.0 5,085
Sulfadoxine 25.65±0.09 19,656,109 ±669,211 1.0 19,656,109
Group C (day 3)
Ibuprofen 36.31±0.00 52,322 ±0.0 1.0 52,322
Efavirenz - - - -
For full confirmation, the chromatographic retention times of the focus compounds detected in the
samples were compared with those of the analytical standards. Compounds were considered
unequivocally identified if the shift in retention time was less or equals to ±5% as suggested by other
authors (Gros et al., 2006; Grujić et al., 2009; Lin and Tsai, 2009). All the detected focus compounds
were unequivocally identified except zidovudine and efavirenz. Efavirenz didn‘t show any peak at the
retention time at which it was indicatively detected in the water sample taken at site 7. Given the fact
that, it had a low intensity (28,300 µV) and high delta (5.94), this all indicates that its detection most
probably was a false positive. The reason for the absence of a peak at the expected retention for the
zidovudine standard is not clear.
Overall, these results fortify the applicability of the identification criteria (Figure 20) to classify the
identification power of the focus compounds into three categories. Unequivocal identification of the
detected focus compounds by confirmation analysis of standards is, however, preferable. It might
confirm the detection of compounds that were labeled as indicative based on Figure 20, and thus could
not be accurately confirmed without standards.
From the entire study, the unequivocally identified pharmaceuticals detected in the Nairobi River basin
water were amoxicillin, carbamazepine, ibuprofen, lamivudine, metronidazole, nevirapine,
paracetamol, sulfadoxine, sulfamethoxazole, and trimethoprim.
4.3.3.2 Approximate quantification of the detected focus compounds in water samples
Based on the one-point calibration, the response factors (RF) (Equation 2) of the analytical standards
were determined (see Table 13). These response factors could be used to quantify the detected focus
compounds in the water samples making use of the MID peak areas given in Table 12.
𝑅𝑒𝑠𝑝𝑜𝑛𝑠𝑒 𝑓𝑎𝑐𝑡𝑜𝑟 (𝑅𝐹) =𝑃𝑒𝑎𝑘 𝑎𝑟𝑒𝑎 𝑟𝑒𝑠𝑝𝑜𝑛𝑠𝑒 𝑜𝑓 𝑐𝑎𝑙𝑖𝑏𝑟𝑎𝑡𝑖𝑜𝑛 𝑠𝑡𝑎𝑛𝑑𝑎𝑟𝑑
𝐶𝑜𝑛𝑐𝑒𝑛𝑡𝑟𝑎𝑡𝑖𝑜𝑛 𝑜𝑓 𝑐𝑎𝑙𝑖𝑏𝑟𝑎𝑡𝑖𝑜𝑛 𝑠𝑡𝑎𝑛𝑑𝑎𝑟𝑑 (𝑚𝑔
𝐿) (2)
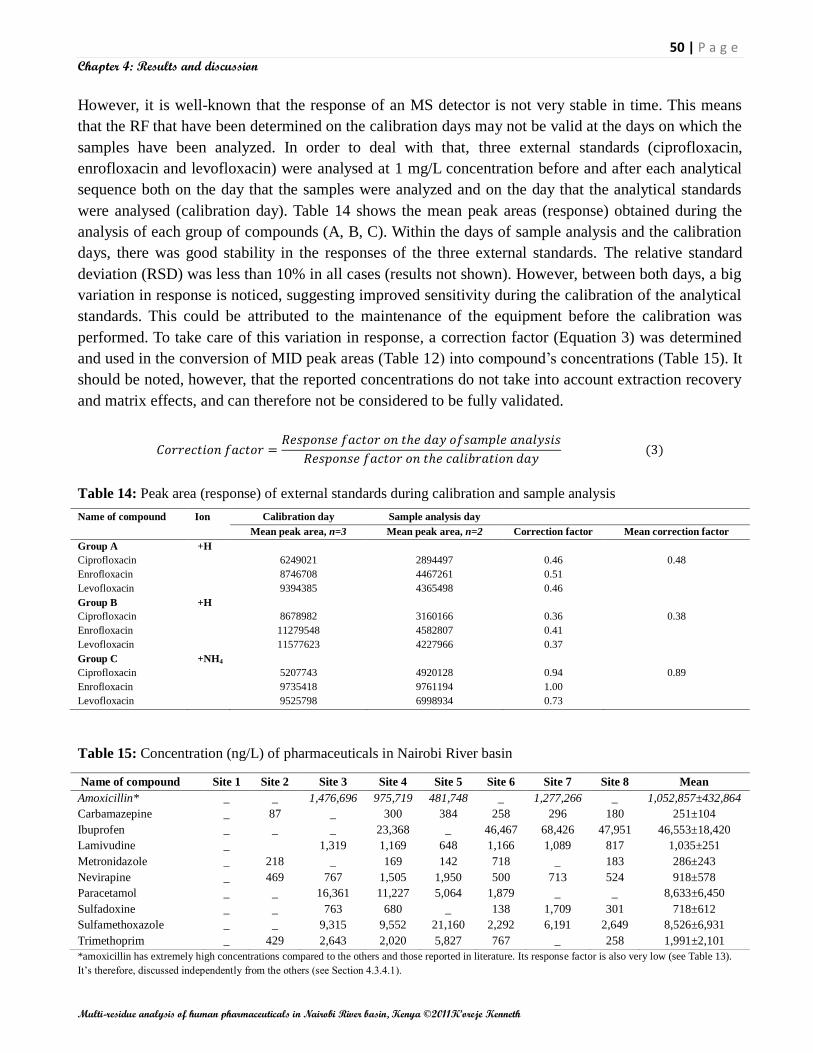
50 | P a g e
Chapter 4: Results and discussion
Multi-residue analysis of human pharmaceuticals in Nairobi River basin, Kenya ©2011K’oreje Kenneth
However, it is well-known that the response of an MS detector is not very stable in time. This means
that the RF that have been determined on the calibration days may not be valid at the days on which the
samples have been analyzed. In order to deal with that, three external standards (ciprofloxacin,
enrofloxacin and levofloxacin) were analysed at 1 mg/L concentration before and after each analytical
sequence both on the day that the samples were analyzed and on the day that the analytical standards
were analysed (calibration day). Table 14 shows the mean peak areas (response) obtained during the
analysis of each group of compounds (A, B, C). Within the days of sample analysis and the calibration
days, there was good stability in the responses of the three external standards. The relative standard
deviation (RSD) was less than 10% in all cases (results not shown). However, between both days, a big
variation in response is noticed, suggesting improved sensitivity during the calibration of the analytical
standards. This could be attributed to the maintenance of the equipment before the calibration was
performed. To take care of this variation in response, a correction factor (Equation 3) was determined
and used in the conversion of MID peak areas (Table 12) into compound‘s concentrations (Table 15). It
should be noted, however, that the reported concentrations do not take into account extraction recovery
and matrix effects, and can therefore not be considered to be fully validated.
𝐶𝑜𝑟𝑟𝑒𝑐𝑡𝑖𝑜𝑛 𝑓𝑎𝑐𝑡𝑜𝑟 =𝑅𝑒𝑠𝑝𝑜𝑛𝑠𝑒 𝑓𝑎𝑐𝑡𝑜𝑟 𝑜𝑛 𝑡𝑒 𝑑𝑎𝑦 𝑜𝑓𝑠𝑎𝑚𝑝𝑙𝑒 𝑎𝑛𝑎𝑙𝑦𝑠𝑖𝑠
𝑅𝑒𝑠𝑝𝑜𝑛𝑠𝑒 𝑓𝑎𝑐𝑡𝑜𝑟 𝑜𝑛 𝑡𝑒 𝑐𝑎𝑙𝑖𝑏𝑟𝑎𝑡𝑖𝑜𝑛 𝑑𝑎𝑦 (3)
Table 14: Peak area (response) of external standards during calibration and sample analysis
Name of compound Ion Calibration day Sample analysis day
Mean peak area, n=3 Mean peak area, n=2 Correction factor Mean correction factor
Group A +H
Ciprofloxacin 6249021 2894497 0.46 0.48
Enrofloxacin 8746708 4467261 0.51
Levofloxacin 9394385 4365498 0.46
Group B +H
Ciprofloxacin 8678982 3160166 0.36 0.38
Enrofloxacin 11279548 4582807 0.41
Levofloxacin 11577623 4227966 0.37
Group C +NH4
Ciprofloxacin 5207743 4920128 0.94 0.89
Enrofloxacin 9735418 9761194 1.00
Levofloxacin 9525798 6998934 0.73
Table 15: Concentration (ng/L) of pharmaceuticals in Nairobi River basin
Name of compound Site 1 Site 2 Site 3 Site 4 Site 5 Site 6 Site 7 Site 8 Mean
Amoxicillin* _ _ 1,476,696 975,719 481,748 _ 1,277,266 _ 1,052,857±432,864
Carbamazepine _ 87 _ 300 384 258 296 180 251±104
Ibuprofen _ _ _ 23,368 _ 46,467 68,426 47,951 46,553±18,420
Lamivudine _
1,319 1,169 648 1,166 1,089 817 1,035±251
Metronidazole _ 218 _ 169 142 718 _ 183 286±243
Nevirapine _ 469 767 1,505 1,950 500 713 524 918±578
Paracetamol _ _ 16,361 11,227 5,064 1,879 _ _ 8,633±6,450
Sulfadoxine _ _ 763 680 _ 138 1,709 301 718±612
Sulfamethoxazole _ _ 9,315 9,552 21,160 2,292 6,191 2,649 8,526±6,931
Trimethoprim _ 429 2,643 2,020 5,827 767 _ 258 1,991±2,101
*amoxicillin has extremely high concentrations compared to the others and those reported in literature. Its response factor is also very low (see Table 13).
It‘s therefore, discussed independently from the others (see Section 4.3.4.1).

51 | P a g e
Chapter 4: Results and discussion
Multi-residue analysis of human pharmaceuticals in Nairobi River basin, Kenya ©2011K’oreje Kenneth
Generally, the mean concentration of pharmaceuticals in the Nairobi River basin ranged from 251 ng/L
to 46 µg/L. The concentrations reduced downstream. Nevirapine is the most frequently detected
compound with a mean concentration of 918 ng/L and ranges from 469-1950 ng/L. Compounds which
recorded high mean concentration levels are ibuprofen (46 µg/L), paracetamol (8.6 µg/L),
sulfamethoxazole (8.5 µg/L) and trimethoprim (2 µg/L).
All the identified focus compounds were detected in sampling site 4, followed by sampling site 6,
which recorded all the compounds except one (amoxicillin). These sites are situated after river
confluences, thus, the convergence of rivers could explain the observation as water from upstream
brings different compounds.
In site 1, none of the target compounds were identified. This fact is buttressed by the results of the
physical-chemical properties at this site which were very low relative to the others. The absence of
domestic and industrial wastewater discharge into the river at this site probably explains this further.
Domestic waste stream has high human drugs contamination (Lin et al., 2009).
In the effluent (site 7), seven out of the ten identified focus compounds were detected at concentrations
ranging from 713 ng/L (nevirapine) to 68 µg/L (ibuprofen). The effluent discharge into the river seemed
to increase the concentrations of some compounds e.g. sulfadoxine downstream.
4.3.4 Discussion
Each day, new pharmaceutical compounds are discovered and registered. Often overlooked are the
possible effects of these compounds on the environment once their intended use has been achieved or in
cases where they are not used, though produced. Nevertheless, some concerned scientists have been
burning the midnight oil to reveal if indeed they may have effects. Antibiotics have been reported to
induce bacterial resistance (Lin and Tsai 2009), while analgesics/anti-inflammatory drugs like
diclofenac led to decrease of gyps vultures in India (Taggart et al., 2007). At the same time, many
studies are reporting the occurrence of PAIs in the environment at concentration levels of low ng/L to
µg/L (Alder et al., 2010; Chen et al., 2007; Prasse et al., 2010; Zuccato et al., 2010). Similar
observations have been made in this study.
4.3.4.1 Antibiotics
The group of antibiotics is one of the most studied pharmaceutical classes in environmental samples.
Moreover, high levels of broad-spectrum antibiotics could induce the development of antibiotic-
resistant microorganisms (Fick et al., 2009). In this study, sulfamethoxazole was detected in 5 out of 8
sites studied, with site 5 having the highest concentration (21.2 µg/L). This could be due to discharge
from pharmaceutical factories in the vicinity (Lin and Tsai, 2009). Other authors have also detected
sulfamethoxazole in river water (Zhang and Zhou, 2007; Zuccato et al., 2010). Similarly, Nödler et al.
(2010) detected sulfamethoxazole with a mean concentration of 93 ng/L.
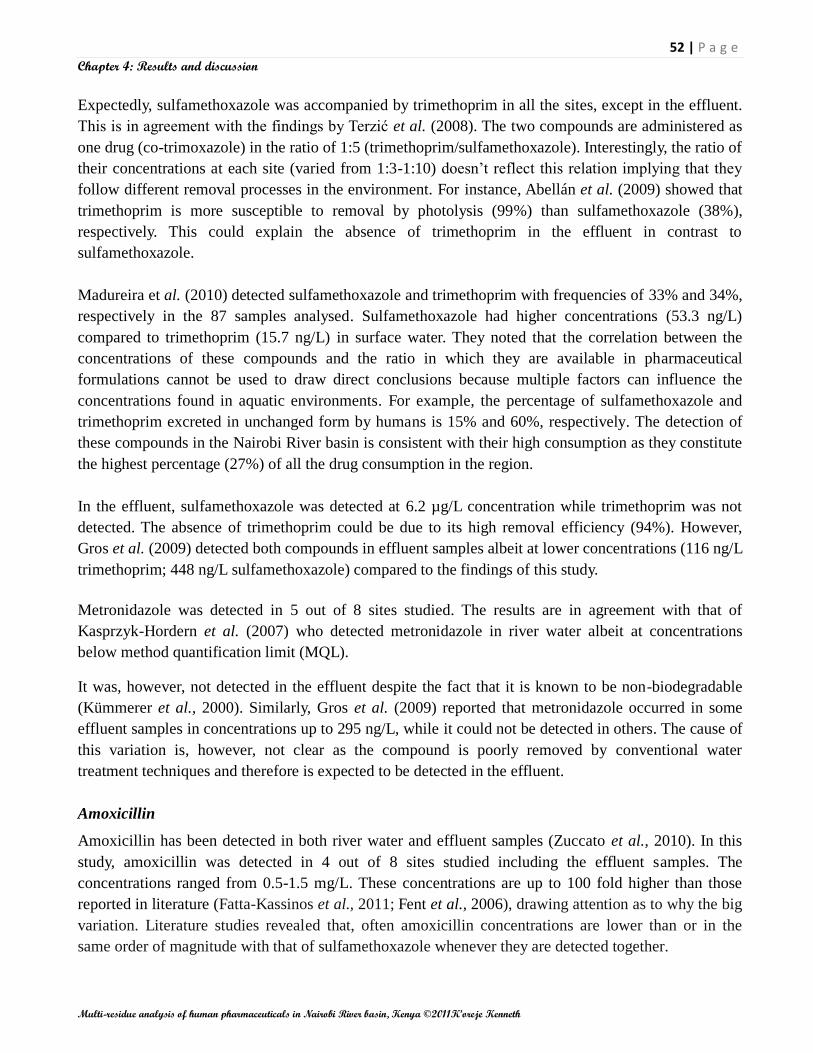
52 | P a g e
Chapter 4: Results and discussion
Multi-residue analysis of human pharmaceuticals in Nairobi River basin, Kenya ©2011K’oreje Kenneth
Expectedly, sulfamethoxazole was accompanied by trimethoprim in all the sites, except in the effluent.
This is in agreement with the findings by Terzić et al. (2008). The two compounds are administered as
one drug (co-trimoxazole) in the ratio of 1:5 (trimethoprim/sulfamethoxazole). Interestingly, the ratio of
their concentrations at each site (varied from 1:3-1:10) doesn‘t reflect this relation implying that they
follow different removal processes in the environment. For instance, Abellán et al. (2009) showed that
trimethoprim is more susceptible to removal by photolysis (99%) than sulfamethoxazole (38%),
respectively. This could explain the absence of trimethoprim in the effluent in contrast to
sulfamethoxazole.
Madureira et al. (2010) detected sulfamethoxazole and trimethoprim with frequencies of 33% and 34%,
respectively in the 87 samples analysed. Sulfamethoxazole had higher concentrations (53.3 ng/L)
compared to trimethoprim (15.7 ng/L) in surface water. They noted that the correlation between the
concentrations of these compounds and the ratio in which they are available in pharmaceutical
formulations cannot be used to draw direct conclusions because multiple factors can influence the
concentrations found in aquatic environments. For example, the percentage of sulfamethoxazole and
trimethoprim excreted in unchanged form by humans is 15% and 60%, respectively. The detection of
these compounds in the Nairobi River basin is consistent with their high consumption as they constitute
the highest percentage (27%) of all the drug consumption in the region.
In the effluent, sulfamethoxazole was detected at 6.2 µg/L concentration while trimethoprim was not
detected. The absence of trimethoprim could be due to its high removal efficiency (94%). However,
Gros et al. (2009) detected both compounds in effluent samples albeit at lower concentrations (116 ng/L
trimethoprim; 448 ng/L sulfamethoxazole) compared to the findings of this study.
Metronidazole was detected in 5 out of 8 sites studied. The results are in agreement with that of
Kasprzyk-Hordern et al. (2007) who detected metronidazole in river water albeit at concentrations
below method quantification limit (MQL).
It was, however, not detected in the effluent despite the fact that it is known to be non-biodegradable
(Kümmerer et al., 2000). Similarly, Gros et al. (2009) reported that metronidazole occurred in some
effluent samples in concentrations up to 295 ng/L, while it could not be detected in others. The cause of
this variation is, however, not clear as the compound is poorly removed by conventional water
treatment techniques and therefore is expected to be detected in the effluent.
Amoxicillin
Amoxicillin has been detected in both river water and effluent samples (Zuccato et al., 2010). In this
study, amoxicillin was detected in 4 out of 8 sites studied including the effluent samples. The
concentrations ranged from 0.5-1.5 mg/L. These concentrations are up to 100 fold higher than those
reported in literature (Fatta-Kassinos et al., 2011; Fent et al., 2006), drawing attention as to why the big
variation. Literature studies revealed that, often amoxicillin concentrations are lower than or in the
same order of magnitude with that of sulfamethoxazole whenever they are detected together.

53 | P a g e
Chapter 4: Results and discussion
Multi-residue analysis of human pharmaceuticals in Nairobi River basin, Kenya ©2011K’oreje Kenneth
It‘s also noted that amoxicillin is susceptible to hydrolysis due to their unstable β-lactam ring,
photolysis and biodegradation (Andreozzi et al., 2004; Hirsch et al., 1999) and hence, easily eliminated
from aquatic systems. In Nairobi region, its consumption is a third of that of sulfamethoxazole, thus,
though its detection is expected, its concentration is thought to be comparable to that of
sulfamethoxazole. Based on these facts, and the fact that its response factor was low (5,085), its
concentration could have been overestimated. Cognizant of this, it is recommended that care should be
taken when interpreting these values. For the purposes of comparison, the values were not considered.
4.3.4.2 Antimalarials
Sulfadoxine was detected in five out of the seven sites studied. Its concentration ranged from 301-
1,709 ng/L. The effluent (site 7) recorded the highest concentration (1.7µg/L). This shows that the
compound is recalcitrant and may not be removed effectively by the conventional water treatment
techniques. This can be reinforced by the fact that the compound is a sulfonamide, which is known to
be more or less non biodegradable, resistant to photolysis and has low sorptivity (Luo et al., 2011).
Sulfadoxine is normally used in combination with pyrimethamine as a second-line drug in malaria
treatment. Since Kenya is a malaria prone country, the use of sulfadoxine is relatively high. There is
limited information on its occurrence, fate and removal in the environment. This study shows that
sulfadoxine concentration in the aquatic systems is in the same order of magnitude as for the other
pharmaceuticals reported, hence it‘s important for monitoring. With resistance to sulfadoxine being
reported (Zakeri et al., 2010), assessment of its ecotoxicity and human toxicity is vital especially any
possible contribution to resistance by exposure through its residues in drinking water.
4.3.4.2 Analgesics/anti-inflammatory drugs
Paracetamol was detected in 4 out of the 8 sites studied. The concentrations ranged from 1.9-16.4 µg/L,
with mean concentration of 8.6 µg/L in river water samples. Its concentration reduced significantly
downstream, with no detection at the last downstream sampling site. This could be due to dilution by
the effluent discharged into the river, which doesn‘t contain it, as well as its susceptibility to photolysis,
hydrolysis, biodegradation processes, and sorption onto suspended solids (Ranieri et al., 2011). Other
research groups have reported the occurrence of paracetamol in surface water in concentrations ranging
from ng/L to µg/L (Gros et al., 2006; Kasprzyk-Hordern et al., 2007; Togola et al., 2008; Zhang and
Zhou, 2007). Comparatively, Nödler et al. (2010) reported mean concentration of 2 µg/L in river water
samples. Similarly, paracetamol was the most often detected compound in all river water samples
analyzed by Lin and Tsai (2009) and found in high concentrations up to 15.7 µg/L. These values are in
agreement with the results of this study. It‘s the mostly used analgesic partly because it is a non-
prescriptive and easily accessible drug. Therefore, it is expected to occur in the aquatic environment. In
Kenya, it is the third most consumed drug (14%), supporting the high concentrations.

54 | P a g e
Chapter 4: Results and discussion
Multi-residue analysis of human pharmaceuticals in Nairobi River basin, Kenya ©2011K’oreje Kenneth
It was, however, not detected in the effluent samples. These findings are in congruent with the results
of Nödler et al. (2010) and Grujíc et al. (2009) who didn‘t detect paracetamol in effluent, despite its
high concentrations in influent. This can be attributed to its high removal efficiency (>99%) in WWTPs
(Gómez et al., 2007; Lavén et al., 2009).
Ibuprofen has been reported in the surface water by various authors (Kim et al., 2009; Lin and Tsai,
2009). In this study, ibuprofen reported the highest concentrations ranging from 23-48µg/L in river
water samples. These values are, however, higher than 359 ng/L reported by Pailer et al. (2009). In
France, Togola and Budzinski (2007) measured mean concentrations of up to 611 ng/L in Seine River.
Ibuprofen is the second most consumed analgesic/anti-inflammatory drug after paracetamol in Nairobi
region. It‘s not surprising then, that both compounds are detected at high concentrations in the samples
tested.
In the effluent sample, a concentration of 68 µg/L was measured. Other authors have measured
ibuprofen in effluent in the range of ng/L to µg/L. Gros et al. (2009) reported concentrations up to 12
µg/L in effluent samples. This is, however, more than fivefold lower than findings of this study. Fent et
al. (2006) reviewed the occurrence of pharmaceuticals in aquatic environment and noted that ibuprofen
occurred in effluent in concentrations up to 85 µg/L. This corroborates the results of this study. The
high concentrations of ibuprofen in effluent are quite perplexing because its elimination efficiency in a
biological (activated sludge) WWTP can be greater than 95% (Sebȍk et al., 2008). However, the
elimination efficiency studies are based on activated sludge system, as opposed to waste stabilization
ponds system which is used in Nairobi. These high concentrations should be of serious concern because
ibuprofen has been reported to cause change to reproduction patterns in Medaka fish at concentration as
low as 1 µg/L and cardio abnormalities in Zebra fish (>10 µg/L) (Corcoran et al., 2010).
4.3.4.2 Antiretrovirals
Two antiretrovirals were detected in the water samples collected during this study. Nevirapine was the
most frequently detected compound (7 out of 8 sites studied) with concentration of 500-1,950 ng/L. In
Germany, Prasse et al. (2010) reported concentrations upto 17 ng/L in river water samples. In the
effluent, we recorded a concentration of 713 ng/L. Prasse et al. (2010) detected nevirapine in domestic
wastewater effluent at concentrations upto 32 ng/L. They noted that the drug is not eliminated in an
activated sludge WWTPs.
On the other hand, lamuvidine was detected in 6 out of 8 sites studied with concentrations upto 1,369
ng/L in river water samples. This is in contrast with the findings of Prasse et al. (2010) who did not
detect lamivudine in river water samples. The effluent sample recorded concentration of 1,089 ng/L.
Prasse et al. (2010) did not detect lamuvidine in effluent and noted that it can be eliminated up to more
than 93% in an activated sludge WWTP. This is, however, not confirmed by this study.
The two drugs are administered either individually or in combination with others, e.g.
stavudine/lamivudine/nevirapine in the ratio of 3:15:25 by mass. Thus, their twin detection is logical.
55 | P a g e
Chapter 4: Results and discussion
Multi-residue analysis of human pharmaceuticals in Nairobi River basin, Kenya ©2011K’oreje Kenneth
Due to the high HIV/AIDS prevalence (6.3% in 2008) in Kenya, consumption of antiretrovirals is high
constituting 15% of all the pharmaceuticals consumed in the Nairobi region. Most of those who are
infected with HIV/AIDS are believed to live in the informal settlements around the city. This could
probably explain the high concentrations of the two drugs in site 3 and 5, which are situated in slum
areas. These areas have no sewerage coverage and, thus, mostly discharge their domestic waste into the
river.
Despite the significant use of antiretrovirals worldwide, there are very limited studies on their
occurrence, fate and removal in the environment. No reports have been done on their environmental
impact. With the detection of this pharmaceutical class in the river water, concern should be raised on
the possible risks it poses to the water consumers downstream. This is particularly important for
nevirapine which has been reported to develop resistance among HIV/AIDS patients (Hauser et al.,
2011). Its introduction into the environment is constant because HIV/AIDS patients administer it for
life and therefore it can be present in the environment all the time.
4.3.4.2 Antipsychotics
Despite its low consumption in Nairobi (0.03%), carbamazepine was detected in 6 out of 8 sites
studied. The concentrations in river water samples were 87-384 ng/L. This is in agreement with Nödler
et al. (2010) who reported concentration of 265 ng/L. Similar ranges have been reported (6-130 ng/L,
Grujíc et al., 2009; 20-652 ng/L, Zhang and Zhou, 2007). In the effluent, a concentration of 296ng/L
was recorded. Lavén et al. (2009) reported concentration of 410 ng/L in effluent. Similarly, Spongberg
and Witter (2008) detected concentrations of up to 111 ng/L in effluent. Its ubiquitous occurrence in the
aqueous environment is due to its recalcitrant nature and poor elimination in WWTPs (Gros et al.,
2006). Zhang et al. (2008) noted that its removal efficiency by conventional WWTP is less than 10%.
It has been noted that its concentration is some times higher in effluent than in influent, which is
attributed to enzymatic cleavage of its glucuronide conjugate (Vieno et al., 2007). It has low
biodegradability at low concentrations and low sorptivity (Zhang et al., 2008), hence its persistence in
aqueous phase. Epilepsy treatment usually lasts for life, as opposed to occasional consumption of other
pharmaceuticals; hence there is constant input of carbamazepine into natural waters (Grujíc et al.,
2009). This can also probably explain its frequent detection in surface water.

56 | P a g e
Chapter 5: Conclusion and recommendations
Multi-residue analysis of human pharmaceuticals in Nairobi River basin, Kenya ©2011K’oreje Kenneth
CHAPTER 5
CONCLUSION AND RECOMMENDATIONS
5.1 Conclusions
With the high population growth globally and emergence of new diseases as well as resurgence of other
diseases which were once considered eradicated, the consumption of pharmaceuticals is bound to reach
new heights. Environmental effects of these drugs shall continue to be getting scientists and
environmentalists concerned. Countries that are still lagging behind in the management of
―pharmaceutical wastes‖ need to start research programmes to monitor the fate, occurrence and
removal of these compounds from the environment. In this work, an overall view of the water quality
status of the Nairobi River basin has been studied. High COD and BOD have been recorded in many
sites along the river, some being higher than the values for domestic WWTP effluent, suggesting heavy
organic pollution. The parameters measured in effluent (COD, BOD, TSS) also registered higher values
than the legal standards for effluent discharged into surface water, implying inefficient treatment.
Apart from the determination of rather classical physical-chemical water parameters, most attention has
been paid towards the analysis of pharmaceutical residues as emerging organic micropollutants in the
Nairobi River basin. First, a systematic methodology based on consumption data and screening analysis
has been developed for prioritization of pharmaceutical classes and compounds for target analysis.
Starting from a first set of 43 priority compounds, a list of 14 focus compounds has been established.
Second, an innovative analytical method allowing both screening and selective target analysis of the
selected pharmaceuticals in surface water is developed making use of advanced HPLC-HRMS
equipment. The escan mode enabled full-scan analysis that was used to screen for the focus
compounds. Retention times, mass accuracy and ion intensity were determined as vital parameters to
identify the detected compounds. The more selective and sensitive MID mode was used as a pre-
confirmation tool for the target compounds identified in the escan mode, and for quantification
purposes. On the basis of well-thought criteria, a decision tree was constructed to define detected
compounds as being ‗positively‘, ‗probably‘, or ‗indicatively‘ identified. Unequivocal identification and
quantitative evaluation was obtained by the analysis of analytical standards.
The analytical standards allowed for the full confirmation of the presence of 10 pharmaceuticals in the
Nairobi River basin water belonging to 5 classes, i.e. antibiotics (trimethoprim, sulfamethoxazole,
metronidazole, amoxicillin), analgesics/anti-inflammatories (paracetamol, ibuprofen), antiretrovirals
(nevirapine, lamuvidine), antimalarials (sulfadoxine) and antipsychotics (carbamazepine). Antibiotics
were the most ubiquitous in the basin having four compounds detected. Nevirapine was the most
commonly detected compound having been detected in 7 out of the 8 sites studied. Higher
concentrations were registered in areas located near informal settlements and industrial area. This is an
indication of domestic wastewater and pharmaceutical facility waste discharges as the main sources of
pharmaceutical residues in the basin.

57 | P a g e
Chapter 5: Conclusion and recommendations
Multi-residue analysis of human pharmaceuticals in Nairobi River basin, Kenya ©2011K’oreje Kenneth
Nine out of the twelve monitored pharmaceutical compounds were detected in the effluent sample,
signifying incomplete removal by the WWTP. Generally, the compound registered mean concentrations
ranging from 251 ng/L (nevirapine) to 46 µg/L (ibuprofen). Sulfadoxine, a newly reported compound in
the aquatic system, recorded a concentration of 301-1,709 ng/L, which is in the same magnitude as the
other compounds that have been reported before.
Through the systematic development of an innovative multi-residue analytical technique, this work
provides, for the first time, data on the occurrence of frequently consumed pharmaceuticals in Kenyan
waters. The findings provide not only invaluable knowledge on the contamination of Nairobi River
basin by pharmaceuticals, but also a concrete basis for further research on the subject as well as the
need for monitoring programmes by the environmental regulatory agencies. It is a wakeup call to the
agencies involved in environmental management to start thinking beyond the conventional water
contaminants and start developing policies and programmes that would tackle the challenges of the
emerging micropollutants such as pharmaceuticals.
5.2 Recommendations
As this work is the first of its kind in Kenya, it provides the foundation on which further research can
be laid. To further improve the knowledge in this field, it is recommended that further research should
focus on:
i) The validation and evaluation of the sample preparation steps and the matrix effects on the
detection method aiming at a more comprehensive quantification of the detected pharmaceuticals.
ii) The pharmaceuticals removal efficiency of the WWTP in order to assess its actual impact in
relation to pharmaceuticals discharge into the river.
iii) The role of total suspended solids and sediments in the removal and/or redissolution of the
pharmaceuticals from the water column. High levels of total suspended solids have been reported
in the basin.
iv) The occurrence of pharmaceutical residues analysis in the drinking water abstracted from the Athi
River where the Nairobi River discharges its waters. The environmental and human health risk
posed by any detected compound should be determined through risk assessment studies.

58 | P a g e
List of Reference
Multi-residue analysis of human pharmaceuticals in Nairobi River basin, Kenya ©2011K’oreje Kenneth
List of Reference
Abellán, M. N., Giménez, J., Esplugas, S. Photocatalytic degradation of antibiotics: The case of
sulfamethoxazole and trimethoprim. Catalysis Today 144 (2009) 131–136.
Acero, J. L., Benitez, F. J., Real, F. J., Roldan, G. Kinetics of aqueous chlorination of some pharmaceuticals
and their elimination from water matrices. Water Research 44 (2010) 4158-4170.
Alder, A. C., Schaffner, C., Majewsky, M., Klasmeier, J., Fenner, K. Fate of β-blocker human
pharmaceuticals in surface water: Comparison of measured and simulated concentrations in the Glatt Valley
Watershed, Switzerland. Water Research 44 (2010) 936-948.
Al-Odaini, N.A., Zakaria, M. P., Yaziz, M. I., Surif, S. Multi-residue analytical method for human
pharmaceuticals and synthetic hormones in river water and sewage effluents by solid-phase extraction and
liquid chromatography–tandem mass spectrometry. Journal of Chromatography A, 1217 (2010) 6791–6806.
Alonso, S. G., Catalá M., Maroto, R., Gil, J. R. L., Miguel, Á. G., Valcárcel, Y. Pollution by psychoactive
pharmaceuticals in the Rivers of Madrid metropolitan area (Spain). Environment International 36 (2010)
195–201.
Andreozzi, R., Caprio, V., Ciniglia, C., De champdoreä, M., Giudice, R., Marotta,R., Zuccato A. Antibiotics
in the Environment: Occurrence in Italian STPs, Fate, and Preliminary Assessment on Algal Toxicity of
Amoxicillin. Environmental Science Technology 38 (2004) 6832-683.
APHA (21st Edition). 2005. Standard Methods for the Examination of Water and Wastewater. American
Public Health Association. Washington, DC: APHA-AWWWA-WEF.
Araujo, L., Wild, J., Villa, N., Camargo, N., Cubillan, D., Prieto, A. Determination of anti-inflammatory
drugs in water samples, by in situ derivatization, solid phase microextraction and gas chromatography–mass
spectrometry. Talanta 75 (2008) 111–115.
Babović, N., Marković, D., Dimitrijević, V., Marković, D. Some indicators of water quality of the Tamiš
River. Chemical Industry & Chemical Engineering Quarterly 17 (2011)107−115.
Bartels, P. and Von Wolf, T. The environmental fate of the antiviral drug oseltamivir carboxylate in
different waters. Science of the Total Environment 405 (2008) 215–225.
Bartelt-Hunt, S., Snow, D. D., Damon-Powell, T., Miesbach, D. Occurrence of steroid hormones and
antibiotics in shallow groundwater impacted by livestock waste control facilities. Journal of Contaminant
Hydrology 123 (2011) 94–103.
Benitez, F. J., Acero, J. L., Real, F. J., Roldán, G. Ozonation of pharmaceutical compounds: Rate constants
and elimination in various water matrices. Chemosphere 77 (2009) 53–59.
Benner, J., Salhi, E., Ternesa, T., von Gunten, U. Ozonation of reverse osmosis concentrate: Kinetics and
efficiency of beta blocker oxidation. Water Research 42 (2008) 3003–3012.

59 | P a g e
List of Reference
Multi-residue analysis of human pharmaceuticals in Nairobi River basin, Kenya ©2011K’oreje Kenneth
Bergheim, M., Helland, T., Kallenborn, R., Kümmerer, K. Benzyl-penicillin (Penicillin G) transformation in
aqueous solution at low temperature under controlled laboratory conditions. Chemosphere 81 (2010) 1477–
148.
Besse, J. and Garric, J. Human pharmaceuticals in surface waters Implementation of a prioritization
methodology and application to the French situation. Toxicology Letters 176 (2008) 104–123.
Brossa, L., Marce´, R. M., Borrull, F., Pocurull, E. Occurrence of twenty-six endocrine-disrupting
compounds in environmental water samples from catalonia, Spain. Environmental Toxicology and
Chemistry 24 (2005) 261–267.
Buchberger, W. W. Current approaches to trace analysis of pharmaceuticals and personal care products in
the environment. Journal of Chromatography A 1218 (2011) 603–618.
Bueno, M. J. M., Era, A.A., Gómez, M. J., Hernando, M. D., García-Reyes, J. F., Fernández-Alba, A. R.
Application of Liquid Chromatography/Quadrupole-Linear Ion Trap Mass Spectrometry and Time-of-Flight
Mass Spectrometry to the Determination of Pharmaceuticals and Related Contaminants in Wastewater.
Analytical Chemistry 79 (2007) 9372-9384.
Camacho-Muñoz, M.D., Santos, L., Aparicio, I., Alonso, E. Presence of pharmaceutically active compounds
in Dõnana Park (Spain) main watersheds. Journal of Hazardous Materials 177 (2010) 1159–1162.
Carlsson, C., Johansson, A.-K., Alvan, G., Bergaman, K., Kuhler, T. Are pharmaceuticals potent
environmental pollutants? Part I: Environmental risk assessments of selected active pharmaceutical
ingredients. Science of Total Environment 364 (2006) 67-87.
Carucci, A., Cappai, G., Piredda, M. Biodegradability and toxicity of pharmaceuticals in biological
wastewater treatment plants. Journal of Environmental Science and Health, Part A 41 (2006) 1831–1842.
Chang, H., Wan, Y., Wu, S., Fan, S., Hu, J. Occurrence of androgens and progestogens in wastewater
treatment plants and receiving river waters: Comparison to estrogens. Water Research 45 (2011) 732-740.
Chen, C., Tzu-Yao, W., Wang, G., Cheng ,H. W., Lin ,Y. W., Lien, G. W. Determining estrogenic steroids in
Taipei waters and removal in drinking water treatment using high-flow solid-phase extraction and liquid
chromatography/tandem mass spectrometry. Science of the Total Environment 378 (2007) 352 – 365.
Christen, V., Hickmann, S., Rechenberg, B., Fent, K. Highly active human pharmaceuticals in aquatic
systems: A concept for their identification based on their mode of action. Aquatic Toxicology 96 (2010)
167–181.
Corcoran, J., Winter, M. J., Tyler, C. R. Pharmaceuticals in the aquatic environment: A criticalreview of the
evidence for health effects in fish. Critical Reviews in Toxicology 40 (2010) 287–304.
Daughton, C. G. and Ruhoy, I.S. Environmental footprint of Pharmaceuticals: the siginificance of factors
beyond direct ecretion to sewers. Environmental Toxicology and Chemistry 28, (2009) 2495-2521.

60 | P a g e
List of Reference
Multi-residue analysis of human pharmaceuticals in Nairobi River basin, Kenya ©2011K’oreje Kenneth
De Graaff, M.S., Vieno, N. M., Kujawa-Roeleveld, K., Zeeman, G., Temmink, H., Buisman, C. J. N. Fate of
hormones and pharmaceuticals during combined anaerobic treatment and nitrogen removal by partial
nitritation-anammox in vacuum collected black water. Water Research 45 (2011) 375-383.
De Witte, B., Dewulf, J., Demeestere, K., Van De Vyvere, V., De Wispelaere, P., Van Langenhove, H.
Ozonation of Ciprofloxacin in Water: HRMS Identification of Reaction Products and Pathways.
Environmental Science Technology 42 (2008) 4889–4895.
Export Processing Zones Authority (2005). Kenya‘s pharmaceutical Industry 2005. Nairobi.
European Surveillance of Antimicrobial Consumption (2008) ESAC Yearbook 2008. Available online at
www.esac.ua.ac.be.
Fatta-Kassinos, D., Meric, S., Nikolaou, A. Pharmaceutical residues in environmental waters and
wastewater: current state of knowledge and future research. Analytical and Bioanalytical Chemistry 399
(2011) 251–275.
Fent, K., Weston, A. A., Caminada, D. Ecotoxicology of human pharmaceuticals. Aquatic Toxicology 76
(2006) 122–159.
Fick, J., Soderstrom, H., Lindberg, R. H., Phan, C., Tysklind, M., Larsson, D. G. J. Contamination of
surface, ground, and drinking water from pharmaceutical production. Environmental Toxicology and
Chemistry 28 (2009) 2522–2527.
Fick, J., Lindberg, R. H., Tysklind, M., Larsson, D. G. J. Predicted critical environmental concentrations for
500 pharmaceutical. Regulatory Toxicology and Pharmacology 58 (2010) 516-523.
Flyborg, L., Bjorlenius, B., Persson, K. M. Can treated municipal wastewater be reused after ozonation and
nanofiltration? Results from a pilot study of pharmaceutical removal in Henriksdal WWTP, Sweden. Water
Science and Technology 61 (2010) 1113-1120.
Fontanals, N., Marće, R. M., Borrull, F. New materials in sorptive extraction techniques for polar
ompounds. Journal of Chromatography A 1152 (2007) 14–31.
García-Galán, M. J., Díaz-Cruz, M. S., Barceló, D. Occurrence of sulfonamide residues along the Ebro river
basin Removal in wastewater treatment plants and environmental impact assessment. Environment
International 37 (2011) 462–473.
Gartiser, S., Urich, E., Alexy, R., Kümmerer, K. Ultimate biodegradation and elimination of antibiotics in
inherent tests. Chemosphere 67 (2007) 604–613.
Ge, L., Chen,J., Wei, X., Zhang,S., Qiao, X., Cai, X., Xie, Q. Aquatic Photochemistry of Fluoroquinolone
Antibiotics: Kinetics, Pathways, and Multivariate Effects of Main Water Constituents. Environmental
Science and Technology 44 (2010) 2400–2405.
Germer, J. and Sinar, E. Pharmaceutical consumption and residuals potentially relevant to nutrient cycling
in Greater Accra, Ghana. Journal of Agriculture and Rural Development in the Tropics and Subtropics 111
(2010) 41-53.

61 | P a g e
List of Reference
Multi-residue analysis of human pharmaceuticals in Nairobi River basin, Kenya ©2011K’oreje Kenneth
Gómez, M.J., Bueno, M.J., Lacorte, Fernández-Alba, A.R., Agüera, A. Pilot survey monitoring
pharmaceuticals and related compounds in a sewage treatment plant located on the Mediterranean coast.
Chemosphere 66 (2007) 993–1002.
Gracia-Lor, E., Sancho, J. V., Hernández, F. Multi-class determination of around 50 pharmaceuticals,
including 26 antibiotics, in environmental and wastewater samples by ultra-high performance liquid
chromatography–tandem mass spectrometry. Journal of Chromatography A 1218 (2011) 2264–2275.
Gros, M., Petrović, M., Barceló D. Tracing Pharmaceutical Residues of Different Therapeutic Classes in
Environmental Waters by Using Liquid Chromatography /Quadrupole-Linear Ion Trap Mass Spectrometry
and Automated Library Searching. Analytical Chemistry 81(2009) 898–912.
Gros, M., Petrović M., Barceló, D. Development of a multi-residue analytical methodology based on
liquidchromatography–tandem mass spectrometry (LC–MS/MS) for screening and trace level determination
of pharmaceuticals in surface and wastewaters. Talanta 70 (2006) 678–690.
Grujíc, S., Vasiljevíc, T., Laŭseví, M. Determination of multiple pharmaceutical classes in surface and
ground waters by liquid chromatography–ion trap–tandem mass spectrometry. Journal of Chromatography A
1216 (2009) 4989–5000.
Hao, C., Lissemore, L., Nguyen, B., Kleywegt, S., Yang, P., Solomon, K. Determination of pharmaceuticals
in environmental waters by liquid chromatography/electrospray ionization/tandem mass spectrometry.
Analytical and Bioanalytical Chemistry 384 (2006) 505–513.
Hauser, A., Mugenyi, K., Kabasinguzi, R., Kuecherer, C., Harms, G., Kunz, A. Emergence and Persistence
of Minor Drug-Resistant HIV-1 Variants in Ugandan Women after Nevirapine Single-Dose Prophylaxis.
PLoS ONE 6 (2011) e20357.
http://www.plosone.org/article/info%3Adoi%2F10.1371%2Fjournal.pone.0020357.
Hirsch, R., Ternes, T., Haberer, K., Kratz, K. Occurrence of antibiotics in the aquatic environment. The
Science of the Total Environment 225 (1999) 109-118.
Hoffman, E. and Stroobant, V. (2nd Ed.) 2002. Mass spectrometry: Principles and Applications. England:
John Willey & Sons, Ltd.
Huerta-Fontela, M., Galceran, M. T., Ventura, F. Occurrence and removal of pharmaceuticals and hormones
through drinking water treatment. Water Research 45 (2011) 1432-1442.
http://www.imshealth.com/portal/site/imshealth/menuitem.a46c6d4df3db4b3d88f611019418c22a/?vgnextoi
d=119717f27128b210VgnVCM100000ed152ca2RCRD&vgnextfmt=default
http://www.chm.bris.ac.uk/ms/theory/sector-massspec.htmL
http://www.who.int/mediacentre/events/annual/world_diabetes_day/en/
http://www.chm.bris.ac.uk/ms/theory/sector-massspec.htmL
Ibáñez, M., Guerrero, C., Sancho, J. V., Hernandez, F. Screening of antibiotics in surface and wastewater
samples by ultra-high-pressure liquid chromatography coupled to hybrid quadrupoletime-of-flight mass
spectrometry. Journal of Chromatography A 1216 (2009) 2529–2539.

62 | P a g e
List of Reference
Multi-residue analysis of human pharmaceuticals in Nairobi River basin, Kenya ©2011K’oreje Kenneth
Jelic, A., Gros, M., Ginebreda, A, Cespedes-Sánchez, R., Ventura, F., Petrovic, M., Barcelo, D. Occurrence,
partition and removal of pharmaceuticals in sewage water and sludge during wastewater treatment. Water
Research 45 (2011)1165-176.
JJemba, P. K. 2008. Pharma-ecology: The Occurrence and fate of pharmaceuticals and personal Care
products in the Environment. Canada: John Willy & sons.
Jones, O. A., Lester, J. N., Voulvoulis, N. Pharmaceuticals: a threat to drinking water? Trends in
Biotechnology 23 (2005) 163-167.
Kasprzyk-Hordern, B., Dinsdale, R. M., Guwy, A. J. The occurrence of pharmaceuticals, personal care
products, endocrine disruptors and illicit drugs in surface water in South Wales, UK. Water Research 42
(2008) 3498–518.
Kasprzyk-Hordern, B., Dinsdale, R.M., Guwy, A. J. Multi-residue method for the determination of
basic/neutral pharmaceuticals and illicit drugs in surface water by solid-phase extraction and ultra
performance liquid chromatography–positive electrospray ionisation tandem mass spectrometry. Journal of
Chromatography A 1161 (2007) 132–145.
Kaufmann, A., Butcher, P., Maden, K, Walker, S., Widmer, M. Comprehensive comparison of liquid
chromatography selectivity as provided by two types of liquid chromatography detectors (high resolution
mass spectrometry and tandem mass spectrometry): ―Where is the crossover point?‖. Analytica Chimica
Acta 673 (2010) 60–72.
Khan, M. H., Bae, H., Jung, J. Y. Tetracycline degradation by ozonation in the aqueous phase: Proposed
degradation intermediates and pathway. Journal of Hazardous Materials 181 (2010) 659–665.
Kim, I., Yamashita, N., Tanaka, H. Photodegradation of pharmaceuticals and personal care products during
UV and UV/H2O2 treatments. Chemosphere 77 (2009) 518–525.
Klavarioti, M., Mantzavinos, D., Kassinos, D. Removal of residual pharmaceuticals from aqueous systems
by advanced oxidation processes. Environment International 35 (2009) 402–417.
Kotchen, M., Kallaos, J., Wheeler, K., Wong, C., Zahller, M. Pharmaceuticals in wastewater: Behavior,
preferences, and willingness to pay for a disposal program. Journal of Environmental Management 90
(2009) 1476–1482.
Kümmerer, K. (3rd edition) 2008. Pharmaceuticals in the Environment: Sources, Fate, Effects and Risks.
Germany: Springer-Verlag Berlin Heidelberg.
Kümmerer, K., Al-Ahmad, A., Mersch-Sundermann, V. Biodegradability of some antibiotics, elimination of
the genotoxicity and affection of wastewater bacteria in a simple test. Chemosphere 40 (2000) 701-710.
Lajeunesse, A. and Gagnon C. Determination of acidic pharmaceutical products and carbamazepine in
roughly primary-treated wastewater by solid-phase extraction and gas chromatography–tandem mass
spectrometry. Internal Journal Environmental Analytical Chemistry 87 (2007) 565–578.

63 | P a g e
List of Reference
Multi-residue analysis of human pharmaceuticals in Nairobi River basin, Kenya ©2011K’oreje Kenneth
Lavén, M., Alsberg, T., Yu, Y., Adolfsson-Erici, M., Sun, H. Serial mixed-mode cation- and anion-exchange
solid-phase extraction for separation of basic, neutral and acidic pharmaceuticals in wastewater and analysis
by high-performance liquid chromatography–quadrupole time-of-flight mass spectrometry. Journal of
Chromatography A 1216 (2009) 49–62.
Li, D., Yang, M., Hu, J., Zhang ,Y., Chang , H., Jin, F. Determination of penicillin G and its degradation
products in a penicillin production wastewater treatment plant and the receiving river. Water Research 42
(2008) 307– 317.
Li, D., Yang, M., Hu, J., Zhang, J., Liu, R., Gu, X., Zhang, Y., Wang, Z. Antibiotic-resistance profile in
environmental bacteria isolated from penicillin production wastewater treatment plant and the receiving
river. Environmental Microbiology 11(6) (2009) 1506–1517.
Li, Z.-H., Velisek, J., Zlabek, V., Grabic, R., Machova, J., Kolarova, J., Li, P., Randak, T. Chronic toxicity
of verapamil on juvenile rainbow trout (Oncorhynchus mykiss): Effects on morphological indices,
hematological parameters and antioxidant responses. Journal of Hazardous Materials 185 (2011a) 870–880.
Li, Z.-H., Velisek, J., Zlabek, V., Grabic, R., Machova, J., Kolarova, J., Li, P., Randak T. Randak. Acute
toxicity of carbamazepine to juvenile rainbow trout (Oncorhynchus mykiss): Effects on
antioxidantresponses, hematological parameters and hepatic EROD. Ecotoxicology and Environmental
Safety 74 (2011b) 319–327.
Lin, A. Y.-C. and Tsai,Y. -T. Occurrence of pharmaceuticals in Taiwan's surface waters: Impact of waste
streams from hospitals and pharmaceutical production facilities. Science of the Total Environment 407
(2009) 3793–3802.
Luo, Y., Xu, L., Rysz, M., Wang, Y., Zhang, M., Alvarez, P. J. J. Occurrence and Transport of Tetracycline,
Sulfonamide, Quinolone, and Macrolide Antibiotics in the Haihe River Basin, China. Environmental
Science and Technology 45 (2011) 1827–1833.
Madureira, T. V., Barreiro, J. C., Rocha, M. J., Rocha, E., Cass, Q. B., Tiritan, M. E. Spatiotemporal
distribution of pharmaceuticals in the Douro River estuary (Portugal). Science of the Total Environment 408
(2010) 5513–5520.
Míege, C., Favier, M., Brosse, C., Canler, J., Coquery, M. Occurrence of betablockers in effluents of
wastewater treatment plants from the Lyon area (France) and risk assessment for the downstream rivers.
Talanta 70 (2006) 739–744.
Ministry of health (2004). Assessment of the pharmaceutical situation in Kenya: A baseline survey. Kenya:
Government of Kenya.
Miranda-García, N., Maldonado, M. I., Coronado, J. M., Malato, S. Degradation study of 15 emerging
contaminants at low concentration by immobilized TiO2 in a pilot plant. Catalysis Today 151 (2010) 107–
113.
Morley, N. J. Environmental risk and toxicology of human and veterinary waste pharmaceutical exposure to
wild aquatic host–parasite relationships. Environmental Toxicology and pharmacology 27 (2009) 161-175.
Mortensen, A. S., and Arukwe, A. Effects of 17 β-ethynylestradiol on hormonal responses and xenobiotic
biotransformation system of Atlantic salmon (Salmo salar). Aquatic Toxicology 85 (2007) 113–123.

64 | P a g e
List of Reference
Multi-residue analysis of human pharmaceuticals in Nairobi River basin, Kenya ©2011K’oreje Kenneth
Nödler, K., Lich, T., Bester, K., Sautera, M. Development of a multi-residue analytical method, based on
liquid chromatography–tandem mass spectrometry, for the simultaneous determination of 46 micro-
contaminants in aqueous samples. Journal of Chromatography A 1217 (2010) 6511–6521
Pailler, J.-Y., Krein, A., Pfister, L., Hoffmann, L., Guignard, C. Solid phase extraction coupled to liquid
chromatography-tandem mass spectrometry analysis of sulfonamides, tetracyclines, analgesics and
hormones in surface water and wastewater in Luxembourg. Science of the Total Environment 407 (2009)
4736–4743.
Payan, M. R., Lopez, M. A. B., Fernandez-Torres, R., Ochon, M. C., Ariza, J. L. G. Application of hollow
fiber-based liquid-phase microextraction (HF-LPME) for the determination of acidic pharmaceuticals in
wastewaters. Talanta 82 (2010) 854–858.
Pedrouzo, M., Borrull, F., Pocurull, E., Marcé, R. M.. Estrogens and their conjugates: Determination in
water samples by solid-phase extraction and liquid chromatography–tandem mass spectrometry. Talanta 78
(2009) 1327–1331.
Prasse, C., Schlusener, P. M., Schulz, R., Ternes, T. A. Antiviral Drugs in Wastewater and Surface Waters: A
New Pharmaceutical Class of Environmental Relevance? Environmental Science and Technology 44 (2010)
1728-1735.
Quinn, B., Gagné, F., Blaise, C. An investigation into the acute and chronic toxicity of eleven
pharmaceuticals (and their solvents) found in wastewater effluent on the cnidarian, Hydra attenuate.
Science of the Total Environment 389 (2008) 306–314.
Racz, L. A. and Goel, R. K. Fate and removal of estrogens in municipal wastewater. Journal of
Environmental Monitoring, 12 (2010) 58–67.
Ranieri, E., Verlichi, P., Young, T.M. Paracetamol removal in subsurface flow constructed wetlands. Journal
of Hydrology 404 (2011) 130–135.
Razavi, B., Ben S., Abdelmelek, W., Song, K., O‘Shea, E., Cooper W. J. Photochemical fate of atorvastatin
(lipitor) in simulated natural waters. Water Research 45 (2011) 625-631.
Ryan, C. C., Tan, D. T., Arnold, W. A. Direct and indirect photolysis of sulfamethoxazole and
trimethoprim in wastewater treatment plant effluent. Water research 45 (2011) 1280-128.
Sacher, F., Ehmann, M., Gabriel, S., Graf, C., Brauch, H. J. Pharmaceutical residues in the river Rhine—
results of a one-decade monitoring programme. Journal of Environmental Monitoring 10 (2008) 664–670.
Santos, L. H., Araujo, A. N., Fachini, A., Pena, A., Delerue-Matos, C., Montenegro, M. C. B.
Ecotoxicological aspects related to the presence of pharmaceuticals in the aquatic environment. Journal of
Hazardous Materials 175 (2010) 45–95.
Scheurer, M., Sacher, F., Brauch, H. Occurrence of the antidiabetic drug metformin in sewage and surface
waters in Germany. Journal of Environmental Monitoring 11(2009) 1608-1613.

65 | P a g e
List of Reference
Multi-residue analysis of human pharmaceuticals in Nairobi River basin, Kenya ©2011K’oreje Kenneth
Sebȍk, A .́, Vasanits-Zsigrai, A., Palkó, G., Záray, G., Molnár-Perl, I. Identification and quantification of
ibuprofen, naproxen, ketoprofen and diclofenac present in waste-waters, as their trimethylsilyl derivatives,
by gas chromatography mass spectrometry. Talanta 76 (2008) 642–650.
Sim, W.-J., Lee, J. W., Lee, E. S., Shin, K., Hwang, S. R., Oh, J. E. Occurrence and distribution of
pharmaceuticals in water from household, livestock farms, hospitals and pharmaceutical manufacturers.
Chemosphere 82 (2011) 179-186.
Spongberg, A. L. and Witter, J. D. Pharmaceutical compounds in the wastewater process stream in
Northwest Ohio. Science of the Total Environment 397 (2008) 148–157.
Stülten, D., Zühlke, S., Lamshöft, M., Spiteller, M. Occurrence of diclofenac and selected metabolites in
sewage effluents. Science of the total environment 405 (2008) 310–316.
Taggart, M. A., Cuthbert, R., Das, D., Sashikumar, C., Pain, D. J., Green, R. E. Diclofenac disposition in
Indian cow and goat with reference to Gyps vulture population declines. Environmental Pollution 147
(2007) 60–65.
Tambosi, J. L., De Sena, R. F., Favier, M., Gebhardt, W., José, H. J., Schröder, De Fátima R., Moreira, P. M.
Removal of pharmaceutical compounds in membrane bioreactors (MBR) applying submerged membranes.
Desalination 261 (2010) 148–156.
Terzića, S., Senta, I., Ahel, M., Gros, M, Petrović, M., Barcelob, D., Müllerd, J., Knepperd, T., Martí, I.,
Ventura, F., Jovančić, P., Jabučar, D. Occurrence and fate of emerging wastewater contaminants in Western
Balkan Region. Science of the total environment 399 (2008) 66–77.
Thomas, G. (2006). Fundamentals of medicinal chemistry. England: John Willey & Sons Limited.
Togola, A and Budzinski, H. Analytical development for analysis of pharmaceuticals in water samples by
SPE and GC–MS. Analytical and Bioanalytical Chemistry 388 (2007) 627–635.
Trenholm, R. A., Vanderford, B. J., Snyder, S. A. On-line solid phase extraction LC–MS/MS analysis of
pharmaceutical indicators in water: A green alternative to conventional methods. Talanta 79 (2009) 1425–
1432.
Trovo, A.G., Nogueira, R. F. P., Agu¨era, A., Fernandez-Alba, A. R., Malato, S. Degradation of the antibiotic
amoxicillin by photo-Fenton process - Chemical and toxicological assessment. Water Research 45 (2011)
1394-1402.
Van Doorslaer, X., Demeestere, K., Heynderickx, P. M., Van Langenhove, H., Dewulf, J. UV-A and UV-C
induced photolytic and photocatalytic degradation of aqueousciprofloxacin and moxifloxacin: Reaction
kinetics and role of adsorption. Applied Catalysis B: Environmental 101 (2011) 540–547.
Van Langenhove, H. and Demeestre, K. 2010. Analyse van Organische Micropolluenten. Vakgroep
Organische Chemie (EnVOC), Gent University.
Vieno, N., Tuhkanen, T., Kronberg, L. Elimination of pharmaceuticals in sewage treatment plants in
Finland. Water Research 41 (2007)1001–1012.

66 | P a g e
List of Reference
Multi-residue analysis of human pharmaceuticals in Nairobi River basin, Kenya ©2011K’oreje Kenneth
Wang, C., Shi, H., Adams, C. D., Gamagedara, I., Stayton, T., Timmons, Y. M. Investigation of
pharmaceuticals in Missouri natural and drinking water using high performance liquid chromatography-
tandem mass spectrometry. Water Research 45 (2011) 1818-1828.
Wille, K., Noppe, H., Verheyden, K., Bussche, V., De Wulf, E., Van Caeter, P., Janssen, C. R., De Brabander,
F., Vanhaecke, L. Validation and application of an LC-MS/MS method for the simultaneous quantification
of 13 pharmaceuticals in seawater. Analytical and Bioanalytical Chemistry (2010) 397:1797–1808.
www.kore.co.uk
Xu, X., Li, X. Y., Li, X. Z., Li, H. Degradation of melatonin by UV, UV/H2O2, Fe2+/H2O2 andUV/Fe2+/H2O2
processes. Separation and Purification Technology 68 (2009) 261–266.
Yao, C., Li, T., Twu, P., Pitner, W. R., Anderson, J.L. Selective extraction of emerging contaminants from
water samples by dispersive liquid–liquid microextraction using functionalized ionic liquids. Journal of
Chromatography A 1218 (2011) 1556–1566.
Yuan, F., Chun, H., Xuexiang, H., Jiuhui, Q., Min, Y. Degradation of selected pharmaceuticals in aqueous
solution with UV and UV/H2O2. Water Research 43 (2009) 1766–1774.
Zakeri, S., Farahani, M. S., Afsharpad, M., Salehi, M., Raeisi, A., Djadid, N. D. High prevalence of the
437G mutation associated with sulfadoxine resistance among Plasmodium falciparum clinical isolates from
Iran, three years after the introduction of sulfadoxine–pyrimethamine. International Journal of Infectious
Diseases 14S (2010) 123–128.
Zhang,Y., Geißen,S., Gal, C. Carbamazepine and diclofenac: Removal in wastewater treatment plants
and occurrence in water bodies. Chemosphere 73 (2008) 1151–116.
Zhang, Z., Feng, Y., Liu, Y., Sun, Q., Gao, P., Ren, N. Kinetic degradation model and estrogenicity changes
of EE2 (17-ethinylestradiol) in aqueous solution by UV and UV/H2O2 technology. Journal of Hazardous
Materials 181 (2010) 1127–1133.
Zhang, Z.L. and Zhou, J. L. Simultaneous determination of various pharmaceutical compounds in water by
solid-phase extraction–liquid chromatography–tandem mass spectrometry. Journal of Chromatography A
1154 (2007) 205–213.
Zhao, J.-L., Ying, G., Liu, Y., Chen, F., Yang, J., Wang, L., Yang, X., Stauber, J. L., Warne, M. J.
Occurrence and a screening-level risk assessment of human pharmaceuticals in the Pearl River system,
South China. Environmental Toxicology and Chemistry 29 (2010) 1377–1384.
Zuccato, E., Castiglioni, S., Bagnati, R., Melis, M., Fanelli, R. Source, occurrence and fate of antibiotics in
the Italian aquatic environment. Journal of Hazardous Materials 179 (2010) 1042–1048.
Zurita, J. L., Repetto, G., Jos, A., Salguero, M, López-Artíguez, M., Caméan, A. M. Toxicological effects of
the lipid regulator gemfibrozil in four aquatic systems. Aquatic Toxicology 81 (2007) 106–115

67 | P a g e
Appendix
Multi-residue analysis of human pharmaceuticals in Nairobi River basin, Kenya ©2011K’oreje Kenneth
Appendix I: Molecular structures of target compounds
Sulfadoxine Amoxicillin Methyldopa
Benzylpenicillin Metronidazole Trimethoprim
Sulfamethoxazole Paracetamol Carbamazepine
Zidovudine Lamivudine Ibuprofen
Nevirapine Efavirenz