faculty of biological sciences ugwoke oluchi c
TRANSCRIPT

Ugwoke Oluchi C.
FACULTY OF BIOLOGICAL SCIENCES
DEPARTMENT OF PURE AND INDUSTRIAL CHEMISTRY
SYNTHESIS, CHARACTERIZATION AND SOLVENT EXTRACTION
STUDIES OF 3,5
BENZOIC ACID AND ITS Co(II) AND Ni(II) COMPLEXES
Digitally Signed by: Content manager’s
DN : CN = Webmaster’s name
O = University of Nigeria, Nsukka
OU = Innovation Centre
Ugwoke Oluchi C.
FACULTY OF BIOLOGICAL SCIENCES
DEPARTMENT OF PURE AND INDUSTRIAL CHEMISTRY
SYNTHESIS, CHARACTERIZATION AND SOLVENT EXTRACTION
STUDIES OF 3,5-BIS[(2-HYDROXY-BENZYLIDENE)-AMINO]
BENZOIC ACID AND ITS Co(II) AND Ni(II) COMPLEXES
UMAR, ABDULLAHI YARO
(PG/M.SC/11/59594)
: Content manager’s Name
Webmaster’s name
a, Nsukka
FACULTY OF BIOLOGICAL SCIENCES
DEPARTMENT OF PURE AND INDUSTRIAL CHEMISTRY
SYNTHESIS, CHARACTERIZATION AND SOLVENT EXTRACTION
AMINO]-
BENZOIC ACID AND ITS Co(II) AND Ni(II) COMPLEXES

ii
SYNTHESIS, CHARACTERIZATION AND SOLVENT
EXTRACTION STUDIES OF 3,5-BIS[(2-HYDROXY-
BENZYLIDENE)-AMINO]-BENZOIC ACID
AND ITS Co(II) AND Ni(II) COMPLEXES
BY
UMAR, ABDULLAHI YARO
(PG/M.SC/11/59594)
DEPARTMENT OF PURE AND INDUSTRIAL CHEMISTRY
UNIVERSITY OF NIGERIA, NSUKKA
JULY, 2014.

iii
TITLE PAGE
SYNTHESIS, CHARACTERIZATION AND SOLVENT EXTRACTION STUDIES
OF 3,5-BIS[(2-HYDROXY-BENZYLIDENE)-AMINO]-BENZOIC ACID
AND ITS Co(II) AND Ni(II) COMPLEXES
BY
UMAR, ABDULLAHI YARO
PG/M.Sc/11/59594
A PROJECT SUBMITTED IN PARTIAL FULFILLMENT OF THE
REQUIREMENT FOR THE AWARD OF MASTER OF SCIENCE
DEGREE IN INORGANIC CHEMISTRY
DEPARTMENT OF PURE AND INDUSTRIAL CHEMISTRY
UNIVERSITY OF NIGERIA, NSUKKA
JULY, 2014.

ii
ii
DECLARATION
I here declare that this project contains the report of my research work and
has not been presented in any previous application for any degree or diploma. All
information from other sources have been acknowledged by means of references.
..................................................
UMAR, ABDULLAHI YARO
……………………………
DATE

iii
iii
CERTIFICATION
This thesis entitled “Synthesis, Characterization and Solvent Extraction
Studies on 3,5-[(2-Hydroxy-benzylidene)-Amino]-Benzoic Acid and its Co(II) and
Ni(II) Complexes” by Umar Abdullahi Yaro meets the regulation governing the
award of the degree of Master of Science of the University of Nigeria, and is
approved for its contribution to scientific and literary presentation.
…………………………. ………………………..
Prof. P.O. Ukoha Date
(Supervisor)
………………………… ………………………..
Dr. A. E. Ochonogor Date
(Head, Department of Pure and
Industrial Chemistry)
…………………………… ……………………..
(Dean, Postgraduate School ) Date

iv
iv
DEDICATION
To almighty God, my father late Alh. Umar-Saje Zakari for his love in quest
for knowledge and the less privileged

v
v
ACKNOWLEDGEMENT
All praise belongs to Allah, the Author and Giver of knowledge and
wisdom.
My sincere gratitude goes to my supervisor, Prof. P. O. Ukoha for his
fatherly role. Who despite his tight schedule finds time to give from his wealth of
experience guidance and counseling without boundaries in academics, social,
moral and spiritual supports.
I like to acknowledge the entire staff of the department of Pure & Industrial
Chemistry, University of Nigeria, Nsukka for their un-alloyed support. Notably:
Dr. Ujam, Dr. Asegbeloyin, Dr. Obasi and Miss Chidinma.
Special thanks to the Management and Staff, Kogi State University,
Anyigba, the out-gone Head of Department of Chemistry, Dr Awodi Y., the
incumbent Head of Department of Chemistry and Tertiary Education Trust Fund
(TET-Fund) for their support.
I wish to acknowledge the entire staff in Chemistry Lab, Biological Science
Lab, Microbiology Lab and Biochemistry Lab, Kogi State University Anyigba.
Notably the Chief Technologist in Biological Science Mr Ogunleye J., Chief
Technologist in Biochemistry Mr. Ekeyi P. and Mr. Usman A. O. in Chemistry.
I say a big thank you to my Mum, Hajiya Sharubutu, my Fiancée Hadiza, my
brothers: Bakatu (Big Bros), Tanimu (TMS), Bello, Yanda, Hamisu, Aptan Nnagi;
and my Confidant & Research Assistant Patricia for your love and understanding
throughout the period of this research.
My warmth appreciations to Dr. Emurotu and family, Mr Agbogun and
family, Mr Samson (My Twin brother), Mr Tobi, Mr Peter (Pete), Mal. Aminu and
family, Alh Jibo and family for your care, support and understanding.

vi
vi
ABSTRACT
3,5-Bis[(2-hydroxy-benzylidene)-amino]-benzoic acid (H2B) and its
cobalt(II) and nickel(II) complexes were synthesized and characterized via:
electronic, IR, 1H NMR and
13C NMR. Job’s continuous variation method was
used to determine the mole ratio for both metal complexes. Solvent extraction
studies were carried out on H2B in 5% DMF with its cobalt(II) and nickel(II)
complexes using CHCl3 as organic solvent; with variable condition effects of
equilibrium time, buffer pH, mineral acids, salting-out agents and complexing
agents. IR spectral study indicates coordination through (N2O2) azomethine and
protonated hydroxyl groups. Job’s continuous variation method showed a metal to
ligand ratio, 1:1, for both metal complexes of H2B. Cobalt(II) complex of H2B
showed quantitative extraction in pH range 5 – 7, while nickel(II) complex of H2B
showed quantitative extraction in pH range 6 – 8. Nickel was successfully
separated from cobalt by four-cycle extraction at 10-3
M HNO3 aqueous mixture of
Ni(II) and Co(II) {10 µgcm-1
each} in 5% H2B/DMF using 0.05 M cyanide as
masking agent and CHCl3 as organic solvent.

vii
vii
TABLE OF CONTENTS
Title page. . . . . . . . . . . i
Declaration . . . . . . . . . . ii
Certification . . . . . . . . . iii
Dedication . . . . . . . . . . iv
Acknowledgment . . . . . . . . . v
Abstract . . . . . . . . . . vi
Table of Contents . . . . . . . . . vii
List of Tables . . . . . . . . . xi
List of Figures . . . . . . . . . xii
CHAPTER ONE:
1.0 General Introduction …………………………………………………. 1
1.1 Background of Study…………………………………..…………... 2
1.2 Scope of Study…………………………………………..…………... 3
1.3 Significance of Study………………………………..……………... 4
1.8 Aims and Objectives…………………………………………... 4
CHAPTER TWO: Literature Review
2.0 Brief Chemistry of Metals under Study………,…………….. 6
2.1 Cobalt ……………………………………………………… 6
2.1.1 Aqueous Chemistry of Cobalt …………………………………... 8
2.1.2 Oxidation States.…………………………… …………….. 8
2.2 Nickel………… ……………………………………………. 13
2.2.1 Aqueous Chemistry of Nickel ...……………………………. 15

viii
viii
2.2.2 Oxidation States………………………………………………... 16
2.2.3 Uses of Nickel and its Compound……………………..………… 17
2.2.4 Nickel and Human Health……………………………………. 18
2.3 Theoretical Fundamentals of Liquid-Liquid Extraction ……..….. 19
2.3.1 Distribution Law …………………………………………………. 20
2.3.2 Limitation of Nernst Distribution Law ………………………….. 22
2.3.3 Thermodynamic Partition Law Constant……………………… 24
2.3.4 Distribution Ratio ……………………………………………… 27
2.4 Efficiency of Extraction ………………………………………… 28
2.4.1 Percentage Extraction ………………………………………….. 29
2.4.2 Separation Factor ……………………………………………… . 31
2.5 Quantitative Treatment of Solvent Extraction Equilibrium …….. 33
2.6 Extraction Methods in Solvent Extraction ……………………… 37
2.6.1 Batch Extraction ………………………………………………… 37
2.6.2 Continuous Extraction …………………………………………… 42
2.6.3 Discontinuous Countercurrent Extraction ……………………….. 43
2.7 Classification of Inorganic Extraction System …………………. 45
2.7.1 Metal Chelate…………………………………………………… . 46
2.7.2 Ion-association Complexes …………………………………….. . 53
2.7.3 Additive Complexes ……………………………………………. 54
2.8 Factors that Influence Stability and Extractability of Metal
Chelate Complexes……………………………………………. 57
2.9 Brief Work on Solvent Extraction of Metals under Study... 62

ix
ix
2.10 Previous Work on 3,5-Bis[(2-Hydroxy-Benzylidene)-Amino]-Benzoic
Acid………………………………………………………….... 66
2.10.1 Salens………………………………………………………... 68
2.10.1.1 Salen Ligand Synthesis…………………..………………..... 69
CHAPTER THREE:
3.0 Experimental…………………………………………………… 73
3.1 Equipments…...………………………………………………….. 73
3.2 Preparation of Metal Stock Solutions…………………………… 73
3.3 Synthesis of 3,5-Bis[(2-Hydroxy-Benzylidene)-Amino]-Benzoic
Acid …………………………………………………………….... 77
3.4 Synthesis of Co(II) and Ni(II) Complexes of 3,5-Bis[(2-Hydroxy-
Benzylidene)-Amino]-Benzoic Acid……………………….… 77
3.5 Determination of the Composition of the Extracted Species….. 78
3.6 Extraction Procedures ……………………………………………. 78
3.6.1 Extraction from Buffer Solution ………………………………… 79
3.6.2 Extraction from Acid Media……………………………………… 80
3.6.3 Extraction in Salting-out Agents………………………………….. 80
3.6.4 Extraction in Complexing Agents ………………………………… 81
3.7 Measurement of Distribution Ratio……………………………….. 82
3.8 Spectrophotometric Analysis of the Metal Ions…………………… 82
3.9 Calibration Curve………………………………………………….. 83
3.10 Separation Procedures……………………………………………. 84
CHAPTER FOUR:
4.0 Results and Discussion…………………………………………… 85
4.1 Electronic Spectra………………………………………………… 85

x
x
4.2 IR Spectra…………………………………………………………. 86
4.3 1H NMR Spectra …………………………………………………. 96
4.4 13
C NMR Spectra ………………………………………………… 97
4.5 Metal–Ligand Mole Ratio……………………………………….. .. 104
4.6 Molecular Formula of the ligand and the Complexes …………. .. 104
4.7 Solubility Data …………………………………………………... 109
4.8 Dissociation and Protonation Constants of the Ligand ………... … 111
4.9 Equilibration Time……………………………………………….. 115
4.10 Effect of pH Buffer on Extraction of Co(II) and Ni(II) …………… 115
4.11 Effect of Acidity …………………………………………………... 120
4.12 Effect of Salting-out Agent on Extraction …………………………. 122
4.13 Effect of Complexing Agents on Extraction ……………………. 125
4.14 Degree of Metal Separation ………………………………………. 128
4.15 Summary and Conclusion ………………………………………….. 128
4.16 Recommendation………………………..………………………….. 130
4.17 Contribution to Knowledge……….………………………………….. 131
References…………….……………………………………………. 132

xi
xi
LIST OF TABLES
Page
4.1 Electronic Spectral data of H2B, CoB and NiB 91
4.2 Summary of Infrared spectral data of H2B, CoB and NiB 95
4.3 Summary of Proton resonance data for the H2B, CoB and NiB in
DMSO - D6 (400 MHz) 101
4.4 13
C NMR data for H2B, CoB and NiB in DMSO - D6 (400 MHz) 108
4.5 Solubility Test Data for the Ligand and its CoB and NiB Complexes 110
4.6 The amount of Co(II) extracted into the organic phase at various
time intervals 117
4.7 The amount of Ni(II) extracted into the organic phase at various
time intervals 118
4.8 Degree of Seperation of Ni(II) from Co(II) 129

xii
xii
LIST OF FIGURES
page
2.1 Graphical representation of Nernst Distribution Law 22
2.2 Deviation from Nernst distribution law 24
2.3 The distribution ratio D for three different substances A, B,
and C, plotted against the variable Z of the aqueous phase. 30
2.4 Same systems showing percentage extraction against Z 31
2.5 Extraction as a function of pH for metals of different formal
Valencies 35
2.6 Separatory funnel of different designs 38
2.7 The graph of ( )
o
orgaqWW n against nth number of extractions 42
2.8 Continuous extraction apparatus 43
2.9 Two interlocking glass units for Craig counter-current distribution 45
2.10 Effect of pH on the extraction of monovalent (Ag+), bivalent (Pb
2+),
tervalent (La3+
), and tetravalent (Th4+
) metal ions by 0.10M
8-hydroxyquinoline in chloroform 58
2.11 Effect of pH on the extraction of cobalt(II) and manganese(II)
by 8-hydroquinoline in chloroform 59
2.12 (R-R) Salen 69
2.13 Metal Complexes of Salen Ligand 1 Utilized in Catalytic
Asymmetric Processes 70
4.1 UV Spectrum of H2B 88
4.2 UV spectrum of CoB 89
4.3 UV Spectrum of NiB
90
4.4 Infra-red spectrum of H2 B 92
4.5 Infra-red spectrum of CoB 93

xiii
xiii
4.6 Infra-red spectrum of NiB
94
4.7 HI NMR spectrum of H2B in DMSO-D6 (400 MHz) 98
4.8 HI NMR spectrum of CoB in DMSO-D6 (400 MHz) 99
4.9 HI NMR spectrum of NiB in DMSO-D6 (400 MHz) 100
4.10 1H and
13C nmr assignment for H2B, CoB and NiB complexes 102
4.11 13
C NMR spectrum of H2B in DMSO-D6 (400 MHz) 105
4.12 13
C NMR spectrum of H2B in DMSO-D6 (400 MHz) 106
4.13 13
C NMR spectrum of H2B in DMSO-D6 (400 MHz) 107
4.14 Job’s plot for Co(II)/H2B mole ratio 112
4.15 Job’s plot for Ni(II)/H2B mole ratio 112
4.16 Structures of ligand, its Co(II) and Ni(II) complexes 113
4.17 Titrimetric determination of pkb for the ligand 114
4.18 Titrimetric method of determining pKa for the ligand 114
4.19 Profile for Co(II) extraction in buffer media 119
4.20 Profile for Ni(II) extraction in buffer media 119
4.21 Profile for extraction of Co(II) in various acid media 121
4.22 Profile for extraction of Ni(II) in various acid media 121
4.23 %E Vs concentration of salting-out agent for Co(II)
extraction with H2B/DMF 124
4.24 %E Vs concentration of salting-out agent for Ni(II)
extraction with H2B/DMF 124
4.25 Effect of complexing agent on the extraction of Co(II) with
H2B/DMF 127
4.26 Effect of complexing agent on the extraction of Ni(II)
with H2B/DMF 127

1
1
CHAPTER ONE
INTRODUCTION
1.0 General Introduction
Extraction is the transfer of a solute from one phase to another. Common
reasons to carry out an extraction in chemistry are to isolate or concentrate the
desired analyte or to separate it from species that would interfere in the analysis.
The most common case is the extraction of an aqueous solution with an organic
solvent that are immiscible with and less dense than water; they form a separate
phase that floats on top of the aqueous phase1.
Solvent or liquid-liquid extraction is based on the principle that a solute can
distribute itself in a certain ratio between two immiscible solvents, one of which is
usually water and the other an organic solvent such as benzene, carbon
tetrachloride or chloroform. In certain cases the solute can be more or less
completely transferred into the organic phase. The technique can be used for
purposes of preparation, purification, enrichment, separation and analysis, on all
scales of working, from microanalysis to production processes. In chemistry,
solvent extraction has come to the forefront in recent years as a popular separation

2
2
technique because of its elegance, simplicity, speed and applicability to both tracer
and macro amounts of metal ions2.
The ability of a solute (inorganic or organic) to distribute itself between an
aqueous solution and an immiscible organic solvent has long been applied to
separation and purification of solutes either by extraction into the organic phase,
leaving undesirable substances in the aqueous phase; or by extraction of the
undesirable substances into the organic phase, leaving the desirable solute in the
aqueous phase.3
1.1 Background of Study
Although solvent extraction as a method of separation has long been known
to the chemists, only in recent years it has achieved recognition among analysts as
a powerful separation technique. Liquid-liquid extraction, mostly used in analysis,
is a technique in which a solution is brought into contact with a second solvent,
essentially immiscible with the first, in order to bring the transfer of one or more
solutes into the second solvent4. The separations that can be achieved by this
method are simple, convenient and rapid to perform; they are clean as much as the
small interfacial area certainly precludes any phenomena analogous to the
undesirable co-precipitation encountered in precipitation separations.

3
3
Solvent extraction has one of its most important applications in the
separation of metal cations. In this technique, the metal ion, through appropriate
chemistry, distributes from an aqueous phase into a water-immiscible organic
phase. Solvent extraction of metal ions is useful for removing them from an
interfering matrix, or for selectivity (with the right chemistry) separating one or a
group of metals from others4.
Solvent extraction is one of the most extensively studied and most widely
used techniques for the separation and pre-concentration of elements. The
technique has become more useful in recent years due to the development of
selective chelating agents for trace metal determination5
1.2 Scope of Work
The Scope of this research is limited to synthesis of the Ligand
Bis(salicylidene)3,5-diaminobenzoic acid, its Co(II) and Ni(II) complexes,
spectrophotometric characterization via UV, IR, H and NMR(1H and
13C),
extraction of cobalt and nickel metal ions in water using chloroform as organic
solvent and separation of Ni(II) from aqueous mixture of Ni(II) and Co(II).

4
4
1.3 Significance of Study
The introduction of versatile organic reagent, ‘dithizone’, dimethylglyoxime
about five years later and 8-hydroxylquinoline in the 1940s opened a new in liquid-
liquid extraction studies which suffered a lull from 1900 till then.6
The search for new extractants for metals continues to draw attention with
the quest for reagents that will be discriminatory enough for particular metal ions
and avoid interferences at the conditions of extraction.
Ukoha et al
7 reported the utilization of the compound Bis(4-hydroxypent-2-
ylidene) diaminethane as a good reagent to extract copper(II) and also separated
the element from a mixture of silver(I).
In this research, we are able to synthesize a schiff base Bis(salicylidene)3,5-
diaminobenzoic acid as a ligand to investigate the extraction characteristics of
cobalt(II) and Nickel(II) in various media. The complexes of cobalt(II) and
nickel(II) were characterized spectrophotometrically via UV-visible, IR, and
NMR(1H and
13C)
1.4 Aims and Objectives
This research is aimed at synthesizing a Schiff base ligand: 3,5-Bis-[(2-
hydroxy-benzylidene)-amino]-benzoic acid; its Co(II) and Ni(II) complexes;
characterization of the ligand and its Co(II) and Ni(II) complexes via, Uv-visible,

5
5
IR, 13
C and 1H NMR; using the ligand to extract Co(II) and Ni(II) from aqueous
solutions of varying conditions. Thus, the optimum extraction condition for the
extraction of Co(II) and Ni(II) from aqueous solution with 3,5-[(2-hydroxy-
benzylidene)-amino]-benzoic acid will be achieved and a favourable condition for
the separation of Ni(II) from Co(II) with the ligand will also be ascertained. Hence,
the true nature of the Co(II) and Ni(II) complexes of the ligand will be known.

6
6
CHAPTER TWO
LITERATURE REVIEW
2.0 Brief Chemistry of Metals under Study
2.1 Cobalt
Cobalt is a rare element of the earth’s crust comprising 29 ppm i.e. 0.0029%;
though widely distributed, stands only thirtieth in order of abundance and is less
common than all other elements of the first transition series except scandium (25
ppm)
More than 200 ores are known to contain cobalt but only a few are of
commercial value. The more important are arsenides and sulfides such as smaltite.
CoAs2, cobaltite (or cobalt glance). CoAsS, and linnaeite, Co3S4. These are
invariably associated with nickel, and often also copper and lead, and it is usually
obtained as a byproduct or co-product in the recovery of these metals. The world’s
major sources of cobalt are the African and Canada with smaller reserves in
Australia and the former USSR.
Properties
The metal is lustrous and silvery with a bluish tinge; appreciably hard. By
contrast the atomic weight of cobalt is known with considerable precision since the

7
7
element has one naturally occurring isotope i.e. 59
Co, but bombardment by thermal
neutrons converts this to the radioactive 60
Co. The latter has a half-life of 5.271y
and decays by means of β- and γ emission to non-radioactive
60Ni. It is used in
many fields of research as a concentrated source of γ-radiation, and also medically
in the treatment of malignant growths.
Property Value
Atomic number 27
Number of naturally occurring isotope 1
Atomic weight 58.933200(9)
Electronic configuration [Ar]3d7 4s
2
Electronegativity 1.8
Metal radius (12-coordinate)/pm 125
Effective ionic radius (6-coordinate)/pm IV 53
III 54.5(Is), 61(hs)
II 65(Is), 74.5(hs)
MP/0C 1495
BP/0C 3100
∆Hfus/kJ mol-1
16.3
∆Hvap/kJ mol-1
382
∆Hf (monatomic gas)/kJ mol-1
425(+ 17)

8
8
Density (200C)/gcm
-3 8.90
Electrical resisitivity (200C)/µohm cm 6.24
2.1.1 Aqueous Chemistry of Cobalt
Cobalt shows no important valence higher than 4, its most important being
an electorvalency of 2 in the cobalt(II) ion Co2+
. The simple cobalt(III) ion Co3+
is
very unstable, so as the hydrated into [Co(H2O)6]3+
, but cobalt forms numerous
stable complexes in which it has a covalency (or oxidation state) of +339
The most common oxidation states of cobalt are +2 and +3. [Co(H2O)6]2+
and
[Co(H2O)6]3+
are both known but the latter is a strong oxidizing agent in aqueous
solution, unless it is acidic, it decomposes rapidly as the CoIII
oxidizes the water
with evolution of oxygen. Consequently, in contrast to CoII, Co
III provides few
simple salts, and those which do occur are unstable. However, CoIII
is unsurpassed
in the number of coordination complexes which it forms, especially with N – donor
Ligands. Virtually all of these complexes are low-spin. The ���� configuration
producing a particularly high CFSE.40
2.1.2 Oxidation States
Oxidation state III(d6)

9
9
This is the most prolific oxidation state, providing a wide variety of
kinetically inert complexes. The complexes are virtually all low-spin and
octahedral, a major stabilizing influence being the high CFSE associated with the
���� configuration (
��
�∆� , the maximum possible for any d
x configuration). Even
[Co(H2O)6]3+
is low-spin but it is such a powerful oxidizing agent that it is unstable
in aqueous solutions and only a few simple salt hydrates, such as the blue
Co2(SO4)3.18H2O and MCo(SO4)2.12H2O (M=K, Rb, Cs, NH4), which contain the
hexaaquo ion, and CoF3.3½H2O can be isolated. This paucity of simple salts of
cobalt(III) contrasts sharply with the great abundance of its complexes, especially
with N-donor Ligands41
and it is evident that the high CFSE is not the only factor
affecting the stability of this oxidation state.40
Cobalt(III) forms few simple salts, but the green hydrated fluoride
CoF3.3.5H2O and the blue hydrated sulfate Co2(SO4)3.18H2O separate on
electrolytic oxidation of Co2+
in 40% HF and 8 M H2SO4, respectively. Alums,
MCo(SO4)2.12H2O are dark blue; they are reduced by water.
In aqueous solutions containing no complexing agents, oxidation of [Co(H2O)6]2+
to CoIII
is very unfavorable:
VEOHCoeOHCo 84.1])(])([ 02
62
3
62 ==+ ++
…………………..(66)
However, electrolytic or O3 oxidation of cold acidic perchlorate solutions of
Co2+
gives [ +3
62 ])( OHCo , which is in equilibrium with [ +2
52 ])()( OHOHCo . At 00C,

10
10
the half-life of these diamagnetic ions is about a month. In the presence of
complexing agents such as NH3, which form stable complexes with CoIII
, the
stability of CoIII
is greatly improved.
VENHCoeNHCo 1.0])(])([ 02
63
3
63 ==+ ++
………....……….(67)
In basic media we have:
VEOHOHCoOHOHCo ss 17.0)()( 0
)(22)( =+=+ −
………..…(68)
Water rapidly reduces uncomplexed Co3+
at room temperature. This relative
instability is evidenced by the rarity of simple salts and binary compounds, where
CoII forms such compounds in abundance.
42
Oxidation state II (d7)
This is one of the two most stable oxidation states. By contrast, CoII
carboxylates such as the red acetate, Co(O2CMe)2.4H2O, are monomeric and in
some cases the carboxylates ligands are unidentate. The acetate is employed in the
production of catalyst used in certain organic oxidations, and also as a drying agent
in oil-based paints and varnishes. Cobalt(II) gives rise to simple salts with all the
common anions and they are readily obtained as hydrates from aqueous solutions.
The parent hydroxide, Co(OH)2, can be precipitated from the aqueous solutions by
the addition of alkali and is somewhat amphoteric, not only dissolving in acid but
also re-dissolving in excess of conc. alkali, in which case it gives a deep blue
solution containing [Co(OH)4]4-
ions. It is obtainable in both blue and pink

11
11
varieties, the former is precipitated by slow addition of alkali at 00C, but it is
unstable and, in the absence of air, becomes pink on warming.
Complexes of cobalt(II), are less numerous than those of cobalt(III) but,
lacking any configuration comparable in stability with the ���� of cobalt(III), they
show a greater diversity of types and are more labile. The redox properties and the
possibility of oxidation must always be considered when preparing CoII complexes.
However, providing solutions are not alkaline and the ligands not too high in the
spectrochemical series, a large number of complexes can be isolated without
special precautions. The most common type is high-spin octahedral, though spin-
pairing can be achieved by ligands such as CN-which also favour the higher
oxidation state. Appropriate choice of ligands can however lead to high-spin-low-
spin equilibria as in [Co(terpy)2]X2.nH2O and some 5- and 6-coordinated
complexes of Schiff bases and pyridines.43
Many of the hydrated salts and their
aqueous solutions contain the octahedral, pink [Co(H2O)6]2+
ion, and bidentate N-
donor ligands such as en, bipy and phen form octahedral cationic complexes
[Co(L-L)3]3+
, which are more stable to oxidation than is the hexamine
[Co(NH3)6]2+
. Acac yields the orange [Co(acac)2(H2O)2] which has the trans
octahedral structure and can be dehydrated to form [Co(acac)2] which attains
octahedral coordination by forming the tetrameric specie.

12
12
Tetrahedral complexes are also common, being formed more readily with
cobalt(II) than with the cation of any other truly transitional element (i.e. excluding
ZnII). Thus, in aqueous solutions containing [Co(H2O)6]
2+ there are also present in
equilibrium, small amounts of tetrahedral [Co(H2O6)4]2+
, and in acetic acid the
tetrahedral [Co(O2CMe)4]2-
occurs. The most obvious distinction between the
octahedral and tetrahedral compounds is that in general the former are pink to
violet in colour whereas the latter are blue, as exemplified by the well-known
equilibrium:
[Co(H2O)6]2+ + 4Cl- [CoCl4]2- + 6H2O
Pink Blue…………….…..(69)
This is not infallible distinction (as the blue but octahedral CoCl2
demonstrates)
On the other hand, Co(III) complexes in which the complexing agent is other
than water, are much more stable than the corresponding Co(II) complexes, e.g.
potassium pentacyanocobaltate(II), K3[Co(CN)5], is such a powerful reducing
agent, i.e. the Co(II) atom so readily loses an electron to form Co(III), that it
reduces water to hydrogen.
−−−+ +→++ OHHeOHH 221 , ……………………………….…….(70)
and is itself oxidized to potassium hexacyanocobaltate(III), K3[Co(CN)6].

13
13
The hydrated cobalt cobalt(II) ion in solution is pink and in hydrated salts it has a
varying shades of pink or red. Anhydrous salts are blue.39
2.2 Nickel
An alloy of nickel was known in China over 2000 years ago, and Saxon
miners were familiar with the reddish-coloured ore, NiAs, which superficially
resembles Cu2O. These miners attributed their inablility to extract copper from this
source to the work of the devil and named the ore ‘Kupfernickel” (Old Nick’s
copper). In 1751 A. F. Cronstedt isolated an impure metal from some Swedish ore
and, identifying it with the metallic component of Kupfernickel, named the new
metal “nickel”. In 1804 J. B. Richter produced a much purer sample and so was
able to determine its physical properties more accurately.
Nickel is the seventh most abundant transition metal and the twenty-second
most abundant element in the earth’s crust (99 pm). Its commercially important
ores are of two types:
- Laterites, which are oxide/silicate ores such as garnierite,
(Ni,Mg)6Si4O10(OH)8 and nickeliferous limonite, (Fe,Ni)O(OH).nH2O,
which have been concentrated by weathering in tropical rainbelt areas such
as New Caledonia, Cuba and Queensland.

14
14
- Sulfides, such as pentlandite, (Ni,Fe)9S8, associated with copper, cobalt and
precious metals so that the ores typically contain about 1½% Ni. These are
found in more temperate regions such as Canada, the former Soviet Union
and South Africa.
Arsenide ores such as niccolite( Kupfernickel (NiAs), smaltite
(Ni,Co,Fe)As2)are no longer of importance.
The most important single deposit of nickel is at Sudbury Basin, Canada. It was
discovered in 1883 during the building of the Canadian Pacific Railway and
consists of sulfide outcrops situated around the rim of a huge basin 17 miles wide
and 37 miles long (possibly a meteoritic crater). Fifteen elements are currently
extracted from this region (Ni, Cu, Co, Fe, S, Te, Se, Au, Ag and the six platinum
metals).
Properties
The metal is silvery-white and lustrous, malleable and ductile so that they can be
easily worked. Difficulties in attaining high purities have also frequently led to
disparate values for some physical properties, while mechanical history has
considerable effect on such properties as hardness.
Property Value
Atomic number 28
Number of naturally occurring isotopes 5

15
15
Atomic weight 58.6034(2)
Electronic configuration [Ar]3d8 4s
2
Electronegativity 1.8
Metal radius (12-coordinate)/pm 124
Effective ionic radius (6-coordinate)/pm IV 48
III 56(Is), 60(hs)
II 69
MP/0C 1455
BP/0C 2920
∆Hfus/kJ mol-1
17.2(+ 0.3)
∆Hvap/kJ mol-1
375(+ 17)
∆Hf (monatomic gas)/kJ mol-1
429(+ 13)
Density (200C)/gcm
-3 8.908
Electrical resisitivity (200C)/µohm cm 6.84
2.2.1 Aqueous Chemistry of Nickel
All well-known nickel compounds, except oxides and hydroxides, contain
nickel in the bivalent state only.

16
16
Nickel sulphate is NiSO4.7H2O is green, the anhydrous salt yellow. It forms
a green double sulphate with (NH4)2SO4, ammonium nickel(II) sulphate (NH4)2SO-
4.NiSO4.6H2O, used in ammonical solution as the electrolyte in nickel plating39
.
2.2.2 Oxidation States
Oxidation state II(d8)
This is undoubtedly the most prolific oxidation state for nickel.
The absence of any other oxidation state of comparable stability for nickel implies
that compounds of NiII are largely immune to normal redox reactions. Ni
II forms
salts with virtually every anion and has an extensive aqueous chemistry based on
the green [Ni(H2O)6]2+
ion which is always present in the absence of strongly
complexing ligands.
The oxidation number of NiII rarely exceeds 6 and its principal
stereochemistries are octahedral and square planar (4-coordinate) with rather fewer
examples of trigonal bipyramidal (5), square pyramidal (5), and tetrahedral (4).
Octahedral complexes of NiII are obtained (often from aqueous solution by
replacement of coordinated water) especially with neutral N-donor ligands such as
NH3, en, bipy and phen, but also with NCS-, NO2
- and O-donor dimethylsulfoxide,
dmso (MeSO).40

17
17
2.2.3 Uses of Nickel and Its Compounds
The primary use of nickel is in the preparation of alloys such as stainless
steel, which accounts for approximately 67% of all nickel used in manufacture.
The greatest application of stainless steel is in the manufacturing of kitchen sinks
but it has numerous other uses as well.
Other nickel alloys also have important applications. An alloy of nickel and
copper for example is a component of the tubing used in the desalination of sea
water. Nickel steel is used in the manufacture of armour plates and burglar proof
vaults. Nickel alloys are especially valued for their strength, resistance to corrosion
and in the case of stainless steel for example, aesthetic value.
Electroplating is another major use of the metal. Nickel plating is used in
protective coating of other metals. In wire form, nickel is used in pins, staples,
jewellry and surgical wire. Finely divided nickel catalyses the hydrogenation of
vegetable oils. Nickel is also used in the colouring of glass to which it gives a
green hue.
Other applications of nickel include:
- Coinage
- Transportation and construction
- Petroleum industry
- Machinery and household appliances

18
18
- Chemical industry.
Nickel compounds also have useful applications. Ceramics, paints and dyes,
electroplating and preparation of other nickel compounds are all applications of
these compounds. Nickel oxide for example is used in porcelain painting and in
electrodes for fuel cells. Nickel acetate is used as a mordant in the textiles industry.
Nickel carbonate finds use in ceramic colours and glazes.
2.2.4 Nickel and Human Health
The first crystallisation of an enzyme was reported in the 1920's. The
enzyme was urease which converts urea to ammonia and bicarbonate. One source
of the enzyme is the bacterium Helicobacter Pylori. The release of ammonia is
beneficial to the bacterium since it partially neutralizes the very acidic environment
of the stomach (whose function in part helps kill bacteria). In the initial study it
was claimed that there were no metals in the enzyme. Fifty years later this was
corrected when it was discovered that nickel ions were present and an integral part
of the system. The Nobel Prize in Physiology or Medicine for 2005 was awarded to
Barry J. Marshall and J. Robin Warren "for their discovery of the bacterium
Helicobacter pylori and its role in gastritis and peptic ulcer disease".44

19
19
2.3 Theoretical Fundamentals of Liquid-Liquid Extraction
Solvent extraction is a mass transfer process between two phases. Generally,
the solute dissolved in an aqueous solution is extracted into a water-immiscible
organic solvent. When the solute molecule crosses the interface of the two liquids,
its neighbouring solvent molecules changes drastically. If a metal is extracted from
an aqueous solution into an organic non-polar solvent, the metal ion is transferred
across the liquid-liquid boundary as an uncharged particle which can be
electroneutral complex (chelate) formed with the organic reagent or an ion-
association complex. Before the extraction, the metal ion in aqueous solution is in
form of metal-aquo complex while the organic phase consists of the organic
chelating agent. The chelating agent converts the metal-aquo complex into a
neutral metal chelate that distributes itself between the two liquid phases in a
definite ratio8.
Thus, solvent extraction brilliantly highlights the usefulness of phase
distribution as a separation principle. At equilibrium, the distribution between two
liquid phases is governed by Gibbs’ phase rule,9
P + F = C + 2 ……………(1)
Where P is the number of phases in thermodynamic equilibrium with each other, C
is the number of components and F is the number of degrees of freedom, which
means the number of intensive properties such as temperature or pressure.

20
20
When phase rule is applied to a system dealing with a solute distributed
between two immiscible solvents, it gives only one degree of freedom. This
implies that if we choose the concentration of the solute in one phase, the solute
concentration in the other phase is fixed10
. Hence, there is definite relationship
between the solute concentration in each of the solvent phases.
2.3.1 Distribution Law
The distribution of a solute between two immiscible liquids is an equilibrium
process. The distribution equilibrium is the basis for the calculation of the
distribution of a substance between the two phases. The physical basis for
extraction and distribution methods of homogenous mixtures is the Nernst
distribution law. The law states that; a solute will distribute itself between two
essentially immiscible solvents so that at equilibrium the ratio of the concentrations
of the solute in the two phases at a particular temperature will be constant provided
the solute is not involved in chemical interactions10
. Thus, the distribution ratio in
the ideal case depends only on the solvent system and temperature, but not on the
initial concentration of the dissolved substance. Furthermore, in the presence of
several species of molecules, the individual molecule is distributed as if others
were not present. Hence, the law does not consider possible products of side
reactions.

21
21
If a substance, A, is dissolved in water, and this aqueous solution is mixed
with an organic solvent, by bringing it into intimate contact through shaking or
stirring, a portion Aorg is taken up by the organic medium while the remainder, Aaq,
is in the aqueous solution, thus establishing the equilibrium condition below.
Aaq Aorg
In addition, if the volume of the two solvent phases is Vorg and Vaq, the
concentrations of A in both phases are:
[ ]V
AAorg
org
org=
[ ]V
AAaq
aq
aq=
[ ][ ]A
AK
aq
org
D=∴
…………………….(2)
Where KD is called the distribution constant. Graphically, the law may be
expressed as in Fig 2.1

22
22
Figure 2.1: Graphical representation of Nernst Distribution Law.
The value of KD is a reflection of the relative solubility of the solutes in the two
phases.11
2.3.2 Limitation of Nernst Distribution Law
Critical treatment of Nernst distribution law has shown certain limitations as
itemized below:
- It is not thermodynamically rigorous12
. The law does not take cognizance of
the activities of different species. Even for the distribution of a single
monomolecular specie, the law will not hold unless the activity coefficients
in the two phases remain equal regardless of the total concentration of
solute.
Slope = KD,A
[A]org
[A]aq

23
23
- The law did not consider when the solute is present in more than one state.
Polymerization or dissociation of the solute specie, or its association with
other dissolved species may produce a complex set of equilibria such that
the analytically determined ratio of concentrations in the two phases varies
with the total concentration of the solute.
- A given partition coefficient refers to partition equilibrium between two
particular solvents. In ternary diagram, the tie lines are drawn connecting the
composition of the two immiscible phases in equilibrium. Since the
composition of each of these phases is independent of the concentration of
the solute for all points along the tie line, a single constant value for the
partition coefficient of this solute will apply to all mixtures whose
composition is represented by points along this line, irrespective of the
relative volume of the phases. However, for any mixture of composition
represented by points lying along any other tie line, a different (constant)
value of the partition coefficient will apply.
- Strictly, the law is only valid with pure solvents13
.
- The law does not hold when there is solute saturation of a phase.
- It did not consider when there is alteration of conditions like pH during
extraction.

24
24
Consequently, in some cases, instead of getting the perfect graph for the
distribution law, we obtain;
Figure 2.2: Deviation from Nernst distribution law.
Fig.2.2 indicates deviation from Nernst distribution law, which occurs due to
the factors listed above. The first deviation as stated above could be corrected by
considering the partition law from thermodynamic point of view.
2.3.3 Thermodynamic Partition Law Constant
Basically, the thermodynamic condition for a heterogeneous equilibrium
which takes place in partitioning of a substance, A, between an aqueous solution
and an organic solvent is that the chemical potentials, µA, of the solute are equal
for the two phases at constant temperature and pressure.14
[A]org
[A]aq

25
25
[ ] [ ] [ ]αµµ ARTIno
AA aqaqaq+=
[ ] [ ] [ ]αµµ ARTIn
o
AA orgorgorg+=
Since [ ] [ ]µµAA orgaq
=
[ ] [ ] [ ]αµµ ARTIn
o
AA aqaqaq+= = [ ] [ ] [ ]αµµ A
RTIno
AA orgorgorg+= …..(3)
These quantities [ ]µ o
A aq
and [ ]µ o
A org
are the standard chemical potentials and [ ]α A aq
and [ ]α A org
the activities of substance A in aqueous and organic phases respectively.
Such solute will obey Henry’s and Roult’s laws15
. Owing to the fact that the two
phases are liquids, the standard state of the substance refers to unit activity (e.g. in
ideal molar solutions). Equation (3) can be rearranged to give:
( ) ( ) ( )( )
( )ADRTIn
A
ARTInGo
AoA
Ka
aq
orgo
ADorgaq
,, ==∆−=−α
αµµ
The partition equilibrium can be characterized (at constant temperature and
pressure) by the thermodynamic equilibrium constant( )ADKa,. The standard chemical
potentials of the solute A for the two phases as well as the values of o
ADG ,∆ and
( )ADKa, remain constant only for ideal behaviour of the system. This implies that
the mutual solubility of the two liquids is negligible and the solution and the
activity coefficients of the substance are not changed over a wide range of
concentration.

26
26
Consequently, if the solute is strongly solvated, or at high concentration
(mole fraction >0.1), or the ionic strength of the aqueous phase is large (>0.1M) or
changes, equation (2), must be corrected for deviation from ideality according to
this equation21
( )( ) [ ]
( ) [ ]
( )( )
aqA
ADorgA
aqaqA
orgorgAO
AD
KK
A
A
γ
γ
γ
γ ,
,==
……………. (4)
This equation is thermodynamically exact. Where γA is activity coefficient
and KD,A the distribution constant. From equation (4), the distribution constant
remains a constant either for a dilute solution where the activity coefficients
approach unity or for systems where the activity coefficients are controlled by the
use of constant ionic medium method. That is, the ionic strength of the aqueous
phase is kept constant during an experiment by use of a more or less inert medium
like NaClO4. Under such conditions, the activity factor ratio of equation (4) is
assumed to be constant, and KD,A is used as in equation (2) as conditions are varied
at constant ionic strength value. The assumption that the activity factor ratio is
constant has been found to be valid over large solute concentration ranges for some
solute even at high total ionic strengths.
More so, in order to take care of the deviation due to the change of form of
the substance by dissociation, associating, polymerization or formation of complex

27
27
with some other components of the sample or interaction with solvent, another
distribution law is defined.
2.3.4 Distribution Ratio
There are always chemical interactions of the solute with the components in
each phase and these interactions can profoundly affect the concentration of the
solute in both phases. Analytically, the total amount of solute present in each phase
at equilibrium is of prime importance and the extraction process is therefore better
discussed in terms of the distribution ratio, D.
The distribution ratio is defined as the ratio of the total analytical
concentration of a solute in the organic phase (regardless of its chemical form) to
its total analytical concentration in the aqueous phase usually measured at
equilibrium16
. In a two phase system, taking into consideration the existence of a
solute in several chemical forms, A1, A2, A3, …Ax, the distribution ratio is given
by;
D = [ ][ ] totalaq
totalorg
A
A
,
,
= [ ] [ ] [ ][ ] [ ] [ ]
)5....(....................................
.......
21
||
2
|
1
aqxaqaq
orgxorgorg
AAA
AAA
+
+
It is important to briefly distinguish between the distribution constant, KD,
which is valid only for single specified specie and the distribution ratio, D, which

28
28
may involve sum of species of the kind indicated by the index, and thus is not
constant. Therefore, any tendency for the solute to be distributed abnormally in
either phase will show variation from the normal distribution ratio. This variation
occurs due to the fact that the same molecular species is not present in both phases,
because of the tendency of the solute to change its form via association,
dissociation or polymerization. But when the chemical form of the solute remains
the same in both phases, then the value of the distribution constant and the
distribution ratio becomes equal.
2.4 Efficiency of Extraction
Owing to the fact that it is not possible to extract a solute completely from
either an aqueous phase into an organic phase or vice-versa, thus we study the
efficiency of extraction, E.
phaseaqueousinsoluteofionconcentratphaseorganicinsoluteofionconcentrat
phaseorganicinsoluteofionconcentratE
+=
If the concentration of the solute in the organic phase is [A]orgVorg and its
concentration in the aqueous phase is [A]aqVaq,
[ ][ ] [ ] aqaqorgorg
orgorg
VAVA
VAE
+=∴
Dividing through by [A]aqVaq

29
29
[ ] [ ][ ] [ ] 1+
=aqaqorgorg
aqaqorgorg
VAVA
VAVAE
[ ][ ]
[ ][ ]
1+⋅
⋅
=
aq
org
aq
org
aq
org
aq
org
V
V
A
A
V
V
A
A
1+
=
aq
org
aq
org
V
VD
V
VD
E
Multiplying both sides with Vaq/Vorg
( )orgaq VVD
DE
+= ................................. (6)
Obviously, the efficiency of an extraction depends on the magnitude of D
and on the relative volumes of the liquid phases.
For phases of equal volumes, i.e., Vaq = Vorg, the efficiency of extraction
becomes:
1+=
D
DE ……………………..(7)
2.4.1 Percentage Extraction
Practically, the term percentage extraction is more informative than
distribution ratio and it can be correlated with the distribution ratio by the
following equations.

30
30
( )orgaq VVD
DE
+=
100% ………………..(8)
But when Vorg = Vaq, then the equation becomes
1
100%
+=
D
DE ………………………(9)
At very low or high values of D, percentage extraction becomes less
sensitive to change in D. Example, at a phase volume ratio of unity, for any value
of D below 0.001, the solute may be considered to be quantitatively retained in the
aqueous phase. Similarly, at large D values, the change in the value of percentage
extraction is negligible. That is to say that percentage extraction depends on the
value of D up to a limit.
Consider the liquid-liquid distribution plots in Fig 2.3
Figure 2.3: The distribution ratio D for three different substances A, B, and C, plotted against the variable Z of the
aqueous phase. Z may represent pH, concentration of extractant in organic phase and others.
0.1
1
D
10
Z
A
B
C
1 2 3

31
31
Figure 2.4: Same systems showing percentage extraction against Z.
In many practical situations, a plot like Fig 1.3 is less informative than that
of Fig 2.4.
Furthermore, percentage extraction curves are particularly useful for
designing separation schemes.13
2.4.2 Separation Factor
If two solutes A1 and A2 are present in a solution in an initial concentration
ratio [A1]/[A2], then upon extraction their concentration ratio in the organic phase
would be [A1]F1/[A2]F2, where F1 and F2 are the corresponding fractions extracted.
The ratio F1/F2, which is the factor by which the initial concentration ratio is
changed by the separation, is a measure of separation. A corollary measure of
separation which represents the change in the ratio of concentrations remaining in
the aqueous phase is (1-F1)/(1-F2)17
.
100%
E
50
0 1 2 3
Z
A
B
C

32
32
Consequently, the ability to separate two solutes depends on the relative
magnitudes of their distribution ratio. In solvent extraction, separation factor18
, β,
is defined as the ratio of the distribution ratio of the two solutes in a system. If the
corresponding distribution ratio of A1 and A2 are D1 and D2, then the separation
factor becomes;
2
1
DD
=β ……………………..(10)
This factor indicates the tendency for the solute A1 to be separated more
readily from aqueous phase into organic phase than solute A2. Thus, two species
can only be separated with one extraction when the value of D1 and D2 are grossly
different. In addition, two solutes whose distribution ratio differs by a constant
factor would be separated most efficiently if the product, D1D2, is unity. As an
illustration of this principle, solutes A1 and A2 with distribution ratios 103 and 10
1
respectively, if present in equal quantity, then single extraction would remove
99.9% of A1 and 90% of A2. A much more efficient extraction would be obtained
if, using the same factor of 100 between the distribution ratios, the two distribution
ratio were 101 and 10
-1. In this case, respective fraction extracted would be 90%
and 10%.

33
33
2.5 Quantitative Treatment of Solvent Extraction Equilibrium
Chelate complexes of many metals are known19-21
and with a given chelating
agent, the properties of the complexes change from one metal to another. This
chelate is a complex composed of a central metal atom and one or more
multidentate ligand22
. In solvent extraction, the extraction of a metal ion, M+ with
an organic reagent, HL, forming a chelate MLn soluble in an organic solvent is
expressed by the equilibrium;
nHM aqorgnorg
n
aqMLnHL
+++−−−−−+
)(, ………….(11)
The extraction constant expression can be written as;
[ ] [ ][ ] [ ]n
orgaq
n
n
aqorgn
exHLM
HMLK
+
+
= ………………………(12)
For example, the extraction of an aqueous solution of copper ion with a chloroform
solution of 8-hydroxyquinoline (oxime) forms the copper-oxine chelate which is
extracted into chloroform, and the proton released increases the acidity of the
aqueous phase23
.
From equation (12)
If several simplifying assumption are made;
- The concentrations of chelate species other than MLn are negligible
- The concentrations of hydroxyl or other anion coordination complexes are
negligible

34
34
- The reagent HL and the chelate MLn exist as simple undissociated molecules
in the organic phase, then;
Substituting D from equation (5) into equation (12) gives:
[ ][ ]n
org
n
aq
exHL
HDK
+
= …………………………(13)
[ ]
[ ]n
aq
n
org
ex
H
HLKD
+=∴ ………………………(14)
Thus for a given reagent and solvent, the extraction of the metal chelates is
dependent only upon pH and the concentration of reagent in the organic phase but
independent on the initial metal concentration. In practice, a constant and large
excess of reagent is used to ensure that all the metal complexes exist as MLn and D
is then dependent only on pH, i.e.,
[ ] n
aqex HKD−+= ……………..…..(15)
The equation above shows that the distribution ratio varies inversely as the
exponential power of hydrogen ion concentration. The logarithm of equation (15)
gives;
log D = log Kex + npH ……………………….(16)
From equation (7) we have that;
( )E
ED
−=
100 ………………………(17)
The log of equation (17) gives;

35
35
log D = log E – log (100 – E) ……………….(18)
Combining equation (16) and (18) gives;
log E – log (100 – E) = log Kex + npH……….(19)
Equation (19) defines the extraction characteristics for any chelate system, and is
represented graphically in Fig 2.5 for mono, di and trivalent metals, i.e., n = 1, 2
and 3 respectively. Also, it indicates the pH range over which a metal will be
extracted.
Figure 2.5: Extraction as a function of pH for metals of different formal valencies.
The position of the curves relative to the pH scales are determined by the
value of Kex. Therefore, the more acidic the reagent or the stronger the metal
complex, the lower the pH over which the metal will be extracted. Furthermore,
increased reagent concentration has a similar effect.
75
25
50
100
M3+
M2+
M+
pH1/
pH1/
pH1/
2
2 4 6 2 4 6 2 4 6 pH
% e
xtr
act
ion

36
36
The pH at which 50% of the metal is extracted, i.e., pH1/2, can be used to
assess the degree of seperability of two or more metals.
At E = 50, equation (19) reduces to;
log Kex = -npH½ …………………………(20)
Substituting log Kex into equation (16);
log D = n(pH – pH½ ) ……………………….(21)
For two metals with separation factor, β=D/'D
'' where D
' > D
'' and
log β = logD' - logD
'' …………………………..(22)
Therefore, for extraction at a specified pH;
−−
−= ΙΙΙΙΙΙ
21
21log pHpHnpHpHnβ ………(23)
If n' = n
'', i.e. metals have the same formal valency,
Logβ = n∆pH½ ……………………….(24).
Assuming that logβ should be at least 5 for an essentially quantitative separation by
a single extraction, ∆pH½ should be 5, 2.5 and 1.7 for pairs of mono-, di- and tri-
valent metals respectively. Selectivity by pH control is greatest, therefore, for
trivalent metals and least for monovalent. This is reflected in the slope of the
curves, which are determined by n and decrease in the order;
M3+
> M2+
> M+.11

37
37
2.6 Extraction Methods in Solvent Extraction
The two phases may be brought into contact with one another discretely or
continuously, giving rise to three common ways of performing solvent extraction;
batch, continuous and countercurrent. The way selected for any particular
extraction will depend upon the relative values of the distribution ratios of the
components in the original mixture, the equipment available, and convenience.
2.6.1 Batch Extraction
Batch extraction is the simplest and most widely used method employed
where a large distribution ratio for the desired separation is readily obtainable11
.
When the value of the distribution ratio for the desired constituent is large (10 or
greater for equal volume of two phases) and considerably different from those of
other components in the mixture, then batch method is preferred. Under these
conditions, a very large percentage of the solute will pass into the extracting liquid
with only a single equilibrium stage. In this method, a liquid containing the
dissolved solute is shaken or stirred with a second, immiscible liquid in a closed
container until partition equilibrium has been attained. Usually, the apparatus used
for this method is quite simple, a separatory funnel of some convenient design24
.
After shaking, the mixture is transferred into the separatory funnel and
allowed to settle. The denser phase is drained through the stop clock and collected

in another vessel. The phase with the desired constituent is then used for any
subsequent operation.
Figure 2.6: Separatory funnel of different designs.
We employ successive extraction to extract more solutes or when D is small.
Successive Extraction
The extraction is done successively and finally the extracts are combined.
The more the number of extraction, the higher the am
However, it can be shown that for a given volume of extracting solvent, it is more
effective to divide it into several small portions and use each portion successively
rather than to make a single extraction with the whole vo
can be proved mathematically as follows:
Suppose Wo
aq of a solute was originally present in V
phase. Let the solute be extracted with successive portions V
phase. Let Waq and Worg be the weights of the solutes in aqueous and organic
38
in another vessel. The phase with the desired constituent is then used for any
funnel of different designs.
We employ successive extraction to extract more solutes or when D is small.
The extraction is done successively and finally the extracts are combined.
The more the number of extraction, the higher the amount extracted, up to a limit.
However, it can be shown that for a given volume of extracting solvent, it is more
effective to divide it into several small portions and use each portion successively
rather than to make a single extraction with the whole volume. This last statement
can be proved mathematically as follows:
of a solute was originally present in Vaq(mL) of the aqueous
phase. Let the solute be extracted with successive portions Vorg(mL) of the organic
be the weights of the solutes in aqueous and organic
38
in another vessel. The phase with the desired constituent is then used for any
We employ successive extraction to extract more solutes or when D is small.
The extraction is done successively and finally the extracts are combined.
ount extracted, up to a limit.
However, it can be shown that for a given volume of extracting solvent, it is more
effective to divide it into several small portions and use each portion successively
lume. This last statement
(mL) of the aqueous
(mL) of the organic
be the weights of the solutes in aqueous and organic

39
39
phase respectively. The concentration values in aqueous and organic phases are Caq
and Corg respectively.
)()()( orgaq
o
aq WWW += (Wo is the total solute)
)(aqW = )()( aqaq VC
)()()( orgorgorg VCW =
Fraction of Solute Remaining In Aqueous Phase After First Extraction
( ) ( )orgorgaqaq
aqaq
o
aq
aq
VCVC
VC
W
WF
)()(
)()(
)(
)(
1
1
1
+==
1)(aqW = weight of solute remaining in aqueous layer after 1
st extraction.
Dividing through by 1)(aqC
)()(
)(
)(
)(
)(
)(
)(
1
.1
1 orgaq
aq
org
aq
org
aq
aq
DVV
V
VC
CV
VF
+=
+
=
)()(
)(
)(
)( 1
orgaq
aq
o
aq
aq
DVV
V
W
W
+=∴
+=
)()(
)(
)()( 1
orgaq
aqo
aqaq DVV
VWW ………….....(25)
Equation (25) enables the determination of the amount of solute that will
remain unextracted in the aqueous phase in a single equilibrium stage, provided the
volume of the two liquid phases and the distribution ratio for the solute in the
system are known. In a similar fashion, it can be shown that;

40
40
aqorg
orgo
aqorgVDV
DVWW
+=)( ……………..(26)
Equation (26) is employed in the calculation of the amount of solute that will
be extracted into the organic phase in a single equilibrium stage. If there is any
mutual solubility of the two liquids, the equilibrium volumes of the two phases will
not be the initial volume unless each liquid has been pre-saturated with the other
before it is used.
Fraction of Solute After Second Extraction
( ) orgorgaqaq
aqaq
o
aq
aq
VCVC
VC
W
WF
22
2
1
2
)(
)()(
)(
)(
2+
==
Dividing through by 2)(aqC ;
orgaq
aq
org
aq
org
aq
aq
DVV
V
VC
CV
VF
+=
+
=
.2
2
)(
)(
2
( ) ( )
+=∴
orgaq
aq
aqaq DVV
VWW 12 ……………..(27)
If we substitute the value of 1)(aq
W into this expression;
( )
2
2
+=
orgaq
aqo
aqaq DVV
VWW ………………(28)
If we continue for the 3rd
extraction;

41
41
( )
3
3
+=
orgaq
aqo
aqaq DVV
VWW
Then for nth extraction;
( )
n
orgaq
aqo
aqaq DVV
VWW n
+= ……………..(29)
Equation (29) enables us to determine the amount of the solute remaining in
aqueous phase after nth extraction.
The total amount extracted into the organic phase after nth extraction is given by;
( )naq
o
aq WW −
n
orgaq
aqo
aq
o
aqDVV
VWW
+−=
+−=
n
orgaq
aqo
aqDVV
VW 1 ……………….(30)
Consequently, knowing the value of the distribution ratio for a solute and the
volumes of the two phases, the number of extractions required to obtain the desired
degree of extraction can be determined.
Graphical representation;
The fraction remaining in aqueous phase is given by;
( )
n
orgaq
aq
o
aq
aq
DVV
V
W
W n
+= …………………(31)

42
42
Figure 2.7: The graph of ( )
o
orgaqWW n against nth number of extractions
From the graph, it can be observed that it is not possible to extract all the
solute from the aqueous phase, even at infinite number of extractions.
Importantly, since the term containing the volume ratio in equation (31) is
exponential in n, it follows that for a given volume of organic extractant, Vorg,
more solute is extracted when extracting the aqueous solution n times with Vorg/n
portions of the organic liquid, than when extracting once with the entire volume,
Vorg. When the distribution ratio is small, several successive extractions with fresh
portions of extractant can be employed to remove sufficient solute from the
aqueous phase but such procedure is often tedious or involves excessive volume of
the extractant25
.
2.6.2 Continuous Extraction
Continuous extraction method solves the problem of successive batch
extraction. It makes use of a continuous flow of immiscible solvent through a
Waq(n) / Woaq
nth extraction

solution, or a continuous counter
stripped and fresh solvent is added continuously from a reservoir or recycled by
distillation. Most continuous extraction devices operate on the same general
principle which consists of distilling the extracting solvent from a boiler flash,
condensing it and passing it continuously through the solution being extracted. The
figures below illustrate two types of apparatus used for this purpose;
Figure 2.8: Continuous extraction apparatus
solvent heavier than water.
2.6.3 Discontinuous Countercurrent Extraction
This method has repeatedly demonstrated that it stands high in the list of
tools available for this purpose by separating more than one compound from
preparations that were thought to be pure by all other techniques
43
solution, or a continuous counter-current flow of both phases. The spent solvent is
stripped and fresh solvent is added continuously from a reservoir or recycled by
distillation. Most continuous extraction devices operate on the same general
h consists of distilling the extracting solvent from a boiler flash,
condensing it and passing it continuously through the solution being extracted. The
figures below illustrate two types of apparatus used for this purpose;
tion apparatus26
. (a) Extraction with a solvent lighter than water. (b) Extraction with a
Discontinuous Countercurrent Extraction
This method has repeatedly demonstrated that it stands high in the list of
le for this purpose by separating more than one compound from
preparations that were thought to be pure by all other techniques
43
current flow of both phases. The spent solvent is
stripped and fresh solvent is added continuously from a reservoir or recycled by
distillation. Most continuous extraction devices operate on the same general
h consists of distilling the extracting solvent from a boiler flash,
condensing it and passing it continuously through the solution being extracted. The
figures below illustrate two types of apparatus used for this purpose;
. (a) Extraction with a solvent lighter than water. (b) Extraction with a
This method has repeatedly demonstrated that it stands high in the list of
le for this purpose by separating more than one compound from
preparations that were thought to be pure by all other techniques27
. It has

44
44
fractionated and given clear-cut evidence of purity for the individual fractions from
many substances, for which no clear-cut evidence has been obtained by any other
technique28
. Discontinuous countercurrent extraction was devised by Craig and it
enables substances with similar distribution ratios to be separated. The extraction
of this type is very efficient because fresh extractant is brought in contact with the
solute-depleted aqueous phase and then the solute-enriched extractants contacted
with the fresh aqueous phase till the equilibrium state is attained by the system. It
is used for fractionation purposes, and involves the use of a series of separatory
funnels or more elaborate contacting vessels to achieve many individual
extractions rapidly and in sequence.
The apparatus are fully automatic and comprises many extraction tubes
mounted on a shaking rack whose axis is attached to an automatic control unit.
This control unit automatically affects the operations of shaking, settling and
decantation. After each shaking operation, the rack is tilted through 90o and the
upper phase decanted into the next extraction tube. The cycle is repeated for up to
50 transfers. This method has been applied with great success to the fractionation
of organic compounds particularly where the distribution ratios are of same order
of magnitude. This technique is not common in inorganic compounds because of
different distribution ratios of the materials to be separated. Thus, batch and
continuous extraction techniques are easily employed.

Figure 2.9: Two interlocking glass units for Craig counter
Position during transfer.
2.7 Classification of Inorganic Extraction System
It is convenient to classify metal extraction systems on the basis of the
nature of the extactable species. Extraction can only be possible in an inorganic
extraction system if the charged metal
uncharged species; metal ch
complex is formed in the aqueous phase prior to extraction, but sometimes the
complexing agent is dissolved in the organic phase, in which case complexation
and extraction take place simultaneously when the
45
Two interlocking glass units for Craig counter-current distribution. (a) Position during e
Classification of Inorganic Extraction System
It is convenient to classify metal extraction systems on the basis of the
nature of the extactable species. Extraction can only be possible in an inorganic
extraction system if the charged metal-aquo complexes are converted into
uncharged species; metal chelate, or ion-association complexes. Usually, the
complex is formed in the aqueous phase prior to extraction, but sometimes the
complexing agent is dissolved in the organic phase, in which case complexation
and extraction take place simultaneously when the two phases are shaken together.
45
current distribution. (a) Position during extraction. (b)
It is convenient to classify metal extraction systems on the basis of the
nature of the extactable species. Extraction can only be possible in an inorganic
aquo complexes are converted into
association complexes. Usually, the
complex is formed in the aqueous phase prior to extraction, but sometimes the
complexing agent is dissolved in the organic phase, in which case complexation
two phases are shaken together.

46
46
Therefore, inorganic extraction system exists in three forms; metal chelates, ion
association complexes and additive complexes.
2.7.1 Metal Chelate
For a reagent to form an uncharged chelate with a metal, the reagent must
behave as a weak acid whose anion is to participate in the complex formation. In
addition, it must contain hydrophobic groups, which reduce the aqueous solubility
of the metal chelate formed. A metal ion Mn+
that is equilibrated with an organic
and aqueous phase is first solvated in the aqueous phase by water molecule to form
metal-aquo complexes. The organic anion from the dissociated organic reagent,
HL, displaces the water molecule in the aquo-metal complex forming neutral metal
chelate, MLn. The metal chelate distributes itself between the aqueous and organic
phase according to Nernst distribution law. For the fact that charge neutrality
reduces electrostatic interaction between the solute and water and the presence of
hydrophobic groups in the metal chelate reduces its aqueous solubility, the overall
solubility of the metal chelate in the organic phase is enhanced.
The equation of the reaction is given by;
( ) OOM xHMlnLH n
n
x 22+−−−+
−+ ……………..(32)

47
47
Typical examples of metal-chelate solvent extraction systems are the inner
complexes formed by 8-hydroxyquinoline, acetylacetone, dithizone and
dimethylglyoxime.
Organic reagents with one anionic group like –OH, -SH and one neutral
basic group like = N and =O are suitable chelating ligand. They can easily replace
coordinated water molecules from metal ions and provide more than one point of
coordination to the metal ion forming chelate compounds which are essentially
neutral and covalently bonded.
Extraction Equilibrium In Chelate Extraction System
The metal chelate extraction process can be thought to consist of four
equilibrium steps. The equilibrium that develops when an aqueous solution of a
divalent cation, such as Zn(II), is extracted with an organic solution containing
large excess of 8-hydroxyquinoline is as follows. The first step involves
distribution of the 8-hydroxyquinoline, HQ, between the organic and aqueous
layers. The second stage is acid dissociation of HQ to give H+ and Q
- ions in the
aqueous layer. The third equilibrium is the complex-formation reaction giving
MQ2. The fourth stage is distribution of the chelate between the two phases. The
fourth equilibrium ensures that MQ2 is not precipitated out of the aqueous
solution29
. The overall equilibrium is the summation of these four reactions given
as;

48
48
+++−−−−−+ )(2)(2)()(22 222)( aqaqorgaq HOHMQHQOHM ………(33)
The extraction constant for this reaction is
[ ]( )
[ ]
[ ]( )aqorg
aqorg
ex
OHMHQ
HMQK
22
2
)(
2
)(2
)(
=
+ ……………………..(34)
Several useful extractive separations with 8-hydroxyqiunoline have been
developed and similar chelating agents are described in the literature.30
.
On a general note, the extraction of metal complex, ML, that can dissociate
in aqueous phase, using a chelating agent, HL can be formulated based on the four
equilibrium steps below.
(1) The chelating agent HL distributes between the aqueous and the organic
phase31
.
(HL)org (HL)aq …………….(35)
[ ][ ]aq
org
HLD HL
HLK =∴
,
…………………….(36)
Where KD,HL is the distribution constant of the ligand, HL.
(2) The chelating agent dissociates in the aqueous phases;
( ) LHHL aqaqaq
−++−−−−− ……………..(37)
[ ] [ ][ ]aq
aqaq
a HL
LHK
−+
= …………………..(38)
Ka is the dissociation constant of the ligand.

49
49
(3) The metal-aquo complex reacts with the reagent anion to form an uncharged
molecule;
( ) On xHMLLOHM aqnaq
n
aqx 2,)(2+−−−+
−+ ……(39)
[ ][ ] [ ]LM
MLK n
aqaq
aq
Fn
n
−+=
…………………..(40)
KF is the formation constant of the metal chelate.
(4) Then the metal chelate is distributed between the organic and aqueous phases.
( ) ( )MLML nn orgaq−−−
…………………(41)
Thus,
[ ][ ]n
n
ML
MLK
aq
org
MLnD=
,
……………………..(42)
Where KD,MLn is the distribution constant of the metal chelate. The analytical
concentration of this metal in the aqueous phase is the sum of the equilibrium
concentrations of its two forms:
[ ] [ ] [ ]MMLM nn aqaqaqt
++=,
……………...(43)
If we assume that the chelate is essentially undissociated in the non-polar
organic solvent, then the distribution ratio (D) will be
[ ][ ] [ ]MML
MLn
n
nD
aqaq
org
++=
………………..(44)

50
50
Furthermore, assuming that the metal chelate distributes largely into the
organic phase,
[ ] [ ]MLM nn
aqaq⟩⟩+
:. Equation (44) becomes;
[ ][ ]M
MLn
nD
aq
org
+=
………………………..(45)
From equation (42)
[ ] [ ]nn MLKMLaqMLnDorg ,
= ………………..(46)
From equation (40)
[ ] [ ][ ]LK
MLM n
aqF
aq
aq
nn
−=+
…………………(47)
From equation (38)
[ ] [ ][ ]+
=−
H
HLKL
aq
aqa
aq
…………………..(48)
From equation (36)
[ ][ ]K
HLHL
HLLD
org
aq,
= …………………..(49)
Substituting for [ ]MLn org
and [ ]Mn
aq
+ in equation (45);
[ ] [ ][ ]ML
LKMLKD
n
n
aq
n
aqFaq
MLnD
−
=
.
,
…………(50)
i.e.,

51
51
[ ]LKKDn
aqFMLnD
−=.
,
………...………….(51)
Substituting for [ ]L aq
− in equation (51)
[ ][ ]H
HLKKKD n
aq
n
aq
n
aFMLnD
+=
.
.
, .…….……….(52)
Substituting for [ ]HLaq
in equation (52).
[ ][ ]HK
HLKKKD
nHLD
n
aq
n
org
n
aFMLnD
+=
,
, …………………(53)
Since,
…………………….(53i)
( )
( )n
org
n
orgex
H
HLKD
+= ……………………….(53ii)
The logarithm of equation (53ii) gives.
( ) npHHLnLogKLogDLog orgex ++= …….(53iii)
Hence, the distribution ratio depends on the extraction constant together with
the concentrations of the chelating agents, HL, and the pH of the solution. The
distribution ratio is an experimental parameter and its value does not necessarily
imply that distribution equilibrium between the phases has been achieved.
Furthermore, the experimental value of the distribution ratio can be altered
by varying the solution conditions. For example, consider the extraction of benzoic
exn
n
aFMLnDK
HLDK
KKK=
,
,

52
52
acid, HB, from water (acidified with HCl to suppress dissociation of the benzoic
acid) into an organic solvent such as ether. The only equilibrium solution is given
by;
HBHB orgaq−−− ……………(54)
[ ][ ]aq
org
D HB
HBK =∴ …………….(55)
But if the aqueous phase is not acidified, the benzoic acid dissociates in the
aqueous phase;
BHHB aqaqaq
−++−−− ………….(56)
[ ] [ ][ ]aq
aqaq
a HB
BHK
−+
=∴ …….…….(57)
Also, if benzene is used as the organic solvent in place of ether, the benzoic
acid is partially dimerized in benzene.
( ) ( )HBHBHBorgorg
.2 −−− ……...(58)
[ ][ ]HB
HBHBK
org
org
d 2.
.=
………………..(59)
The ratio of the total concentration of benzoic acid in each phase regardless
of its form is given by
[ ] [ ][ ] [ ]BHB
HBHBHBD
aqaq
orgorg
−+
+=
.2 ………(60)
From equation (57)

53
53
[ ] [ ][ ]
aq
aq
a
H
HBKB +
−= …………..…(61)
From equation (59)
[ ] [ ]HBKHBHBorgdorg
2
. = …………(62)
Substituting equation (61) and (62) into equation (60), we obtain,
[ ] [ ]
[ ][ ][ ]
[ ] [ ]( )
[ ] [ ]
++
=
++
+=
+
HKHB
KHB
H
HBKHB
HBKHB
aq
a
aq
dorg
aq
aq
aaq
orgdorgHB
D
1
2122 …………………...……..(63)
[ ]( )[ ]HK
KK
a
dDHB
D+
+=
+1
21 ……………………………………………....…..(64)
Therefore, at low pH, benzoic acid will be found more in organic layer as D
will be large. But at high pH, when D will be small, benzoic acid will be found in
aqueous layer almost entirely as benzoate ion.
2.7.2 Ion-Association Complexes
Ion-association complexes are uncharged species formed by the association
of ions due to electrostatic forces of attraction. Generally, the complexes are
formed when an anionic complex of a metal ion interacts with cationic species
formed by the dissociation of ligand in the aqueous phase. The three equilibrium
steps that are involved for the formation of these complexes include:

54
54
Firstly, the formation of anionic complex by the replacement of the
aquomolecules attached to the metal ion by the major anions in the aqueous phase.
Secondly, the transfer of the organic reagent from the organic phase to the acidic
aqueous phase where it is protonated and it becomes cationic. Thirdly, the
formation of the ion-association complex by the association of the anionic metal
complex with the cationic ligand. The ion-association complexes are easily
attracted into the organic phase because of the weak solvation in the organic phase
and the electrostatic interaction between the cations and the anions. High dielectric
solvents like dichloromethane and nitrobenzene favour their formation.
2.7.3 Additive Complexes
Additive complexes are either ion associated or chelated but in addition may have
other molecules coordinated to them as ligand. The coordinated molecule may be a
reagent molecule, organic solvent molecule or hydroxyl molecules.
Additive Complexes With Organic Reagents
The metal may be incorporated into a large cation or anion or ion containing
bulky organic group. This, in association with an ion of opposite charge,
constitutes an ion pair, which may be readily extracted by an organic solvent. For
example, copper (I) reacts with 2, 9-dimethylphenanthroline to form a large
univalent cation which associates with a nitrate or perchlorate anion to form a

55
55
compound extractable into chloroform39
. Zinc as ZnCl2-
4 associates with two
tribenzylammonium ions [(C6H5CH2)3NH+] to give an uncharged specie soluble in
xylene. Tetraphenylarsonium perrhenate (C6H5)AS+.ReO
-4 and tetraphenyl
arsonium permanganate (C6H5)AS+. MnO
-4 are examples of such additive
complexes.
In order to illustrate the possible equilibrium in additive complexes of this
type, the associations of perrhenate and tetraphenylarsonium chloride are used as
follows32
KD,L KL(R4As+,Cl-)org (R4As+,Cl-)(aq) R4As+
(aq) + Cl-(aq) ……..(65i)
KD,M KM(R4As+,ReO4
-)org (R4As+,ReO4-)(aq) R4As+
(aq) + ReO4-(aq) ....(65ii)
Where R = C6H5
However, not all additive complexes with organic reagent system behaves
fully in accordance with this simple expression because it usually involves many
other complicated equilibria.
Additive Complexes with Organic Solvents
In these additive complexes, the organic solvent plays a major role in the
extraction processes. These complexes are usually formed when hydrophobic
reagents are employed as organic reagent (solvent), and, or the maximum
coordination number of the metal and the geometry of the ligand are favourable.

56
56
For example, uranyl nitrate, UO2(NO3)2, is extracted from nitric acid solutions by
diethyl ether. The hydrated species, UO2(NO3)2. 6H2O, in the aqueous phase
becomes UO2(NO3)2 . 2[(C2H5)2O]. 2H2O in the organic phase. As can be
observed above, the solvent, ether, replaces four water molecules attached to the
metal chelate to form a less hydrophilic additive complex, which is readily
extracted by non-polar solvent. Other solvents beside diethyl ether have been used,
including derivatives of phosphoric acid such as tri-n-butyl phosphate
(C4H9O)3P=O. Some conditions that favours these reactions are;
- Where the maximum coordination number of the metal and the geometry of
the ligands are favourable.
- Where the solvent easily displaces the coordinated water molecule from the
neutral chelate.
- Where the organic reagent is less hydrophilic and less nucleophilic than the
chelating ligand.
The formation of additive complexes of this type is established by measuring
the distribution ratio D1 and D2 of the metal using two different organic solvents at
the same reagent concentration. Variation of the ratio D1/D2 with pH confirms that
these additive complexes are formed, otherwise it will remain constant.
Additive Complexes with Hydroxyl Groups

57
57
The general formula of these complexes is MLn(OH)p. The extraction of
such complexes requires high alkaline media and an organic solvent with high
dielectric constant33
. The conditions above increase the partition constant thus
enhancing the extraction processes.
2.8 Factors that Influence Stability and Extractability of Metal Chelate
Complexes
The quantitative description of extraction given by Kolthoff and Sandell34
and the theoretical treatment of solvent extraction of metal chelates developed by
some workers35,10
are reviewed by briefly discussing some important points below;
Effect of Acidity (pH)
Equation (14) shows the dependence of the dissociation constant on
hydrogen ion concentration. The hydrogen ion concentration of the aqueous phase
governs the degree of dissociation of the chelating agent and hence the amount of
the anion present in the solution to chelate with the metal ion. The value of D
increases with decrease in hydrogen ion concentration, that is, as the pH increases.
This increment depends on the oxidation state of the metal ion being extracted.
Consequently, a high pH will favour dissociation, chelate formation, and
extraction. Also for a change of one pH unit, for example, the concentration of the
organic reagent being constant, the value of D is increased to 100 times if a

58
58
bivalent metal ion is extracted, or 1000 times for the extraction of a tervalent metal
ion36
. The effect of pH on the extraction of metal ions 1+, 2+, 3+, and 4+ charges
with 0.1M 8-hydroxyquinoline in chloroform is shown in Fig 2.10.
Figure 2.10: Effect of pH on the extraction of monovalent (Ag+), bivalent (Pb
2+), tervalent (La
3+), and tetravalent
(Th4+)
metal ions by 0.10 M 8-hydroxyquinoline in chloroform.
At fifty percent extraction, log D in equation (16) is zero. The pH of the
solution at this point is called pH one-half (pH1/2) and is a constant, characteristic
of the system under investigation23
.
Effect of Organic Chelating Agent
As clearly indicated in equation (14), the distribution ratio and the degree of
extraction increases as the concentrations of the chelating agent increase at
constant pH. But the concentration of chelating agent in the organic phase is
limited by its solubility (8-hydroxquinoline is soluble to the limit of 2.6M in
chloroform). Moreso, there is a shift to lower pH value with increasing
concentration of the chelating agent and this enables the extraction to be carried
out at a pH low enough to prevent hydrolysis.
TH4+
100
50
Pb2+
Ag
+
La3+
0 2 4 6 8 10 12
%E

59
59
Fig. 2.11 shows the extraction curves for the extraction of manganese with
8-hydroxyquinoline in chloroform at a concentration range of 0.1 and 0.0lM. As
can be observed, the pH½ value for manganese decreases from 6.66 to 5.66.
Figure 2.11: Effect of pH on the extraction of colbalt (II) and manganese (II) by 8-hydroquinoline in chloroform.
Sometimes, the chelon forms an adduct with metal chelate, MLn (HL)r, and
an increase in the concentration of the chelating agent will have a greater effect
than that predicted by equation (14) since the dependency upon the concentration
of the chelating agent is now (n + r) instead of just n. Cobalt oxinate and oxine
form such an adduct.
Effect of Masking Agent
When a masking agent (sequestering agent) such as ammonia, tartrate,,
nitrilotriacetic acid, or ethylenediaminetetraacetic acid is present in the aqueous
phase it complexes with the metal ion, thereby competing with the chelating agent
and the value of D is lowered. In solvent extraction, a masking agent is a
compound that can form a non-extractible complex with metal ions in the aqueous
0.01M
0.1M
0.01M
Mn
Co2+
0.1M
100
50
%E
2 0 4 6 8 10 12
pH

60
60
phase. Consequently, at constant concentration of extracting agent and pH, the
presence of masking agent decreases the percentage of metal extracted.
Furthermore, there is a shift of the %E-pH curve to higher pH values in the
presence of masking agent. The magnitude of this pH shift depends on the strength
of the metal-masking agent bond and on the concentration of the masking agent.
The application of masking agents in extraction separation of metals is of
extreme importance. By a selective utilization of the masking agents, it is possible
to extract a particular metal of interest from a mixture of metals, which form non-
extractable ionic complexes and remain masked in the aqueous phase.
Effect of Variation of the Oxidation State of Metal
In solvent extraction, a metal in one oxidation state may bond with a
chelating agent but does not in another oxidation state. Thus, such metal must be
converted to the appropriate oxidation state before extraction.
Example, Fe(II) complexes with O-phenanthroline while Fe(III) does not.
Therefore, we have to reduce Fe(III) using hydroxylamine hydrochloride before
treatment with the chelating agent. Also, Pd(II) complexes with dithizone while
Pd(IV) does not.
Effect of Salting-Out Agents
In solvent extraction, salting-out agents are ionic salts which when dissolved
in the aqueous phase increase ionic strength of the medium, hence causing a

61
61
decrease in the solubility of the non-ionic metal chelate in the aqueous phase.
Consequently, salting-out agents increase D of metal during extraction.
The mechanism of salting-out effect is as follows;
- The ionic activity of the extractable metal chelate is decreased.
- The highly hydrated ions of the salt deplete the effective concentration of
free H2O molecules, thereby making the metal chelate formation easy.
- The dielectric constant of the aqueous phase is increased, resulting in
decrease in solubility of the metal chelate in aqueous phase, but increase in
the organic phase.
Effect of the Stability of the Metal Chelate
Equation (39) shows that the stability constant of the metal chelate is
directly proportional to the distribution ratio. Thus, the larger the value of the
stability constant the greater the percent of the metal extracted at a constant pH,
other factors remaining unchanged. Conversely, the more stable the complex the
lower the pH of extraction.
Influence of Organic Solvent
In solvent extraction, choice of organic solvent highly depends on the
solubility of the organic reagent and the degree of immiscibility with the aqueous
phase37
. In addition, the organic solvent should possess the following
properties23,38
;

62
62
- It should have high density difference with the aqueous phase in order not to
form emulsions.
- It should have very low viscosity to permit good contact between the two
phases while shaking.
- The metal chelate should be readily soluble.
- The organic solvent should have low toxicity and inflammability.
- It should have such a property that will make for easy stripping off the
metal.
- It should have high boiling point for easy recovery after extraction.
2.9 Brief Work on Solvent Extraction of Metals under Study
Prior to the introduction of solvent extraction; the separation of cobalt and
nickel was very difficult to achieve, due to the very similar chemical behaviours of
these two metals. One of the early applications of solvent extraction in the
processing of base metals was the separation of cobalt from nickel in chloride
solutions by tertiary amines. The ease and efficiency of separation achievable by
selective extraction of cobalt as the tetrachlorocomplex ion by tertiary amines
(reaction 71), made solvent extraction an attractive route which was soon adopted
industrially.
−− +=+ ClCoClNHRNHClRCoCl orgorg )(423)(3
2
4 )(2 ……………………..(71)

63
63
The main disadvantage of the amine extraction route is the necessity to use
chloride solutions in order to form the extractible cobalt chloro-complexes.
Many efforts have been made to establish a viable cobalt-nickel solvent
extraction separation process for sulphate solutions. Reagents used for this
application have all been cation exchangers comprising various alkyl phosphorous-
based acids. Early on, the familiar di-2-ethylhexyl phospholic acid (DEHPA) was
used. It was found that if extraction was carried out at 50-600C, instead of ambient
temperature, the pH window separating cobalt and nickel expanded to about one
pH unit, enabling a satisfactory separation to be achieved by careful pH control
during extraction. A process based on this principle was operated industrially in
South Africa. Later on it was shown that better separation factors between cobalt
and nickel were achieved by the use of alkyl phosphonic and phosphinic acids45
.
Processes using alkyl phosphonic acids have been operated in Japan and, more
recently, in Finland46
. The commercial availability of alkyl phosphinic acids, in
particular 2,4,4-trimethyl-pentyl phosphinic acid, which is marketed under the
trade name, Cyanex 272, by the American Cyanamid company, resulted in many
papers being published on the application of this reagent to cobalt-nickel
separation47

64
64
Solvent extraction method was widely applied in separation of metal ions
from aqueous phase by contacting with an organic phase which contains a metal
selective organic reagent dissolved in a diluents48
.
Emad and Khalid49
reported the use of N,NI-carbonyl difatty amides
(CDFAs)for the extraction of cobalt(II) and separating it from other elements
(Ni(II), Cd(II), Mn(II) and Fe(II)) owing to its selectivity for cobalt(II) and its fast
rate of extraction from aqueous via: Effect of pH, solvent, shaking time, and
concentration of Co(II).49
Since the first commercial process using di-2-ethyl hexyl phosphoric acid
(D2EHPA) was developed by RITCEY et al50
, the organophosphorus extractants
have been proved to be primary solvents for separation cobalt from nickel in acidic
media solution51,52,53,54
. 2-ethylhexyl phosphonic acid mono-2-ethylhexyl ester was
developed and marketed as PC- 88A by the Daihachi Chemical Industry, and as
SME 418 by Shell used by the Nippon Mining55,56,57
. Under the same extraction
condition, this reagent gives a Co/Ni separation factor about 200 times greater than
that of D2EHPA. A similar solvent with PC-88A, named as P507, was produced in
early 1970s and found commercial application of Co/Ni separation in one Chinese
metallurgical enterprises in 198158
. Several phosphinic acids, such as Cyanex272,
Cyanex301 and Cyanex302, were developed by Cytec Chemicals. Cyanex272 is
being used in the Outokumpu Plant in Finland59
.

65
65
A survey of literature has reviewed the cobalt-nickel separation factors from
sulphate media using phosphoric, phosphonic and phosphinic acids60
. The
separation ability of cobalt and nickel increases in the order
phosphinic>phosphonic>phosphoric acid due to the increasing stabilization of
tetrahedral coordination compound of cobalt with the extractant in the organic
phase, because the tetrahedral compound is more stable than the octahedral one.
Out of the three types of extractants, Co-Ni separation factor of phosphoric acid,
such as D2EHPA, is usually below 10. Cyanex solvents are usually most expensive
in despite of most selective.
Much basic research has been carried out on the extraction of cobalt and
nickel from sulphate solution. Fujimoto et al61
have patented a process for cobalt-
nickel separation using PC-88A. The date shows 45.8 g/L cobalt extraction at pH
4.5 from a solution containing 30 g/L each of Co and Ni using 20%(volume
fraction) PC-88A. Devi et al62
studied the Co-Ni separation effects of D2EHPA,
PC-88A and Cyanex272 from a sulphate solution containing 0.01 mol/L metal ions
each and 0.1 mol/L Na2SO
4. In the case of extractions with 0.05 mol/L Na-PC88A,
the separation factor can reach over 1 000 at equilibrium pH range of 5.75−6.2, but
was extremely pH sensitive.

66
66
However, studies concerning extraction separation of cobalt and nickel using
PC-88A from chloride media are little. Sarangi et al63
indicated that the Co-Ni
separation factor can reach 37−72 at equilibrium pH range of 5.5−5.7 using
different concentrations of PC-88A from a chloride solution. Separation factors
obtained with binary mixture of extractants gave a value 5.6 times higher in the
case of Na-PC88A as extractant and Na-Cyanex 272 as synergist than that for Na-
Cyanex 272 alone. LIU et al64
reported Co-Ni separation using P507 as extractant
in sulfate and chloride solution.
2.10 Previous Work on 3,5-Bis-[(2-Hydroxy-Benzylidene)-Amino]-Benzoic
Acid
The compound 3,5-Bis[(hydroxyl-benzylidene)-amino]-benzoic acid is a
salen compound belonging to a class of Schiff’s base. Schiff’s bases (also called
azomethines or imines) are named after Hugo Schiff (1834-1915). These
compounds are functional groups with the general formula R1R2C=N-R3. They
contain carbon-nitrogen double bonds in which nitrogen atom are connected to an
aryl or alkyl group. The role of the R3 group is to stabilize the imine Schiff’s
base.65
Strictly speaking Schiff bases are compounds having a formula RR’C=NR”
where R is an aryl group, R’ is a hydrogen atom and R’’ is either an alkyl or aryl

67
67
group. However, usually compounds where R” is an alkyl or aryl group and R’ is
an alkyl or aromatic group are also counted as Schiff bases66
.
These compounds are synthesized from and aromatic imine and a carbonyl
compound (e.g. aldehydes, ketones; scheme1) through a nucleouphilic addition,
which leads to the formation of a hemi-aminal, and the consequent dehydration to
generate an imine. The reaction of 4, 4’-diaminodiphenyl ether with O-vanillin can
be regarded a typical reaction67
.
Application of aldehydes will lead to the formation of imines of R1HC=N-R2
type. This is while the result of the same reaction with ketones are R1R2C=NR3
amines (it should be noted that reaction of ketones occurs more steadily than that
of aldehydes. The overall mechanism of forming Schiff’s bases is according to the
multi-step reaction below:
C O H2 N C N H2O
aldehyde orketone
amineSchiff base orimine ……………………(72)
An imine (Schiff base), such as that formed from O-vanillin, forms
complexes with metal ions via N and O donor atoms. The steric and electronic
effects around the metal core can be finely tuned through appropriate selection of
electron withdrawing or electron donating substituent in the Schiff bases. These N
and O atoms induce two opposite electronic effects: the phenolate oxygen is
+

68
68
regarded as a hard donor, which stabilizes the higher oxidation states while the
imine nitrogen is a softer donor and will hence stabilize the lower oxidation states
of the metal ion68
.
The Schiff base class is very versatile as compounds can have a variety of
different substituent and they can be unbridged or N, N’-bridged. Most commonly
Schiff bases have NO or N2O2-donor atoms but the oxygen atoms can be replaced
by sulphur, nitrogen, or selenium atoms69
. Schiff bases can be classified into:
- Symmetric Schiff base: Salen, Salophen
- Asymmetric Schiff base: Salen, Salophen and Hydrazone
2.10.1 Salens
The term “Salen” is the abbreviation of the name of a popular chelating
ligand used in coordination chemistry and homogenous catalysis. i.e.
salicylaldehyde and ethylenediamine
Salen H2 forms complexes with most transition metals, where in most cases
the metal takes a square pyramidal or octahedral coordination, M(salen)L and
M(salen)L2. Examples include Vo(salen) and Co(salen)Cl(pyridine).
Numerous salen-derivatives are known. E.g. the ligand abbreviated “Salph”
is derived from the condensation of 1,2-phenylenediamine and salicylaldehyde70
.

69
69
2.10.1.1 Salen Ligand Synthesis
Salen Ligands are prepared by the condensation of a salicylaldehyde
derivative with a 1,2-diamine, and the simplest, a chiral version (Fig 2.12) is
prepared from salicylaldehyde and ethylenediamine, abbreviations of which
combine to give this ligand class its name.
N N
H H
t - Bu
t - Bu t - Bu
t - Bu OHHO
Fig 2.12: (R,R)-Salen
Chiral versions of this tetradentate bis(imine) ligand are accessed simply by
using chiral 1,2-diamines, although Ligands derived from other diamines (1,3-,
1,4-, etc.) are often included in this class. Chiral salen Ligands have several
attractive features that constitute the basis for their utility in asymmetric reactions.
The salicyladehyde and diamine components are synthetically accessible and their
condensation to generate the salen ligand generally proceeds in nearly quantitative
yield. Metal complexes of salen Ligands are readily prepared from a variety of first
row and second row transition metal salts as well as main group metals. Once the
appropriate metal for the desired reactivity has been identified, the modularity of

70
70
synthesis of salen Ligands allows for the systematic tuning of catalyst steric and
electronic properties by modification of the metal counterion, the chiral diamine or
the salicylaldehyde components71
. Although a large number of ligand structures
are thus accessible, it is striking that salen 1 has often been found to be the
optimum ligand for a broad range of reactions catalyzed by several different metals
(Fig 2.13)
N
t - Bu
t - Bu t - Bu
t - Bu OO
N
M
M = H.H 2. M = Mn-Cl 3a. M = Co
3b. M = Co-OAc 3c. M = Co-SbF6 4a. M = Cr-Cl
4b. M = Cr-N3 4c. M = Cr-BF4 4d. M = Cr-SbF6
5a. M = Al-Cl 5b. M = Al-N3
Fig 2.13: Metal complexes of salen ligand 1 utilized in catalytic asymmetric processes
Salen ligand 1 was first identified in the context of Mn-catalyzed
asymmetric epoxidation of unfunctionalized olefins72
.
The industrial synthesis of ligand 1 utilizes very inexpensive raw materials
(scheme1)73
and the ligand is now available commercially in both laboratory and
bulk quantities.

71
71
t-Bu
t-Bu
N
N
N
NHOAc. 1200C
OH
t-Bu
OH
CHO
t-Bu
+
NH 2
NH 2
OH
OH
HO 2C
HO 2C
HOAC, M eOH
NH 2
NH 3
OH
OH
HO 2C
O2C
N
OHt - Bu
t - Bu t - Bu
t - BuHO
Nt-Bu
OH
CHO
t-Bu
2+ NH2NH3
OHOH
HO2C O2C
K2CO3
Toluene/EtOH
Mandal et al74
reported the synthesis of N,N,-Bis(salicylidene)-3,4-
diaminobenzoic acid and its nickel(II) complex, by reacting 2 moles of
salicylaldehyde with 1 mole of 3,4-diaminobenzoic acid in 85% yield.
COOH
NH2
NH2
O
OH
Two equiv. in MeOH
(1)
(2) NiCl2/MeOH, 600CNiN
N
O O
CO2H
...(73)
……..(74)

72
72
Laye and Sanudo75
also reported the synthesis (in situ) of 3,5-Bis[{2-
hydroxyphenyl)methylene}amino]benzoic acid by the condensation reaction of 2
moles of salicylaldehyde with 3,5-diaminobenzoic acid:
NH2H2N
HOOH
H
O
HHO
OH
N
HO
N2+
In this research, we are able to synthesize, isolate and re-crystallize the
compound: 3,5-Bis-[(hydroxyl-benzylidene)-amino]-benzoic acid, with its
cobalt(II) and Ni(II) complexes respectively.
...(75)

73
73
CHAPTER THREE
3.0 EXPERIMENTAL
3.1 Equipments
Weighing balance (Metler E-2000), Metler Toledo 300 pH meter, Universal
pH indicator paper, Ground-glass-stoppered extraction bottles, Orbital shaker,
Separatory funnel, Agilent 8453 UV/Visible spectrophotometer, FTIR Shimadzu
spectrophotometer, Agilent-NMR-vnmrs400MHz spectrometer.
3.2 Preparation of Metal Stock Solutions
Cobalt (II):
Standard solution of cobalt(II) containing 100 µg/cm3
was prepared by
dissolving 0.10092 g of cobalt chloride hexahydrate, CoCl2.6H2O, in some quantity
of distilled water and then making it up to mark in 250 cm3 standard volumetric
flask.
Nickel (II):
Standard nickel(II) solution (100 µg/cm3) was prepared by dissolving
0.119697 g of nickel sulphate hexahydrate, NiSO4.6H2O, in some quantity of
distilled water and then making it up to mark in 250 cm3 standard volumetric
flask.
pH Solutions:

74
74
Clark and Lubbs’ procedure8 was used to prepare standard buffer solutions
covering the pH range 1-13 with standard solutions of the following acid/salt
systems:
Hydrochloric acid/potassium chloride,
hydrochloric acid/potassium hydrogen phthalate,
potassium hydrogen phthalate/sodium hydroxide,
and boric acid/sodium hydroxide.
Universal indicator paper and Metler Toledo 300 pH meter were used to
check the pH values of the solutions.
Acid Solutions:
Acid solutions of high concentrations were prepared and lower
concentrations obtained by diluting as required.
5 M HCl: A volume of 42.96 cm3 of 36% HCl (s.g. 1.18) was diluted in some
quantity of distilled water and made up to mark in 100 cm3 standard
volumetric flask.
5 M H2SO4: A volume of 27.78 mL of 98% H2SO4 (s.g. 1.84) was diluted in some
quantity of distilled water and made up to mark in 100 cm3 standard
volumetric flask.

75
75
5 M HNO3: A volume of 31.69 cm3 of 70% HNO3 (s.g. 1.42) was diluted in some
quantity of distilled water and made up to mark in 100 cm3 standard
volumetric flask.
5M HClO4: A volume of 49.62 cm3 of 61% HClO4 (s.g. 1.66) was diluted in some
quantity of distilled water and made up to mark in 100 cm3 standard
volumetric flask.
Salt Solutions:
Sodium chloride, 2 M: A 11.689 g of NaCl was dissolved in some quantity of
distilled water and made up to mark in 100 cm3 standard volumetric flask.
Sodium sulphate, 2 M: A 28.409 g of Na2SO4 was dissolved in some quantity of
distilled water and made up to mark in 100 cm3 standard volumetric flask.
Potassium Nitrate, 2 M: A 20.221 g of KNO3 was dissolved in some quantity of
distilled water and made up to mark in 100 cm3 standard volumetric flask.
Sodium Perchlorate, 2 M: A 24.488 g of NaClO4 was dissolved in some quantity of
distilled water and made up to mark in 100 cm3 standard volumetric flask.
The above high concentrated salt solutions were diluted as required and
fresh solutions were prepared monthly.
Masking Agents Solutions:
Potassium Cyanide, 1 M: A 3.256 g of KCN was dissolved in some quantity of
distilled water and made up to mark in 50 cm3 standard volumetric flask.

76
76
Potassium Sodium Tatrate, 1 M: A 14.112 g of potassium sodium tatrate was
dissolved in some quantity of distilled water and made up to mark in 50 cm3
standard volumetric flask.
Ammonium thiocyanate, 1 M: A 76.12 g of NH4SCN was dissolved in some
quantity of distilled water and made up to mark in 50 cm3 standard
volumetric flask.
Potassium hydrogen Phthalate, 1 M: A 10.211 g of KH(C8H5O4) was dissolved in
some quantity of distilled water and made up to mark in 50 cm3 standard
volumetric flask.
EDTA, 0.4 M: A 7.445 g of EDTA-disodium salt dehydrate, (C4H6N2O4Na2) was
dissolved in some quantity of distilled water and made up to mark in 50 cm3
standard volumetric flask.
Sodium oxalate, 1 M: A 6.700 g of Na2C2O4 was dissolved in some quantity of
distilled water and made up to mark in 50 cm3 standard volumetric flask.
Spectrophotometric Reagents Solutions:
Dimethylglyoxime: Dimethylglyoxime is prepared by dissolving 0.50 g of A. R.
dimethylglyoxime in 250 cm3 ammonium solution and diluting to 500 cm
3
with distilled water.65

77
77
Thiocyanate Ligand: A standard stock solution of ligand (SCN-) 152.588 g/L was
prepared by dissolving (50 g) of NH4SCN in distilled water. The volumetric
flask (250 cm3) was completed to the mark with distilled water.
66
3.3 Synthesis of 3,5-Bis-[(2-Hydroxy-Benzylidene)]-Amino]-Benzoic Acid.
Synthesis of the Schiff base ligand was carried out according to reported
method67
. The procedure was as follows:
To a solution of 400 mg (3.3 mmol) of salicylaldehyde in 10 cm3 of
methanol was added with stirring on magnetic stirrer a methanolic solution of 250
mg (1.6 mmol) of 3,5-diaminobenzoic acid. From this solution after some time, an
orange-colored crystalline solid precipitated out, which was filtered, dried, and
recrystallized from methanol.
3.4 Synthesis of Co(II) and Ni(II) Complexes of 3,5-Bis-[(2-Hydroxy-
Benzylidene)]-Amino]-Benzoic Acid.
Both cobalt(II) and nickel(II) complexes of the N,N/-bis(salicylidene)-3,5-
diaminobenzioc acid were synthesized according to literature.67
The orange Schiff base (100 mg) was dissolved in hot methanol; to this was
added a methanolic solution of equimolar solution of the metals (0.28 mmol), and
the resulting mixture was heated at 600C for 30 minutes. The resulting precipitate

78
78
upon standing at ambient temperature was filtered and recrystallized from a
mixture of methanol and chloroform.
3.5 Determination of the Composition of the Extracted Species
Job’s Continuous variation Method
The experiment was performed as described in literature68
as follows: An
equimolar concentration of Co(II) or Ni(II), and the ligand was mixed. The mixing
was in such a way that a bottle containing X cm3 of the metal solution in 1.00 mL
of aqueous phase also contained (1-X) cm3 of the reagent in the same quantity of
the organic phase. Thus, the sum of the metal ion concentration and ligand
concentration was constant for each solution. The phases were shaken, centrifuged
and separated. The absorbance of the organic phase was measured at wavelength of
maximum absorption of the complex.
3.6 Extraction Procedures
Agitation Speed: The orbital shaker was set at a high constant speed such that
increase in agitation speed did not change the extraction rate.
Equilibration Temperature: Solutions of both organic and aqueous phases were
allowed to equilibrate at room temperature 28±1oC before mixing for extraction. In
addition, all extractions were performed at the temperature stated above.

79
79
Equilibration Time: The time taken by the metal complex to transfer from
aqueous phase into organic phase.
The procedure for the determination of equilibration time is as follows:
0.6mL of 10 µg/cm3 solution of metal ion, Co(II) or Ni(II), was pipetted into
different extraction bottles, 0.2 cm3 of H2B (5%/DMF) was added and each made
up to 6.00 cm3 with distilled water. Equal volume (6.0 cm
3) of chloroform was
added to each bottle. The bottles were shaken and one bottle removed after each of
the desired time interval, 5, 10, 15, 20, 25, 30, 35, 40, 45, 50, 55 and 60 minutes.
The two phases were centrifuged and separated. The amount of metal ion left
unextracted in the aqueous phase was determined specrtrophotometrically.
3.6.1 Extraction from Buffer Solution
0.6 cm3 of 10 µg/cm
3 solution of Co(II) or Ni(II), was pipetted into different
extraction bottles representing pH values from 1 to 13. 3.4 cm3 of the buffer
solution of known pH was added into each bottle. The solutions were adjusted to
the appropriate pH using either dilute hydrochloric acid or ammonia solution; 0.2
mL of H2B (5%/DMF) was added and finally made up to 6.0 cm3 with the
corresponding buffer solution.
Equal volume (6.0 cm3) of chloroform was added to each of the extraction
bottle. The phases were equilibrated for the appropriate time determined for each

80
80
metal, centrifuged and separated. The amount of metal ion left extracted and
unextracted in both the organic and aqueous phases were determined
spectrophotometrically after the perchloric acid decomposition.
3.6.2 Extraction from Acid Media
A volume , 0.6 cm3 of 10 µg/cm
3 solution of Co(II) or Ni(II) was pipetted
into different extraction bottles and the appropriate volume of the acid (H2SO4,
HCl, HNO3 or HClO4) was added such that on final dilution to 6.0 cm3 with
distilled water the concentration range 0.001-2.0 M is covered; 0.2 cm3 of H2B
(5%/DMF) was added and finally made up to 6.0 cm3 with distilled water.
Equal volume (6.0 cm3) of chloroform was added to each of the extraction
bottle. The phases were equilibrated for the appropriate time determined for each
metal, centrifuged and separated. The amount of metal ion left extracted and
unextracted in both the organic and aqueous phases were determined
spectrophotometrically after the perchloric acid decomposition.
3.6.3 Extraction in Salting Out Agents
A volume, 0.6 cm3 of 10 µg/cm
3 solution of Co(II) or Ni(II) was pipetted
into different extraction bottles. Appropriate volume of salting-out agent (Na2SO4,
NaCl, KNO3 or NaClO4) was added to cover the concentration range 0.001-1.0 M

81
81
in 6.0 cm3 of final solution. A specific volume of the corresponding acid (H2SO4,
HCl, HNO3 or HClO4) was added into the appropriate bottle to give a
concentration at which only partial extraction of the metal ion was obtained; 0.2
cm3 of H2B (5%/DMF) was added and finally made up to 6.0 cm
3 with distilled
water.
Equal volume (6.0 cm3) of chloroform was added to each of the extraction
bottle. The phases were equilibrated for the appropriate time determined for each
metal, centrifuged and separated. The amount of metal ion left extracted and
unextracted in both the organic and aqueous phases were determined
spectrophotometrically after the perchloric acid decomposition.
3.6.4 Extraction in Complexing Agents
A volume, 0.6 cm3 of 10 µg/cm
3 solution of Co(II) or Ni(II) was pipetted
into different extraction bottles. Appropriate volume of complexing agent (cyanide,
EDTA, fluoride, phthalate, tartrate or thiocyanate) solution was added to cover the
concentration range 0.001-1.0 M in 6 cm3 of final solution. A specific volume of
acid was added into each bottle such that allows for quantitative extraction of the
metal ion under study; 0.2 cm3 of H2B (5%/DMF) was added and finally made up
to 6.0 cm3 with distilled water.

82
82
Equal volume (6.0 cm3) of chloroform was added to each of the extraction
bottle. The phases were equilibrated for the appropriate time determined for each
metal, centrifuged and separated. The amount of metal ion left extracted and
unextracted in both the organic and aqueous phases were determined
spectrophotometrically after the perchloric acid decomposition.
3.7 Measurement of Distribution Ratio
After separation of the organic and the aqueous phases, the amount of the
metal ion unextracted in the aqueous phase was analysed spectrophotometrically
after perchloric acid decomposition discussed below. The amount of metal
extracted into the organic phase was also obtained spectrophotometrically.
The distribution ratio of the metal was calculated as the ratio of the
concentration of the metal ion in the organic phase to that in the aqueous phase.
3.8 Spectrophotometric Analysis of the Metal Ions
Cobalt(II) as the Thiocyanate Complex:66
To 3 cm3 of the metal solution 5 cm
3 of acetone was added (reducing the
polarity of water to prevent the dissociation of the complex), followed by 1 cm3 of
concentrated HCl; 1 cm3 of SCN
- solution to produce a blue complex. The
volumetric flask (10 cm3) was completed to the mark with distilled water. The
83
83
absorbance of the cobalt(II)thiocyanate complex was measured at 625 nm against a
reagent blank. The amount of cobalt was determined from the calibration curve.
Nickel(II) as the dimethylglyoxime complex:65
The nickel(II) extraction raffinate (10 cm3) was transferred to a beaker
containing 90 cm3 of water, 5.0 g of A. R. citric acid was added; followed by dilute
ammonia solution until the pH was 7.5. The solution was cooled and transferred to
a separatory funnel. 20 cm3 of dimethylglyoxime solution was added and allowed
to stand for 2 minutes, then 12 cm3 of chloroform. The mixture was shaken for 1
minute; the phases were allowed to settle out. The red chloroform layer was
separated and the absorbance determined at 366 nm against a reagent blank. The
amount of nickel was determined from the calibration curve.
3.9 Calibration Curve
Aliquots of the metal ion solutions were pipetted into separate extraction
bottles such that on final dilution to 10 cm3, the concentration range 0.1-10 µg/cm
3
was covered. The metal ion solution was treated as outlined above and the
absorbance measured at appropriate wavelength. The calibration curve was
constructed by plotting the absorbance against metal concentration. The

84
84
concentrations of each metal ion after extraction were read off from the straight
line graph using the absorbance obtained.
3.10 Separation Procedures
A mixture containing equal amount (10 µg) of Co(II) and Ni(II) in 0.01 M
HNO3, and containing 0.25 cm3 of 1.0 M cyanide was added. Nickel was extracted
with 0.2 cm3 H2B/DMF; the solution was made up to 6.0 cm
3 using distilled water.
Equal volume (6.0 cm3) of chloroform was added to each of the extraction
bottle. The phases were equilibrated for the appropriate time determined for
Nickel, centrifuged and separated. The extraction was repeated four more times
with fresh 0.2 cm3 of reagent solution and 6.0 cm
3 of chloroform. The aqueous and
the combined organic extract were analyzed spectrophotometrically for both metals
as given above.

85
85
CHAPTER FOUR
4.0 RESULTS AND DISCUSSIONS
4.1 Electronic Spectra
Figures 4.1, 4.2 and 4.3 shows the UV-Visible spectra of H2B, CoB and NiB
complexes respectively. The summary of the results are presented in Table 4.1.
The ligand shows maximum absorption at 346 nm with molar absorptivity of 2917
mol-1
cm-1
which is ascribed to intraligand π-π*
transitions similar to earlier
reported in literature79
.
The CoB complex shows strong absorption peaks of 339 nm (29498.53 cm-
1), 348 nm (28735.63 cm
-1), 370 nm (27027.03 cm
-1) and a weak band at 306 nm
(32679.74 cm-1
) with molar absorptivity of 4770 mol-1
cm-1
, 4201 mol-1
cm-1
, 4009
mol-1
cm-1
and 966 mol-1
cm-1
respectively. Co(II), a d7 in ground state has an
3F
term 25
2 gg et configuration80,81
. The bathochromic shift at 348 nm may be due to
intraligand π-π*
transitions. The peak at 346 nm with molar absorptivity of 2917
mol-1
cm-1
in the ligand shifted to 339 nm (29498.53 cm-1
) in the CoB complex.
This is probably due to ligation of N and O atoms to Co which limited the
availability of their electrons for transition. The NiB complex shows absorption
maxima of 333 nm (30030.03 cm-1
) with a peak at 346 nm (28901.73 cm-1
). Ni(II)

86
86
a d8 in ground state has an
4F term 26
2 gg et configuration the hypsochromic shift of
333 nm (30030.03 cm-1
) is probably due to charge transfer. The intensities in molar
absorptivities of both metal complexes of the ligand (NiB and CoB) shows
symmetry allowed charge transfer (CT) band absorption.82,83
There was no spin
forbidden, and Laporte-forbidden81
d-d transitions.
4.2 IR SPECTRA
Figures 4.4, 4.5 and 4.6 show the IR spectral analysis of the ligand H2B and its
cobalt(II) CoB and nickel(II) NiB complexes. The summary of the result is
tabulated in Table 4.2.
From the spectral result of the ligand, the observed absorbance at 3100-2800
cm-1
centered at 3000 cm-1
was assigned to carboxylic O–H vibration81,82
; the
characteristic absorbance was also seen in the spectrum of both CoB and NiB
complexes indicating that the carboxylic group did not participate in coordination
with the metal in each complexes. Furthermore, the C=O stretch observed at
1687.77 cm-1
, 1688.81 cm-1
and 1687.77 cm-1
, for H2B, CoB and NiB complexes
respectively83,84
confirms the absence of coordination or bond formation with the
carboxylic group. The broad aromatic phenolic O–H85
absorbance 3600 – 3400 cm-
1 centered at 3500 cm
-1 was only observed in the ligand, this broad absorbance

87
87
disappeared in both spectrum of CoB and NiB; these disappearances can be
attributed to the coordination or bond formation between the metal and ligand
through the oxygen group of the ligand. This is further confirmed by the shift of
wavelength of C–O stretch (phenolic) observed at 1289.46 cm-1
of the ligand to
1287.53 cm-1
and 1288.49 cm-1
for CoB and NiB complexes respectively81
. The
aromatic region shows assignment of 2922.25 cm-1
, 2923.22 cm-1
and 2915.50 cm-1
for H2B, CoB and NiB respectively due to vibrations of C–H deformation; 769.94
cm-1
, 759.98 cm-1
and 760.94 cm-1
for H2B, CoB and NiB respectively due to
vibrations of C–H out of plane deformation and 1449.55cm-1
, 1449.55 cm-1
and
1450.52 cm-1
for H2B, CoB and NiB respectively due to vibrations of CC
skeletal ring vibrations82,84
.
The C=N group was assigned 2922.25 cm-1
, 2923.22 cm-1
and 2915.50 cm-1
;
the little changes observed in shift on wavelength is characteristics of soft donation
of unpaired electron on the nitrogen atom to the metal in both complexes of CoB
and NiB.
The additional band observed in only the CoB (415.67 cm-1
; 497.65 cm-1
)
and NiB (471.61 cm-1
; 487.04 cm-1
) complexes were assigned to M–N and M – O
vibrations respectively as reported by El-Ajaily et al86
, and Prakash et al87
.
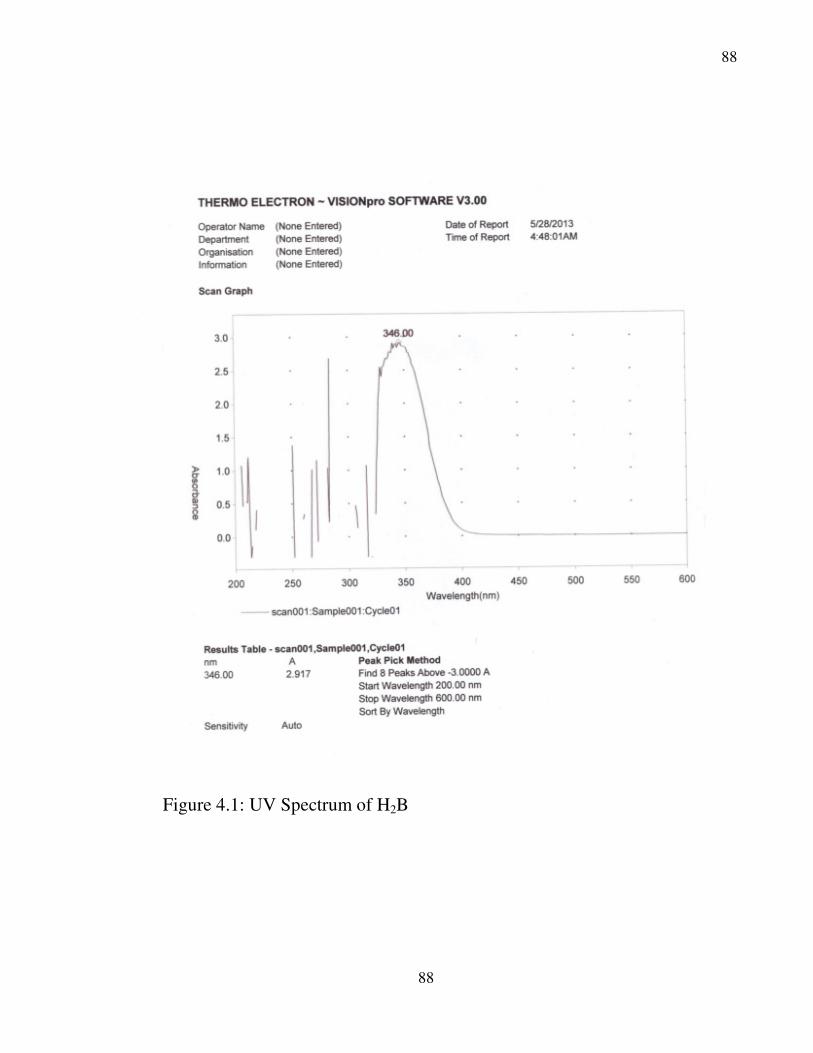
88
88
Figure 4.1: UV Spectrum of H2B

89
89
Figure 4.2: UV Spectrum of CoB

90
90
Figure 4.3: UV Spectrum of NiB

91
91
Table 4.1: Electronic Spectral data of H2B, CoB and NiB
Compound Absorbance Wavelength(nm) Wavelength(cm-1
) ε (Molar Absorptivity)
in mol-1
cm-1
Assignment
H2B 2.917 346 28901.73 2917 π-π*
CoB 4.770
4.201
4.009
0.966
339
348
370
306
29498.74
28735.63
27027.03
32679.74
4770
4201
4009
966
CT
π-π*
CT
CT
NiB 3.141
3.554
333
346
30030.03
28901.73
3141
3554
CT
π-π*

Figure 4.4: Infra-red Spectrum of H
92
red Spectrum of H2B
92

Figure 4.5: Infra-red Spectrum of CoB.
93
red Spectrum of CoB.
93

Figure 4.6: Infra-red Spectrum of NiB
94
red Spectrum of NiB
94

95
95
Table 4.2: Summary of Infrared Spectral Data of H2B, CoB and NiB.
H2B wavelength
(cm-1
)
CoB wavelength
(cm-1
)
NiB wavelength
(cm-1
)
Assignments
3100-2800
Centered at 3000b
3100-2800
Centered at 3000b
3100-2800
Centered at 3000b
v(OH) Carboxylic
1687.8s 1686.8s 1687.8s v(C=O) Carboxylic
3600-3400
Centered at 3500b
- - v(O–H) Phenolic
1289.5s 1287.5b 1288.5s v(C–O) Phenolic
1585.5s 1584.6b 1585.5b v(C=N)str Azomethine
2922.3s 2923.2w 2915.5w v(C–H)def. Aromatic
760.9s 760.0s 761.0b v(C–H)def. Aromatic out
of plane
1449.6s 1449.6b 1450.5b v(C=C)
skeletal ring vibration
- 415.7s 471.6w v(M–N) metal bonded to
nitrogen
- 497.7w 487.0w v(M–O) metal bonded to
oxygen
Legend:
b = broad,
s = strong
w = weak

96
96
4.3 1H NMR Spectra
Figures 4.7, 4.8, and 4.9 show the 1H nuclear magnetic resonance (NMR)
spectrum for the compound 3,5-[(2-hydroxyl-benzylidene)-amino]-benzoic acid
and its cobalt(II) and nickel(II) complexes in dimethyl sulfoxide (DMSO-
D6,400MHz); and the summary of the shift assignments (δ ppm) are represented in
Table 4.3
The singlet signals (δ ppm) at 10.09, 10.11 and 10.14 are assigned to the
carboxylic protons Ha (COOH)88
in ring A Fig. 4.10 (i) for ligand, its cobalt(II)
and nickel(II) complexes respectiviely; which is in contrast to the 7.7 ppm reported
by Chizoba et al89
. The singlet peaks at 8.78 ppm, 8.81 ppm and 8.84 ppm are
assigned to the 2 symmetrical azomethine protons Hd (HC=N) in the ligand H2B,
CoB and NiB respectively. The four multiplets appearing in the spectrum for the
ligand H2B {δ ppm: 7.61-7.55, (3Jo=8 Hz,
4Jo=4 &5 Hz, 2H); 7.48-7.45, (
3Jo=7
Hz, 5Jo=2 Hz, 2H); 7.39-7.33, (
3Jo=8 Hz, 2H) and 6.94-6.90, (
3Jo=8 Hz,
4Jo=4 Hz,
5Jo=2 Hz, 2H)}; CoB complex {δ ppm: 7.63-7.58, (
3Jo=7 & 8 Hz, 2H); 7.51-7.47,
(3Jo=7 & 8 Hz, 2H); 7.40-7.36, (
3Jo=7 & 8 Hz, 2H) and 6.96-6.90, (
3Jo=8 &10 Hz,
2H)} and NiB complex {δ ppm: 7.66-7.60, (3Jo=7 & 8 Hz, 2H); 7.54-7.50, (
3Jo=6
&8 Hz, 2H); 7.45-7.34, (3Jo=8 &9 Hz, 2H) and 6.99-6.93, (
3Jo=8 & 10 Hz, 2H)}
are due to the unsymmetric di-substituted aromatic ring (AA’BB
’system)
90 protons
He-h of the symmetric ring B Fig. 4.10 (i). The doublets centered at δ ppm: 7.06,

97
97
(J=26 Hz, 2H); δ ppm: 7.07, (J=19 Hz, 2H) and δ ppm: 7.10, (J=24 Hz, 2H) were
assigned to the chemically equivalent protons Ha on the aromatic ring A Fig. 4.10
(i). Holbach et al91
also reported similar J-values. The singlet peak at 7.70 ppm
appearing in only the ligand’s spectrum can be assigned to the 2 symmetrical
aromatic/phenolic OH88
Hi in ring B Fig. 4.10 (i). John et al92
reported values up to
14.70 ppm. The singlet peaks at 6.76 ppm, 6.75 ppm and 6.79 ppm in the spectrum
of the ligand H2B, its complexes CoB and NiB respectively; integrated for 1H each
are assigned to Hc proton para to the carboxylic group in ring A Fig. 4.10 (i).
It can be deduced from the proton magnetic resonance spectrum that the
ligand is symmetrical with HC=N and Ar-OH functional groups appearing on both
sides; the ligand has 16 protons while the two complexes CoB and NiB has 14
protons each; due to the absence of the symmetrical Ar-OH groups Hi Fig. 4.10 (ii)
signal in both spectrum. Hence, no coordination through the carboxylic group.
4.4 13
C NMR Spectra
Figure 4.11, 4.12 and 4.13 shows the 13
C nuclear magnetic resonance of the
ligand H2B, its cobalt(II), CoB, and nickel(II), NiB, complexes respectively in
DMSO-D6 (400MHz). The summary of the results are represented in Table 4.4.

98
98
Figure 4.7: 1H NMR spectrum of H2B in DMSO-D6 (400MHz)

99
99
Figure 4.8: 1H NMR spectrum of CoB in DMSO-D6 (400MHz)

100
100
Figure 4.9: 1H NMR spectrum of NiB in DMSO-D6 (400MHz)

101
101
Table 4.3: Summary of Proton Resonance Data for H2B, CoB and NiB in DMSO-D6 (400MHz).
Assignment Ligand (in ppm) CoB (in ppm) NiB (in ppm)
COOH 10.09 (1H, S) 10.11 (1H, S) 10.14 (1H, S)
Sym. HC=N 8.78 (2H, S) 8.81 (2H, S) 8.84 (2H, S)
Sym Ar-OH 7.70 (2H, S) - -
Sym Ar-H
Salicyldehyde moiety
7.61-7.55 (2H, M); 7.48-7.45 (2H,
M); 7.39-7.33 (2H, M) and 6.94-
6.90 (2H ,M)
7.63-7.58 (2H, M); 7.51-7.47 (2H,
M); 7.40-7.34 (2H, M) and 6.96-
6.90 (2H ,M)
7.66-7.60 (2H, M); 7.54-7.50
(2H, M); 7.45-7.39 (2H, M)
and 6.99-6.93 (2H ,M)
Ar-H
Of the COOH moiety
7.06, (J=26 Hz, 2H) 7.07, (J=19 Hz, 2H) 7.10, (J=24 Hz, 2H)
Ar-H
Of the COOH moiety
6.76 (1H, S) 6.76 (1H, S) 6.76 (1H, S)

102
102
A
B
c
N N CC
OH HO
HO O
A
B
MN N CHdHC
O O
aHO O
H Hb
He
hH
Hg
Hf
H
HH
H
A
B
c
N N CHdHC
OH iHO
aHO O
H Hb
He
hH
Hg
Hf
H
HH
H(i)
(ii)
(iii)
1
2
3
45
6
7
8
9
1011
12
M = Co or Ni
Figure 4.10: 1H and
13C nmr assignment for H2B, CoB and NiB complexes.
B
B
B
e
f
g
h
d
i
g
12
f
e
d
h
b
b
11
10
9
8
7
6

103
103
The signals (δ) at 193.74 ppm, 193.73 ppm and 193.73 ppm for H2B, CoB
and NiB spectrum respectively are due to the vibration of carbon in the C1 (COOH)
of carboxylic acid group. The vibrations (δ): at 133.97 ppm, 134.00 ppm and
133.96 ppm for H2B, CoB and NiB spectrum respectively were assigned for the
quaternary carbon C2 (C-COOH) attached to ring A Fig. 4.10 (iii). The signals at
122.27 ppm(2C), 119.38 ppm; 122.30 ppm(2C), 119.41 ppm and 122.30 ppm(2C),
114.40 ppm for H2B, CoB and NiB spectrum respectively were assigned to the
vibration C3 (C-H) aromatic of ring A Fig. 4.10 (iii); Obasi et al93
reported similar
signals for phenyl carbons. The vibrations at (δ) 160.60 ppm (2C), 160.61 ppm
(2C) and 160.61 ppm (2C) for H2B, CoB and NiB spectrum respectively were
assigned to the symmetric vibration C4 (C-N) aromatic of ring A Fig. 4.10 (iii).
The signals (δ in ppm) at 163.69(2C), 163.63(2C) and 163.67(2C) for H2B, CoB
and NiB spectrum respectively were assigned to the vibration of the symmetric C4
(HC=N) azomethine carbon94
Fig. 4.10 (iii). The vibrations (δ in ppm) at
117.51(2C), 117.54(2C) and 117.53(2C) were assigned to the symmetric
quaternary carbon C7 (C-CHN) aromatic of ring B Fig. 4.10 (iii) for the ligand
H2B, its complexes CoB and NiB respectively. The symmetric C9,10,11 (C-H)
aromatic vibrations of ring B Fig. 4.10 (iii) were observed at (δ in ppm):
133.00(2C), 130.80(2C), 120.23(2C) & 117.00(2C); 133.02(2C), 130.78(2C),

104
104
120.24(2C) & 117.01(2C) for the ligand H2B, its complexes CoB and NiB
respectively. The vibrations (δ in ppm) at 160.87(2C), 160.87(2C) and 160.88(2C)
were assigned to the symmetric C12 (C-OH) aromatic of ring B Fig. 4.10 (iii).
From the 13
C NMR spectrum, the ligand is symmetrical with a total of 21
carbon in 12 chemical environments; thus, the donor atoms are also symmetrical in
each of the complexes giving favourable condition for planar geometries.
4.5 Metal–Ligand Mole Ratio
Figure 4.14 shows the results obtained by using Job’s continuous variation
in investigating Co(II)-ligand mole ratio.
The Co(II) to H2B mole ratio obtained is 1:1. Figure 4.15 shows the mole
ratio of Ni(II) to H2B of Job’s plot, which is also a 1:1 metal-ligand mole ratio.
Lokhande et al95
also reported a 1:1 metal-ligand ratio in Ni(II) complex of Bis[3-
hydroxyimine-5-methyl-N-methyl]-2-imine.
4.6 Molecular Formula of the Ligand and the Complexes
The results of infrared (FTIR) data, nuclear magnetic resonance (1H &
13C NMR)
spectrum and UV-Visible spectrum indicate the structure of the ligand to be as in
Figure 4.16. The results of stoichiometric analysis based on Job’s continuous

105
105
Figure 4.11: 13
C NMR Spectrum of H2B in DMSO-D6 (400MHz)

106
106
Figure 4.12: 13
C NMR Spectrum of CoB in DMSO-D6 (400MHz)

107
107
Figure 4.13: 13
C NMR Spectrum of NiB in DMSO-D6 (400MHz)

108
108
Table 4.4: Summary of 13C Data for H2B, CoB and NiB in DMSO-D6 (400MHz)
Assignment H2B(δ in ppm) CoB(δ in ppm) NiB(δ in ppm)
v (COOH) Carboxylic acid
carbon
193.74 193.73 193.73
v (C-COOH) of aromatic 133.97 134.00 133.96
v (sym. C-N) of aromatic 160.60(2C) 160.61(2C) 160.61(2C)
v (C-H) aromatic of COOH
moiety
122.27 (2C), 119.38 122.30 (2C), 119.41 122.30 (2C), 119.40
v (sym. HC=N) azomethine
carbon
163.69(2C) 163.63(2C) 163.67(2C)
v (sym. C-CHN) of aromatic 117.51(2C) 117.54(2C) 117.53(2C)
v (sym. C-H) aromatic of
salicylaldehyde moiety.
133.00(2C), 130.80(2C),
120.23(2C), 117.00(2C)
133.02(2C), 130.78(2C),
120.27(2C), 117.03(2C)
133.01(2C), 130.78(2C),
120.24(2C), 117.01(2C)
v (sym. C-OH) aromatic of
salicylaldehyde moeity
160.87(2C) 160.87(2C) 160.88(2C)

109
109
variation method further assisted in proposing a geometry for the ligand’s Co(II)
and Ni(II) complexes. The infra-red spectra indicated that the two metal ions,
Co(II) and Ni(II), were coordinated to the azomethine nitrogen atoms and the
oxygen of the deprotonated hydroxyl group. From the proton magnetic resonance
spectra, it was deduced that the ligand has a total of 16 protons and is symmetrical
with some functional groups, HC=N and Ar-OH, appearing in both sides. The 13
C
NMR spectra confirmed that the ligand is symmetrical as reported earlier in
literature89
. Consequently, the proposed structure of the ligand and its Co(II) and
Ni(II) complexes are shown in Figure 4.16.
4.7 Solubility Data
Table 4.5 shows the solubility data for the ligand and its complexes. Both
ligand, CoB and NiB complexes were insoluble in water; this may indicate that, the
hydrophobic component of both the ligand and the complexes are large. Since the
cobalt(II) and nickel(II) complexes were insoluble in water but sparingly soluble in
chloroform and very soluble in dimethyl formamide (DMF); consequently,
chloroform was selected as solvent for the solvent extraction studies of the two
metals.

110
110
Table 4.5: Solubility data for the ligand, its CoB and NiB complexes.
Solvents H2B CoB NiB
Water I I I
Ethanol S S S
Methanol S S S
Chloroform SS SS SS
CCl4 I I I
N-Hexane SS SS SS
di-ethylether I I I
Toluene SS SS SS
Acetone VS VS VS
DMF VS VS VS
DMSO VS VS VS
Legend: I=Insoluble; S=Soluble; SS=Sparingly Soluble; VS=Very Soluble.

111
111
4.8 Dissociation and Protonation Constants of the Ligand
The ligand, 3,5-Bis-[2-hydroxy-benzylidene)-amino]-benzoic acid (0.01 M)
in DMF gave a pH of 9.56. Applying potentiometric titration method95
by titrating
the solution of the ligand with 0.01M HCl, a protonation constant of pKb 4.14 was
obtained as shown in Figure 4.17. This is similar to the pKb 4.2 value earlier
reported in literature89
and show a simultaneous protonation of the two azomethine
nitrogen atoms;
H2B + 2H+ H4B
2+ ………Kb …(76)
The determination of the acid dissociation constant, pKa, using
potentiometric titration method by titrating with 0.01M NaOH gave 10.12 as
shown in Figure 4.18. Similar values of pKa was reported in literature89
. This
means that in a basic medium, there is simultaneous loss of two protons of the
hydroxyl groups.
H2B B2-
+ 2H+ ……….. Ka
……(77)

112
112
Figure 4.14: Job’s plot for Co(II)/H2B mole ratio.
Figure 4.15: Job’s plot for Ni(II)/H2B mole ratio.
0
0.1
0.2
0.3
0.4
0.5
0.6
0.7
0.8
0.9
0 2 4 6 8 10
Ab
sorb
an
ce
Mole ratio
0
0.05
0.1
0.15
0.2
0.25
0.3
0 2 4 6 8 10
Ab
sorb
an
ce
Mole ratio
1/9 2/8 3/7 4/6 5/5 6/4 7/3 8/2 9/1
1/9 2/8 3/7 4/6 5/5 6/4 7/3 8/2 9/1

113
113
N N CHHC
OH HO
HO O
3,5-Bis[2-Hydroxy-Benzylidene)-Amino]-Benzoic acid {H2B}
3,5-Bis[2-Hydroxy-Benzylidene)-Amino]-Benzoicacidcobalt(II) {CoB}
3,5-Bis[2-Hydroxy-Benzylidene)-Amino]-Benzoicacidnickel(II) {NiB}
CoN N CHHC
O O
HO O
Ni
N N CHHC
O O
HO O
Figure 4.16: Structures of Ligand, its Co(II) and Ni(II) Complexes
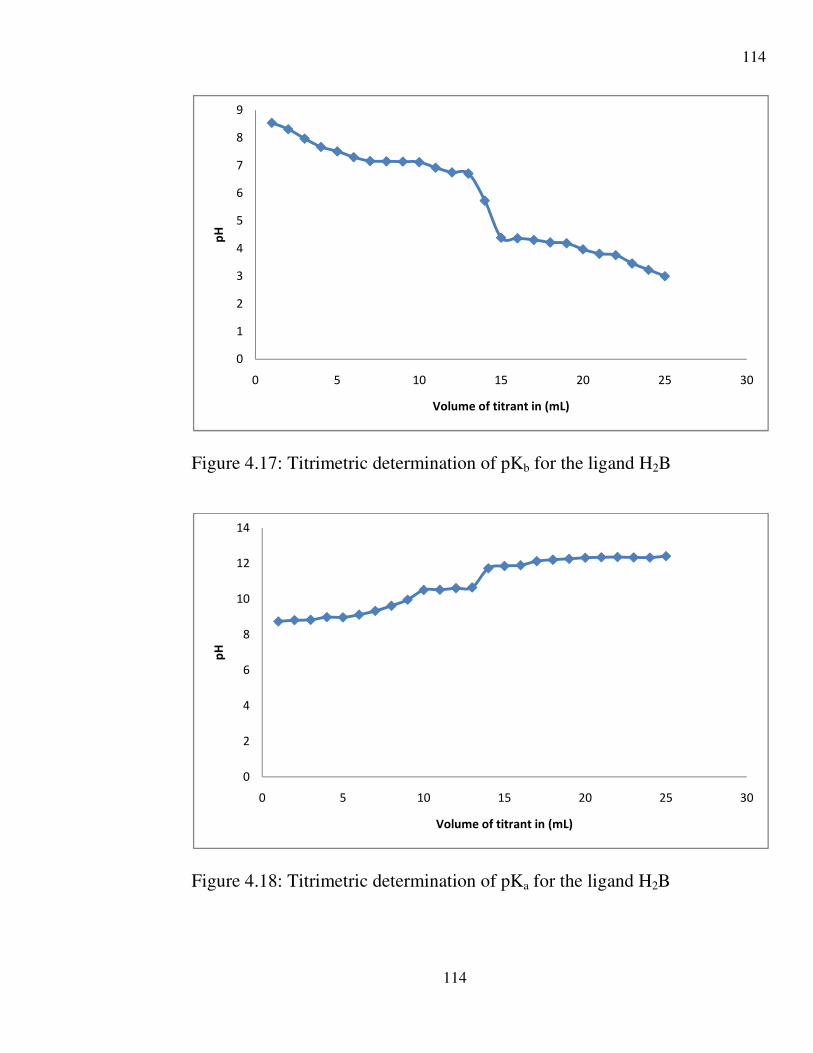
114
114
Figure 4.17: Titrimetric determination of pKb for the ligand H2B
Figure 4.18: Titrimetric determination of pKa for the ligand H2B
0
1
2
3
4
5
6
7
8
9
0 5 10 15 20 25 30
pH
Volume of titrant in (mL)
0
2
4
6
8
10
12
14
0 5 10 15 20 25 30
pH
Volume of titrant in (mL)

115
115
4.9 Equilibration Time
The equilibration time for the extraction of Co(II) and Ni(II) was carried
out with 5% H2B/DMF in chloroform. The amounts extracted at various time
intervals are tabulated in Table 4.6 and 4.7.
For the extraction of Co(II) and Ni(II) an equilibration time of 15 min.
was established. This time was employed in subsequent extraction of the metal
ions.
4.10 Effect of pH Buffer on Extraction of Co(II) and Ni(II)
The extraction of Co(II) with 5% H2B/DMF was studied as a function of
pH in the pH range 1-13 as shown in Figure 4.19. As the pH decreased from 5
to 1, the percentage extraction also decreased. This may be due to the
competition between H+ and Co2+ for the azomethine ligation sites, which is
unfavourable for the formation of the complex. In addition, it may be due to the
masking effect of the acid component of the buffer. At pH 6, up to 94.50%
extraction was obtained which is in line with extraction at pH 6.2 reported by
Al-Mulla and Al-Janabi96 in the extraction of Co(II) from aqueous solution
using N, N’-carbonyl difatty amides. This may be due to the formation of a

116
116
neutral chelate complex completely extractable into the organic phase. As given
in equation (77), dissociation of the ligand at high pH enhanced the formation of
the chelate with the metal ions. As the pH increased to 13, the percentage
extraction decreased. This is probably due to hydrolysis of the metal ion thereby
decreasing the amount available for complexation and extraction. The masking
effect of the base component of the buffer may contribute to the decrease.
The extraction behaviour of Ni(II) with 5% H2B/DMF was examined by
varying the pH from 1-13 as shown in Figure 4.20. At the pH range 1-6, the
percentage extraction decreased with increase in hydrogen ion concentration.
Also, the reason may be because of high competition between the proton and
Ni(II) for the azomethine ligation sites. The extraction of Ni(II) followed the
same pattern as that of Co(II). At pH 8 up to 97.88% was extracted. As the pH
increased to 13, the percentage extraction decreased appreciably. This may be
because of hydrolysis of Ni(II) at higher pH, thus decreasing the amount
available for bonding.
The extractive behavior of Ni(II) and Co(II) are similar, although
quantitative extraction of Co(II) was seen tending towards lower pH than Ni(II);
hence its application in major separation of the two metal ions in solution97,98.

117
117
Table 4.6: The amount of Co(II) extracted into the organic phase at various time
intervals
(Initial Concentration=10 µg/cm3.)
Time (min) Co(II) in organic phase
(µg/cm3)
Co(II) in aqueous phase
(µg/cm3)
5 4.88 5.00
10 4.33 5.55
15 5.22 4.55
20 5.11 4.88
25 5.11 4.77
30 4.88 4.77
35 4.66 5.11
40 3.88 6.00
45 3.33 6.66
50 3.11 6.55
55 2.77 7.11
60 2.22 7.66

118
118
Table 4.7: The amount of Ni (II) extracted into the organic phase at various time
intervals
(Initial Concentration=10 µg/cm3.)
Time (min) Ni(II) in organic phase
(µg/cm3)
Ni(II) in aqueous phase
(µg/cm3)
5 5.00 4.77
10 5.33 4.44
15 5.88 3.77
20 5.88 3.66
25 4.77 5.22
30 4.55 5.22
35 4.00 4.77
40 3.88 6.00
45 3.55 6.33
50 3.11 6.77
55 3.33 6.44
60 3.33 6.55

119
119
Figure 4.19: Profile for Co(II) extraction in buffer media.
Figure 4.20: Profile for Ni(II) extraction in buffer media.
0
10
20
30
40
50
60
70
80
90
100
0 2 4 6 8 10 12 14
%E
pH
0
20
40
60
80
100
120
0 2 4 6 8 10 12 14
%E
pH

120
120
4.11 Effect of Acidity
The extraction of Co(II) with 5% H2B /DMF was studied as a function of
different mineral acids (HCl, H2SO4, HNO3 and HClO4) within acid concentration
range 10-3
– 2.0 M.
A plot of percentage extraction against different acids
concentrations is shown in Figure 4.21. As the acidity decreased from 10-1
to 10-3
M, the percentage extraction increased. This may be due to the formation of
extractable complexes of cobalt at low [H+]. From equation (77), at high pH
deprotonation of the ligand was favoured to form B2-
, thus enhancing the formation
of the complex. As the acid concentration increased to 2 M the percentage of
Co(II) extracted decreased which may be due to the competition for the
azomethine ligation sites between the protons and the cobalt ions.
The extraction of Ni(II) with 5% H2B/DMF was studied as a function of
different acids (HCl, HNO3, H2SO4 and HClO4) concentrations (10-3
-2.0 M). As
illustrated in Figure 4.22, the extraction pattern of Ni(II) is almost the same as that
of Co(II).
The extraction of both metal ions in HNO3 and HClO4 were higher than the
H2SO4 and HCl, with maximum extraction in the HNO3 media for both metal ions.
Up to 88.51% and 95.39% Co(II) and Ni(II) were extracted respectively in aqueous
HNO3 medium.

121
121
Figure 4.21: Profile for extraction of Co(II) in various acid media.
Figure 4.22: Profile for extraction of Ni(II) in various acid med
0
10
20
30
40
50
60
70
80
90
100
0 1 2 3 4 5 6
%E
Acid concentration (M)
HCl
H2SO4
HNO3
HClO4
0
20
40
60
80
100
120
0 1 2 3 4 5 6
%E
Acid concentration (M)
HCl
H2SO4
HNO3
HClO4
10-3
10-2
10-1
1 2
10-3
10-2
10-1
1 2

122
122
4.12 Effect of Salting-Out Agent on Extraction
The extraction of Co(II) with 5% H2B in DMF was studied at varying
concentrations, 10-3
– 1.0 M of salting out agents (NaCl, Na2SO4, NaClO4 and
KNO3) at a constant acid concentration in which partial extraction of the metal ion
was achieved and the results are shown in Figure 4.23. Extraction of Co(II) in 1.0
M HCl gave only 24.98%, but addition of small amount (0.001M) of NaCl
enhanced the percentage extraction up to 86%. This may be attributed to increase
in dielectric constant of the aqueous media that made the complex less ionic, hence
more soluble in the organic phase than in the aqueous phase6. As the concentration
of NaCl increased from 10-2
–1.0 M, the amount extracted decreased appreciably,
owing to the formation of the tetrachloro anionic complex, [CoCl4]2-
. At 0.1 M
H2SO4, the percentage extraction was enhanced from 40.21% to 87.51% by
addition of 0.001 M Na2SO4. The amount extracted decreased with increase in
concentration of Na2SO4. At 1.0 M HClO4, the presence of small quantity of
NaClO4 (0.001 M) increased the percentage extraction from 65.53% to 98.89%.
Also the reason may be due to increased dielectric constant of the aqueous phase
which made the complex less ionic.
The salting out effect of KNO3 is almost the same as that of NaClO4.
Extraction of Ni(II) with 5% H2B/DMF was studied at different concentrations
of salting out agents (NaCl, Na2SO4, NaClO4 and KNO3) and at a constant

123
123
concentration of the acid at which non-quantitative extraction of the metal was
achieved. The results are shown in Figure 4.24. The extraction of Ni(II) in 0.1 M HCl
was enhanced from 43% to 66.01%, however, increase in concentration shows
decrease in extraction which may be attributed to the formation of NiCl42- which
hinders the ligation of the metal. Extraction was enhanced from 43% to 51% in 0.001
M H2SO4 with Na2SO4 concentration of 0.001 M. The amount of Ni(II) extracted did
not show appreciable increase which implies that H2SO4 does not have much effect on
Ni(II)4. At 1.0 M HClO4, extraction of Ni(II) was enhanced from 52.30% to 98.86%
0.005 M NaClO4. Also, this may be due to increase in dielectric constant of the
aqueous phase as the concentration of the salting out agent increases. At a
concentration of 1.0 M HNO3, the salting out effect of KNO3 was observed at a
concentration range of 0.001 – 1.0 M. The amount of Ni(II) extracted increased with
decrease in concentration of the salting out agent. Addition of 0.005 M KNO3
enhanced the extraction up to 97.72%. The reasons for this behaviour may be same as
the ones adduced above.
It was observed that KNO3 and NaClO4 are excellent salting-out agents for
the extraction of both cobalt(II) and nickel(II) complexes of H2B. This may be that
the KNO3 and NaClO4 increases the dielectric constant of the aqueous phase more
readily making the metal ions passive and hence more stable in the organic phase.
Similar effect was reported by Ezugwu et al89
for the extraction of Hg(II) and
Ag(I) using H2B.

124
124
Figure 4.23: %E Vs Concentration of salting-out agent for Co(II)
extraction with H2B/DMF
Figure 4.24: %E Vs Concentration of salting-out agent for Ni(II)
extraction with H2B/DMF
0
20
40
60
80
100
120
0 1 2 3 4 5 6
%E
Concentration of salting-out agent (M)
NaCl/HCl(1.0M)
Na2SO4/H2SO4(0.1M)
NaNO3/HNO3(0.1M)
NaClO4/HClO3(1.0M)
0
20
40
60
80
100
120
0 1 2 3 4 5 6
%E
Concentration of salting-out agent (M)
NaCl/HCl(1.0M)
Na2SO4/H2SO4(0.1M)
NaNO3/HNO3(0.1M)
NaClO4/HClO3(1.0M)

125
125
4.13 Effect of Complexing Agents on Extraction
Figure 4.25 shows the effect of complexing agents in the concentration
range 0.001 – 1.0 M on the extraction of Co(II) from 0.001 M HNO3, which was
the acid concentration at which there was maximum extraction of the metal ion.
The masking effect of EDTA was studied between the concentration range
0.001 – 0.4 M. Cobalt (II) ion was masked 91 – 96% by EDTA in 0.05 to 0.4 M.
At 0.1 to 1.0 M cyanide ion concentration, up to 99% of Co(II) was masked.
Thiocyanate had a maximum masking action (86.64%) at 1.0 M. The masking
effect of phthalate ion was studied between concentration range 0.001 – 0.3 M.
Masking effect was not appreciable, only 21 – 28% Co(II) was masked between
the concentrations 0.1 – 0.3 M. At lower concentration of phthalate ion, the
effect was much less. Up to 70.50% Co(II) was masked at 1.0 M tartrate ion but
the interference was not appreciable in lower concentrations, about 35.21%
Co(II) was masked at 0.001 M. The effect of fluoride ion as a masking agent on
cobalt(II) was also not appreciable. At concentrations 0.001 – 1.0 M only 11.36
– 21.12% Co(II) respectively were masked. This could be that tartrate, phthalate
and fluoride complexes of Co(II) and Ni(II) complexes are not very stable.
The effect of complexing agents on the extraction of Ni(II) from 0.001 M
HNO3 at the concentration range 0.001 – 1.0 M is shown in Figure 4.26. It was

126
126
observed that EDTA and cyanide ions greatly influenced the extraction of
Ni(II). EDTA had the highest interference since up to 80.51% Ni(II) was
masked at 0.1 – 0.4 M. Cyanide at a concentration range 0.1 – 1.0 M masked up
to 77.28% Ni(II). At higher concentration (1.0 M) of thiocyanate ion, up to
70.49% of Ni (II) was masked but as the concentration decreased to 0.001 M,
the interference reduced to 22.35%. Phthalate masked Ni(II) between 24.12 –
14.74% at 0.001 – 1.0 M. The effect did not follow increase or decrease in
concentration. But low masking was observed in 0.001 M and 1.0 M of 19.48
and 14.74% respectively. At lower tartrate ion concentration (0.001 M) up to
34.47% Ni(II) was masked. The interference increased as the concentration
increased; up to 68.17% Ni(II) was masked.
The high masking of Co(II) in the presence of EDTA and cyanide ions
may be due to the formation of very stable non-extractable Co(II) complexes of
EDTA and cyanide as Co-EDTA and [Co(CN)6]4- respectively99. Partial
interference of tartrate, phthalate and flouride ions on both Co(II) and Ni(II)
could be that their complexes are not very stable. Copious comparisons are due
for the reports of Ezugwu et al89 and Ukoha et al
6

127
127
Figure 4.25: Effect of complexing agent on the extraction of Co(II) with
H2B/DMF
Figure 4.26: Effect of complexing agent on the extraction of Ni(II) with
H2B/DMF
-10
0
10
20
30
40
50
60
70
80
90
100
0 1 2 3 4 5 6
%E
Concentration of complexing agents (M)
Cyanide
EDTA
Flouride
Phthalate
Tartrate
Thiocyanate
0
10
20
30
40
50
60
70
80
90
0 1 2 3 4 5 6
%E
Concentration of complexing agents (M)
Cyanide
EDTA
Flouride
Phthalate
Tartrate
Thiocyanate

128
128
4.14 Degree of Metal Separation
Table 4.8 illustrates the results obtained from the analysis of mixtures of
Co(II) and Ni(II) extracted from 0.001 M HNO3 using 5% H2B/DMF. At this acid
concentration up to 95.39% Ni(II) was quantitatively extracted but the presence of
0.01 M cyanide masked 47.10% of Ni(II).
The separation is based on the fact that at 0.01 M cyanide up to 98.90%
Co(II) was masked while about 33.33% Ni(II) was extracted. Owing to the fact that
Ni(II) is partially masked, a four-cycle extraction process6 was employed for the
separation of the two metals. After extraction very small amount of Ni(II) was
remaining in the aqueous phase but about 99.16% Co(II) was extracted. Although
the procedure is laborious, however, it is clean and efficient; and a five-cycle
extraction will completely separate nickel(II) from cobalt(II).
4.15 Summary and Conclusion
Spectroscopic characterization via electronic, 1H NMR,
13C NMR and IR of
the synthesized ligand, 3,5-Bis[(2-hydroxy-benzylidene)-amino]-benzoic acid
(H2B), its cobalt(II) and nickel(II) complexes were successfully characterized
showing the coordination of the complexes through azomethine and deprotonated
hydroxyl group of the ligand. The Job’s plots shows metal to ligand mole ratio of
1:1 for both metals to H2B.

129
129
Table 4.8: Degree of separation of Ni(II) from Co(II)
Element
Amount taken
(µg)
Amount found (µg)in
organic phase
Amount found
(µg)in aqueous
phase
10 0 9.66
Co(II) 10 0 9.88
10 0 9.88
10 0 9.66
10 9.66 0.11
Ni(II) 10 9.44 0.22
10 9.77 0
10 9.66 0.11
Standard Deviation = 0.12

130
130
Cobalt(II) was quantitatively extracted as [CoB] chelate in 5% DMF using
CHCl3 in the pH range 5 – 7, as well as in 10-3
– 10-1
M HCl, HNO3, HClO4 and
H2SO4. The presence of cyanide and EDTA masked Co(II). Nickel(II) was
quantitatively extracted as [NiB] chelate in 5% DMF using CHCl3 in the pH range
6 – 8, as well as in 10-3
– 10-1
M HCl, HNO3, HClO4 and H2SO4. KNO3 and
NaClO4 proved to be a good salting out agents for the extraction of both Co(II) and
Ni(II).
Conclusively, 3,5-Bis[(2-hydroxy-benzylidene)-amino]-benzoic acid (H2B)
proved to be a good extractant for Co(II) and Ni(II) in aqueous solution. Nickel(II)
has been successfully separated from cobalt(II) by four-cycle extraction at 10-3
M
HNO3 aqueous mixture of Ni(II) and Co(II) in 5%H2B/DMF using 0.05 M cyanide
as masking agent and CHCl3 as organic solvent.
4.16 Recommendation
Further work is required to fully characterize the extracted species.
Preparation of the complexes in various reaction media (low acidity, high acidity,
low pH, and high pH) is required. Characterization which includes elemental
analysis and mass spectroscopy will also be necessary.
To prove on the extractability of the metals, new solvents or solvent
mixtures will be required.

131
131
4.17 Contributions to Knowledge
The project synthesis, characterization and solvent extraction studies of 3,5-
Bis[(2-hydroxy-benzilidene)-amino]-benzoic acid and its Co(II) and Ni(II)
complexes were successfully synthesized. Characterization of the ligand and
complexes based on IR, NMR showed that the ligand is tetradentate and
coordinates through ONNO atoms. The complexes characterized are neutral square
planar compounds.

132
132
References
1. Harris D. C. (2010).Quantitative Chemical analysis (8th Ed.) W.H. Freeman
and Company New York, pp.538-542.
2. Fifield F. W. and Kealey D. (1975). Principles and Practices of Analytical
Chemistry. International Textbook Company, Ltd. London, pp67.
3. Rydberg J., Choppin G. R., Emusikas C. and Sekine T. (2004). Solvent
Extraction Equilibria. Taylor & Francis Group, LLC USA, pp.93.
4. Kolthoff I.M. A Review of Electrochemistry in non-aqueous Solvents by:
School of Chemistry. University of Minnesota, Minneapolis,
Minnesota 55455 USA, pp.305-325.
5. Regel-Rosocka M. and Alguacil F.J. (2013). Recent Trends in Metals
Extraction. Revista de Metalurgia 49(4): 292-316
6. Ukoha, P.O. Nwabue, F. I. and Obasi, L. N. (2011). Solvent Extraction Studies
on copper(II) and silver(I) complexes of bis (4-hydroxypent-2-
ylidene) diaminoethene: Composition of Extracted Species. E-
Journal of Chemistry. 8(4): 1864-1871
7. Ukoha, P.O., Obasi L.N. and Nwabue F.I. (2012). Solvent Extraction Studies
on Copper(II) and Silver(I) complexes of Bis(4-hydroxypent-2-
ylidene) Diaminethane: Separation of Ag(I) from Cu(II).
Internation J. Chem. 22(1): 15-24.
8. Ukoha, P.O. (1988). Solvent extraction studies on Cu (II) and Ag (I) complexes
of bis (4-hydroxypent-2-ylidene) diaminoethene. M.Sc. Thesis,
University of Nigeria, Nsukka, p. 5.
9. Gibbs, J. W. (1961). Scientific Papers. Dover, New York. p. 17
10. Stary, J. (1964). The solvent extraction of metal chelates. Pergamon, Oxford,
p. 1.
11. Fifield, F. W., and Kealey, D. (1990). Principles and practice of analytical
chemistry. (3rd ed.). Blackie Academic and Professional, London,
p. 53).

133
133
12. Vogel, I. (1961). A textbook of quantitative inorganic analysis including
elementary analysis (3rd ed.), Longman, Green and Co., Ltd.,
London, pp.807.
13. Rydberg, J. (1992). Solvent Extraction Equilibria. Marcel Dekker, Inc., New
York, p. 110.
14. Holzbecher, Z. (1976). Handbook of organic reagents in inorganic analysis.
Ellis Horwood Limited, London, p. 163.
15. Atkins, P., and de Paula, J. (1978). Physical chemistry. (7th ed.), Oxford
University Press, London, pp.857
16. McNaught, A.D., and Wilkinson, A. (1997). IUPAC, Compendium of
chemical terminology (2nd ed.), Blackwell Scientific Publications,
Oxford, pp.978.
17. Freiser, H. (1964). Separations Processes in Analytical Chemistry. Am. Chem.
Soc.11(1): 76-81
18. Murrel, L.L. (1956). The Separation Factor. Anal. Chem. 28 (1):138.
19. Maitani, T. (1979). Isotropic PMR shift in pyridine base adducts of Mn (II),
Fe (II), and Ni (II) complexes of TTA and STTA. J. Inorg. Nucl.
Chem. 41: 1697-1702.
20. Joshi, K., and Pathak, V.N. (1973). Synthesis of some new piperidinum
tetrakis rare earth 1,3-diketonates and their fluorescence and
infrared spectral studies. J. Inorg. Nucl. Chem. 35: 3161-3170.
21. Hincley, C.C.(1969). Paramagnetic shifts in solutions of cholesterol and the
dipyridine adduct of trisdipivalomethanatoeuropium (III). A shift
reagent. 91:5160.
22. Heslop, R.B., and Robinson, P.L. (1975). Inorganic chemistry. (3rd ed.).
Elsevier Pub. Co., New York, p. 589.
23. Ditts, R.V. (1974). Analytical chemistry methods of separation. Litton
Educational Publishing Inc., New York, p. 280.

134
134
24. Furniss, B.S. (1989). Vogel’s textbook of practical organic chemistry. (5th
ed.), John Longman Group UK Limited, England, p. 67.
25. Jolly, W. L. (1960). Synthetic Inorganic Chemistry. Prentice-Hall International
Inc., London, p. 136.
26. Morrison, G. H., and Freiser, H. (1957). Solvent Extraction in Analytical
Chemistry. G. Wiley and Sons, New York, pp. 78
27. Harfenist, E.J., and Craig, L.C. (1952). Countercurrent Distribution Studies
with Insulin. J. Am. Chem. Soc. 74: 3083.
28. Yoe, J. H., and Koch, H. J. (1957). Trace analysis. John Wiley and Sons, Inc.,
New York, pp. 102-125.
29. Skoog, D.A., West, D.M., Holler, F.J., and Crauch, S.R. (2004). Fundamental
of analytical chemistry. (8th ed.). Thomson Asia pte Ltd.
Singapore, pp.865
30. Dean, J. A. (1995). Analytical chemistry handbook. McGraw-Hill, New York,
p. 224.
31. Ezekwe, N. U. (1995). Principles and theory of analytical chemistry. Snaap
Press Limited, Vol. 1, p. 98.
32. Bell, C. F., and Lott, K. A. K. (1963). Modern approach to inorganic chemistry.
Butterworths, London, p. 187.
33. Ukoha, P.O. (1988). Solvent extraction studies on Cu (II) and Ag (I) complexes
of bis (4-hydroxypent-2-ylidene) diaminoethene. M.Sc. Thesis,
University of Nigeria, Nsukka. p. 5.
34. Kolthoff, I.M., and Sandell, E.B. (1941). A quantitative expression for the
extractability of metals in the form of dithizonates from aqueous
solutions. The equilibrium constant of Zinc dithizonate preliminary
paper. J.Am. Chem. Soc. 63:1906.
35. Morrison, G. H., and Freiser, H. (1957). Solvent extraction in analytical
chemistry. G. Wiley and Sons, New York, pp.102

135
135
36. Holzbecher, Z. (1976). Handbook of organic reagents in inorganic analysis.
Ellis Horwood Limited, London, p. 163.
37. Hargis, L. G. (1988). Analytical Chemistry Principle and Techniques. Prentice-
Hall, Inc., New Jersey, p.121
38. Bailes, J. P. (1977). Chemistry and Industry. LLC USA, pp. 64-68.
39. Wilson, J.G. and Newall, A.B. (1981). General and Inorganic Chemistry (2nd
ed.) University press, Cambridge. pp573-578.
40. Greenwood, N.N. and Earnshaw, A. (1997). Chemistry of the element (2nd
ed.). Butterworth Heinemann, UK. pp.1113-1143.
41. Hendry, P. and Ludi, A. (1983). Synthesis and Characterization of selected M2+
Transistion Element. Adv. Inorg. Chem. 35: 117-98.
42. Cotton, F. A., Wilkinson, G., Murillo, A. C. and Bochhmann, M. (1999).
Advanced Inorganic Chemistry (6th Ed.). John Wiley and Sons.
New York. p.1355.
43. Thuery, P. and Zarambowitch, J., (1986). Square Planar Complexes. Inorg.
Chem. 25: 2001-2008.
44. Lancashire, J. R. (2010). Nickel Chemistry.
http://www.chem.uwimona.edu.jm/uwichem.html.
45. Preston, J. S. (1982). Extraction of Co(II) from Aqueous Solution.
Hydrometallurgy, 9: 115-119.
46. Nyman, B., Aaltonen A., Hultholm S. E. and KaJ-pale K., (1992). Seperation
of Nickel(II) from Cobalt(II) using Cyanex 272. Hydrometallurgy.
29: 461-478.
47. Malijkovic, D., Lenhard, Z. and Balen, M. (1991). Extraction of Co(II) and
Ni(II) with Cyanex 272 in EMC'91: non ferrous metallurgy-
present and future, Elsevier Applied Science. 175-181.

136
136
48. Jeffery, G.H., Baset, J. and Mendham, J. (1979). Vogel’s Text Book of
Quantitative Inorganic Analysis. (5th ed.) Longmam green,
London, pp.978.
49. Emad, A. J. A. and Khalid, S. A. (2011). Extraction of cobalt(II)from aqueous
solution by N,NI-carbonyl difatty amides. Chinese Chemical letters
22: 469-472.
50. Ritcey, G. M., Ashbrook, A. W. and Lucas, B. H. (1975). Development of a
solvent extraction process for the separation of cobalt and nickel. J.
CIM Bull. 68(753): 111−123.
51. Flett, D. S. and West, D. W. (1978). Improved solvent extraction process for
cobalt-nickel separation in sulphate solution by use of di(2-
ethylhexy)phosphoric acid. London: Inst Min Metal. 49−57.
52. Pretson, J. S. (1982). Solvent extraction of cobalt and nickel by
organophosphorus acids (1): Comparison of phosphoric,
phosphonic, and phosphinic acid systems. J. Hydrometallurgy.
9(2): 115−133.
53. Rickelton, W. A, Flett, D. S. and West, D. W. (1983). Cobalt-nickel separation
by solvent extraction with dialkylphosphinic acid New York:
American Institute of Chemical Engineers,. 195.
54. Ashbook, A. W. and Ritcey, G. M. (1971). Hydrometallurgical processing of
super alloy scrap for the recovery of cobalt and nickel. Elsvier,
Montreal, p.45.
55. Kasai ,T., Nakayama, H., and Kazuhiko, M. (1980). New NMC process for
winning nickel and cobalt from sulphate solution. NV, Las Vegas,
p.49.
56. Fujimoto, A., Miura, I. and Noguchi, K. (1977). Separation of Cobalt and
Nickel by Solvent Extraction. Japanese. 8(41): 05-14.
57. Ando, M., Emoto, S, Takahashi, M. (1971). Nickel and cobalt refinery of
nippon mining. Vancouver: CIM. pp19.

137
137
58. Liu, D., Ru R., Zhang, R. and Chen, G. (1985). Separation of cobalt from
nickel in sulfate solutions by solvent extraction with P507.
Cannes: Elsvier. 2: 2-9.
59. Kerfoot, D. G. E.(1986). Review of hydrometallurgical refinery operations:
responses to questionnaire. Metallurgists. 12:15-17.
60. Sarangi, K., Reddy, B. R. and Das, R. P.(1999). Extraction studies of cobalt(II)
and nickel (II) from chloride solutions using Na-Cyanex 272,
separation of Co(II)/Ni(II) by the sodium Salts of D2EHPA,
PC88A and Cyanex 272 and their mixtures. J. Hydrometallurgy.
52: 253-265.
61. Fujimoto, A., Miura, I. and Noguchi, K. (1978). Cobal-Nikel Separation Using
PC-88A. P. Japan 96:301.
62. Devi, N. B., Nathsarma, K. C. and Chakravortty, V. (1998). Separation and
recovery of cobalt(II) and nickel (II) from sulphate solutions using
sodium salts of D2EHPA, PC88A and Cyanex 272. J.
Hydrometallurgy. 49: 47−61.
63. Sarangi, K., Reddy, B. R. and Das, R. P. (1999). Extraction studies of
cobalt(Ⅱ) and nickel (II) from chloride solutions using Na-Cyanex
272, separation of Co(II)/Ni(II) by the sodium salts of D2EHPA,
PC88A and Cyanex 272 and their mixtures. J. Hydrometallurgy.
52: 253−265.
64. Liu, D., Ru R. Zhang, R. and Chen, G.(1985). Separation of cobalt from nickel
in sulfate solutions by solvent extraction with P507 Cannes:
Elsvier. pp.2−9.
65. Faridbod, F., Ganjali, M. R., Dinarvand, R. and Nourozi, P. (2007). Ion
recognition: Application of symmetric and asymmetric Schiff
bases and their complexes for the fabrication of cationic and
anionic membrane sensors to determine ions in real samples.
Comb. Chem. High T. scr. 10: 527-546
66. Layer, R. W. (1963). Chemistry Revision U.K. Ltd. Washington, DC, pp.489-
510.

138
138
67. Kim, W., Chin, C., Kim, T., Lough, A. J., Kim, B. M. and Chin, J., (2007).
Electronic and Stearic Effects of Diamine Recognition with a
Highly Rigid Zn(II) Complex. Bull. Korean Chem. Soc. 28(1):
133-35.
68. Gupta, V. K., Singh, A. K. and Gupta, B. (2006). A cerium(III) selective
polyvinyl chloride membrane sensor based on a Schiff base
complex of N,N’-bis[2-(salicylidenamino)ethyl]ethane-1,2-
diamine. Anal. Chim. Acta. 575: 198-204.
69. Garnovskii, A. D. Nivorozhkin, A. L. and Minkin, V. I. (1993). Coordination.
Chem. Rev. 126: 1-69.
70. Larrow, J. F., and Jacobsen, E. N. (2004). (R,R)-N,N’-Bis(3,5-di-tert-
butylsalcylidene)-1,2-cyclohexane diamino manganes(III)chloride.
A highly enantioselective epoxidation catalyst. Org. Synth. Coll.
10: 96.
71. Jacobsen, E.N., Zhang, W. and Gϋler, M. L. (1991). Reactions of β-Ketoesters
to Methyl Vinyl Ketone in Water. J. Am. Chem Soc. 113:6703.
72. Jacobsen, E. N., Zhang, W., Muci A. R., Ecker J. R. and Deng L. (1991).
Nickel(II) and Cobalt(II) Catalysts Bases on Poly-Salen type
Ligandd for the Dimerization of Propylene. J. Am. Chem. Soc.
113:7063.
73. Larrow, J. F. and Jacobsen, E. N. (1997). Synthesis and Characterization of
(R,R)-N,N’-Bis(3,5-di-tert-butylsalcylidene)-1,2-cyclohexane
diamino manganes(III)chloride Org. Syn. 75:1.
74. Mandal, S.S., Varshney, U. and Bhattacharya, S. (1997). Role of Central Metal
ion and Ligand charge in DNA Binding and Modification by
Metallosalen Complexes. Bioconjugate Chem. 8: 798-812.
75. Laye, H. R. and Sanudo, C.E. (2009). Synthesis of Fe(II) and Cu(II) Building
Block for Metal-organic frame work. Inorganica Chimica Acta.
362: 2205-2212.

139
139
76. Bassett, J., Denney, R. C., Jeffery, G. H. and Mendham, J. (1978). Vogel’s
Textbook of Quantitative Chemical Analysis. (4th Ed.). Longman
Inc. New York, p. 161.
77. Alaa, F. H., Moen, I. A., and Hamsa, M. Y. (2008). Adsorption of cobalt(II) ion
from aqeous solution of selected Iraqi clay surfaces. National
Journal of Chemistry. 30: 229-250.
78. Subhrangsu, S. M., Umesh, V. and Santanu, B. (1997). Role of the central
metal ion and ligand charge in the DNA binding and modification
by Metallosalen complexes. Bioconjugate Chem. 8: 798-812.
79. Haeffner, E., Nilsson, G., and Hultgren, A. (1955). International Conference,
peaceful use of atomic energy. Geneva, p. 785.
80. Christian, G. D. (2004). Analytical Chemistry. (6th Ed.). John Wiley & Sons
Inc. USA, p. 468.
81. William, K. (1991). Organic Spectroscopy. (3rd Ed.). Macmillan Educ. Ltd.
ELBS Hong Kong, p.393.
82. Stuart, B. (2004). Infrared spectroscopy: Fundamentals and Principles. John
Wiley and Sons Ltd. pp.74-87.
83. Sablinskas, V., Steiner, G. and Hof, M. (2003). Infrared Spectroscopy: In
Handbook of Spectroscopy (Ed.). Gauglitz G. and Vo-Dinho T.
(2003). Wiley-VCH Verlag GmbH & Co. KGaA, Weinheim.
pp.89-112.
84. Coates, J. (2000). Interpretation of Infrared Spectra, A practical Approach: In
Encyclopedia of Analytical Chemistry. (Ed.) Meyers R. A. John
Wiley & Sons Ltd, Chichester. pp.10815-10837.
85. Silverstein, R. M., Webster, F. X., and Kiemle, D. J. (2005). Spectrometric
Identification of Organic Compounds. (7th Ed.). John Wiley &
Sons Inc. USA, pp87-96
86. El-Ajaily, M. M., Abdlsem, F. A. and Ben-Gweirif, S. (2007). Preparation,
Characterization and Anti-bacterial Activity of Some Metal ion
Complexes. E-journal of Chemistry. 4(4): 461-466.

140
140
87. Prakash, A., Gwanwar, M. P. and Singh, K. K. (2011). Synthesis,
Spectroscopy and Biological Studies of Nickel(II) Complexes with
Tetradentate Schiff Base N2O2 Donor Group. Journal of
Developmental Biology and Tissue Engineering. 3(2): 13-19.
88. Gϋnther, H. (1995). NMR Spectroscopy: Basic Principles, Concepts and
Applications in Chemistry. (2nd Ed.) John Wiley & Sons Ltd.
Sussex, England, pp.97-99.
89. Ezugwu, C. I., Ujam, O. T., Ukoha, P. O. and Ukwueze. N. N. (2013).
Complex Formation and Extraction Studies of N, N’-
bis(salicylidene)-3,5-diaminobenzoic acid on Hg(II) and Ag(I)
ions. Chemical Science Transactions. 2(4): 1118-1125.
90. Macomber, R. S. (1998). A complete introduction to modern NMR
spectroscopy. John Wiley & Sons Inc. USA, pp.132-151.
91. Holbach, M., Zheng, X., Burd, C., Jones, C. W. and Wech, M. (2006). A
practical one-pot synthesis of Enantiopure unsymmetrical Salen
Ligands. J. Org. Chem. 71(7): 2903-2906.
92. John, A., Katiyar, V., Pang, K., Shaikh, M. M., Nanavati, H. and Ghosh, P.
(2007). Ni(II) and Cu(II) complexes of phenoxy-ketimine ligands:
Synthesis, structures and their utility in bulk ring opening
polymerization (ROP) of L-Lactide. J. Poly.
doi:10.1016/j.poly.2007.04.039.
93. Obasi, L. N., Ukoha, P. O. and Chah, K. F. (2011). Synthesis, Spectroscopic
Characterization and Antimicrobial screening of N-(thiazole-2-yl)-
4-chlorobenzen sulphonamide and its nickel(II) and cobalt(II)
complexes. J. Chem. Soc. Nig. 36(1): 102-109.
94. Patnaik, P. (2004). Dean’s Analytical Chemistry Handbook. (2nd Ed.).
McGraw-Hill, England. p.714. www.digitalengineering.com.
95. Gran, G. (1952). Determination of the equivalence point in potentiometric
titration II. Analyst 77: 661 – 671.

141
141
96. Al-Mulla, E. A. J. and Al-Janabi, S. W. K. (2011). Extraction of Co(II) from
aqueous solution by N, N’-Carbonyl difatty amides. Chinese
Chemical Letters. 22: 469-472.
97. Luo, L., Wei, J., Wu, G., Toyohisa, F. and Atsushi, B. (2006). Extraction
studies of Cobalt(II) and Ni(II) from chloride solution using
PC88A. Trans. Nonferrous Met. Soc. China. 16: 687-692.
98. Al-Sabti, M. D. (2008). Effect of temperature on the solvent extraction of
Cobalt(II), Nickel(II) and Copper(II) metal ions by O-
diphenylamino benzoic acid. Eng & Tech. 26(5): 496-500.
99. Svehla, G. (1979). Revised: Vogel’s Text book of macro and semimicro
qualitative inorganic analysis. (5th Ed.). Longman group Ltd.
London, pp.97,99,254 and 264.