facts on alberta: living and doing business in alberta...real economic growth (%, at 2002 prices)...
TRANSCRIPT
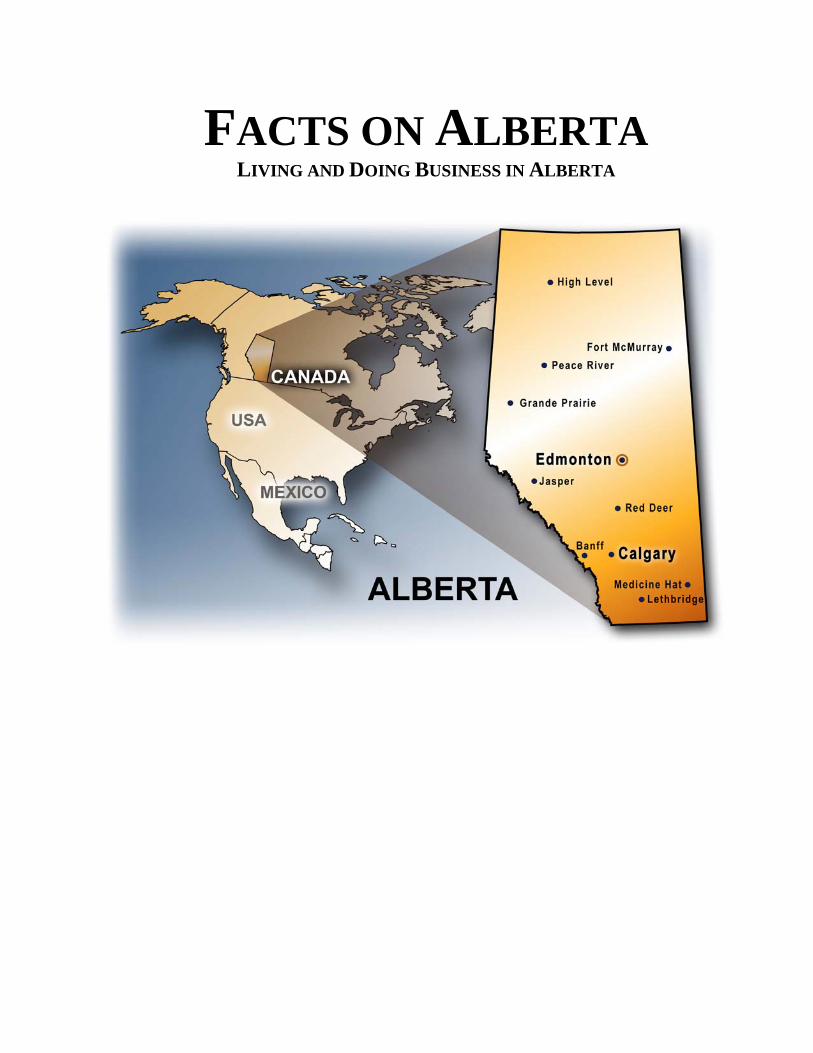
Facts on AlbertaLiving and Doing Business in Alberta
April 2009
FACTS ON ALBERTA LIVING AND DOING BUSINESS IN ALBERTA
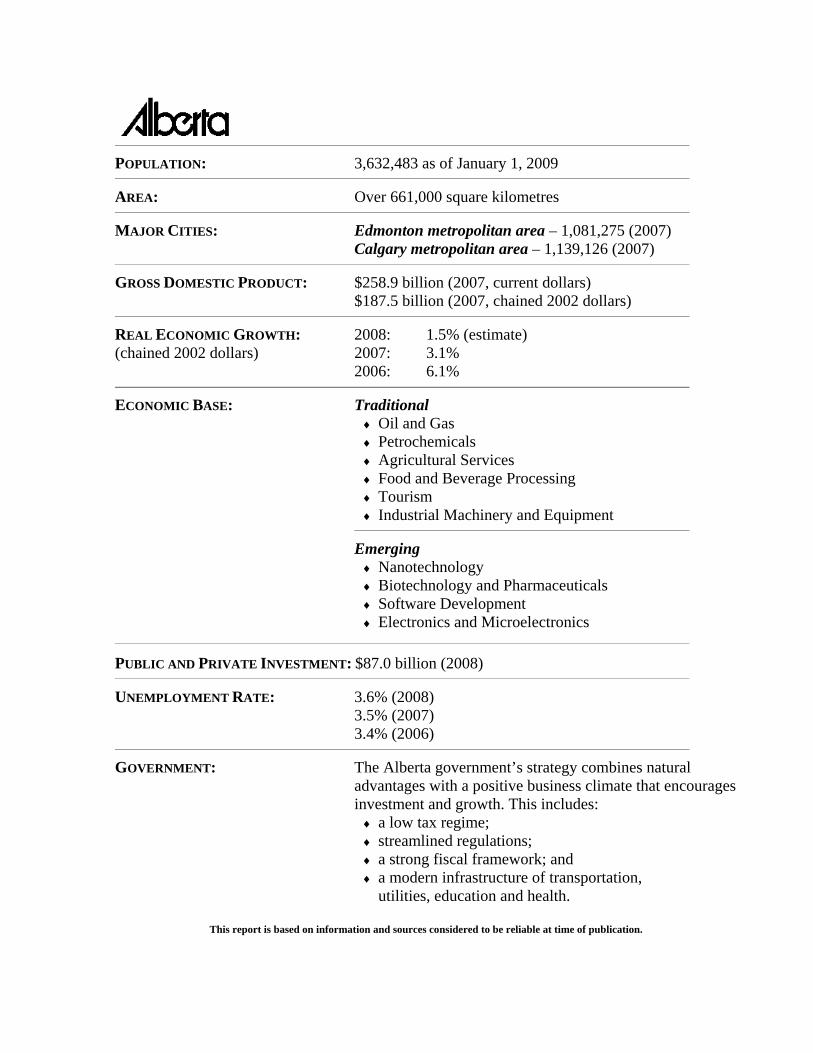
POPULATION: 3,632,483 as of January 1, 2009
AREA: Over 661,000 square kilometres
MAJOR CITIES: Edmonton metropolitan area – 1,081,275 (2007) Calgary metropolitan area – 1,139,126 (2007)
GROSS DOMESTIC PRODUCT: $258.9 billion (2007, current dollars) $187.5 billion (2007, chained 2002 dollars)
REAL ECONOMIC GROWTH: 2008: 1.5% (estimate) (chained 2002 dollars) 2007: 3.1% 2006: 6.1%
ECONOMIC BASE: Traditional ♦ Oil and Gas ♦ Petrochemicals ♦ Agricultural Services ♦ Food and Beverage Processing ♦ Tourism ♦ Industrial Machinery and Equipment
Emerging ♦ Nanotechnology ♦ Biotechnology and Pharmaceuticals ♦ Software Development ♦ Electronics and Microelectronics
PUBLIC AND PRIVATE INVESTMENT: $87.0 billion (2008)
UNEMPLOYMENT RATE: 3.6% (2008) 3.5% (2007) 3.4% (2006)
GOVERNMENT: The Alberta government’s strategy combines natural advantages with a positive business climate that encourages investment and growth. This includes:
♦ a low tax regime; ♦ streamlined regulations; ♦ a strong fiscal framework; and ♦ a modern infrastructure of transportation,
utilities, education and health.
This report is based on information and sources considered to be reliable at time of publication.

TABLE OF CONTENTS ALBERTA - FRESH OPPORTUNITIES ...............................................................................................1
• Business .............................................................................................................................................. 1 • Lifestyle. ............................................................................................................................................. 1
ECONOMY.........................................................................................................................................2 • Alberta Economic Results.................................................................................................................. 2 • Economic Well-Being. ....................................................................................................................... 3 • Economic Structure. ........................................................................................................................... 5 • Alberta Economic Indicators ............................................................................................................. 6
PRODUCTIVITY.................................................................................................................................7 TAXATION.......................................................................................................................................10
• Personal Income Taxes..................................................................................................................... 11 • Interprovincial Tax and Health Care Premium Comparison.......................................................... 12 • Corporate Taxation........................................................................................................................... 13 • Research and Development Tax Credits ......................................................................................... 15 • Municipal Taxation. ......................................................................................................................... 16
REAL ESTATE.................................................................................................................................17 • Industrial Real Estate........................................................................................................................ 17 • Commercial Real Estate................................................................................................................... 19 • Residential Housing ......................................................................................................................... 20
LABOUR FORCE .............................................................................................................................22 • Employment...................................................................................................................................... 22 • Skilled Labour .................................................................................................................................. 24 • Wages and Salaries........................................................................................................................... 25 • Employment Standards .......................................................................................................... 27
INVENTORY OF MAJOR ALBERTA PROJECTS..............................................................................28 TRANSPORTATION ........................................................................................................................29
• Railways............................................................................................................................................ 29 • Highways .......................................................................................................................................... 30 • Air Service ........................................................................................................................................ 30
POST SECONDARY EDUCATION ....................................................................................................31 • Alberta Universities and Technical Institutes ................................................................................. 32
• University of Alberta .............................................................................................................. 32 • University of Calgary ............................................................................................................. 33 • University of Lethbridge ........................................................................................................ 34 • Athabasca University.............................................................................................................. 34 • Northern Alberta Institute of Technology (NAIT)................................................................ 35 • Southern Alberta Institute of Technology (SAIT) ................................................................ 35
• Public and Private Colleges. ............................................................................................................ 36 • Educational Support ......................................................................................................................... 36
RESEARCH AND DEVELOPMENT COMMUNITY............................................................................38 • Research Funding at Universities .................................................................................................... 44 • World Class Research Infrastructure............................................................................................... 44

ALBERTA - FRESH OPPORTUNITIES Business Alberta has been blessed with an abundance of natural resources that have formed the foundation of its thriving economy. The Alberta government has built on this foundation by engineering an economic plan and creating a positive business climate that encourages investment, fosters diversification and allows businesses to compete successfully around the globe. The result is one of the most vibrant and competitive economies in the world. Overall, Alberta’s globally competitive business climate consists of:
o a diverse and relatively strong economy; o a young, skilled and productive workforce; o a strong commitment to innovation and knowledge-based progress; o a highly entrepreneurial and competitive business community; o a business-friendly province committed to responsible regulation; o the lowest overall tax load of any province in Canada, including no provincial sales tax; o a modern and efficient infrastructure; o an abundance of natural resources; and o a fiscally responsible provincial government.
Lifestyle Each year, thousands of people move to Alberta, drawn by personal or business opportunities and the exceptional standard of living. Alberta is a prosperous province, where residents share a rich natural environment and enjoy outstanding opportunities in recreation, arts and culture. In particular, Alberta offers:
o safe, modern cities and charming small towns and villages; o cultural diversity; o accessible education and health care; o tremendous recreation and leisure opportunities; o music, dance, film, literature, theatre and visual arts experiences; o sporting events, fairs and rodeos; o internationally recognized museums, national parks and world heritage sites; and o a clean, beautiful, natural environment.
Alberta’s communities offer resources and expertise that meet your business needs. To find out more, visit the Alberta First website (www.albertafirst.com).
1

ECONOMY Alberta’s economy continued to grow in 2008 despite a global economic slowdown. While the demand for many of Alberta’s natural resources has weakened, a low unemployment rate, a well trained workforce and an increasingly diversified economy will contribute to Alberta’s ability to weather the global economic downturn.
Alberta Economic Results
o Over the last two decades, Alberta had the highest Gross Domestic Product (GDP) growth rate in Canada, at 3.5% per year. In 2008, Alberta's economy grew by an estimated 1.5%. Although slipping commodity prices and a global economic downturn are expected to negatively impact Alberta’s economic performance in 2009, most private sector forecasters expect the province to continue to lead the country in economic growth over the long term.
o Alberta’s exports of goods increased by one third between 2007 and 2008 to an estimated $109 billion. This increase can be attributed to the rapid rise of energy prices.
o Alberta has a rapidly growing manufacturing base. Between 2007 and 2008, manufacturing shipments increased 6.9% to $70.1 billion.
o The province consistently has the highest investment per capita among provinces. In 2008, Alberta investment per capita was $24,262, more than double the national average. A total of $87 billion was invested in 2008, more than double the 2002 level.
o Average annual employment in the province in 2008 increased by 53,900 over 2007. Between 1998 and 2008, employment increased by 503,400.
o Alberta’s average unemployment rate in 2008 was the lowest in Canada at 3.6%. Interprovincial Indicators
Current $ Constant $* 1997 - 2007 2006 2007 2008***Newfoundland and Labrador 508 13.2 29,524 19,696 5.1 3.0 9.1 1.0Prince Edward Island 140 10.8 4,549 4,149 2.6 2.4 2.4 1.2Nova Scotia 938 7.7 33,010 28,803 2.6 0.9 1.7 1.6New Brunswick 747 8.6 26,947 23,669 2.9 2.4 1.7 1.1Quebec 7,751 7.2 296,692 265,888 2.7 1.7 2.6 1.0Ontario 12,929 6.5 584,957 536,340 3.5 2.6 2.3 0.0Manitoba 1,208 4.2 48,549 41,662 2.6 4.0 3.3 2.7Saskatchewan 1,016 4.1 51,628 39,834 2.1 -0.3 2.5 5.4Alberta 3,585 3.6 258,936 187,493 3.9 6.1 3.1 0.6**British Columbia 4,382 4.6 192,528 164,583 3.1 4.4 3.0 1.0Canada 33,311 6.1 1,535,646 1,319,681 3.3 3.1 2.7 0.6
Province2008
Population (000s)
Unemployment Rate 2008
(%)
2007 GDP($ millions)
Real Economic Growth (%, at 2002 Prices)
Notes: *2007 GDP in chained 2002 dollars. **Alberta Finance and Enterprise real economic growth estimate for Alberta is 1.5% for 2008. ***Conference Board of Canada 2008 forecast Sources: Statistics Canada; Conference Board of Canada (Provincial Outlook - Winter 2009)
2
Economic Well-Being
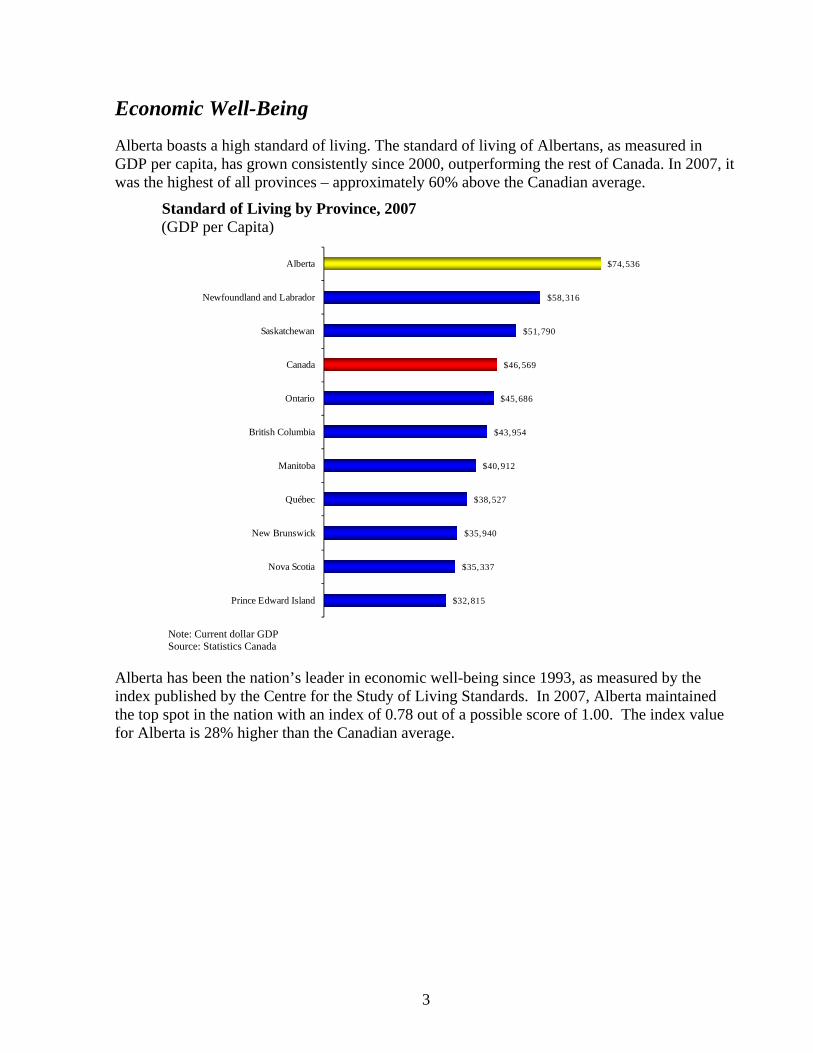
Alberta boasts a high standard of living. The standard of living of Albertans, as measured in GDP per capita, has grown consistently since 2000, outperforming the rest of Canada. In 2007, it was the highest of all provinces – approximately 60% above the Canadian average.
Standard of Living by Province, 2007 (GDP per Capita)
$32,815
$35,337
$35,940
$38,527
$40,912
$43,954
$45,686
$46,569
$51,790
$58,316
$74,536
Prince Edward Island
Nova Scotia
New Brunswick
Québec
Manitoba
British Columbia
Ontario
Canada
Saskatchewan
Newfoundland and Labrador
Alberta
Note: Current dollar GDP Source: Statistics Canada
Alberta has been the nation’s leader in economic well-being since 1993, as measured by the index published by the Centre for the Study of Living Standards. In 2007, Alberta maintained the top spot in the nation with an index of 0.78 out of a possible score of 1.00. The index value for Alberta is 28% higher than the Canadian average.
3

Index of Economic Well-Being by Province, 2007
0.511
0.545
0.562
0.566
0.580
0.581
0.583
0.586
0.608
0.613
0.778
New Brunswick
Newfoundland and Labrador
Saskatchewan
Nova Scotia
Québec
Prince Edward Island
Manitoba
Ontario
Canada
British Columbia
Alberta
Note: Measures consumption flows, wealth stocks, income distribution, and economic security. Source: Centre for the Study of Living Standards
The province’s strong performance in economic well-being indicators was also evident in international comparisons. In 2006, Alberta ranked second compared to 14 OECD nations in an international comparison of economic well-being.
Index of Economic Well-Being – International Comparison, 2006
0.49
0.49
0.50
0.55
0.58
0.59
0.62
0.63
0.63
0.64
0.67
0.68
0.71
0.71
0.74
United Kingdom
Spain
United States
Italy
Australia
Canada
Sweden
Germany
Finland
France
Netherlands
Belgium
Denmark
Alberta
Norway
Note: Measures consumption flows, wealth stocks, income distribution, and economic security. Source: Centre for the Study of Living Standards
4
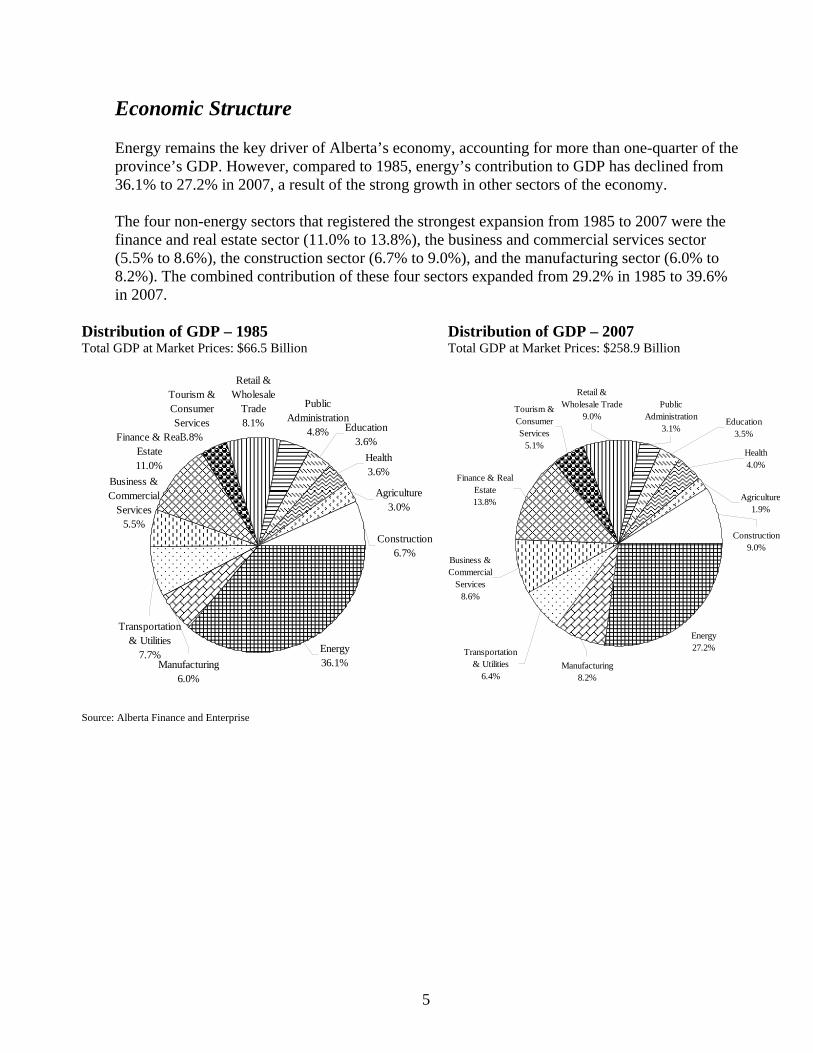
Economic Structure Energy remains the key driver of Alberta’s economy, accounting for more than one-quarter of the province’s GDP. However, compared to 1985, energy’s contribution to GDP has declined from 36.1% to 27.2% in 2007, a result of the strong growth in other sectors of the economy. The four non-energy sectors that registered the strongest expansion from 1985 to 2007 were the finance and real estate sector (11.0% to 13.8%), the business and commercial services sector (5.5% to 8.6%), the construction sector (6.7% to 9.0%), and the manufacturing sector (6.0% to 8.2%). The combined contribution of these four sectors expanded from 29.2% in 1985 to 39.6% in 2007.
Distribution of GDP – 1985 Total GDP at Market Prices: $66.5 Billion
Energy36.1%Manufacturing
6.0%
Transportation & Utilities
7.7%
Business & Commercial
Services5.5%
Finance & Real Estate11.0%
Tourism & Consumer Services
3.8%
Retail & Wholesale
Trade8.1%
Public Administration
4.8% Education3.6%
Health3.6%
Agriculture 3.0%
Construction6.7%
Source: Alberta Finance and Enterprise
Distribution of GDP – 2007 Total GDP at Market Prices: $258.9 Billion
Tourism & Consumer Services
5.1%
Energy27.2%
Manufacturing8.2%
Transportation & Utilities
6.4%
Business & Commercial
Services8.6%
Finance & Real Estate13.8%
Retail & Wholesale Trade
9.0%Public
Administration3.1%
Education3.5%
Health4.0%
Agriculture1.9%
Construction9.0%
5

Alberta Economic Indicators Y/Y % Change
Indicator 2003 2004 2005 2006 2007 2008 2006-07 2007-08 Demographics:
Population ('000's), as of July 1 3,183.4 3,239.5 3,322.2 3,421.3 3,510.9 3,585.1 2.6% 2.1% Net international migration (July 1 through June 30) 12,227 14,034 16,477 21,279 29,675 37,173 39.5% 25.3% Net inter-provincial migration (July 1 through June 30) 11,903 10,606 34,423 45,795 33,809 10,010 -26.2% -70.4%
Labour Force:
Employment ('000's) 1,716.7 1,757.5 1,784.4 1,870.7 1,959.4 2,013.3 4.7% 2.8% Job creation ('000's) 45.9 40.8 27.3 86.4 88.1 54.0 Full Time ('000's) 1,407.6 1,440.2 1,477.6 1,570.1 1,649.1 1,687.5 5.0% 2.3% Part Time ('000's) 309.1 317.2 306.8 300.6 310.4 325.8 3.3% 5.0% Unemployment Rate (%) 5.1 4.6 3.9 3.4 3.5 3.6 - - Employment Insurance beneficiaries (#) 33,931 28,839 22,378 18,834 16,838 17,442 -10.8% 3.6% Average Weekly Earnings ($, incl. overtime) 703.50 724.42 762.08 799.14 835.37 875.65 4.5% 4.8% Wages and salaries ($ millions) 66,266 72,707 82,878 95,678 106,647 115,554 11.5% 8.4%
Gross Domestic Product:
Gross Domestic Product, nominal ($millions) 170,113 189,743 220,419 239,584 258,936 - 8.1% - Gross Domestic Product, chained 2002$ (millions) 155,359 163,564 171,416 181,791 187,493 - 3.1% - Real GDP growth (%) 3.2 5.3 4.8 6.1 3.1 - - -
Construction: Capital investment, construction and M&E ($ millions) 44,744 50,808 65,034 76,924 83,933 86,981 9.1% 3.6% Capital investment per capita ($) 14,055 15,684 19,576 22,484 23,906 24,262 6.3% 1.5% Capital investment, construction ($ millions) 28,984 33,992 44,382 52,987 59,768 62,237 12.8% 4.1% Capital investment, M&E ($ millions) 15,760 16,816 20,652 23,937 24,165 24,744 1.0% 2.4% Building permits ($millions) 6,667 7,327 10,202 13,876 15,730 13,141 13.4% -16.5% Housing starts in all areas (number) 36,171 36,270 40,847 48,962 48,336 29,164 -1.3% -39.7%
Consumer Spending and Income:
Retail trade ($million) 39,318 43,372 48,493 55,942 61,156 61,014 9.3% -0.2% Personal income per capita ($) 33,423 35,930 39,078 43,116 45,875 - 6.4% - Personal disposable income per capita ($) 25,920 27,915 30,012 33,134 35,208 - 6.3% - New car sales (number) 194,450 196,154 222,361 248,731 257,050 238,534 3.3% -7.2% MLS, units sold 51,334 57,460 65,866 74,350 71,430 56,399 -3.9% -21.0% MLS, average price ($) 182,749 194,703 217,890 285,167 357,168 352,234 25.2% -1.4% Consumer Price Index (2002=100) 104.4 105.9 108.1 112.3 117.9 121.6 5.0% 3.1% Consumer bankruptcies (number) 9,160 8,719 7,542 5,248 4,768 6,066 -9.1% 27.2%
International and Inter-Provincial Trade:
International exports - goods ($millions) 57,044 63,688 76,279 77,744 81,873 109,039 5.3% 33.2% International exports - goods and services ($millions) 64,697 71,508 84,562 86,157 90,473 - 5.0% -
Business Entry and Exit:
Incorporations (number) 32,569 34,317 40,325 48,207 48,791 43,515 1.2% -10.8% Business bankruptcies (number) 1,636 1,565 1,194 666 449 447 -32.6% -0.4%
Energy:
Crude oil production ('000 m3) 95,311 101,007 98,879 106,018 108,997 - 2.8% - Natural gas production (million m3) 166,672 167,726 168,349 167,385 165,594 - -1.1% - Wells drilled - completion basis (number) 14,968 16,648 16,911 16,687 14,453 15,366 -13.4% 6.3% Number of active drilling rigs (average #) 314 331 381 371 241 236 -35.0% -2.1%
Manufacturing:
Manufacturing shipments ($millions) 48,076 53,608 60,439 64,382 65,593 70,144 1.9% 6.9% Wholesale:
Wholesale trade ($millions) 39,967 44,966 52,266 59,073 61,723 68,286 4.5% 10.6% Agriculture:
Farm cash receipts ($millions) 7,049 8,009 7,832 7,811 8,748 10,079 12.0% 15.2%
Sources: Industry Canada, Service Alberta, Canada Mortgage and Housing Corporation, Canadian Real Estate Association, Statistics Canada, and Alberta Finance and Enterprise, Canadian Association of Oilwell Drilling Contractors.
6

PRODUCTIVITY Productivity measures the efficiency with which resources are employed in the production process. It is the most important source of long-term economic growth and increased standard of living as it addresses the overall performance of a company or economy through achieving greater resource allocation, human resource efficiency, increased innovation, technology diffusion and capital investment. Productivity is an essential component to the success and health of every company in Alberta and the overall standard of living of Albertans. Alberta has a favourable environment that supports productivity: low taxes, a well-developed innovation system, a skilled labour force, and a culture of innovation and entrepreneurship. In 2007, Alberta’s labour productivity – measured as the ratio of output (GDP) to labour inputs (hours worked) – was higher than that of any other province. Total value added (or GDP) per hour in Alberta was 117% of the Canadian average.
Labour Productivity by Province – Total Economy, 2007 (real GDP per hour worked)
$30.86
$32.94
$33.55
$35.96
$38.60
$38.98
$41.07
$41.21
$41.95
$47.01
$48.20
Prince Edward Island
New Brunswick
Nova Scotia
Manitoba
British Columbia
Québec
Canada
Saskatchewan
Ontario
Newfoundland and Labrador
Alberta
Note: GDP at basic prices in chained 2002 dollars Sources: Statistics Canada, Alberta Finance and Enterprise
The mining and oil and gas, information services, finance and insurance, and manufacturing sectors had the highest labour productivity in Alberta in 2007.
7

Labour Productivity by Industry in Alberta, 2007 (real GDP per hour worked)
$121
$83
$81
$61
$47
$42
$42
$36
$34
$27
Mining and Oil and Gas
Information Services
Finance and Insurance
Manufacturing
Wholesale
Transportation
Agriculture
Construction
Prof., Scientific and Tech. Services
Retail
Note: GDP at basic prices in chained 2002 dollars Sources: Statistics Canada, Alberta Finance and Enterprise
Alberta’s manufacturing sector had the highest productivity of all provinces, partly because of its highly productive chemical, machinery and food processing industries. In 2007, the total value added per hour in Alberta exceeded the Canadian average by 18.4%.
8

Manufacturing Sector Labour Productivity by Province, 2007 (real GDP per hour worked)
24.45
30.58
35.24
37.59
38.13
46.36
47.4
50.77
51.31
56.92
60.73
Newfoundland and Labrador
Prince Edward Island
New Brunswick
Manitoba
Nova Scotia
British Columbia
Québec
Saskatchewan
Canada
Ontario
Alberta
Note: GDP at basic prices in 2002 chained dollars Sources: Statistics Canada, Alberta Finance and Enterprise
Alberta has a commitment to creating a supportive environment for companies in the province to improve their productivity and become successful in world markets. For example, effective January 1, 2009, Alberta’s provincial scientific research and experimental development (SR&ED) tax credit is worth 10% of a company’s eligible expenditures up to $4 million, for a maximum credit of $400,000.
9
TAXATION Albertans have the lowest overall personal taxes in Canada
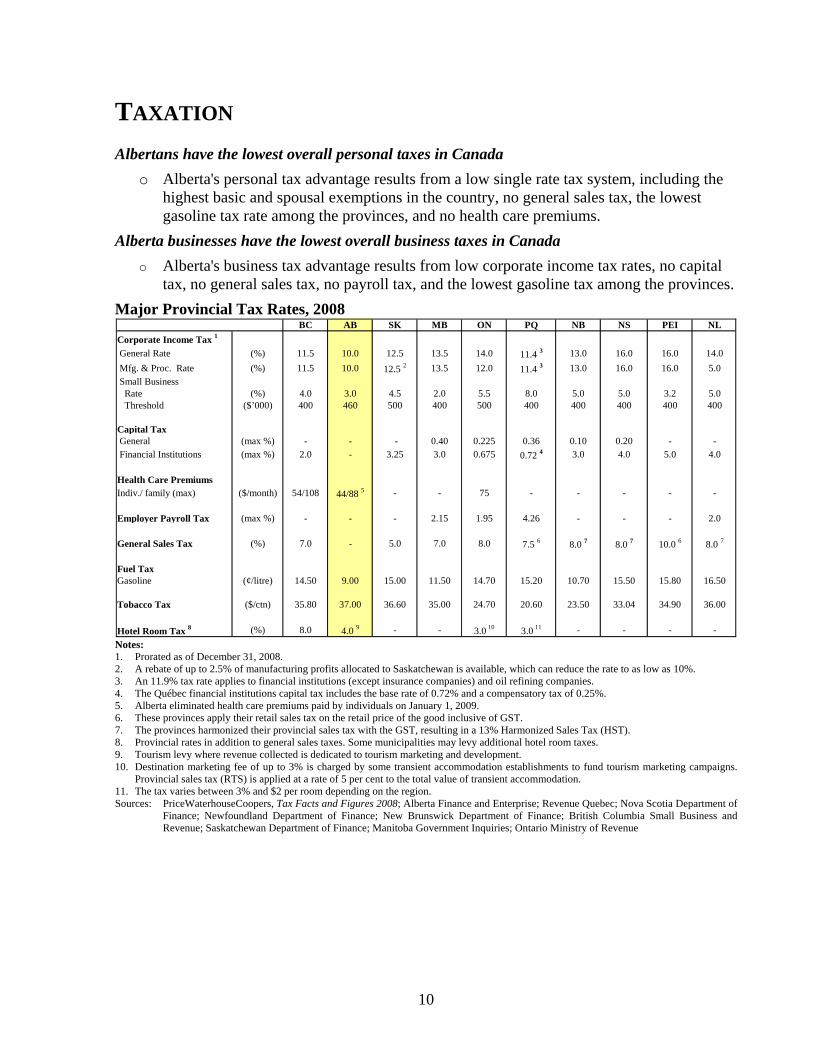
o Alberta's personal tax advantage results from a low single rate tax system, including the highest basic and spousal exemptions in the country, no general sales tax, the lowest gasoline tax rate among the provinces, and no health care premiums.
Alberta businesses have the lowest overall business taxes in Canada o Alberta's business tax advantage results from low corporate income tax rates, no capital
tax, no general sales tax, no payroll tax, and the lowest gasoline tax among the provinces. Major Provincial Tax Rates, 2008
BC AB SK MB ON PQ NB NS PEI NLCorporate Income Tax 1
General Rate (%) 11.5 10.0 12.5 13.5 14.0 11.4 3 13.0 16.0 16.0 14.0 Mfg. & Proc. Rate (%) 11.5 10.0 12.5 2 13.5 12.0 11.4 3 13.0 16.0 16.0 5.0 Small Business Rate (%) 4.0 3.0 4.5 2.0 5.5 8.0 5.0 5.0 3.2 5.0 Threshold ($’000) 400 460 500 400 500 400 400 400 400 400
Capital Tax General (max %) - - - 0.40 0.225 0.36 0.10 0.20 - - Financial Institutions (max %) 2.0 - 3.25 3.0 0.675 0.72 4 3.0 4.0 5.0 4.0
Health Care PremiumsIndiv./ family (max) ($/month) 54/108 44/88 5 - - 75 - - - - -
Employer Payroll Tax (max %) - - - 2.15 1.95 4.26 - - - 2.0
General Sales Tax (%) 7.0 - 5.0 7.0 8.0 7.5 6 8.0 7 8.0 7 10.0 6 8.0 7
Fuel Tax Gasoline (¢/litre) 14.50 9.00 15.00 11.50 14.70 15.20 10.70 15.50 15.80 16.50
Tobacco Tax ($/ctn) 35.80 37.00 36.60 35.00 24.70 20.60 23.50 33.04 34.90 36.00
Hotel Room Tax 8 (%) 8.0 4.0 9 - - 3.0 10 3.0 11 - - - -Notes: 1. Prorated as of December 31, 2008. 2. A rebate of up to 2.5% of manufacturing profits allocated to Saskatchewan is available, which can reduce the rate to as low as 10%. 3. An 11.9% tax rate applies to financial institutions (except insurance companies) and oil refining companies. 4. The Québec financial institutions capital tax includes the base rate of 0.72% and a compensatory tax of 0.25%. 5. Alberta eliminated health care premiums paid by individuals on January 1, 2009. 6. These provinces apply their retail sales tax on the retail price of the good inclusive of GST. 7. The provinces harmonized their provincial sales tax with the GST, resulting in a 13% Harmonized Sales Tax (HST). 8. Provincial rates in addition to general sales taxes. Some municipalities may levy additional hotel room taxes. 9. Tourism levy where revenue collected is dedicated to tourism marketing and development. 10. Destination marketing fee of up to 3% is charged by some transient accommodation establishments to fund tourism marketing campaigns.
Provincial sales tax (RTS) is applied at a rate of 5 per cent to the total value of transient accommodation. 11. The tax varies between 3% and $2 per room depending on the region. Sources: PriceWaterhouseCoopers, Tax Facts and Figures 2008; Alberta Finance and Enterprise; Revenue Quebec; Nova Scotia Department of
Finance; Newfoundland Department of Finance; New Brunswick Department of Finance; British Columbia Small Business and Revenue; Saskatchewan Department of Finance; Manitoba Government Inquiries; Ontario Ministry of Revenue
10

Personal Income Taxes Alberta's low personal income taxes allow people to spend or invest more of their own money according to their wishes. Alberta's low top marginal tax rate rewards the efforts of Albertans and attracts skilled workers from around the world, further fuelling an already dynamic economy. Alberta indexes its personal income tax system to offset inflation, protecting taxpayers. For the 2008 tax year, an additional $726 was added to the basic, spousal and eligible dependant amounts, raising them from $15,435 in 2007 to $16,161 in 2008. The annual indexing of the Alberta Family Employment Tax Credit began in July 2006. The maximum benefits as of July 2008 were increased to $669 for one child, $1,277 for two children, $1,642 for three children and $1,764 for four or more children. The income level at which the credit begins to be phased out rose from $27,633 to $32,633. A typical working family with two children can earn up to $41,000 in 2008 before paying provincial income taxes, as the Alberta Family Employment Tax Credit offsets any income taxes paid to that level.
Top Marginal Effective Personal Income Tax Rates – May 2008
29.00%
29.00%
29.00%
29.00%
29.00%
29.00%
29.00%
29.00%
29.00%
24.22%
10.00%
11.16%
14.70%
15.00%
16.00%
16.70%
17.40%
17.50%
17.95%
24.00%
Alberta
Ontario
British Columbia
Saskatchewan
Newfoundland and Labrador
Prince Edward Island
Manitoba
Nova Scotia
New Brunswick
Québec*
Federal Personal Income Tax Provincial Personal Income Tax
*Federal rates that apply in Quebec have been reduced by the 16.5% "Quebec abatement". Note: Includes Surtaxes Source: PriceWaterhouseCoopers, Tax Facts and Figures 2008
11
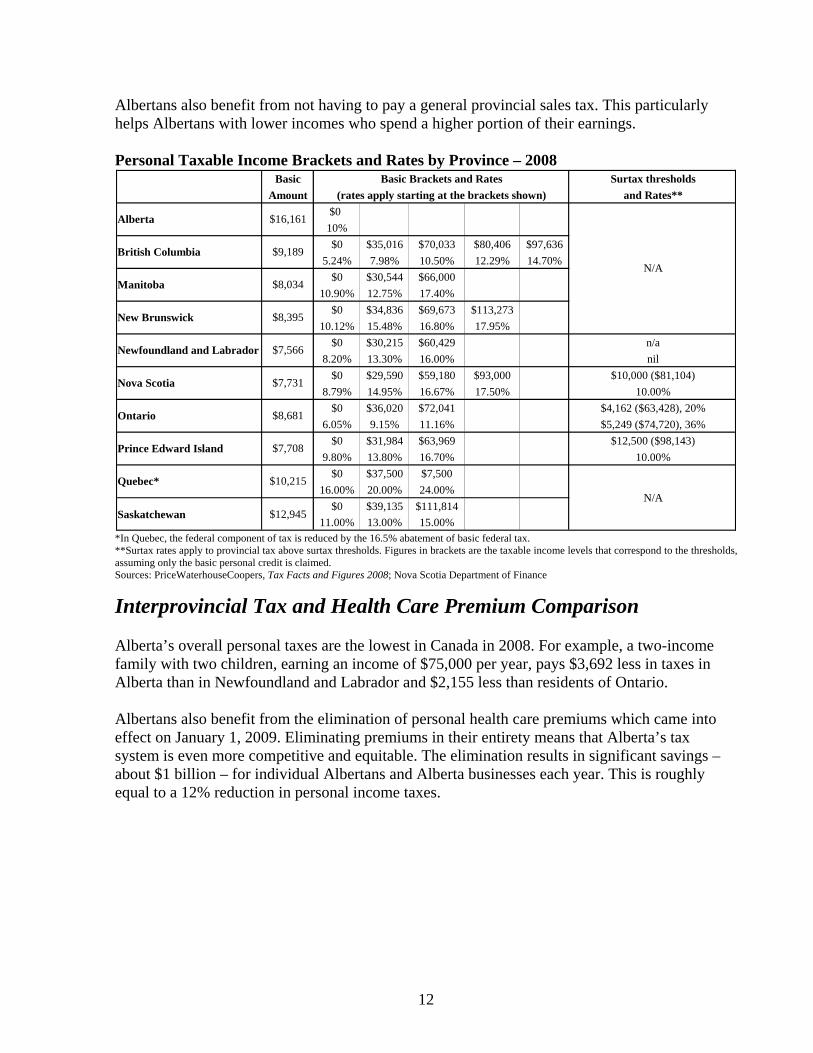
Albertans also benefit from not having to pay a general provincial sales tax. This particularly helps Albertans with lower incomes who spend a higher portion of their earnings. Personal Taxable Income Brackets and Rates by Province – 2008
BasicAmount
$010%$0 $35,016 $70,033 $80,406 $97,636
5.24% 7.98% 10.50% 12.29% 14.70%$0 $30,544 $66,000
10.90% 12.75% 17.40%$0 $34,836 $69,673 $113,273
10.12% 15.48% 16.80% 17.95%$0 $30,215 $60,429
8.20% 13.30% 16.00%$0 $29,590 $59,180 $93,000
8.79% 14.95% 16.67% 17.50%$0 $36,020 $72,041
6.05% 9.15% 11.16%$0 $31,984 $63,969
9.80% 13.80% 16.70%$0 $37,500 $7,500
16.00% 20.00% 24.00%$0 $39,135 $111,814
11.00% 13.00% 15.00%
Prince Edward Island $7,708$12,500 ($98,143)
10.00%
Quebec* $10,215N/A
Saskatchewan $12,945
Ontario $8,681$4,162 ($63,428), 20%$5,249 ($74,720), 36%
Nova Scotia $7,731$10,000 ($81,104)
10.00%
$8,034
New Brunswick $8,395
Newfoundland and Labrador $7,566n/anil
Basic Brackets and Rates Surtax thresholds(rates apply starting at the brackets shown) and Rates**
Alberta $16,161
N/ABritish Columbia $9,189
Manitoba
*In Quebec, the federal component of tax is reduced by the 16.5% abatement of basic federal tax. **Surtax rates apply to provincial tax above surtax thresholds. Figures in brackets are the taxable income levels that correspond to the thresholds, assuming only the basic personal credit is claimed. Sources: PriceWaterhouseCoopers, Tax Facts and Figures 2008; Nova Scotia Department of Finance
Interprovincial Tax and Health Care Premium Comparison Alberta’s overall personal taxes are the lowest in Canada in 2008. For example, a two-income family with two children, earning an income of $75,000 per year, pays $3,692 less in taxes in Alberta than in Newfoundland and Labrador and $2,155 less than residents of Ontario. Albertans also benefit from the elimination of personal health care premiums which came into effect on January 1, 2009. Eliminating premiums in their entirety means that Alberta’s tax system is even more competitive and equitable. The elimination results in significant savings – about $1 billion – for individual Albertans and Alberta businesses each year. This is roughly equal to a 12% reduction in personal income taxes.
12

Employment Income of $125,000 – Two-Income Family with Two Children ($) – 2008 BC AB SK MB ON PQ NB NS PEI NL
Provincial Income Tax 5,463 7,036 9,311 10,124 6,283 10,723 10,757 10,785 10,349 10,174 Provincial Sales Tax 2,082 1,264 2,226 2,546 3,068 3,000 2,868 3,383 3,260 Health Care Premium 972 792 788 Payroll Tax 925 1,136 2,628 654 Fuel Tax 653 405 675 518 662 684 482 698 771 743 Total Provincial Tax 9,170 8,233 11,250 13,793 11,415 17,103 14,239 14,351 14,503 14,831 Employment Income of $75,000 – Two-Income Family with Two Children ($) - 2008
BC AB SK MB ON PQ NB NS PEI NL Provincial Income Tax 2,245 2,839 4,096 4,585 2,615 2,790 4,677 4,568 4,727 4,422 Provincial Sales Tax 1,354 838 1,477 1,670 2,124 2,003 1,920 2,245 2,171 Health Care Premium 972 792 563 Payroll Tax 555 681 1,577 392 Fuel Tax 653 405 675 518 662 684 482 698 711 743 Total Provincial Tax 5,224 4,036 5,609 7,135 6,191 7,175 7,162 7,186 7,683 7,728 Employment Income of $30,000 – One-Income Family with Two Children ($) - 2008
BC AB SK MB ON PQ NB NS PEU NL Provincial Income Tax 530 (1,141) (614) 305 (380) (4,217) 740 902 1,066 1,168 Provincial Sales Tax 666 375 897 880 1,096 1,203 1,144 1,335 1,279 Health Care Premium 225 Payroll Tax 222 273 631 157 Fuel Tax 435 270 450 345 441 456 321 465 591 495 Total Provincial Tax 1,631 (871) 211 1,769 1,439 (2,034) 2,264 2,511 2,992 3,099
Notes: Calculations are based on other provinces’ tax parameters known as of April 3, 2008. Assumptions: • Business is assumed to bear between 25% and 60% of the provincial sales tax, depending upon the provincial tax regime. • Health care insurance premiums are net of premium subsidies. • In provinces that impose payroll taxes, 75% is assumed to be borne by employees and 25% by employers. The same 75/25 split is assumed
for the net health care insurance premiums. • Fuel tax is based on estimated consumption of 3,000 litres per year for one-income families and 4,500 litres for two-income families. • Tobacco tax is based on estimated consumption of 100 packs per adult per year. • RRSP/RPP contributions of $1,000, $9,700 and $16,800 are included in the calculation of personal income tax for the $30,000, $75,000 and
$125,000 families, respectively. • For two-income families, income and RRSP/RPP contributions are split 60/40 between the two spouses. • The children in each family are assumed to be 6 and 12 years old. Source: Alberta Finance and Enterprise, Budget 2008 Corporate Taxation Alberta provides an attractive tax environment for business. Alberta’s low taxes on capital investment are a key factor in encouraging businesses to invest in new technologies and machinery, increasing innovation and boosting productivity. Ultimately this results in a higher standard of living for all Albertans. In addition, Alberta has no provincial capital or payroll taxes, which are common in many other provinces and U.S. states.
13

Provincial General Capital and Payroll Tax Rates - 2008
BC AB SK MB ON PQ NB NS PEI NLCapital Tax (max %) - - - 0.40 0.225 0.36 0.10 0.20 - -Payroll Tax (max %) - - - 2.15 1.95 4.26 - - - 2.00 Source: Alberta Finance and Enterprise, Budget 2008 Provincial Corporate Income Tax Rates – pro-rated for December 31, 2008
BC AB SK MB ON PQ NB NS PEI NLGeneral (%) 11.5 10.0 12.5 13.5 14.0 11.4 2 13.0 16.0 16.0 14.0 Mfg. & Processing (%) 11.5 10.0 12.5 1 13.5 12.0 11.4 2 13.0 16.0 16.0 5.0 Small Business (%) 4.0 3.0 4.5 2.0 5.5 8.0 5.0 5.0 3.5 5.0 1. A rebate of up to 2.5% of manufacturing profits allocated to Saskatchewan is available, which can reduce the rate to as low as 10%. 2. An 11.9% tax rate applies to financial institutions (except insurance companies) and oil refining companies. Source: PriceWaterhouseCoopers, Tax Facts and Figures 2008
Federal Corporate Tax Rates – 2008 (in currency of country)
Federal Corporate Tax Rates Canada United States
Corporate Income Tax (%) a Top General Statutory Rate 19.5 35.0 Manufacturing Rate 19.5 35.0 Small Business 11.0 34.0 Combined Effective (Cdn. Federal +AB and US Federal + State Avg.) 29.5 39.25
General Sales Tax (%) b 5.0 -
Canada Pension Plan/Social Security c 4.95 % (max. $2,049.30 on max. contributory earnings of $44,900)
6.2% (max. $6,324 on max. contributory earnings of $102,000)
Employment Insurance/ Unemployment Tax (employer premiums) d
2.42% (max. $995 on max. insurable earnings of $41,100)
6.2% ($434 on taxable wage limit of $7,000)
Medicare - 1.45% Notes: a) Canada: Federal small business rate is currently being applied to taxable income up to C$400,000. United States: The small business rate is
the effective federal rate on taxable income of US$335,000 approximating the Canadian federal small business threshold. Combined effective rate shows the basic federal and a weighted average state corporate marginal income tax rate.
b) This refundable value-added tax has no net cost once input tax credits (refunds) have been claimed. c) Represents Canada Pension Plan and U.S. Social Security. In Canada, employee and employer contribution rates were 4.95% of the
employee pensionable earnings to a maximum contribution to the plan of $2,049.30. Individuals who earn less than $3,500 annually do not need to contribute to the plan. The tax exempt amount for U.S. Social Security is $13,560 per year.
d) Canada: All rates shown are maximum rates paid by employers at 1.4 times the employee premium and are levied at the federal level only. United States: Employers who pay the state unemployment tax receive an offset credit of up to 5.4% regardless of the rate of tax they pay the state. Therefore, the net FUTA tax rate can be as low as 0.8%, for a maximum federal tax of $56.00 per employee, per year. State law determines individual state unemployment insurance tax rates.
Sources: Internal Revenue Service; PriceWaterhouseCoopers, Tax Facts and Figures 2008; Canada Revenue Agency, Federation of Tax Administrators; U.S. Department of Labour; Organization for Economic Co-operation and Development
14

Research and Development Tax Credits Federal Scientific Research and Experimental Development Program
The Scientific Research and Experimental Development (SR&ED) Program is a federal tax incentive program to encourage Canadian businesses of all sizes and in all sectors to conduct research and development (R&D) in Canada. The SR&ED Program is the largest single source of federal government support for industrial research and development.
Generally, a Canadian-controlled private corporation (CCPC) can earn an investment tax credit (ITC) of 35% up to the first $2 million of qualified expenditures for SR&ED carried out in Canada, and 20% on any excess amount. Other Canadian corporations, proprietorships, partnerships, and trusts can earn an ITC of 20% of qualified expenditures for SR&ED carried out in Canada.
Normally, a CCPC with a taxable income in the immediately preceding year that does not exceed the business limit may receive a portion of the ITC earned as a refund, after applying these tax credits against taxes payable. The ITC earned by a Canadian corporation that is not a CCPC is non-refundable, but may be used to reduce any taxes payable. The ITC earned by a proprietorship or certain trusts may be partially refunded after applying these tax credits against taxes payable.
To qualify for the SR&ED Program, work must advance the understanding of scientific relations or technologies, address scientific or technological uncertainty, and incorporate a systematic investigation by qualified personnel.
Work that qualifies for SR&ED tax credits includes: o experimental development to achieve technological advancement through the creation of
new materials, devices, products, or processes, or to improve existing ones; o applied research to advance scientific knowledge with a specific practical application in
view; o basic research to advance scientific knowledge without a specific practical application in
view; and o support work in engineering, design, operations research, mathematical analysis,
computer programming, data collection, testing, or psychological research, but only if the work is commensurate with, and directly supports the eligible experimental development of applied or basic research.
Alberta Scientific Research and Experimental Development Program The Alberta Scientific Research and Experimental Development (SR&ED) tax credit is a key action in the provincial strategy to build a next generation economy in Alberta through technological innovation and the development of value-added sectors. It benefits businesses conducting research and development that will lead to new, improved or technologically advanced products or processes. The Alberta SR&ED tax credit is over and above the federal SR&ED credit, helping to further the research and development investments made by Alberta companies. The credit is for all
15

expenditures incurred after December 31, 2008 that are also eligible for the federal credit. The Alberta SR&ED tax credit is worth 10% of a company's eligible expenditures up to $4 million, for a maximum credit of $400,000. It will be refundable for all companies. Municipal Taxation In Alberta, the assessment of residential property for the purposes of municipal and education taxation is based on market value as set out in the Municipal Government Act and Regulations. There are two levies against assessable property in the province: the Municipal Levy, used to fund municipal services, and the Alberta Education Levy, collected on behalf of the provincial government to help fund education. All business occupants in the cities of Calgary and Edmonton are assessed for business taxation. Business tax is calculated based on the assessed value of the space occupied by the business, multiplied by the annual tax rate as set by each city council. In 2009, the business tax rates for Calgary and Edmonton are 6.54% and 6.89%, respectively.
16
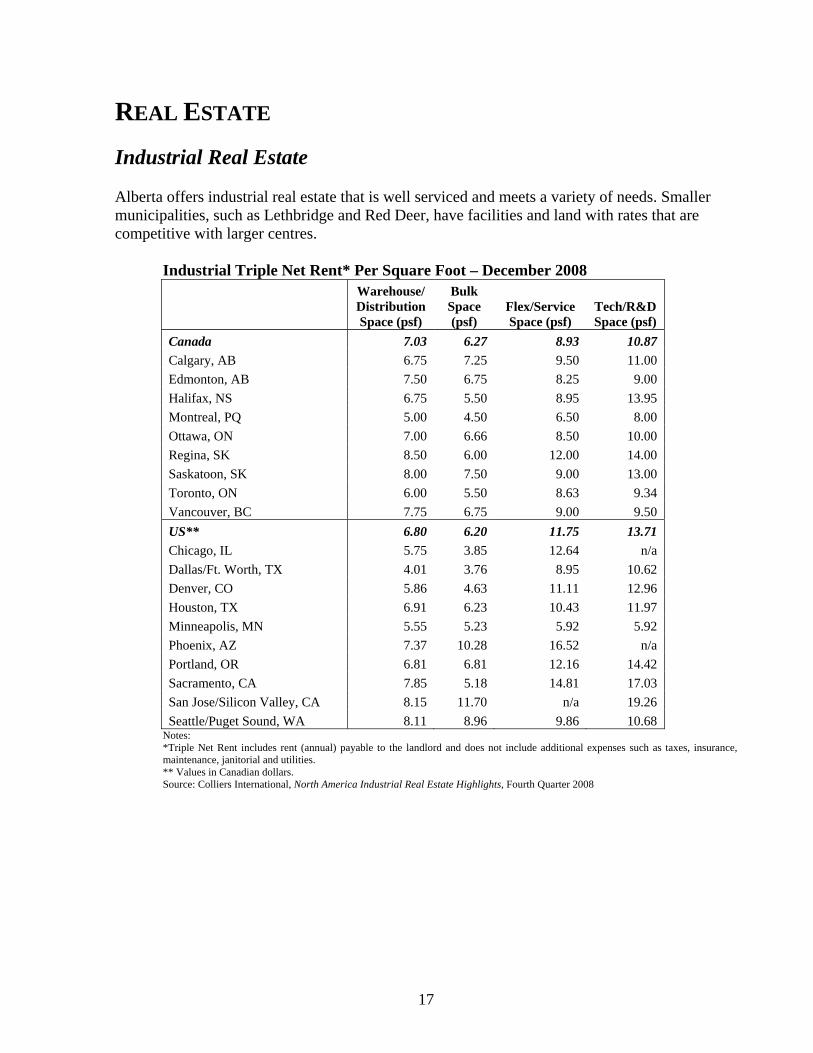
REAL ESTATE Industrial Real Estate Alberta offers industrial real estate that is well serviced and meets a variety of needs. Smaller municipalities, such as Lethbridge and Red Deer, have facilities and land with rates that are competitive with larger centres.
Industrial Triple Net Rent* Per Square Foot – December 2008
Warehouse/Distribution Space (psf)
Bulk Space (psf)
Flex/Service Space (psf)
Tech/R&D Space (psf)
Canada 7.03 6.27 8.93 10.87 Calgary, AB 6.75 7.25 9.50 11.00 Edmonton, AB 7.50 6.75 8.25 9.00 Halifax, NS 6.75 5.50 8.95 13.95 Montreal, PQ 5.00 4.50 6.50 8.00 Ottawa, ON 7.00 6.66 8.50 10.00 Regina, SK 8.50 6.00 12.00 14.00 Saskatoon, SK 8.00 7.50 9.00 13.00 Toronto, ON 6.00 5.50 8.63 9.34 Vancouver, BC 7.75 6.75 9.00 9.50 US** 6.80 6.20 11.75 13.71 Chicago, IL 5.75 3.85 12.64 n/a Dallas/Ft. Worth, TX 4.01 3.76 8.95 10.62 Denver, CO 5.86 4.63 11.11 12.96 Houston, TX 6.91 6.23 10.43 11.97 Minneapolis, MN 5.55 5.23 5.92 5.92 Phoenix, AZ 7.37 10.28 16.52 n/a Portland, OR 6.81 6.81 12.16 14.42 Sacramento, CA 7.85 5.18 14.81 17.03 San Jose/Silicon Valley, CA 8.15 11.70 n/a 19.26 Seattle/Puget Sound, WA 8.11 8.96 9.86 10.68
Notes: *Triple Net Rent includes rent (annual) payable to the landlord and does not include additional expenses such as taxes, insurance, maintenance, janitorial and utilities. ** Values in Canadian dollars. Source: Colliers International, North America Industrial Real Estate Highlights, Fourth Quarter 2008
17

Technology/R&D Space – Triple Net Rent* Per Square Foot** – December 2008
$5.92
$8.00
$9.00
$9.34
$9.50
$10.00
$10.62
$10.68
$10.87
$11.00
$11.97
$12.96
$13.00
$13.71
$13.95
$14.00
$14.42
$17.03
$19.26
Minneapolis, MN
Montréal, PQ
Edmonton, AB
Toronto, ON
Vancouver, BC
Ottawa, ON
Dallas/Ft. Worth, TX
Seattle/Puget Sound, WA
Canada
Calgary, AB
Houston, TX
Denver, CO
Saskatoon, SK
US
Halifax, NS
Regina, SK
Portland, OR
Sacramento, CA
San Jose/Silicon Valley, CA
Notes: *Triple Net Rent includes rent (annual) payable to the landlord and does not include additional expenses such as taxes, insurance, maintenance, janitorial and utilities. ** Values in Canadian dollars. Source: Colliers International, North America Industrial Real Estate Highlights, Fourth Quarter 2008
18

Commercial Real Estate Calgary is home to the highest concentration of corporate head office employment and the highest number of head offices per capita in Canada. Edmonton, the capital of Alberta, is the location of most of the provincial and federal government offices.
Head Office Employment per Capita (000’s) – 2008
3.7
4.1
5.2
9.2
9.7
10.7
16.0
Edmonton
Ottawa-Gatineau
Vancouver
Winnipeg
Montréal
Toronto
Calgary
Source: Statistics Canada, Business Register, Head Office Employment in Canada, 2008
Although high demand for corporate office space drove up rent in Calgary, both Calgary and Edmonton Class “A” rates were competitive when compared to other major metropolitan areas in North America in 2008.
Downtown Class ‘A’ Office Space, Average Annual Quoted Rent Per Square Foot, 2008 $27.60
$30.60
$33.00
$44.00
$45.50
$47.00
$48.93
$50.50
$55.50
$57.80
Montréal, PQ
Halifax, NS
Regina, SK
Vancouver, BC
Edmonton, AB
Canada*
US**
Ottawa, ON
Calgary, AB
Toronto, ON
Notes: * weighted average ** weighted average in Canadian dollars Source: Colliers International, North America Office Real Estate Highlights, Fourth Quarter 2008
19

Residential Housing RBC Financial Group’s housing affordability index measures the proportion of median pre-tax household income required to service the cost of mortgage payments, property taxes and utilities for a home. As of the third quarter of 2008, Alberta homes had increased in affordability relative to 2007. While they continue to remain more affordable than the national average, Alberta housing prices are still above long-term averages. Affordability rates in Edmonton and Calgary are comparable to rates in other large metropolitan areas in Canada. Housing affordability is expected to improve in 2009.
Home Ownership: Provincial Affordability Comparisons Percentage of household income taken up by ownership costs (A lower affordability index value indicates increased affordability)
Detached Bungalow
Standard Two-Storey
Standard Townhouse
Standard Condominium
Canada* 45.7 52.0 36.9 31.4 British Columbia 69.7 77.7 53.8 38.7 Alberta 43.0 46.4 32.1 28.2 Saskatchewan 47.7 50.1 39.1 32.5 Manitoba 39.5 42.6 25.8 23.0 Ontario 44.1 50.7 36.5 30.9 Quebec 35.3 42.5 30.2 29.5 Atlantic Canada 35.4 41.2 30.3 27.6
*Population weighted average Source: RBC Financial Group, Housing Trends and Affordability, Third Quarter 2008, December 2008
20
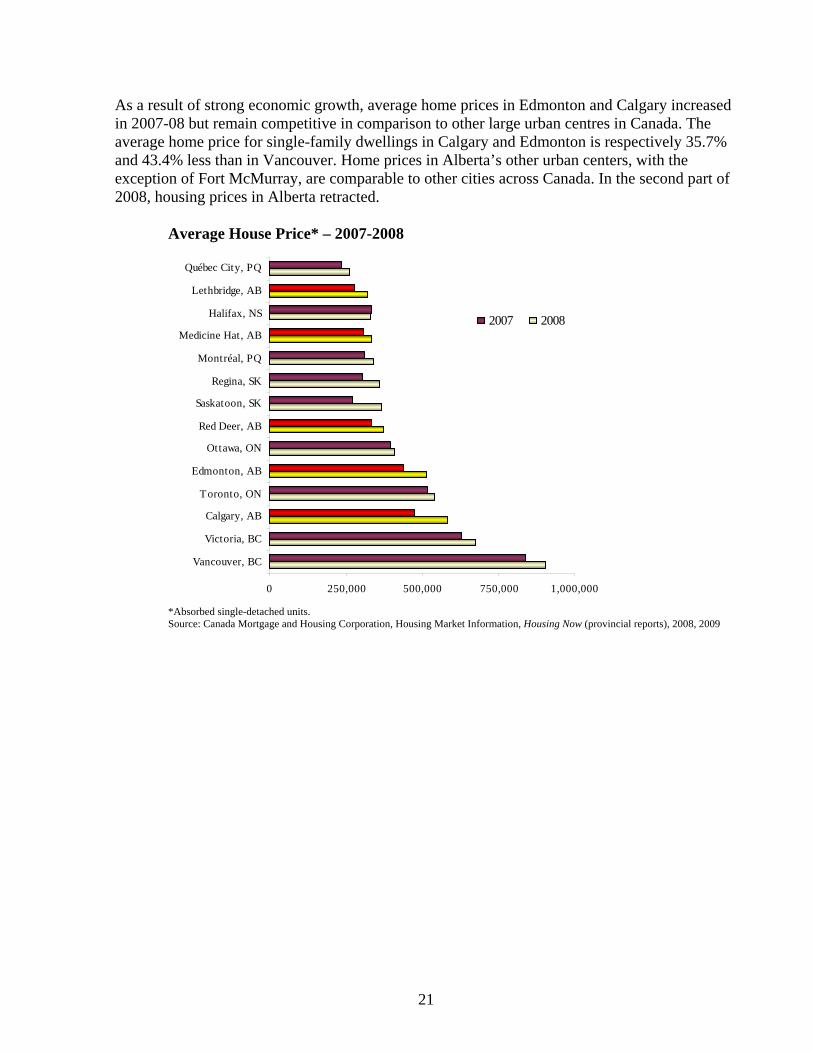
As a result of strong economic growth, average home prices in Edmonton and Calgary increased in 2007-08 but remain competitive in comparison to other large urban centres in Canada. The average home price for single-family dwellings in Calgary and Edmonton is respectively 35.7% and 43.4% less than in Vancouver. Home prices in Alberta’s other urban centers, with the exception of Fort McMurray, are comparable to other cities across Canada. In the second part of 2008, housing prices in Alberta retracted.
Average House Price* – 2007-2008
0 250,000 500,000 750,000 1,000,000
Québec City, PQ
Lethbridge, AB
Halifax, NS
Medicine Hat, AB
Montréal, PQ
Regina, SK
Saskatoon, SK
Red Deer, AB
Ottawa, ON
Edmonton, AB
Toronto, ON
Calgary, AB
Victoria, BC
Vancouver, BC
2007 2008
*Absorbed single-detached units. Source: Canada Mortgage and Housing Corporation, Housing Market Information, Housing Now (provincial reports), 2008, 2009
21

LABOUR FORCE Employment In 2008, Alberta had the highest labour force participation rate among the provinces at 74.7%, higher the national average of 67.8%. At the same time, Alberta also had the highest employment rate at 72.0% and the lowest unemployment rate at 3.6% among all provinces.
Employment Rates – 2008
72.0%
66.8%
66.7%
63.6%
63.6%
63.5%
61.3%
60.9%
59.3%
59.0%
51.7%
Alberta
Saskatchewan
Manitoba
Canada
Ontario
British Columbia
Prince Edward Island
Quebec
New Brunswick
Nova Scotia
Newfoundland and Labrador
Source: Statistics Canada, Labour Force Historical Review 2008
Unemployment Rates – 2008
13.2%
10.8%
8.6%
7.7%
7.2%
6.5%
6.1%
4.6%
4.2%
4.1%
3.6%
Newfoundland and Labrador
Prince Edward Island
New Brunswick
Nova Scotia
Quebec
Ontario
Canada
British Columbia
Manitoba
Saskatchewan
Alberta
Source: Statistics Canada, Labour Force Historical Review 2008
22

Between 2007 and 2008, the number of people employed in Alberta grew by 2.8% or by 53,900. The previous decade has seen the number of people employed in the province of Alberta grow by 503,400.
Employment by Industry - 2008
Sector '000 Agriculture 61.0 Forestry, fishing, mining, oil and gas 149.2 Utilities 17.5 Construction 205.3 Manufacturing 144.1 Trade 317.0 Transportation and warehousing 102.2 Fin., insurance, real estate and leasing 111.7 Professional, scientific and tech. services 164.2 Business, bld. & other support services 63.9 Educational services 126.8 Health care and social assistance 190.2 Information, culture and recreation 71.6 Accommodation and food services 113.9 Other services 91.2 Public administration 83.4 All industries 2013.3
Source: Statistics Canada, Labour Force Historical Review 2008
Employment by Occupation - 2008 Occupation '000
Management occupations 165.4 Business, finance and administrative 372.7 occupations Natural and applied sciences and 153.6 related occupations Health occupations 103.3 Occupations in social science, education, 149.5 government service and religion Occupations in art, culture, recreation 45.8 and sport Sales and service occupations 456.4 Trades, transport and equipment 379.6 operators and related occupations Occupations unique to primary industry 121.5 Occupations unique to processing, 65.6 manufacturing and utilities All occupations 2013.3
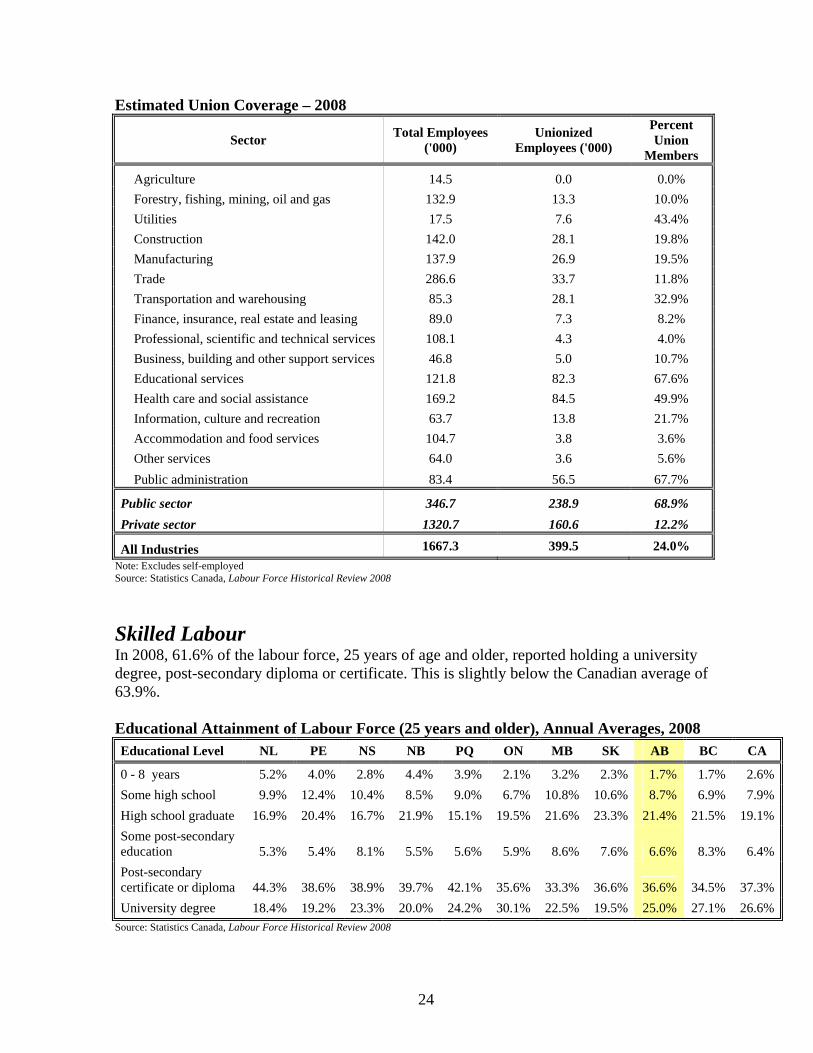
Alberta's overall unionization is estimated at 24%, which is the lowest in Canada. The highest rates of unionization are in the public sector (public administration, education, health and utilities). The unionization rate in the private sector is 12.2%.
According to Human Resources and Skills Development Canada, the estimated number of person-days lost to labour disputes in Alberta in 2008 averaged 10.7 days per 1,000 paid workers (excludes self employed), compared to 60.6 days per 1,000 paid workers nationally.
23
Estimated Union Coverage – 2008
Sector Total Employees ('000)
Unionized Employees ('000)
Percent Union
Members
Agriculture 14.5 0.0 0.0% Forestry, fishing, mining, oil and gas 132.9 13.3 10.0% Utilities 17.5 7.6 43.4% Construction 142.0 28.1 19.8% Manufacturing 137.9 26.9 19.5% Trade 286.6 33.7 11.8% Transportation and warehousing 85.3 28.1 32.9% Finance, insurance, real estate and leasing 89.0 7.3 8.2% Professional, scientific and technical services 108.1 4.3 4.0% Business, building and other support services 46.8 5.0 10.7% Educational services 121.8 82.3 67.6% Health care and social assistance 169.2 84.5 49.9% Information, culture and recreation 63.7 13.8 21.7% Accommodation and food services 104.7 3.8 3.6% Other services 64.0 3.6 5.6% Public administration 83.4 56.5 67.7%
Public sector 346.7 238.9 68.9% Private sector 1320.7 160.6 12.2%
All Industries 1667.3 399.5 24.0% Note: Excludes self-employed Source: Statistics Canada, Labour Force Historical Review 2008 Skilled Labour In 2008, 61.6% of the labour force, 25 years of age and older, reported holding a university degree, post-secondary diploma or certificate. This is slightly below the Canadian average of 63.9%. Educational Attainment of Labour Force (25 years and older), Annual Averages, 2008 Educational Level NL PE NS NB PQ ON MB SK AB BC CA
0 - 8 years 5.2% 4.0% 2.8% 4.4% 3.9% 2.1% 3.2% 2.3% 1.7% 1.7% 2.6%Some high school 9.9% 12.4% 10.4% 8.5% 9.0% 6.7% 10.8% 10.6% 8.7% 6.9% 7.9%High school graduate 16.9% 20.4% 16.7% 21.9% 15.1% 19.5% 21.6% 23.3% 21.4% 21.5% 19.1%Some post-secondary education 5.3% 5.4% 8.1% 5.5% 5.6% 5.9% 8.6% 7.6% 6.6% 8.3% 6.4%Post-secondary certificate or diploma 44.3% 38.6% 38.9% 39.7% 42.1% 35.6% 33.3% 36.6% 36.6% 34.5% 37.3%University degree 18.4% 19.2% 23.3% 20.0% 24.2% 30.1% 22.5% 19.5% 25.0% 27.1% 26.6%
Source: Statistics Canada, Labour Force Historical Review 2008
24

Wages and Salaries Alberta wage and salary rates are competitive with the rest of Canada. Relative to the U.S., Alberta and the rest of Canada provide a cost advantage because of publicly funded heath care. General Minimum Wage Rate – 2008
BC AB SK MB ON PQ NB NS PEI NL$8.00 $8.40 1 $8.60 2 8.50 3 $8.75 4 8.50 5 7.75 6 $8.10 7 $8.00 $8.50 8
Notes: 1. Increases to $8.80 as of April 1, 2009 2. Increases to $9.25 as of May 1, 2009 3. Increases to $8.75 as of May 1, 2009 4. Increases to $9.50 as of March 31, 2009 5. Increases to $9.00 as of May 1, 2009 6. Increases to $8.00 as of April 15, 2009 7. Increases to $8.60 as of April 1, 2009 8. Increases to $9.00 as of July 1, 2009 Source: Alberta Employment and Immigration, 2008 The 2007 Alberta Wage and Salary Survey examined more than 200,000 full-time and part-time employees and covers over 400 occupations. It can be used to find information on wages and salaries for full-time and part-time employees in Alberta by occupation, geographic area and industry group. The complete survey can be found online at www.alis.gov.ab.ca. 2007 Alberta Wage and Salary Survey – Select Occupation by Industry
Average Hourly WageThree Years Experience
Accommodation and Food Services Industry (Including Tourism)Cooks $13.81Food and Beverage Servers $9.01
Agriculture IndustryGeneral Farm Workers $17.14Labourers in Food, Beverage and Tobacco Processing $14.16
Business, Building, and Other Support Services IndustryReceptionists and Switchboard Operators $15.73Residential and Commercial Installers and Servicers $24.03
Construction IndustryElectricians (Except Industrial and Power System) $23.02Plumbers $21.76Construction Trades Helpers and Labourers $17.65
Educational Services IndustrySecondary School Teachers $30.95Elementary School and Kindergarten Teachers $29.92
Finance, Insurance, Real Estate and Leasing IndustryFinancial Auditors and Accountants $23.75Insurance Agents and Brokers $23.20
Customer Service Representatives - Financial Services $17.20
Occupation by Industry
… Continued
25

Average Hourly WageThree Years Experience
Health Care and Social Assistance IndustryPharmacists $39.92Registered Nurses (Nurse Practitioner) $31.78Physiotherapists $25.03
Manufacturing IndustryIndustrial and Manufacturing Engineers $31.19
Mining and Oil and Gas Extraction IndustryWelders and Related Machine Operators $25.32Heavy Equipment Operators (Except Crane) $25.10Steamfitters and Pipefitters $30.44Oil and Gas Well Drilling Workers and Services Operators $29.46
Other Services (Repair, Personal and Related) IndustryAutomotive Service Technicians $23.15Baby Sitters, Nannies and Parent Helpers $15.81
Professional, Scientific and Technical Services IndustryMechanical Engineers $34.29Computer Programmers $24.78Civil Engineering Technologists and Technicians $26.52Computer and Network Operators $27.73Lawyers and Quebec Notaries $39.13
Public Administration IndustrySocial Workers $27.98
Retail Trade IndustryRetail Salespersons and Sales Clerks $14.96Cashiers $11.15
Transportation and Warehousing IndustryShippers and Receivers $17.08Truck Drivers $24.41
Wholesale Trade IndustryTechnical Sales Specialists $27.07
Purchasing and Inventory Clerks $20.10
Occupation by Industry
Source: Alberta Employment and Immigration
The Alberta Workers’ Compensation Board (WCB) has taken major steps over the past several years to improve operations and reduce accident claims. Although unchanged from 2008, Alberta’s 2009 average premium rate of $1.32 per $100 of insurable earnings remains the lowest in Canada, still considerably lower than the next lowest rate of British Columbia, where the average premium charged is $1.56.
Workers Compensation Board Premiums – 2009 Assessment Rates* Per $100 Payroll
BC AB SK MB ON PQ NB NS PE NL $1.56 $1.32 $1.66 $1.60 $2.26 $2.10 $2.03 $2.65 $2.16 $2.75
*Provisional rates. Source: Association of Workers’ Compensation Boards of Canada
26

Employment Standards
The majority of employees in the province are covered by the Alberta Employment Standards Code, which establishes minimum employment standards for employers and employees. The code stipulates minimum standards in areas such as:
1. Hours of work, payment of earnings and overtime pay o In general, the maximum workday is 12 hours long. o An employer must allow employees at least one day of rest each week. Employees cannot
be required to work more than 24 consecutive days unless the period is followed by at least four consecutive days of rest.
o Employees must be paid at least once a month and no later than 10 consecutive days after the end of each pay period.
o Time over eight hours in a day and/or 44 hours in a week is considered overtime. Overtime is paid at 1.5 times the regular wage. Employers and employees may enter into a written overtime agreement. With the agreement, instead of overtime pay, employees receive time off with regular pay equal to the number of overtime hours worked.
2. Vacation and vacation pay o Entitlement to two weeks after 12 months of employment. o Entitlement to three weeks after five years of employment.
3. Minimum wage rate o $8.80 per hour, effective April 1, 2009. Any changes in minimum wage occur on April 1. Usually, the minimum wage increases when the average weekly wage goes up.
4. General holidays o In Alberta, the following are statutory holidays: New Year's Day; Alberta Family Day;
Good Friday; Victoria Day; Canada Day; Labour Day; Thanksgiving Day; Remembrance Day; Christmas Day; and any other day designated as a general holiday by an employer.
5. Minimum termination notice requirements that employers must give o one week – for employment of more than three months, but less than two years o two weeks – for employment of two years, but less than four years o four weeks – for employment of four years, but less than six years o five weeks – for employment of six years, but less than eight years o six weeks – for employment of eight years, but less than 10 years o eight weeks – for employment of 10 years or more o or the wages the employee would have earned for the applicable period of notice
6. Parental benefits o A birth mother will be able to take up to 52 weeks of unpaid, job-protected leave from
employment made up of 15 weeks maternity leave and 37 weeks of parental leave. o Fathers and/or adoptive parents are also eligible for 37 weeks of unpaid, job-protected
parental leave. Adoptive parents can take parental leave regardless of the age of the adopted child.
o Parental leave may be taken entirely by one of the parents or can be shared between both parents, but the total cannot exceed 37 weeks.
27

April 27, 2007
INVENTORY OF MAJOR ALBERTA PROJECTS As of January 2009, the value of Alberta’s major construction projects totalled $259.7 billion. The Wood Buffalo-Cold Lake region accounted for 31.6%, followed by the Edmonton region at 28% and the Calgary region at 13.1%. The oil sands and infrastructure sectors represent the largest share of investments.
Alberta Major Construction Projects* – January 2009 Region Investment ($ 000,000)
1) Wood Buffalo - Cold Lake 81,932.8
2) Athabasca - Grande Prarie 11,738.0
3) Edmonton Region 72,837.2
4) Red Deer Region 2,986.3
5) Banff - Jasper 6,636.1
6) Calgary Region 33,949.5
7) Camrose - Drumheller 5,501.0
8) Lethbridge - Medicine Hat 4,256.8
9) Other** 39,837.7
Total 259,675.0 Notes: * Includes projects valued at $5 million or greater that are planned, underway, or have been
recently completed. A number of these projects have been deferred because of the financial crisis and low crude oil prices. It is expected that the projects will proceed when global economic conditions improve.
** Includes projects that cannot be allocated to a specific region, e.g., pipelines, highways, etc. Source: Alberta Finance and Enterprise, Inventory of Major Alberta Projects, January 2009
Alberta Major Construction Projects Total $259.7 billion – January 2009
1) Wood Buffalo - Cold Lake
31.6%
2) Athabasca - Grande Prarie4.5%
3) Edmonton Region28.0%
6) Calgary Region13.1%
9) Other**15.3%
8) Lethbridge - Medicine Hat
1.6%
7) Camrose - Drumheller
2.1%
5) Banff - Jasper2.6%
4) Red Deer Region1.2%
28

TRANSPORTATION Alberta's transportation infrastructure plays a critical role in the province's economy. The province’s strength as a major exporter of primary commodities and manufactured products to the global marketplace is supported by a highly efficient and competitive transportation and logistics system. Alberta has emerged as the western North America warehouse and distribution hub for Canada and the Pacific Northwest region of the United States. Alberta enjoys direct access to the Western Canada market of over nine million and to a total market of more than 120 million within a 1,800 km radius of the Alberta border. With direct connections to two of North America's largest highway trade corridors (CANAMEX, Trans-Canada), quick and efficient access to the southern U.S. and Mexican markets is available.
EdmontonCalgary
Denver
Toronto
New York
LosAngeles
Vancouver
Dallas
Distances to Major Markets (kilometres)
Canada Edmonton Calgary
Montreal 3,551 3,582 Regina 780 758 Saskatoon 523 610 Toronto 3,356 3,387 Vancouver 1,189 957 Winnipeg 1,295 1,326
United States Edmonton Calgary Chicago 2,610 2,553 Dallas 3,175 2,991 Denver 2,045 1,765 Detroit 3,035 2,978 Los Angeles 2,745 2,460 Minneapolis 2,228 1,920 Portland 1,521 1,252
San Francisco 2,380 2,111
Seattle 1,298 1,067
Source: Household Goods Carrier’s Bureau - Mileage Guide
Railways Two transcontinental railway companies, Canadian National (CN) and Canadian Pacific Railway (CPR), service Alberta. Both companies provide highly efficient and competitive service in the movement of export commodities such as petrochemicals, forest products, grain, coal, fertilizers and sulphur to major ports, and throughout the U.S. and Mexico. A modern network of intermodal terminals is strategically located at Vancouver, Prince Rupert, Prince George, Calgary, Edmonton, Regina, Saskatoon,
29

Winnipeg, Thunder Bay, Dryden, Toronto, Mississauga, Brampton, Montreal, Moncton and Halifax for movement of containerized cargo to the United States and international markets.
Highways
Alberta has more than 30,800 km of provincial highways that form an extensive network throughout the province. More than 27,000 km are paved and 3,800 km are gravelled. Alberta’s provincial highway network connects Alberta to the North American highway system and provincial highways in the province have good pavement conditions.
Alberta is enhancing its section of the Canada, America and Mexico (CANAMEX) corridor, which links the three countries and stretches about 6,000 km from Anchorage, Alaska to Mexico City, Mexico. The goals of the CANAMEX corridor are to improve access for the north-south flow of goods and people; increase transport productivity and reduce transport costs; promote a seamless and efficient inter-modal transport system; and reduce administration and enforcement costs through harmonized regulations.
Air Service
Alberta has a network of 85 international, regional, and paved community airports. The province is home to several air taxi, commuter, airline and special flight operations. Alberta also has ambulance, forest fire suppression, agriculture crop spraying, aerial mapping and remote sensing, corporate aviation, recreational flying and flying education services.
Two world-class international airports, located in Calgary and Edmonton, service Alberta. These airports have 24-hour cargo services, modern cargo terminals and U.S. pre-clearance facilities. They are used by major international airlines and provide direct passenger and cargo services to many North American and international destinations. They are also the major gateways to northern Canada.
Calgary International Airport, which serves as the hub for air traffic in the prairies, has the largest civil aviation runway in Canada measuring 3,863 metres. It is Canada’s third-busiest airport by passenger volume, handling 12.5 million passengers in 2008. Calgary International Airport’s passenger growth over the past five years is up 55%. Calgary International Airport is the only Canadian airport strategically located on the crossroads of the TransCanada (east-west) and CANAMEX (north-south) Highways.
The Edmonton International Airport is Canada's most northerly 24-hour international airport. It is Canada's fifth busiest airport with annual passenger movement of more than 6.4 million in 2008. It is the only Canadian airport to report growth in every month of 2008. The Edmonton International Airport is the second-largest airport in Canada measured by landmass, comprising an area of over 7,000 acres. Strategically located, Edmonton International Airport is conveniently situated adjacent to the major highway linking Edmonton and Calgary.
30
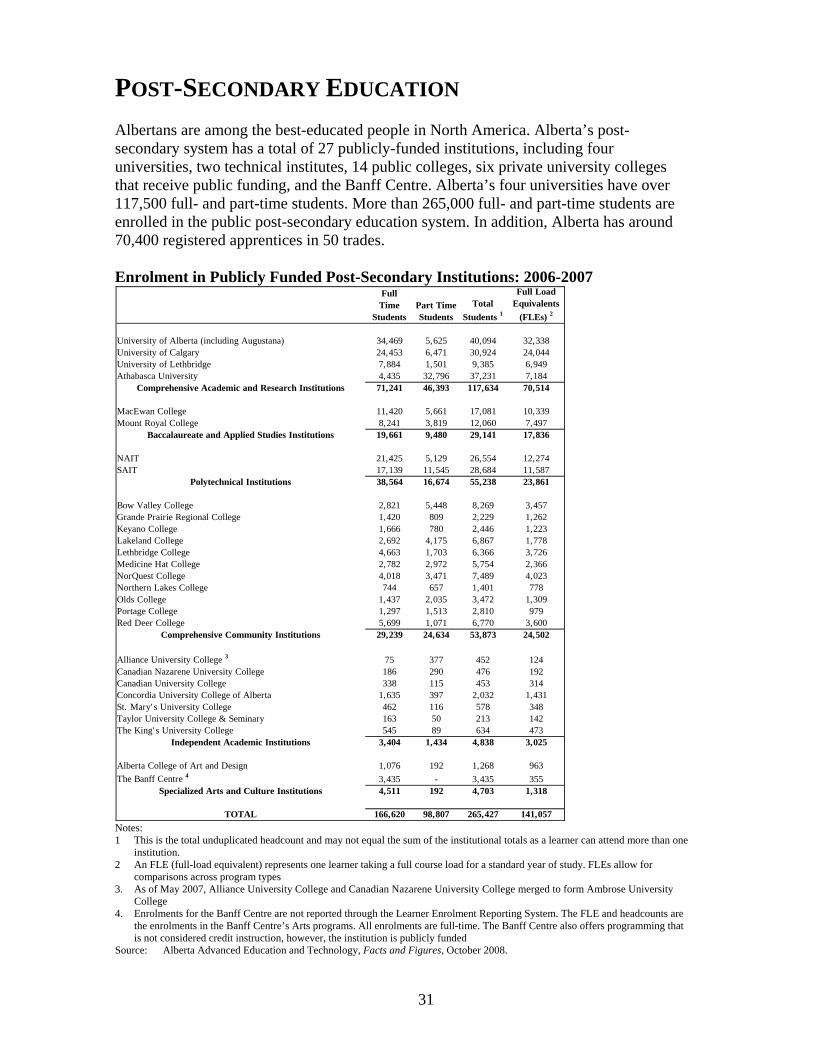
POST-SECONDARY EDUCATION Albertans are among the best-educated people in North America. Alberta’s post-secondary system has a total of 27 publicly-funded institutions, including four universities, two technical institutes, 14 public colleges, six private university colleges that receive public funding, and the Banff Centre. Alberta’s four universities have over 117,500 full- and part-time students. More than 265,000 full- and part-time students are enrolled in the public post-secondary education system. In addition, Alberta has around 70,400 registered apprentices in 50 trades. Enrolment in Publicly Funded Post-Secondary Institutions: 2006-2007
Full Time
StudentsPart Time Students
Total Students 1
Full Load Equivalents
(FLEs) 2
University of Alberta (including Augustana) 34,469 5,625 40,094 32,338University of Calgary 24,453 6,471 30,924 24,044University of Lethbridge 7,884 1,501 9,385 6,949Athabasca University 4,435 32,796 37,231 7,184
Comprehensive Academic and Research Institutions 71,241 46,393 117,634 70,514
MacEwan College 11,420 5,661 17,081 10,339Mount Royal College 8,241 3,819 12,060 7,497
Baccalaureate and Applied Studies Institutions 19,661 9,480 29,141 17,836
NAIT 21,425 5,129 26,554 12,274SAIT 17,139 11,545 28,684 11,587
Polytechnical Institutions 38,564 16,674 55,238 23,861
Bow Valley College 2,821 5,448 8,269 3,457Grande Prairie Regional College 1,420 809 2,229 1,262Keyano College 1,666 780 2,446 1,223Lakeland College 2,692 4,175 6,867 1,778Lethbridge College 4,663 1,703 6,366 3,726Medicine Hat College 2,782 2,972 5,754 2,366NorQuest College 4,018 3,471 7,489 4,023Northern Lakes College 744 657 1,401 778Olds College 1,437 2,035 3,472 1,309Portage College 1,297 1,513 2,810 979Red Deer College 5,699 1,071 6,770 3,600
Comprehensive Community Institutions 29,239 24,634 53,873 24,502
Alliance University College 3 75 377 452 124Canadian Nazarene University College 186 290 476 192Canadian University College 338 115 453 314Concordia University College of Alberta 1,635 397 2,032 1,431St. Mary' s University College 462 116 578 348Taylor University College & Seminary 163 50 213 142The King' s University College 545 89 634 473
Independent Academic Institutions 3,404 1,434 4,838 3,025
Alberta College of Art and Design 1,076 192 1,268 963The Banff Centre 4 3,435 - 3,435 355
Specialized Arts and Culture Institutions 4,511 192 4,703 1,318
TOTAL 166,620 98,807 265,427 141,057 Notes: 1 This is the total unduplicated headcount and may not equal the sum of the institutional totals as a learner can attend more than one
institution. 2 An FLE (full-load equivalent) represents one learner taking a full course load for a standard year of study. FLEs allow for
comparisons across program types 3. As of May 2007, Alliance University College and Canadian Nazarene University College merged to form Ambrose University
College 4. Enrolments for the Banff Centre are not reported through the Learner Enrolment Reporting System. The FLE and headcounts are
the enrolments in the Banff Centre’s Arts programs. All enrolments are full-time. The Banff Centre also offers programming that is not considered credit instruction, however, the institution is publicly funded
Source: Alberta Advanced Education and Technology, Facts and Figures, October 2008.
31

Alberta Universities and Technical Institutes
Founded in 1908, the University of Alberta (U of A) has grown to become one of Canada’s foremost research-intensive universities. It is Canada’s second-largest English-speaking university, serving in excess of 37,000 students in more than 200 undergraduate and 170 graduate programs. The U of A also offers liberal arts education at the Augustana Campus in Camrose. The U of A is the largest research institution in the province and ranks among the top Canadian universities in annual sponsored research funding. In 2007/08, the U of A generated more than $490 million in research revenue (including clinical trials and related research). Because of its focus on research, in 2006/07, the U of A ranked among the top five Canadian universities for total annual sponsored research funding from the three federal government granting councils: the Canadian Institute for Health Research, the Natural Sciences and Engineering Research Council, and the Social Science and Humanities Research Council. The same year, the university ranked second of G13 universities by total sponsored research revenue. U of A researchers participate actively in 21 of 24 (2007/08) federal Networks of Centres of Excellence that link industry, universities, and the government in applied research and development. Full-Time Equivalent Enrolment* By Faculty, 2007-2008
Agriculture/Forestry/Home Economics 1,402Arts 6,141Augustana 888Business 2,287Education 3,583Engineering 4,088Law 520Medicine and Dentistry 1,774Native Studies 142Nursing 1,745Open Studies 627Physical Education and Recreation 994Pharmacy and Pharmaceutical Sciences 580Rehabilitation Medicine 115Faculté Saint-Jean 618Science 6,301
Undergraduate Studies total 31,805Graduate Studies total 5,971Total 37,775 *The full-year FTE enrolment count uses Fall and Spring/Summer seasonal headcounts. Part-time graduate student counts are divided by 3, part-time undergraduate counts by 4. Each fall full-time student is counted as 1.0. Source: University of Alberta, University of Alberta Data Book, 6May 2008
Between 1994 and March 2008, the U of A:
o recorded more than 1,267 invention reports;
o received more than 393 patents; o issued more than 308 licenses/
options to use technologies; o generated licensing and royalty
revenue of about $31 million; and
o ‘spun-off’ 71 active companies, employing more than 1,100 people.
For Further Information: Office of Public Affairs 6th Floor, General Services Building University of Alberta, Edmonton, Alberta Canada T6G 2H1 Phone: (780) 492-2325 Website: www.ualberta.ca
32

The University of Calgary (U of C), founded in 1945, is home to scholars in 17 faculties (offering more than 100 academic programs) and 30 research institutes and centres, 4,000 academic and support staff, and more than 23,800 full-time undergraduate and graduate students.
U of C has established a reputation as one of Canada’s top research institutions with sponsored research funding revenues of $254 million in 2006/07. In 2006, the U of C was welcomed into the G13 group of Canada’s leading research universities with research funding ranking among the top ten. The university belongs to 20 out of the 24 Networks of Centres of Excellence (2006/07), an innovative national approach to research and development designed to develop Canada’s economy and improve the Canadian quality of life. About 80 chairs and professorships in such areas as American studies, schizophrenia, project management, cancer, and intelligent manufacturing attract renowned scholars and leading researchers to the U of C. Government and industry jointly support more than 45 endowed chairs at the university. Full-Time Students by Faculty 2007-2008
Collaborative Degree 172 Combined Degree students* 683 Communication & Culture 1,437 Education 816 Fine Arts 403 Haskayne School of Business 2,257 Humanities 1,024 Kinesiology 569 Law 247 Medicine 1,307 Open Studies 542 Nursing 730 Schulich School of Engineering 2,640 Science 3,529 Social Sciences 2,947 Social Work 341
Undergraduate Studies total 19,644 Graduate Studies total 4,167 Total 23,811 *Combined degree students are registered in degree programs in two or more faculties. Source: University of Calgary, Fact Book 2007-2008, December 2008
The U of C is a leader in collaborative research relationships and partnerships with academia, government, private and non-profit organizations. − Companies spun-off from research and
innovation at the university are valued at more than half a billion dollars.
− The U of C is among the top four universities in Canada in revenue generated from licensing activity.
For Further Information: Communications Office Administration 113 University of Calgary 2500 University Drive NW Calgary, Alberta, Canada T2N 1N4 Phone: (403) 220- 2920 Website: www.ucalgary.ca
33

The University of Lethbridge (U of L) offers full degree programs in arts and science, education, health sciences, fine arts, and management to approximately 7,000 full-time equivalent students. The U of L has a focus on liberal arts, selected professional programs, smaller classes, co-op placements, and involvement of students in faculty research. There are five faculties and schools at the U of L offering over 150 undergraduate program options. Many courses are also offered on U of L campuses in Edmonton and Calgary. The U of L is one of the few Canadian universities committed to a liberal arts undergraduate education. The Centre for the Arts at the U of L was designed to bring together the teaching faculties of art, music and theatre/drama, and to provide teaching spaces tailored to their specific needs. Additional Information:
The University of Lethbridge 4401 University Drive Lethbridge, Alberta T1K 3M4 Phone: (403) 320-5700 Website: www.uleth.ca
Athabasca University (AU) is Canada's leading distance-education and online university. In 2006/07 AU served more than 37,000 students. Approximately 265,000 students have registered in AU's individualized courses and programs since the university was created by the Government of Alberta in 1970. AU offers full bachelor degree programs and university transfer courses in the natural and pure sciences, humanities, social sciences, interdisciplinary studies, administrative studies, commerce, nursing and allied professional fields. At the graduate level, the university offers degree programs in distance education, health studies, and business administration. AU’s programs are predominantly available through individualized study. Course materials are designed specifically for distance and online learners. Additional Information:
Athabasca University 1 University Drive Athabasca, Alberta T9S 3A3 Phone: 1-800-788-9041 Website: www.athabascau.ca
34

The Northern Alberta Institute of Technology (NAIT) offers 41 accredited programs and courses, and is considered one of Canada’s finest and largest technical training institutes. NAIT is Alberta’s third largest post-secondary educational institution with approximately 86,000 customers each year. NAIT trains half of Alberta’s 70,400 registered apprentices and nearly one-fifth of Canada’s registered apprentices. NAIT is a leader in technical training and applied education designed to meet the demands of Alberta’s industries. NAIT confers certificates, diplomas, and applied degrees. The Institute has 250 programs, including 35 apprenticeship offerings and over 1,400 continuing education courses. The NAIT HP Centre for Information and Communications Technology is one of the most technologically advanced facilities in the world. The Centre provides a leading-edge environment for applied technology and research. Additional Information: Northern Alberta Institute of Technology 11762 – 106 Street Edmonton, Alberta T5G 3H1 Phone: 1-800-661-4077 Website: www.nait.ab.ca
Since it was founded in 1916, the Southern Alberta Institute of Technology (SAIT) has become a leader in providing state-of-the-practice technological training. In recent years, SAIT has developed seven world-class Centres of Advanced Technology Development. The Centres, along with the 390 corporate specific training programs offered by SAIT, are symbols of its reputation as an industry driven technical institute. SAIT is known worldwide for its quality technical education and hands-on training. More than 1,000 private and public sector professionals provided advice and guidance to ensure that what is taught in the classroom is what’s required in the workplace. SAIT provides education and first class training to more than 75,000 individuals each year in 101 apprenticeship, applied degree, diploma and certificate programs. Additional Information: Southern Alberta Institute of Technology 1301 – 16 Avenue NW Calgary, Alberta T2M 0L4 Phone: 1-877-284-SAIT (7248) Website: www.sait.ab.ca
35

Public and Private Colleges
Alberta has an extensive network of public and private accredited colleges. These institutions offer academic upgrading, job readiness, apprenticeship, certificate, diploma, university transfer and applied degree programs. Alberta’s 14 public colleges include:
o Alberta College of Art and Design (Calgary) o Bow Valley College (Calgary) o Grande Prairie Regional College (Grande Prairie) o Keyano College (Fort McMurray) o Lakeland College (Lloydminster, Vermilion, Sherwood Park) o Lethbridge College (Lethbridge) o MacEwan College (Edmonton) o Medicine Hat College (Medicine Hat, Brooks) o Mount Royal College (Calgary) o NorQuest College (Edmonton, Stony Plain, Wetaskiwin) o Northern Lakes College (Grouard, Slave Lake) o Olds College (Olds) o Portage College (St. Paul, Cold Lake, Lac La Biche) o Red Deer College (Red Deer)
The Campus Alberta Quality Council (CAQC) reviews all proposals for new degree programs from both public and private institutions to ensure they are of high quality before they are approved. The Council also conducts periodic evaluations of approved degree programs to ensure that quality standards continue to be met. Alberta has six private colleges accredited to grant specific academic degrees at the university level. These include:
o Ambrose University College (Calgary) o Canadian University College (Lacombe) o Concordia University College of Alberta (Edmonton) o The King’s University College (Edmonton) o St. Mary’s University College (Calgary) o Taylor University College and Seminary (Edmonton)
In addition, The Banff Centre is a publicly funded institution that provides advanced continuing education opportunities in fine arts, management studies, language training and environmental training for people who already have academic credentials and/or professional experience in their discipline.
Educational Support
Alberta’s education system continues to be among the best in the world and is staying at the forefront by providing students with the tools they need to achieve their potential. Investments in schools, universities, colleges and technical institutes are increasing, so they can provide high quality and affordable education.
The Alberta’s per student and per capita spending on basic education continues to be among the highest in Canada. Provincial funding for K-12 was over $5.8 billion in 2008/09. Of that,
36
$5.2 billion was provided for operating support to school boards and other educational support to manage current initiatives giving the province the flexibility to address local education needs.
In 2008/09, the Government of Alberta provided more than $3.4 billion for operating and capital programs for the post-secondary education system. This represented an increase of 5.5 per cent or $178 million over 2007/08 funding levels. Of the total post-secondary funding for 2008/09, $188 million was dedicated towards Alberta's provincial student assistance and debt relief programs – the most generous in Canada. Another $1.5 billion was allocated to post-secondary capital projects to be supported over three years.
The Government of Alberta is committed to encouraging and rewarding the excellence of Alberta students by offering scholarships through the Achievement Scholarship program, the Alberta Heritage Scholarship Fund, and need-based bursaries.
The Alberta government established the Achievement Scholarships program in 2000 to recognize the excellence of Alberta students. This program includes the Jason Lang Scholarship, the Jimmie Condon Athletic Scholarship, and the Graduate Student Scholarship. These scholarships continue to be offered nearly a decade later.
The Alberta Heritage Scholarship Fund was designed to stimulate the pursuit of excellence by rewarding outstanding achievement and encouraging and assisting Albertans to achieve their fullest potential. The scholarships and awards support Albertans in many areas including academics, the arts, community involvement and athletics. The scholarship fund currently administers over 40 different scholarships and has a yearly budget in excess of $38 million (2008/09).
Alberta Scholarship Programs also administers the Northern Alberta Development Council Bursary, Northern Student Supplement, Alberta Opportunities Bursary, the Canada Millennium Bursary and the Millennium Alberta Rural Incentive Bursary to assist students in financial need in the pursuit of their studies.
In 2005, the Government of Alberta launched the Alberta Centennial Education Savings Plan (ACES) to provide an incentive for parents to begin planning and saving for their children’s post-secondary education as early as possible. The plan contributes $500 to the Registered Education Savings Plan (RESP) of every child born to Alberta residents. The same year, an Alberta-funded national scholarship program was launched by the Government of Alberta as an Alberta centennial gift to Canadians. The Alberta Centennial Scholarships provides 325 scholarships annually. One of these awards is the Queen Elizabeth II Graduate Scholarship, established in honour of The Queen's visit to Alberta in May 2005, to commemorate the province's centennial year. The program provides awards to Canadian citizens or permanent residents who are enrolled full-time in a master or doctoral program at a designated Alberta university.
37

RESEARCH AND DEVELOPMENT COMMUNITY Alberta has an excellent science and research infrastructure (including people, knowledge, equipment, and facilities) that forms the basis for the development, adoption and commercialization of new technology, products and processes that are recognized and sold globally.
Alberta Science and Research Authority www.asra.gov.ab.ca Created in 1994, the Alberta Science and Research Authority (ASRA) is an independent board-governed organization, comprised of members from Alberta's academic, business and research communities. ASRA
was established to maximize the effectiveness of science and research as an integral component to the success of the province. ASRA's mission is to enhance the contribution of science and research and innovation to the sustainable prosperity and quality of life of all Albertans. In order to fulfill this mission ASRA functions as the senior science and research body of the Government of Alberta and works collaboratively with government departments and agencies and other stakeholders. Alberta Life Sciences Institute http://alsi.Alberta.ca The Alberta Life Sciences Institute (ALSI) focuses on life sciences opportunities at the convergence of the traditional sectors of health, agriculture, energy and forestry. It was established in 2005 as an unincorporated board comprising representatives from industry, academia and government. ALSI focuses on the following areas of opportunity:
o bio-products innovation, o health innovation, o resource management innovation, and o building the base.
Alberta Agricultural Research Institute
www.aari.ab.ca AARI is the primary agency in Alberta for funding, coordinating and promoting strategic agricultural initiatives in research, development and technology transfer for the agriculture and food sector. AARI's mission is to align the direction and priority for strategic research in bio-products,
sustainable production and food for health.
38
Alberta Forestry Research Institute
www.advancededucation.gov.ab.ca/technology/wwwtechnology_asp/techprior/institutes/afri/afri.asp AFRI was formed in 2002 and is an unincorporated board established by the Alberta Science and Research Authority Act, representing industry, academia
and government. Its role is to promote and coordinates research and innovation in the forestry sector and to enhance the contribution of science and research to Alberta’s sustainability. Alberta Energy Research Institute
www.aeri.ab.ca AEIE was established August 1, 2000 by the Alberta Science and Research Authority Act to promote and invest in energy research, technology evaluation and technology transfer in areas including oil and gas, heavy oil and oil sands, coal, electricity, renewable and alternative energy.
Alberta Information and Communications Technology Institute www.advancededucation.gov.ab.ca/technology/wwwtechnology_asp/techprior/institutes/aicti/AICTI.asp AICTI was created by the Government of Alberta through the Alberta Science and Research Authority Act in 2005. The board is appointed by the Minister of Advanced Education and Technology and is comprised of nationally and internationally recognized leaders from academia, industry and research. The board provides leadership and guidance in expanding Alberta’s information and communications technology sector (ICT). The Board’s leadership and guidance has led to important outcomes, such as:
o the Alberta SuperNet, o the Alberta Informatics Circle of Research Excellence (iCORE), o Alberta Ingenuity Centre for Machine Learning, o investments in high-performance computing infrastructure through WestGrid and
Cybera, and o the establishment of the National Institute for Nanotechnology.
Alberta Research Council
www.arc.ab.ca The Alberta Research Council (ARC) was founded in 1921 and operated as a provincial corporation under the Alberta Research Council Act until 1999, when it was incorporated as a not-for-profit business under the Business Corporations Act. A wholly-owned subsidiary of the Crown,
ARC is governed by a seven-member board of directors drawn from the private sector, and the post-secondary education sectors.
39
ARC is an applied research and development (R&D) corporation that bridges the gap between basic research and the market. It specializes in converting early stage ideas into marketable technology products and services. ARC provides integrated prototyping, product development, testing and technology commercialization services. Generally ARC advances research priorities important to Alberta and enhances the competitiveness and success of Alberta companies in the following key areas:
o Industrial bio-products, o Bitumen and heavy oil, o Health and wellness, o Integrated landscape management, o Waste management, o Carbon conversion, capture and storage, o Water resource management, o Enhanced gas and oil recovery, o Building products and systems, and o Technical and Testing Services.
Informatics Circle Of Research Excellence www.icore.ca iCORE was established in October 1999 by the Government of Alberta to foster world-class university-
based research that supports the ICT sector. iCORE is funded by the Government of Alberta and supported by partners in universities and industry. The mandate of iCORE is to attract and grow a critical mass of outstanding researchers in the fields of wireless communications, artificial intelligence, quantum and nanocomputing, and other information and communications technology related disciplines. iCORE Inc. invests in the highest calibre research scientists and leaders who work on fundamental and applied problems in information and communications technology. It aims to fund iCORE Chairs at Alberta universities, around which world-class research teams will be developed. Alberta Heritage Foundation for Medical Research
www.ahfmr.ab.ca Established by the Government of Alberta in 1980 AHFMR supports biomedical and
health research at Alberta universities, affiliated institutions, and other medical and technology-related institutions. Operating funds come from a portion of the interest revenue from a Government endowment. Since 1980, AHFMR has contributed more than $1 billion directly to the scientific community. Grants and awards include: personnel awards and establishment grants for senior scientists, training awards for students, infrastructure grants, including equipment and conference grants, and special initiative funding in health research.
40

Alberta Ingenuity Fund www.albertaingenuity.ca Alberta Ingenuity is the trade name of the Alberta Heritage Foundation for Science and Engineering Research. Established by the Government of Alberta in 2000, Alberta Ingenuity is an arms-length, independent body accountable to government through the Minister of Advanced Education and Technology.
Alberta Ingenuity supports science and engineering research of the highest calibre and is investing in areas of strategic importance to the province, such as water research, nanotechnology and clean energy. Alberta Ingenuity has four Ingenuity Centres and two Ingenuity Institutes, which are aligned with Alberta government priorities and are attracting the world’s best researchers and graduate students to the province.
Alberta Ingenuity focuses on helping companies commercialize research and translate new discoveries into useful products and business opportunities and on transforming research at academic institutions. Making connections between academic institutions and industry to foster partnerships and create more commercialization opportunities for Alberta companies are priorities for Alberta Ingenuity. Telecommunications Research Laboratories
www.trlabs.ca TRLabs (Telecommunications Research Laboratories) is Canada's largest research consortium (industry, university, government) in information and communications technology. TRLabs operates five laboratories in Western Canada (with locations in Edmonton and
Calgary) where university professors, graduate students, industry partners and staff researchers work together to conduct applied research. Established in 1986, TRLabs creates innovative technologies and trains students to enhance Canada’s information and communication technology expertise. Its research program is focused on the following strategic areas: eHealth, eHome, and Connected Media.
41
The National Institute for Nanotechnology
http://nint-innt.nrc-cnrc.gc.ca/ The National Institute for Nanotechnology (NINT) is an integrated, multi-disciplinary institution involving researchers in physics, chemistry, engineering, biology, informatics, pharmacy and medicine. Established in 2001, it is operated as a partnership
between the National Research Council and the University of Alberta, and is jointly funded by the Government of Canada, the Government of Alberta and the university. NINT operates a $52.2 million, 20,000 square-metre building that is one of the world's most technologically advanced research facilities in Alberta. The goal of NINT's Business Development Office is to assist Edmonton-based nanotechnology firms by fostering collaboration, providing access to the facility and researcher expertise, and assisting companies with commercialization, licensing and other business activities. NINT’s Innovation Centre can provide laboratory and office space for up to 15 companies at a time. Alberta Ingenuity Centre for Machine Learning
www.machinelearningcentre.ca The AICML was created in 2002 to enhance the research expertise in Machine Learning and related areas that exists in the
Computing Science Department of the University of Alberta. The Centre applies its capabilities in advanced data analysis to change the way health information is used in Alberta. AICML connects talent in academia with industry and leading international researchers. C ybera
www.cybera.ca Cybera is a non-profit organization, which provides provincial leadership in integrating, leveraging and sustaining investments in cyberinfrastructure technologies in Alberta. Its offices are located at the University of Calgary and the University of Alberta.
Cybera supports companies to advance research and development in areas such as health, energy, resource management and information and communications technology. It offers specialized project management and consultation services for test-bed environments, cloud computing, social media platform development, high performance computing, software applications, and data management.
42

The Banff New Media Institute www.banffcentre.ca The Banff New Media Institute (BNMI) is an internationally known art and digital research innovation centre. The
multidisciplinary facility operates three Advanced Research Technology labs (ART Labs) in the areas of visualization, collaborative systems, and mobile media. BNMI commissions research, provides training, and offers creative production support. nanoAlberta nanoAlberta works with industry, researchers and investors to help build Alberta's nanotechnology industry and apply the benefits of nanotechnology in the energy, environment, medical, agriculture and forestry sectors. WestGrid
http://westgrid.ca/ The Western Canada Research Grid (WestGrid) operates high performance computing (HPC), collaboration and visualization infrastructure across western Canada. Its partners in Alberta include the University of Alberta, University of
Calgary, University of Lethbridge, The Banff Centre, and Athabasca University. WestGrid is WestGrid is one of seven HPC Consortia in Canada. These consortia are part of a national HPC organization called Compute/Calcul Canada.
43
Research Funding at Alberta Universities Alberta’s research universities rank among the best in Canada in terms of sponsored research revenue, an indicator of excellence and capacity. In 2006/2007, these universities received $686.5 million in sponsored research funding, an increase of 56.9% over the past five years. Over the past nine years, they have received a total of $4.5 billion in sponsored research funding. Since 1997/1998, provincial government funding for university research has quadrupled, reaching $192.7 million in 2007/2008, a firm indication of Alberta’s commitment towards science and innovation. Over the same period, federal government research funding to Alberta research universities has more than tripled to $296 million and the level of sponsored research funding provided to universities by non-governmental sources (primarily industry and non-profit organizations) more than doubled to $152 million. Alberta’s major research universities generate funding through the activities of their respective technology transfer programs: TEC Edmonton for the University of Alberta, University Technologies International Inc. for the University of Calgary, and the Technology Transfer Office for the University of Lethbridge. In 2006/2007, these universities filed 151 patents, were issued 40 patents, formed four start-up companies, and received $6.5 million in gross licensing revenues. World-Class Research Infrastructure Alberta researchers have access to some of the leading technology in the world. It is the research capacity established by this high quality infrastructure that attracts and retains the best researchers, those who generate new knowledge, who address pressing needs in our society, and who train the best students to take that knowledge into the workforce. Highly trained and skilled researchers and students are critical for building, attracting and retaining successful companies to fuel Alberta’s economy. Alberta is committed to ensuring its researchers have access to the equipment they need. To that end, the Alberta Science and Research Investments Program (ASRIP) committed in its last competition approximately $43 million in support of research infrastructure in Alberta. These funds support fourteen projects with a total cost of $188 million, including equipment to support research in high performance computing, remote sensing, nanotechnology, improved oil sands recovery, prion diseases research, genomics and other.
44

Alberta Finance and Enterprise 4th Fl Commerce Place 10155-102 Street Edmonton, AB Canada T5J 4L6 Telephone: 780.427.6787 Fax: 780.422.0061
Website: www.albertacanada.com
You can access Facts on Alberta and the following related department publications on the Internet at: www.albertacanada.com/statpub ♦ Monthly Economic Review ♦ Inventory of Major Alberta Projects ♦ Highlights of the Alberta Economy ♦ Place-to-Place Price Comparison Survey ♦ Alberta’s International Merchandise Exports
© 2009 Government of Alberta ISBN: 978-0-7785-5718-0(pdf) ISSN: 1911-2505
Printed in Canada