facts and figures about the people who live in the
TRANSCRIPT

1
facts and figures about the people who live in the Lancaster District
January 2016
2
contents
3 purpose and key links 15 crime
4 headline facts and figures 16 hate crime
5 demographic and age 17 ethnicity
6 employment 18 children and young people
8 housing 19 older people
9 deprivation 20 disability
10 households 22 religion
11 education 23 sexual orientation
13 health 24 gender and reassignment
25 Lancaster District ‘communities together’ group
issues and suggestions
If you have any issues with the information available or web links, or any suggestions for information to be included, please contact:
Organisational Development
01524 582069

3
purpose
This document provides key information about the Lancaster District and the various communities within it, with the intention of supporting many of the
Council & partners’ activities and decisions, for example when conducting equality analysis to assess the impact of an initiative on the communities within
the district.
The information is accurate as of January 2016 and will be reviewed annually. It has been gathered from a number of different sources, such as:
Census records
Office for National Statistics (ONS) research and estimates
Lancashire County Council’s Lancaster District Profile
Media outlets and other sources
Where appropriate, further information can be found by clicking the relevant web link, indicated as shown here (no actual link).
key links
Lancaster District Profile compiled by Lancashire County Council provides ‘a snapshot of some of the most important economic, social and
environmental factors in Lancaster district’, and also contains many useful links to other information sources.
MOSAIC population groups for Lancaster have also been collated by Lancashire County Council. A description of the MOSAIC groups can be found
here and instructions on using the interface here. Groups can be viewed by Ward or Lower Super Output Area; each can be filtered to show the
Lancaster district only.
The 2011 Census has been developed into a suite of interactive maps based on various different criteria. Click the relevant link to explore by
postcode or by scrolling through the map.
LG Inform and LG Inform Plus contain data for over 3000 different measures, which can be downloaded or developed into bespoke reports at
District, Ward or Output Area level. Registration may be required to use certain features of the sites.

4
headline facts and figures The Lancaster district has a high proportion of White British residents: 91.5% compared to 79.8% in England
This represents an increase in ethnic diversity though as the corresponding figure in 2001 was 95.8%
The largest minority group is ‘Other White’ which constitutes 4,547 residents or 3.3% of the population, with 1,693 or 1.3% of the population originating from Poland
There are also significant Indian (1,212 residents, 0.9% of the population) and Chinese (1,231 residents, 0.9% of the population) communities
95.8% of residents speak English as their main language compared to 94.9% in the North West and 92% in England
16.6% of the population are aged 0-15, 65.1% aged 16-64 and 18.3% aged 65 and over with 18-24 (14.2%), 45-54 (13.2%) and 65-79 (13.1%) the largest age groups
The district has an above average proportion of Christian residents (65.9% compared to 59.3% in England and Wales); 24.5% of the population state no religion while the second largest religious group is Muslim (1.3% compared to 6.6% in Lancashire and 4.8% in England and Wales)
19.4% of residents describe their day-to-day activity as ‘limited’ by a health problem or disability, with 10.2% ‘limited a little’ and 9.2% ‘limited a lot’
Living arrangement figures closely reflect the average for England, with 48,214 married couples in the district, representing 45.1% of the total residents aged over 16
There are also 12,510 residents over 16 in cohabiting opposite-sex relationships (11.7%) and 886 in registered Civil Partnerships or cohabiting same-sex relationships (0.8%)
There are 45,210 residents over 16 not living in a couple (42.3% of the total), with 5,634 of these being lone parents (9.7%)

5 getting to know our communities
demographic and age
0%
2%
4%
6%
8%
10%
12%
14%
16%
Age Distribution
Lancaster % North West % England %
Polish
Other Chinese
Greek
German
Gujarati
French
Spanish
Arabic
Cantonese
Russian
Bulgarian
0 200 400 600 800 1,000 1,200 1,400 1,600 1,800
Non-English First Languages in Lancaster
133914
138375
141222143400
148000
125000
130000
135000
140000
145000
150000
2001 2010 2019 2028 2037
Population It is estimated that
between 2012 and
2037 the population
of Lancaster will
increase by 5.9%
(sources: 2011 Census, District Profile)
The age groups 15-24 and 65+ have an
above average proportion in the Lancaster
district due to the universities and the district
being a popular retirement destination
(source: District Profile)
(source: 2011 Census)

6 getting to know our communities
employment
£0
£5,000
£10,000
£15,000
£20,000
£25,000
Median Gross Employment Income Median Gross Self-EmploymentIncome
Earned Income 2012/13
Lancaster North West United Kingdom
0 2000 4000 6000 8000 10000 12000
Human Health & Social Work
Wholesale & Retail
Education
Accommodation & Food Service
Construction
Top 5 Employment Types
56,500 people employed in the district
4330 active enterprises in the district
500 new enterprises in 2014
400 enterprises closed in 2014
(source: District Profile)
While the manufacturing sector has declined
the service sector has become a far greater
source of employment
(source: District Profile)
(source: District Profile)

7 getting to know our communities
employment
0% 5% 10% 15% 20% 25%
Less Than 2km
2km - 5km
5km - 10km
10km - 20km
20km - 30km
30km - 40km
40km - 60km
60km and Over
Work Mainly at Home
Distance Travelled to Work
England and Wales Lancaster
0%
20%
40%
60%
80%
100%
Lancaster Great Britain
Employment Density
Public Private
0%
20%
40%
60%
80%
100%
Lancaster Great Britain
Employment Rate
Public Private
Lancaster has a high proportion of people travelling 60km or
more to work, which would allow workers to reach
Manchester
(source: District Profile)
Percentage of
the workforce in
employment
(source: 2011 Census)
Number of jobs divided by population aged
16-64; this suggests a significant number of
residents employed outside the district
(source: District Profile)

8 getting to know our communities
housing
Dwelling Types
Local Authority
Registered SocialLandlord
Other Public Sector
Owner-Occupied /Privately Rented
Lancaster
England
Dwellings by Council Tax Band
A
B
C
D
E
F
G
H
0
1
2
3
4
5
6
7
8
2000 2003 2006 2009 2012
Median House Price to Median Individual Earnings 2000 - 2013
Lancaster Lancashire England
In the last decade, the house price to earnings ratio in
the district has been typically around 25% lower
than the average for England
(source: District Profile)
The district contains
a high proportion of
dwellings in the
lowest two
Council Tax bands
(source: District Profile)
6.2% of properties in the district
are Local Authority-owned
(source: District Profile)

9 getting to know our communities
deprivation
0%
2%
4%
6%
8%
10%
12%
14%
Lancaster England
Fuel-Poor %
20.5
21
21.5
22
22.5
23
23.5
24
2004 2007 2011 2015
Indices of Deprivation 2004 - 2015high score = most deprived
Lancaster Lancashire England
The 2015 English Indices of Deprivation showed Lancaster
as the 125th most deprived district out of 326 in England
(source: Indices of Deprivation)
Determined by energy efficiency status of the
property, cost of energy and household income
(source: District Profile)

10 getting to know our communities
households
0%
10%
20%
30%
40%
50%
60%
70%
80%
90%
100%
Usual Residents Elsewhere withSecond Home in the Area
Usual Residents in the Areawith Second Home Elsewhere
Second Homes
Lancaster
Lancashire
North West
Children in Households
No Children
One Child
Two or More Children
All Children Non-Dependent
Living Arrangements
Married
Co-Habiting(Opposite-Sex)
Registered CivilPartnership orCohabiting (Same-Sex)Not Living in aCouple: Total
There are
57,822
households
and 106,820
residents
over 16 in the
district
(source: 2011 Census)
The district has a high proportion of people either
resident elsewhere with a second home in the
area (for a variety of reasons, such as work, holidays
or family), or resident in the area with a second
home elsewhere (primarily University students).
(source: District Profile)

11 getting to know our communities
education
Non-White Ethnicity of Pupils
Asian Black Chinese Mixed Irish Traveller Gypsy/Roma
0 8000 16000 24000 32000
No Qualifications
Level 1
Level 2
Apprenticeship
Level 3
Level 4 and Above
Other
Full-Time Students
Education Status
23,804 people with no qualifications and
16,413 full-time students aged 16-74
(source: 2011 Census)
The district has the highest
concentration of Gypsy/Roma and
Irish Traveller pupils in Lancashire
(source: District Profile)
Schools in the District
1 Nursery School
52 Primary Schools
6 Secondary Schools
2 Special Schools
2 Pupil Referral Units
(source: District Profile)

12 getting to know our communities
education
0 2000 4000 6000 8000 10000
1-19 Hours
20-49 Hours
50+ Hours
Unpaid Carers
3.0%
3.5%
4.0%
4.5%
5.0%
5.5%
6.0%
6.5%
7.0%
2012 2013 2014
% of 16 to 18-year-olds NEET at Year End
Lancashire North West
0
10
20
30
40
50
60
70
80
90
100
Lancaster Lancashire England
5+ GCSE A*-Cincluding English and Maths
14,615 unpaid
carers
(source: 2011 Census)
NEET: not in education,
employment or training
(source: District Profile)
The district’s 58.8% of pupils achieving
5 or more grade A*-C GCSEs is ahead of
the average for both Lancashire and England
(source: District Profile)
13 getting to know our communities
health
1200
1250
1300
1350
1400
1450
1500
1550
1600
1650
2000 2002 2004 2006 2008 2010 2012 2014
Births & Deaths 2000 - 2014
Births Deaths
70
72
74
76
78
80
82
84
2001 2002 2003 2004 2005 2006 2007 2008 2009 2010 2011 2012
Average Life Expectancy
Eng & Wal Male Eng & Wal Female Lancaster Male Lancaster Female
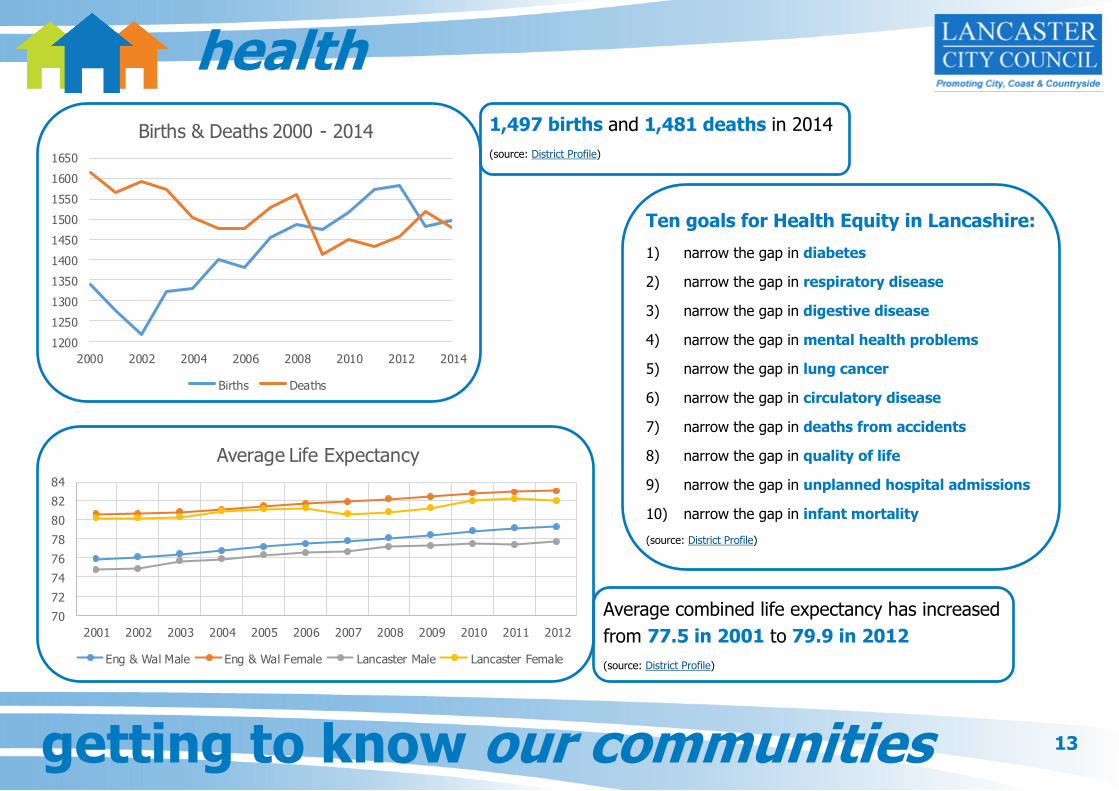
1,497 births and 1,481 deaths in 2014
(source: District Profile)
Average combined life expectancy has increased
from 77.5 in 2001 to 79.9 in 2012
(source: District Profile)
Ten goals for Health Equity in Lancashire:
1) narrow the gap in diabetes
2) narrow the gap in respiratory disease
3) narrow the gap in digestive disease
4) narrow the gap in mental health problems
5) narrow the gap in lung cancer
6) narrow the gap in circulatory disease
7) narrow the gap in deaths from accidents
8) narrow the gap in quality of life
9) narrow the gap in unplanned hospital admissions
10) narrow the gap in infant mortality
(source: District Profile)

14 getting to know our communities
health
25%
27%
29%
31%
33%
35%
37%
39%
41%
43%
45%
2005 2006 2007 2008 2009 2010 2011 2012
Weekly Sport Participation
Lancaster England
0
5
10
15
20
25
30
35
40
45
50
2007 2008 2009 2010 2011 2012
Under-18 Conceptions per 1000
Lancaster North West England
Pregnancy amongst 15- to 17-year-olds has decreased
by 36.9% in the district over the period 98-00 to 10-12,
compared to 27.4% in the North West and 31.3% in
England
(source: District Profile)
Sport England research suggests that women are less
likely to regularly participate in sport than men;
sport participation can also be influenced by factors such
as age, ethnicity, faith, sexual orientation and disability.
(source: Sport England)

15 getting to know our communities
crime
0 5 10 15 20 25 30 35
Violence Against the Person
Sexual Offences
Robbery
Theft Offences
Criminal Damage/Arson
Victim-Based Crime 2014/15offences per 1,000 population
England & Wales Lancaster
10
11
12
13
14
15
16
17
18
Mar-
12
May-1
2
Jul-12
Sep-1
2
Nov-
12
Jan-1
3
Mar-
13
May-1
3
Jul-13
Sep-1
3
Nov-
13
Jan-1
4
Mar-
14
May-1
4
Jul-14
Sep-1
4
Nov-
14
Jan-1
5
Mar-
15
Crime Rate 2012 - 2015offences per 1,000 population
Lancaster England & Wales
Community Safety Priorities:
Anti-Social Behaviour
Domestic Abuse
Road Safety
Child Sexual Exploitation
Counter-Terrorism
Hate Crime
(source: Safer Lancashire)
Crime figures in Lancashire can be viewed by postcode,
ward or electoral division, or compared with other
similar areas using the Safer Lancashire statistical tool
(source: Safer Lancashire)
16 getting to know our communities
hate crime
0
5000
10000
15000
20000
25000
30000
35000
40000
45000
50000
2011/12 2012/13 2013/14
Hate Crime 2011 - 2014
Race Sexual Orientation Religion Disability Transgender
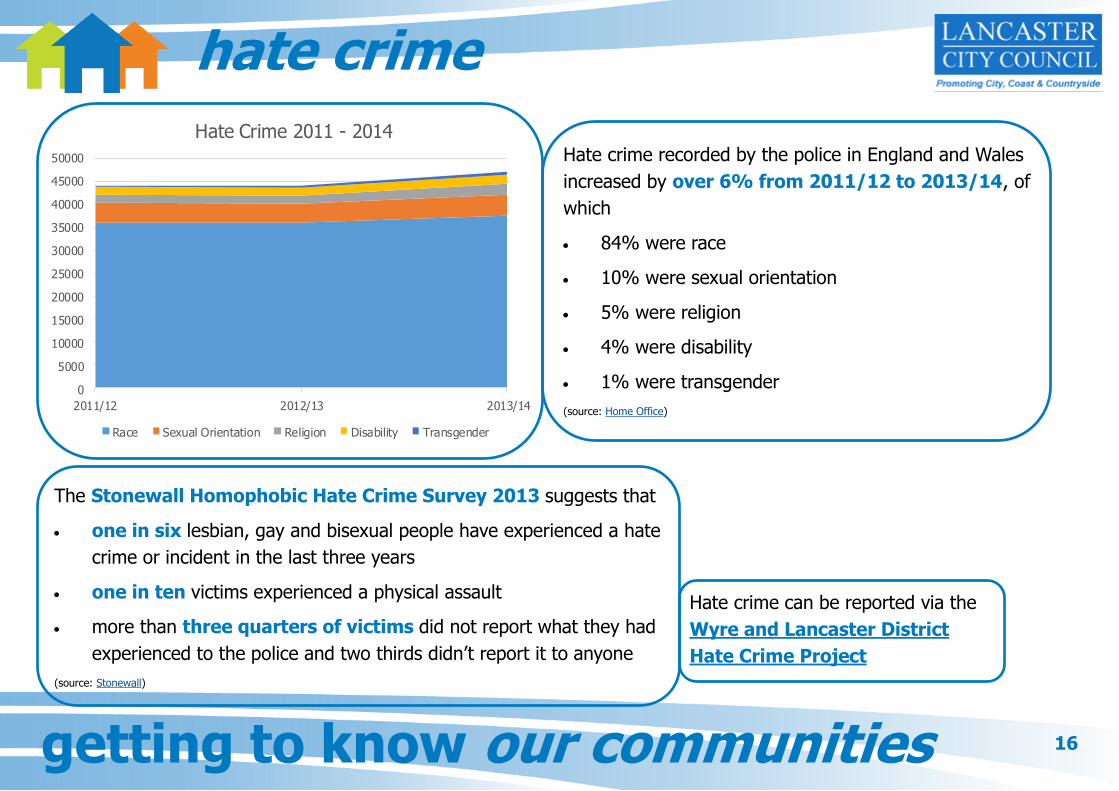
Hate crime recorded by the police in England and Wales
increased by over 6% from 2011/12 to 2013/14, of
which
84% were race
10% were sexual orientation
5% were religion
4% were disability
1% were transgender
(source: Home Office)
The Stonewall Homophobic Hate Crime Survey 2013 suggests that
one in six lesbian, gay and bisexual people have experienced a hate
crime or incident in the last three years
one in ten victims experienced a physical assault
more than three quarters of victims did not report what they had
experienced to the police and two thirds didn’t report it to anyone
(source: Stonewall)
Hate crime can be reported via the
Wyre and Lancaster District
Hate Crime Project

17 getting to know our communities
ethnicity There has been an increasing diversity in ethnicity
during the last decade, mainly in the ‘Other White’ and
‘Other’ groups; this is likely a result of migration from
Eastern Europe.
(source: District Profile)
A Gypsy and Traveller Accommodation Assessment
in July 2013 highlighted that
There are around 158 Traveller pitches in the area
139 of these are on private sites with the remainder
on the Mellishaw Lane site
An additional 44 pitches are required by 2026 due to
the formation of new Traveller householders
From 2013-18 the need for additional pitches is low
There are currently no Travelling Showpeople plots in
the district although there were six unauthorised
encampments during 2011-13
(source: Lancaster City Council)

18 getting to know our communities
children and young people
0.1
0.12
0.14
0.16
0.18
0.2
0.22
2004 2007 2011 2015
Indices of Deprivation Affecting Children
Lancaster England
10%
12%
14%
16%
18%
20%
Lancaster England
% Children in Low-Income Families
The district was ranked 147 out of 326 Local Authority
areas in England for deprivation affecting children in 2015
(source: gov.uk)
This measure is based on
“the proportion of children living in families in receipt of
out-of-work benefits or tax credits where their reported
income is less than 60% median income”
(source: District Profile)
Lancaster Children and Young People’s Trust Priorities
Working Together with Families
Early Support
Supporting Other Countrywide Initiatives
Local Knowledge
Operation of the Trust
(source: District Profile)

19 getting to know our communities
older people
0
10000
20000
30000
40000
50000
60000
70000
2005 2010 2015 2020
Older Age Groups 2005 - 2020
50-64 65-79 80+
0% 10% 20% 30% 40% 50% 60% 70%
Home during the day
Home at night
Travelling during the day
Travelling at night
Town during the day
Town at night
Community Safety: Over-45s in Lancaster
Fairly Safe % Very Safe %
0
0.05
0.1
0.15
0.2
0.25
2004 2007 2011 2015
Indices of Deprivation Affecting Older People
Lancaster England
The district was ranked 127 out of 326
Local Authority areas in England for
deprivation affecting older people in 2015
(source: gov.uk)
Based on current trend, it is likely that
24% of the district’s population will be
over 65 by 2030
(source: District Profile, 2011 Census)
(source: District Profile)

20 getting to know our communities
disability
0%
2%
4%
6%
8%
10%
12%
Lancaster North West England
% of Disabled People with 'Day to Day Activities Limited'
A Lot A Little
(source: 2011 Census)
deaf & blind people
approximately 250,999 deafblind people in the UK
222,000 of these aged over 70
33,000 adults aged 20-69
4,000 children aged 0-19
estimated 7,743 deafblind people and 2,901 with more
severe impairment living in Lancashire
(source: Sense)
The RNIB sight loss data tool contains information on
blindness, visual impairment and sight loss for Lancashire,
the North West and England; in Lancashire there are
2800 people registered blind
265 certified visually impaired
37090 living with sight loss
(source: RNIB)

21
disability
0 2 4 6 8 10 12 14 16 18
18-64 learning disability known to LA
Children with moderate learning…
Children with severe learning difficulties…
Children with profound & multiple…
Children with autism known to schools
Learning Difficultiesper 1,000 population
England Lancashire
There were around 1.5 million people estimated to be living
with a learning disability in the UK in 2011, including
905,000 adults (530,000 men and 375,000 women)
(source: foundation for people with learning disabilities)
UK mental health
one in four people will experience some kind of mental health problem in the course of a year
anxiety and depression is the most common mental disorder
women are more likely to have been have been treated for a mental health problem than men
around ten percent of children have a mental health problem at any one time
depression affects one in five older people
men are three times more likely to die by suicide than women
the UK has one of the highest self-harm rates in Europe: 400 per 100,000 population
only one in ten prisoners has no mental disorder
(source: mentalhealth.org.uk)

22 getting to know our communities
religion
6684171534
Residents by Gender
Male Female
0%
10%
20%
30%
40%
50%
60%
70%
80%
Christian Buddhist Hindu Jewish Muslim Sikh Other NoReligion
NotStated
Population by Religion
Lancaster Lancashire England & Wales
Lancaster’s percentage of residents who claim no religion is
second highest among authorities in Lancashire, while the
Muslim population of 1.3% is well below the 6.6% average
for Lancashire
(source: District Profile)

23 getting to know our communities
sexual orientation
1.5%
7%
0
2000
4000
6000
8000
10000
12000
ONS Estimate Stonewall Estimate
Estimated Lesbian, Gay or Bi-Sexual in Lancaster Government statistics show around 1-2% of people identify
themselves as gay, lesbian or bisexual; but the gay rights
charity Stonewall estimates the true figure may be 5-7%,
suggesting a total of around 9,889 people in the district
(source: ONS)
The LGBT group Out in the Bay also suggest that Lancaster could
have the second-highest LGBT population in Lancashire
(second to Blackpool), along with a 3% transgender population
The introduction of Same Sex Marriage from
29 March 2014 has caused a significant
decrease in the formation of Civil Partnerships,
but an increase in the overall total
(source: ONS) 20
40
60
80
100
120
2009 2010 2011 2012 2013 2014 2015
Civil Partnerships and Same Sex Marriages Formed in Lancashire
Civil Partnerships Same Sex Marriages

24 getting to know our communities
gender and reassignment
gender reassignment
Research conducted by the Press for Change group suggests that there is ‘no
publicly available statistical data on which to make firm estimates’; although they
estimated in 2000 that there were around 5,000 transsexual people in the UK
based on numbers of those who had changed their passports.
The Equality and Human Rights Commission (EHRC) also produced a report
detailing the difficulties in gathering equality data on this characteristic, along with
best practice and areas to consider.
6684171534
Residents by Gender
Male Female
(source: 2011 Census)

25 getting to know our communities
communities together
Lancaster District ‘Communities Together’ group
The below communities from the Lancaster district are invited/represented on this group which meets on a quarterly basis: Hindu Lancaster University academic and student community Jewish Baha’i Chinese Traveller Polish University of Cumbria academic and student community African Huaxian Chinese Muslim Interfaith group The purpose of this group is to provide the district with a forum where community members and representatives of key agencies can come together, build
relationships and share experiences and knowledge with a view to improving community cohesion, a sense of belonging and taking part to encourage and promote positive relationships between diverse and emerging communities and groups in the district to organise and support events that celebrate diversity, welcome newcomers and promote positive relationships between communities to act as a link between local communities and statutory agencies, including advising statutory agencies on messages and consultations
that are relevant to those communities Lancaster City Council host these meetings and other a number of other organisations are invited to attend including Lancashire Constabulary, Lancashire Fire and Rescue and Health Watch.