facts and figures 2008 - sfk · (wmg drugs) respectively the ... pma pensioenfonds medewerkers...
TRANSCRIPT

Facts and Figures 2008
Table of contents
Foundation for Pharmaceutical Statistics 4‘Facts and Figures 2008’: a brief sketch 7
Chapter 1 Expenditure on pharmaceutical aid 111.1 Expenditure up by 8.1% 111.2 The costs of drugs 151.3 Causes of structural growth 161.4 Good runners 251.5 Market shares of product groups 331.6 Pharmacy fee 37
Chapter 2 Cost control 392.1 Drug Price Act 392.2 Health Care Market Regulation Act (WMG) 392.2.1 Decontrolling purchase benefits 412.2.2 Clawback 412.2.3 Basic agreement 422.2.4 De Geus measure 422.2.5 Covenant years 2004-2007 432.2.6 Pharmacy Care Transition Agreement 2008-2009 442.2.7 Audit of practice costs and purchase benefits 462.2.8 Preferential policy leads to price war 472.3 Drug Reimbursement System 49
Chapter 3 Drug consumption in a Western European perspective 52
Chapter 4 The community pharmacy in figures 554.1 Independent pharmacies versus chains 554.2 Turnover of the community pharmacy 574.3 Pharmacy practice costs 59
Chapter 5 Core figures pharmaceutical aid in 2007 66
3

4 5
Foundation for Pharmaceutical Statistics
Since 1990, the Foundation for Pharmaceutical Statistics (Stichting Farmaceutische Kengetallen, SFK) has been collecting and analysing exhaustive data about the use of pharmaceuticals in the Netherlands. The SFK directly gathers its data from a panel of pharmacies. Currently, 1,760 of the 1,940 community pharmacies in the Netherlands are represented on this panel. The 1,760 pharmacies on the SFK-panel combined serve 13.7 million Dutch, dispensing drugs, medical aids or bandages 160 million times a year. For each dispensation, the SFK registers information about the drug or medical aid supplied, the dispensing pharmacy, the health insurance company that does or does not reimburse the dispensation, the prescribing doctor and the patient for whom the prescription was issued. With this, the SFK has the most elaborate collection of data in this field in the Netherlands. Thorough validation routines and proven statistical procedures guarantee the high quality and representativeness of the SFK-data.
The figures mentioned in this publication represent the nation-wide consumption of drugs via community pharmacies. The figures are determined using a stratification technique developed by the SFK. This technique does not only make use of the data supplied by pharmacies that are affiliated with the SFK, but also of available information from non-participating pharmacies. The technique among other things takes into account the size of the patient population and the geographical location of the pharmacy.
This publication contains no data about the use of drugs in hospitals. The Ministry of Public Health, Welfare and Sport (VWS) commissioned the SFK to publish the Expensive and Orphan Drug Monitor in 2007 under the supervision of the Netherlands Hospital Association, the Dutch Federation of University Medical Centres and the Dutch Association of Hospital Pharmacists. The monitor shows the expenditure developments of medications that are included in the policy rules for expensive medicines and orphan drugs for the period of 2004 through 2006. The SFK has also been commissioned to carry out this monitor for 2007 and 2008.
PrivacyWith regard to the registration of data concerning drug consumption, the SFK takes utmost care to protect the privacy of the parties involved. Privacy regulations guarantee the privacy of the participating pharmacists. With regard to the prescribing doctor and the patient, the SFK only uses anonymously gathered data. The identity of the doctor remains hidden from the SFK through an encryption key that all participating pharmacies individually enter into their pharmacy computer systems. Information from all the different doctors and pharmacies can only be linked if all parties
involved authorise the SFK to do so in writing. In an increasing number of regions, the SFK supports cooperation structures of pharmacists and general practitioners. In these cooperation structures medicine consumption figures are exchanged via a Data Warehouse that is accessible through part of the SFK-intranet, which is protected against third parties.
The patient’s identity always remains hidden from the SFK, because the SFK uses the serial number allocated to the patient in question in the pharmacy. The SFK cannot match the numbers and the individual persons. Of course, the pharmacy knows the identity of its own patients, but this information is not passed on to the SFK.
Participation in the SFKAll community pharmacies in the Netherlands can participate in the SFK with no costs attached. Pharmacists who supply the SFK with information receive each quarter a monitor report; or if a monthly report is preferred, they can be easily requested via the SFK website. In addition, these pharmacists can freely access up-to-date and detailed data regarding drug consumption in their own practice via the SFK Date Warehouse as management information for the own business or as ‘mirror information’ for pharmacotherapeutical consultations with general practitioners. In order to monitor the efficiency of medicine use and to support practice-oriented programmes in the field of pharmaceutical patient care and the pharmacotherapeutical consultation, the SFK provides tailor-made reports via the Internet, either with or without a fee. In drawing up these customised reports the SFK works together with the Scientific Institute of Dutch Pharmacists (WINAp) and the Dutch Institute for Responsible Drug Consumption (DGV).
Definitions usedWith the costs of drugs, the SFK means the costs at pharmacy fee price (WMG drugs) respectively the costs at pharmacy purchase price (non-WMG drugs), as registered in the G-Standard of Z-Index.
The Health Care Market Regulation Act (WMG) went into effect on 1 October 2006. The Health Care Market Regulation Act (WMG) replaces the Health Care Charges Act (WTG ). Performances and charges that fall under the Health Care Charges Act (WTG), also fall under the Health Care Market Regulation Act (WMG).
The drug expenditure entails the total drug costs and pharmacy fees.
All expenditures in this publication concern the statutorily insured drug package and do not include VAT, unless stated otherwise. The VAT for prescription drugs is 6%.

6 7
List of abbreviations
Bogin Bond van de Generieke Geneesmiddelenindustrie Nederland (The Association of the Dutch Generic Medicines Industry)
CBb College van Beroep voor het Bedrijfsleven (Trade and Industry Appeals Tribunal)
CBS Centraal Bureau voor de Statistiek (Statistics Netherlands) CVZ College voor Zorgverzekeringen (Health Care Insurance Board) DDD Defined Daily Dose
GVS Geneesmiddelenvergoedingssysteem (Drug Reimbursement System)
KNMP Koninklijke Nederlandse Maatschappij ter bevordering der Pharmacie (Royal Dutch Association for the Advancement of Pharmacy )
NApCo Nederlandse Apothekers Coöperatie (Dutch Pharmacists Cooperative)
NZa Nederlandse Zorgautoriteit (Dutch Health Care Authority) (formally the CTG- College Tarieven Gezondheidszorg: the Health Care Charges Board)
PMA Pensioenfonds Medewerkers Apotheken (Pension Fund Pharmacy Employees)
SFK Stichting Farmaceutische Kengetallen (Foundation for Pharmaceutical Statistics)
VAT Value Added Tax
VWS Ministerie van Volksgezondheid, Welzijn en Sport (Ministry of Public Health, Welfare and Sport)
WGP Wet Geneesmiddelenprijzen (Drug Price Act)
WINAp Wetenschappelijk Instituut Nederlandse Apothekers (Scientifc Institute of Dutch Pharmacists)
WMG Wet Marktordening Gezondheidszorg (Health Care Market Regulation Act)
WTG Wet Tarieven Gezondheidszorg (Health Care Charges Act)
ZN Zorgverzekeraars Nederland (Dutch Health Insurers)
‘Facts and Figures 2008’: a brief sketch
Expenditure on medicines up by 8.1%In 2007, € 4,652 million was spent via community pharmacies on medicines that fall within the statutorily insured drug package. This is € 350 million or 8.1% more than in 2006. The expenditure increase can primarily be traced back to the increasing use of ‘expensive’ medicines (medicines that cost more than € 500 per prescription). The group of expensive medicines is responsible for almost 40% of the expenditure growth in 2007. Along with that the expenditures grew because of a substantial nationwide growth in the number of prescriptions.
Expectations for 2008The SFK expects that the expenditure on pharmaceutical aid via community pharmacies will slightly decrease to € 4,603 million in 2008. In respect to this, account has been taken of the structural increase in medicine expenditure, the price reductions as a result of the 2008 Pharmacy Care Transition Agreement, the price reductions in June and July 2008 as well as the preferential policy, the re-inclusion of contraceptives in the package and also the reduction of the maximum prices because of price developments in surrounding countries.
In particular, the price reductions resulting from the preferential policy contribute to the expected decrease. The prices of the most important generic drugs decrease an average of 85%. On balance, the price war leads to a cost reduction of € 355 million on an annual basis. During the period from January to May 2008, the prices of generic medicines were already reduced by € 125 million as a result of the Pharmacy Care Transition Agreement that Minister Klink closed with the medicine sector in September 2007. In addition, the prices of generic medicines taken on average were cut in half in a six-month period.
Causes of growthWithout government intervention or that of market parties, expenditure on medicines currently increases by 9% to 10% annually. The increase in the amount spent on drugs is a structural phenomenon that can be ascribed to a shift in drug consumption towards newer, usually more expensive drugs, to demographic factors (population growth and ageing), the increasing use of chronic medicines, the admission of new drugs in the statutorily insured drug package and the shift of care from the hospital to the home. Furthermore, the growing market share of community pharmacies at the expense of the market share of dispensing general practitioners influences the increase in drug expenditure in community pharmacies.

8 9
Governmental agreements with the sectorIn line with agreements made earlier, in December 2006 the government made nationwide agreements with the sector (pharmacists, medicines suppliers and healthcare insurers) about the medicine price developments in 2006 and 2007. This savings objective was set to be € 971 million for the year 2007. Supported by the reduction of the maximum prices influenced by the Drug Price Act and the expiry of patents of diverse medicines, the in the covenants agreed to savings objectives were realized in 2005 and onwards.
The government closed a new agreement with the sector in September 2007. On the one hand, this involved continuation and refinement of the austerity agreements from earlier covenants. On the other hand, based on a collective procedure to be worked out, it was agreed that parties would work towards a new market condition in which the diverse links within the column are motivated to provide the client with maximum added value and the existing regulation can be cut back. This is the reason why the agreement was called Pharmacy Care Transition Agreement. Moreover, it was agreed that the clawback of 6.82% would be temporarily increased during the months of December 2007 through June 2008 with a transition surcharge to 11.3%. Moreover the amount of € 215 million (incl. VAT) on purchase benefits that pharmacists and dispensing general practitioners submit via the mainstream clawback rule means that yet another € 50 million (incl. VAT) on extra purchase benefits by pharmacists and dispensing general practitioners are skimmed.
Practice costs and purchase benefits In 2007, on behalf of the Ministry of Health, Welfare and Sport (VWS) and in consultation with the Association of Dutch Health Care Insurers, the Royal Dutch Association for the Advancement of Pharmacy (KNMP) and the Dutch Association of General Practitioners (LHV), the Dutch Health Care Authority (NZa) allowed for an audit of the practice costs and the purchase benefits for pharmacists and dispensing general practitioners. The audit showed that the reimbursement of the practice costs for an average community pharmacy insufficiently covered the actual costs. Taking into account the purchase benefits that pharmacies need to finance the practice costs, the parties in the Pharmacy Care Transition Agreement concluded that in 2008, there is room for increase of the savings objectives by € 340 million to € 1,311 million. Despite the fact that the outcomes from the audit are underwritten by the parties involved, under pressure from the Dutch House of Representatives, Minister Klink had commissioned an audit of pharmacists and dispensing general practitioners for the third time in one year.
More generic drugsDutch pharmacists supply more and more generic medicines. In 2007, half of all dispensations concerned a generic drug. The increase in the number of generic dispensations is connected to the best-efforts obligation that pharmacists agreed upon with the government in the covenant; to promote the use of cheaper generic medicines. The number of generic dispensations also grew less substantially than in the previous years because there are relatively few medicines for which the patent expired in 2007.
More expensive medicinesThe expenditures on medicines that cost more than € 500 per prescription substantially increased in the past five years. In 2007, the costs of these expensive drugs increased by € 131 million. This is 37% of the total expenditure increase. An increasing larger portion of expenditures on these medicines find their way through channels other than the mainstream neighbourhood pharmacy. This phenomenon is also called unique delivery or selective distribution of specialized medicines. Two medicines that fall under the unique deliveries (the TNF alpha-inhibitors adalimumab and etanercept) are high in the top 10 of medicines with the highest expenditures and the top 10 expenditures increased in 2007.
Medicine consumption temporarily towards West European averageCompared to other West European countries, the Dutch spend little money on medicines. In 2006, the Dutch consumed € 321 per person worth of medicines (including the delivery of expensive medicines). In countries surrounding the Netherlands, such as Belgium (€ 359), Germany (€ 427) and France (€ 506), an average of 12% to 60% more is spent on medicines per capita. Compared to Denmark expenditure per person in the Netherlands is higher. Because of the increase in the consumption of expensive medicines, which in some countries are only available through hospitals, the Netherlands leans more towards the Western European average (€ 361). The SFK expects that the Netherlands will once again be part of the tail group in terms of medication expenditures per person from 2008 onwards.
Substantial growth in pharmacy establishmentsAt the end of 2007, there were 1,893 community pharmacies in the Netherlands. This is 68 pharmacy practices more than a year ago. The considerable growth in pharmacy establishments that have taken place in recent years involved proportionately more specialist pharmacies, such as out-of-hours pharmacies, outpatient pharmacies and preparation pharmacies, than it did the mainstream neighbourhood pharmacy. The community pharmacies provide medicine provisions for 92.1% of the Dutch population. The remaining part of the

10 11
population has to rely on dispensing general practitioners (usually in rural areas). The average community pharmacy serves a patient population of 8,100 people. In 2007, the average pharmacy practice supplied a drug prescribed by a doctor 78,000 times for a total sum of € 2,502,000. Turnover increase is chiefly attributable to the nationwide growth of the number of prescriptions and the increasing use of expensive medicines.
Labour marketAt the end of last year, 24,707 people were employed in a community pharmacy in the Netherlands, 4% more than in 2006. In the past year, the number of employed pharmacist’s assistants increased by 600 people to 16,027. Most of the pharmacist’s assistants prefer a part-time work contract. Only 26% of the pharmacist’s assistants work full-time. The nationwide number of dispensations growing more substantially than pharmacy personnel can be an indication that there will be more job market pressure in the pharmacy branch. The processing rate, an indicator for the productivity and work pressure in a pharmacy, increased by 2% to 14,500 prescriptions in 2007.
PharmacistsLast year, 117 people graduated as pharmacists. With this, the number of graduates reaches a low point. Approximately 70% of the graduate pharmacists opt for a function in the community pharmacy sector. On balance, the increase in the number of active pharmacists in community pharmacies amounted to 35 pharmacists. The number of graduates, and likewise because of this the influx of new pharmacists in the job market, is once again expected to pick up from 2008 onwards. There is a great interest in the study of pharmacy. In 2007, 507 students enrolled to study pharmacy at the universities of Utrecht, Groningen and Leiden. The pharmacy student population amounted to 2,152 people at the beginning of 2008, 12% more than a year earlier. Women in particular choose to study pharmacy: 61% of first-year students and 60% of all enrolled students are women.
1 Expenditure on pharmaceutical aid
1.1 Expenditure up by 8.1% In 2007, € 4,652 million was spent on medicines in Dutch community pharmacies. This is € 350 million, or 8.1%, more than in 2006.
The increase in expenditures can be traced to two main causes. Firstly, the expenditures are growing because of increasing use of ‘expensive’ medicines. In recent years, this share has increased from 6.9% in 2002 to 15.1% in 2007. Almost 40% of the entire increase in expenditures is caused by this group of prescriptions. Medicines that amount to more than € 500 per prescription are considered to be the expensive medicines. Without exception, this is due to small groups of consumers with high expenditures per user. Secondly, there is a relatively intense growth in the total number of dispensations. The number of dispensations via community pharmacies increased by 5.8% in 2007. This is indeed a less substantial increase than in 2006; however, it is still more in comparison with the years prior to that. It is noteworthy that there is an above-average increase in groups of medicines which are already administered such as proton pump inhibitors, antithrombotics and cholesterol-reducers. These three medicine groups alone account for almost 25% of the growth in prescriptions. This growth can probably be attributed to the prescribers’ more consistent adherence to regulations and standards established from new therapeutic insights gained for these groups of medicines.
Among the oncological medicines and immunomodulators, expenditures increased the greatest amount in an absolute sense. In 2007, € 479 million was spent. This is almost € 67 million more than in 2006. The turnover of these medicines rose more than average in terms of percentages as well. In 2007, the expenditures increased by 16.2%. This increase is to a large extent attributable to the medicines entanercept (Enbrel®) and adalimumab (Humira®). These TNF alpha-blocking agents are prescribed for serious forms of rheumatism, among other things. Adalimumab and etanercept are considered to be prompt or unique dispensations. The manufacturers of these medicines distribute their medicine selectively. This means that not every community pharmacy can deliver in these drugs right away. The expenditures for protein kinase inhibitors have also continually increased. This class of medicines is prescribed for diverse forms of cancer. These medicines can easily be used at home, because they are available in tablet form. Imatinib (Glivec®) was the first available medicine in this class; however, four other protein kinase inhibitors have been admitted into the drug package.
The expenditures on the group of cardiovascular medicines have risen above one billion euros for the first time. The turnaround rose by € 60 million from € 965 million in 2006 to € 1,025 million in 2007. Within the group of cardiovascular drugs, the increased use of drugs belonging to the

12 13
group of angiotensin-ll-antagonists has resulted in an expenditure increase of € 22 million. Angiotensin-ll-antagonists are used in the treatment of high blood pressure and heart failure. Furthermore, the increase in the use of cholesterol-reducing medicines results in an expenditure growth of € 19 million. The cardiovascular medicines turnover rose more than average in terms of percentages as well; by 6.2%.
The expenditures on drugs focused on the gastrointestinal tract and metabolism increased in an absolute sense by € 38 million; increases for the respiratory system of € 37 million and for the nervous system with € 34 million are likewise, substantial. However, these groups did not increase above average from a relative perspective. The above-average increase is found chiefly with medicine groups consisting of many relatively expensive medicines, such as the earlier-mentioned oncological medicines and immunomodulators (+16.2%), systemic hormone preparations (+19.1%) and blood organs/blood-forming organs (+13.3%).
The medicines focused on the gastrointestinal tract and metabolism showed an expenditure increase of € 37 million in 2007. Turnover went up from € 656 million to € 693 million. Over half of all of these increases were caused by the proton pump inhibitors, which had a turnover increase of € 19 million. Furthermore, € 11 million more was spent on diabetes medication in the form of insulin. The turnover of the oral diabetes medication was somewhat lower than in 2006. Expenditure on laxatives increased to € 54 million. In 2004, self-care medicines that belong to this group that were still partially reimbursed, were excluded by the insurer. The prescription laxatives remained eligible for reimbursement. Since 1 January 2005, they are once again eligible for reimbursement. However, the turnover of these drugs is not yet at the level of 2003, whereas the expenditure of prescription laxatives is almost twice as high as it was in 2003.
Chiefly, drugs for ADHD (+€ 10 million), antipsychotics (+€ 8 million) and medicines for epilepsy (+€ 6 million) contributed the most to the increase of expenditures for medicines for the central nervous system. The expenditure increase in the first group is mainly paid for by the patient or by a supplementary insurance policy, because high patient co-payments apply to a dual medicine for ADHD. With the medicines for epilepsy, the increase is noticeable because of the two most recently introduced medicines in this group, namely pregabalin (Lyrica®) and levetiracetam (Keppra®).
The turnaround increase with the respiratory medicines is chiefly attributable to the increasing use of inhalation sympathicomimetics
(+€ 20 million). There is a substantial increase in the turnover of the combination of bronchial dilators with an inflammation inhibitor (Seretide® and Symbicort®). This is partially at the expense of the singular preparations.
Apart from the expenditure mentioned above, which only relates to medicines that form part of the statutorily insured drug package, community pharmacies supplied € 240 million worth of non-package medicines in 2007. This concerns medicines that are not directly eligible for reimbursement via health insurance companies; however, they are sometimes reimbursable via a supplementary insurance policy. A considerable part of the expenditure on non-package medicines can be ascribed to contraceptives (€ 70 million). As of 1 January 2004, women over 21 are no longer automatically reimbursed for the use of contraceptives like the pill and the IUD. These medicines are again fully reimbursed via the basic public healthcare insurance as of 2008. However, just as with all other package medicines, they fall under the co-payment that was introduced in 2008. The users must also contribute a co-payment for the use of the impotence medicines: sildenafil (Viagra®), tadalafil (Cialis®) and vardenafil (Levitra®). All totalled, these drugs have a turnaround of € 16 million.
From 1 January 2000, claims regarding haemostatics, which are used for the treatment of haemophiliacs, were brought under the Special Medical Operations Act. Because of this, the amounts spent on these medicines no longer fall under the budget for medicine distribution via community pharmacies and dispensing general practitioners, but under the budget for hospital care. Since 1 January 2002, the treatment of haemophiliacs has been limited to specially designated treatment centres. The extramural claim on medicines with blood coagulation factors, a subsection within the haemostatics, has disappeared. In 2007, € 6 million worth of these medicines was still supplied via community pharmacies.
Of the total Dutch population, 15 million people (92.1%) are served by community pharmacies. In small rural areas the population has to rely on the services of dispensing general practitioners.
Based on current insights (situation June 2008), the Foundation for Pharmaceutical Statistics (SFK) expects that expenditure on pharmaceutical care via community pharmacies will decrease in 2008 to € 4,603 million. In respect to this, account has been taken of the structural increase in medicine expenditures, the price reductions as a result of the 2008 Pharmaceutical Care Transition Agreement, the price reductions in June and July 2008 as a result of the preference policy, the re-inclusion of contraceptives in the package as well as the reduction of the maximum prices because of price developments in surrounding countries.

14 15
1.01 Total expenditure on pharmaceutical aid: community pharmacies
Source: Foundation for Pharmaceutical Statistics
1.2 The costs of drugsRegarding the expenditure on pharmaceutical aid, two components can be distinguished:1. The costs of drugs at pharmacy (purchase) price that may be passed on to the patient by the pharmacy.2. The fee for the service of the pharmacy; this fee is closely related to the number of prescriptions.
1.02 Medicine costs and pharmacy fee: community pharmacies
Source: Foundation for Pharmaceutical Statistics
With 81%, the costs of drugs account for most of the total expenditure on pharmaceutical care. In 2007, the costs of medicines rose by almost € 300 million to € 3,778 million (an 8.6% increase). Between 2003 and 2007, medicine costs increased an average of 4.5% annually. The increase in the clawback in the last months of 2003 (De Geus measure), and the price reductions for generic medicines as a result of the covenants closed in 2004 and 2005, has curbed the growth of medicine costs during this period. Moreover, in 2004, the restrictions for reimbursement on self-care medicines, medicines for IVF and contraceptives led to a savings on the pharmaceutical aid budget. The privatization of dressing materials from pharmaceutical aid to medical supplies in 2006 led to lower costs in the pharmaceutical aid budget. Without the measures mentioned above, the costs would have gone up by 9-10% annually.
1999 2000 2001 2002 2003 2004 2005 2006 2007 2008 (prognosis)
5.000
4.500
4.000
3.500
3.000
2.500
2.000
1.500
1.000
4,302
4,652 4,603
4,1453,9093,967
3,702
3,419
3,0922,869
In millions of Euros
2003 2004 2005 2006 2007 2003 2004 2005 2006 2007
3.500
3.000
2.500
2.000
1.500
1.000
500
0
In millions of Euros
769801824 874
3,1403,166
3,479
3,778
802
3,343
Drug costs Pharmacy fee

16 17
In 2007, pharmacy fees amounted to € 874 million. This is € 50 million, or 6.1%, more than in 2006. The most important component of the pharmacy fee is the fixed fee per prescription that pharmacies are allowed to charge per dispensed prescription drug. As of 1 January 2007, the Dutch Health Care Authority (NZa) set the fixed prescription fee at € 6.10. In 2008, The Dutch Health Care Authority (NZa) reduced this to € 6.00. This is notable, because the Minster of Health had notified the NZa in 2007 that the fixed fee per prescription - in accordance with the 2008 and 2009 Pharmaceutical Care Transition Agreement - must continue to be maintained at its former level.
1.3 Causes of structural growthWithout taking into account the effects of any expenditure cuts and exceptional circumstances, such as the expiry of patents on often-used medicines, there is a structural increase of 9% to 10% in the amount spent on medicines per year. This continuous increase in expenditure on pharmaceutical aid is mainly attributable to the following six structural growth factors, namely:• shiftinconsumptionpatterntonewer,oftenmoreexpensivemedicines;• shiftinhealthcareservicesfromthehospitaltothehome;• admissionofnewmedicinestothestatutorilyinsureddrugpackage;• changeinprescriptionandconsumptionbehavioursuchaswiththe
increase in chronic use of drugs;• ageingoftheDutchpopulation;• growthoftheDutchpopulation.
Shift in consumption pattern to newer, often more expensive medicines With WMG medicines (prescription medicines that fall under the Health Care Market Regulation Act), the medicine costs per prescription have risen from an average of € 19.85 in 1998 to € 26.66 in 2007. This corresponds with an average annual increase of 3.3%. In the period until 2004, the costs per WMG prescription increased by approximately 5.0% a year. In 2004, the costs per WMG prescription did not increase any further, but in fact dropped. This cost decrease was a direct result of the 2004 covenant between the Ministry of Health, Welfare and Sport (VWS), the Royal Dutch Association for the Advancement of Pharmacy (KNMP), Dutch Health Insurers (ZN) and the Association of the Dutch Generic Medicines Industry (Bogin). The costs per WMG prescription increase by 2.4% in 2007.
1.03 Medicine costs per WMG prescription
Source: Foundation for Pharmaceutical Statistics
Under pressure from the Drug Price Act, the introduction and increase of the clawback and the 2004 covenant and its extension to 2007 (see paragraph 2.2.5 and 2.2.6), prices of prescription medicines have on average fallen by more than 34% since 1998 (see graph 2.03). Without these measures, the average costs per supplied drug would double in ten years’ time.
The most important explanation for the cost increase per prescribed medicine is the shift in consumption towards more expensive medicines. Regardless of the year of introduction, the expenditures on medicines costing more than € 500 per prescription increased substantially in the past five years. Turnover of these medicines increased from € 333 million in 2003 to € 704 million in 2007. Compared to 2006, this is a growth of € 131 million; 37% of the total expenditure increase. An increasing larger portion of these expensive medicines find their way through channels other than the mainstream neighbourhood pharmacy. This phenomenon is also called unique delivery or selective distribution of specialized medicines.
1998 1999 2000 2001 2002 2003 2004 2005 2006 2007
25
20
15
10
5
0
In Euros
25.3024.72
23.46
20.9919.85
26.02 26.66
22.08
25.38 25.96

18 19
1.04 Drug expenditures costing more than € 500 per prescription
Source: Foundation for Pharmaceutical Statistics
The expensive drugs are not necessarily the newest medicines. Since 2001, recently developed medicines take up less of the care budget than in previous years. At the end of the 1990s, the medicines that were on the market for three years or less still accounted for 9% to 10% of the total drug costs. Since the millennium change, the proportion of cost of new medicines dropped to just above 6%. In the past year, this proportion has further gone down to the lowest percentage in the past 10 years, namely by 3.4%. This drop is related to the fact that in the past years fewer new medicines have become available than was previously the case. In 2007, community pharmacies dispensed over € 3.8 billion’s worth of prescription drugs, of which €127 million concerns drugs that were introduced in the previous three years.Developing medicines is a costly affair. That is why new medicines usually have a higher cost price. The cost price of medicines introduced from 2004 onwards is at an average price of €121 per prescribed medicine, almost five times as high as the average price for the total group of prescription medicines. Nevertheless, it can be noted that new medicine therapies can lead to cost savings elsewhere within the healthcare sector. Compared to other forms of healthcare, drug therapy is a very effective method of treatment.
In general, medical specialists tend to prescribe more expensive medicines than general practitioners. In 2007, a prescription drug prescribed by a specialist costs on average € 52 (including pharmacy fees). For general practitioners the average costs per prescription were € 21. The higher costs per prescription for specialist prescriptions are partly caused by a difference in the quantity of
medicines that are prescribed per time. On average, specialists prescribe 52 defined daily doses (DDD) per prescription, against 48 defined daily doses per prescription for general practitioners. Furthermore, medical specialists are more often found to prescribe recently developed medicines. New drugs are usually more expensive than existing drugs. Because these new medicines are still patented, there are also no cheaper generic variants available. Of the prescription medicines that specialists prescribe, 4.4% has been available in the Netherlands for five years or less. For general practitioners, the share of such recently introduced drugs remains limited to 2.2%. In 2007, a total of 23 million prescription medicines were dispensed by a specialist. The difference in costs per prescription is also influenced by differences between the patient populations of general practitioners and medical specialists.
Shift in health care services from the hospital to the homeThe decrease in the number of patient-days and the reduction in the number of hospital beds in the past few years demonstrate how healthcare is increasingly shifting from the hospital to care at home. Thus, in spite of the average population growth of 0.55% per year, the total number of patient-days has been reduced by almost a quarter since 1990. In 1990, the Netherlands still had a hospital capacity of 43 beds for every 10,000 inhabitants. Meanwhile this has dropped to 32 beds for every 10,000 inhabitants. In the longer term, this capacity will be further reduced to 25 beds for every 10,000 inhabitants. Through longer waiting lists and shorter hospitalisation periods (the average hospital stay has been shortened by 20%), this development leads to a shift within healthcare from the intramural to the extramural sector. In a financial sense, the pharmaceutical sector thus functions as a valve within the healthcare sector: cutbacks and savings elsewhere in healthcare regularly lead to higher costs in the pharmaceutical sector. The effect this shift has on the increase in medicine use in the Netherlands is estimated at some 3% per year. Admission of new medicines to the statutorily insured drug package Upon the advice of the Dutch Health Care Insurance Board (CVZ) the government determines its policy with regard to the inclusion of new medicines in the statutorily insured drug package. Medicines that are judged as therapeutically unique at that particular moment by the Ministry of Health, Welfare and Sport (VWS) are placed on the so-called ‘Bijlage 1B’ (Enclosure 1B) list. This list chiefly concerns new and innovative medicines that are fully reimbursed by the health insurance companies. In 2007, the costs of medicines listed in ‘Bijlage 1B’ increased by 6.7% to € 582 million. There were merely about a dozen new drugs placed on the ‘Bijlage 1B’ list. Merely a few were above a turnover of more than € 1 million. The medicine mentioned in ‘Bijlage 1B’ with the highest turnover is the bronchodilator, tiotropium (Spiriva®).
2002 2003 2004 2005 2006 2007
800
700
600
500
400
300
200
100
0
573
704
492
389
256
333
In millions of Euros
20 21
Expenditure on this medicine came to € 60 million. In 2006, tiotropium had the largest cost increase. In 2007 the largest cost increase is the combination drug of tenofovir with emtricitabine (Truvada®). This HIV inhibitor was included in the basic health care package in October 2006, which resulted in a biased comparison of the increase from 2006 to 2007. The increase in the expenditures of this drug preparation is chiefly at the expense of the individual preparations tenofovir (Viread®) and emtricitabine (Emtriva®). These drugs therefore belong to the largest cost decreases in ‘Bijlage 1B’. The absolute largest cost decrease was the fentanyl patches which fall under the category of the Opium Act. The expiration of the patent provided more generic options and the original (Durogesic®) disappeared from the ‘Bijlage 1B’ list.
Changed prescription and consumption behaviourFrom a European perspective, the average Dutch person does not consume a lot of medicines (see also Chapter 3). Drugs are prescribed in approximately two-thirds of the cases that a patient consults with a general practitioner in the Netherlands. In more southern European countries, this percentage can exceed 90%. According to the research institute IMS Health, an average of 15% to 40% more medicines are prescribed in countries such as Belgium, France and Spain than are in the Netherlands.
The steady medicine cost increase can partially be explained by the fact that doctors are prescribing ever-larger quantities of medicines per prescription. In 2007, the average prescription length came out to be 48 days. This is a decrease of 0.3% in comparison with the year prior. By comparison: in 1991, only an average 38-day supply was provided. This development may be explained by an increase in the chronic use of drugs. When somebody is prescribed a specific drug for the first time, the average supply will last the patient 15 days. After that, a maximum dose of 30 or 90 days applies. Only contraceptives form an exception to this. In October 2003, it was determined that per prescription a quantity of oral contraceptives can be dispensed that is sufficient for a whole year. Until 2006, the limit of the maximum amount to reimburse was established in a legal prescription directive. At the time, the prescription directive was enforced to prevent wasting unused medicines. The prescription regulation expired in the new Health Care Insurance Act (ZFW) and the Health Care Insurance Decree, which is based on that. From that moment on, it was up to the health insurers to make agreements with pharmacies regarding this. Most of the health insurance companies have included the old prescription regulations in their policy terms and conditions.
The increased chronic use of drugs also appears from the growing number of repeat prescriptions that are processed by pharmacies. By far most of the prescriptions that doctors write are repeats of earlier prescriptions. In 74%
of cases, prescription medicines are supplied that were dispensed to the same patient by the same pharmacy shortly before. In 2003, only 68% of prescriptions were repeat prescriptions. On an annual basis, this amounts to 102 million repeat prescriptions, compared to 36 million first dispensations. For medicines like cholesterol-reducers, beta-blockers, antidepressants and sleep-inducing drugs, it is actually in more than 90% of cases that the same medicine is again supplied to the same patient by the same pharmacy. These figures confirm the chronic nature of many drug therapies. There is a strong connection between the chronic use of drugs and the age of patients. On average, for patients in the age category up to 40 years, 52% of all dispensed drugs are repeat prescriptions; whilst for senior-citizens this runs up to 84%.
Ageing of the Dutch population In the Netherlands, 2,368,000 inhabitants are 65 years and older. This number corresponds with 14% of the total population. According to Statistics Netherland (CBS), in the year 2010 the number of elderly people in the Netherlands will have risen to 2,520,000 (15%) and in 2020 to 3,281,000 (20%). At the current rate of use and cost of medicines, the changing composition of the population would cause the total drug expenditure to increase by an additional € 46 million annually until 2020, which is 1.0 % per year. In 2020, the ageing populations’ medicine use will be more than 10% higher than in 2007. If the increase in drug use as a result of population growth is also included in the calculation, then the structural increase due to demographic developments amounts to 13%. According to the population prognosis by Statistics Netherlands (CBS), the aging of the population will reach its peak around 2040. Dutch people of 65 years and older consume three times as many drugs as the average Dutch person. For those people aged 75 years and above, the consumption pattern even increases to four times the level of the average Dutch person. Medicines in this age group are also for the most part taken chronically: more than four out of five prescriptions that senior citizens hand in at their pharmacies are repeat prescriptions. Every day, the average senior citizen uses three different medicines simultaneously.
The higher drug consumption among older people translates to proportionally higher drug expenditure. Of the € 4.7 billion that was spent in 2007 on medicines via community pharmacies, € 1.9 billion (40%) relates to people of 65 years and over. Most money was spent on gastric acid suppressors, cholesterol-reducing medicines and medicines applied for asthma/ COPD. In first position, is the cholesterol-reducer atorvastatin (Lipitor®), on which € 81 million was spent in 2007 by people from the age category concerned. Number two is the gastric acid suppressor pantoprazole (Pantozol®) with

22 23
€ 55 million. In the third-place is salmeterol with an inflammation-inhibitor (Seretide®) with € 51 million. Number four is omeprazole (Losec®) with € 47 million; and the fifth place is taken by simvastatin (Zocor®) with € 43 million.
The most frequently used drug by older people in 2007 is metoprolol with more than 2.1 million prescriptions. This medicine is used among other things for hypertension and angina pectoris. In second place is antiplatelet agent acetylsalicylic acid (2.0 million prescriptions) followed by the cholesterol-reducer simvastatin (1.5 million prescriptions). In the fourth position is the diuretic furosemide (1.4 million prescriptions). The sleep-inducer temazepam rounds off the top five with 1.4 million prescriptions. One year earlier, this medicine stood in the third place of the drugs most used by the elderly. The decrease is the result of an increase of the use of other medicines in the top five, while the use of temazepam practically remains the same.
1.05 Drug consumption per age group in 2007 (in number of prescriptions)
Source: Foundation for Pharmaceutical Statistics
1.06 Drug expenditure per age group in 2007
Source: Foundation for Pharmaceutical Statistics
Women use more drugs than men do. In 2007, community pharmacies supplied drugs to women 86 million times in comparison to 59 million times to men. Women therefore consume 1.5 times as many medicines as men. In the past the use of contraceptives still played a limited role in this higher consumption by women. As of 1 January 2004, the contraceptive pill for women 21 and older is no longer standard reimbursed. This cases the ‘pill effect’ in the above-mentioned figures to be fractional. The fact that women have a higher life expectancy does play an important role. For all age groups – with the exception of the ‘young children’ category – it applies that women use more drugs than men do. The difference in drug use between the sexes is 60% attributable to a female effect and 40% attributable to an age effect. Women use more antidepressants, anti-inflammatory medicines (NSAIDs), tranquilizers and sleep-inducing tablets than men do, but fewer antitrhombotics and cholesterol-reducers.The difference between men and women is smaller in terms of medicine expenditures, because men consume more expensive drugs on average. Women pay 1.2 times as much money on medicines than do men.
0-1 2-10 11-20 21-40 41-64 65-69 70-74 ≥75 years Average year years years years years years years Dutch person
35
30
25
20
15
10
5
0
9.7
23.8
39.7
18.9
4.63.0
2.22.8
10.4
0-1 2-10 11-20 21-40 41-64 65-69 70-74 ≥75 years Average year years years years years years years Dutch person
1000
900
800
700
600
500
400
300
200
100
0
In Euros
310
805
1,009
669
146104
5878
375

24 25
1.07 Drug consumption (in number of prescriptions) and expenditure based on gender in 2007
Source: Foundation for Pharmaceutical Statistics
Growth of the Dutch population Figures from Statistics Netherlands (CBS) show that the Dutch population increased by 0.3% in 2007. The number of inhabitants increased from 16,357,992 in 2007 to 16,404,282 on 1 January 2008. In comparison with the first years of this century, the population growth can still be considered low. The population growth is somewhat higher than expected chiefly due to immigration from other European Union countries. For the coming years, Statistics Netherlands (CBS) expects a population growth of approximately 0.2% per year.
Higher market share of community pharmaciesThe Foundation for Pharmaceutical Statistics (SFK) only registers the amount spent on medicines in community pharmacies. In scarcely populated areas where it is not economically feasible to operate a community pharmacy, pharmaceutical care is provided by dispensing general practitioners. Based on figures from the Health Care Insurance Board (CVZ) it can be concluded that the market share of community pharmacies is growing at the expense of the market share of dispensing general practitioners. In 1997, 89.8% of
the people with National Health Care Insurance registered with a community pharmacy. In 2007, the market share of pharmacies amounted to 92.1%. According to the Netherlands Institute for Health Services Research (NIVEL), there were 568 dispensing general practitioners in the Netherlands on 1 January 2007. The number of dispensing general practitioner practices at the beginning of 2006 amounted to 480. In 1996, there were still 702.
1.4 Good runnersMore than 60% of the total medicine expenditure in the Netherlands can be traced back to four groups of medicines. Number of patients1 Cardiovascular medicines € 1,025 million 3.2 million (cholesterol-reducing medicines and such)2 Gastric medicines € 693 million 3.0 million (Gastric acid suppressors and such)3 Medicines for the central € 670 million 2.9 million nervous system (antidepressants, pain killers, sleep-inducing medicines and others)4 Medicines for the respiratory system € 497 million 2.4 million (medicine for asthma, chronic lung diseases and such) 5 Other medicines € 1,766 million
Total expenditure € 4,652 million 10.4 million
The number of patients that picked up a cardiovascular medicine from a community pharmacy in the last six months of 2007 amounted to 3.2 million. Three million Dutch people received a gastric medicine prescription, such as a gastric acid inhibitor. Naturally, it happens that patients use medicines from different medicine groups simultaneously. Therefore, the number of users of the various medicines cannot be added up.In total, 10.4 million Dutch were prescribed one ore more medicines via a community pharmacy in the last months of 2007. This corresponds with 70% of the total patient population that is served by pharmacies.
Further detailed to substance level, the 10 medicines with the highest turnover rate in the community pharmacies account for a total expenditure of € 911 million. This is 20% of the total expenditure in 2007. Top 10 medicines are on average twice as expensive as an average medicine. These good runners for a significant part determine the increase in the average costs of prescription drugs in recent years.
12
10
8
6
4
2
0
In Euros
Use of drugs Medicine expenditure
Male Female Average Dutch person
300
250
200
150
100
50
0Male Female Average
Dutch person
7.9
11.3
9.7
289
329310

26 27
Cholesterol-reducing medicinesIn 2007, € 380 million worth of cholesterol-reducing medicines was dispensed via community pharmacies. Compared to last year, this is a growth of € 26 million, or 7%. The expenditures increased less rapidly than did the use. Measures in the number of dispensations, as well as DDD’s, increased by 9% and almost 11%, respectively. This means that general practitioners chose a cheaper cholesterol-reducer relatively more often. The number of users that received a cholesterol-reducing medicine via a pharmacy increased from 1,308,000 in 2006 to 1,369,000 people in the second half of 2007. Anyone who starts using a cholesterol-reducer will usually continue taking this type of medicine for the rest of his or her life.
Of the 6.4 million prescriptions for cholesterol-reducing medicines in 2006, 94% concerns the group of cholesterol synthesis inhibitors (statins). The number of supplied statins almost doubled in the last four years from 3.6 million to 6.0 million. This corresponds with a 14% average annual increase. During the past year, the number of dispensations increased much less substantially than during the previous year. After a broadcast by the TV program Radar on 5 March 2007, the number of people who discontinued use increased by 35%. Moreover, the number of people who started a statin treatment decreased by one-third after the broadcast. As a result, the number of consumers of statins decreased for the first time in years during the spring of 2007. During the second half of the year, consumption increased once again. In the past four years, the expenditures on this group increased from € 318 million to € 354 million. Thanks to the price reductions that resulted from the agreements by the government with the sector and the expiry of the patents on the frequently consumed simvastatin (2003) and on pravastatin (2004), the average price level for the various statins fell considerably. As a result, the increase in turnover in the period 2003 up to and including 2007 remained limited to an average of 2.7% per year.
The cholesterol-reducer on which most money was spent is atorvastatin (Lipitor®). In 2007, turnover of this medicine increased from € 162 million to €167 million. This comes down to an increase of 3.2%. Despite this limited increase, atorvastatin maintains the first position in the top 10 medicine expenditures of 2007. The expenditure increase remained somewhat mild in comparison with the increase of the use of this medicine also. The number of dispensations grew by 5.1% to 1,833,000. Just as in 2006, the consumption of simvastatin (Zocor®) increased more substantially than it did the other statins. The number of dispensations of simvastatin increased by 18% to 2,578,000. In the fourth quarter of 2007, community pharmacies dispensed the generic variety in more than 97% of all the cases. Only the consumption of rosuvastatin kept pace with simvastatin to some extent. The number of dispensations from this drug increased 14% more than the average.
Rosuvastatin now has the third position under cholesterol-reducers when measured based on turnover. The other cholesterol-reducing medicines have merely a limited share in the dispensations and expenditures. The exceptions are the relatively new medicine, ezetimib (Ezetrol®) and the combination thereof with simvastatin (Inegy®). In 2006, the expenditures on these medicines came out to be € 35 million four 333,000 dispensations. In comparison with the previous year, that comes down to an increase of 43% and 38%, respectively. In particular, the use of the combination ezetimib with simvastatin increased considerably. Gastric acid suppressorsIn 2007, € 303 million was spent on gastric acid inhibitors dispensed via the community pharmacies; € 15 million more than the previous year. Of the total turnover, € 285 million (94%) was spent on medicines from the category of proton pump inhibitors. This category includes among other things omeprazole, pantoprazole and esomeprazole. In recent years, the number of prescriptions for proton pump inhibitors increased from 3.7 million in 2003 to 6.2 million in 2007; an annual growth of 13%. This increase was partially at the expense of H2 antagonists such as ranitidine, and cimetidine. In 2007, a total of 1,403,000 people received a prescription for a proton pump inhibitor.
Omeprazole (Losec®) remains the most used gastric acid suppressor. With € 3.0 million, the medicine, of which the patent expired in 2002, ranks second in the top 10 of medicines on which the most money is spent. This is 1.1 million prescriptions more than the competitor pantoprazole (Pantozol®), which now also ranks in the top 10 most dispensed medications. However, in 2007, the turnover for pantoprazole is € 6 million higher than that of omeprazole. The turnover of pantoprazole grew by 9% to € 106 million. With this, pantoprazole occupies the third position, and omeprazole the fourth position in the top 10 of medicines with the highest expenditure. The third, proton pump inhibitor in the top 10 of medicines with the highest expenditure is esomeprazole (Nexium®). Expenditures on this medicine increased by 10% to € 61 million.
Medical specialists more often than general practitioners prefer prescribing pantoprazole and esomeprazole to omeprazole. Within the group of proton pump inhibitors, general practitioners choose omeprazole somewhat more than half the cases. Among medical specialist the proportion of omeprazole remains limited to almost 30%.
AntidepressantsThe stagnating growth of antidepressants in 2005 seems to have been incidental. In 2007, again the Dutch consumed fewer antidepressants than

28 29
in the previous year. In the last six months of 2007, the community pharmacies supplied antidepressants to 811,000 people. In the same period in 2006, this concerned 762,000 people. Approximately 14,000 youths under the age of 21 use an anti-depressive.
The number of prescriptions has risen by 6% to 6.2 million. In particular, the use of antidepressants that are still under a patent saw a relatively substantial increase. More then 60% can be attributed to this group, with which venlafaxine (Efexor®), escitalopram (Lexapro®) and duloxetine (Cymbalta®) are growing and most significantly. To the contrary, the expenditures remain practically equal and came out to an amount of € 157 million. This is correlated with the price reductions that result from the covenant and from the reduction of the legislated maximum prices.
With 1.4 million prescriptions, paroxetine remains in the lead within the antidepressants category, but was dispensed 34,000 fewer times in than in 2006. The medicine must continually relinquish territory to venlafaxine (Efexor®) and citalopram (Cipramil®). The number of prescriptions for both medications increased by 13%. The consumption of citalopram is probably increasing; however, the laevorotatory isomer escitalopram (Lexapro®) is increasing considerably more. The number of dispensations of escitalopram grew by 68%. The original manufacturer of citalopram does how to partially compensate for its loss in market share through the introduction of generics.
Asthma/COPDIn 2007, the community pharmacies dispensed medicine for asthma and COPD 6.8 million times to the amount of € 377 million. Almost half of the turnover comes from the combination preparations of inflammation inhibitors with bronchodilators. The two most significant types of medicines for asthma and COPD are bronchodilators and inflammation inhibitors. In 2007, community pharmacies dispensed a bronchodilator 3.4 million times for the total amount of € 126 million. Inflammation inhibitors were dispensed 1.2 million times. These two types of medications combined amounted to an expenditure of € 53 million. Combination preparations of inflammation inhibitors with bronchodilators were dispensed 1.8 million times, and had a € 181 million turnover.
The expenditure growth on drugs administered for asthma and COPD has shown the same upward trend for a few years now. This is caused by an increasing consumption of medicines, particularly the combination preparations (+13%). The increase in the expenditure for the combination salmeterol with fluticason (Seretide®) persists. In 2007, € 123 million was spent on this medicine, € 12 million (+11%) more than in 2006. This amount also consists of the fixed fee per prescription for the service of the pharmacy. The consumption of Symbicort® also continues to increase. In 2007, Symbicort® was dispensed via community
pharmacies 634,000 times. The total turnover of Symbicort® amounted to € 59 million, € 9 million (+19%) more than in the previous year.
Tiotropium (Spiriva®) is a bronchodilator prescribed for COPD. Since its entry on the market in the second quarter of 2002, expenditure has risen substantially. In 2007, turnover of tiotropium went up by € 7 million to € 60 million (+14%). In the past year, the medicine was supplied 681,000 times, which is 68,000 times more than in 2006 (+14%).
Prompt dispensingThe TNF alpha-inhibitors, adalimumab and etanercept take the high positions in the top 10 of medicines with the highest expenditure. Adalimumab and etanercept belong to the TNF alpha-blocking agents that are prescribed for serious forms of rheumatism, among other things. In 2007, the turnover of both medicines mutually grew substantially. Etanercept (Enbrel®) holds the sixth place in the top 10 with a turnover of € 80 million. This is an increase of more than 20% compared to 2006. This increase goes completely past the mainstream community pharmacy. That already entirely applies to adalimumab (Humira®), because nearly all dispensations of this medicine transpire almost exclusively via one exclusive pharmacy. Adalimumab is in the second place again with a turnover of € 73 million; an increase of 18% in comparison with 2006.
Adalimumab and etanercept are considered to be prompt dispensations. This phenomenon is also called unique delivery or selective distribution of specialized medicines. The medicines that find their way to the patients in this manner, all have in common that they are intended for a relatively small patient group, and that they usually are administered via injections and that they are expensive. These medicines cannot be delivered by every community pharmacy, just like that. Manufacturers deliberately choose not to supply these medicines by way of every wholesaler, which is more common, but rather they merely deal with one party. Examples of companies that embark on this market are Red Swan, Apotheekzorg, Klinerva, Medizorg and Alloga. They provide some medications directly to the patient. In that case, it is not possible for the mainstream pharmacy to provide this medicine. There are also medicines that are part of the direct delivery, with which it is possible that the patient can receive the prescribed medicine at a self-chosen pharmacy.
The number of drugs that are selectively distributed as well as its accompanying turnover has a relatively substantial growth. In 2007, the expenditures of the medicines involved amounted to € 518 million. This is an increase of 25% compared to the previous year. This increase takes place practically entirely via the companies that focus on direct deliveries. The expenditures via mainstream community pharmacies remained practically the same from 2004 through 2007.

30 31
1.08 Expenditures on prompt dispensing via selected and mainstream community pharmacies
Source: Foundation for Pharmaceutical Statistics
Metoprolol the most dispensed drugIn 2007, the selective beta-blocker metoprolol (Lopresor®, Selokeen®) was the most dispensed medicine via community pharmacies. Metoprolol, which is used to treat cardiovascular conditions, was supplied 3.7 million times in the past year, which is 316,000 times more than in 2006. Over half of all dispensations of metoprolol go to people of 65 years and over. The greater consumption has also led to a turnover growth. Expenditure on metoprolol has risen to € 64 million, keeping it at its eighth position in the top 10 medication expenditure list.
The tranquilizers oxazepam and temazepam gradually decrease in the top 10. Oxazepam (Seresta®), which was still the most dispensed medicine in 2004, is in third position in 2007. In the past year, oxazepam was dispensed 2,972,000 times via Dutch pharmacies. This medicine is used for fear, tension, restlessness and anxiety. When taken at night, it promotes sleep. Competitor temazepam (Normison®), was chiefly used for sleep disorders, was dispensed 2,579,000 times in 2007 and is in fifth place. Together, oxazepam and temazepam account for half of all dispensed benzodiazepines. Minister Klink of the Ministry of Public Health, Welfare and Sport (VWS) intends to take the benzodiazepines out of the public health care package to a large extent in 2009.
1.09 Top 10 medicine expenditures in 2007
Substance Brand name Type of medicine Expenditures (€)
1 C10AA05 Atorvastatin (1) Lipitor® Cholesterol-reducing 167 million
2 R03AK06 Salmeterol with
fluticason (2)
Seretide® In respiratory conditions 123 million
3 A02BC02 Pantoprazole (3) Pantozol® Inhibits the production of
stomach acid
106 million
4 A02BC01 Omeprazole (4) Losec® Inhibits the production of
stomach acid
100 million
5 L04AB01 Etanercept (6) Enbrel® In rheumatism 80 million
6 L04AA11 Simvastatin (5) Zocor® Cholesterol-reducing 78 million
7 L04AB04 Adalimumab (7) Humira® In rheumatism 73 million
8 C07AB02 Metropolol (8) Lopresor®
Selokeen®
In cardiovascular conditions 64 million
9 A02BC05 Esomeprazole (9) Nexium® Inhibits the production of
stomach acid
61 million
10 R03BB04 Tiotropium (10) Spiriva® In respiratory conditions 60 million
Source: Foundation for Pharmaceutical Statistics
1.10 Top 10 medicine expenditure increased in 2007
Substance Brand name Type of medicineExpenditures
increase (€)
1 J05AR03 Tenofovir with
emtricitabine (-)
Truvada® For HIV 15 million
2 L04AB01 Etanercept (2) Enbrel® In rheumatism 13 million
3 R03AK06 Salmeterol with
fluticason (6)
Seretide® In respiratory conditions 12 million
4 L04AB04 Adalimumab (1) Humira® In rheumatism 11 million
5 C10AA01 Simvastatin (4) Zocor® Cholesterol-reducing 10 million
6 R03AK07 Formoterol with
budesonide (9)
Symbicort® In respiratory conditions 9 million
7 A02BC02 Pantoprazole (5) Pantozol® Inhibits the production of
stomach acid
9 million
8 N06BA04 Methylfenidaat (-) Concerta®,
Ritalin®
For ADHD 8 million
9 R03BB04 Tiotropium (8) Spiriva® In respiratory conditions 7 million
10 V01AA Allergy extracts (-) Other
preparations
For allergies 7 million
Source: Foundation for Pharmaceutical Statistics
2004 2005 2006 2007
600
500
400
300
200
100
0
272259
268266
Mainstream community pharmacies Selected pharmacies
41
100
164
250
In millions of Euros

32 33
1.11 Top 10 medicine prescriptions 2007
Substance Brand name Type of medicine Prescriptions
1 C07AB02 Metoprolol (1) Lopresor®,
Selokeen®
In cardiovascular conditions 3,672,000
2 A02BC01 Omeprazole (4) Losec® Inhibits the production of
stomach acid
2,988,000
3 N05BA04 Oxazepam (2) Seresta® Sedatives 2,972,000
4 B01AC06 Acetylsalicylic acid (3) Aspirine® Blood platelet aggregation
inhibitor
2,729,000
5 N05CD07 Temazepam (5) Normison® Sleep-inducers 2,579,000
6 C10AA01 Simvastatin (7) Zocor® Cholesterol-reducing 2,578,000
7 M01AB05 Diclofenac (6) Voltaren® Painkillers 2,397,000
8 A10BA02 Metformin (8) Glucophage® In diabetes 2,185,000
9 B01AC08 Carbasalate calcium (9) Ascal® Blood platelet aggregation
inhibitor
2,014,000
10 A02BC02 Pantoprazole (-) Pantozol® Inhibits the production of
stomach acid
1,884,000
Source: Foundation for Pharmaceutical Statistics
1.12 Top 10 increasing medicine prescriptions 2007
Substance Brand name Type of medicineIncreased
prescriptions
1 A02BC01 Omeprazole (3) Losec® Inhibits the production of
stomach acid
454,000
2 C07AB02 Metoprolol (2) Lopresor®,
Selokeen®
In cardiovascular conditions 316,000
3 C10AA01 Simvastatin (1) Zocor® Cholesterol-reducing 289,000
4 A02BC02 Pantoprazole (7) Pantozol® Inhibits the production of
stomach acid
251,000
5 A10BA02 Metformine (5) Glucophage®In diabetes 235,000
6 C03AA03 Hydrochlorthiazide (6) Other Diuretics 179,000
7 A06AD65 Macrogol, combination
preperations(-)
Other For constipation 164,000
8 B01AC06 Acetylsalicylic acid (4) Aspirine® Blood platelet aggregation
inhibitor
162,000
9 H03AA01 Levothyroxine (-) Other Thyroid hormone 156,000
10 A12AX Calcium with other
medicines (-)
Other For calcium deficiency 144,000
Source: Foundation for Pharmaceutical Statistics
TAKE NOTE: Besides the brand names mentioned in Table 1.09 up to and including 1.12, in some cases
the generic variants have been included in the listed figures. The figures between the brackets after the
substance name in Table 1.09 through 1.12 represent the position in the top 10 in 2006.
1.5 Market shares of product groupsAmong prescription medicines, the following product categories can be distinguished.
Proprietary medicinal productsBranded medicines developed by the manufacturer that are, or were, patented.
Pharmaceutical importsBranded medicines that are imported outside the official channel of the manufacturer from countries within the European Union, where prices are lower than in the Netherlands.
Generic medicinesMedicines modelled after branded medicines of which the patent has expired; they do not carry a brand name, but the name of the active substance. Generic medicines can be classified into the following categories:• tabletsandcapsules• genericbrands Generic medicines for which the name of the manufacturer is linked to
the medicine’s generic name• pharmaceuticalpreparations Generic medicines administered in another ways than in tablets or capsules
Pharmacy-made productsMedicines prepared in the community pharmacy.
The market share of pre-packaged, unbranded medicines, the so-called ‘generic’ medicines, has been increasing considerably in the last few years. In 2007, half of all dispensations concerned a generic medicine. Where the market share of this group was still only 28% in 1995, this has meanwhile run up to 54%. In 2007, generic medicines were dispensed on prescription 78 million times via the community pharmacy. This is an increase of more than 6.5% compared to 2006. The development is connected to the best-efforts obligation that pharmacies agreed upon with the government in the covenant; to promote the use of cheaper generic medications. The number of generic dispensations did indeed grow above average, but, because of a lower price level, the medication costs saw a less than average increase. This caused a decrease in the generic share in the costs by almost 1 percentage point to 21% in 2007. Another reason for this reduction is that in recent years, relatively few medicines had an expired patent and therefore fewer new generic medications were placed on the market.
34 35
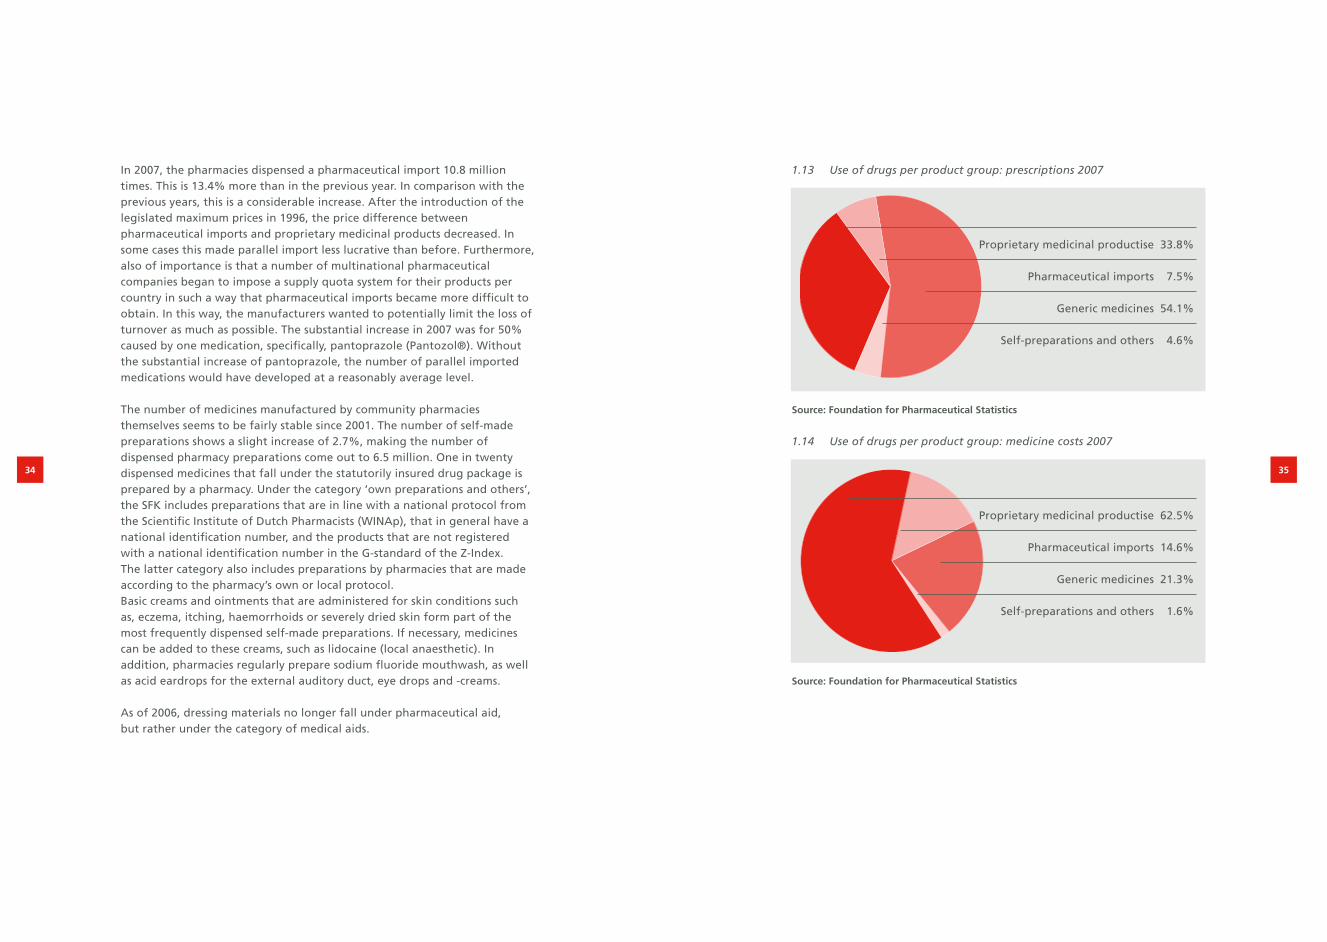
1.13 Use of drugs per product group: prescriptions 2007
Source: Foundation for Pharmaceutical Statistics
1.14 Use of drugs per product group: medicine costs 2007
Source: Foundation for Pharmaceutical Statistics
In 2007, the pharmacies dispensed a pharmaceutical import 10.8 million times. This is 13.4% more than in the previous year. In comparison with the previous years, this is a considerable increase. After the introduction of the legislated maximum prices in 1996, the price difference between pharmaceutical imports and proprietary medicinal products decreased. In some cases this made parallel import less lucrative than before. Furthermore, also of importance is that a number of multinational pharmaceutical companies began to impose a supply quota system for their products per country in such a way that pharmaceutical imports became more difficult to obtain. In this way, the manufacturers wanted to potentially limit the loss of turnover as much as possible. The substantial increase in 2007 was for 50% caused by one medication, specifically, pantoprazole (Pantozol®). Without the substantial increase of pantoprazole, the number of parallel imported medications would have developed at a reasonably average level.
The number of medicines manufactured by community pharmacies themselves seems to be fairly stable since 2001. The number of self-made preparations shows a slight increase of 2.7%, making the number of dispensed pharmacy preparations come out to 6.5 million. One in twenty dispensed medicines that fall under the statutorily insured drug package is prepared by a pharmacy. Under the category ‘own preparations and others’, the SFK includes preparations that are in line with a national protocol from the Scientific Institute of Dutch Pharmacists (WINAp), that in general have a national identification number, and the products that are not registered with a national identification number in the G-standard of the Z-Index. The latter category also includes preparations by pharmacies that are made according to the pharmacy’s own or local protocol. Basic creams and ointments that are administered for skin conditions such as, eczema, itching, haemorrhoids or severely dried skin form part of the most frequently dispensed self-made preparations. If necessary, medicines can be added to these creams, such as lidocaine (local anaesthetic). In addition, pharmacies regularly prepare sodium fluoride mouthwash, as well as acid eardrops for the external auditory duct, eye drops and -creams.
As of 2006, dressing materials no longer fall under pharmaceutical aid, but rather under the category of medical aids.
Proprietary medicinal productise 33.8%
Pharmaceutical imports 7.5%
Generic medicines 54.1%
Self-preparations and others 4.6%
Proprietary medicinal productise 62.5%
Pharmaceutical imports 14.6%
Generic medicines 21.3%
Self-preparations and others 1.6%

36 37
1.15 Development in the use of drugs per product group: prescriptions 2006-2007
Source: Foundation for Pharmaceutical Statistics
1.16 Development in the use of drugs per product group: medicine costs 2006-2007
Source: Foundation for Pharmaceutical Statistics
1.6 Pharmacy feeIn 2007, community pharmacies generated € 874 million worth of fees for their services. This sum includes the fixed fee for WMG prescriptions € 844 million) and the pharmacy margin on medicines that are not covered by the Health Care Market Regulation Act (€ 30 million). The fixed fee per prescription is by far the most important component of the pharmacy fee. In 2007, the fixed fee was € 6.10 per dispensed WMG medicine.
Fee per prescriptionThe pharmacy’s earnings are not in line with the costs of medicines, because the pharmacy fee for dispensing a WMG medicine is linked to the doctor’s prescription and not to the price of the drug. WMG medicines are prescription medicines that are only available in pharmacies and have a fixed fee per prescription. The pharmacist has nothing to gain from (unnecessarily) dispensing expensive medicines. Per prescription, the pharmacist receives a fixed fee, regardless of the price and the quantity of the medicine concerned. Depending on the situation and the kind of medicine, there is however a limit to the quantity supplied: for 15, 30 or 90 days. Since October 2003, contraceptives have a maximum delivery period of 1 year. Before that, this was limited to six months. Within the framework of the new Health Care Insurance Act and the Health Care Insurance Decree based on that, the legal prescription directive, which sets restrictions to the maximum quantities of medicines to be reimbursed, was rescinded in 2006. In most cases, the insurance companies have agreed with pharmacies to maintain the former arrangement.
The fee that pharmacies may charge for their services for each prescribed medicine dispensed was fixed at € 6.10 as of 1 January 2007. With this, it remains the same for the fifth year in a row. On the basis of the Health Care Market Regulation Act (WMG), the Dutch Health Care Authority annually determines the policy regulations for the fixed fee per prescription. For this adjustment, the Dutch Health Care Authority (NZa) takes into account the number of prescriptions per pharmacy (via adjustment of the calculation norm) along with inflation and the labour costs developments. In 2008, the NZa lowered the fixed fee per prescription to € 6.00.
Proprietary Pharmaceutical Generic Self-preparations Total medicinal productise imports medicines and others
14%
12%
10%
8%
6%
4%
2%
0%
5.8%
6.5%
2.7%
13.4%
3.8%
Proprietary Pharmaceutical Generic Self-preparations Total medicinal productise imports medicines and others
16%
13%
10%
8%
6%
4%
2%
0%
8.6%
5.0%
16.7%
12.9%
8.7%

38 39
1.17 Pharmacy fee per WMG prescription
* September – December 2003: € 6.30
Source: Foundation for Pharmaceutical Statistics
2 Cost control
Controlling the collective drug expenditure has for many years been a central theme of the government’s care policy. The government mainly focuses on the prices from drug manufacturers (Section 2.1), the level of the fee the pharmacy may charge (Section 2.2) and the degree in which costs of the medicine consumption can be claimed from the health insurer (Section 2.3). The medicine covenant also played an important part in the price reduction in recent years. Under pressure from an active government policy, the prices of prescription medicines have fallen by more than 40% from 1996 through May 2008 (see Figure 2.03). As a result of the preference policy that diverse healthcare insurers implement, the prices of generic medicines were cut in half in one fell swoop, effective 1 June 2008. For the entire drug package, that involves a price decrease of as much as 8%.
2.1 Drug Price Act (WGP)The Drug Price Act (WGP) was introduced in the Netherlands in 1996. This act stipulates that the official list prices from drug manufacturers cannot exceed the average price of the same drug concerned in the countries surrounding the Netherlands: Belgium, Germany, France and Great Britain. These list prices relate to the trade between manufacturers, importers, wholesalers and pharmacies. The introduction of the act caused prices of drugs in the Netherlands to decrease by an average of 15% in 1996. Twice a year, the Ministry of Public Health adjusts the legal maximum prices on the basis of current figures on price developments in the surrounding countries. Partially under the influence of a strong euro and the pricing policy in the countries surrounding the Netherlands, various maximum prices were lowered in the past years. Under influence of lower maximum prices, the price level of medicines dropped an annual average of 2% in recent years. This trend continues unabated in 2008. The WGP is currently the government’s most significant instrument in influencing and affect on medicine prices.
2.2 Health Care Market Regulation Act (WMG)The Health Care Market Regulation Act (WMG) went into effect on 1 October 2006. The WMG replaced the Health Care Charges Act (WTG). Via the Health Care Market Regulation Act (WMG), the government specifies which maximum rates a pharmacy may charge the person using the medicine or the health insurer with whom the particular user is insured. Here, a distinction is made between a fixed fee for the services provided by the pharmacy, and a (purchase) fee for the prescription medicines supplied by the pharmacy.
The fixed fee per prescription is a fixed amount that the pharmacy may charge per dispensed prescription. Starting point for establishing the amount of the fixed fee is a realistic compensation of the pharmacy practice costs and the
1999 2000 2001 2002 2003* 2004 2005 2006 2007 2008
7
6
5
4
3
2
1
0
In Euros
6.10 6.106.106.00
5.385.08
6.00
5.67
6.10 6.10

40 41
standard income for the established pharmacist as specified by the government (Section 4.3). Previously, the fixed fee per prescription was determined by the Health Care Charges Board (CTG), but with the arrival of the Health Care Market Regulation Act (WMG), the Dutch Health Care Authority (NZa) 2007 has determined the fixed fee per prescription since 2007. The fixed fee per prescription has been set at € 6.10 for the past five years. Effective as of 1 January 2008, the Dutch Health Care Authority (NZa) lowered the fixed fee per prescription to € 6.00 despite the fact that the Transition agreement had agreed to keep the fixed fee per prescription at € 6.10 in 2008 and 2009. Dispensing general practitioners also use the fixed fee as a temporary rate. For patients covered by insurance, dispensing general practitioners receive a subscription rate per insured patient on a quarterly basis, regardless of the number of prescription medications that the person in question receives. As of 1 January 2008, this subscription rate has been set at € 8.90 per quarter. For dispensing general practitioners who have made agreements with the health insurance companies about the separation of care and trade, deviating tariffs apply (€ 8.30 per quarter for people younger than 65, and € 30.10 per quarter for people of 65 years and over).
The Dutch Health Care Authority (NZa) introduced a differentiated fixed fee per prescription as of 1 July 2008. Along with the basic compensation from each prescription regulation that is in effect, there is an additional compensation for supplemental services such as a First Dispensation and (specialized) pharmacy preparations or a surcharge for dispensations that take place during the evening, night or Sundays. Finally, the Dutch Health Care Authority (NZa) has determined a separate delivery charge for deliveries via a weekly dosage system.
2.01 Pharmacy service defrayment per 1 July 2008
Charge Average number of
indications per pharmacy
per year
Average compensation
indication per pharmacy
per year
Basic charge
Standard dispensation
Weekly dosage
€ 5.30
€ 2.90
69,000
12,000
€ 365,700
€ 34,800
Supplemental charge
1st dispensation
Regular preparation
Specialized preparation
Services outside of
normal business hours
€ 1.05
€ 10.60
€ 79.40
€ 10.60
12,700
1,875
165
975
€ 13,400
€ 19,900
€ 13,100
€ 10,300
Total € 457,200
75,000 x € 6.10 = € 457,200
Source: The Dutch Health Care Authority (NZa)/Foundation for Pharmaceutical Statistics
The purchase fee that a pharmacy may charge for dispensing prescription medicines is in principle based on the list price that the medicine supplier (the manufacturer or importer) has specified for the product concerned. In practice, pharmacies can agree discounts for these list prices from their suppliers. These purchase benefits have in the last few years periodically been the subject of debate.
2.2.1 Decontrolling purchase benefitsUntil October 1991, the statutory regulation was that pharmacies were allowed to charge the actually paid net purchase price plus a margin of 4% of the corresponding list price for the supply of prescription medicines. On 1 October 1991, the then State Secretary of Health, Mr Simons, decided to reduce the fixed fee per prescription for reasons of cutbacks. In connection with this measure, pharmacies were allowed to charge the list prices for the prescription medicines supplied and thus to retain all agreed purchase benefits. In this way, the pharmacies could compensate the loss of income from the reduction of the fixed fee.
Because of the more active commercial attitude of pharmacists and the expiry of drug patents (which has led to the arrival of new manufacturers of the drugs concerned and thus to more competition), the purchase benefits realised by pharmacies rose. On the other hand, the height of the fixed fee lagged behind the development of the pharmacy practice costs. This makes the purchase benefits an essential element in the financing of pharmacy practices. During the 1990s, the exceeding of the macro budget for the expenditure on drugs became an annually recurring point of attention for the government. By skimming the purchase benefits realised by pharmacies, the government has been fairly successful, through the introduction of the clawback and making national agreements concerning the pricing development of medicines with an expired patent, the government has been successful in recent years in curbing expenditure to the set budgetary frameworks.
2.2.2 ClawbackIn 1998, the so-called clawback was introduced. Modelled after the British example, the then Minister of Health, Mrs Borst, introduced a legal arrangement that made it compulsory for pharmacies to on-charge part of the realised purchase benefits as a price benefit to the users, respectively the health insurance companies. In 1998, this resulted in an effective discount rate of 2% on an annual basis of the list prices provided by the medicine suppliers (the arrangement was introduced halfway through the year). In 1999, pharmacies were obligated to grant users and health care insurers an effective 3% discount.

42 43
2.2.3 Basic agreementOn 8 October 1999, the Minister of Health concluded an agreement with the Royal Dutch Association for the Advancement of Pharmacy (KNMP) for the period of 1 January 2000 through 31 December 2002. The agreement provided for a gradual increase of the fixed fee per prescription in connection with an adjustment of the clawback from 3% to effectively 6% (formally, the clawback was increased to 6.82% to a maximum of € 6.80 per dispensed prescription). The clawback was based on the findings from an investigation into the scope of the purchase benefits realised by pharmacies, conducted by accounting firm PriceWaterhouseCoopers. The parties subscribed to the starting point that a trade margin of 4% was a realistic compensation for the costs and risks that are associated with the running of a pharmacy. This corresponded to the original situation where 4% of purchase benefits was also considered legally as a regular trade margin (see Section 2.2.1).
2.2.4 De Geus measureInitially, the idea was that once the validity period of this agreement ended, the health insurance companies would carry full responsibility for controlling the expenditure on medicines. However, in the summer of 2002 the health insures took the view that they had insufficient possibilities to curb the expenditure on medicines within the budgetary frameworks defined by the government. They petitioned the Minister of Health to regain control over this matter. On 15 November 2002 the outgoing interim Minister of Health, Mr De Geus, announced an adjustment of the clawback scheme with the objective of realising an extra saving of € 280 million (incl. VAT) on the expenditure on drugs.
On behalf of the pharmacists, the Royal Dutch Association for the Advancement of Pharmacy (KNMP) challenged the scheme. After several legal skirmishes, the Trade and Industry Appeals Tribunal (CBb) granted its preliminary consent to the introduction of the adjusted clawback scheme as of 1 September 2003 on the condition that the government would provide an adequate safety net scheme for pharmacies that would be disproportionally disadvantaged by this measure. Partly because a satisfactory safety net scheme was lacking, the Royal Dutch Association for the Advancement of Pharmacy (KNMP) in 2003 fled full legal proceedings against the scheme. On 18 December 2003, the CBb entered a final judgement in favour of the pharmacists and quashed the related tariff rule. The judge ruled various points of the safety net scheme drawn up by the government as unsubstantial. Partly under the influence of this ruling, the introduction of the so-called WTG Express was accelerated. Within the framework of the WTG Express, which was introduced on 1 February 2005,
the CTG/ZAio (currently The Dutch Health Care Authority, NZa) has among other things the authority to determine binding tariffs for individual health insurance companies. These authorizations were assumed by the Health Care Market Regulation Act (WMG).
2.2.5 Covenant Years 2004-2007Immediately after the decision by the Trade and Industry Appeals Tribunal (CBb), the Ministry of Health, Welfare and Sport (VWS), the Royal Dutch Association for the Advancement of Pharmacy (KNMP) and the Association of Dutch Health Insurers (ZN) began negotiations to reach a solution for the deadlock that had arisen. In consultation with the Association of the Generic Medicines Industry in the Netherlands (Bogin), these discussions resulted in a covenant agreed by the parties involved on 13 February 2004.The most important agreement in this covenant was that parties agreed that as of 1 January 2004, the prices of the generic medicines would be reduced to an average of 40% under the list price level of the of the manufacturers involved. In addition to this, the new generic medicines would be priced 40% below the price level of the corresponding original brand name medicine when placed on the market. Effective 1 January 2005, Nefarma, the representative organization of proprietary suppliers, also joined the medicines covenant. In addition to the rules of the 2004 covenant it was then agreed that manufacturers of proprietary medicinal products would as of 1 January 2005 reduce the prices of prescription medicines for which on “the level of substance and application” similar generic drugs were available, or that proprietary manufacturers would implement compensating price reductions within the single-source segment (medicines for which no generic alternatives are available). To this promise Nefarma did set the condition that during the term of the covenant the government does not sharpen the Drug Reimbursement System (GVS, see Section 2.3).These agreements were continued in 2006 and 2007. With the support of the reduction of maximum prices affected by the Drug Price Act and the expiration of the medicine patents of diverse medicines, the savings objectives agreed in the covenants have been continually realized since 2005.

44 45
2.02 Medicine covenants savings agreements (amounts incl. VAT and dispensing general practitioners’ medicine costs)
Source: Foundation for Pharmaceutical Statistics
2.2.6 Pharmaceutical Care Transaction Agreement 2008-2009On 17 September 2007, Minister Klink from the Ministry of Health, Welfare and Sport (VWS), again closed an agreement with the Association of the Generic Medicines Industry in the Netherlands (Bogin), the Royal Dutch Association for the Advancement of Pharmacy (KNMP), Nefarma and the Association of Dutch Health Insurers (ZN). On the one hand, this involved a continuation and refinements of the cutback agreements from earlier covenants. The parties agreed that the prices of generic medicines should still be reduced by 10% in 2008 and that the new generic medicines that would follow, should be placed on the market for half the price of the corresponding original brand name medicine. Moreover, it was agreed that the clawback of 6.82% would be temporarily increased during the months of December 2007 through June 2008 with a transition surcharge to 11.3%. In addition to the amount of € 215 million (incl. VAT) in purchase benefits that pharmacies and dispensing general practitioners surrender via the existing claw back rule, this means that yet another € 15 million (incl. VAT) in extra purchase benefits would be siphoned off from pharmacies and dispensing general practitioners.
2.03 Price development of prescription drugs based on the SFK price index (January 1996 = 100), sales weighted average
Source: Foundation for Pharmaceutical Statistics
On the other hand, in the Pharmacy Care Transition Agreement 2008-2009, based on a collective procedure to be worked out, it was agreed that parties would work towards a new market condition in which the diverse links within the column are motivated to provide the client with maximum added value and the existing regulation can be cut back.Furthermore, the parties decreed in the Pharmacy Care Transition Agreement that the pharmacies need the purchase benefits, which are established based on the study coordinated by the Dutch Health Care Authority (NZa) (Section 2.2.7), in order to finance their practice costs. With the potentially further cut back, and siphoning off of purchase benefits, pharmacies would have to be compensated one after another via an increase of the pharmacy fees. In the Pharmacy Care Transition Agreement, parties agreed that the fixed fee per prescription in 2008 would remain unchanged for the time being, given the supplemental incomes from purchase benefits. Strikingly enough, the Dutch Health Care Authority (NZa) ignored this agreement, and lowered the fixed fee per prescription for pharmacies as of 1 January 2008. The Royal Dutch Association for the Advancement of Pharmacy (KNMP) began a grievance procedure at the Dutch Health Care Authority (NZa) concerning this.
2004 2005 2006 2007 2008 2009
1.400
1.300
1.200
1.000
900
800
700
600
500
971
1.311
1.427
843
685622
In millions of Euros
50%
60%
70%
80%
90%
100%
Temporary introduction“De Geus” measure
Transition AgreementPreterential policy
Start convenant period
Increase of claw backAgreement VWS-KNMP
Introduction of claw back
Introduction Drug Price Act
1996 1997 1998 1999 2000 2001 2002 2003 2004 2005 2006 2007 2008

46 47
2.2.7 Audit of practice costs and purchase benefitsIn 2007, on behalf of the Ministry of Health, Welfare and Sport (VWS) and in consultation with the Association of Dutch Health Care Insurers, the Royal Dutch Association for the Advancement of Pharmacy (KNMP) and the Dutch Association of General Practitioners (LHV), the Dutch Health Care Authority (NZa) allowed for an audit of the practice costs and the purchase benefits for pharmacists and dispensing general practitioners. The results of this investigation were presented in March 2007.
The audit showed that the reimbursement of the practice costs for the average pharmacies is insufficient to cover the actual costs. The audit of practice costs ascertained that the costs that can be traced directly from the financial administration came out to be € 500,196 per pharmacy in 2004. The pharmacies merely received € 386,031 in fee for pharmacy reimbursements via the fixed fee per prescription rule in 2004. This means that in 2004, the average pharmacy has to finance at least € 114,165 in practice costs via purchase benefits. Either that or the fixed fee prescription would have to be increased by a minimum of € 1.50, if the pharmacies could have agreed upon no purchase benefits. Only the costs that were directly traceable from the pharmacies’ financial administration were included in the audit. The auditors mention that they were not able to determine the costs of packaging and waste. The interest compensation for the out-of-pocket money that pharmacists invest in the pharmacy or have accrued from in property ownership has not yet been established. These posts are estimated to be in the amount of € 45,000 per pharmacy. Total deficit of the fee for pharmacy reimbursement amounts to € 159,000 per pharmacy or about € 2.10 per prescription regulation.
The Dutch Health Care Authority (NZa) examination of the purchase benefits showed that the average pharmacy in 2004 realized a purchase benefit amounting to € 311,000. This is 16.5% of the purchase value. Pharmacists deducted € 98,000 from this via the clawback. Therefore the remaining purchase benefits amounted to € 213,000. As the figures above show, a pharmacy in 2004 needed approximately € 159,000 in purchase benefits to cover the practice costs. An amount of € 54,000 remains outstanding on balance for the pharmacy owner. This does not include the costs and risks that result from running a pharmacy business.
Based on market estimates by the Health Care Insurance Board (CVZ), the Dutch Health Care Authority (NZa) extrapolated the research outcomes from 2004 through to 2008. The expectation was that the average cost percentage of 16.5% in 2004 would increase to 18.9% in 2008. The increase is correlated with the increasing use of generic medicines and the fact that proportionately,
the generic medicines realized the most purchase benefits.Taking into account the fact that the purchase benefits that pharmacies already surrender via the clawback, and taking into account the purchase benefits that pharmacies need to finance the practice costs, the parties in the Pharmacy Care Transition Agreement concluded that in 2008, there is room for increase of the savings objectives by € 340 million to € 1,311 million.If further price decreases lead to more savings, pharmacies should be compensated for that via the pharmacy fee, as Minister Klink has repeatedly confirmed.
Under pressure by the Dutch House of Representatives, Minister Klink had KPMG accounting bureau analyse if the extrapolation of outcomes from the purchase benefits audit by the Dutch Health Care Authority (NZa) are valid and if they are in conjunction with the current situation. To this end, KPMG performed an audit and inspected the bookkeeping at pharmaceutical wholesalers and medicine suppliers. The most important conclusion from the KPMG audit was that these outcomes virtually matched the extrapolations of the outcomes from the Dutch Health Care Authority (NZa) inspection that took place in 2007. Even though the Association of Dutch Health Insurers initially had expressed appreciation for the audit by KPMG and the Association of Dutch Health Insurers itself was involved in the purchase benefit audit by the Dutch Health Care Authority (NZa), as well as the manner with which it was extrapolated, afterwards, the insurers were unsatisfied with the outcomes of the investigation, resulting in the Association of Dutch Health Insurers to appeal to the Dutch House of Representatives for the third time in one year to perform an audit. A motion with this intention by parliamentary member Van der Veen, a chairman of Agis insurance company until the end of 2006, was accepted by the house majority.
2.2.8 Preferential policy leads to price war In the beginning of 2008, a number of healthcare insurers announced they would further expand the preferential policy. The preferential policy includes that an insurer notifies a person insured with a basic policy merely has a right to reimbursement of one of a few variants within a certain medicine cluster. Medicines from a supplier (label) that are not covered by the health insurer are then not entirely reimbursed. Noncompliance of the co-payment rule within the Drug Reimbursement System (Section 2.3) means that the patient would have to pay for potential alternatives entirely out of ones own pocket.The Association of the Generic Medicines Industry in the Netherlands (Bogin) saw this as a breach of the agreements within the Pharmacy Care Transition Agreement. In a legal proceeding that the Bogin introduced, the judge concluded that insurers have these options, although insurers may not introduce this policy with collective agreement. Furthermore, the judge decreed

48 49
As a result of the drastic price decreases for generics, community pharmacies see their purchase benefits from these products disappear at a rapid rate. This means that the pharmacies no longer have financial coverage for practice costs that up until now were paid from these purchase benefits in accordance with the sector wide agreements in the Pharmacy Care Transition Agreement. That is why the Royal Dutch Association for the Advancement of Pharmacy (KNMP) submitted a request to the Dutch Health Care Authority (NZa) to bring the fixed fee per prescription to the cost coverage level (€ 8.25). At the end of June 2008, the Dutch Health Care Authority (NZa) issued a fixed fee per prescription of € 6.10 with a medicine not covered, despite there being a tariff rule. The Royal Dutch Association for the Advancement of Pharmacy (KNMP) began a grievance procedure against this at the Dutch Health Care Authority (NZa), and the Trade and Industry Appeals Tribunal (CBb) sought to reach for a temporary provision for pharmacies. The judge then decided to suspend the clawback rule as of 1 July 2008.
2.3 Drug Reimbursement SystemUp to and including the previous year, patients themselves only had to pay a very limited amount for the medicines dispensed by community pharmacies. The preferential policy introduced in 2008 can change this. In 2007, Dutch patients paid an average of 5.6% of the expenditure on medicines in community pharmacies out of their own pocket. Besides a sum of € 240 million for (medication) products that do not qualify for reimbursement at all, € 34 million extra was paid in within the scope of the Drug Reimbursement System (GVS). This is € 11 million more than in the previous year. Almost 40% of the Drug Reimbursement System (GVS) pays for extended-release methylphenidate (Concerta®, Medikinet CR® and Equasym XL®). The entire additional charge for this medicine came to € 13 million. This amount has almost quadrupled in two years time. Methylphenidate is used for the treatment of children and adults with ADHD. Atomoxetine (Strattera®) is also used for this. We find this medicine in the second place with a small € 5 million in co-payment. The third place is taken by tolterodine (Detrusitol®), a product that is used for incontinence and has an entire co-payment that amounts to € 4 million.
that the Association of Dutch Health Insurers had indeed placed its signature on the Pharmacy Care Transition Agreement; however, this does not mean that individual insurance companies are bound to the agreements in the settlement.
In the spring of 2008, under the leadership of the Ministry of Public Health, Welfare and Sport (VWS), discussions began about analysing if parties in the sector could reach agreement concerning alternative measures that would make the preferential policy unnecessary. Initially, the parties seemed to be in agreement about a substantial price reduction for generic medicines in combination with an increase of the fixed fee per prescription to a more realistic level and an experiment focusing on the promotion of more price flexibility. Although agreement seems to exist at delegation level, a few individual insurers eventually indicated they were unwilling to participate in the savings alternatives. The result is that health care insurers Menzis, UVIT, CZ and Agis have implemented an extensive preferential policy since 1 July 2008. Because of the subtleties in differences in regulations, the insurers seem to have up against earlier objections by the judge.
(Generic) medicine manufacturers were requested to present a new nationwide medicine price for a number of specific medicines mentioned by the insurers, as of 1 June 2008. On the basis of this price quote, the health care insurers designated the medicines that would still be reimbursed as of 1 July 2008. In reality, this comes down to the fact that in most cases only the most inexpensive variants are reimbursed. The nationwide “contractors” of healthcare insurers brought about a real price war among generic medicine suppliers. According to reports, some suppliers lowered their prices below the cost price in order to gain a unique position in the Dutch market. As a result of the preferential policy, a few generic medicines suppliers at seeing their market share drastically dwindle. The big “winner” of the generic suppliers – to the extent that we can speak of a “winner” – is the German Ratiopharm, which has acquired a monopoly position with diverse important medicines. The big loser is Pharmachemie, for whom the turnover of medicines that fall under the preferential policy decreases to a quarter of the original turnover. The prices of the most important generic medicines decreased by an average of 85%. In a few cases, the price is even reduced more than 90%. On balance, the price war leads to a cost decrease of € 355 million annually. Earlier this year the prices of generic medicines were already reduced by € 125 million as a result of the Pharmacy Care Transition Agreement that Minister Klink closed with the medicine sector last year. This cut the turnover of generic medicines in half within a six-month period.
With the preferential policy, a patient has to switch over to another medicine variant 3.4 million times in a brief period because the insurers involved only reimburse the cheapest variant.

50 51
in such an adjustment of the GVS. In November 2005, the Health Care Insurance Board (CVZ) reported its findings on this matter. The CVZ fears that a sharpening of the GVS will lead to a substantial increase in the number of extra payments. To limit the number of extra payments, the CVZ suggests refraining from adjusting the calculation system of the reimbursement limits, but instead to again determine the limits on the basis of the lower, current medicine prices. In February 2007, the Health Care Insurance Board (CVZ) recommended that the minister modernize the Medicine Reimbursement System (GVS). The Health Care Insurance Board (CVZ) proposes that the cluster criteria be adjusted and the absence of a patent on a medicine be allowed to play a part in the reimbursement increase. It is also the intention to adjust the reimbursement limits annually. Because the very radical changes in the composition of the clusters and they require considerable preparation, the Health Care Insurance Board (CVZ) recommends a milder assimilation of the Medicine Reimbursement System (GVS) during the transition period. This assimilation comes down to establishing reimbursement limits on the price level that the generic medicine suppliers had implemented during the covenant.
2.04 Total GVS-contribution via community pharmacies
Source: Foundation for Pharmaceutical Statistics
The GVS was introduced on 1 July 1991. The GVS implies that the Ministry of Health, Welfare and Sport determines whether and to what extent a drug is reimbursed. Medicines that the ministry considers as inter-replaceable are clustered. Per cluster a reimbursement limit has been defined. When the patient uses a drug of which the price exceeds the particular reimbursement limit, the price difference is for the account of the patient. The Ministry of VWS last adjusted the various reimbursement limits in February 1999 on the basis of the then current prices.In April 2004, the Health Care Insurance Board (CVZ) advised to adjust the reimbursement limits on the basis of the current medicine prices, so that the price reductions that ensue from the covenant (see Section 2.2.5) result in new (lower) reimbursement limits. According to the Health Care Insurance Board (CVZ), this would lead to an extra saving of € 170 million (incl. VAT). The CVZ also proposed to attach more importance to the availability of cheaper unbranded drugs when defining reimbursement limits. In the long term, CVZ recommends a normative reduction of the reimbursement limits by 40% the moment the patent on a medicine expires and a second supplier of this product appears. In relation to the covenant for the year 2005 and following years (see Section 2.2.5), Minister Hoogervorst has not taken this recommendation on board. Instead, the Minister of Public Health has requested the CVZ to conduct a study into the execution problems involved
1997 1998 1999 2000 2001 2002 2003 2004 2005 2006 2007
35
30
25
20
15
10
5
0
In millions of Euros
16
23
15
201818
2019
15
11
34

52 53
3 Drug consumption in a western European perspective
In 2006, the Dutch spent an average of € 321.00 on medicines. This amount also includes the drugs that fall within the category of expensive medicines (on average € 43 per person). The cost of expensive medicines amount to more than € 500 per prescription. These medicines are often placed on the market via selected pharmacies. Because of the increase in the consumption of expensive medicines, which in some countries are only available through hospitals, the Netherlands leans more towards the Western European average. The Foundation for Pharmaceutical Statistics (SFK) expects that the Netherlands will once again be part of the tail group in terms of medication expenditures per person from 2008 onwards. Through the introduction of the preferential policy, the prices of generic medicines in the Netherlands have drastically dropped since June 2008 (see section 2.2.8). The medicine expenditures decrease from this at more then 10% annually.
In the neighbouring countries around the Netherlands, lie the medicine consumption from 12% to 60% higher. In 2006, the amount spent on medicine per capita in Belgium on average was € 359, in Germany € 427 and in France € 506. In comparison with the traditionally austere Danish, the expenditures are 33% higher per capita in the Netherlands. An important factor in the lower expenditures per capita of the population in Britain is the information that expensive medicines are reserved for the hospitals and these expenditures therefore fall outside of the extramural scope. In addition to this, the expenditure in England exclusively involves medicines that are reimbursed by the National Health Service.
The differences in drug consumption can to some extent be explained by the degree of ageing of the population in the various countries. In the Netherlands, 14.3% of the population is 65 years and older. In Belgium and Germany, the share of senior citizens is 17.2% and 19.3%, respectively; a bit higher. In France, 16.2% of the population is 65 years and older. The average for the European Union amounts to 17.7%.
1Because of the absence of current data concerning all of Great Britain, the Foundation
for Pharmaceutical Statistics (SFK) can only report about England.
3.01 Medicine expenditure via pharmacies per capita in 2006
a Source: Comptes Nationaux de la Santé 2006
b Figure for the year 2005
c Source: Pharmaceutical Information Centre, Pharma Facts Finland 2007
Source: Foundation for Pharmaceutical Statistics
If one relates the expenditure on pharmaceutical aid to the total costs of health care, the Netherlands again occupies a modest position among the European countries. In 2006, 10% of the total health care costs in the Netherlands were related to expenditure on pharmaceutical aid. This places the Netherlands in the European ‘tail group’. Generally speaking, it can be concluded that the further south a country is situated, the higher the share of expenditure on pharmaceutical aid.
France a
Switzerland b
Germany
Belgium
Finland c
Sweden b
Austria
Italy
THE NETHERLANDS
Spain
Portugal b
Ireland b
Denmark
England b
0 50 100 150 200 250 300 350 400 450 500
€ 506
€ 485
€ 427
€ 359
€ 344
€ 343
€ 326
€ 321
€ 313
€ 304
€ 299
€ 240
€ 183
€ 349

54 55
3.02 Percentage spent on pharmaceutical aid in relation to the total expenditure on health care in 2006
a Source: Comptes Nationaux de la Santé 2006
b Figure for the year 2005
c Source: Pharmaceutical Information Centre, Pharma Facts Finland 2007
Source: Foundation for Pharmaceutical Statistics
Compared to most European countries, a lot of generic (unbranded) medicines are consumed in the Netherlands. Dutch pharmacies dispense a generic drug in 54% of all cases. This is comparable with countries such as Germany and Great Britain. In most of the other countries, including Belgium, France, Spain, Italy, Austria and Switzerland, this share lies in the range of 10% to 20%. The most important explanation for relatively low medication expenditures in the Netherlands concerns a reserved prescription policy and consumption behaviour.
Pharmacy sizeThe Dutch community pharmacy serves an average of 8,100 patients per pharmacy practice. In Belgium (2,000 patients), Spain (2,000 patients), France (2,500 patients), Germany (4,000 patients) and Great Britain (5,000 patients), the pharmacies have a considerably smaller patient population. In the Netherlands, 8% of the population has to rely on a dispensing general practitioner. That is 6% in Great Britain. In Germany and Belgium no drugs are dispensed via general practitioners.
4 The community pharmacy in figures
The growth in the number of community pharmacies in the Netherlands was never as strong as it was in the past year. At the end of 2007, the Netherlands can count 1,893 community pharmacies, 68 more than the previous year.
4.01 Development of the number of community pharmacies
Source: Foundation for Pharmaceutical Statistics
4.1 Independent pharmacies versus chainsUntil 1998, specific requirements were set by the government to the running of a community pharmacy, which led to pharmacies generally being owned by pharmacists. Since 1999, there has been a liberalisation in this area. Since then, the relaxing of the rules and regulations has made it considerably easier for non-pharmacists to own pharmacies. The liberalisation has among other things resulted in the fact that existing market parties, particularly certain pharmaceutical wholesalers, have extended their market position by acquisition of existing pharmacies and setting up pharmacy chains. Incidentally, the provision of drugs does always need to take place under the direct supervision of a pharmacist. Under Article 19 of the Medicines Act (Wet op de Geneesmiddelenvoorziening, WOG), each pharmacy should have at least one pharmacist available.
The purchase of existing pharmacies, specifically by pharmaceutical wholesalers, is the most important explanation for the fact that the percentage of pharmacies owned by pharmacists has decreased for a number
Portugal b
Spain
France a
Finland c
Germany
Belgium
Italy
Sweden b
Ireland
Denmark
Switserland b
Austria
THE NETHERLANDS
England b
0.0% 5.0% 10.0% 15.0% 20.0% 25.0% 30.0% 35.0%
25.7%
22.1%
20.4%
18.5%
17.8%
15.1%
13.0%
13.0%
11.4%
11.0%
10.9%
10.8%
9.0%
15.0%
1998 1999 2000 2001 2002 2003 2004 2005 2006 2007
1,900
1,800
1,700
1,600
1,500
1,400
1,732
1,6541,629
1,5881,571
1,602
1,697
1,893
1,825
1,784

56 57
21 pharmacies. Along with these chains that are members of the Association of Chain Pharmacies (ASKA), there are still the Medsen (AIO) consisting of 60 pharmacies with an 80 majority interest, the Association of Dutch Pharmacists (VNA) with approximately 80 pharmacists and Prickartz with 25 pharmacists.
Besides the above-mentioned pharmacy chains, there are also a number of pharmacies that are run by a trust (2%), for example by specific health centres. There are also chemist’s chains that own community pharmacies, although this is dwindling. Chemist chain DA currently owns two pharmacies, two fewer than previously. Multinational Ahold had placed five pharmacies in chemist’s subsidiary Etos, but has since closed them all. There are also a couple of health care insurers with an interest in one or more pharmacies. In addition to this, other insurers work more frequently with existing pharmacies as so-called “preferred providers”.
The relaxing of the rules and regulations for pharmacies has seen the establishment of more and more specialist pharmacies, which focus on specific forms of service. Of the 1,893 community pharmacies, 32 of them are out-of-hours pharmacies, which are pharmacies specifically focused on providing services during the evenings and weekends. The associated pharmacies no longer perform these uneconomic services independently but have combined these in a joint facility. In addition, there is an unknown number of pharmacies that provide 24-hour services and thus providing temporary services for surrounding pharmacies. Included among the 1,893 community pharmacies are also pharmacies that provide their services via the Internet or by post. One of these online pharmacies, the National Pharmacy, is a collaboration with TNT Post, among others. In July 2008, the TNT Post bought 35% of the interest in the Internet pharmacy. Moreover, a large number of mainstream community pharmacies also provide services via the Internet.
4.2 Turnover of the community pharmacy Due to the relative increase in the number of pharmacy practices in the Netherlands, the average patient population of a community pharmacy further fell from 8.300 to 8.100 people. In 2002, pharmacies served an average of 9,000 people. Compared to most other European countries, the patient population of a Dutch pharmacy can still be called sizeable. In Germany, the average pharmacy serves 4,000 patients. In France a pharmacy serves an average of 2,500 patients. In Belgium and Spain, the counter stops at 2,000 patients per pharmacy.
of years. This trend has not persisted in the previous year; a share of pharmacies owned by pharmacists (65%) has remained the same compared to 2006.
Many (young) independent pharmacists choose to set up a new pharmacy. Apart from the fact that few pharmacies currently change ownership, perhaps what plays a role in this is that independent pharmacists in the past generally could not finance as high a take-over price as pharmaceutical wholesalers could. Pharmacists aspiring to manage their own pharmacy nevertheless often venture and take the chance to set up a new pharmacy on their own. A membership at the Dutch Pharmacists Cooperative (NApCo), which advocates for the independent entrepreneurial pharmacist, increased in 2007 from 266 to 367 pharmacies.
With a total of 673 pharmacy establishments, the percentage of chain pharmacies remained stable last year by 35%. Of the 76 newly opened pharmacies in 2007 – eight of them ceased operation – nearly 12 of them (16%) are owned by a chain. Along with this, the number of chain pharmacies, increased slightly from 647 establishments in 2006 to 673 establishments in 2007. This increase is in line with the general growth of the number of pharmacy establishments in the Netherlands, despite the substantial ambitions for growth by various pharmacy chains. At the beginning of 2007, the pharmacy chains expressed that they expect to own half of all pharmacies by 2012. Currently, the actual developments have substantially delayed these ambitions of growth.
The Association of Chain Pharmacies (ASKA) is the pharmacy chain trade organization established in 2005 with the goal of promoting the interests of centrally led pharmacy companies. Currently, the Association of Pharmacy Chains (ASKA) has six members, namely Mediq Pharmacy (part of OPG), Alliance Pharmacy (previously ‘de Vier Vijzels’), Escura (part of Brocacef), Lloyds Pharmacies, Zorggroep Almere and Thio Pharma, that collectively own 506 pharmacies at the beginning of 2008 (470 at the beginning of 2007).
Mediq Pharmacy, Lloyds Pharmacies, and Alliance Pharmacy are – abeit an exception – 100% owner of the pharmacies that they have acquired. Mediq Pharmacy owns 227 (2007: 220) community pharmacies; Lloyds Pharmacies owns 62 (2007: 60), pharmacies, and Alliance Pharmacy has grown to 78 (2007: 75) pharmacies. Brocacef wholesale placed its pharmacies within the formula of Escura Pharmacy, owning 91 (2007: 84) pharmacies. Independent pharmacies also participate in this formula. Thio Pharma, a member of Association of Chain Pharmacies (ASKA) as well as the Dutch Pharmacists Cooperative (NApCo), owns 29 pharmacies and Zorggroep Almere owns

58 59
The average community pharmacy dispensed medicine 78,000 times in 2007. This is 2,000 prescriptions more than in 2006, or an increase of 2.7%. Even though the number of nationwide dispensations increased by 5.8% to 145 million, the considerable growth in the number of pharmacy establishments in the Netherlands limited the prescription increase per pharmacy. In de period around the millennium change, a prescription increase of 3% to 4% was customary. Only in 2004, the average number of dispensations per pharmacy dropped as a result of the curtailment of the reimbursement entitlements.
In 2007, the turnover of an average pharmacy amounted to an average of € 2,502,000. Compared to the previous year, this involves an increase of 5%. The turnover growth is predominantly traceable to the nationwide growth in the number of prescriptions and the increasing use of expensive medicines (medicines that cost more than € 500 per prescription). A portion of these expensive medicines is placed on the market by way of unique suppliers, thus bypassing mainstream community pharmacy. If the expenditure on expensive medicines by way of unique channels is not taken into consideration, the turnover of an average community pharmacy still increases to € 2,367,000 (3.3% more than in 2006). This means that an average pharmacy actually turns over € 135,000 less than the above-mentioned average data shows.
Of the total turnover of € 2,502,000 on pharmaceutical aid, € 470,000, or 19%, is earmarked as pharmacy fee. This share has remained unchanged in comparison to previous years. The costs of materials for drugs form the other component of the turnover and amount to € 2,032,000. The most important source of income for pharmacies is the fixed fee per prescription (on average € 454,000). This concerns the fixed pharmacy fee that the pharmacy may charge when dispensing a WMG medicine (medicines only available on prescription in pharmacies). For 2007, this fixed fee per prescription was established by the Dutch Health Care Authority mutually set at € 6.10. As of 1 January 2008, based on the usual annual trend readjustments, the Dutch Health Care Authority (NZa) reduced the fee to € 6.00.
In addition to the income from fixed fee per prescription, a pharmacy receives incomes from the supply of non-WMG medicines. These are (self-care) medicines that do not fall under the Health Care Market Regulation Act (WMG) and which are also sometimes available in places other than the pharmacy, such as chemist chains and supermarkets. Non-WMG medicines are only eligible for reimbursement if the practitioner prescribes the medicine for chronic use. In 2007, a pharmacy dispensed a non-WMG product that is covered by the basic package (for chronic use) on the average of 3,600 times for a total amount of € 63,000. Of this amount, € 16,000 is
margin income. Actually, the reimbursement that pharmacies realize with dispensation of these drugs, is lower. Pharmacies and health care insurers agree on lower prices in reality, which lowers the realized margin. 4.02 Development in turnover and number of prescriptions in community pharmacy, basic package
Source: Foundation for Pharmaceutical Statistics
The turnover of a pharmacy in itself does not serve as a reliable indication of its profitability. The earnings of the pharmacy are to an important degree determined by the number of prescriptions. A more expensive WMG drug does not earn the pharmacy more money; after all, the pharmacist receives a fixed fee per prescription.
4.3 Pharmacy practice costsIn principle, pharmacists must finance their practice costs and their income from the fixed fee that applies for WMG drugs. When determining the height of the fixed fee per prescription, account is taken of the revenues from pharmaceutical aids, freely available medicines and other over-the-counter products. It is a widespread (political) misconception that the other (trade) activities of the pharmacy are subsidised from the fixed fee. In practice the very opposite is in fact the case because the related revenues are deducted from the fixed fee.
2003 2004 2005 2006 2007 2003 2004 2005 2006 2007
3000
2500
2000
1500
1000
500
0
76,000
80,50078,000
2,2792,367 2,3842,502
75,700 76,000
2,358
Turnover in € (x 1000) Prescriptions
120,000
100,000
80,000
60,000
40,000
20,000
0
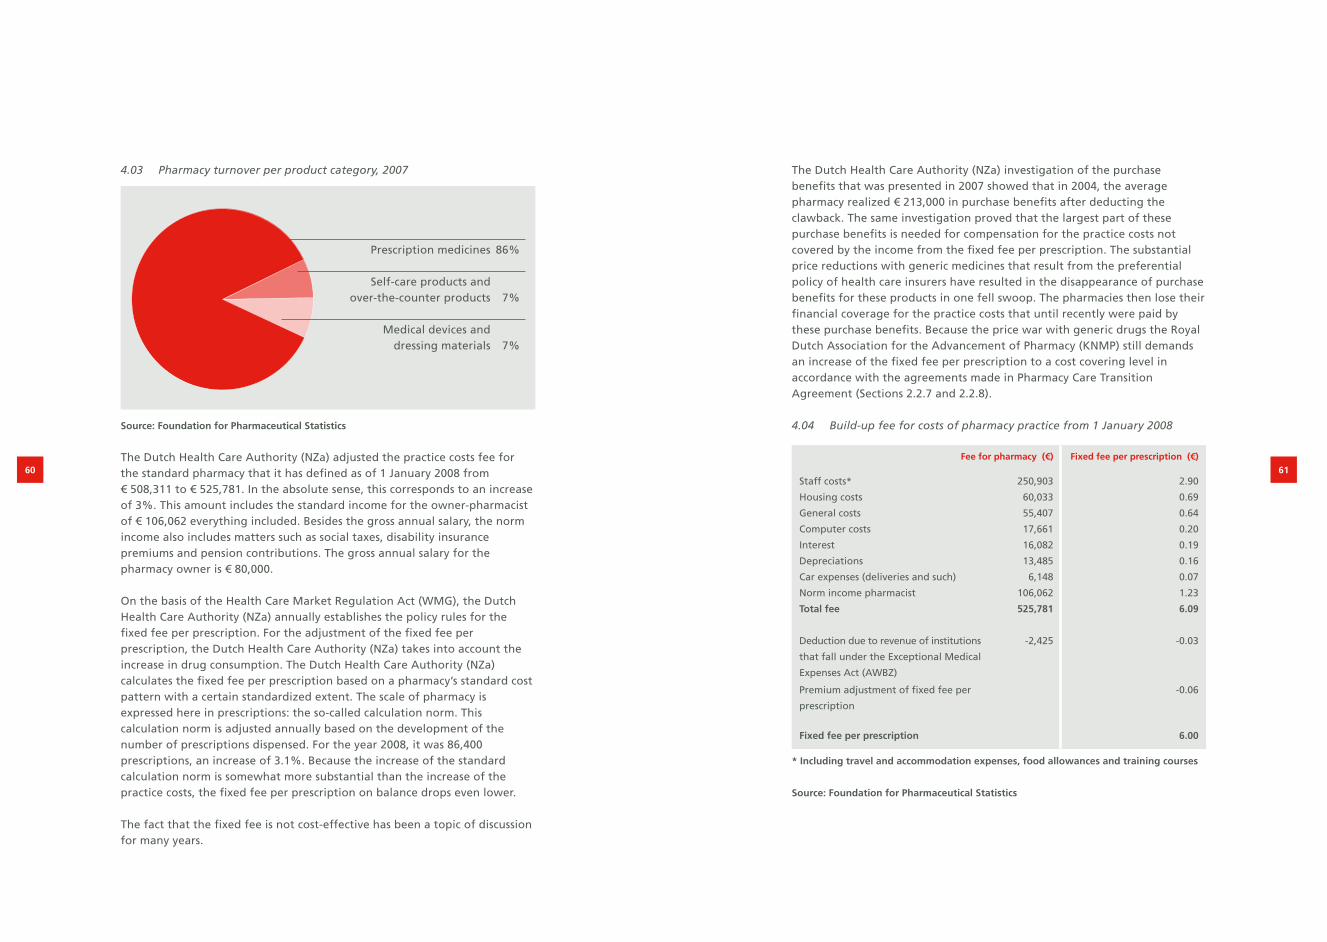
60 61
4.03 Pharmacy turnover per product category, 2007
Source: Foundation for Pharmaceutical Statistics
The Dutch Health Care Authority (NZa) adjusted the practice costs fee for the standard pharmacy that it has defined as of 1 January 2008 from € 508,311 to € 525,781. In the absolute sense, this corresponds to an increase of 3%. This amount includes the standard income for the owner-pharmacist of € 106,062 everything included. Besides the gross annual salary, the norm income also includes matters such as social taxes, disability insurance premiums and pension contributions. The gross annual salary for the pharmacy owner is € 80,000.
On the basis of the Health Care Market Regulation Act (WMG), the Dutch Health Care Authority (NZa) annually establishes the policy rules for the fixed fee per prescription. For the adjustment of the fixed fee per prescription, the Dutch Health Care Authority (NZa) takes into account the increase in drug consumption. The Dutch Health Care Authority (NZa) calculates the fixed fee per prescription based on a pharmacy’s standard cost pattern with a certain standardized extent. The scale of pharmacy is expressed here in prescriptions: the so-called calculation norm. This calculation norm is adjusted annually based on the development of the number of prescriptions dispensed. For the year 2008, it was 86,400 prescriptions, an increase of 3.1%. Because the increase of the standard calculation norm is somewhat more substantial than the increase of the practice costs, the fixed fee per prescription on balance drops even lower.
The fact that the fixed fee is not cost-effective has been a topic of discussion for many years.
The Dutch Health Care Authority (NZa) investigation of the purchase benefits that was presented in 2007 showed that in 2004, the average pharmacy realized € 213,000 in purchase benefits after deducting the clawback. The same investigation proved that the largest part of these purchase benefits is needed for compensation for the practice costs not covered by the income from the fixed fee per prescription. The substantial price reductions with generic medicines that result from the preferential policy of health care insurers have resulted in the disappearance of purchase benefits for these products in one fell swoop. The pharmacies then lose their financial coverage for the practice costs that until recently were paid by these purchase benefits. Because the price war with generic drugs the Royal Dutch Association for the Advancement of Pharmacy (KNMP) still demands an increase of the fixed fee per prescription to a cost covering level in accordance with the agreements made in Pharmacy Care Transition Agreement (Sections 2.2.7 and 2.2.8).
4.04 Build-up fee for costs of pharmacy practice from 1 January 2008
Fee for pharmacy (€) Fixed fee per prescription (€)
Staff costs* 250,903 2.90
Housing costs 60,033 0.69
General costs 55,407 0.64
Computer costs 17,661 0.20
Interest 16,082 0.19
Depreciations 13,485 0.16
Car expenses (deliveries and such) 6,148 0.07
Norm income pharmacist 106,062 1.23
Total fee 525,781 6.09
Deduction due to revenue of institutions
that fall under the Exceptional Medical
Expenses Act (AWBZ)
-2,425 -0.03
Premium adjustment of fixed fee per
prescription
-0.06
Fixed fee per prescription 6.00
* Including travel and accommodation expenses, food allowances and training courses
Source: Foundation for Pharmaceutical Statistics
Prescription medicines 86%
Self-care products and over-the-counter products 7%
Medical devices and dressing materials 7%

4.05 Number of persons employed in community pharmacies
2003 2004 2005 2006 2007Annual
increase
Pharmacies 1,697 1,732 1,784 1,825 1,893 2.8%
Pharmacists 2,681 2,734 2,789 2,825 2,871 1.7%
Pharmacist’s assistants 14,133 14,641 15,096 15,427 16,027 3.4%
Other 4,904 5,057 5,162 5,457 5,809 4.3%
Source: Foundation for Pharmaceutical Statistics
4.06 Number of employees in an average pharmacy in 2007 (in full-time units)
Source: Foundation for Pharmaceutical Statistics
Processing rateThe processing rate, the number of prescriptions per full-time pharmacist’s assistant, is a good criterion to establish whether the number of employees is in proportion to the work pressure in the pharmacy. In 2007, the average processing rate was 14,500 prescriptions per full-time pharmacist’s assistant, a historical record. The processing rate is calculated on the basis of the dispensed Health Care Market Regulation Act (WMG) and non-WMG medicines; irrespective of the fact whether these are reimbursed by the health insurance company. Medical aids, such as stoma- and incontinence materials as well as non-medicinal products that are not registered via the pharmacy information system, are not taken into account when determining the processing rate. Also the dressing materials, that no longer fall under pharmaceutical aid but under the category of medical aids, as of 2006 are not included in establishing the work pressure.
No absolute standardAlthough the national processing rate gives a good indication of the productivity development within the community pharmacy, this figure cannot be used indiscriminately as an absolute standard to assess the situation in the own pharmacy. Various factors may cause big differences in the number of dispensations per assistant. Thus the processing rate for pharmacies in large cities is usually lower than the national average (-4%). Traditionally, rural pharmacies in fact have a higher processing rate (+15%). The most important explanation for this phenomenon is the fact that rural pharmacies deal with a more limited group of prescribers. As a result, the pharmacists are better able to make agreements with the general practitioners involved about the available formula and the advanced passing on of prescriptions via fax or computer.
Other local factors that influence the processing rate and the work pressure felt in the pharmacy are among other things the way in which evening and weekend shifts are organised, the degree of mundane routine in the pharmacy and the degree to which pharmacy preparations are provided. Community pharmacies are increasingly entering into forms of cooperation with respect to these uneconomic parts of pharmacy services, like evening/weekend shifts and pharmacy preparations (see introduction Chapter 4).
4.07 Development processing rate
Source: Foundation for Pharmaceutical Statistics
62 63
Pharmacist’s assistants 6.01
Established/managing pharmacist 1.00 Second pharmacists 0.55
Other 1.63
11,000 11,500 12,000 12,500 13,000 13,500 14,000 14,500
13,022
13,712
13,932
14,454
14,374
14,424
14,115
14,500
14,221
14,090
1998
1999
2000
2001
2002
2003
2004
2005
2006
2007

64 65
Increase in work pressureAccording to the Pension Fund Pharmacy Employees (PMA), 16,027 pharmacist’s assistants were employed in Dutch community pharmacies on 1 January 2008. This is 600 more people (+3.9%) than in the previous year. A full-time pharmacist’s assistant works 36 hours per week. Most of the pharmacy assistants indicate a preference for part-time work. Of all pharmacists’ assistants, only 26% work full-time. In 2002, this was 32% and in 1999, 42% of the assistants still worked full-time. Just as in the past couple of years, the average work week in 2007 averaged out to be 25.5 hours. Converted into full-time units, every pharmacy employs on average 6.01 pharmacist’s assistants. Pharmacist’s assistant is a typical female occupation. Merely 1% of the active pharmacist’s assistants are men. A little over half of all pharmacists’ assistants work 24 hours per week or less. Mainly younger (female) assistants up to the age of 30 have full-time jobs. The wish to be able to combine work and family undoubtedly plays an important role in the great demand for part-time work.
The number of support co-workers in community pharmacies increased from 5,457 to 5,809 people (+6.5%). More than three-quarters of the support co-workers are women also. Of the pharmacist’s assistants, 18% work full-time. On average, they work 19 hours per week. The degree to which these supporting co-workers carry out work that lighten the work pressure, such as expressed in the processing rate, is unknown by the Foundation for Pharmaceutical Statistics (SFK). The nationwide number of dispensations growing more substantially than pharmacy personnel can be an indication that they will be more job market pressure in the pharmacy branch. The Pharmacy Business Fund Foundation (SBA) predicts a considerable shortage of pharmacy assistants if the policy does not change.
PharmacistsThe number of people that studied to be a pharmacist at the faculties in Utrecht and Groningen had not been so low for decades as it was in 2007. In combination with the increasing number of pharmacies in the Netherlands, the pharmacist will remain a rare breed in the coming time. A decreasing trend began in 2005 when there were 173 new pharmacists who graduated. In 2006, there were still 141 graduates; in 2007, there were 117. Many of the pharmacists that graduated in these years began their study between 1999 and 2001. This period was the absolute deepest point, with the lowest number of first-year students studying pharmacy in years. This dip coincided with the extension of the limited number for the study of medicine. The increasing number of first-year pharmacy students after 2001 indicates that studying pharmacy gained in popularity again. This increase also means that the increasing influx of new pharmacists in the job market is expected to pick up beginning in the coming year.
Approximately 70% (82 people) of the graduate pharmacists opt for a function in the community pharmacy sector. The increase in the number of active pharmacists in community pharmacies amounted to 35 people in 2007. That means that 47 community pharmacists left the active profession in the past year.
4.08 Development of active pharmacists in community pharmacy
Source: Foundation for Pharmaceutical Statistics
The academic study of pharmacy has enjoyed a steady rise in interest since 2002. The number of first-year pharmacy students at Utrecht and Groningen last year was 419. Furthermore, 88 students enrolled as first-year students to study Bio-Pharmaceutical Sciences at the University of Leiden. In addition, the total number of first-year pharmacy students increased by 59 people (+13%) to 507 in 2007. The total number of students at pharmaceutical training institutes in the Netherlands was 2,152 people in early 2008. In addition, the size of the pharmacy student population grew 12% compared to a year earlier.
There are 1,291 women (60%) and 861 men (40%) who study pharmacy. The prevalence of women is with this no longer as strong as in 2003, when 63% of all pharmacy students were women. Among the first year pharmacy students, women have been the majority for a few years: 61% of the 507 first year pharmacy students are women.
60
50
40
30
20
10
0
55
35
36
53
11
34
2002 2003 2004 2005 2006 2007
Influx pharmacists

66 67
5 Core figures pharmaceutical aid in 2007
The Netherlands Average per
pharmacy
Average per
person
Total expenditure pharmaceutical aid
of which GVS co-payments
€ 4.652 million
€ 34 million
€ 2,502,000
€ 18,000
€ 310
€ 2
Drug costs
WMG
Non-WMG
€ 3.778 million
€ 3.690 million
€ 88 million
€ 2,032,000
€ 1,985,000
€ 47,000
€ 252
€ 246
€ 6
Pharmacy fee
Fixed fee per prescription
Margin non-WMG*
€ 874 million
€ 844 million
€ 30 million
€ 470,000
€ 454,000
€ 16,000
€ 58
€ 56
€ 2
Prescriptions
WMG
Non-WMG
145 million
138 million
7 million
78,000
74,400
3,600
9.68
9.23
0.45
Patients 15 million 8,100 -
* Margin non-WMG based on the G-standard reported recommended sales price.
Pharmacists and health care insurers agree on lower prices in reality, which in
actuality lowers the realized margin more than what is mentioned above.
Source: Foundation for Pharmaceutical Statistics

68
ColophonFacts and Figures 2008 is a publication from the Foundation for Pharmaceutical Statistics (Stichting Farmaceutische Kengetallen, SFK). Reproduction of data from this brochure is allowed provided that the source is fully acknowledged as follows: Foundation for Pharmaceutical Statistics (Stichting Farmaceutische Kengetallen), August 2008.
Editingdrs. A.M.G.F. Griensdrs. J.L. TinkeR.J. van der Vaart
TranslationSlootweg Translations, Dordrecht
Designwww.coloursofeden.nl, Amstelveen
PrintingThiemeMediaServices, Delft
Editorial addressFoundation for Pharmaceutical StatisticsP.O. Box 304602500 GL The HagueTelephone (+31) (0) 70 373 74 44 Fax (+31) (0) 70 373 74 45E-mail [email protected] www.sfk.nl