facts and fiction about livestock and climate change
TRANSCRIPT

Facts and fiction about livestock and climate change
Frank Mitloehner, Professor & Air Quality SpecialistDepartment of Animal Science, University of California, Davis


Facts or Fiction on Livestock and Climate Change?
• Livestock produces 18% of all anthropogenic GHG globally
• Livestock produces more GHG than transportation
• Livestock produces even more than 18%, namely 51% of all GHG globally (Worldwatch Institute)
• Grazing systems produce less GHG than conventional animal production in confinement systems

(NRC, 2003)
Life Cycle Assessment

GHG & GWP
Global Warming Potential (GWP) of Main GHG Carbon Dioxide, CO2 1 Methane, CH4 25 Nitrous Oxide, N2O 298
CO2 – Carbon Dioxide CH4 – Methane N2O – Nitrous Oxide

Carbon Dioxide and Carbon Flux

U.S. – the big GHG picture
Source: EPA (2009)


4.5 Billion + population of USA in 10 years

Today and Tomorrow’s Markets

11
100
200
300
400
500
Inde
x nu
mbe
r:196
1=10
0
1960 1970 1980 1990 2000 2010
Roots and tubers CerealsMeat MilkEggs
Per caput consumption of major food items in developing countries – kg per caput per year (index numbers 1961=100)
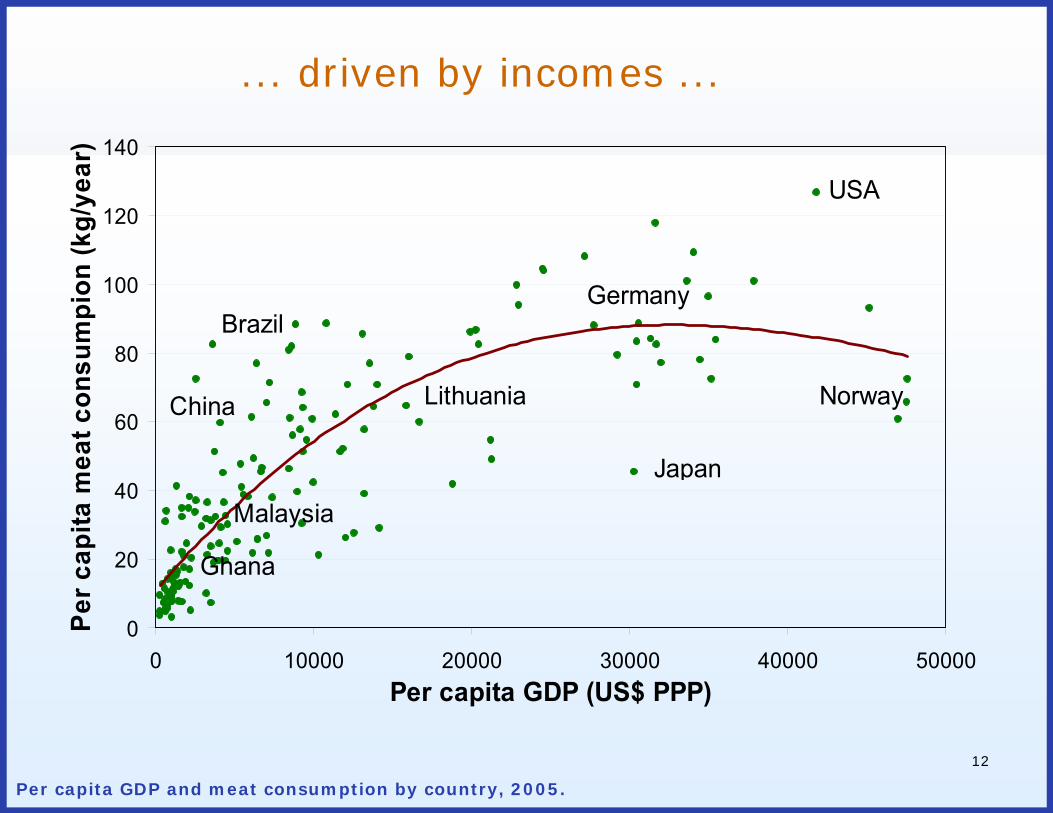
Consumption is growing rapidly in developing countries ...
Eggs
Meat
Milk
12
Per capita GDP and meat consumption by country, 2005.
0
20
40
60
80
100
120
140
0 10000 20000 30000 40000 50000Per capita GDP (US$ PPP)
Per c
apita
mea
t con
sum
pion
(kg/
year
)
USA
Japan
China
Brazil
Malaysia
Germany
Ghana
NorwayLithuania
... driven by incomes ...

Global livestock distribution
FAO (2006)

Distribution of cropland
FAO (2006)

FAO (2010)

Mitigation: interventions to improve productivity
Gill et al. (2010)

Relationship between total greenhouse gas emissions and milk
output per cow
0.00
2.00
4.00
6.00
8.00
10.00
12.00
0 1,000 2,000 3,000 4,000 5,000 6,000 7,000 8,000 9,000
Output per cow, kg FPCM per year
kg C
O2-
eq. p
er k
g FP
CM

US Dairy trends
• Today, there are 9 million dairy cows in the US, 16 million fewer than existed in 1950.
• Even though cow number have decreased dramatically (1950 versus 2013), milk production nationally has increased 60 percent.
• The carbon footprint of a glass of milk is 2/3 smaller today than it was 70 years ago.

US Pork Trends

US Beef trends
• In 1970, the US had 140 Million head of beef
• By comparison, today there are 90 Million head
• In both 1970 and 2010, 24 Million tons of beef were produced
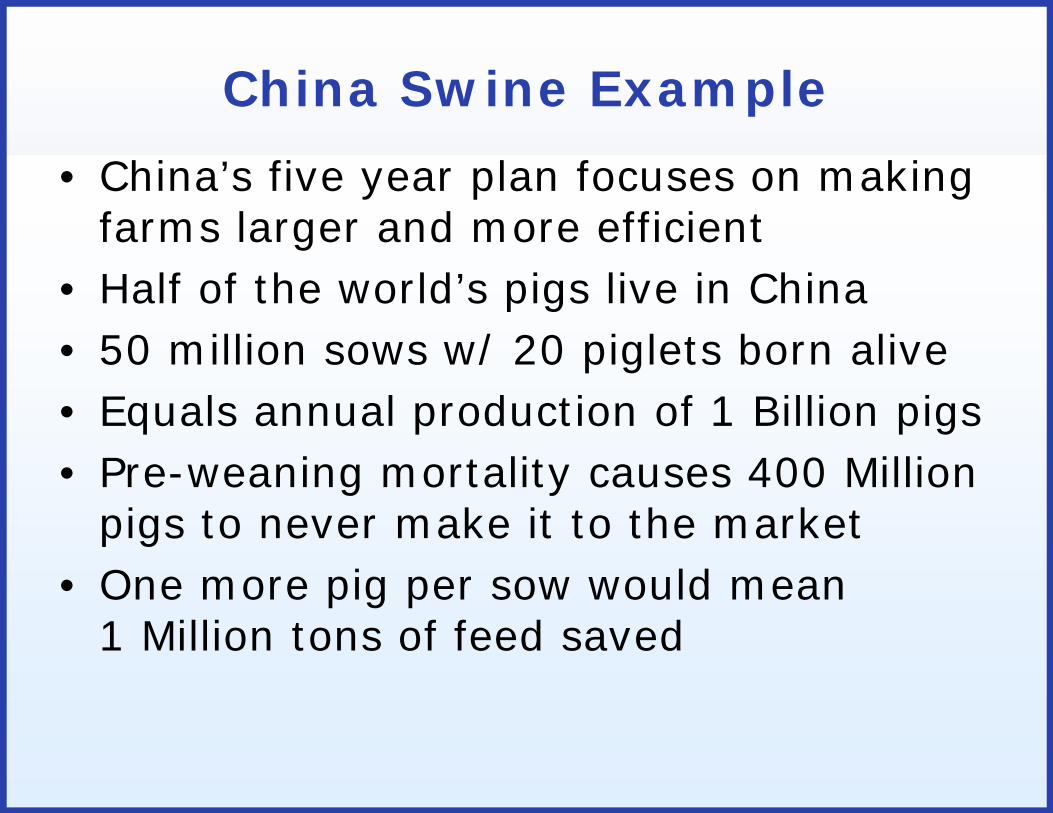
China Swine Example• China’s five year plan focuses on making
farms larger and more efficient• Half of the world’s pigs live in China• 50 million sows w/ 20 piglets born alive• Equals annual production of 1 Billion pigs• Pre-weaning mortality causes 400 Million
pigs to never make it to the market• One more pig per sow would mean
1 Million tons of feed saved
Sustainable Intensification is key
• Production intensity and emission intensity are inversely related

Presentation to National Academies IOM , Washington DC, July 17, 2013