factors that influence the use of web 2.0 tools for e-learning...factors that influence the use of...
TRANSCRIPT

Factors that influence the use of Web 2.0 tools for
e-learning
Soheila Mohammadyari
A thesis submitted to
Auckland University of Technology in partial fulfillment of the requirements for the degree of
Master of Business (MBus)
2012
Faculty of Business & Law
Primary Supervisor: Dr. Harminder Singh

To my beloved dad,
Mohammad Rasul Mohammadyari
1923 - 1998
i
Table of Contents
Attestation of Authorship .......................................................................................... v Acknowledgements .................................................................................................. vi Abstract ................................................................................................................... vii List of Tables ........................................................................................................... viii List of Figures ........................................................................................................... ix Acronyms .................................................................................................................. x CHAPTER 1: INTRODUCTION ...................................................................................... 1
1.1 Research overview .................................................................................................. 1
1.2 Methodology ........................................................................................................... 3
1.3 Implications ............................................................................................................. 3
1.4 Outline of thesis ...................................................................................................... 4
Chapter summary ............................................................................................................. 5
CHAPTER 2: RESEARCH CONTEXT ............................................................................... 6 2.1 Introduction ............................................................................................................ 6
2.2 An overview of Web 2.0 .......................................................................................... 6
2.2.1 What is Web 2.0? ..................................................................................................... 6
2.2.2 Characteristics of Web 2.0 ....................................................................................... 7
2.2.3 Web 2.0 tools for professionals ............................................................................... 8
2.2.3.1 Wiki ............................................................................................................................ 9
2.2.3.2 Blog .......................................................................................................................... 10
2.2.3.3 RSS ............................................................................................................................ 11
2.2.3.4 Podcast ..................................................................................................................... 12
2.2.3.5 Social networks ........................................................................................................ 13
2.3 Significance of Web 2.0 for professionals ................................................................ 14
2.4 Web 2.0 in New Zealand SMEs ................................................................................ 15
2.5 Adopting Web 2.0 in SMEs – the challenges ............................................................ 16
2.6 Adopting Web 2.0 in SMEs – the benefits ............................................................... 17
2.7 Web 2.0 user adoption studies ............................................................................... 18
2.8 Web 2.0 and Continuing Professional Development (CPD) ...................................... 18
2.8.1 Web 2.0 and e-‐learning ......................................................................................... 19
2.8.2 e-‐Learning at the workplace .................................................................................. 19
2.8.3 Continuing Professional Development (CPD) ........................................................ 20
2.8.3.1 What is CPD? ............................................................................................................ 20
2.8.3.2 Why is CPD needed? ................................................................................................ 20
2.8.3.3 What are the benefits of CPD to employers? ........................................................... 21
Chapter summary ............................................................................................................ 22
CHAPTER 3: LITERATURE REVIEW ............................................................................. 23
ii
3.1 Introduction ........................................................................................................... 23
3.2 Models of Information Technology (IT) adoption .................................................... 23
3.2.1 Theory of Reasoned Action (TRA) .......................................................................... 23
3.2.2 Theory of Planned Behavior (TPB) ......................................................................... 23
3.2.3 Technology Acceptance Model (TAM) I & II .......................................................... 24
3.2.4 Diffusion of Innovation Theory (DIT) ..................................................................... 24
3.2.5 Unified Theory of Acceptance and Use of Technology (UTAUT) ........................... 25
3.2.6 Expectancy Disconfirmation Theory (EDT) ............................................................. 26
3.3 Web 2.0 user adoption studies ............................................................................... 29
3.4 Digital Literacy ....................................................................................................... 34
Chapter summary ............................................................................................................ 37
CHAPTER 4: RESEARCH MODEL AND HYPOTHESES ................................................... 38 4.1 Introduction ........................................................................................................... 38
4.2 Web 2.0 Adoption .................................................................................................. 38
4.2.1 Performance Expectancy (PE) ................................................................................ 39
4.2.2 Effort Expectancy (EE) ............................................................................................ 39
4.2.3 Social Influence (SI) ................................................................................................ 39
4.2.4 Facilitating Conditions (FC) .................................................................................... 40
4.2.5 Digital Literacy (DL) ................................................................................................ 40
4.3 Web 2.0 Continued Use .......................................................................................... 40
4.3.1 Expectation Confirmation (EC) ............................................................................... 41
4.3.2 Perceived Usefulness (PU) ..................................................................................... 41
4.3.3 Satisfaction (S) ....................................................................................................... 42
CHAPTER 5: METHODOLOGY .................................................................................... 44 5.1 Introduction ........................................................................................................... 44
5.2 Research objectives ................................................................................................ 44
5.3 Research methodology and justification ................................................................. 45
5.4 Research design ...................................................................................................... 46
5.5 Survey .................................................................................................................... 47
5.5.1 Survey development .............................................................................................. 47
5.5.1.1 Qualtrics ................................................................................................................... 48
5.5.1.2 Self-‐administrated questionnaire ............................................................................. 48
5.5.1.3 Survey design ........................................................................................................... 48
5.5.1.4 Likert-‐type scales ...................................................................................................... 49
5.5.1.5 Pilot survey ............................................................................................................... 52
5.5.2 Data collection ....................................................................................................... 52
5.5.3 Quantitative data analysis procedure .................................................................... 53
iii
5.6 In-‐depth interviews ................................................................................................ 55
5.6.1 Sample recruitment ............................................................................................... 55
5.6.2 Qualitative data analysis strategy .......................................................................... 56
5.7 Ethical consideration .............................................................................................. 57
Chapter summary ............................................................................................................ 57
CHAPTER 6: QUANTITATIVE ANALYSIS ..................................................................... 58 6.1 Introduction ........................................................................................................... 58
6.2 Data preparation for statistical analysis .................................................................. 58
6.3 Data cleaning ......................................................................................................... 59
6.4 Descriptive analysis ................................................................................................ 59
6.4.1 Demographics ........................................................................................................ 59
6.4.2 Digital literacy ........................................................................................................ 61
6.4.3 Comparison between users and non-‐users ........................................................... 62
6.4.3.1 Comparing users and non-‐users in terms of their demographic characteristics ...... 62
6.4.3.2 Comparing users and non-‐users in terms of their digital literacy ............................ 65
6.4.3.3 Comparing users and non-‐users in terms of their familiarity with Web 2.0 tools ... 66
6.4.3.4 Comparing users and non-‐users in terms of the 7-‐item digital literacy construct ... 66
6.5 Validation of instrument ........................................................................................ 67
6.5.1 Reliability ............................................................................................................... 67
6.5.2 Convergent and discriminant validity .................................................................... 68
6.6 Structural model evaluation ................................................................................... 70
CHAPTER 7: QUALITATIVE ANALYSIS ........................................................................ 73 7.1 Introduction ........................................................................................................... 73
7.2 Sample Characteristics ........................................................................................... 73
7.2.1 Qualitative data analysis stages ............................................................................. 75
7.2.2 Challenges facing Web 2.0 adoption ..................................................................... 76
7.2.2.1 Theme 1: Infrastructure constraints ........................................................................ 76
7.2.2.2 Theme 2: Culture ...................................................................................................... 76
7.2.3 Factors that affect the adoption of Web 2.0 tools by professionals ..................... 76
7.2.3.1 Theme 3: Satisfaction ............................................................................................... 76
7.2.3.2 Theme 4: Digital literacy/limited IT skills and support ............................................. 77
7.2.3.3 Theme 5: Perceived usefulness and benefits ........................................................... 78
7.2.3.4 Theme 6: Reluctance to use Web 2.0 tools for learning – expectation ................... 78
7.2.3.5 Theme 7: Quality of service ...................................................................................... 79
7.2.3.6 Theme 8: Ease of use ............................................................................................... 80
Chapter summary ............................................................................................................ 80
CHAPTER 8: DISCUSSION AND CONCLUSION ............................................................ 81 8.1 Introduction ........................................................................................................... 81
iv
8.2 Discussion .............................................................................................................. 81
8.3 Practical Implications ............................................................................................. 85
8.4 Limitations ............................................................................................................. 87
8.5 Conclusion .............................................................................................................. 88
APPENDICES ............................................................................................................ 90 Appendix A: Ethics approval form .................................................................................... 90
Appendix B: Participant information sheet ...................................................................... 91
Appendix C: Consent form ............................................................................................... 93
Appendix D: Questionnaire .............................................................................................. 94
Appendix E: Publication in newsletter of professional organizations .............................. 100
Appendix F: Descriptive statistics of overall sample ....................................................... 101
Appendix G: Descriptive statistics for all items ............................................................... 103
Appendix H: Familiarity with Web 2.0 tools for overall sample ...................................... 104
Appendix I: Seven-‐item digital literacy construct for overall sample ............................... 105
REFERENCES .......................................................................................................... 106

v
Attestation of Authorship
I hereby declare that this submission is my own work and that, to the best of my
knowledge and belief, it contains no material previously published or written by another
person (except where explicitly defined in the acknowledgements), nor material which
to a substantial extent has been submitted for the award of any other degree or diploma
of a university or other institution of higher learning.
Soheila 28/02/2012
_______________________________________
Soheila Mohammadyari

vi
Acknowledgements
I am grateful to have the opportunity to thank a number of people that have been
helping me on this journey and in completing this thesis.
Firstly, I would like to express my sincere gratitude to my wonderful supervisor, Dr.
Harminder Singh, from the Auckland University of Technology, for sparing his time in
providing me with advice and support from the very start to the end. Without his
guidance, encouragement, professionalism, I would not have been able to complete this
thesis at this high level. His professionalism and reasonableness helped me to overcome
numerous difficulties along the way.
Also, I want to thank Dr. Ken Hyde from the Auckland University of Technology, for
his guidance in statistical analysis.
I am sincerely acknowledging the financial support of Auckland University of
Technology in New Zealand for awarding me a scholarship for my studies.
Moreover, I would also like to thank the professional organizations for supporting my
research and distributing my survey.
I wish to express my sincere appreciation and gratitude to all the respondents who
devoted their time in taking part in this thesis. It would not have been completed
without you.
Many thanks also to all of my friends in New Zealand and overseas for their
encouragement.
Last but not least, special thanks to my beloved mother, my lovely brother and sister
who always brighten up my day, and for being my support system throughout this entire
process.
vii
Abstract
Web 2.0 tools, such as blogs, wikis, podcasts, and RSS feeds, provide users with a
flexible, collaborative and interactive environment for developing communities around
shared interests. These tools are especially useful for professionals, such as accountants
and lawyers, working in small and medium-sized enterprises (SMEs) for their
continuing professional development (CPD) because they can obtain access to high-
quality resources and interact with training providers and their peers at a much lower
cost. However, there has been relatively little adoption of such tools by this group of
professionals, and little relevant empirical research on this issue.
This study addressed this issue by examining the adoption of Web 2.0 tools by
accounting professionals in New Zealand SMEs. A research model based on the Unified
Theory of Acceptance and Use of Technology (UTAUT) and the Expectation
Disconfirmation Theory (EDT) was drawn up and tested with a survey and a series of
semi-structured interviews. 40% of the respondents use Web 2.0 tools, and 45.9% plan
to continue using them in the future. The results indicate that digital literacy and
performance expectancy were significantly related to the decision to adopt Web 2.0
tools. The interview findings support the variables used in the model, and offer
additional insights on the barriers hindering the adoption of Web 2.0 tools. The study
highlights certain trends in the adoption of this technology and provides guidance to
future researchers and practitioners in this field.

viii
List of Tables
Table 3.1: Definition of UTAUT’s constructs and their sources .................................... 26
Table 3.2: Definition of EDT’s constructs and their sources .......................................... 28
Table 3.3: Web 2.0 adoption studies ............................................................................... 30
Table 5.1: Construct items of scales ............................................................................... 50
Table 6.1: Demographic characteristics .......................................................................... 60
Table 6.2: Digital literacy characteristics ........................................................................ 61
Table 6.3: Demographic characteristics of Web 2.0 users and non-users (%) ............... 63
Table 6.4: Comparing current users and those who intend to use Web 2.0 within demographic categories ........................................................................................... 64
Table 6.5: Digital literacy of Web 2.0 users and non-users (%) ..................................... 65
Table 6.6: Mean Familiarity Scores for Web 2.0 tools among Web 2.0 users and non-users ......................................................................................................................... 66
Table 6.7: Mean Familiarity Scores for 7-item Digital Literacy (DL) construct among Web 2.0 users and non-users ................................................................................... 67
Table 6.8: Reliability of constructs ................................................................................. 67
Table 6.9: CFA results - Model 1 .................................................................................... 69
Table 6.10: CFA results – Model 2 ................................................................................. 69
Table 6.11: Results for Model 1 ...................................................................................... 70
Table 6.12: Results for Model 2 ...................................................................................... 70
Table 6.13: Summary of hypothesis tests ....................................................................... 72
Table 7.1: Interview informants ...................................................................................... 73
Table 7.2: Interviewee and interview particulars ............................................................ 74

ix
List of Figures
Figure 1.1: Thesis outline .................................................................................................. 5
Figure 2.1: Example of a Wiki .......................................................................................... 9
Figure 2.2: Example of a Blog ........................................................................................ 10
Figure 2.3: Examples of RSS Feeds ................................................................................ 11
Figure 2.4: Example of Podcasts ..................................................................................... 12
Figure 2.5: Example of Social networks ......................................................................... 13
Figure 2.6: Adoption of Web 2.0 Tools .......................................................................... 16
Figure 3.1: Unified Theory of Acceptance and Use of Technology (UTAUT) (Venkatesh et al., 2003) .......................................................................................... 25
Figure 3.2: Expectancy Disconfirmation Theory (EDT) (Oliver, 1977, 1980) .............. 27
Figure 4.1: Research model for Web 2.0 Adoption (Model 1) ....................................... 38
Figure 4.2: Research model for Web 2.0 Continued Use (Model 2) .............................. 40
Figure 5.1: Research design ............................................................................................ 47
Figure 6.1: Partial Least Square (PLS) results for Model 1 ............................................ 71
Figure 6.2: Partial Least Square (PLS) results for Model 2 ............................................ 72
Figure 7.1: Qualitative data analysis stages .................................................................... 75

x
Acronyms
ACCA Association of Chartered Certified Accountants ADPT Adoption APs Accounting Professionals AUT Auckland University of Technology CFA Confirmatory Factor Analysis CI Continuance Intention CPA Certified Practicing Accountant CPD Continuing Professional Development DIT Diffusion of Innovation Theory DL Digital Literacy EC Expectation Confirmation EDM Expectation Disconfirmation Model EDT Expectation Disconfirmation Theory EE Effort Expectancy E-learning Electronic Learning EOU Ease Of Use FC Facilitating Conditions ICT Information Communication Technology IS Information System IT Information Technology ITU Intention To Use NZ New Zealand NZICA New Zealand Institute of Chartered Accountants PE Performance Expectancy PEOU Perceived Ease Of Use PLS Partial Least Squares PU Perceived Usefulness RSS Really Simple Syndication S Satisfaction SBA Small Business Accounting SEM Structural Equation Modeling SI Social Influence SMEs Small and Medium-Sized Enterprises SPSS Statistical Package for the Social Sciences TAM Technology Acceptance Model TPB Theory of Planned Behavior TRA Theory of Reasoned Action U Usefulness UTAUT Unified Theory of Acceptance and Use of Technology WWW World Wide Web

1
CHAPTER 1: INTRODUCTION
This thesis examines the adoption of Web 2.0 tools by professionals for their
Continuing Professional Development (CPD) needs. This chapter introduces the topic
and the motivation for studying it, and concludes with an overview of the thesis.
1.1 Research overview Training is a strategic tool for organizations and has been found to reduce employee
turnover and increase their profitability (Ong, Lai, & Wang, 2004). From an individual
perspective, training keeps employees aware of the latest technologies and knowledge
in their fields, and helps them remain competitive. Information Technology (IT) has
significantly altered the way we learn and how we are trained, and companies are
increasingly using e-learning to enhance the consistency and convenience of their
training activities. E-learning refers to the use of technology to deliver information and
instruction to users (Salas, Kosarzycki, Burke, Fiore, & Stone, 2002). A variety of
instructional material (text, video, and audio) is integrated and conveyed via online
discussions, quizzes, live chat sessions, and assignments. E-learning allows
asynchronous and synchronous interaction between learners and trainers (Salas et al.,
2002).
E-learning has been greatly enhanced by the use of Web 2.0 technologies, such as blogs,
podcasts and wikis, because they enable flexible, learner-centered training. For
example, training can be provided “on-demand” to better meet the needs of employees
who are geographically dispersed or have conflicting schedules. Web 2.0 technologies
are especially appealing to Small and Medium-Sized Enterprises (SMEs) because they
reduce the scale economies for professional training. While previously only larger firms
could afford to hire high-quality trainers or purchase expensive training software
packages, today employees of SMEs can access similar high-quality resources and
interact with these training providers at a much lower cost.
These benefits have meant that many companies, including SMEs, have invested
significant resources in promoting Web 2.0 alternatives to traditional kinds of training
(Anderson & Schwager, 2004). However, even though Web 2.0 tools have the potential
to provide better services to individuals at a lower cost, these effects will only come
about if individuals adopt them widely (Riegner, 2007). This has not been the case
(Ajjan & Hartshorne, 2008; Alexander, 2006; Broady-Preston, 2009; Evans, 2008; Kim,
2
2010), meaning that investments in these tools may be wasted.
Without understanding what encourages individuals to use Web 2.0 tools, we will not
be able to act to increase their adoption (Broady-Preston, 2009; Evans, 2008). However,
there is a lack of empirical research on this issue (McLean, Richards, & Wardman,
2007). In addition, a review of the existing research on Web 2.0 adoption shows that
relatively few studies have studied professionals (Broady-Preston, 2009; Dale,
Kinnison, Short, May, & Baillie, 2011; Tu, Blocher, & Ntoruru, 2008; Usher, 2011),
and most studies took place in large organizations. As a consequence, little has been
written about the factors that influence SMEs to adopt Web 2.0 tools. The current study
aims to fill these gaps by conducting field research on Web 2.0 adoption by
professionals in SMEs.
Understanding why individuals accept or reject new information technology is one of
the most challenging issues in IS research (Ajjan & Hartshorne, 2008), and applies to
Web 2.0 tools too. This study aims to understand the factors that affect individual use of
Web 2.0 technologies, and the experiences of individuals who have used them. This
study asks the following questions:
Ø What influences their adoption of Web 2.0 tools?
Ø What influences their decision to continue using these tools if they have already
adopted them?
Studies on the user adoption of IT mainly use the Unified Theory of Acceptance and
Use of Technology (UTAUT) (Venkatesh et al. 2003), while research on continuance
intention is usually based on the Expectation Disconfirmation Theory (EDT)
(Bhattacherjee, 2001b). We apply both of these models to our context, and extend
UTAUT by examining the Digital Literacy (Hargittai, 2005) of users. Digital Literacy
(DL) is relevant in this context because it allows us to conceptualize IT use as an
evolving skill. In other words, users who are comfortable with IT should take up
innovations, such as Web 2.0, much more easily than users who are less savvy with IT.
The objectives of this study are to: a) increase our knowledge and understanding of the
use of Web 2 .0 tools by professionals working in SMEs, and b) identify the factors that
influence the adoption of Web 2.0 tools by professionals.
3
1.2 Methodology Choosing a suitable research methodology is an important part in defining the steps to
be taken to answer the research objectives and questions (Leedy & Ormrod, 2005,
2009). Combining quantitative and qualitative research methods has received increased
attention from IT researchers (Gable, 1994; Kwan & Ding, 2008; Petter & Gallivan,
2004). The use of mixed methods allows a better understanding of the research
phenomenon, as multiple research methods increase the validity of the data and results
(Bouma & Ling, 2004). Thus, a combination of quantitative (survey) and qualitative
(semi-structured interviews) methods was used for this study.
Quantitative methods were used to test the relationships between the variables in the
research model and to provide evidence to invalidate or support the research hypotheses
(Bernard, 2000; Creswell, 2009; Neuman, 2010; Punch & Punch, 2005). The qualitative
data was used to evaluate the validity of the constructs in the research model and to
provide a richer understanding of Web 2.0 adoption by professionals. It provided an
insight into the challenges facing Web 2.0 tools implementation and was used to
validate the findings from the survey.
1.3 Implications This study contributes to the emerging body of literature on Web 2.0 adoption by
empirically validating two widely-used models of IT adoption and continuance in a new
context. In addition, the model of IT adoption was extended with by including a new
variable (Digital Literacy) to account for the evolutionary aspect of Web 2.0. The
study’s findings provide researchers and practitioners with guidance to enhance their
strategies to encourage adoption of these technologies.
Given that the study took place among SMEs in New Zealand, the findings will help
SMEs managers, IT consultants, vendors and government agencies develop guidelines
to encourage the adoption of Web 2.0 for e-learning, so as to enhance the
competitiveness of New Zealand’s SMEs in the global business environment.
4
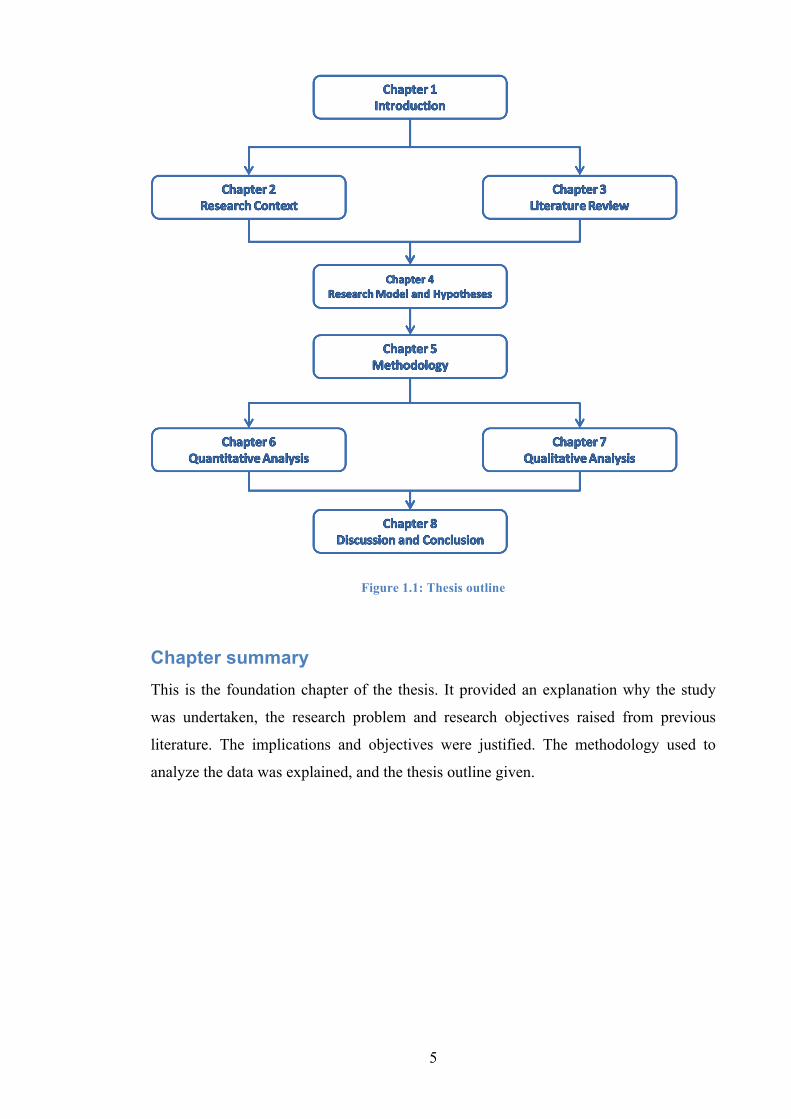
1.4 Outline of thesis This section is a detailed overview of the thesis, and is represented in Figure 1.1.
Chapter 2 (Research Context) sheds light upon the environment being investigated, and
the roots of the problems posed in the current study. The chapter reviews the literature
on Web 2.0 adoption, and identifies significant issues related Web 2.0 adoption, both in
NZ and elsewhere and among large firms and SMEs. The chapter concludes by
providing information about CPD and its significance among professionals.
Chapter 3 (Literature review) reviews the existing models of IT adoption to identify
the most appropriate theoretical background for this study, followed by a discussion on
DL, and the justification for including it in the models being tested.
Chapter 4 (Research model and hypotheses) presents the research model and
hypotheses that will be tested.
Chapter 5 (Methodology) describes the methodologies used in this study. It first
discusses the design of the survey, sample selection, and data collection and analysis. It
then describes the qualitative data gathering process: the design of the interviews,
sample recruitment, and the strategy employed to analyze the interview data.
Chapter 6 (Quantitative analysis) provides details of how the survey data was
analyzed, and the results of the analysis.
Chapter 7 (Qualitative analysis) describes the data obtained from the interviews, and
the findings after analyzing it.
Chapter 8 (Discussion and conclusion) discusses the results in detail and presents
insights into the findings of the study. This chapter also details the contributions of the
research, and its theoretical and practical implication. Finally, it highlights the
limitations of the research, and provides directions for further research.
5
Figure 1.1: Thesis outline
Chapter summary This is the foundation chapter of the thesis. It provided an explanation why the study
was undertaken, the research problem and research objectives raised from previous
literature. The implications and objectives were justified. The methodology used to
analyze the data was explained, and the thesis outline given.
6
CHAPTER 2: RESEARCH CONTEXT
2.1 Introduction This chapter looks at the Web 2.0 phenomenon; both globally as well as from the
perspective of SMEs, and CPD. Small and Medium Sized Enterprises (SMEs) are a
major source of economic growth for most countries and regions (Taylor & Murphy,
2004). Thus, it is important to understand what drives their adoption of IT because the
benefits they gain can significantly impact firms. Since the information-seeking
practices of SMEs differ from large firms in significant ways (Buonanno et al., 2005),
the factors that drive adoption may differ between small and large firms. Without a
better understanding of the differentiating factors that affect the adoption of Web 2.0
innovations, the drive to adopt Web 2.0 tools will not successfully contribute to SMEs’
competitiveness (Martin & Matlay, 2001; Poon & Swatman, 1995).
2.2 An overview of Web 2.0
2.2.1 What is Web 2.0?
Tim Berners-Lee, the inventor of the WWW, wanted the Web to be a place for
connection where:
“… all the information stored on computers everywhere was linked…all the bits of information in every computer at CERN, and on the planet, would be available to [him] and to anyone else. There would be a single, global information space” (Berners-Lee, 1999, p.4).
The original Web, now known as Web 1.0, did not meet Berners-Lee’s expectations. In the
early 1990s, Web 1.0 required a fairly-high level of training to publish online. For
example, it required an understanding of HTML (Hyper Text Markup Language)
(Andersen, 2007; Richardson, 2010). Web 1.0 became a one-way road for
communication and a place where the users simply collected information (Rosen &
Nelson, 2008). Years later, after the arrival of new technologies, Berners-Lee’s ideal
read/write Web, now called Web 2.0, has simplified communication and collaboration
(Andersen, 2007; Richardson, 2010; Rosen & Nelson, 2008).
The term “Web 2.0” (coined by Darcy Di Nucci) was brought into the
public awareness by Tim O’Reilly, a technology-related publisher, and his colleagues at
a 2004 conference (Andersen, 2007). O’Reilly’s 2005 article, “What is Web 2.0”
introduced many people to the ideas behind the coining of the Web 2.0 term (O'Reilly,

7
2005). According to Wikipedia (www.en.wikipedia.org/wiki/Web2.0), Web 2.0 is:
“A second generation of services available on the World Wide Web that lets people collaborates and share information online. In contrast to the first generation, Web 2.0 gives users an experience closer to desktop applications than the traditional static Web pages.”
O’Reilly has described Web 2.0 as:
“… the network as platform, spanning all connected devices; Web 2.0 applications are those that make the most of the intrinsic advantages of that platform: delivering software as a continually-updated service that gets better the more people use it, consuming and remixing data from multiple sources, including individual users, while providing their own data and services in a form that allows remixing by others, creating network effects through an ‘architecture of participation’ and going beyond the page metaphor of Web 1.0 to deliver rich user experiences” (O'Reilly, 2006).
The definition of Web 2.0 varies by use and subject according to researchers, scholars,
students, educators, policy makers, and others (Andersen, 2007; Richardson, 2010;
Rosen & Nelson, 2008). A broad definition is that Web 2.0 is the conceptual framework
for a web-based platform where individuals are able to use groups of technology tools to
create and post content, collaborate on tasks with others, interact in social networks,
revise existing content, and share information. In this web-based platform world, users are
able to participate and control the content, and the boundaries are limitless (O'Reilly,
2005, 2006). It is new, participatory, open, democratic, free, global, cross-cultural, and
unlimited by time zones (Andersen, 2007).
2.2.2 Characteristics of Web 2.0
O’Reilly (2005) states that Web 2.0 tools should be seen:
“As a set of principles and practices that tie together a veritable solar system of sites that demonstrate some or all of those principles, at a varying distance from that core.” (para. 7).
Within the Web 2.0 platform, each individual is able to build and control their own data,
collective intelligence is harnessed, services are offered instead of packaged software,
and data are able to be remixed and transformed. Google is a good example of this as it
continuously releases its software, offering services, and allowing users to manage their
data online. Meanwhile, it is serving as a browser, acting as a database where huge
amounts of data are collected; and a search engine and server for its users and their
online activities. This platform merges various services and keeps its software up-to-

8
date for end-users connected into and through the Internet (O'Reilly, 2005).
In the Web 1.0 world, a few users who were familiar with HTML could collect and use
online data and create a web page. A Web 2.0 world, in contrast, is open to all
individuals. There are few obstacles to the use of Web 2.0 technologies, and with basic
computer technology skills, most people can offer feedback on blogs, write and edit
information on wikis, add tags to images or web pages, and upload photos or podcasts.
This active Web environment is open for posting, uploading, creating and publishing
contents under users’ control (Solomon & Schrum, 2007).
One of the most significant characteristics of Web 2.0 tools is that many Web 2.0 tools
are under an open source license (Solomon & Schrum, 2007). Open source supporters
“believe that the source code for programs should be available for anyone else to study,
use, enhance, and distribute” (Solomon & Schrum, 2007, p.50). All users, including
programmers, can contribute feedback to help in the revision and regular upgrading of open
source software. The open source software authors are community members from
around the world from many cultural backgrounds and nationalities. No-cost does not
mean that choice is limited; in fact, there are many choices among open source
software, such as Moodle, Mozilla Firefox, and the sound editor Audacity.
2.2.3 Web 2.0 tools for professionals
Web 2.0 applications depend on interaction with individuals. They are used to build
collaboration between individuals/users who actively participate by sharing their
experiences, information, knowledge and feedback. For example, sites such as
Facebook (http://www.facebook.com), LinkedIn (http://nz.linkedin.com), YouTube
(http://www.youtube.com) and MySpace (http://www.myspace.com), help individuals
keep in touch with each other, share information and sell goods and services.
Various Web 2.0 applications are available in different formats, such as wikis, blogs,
RSS, podcasting, and social networking. They have a range of characteristics and have
led to the creation of various Web 2.0 communities. The next section articulates the use
of different Web 2.0 formats and provides an overview of current and emerging
business models

9
2.2.3.1 Wiki Wikis are web pages that can be created and edited by their users by using any web
browser. Wikis support hyperlinks and have simple syntax for creating new pages and
linking internal pages on the fly, like Wikipedia (http://www.wikipedia.org). Wikis can
be used to support knowledge management in workplaces (Dave & Koskela, 2009;
Kille, 2006). Some wikis has been created for specific interests, such as television trivia
(http://www.tviv.org), or to design and support personal organizers
(http://www.tiddlywiki.com). Wikis have also been employed by professionals to
interact with their customers or for exchanging information (Boulos, Maramba, &
Wheeler, 2006). Thus, wikis are tools that allow people to join together in knowledge-
building communities in which people are able to improve their reflective and critical
thinking skills (Jonassen, Howland, Marra, & Crismond, 2008). The revision capability
is one of the most distinctive functions of wikis- it allows people to review previous
versions of a page, revise or revert to the version they prefer, compare thoughts from
different participants and practice social negation without social presence (Hemmi,
Bayne, & Land, 2009).
Examples of wikis for professionals are: a) FilesTube (www.filestube.com/p/
professional+wikis), which provides updated information for professionals worldwide;
b) Omega wiki (www.omegawiki.org/planned_Wikis_for_Professionals) (Figure 2.1)
designed for patient support; and c) Accounting Wikia (http://accounting.
wikia.com/wiki/Accounting_Wiki) which allows accounting professionals and
practitioners to publish their articles on the site. Small businesses can also use a wiki-
sourcebook to create wikis (smallbusiness.com/wiki/Directory:Accounting).
Figure 2.1: Example of a Wiki

10
2.2.3.2 Blog The word “blog” is short for web log. Blogs are frequently-updated websites on
particular themes (such as education, business, accounting, and health), and are usually
published by individuals (see Figure 2.2). A blog can bring together individuals with
common interests to form networks of contributors, who together formulate knowledge
founded in the experiences of the network itself (O'Reilly, 2005). The posts (articles) on
blogs are usually (but not always) written by one person, and other individuals are
encouraged to comment on these posts. Blogs can consist of images, text, and
multimedia files (Blood, 2004; Nardi, Schiano, Gumbrecht, & Swartz, 2004; Vogel &
Goans, 2005).
A blog is an effective way for transferring knowledge from an individual to others. This
includes knowledge among professionals, and various blogs have appeared for each
profession. For example, blogs in the field of accounting include “The Analyst’s
Accounting Observer” (www.accountingobserver.com/blog/), which tracks accounting
issues in the news, and “Inside Sarbanes-Oxley” (www.insidearbanesoxley.com) on
internal auditing issues.
Moreover, since blogs allows discourse rather than extended monologues or other
traditional methods of learning, users are provided with opportunities to engage keenly
in a socially constructed learning process relevant to CPD (Santy & Smith, 2007). Blogs
are also useful for improving writing skills and engaging in collaborative learning
(Blood, 2002; Downes, 2004; Du & Wagner, 2007; Kaplan, Piskin, & Bol, 2010;
Richardson, 2010).
Figure 2.2: Example of a Blog

11
2.2.3.3 RSS RSS (Real Simple Syndication) (see Figure 2.3) is an Extensible Markup Language
(XML)-based data format that allows users to discover updates to the content of RSS-
enabled websites. RSS can also stand for “rich site summary” (Duffy & Bruns, 2006),
because it enables users to obtain news and commentaries from authors directly as soon
as they are published, negating the need for intermediaries. Thus, users can stay up-to-
date with an enormous amount of new information without having to visit surfing
numerous websites every day. RSS “feeds” can be easily set up and work automatically
without having to verify settings (Duffy & Bruns, 2006). Wikipedia
(http://en.wikipedia.org/wiki/RSS) describes RSS as:
“A family of Web feed formats used to publish frequently updated digital content, such as blogs, news feeds or podcasts.”
Readers obtain updates on websites immediately by signing up to the RSS feed of a site
or blog. RSS feeds can be obtained and deciphered with help of feed readers, which
keep readers updated on new posts. RSS allows users to create and compose their daily
news package individually according to academic disciplines, personal and professional
interests.
Figure 2.3: Examples of RSS Feeds

12
2.2.3.4 Podcast Podcasts originated from the widespread use of Apple’s iPod music player in the mid-
2000s, and is a conjugate of “iPod” and “broadcast” (see Figure 2.4). Podcasts refer to
the sharing of multimedia files over the Internet. Podcasting is akin to TV on-demand or
radio. Listeners can select the place, time, and content to listen to a program (Campbell,
2005; Frydenberg, 2006; Harris & Park, 2008), rather than having to listen or view it
when it is being broadcast.
Podcasts have been used in CPD to create a collaboration framework among students.
For example, members of the NZ Institute of Chartered Accountants (NZICA), who
require continuing education credits to renew their license, can use NZICA’s podcasts
(www.nzica.com/podcasts.aspx) to acquire these credits.
Figure 2.4: Example of Podcasts
13
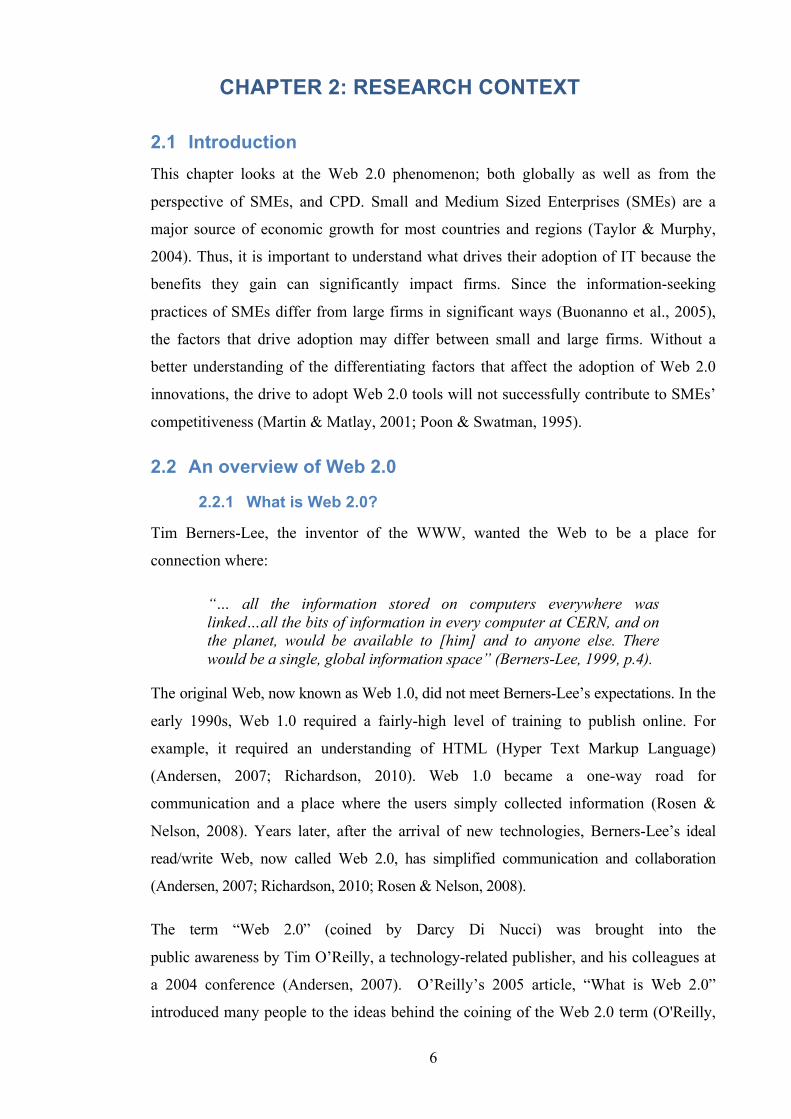
2.2.3.5 Social networks Social networks are online communities that connect people with similar interests
(Mason & Rennie, 2008) so that they can communicate with each other and obtain/pass
knowledge to others. Examples include Facebook (http://www.facebook.com), which is
for general interests, and Café Mom (http://www.cafemom.com), which provides advice
and information to mothers. Although social networking sites are most popular for
personal socializing, they are also used in educational and professional settings such as
professional communities and cross cultural language learning communities (Gray,
Thompson, Clerehan, Sheard, & Hamilton, 2008).
For example, LinkedIn (http://www.linkedin.com) (shown in Figure 2.5) is used to
exchange information about careers. Social networks for professional accountants
include Accounting Networks (http://www.accounting-networks.com), ARNE
(https://cs.thomsonreuters.com/community) and Accountants’ World (http://www.
accountantsworld.co.uk). These social networks are an avenue for professionals to
discuss challenging cases, share professional insights, and learn techniques to improve
their workplace performance, job and customer satisfaction.
Figure 2.5: Example of Social networks

14
2.3 Significance of Web 2.0 for professionals Although many professionals might not pay much attention to trendy websites or spend
time sharing their videos, music, and pictures, the following features of Web 2.0 tools
can have a significant effect on their working lives:
Ø Corporate information systems are becoming more complex because firms are
integrating business applications from varied and multiple systems. Data is also
being generated from many sources and integrated. To use a Web 2.0 term,
organizations are progressively “mashing up” data and applications to provide easier
access and better information to individuals. For instance, many organizations’
information systems’ have already integrated data from their own ERP (Enterprise
Resource Planning) systems, their vendors’ systems, and their customers’ feedback.
Ø The web is being used as a platform to collaborate and share information in
numerous new ways. Web 2.0 tools are becoming forums for contributing ideas,
discussing problems, and providing solutions. These services have become popular
because they are useful- users can interact with each other- and these advantages
become even more powerful when more users use them because of network effects.
Ø Web 2.0 offers a new kind of web with a much improved user interface. Instead of
hyperlinked pages that require users to shuffle from one page to another, pop-up
windows can display information and disappear when no longer needed. These
improvements rely on technologies such as AJAX (Asynchronous JavaScript in
XML) that allow the web browser to display data more effectively and efficiently
(Tu, Blocher, & Ntoruru, 2008).
These developments matter for business professionals at three levels. First,
organizations are changing the way they do business by using Web 2.0 tools- they have
greater access to data and can manipulate and analyze it much more easily. Business
professionals need to know how to integrate these tools into their work processes so that
they become more effective, especially in terms of monitoring and data access. Second,
professionals can use these tools to exchange information with their peers in the same
profession in other firms. Last, they can use Web 2.0 tools as part of their e-learning
toolkit to update their knowledge and develop their professional skills.

15
2.4 Web 2.0 in New Zealand SMEs Many New Zealand (NZ) firms use the Internet to sell their services and products.
Studies show that there are a large number of active Internet users in NZ, perhaps due to
the fact that New Zealanders have easily adopted new technologies (Cameron &
Massey, 1999). SMEs are viewed in NZ as sources of innovation and flexibility, and
make a major contribution to its economy, both in terms of the number of SMEs and the
proportion of the labor force employed by these companies. The importance of the SME
sector in NZ is increasing as large companies downsize to compete in the international
markets, workers face less job security, and more individuals turn their hands to small
businesses at retirement or as a lifestyle choice.
For the purposes of this study, an SME is defined as an enterprise with 30 or fewer
employees, which is generally managed by the owner. SMEs are usually not part of
larger businesses or a group of companies with access to managerial expertise. As in
many other economies, most firms in New Zealand are small and medium-sized, with
97% of all firms employing 30 or fewer employees (Peursem & Jiang, 2008).
With more opportunities presented by technological development and globalization, the
role of SMEs seems to be expected to continue to enhance in the coming years
(Cameron & Massey, 1999). NZ’s SMEs form an important component of the
economy’s output (37%), both in terms of the number of companies (97%) and account
for up to 70% of employment (Deloitte, Touche, & Tohmatsu, 2008). In addition, a
survey conducted by CPA Australia Ltd in 2011 indicated that: “(the) IMF’s forecast
for New Zealand’s GDP growth is 2 per cent for 2011 and 3.7 per cent for 2012. This
positive growth forecast is reflected in the relatively neutral-to-positive expectations
that many New Zealand small businesses have on the economy” (CPA Australia Ltd,
2011, p.7).
A survey by Deloitte, Touche, & Tohmatsu revealed that although the adoption rates for
Internet presence was high, limited Internet based learning was conducted and the
forecast growth for Web 2.0 usage by professionals and organizations was quite vague
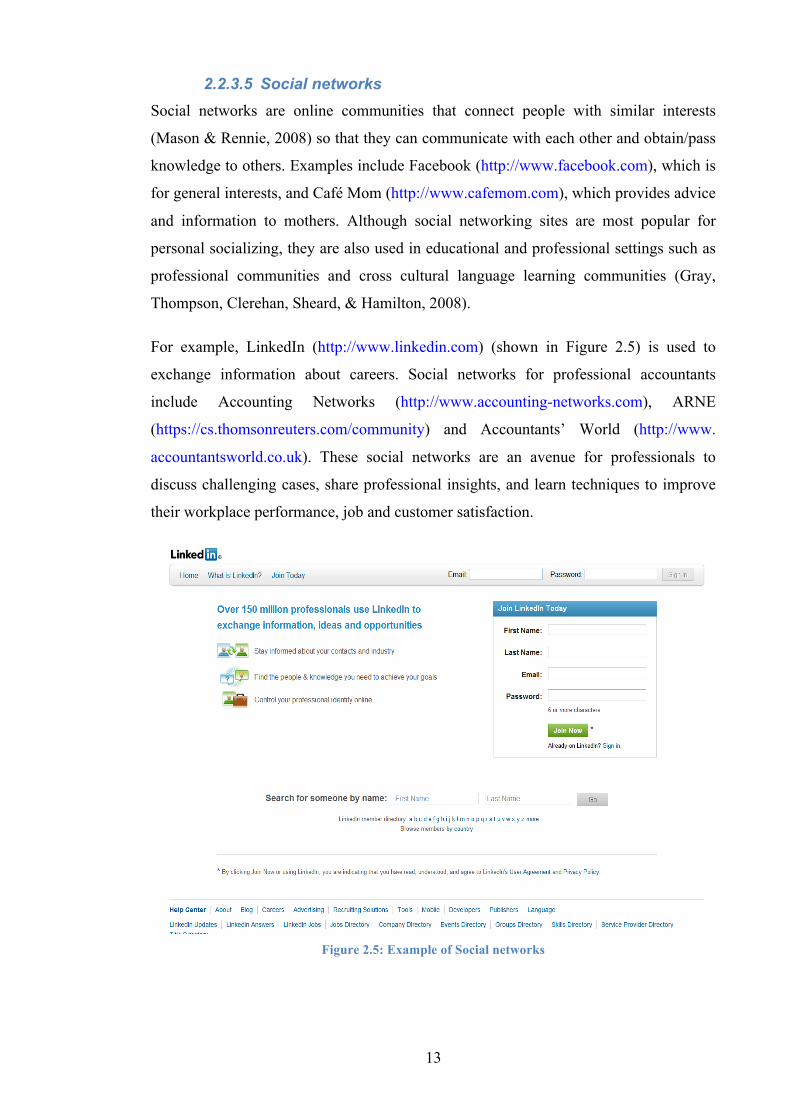
(Deloitte et al., 2008). However, a more recent study indicates that there is an increase
in organizational adoption of Web 2.0 tools. In 2011, social networking sites (see Figure
2.6) made the biggest gains and increased their lead over other popular Web 2.0
technologies such as blogs and video sharing. Seventy-two percent of participants said
that their organizations used at least one social technology. Participants also state that
16
their companies use Web 2.0 technologies (social tools) to improve their understanding
of external environments, find out new ideas, and manage projects and employees.
Participants state that different Web 2.0 tools are beneficial for different processes
(McKinsey, 2011).
Figure 2.6: Adoption of Web 2.0 Tools
(From: The networked enterprise holds steady: McKinsey, 2011, p. 2)
The Deloitte, Touche, & Tohmatsu, and CPA Australia surveys also pointed out that
large firms, particularly those in the financial services sector, were more likely to view
Web 2.0 tools as being of strategic importance compared to SMEs. This indicated a lack
of awareness among SMEs of the possibilities inherent in these innovations.
2.5 Adopting Web 2.0 in SMEs – the challenges While many organizations recognize the benefits of using Web 2.0 tools, their adoption
can be challenging. The Deloitte, Touche, & Tohmatsu, and CPA Australia surveys
found that the barriers for Web 2.0 tools usage included a lack of knowledge and skills,
cost, a lack of organizational direction, and the low level of management skills among
many small businesses (CPA Australia Ltd, 2011; Deloitte et al., 2008).
Thus, efforts to encourage SMEs to use Web 2.0 tools need to consider their
characteristics to understand how Web 2.0 tools are actually used by them. In general,
the SME sector is very dynamic. However, although many new enterprises start each
year, only 40% of them survive for ten years (Levy & Powell, 2004). This is partly due

17
to the management structure of these enterprises: SMEs are strongly influenced by the
personality of their owner and his/her attitude towards doing business (Levy & Powell,
2004; Masurel, Montfort, & Lentink, 2003): as Burns commented, “a real small firm
has two arms, two legs and a giant ego” (Burns, 2001, p.67). In addition, because they
have limited resources, their business strategies often focus on survival, instead of
growth (Levy & Powell, 2004).
Often, IT applications are adopted with a short-term perspective, meaning that IT is
used for day-to-day operations rather than to support management activities, such as
planning or monitoring market trends. As SMEs generally lack IT expertise and
capacity, their owners are the usually the only ones with the authority and (limited)
knowledge to identify IT opportunities and invest in them. Implementing and applying
of IT in a business depends strongly on its owners’ personality, skills and experiences
(Levy & Powell, 2004; Street & Cameron, 2007).
While SMEs use the Internet heavily, their adoption of Web 2.0 tools varies widely.
Their Internet use has a very clear functional focus: they use it to access information,
communicate with their suppliers and customers, and carry out transactions, such as
banking or placing orders. From that perspective, Web 2.0 tools have limited use for
SMEs because they are not intended for such operational processes. This lack of fit with
their needs means that they are also unwilling to adopt Web 2.0 tools because they will
not be able to assess and evaluate their benefits easily. Finally, some SMEs are put off
by the risks of using Web 2.0 tools internally (e.g. legal risks because of employee
abuse) (De Saulles, 2008a, 2008b).
2.6 Adopting Web 2.0 in SMEs – the benefits On the other hand, the use of Web 2.0 technologies facilitates communication within
firms. Web 2.0 tools such as wikis are useful for writing documents collaboratively,
because all employees can insert, delete, or edit the content (West & West, 2009).
Employees can declare their level of competence on a particular process or technology
so that employees who need help will know who to contact. Such internal collaboration
benefits companies since it helps employees share important information and their
expertise with each other. Such collaboration often improves the work climate, and
good relations in an organization can themselves be a competitive advantage.
18
Since Web 2.0 technologies are participatory, decentralized, linked and emergent, they
can also facilitate innovation processes since employees can collaborate efficiently and
professionally (Vapola, Tossavainen, & Gabrielsson, 2008). Web 2.0 tools also provide
companies with opportunities to create external networks where they can receive
feedback from their partners, stakeholders, and customers. The use of such
collaboration networks can thus support innovation, possibly helping organizations gain
a competitive advantage (Chesbrough, 2003; De Wit & Meyer, 2010; Seybold, 2006).
Thus, the major organizational benefits from adopting Web 2.0 tools include an
enhanced reputation, improved knowledge-sharing, higher employee commitment and
engagement, and greater staff efficiency and productivity (Dawson, Hough, Hill,
Winterford, & Alexandrov, 2009).
2.7 Web 2.0 user adoption studies Researchers have begun examining the factors that influence the adoption of Web 2.0
tools. Although the details of these studies are presented in the next chapter (Section
3.3), their key findings are that adoption is influenced by technological issues, social
influence, performance expectancy, trust, satisfaction and effort expectancy.
2.8 Web 2.0 and Continuing Professional Development (CPD) CPD is a method by which professionals can continue to learn and develop throughout
their careers, thereby keeping their knowledge and skills up to date in order to work
effectively. Thus, it relies on a community of individuals with similar interests and
stresses the timely dissemination of knowledge. Web 2.0 tools can help in both aspects.
Web 2.0 tools bring together individuals with common interests to share and formulate
knowledge founded in their experiences (O'Reilly, 2005). They facilitate interaction and
collaboration, offer opportunities for immediate feedback, create communities, and
harness collective intelligence with no associated costs (Andersen, 2007; Solomon &
Schrum, 2007). With Internet connectivity, people can easily modify these tools to meet
their personal interests and needs.
The use of Web 2.0 for learning may be attractive because it is flexible enough to meet
individual learning needs, can help develop critical thinking skills, provides an
alternative learning environment by expanding learning outside the classroom, and can
prepare users for lifelong learning (Lemke, Coughlin, Garcia, Reifsneider, & Baas,
2009). In addition, Web 2.0 tools allows discourse rather than concentrating on

19
extended monologues or other traditional methods of learning, users/professionals are
able keenly to engage in a socially constructed learning process relevant to CPD (Santy
& Smith, 2007).
2.8.1 Web 2.0 and e-learning
E-learning can be defined as “the use of computer network technology, primarily over
or through the Internet, to deliver information and instruction to individuals” (Welsh,
Wanberg, Brown, & Simmering, 2003, p.246). ICT has provided many mechanisms for
supporting learning and e-learning is seen as the new model for modern education,
particularly for SMEs.
These days, the Internet has become the core platform for e-learning: it places the
learner at the center and encourages communication, informal consumption, and
knowledge creation and sharing. These trends have accelerated with the emergence and
use of Web 2.0 tools. With sharing, networking and collaboration embedded in them,
Web 2.0 tools are altering users’ activities and relationship with knowledge and
information (Tu, 2004; Tu, Blocher, & Roberts, 2008).
Web 2.0 tools have been widely used to enhance communication and knowledge
transfer in virtual learning environments, and have made training more efficient and
effective (Aczel, Peake, & Hardy, 2008). One reason for this is that they support the
conception of learning as a behavior that takes place in an organizational and social
context, not only within individuals’ (Moon, Birchall, Williams, & Vrasidas, 2005;
Tynjälä & Häkkinen, 2005).
2.8.2 e-Learning at the workplace
Workplace learning refers to training or learning undertaken in the workplace (Craig,
2007). Workplace learning is the means, process, and activity by which an employee
learns in the workplace, from basic skills to high technologies and management
practices that are immediately applicable to an employee’s job, duty, and role (Evans &
Fuller, 2006).
The increased intensity of competition, industrial changes, and globalization has led
companies to look for new ways to develop and improve their competitive advantages.
Continuous innovation has become a key objective, and to achieve it, knowledge is seen
as the central resource with learning as an essential process. This has led to a greater
emphasis on studies of workplace learning, especially because of the increasingly

20
important role played by professional skills and expertise in organizational
developments (Derouin, Fritzsche, & Salas, 2005).
2.8.3 Continuing Professional Development (CPD)
In today’s society, individuals base their self-esteem on their work and increasingly find
that their satisfaction and identity comes from their profession (Mott, 2000). Mott states
that education is becoming an increasingly essential factor in individuals’ lives,
especially in the workplace. Grotelueschen (1985) describes the educational
participation of professional workforces as involvement in a formal education activity
that is typically short-term, part-time, or both. Educational institutions, professional
associations and societies, professional service agencies, the government, and other
organizations provide CPD activities (Grotelueschen, 1985).
The distinction between CPD and continuing education in general relates to the benefits
received from the educational experiences, the nature of the participation, and the
characteristics of the referent population (Grotelueschen, 1985). Lifelong education is a
learning experience that prepares an employee for future positions, while training is
education employees receive to improve their performance on their present job (Spears
& Parker, 2002). Training is essential for organizations to become more effective and to
enhance their productivity.
2.8.3.1 What is CPD? CPD refers to any activities engaged in by qualified professionals through which they
continue to develop professionally (Ryan, 2003) by “improving (their) professional
competence and practice” (Mott, 2000: p.23). Through CPD, professionals enhance
their existing skills as well as pick up new skills and knowledge. It is not exclusively
about formal qualifications or courses (though these can be a key element of CPD), and
may comprise development in both non-technical and technical areas. CPD includes a
number of activities such as work experience, open learning, private study, and many
more (Martin & Madigan, 2006).
2.8.3.2 Why is CPD needed? Employees carry out CPD because of the need for professional advancement, personal
fulfillment, skill development, and collegiality (Grotelueschen, 1985). Although
professions that require licensure and certification make use of CPD more frequently,
CPD is growing in size, stature, and coherence for many professions (Cervero, 2000).
One reason for this is greater employment instability. The increased use of temporary

21
employees, consultancy engagements, and short-term contracts has meant that
individuals need to take greater responsibility for their own careers to maintain their
employability. CPD has also become a more prominent aspect of the workplace
environment because of the increase of research-based knowledge, rapid societal
changes, and spiraling technological innovations (Cervero, 2000).
Professionals also recognize the need to continually update their skills and knowledge.
Their initial training cannot provide all the skills and knowledge that they need to be
successful in their career. Most professionals would want to specialize, receive
promotions and move into managerial positions during their careers, or develop the
skills and knowledge needed to succeed in the context of changing technologies and
markets (Broady-Preston, 2009; Brosnan & Burgess, 2003; Ryan, 2003).
Continuing employment is the main motivation for individuals/professionals to get
involved in CPD. The job market is continually growing, and individuals/professionals
need to update their knowledge and skills, and be ready to increase the chance of
continued employment. For most professionals, involvement in CPD is required to
continue their membership in their professional organizations, which is essential for
their professional standing. For sole practitioners, it is important to maintain her/his
competence to remain self-reliant and provide professional services (Broady-Preston,
2009; Butler, 2011).
2.8.3.3 What are the benefits of CPD to employers? Professionally competent employees will boost a firm’s public image, which in turn
affects their recruitment and their ability to develop relationships with clients.
Professional organizations, clients, employers and government benefit from CPD and
the resulting continuance, and increasing of the skills and knowledge of the workforce.
Professional organizations want to help their members remain competent. In addition,
ensuring that only competent individuals are members can boost the reputation of the
organization. Clients of professionals require them to have the necessary skills and
knowledge to do their job, and CPD helps ensure that. Employers also should have
knowledgeable employees so that their business remains competitive. Finally,
governments are interested in the benefits that CPD brings to industries, the overall
economy, and the population’s well-being (Benson, 2004; Brosnan & Burgess, 2003;
Butler, 2011).

22
Chapter summary This chapter laid out the context of the study. It began with an overview of the Web 2.0
phenomenon and the issues affecting its adoption. While Web 2.0 tools can be a
powerful lure for organizations, in terms of improved knowledge sharing,
innovativeness, and relationships with stakeholders, SMEs are still lagging in their use
compared to large organizations because of challenges such as a lack of knowledge and
skills, costs, and a lack of organizational direction. The chapter then discussed the link
between Web 2.0 and e-learning, especially for professionals who are working on their
CPD to maintain their employability. The next chapter examines the literature on IT
adoption and use, which will be used to develop the research model.

23
CHAPTER 3: LITERATURE REVIEW
3.1 Introduction This chapter will review the literature on technology adoption to identify the most
appropriate model for understanding the factors that affect the adoption of Web 2.0
tools by professionals. It will then discuss recent studies on Web 2.0 adoption.
Following that, this chapter will provide an overview of the concept of digital literacy
and its relevance for this study. The chapter concludes with a summary.
3.2 Models of Information Technology (IT) adoption There are various theories about the acceptance and adoption of IT. Some of them are
grounded in social psychology and focus on the user’s internal decision processes
(Davis, 1989; Fishbein & Ajzen, 1975), while others focus on the features of the
innovation and on its diffusion among new users (Rogers, 1995). In the following
paragraphs, I will discuss these models: Theory of Reasoned Action (TRA) (Fishbein &
Ajzen, 1975), Theory of Planned Behavior (TPB) (Ajzen, 1991), Technology
Acceptance Model (TAM) I and II (Davis, 1989); (Venkatesh & Davis, 2000),
Diffusion of Innovation Theory (DIT) (Rogers, 1962), Expectancy Disconfirmation
Theory (EDT) (Bhattacherjee, 2001b) and the Unified Theory of Acceptance and Use of
Technology (UTAUT) (Venkatesh, Morris, Davis, & Davis, 2003).
3.2.1 Theory of Reasoned Action (TRA)
TRA (Fishbein & Ajzen, 1975) argues that an individual’s behavior is determined by
his/her intention to perform the behavior, and that the intention is a function of his/her
attitude toward the behavior and the subjective norms toward that behavior. In terms of
IT adoption, TRA posits that a user’s decision to adopt a new technology is predicted by
his/her intention to do so, and the strength of this intention depends on his/her attitude
toward IT adoption and the opinions of other individuals about adopting that technology
(i.e. the subjective norms surrounding IT adoption).
3.2.2 Theory of Planned Behavior (TPB)
The TPB model suggests that the main determinants of users’ behavior are their
attitudes towards the behavior, the level of perceived behavioral control, and the
subjective norms around that behavior (Ajzen, 1985). Attitudes toward a behavior refer
to users’ negative or positive feelings about their performance. Subjective norms refer
to users’ understanding of the opinions of individuals who are important to them

24
regarding that behavior, and perceived behavioral control is defined as the perceived
ease or difficulty with which the behavior can be performed.
3.2.3 Technology Acceptance Model (TAM) I & II
Davis (1989) adapted Fishbein & Ajzen’s TRA to explain technology acceptance and
developed TAM. According to TAM, “Usefulness” (U) and “Ease Of Use” (EOU) are
the main factors that influence the rejection or acceptance of an innovation by
individuals. Davis suggested that if people believed that using an innovation would
require little effort, this would improve their perception of EOU, and if people believed
that an innovation would enhance their performance, they would perceive it as being
useful.
TAM II (Venkatesh and Davis, 2000) extended TAM by including the determinants of
the Perceived Usefulness (PU) and Intention To Use (ITU) constructs. The variables
that affect PU are divided into cognitive instrumental processes and Social Influence
(SI) processes. SI processes are made up of voluntariness, subjective norms, and image,
while cognitive instrumental processes consist of output quality, Perceived Ease Of Use
(PEOU), job relevance, and result demonstrability (Venkatesh & Davis, 2000).
3.2.4 Diffusion of Innovation Theory (DIT)
DIT (Rogers, 1962) suggests that innovation diffuse when users accept and use new
things or ideas. The model describes the determinants of the rate of adoption, the
process of innovation adoption, and the various categories of adopters based on their
likelihood of adopting an innovation. Rogers (1995) states that the innovation’s
trialability, relative advantage, complexity, compatibility with existing systems, and
observability can explain up to 87% of the variance in the rate of innovation adoption
(Rogers, 1995).
The TAM and DIT models are among the most influential models in explaining and
predicting innovation adoption and system use. Originating from different disciplines,
TAM and DIT are similar in some respects. For example, the relative advantage
construct in DIT is often perceived to be the equivalent of the usefulness construct in
TAM, and the complexity construct in DIT is very similar to the EOU concept in TAM
(Moore & Benbasat, 1996).

25
3.2.5 Unified Theory of Acceptance and Use of Technology (UTAUT)
Venkatesh, et al. (2003) developed the Unified Theory of Acceptance and Use of
Technology (UTAUT) (Figure 3.1) to integrate prior research on IT acceptance and use.
In this model, Effort Expectancy (EE) and Performance Expectancy (PE) incorporate
the constructs of PU and EOU in the original TAM model. UTAUT suggests that, while
EE can be important in determining users’ acceptance of IT, EOU may become less
important over time as users engage with the technology for a sustained period of time.
Thus, EOU is expected to be more salient only in the early stages of using IT.
Figure 3.1: Unified Theory of Acceptance and Use of Technology (UTAUT) (Venkatesh et al., 2003)
UTAUT also endeavored to explain how individual differences can influence IT use by
proposing that the relationships between PEOU, PU, and ITU can be moderated by
gender, age, experience, and voluntariness of use. For instance, Venkatesh, et al. (2003)
found that the relationship between ITU and PU varied with gender and age- it was
stronger for male and younger employees. The impact of PEOU on usage intentions was
also moderated by age and gender, such that it was stronger for older and female
employees.
This model was able to explain 70% of the variance in ITU (Venkatesh, et al. 2003),
with greater clarity than the TAM model. Thus, UTAUT is being used widely to
examine the users’ acceptance of the technologies (AbuShanab & Pearson, 2007;
AlAwadhi & Morris, 2008; Baltaci-Goktalay & Ozdilek, 2010). Table 3.1 lists the
definitions of the constructs as described in the original paper (Venkatesh et al., 2003).

26
Table 3.1: Definition of UTAUT’s constructs and their sources
Construct Definitions Source of constructs
Performance Expectancy
(PE)
The degree to which an individual believes that using the
system will help him or her to attain gains in job performance
(p.447).
‘PU’ from TAM and C-TAM-TPB, ‘extrinsic motivation’ from MM, ‘job-fit’ from The Model of Personal Computer Utilization (MPCU), ‘relative advantage’ from DIT, and ‘outcome expectations’ from SCT (Compeau & Higgins, 1995; Davis, 1989; Moore & Benbasat, 1996; Moore & Benbasat, 1991; Thompson, Brown, Kay, & Titterington, 1991; Venkatesh et al., 2003).
Effort Expectancy
(EE)
The degree of ease associated with the use of the system
(p.450).
‘PEOU’ from TAM, ‘complexity’ from MPCU, and ‘EOU’ from DIT. (Venkatesh et al., 2003)
Social Influence
(SI)
The degree to which an individual perceived that
important others believe he or she should use the new system
(p.451).
‘Subjective norm’ in TRA, TAM2, TPB and C-TAM-TPB, ‘social factors’ in MPCU, and ‘image’ in DIT. (Davis, 1989; Moore & Benbasat, 1991; Thompson et al., 1991; Venkatesh et al., 2003).
Facilitating Conditions
(FC)
The degree to which an individual believes that an
organizational and technical infrastructure exists to support
use of the system (p.453).
‘Perceived behavioral control’ from TPB, C-TAM-TPB, ‘facilitating conditions’ from MPCU, and ‘compatibility’ from DIT (Kirkman, Cornelius, Sachs, & Schwab, 2002; Moore & Benbasat, 1991; S. Taylor & Todd, 1995; Thompson et al., 1991; Venkatesh et al., 2003).
3.2.6 Expectancy Disconfirmation Theory (EDT)
EDT was developed by marketing researchers, who proposed that a customer’s to
repurchase a service or a product is influenced by his/her prior experience with the
service or product (Anderson & Sullivan, 1993; Oliver, 1980). A satisfactory experience
is viewed as the main determinant of long-term customer relationships. EDT is widely
used in the consumer behavior literature to investigate customer satisfaction and post-
purchase behavior, such as repurchase intention and service marketing (Anderson &
Sullivan, 1993; Dabholkar, Shepherd, & Thorpe, 2000; Oliver, 1980, 1993; Patterson,
Johnson, & Spreng, 1997; Spreng, MacKenzie, & Olshavsky, 1996; Swan & Trawick,
1981).

27
The theory (Figure 3.2) posits that the key predictor of an individual’s willingness to
continue with some action is whether his/her expectations about that act were met when
he/she first used that good or service. This “Expectation Confirmation” (EC) affects the
individual’s perception of the good’s/service’s performance, as well as his/her
satisfaction with the good/service (Bhattacherjee & Premkumar, 2004; Spreng & Page,
2003).
Figure 3.2: Expectancy Disconfirmation Theory (EDT) (Oliver, 1977, 1980)
Bhattacherjee (2001b) applied this model in the IS context, proposing that the
Continuance Intention (CI) is similar to customers’ repurchase intention because both
intentions follow an initial decision (purchase and/or acceptance), are determined by the
initial use of IT or products’ experience, and could direct to an ex post facto reversal of
the initial decisions. In the IT/IS context, EDT has been used to explain user satisfaction
with various types of IS systems (Au, Ngai, & Cheng, 2002; Au, Ngai, & Cheng, 2008;
Belanche, Casalo, & Flavian, 2010; Bhattacherjee, 2001a, 2001b; Bhattacherjee &
Premkumar, 2004; Hossain & Quaddus, 2011; Kim, 2010; Lee, 2010a, 2010b; Limayem
& Cheung, 2008; McKinney & Yoon, 2002; Susarla, Barua, & Whinston, 2003;
Woodroof & Kasper, 1995).
Bhattacherjee proposed the Expectancy Disconfirmation Model (EDM) by integrating
the EDT and the TAM. This model is largely derived from EDT, and the most
important distinction is the differentiation between the pre- and post-adoption stages of
IT use. Table 3.2 describes the constructs in EDT.

28
Table 3.2: Definition of EDT’s constructs and their sources
Construct Definitions Source of constructs
Perceived Usefulness
(PU)
The degree to which a person believes that using a particular
system would enhance his or her job performance (Davis, 1989. p.320).
“Relative advantage” from DIT, “PU” from TAM (Bhattacherjee, 2001b; Davis, 1989; Rogers, 1962).
Expectation Confirmation
(EC)
When performance is better than expected, then expectations are
positively confirmed.
This association comes from adaptation level theory (Helson, 1964), self-perception theory (Bem, 1972), “PU” from TAM (Davis, 1989), (Bhattacherjee & Premkumar, 2004).
Satisfaction (S)
The summary psychological state resulting when the emotion surrounding disconfirmed
expectations is coupled with the consumer’s prior feelings about the
consumption experience (Oliver, 1981, p.29).
Initial definition from (Locke, 1976, p.1300), in job performance context from (Oliver, 1981, p.29), in building and retaining a loyal base from (Anderson & Sullivan, 1993, p.160), overall satisfaction from (Spreng et al., 1996).
Continuance Intention
(CI)
Willingness to continue to use/purchase a technology/service
or product.
“ITU” from TAM II (Venkatesh & Davis, 2000). Behavioral intention from (Mathieson, 1991).
EDT posits that consumers’ intention to repurchase products or continue service usages
is determined mainly by their satisfaction with their prior use of the products or services
(Anderson & Sullivan, 1993; Karahanna, Straub, & Chervany, 1999). Bhattacherjee
(2001b) extended EDT to the IS context in three ways. Firstly, while EDT examines
both post-consumption and pre-consumption variables, the EDM refers only to post-
acceptance variables. The outcome of any pre-acceptance variables is captured within
the satisfaction and confirmation constructs. Secondly, EDT studies pre-consumption
expectation effects, not post-consumption expectation effects. The EDM revised EDT to
include ex post facto expectations. Lastly, expectations are represented by PU, because
PU is a cognitive belief salient to IT usage (Davis, 1989). IT continuance intention
refers to the beliefs that influence users’ intentions across all stages of IT usage
(Karahanna et al., 1999).
The preceding sections discussed the common theories that are used to study IT
adoption. The key difference between the EDM and UTAUT models is that the latter
seeks to explain the initial uptake of a technology, while the former examines what
motivates users to continue using a technology after they have started using it. Given
that the present study is interested in investigating both the initial adoption decision as
29
well as the continued use of Web 2.0 tools, both of these models are relevant. The next
section looks at prior studies on Web 2.0 adoption and presents their findings, as well as
the theoretical perspectives they used.
3.3 Web 2.0 user adoption studies Recent studies have begun examining the use and adoption of Web 2.0 tools. These
studies explore Web 2.0 adoption in different contexts and attempt to identify the
factors, which influence the adoption of these technologies by individuals. Table 3.3
highlights the findings from these studies.
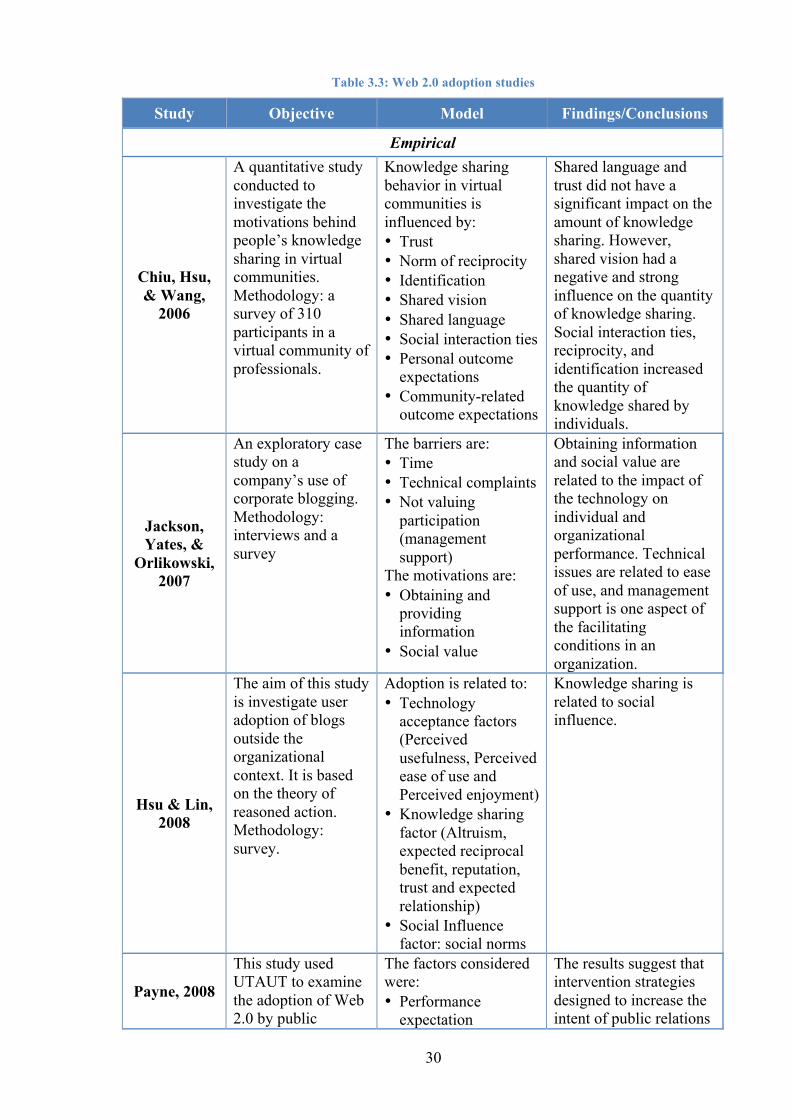
30
Table 3.3: Web 2.0 adoption studies
Study Objective Model Findings/Conclusions
Empirical
Chiu, Hsu, & Wang,
2006
A quantitative study conducted to investigate the motivations behind people’s knowledge sharing in virtual communities. Methodology: a survey of 310 participants in a virtual community of professionals.
Knowledge sharing behavior in virtual communities is influenced by: • Trust • Norm of reciprocity • Identification • Shared vision • Shared language • Social interaction ties • Personal outcome
expectations • Community-related
outcome expectations
Shared language and trust did not have a significant impact on the amount of knowledge sharing. However, shared vision had a negative and strong influence on the quantity of knowledge sharing. Social interaction ties, reciprocity, and identification increased the quantity of knowledge shared by individuals.
Jackson, Yates, &
Orlikowski, 2007
An exploratory case study on a company’s use of corporate blogging. Methodology: interviews and a survey
The barriers are: • Time • Technical complaints • Not valuing
participation (management support)
The motivations are: • Obtaining and
providing information
• Social value
Obtaining information and social value are related to the impact of the technology on individual and organizational performance. Technical issues are related to ease of use, and management support is one aspect of the facilitating conditions in an organization.
Hsu & Lin, 2008
The aim of this study is investigate user adoption of blogs outside the organizational context. It is based on the theory of reasoned action. Methodology: survey.
Adoption is related to: • Technology
acceptance factors (Perceived usefulness, Perceived ease of use and Perceived enjoyment)
• Knowledge sharing factor (Altruism, expected reciprocal benefit, reputation, trust and expected relationship)
• Social Influence factor: social norms
Knowledge sharing is related to social influence.
Payne, 2008
This study used UTAUT to examine the adoption of Web 2.0 by public
The factors considered were: • Performance
expectation
The results suggest that intervention strategies designed to increase the intent of public relations

31
relation practitioners. Methodology: 338 public relation practitioners were surveyed in two-wave online surveys
(usefulness of blogging)
• Social influence • Effective technology
practitioners to accept Web 2.0 tools should focus on PE, SI, and affective components of technology.
Chai, 2009
This study investigates the factors that affect bloggers’ knowledge sharing outside the organization. Methodology: survey of 446 students from two large US universities
The adoption factors are: • Trust (trust in
blogger, trust in information, trust the internet, trust the serves provider)
• Information privacy concerns
• Social ties, gender and reciprocity
The author argues that privacy is a concern for individual involvement is on the internet. Privacy was not considered to be a relevant issue for the present study because of the CPD context, which meant that the information being shared was professional, not personal, information.
In, Jaekyoung, & Sooyeon,
2009
This research studied the social motivation for using blogs using motivation theory and TAM theory.
The factors studied were: • Perceived usefulness • Perceived ease of use • Reciprocity • Social identity • Enjoyment of helping
Social identity was significantly related to blog use.
Paroutis & Al Saleh,
2009
This study investigated the key determinants of collaborating and sharing knowledge using web 2.0 technologies within organizations. Methodology: A case study was conducted in a technology company.
The determinants include: • History • Outcome expectancy • Perceived
organizational/management support
• Trust
Certain variables were similar to those in UTAUT: • History- related to
compatibility; • Outcome expectancy
- related to perceived benefits and rewards
• Organizational/management support- related to facilitating conditions
Wattal, Racherla, & Mandviwall
a, 2009
This study examined the role of socio-demographic characteristics and social networks in blog adoption and usage by employees in a large multi-national corporation.
It focused on • Individual
characteristics (age, gender)
• Organizational factors (managerial adoption)
• Social influences (adoption in relational & spatial networks)
Age was negatively related to adoption, but gender had no significant impact. Usage in spatial networks and managerial influence explained much of the variance in adoption.

32
Sumak, Polancic, &
Hericko, 2010
The study measured how an e-learning technology (Moodle) was used among students. The UTAUT model was used. Methodology: 235 undergraduate students were surveyed.
The factors studied were: • Performance
Expectancy (PE) • Effort Expectancy
(EE) • Social Influence (SI) • Facilitating
Conditions (FC) • Attitude Toward
Using (ATU) • Behavioral Intention
(BI) • Use (U)
SI and PE had a significant direct effect on ATU, but EE did not. BI is affected by SI, not EE, PE and ATU. Use is determined by FC and BI.
Schoendienst, Krasnova, Guenther, & Riehle, 2011
The study examined the factors influencing employees’ adoption of micro-blogging, and suggested that micro-blogging should be presented to employees as an efficient means of personal brand building, communication, and knowledge management. Methodology: A survey of 82 Twitter users. The participants were asked to imagine that a Twitter-like system was introduced in their workplace.
The factors studied were: • Intention to Follow
(FLW) • Intention to
Contribute (CTB) • Performance
Expectancy (PE) • Effort Expectancy
(EE) • Signal-to-Noise Ratio
(SN) • Communication
Benefits (CBE) • Expected
Relationships (ER) • Reputation (RE) • Privacy Concerns
(PV) • Collaborative Norms
(CN)
PE, PV, CBE, RE, and SN significantly affect micro-blogging usage.
Conceptual
Bradley, 2007
This Gartner research report describes the factors that motivate firms to shift to an “enterprise 2.0” model from the organizational as well as system viewpoints.
Organizational factors: • Purpose of use • Liberty • Authorship • Nurturing
(management support) including awareness and reward
• Tipping point (critical mass)
System characteristics: • Structure (user’s
Promoting authorship is important for user adoption. Critical mass (tipping point) refers to the level of community participation, which is similar to social influence.

33
facilitators to do the work)
• Ease of use • Ecosystem
(integration of the use of web 2.0 with the daily work process)
• Discoverability (easy to discover the content of the system)
• Seed (initial content and key participant to start the contribution)
Hester & Scott, 2008
The study develops a theoretical model to examine the drivers of the adoption of wikis. The model was derived from the DOI framework and prior studies of wiki adoption.
The motivators for wiki diffusion are user perceptions of wiki: • Complexity • Relative advantage • Usefulness for work • Critical mass
There are two levels of adoption-related factors: organizational and users. For this study, we consider only user-related factors. Critical mass is similar to social influence.
Shumarova & Swatman,
2008
This study investigated the factors that motivate employees to use shadow (informal) collaboration tools (i.e. wiki and blogs) rather than the formal ICT. Methodology: content analysis of the literature on computer supported collaborative work (CSCW) from 1997 to 2008
Adoption was related to: • Performance
(technology speed and system quality)
• Personal satisfaction (perceived behavior controls over using the collaborative tools and communicating or discussing with others)
• Affordability (organization’s ability to obtain the system)
Performance and personal satisfaction are related to performance expectancy, while affordability is similar to facilitating conditions.
Torning, 2008
This paper develops a conceptual model and argues that CSCW systems in organization need a new design based on web 2.0.
Adoption was related to: • The “time famine”
for knowledge workers
• A culture of sharing information
The availability of time can be considered to be similar to effort expectancy, while a culture of knowledge sharing is related to social influence.

34
The review above shows that most studies on Web 2.0 adoption used the UTAUT
model, although some extended it with variables such as privacy, social influence or
knowledge sharing. Most of these variables can be subsumed under the existing
UTAUT framework, while some, such as privacy, are not relevant to the present study,
as it deals with the use of Web 2.0 tools for exchanging work-related information
relevant to members of a profession, not personal information. Thus, this study will rely
on UTAUT to study the use of Web 2.0 tools.
However, one aspect of the Web 2.0 world that is not captured by these models is the
evolutionary aspect of Web 2.0 tools. Using Web 2.0 tools successfully requires users to
have good Web 1.0 skills, e.g. searching, collating search results, commenting, and
sharing links. These skills can be measured by the concept of Digital Literacy. It is
likely that users who are uncomfortable with basic web-surfing would be less keen to
use Web 2.0 tools, as they require more intense involvement with web browsers and a
higher level of online interaction. The next section discusses this concept in more detail.
3.4 Digital Literacy Literacy is defined as the ability to write and read at an acceptable level of skill
necessary for communication (Holdaway, 1979). However, literacy has lately taken on
other meanings; for example, researchers have introduced visual literacy, mathematical
literacy, and technological literacy. While it might be problematic to measure the degree
to which literacy has an impact on an individual’s overall happiness, one can easily
accept that an increase in literacy would lead to an improvement of the individual’s life
and society’s development (Goodfellow, 2011). Nowadays, we are living in an era,
which can be called the digital era, and it is worth clarifying the role of literacy in terms
of the digital world.
Gilster (1997) introduced the concept of digital literacy (DL) and defined it as “… the
set of attitudes, understanding and skills to handle and communicate information and
knowledge effectively, in a variety of media and formats” (p. 17). The term itself had
been used over the past decade, but with a narrower meaning- the ability to deal with
hypertext information. Gilster’s idea was broader, and did not involve a list of certain
skills, attitudes, or competencies defining what it is to be digitally literate (Gilster,
1997). He described the concept in general, as the abilities to use and understand
information from a wide range of digital sources, and considered it to be basic literacy
in the digital age. Thus, it is the modern form of the traditional idea of literacy- the

35
abilities to write, read and deal with information using the format of time and
technology. In the knowledge economy and information society, it is a fundamental life
skill (Bawden, 2001; Martin, 2008).
DL is now seen as a broader concept, combining other related literacies, such as
information evaluation, knowledge gathering, and a certain understanding (Virkus,
2003). DL in this sense is a framework for integrating several skill-sets and other
literacies. Updating these abilities will be necessary, as people’s circumstances change
and as changes in the digital information environment bring the need for new
understandings and new abilities (Markless & Streatfield, 2007). Nowadays, DL
includes the ability to use computers, send e-mail, prepare material using computers,
search for information on the web, and use other types of electronic technologies. As
the use of technology, particularly mobile technology, expands, it is vital that the
digitally literate individuals understand the changing world. According to Microsoft’s
DL curriculum (www.microsoft.com/digitalliteracy), “the goal of digital literacy is to
teach and assess basic computer concepts and skills so that people can use computer
technology in everyday life to develop new social and economic opportunities for
themselves, their families, and their communities.”
Today, a definition of DL includes the awareness of what IT can do, combined with the
abilities to do tasks, and the ability to work alone and to know when assistance is
needed. In summary, it is essential to be comfortable with using technologies, being
able to use computers or mobile devices to communicate with one another, both in the
work place and home environment, and be aware that technologies are changing and
need not be feared.
Why do people need to be digitally literate? According to Smith-Gratto (cited in Huerta
& Sandoval Almazan, 2007), people tend believe what they read if it is written in a
scientific manner. People often do not use their intelligence – it is easier to Google a
second or third time than to remember (Carr, 2008). It is essential that people understand
how technologies work and how to use them, or else they might: believe information,
which is incorrect, expose their information to others, disclose information by accident,
or disclose their systems to hateful attacks. If people believe that pushing a button can
provide what they need, what happens if it goes wrong? What happens if people do not
know it is going wrong and keep using it, e.g., not perceiving that there are viruses
running, using information which is not correct, but believing it. People need to know
36
and be able to interpret what they find when using technology- “information is not
knowledge” (Holmes & Gardner, 2006, p.16). If people do not know where the
information is coming from it would lead to believing wrong, incomplete or incorrect
information. People may act on incorrect information in their personal and business
lives (e.g. while using business analytics application). Thus, individuals need to be able
to assess the validity of the data they find. Security can be a key issue in using
technologies; people need to know about computers virus program and other forms of
malicious software; people need to know when their systems can be exposed to hacking
or interception. Digital literacy is beneficial in these ways:
Ø It increases ICT infrastructure development and use.
Ø It promotes the adoption of smart ICT and increased productivity.
Ø Digitally-literate populations are more innovative and creative.
Ø It promotes economic and social inclusion.
Ø It promotes and supports empowerment and engagement.
Ø It helps children and youth mitigate online risk.
Ø It enables public participation.
On the other hand, what would people miss if they were not digitally literate? Caldwell
and Bradley (2009) argued “if users are led to believe that they do not need to spend
time learning or developing expertise with the ICT systems that they buy, these users
are in fact becoming more detached from the ICT and its influences on the Information
Society” (p. 28). They might not take full advantage of or know the advantages of
technologies, or may not see opportunities in their business and personal lives. For
example, they may lose the opportunities offered by social networking tools to keep in
touch with each other, find job opportunities, and make use of learning facilities if they
are not familiar with technology.
In order to be included in the information society, individuals have to be digitally
literate. This study extended UTAUT by including this concept as a key predictor of
Web 2.0 adoption. Digital literacy is particularly relevant in the context of Web 2.0
adoption because it allows us to conceptualize IT use as an evolving skill. In other
words, users who are comfortable with IT should take up innovations, such as Web 2.0,
much more easily than users who are less savvy with IT. The vision of a knowledge-
based society, where economic wealth depends on individuals’ ability to deal with the
abundance of information and to adapt to an ever-changing working environment,
makes digital literacy a particularly salient concept for examining individual adoption of

37
IT. Unlike computer self-efficacy (Compeau & Higgins, 1995), which is based on
people’s perception of their skills, digital literacy focuses on their awareness of
important IT-related terms and norms, and is thus a more direct measure of their IT
abilities (Hargittai, 2005).
Chapter summary This chapter reviewed the literature on IT adoption, including studies of Web 2.0
adoption UTAUT (Venkatesh et al., 2003) and the expectation disconfirmation theory
(Bhattacherjee, 2001b) are the dominant theories for understanding IT adoption and
continued use. This chapter summarized the key factors in the model, and introduced
the concept of digital literacy (Hargittai, 2005) as an additional factor worth considering
in studies of Web 2.0 adoption. The next chapter presents the research models.
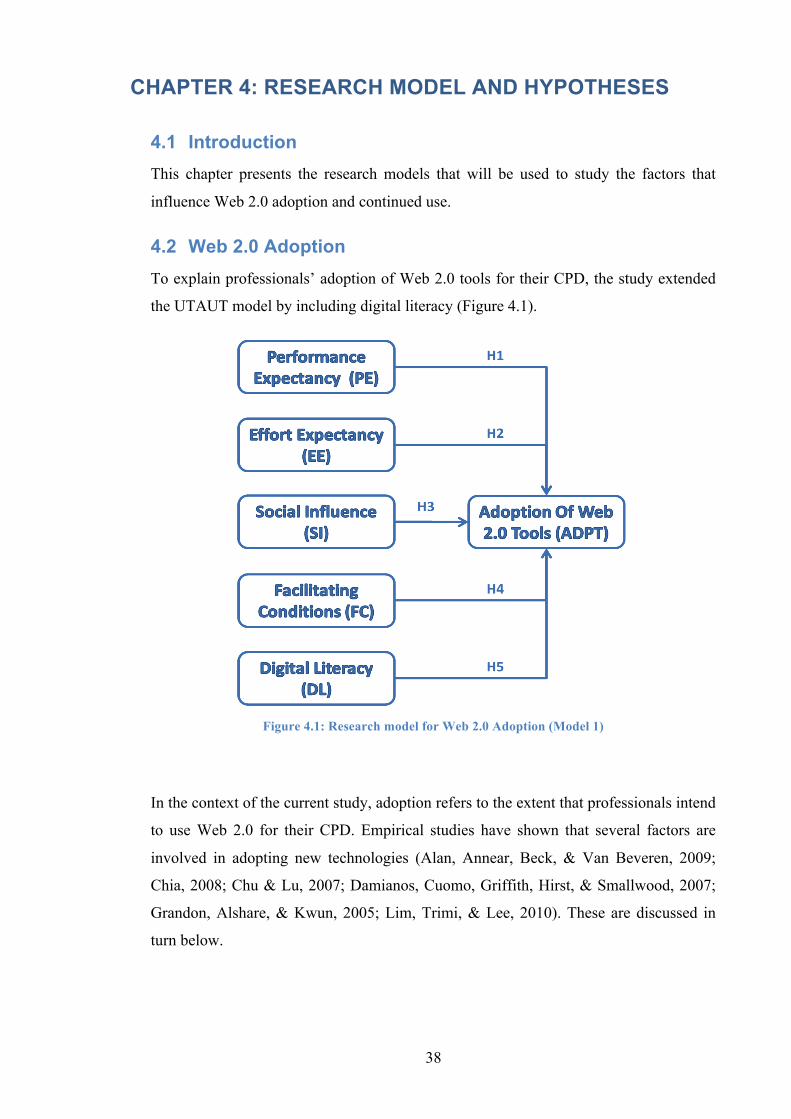
38
CHAPTER 4: RESEARCH MODEL AND HYPOTHESES
4.1 Introduction This chapter presents the research models that will be used to study the factors that
influence Web 2.0 adoption and continued use.
4.2 Web 2.0 Adoption To explain professionals’ adoption of Web 2.0 tools for their CPD, the study extended
the UTAUT model by including digital literacy (Figure 4.1).
Figure 4.1: Research model for Web 2.0 Adoption (Model 1)
In the context of the current study, adoption refers to the extent that professionals intend
to use Web 2.0 for their CPD. Empirical studies have shown that several factors are
involved in adopting new technologies (Alan, Annear, Beck, & Van Beveren, 2009;
Chia, 2008; Chu & Lu, 2007; Damianos, Cuomo, Griffith, Hirst, & Smallwood, 2007;
Grandon, Alshare, & Kwun, 2005; Lim, Trimi, & Lee, 2010). These are discussed in
turn below.

39
4.2.1 Performance Expectancy (PE)
PE is the extent to which users believe that an application enhances their performance.
In the context of this study, PE refers to the extent that professionals believe that using
Web 2.0 will enhance their performance. Venkatesh et al. (2003) find that PE was a
strong indicator of users’ intention to use new technologies in organizational context.
Empirical studies show support for the relationship between PU and behavioral
intention in the context of Web-based learning and e-learning (Mahmod, Dahlan,
Ramayah, Karia, & Asaari, 2005; Ong et al., 2004; Saade & Bahli, 2005; Shumarova &
Swatman, 2008). Therefore, the following hypothesis is accordingly proposed.
H1: PE will positively influence adoption of Web 2.0 tools.
4.2.2 Effort Expectancy (EE)
EE is to the extent to which users believe that using an application is free of effort. In
the context of this study, EE refers to the extent to which professionals believe that
using Web-based learning is free of effort. EE relates to perceived ease of use in the
TAM model, which assumes that an application that is perceived to be easier to use is
more likely to encourage a perception of usefulness and thus an intention to use it. To
the extent that higher EE leads to improved performance, EE should have a direct effect
on adoption. Studies indicate that PEOU is positively associated with PU and
behavioral intention in the context of Web-based learning and technology acceptance
(Ong et al., 2004; Saade & Bahli, 2005). Therefore, it is hypothesized:
H2: EE will positively influence adoption of Web 2.0 tools.
4.2.3 Social Influence (SI)
SI is to the degree to which users perceive that important persons believe they should
use an application. The concept is similar to subjective norms in the TPB model, which
argues that the more favorable the SI of a behavior, the stronger would be users’
intention to perform it. According to DIT (Rogers, 1962), individual tends to increase
communication with others to understand their IT adoption. Such an increased
interaction can influence adoption decisions. Studies show that subjective norms are an
important predictor of intention to use an application (Eckhardt, Laumer, & Weitzel,
2009; Hsu & Lin, 2008; Payne, 2008). In the context of this study, SI refers to the
degree to which professionals perceive that persons whom they regard as important
believe they should use Web 2.0 tools for their CPD. Therefore, the following

40
hypothesis is accordingly proposed.
H3: SI will positively influence adoption of Web 2.0 tools.
4.2.4 Facilitating Conditions (FC)
FC is to the degree to which users believe that organizational and technical
infrastructures exist to support use of an application. In this study, regarding to Web 2.0
utilization, FC is conceptualized as support (technical and non-technical) provided by
the company and ease of access to Web 2.0. The following hypothesis is proposed:
H4: FC will positively influence adoption of Web 2.0 tools.
4.2.5 Digital Literacy (DL)
DL is the ability to understand, analyze, assess, organize and evaluate information using
digital technologies. DL involves a having knowledge of technologies and
understanding how to use them. DL also involves an awareness of the technological
services that affect individuals and culture. DL empowers individuals to communicate
with others and work more effectively and increase productivities, particularly with
those who have the same skills and proficiency (Ferro, Helbig, & Gil-Garcia, 2011).
The following hypothesis is proposed:
H5: DL will positively influence adoption of Web 2.0 tools.
4.3 Web 2.0 Continued Use To explain professionals’ continued use of Web 2.0 tools for their CPD, the study relied
on the EDT model (Figure 4.2). Continuance intention (CI) is defined in this context as
the intention of professionals to reuse Web 2.0 tools for their CPD.
Figure 4.2: Research model for Web 2.0 Continued Use (Model 2)

41
4.3.1 Expectation Confirmation (EC)
Expectation and confirmation are negatively related, because lower expectations are
more likely to be positively confirmed whereas high expectations are more likely to be
negatively confirmed (Yi, 1990). Empirical studies in marketing and IS have generally
supported this relationship for example; (Belanche et al., 2010; Bhattacherjee &
Premkumar, 2004; Kandasamy & Ancheri, 2009; Spreng et al., 1996).
Performance greater than expectations (positive confirmation) generally leads to high
satisfaction and vice versa (Spreng & Page, 2003; Yi, 1990). This relationship has been
supported in both IT (Bhattacherjee, 2001b; Bhattacherjee & Premkumar, 2004; Hsu &
Lu, 2004; Hsu, Chiu, & Ju, 2004; Khalifa & Liu, 2002; Susarla et al., 2003), and
marketing (Yi, 1990). In the context of this study, if users find that Web 2.0 tools
perform better than expected after using them, their expectations will be confirmed or
exceeded and this positive confirmation will increase their satisfaction with these tools.
In addition, when their expectations are exceeded or met, users’ perception of the
usefulness of a technology increases. Therefore, it is hypothesized that:
H6: EC positively influences satisfaction.
H7: EC positively influences PU.
4.3.2 Perceived Usefulness (PU)
Changes in professionals’ perceptions as they gain online experience strengthen the
usefulness of Web 2.0 tools (Venkatesh, 1999). In the context of this study, perceived
usefulness refers to the extent to which professionals believe that using Web 2.0 tools
will enhance the ability of the CPD to improve their job performance. When a
technology’s usefulness increases, users are more inclined to continue using it (Arbaugh
& Duray, 2002; Pituch & Lee, 2006). Also, the more useful users find a technology, the
more satisfied they will be with it. Therefore, it is hypothesized that:
H8: PU will positively influence satisfaction.
H9: PU will positively influence continuance intention.

42
4.3.3 Satisfaction (S)
Two definitions by Locke (1976), (in job performance context) and Oliver (1981) (in
the context of use) are proposed. Locke defines satisfaction as “a pleasurable or positive
emotional state resulting from the appraisal of one’s job” (Locke, 1976, p.1300). Oliver
extends this definition as “the summary psychological state resulting when the emotion
surrounding disconfirmation expectations is coupled with the consumer’s prior feelings
about the consumption experience” (Oliver, 1981, p.29). In addition, in the consumer
behavior context, satisfaction is defined as the buyers’ cognitive state of being
inadequately or adequately rewarded for scarifies they have undergone (Howard &
Sheth, 1969).
Satisfaction in an IS context (Chin & Lee, 2000; Chiu, Chiu, & Chang, 2007; Chiu &
Wang, 2008; Doll, Deng, Raghunathan, Torkzadeh, & Xia, 2004; Doll & Torkzadeh,
1988; Gavrilis, Kakali, & Papatheodorou, 2008; Shumarova & Swatman, 2008) is
defined as the affective attitude towards the specific applications by individuals who
interact with the applications directly. All of these definitions highlight the
psychological states associated with cognitive appraisal of the confirmation (expectation
performance discrepancy). That is, lower expectations would result in a higher chance
of being confirmed, which in turn positively influence users’ satisfaction and intention
to continue. In addition, since individuals focused on knowledge and education may be
pleased and satisfied with well-presenting technologies despite having low expectations
(Cohen & Houston, 1972; Tse & Wilton, 1988), it is highly likely that users using
technologies for such purposes will continue using them once they are satisfied.
In this study, satisfaction is defined as the professionals’ overall affective and cognitive
evaluation of the pleasurable level of usage-related fulfillment experienced with the
Web 2.0 tools. If professionals are satisfied with a technology, professionals should feel
that it will work well in the future, creating a willingness to depend upon it. Logically,
professionals who are dissatisfied with Web 2.0 tools will not be as willing to depend
on that technology in the future for learning (Ribbink, Van Riel, Liljander, & Streukens,
2004).
This relationship between satisfaction and an interest in being involved in future
exchanges with the technology has been supported in prior studies (e.g., Belanche et al.,
2010; Chiu, Hsu, Sun, Lin, & Sun, 2005; Deng, Turner, Gehling, & Prince, 2010;
Hossain & Quaddus, 2011; Khalifa & Liu, 2004; Lee, 2010a; Spreng et al., 1996;
43
Spreng & Page, 2003; Susarla et al., 2003; Thong, Hong, & Tam, 2006). Therefore, the
following hypothesis is proposed:
H10. Satisfaction will positively influence CI.
The next chapter presents the methodology that will be used to test these hypotheses.

44
CHAPTER 5: METHODOLOGY
5.1 Introduction The primary purpose of this chapter is to identify and justify the choice of methodology
used to address the research objectives. The current study used a mixed method
approach to investigate and identify the factors effecting professionals intention to
continue Web 2.0 tools usage. A combination of quantitative and qualitative research
methodologies was employed for the current study. The web-based and paper
questionnaires were followed by a series of in-depth interviews. This chapter begins
with an explanation of research objectives, a discussion on research methods, and a
justification for the chosen methodology. Next, details of the survey will be presented:
how the questionnaire was developed and designed, how the sample was recruited, and
how the data was gathered and analyzed. Following that, the qualitative portion of the
study will be presented: how the sample was recruited, how the interviews were
conducted, and how the qualitative data was analyzed. The ethical concerns involved in
the study will also be discussed.
5.2 Research objectives E-learning/CPD has been greatly enhanced by the use of Web 2.0 tools, such as blogs,
podcasts and wikis, because they enable flexible, learner-centered training. For
example, training can be provided “on-demand” to meet the needs of employees who
are geographically dispersed or have conflicting schedules. Web 2.0 tools are especially
appealing to SMEs, because they reduce the scale economies for professional training.
While previously only larger firms could afford to hire high-quality trainers or purchase
expensive databases, today employees of SMEs can access similar high-quality
resources and interact with these training providers at a much lower cost. However,
even though this technology has distinct benefits for SMEs, as it enables them to
overcome the challenges of their “smallness”, studies on this topic have mainly focused
on large organizations. The current study attempted to fill this gap by examining the use
of Web 2.0 tools by professionals in NZ mainly working in SMEs.
We attempted to examine this issue in the context of the use of Web 2.0 tools by
professionals. Web 2.0 tools are especially valuable for professionals working in SMEs
or operating as SMEs, because they enable them to improve their skills and knowledge
much more efficiently. First, instead of having to attend training sessions in person, they

45
can now obtain the knowledge online and in a much timely manner. Second, the
communities created around Web 2.0 tools such as blogs are viable alternatives to the
networks found in large organizations. They thus compensate SMEs’ professionals for
one of the main barriers they face in continuing their education - their lack of access to
knowledge and learning networks because of their size. These findings of the current
study will help practitioners and researchers better understand the factors hindering and
supporting the use of Web 2.0 tools among New Zealand’s SMEs, which dominate its
economic landscape. This understanding will also help SME managers, IT consultants,
vendors and government agencies develop guidelines to encourage the adoption of Web
2.0 tools for e-learning, so as to enhance the competitiveness of New Zealand’s SMEs
in the global business environment.
The objectives of the study are to identify the factors that lead professionals to:
ü Adopt Web 2.0 tools, and
ü Continue using these tools if they have already adopted them.
5.3 Research methodology and justification Creswell (2009) states that quantitative methods are those that focus on capturing
frequencies and numbers. Data collected by quantitative methods provides information,
which is easy to analyze statistically to generalize respondents’ explicit/implicit claims,
and is fairly reliable. Moreover, with a limited amount of time for conducting the
current study, the quantitative questions are easy for respondents to answer and
understand and the data is simpler to interpret (Dillman, 2007). However, the
quantitative method is criticized for not providing an in-depth description of the
phenomenon under investigation. In contrast, qualitative methods are concerned with
describing the meaning of a phenomenon under investigation. Although qualitative
methods are also criticized regarding their validity and reliability, they provide much
richer and deeper descriptions than quantitative methods (Creswell, 2009).
Therefore, the current study applied a mixed method approach (Creswell, 2009), by
combining qualitative and quantitative research methods. Tashakkori (2006) defines
“mixed method studies are those that combine the qualitative and quantitative
approaches into the research methodology of a single study or multiphase study”
(Tashakkori, 2006, p.17-18). Johnson and Turner state that methods should be mixed
such that their strengths complement each other and their weaknesses do not overlap
(Chapter 11, cited in Tashakkori & Teddlie, 2003). An investigator-led mixed method

46
(Denzin, 1970) and a sequential confirmatory strategy (Creswell, 2009) were adopted in
this study. The qualitative was used to deepen the understanding of the phenomenon,
and surface novel ideas, while the quantitative method (survey) was used to test the
relevance of an existing model, that had been adapted by including a new construct.
Interviews (qualitative method) were selected as to develop a holistic and in-depth
understanding of the research phenomenon (Teddlie & Tashakkori, 2009). The used of
interviews would prevent the study from possibly misrepresenting the phenomenon, and
help ensure the validity and reliability of the data collection (Locander, Sudman, &
Bradburn, 1976). Interviews help researchers probe participants for clarity or for more
detailed information when needed. Overall, the rationales for the mixed method
approach for the current study are: 1) an ability to extract adequate information from the
underlying data collected (representation), 2) ascertain the validity of the data
interpretation (legitimation) (Kaplan & Duchon, 1988; Onwuegbuzie & Teddlie, 2003).
Addtionally, the interview method provides more than just additional voices; it provides
facts, expertise, balance, depth and credibility. It also breathes life into information
from the survey that might otherwise fall flat.
In terms of quantitative methods, the current study replicates the Bhattacherjee (2001b),
Hargittai (2005) and Venkatesh et al., (2003) studies, which used surveys. As the
purpose of the current study is to examine the relationships between the variables that
“have been previously identified and measured” rather than to explore “what are the
variables involved” (Perry, 1998, p.78), Perry suggests quantitative methodology is
appropriate (Perry, 1998).
This study was conducted within the positivist paradigm in which “the observer is
independent and the word is objective and external” (Remenyi & Williams, 1998,
p.104). Therefore, the study focused on facts provided by analysis of data collected
from the survey and interviews. As the Bhattacherjee, Hargittai, and Venkatesh et al.
studies had been replicated in other contexts before, a close replication using a similar
methodology and context was considered more appropriate. Section 5.5 and its sub-
sections will provide the details of the survey.
5.4 Research design In order to address and treat the research objectives properly, a researcher needs to
choose an appropriate research design to collect data (Straub, Boudreau, & Gefen,
2004). Research design is a structured set of rational decision-making choices, or

47
guidelines to support in generating reliable and valid research outcomes (Seddon &
Scheepers, 2011). The current research design is pictorially represented in Figure 5.1, as
shown in the diagram; the literature review was a continuous activity during the current
study.
Figure 5.1: Research design
5.5 Survey This section describes survey development, data collection, data analysis, and validity
and reliability issues.
5.5.1 Survey development
A structured self- administered questionnaire was used. All the questions were closed-
end questions and the survey was administered as a hard copy as well as an online
survey tool using Qualtrics. The survey can be accessed here:
http://autfbl.qualtrics.com/SE/ ?SID=SV_819uz0a7TX6IH1a

48
5.5.1.1 Qualtrics The Qualtrics survey tool is available to all AUT students, and staff through a
university-wide site license. The Qualtrics survey tool is a full-featured, easy-to-use,
web-based tool that allows users to create and take survey through a web browser. It
also comes with various question types and provides premade questions as well.
Moreover, it is able to provide several methods distribution and analysis of the results.
Its features and abilities are:
Ø Quick Survey Builder that guides beginners through creating a survey
Ø Survey Library with templates that you can customize to meet your specific needs
Ø Tool to send and track participation invitations and reminders
Ø Tool to display survey results, graphically and statistically
Ø Ability to export data, including to SPSS or Excel
5.5.1.2 Self-administrated questionnaire Respondents answered the self-administered questionnaire from the Qualtrics
web link, as well as through hard copies sent by the researcher. As suggested by
Saunders, Lewis, and Thornhill, “the self-administered method could help to elicit
participants beliefs, opinions, attitudes, perceptions” (Saunders, Lewis, & Thornhill,
2009, p.121). Saunders et al. (2009) state that self- administrated questionnaires ensure
the right respondent participates in research. Since the current study was set in New
Zealand, the survey had to be dispersed to a large geographical area, making this an
appropriate method. Online surveys can significantly reduce the time needed for
implementation and improve response rates (Dillman, 2007).
5.5.1.3 Survey design The survey consists of 34 items taken from the Bhattacherjee (2001b), Hargittai (2005),
and Venkatesh et al. (2003) studies. The questionnaire (Appendix D) has five sections.
The first section asked for the participants’ general demographic information including
location, education background, social role, gender, age and work experience.
The second section explores the participants’ ICTs and digital literacy background
(based on Hargittai’s study). In this section, respondents’ digital knowledge, experience
and Internet use were studied. This helps measure participants’ literacy and ability to use
online technologies. Based on Hargittai’s (2005) recommendation (page 375), a sum of
seven items from Q 20 was used to develop the digital literacy scale.

49
The third and fifth sections of the questionnaire used existing scales obtained from the
Bhattacherjee and Venkatesh et al. studies (except Q.22). These sections are designed
to explore the participants’ perceptions and experiences with Web 2.0 tools before and
after usage. The fourth section was used to divide participants into two groups: those
who currently use Web 2.0 tools continue to answer the rest of survey and those
who do not use Web 2.0 tools could skip to the end of the survey. This allows the
researcher to differentiate between the two groups of respondents: those who are using
Web 2.0 tools and those who were not.
5.5.1.4 Likert-type scales Likert-type scales are commonly used for measuring attitudes, beliefs and opinions
(DeVellis, 2011). Therefore, it was appropriate for this research as the research
measured professionals’ beliefs and opinions concerning their attitude towards Web 2.0
usage.
According to Hinkin, the main issue in using likert-type scale is “to generate sufficient
variance among respondents for subsequent statistical analysis” (1995, p.977).
Moreover, Clark and Watson state providing more response alternatives does not
necessarily increase validity or reliability of responses because respondents might not
be able to make more subtle distinctions that are required, and might respond randomly,
which in turn would lead to invalid responses (Clark & Watson, 1995). Researchers
have found that reliability of responses increases steadily for a 5-point scale or 7-point
scale (Lissitz & Green, 1975 cited in Hinkin, 1995). Therefore, a combination of 5-point
scale and 7-point scale should be appropriate to generate sufficient variance of
responses.
Bhattacherjee (2001b), Hargittai (2005), and Venkatesh et al. (2003) used Likert-type
scales in their studies and yielded satisfactory variance of responses for their statistical
analysis. Thus, the Likert-type scale method remained unchanged in current study. In
this study the questionnaire requires participants to respond to some statements from 1
to 5 where 1 represents having “no understanding” and 5 represents having “a full
understanding” of the term and to some statements from 1 to 7 where 1 represents very
strongly disagree and 7 represents very strongly agree on their answers. The following
Table 5.1 shows the scales used in the research model. There were 10 constructs, and a
total of 32 items to measure them.

50
Table 5.1: Construct items of scales
Construct Code Hyp. Statement Source
Performance Expectancy
(PE)
PE1
H1
23- I expect to find Web 2.0 tools useful for my CPD
Venkatesh et al, (2003)
PE2 24- Using Web 2.0 tools will enable me to accomplish tasks for my CPD more quickly
PE3 25- Using Web 2.0 tools will increase my productivity in carrying out my CPD
PE4 26- If I use Web 2.0 tools, I will increase my chances of getting a raise
Effort Expectancy
(EE)
EE1
H2
27- My interaction with Web 2.0 tools will be clear and understandable
EE2 28- It will be easy for me to become skillful at using Web 2.0 tools
EE3 29- I will find Web 2.0 tools easy to use
EE4 30- Learning to operate Web 2.0 tools will be easy for me
Social Influence
(SI)
SI1
H3
35- People who influence my behavior think that I should use Web 2.0 tools for my CPD
SI2 36- People who are important to me think that I should use Web 2.0 tools for my CPD
SI3 37- The senior management of my organization has been helpful in the use of Web 2.0 tools for my CPD
SI4 38- In general, my organization has supported the use of Web 2.0 tools for my CPD
Facilitating Conditions
(FC)
FC1
H4
39- I have the resources necessary to use Web 2.0 tools for my CPD
FC2 40- I have the knowledge necessary to use Web 2.0 tools
FC3 41- Web 2.0 tools are not compatible with other technologies I use
FC4
42- A specific person (or group) is available for assistance with difficulties I experience with Web 2.0 tools
Digital Literacy
(DL) (sum of 7
items)
DL1
H5
19- Do you know how to download a file from the World Wide Web to your computer?
Hargittai, (2005)
DL5k 20- How familiar are you with the following terms? MP3
DL5ag 20- How familiar are you with the following terms? Preference setting
DL5ai 20- How familiar are you with the
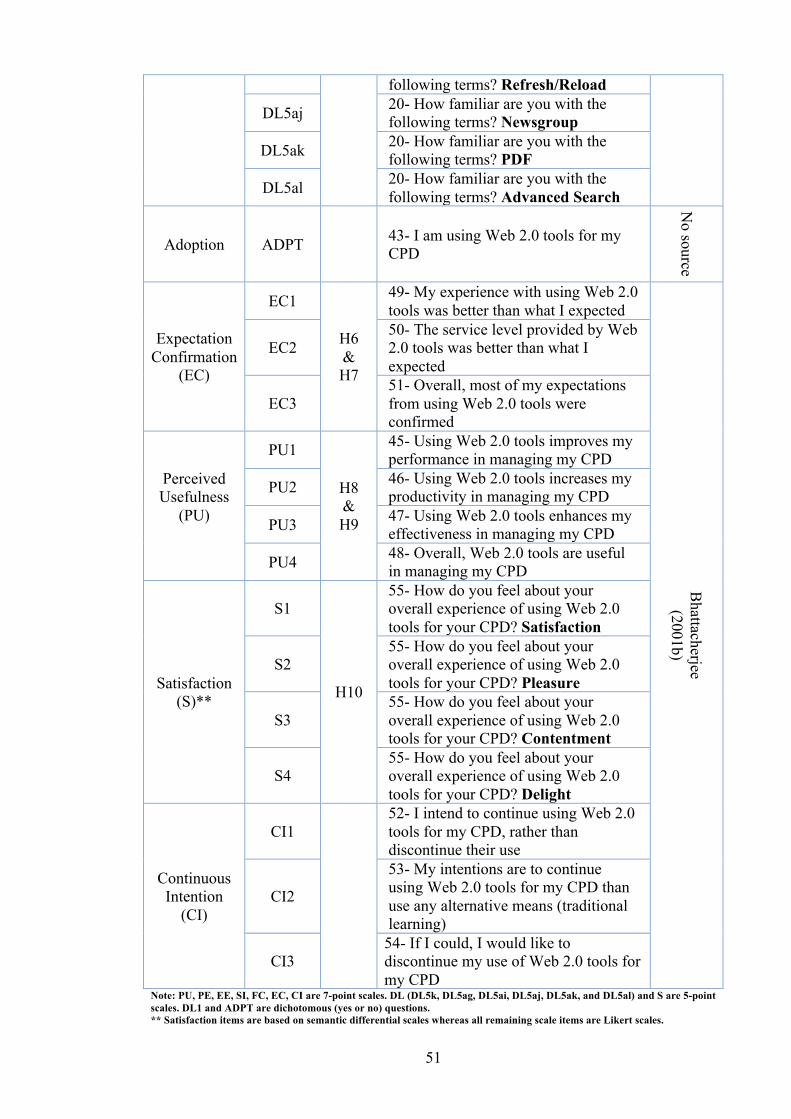
51
following terms? Refresh/Reload
DL5aj 20- How familiar are you with the following terms? Newsgroup
DL5ak 20- How familiar are you with the following terms? PDF
DL5al 20- How familiar are you with the following terms? Advanced Search
Adoption ADPT 43- I am using Web 2.0 tools for my CPD
No source
Expectation Confirmation
(EC)
EC1
H6 & H7
49- My experience with using Web 2.0 tools was better than what I expected
Bhattacherjee (2001b)
EC2 50- The service level provided by Web 2.0 tools was better than what I expected
EC3 51- Overall, most of my expectations from using Web 2.0 tools were confirmed
Perceived Usefulness
(PU)
PU1
H8 & H9
45- Using Web 2.0 tools improves my performance in managing my CPD
PU2 46- Using Web 2.0 tools increases my productivity in managing my CPD
PU3 47- Using Web 2.0 tools enhances my effectiveness in managing my CPD
PU4 48- Overall, Web 2.0 tools are useful in managing my CPD
Satisfaction (S)**
S1
H10
55- How do you feel about your overall experience of using Web 2.0 tools for your CPD? Satisfaction
S2 55- How do you feel about your overall experience of using Web 2.0 tools for your CPD? Pleasure
S3 55- How do you feel about your overall experience of using Web 2.0 tools for your CPD? Contentment
S4 55- How do you feel about your overall experience of using Web 2.0 tools for your CPD? Delight
Continuous Intention
(CI)
CI1
52- I intend to continue using Web 2.0 tools for my CPD, rather than discontinue their use
CI2
53- My intentions are to continue using Web 2.0 tools for my CPD than use any alternative means (traditional learning)
CI3 54- If I could, I would like to discontinue my use of Web 2.0 tools for my CPD
Note: PU, PE, EE, SI, FC, EC, CI are 7-point scales. DL (DL5k, DL5ag, DL5ai, DL5aj, DL5ak, and DL5al) and S are 5-point scales. DL1 and ADPT are dichotomous (yes or no) questions. ** Satisfaction items are based on semantic differential scales whereas all remaining scale items are Likert scales.

52
5.5.1.5 Pilot survey A questionnaire should be pilot tested before researchers intend to use it to collect data
to increase its efficiency and validity (Saunders et al., 2009). Pilot testing enables
researchers to find out the time required to complete the questionnaire, whether any
questions are biased or wrongly encoded, whether the questionnaire directions are easy
to follow, and any other problems related to the survey’s design (Dillman, 2007). The
survey was pilot-tested by six individuals and some questions were amended based on
their feedback. Overall, the respondents to the pilot survey indicated that the
questionnaire was easy to understand and complete, and did not take too long to
complete.
5.5.2 Data collection
The data was collected from June 2011 through November 2011 through the paper and
online surveys. The target population was the accounting profession, which includes
auditors, financial accountants and managerial accountants. This profession was
chosen because: a) CPD is a key requirement for retaining certification, b) various
professional accounting organizations are active in managing CPD activities, and c)
some Web 2.0 tools, such as podcasts, RSS and blogs, are being used for CPD
activities.
To ensure that the relevant population responded to the survey, professional
accounting organizations, such as ACCA, CPA, and NZICA, were contacted by the
researcher and the researcher’s supervisor to see if they would support the project. In
return for their assistance, these organizations were offered a report summarizing the
findings of the survey as an incentive. Once their approvals were received, the
organizations were sent a short paragraph on the survey and the link to the survey. They
published this on their websites and/or sent it their members as an email notice (see
Appendix E). To improve the response rate, all respondents were offered an equal
opportunity to win 2 NZ$50 gift vouchers.
Besides the professional accounting organizations, snowball sampling was also used
to increase the response rate. Snowball sampling refers to non-probability sampling, and
is useful when respondents are not easy to obtain (Dillman, 2007). When someone
participates in research, they are also asked to recommend their friends to participate
in the research. This method helps ensure that the respondents meet the researcher’s
criteria (Dillman, 2007; Fink, 2003). For this study, the researcher sent the survey

53
invitation to her acquaintances who were APs, with a request that they forward it to their
colleagues who were also APs.
About 250 invitations were distributed by the researcher in this way, in addition to the
links to the online survey that were distributed by the professional organizations. A total
of 91 surveys were returned, of which six of these were incomplete. Therefore, a total of
85 completed surveys (online and offline) were usable.
5.5.3 Quantitative data analysis procedure
SPSS v18 was used to obtain descriptive statistics for the variables. Structural Equation
Modeling (SEM) was then used to assess the models. SEM is a combination of path
analysis and factor analysis that allows researchers to simultaneously consider the
relationships between multiple independent and dependent variables in a single,
systematic analysis (Gefen, Straub, & Boudreau, 2000). The interest in SEM is often on
the theoretical constructs, represented by the latent variables. The relationships between
these latent variables (the structural model) are theoretically derived and represented by
the path coefficients between the factors. At the same time, SEM also allows the testing
of the measurement model, which refers to the relationships between the observed
indicators and the latent variables.
SEM can be carried out in two ways: a) the covariance-based approach (with tools such
as EQS, Amos, Lisrel and others), and b) the component-based approach, which is
referred to as PLS. In covariance-based SEM, the goal is to test whether the covariance
matrix predicted by the research model fits the covariance matrix of the sample data. The
statistical results for this approach take the form of goodness of fit indices, which indicate
how well the data fit the model. Component-based SEM, on the other hand, is variance-
based and focuses on maximizing the prediction of the dependent variables, instead of
explaining the covariation in the data. Because of this difference, component-based SEM in
the form of PLS makes fewer demands on the underlying data distribution and sample size,
compared to covariance-based SEM (Chin, 1998). PLS is also useful because it provides
explicit estimates of latent variable scores, unlike covariance-based SEM (Urbach &
Ahlemann, 2010).
For this study, the PLS approach was chosen because, besides the small sample size, the
dataset was found to contain a number of abnormally distributed variables, with high
kurtosis values. Smart PLS 2.0 M3 (Ringle, Wende, & Will, 2005) was used to carry out
the analysis, and a p-value of 0.05 was set as level of significance to support or reject the

54
hypotheses. The measurement model was evaluated by using Confirmatory Factor
Analysis (CFA). CFA helps to validate and verify the factor structure of the latent
variables by providing measures of the validity and reliability of the constructs (Cole,
1987).
This study examined the construct, content, convergent, and discriminant validity of the
instruments. Construct validity is the extent to which an operation measures the concepts
that it purports to measure (Straub, 1989). Each item in an instrument should be
representative of the construct, and collectively the item should widely cover all aspects
of the construct (Lewis, Templeton, & Byrd, 2005). To ensure validity of constructs’
items, all 32 items of ten constructs of this study were developed by using existing
validated scales from the previous researches.
Content validity is mostly established through literature reviews and expert panels
(Boudreau, Gefen, & Straub, 2001). To ensure content validity of each constructs’ items
in the instruments, this study reviewed the literature comprehensively and used expert
opinions. Convergent validity is a function of the association between two different
measurement scales, which are supposed to measure the same concept, and is achieved when
multiple indicators operate in a consistent manner (Straub, 1989).
Discriminant validity refers to the extent to which a measure is distinct from other measures
(Hair, Black, Babin, Anderson, & Tatham, 2006). . Ideally, an item is expected to be related
to other items that measure the same construct (convergent validity), but to differ from items,
which measure different constructs (discriminant validity) (Hair et al., 2006). For this study,
convergent validity was optimized by using multiple items to measure all constructs. All of
the scales were adopted from established scales that have been tested for validity previously.
Discriminant validity was tested according to Anderson & Gerbing’s (1988) suggestion.
Reliability is concerned with the internal consistency and stability of a measurement
(Boudreau et al., 2001; Sekaran, 2006). According to Straub, reliability analysis answers
the question: “Do the measures show stability across the units of observation? That is,
could measurement error be so high as to discredit the finding?” (Straub, 1989, p.150).
Reliability is often estimated by Cronbach’s Alpha, which ranges from 0 (completely
unreliable) to 1 (perfectly reliable) (Lewis et al., 2005). It is widely used in the social
sciences because it provides a measure of reliability that can be achieved from one
testing session or one administration of a questionnaire (Leech, Barrett, & Morgan,
2005). This study used Cronbach’s Alpha and composite reliability (CR) to assess the

55
reliability of the measures (Cronbach, 1951; Nunnally, 1978; Sellitz, Wrightsman, & Cook,
1976).
After establishing the quality of the constructs, the structural model was evaluated by
examining the path coefficients for the hypothesized relationships. Using a bootstrap
sampling method, 500 samples were generated to estimate the path coefficients and
their t-values, as well as the R2 for each dependent variable.
5.6 In-depth interviews Like other IT adoption studies (Nodder et al., 2003), semi-structured interviews were
conducted after the survey. Such interviews are useful because they provide more
details for this study, as the interviewer could interact with the respondents (Ross,
1974). Semi-structured interviews provide a framework with a set of categories to be
tested from the literature, similar to a structured interview, but allow the interviewers to
be flexible and give the respondents opportunities and flexibility with their responses
(Bryman & Bell, 2007).
Twelve in-depth interviews were conducted using ooVoo and Skype, because the
participants were located outside the Auckland metropolitan area. The focus of the
interviews was to obtain further insight into the extent to which professionals
understand and utilized Web 2.0 technologies and any concerns that they may have in
responding to the trend towards using Web 2.0 technologies. The interview questions
were in a semi-structured format. They consisted of 16 semi-structured questions, which
are better described as probes. The answers were written down and transcribed by the
researcher, because the participants declined to be recorded. The questions were
designed to stimulate respondents to provide information on the factors they believed
have influenced their intention to use or avoid Web 2.0 for their CPD.
5.6.1 Sample recruitment
A purposive sampling technique was employed for this part of the study. To recruit
participants for the interviews, managers of small and medium-sized accounting firms
in New Zealand were contacted by the researcher. The study was described to them
thoroughly in a simple and friendly way to encourage their participation. This
participation constituted the firm giving permission to interview its employees. The
twelve APs interviewed were a mix of managers, auditors and professional accountants.
A Participation Information Sheet (Appendix B) explaining the research and the

56
interviewees’ role in the study, and a Consent Form (Appendix C), were mailed to them.
The interviewees were assured that their privacy would be protected. At the start of
interviews via ooVoo and Skype, all participants were asked to confirm that they had
received these forms and provided their verbal consent to participate. Snowball
sampling was used at the end of the interview when the interviewees were asked to
nominate another employee.
5.6.2 Qualitative data analysis strategy
Bogdan and Taylor (1975) define qualitative analysis as a “… process, which entails an
effort to formally identify themes and to construct hypotheses (ideas) as they are
suggested by data and an attempt to demonstrate support for those themes and
hypotheses” (cited in Tesch, 1990, p.113). This process involves three stages: data
reduction, data display and conclusion drawing (Miles & Huberman, 1994). An
alternative way of organizing the activities is: accuracy test and data reduction, coding,
and selective coding and adding the data interpretation as the last stage of the analysis
as suggested by researchers (Kaplan & Maxwell, 2005; Myers & Avison, 2002;
Sandelowski, 1998; Silverman, 2006; Wolcott, 1994) (see Figure 7.1). These
steps/stages involve extracting some organized meaning from the many pages of
interviews transcripts; beginning with identifying the descriptive themes and concluding
with the interpreting of those identified themes.
All of the interviews were transcribed by the researcher. Following each interview,
ambiguous areas were identified and clarifications sought from the interviewee. To
assess the reliability of the data, the researcher asked interviewees to clarify some of
their comments later on during their interview. In some cases, two employees from the
same firm were interviewed, and this enabled their experiences to be compared and
counter-checked (Hair, Celsi, Money, Samouel, & Page, 2011; Saunders et al., 2009;
Sekaran, 2006). The validity of interview data can be assessed by comparing it with
other sources of information. In this study, this was achieved by comparing the
interview findings with the survey results (Creswell, 2009; Hair et al., 2011; Saunders et
al., 2009; Sekaran, 2006).
The coding process was performed by the researcher, and theoretical saturation was
achieved after three rounds of coding. The results of the qualitative data analysis were
interpreted both separately and in conjunction with the findings from the survey. The
analysis of the interviews will be discussed in Chapter 7.

57
5.7 Ethical consideration Since this study uses human subjects, attention needed to be paid to ethical values. The
participants for the survey were mature adults (over 18 years old), and were provided
with an Information Sheet describing the study. This sheet was incorporated in the
online survey as well as the hard copy version, and was used to obtain informed consent
from the participants.
Ensuring the dignity and safety of the participants was also important for the interviews.
They received a 'Participant Information Sheet' (Appendix B), which outlined that the
research process was commonplace and safe. It informed them what they should do if
they felt any discomfort when answering the questions and/or being transcribed.
Finally, they were told that the data would be anonymized and confidential so as to
protect their privacy.
This study was considered to have a low level of ethical risk based on guidelines in
AUT’s Ethics Knowledge Base: no deception was involved, the participants had to
provide informed consent, and the project would only be conducted after being
approved by the Auckland University of Technology Ethical Committee (AUTEC).
The ethics approval form is attached as Appendix A.
Chapter summary This study used quantitative and qualitative data to identify the factors that influence the
adoption and continued use of Web 2.0 tools by APs for their CPD. A survey was
designed based on Bhattacherjee 2001b, Hargittai 2005, and Venkatesh et al. 2003. 250
invitations to participate in the research were sent. In total, out of 91 returned
questionnaires (online survey and paper survey), 85 were usable. The data was analyzed
with SPSS 18.0 and SmartPLS 2.0. Twelve semi-structured interviews were also carried
out, and their data were coded and summarized. The next two chapters present the
results of the analyses.

58
CHAPTER 6: QUANTITATIVE ANALYSIS
6.1 Introduction This chapter discusses the quantitative data analysis that was carried out and the results
of this analysis. The next chapter contains the results of the qualitative portion of the
study. This chapter begins by describing the procedures used for data preparation. Next,
I provide some descriptive statistics of the sample. Following that, I show how my
research model was evaluated with Partial Least Squares (PLS) and provide the results
for the measurement and structural models
6.2 Data preparation for statistical analysis Data preparation includes data coding, entering it into a database, cleaning it, and
checking for any missing data (Fink, 2009). This study followed the data preparation
procedure as follows:
• All data from the paper surveys was entered into Qualtrics in order to have all data
(web-based and paper responses) in one database.
• After the data was entered to Qualtrics, the raw data was checked visually.
• All data sets were sight-edited for usability and completeness to check if they
completed by eligible participants. For instance, if a respondent responded all
questions exactly the same, the data was considered unusable, and/or to check if
they are completed, if not, the data was considered not completed.
• The data from the usable responses was downloaded into a SPSS 18.0 statistical
package.
• After the data was downloaded to SPSS 18.0, another test was conducted to make
sure that the data had been appropriately downloaded. The test involved a random
sample being examined manually. A systematic random sample of every forth
questionnaire was checked manually by comparing the downloaded data against the
original.
• Frequencies were computed using SPSS 18.0 for all variables to check for missing
data and outlier responses.

59
6.3 Data cleaning Using boxplots, outliers were identified for each of the constructs. They were:
• Respondents 3, 34 and 70 for the PE items;
• Respondents 3 and 70 for the EE items;
• Respondents 2, 23, 39 and 70 for the FC items; and
• Respondents 16, 34, 38, 39 and 70 for the SN items
These results indicated that participant 70 should be removed from the dataset as s/he
was an outlier on all of the factors. Thus, the following analysis was carried out without
participant 70’s responses.
6.4 Descriptive analysis 91 surveys were returned. Of these 91, 6 were unusable because they were incomplete.
After removing the outlier, 85 surveys were used for the analysis. Appendix G provides
descriptive statistics for the set of variables in the current study.
6.4.1 Demographics
Appendix F provides mean score for demographic information, while Table 6.1
provides a general overview of the participants’ demographic information, such as
gender, age, CPD requirement, training, education, and work experience. 49 (57.6%)
respondents were female and 36 (42.4%) were male. Most (61.2%) of the respondents
had no children. The largest group of participants (42.4%) was aged between 20 and 30,
and about a third was between 31 and 40. About half of the respondents were accredited
with NZICA, while 21.2% were part of CPA Australia. Almost all (92.9%) of them
required CPD to maintain their professional accreditation. 52.9% of respondents had
attended professional training in the last 12 months. Most (44.7%) respondents were
university graduates, and a third of them (32.9%) had master’s degrees. Most
participants were from Auckland (75.3%), followed by Wellington with 8.2% and
Hamilton with 7.1%.
34.1% of the working respondents had less than 5 years of work experience, while
25.9% had between 11 to 20 years of work experience. Nearly half (47.1% ) had less
than 5 years of accounting experiences, followed by those who had 6-10 years of
experience (37.6%). 65.8% of respondents were working in SMEs, which are defined as
firms with fewer than 30 employees.

60
Table 6.1: Demographic characteristics
Variables Frequency Percent
Gender Female 49 57.6 Male 36 42.4
Age
Below 20 0 0 20 - 30 36 42.4 31 - 40 24 28.2 41 - 50 15 17.6
Above 50 10 11.8
Accredited with NZICA 42 49.4
CPA 18 21.2 Others (e.g. ACCA) 28 32.9
CPD requirement Yes 79 92.9 No 6 7.1
Training Yes 45 52.9 No 40 47.1
Education
University Graduate 38 44.7 Master Degree 28 32.9
PhD 3 3.5 Qualification e.g. ACCA 16 18.8
City
Auckland 64 75.3 Christchurch 2 2.3
Dunedin 1 1.2 Hamilton 6 7.1
Wellington 7 8.2 Others 6 7.1
Working Yes 69 81.2 No 16 18.8
Work experience (years)
Less than 5 29 34.1 6 - 10 15 17.6 11 - 20 22 25.9 21 - 30 14 16.5
More than 30 5 5.9
Accounting experience (years)
Less than 5 40 47.1 6 - 10 32 37.6 11 - 20 9 10.6 21 - 30 3 3.5
More than 30 1 1.2
Is childcare needed? Yes 33 38.8 No 52 61.2
No. of employees in firm
Self-employed 16 18.8 Less than 10 18 21.2
11 - 20 11 12.9 21 - 30 11 12.9 31 - 50 10 11.8
More than 50 19 22.4

61
6.4.2 Digital literacy
Table 6.2 reflects different aspects of the respondents’ digital literacy. Almost all
respondents (98.8%) access the Internet several times a day, while only 1.2% accessed
the Internet a few times a week. The respondents communicate mainly with their mobile
phones and email. Online communications methods, such as VOIP and chat rooms, had
penetration rates with 49.4%, 28.2%, and 17.6% respectively. Nearly all of the
respondents saw themselves as being fairly or highly skilled at using the Internet, and
could accomplish standard tasks such as downloading files, sending files, opening
attachments, and naming a search engine (see Appendix F for mean score).
Table 6.2: Digital literacy characteristics
Frequency Percent
Internet usage frequency
Several times in a day 84 98.8 Once a day 0 0
A few times a week 1 1.2 Once a month 0 0
Less than once a month 0 0 Never/almost never 0 0
Communication methods
Fax 21 24.7 Phone 61 71.8
Mobile phone 80 94.1 Chat room 24 28.2
Surface mail 15 17.6 Courier 7 8.2 Email 80 94.1
VOIP (e.g. Skype) 42 49.4 Face to face 77 90.6
Do you know how to download a file?
Yes 83 97.6 No 2 2.4
Do you know how to send a file?
Yes 79 92.9 No 6 7.1
Do you know how to open an attachment?
Yes 84 98.8 No 1 1.2
Name a search engine Yes 78 91.8 No 7 8.2
How would you rate your Internet skills?
Not at all skilled 0 0 Not very skilled 3 3.5
Fairly skilled 40 47.1 Very skilled 34 40.0
Expert 8 9.4

62
6.4.3 Comparison between users and non-users
6.4.3.1 Comparing users and non-users in terms of their demographic characteristics
In this section, the users (34) and non-users (51) of Web 2.0 tools are compared (Tables
6.3 and 6.4) and the salient points are mentioned here. 38.8% of females use Web 2.0
tools for their CPD, compared with 41.7% of the males. Half of the non-users were
below 30, while only about 30% of users were in the same age group. Similarly, nearly
half of non-users had less than five years of work experience, whereas only 11.8% of
users were in the same category. This two indicators show that experienced
professionals are more likely to adopt Web 2.0 than younger, less-experienced
professionals. So, while younger professionals may be more “web-savvy” than their
older colleagues, they may not be keen to use Web 2.0 for their CPD because they lack
the learning that comes with being part of managing the accreditation process or the
peer networks that may support the use of such new techniques.
NZICA members were a bigger proportion of users, and a significant section of non-
users were accredited by bodies other than NZICA or CPA Australia. About two-thirds
of those who use Web 2.0 tools have undergone training in the last 12 months,
compared to about 45% of non-users. These two indicators point to the presence of
external influences, in this case peer professionals, in driving technology adoption.
About a quarter of non-users were self-employed, unlike 8.8% of users. This indicates
the surprising lack of take-up of Web 2.0 tools by individual professionals, even though
these tools can help them reduce their training expenses.
While 52.9% of Web 2.0 users required childcare, only about a third of non-users did
so. This indicates that professionals with children have adopted Web 20 more readily
than those without any children. This could be a means to improve the balance between
their work and personal lives, because learning through Web 2.0 tools equates less time
spent away from the family on training events after work.
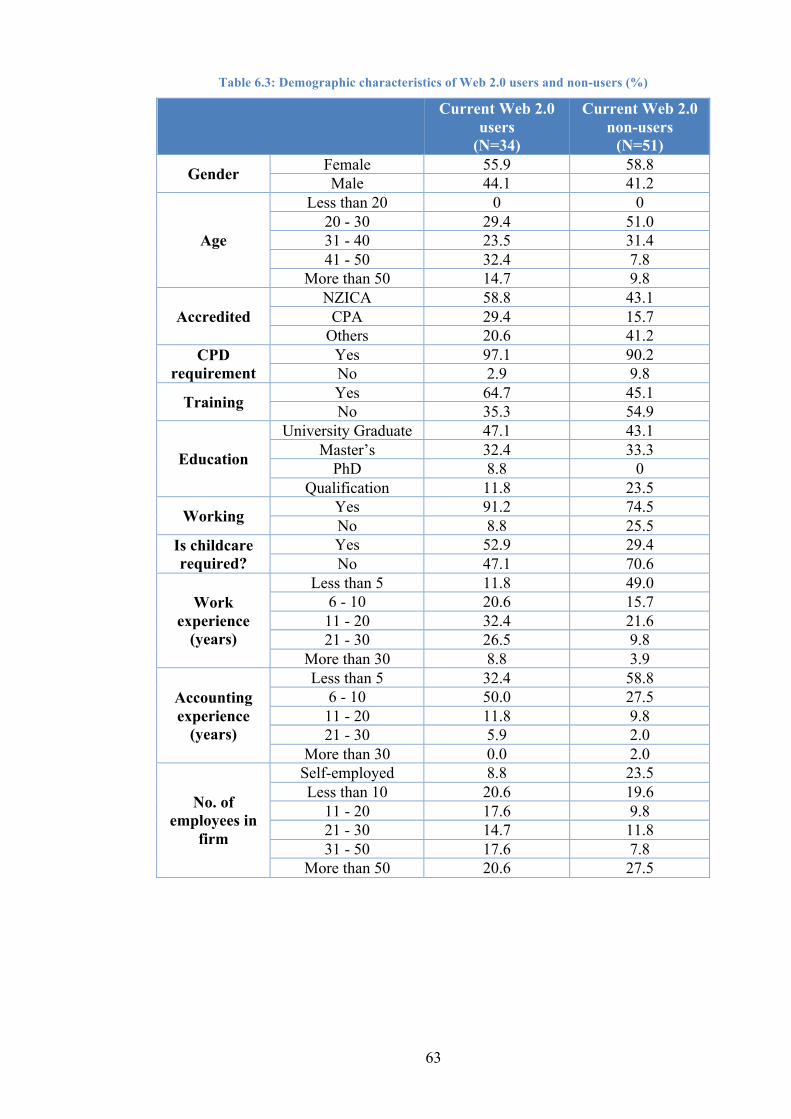
63
Table 6.3: Demographic characteristics of Web 2.0 users and non-users (%)
Current Web 2.0 users
(N=34)
Current Web 2.0 non-users
(N=51)
Gender Female 55.9 58.8 Male 44.1 41.2
Age
Less than 20 0 0 20 - 30 29.4 51.0 31 - 40 23.5 31.4 41 - 50 32.4 7.8
More than 50 14.7 9.8
Accredited NZICA 58.8 43.1
CPA 29.4 15.7 Others 20.6 41.2
CPD requirement
Yes 97.1 90.2 No 2.9 9.8
Training Yes 64.7 45.1 No 35.3 54.9
Education
University Graduate 47.1 43.1 Master’s 32.4 33.3
PhD 8.8 0 Qualification 11.8 23.5
Working Yes 91.2 74.5 No 8.8 25.5
Is childcare required?
Yes 52.9 29.4 No 47.1 70.6
Work experience
(years)
Less than 5 11.8 49.0 6 - 10 20.6 15.7 11 - 20 32.4 21.6 21 - 30 26.5 9.8
More than 30 8.8 3.9
Accounting experience
(years)
Less than 5 32.4 58.8 6 - 10 50.0 27.5 11 - 20 11.8 9.8 21 - 30 5.9 2.0
More than 30 0.0 2.0
No. of employees in
firm
Self-employed 8.8 23.5 Less than 10 20.6 19.6
11 - 20 17.6 9.8 21 - 30 14.7 11.8 31 - 50 17.6 7.8
More than 50 20.6 27.5

64
Table 6.4: Comparing current users and those who intend to use Web 2.0 within demographic categories
Current Web 2.0 users
Future Web 2.0 users
Yes No Yes No
Gender Female 38.8% 61.2% 49.0% 12.2% Male 41.7% 58.3% 41.7% 16.7%
Accredited NZICA 47.6% 52.4% 35.7% 16.7%
CPA 55.6% 44.4% 33.3% 11.1% Others 25.0% 75.0% 64.3% 10.7%
CPD requirement
Yes 41.8% 58.2% 48.1% 10.1% No 16.7% 83.3% 16.7% 66.7%
Training Yes 48.9% 51.1% 37.8% 13.3% No 30.0% 70.0% 55.0% 15.0%
Education
University Graduate 42.1% 57.9% 42.1% 15.8% Master’s 39.3% 60.7% 50.0% 10.7%
PhD 100.0% .0% .0% .0% Qualification 25.0% 75.0% 56.3% 18.8%
Working Yes 44.9% 55.1% 42.0% 13.0% No 18.8% 81.3% 62.5% 18.8%

65
6.4.3.2 Comparing users and non-users in terms of their digital literacy
Table 6.5 shows the proportion of different aspects of digital literacy among users and
non-users of Web 2.0 tools. The two groups are mostly similar in terms of the frequency
of their internet usage, use of VOIP and chat room applications, and ability to upload or
download files. The only significant difference was that about 60% of users considered
themselves to be “very skilled” while roughly the same percentage of non-users
considered themselves to be “fairly skilled”.
Table 6.5: Digital literacy of Web 2.0 users and non-users (%)
Users (%)
Non-users (%)
Internet usage
Several times a day 100.0 98.0 Once a day 0 0
A few times a week 0 2.0 Once a month 0 0
Less than once a month 0 0 Never/almost never 0 0
Communication methods
Fax 23.5 25.5 Phone 67.6 74.5
Mobile phone 94.1 94.1 Chat room 29.4 27.5
Surface mail 17.6 17.6 Courier 5.9 9.8 Email 97.1 92.2
VOIP (e.g. Skype) 50.0 49.0 Face to face 97.1 86.3
Digital Literacy: Downloading a file
Yes 100.0 96.1 No 0 3.9
Digital Literacy: Sending a file
Yes 97.1 90.2 No 2.9 9.8
Digital Literacy: Opening an attachment
Yes 100.0 98.0 No 0 2.0
Digital Literacy: Name a search engine
Yes 88.2 94.1 No 11.8 5.9
Internet skills
Not at all skilled 0 0 Not very skilled 2.9 3.9
Fairly skilled 29.4 58.8 Very skilled 58.8 27.5
Expert 8.8 9.8

66
6.4.3.3 Comparing users and non-users in terms of their familiarity with Web 2.0 tools
Appendix H provides a summary of the participants’ experiences with Web 2.0 tools,
while Table 6.6 provides the mean scores for users and non-users. As expected, users
were more familiar with these tools than non-users. Non-users were most familiar with
blogs and social networking sites, which could be attributed to their use of these tools
for their personal reasons.
Table 6.6: Mean Familiarity Scores for Web 2.0 tools among Web 2.0 users and non-users
Users (N=34)
Non-users (N=51)
Blogs 4.21 3.57 Mash-ups 3.44 2.08
Microblogging 3.00 2.27 Podcasts 4.12 3.35
Prediction markets 3.12 2.39 Rating 3.74 3.08
RSS feeds 4.09 2.86 Social networking sites 4.62 4.24
Tagging 4.12 3.43 Wikis 4.03 3.29
(The answers were on a scale of 1 = No understanding to 5 = Full understanding)
6.4.3.4 Comparing users and non-users in terms of the 7-item digital literacy construct
This study followed the advice of Hargittai (2005: p.375) in using a summarized seven-
item scale for digital literacy. This scale comprised these items: Download, MP3,
Preference setting, Refresh/Reload, Newsgroup, PDF, and Advanced Search. Hargittai
and her colleagues have found that this shorter scale correlates highly with measures of
actual skill, compared to other measures such as time spent online, number of years of
Internet use and Internet self-efficacy (Hargittai, 2005; Hargittai & Hsieh, 2012).
The DL construct is a summed measure of the scores for the seven items. Appendices F
and I provide mean scores for DL construct (all participants), and frequency for overall
sample (7-item DL construct) respectively. Table 6.7 depicts the mean scores for the 7-
item Digital Literacy (DL) construct for users and non-users of Web 2.0 tools. Both
groups had similar levels of familiarity with the seven DL terms.

67
Table 6.7: Mean Familiarity Scores for 7-item Digital Literacy (DL) construct among Web 2.0 users and non-users
Current Web 2.0
users (N=34)
Current Web 2.0 non-users
(N=51) Download 4.59 4.33
MP3 3.65 3.47 Preference setting 4.53 4.14
Refresh/Reload 3.82 3.02 Newsgroup 4.74 4.57
PDF 4.59 4.25 Advanced search 4.59 4.33
6.5 Validation of instrument The psychometric properties of the constructs were evaluated using Confirmatory
Factor Analysis (CFA) with SmartPLS 2.0 (Ringle et al., 2005). The reliability,
convergent validity and discriminant validity of the constructs were measured as
follows.
6.5.1 Reliability
The reliability of a measure refers to the degree to which the instruments are free of
random error, or its consistency and stability (Sekaran, 2006). SmartPLS 2.0 provides
values of the Composite Reliability (CR) and Cronbach’s alpha for each construct.
Researchers suggest a value more than 0.7 is regarded as a satisfactory and acceptable
level (Fornell & Larcker, 1981; Hair et al., 2006). As can be seen in Table 6.8, the
composite reliability and Cronbach’s Alpha statistics for each construct exceed 0.7.
Therefore, the reliability of all constructs in the current study is adequate.
Table 6.8: Reliability of constructs Constructs No. of Items CR Cronbach's
Alpha (a)
Mod
el 1
PE 4 0.95 0.93 EE 4 0.97 0.96 SI 4 0.96 0.94 FC 4 0.87 0.80 DL Sum of 7 1.00 1.00
ADPT 1 1.00 1.00
Mod
el 2
EC 3 0.98 0.96 PU 4 0.98 0.97 S 4 0.98 0.97
CI 3 0.86 0.76

68
6.5.2 Convergent and discriminant validity
Construct validity of all the current study scales was evaluated by using CFA. As
discussed earlier in previous chapter, CFA is considered appropriate in research with
pre-validated measurement scales (Bhattacherjee & Premkumar, 2004).
The CFA results for Model 1 and Model 2 are presented in Tables 6.9, 6.10, 6.11 and
6.12. Tables 6.11 and 6.12 also indicate the mean values of the latent constructs, as
estimated by SmartPLS 2.0. The three criteria recommended by Fornell & Larcker
(1981) for assessing convergent validity are: i) the factor loadings of the items should
exceed 0.707, ii) the construct reliabilities should exceed 0.7, and iii) the Average
Variance Extracted (AVE) by each construct should exceed 0.50. The results show that
all items loaded on their expected factors and that the loadings of the items in both
models that exceed the cut-off level. The Average Variance Extracted (AVE) from each
construct exceeds the recommended lower limit of 0.50. Thus, convergent validity was
established.
Gefen and Straub (2005) recommended two criteria to assess discriminant validity: i)
the square root of the AVE for each construct should exceed the inter-construct
correlations, and ii) the within-item construct loadings should exceed the inter-construct
cross-loadings by at least 0.10. The results indicate that these requirements were met for
all pairs of constructs in both models, with the average variance extracted ranging from
0.79 to 0.98 (Table 6.11 and 6.12), and the loadings of items on their constructs were at
least 0.10 higher than their loadings on other constructs (Table 6.9 and 6.10).

69
Table 6.9: CFA results - Model 1
Factors loadings Constructs ADPT DL EE FC PE SI
ADPT 1.00 0.20 0.40 0.45 0.56 0.43 DL 0.20 1.00 0.31 0.14 0.16 0.08 EE1 0.45 0.20 0.92 0.62 0.88 0.63 EE2 0.37 0.33 0.95 0.51 0.71 0.35 EE3 0.31 0.34 0.94 0.46 0.64 0.37 EE4 0.34 0.33 0.95 0.53 0.70 0.42 FC1 0.38 0.15 0.56 0.84 0.73 0.70 FC2 0.40 0.27 0.65 0.85 0.69 0.57 FC3 0.33 -0.05 0.27 0.68 0.34 0.48 FC4 0.32 0.02 0.29 0.78 0.38 0.60 PE1 0.53 0.12 0.79 0.61 0.92 0.65 PE2 0.52 0.16 0.71 0.69 0.95 0.69 PE3 0.53 0.13 0.73 0.68 0.93 0.78 PE4 0.44 0.19 0.66 0.54 0.83 0.65 SI1 0.39 0.04 0.36 0.59 0.63 0.92 SI2 0.42 -0.00 0.40 0.64 0.69 0.94 SI3 0.37 0.08 0.48 0.76 0.71 0.96 SI4 0.42 0.19 0.56 0.77 0.79 0.88
PE= Performance Expectancy; EE= Effort Expectancy; SI= Social Influence; FC= Facilitating Conditions; DL= Digital Literacy; ADPT= Adoption
Table 6.10: CFA results – Model 2
Factors loadings
Constructs CI EC PU S CI1 0.87 0.78 0.83 0.65 CI2 0.88 0.63 0.60 0.59
CI3RV 0.70 0.34 0.41 0.50 EC1 0.70 0.97 0.88 0.50 EC2 0.72 0.98 0.86 0.55 EC3 0.73 0.94 0.87 0.49 PU1 0.75 0.85 0.98 0.66 PU2 0.74 0.84 0.98 0.62 PU3 0.77 0.92 0.94 0.59 PU4 0.71 0.84 0.92 0.60 S1 0.60 0.45 0.57 0.91 S2 0.70 0.50 0.61 0.98 S3 0.66 0.49 0.59 0.98 S4 0.75 0.58 0.67 0.96
PU= Perceived Usefulness; EC= Expectation Confirmation; S= Satisfaction; CI= Continue Intention; CI3RV= CI3 reverse item

70
Table 6.11: Results for Model 1
Constructs Mean AVE CR Cronbach's Alpha (α) ADPT DL EE FC PE SI
ADPT 0.39 1.00 1.00 1.00 1.00 DL 25.6 1.00 1.00 1.00 0.20 1.00 EE 5.05 0.88 0.97 0.96 0.40 0.31 0.94 FC 4.70 0.62 0.87 0.80 0.45 0.14 0.58 0.79 PE 4.78 0.83 0.95 0.93 0.56 0.16 0.80 0.69 0.91 SI 4.58 0.86 0.96 0.94 0.43 0.08 0.49 0.75 0.76 0.98
Construct composite reliability (CR), Cronbach’s Alpha (α) - Reliability, which should be 0.70 or greater. Diagonal elements (bold-shaded) are the square roots of average variance extracted (AVE) by latent constructs from their indicators. Off-diagonal elements are correlations between latent constructs. For convergent and discriminant validity, diagonal elements should be at least 0.707 (i.e., AVE>0.50) and larger than off-diagonal elements in the same row and column.
Table 6.12: Results for Model 2
Constructs Mean AVE CR Cronbach's Alpha (α) CI EC PU S
CI 5.81 0.68 0.86 0.76 0.82 EC 5.46 0.93 0.98 0.96 0.74 0.96 PU 5.46 0.92 0.98 0.97 0.78 0.90 0.96 S 4.16 0.92 0.98 0.97 0.71 0.53 0.64 0.96
Construct composite reliability (CR), Cronbach’s Alpha (α) - Reliability, which should be 0.70 or greater. Diagonal elements (bold-shaded) are the square roots of average variance extracted (AVE) by latent constructs from their indicators. Off-diagonal elements are correlations between latent constructs. For convergent and discriminant validity, diagonal elements should be at least 0.707 (i.e., AVE>0.50) and larger than off-diagonal elements in the same row and column.
6.6 Structural model evaluation After confirming the validity and reliability of the constructs, the next step is to test the
structural model for the hypothesized paths. For the first model, which aimed to
establish the factors that influence users to adopt Web 2.0 tools, the responses of the
entire sample (N=85) was used. For the second model, which examines the factors that
motivate current users to continue their use, only those respondents who are currently
using Web 2.0 tools were tested (N=34).
Figures 6.1 and 6.2 depict the path coefficients for each hypothesized and the t-values
which indicate the significance of the paths. In addition, the R2 values for each
dependent variable are shown in the blue circles. Overall, Model 1explains 35% of the
variance in the data and Model 2 explains 68% of the variance in the intention to
continue using Web 2.0 tools.
The results of the hypotheses are summarized in Table 6.13. In Model 1, only two of the
hypothesized paths are significant: performance expectancy and digital literacy.
However, digital literacy is only weakly related to adoption (β = 0.154; t = 1.931). In
Model 2, all of the hypothesized paths coefficients are significant and in the expected

71
direction, except for the relationship between expectation confirmation and satisfaction,
which is negative and weakly significant (β = -0.264; t = 1.961).
Figure 6.1: Partial Least Square (PLS) results for Model 1

72
Figure 6.2: Partial Least Square (PLS) results for Model 2
Table 6.13: Summary of hypothesis tests
Hypothesis Supported?
Mod
el 1
H1 PE → ADPT Yes H2 EE → ADPT No H3 SI → ADPT No H4 FC → ADPT No H5 DL → ADPT Yes
Mod
el 2
H6 EC → S No H7 EC → PU Yes H8 PU → S Yes H9 PU → CI Yes H10 S → CI Yes

73
CHAPTER 7: QUALITATIVE ANALYSIS
7.1 Introduction This chapter presents the results of the analysis of the semi-structured interviews. The
purpose of conducting these interviews was to supplement the findings of the survey.
The methods used to collect and analyze the interview data were explained in Chapter 5.
7.2 Sample Characteristics Twelve informants from ten organizations operating in five industries were interviewed
(Table 7.1). The each interview lasted for an average of 40 minutes. All interviews were
transcribed by the researcher as recording was not permitted by participants.
Table 7.1: Interview informants
Interview informants
Organizational role Industry Organization size City
Management Accounting SBA Small Hamilton
Assistant Accountant SBA Small Wanganui
Assistant Accountant a SBA Small Albany
Assistant Accountant a SBA Small Albany
Financial Accounting & Reporting SBA Small Taranaki
Accounts Officer SBA Small Christchurch
Auditor Real Estate Medium Rotorua
Accountant Retail Medium Tauranga
Management Accounting & Budgeting Hospitality & Leisure Medium Wellington
Financial Manager Hospitality & Leisure Medium Wellington
Payroll b Health Care Medium Wellington
Finance Director b Health Care Medium Wellington a, b letters are indicating informants from the same firm.

74
The data gathering commenced on September 19th and carried on for 45 days, ending on
November 2nd 2011. Twelve professionals from eight cities were interviewed using two
online technologies, ooVoo and Skype.
The quiet and professional nature of the interview setting allowed the interviewees to
feel safe, and for a friendly social atmosphere to be created between interviewees and
researcher. This is outlined in Table 7.2 below. In the table, the interviewees were given
codes according to the name of city they lived in, for both ethical approval reasons and
their comfort, as this ensured their confidentiality.
Table 7.2: Interviewee and interview particulars
Respondent and interview particulars
Date Code Time Technology
Sept
embe
r
19th HAM 10:30 am ooVoo
22nd WAN 12: 00 pm ooVoo
23rd AL1 9:30 am Skype
26th AL2 9:45 am ooVoo
Oct
ober
13th CHR 5:30 pm ooVoo
14th TAR 10:00 am Skype
WE1 1:00 pm Skype
27th WE2 2:30 pm Skype
WE3 4:30 pm Skype
31st WE4 3:00 pm Skype
Nov
embe
r
1st ROT 8:40 am Skype
2nd TAU 10:00 am ooVoo

75
7.2.1 Qualitative data analysis stages
As mentioned in Chapter 5, this study adopted the data analysis model of Miles &
Huberman and developed into four conceptual analysis stages (Figure 7.1). These
conceptual stages involve extracting some organized meaning from the many pages of
interviews transcripts; beginning with identifying the descriptive themes and concluding
with the interpreting of those identified themes.
Figure 7.1: Qualitative data analysis stages
Stage 1: Accuracy test and data reduction: to enhance the accuracy of the data, the
notes taken during the interviews were read back to the respondents at the end of the
each interview. This helped ensure the validity of the data. Data reduction refers to “the
process of selecting, simplifying and transforming data that appears in the original
documents” (Mile and Huberman, 1994, p.10). The purpose of the data reduction is to
report and summarize what the respondents have declared, enabling the detection of
invalid data.
Stage 2: Coding: the data within each transcript was grouped according to the
questions. A matrix was created, with each question forming a column heading and the
twelve interviewees being the rows. The data from the interviews that pertained to each
question formed the content of the cells. The aim of the process was to link all answers
to any given question to allow the researcher to scan through the data in relation to any
question easily, and underline any differences (Auerbach & Silverstein, 2003). Coding
was carried out by analyzing the data at a fine grain to extract the concepts that the
interviewees referred to. This led to the extraction of 42 concepts. The respondents
often embellished their answers with other comments, which meant that there was an
ample amount of data.
Stage 3: Selective coding: selective coding begins when the researcher shifts from
running the data to delimiting the coding process (Glaser, 1978). Its benefit is that the
researcher may concentrate on the analysis of one core variable with all the
consequences and conditions that relate to it, but still within the total context developed
during the coding (Glaser, 1978). The results of selective coding were eight categories
that represented the themes that dominated the thoughts of the interviewees. These eight

76
themes subsumed the 42 codes that resulted from the initial coding exercise. Some of
these eight categories confirmed a number of the factors that were deduced from the
literature review, and further validated through the quantitative research.
Stage 4: Data interpretation: connections and themes were used to report the findings.
A brief discussion of the factors that hinder accounting professionals from using Web
2.0 tools is provided next, followed by a list of the factors that encourage them to adopt
these tools. .
7.2.2 Challenges facing Web 2.0 adoption
7.2.2.1 Theme 1: Infrastructure constraints Some participants mentioned that IT infrastructure is one of the main challenges users
faced with Web 2.0 tools adoption. A Finance Director of an organization stated that the
Internet penetration rate in the company is low and was attributed to poor bandwidth, IT
literacy, and the limited affordability associated with personal computer and Internet
connection costs. In addition, he mentioned system integration as a technical challenge.
“Technical issues such as Internet penetration rate, the cost of accessing the Internet, IT experience, and system integration are the real challenges for employees to adopt Web 2.0 tools”.
7.2.2.2 Theme 2: Culture Another main challenge for Web 2.0 adoption is culture. This challenge is particularly
apparent in New Zealand, because it a multi-cultural country. Some participants referred
to many obstructions to access the Internet in general, but culture can be a key challenge
to the widespread use of Web 2.0 tools. Some prefer the traditional face-to-face way of
learning. In this regard, a Payroll Officer stated:
“In my opinion, some people prefer to get the face-to-face learning services from the CPD providers. But we need to change this culture by building awareness among them regarding the advantages/benefits of using e-learning services ….. I strongly believe that changing users’ culture is fundamental for the widespread of Web 2.0 tools”.
7.2.3 Factors that affect the adoption of Web 2.0 tools by professionals
7.2.3.1 Theme 3: Satisfaction All respondents agreed on the importance of user satisfaction as one of the main factors
that affects their willingness to use Web 2.0 tools. The lack of satisfaction, according is
considered as one of the main barriers to Web 2.0 adoption in NZ. The interviewees
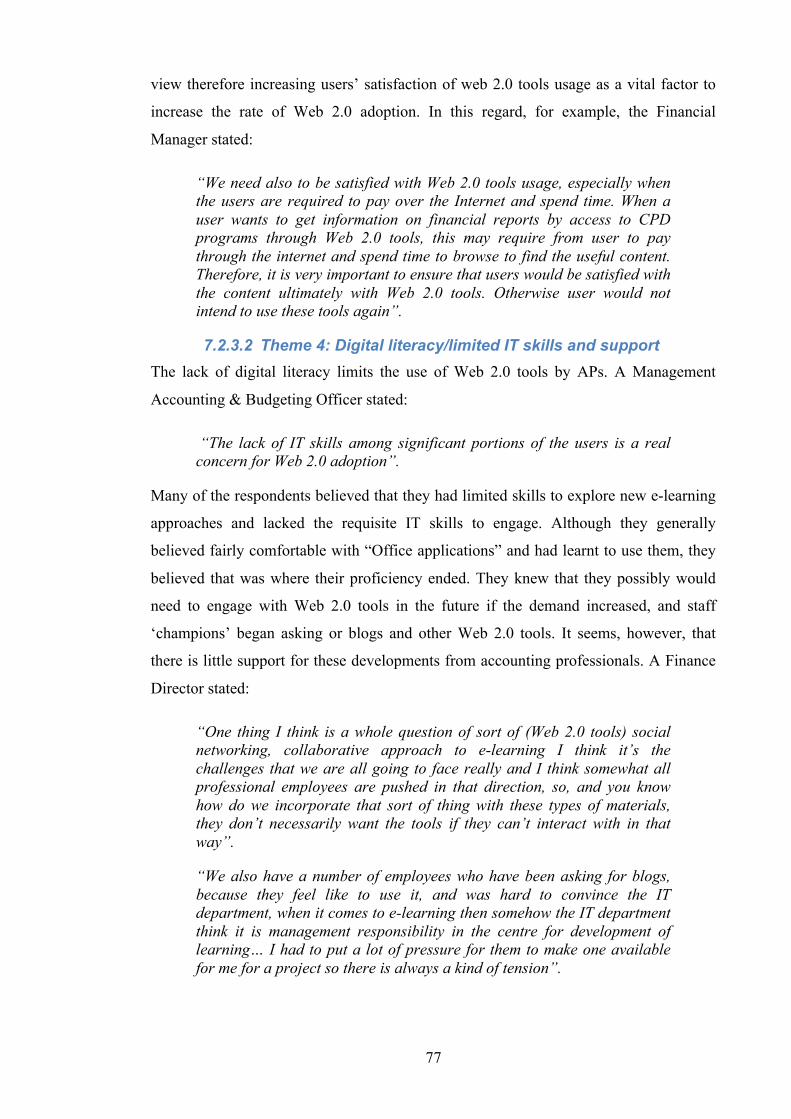
77
view therefore increasing users’ satisfaction of web 2.0 tools usage as a vital factor to
increase the rate of Web 2.0 adoption. In this regard, for example, the Financial
Manager stated:
“We need also to be satisfied with Web 2.0 tools usage, especially when the users are required to pay over the Internet and spend time. When a user wants to get information on financial reports by access to CPD programs through Web 2.0 tools, this may require from user to pay through the internet and spend time to browse to find the useful content. Therefore, it is very important to ensure that users would be satisfied with the content ultimately with Web 2.0 tools. Otherwise user would not intend to use these tools again”.
7.2.3.2 Theme 4: Digital literacy/limited IT skills and support The lack of digital literacy limits the use of Web 2.0 tools by APs. A Management
Accounting & Budgeting Officer stated:
“The lack of IT skills among significant portions of the users is a real concern for Web 2.0 adoption”.
Many of the respondents believed that they had limited skills to explore new e-learning
approaches and lacked the requisite IT skills to engage. Although they generally
believed fairly comfortable with “Office applications” and had learnt to use them, they
believed that was where their proficiency ended. They knew that they possibly would
need to engage with Web 2.0 tools in the future if the demand increased, and staff
‘champions’ began asking or blogs and other Web 2.0 tools. It seems, however, that
there is little support for these developments from accounting professionals. A Finance
Director stated:
“One thing I think is a whole question of sort of (Web 2.0 tools) social networking, collaborative approach to e-learning I think it’s the challenges that we are all going to face really and I think somewhat all professional employees are pushed in that direction, so, and you know how do we incorporate that sort of thing with these types of materials, they don’t necessarily want the tools if they can’t interact with in that way”.
“We also have a number of employees who have been asking for blogs, because they feel like to use it, and was hard to convince the IT department, when it comes to e-learning then somehow the IT department think it is management responsibility in the centre for development of learning… I had to put a lot of pressure for them to make one available for me for a project so there is always a kind of tension”.

78
7.2.3.3 Theme 5: Perceived usefulness and benefits The respondents agreed on the importance of concentrating on creating awareness
among professionals on how the use of Web 2.0 tools and information could save them
money and time. An Auditor expressed this opinion:
“Currently, in my opinion, New Zealanders, according to the existing multi-cultural environment, some prefer to get face-to face learning services. But this needs to be changed by building awareness among them regarding the benefits of using e-learning services. For instance, how the use of e-learning services could save their money and time. Fortunately, Web 2.0 services regarding e-learning is promoting and widely using in educational sectors. In this way people learn how to use Web 2.0 tools to increase their productivities”.
However, professionals will not perceive the full benefits of using Web 2.0 tools until
CPD providers provide them with sophisticated and advanced e-services.
CPD providers should provide a straightforward and easy to use service delivery
mechanism with minimum effort required. In this regard, an Assistant Accountant said:
“Providing easy to use services to the users is also important”.
7.2.3.4 Theme 6: Reluctance to use Web 2.0 tools for learning – expectation
Although the majority of Internet users engage with Facebook or other social
networking tools in their daily lives, the use of these tools by SMEs was limited,
reflecting the wider situation in NZ SMEs. Interestingly, employees were reluctant to
use such tools in the course of their learning, preferring to use these sites for personal
use.
“It is noticeable that these employees have an online presence that they would rather keep separate from their professional life. They prefer to engage in social networking sites for pleasure rather than for learning and want to keep the professional and personal separate”.
“I am personally concerned that employees are naive in their use of social networking sites and believe that they often present an online participation that may expose them to risks”.
“I know some organizations encourage the use of Facebook within their learning and teaching. My organization said “No, it’s not going to happen” there are some issues regarding data protection, so …And I also had problems with getting information for my particular topic. It means the service level provided by online tools is not what I expected.....”.
Some participants commented on the quality of service of Web 2.0 tools. Some of the

79
aspects they mentioned included: providing reliable online services; auditing websites,
including e-learning sites to ensure the accuracy and freshness of information; and
responding to enquiries accurately and quickly. An Accounting Assistant pointed out
the key role of response and reliability:
“ … If an online service is down, users will not use it. After providing online services, there must be customer services to provide responses to all enquiries quickly and clearly”.
7.2.3.5 Theme 7: technological innovation This study provides an overview on the variety of ways in which Web 2.0 gives rise to
technological innovation, outlining different areas in which Web 2.0 provides learners
with new technological solutions which give rise to innovation in organization, even if
this is not complemented by, or embedded in, pedagogical or organizational strategies.
Online content can support more creative and active users engagement in learning. Web
2.0 can open up a massive variety of new channels for accessing knowledge and
offering alternative learning opportunities. There are several online communities, which
connect learners creating new opportunities for informal learning, for example,
LiveMocha is a community that enables language learners and native speakers to
connect with each other to learn language in interaction, providing also available
learning resources for language learning. A Financial Manager stated:
“Web 2.0 tools can also offer the opportunities to alter traditional educational form by allowing more personalized learning pathway. The initiative is based on pure online learning with no obligatory traditional classroom teaching sessions. Learning takes place through an online platform, consisting of virtual classroom environment, wikis and blogs. This system allows for learners’ flexibility, bridging location and time gaps. Learners are actively taking control over their learning pace and timing and are empowered by the creation of their own learning portfolios. Evidence collected as part of this study indicates that reflective learning and self-confidence are boosted, and differentiation according to learners needs is facilitated. This illustrates that the new generation of digital tools can be appropriated to substitute more traditional educational formats”.
“Web 2.0 tools furthermore support providers in integrating ICT into their teaching. Providers can create educational blogs and invite people and other lecturer to post contents on it. There are different types of educational blogs: school news, classroom diaries, project blogs, literary notebooks etc. The platform provides connections between blogs by means of tags, and cross-search capabilities. It has also a user’s forum and several tutorials”.
80
7.2.3.6 Theme 8: organizational innovation Web 2.0 tools facilitate communication channels among organizational subunits
characterized by informal networks, weak ties and boundary spanners. Knowledge
transfer is fostered through increased social capital by interacting via these informal
channels. When employees have access to greater, diverse knowledge, the innovation
knowledge barrier should be lower. It is more likely that new ideas are generated and
identified out of interactions among diverse knowledge. A finance Director pointed out
that:
“The exposure of boundary spanners to diverse knowledge and experts increases organizations’ absorptive capacity to make new linkages and associations among diverse knowledge, leading to the generation of new ideas.”
Organizational use of Web 2.0 tools thus will drive organizational innovation through
constant transfer of diverse knowledge facilitated by the interplay of informal networks,
weak ties, boundary spanners and social capital.
Chapter summary Analysing the data from the twelve interviews led to eight themes being surfaced- two
factors that hindered the adoption of Web 2.0 tools and six that encouraged adoption. In
the following chapter, the results of the quantitative and qualitative methods will be
compared to provide a fuller understanding of the phenomenon being studied.
81
CHAPTER 8: DISCUSSION AND CONCLUSION
8.1 Introduction This study has contributed to research by integrating the construct of digital literacy
with the Unified Theory of Acceptance and Use of Technology (UTAUT), and
empirically validating the significance of digital literacy as a predictor of Web 2.0
adoption. In this chapter, the results of the findings from the analysis of the qualitative
and quantitative data will be interpreted, as well as a discussion of the contribution of
the study and its limitations. The chapter concludes with some ideas for future direction
for research in this area.
8.2 Discussion This thesis studied the adoption of Web 2.0 tools by professionals for their continuous
professional development. It was motivated by the low level of adoption by
professionals of these tools, which provide benefits such access to a wider network of
peers, more up-to-date learning resources, and lower training costs. Therefore, the
principal objective of this study is to gain a better understanding of the factors
influencing the professional’ adoption of Web 2.0 tools. To examine this problem, two
research models were developed after a literature review, based on the Unified Theory
of Acceptance and Use of Technology (UTAUT), digital literacy, and Expectation
Disconfirmation Theory (EDT).
The models were evaluated with a survey as well as a series of semi-structured
interviews. These enabled the researcher to understand in depth the factors influencing
the adoption of Web 2.0 by professionals. The interviews also allowed the comparison
of actual practice with theory. The results revealed that while only 40% of the 85
respondents use Web 2.0 tools currently, the majority of the non-users expressed their
willingness to use Web 2.0 tools in the future. The adoption of Web 2.0 tools by
professionals was determined by their performance expectancy of these tools, that is
whether using these tools will improve their performance, and their level of digital
literacy. Unlike prior research, the other factors of the UTAUT model (effort
expectancy, social influence, and facilitating conditions) did not have any significant
impacts on the adoption of Web 2.0 tools by professionals.

82
These findings suggest that the digital literacy construct deserves more attention in Web
2.0 adoption research. While performance expectancy has been found to affect Web 2.0
uses, specifically blogging by PR practitioners (Payne, 2008), digital literacy has not
been studied as widely yet. Its low-to-medium correlations with the other constructs
(Table 6.11), including effort expectancy, which is defined as the degree of ease
associated with the use of the system, combined with its significant relationship with
Web 2.0 adoption, indicate that it is capturing a unique aspect of user ability.
Moreover, the interview results also indicated that there was concern among users that
they lacked the necessary skills and were reluctant to use Web 2.0 tools for their
professional needs, preferring to use it for their personal activities. They were also
unsure about the quality of service these tools would provide: would the data be up-to-
date and accurate? Would they be maintaining an adequate amount of uptime? Would
they respond to queries in a timely manner and answer feedback? These comments were
intriguing, especially when since the survey indicated that they were fairly similar in
terms of their experience with the Internet.
Interview results showed that Web 2.0 tools trigger technological innovation in learning
by providing new formats for knowledge gain, management and distribution. Web 2.0
technologies upsurge accessibility and availability of learning contents by providing
learners with a wide range of platforms offering a broad variety of educational material.
Furthermore, these technologies support new strategies for studying a subject matter by
making available a range of dynamic tools for transforming content and displaying
information in different formats. Web 2.0 can also contribute to diversifying and
enhancing teaching methods and practices by supplying professionals with accessible
and adaptable tools and resources. Learners can profit from flexible and dynamic
applications that are better suited to their individual learning styles, preferences and
needs.
Moreover, Web 2.0 technologies enable networking and community building among
providers and learners, allowing for knowledge exchange and collaboration among
geographically dispersed groups. It can, in particular, simplify intercultural exchange
and cross-border, cross-institutional collaboration by providing environment capable of
establishing a sense of community among learners that have never met face-to-face.
Organizational innovation addresses the envisaged change, supported by ICT, whereby
learning centers, universities towards learning service providers, companies towards

83
learning organizations and cities and regions towards learning support environments.
This revolution is supported by (1) new collaborative approaches using ICT; (2) new
assessment systems, e.g. e-assessment, on-demand testing with immediate feedback for
diagnostic purposes, interactive simulation-based testing; (3) new accreditation
mechanisms, e.g. in the form of e-portfolios which could be used to provide a digital
record of learning achievements in formal, non-formal and informal learning settings
and offer a showcase for learners’ work.
This study provides an overview on the diverse ways in which Web 2.0 tools and
strategies can serve to support organizational innovation. Web 2.0 tools can open up a
vast variety of new channels for knowledge distribution, which substantially facilitate
the access to and exchange of learning materials allowing multi-directional interaction.
Especially professionals are exploiting these new means of information production and
distributions to facilitate organizational procedures, involve learners in personalizing
their learning pathways, improve communication processes and increase collaboration,
support and guidance. Web 2.0 strategy exemplifies the perceived opportunities in
enhancing the virtual learning environment with Web 2.0 tools: Blogs and RSS feeds
are used instead of newsletters; social bookmarking technologies facilitate the
management of course reading lists in a collaborative way; podcasts of public lectures
can be downloaded after the event; and online services can help building a sense of
community amongst professionals. Similarly, many organizations have recently
integrated various Web 2.0 applications into their services aiming to set up an open,
collaborative and accumulating eLearning environment for knowledge sharing and
networking, supplying learners with tools for online collaboration and networking. As
mentioned earlier there are many examples, where Web 2.0 tools used as course
platforms facilitate organizational innovation by improving transparency and
information distribution. For example, organizations employ a blog environment
together with a wiki and other tools such as Youtube, Slideshare or chat to facilitate
learning exchanges between learners and providers of the knowledge. Providers can
store and manage learning materials and information relevant to the subject on the blog,
which is periodically updated and distributed through RSS. Learners can share their
insights, assignments and practices and comment on other learners/users’ content,
improving their collaboration and writing skills. Through the wiki, learners develop a
collaborative glossary with the most relevant terms of the discipline.
Similarly, providers use blogs, podcasts and group discussions to facilitate information
84
exchange. They employ a blog to post information, provide links and add audio-clips in
the form of podcasts, by recording their messages over the phone using a free number.
Learners receive alerts of any new information added on their computers or iPods and
can post follow- up comments. Free podcasts and videos from YouTube, linked to the
blog, are part of the course materials. Through a “blogroll” inside the blog, all
participants/learners are able to keep up with a collection of all learning logs. All
documents, including instructions for assignments are developed using Google
Documents, which allows for faster and easier editing and sharing, facilitating learners
collaboration and providers’ assessment of individual progress.
These examples validate that Web 2.0 technologies can contribute to innovating the
organizational frameworks of knowledge distribution and generation by allowing
provider and learner to connect and communicate in a variety of new ways using a
range of different media. As a result access to information and learning content is
improved; peer support and lecturer guidance are facilitated; a greater range of learning
materials, sources and resources, recommendations and experiences is available to
learners.
The study’s conceptualization of Web 2.0 adoption as an evolutionary process, arising
out of prior proficiency with Web 1.0 applications, was supported by the finding that
older, more experienced professionals were more likely to adopt Web 2.0 than younger,
less-experienced professionals. Younger professionals may be seen to be “digital
natives” because they have grown up with the Internet; however, they may actually be
“naive users” (Hargittai, 2010) who vary in the extent to which they are able to
incorporate the web in their daily lives. In the context of this study, older professionals,
who have experienced the tumult of the Internet’s growth, may be better placed to
decide which tools are worth focusing on for their professional needs. In addition, their
experience with managing the CPD process may have taught them how to mix and
match off-line and online learning mechanisms.
The intention to continue using Web 2.0 tools was significantly predicted by perceived
usefulness and satisfaction, confirming prior research (Li & Kishore, 2006). However,
although expectation confirmation significantly predicted perceived usefulness, it was
negatively and weakly related to satisfaction. One reason for this surprising finding may
be that the small sample size used to test Model 2 may affect the reliability of the
results. The qualitative results indicated the value of demonstrating the usefulness of the

85
technology and spreading awareness about it. The respondents also commented on the
importance of ensuring user satisfaction so that professionals would continue using
these tools. Their uncertainty over the quality of service of Web 2.0 tools supports the
inclusion of expectation confirmation in the model.
Future research on Web 2.0 adoption could incorporate this aspect of service quality to
develop a measure of expectation confirmation tailored to Web 2.0 use. This would be a
valuable contribution because the current measures were developed in an intra-
organizational client-server model of technology adoption, whereby a high level of
service quality is assumed, so that the focus of adoption studies is on the features of the
technology, the adopter and the organization’s support structure. Working with Web 2.0
applications, which are usually operated outside an organization’s boundaries and where
no concrete service levels have been agreed upon, introduces an additional level of
complexity into a user’s decision to adopt a technology: will it work as it says it does?
Researchers should thus consider how established IS theories may change as the
material aspects of information technology evolve over time. What are the hidden or
unspoken assumptions in these theories? Because they were developed at a certain point
in time, are these theories limited by the paradigms of computing, both organizational
and architectural, that existed then?
8.3 Practical Implications This study has implications for three groups of practitioners: professional accountants,
CPD providers (who are usually associations of professional accountants), and
developers and authors of Web 2.0 CPD services/tools.
For accounting practitioners, the survey highlights that less than half of them are
currently using Web 2.0 tools, even though they offer some promising benefits. These
advantages are more critical for accounting professionals in SME firms, as described in
Chapter 4. Since performance expectancy is a key determinant of adoption, managers of
such firms should increase the awareness of these resources and their potential ability to
enhance their staff’s performance. To ensure the quality of the content and the
reliability of the service, they could set up one of the tools, such as a blog, wiki or RSS
feed, in-house to provide a comfortable setting for their colleagues to explore and
familiarize themselves with the use of these tools. Such a tactic may also increase the
digital literacy of those who score lowly in this capacity. Another tactic may be to
nominate “power-users” to motivate their local networks as one way to create a learning

86
culture. These champions could also help ensure that their colleagues’ expectations are
set at the right level by providing them with realistic examples of the extent to which
these tools helped the power-user. Finally, managers of accounting professionals could
also ensure that they do not face some of the infrastructure constraints mentioned in the
interviews, such as a lack of a blogging platform or procedures/protocols to govern
what can and cannot be shared on Web 2.0 sites.
Professional accounting organizations could also work to promote wider awareness of
these tools and incorporate them into their existing CPD frameworks. By creating an
online network of like-minded learners, the organization may be able to increase its
CPD pass rate while lowering its costs. As the accounting profession becomes more
focused on wider aspects of information assurance and as the use of modern
technologies such as XBRL (Xtensible Business Reporting Language) become more
widespread, accountants of all stripes have to increase their digital literacy so that they
can take advantage of new opportunities and/or prevent the obsolescence of their skills.
Developers of Web 2.0 tools for CPD can possibly segment the market to serve
professionals with high and low levels of digital literacy. They could provide more
complex tools for the former group and more basic services for the latter. In addition,
they could collaborate with professional organizations to make their members aware of
the possible performance improvements the use of Web 2.0 tools could lead to, as well
as the usefulness of these tools in helping them achieve their CPD goals. This would
address the performance expectancy aspect of encouraging adoption. Shifting from a
world where CPD is predominantly delivered offline to an interactive, dynamic,
“always on” model of CPD will be challenging, because it highlights key issues, such
as: where does authority lie about interpretation? How much debate should there be on
procedures or practices? Who monitors these sites for inaccuracies and who is
responsible for correcting them? Addressing these issues will be a difficult trial for
professional organizations and education providers.
Previous research has suggested that the use of Web 2.0 for e-learning has mainly been
to provide access to and disseminate information (Bodell et al., 2009). However, Web
2.0 tools allow users not only to retrieve information but also to use the network as a
platform to create and own the data (O'Reilly, 2005). This phenomenon can support
online reflection and community-based interaction and knowledge-sharing (Bodell et
al., 2009). Though there is an element of content delivery in these systems, there is also

87
an increasing acknowledgment that learning is a creative activity and that the suitable
venue is a platform rather than an application. What is needed is an exploration as to
how the content of learning, whether professionally authored or created by users, can be
used as the basis for learning activities rather than a conduit for learning content
(Downes, 2005).
It is important to note that the professionals interviewed wanted to separate their usage
of Web 2.0 tools for their professional development from their usage of these tools for
their personal social interaction. They wanted to keep their social networking activities
separate from their profession, seeing this as their ‘off work’ and social space. There
were some concerns stated by professionals regarding the formal involvement of
professionals through social networking sites. They stated that there was the potential
for employees to operate innocently in these environments and put themselves at risk if
they exposed their personal details in publicly accessible forums. These publicly
available profiles may reflect severely on professionals when they apply for
employment or in other formal contexts. These concerns, along with a blurring of the
boundaries between professional and personal online activities, may require significant
changes in IT skills and culture before potential benefits can be achieved.
8.4 Limitations The findings of the study should be read in light of its limitations. First, it was designed
as a cross-sectional study, which limits its ability to determine causality. Future research
could test this model longitudinally. This may possibly strengthen the effects of digital
literacy, since it is conceptualized as an evolutionary construct.
Second, by studying New Zealand accountants, the study’s findings may be less
generalizable to other contexts because of some unique aspects of the business
environment here. For example, more than 90% of all firms are SMEs. In addition, the
small population (4.5 million) is scattered across a relatively large land-mass, which
may prevent the diffusion of information through (physical) social networks, biasing the
findings. Conducting comparative studies in different countries would offer an
opportunity for comparing the findings and supporting or extending its results.
Third, the use of a self-administrated questionnaire may explain the inconsistency of the
findings of Model 1 with prior UTAUT studies. Self-administrated usage measures may
be biased or relative so that they cannot accurately represent adoption (Straub, Limayem
& Karahanna-Evaristo, 1995) In the context of the current study, it is likely that

88
professionals’ perceptions about “how often” (frequencies) and “how many hours”
(duration) they actually use Web 2.0 reflect only their general usages of Web 2.0 in
different contexts and at different times.
Fourth, the use of a single survey to gather data on both independent and dependent
variables may lead to common method bias (Sharma et al., 2009). Future research could
minimize this by system-generated data on adoption and continued use, or by using
techniques such as marker variable. Fifth, the 7-item measure of digital literacy may be
dated now since it was developed seven years ago. Advancements in technology, such
as the growth of mobile devices and the consumerization of technology, may mean that
alternative measures of digital literacy should be developed. Another possible direction
for further research is to refine the digital literacy construct by adopting a semantic
differential scale and testing different weights for the items that make up the construct.
Last, a challenge with this study is in defining “Web 2.0”. The various technologies
covered by the term, such as wikis, RSS and podcasts, may seem similar to technically-
oriented individuals, since they are based on some aspect or variant of XML. However,
it is a moot point if users from non-technical backgrounds share the same
understanding. To them, the different types of Web 2.0 tools may fall into very different
categories and our attempt to put them in a bucket may not make sense to them. Thus, it
would be helpful if future research on this topic narrowed its focus by examining one
particular type of Web 2.0 tool, while at the same time, finding out if the users of that
tool were also involved in or participated in other Web 2.0 tools/services.
8.5 Conclusion Within the accounting field, although e-learning is being used more intensively in recent
years, there has been no significant demand for Web 2.0 tools. Some professionals have
demonstrated a willingness to explore new approaches, but many still hold reservations
about becoming involved with innovative pedagogical tools and have not yet realized
what can be achieved with the tools. The range of possible functions offered by e-
learning has not been fully exploited. SMEs especially continue to limit their use of
such tools to their repository functions, perhaps pushed to do so because of the poor IT
skills of their employees.
Despite its limitations, this study has contributed to research and practice in Web 2.0
adoption. The results revealed the importance of factors such as satisfaction, perceived
usefulness, performance expectancy and digital literacy, on the adoption of Web 2.0

89
tools by professionals. Digital literacy as a construct deserves more attention in e-
learning and other settings because it incorporates the idea of IT use as a skill that
evolves. In light of these findings, the study has offered various suggestions to different
communities of practitioners to improve the adoption of Web 2.0 tools by professionals.
Although the potential offered by Web 2.0 tools is significant, it needs to be balanced
against the challenges of doing so.

90
APPENDICES
Appendix A: Ethics approval form
MEMORANDUM Auckland University of Technology Ethics Committee (AUTEC)
To: Harminder Singh From: Dr Rosemary Godbold and Madeline Banda Executive Secretary, AUTEC Date: 3 June 2011 Subject: Ethics Application Number 11/76, Factors that influence the use of Web 2.0
tools for e-learning.
Dear Harminder Thank you for providing written evidence as requested. We are pleased to advise that it satisfies the points raised by the Auckland University of Technology Ethics Committee (AUTEC) at their meeting on 11 April 2011 and that on 23 May 2011; we approved your ethics application. This delegated approval is made in accordance with section 5.3.2.3 of AUTEC’s Applying for Ethics Approval: Guidelines and Procedures and is subject to endorsement at AUTEC’s meeting on 27 June 2011.Your ethics application is approved for a period of three years until 23 May 2014.We advise that as part of the ethics approval process, you are required to submit the following to AUTEC: • A brief annual progress report using form EA2, which is available online through
http://www.aut.ac.nz/research/research-ethics/ethics. When necessary this form may also be used to request an extension of the approval at least one month prior to its expiry on 23 May 2014;
• A brief report on the status of the project using form EA3, which is available online through http://www.aut.ac.nz/research/research-ethics/ethics.This report is to be submitted either when the approval expires on 23 May 2014 or on completion of the project, whichever comes sooner;
It is a condition of approval that AUTEC is notified of any adverse events or if the research does not commence. AUTEC approval needs to be sought for any alteration to the research, including any alteration of or addition to any documents that are provided to participants. You are reminded that, as applicant, you are responsible for ensuring that research undertaken under this approval occurs within the parameters outlined in the approved application. Please note that AUTEC grants ethical approval only. If you require management approval from an institution or organization for your research, then you will need to make the arrangements necessary to obtain this. When communicating with us about this application, we ask that you use the application number and study title to enable us to provide you with prompt service. Should you have any further enquiries regarding this matter, you are welcome to contact Charles Grinter, Ethics Coordinator, by email at [email protected] or by telephone on 921 9999 at extension 8860.On behalf of AUTEC and ourselves, we wish you success with your research and look forward to reading about it in your reports. Yours sincerely Dr. Rosemary Godbold and Madeline Banda Executive Secretary Auckland University of Technology Ethics Committee Cc: Soheila [email protected]

91
Appendix B: Participant information sheet
Participant Information Sheet May 15, 2011 Project title: Factors that influence the use of Web 2.0 tools for e-learning
Dear participant,
Kia Ora
An invitation I am a Master’s student in Business Information Systems at the Auckland University of Technology (AUT). For my thesis, I am studying how accounting professionals, such as auditors and accountants, in New Zealand use Web 2.0 tools, such as blogs, wikis and podcasts, for their continuing professional development (CPD). I am conducting a survey to gather data on this topic, and you are invited to participate in it. Participation is voluntary but your help is greatly appreciated. As an incentive, I will be conducting a draw in which 2 respondents to this survey will win a prize of a $50 gift card. If you agree to participate, please indicate your consent by signing the Consent Form on the next page.
What is the purpose of this research? The purposes of this research are to:
Ø Investigate how accounting professionals are using Web 2.0 tools for their CPD Ø Identify some of the key factors that influence the use of Web 2.0 tools
How was I chosen for this invitation? Participants were recruited through contact with professional accounting organizations, such as NZICA and CPA Australia.
What will happen in this research? The survey will take approximately 20-30 minutes to complete. Please answer each question as carefully as possible. You may decline to answer any specific question if you wish to. If you feel that you cannot answer a question, please continue to the next one.
What are the discomforts and risks? We do not cause any discomfort for participants. The information collected from the survey will be aggregated and anonymized, so that it will not be linked to any particular individual(s). Your individual data will not be shared and your name and address are not required.

92
What are the benefits? The findings of this study will help practitioners and researchers better understand the factors hindering and supporting the use of Web 2.0 tools among New Zealand’s SMEs, which dominate its economic landscape. This understanding will help SME managers, IT consultants, vendors and government agencies develop guidelines to encourage the adoption of Web 2.0 application for e-learning, so as to enhance the competitiveness of New Zealand’s SMEs in the global business environment.
What are the costs of participating in this research? The time commitment will be 20-30 minutes. Your participation is vital for the completion of this research project. Should you prefer not to participate, or if you wish to cease participation at any time, you are free to do so.
What opportunity do I have to consider this invitation? Two weeks
How do I agree to participate in this research? A Consent Form will accompany the survey. By completing this survey you indicate your consent to participate.
Will I receive feedback on the results of this research? Professional associations who support this study will be offered a report summarizing its findings. Individual participants should be able to read this report if the professional associations provide access to it.
What do I do if have concerns about this research? Any concerns regarding the nature of this project should be notified in the first instance to the Project Supervisor, Dr. Harminder Singh, Faculty of Business and Law, the Auckland University of Technology (AUT), Auckland. Tel: 9 921-9999 ext. 5029. E-mail [email protected]. Concerns regarding the conduct of the research should be notified to the Executive Secretary, AUTEC, Madeline Banda, [email protected], 921-9999 ext 8044.
Whom do I contact for further information about this research? Researcher contact details: Soheila Mohammadyari, Master student, the Auckland University of Technology (AUT), mobile: 021-1439491. Email: [email protected]. Project Supervisor contact details: Dr. Harminder Singh, Faculty of Business and Law, the Auckland University of Technology (AUT), Auckland. Tel: 9 921-9999 ext. 5029. E-mail: [email protected].
I thank you in advance for your support of this research project. Sincerely, Soheila Mohammadyari (Ms.)
Approved by the Auckland University of Technology Ethics Committee on 23/05/2011 AUTEC Reference number 11/76

93
Appendix C: Consent form
Consent to Participate in Research Title of Project: Factors that influence the use of Web 2.0 tools for e-
learning
Project Supervisors: Dr. Harminder Singh
Researcher: Soheila Mohammadyari
• I have read and understood the information provided about this research project in the Information Sheet dated May 15, 2011.
• I understand that I may withdraw myself or any information that I have provided for this project at any time prior to the completion of data collection, without being disadvantaged in any way. If I withdraw, I understand that all relevant records of my responses, or parts thereof, will be destroyed.
• I agree to take part in this research.
• I understand that I will not be identified in any way including publications resulting from this research.
• I understand that data will be kept for at least six years, and will be destroyed at the end of the research period.
• I would like to be interviewed on this topic Yes No
• I would like to enter the draw for the $50 gift card. Yes No Participant name: …………………………………….
Participant signature: .................................................... Date: ………………….
Project Supervisor Contact Details: Dr. Harminder Singh, Faculty of Business and Law, the Auckland University of Technology (AUT), Auckland. Tel: 9 921-9999 ext. 5029. E-mail [email protected]. Researcher: Soheila Mohammadyari, Master student, the Auckland University of Technology (AUT), mobile: 021-1439491. Email: [email protected].
Approved by the Auckland University of Technology Ethics Committee on 23/05/2011AUTEC Reference number 11/76

94
Appendix D: Questionnaire
Examining Web 2.0 use among accounting professionals
We are interested in knowing your experiences with the use of Web 2.0 tools for your continuing professional development (CPD). Web 2.0 tools include blogs, wikis, podcasts, RSS feeds, and social networking sites. Accounting organisations, such as NZICA and ACCA, have started using some of these tools, such as podcasts, as part of their CPD resources. Your answers are entirely confidential and your name and address are not required. By completing this survey you indicate your consent to participate. A draw will be held where 2 respondents will win a prize of a gift card (2x$50). If you have any questions on this survey, please address them to: Dr. Harminder Singh, Faculty of Business and Law, Auckland University of Technology, Auckland. Tel: 9 921-9999 ext. 5029, e-mail: [email protected]. Thank you for your participation.
Please tick the boxes as appropriate, or circle the numbers that best represent your answer.
Section 1: Demographic Information
1. Gender: Female Male 2. What is your age? (Please round your answer to the nearest whole number)
__________________ 3. What is your occupation? __________________ 4. Are you accredited with:
a) NZICA (the New Zealand Institute of Chartered Accountants) b) CPA Australia c) Other professional accounting bodies. Please specify: _____________________
5. Do you require continuing professional development (CPD) to maintain your
professional accreditation? Yes/No 6. Did you attend any professional training events in the last 12 months? Yes/No 7. What is the highest level of education you have completed?
University Graduate Master’s Degree Doctoral Degree (PhD) Professional Qualifications (e.g. ACCA)

95
8. Which city do you live in now? _______________________ 9. Are you currently working? Yes/No
If yes, how many hours per week, on average? _______________________ 10. How many years of work experience do you have? (Please round your answer to
the nearest whole number) _______________________ 11. How many years of work experience do you have in the accounting/audit industry?
(Please round your answer to the nearest whole number) ______________________ 12. Do you have any childcare responsibilities? Yes/No 13. How many employees are there in your firm? ______________________
Section 2: Internet Use, Knowledge and Experience
14. In which year did you start using the Internet? ____________________
15. On average, how often do you use the Internet (Choose one)?
Several times in a day Once a day A few times a week
Once a month Less than once a month Never / almost never
16. On average how many hours a week at work do you use the Internet?
_________Hours
17. On average how many hours a week at home do you use the Internet?
_________Hours
18. Which of the following do you use to communicate with others in your daily life?
Tick as many as applicable
Fax Phone Mobile Phone Chat room
Surface Mail Courier Email VOIP (e.g. Skype)
Face to face
19. Please circle the appropriate answer. Do you know:
How to download a file from the World Wide Web to your computer? Yes No
How to send a file that is on your computer’s hard drive to someone using
another computer (i.e. through FTP)?
Yes No
How to open an attachment someone sent you via email? Yes No
The name of any search engine? Yes No

96
20. How familiar are you with the following terms? Please choose/circle a number between 1 and 5 where 1 represents having “no understanding” and 5 represents having “a full understanding” of the term.
Modem 1 2 3 4 5 Usenet 1 2 3 4 5 Browser 1 2 3 4 5 Message thread 1 2 3 4 5
Server 1 2 3 4 5 Filtering software 1 2 3 4 5 ISP 1 2 3 4 5 Cookie 1 2 3 4 5
HTML 1 2 3 4 5 DNS parking 1 2 3 4 5 “bcc” option in email 1 2 3 4 5 Mirror site 1 2 3 4 5
Flaming 1 2 3 4 5 P3P 1 2 3 4 5 Spam 1 2 3 4 5 Click-through 1 2 3 4 5
Spider 1 2 3 4 5 Image map 1 2 3 4 5 Boolean expression 1 2 3 4 5 E-zine 1 2 3 4 5
MP3 1 2 3 4 5 Meta-tag 1 2 3 4 5 JPG 1 2 3 4 5 Frames 1 2 3 4 5
XML 1 2 3 4 5 Shareware 1 2 3 4 5 Meta-search engine 1 2 3 4 5 Preference setting 1 2 3 4 5
Natural language 1 2 3 4 5 Remote login 1 2 3 4 5 Proximity operators 1 2 3 4 5 Refresh/Reload 1 2 3 4 5
gov (“dot gov”) 1 2 3 4 5 Newsgroup 1 2 3 4 5 Banner ad 1 2 3 4 5 PDF 1 2 3 4 5
Weblog 1 2 3 4 5 Advanced Search 1 2 3 4 5
21. In terms of your Internet skills, do you consider yourself to be...……
1 2 3 4 5
Not at all skilled
Not very skilled
Fairly skilled
Very skilled
Expert
(Please circle a number)

97
Section 3: Perceptions of Web 2.0 Tools - prior to usage
Web 2.0 tools are applications that cultivate online participation in content creation and social interaction. Web 2.0 tools include blogs, wikis, podcasts, RSS feeds, and social networking sites. Accounting organisations, such as NZICA and ACCA, have started using some of these tools, such as podcasts, as part of their CPD resources.
22. How familiar are you with the following web 2.0 terms? Please choose/circle a number between 1 and 5 where 1 represents having “no understanding” and 5 represents having “a full understanding” of the term.
Wikis 1 2 3 4 5 Blogs 1 2 3 4 5
Podcasts 1 2 3 4 5 RSS feeds 1 2 3 4 5 Social networking 1 2 3 4 5 Mash-ups 1 2 3 4 5
Microblogging 1 2 3 4 5 Prediction markets 1 2 3 4 5 Rating 1 2 3 4 5 Tagging 1 2 3 4 5
Below are a series of statements about Web 2.0 and CPD. Please indicate your agreement or disagreement with the following statements using the scale shown. If you currently use Web 2.0 tools for your CPD, your answers to the questions below should reflect your perceptions before you began using these tools.
1 2 3 4 5 6 7
Very strongly disagree
Strongly disagree
Disagree neither agree nor disagree
Agree Strongly agree
Very strongly agree
23 I expect to find Web 2.0 tools useful for my CPD 1 2 3 4 5 6 7
24 Using Web 2.0 tools will enable me to accomplish tasks for my CPD more quickly
1 2 3 4 5 6 7
25 Using Web 2.0 tools will increase my productivity in carrying out my CPD
1 2 3 4 5 6 7
26 If I use Web 2.0 tools, I will increase my chances of getting a raise 1 2 3 4 5 6 7
27 My interaction with Web 2.0 tools will be clear and understandable 1 2 3 4 5 6 7
28 It will be easy for me to become skillful at using Web 2.0 tools 1 2 3 4 5 6 7
29 I will find Web 2.0 tools easy to use 1 2 3 4 5 6 7
30 Learning to operate Web 2.0 tools will be easy for me 1 2 3 4 5 6 7
31 Using Web 2.0 tools is a bad idea 1 2 3 4 5 6 7
32 Web 2.0 tools make work more interesting 1 2 3 4 5 6 7
33 Learning through Web 2.0 tools is fun 1 2 3 4 5 6 7
34 I like learning through Web 2.0 tools 1 2 3 4 5 6 7

98
35 People who influence my behavior think that I should use Web 2.0 tools for my CPD
1 2 3 4 5 6 7
36 People who are important to me think that I should use Web 2.0 tools for my CPD
1 2 3 4 5 6 7
37 The senior management of my organization has been helpful in the use of Web 2.0 tools for my CPD
1 2 3 4 5 6 7
38 In general, my organization has supported the use of Web 2.0 tools for my CPD
1 2 3 4 5 6 7
39 I have the resources necessary to use Web 2.0 tools for my CPD 1 2 3 4 5 6 7
40 I have the knowledge necessary to use Web 2.0 tools 1 2 3 4 5 6 7
41 Web 2.0 tools are not compatible with other technologies I use 1 2 3 4 5 6 7
42 A specific person (or group) is available for assistance with difficulties I experience with Web 2.0 tools
1 2 3 4 5 6 7
Section 4: Current Use of Web 2.0 Tools
43 I am using Web 2.0 tools for my CPD Yes/No
If you answered “Yes” to Question 43, continue to Section 5 – Question 45 If you answered “No” to Question 43: continue to Question 44
44 I intend to use Web 2.0 tools for my CPD Yes/No This is the end of the survey for those who have NOT used Web 2.0 tools.
Section 5: Experiences With Web 2.0 Tools – after usage
If you have used or are using Web 2.0 tools for your CPD, please answer the following questions. If not, please go to the end of the survey. 1 2 3 4 5 6 7
Very strongly disagree
Strongly disagree
Disagree neither agree nor disagree
Agree Strongly agree
Very strongly agree
45 Using Web 2.0 tools improves my performance in managing my
CPD 1 2 3 4 5 6 7
46 Using Web 2.0 tools increases my productivity in managing my CPD 1 2 3 4 5 6 7
47 Using Web 2.0 tools enhances my effectiveness in managing my CPD
1 2 3 4 5 6 7
48 Overall, Web 2.0 tools are useful in managing my CPD 1 2 3 4 5 6 7
49 My experience with using Web 2.0 tools was better than what I expected
1 2 3 4 5 6 7
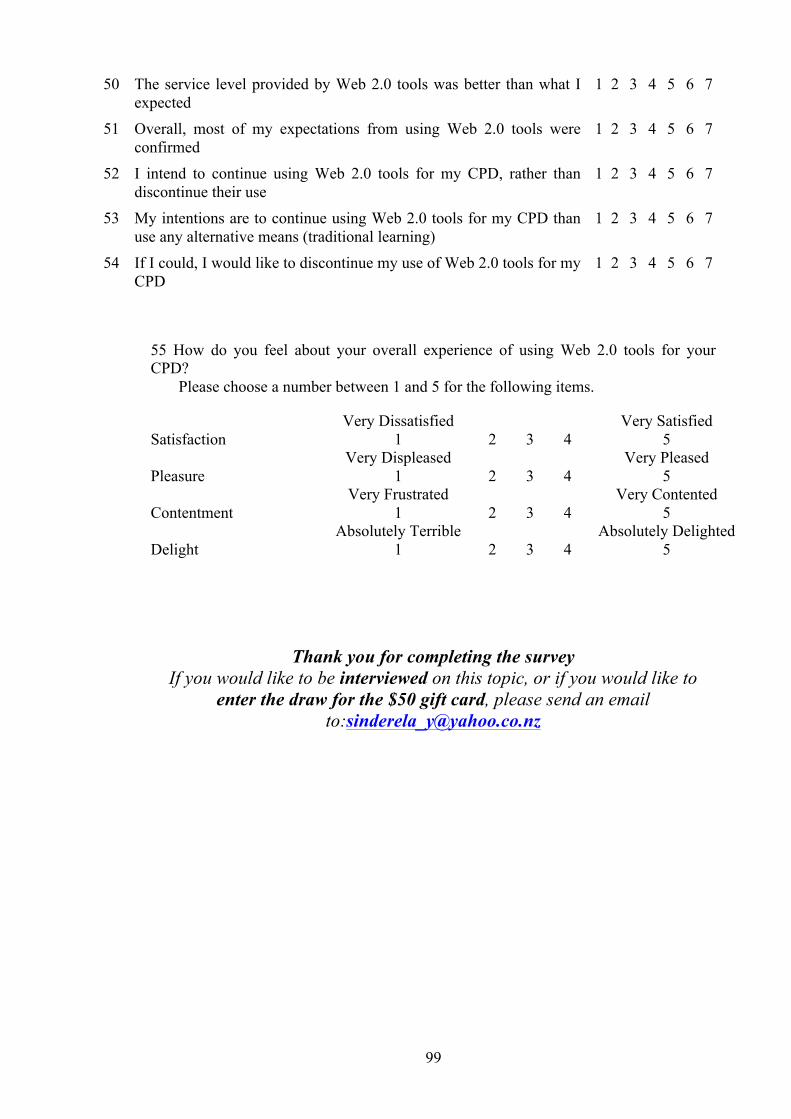
99
50 The service level provided by Web 2.0 tools was better than what I expected
1 2 3 4 5 6 7
51 Overall, most of my expectations from using Web 2.0 tools were confirmed
1 2 3 4 5 6 7
52 I intend to continue using Web 2.0 tools for my CPD, rather than discontinue their use
1 2 3 4 5 6 7
53 My intentions are to continue using Web 2.0 tools for my CPD than use any alternative means (traditional learning)
1 2 3 4 5 6 7
54 If I could, I would like to discontinue my use of Web 2.0 tools for my CPD
1 2 3 4 5 6 7
55 How do you feel about your overall experience of using Web 2.0 tools for your CPD?
Please choose a number between 1 and 5 for the following items.
Very Dissatisfied Very Satisfied Satisfaction 1
Very Displeased 2 3 4 5
Very Pleased Pleasure 1
Very Frustrated 2 3 4 5
Very Contented Contentment 1
Absolutely Terrible 2 3 4 5
Absolutely Delighted Delight 1 2 3 4 5
Thank you for completing the survey If you would like to be interviewed on this topic, or if you would like to
enter the draw for the $50 gift card, please send an email to:[email protected]
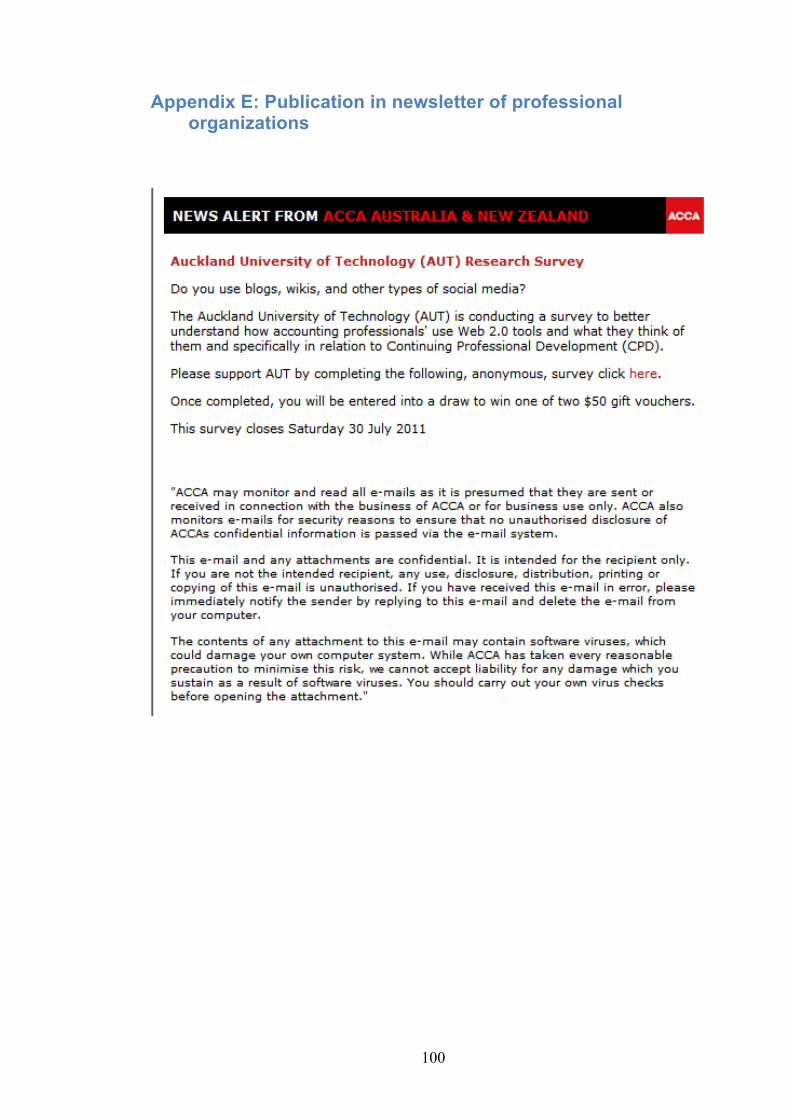
100
Appendix E: Publication in newsletter of professional organizations

101
Appendix F: Descriptive statistics of overall sample
Digital literacy (N = 85)
Mean Std.Dev Internet usage frequencies Several times in a day 1.02 .217
Communication methods
Fax .25 .434 Phone .72 .453
Mobile phone .94 .237 Chat room .28 .453
Surface mail .18 .383 Courier .08 .277 Email .94 .237
VOIP (e.g. Skype) .49 .503 Face to face .91 .294
Digital literacy
How to download 1.02 .152 How to send a file 1.07 .258
How to open attachment 1.01 .108 Name of search engine 1.08 .277
Internet skills Not at all skilled 3.55 .716
Demographic (N = 85) Mean Std.Dev
Gender 1.42 .497
Accredited with NZICA .49 .503
CPA .21 .411 Others (e.g. ACCA) .33 .473
CPD requirement 1.07 .258 Training 1.47 .502
Education 1.96 1.117 Working 1.19 .393 Childcare 1.61 .490
Web 2.0 tools (N= 85) Mean Std.Dev
Blogs 3.82 1.082 Mash-ups 2.62 1.480 Microblogging 2.56 1.277 Podcasts 3.66 1.211 Prediction markets 2.68 1.311 Rating 3.34 1.402 RSS feeds 3.35 1.453 Social networking sites 4.39 .914 Tagging 3.71 1.361 Wikis 3.59 1.357

102
DL construct items (N= 85) Mean Std.Dev
Download (DL1) 1.02 .152 MP3 (DL5k) 4.44 .957 Preference setting (DL5ag) 3.54 1.460 Refresh/Reload (DL5ai) 4.29 1.132 Newsgroup (DL5aj) 3.34 1.368 PDF (DL5ak) 4.64 .595 Advanced Search (DL5al) 4.39 .914

103
Appendix G: Descriptive statistics for all items
Descriptive statistics N Minimum Maximum Mean Std. Deviation
PU1 34 3 7 5.44 1.021 PU2 34 3 7 5.47 .992 PU3 34 3 7 5.41 1.019 PU4 34 4 7 5.68 .843 PE1 85 1 7 4.91 1.087 PE2 85 1 7 4.80 1.163 PE3 85 2 7 4.80 1.153 PE4 85 1 7 4.69 1.354 EE1 85 2 7 4.91 1.007 EE2 85 2 7 5.19 .970 EE3 85 2 7 5.11 1.069 EE4 85 1 7 5.08 1.104 SI1 85 1 7 4.62 1.225 SI2 85 1 7 4.55 1.277 SI3 85 1 7 4.60 1.302 SI4 85 1 7 4.66 1.323 FC1 85 1 7 4.89 1.195 FC2 85 1 7 4.92 1.093 FC3 85 1 7 4.47 1.333 FC4 85 1 7 4.52 1.240 DL1 85 1 2 1.02 .152
DL5k 85 1 5 4.44 .957 DL5ag 85 1 5 3.54 1.460 DL5ai 85 1 5 4.29 1.132 DL5aj 85 1 5 3.34 1.368 DL5ak 85 2 5 4.64 .595 DL5al 85 1 5 4.39 .914 ADPT 85 1 2 1.60 .493 EC1 34 4 7 5.47 .861 EC2 34 4 7 5.47 .929 EC3 34 3 7 5.59 .957 S1 34 3 5 4.24 .654 S2 34 2 5 4.15 .744 S3 34 3 5 4.18 .673 S4 34 3 5 4.18 .716
CI1 34 4 7 5.76 .955 CI2 34 1 7 5.38 1.415 CI3 34 1 4 1.65 .981

104
Appendix H: Familiarity with Web 2.0 tools for overall sample
Web 2.0 tools (N= 85)
Frequency Percent
Blogs
(No understanding) 1 3 3.5 2 6 7.1 3 22 25.9 4 26 30.6
(Full understanding) 5 28 32.9
Mash-ups
(No understanding) 1 31 36.5 2 9 10.6 3 18 21.2 4 15 17.6
(Full understanding) 5 12 14.1
Microblogging
(No understanding) 1 26 30.6 2 10 11.8 3 31 36.5 4 11 12.9
(Full understanding) 5 7 8.2
Podcasts
(No understanding) 1 7 8.2 2 6 7.1 3 21 24.7 4 26 30.6
(Full understanding) 5 25 29.4
Prediction markets
(No understanding) 1 22 25.9 2 15 17.6 3 25 29.4 4 14 16.5
(Full understanding) 5 9 10.6
Rating
(No understanding) 1 15 17.6 2 6 7.1 3 21 24.7 4 21 24.7
(Full understanding) 5 22 25.9
RSS feeds
(No understanding) 1 16 18.8 2 7 8.2 3 17 20.0 4 21 24.7
(Full understanding) 5 24 28.2
Social networking
sites
(No understanding) 1 1 1.2 2 3 3.5 3 10 11.8 4 19 22.4
(Full understanding) 5 52 61.2
Tagging
(No understanding) 1 11 12.9 2 5 5.9 3 13 15.3 4 25 29.4
(Full understanding) 5 31 36.5
Wikis
(No understanding) 1 11 12.9 2 6 7.1 3 18 21.2 4 22 25.9
(Full understanding) 5 28 32.9
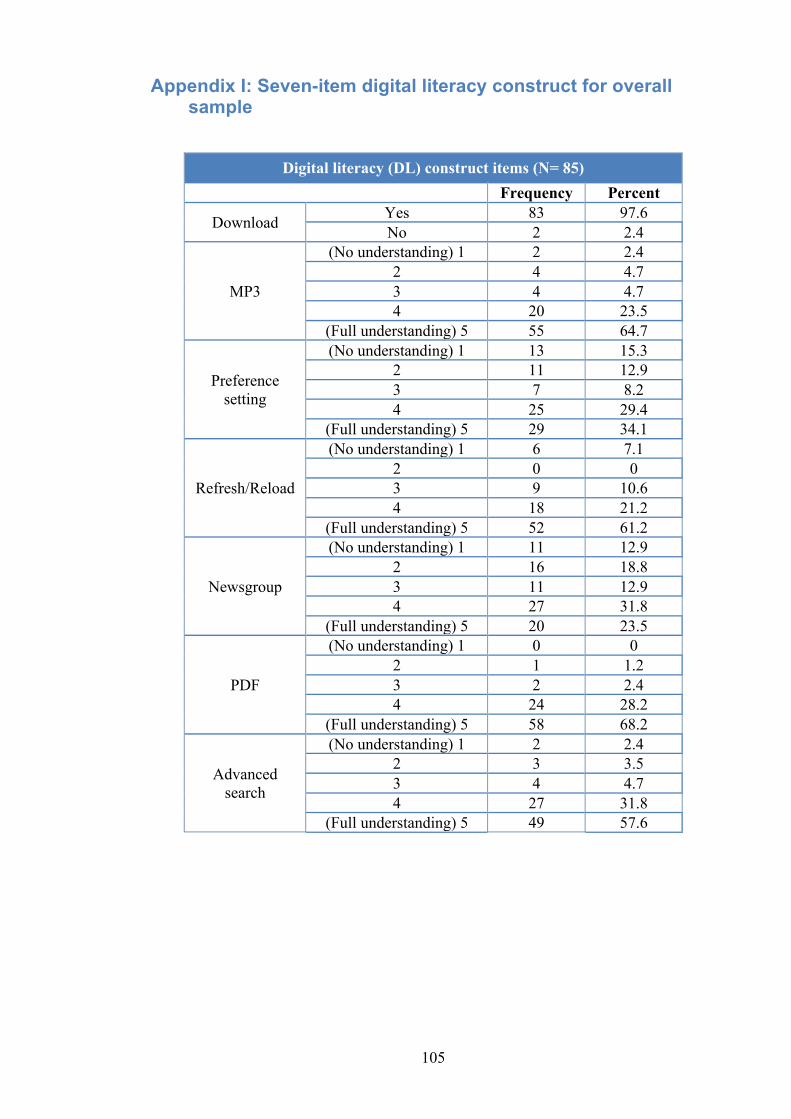
105
Appendix I: Seven-item digital literacy construct for overall sample
Digital literacy (DL) construct items (N= 85) Frequency Percent
Download Yes 83 97.6 No 2 2.4
MP3
(No understanding) 1 2 2.4 2 4 4.7 3 4 4.7 4 20 23.5
(Full understanding) 5 55 64.7
Preference setting
(No understanding) 1 13 15.3 2 11 12.9 3 7 8.2 4 25 29.4
(Full understanding) 5 29 34.1
Refresh/Reload
(No understanding) 1 6 7.1 2 0 0 3 9 10.6 4 18 21.2
(Full understanding) 5 52 61.2
Newsgroup
(No understanding) 1 11 12.9 2 16 18.8 3 11 12.9 4 27 31.8
(Full understanding) 5 20 23.5
(No understanding) 1 0 0 2 1 1.2 3 2 2.4 4 24 28.2
(Full understanding) 5 58 68.2
Advanced search
(No understanding) 1 2 2.4 2 3 3.5 3 4 4.7 4 27 31.8
(Full understanding) 5 49 57.6

106
REFERENCES
AbuShanab, E., & Pearson, J. (2007). Internet banking in Jordan: The unified theory of acceptance and use of technology (UTAUT) perspective. Journal of Systems and Information Technology, 9(1), 78-97.
Aczel, J., Peake, S., & Hardy, P. (2008). Designing capacity-building in e-learning expertise: Challenges and strategies. Computers & Education, 50(2), 499-510.
Ajjan, H., & Hartshorne, R. (2008). Investigating faculty decisions to adopt Web 2.0 technologies: Theory and empirical tests. The Internet and Higher Education, 11(2), 71-80.
Ajzen, I. (1985). From intentions to actions: A theory of planned behavior [In J. Kuhl, & J. Beckmann (Eds.)]. Springer series in social psychology, 11-39.
Ajzen, I. (1991). The theory of planned behavior. Organizational behavior and human decision processes, 50(2), 179-211.
Ajzen, I., & Fishbein, M. (1975). Belief, attitude, intention and behavior: an introduction to theory and research. Reading, MA: Addision-Wesley.
Alan, C., Annear, J., Beck, E., & Van Beveren, J., &. (2009). A framework for the adoption of ICT and security technologies by SME's: University of Ballarat, viewed.
AlAwadhi, S., & Morris, A. (2008). The Use of the UTAUT Model in the Adoption of E-government Services in Kuwait, in proceedings of the 41st Hawaii International Conference on Systems Science (HICSS-41 2008). Waikoloa, Bia Island, Hawaii, USA.
Alexander, B. (2006). Web 2.0: A new wave of innovation for teaching and learning. Learning, 41(2), 32-44.
Andersen, P. (2007). What is Web 2.0?: ideas, technologies and implications for education: Citeseer.
Anderson, & Gerbing, D. W. (1988). Structural equation modeling in practice: A review and recommended two-step approach. Psychological bulletin, 103(3), 411.
Anderson, & Schwager, P. H. (2004). SME adoption of wireless LAN technology: Applying the UTAUT model.
Anderson, & Sullivan, M. W. (1993). The antecedents and consequences of customer satisfaction for firms. Marketing science, 125-143.
Arbaugh, J., & Duray, R. (2002). Technological and structural characteristics, student learning and satisfaction with web-based courses. Management Learning, 33(3), 331-347.
Au, N., Ngai, E. W. T., & Cheng, T. (2002). A critical review of end-user information system satisfaction research and a new research framework. Omega, 30(6), 451-478.
Au, N., Ngai, W., & Cheng, T. (2008). Extending the understanding of end user information systems satisfaction formation: An equitable needs fulfillment model approach. MIS quarterly, 32(1), 43-66.
Auerbach, C. F., & Silverstein, L. B. (2003). Qualitative data: An introduction to coding and analysis: NYU press.
Baltaci-Goktalay, S., & Ozdilek, Z. (2010). Pre-service teachers' perceptions about web 2.0 technologies. Procedia-Social and Behavioral Sciences, 2(2), 4737-4741.
Barclay, D., Higgins, C., & Thompson, R. (1995). The partial least squares (PLS) approach to causal modeling: Personal computer adoption and use as an illustration. Technology studies, 2(2), 285-309.
Bawden, D. (2001). Information and digital literacies: a review of concepts. Journal of documentation, 57(2), 218-259.

107
Belanche, D., Casalo, L. V., & Flavian, C. (2010). Providing online public services successfully: the role of confirmation of citizens' expectations. International Review on Public and Nonprofit Marketing, 1-18.
Bem, D. J. (1972). Self-perception theory. Advances in experimental social psychology, 6, 1-62.
Benson, E. P. (2004). Online learning: A means to enhance professional development. Critical Care Nurse, 24(1), 60.
Bernard, H. R. (2000). Social research methods: Qualitative and quantitative approaches: Sage Publications, Inc.
Berners-Lee, T. (1999). Weaving the Web: The original design and ultimate destiny of the World Wide Web by its inventor: Harper San Francisco.
Bhattacherjee, A. (2001a). An empirical analysis of the antecedents of electronic commerce service continuance. Decision support systems, 32(2), 201-214.
Bhattacherjee, A. (2001b). Understanding information systems continuance: An expectation-confirmation model. Mis Quarterly, 351-370.
Bhattacherjee, A., & Premkumar, G. (2004). Understanding changes in belief and attitude toward information technology usage: A theoretical model and longitudinal test. MIS Quarterly, 28(2), 229-254.
Blood, R. (2002). The weblog handbook: Practical advice on creating and maintaining your blog: Basic Books.
Blood, R. (2004). How blogging software reshapes the online community. Communications of the ACM, 47(12), 53-55.
Bodell, S., Hook, A., Penman, M., & Wade, W. (2009). Creating a learning community in today's world: how blogging can facilitate continuing professional development and international learning. The British Journal of Occupational Therapy, 72(6), 279-281.
Boudreau, M. C., Gefen, D., & Straub, D. W. (2001). Validation in information systems research: A state-of-the-art assessment. MIS quarterly, 1-16.
Boulos, M., Maramba, I., & Wheeler, S. (2006). Wikis, blogs and podcasts: a new generation of Web-based tools for virtual collaborative clinical practice and education. BMC medical education, 6(1), 41.
Bouma, G. D., & Ling, R. (2004). The research process: Oxford University Press, USA. Bradley, A. (2007). How to apply the PLANT SEEDS Framework for enhanced
enterprise Web 2.0 adoption. Gartner Research. Broady-Preston, J. (2009). Professional education, development and training in a Web
2.0 environment: A case study of the UK. New Library World, 110(5/6), 265-279.
Brosnan, K., & Burgess, R. C. (2003). Web based continuing professional development‚ learning architecture approach. Journal of Workplace Learning, 15(1), 24-33.
Bryman, A., & Bell, E. (2007). Business research methods: Oxford University Press, USA.
Buonanno, G., Faverio, P., Pigni, F., Ravarini, A., Sciuto, D., & Tagliavini, M. (2005). Factors affecting ERP system adoption: A comparative analysis between SMEs and large companies. Journal of Enterprise Information Management, 18(4), 384-426.
Burns, P. (2001). Entrepreneurship and small business: Palgrave Macmillan. Butler, M. (2011). The development, implementation, validation and evaluation of a
continuing professional development learning programme for nurses working in Saudi Arabia.
Cameron, A., & Massey, C. (1999). Small and medium sized enterprises: A New Zealand Perspective. . Auckland Addison Wesley Longman New Zealand Ltd.
Campbell, G. (2005). Podcasting in education. Educause Rev November/December, 33-
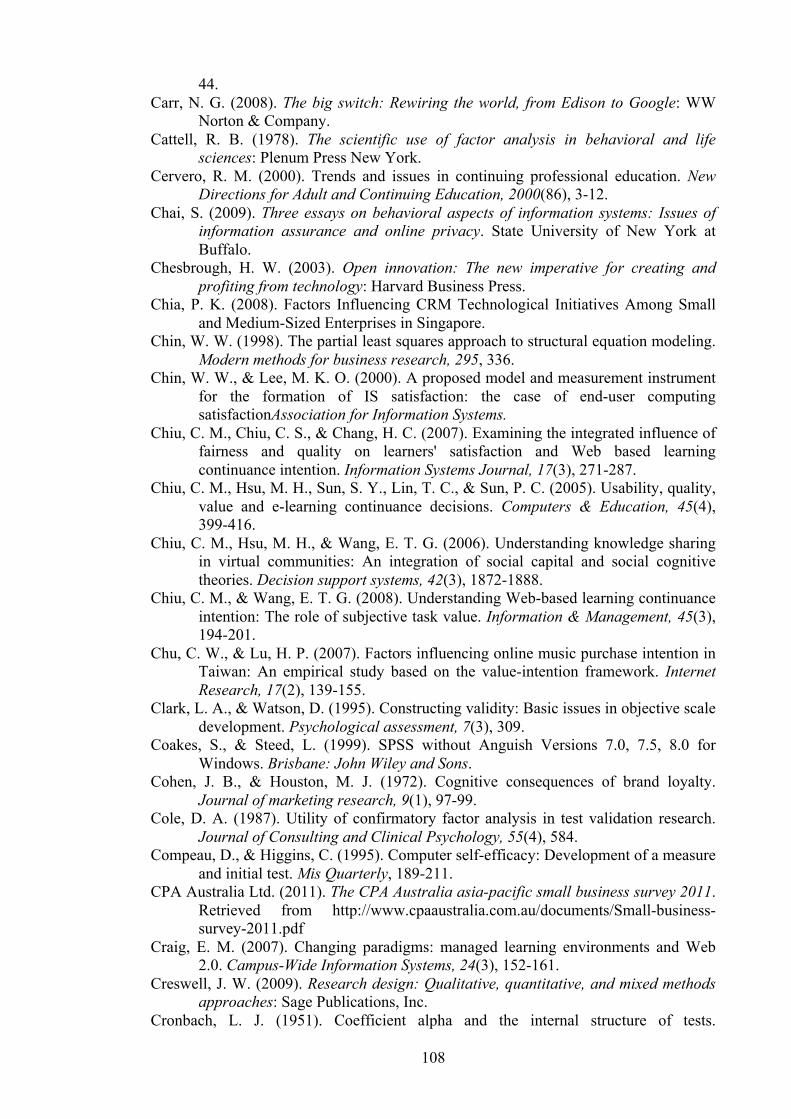
108
44. Carr, N. G. (2008). The big switch: Rewiring the world, from Edison to Google: WW
Norton & Company. Cattell, R. B. (1978). The scientific use of factor analysis in behavioral and life
sciences: Plenum Press New York. Cervero, R. M. (2000). Trends and issues in continuing professional education. New
Directions for Adult and Continuing Education, 2000(86), 3-12. Chai, S. (2009). Three essays on behavioral aspects of information systems: Issues of
information assurance and online privacy. State University of New York at Buffalo.
Chesbrough, H. W. (2003). Open innovation: The new imperative for creating and profiting from technology: Harvard Business Press.
Chia, P. K. (2008). Factors Influencing CRM Technological Initiatives Among Small and Medium-Sized Enterprises in Singapore.
Chin, W. W. (1998). The partial least squares approach to structural equation modeling. Modern methods for business research, 295, 336.
Chin, W. W., & Lee, M. K. O. (2000). A proposed model and measurement instrument for the formation of IS satisfaction: the case of end-user computing satisfactionAssociation for Information Systems.
Chiu, C. M., Chiu, C. S., & Chang, H. C. (2007). Examining the integrated influence of fairness and quality on learners' satisfaction and Web based learning continuance intention. Information Systems Journal, 17(3), 271-287.
Chiu, C. M., Hsu, M. H., Sun, S. Y., Lin, T. C., & Sun, P. C. (2005). Usability, quality, value and e-learning continuance decisions. Computers & Education, 45(4), 399-416.
Chiu, C. M., Hsu, M. H., & Wang, E. T. G. (2006). Understanding knowledge sharing in virtual communities: An integration of social capital and social cognitive theories. Decision support systems, 42(3), 1872-1888.
Chiu, C. M., & Wang, E. T. G. (2008). Understanding Web-based learning continuance intention: The role of subjective task value. Information & Management, 45(3), 194-201.
Chu, C. W., & Lu, H. P. (2007). Factors influencing online music purchase intention in Taiwan: An empirical study based on the value-intention framework. Internet Research, 17(2), 139-155.
Clark, L. A., & Watson, D. (1995). Constructing validity: Basic issues in objective scale development. Psychological assessment, 7(3), 309.
Coakes, S., & Steed, L. (1999). SPSS without Anguish Versions 7.0, 7.5, 8.0 for Windows. Brisbane: John Wiley and Sons.
Cohen, J. B., & Houston, M. J. (1972). Cognitive consequences of brand loyalty. Journal of marketing research, 9(1), 97-99.
Cole, D. A. (1987). Utility of confirmatory factor analysis in test validation research. Journal of Consulting and Clinical Psychology, 55(4), 584.
Compeau, D., & Higgins, C. (1995). Computer self-efficacy: Development of a measure and initial test. Mis Quarterly, 189-211.
CPA Australia Ltd. (2011). The CPA Australia asia-pacific small business survey 2011. Retrieved from http://www.cpaaustralia.com.au/documents/Small-business-survey-2011.pdf
Craig, E. M. (2007). Changing paradigms: managed learning environments and Web 2.0. Campus-Wide Information Systems, 24(3), 152-161.
Creswell, J. W. (2009). Research design: Qualitative, quantitative, and mixed methods approaches: Sage Publications, Inc.
Cronbach, L. J. (1951). Coefficient alpha and the internal structure of tests.
109
Psychometrika, 16(3), 297-334. Dabholkar, P. A., Shepherd, C. D., & Thorpe, D. I. (2000). A comprehensive
framework for service quality: an investigation of critical conceptual and measurement issues through a longitudinal study. Journal of Retailing, 76(2), 139-173.
Dale, V., Kinnison, T., Short, N., May, S., & Baillie, S. (2011). Web 2.0 and the veterinary profession: current trends and future implications for lifelong learning. Veterinary Record, 169(18), 467-467.
Damianos, L. E., Cuomo, D., Griffith, J., Hirst, D. M., & Smallwood, J. (2007). Exploring the adoption, utility, and social influences of social bookmarking in a corporate environmentIEEE.
Dave, B., & Koskela, L. (2009). Collaborative knowledge management-A construction case study. Automation in Construction, 18(7), 894-902.
Davis, F. D. (1989). Perceived usefulness, perceived ease of use, and user acceptance of information technology. MIS quarterly, 319-340.
Dawson, R., Hough, J., Hill, J., Winterford, B., & Alexandrov, D. (2009). Implementing Enterprise 2.0: Advanced Human Technologies.
De Saulles, M. (2008a). Never too small to join the party. Information World Review, 10-12.
De Saulles, M. (2008b). SMEs and the Web–Executive Summary. University of Brighton.
De Vaus, D. A. (2002). Analyzing social science data (Vol. 20): Sage Publications Ltd. De Wit, B., & Meyer, R. (2010). Strategy: Process, Content, Context, An International
Perspective: Cengage Learning Business Pr. Deloitte, Touche, & Tohmatsu, D. T. (2008). Deloitte e-Business survey: insights and
issues facing New Zealand business: Deloitte Touche Tohmatsu. Deng, L., Turner, D. E., Gehling, R., & Prince, B. (2010). User experience, satisfaction,
and continual usage intention of IT. European Journal of Information Systems, 19(1), 60-75.
Denzin, N. K. (1970). The research act in sociology: A theoretical introduction to sociological methods: Butterworths London.
Derouin, R. E., Fritzsche, B. A., & Salas, E. (2005). E-learning in organizations. Journal of Management, 31(6), 920.
DeVellis, R. F. (2011). Scale development: Theory and applications (Vol. 26): Sage Publications, Inc.
Dillman, D. A. (2007). Mail and internet surveys: The tailored design method: John Wiley & Sons Inc.
Doll, W. J., Deng, X., Raghunathan, T., Torkzadeh, G., & Xia, W. (2004). The meaning and measurement of user satisfaction: A multigroup invariance analysis of the end-user computing satisfaction instrument. Journal of Management Information Systems, 21(1), 227-262.
Doll, W. J., & Torkzadeh, G. (1988). The measurement of end-user computing satisfaction. MIS quarterly, 259-274.
Downes, S. (2004). Educational blogging. Educause review, 39(5), 14-26. Downes, S. (2005). E-learning 2.0 elearn magazine. Retrieved from
http://www.elearnmag.org/subpage.cfm?section=articles&article=29-1 Du, H. S., & Wagner, C. (2007). Learning with weblogs: Enhancing cognitive and
social knowledge construction. Professional Communication, IEEE Transactions on, 50(1), 1-16.
Duffy, P. D., & Bruns, A. (2006). The use of blogs, wikis and RSS in education: A conversation of possibilities.
Eckhardt, A., Laumer, S., & Weitzel, T. (2009). Who influences whom: Analyzing
110
workplace referents social influence on IT adoption and non-adoption. Journal of Information Technology, 24(1), 11-24.
Eley, T. C., & Stevenson, J. (1999). Using genetic analyses to clarify the distinction between depressive and anxious symptoms in children. Journal of Abnormal Child Psychology, 27(2), 105-114.
Evans. (2008). An evaluation of the user experiences of Web 2.0 tools and technologies amongst NHS staff
Evans, & Fuller, A. (2006). Improving workplace learning: Taylor & Francis. Falk, R. F., & Miller, N. B. (1992). A primer for soft modeling: University of Akron
Press. Ferro, E., Helbig, N. C., & Gil-Garcia, J. R. (2011). The role of IT literacy in defining
digital divide policy needs. Government Information Quarterly, 28(1), 3-10. Field, A. (2005). Discovering Statistics using SPSS:(and Sex, Drugs and Rock ‘n’ roll).
(2 ed. ed.): Sage Publications Ltd, London. Fink, A. (2003). The Survey Kit: How to sample in surveys (Vol. 7): Sage Publications,
Inc. Fink, A. (2009). How to conduct surveys: A step-by-step guide: Sage Publications, Inc. Fishbein, M., & Ajzen, I. (1975). Belief, attitude, intention, and behavior: An
introduction to theory and research. Fornell, C., & Larcker, D. F. (1981). Evaluating structural equation models with
unobservable variables and measurement error. Journal of marketing research, 39-50.
Fornell, C., Lorange, P., & Roos, J. (1990). The cooperative venture formation process: A latent variable structural modeling approach. Management science, 1246-1255.
Frydenberg, M. (2006). Principles and pedagogy: The two P's of podcasting in the information technology classroom
Gable, G. G. (1994). Integrating case study and survey research methods: an example in information systems. European Journal of Information Systems, 3(2), 112-126.
Gavrilis, D., Kakali, C., & Papatheodorou, C. (2008). Enhancing library services with Web 2.0 functionalities. Research and Advanced Technology for Digital Libraries, 148-159.
Gefen, D. and Straub, D. (2005) A practical guide to factorial validity using PLS-Graph: tutorial and annotated example. Communications of the AIS, 16, 91-109.
Gefen, D., Straub, D. W., & Boudreau, M. C. (2000). Structural equation modeling and regression: Guidelines for research practice. Communications of the Association for Information Systems, 4(7), 1-70.
Gilster, P. (1997). Digital literacy: Wiley Computer Pub. Glaser, B. G. (1978). Theoretical sensitivity: Advances in the methodology of grounded
theory (Vol. 2): Sociology Press. Goodfellow, R. (2011). Literacy, literacies and the digital in higher education. Teaching
in Higher Education, 16(1), 131-144. Grandon, E. E., Alshare, K., & Kwun, O. (2005). Factors influencing student intention
to adopt online classes: a cross-cultural study. Journal of Computing Sciences in Colleges, 20(4), 46-56.
Gray, K., Thompson, C., Clerehan, R., Sheard, J., & Hamilton, M. (2008). Web 2.0 authorship: Issues of referencing and citation for academic integrity. The Internet and Higher Education, 11(2), 112-118.
Grotelueschen, A. D. (1985). Assessing professionls' reasons for participating in continuing education. New directions for adult and continuing education, 1985(27), 33-45.
Hair, J. F., Black, W. C., Babin, B. J., Anderson, R. E., & Tatham, R. L. (2006).

111
Multivariate data analysis. Upper Saddle River, NJ: Pearson Prentice Hall. Hair Jr, J. F., Celsi, M. W., Money, A. H., Samouel, P., & Page, M. J. (2011). Essentials
of business research methods: ME Sharpe Inc. Hargittai, E. (2005). Survey measures of web-oriented digital literacy. Social Science
Computer Review, 23(3), 371. Hargittai, E. and Hsieh, Y.P. (2012). Succinct Survey Measures of Web-Use Skills.
Social Science Computer Review (Forthcoming). Available at: http://webuse.org/p/a34
Harris, H., & Park, S. (2008). Educational usages of podcasting. British Journal of Educational Technology, 39(3), 548-551.
Helson, H. (1964). Adaptation-level theory. In. New York: Harper & Row. Hemmi, A., Bayne, S., & Land, R. (2009). The appropriation and repurposing of social
technologies in higher education. Journal of Computer Assisted Learning, 25(1), 19-30.
Henseler, J., Ringle, C. M., & Sinkovics, R. R. (2009). The use of partial least squares path modeling in international marketing. Advances in international marketing, 20(2009), 277-319.
Hester, A. J., & Scott, J. E. (2008). A conceptual model of wiki technology diffusion. Paper presented at the Hawaii International Conference on System Sciences. Manoa, Hawaii.
Hinkin, T. R. (1995). A review of scale development practices in the study of organizations. Journal of Management, 21(5), 967.
Holdaway, D. (1979). The foundations of literacy: Heinemann Educational Books Inc., 70 Court St., Portsmouth.
Holmes, B., & Gardner, J. (2006). E-learning: Concepts and practice: Sage Publications Ltd.
Hossain, M. A., & Quaddus, M. (2011). Expectation-Confirmation Theory in Information System Research: A Review and Analysis. Information Systems Theory, 441-469.
Howard, J. A., & Sheth, J. N. (1969). The theory of buyer behavior. Hsu, & Lin, J. C. C. (2008). Acceptance of blog usage: The roles of technology
acceptance, social influence and knowledge sharing motivation. Information & management, 45(1), 65-74.
Hsu, & Lu, H. P. (2004). Why do people play on-line games? An extended TAM with social influences and flow experience. Information & management, 41(7), 853-868.
Hsu, M. H., Chiu, C. M., & Ju, T. L. (2004). Determinants of continued use of the WWW: an integration of two theoretical models. Industrial management & data systems, 104(9), 766-775.
Huerta, E., & Sandoval Almazan, R. (2007). Digital literacy: Problems faced by telecenter users in Mexico. Information Technology for Development, 13(3), 217-232.
Hulland, J. (1999). Use of partial least squares (PLS) in strategic management research: A review of four recent studies. Strategic Management Journal, 20(2), 195-204.
Ifinedo, P. (2006). Acceptance and continuance intention of web-based learning technologies (WLT) use among university students in a Baltic country. The Electronic Journal of Information Systems in Developing Countries, 23(0).
In, H. S., Jaekyoung, L., & Sooyeon, K. (2009). A study on the factors influencing the intention of Blog usage: Paper presented at the Pacific Asia Conference on Information Systems Hyderabad, India.
IPTS. (2008). Learning 2.0: A Study on the Impact of Web 2.0 Innovations on Education and Training in Europe. Retrieved from

112
http://is.jrc.ec.europa.eu/pages/Learning-2.0.html Jackson, A., Yates, J. A., & Orlikowski, W. (2007). Corporate Blogging: Building
community through persistent digital talkPaper presented at the The 40th Hawaii International Conference on System Sciences, Big Island, Hawaii.
Jonassen, D., Howland, J., Marra, R. M., & Crismond, D. (2008). Meaningful learning with technology (3rd ed.): Pearson/Merrill Prentice Hall.
Kaiser, H. F. (1958). The varimax criterion for analytic rotation in factor analysis. Psychometrika, 23(3), 187-200.
Kandasamy, I., & Ancheri, S. (2009). Hotel employees' expectations of QWL: A qualitative study. International Journal of Hospitality Management, 28(3), 328-337.
Kaplan, & Duchon, D. (1988). Combining qualitative and quantitative methods in information systems research: a case study. MIS quarterly, 571-586.
Kaplan, B., & Maxwell, J. (2005). Qualitative research methods for evaluating computer information systems. Evaluating the Organizational Impact of Healthcare Information Systems, 30-55.
Kaplan, M. D., Piskin, B., & Bol, B. (2010). Educational Blogging. Journal of Marketing Education, 32(1), 50-63.
Karahanna, E., D. W. Straub, et al. (1999). Information technology adoption across time: a cross-sectional comparison of pre-adoption and post-adoption beliefs. MIS quarterly, 183-213. Khalifa, M., & Liu, V. (2002). Satisfaction with Internet-based servicesIEEE. Khalifa, M., & Liu, V. (2004). The state of research on information system satisfaction.
Journal of Information Technology Theory and Application (JITTA), 5(4), 4. Kijsanayotin, B., Pannarunothai, S., & Speedie, S. M. (2009). Factors influencing health
information technology adoption in Thailand's community health centers: Applying the UTAUT model. International journal of medical informatics, 78(6), 404-416.
Kille, A. (2006). Wikis in the workplace: how wikis can help manage knowledge in library reference services. Libres, 15(2).
Kim, D. J. (2010). An investigation of the effect of online consumer trust on expectation, satisfaction, and post-expectation. Information Systems and E-Business Management, 1-22.
Kirkman, G. S., Cornelius, P., Sachs, J., & Schwab, K. (2002). Global information technology report, 2001-2002: Oxford University Press.
Kwan, M. P., & Ding, G. (2008). Geo-Narrative: Extending Geographic Information Systems for Narrative Analysis in Qualitative and Mixed-Method Research. The Professional Geographer, 60(4), 443-465.
Lawley, D. N., & Maxwell, A. E. (1971). Factor analysis as a statistical method (Vol. 18): Butterworths London.
Lee, M. C. (2010a). Explaining and predicting users' continuance intention toward e-learning: An extension of the expectation-confirmation model. Computers & Education, 54(2), 506-516.
Lee, M. C. (2010b). Exploring consumers initial intention and continuance intention to use online shopping: An extension of the Expectation-Confirmation Model.
Leech, N. L., Barrett, K. C., & Morgan, G. A. (2005). SPSS for intermediate statistics: Use and interpretation: Lawrence Erlbaum Assoc Inc.
Leedy, P. D., & Ormrod, J. E. (2005). Practical research: Planning and design: Pearson Merrill Prentice Hall.
Leedy, P. D., & Ormrod, J. E. (2009). Practical research: Planning and design: NJ. Lemke, C., Coughlin, E., Garcia, L., Reifsneider, D., & Baas, J., &. (2009). Leadership
for Web 2.0 in education: Promise and reality: Culver City, CA: Metiri Group.
113
Commissioned by CoSN through support from the John D. and Catherine T. MacArthur Foundation.
Levy, M., & Powell, P. (2004). Strategies for growth in SMEs: The role of information and information systems: Butterworth-Heinemann.
Lewis, B. R., Templeton, G. F., & Byrd, T. A. (2005). A methodology for construct development in MIS research. European Journal of Information Systems, 14(4), 388-400.
Li, J. P., & Kishore, R. (2006). How robust is the UTAUT instrument?: a multigroup invariance analysis in the context of acceptance and use of online community weblog systemsACM.
Lim, S., Trimi, S., & Lee, H. H. (2010). Web 2.0 service adoption and entrepreneurial orientation. Service Business, 1-11.
Limayem, M., & Cheung, C. M. K. (2008). Understanding information systems continuance: The case of Internet-based learning technologies. Information & management, 45(4), 227-232.
Locander, W., Sudman, S., & Bradburn, N. (1976). An investigation of interview method, threat and response distortion. Journal of the American Statistical Association, 269-275.
Locke, E. A. (1976). The nature and causes of job satisfaction. Handbook of industrial and organizational psychology, Dunnette, MD (ed.); Holt, Reinhart & Winston, New York., 1297-1349.
Mahmod, R., Dahlan, N., Ramayah, T., Karia, N., & Asaari, M. H. A. H. (2005). Attitudinal Belief on Adoption of e-MBA Program in Malaysia. Online Submission, 10.
Markless, S., & Streatfield, D. (2007). Three decades of information literacy: redefining the parameters. Change and Challenge: Information literacy for the, 21.
Martin. (2008). Digital literacy and the ìdigital society. Digital literacies: Concepts, policies and practices, 30.
Martin, & Madigan, D. (2006). Digital literacies for learning: Library Assn Pub Ltd. Martin, & Matlay, H. (2001). “Blanket” approaches to promoting ICT in small firms:
some lessons from the DTI ladder adoption model in the UK. Internet Research, 11(5), 399-410.
Mason, R., & Rennie, F. (2008). E-learning and social networking handbook: resources for higher education: Psychology Press.
Masurel, E., Montfort, K. V., & Lentink, R. (2003). SME innovation and the crucial role of the entrepreneur: Faculty of Economics and Business Administration, Vrije Universiteit.
Mathieson, K. (1991). Predicting user intentions: comparing the technology acceptance model with the theory of planned behavior. Information systems research, 2(3), 173-191.
McKinney. (2011). The networked enterprise holds steady: McKinsey Global Survey results. Retrieved from http://download.mckinseyquarterly.com/the_networked _enterprise_holds_steady.pdf
McKinney, V., & Yoon, K. (2002). The measurement of web-customer satisfaction: An expectation and disconfirmation approach. Information Systems Research, 13(3), 296.
McLean, R., Richards, B. H., & Wardman, J. I. (2007). The effect of Web 2.0 on the future of medical practice and education: Darwikinian evolution or folksonomic revolution? Medical journal of Australia, 187(3), 174.
Miles, M. B., & Huberman, A. M. (1994). Qualitative data analysis: An expanded sourcebook. 1994. Beverly Hills: Sage Publications.
Moon, S., Birchall, D., Williams, S., & Vrasidas, C. (2005). Developing design

114
principles for an e-learning programme for SME managers to support accelerated learning at the workplace. Journal of Workplace Learning, 17(5/6), 370-384.
Moore, G., & Benbasat, I. (1996). Integrating diffusion of innovations and theory of reasoned action models to predict utilisation of information technology by endusersSpringer.
Moore, G. C., & Benbasat, I. (1991). Development of an instrument to measure the perceptions of adopting an information technology innovation. Information systems research, 2(3), 173-191.
Mott, V. W. (2000). The development of professional expertise in the workplace. New directions for adult and continuing education, 2000(86), 23-31.
Myers, M. D., & Avison, D., &. (2002). Qualitative research in information systems, London: Sage publications.
Nardi, B. A., Schiano, D. J., Gumbrecht, M., & Swartz, L. (2004). Why we blog. Communications of the ACM, 47(12), 41-46.
Neuman, W. L. (2010). Social Research Methods: Quantitative and Qualitative Methods: Allyn & Bacon.
Nodder, C., Mason, D., Ateljevic, J., Milne, S., Frew, A., Hitz, M., & O'Connor, P. (2003). ICT adoption and use in New Zealand's small and medium tourism enterprises: a cross sectoral perspectiveSpringer-Verlag Wien.
Nunnally, J. C. (1978). Psychometric theory. New York: Tata McGraw-Hill. O'Reilly, T. (2005). What is Web 2.0: Design patterns and business models for the next
generation of software. Retrieved from http://www.oreillynet.com/pub/a/oreilly/tim/news/2005/09/30/what-is-web-20.html
O'Reilly, T. (2006). Web 2.0 compact definition: Trying again. Read, 2007(December 31).
Oliver, R. L. (1977). Effect of expectation and disconfirmation on postexposure product evaluations: An alternative interpretation. Journal of Applied Psychology, 62(4), 480.
Oliver, R. L. (1980). A cognitive model of the antecedents and consequences of satisfaction decisions. Journal of marketing research, 17(4), 460-469.
Oliver, R. L. (1981). Measurement and evaluation of satisfaction processes in retail settings. Journal of Retailing, 57(3), 25-48.
Oliver, R. L. (1993). Cognitive, affective, and attribute bases of the satisfaction response. Journal of Consumer Research, 418-430.
Ong, C. S., Lai, J. Y., & Wang, Y. S. (2004). Factors affecting engineers' acceptance of asynchronous e-learning systems in high-tech companies. Information & management, 41(6), 795-804.
Onwuegbuzie, A. J., & Teddlie, C. (2003). A framework for analyzing data in mixed methods research. Handbook of mixed methods in social and behavioral research, 351-383.
Paroutis, S., & Al Saleh, A. (2009). Determinants of knowledge sharing using Web 2.0 technologies. Journal of Knowledge Management, 13(4), 52-63.
Patterson, P. G., Johnson, L. W., & Spreng, R. A. (1997). Modeling the determinants of customer satisfaction for business-to-business professional services. Journal of the Academy of Marketing Science, 25(1), 4-17.
Payne, K. (2008). Much ado about something: Web 2.0 acceptance and use by public relations practitioners. Pedagogy Posters _ 108, 76.
Perry, C. (1998). A structured approach for presenting theses. Australasian Marketing Journal (AMJ), 6(1), 63-85.
Petter, S. C., & Gallivan, M. J. (2004). Toward a framework for classifying and guiding

115
mixed method research in information systemsIEEE. Peursem, K. V., & Jiang, L. (2008) Internal audit outsourcing practice and rationales:
SME evidence from New Zealand. Asian Review of Accounting, 16(3), 219–245. Pituch, K. A., & Lee, Y. (2006). The influence of system characteristics on e-learning
use. Computers & Education, 47(2), 222-244. Poon, S., & Swatman, P. (1995). The Internet for small businesses: An enabling
infrastructure for competitiveness. Retrieved from http://www.isoc.org/inet95/proceedings/PAPER/126/html/paper.html
Punch, K. F., & Punch, K. (2005). Introduction to social research: Quantitative and qualitative approaches: Sage Publications Ltd.
Remenyi, D., & Williams, B. (1998). Doing research in business and management: an introduction to process and method: Sage Publications Ltd.
Ribbink, D., Van Riel, A. C. R., Liljander, V., & Streukens, S. (2004). Comfort your online customer: quality, trust and loyalty on the internet. Managing service quality, 14(6), 446-456.
Richardson, W. (2010). Blogs, wikis, podcasts, and other powerful web tools for classrooms: Corwin Press.
Riegner, C. (2007). Word of mouth on the web: the impact of Web 2.0 on consumer purchase decisions. Journal of Advertising Research, 47(4).
Ringle, C. M., Wende, S., & Will, S. (2005). SmartPLS 2.0 (M3). University of Hamburg: Hamburg, Germany.Retrieved from http://www.smartpls.de.
Rogers, E. M. (1962). Diffusion of innovations: The Free Press, New York. Rogers, E. M. (1995). Diffusion of innovations: The Free Press, New York. Rosen, D., & Nelson, C. (2008). Web 2.0: A New Generation of Learners and
Education. Computers in the Schools, 15. Ross, R. (1974). Research: An Introduction. New York: Barnes & Noble. Ryan, J. (2003). Continuous professional development along the continuum of lifelong
learning. Nurse Education Today, 23(7), 498-508. Saade, R., & Bahli, B. (2005). The impact of cognitive absorption on perceived
usefulness and perceived ease of use in on-line learning: an extension of the technology acceptance model. Information & management, 42(2), 317-327.
Salas, E., Kosarzycki, M. P., Burke, C. S., Fiore, S. M., & Stone, D. L. (2002). Emerging themes in distance learning research and practice: some food for thought. International Journal of Management Reviews, 4(2), 135-153.
Sandelowski, M. (1998). Writing a good read: Strategies for re-presenting qualitative data. Research in Nursing & Health, 21(4), 375-382.
Santy, J., & Smith, L. (2007). Being an e-learner in health and social care: a student's guide: Taylor & Francis.
Saunders, M., Lewis, P., & Thornhill, A. (2009). Research methods for business students: Pearson Education.
Schoendienst, V., Krasnova, H., Guenther, O., & Riehle, D. (2011). Micro-Blogging Adoption in the Enterprise: An Empirical Analysis.10th International Conference on Wirtschaftsinformatik, 16th - 18th February 2011. Zurich, Switzerland.
Seddon, P. B., & Scheepers, R. (2011). Towards the improved treatment of generalization of knowledge claims in IS research: drawing general conclusions from samples. European Journal of Information Systems.
Sekaran, U. (2006). Research methods for business: A skill building approach: Wiley-India.
Sellitz, C., Wrightsman, L. S., & Cook, S. W. (1976). Research methods in social relations. New York: Holt, Rinehart & Winston.
Seybold, P. B. (2006). Outside innovation: how your customers will co-design your

116
company's future: HarperBusiness. Sharma, J., Chhabra, R., Cheng, A., Brownell, J., Liu, Y., & Yan, H. (2009). Control of
self-assembly of DNA tubules through integration of gold nanoparticles. Science, 323(5910), 112.
Shumarova, E., & Swatman, P. A. (2008). Informal eCollaboration Channels: Shedding Light on “Shadow CIT”. 21st Bled eConference eCollaboration: Overcoming Boundaries Through Multi-Channel Interaction, 15-18.
Silverman, D. (2006). Interpreting qualitative data: Methods for analyzing talk, text, and interaction: Sage Publications Ltd.
Solomon, G., & Schrum, L. (2007). Web 2.0: New Tools. New Schools, International Society for Technology in Education, Washington, DC.
Spears, M. C., & Parker, D. F. (2002). A probit analysis of the impact of training on performance appraisal satisfaction. American Business Review, 20(2), 12-16.
Spreng, R. A., MacKenzie, S. B., & Olshavsky, R. W. (1996). A reexamination of the determinants of consumer satisfaction. The Journal of Marketing, 15-32.
Spreng, R. A., & Page Jr, T. J. (2003). A Test of Alternative Measures of Disconfirmation. Decision sciences, 34(1), 31-62.
Stevens, J. (2002). Applied multivariate statistics for the social sciences: Lawrence Erlbaum.
Straub. (1989). Validating instruments in MIS research. MIS quarterly, 147-169. Straub, Boudreau, M. C., & Gefen, D. (2004). Validation guidelines for IS positivist
research. Communications of the Association for Information Systems, 13(24), 380-427.
Straub, Limayem, M., & Karahanna-Evaristo, E. (1995). Measuring system usage: implications for IS theory testing. Management science, 1328-1342.
Street, C. T., & Cameron, A. F. (2007). External Relationships and the Small Business: A Review of Small Business Alliance and Network Research. Journal of Small Business Management, 45(2), 239-266.
Sumak, B., Polancic, G., & Hericko, M. (2010). An empirical study of virtual learning environment adoption using UTAUTpresented in Second International Conference on Mobile, Hybrid, and On-line Learning.
Susarla, A., Barua, A., & Whinston, A. B. (2003). Understanding the service component of application service provision: An empirical analysis of satisfaction with ASP services. Mis Quarterly, 91-123.
Swan, J. E., & Trawick, I. F. (1981). Disconfirmation of expectations and satisfaction with a retail service. Journal of Retailing.
Tashakkori, A. (2006). Mixed methodology: Combining qualitative and quantitative approaches (Vol. 46): Sage.
Tashakkori, A., & Teddlie, C. (2003). Handbook of mixed methods in social & behavioral research: Sage Publications, Inc.
Taylor, & Murphy, A. (2004). SMEs and e-business. Journal of Small Business and Enterprise Development, 11(3), 280-289.
Taylor, S., & Todd, P. A. (1995). Understanding information technology usage: A test of competing models. Information systems research, 6(2), 144-176.
Teddlie, C., & Tashakkori, A. (2009). Foundations of mixed methods research: Integrating quantitative and qualitative approaches in the social and behavioral sciences: Sage Publications, Inc.
Tesch, R. (1990). Qualitative research: Analysis types and software tools. New York: Falmer
Thompson, A. M., Brown, J. C., Kay, J. W., & Titterington, D. M. (1991). A study of methods of choosing the smoothing parameter in image restoration by regularization. IEEE Transactions on Pattern Analysis and Machine

117
Intelligence, 13(4), 326-339. Thong, J. Y. L., Hong, S. J., & Tam, K. Y. (2006). The effects of post-adoption beliefs
on the expectation-confirmation model for information technology continuance. International Journal of Human-Computer Studies, 64(9), 799-810.
Torning, K. (2008). Position paper: Adapting Web 2.0 to Corporate Reality: Paper presented at the ACM conference on Computer Spported Cooperative Work, San Diego, CA, USA.
Tse, D. K., & Wilton, P. C. (1988). Models of consumer satisfaction formation: an extension. Journal of marketing research, 204-212.
Tu, C. H. (2004). Online collaborative learning communities: Twenty-one designs to building an online collaborative learning community: Libraries Unltd Inc.
Tu, C. H., Blocher, M., & Ntoruru, J. (2008). Integrate Web 2.0 technology to facilitate online professional community: EMI special editing experiences. Educational Media International, 45(4), 335-341.
Tu, C. H., Blocher, M., & Roberts, G. (2008). Constructs for Web 2.0 learning environments: a theatrical metaphor. Educational Media International, 45(4), 253-269.
Tucker, L. R., & Lewis, C. (1973). A reliability coefficient for maximum likelihood factor analysis. Psychometrika, 38(1), 1-10.
Tynjälä, P., & Häkkinen, P. (2005). E-learning at work: theoretical underpinnings and pedagogical challenges. Journal of Workplace Learning, 17(5/6), 318-336.
Urbach, N., & Ahlemann, F. (2010). Structural equation modeling in information systems research using partial least squares. Journal of Information Technology Theory and Application, 11(2), 5-40.
Usher, W. T. (2011). Australian health professionals’ social media (Web 2.0) adoption trends: early 21st century health care delivery and practice promotion. Australian Journal of Primary Health.
Vapola, T., Tossavainen, P., & Gabrielsson, M. (2008). The battleship strategy: The complementing role of born globals in MNC’s new opportunity creation. Journal of International Entrepreneurship, 6(1), 1-21.
Venkatesh, V. (1999). Creation of favorable user perceptions: exploring the role of intrinsic motivation. MIS quarterly, 239-260.
Venkatesh, V., & Davis, F. D. (2000). A theoretical extension of the technology acceptance model: Four longitudinal field studies. Management science, 186-204.
Venkatesh, V., Morris, M. G., Davis, G. B., & Davis, F. D. (2003). User acceptance of information technology: Toward a unified view. MIS quarterly, 425-478.
Vinzi, V. E., Chin, W. W., & Henseler, J. (2009). Handbook of partial least squares: Concepts, methods and applications: Springer Verlag.
Virkus, S. (2003). Information literacy in Europe: a literature review. Information research, 8(4), 8-4.
Vogel, T. M., & Goans, D. (2005). Delivering the News with Blogs. Internet Reference Services Quarterly, 10(1), 5-27.
Wattal, S., Racherla, P., & Mandviwalla, M. (2009). Employee adoption of corporate blogs: A quantitative analysis. proceedings of the 42nd Hawaii International Conference on System Sciences.
Welsh, E. T., Wanberg, C. R., Brown, K. G., & Simmering, M. J. (2003). E-learning: emerging uses, empirical results and future directions. International Journal of Training and Development, 7(4), 245-258.
West, J. A., & West, M. L. (2009). Using Wikis for Online Collaboration: the power of the read-write web: Jossey-Bass Inc Pub.
Wolcott, H. F. (1994). Transforming qualitative data: Description, analysis, and

118
interpretation: Sage Publications, Inc. Woodroof, J. B., & Kasper, G. M. (1995). Synthesis of equity, expectation, and needs
theories as a conceptual foundation for the user satisfaction construct in information systems research
Yi, Y. (1990). A critical review of consumer satisfaction, in V. A. Zeithmal (ed.). Review of Marketing 4, 68-123.