factors that influence rf power output of gsm … · factors that influence rf power output of gsm...
TRANSCRIPT

Factors that Influence RF Factors that Influence RF Power Output of GSM Mobile Power Output of GSM Mobile Phones Phones
June 4, 2007AIHce 2007, Philadelphia, PAM. Shum, L.S. Erdreich, M.D. Van Kerkhove, C. Scrafford, L. Barraj, M. McNeely, A.R. Sheppard, M. KelshFunded by CTIA with Technical Oversight from FDA
Asher Sheppard Consulting

2
Background Background
•• Anecdotal reports linking brain cancer Anecdotal reports linking brain cancer and cell phonesand cell phones
•• Epidemiologic Epidemiologic research largely research largely negativenegative
•• Widespread cell phone useWidespread cell phone use•• Need to better understand exposureNeed to better understand exposure

3
Background (contBackground (cont’’d)d)
•• Comprehensive cell phone exposure Comprehensive cell phone exposure assessment research project assessment research project –– Recall study Recall study –– Software Modified Phone surveySoftware Modified Phone survey–– Analysis of FCC Maximum SAR compliance Analysis of FCC Maximum SAR compliance
datadata–– Field StudyField Study

4
Study ObjectivesStudy Objectives
•• Assess factors potentially influencing Assess factors potentially influencing RF of GSM phonesRF of GSM phones–– Geographic locationGeographic location–– UrbanicityUrbanicity–– Moving vs. stationary samples Moving vs. stationary samples –– Indoors vs. outdoorsIndoors vs. outdoors–– User characteristics (e.g., handsUser characteristics (e.g., hands--free)free)–– Environmental factors (e.g., weather)Environmental factors (e.g., weather)

5
MethodsMethods
•• Recruited volunteers Recruited volunteers •• 3 study areas (3 study areas (SAsSAs): ):
–– SA1 SA1 –– New Jersey New Jersey –– SA2 SA2 –– New York City New York City –– SA3 SA3 –– San Francisco area San Francisco area
•• Survey ComponentsSurvey Components–– SoftwareSoftware--modified phones (modified phones (SMPsSMPs))–– Log bookLog book–– 5 days of logging phone calls5 days of logging phone calls–– QuestionnaireQuestionnaire

6
AnalysisAnalysis
•• Included only volunteers: >70% Included only volunteers: >70% compliance (SMP and log book compliance (SMP and log book matched)matched)
•• Calculated average energy output per Calculated average energy output per minute (J/min) per callminute (J/min) per call
•• Associations assessed within each of Associations assessed within each of 3 3 SAsSAs and all 3 combinedand all 3 combined
•• Conducted ANOVA and post hoc tests Conducted ANOVA and post hoc tests before combiningbefore combining
•• Multivariate, stepMultivariate, step--wise regression wise regression analysisanalysis

7
ResultsResults
•• 2537 calls2537 calls•• 53 subjects53 subjects•• Compliance rateCompliance rate
–– NJ (college students): 77.7%NJ (college students): 77.7%–– NYC (public): 82.8%NYC (public): 82.8%–– SF (professionals): 86.8%SF (professionals): 86.8%
•• Most calls were within study areasMost calls were within study areas
8
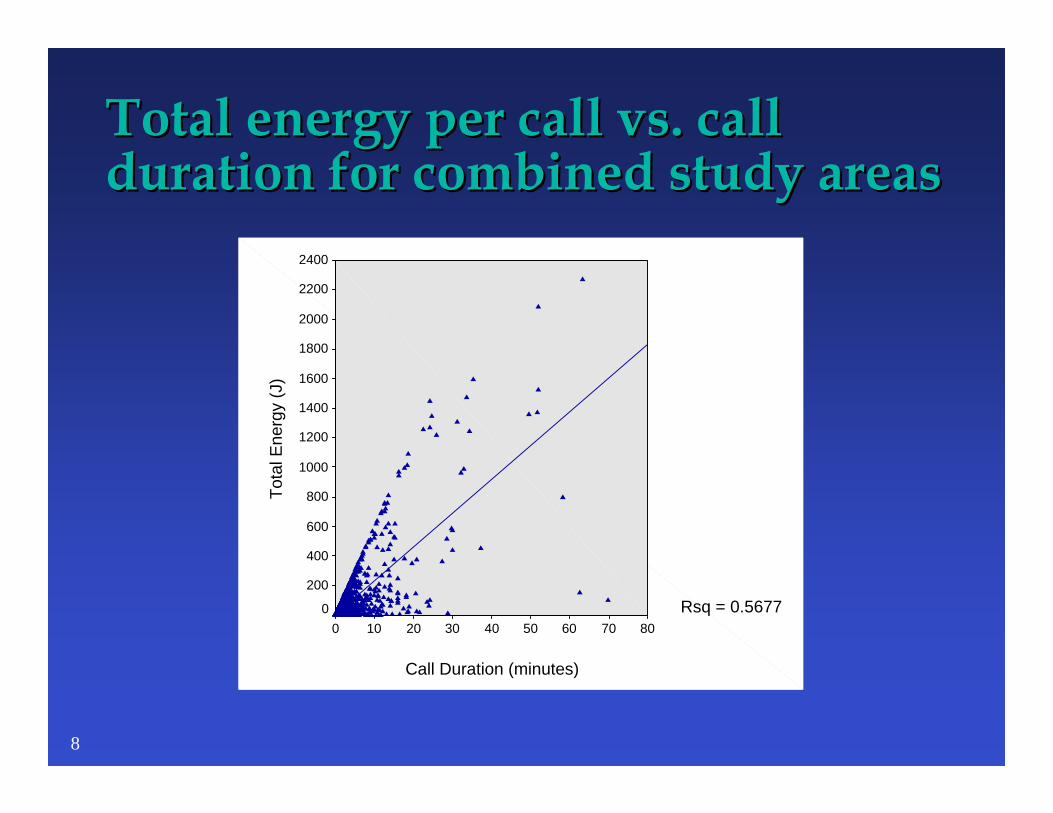
Total energy per call vs. call Total energy per call vs. call duration for combined study areasduration for combined study areas
Call Duration (minutes)
80706050403020100
Tota
l Ene
rgy
(J)
2400
2200
2000
1800
1600
1400
1200
1000
800
600
400
200
0 Rsq = 0.5677

9
Average output energy by study Average output energy by study areaarea
5731384580N =
SA3SA2SA1
Ave
rage
ene
rgy
outp
ut (J
/min
)
80
70
60
50
40
30
20
10
0
10
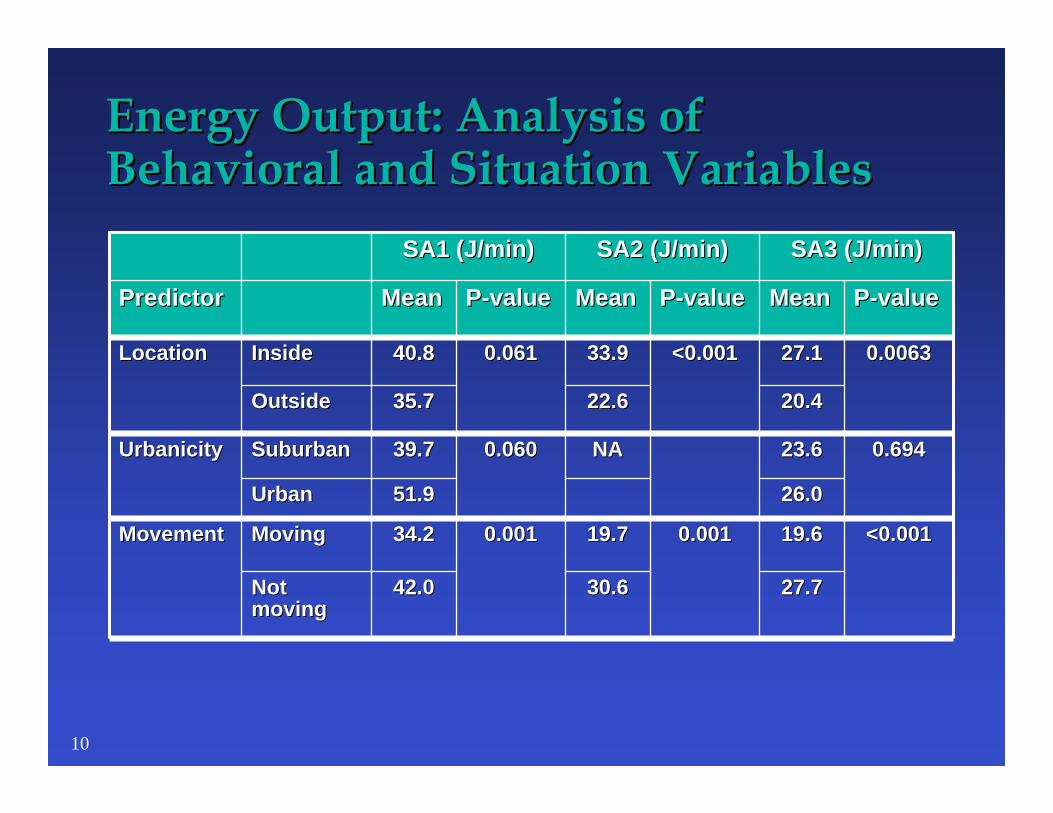
Energy Output: Analysis of Energy Output: Analysis of Behavioral and Situation VariablesBehavioral and Situation Variables
SA3 (J/min)SA3 (J/min)SA2 (J/min)SA2 (J/min)SA1 (J/min)SA1 (J/min)
27.727.730.630.642.042.0Not Not movingmoving
<0.001<0.00119.619.60.0010.00119.719.70.0010.00134.234.2MovingMovingMovementMovement
26.026.051.951.9UrbanUrban
0.6940.69423.623.6NANA0.0600.06039.739.7SuburbanSuburbanUrbanicityUrbanicity
20.420.422.622.635.735.7OutsideOutside
0.00630.006327.127.1<0.001<0.00133.933.90.0610.06140.840.8InsideInsideLocationLocation
PP--valuevalueMeanMeanPP--valuevalueMeanMeanPP--valuevalueMeanMeanPredictorPredictor

11
Energy Output: Analysis (contEnergy Output: Analysis (cont’’d)d)
23.223.229.529.540.740.7WeekdayWeekday
0.036 0.036 28.628.60.247 0.247 27.327.30.4140.41438.838.8WeekendWeekendDay of Day of WeekWeek
SA3 (J/min)SA3 (J/min)SA2 (J/min)SA2 (J/min)SA1 (J/min)SA1 (J/min)
24.224.229.129.142.942.9No HandsNo Hands--FreeFree
0.694 0.694 23.523.50.7640.76428.028.0<0.001 <0.001 19.919.9HandsHands--FreeFree
ModeMode
20.520.525.525.535.635.6OtherOther11.011.031.631.646.246.2SchoolSchool18.818.817.117.137.737.7WorkWork
<0.001 <0.001 40.040.0<0.001 <0.001 33.533.50.0090.00941.241.2HomeHomePlacePlace
PP--valuevalueMeanMeanPP--valuevalueMeanMeanPP--valuevalueMeanMeanPredictorPredictor

12
Energy Output: Summary Statistics Energy Output: Summary Statistics after Adjustment for Study Area*after Adjustment for Study Area*
<0.001<0.00158858819.319.322.822.8MovingMovingMovementMovement1533153322.922.932.632.6Not Not
movingmoving
PP--valuevalueNNStd DevStd DevMean Mean (J/min)(J/min)
PredictorPredictor
20382038
111111
1298129886986986386313101310
<0.001<0.001
<0.001<0.001
<0.001<0.001
22.522.530.730.7No HandsNo Hands--FreeFree
21.321.322.422.4HandsHands--FreeFree
ModeMode
22.922.928.928.9UrbanUrban21.821.832.432.4SuburbanSuburbanUrbanicityUrbanicity20.120.123.523.5OutsideOutside22.922.934.434.4InsideInsideLocationLocation
*non*non--parametric tests performedparametric tests performed
13
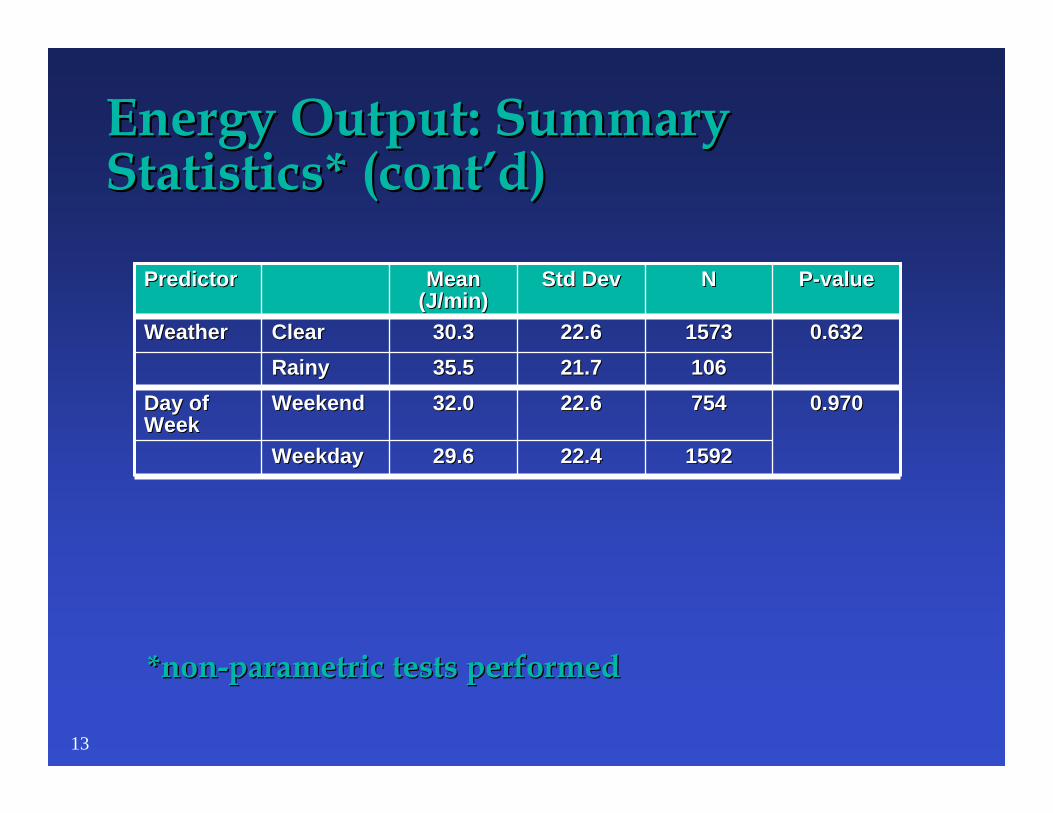
Energy Output: Summary Energy Output: Summary Statistics* (contStatistics* (cont’’d)d)
PP--valuevalueNNStd DevStd DevMean Mean (J/min)(J/min)
PredictorPredictor
1592159222.422.429.629.6WeekdayWeekday
0.9700.97075475422.622.632.032.0WeekendWeekendDay of Day of WeekWeek
10610621.721.735.535.5RainyRainy0.6320.6321573157322.622.630.330.3ClearClearWeatherWeather
*non*non--parametric tests performedparametric tests performed
14
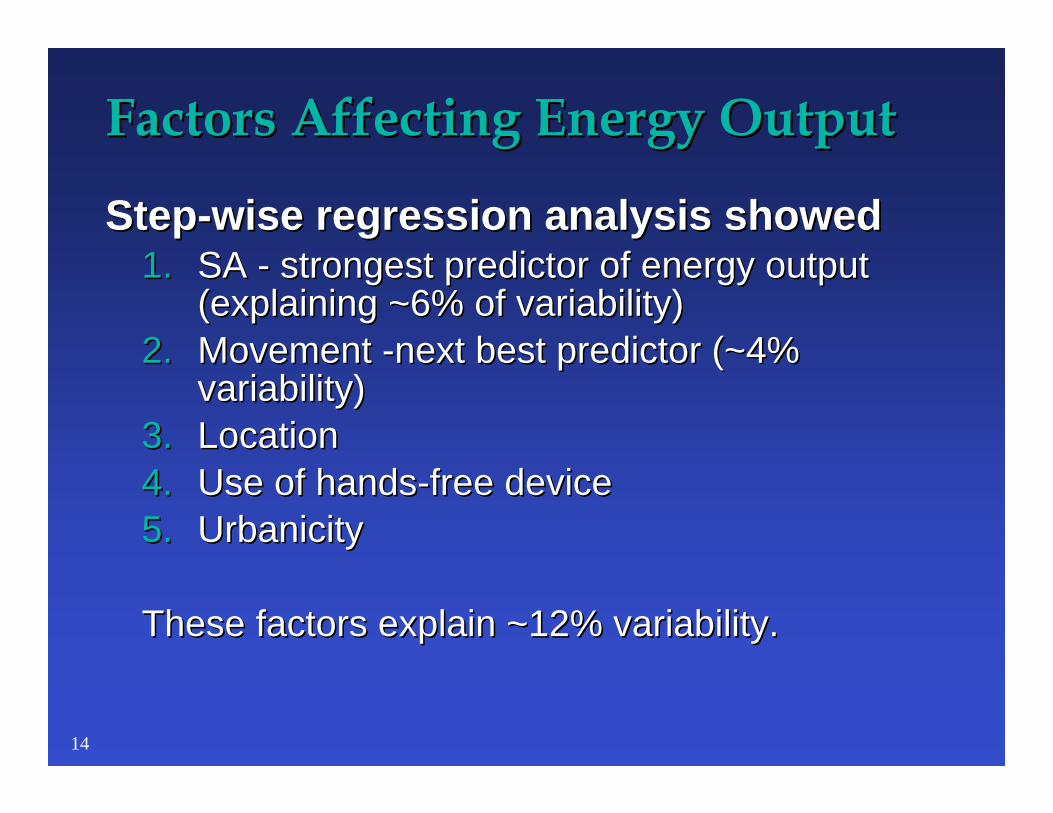
Factors Affecting Energy OutputFactors Affecting Energy Output
StepStep--wise regression analysis showedwise regression analysis showed1.1. SA SA -- strongest predictor of energy output strongest predictor of energy output
(explaining ~6% of variability)(explaining ~6% of variability)2.2. Movement Movement --next best predictor (~4% next best predictor (~4%
variability)variability)3.3. LocationLocation4.4. Use of handsUse of hands--free devicefree device5.5. UrbanicityUrbanicity
These factors explain ~12% variability.These factors explain ~12% variability.
15
Factors with unclear effect on Factors with unclear effect on energy outputenergy output
•• Weather Weather (limited data)(limited data)
•• Transportation Transportation (sparse data; modes not comparable)(sparse data; modes not comparable)
•• Place Place (sparse data over many categories)(sparse data over many categories)

16
DiscussionDiscussion••Movement affects energy output Movement affects energy output (J/min)(J/min)–– Stationary > MovingStationary > Moving–– GSM technology goes to max power GSM technology goes to max power
at each handoverat each handover–– Expect more handovers and higher Expect more handovers and higher
total energy while moving, total energy while moving, particularly drivingparticularly driving
–– Observed opposite findingObserved opposite finding

17
Discussion (contDiscussion (cont’’d)d)
••Location affects energy outputLocation affects energy output–– Inside>OutsideInside>Outside–– Expected Expected –– More power needed inside for More power needed inside for
communication with outside base communication with outside base station (except for internal networks)station (except for internal networks)

18
Discussion (contDiscussion (cont’’d)d)
••Urbanicity Urbanicity affects energy outputaffects energy output–– Urban>Suburban (not consistent)Urban>Suburban (not consistent)–– UnexpectedUnexpected–– Expect greater distances to suburban Expect greater distances to suburban
area base stations would require more area base stations would require more powerpower
–– Obstacles in urban environments may Obstacles in urban environments may affect power output of mobile phonesaffect power output of mobile phones

19
Discussion (contDiscussion (cont’’d)d)
•• Variables in our study only explain Variables in our study only explain about 12% of variability in energy about 12% of variability in energy outputoutput–– SASA–– MovementMovement–– LocationLocation–– Use of handsUse of hands--freefree–– UrbanicityUrbanicity

20
LimitationsLimitations
•• One phone modelOne phone model•• GSM technology onlyGSM technology only•• Volunteer participants (3 areas)Volunteer participants (3 areas)•• Logbook data issuesLogbook data issues•• Energy output rates overestimated by Energy output rates overestimated by
assuming user speaks 100% of timeassuming user speaks 100% of time•• Not able to obtain data about network Not able to obtain data about network
characteristicscharacteristics
21
Next StepsNext Steps
•• Ongoing research addresses Ongoing research addresses limitationslimitations–– Investigates actual output of different makes Investigates actual output of different makes
and modelsand models•• Worthwhile to study larger groups in Worthwhile to study larger groups in
other geographic areasother geographic areas–– Extend methods to include nonExtend methods to include non--GSM mobile GSM mobile
phonesphones–– Obtain data related to system buildObtain data related to system build--outout
•• Implication for Implication for epidemiologic epidemiologic researchresearch

22
UpcomingUpcoming
•• Full paper: Full paper: ErdreichErdreich et al. et al. Factors that Factors that Influence RF Power Output of GSM Influence RF Power Output of GSM Mobile Phones.Mobile Phones. Radiation Research (in Radiation Research (in press).press).

23
AcknowledgementsAcknowledgements
•• Funding: Cellular Telecommunications Funding: Cellular Telecommunications and Internet Association (CTIA) under a and Internet Association (CTIA) under a Collaborative Research and Development Collaborative Research and Development Agreement (CRADA)Agreement (CRADA)
•• Technical scientific oversight: Center for Technical scientific oversight: Center for Devices and Radiological Health of the Devices and Radiological Health of the U.S. Food and Drug Administration (FDA)U.S. Food and Drug Administration (FDA)
•• Exposure Assessment Panel: Joseph Exposure Assessment Panel: Joseph Bowman, Richard Tell, Bowman, Richard Tell, DimitriosDimitriosTrichopoulosTrichopoulos, Joe , Joe Wiart Wiart
•• Joe Morrissey (Motorola) Joe Morrissey (Motorola)