factors associated with stock price volatility and
TRANSCRIPT
PertanikaJ. Soc. Sci & Hum. 1(2): 179-186 (1993) ISSN: 0128-7702© Universiti Pertanian Malaysia Press
Factors Associated with Stock Price Volatility and Evaluation of Gordon's ShareValuation Model on the Kuala Lumpur Stock Exchange*
SHAMSHER MOHAMAD and Al'\lNUAR MD ASSIRDepartment ofAccounting and Finance,
Faculty of Economics and Management,
Universiti Pertanian Malaysia,
43400, Serdang, Selangor Darul Ehsan, Malaysia.
Keywords: Share price volatility, share valuation model, dividend yield, payout ratio, earningsvariability, asset growth, debts to asset ratio, firm size, return to equity
ABSTRAK
Peningkatan kemudahubahan harga saham di pasaran saham di seluruh dunia pada masa ini telah merangsangpeningkatan usaha penyelidikan kearah memahami faktor-faktor yang mempengaruhi kemudahubahan hargasaham. Justeru itu, objektif kajian ini adalah (i) untuk mengasingkan dan mengenalpasti faktor-faktor yangdicadangkan oleh teori dan amalan pelaburan dan mengkaji keupayaan faktor-faktor secara bersama dalammenghuraikan kemudahubahan harga saham di Bursa Saham Kuala Lumpur (BSKL); (ii) untuk menilaikebolehgunaan model penilaian harga saham Gordon di BSKL. Penemuan kajian menunjukkan lima darienam faktor yang dicadangkan berhasil menghuraikan 23 peratus perubahan harga saham di BSKL dan duadari faktor-faktor ini adalah signifikan pada paras keertian O.OS. Hasil kajian juga menunjukkan model Gordonsesuai digunakan untuk menilai harga saham di BSKL dengan statistik F yang signifikan, R2 bernilai 70 peratusdan tanda koefisyen pembolehubah dividen dan penumbuhan perolehan adalah sepenimana yang diramaloleh teori. Berbeza dengan kepercayaan umum, adalah didapati faktor-faktor asas merupakan kuasa penenmyang menguasai perubahan harga saham di BSKL.
ABSTRACT
The worldwide increase in share price volatility in recent years has stimulated an abundance of research in an
effort to understand individual share price volatility in international markets. The objectives of this study are:(i) to isolate factors suggested by investment theories and practices and to observe their ability to jointly explainshare price volatility on the developing Kuala Lumpur Stock Exchange (KLSE) and (ii) to evaluate theapplicability of Gordon's share valuation model on the KLSE. The findings suggest that five of the six suggestedvariables jointly explain 23 per cent of price changes on the KLSE for the period 1975 to 1990, and two of thesefactors were significant at 5 per cent level. Gordon's model holds well with F-statistics significant at 5 per centlevel, R-squared is 70 per cent, and the signs of the coefficient of dividend and earnings growth variables are inthe predicted direction. Contrary to popular belief, fundamental factors appear to be a significant forceinfluencing share price changes on the KLSE.
INTRODUCTION
All investors, be they institutional or individual,hold one common objective when they invest inthe share market; they all hope to maximiseexpected returns at some preferred level of risk.For investment in common stocks, not much isknown about what causes the changes in shareprices except the vague idea that somefundamental variables and other unsystematic
factors affect share prices. These create greatconcerns to investors and others such asstockbrokers, fund managers and investmentanalysts. Due to worldwide increases in shareprice volatility in recent years (for example, theBlack Monday or October 1987 market crash),studies on share price changes have receivedincreasing attention: Williams and Pfeifer (1982);Baskin (1989); and Downs (1991). Ariff and
"The main findings were presented at the 5th Annual Pacific Basin Finance Conference in Kuala Lumpur onJune 22-251992.

Shamsher Mohamad and Annuar Md. Nassir
Johnson (1990) report the standard deviations ofthe rate of change in returns in the last ten yearsto 1990 of London (8%), Tokyo (12%), NewYork (13%), Singapore (27%) and KualaLumpur (31%). Whether the various factorssuggested by valuation theories and practices arein fact jointly related to share price volatility is stillunresolved. An important example is a recentstudy by Fama and French (1992) which revealedthat share price returns are explained more byfactors such as size and book-to-price ratio ratherthan the capital asset pricing model (CAPM)suggested beta factors.
Another related issue which has receivedmuch coverage since the mid-1980s is thesearch for factors that change the values offinns which in turn lead to changes in the shareprices of firms. If these factors can beidentified, then it makes sense to considerchanges in the values of firms to have beendriven by these factors.
Share price volatility may ultimately be dueto changes in the values of firms arising fromchanges in the fundamental factors that areassociated with changes in values of firms.Consequently increased volatility in share pricesmay be a result of increased volatility in thesevalue-drivers. Some of these probable long-termvalue-drivers are inferred from theoretical andpractitioner guidelines. Recent examples of suchstudies include, among others, Wilcox (1984),Rappaport (1986), Baskin (1989) and Downs(1991) .
The objective of this paper is first to addresstwo related questions of share price volatility andfirm value changes as essentially beingdetermined by factors which are responsible forcreating changes in the value of firms. This isdone by referring to related theories and practicesand building empirical models to specify andisolate the value-drivers associated with shareprice volatility and price changes. Six key variablesare identified from accepted valuation theoriesand practices. These are elucidated in the nextsection. This is followed by the findings on theprice volatility of Malaysian common stock prices.The paper also aims to test the empirical validityof Gordon's share valuation model on theMalaysian equity market; the model is discussedand the findings presented, followed by theconclusion.
STOCKPRlCE VOIATIUTY FACTORS ANDTHE TEST MODEL
There have been attempts to investigate shareprice volatility by relating share price changes toone or more independent factors suggested byvaluation theories in finance and accounting.
The derivation of the relationship betweenprice volatility and value-drivers is discussed byWilliams and Pfeifer (1982) and Baskin (1989).The relationship derived from several studiesusing this line of inquiry can be generalised asfollows:
k
PV; = a + A bj (X); + e;J=l
wherePV; the cross-sectional observed
values of share price volatility ofa representative sample of i = 1,... n shares;
a, b;: respectively the intercept and thecoefficents of theory-suggestedindependent variables j = 1, .... k.Six factors were observed foreach firm in the sample of 100firms over each year of the testperiod from 1975 to 1990;
xi a matrix of six independentvariables observed over each yearfor each firm in the sample; and
e; the i.i.d. residual term satisfyingzero expectation, constantvariance unrelated to theindependent variables.
The model tested in this paper is specified asa linear model. If in fact the relatonship is nonlinear, further work is necessary to test otherfunctional forms of this model.
The values of the dependent (PV) andindependent (x) variables are obtained as theaverages of the individual firm variables over anannual cross-section of time and then expressedas averages over the test period of sixteen years.That is, each variable is a simple average oversixteen individual years for each firm and thesample size is 100 firms listed on the KualaLumpur Stock Exchange. The sample representsmore than fifty per cent of the capitalisation ofthe market. The financial data set is obtainedfrom the annual reports in the Companies AnnualHandbook. The share price volatility was measuredby the Parkinson's extreme value method
180 PertanikaJ. Soc. Sci. & Hum. Vol. 11 0.21993
Stock Price Volatility and Evaluation of Gordon's Share Valuation Model on the KLSE
relates to dividend growth, it is assumed that thisis monotonically related to growth in assets of afirm over a long period for it is the growthpotential that sustains the long-term dividendgrowth. The asset growth is measured as follows;
The values for this ratio for each year arecalculated and the average over the test period isa simple average of the time series for thesampled firms.
The fifth variable, debt-to-assets ratio, DA, isa ratio of total borrowings-to-assets of a firm atthe end of each year averaged over the testperiod. Corporate finance theory predicts thatincreases in debt-asset ratios should lead to agreater rate of change in the firm's valueprovided the firms had unused debt capacity.Thus this variable should be positively related toprice volatility. The positive effect of financialleverage must be balanced against the costsarising from increased financial distress. Ineither case price changes are likely to be directlyrelated to debt-to-asset changes. Trade debt isexcluded as it is not a leverage-related variable.
Larger firms, being more diversified havelower risk and earnings are likely to be stable.This suggests that the size of firms may inhibitprice volatility (Atiase 1985). Consequenty, thesixth variable is the firm size, SZ. The size isobserved as the size of total assets using equitymeasured at market values at the end of eachyear for each firm, averaged over the test period.Since these are levels data, the firm size isobserved in Malaysian ringgit and specified aslogarithm to the base of 10. The reason forincluding the size variable is that studies haveshown that it appears to matter in almost all testsof theories (Basu 1977; Reingaum 1981; Famaand French 1992). At worst, this variable is alsoimportant as a control for the firm size factor butless as a value dliver in the model.
In the absence of multicollinearity andassuming residuals are normally distributed,equation (1) predicts a somewhat deterministicrelationship between the fundamental variables,~, and the share price changes represented bythe extreme value volatility measure. The powerof Gordon's theory is judged by the overall fit ofthe tested model or whether it describes the
(Garman and Klass 1980) in order to have anefficient estimate of this dependent variable.Specifically:
, AP (High) - AP (Low) )PV = _ (_ 2
, '0.5 [AP (High) +AP (Low)]
The capitalisation-adjusted high, AP(High),and low, AP(Low), prices of each firm's sharewere observed. The volatility is then the square ofthe price difference between the high and lowprices in each year divided by the firms' averageprice of shares in each financial year. The squareroot of this variable is the standard deviation,which is the share price volatility variable, PV, inthis study. Thus share price volatility isrepresen ted as the exten t of variation of shareprices in the market.
The first of the six independent variables isthe dividend yield, DY, which Gordon's (1962)theory suggests to be inversely related to shareprice volatility. Gordon's share valuation theorycan be extended to show that dividend yield andpayout ratio are inversely related to share pricevolatili ty (Williams and Pfeifer 1982; Baskin1989). The dividend yield is measured for eachyear as the ratio of the sum of interim and finaldividends for the year divided by the closingshare price at the end of each financial year overthe test period for each firm. The cross-sectionalaverage is the simple average of the variable foreach of the firms over the sixteen-year period.The second variable, the payout ratio, POR, iscalculated similarly but with dividends divided bythe after-tax net earnings of the firm.
The third variable suggested by evidence onthe now well-entrenched efficient market theory(Annual' et al. 1992) for Kuala Lumpur is theearnings variable which should be related toshare price changes and thus to volatility. Shareprices react directly to changes in the reported orpredicted earnings changes. Therefore, it islogical to suggest a direct relationship betweenshare price volatility and earnings volatility, EV. Itis measured by the standard deviation of theearnings per share of firms over the test period.
The fourth variable, rate of asset growth, AG,suggests that the greater the asset growth thegreater the share price changes. AG is positivelyrelated to volatility: Gordon's dividend valuationtheory for firms with dividend growth suggestsgrowth as an important variable. Though this
[TA ]~
AG = TA:_1
-- 1 TA: total assets
PertanikaJ. Soc. Sci. & Hum. Vol. 1 No.2 1993 181
Shamsher Mohamad and Annuar Md. Nassir
actual behaviour of the market (significant Fratio), the extent to which it explains the stockprice variability (large R-squared value) andsignificance of its individual variables. Thehypotheses are:
HO : There is no significant joint relationshipbetween the fundamental variables andshare price volatili ty
HI There is a significant joint relationshipbetween the fundamental variables andshare price volatility.
Rejection of the null hypothesis wouldsuggest that the model explains the relationshipbetween share price volatility and the factorsdetermining the share prices. The proposition ofthe model is true if the alternate hypothesis isaccepted. Tests can be done by examining the F(k, -k) value for significance of the postulatedrelationship where k = 6 and N = 100. Aftertesting the general model with six independentvariables a parsimonious model is developed bycontrolling for multicollinearity and using stepwise regression. Pair-wise regression would be runto detect multicollinearity between variables by:for example, paR and DY are by definitionmulticollinear. Some of these variables will bedropped to improve reliability of the test results.The parsimonious model is built using Akaike'sprocedure as in Mendenhall and Sincich (1989).
The predicted relationship between each ofthe independen t variables is specified by thetheory developed in Williams and Pfeifer (1982)and Baskin (1989). The relationships arepostulated as follows: DY < 0; paR < 0; AG > 0;EV > 0; DA > 0; and SZ < O. That is, the dividendyield, payout ratio and firm size should benegatively related to price changes measured asvolatility; earnings volatility, asset growth andleverage should be positively related. Hypothesistests will be done by examining the signs of the
coefficients with t-values providing test statisticsfor significance of the predicted relationships.The extent of the joint relationship in the modelwill be quantified by computing the adjusted Rsquared value as a measure of the proportion ofvariation in share price volatility explained by thefundamental variables entering the model.
FINDINGS ON PRICE VOLATILITY
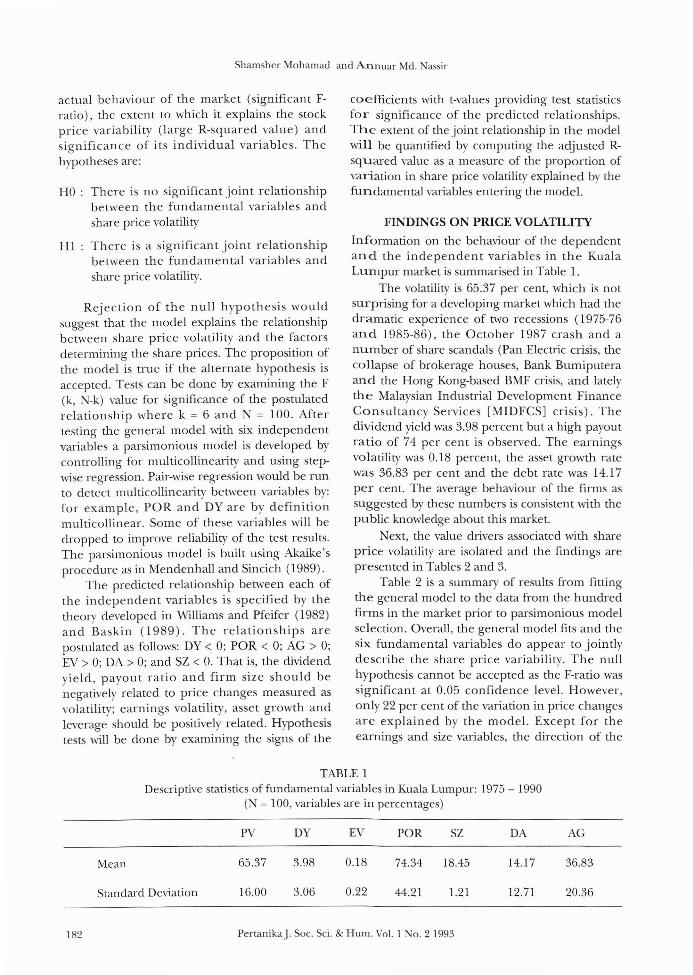
Information on the behaviour of the dependentand the independent variables in the KualaLumpur market is summarised in Table l.
The volatility is 65.37 per cent, which is notsurprising for a developing market which had thedramatic experience of two recessions (1975-76and 1985-86), the October 1987 crash and anumber of share scandals (Pan Electric crisis, thecollapse of brokerage houses, Bank Bumiputeraand the Hong Kong-based BMF crisis, and latelythe Malaysian Industrial Development FinanceConsultancy Services [MIDFCS] crisis). Thedividend yield was 3.98 percent but a high payoutratio of 74 per cent is observed. The earningsvolatility was 0.18 percent, the asset growth ratewas 36.83 per cent and the debt rate was 14.17per cent. The average behaviour of the firms assuggested by these numbers is consistent with thepublic knowledge about this market.
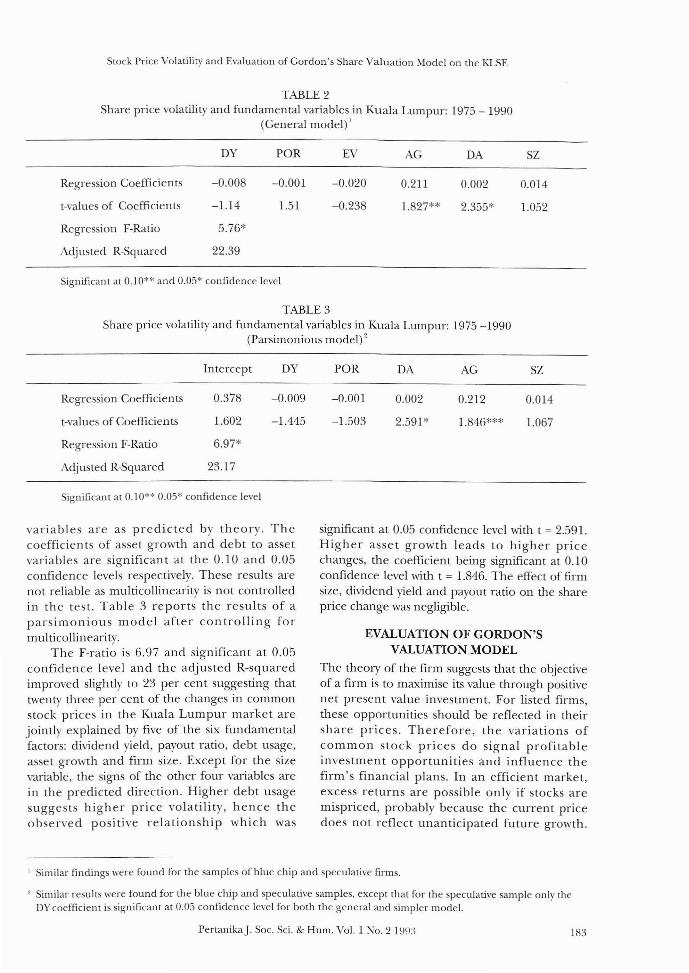
Next, the value drivers associated with shareprice volatility are isolated and the findings arepresented in Tables 2 and 3.
Table 2 is a summary of results from fittingthe general model to the data from the hundredfirms in the market prior to parsimonious modelselection. Overall, the general model fits and thesix fundamental variables do appear to jointlydescribe the share price variability. The nullhypothesis cannot be accepted as the F-ratio wassignifican t at 0.05 confidence level. However,only 22 per cent of the variation in price changesare explained by the model. Except for theearnings and size variables, the direction of the
TABLE 1Descriptive statistics of fundamental variables in Kuala Lumpur: 1975 - 1990
(N = 100, variables are in percentages)
Mean
Standard Deviation
PV
65.37
16.00
DY
3.98
3.06
EV
0.18
0.22
POR
74.34
44.21
SZ
18.45
1.21
DA
14.17
12.71
AG
36.83
20.36
182 PertanikaJ. Soc. Sci. & Hum. Vol. 1 No.2 1993
Stock Price Volatility and Evaluation of Gordon's Share Valuation Model on the KLSE
TABLE 2Share price volatility and fundamental variables in Kuala Lumpur: 1975 - 1990
(General model) 1
DY POR EV
Regression Coefficients -0.008 -0.001 -0.020
t-values of Coefficients -1.14 1.51 -0.238
Regression F-Ratio 5.76*
Adjusted R-Squared 22.39
Significant at 0.10** and 0.05* confidence level
AG
0.211
1.827**
DA
0.002
2.355*
SZ
0.014
1.052
TABLE 3Share price volatility and fundamental variables in Kuala Lumpur: 1975 -1990
(Parsimonious model) 2
Intercept DY
Regression Coefficients 0.378 -0.009
t-values of Coefficients 1.602 -1.445
Regression F-Ratio 6.97*
Adjusted R-Squared 23.17
Significant at 0.10** 0.05* confidence level
POR
-0.001
-1.503
DA
0.002
2.591 *
AG
0.212
1.846"'**
SZ
0.014
1.067
variables are as predicted by theory. Thecoefficients of asset growth and debt to assetvariables are significant at the 0.10 and 0.05confidence levels respectively. These results arenot reliable as multicollinearity is not controlledin the test. Table 3 reports the results of aparsimonious model after controlling formulticollinearity.
The F-ratio is 6.97 and significant at 0.05confidence level and the adjusted R-squaredimproved slightly to 23 per cent suggesting thattwenty three per cent of the changes in commonstock prices in the Kuala Lumpur market arejointly explained by five of the six fundamentalfactors: dividend yield, payout ratio, debt usage,asset growth and firm size. Except for the sizevariable, the signs of the other four variables arein the predicted direction. Higher debt usagesuggests higher price volatility, hence theobserved positive relationship which was
significant at 0.05 confidence level with t = 2.591.Higher asset growth leads to higher pricechanges, the coefficient being significant at 0.10confidence level with t = 1.846. The effect of firmsize, dividend yield and payout ratio on the shareprice change was negligible.
EVALUATION OF GORDON'SVALUATION MODEL
The theory of the firm suggests that the objectiveof a firm is to maximise its value through positivenet present value investment. For listed firms,these opportunities should be reflected in theirshare prices. Therefore, the variations ofcommon stock prices do signal profitableinvestment opportunities and influence thefirm's financial plans. In an efficient market,excess returns are possible only if stocks aremispriced, probably because the current pricedoes not reflect unanticipated future growth.
1 Similar findings were found for the samples of blue chip and speculative firms.
, Similar results were found for the blue chip and speculative samples, except that for the speculative sample only theDY coefficient is significant at 0.05 confidence level for both the general and simpler model.
PertanikaJ. Soc. Sci. & Hum. Vol. 1 No. 2 EI~I:\ 183
Shamsher Mohamad and Annuar Md. Nassir
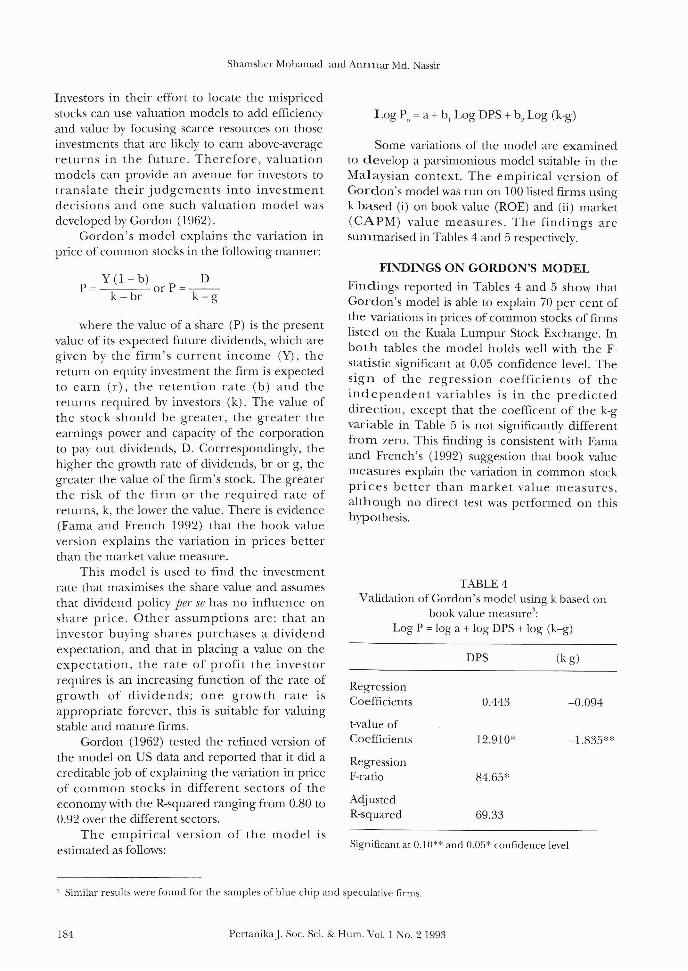
Investors in their effort to locate the mispricedstocks can use valuation models to add efficiencyand value by focusing scarce resources on thoseinvestments that are likely to earn above-averagereturns in the future. Therefore, valuationmodels can provide an avenue for investors totranslate their judgements into investmentdecisions and one such valuation model wasdeveloped by Gordon (1962).
Gordon's model explains the variation inprice of common stocks in the following manner:
Y(1-b) DP= orP=--
k - br k- g
where the value of a share (P) is the presentvalue of its expected future dividends, which aregiven by the firm's current income (Y), thereturn on equity investment the firm is expectedto earn (r), the retention rate (b) and thereturns required by investors (k). The value ofthe stock should be greater, the greater theearnings power and capacity of the corporationto payout dividends, D. Corrrespondingly, thehigher the growth rate of dividends, br or g, thegreater the value of the firm's stock. The greaterthe risk of the firm or the required rate ofreturns, k, the lower the value. There is evidence(Fama and French 1992) that the book valueversion explains the variation in prices betterthan the market value measure.
This model is used to find the investmentrate that maximises the share value and assumesthat dividend policy per se has no influence onshare price. Other assumptions are: that aninvestor buying shares purchases a dividendexpectation, and that in placing a value on theexpectation, the rate of profit the investorrequires is an increasing function of the rate ofgrowth of dividends; one growth rate isappropriate forever, this is suitable for valuingstable and mature firms.
Gordon (1962) tested the refined version ofthe model on US data and reported that it did acreditable job of explaining the variation in priceof common stocks in different sectors of theeconomy with the R-squared ranging from 0.80 to0.92 over the different sectors.
The empirical version of the model isestimated as follows:
Log Po = a + b l Log DPS + b2
Log (k-g)
Some variations of the model are examinedto develop a parsimonious model suitable in theMalaysian context. The empirical version ofGordon's model was run on 100 listed firms usingk based (i) on book value (ROE) and (ii) market(CAPM) value measures. The findings aresummarised in Tables 4 and 5 respectively.
FINDINGS ON GORDON'S MODEL
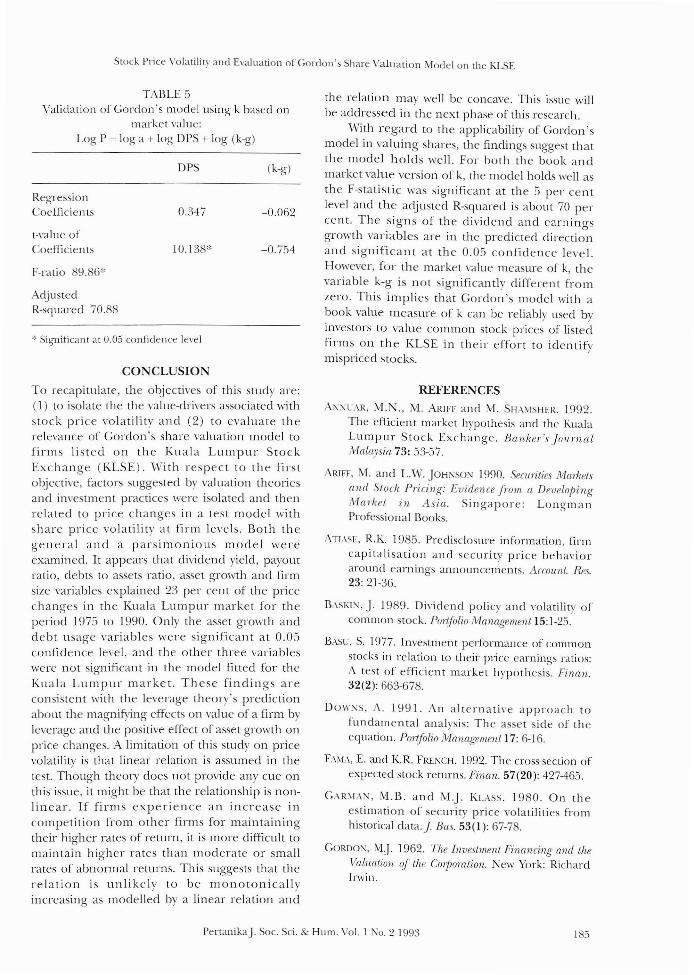
Findings reported in Tables 4 and 5 show thatGordon's model is able to explain 70 per cent ofthe variations in prices of common stocks of firmslisted on the Kuala Lumpur Stock Exchange. Inboth tables the model holds well with the Fstatistic significant at 0.05 confidence level. Thesign of the regression coefficients of theindependent variables is in the predicteddirection, except that the coefficent of the k-gvariable in Table 5 is not significantly differentfrom zero. This finding is consistent with Famaand French's (1992) suggestion that book valuemeasures explain the variation in common stockprices better than market value measures,although no direct test was performed on thishypothesis.
TABLE 4Validation of Gordon's model using k based on
book value measure':Log P = log a + log DPS + log (k-g)
DPS (k-g)
RegressionCoefficients 0.443 -0.094
t-value ofCoefficients 12.910* -1.835**
RegressionF-ratio 84.65*
AdjustedR-squared 69.33
Significant at 0.10** and 0.05* confidence level
3 Similar results were found for the samples of blue chip and speculative firms.
184 PertanikaJ. Soc. Sci. & Hum. Vol. 1 No.2 1993
Stock Price Volatilit)' and Evaluation of Gordon's Share Valuation Model on the KLSE
TABLE 5Validation of Gordon's model using k based on
market value:Log P = log a + log OPS + log (k-g)
CONCLUSION
To recapitulate, the objectives of this study are:(1) to isolate the the value-drivers associated withstock price volatility and (2) to evaluate therelevance of Gordon's share valuation model tofirms listed on the Kuala Lumpur StockExchange (KLSE). '''Tith respect to the firstobjective, factors suggested by valuation theoriesand investment practices were isolated and thenrelated to price changes in a test model withshare price volatility at firm levels. Both thegeneral and a parsimonious model wereexamined. It appears that dividend yield, payoutratio, debts to assets ratio, asset growth and firmsize variables explained 23 per cent of the pricechanges in the Kuala Lumpur market for theperiod 1975 to 1990. Only the asset growth anddebt usage variables were significant at 0.05confidence level, and the other three variableswere not significan t in the model fitted for theKuala Lumpur market. These findings areconsistent with the leverage theory's predictionabout the magnifYing effects on value of a firm byleverage and the positive effect of asset growth onprice changes. A limitation of this study on pricevolatility is that linear relation is assumed in thetest. Though theory does not provide any cue onthis issue, it might be that the relationship is nonlinear. If firms experience an increase incompetition from other firms for maintainingtheir higher rates of return, it is more difficult to
maintain higher rates than moderate or smallrates of abnormal returns. This suggests that therelation is unlikely to be monotonicallyincreasing as modelled by a linear relation and
':' Significanr at 0.05 confidence le'el
RegressionCoefficien ts
t-value ofCoef(iciel1ls
F-ratio 89.86*
AdjustedR-squared 70.88
DPS
0.347
10.138'"
(k-g)
-0.062
-0.754
the relation may well be concave. This issue willbe addressed in the next phase of this research.
With regard to the applicability of Gordon'smodel in valuing shares, the findings suggest thatthe model holds well. For both the book andmarket value version of k, the model holds well asthe F-statistic was significant at the 5 per centlevel and the adjusted R-squared is about 70 percent. The signs of the dividend and earningsgrO'wth variables are in the predicted directionand significant at the 0.05 confidence level.However, for the market value measure of k, thevariable k-g is not significantly different fromzero. This implies that Gordon's model with abook value measure of k can be reliably used byinvestors to value common stock prices of listedfinns on the KLSE in their effort to identifymispriced stocks.
REFERENCES
A1\''It.:AR, M.N., M. ARIFF and M. SHAMSHER. 1992.The efficient market hypothesis and the KualaLumpur Stock Exchange. Banker's JournalMalaysia 73: 53-57.
ARlFF, M. and L.W.10Hl':so'l 1990. Secu:rilies Mmilelsand Stock Pricing: Evidenre from a DevelojJingNfarket in Asia. Singapore: LongmanProfessional Books.
ATIASE, R.K. 1985. Predisclosure information, flflncapitalisation and security price behavioraround eal-nings announcements. Arcount. Res.23: 21-36.
BASKJ'I, J. 1989. Dividend policy and volatility ofcommon stock. Portfolio Management 15:1-25.
BASt.:, S. 1977. Investment performance of commonstocks in relation to their price earnings ratios:A test of efficient market hypothesis. Finan.32(2): 663-678.
OO>l'1\'S, A. 1991. An alternative approach tofundamental analysis: The asset side of theequation. POlifolio Nlanagement 17: 6-16.
F.~vL-\, E. and K.R. FRENCH. 1992. The cross-section ofexpected stock returns. Finan. 57(20): 427-465.
G"-\R~'[AN, M.B. and M.j. KLASS. 1980. On theestimation of security price volatilities fromhistorical clata ..f Bus. 53(1): 67-78.
GORDO:\, MJ 1962. The Investment Financing and theValuation of the CorjJolation. New York: RichardIrwin.
PertanikaJ. Soc. Sci. & Hum. Vol. 1 No.2 1993 185

Shamsher Mohamad and Annuar Md. Nassir
ME1\DENHALl., W. and T. SINCICH. 1989. A SecondCouTSe in B1uiness Statistics: Regression Analysis.London: MacMillan.
RApPAPORT, T. W. 1986. The affordable dividendapproach to equity valuation. Finan. Analysts
Journal 52-58.
REI:\'GAl U~'I, M.R. 1982. A direct test of Roll'sconjecture on the firm size effect. J. Finan.37(1): 27-36.
WILCOX, J.W. 1984. The PIB-ROE Valuation Model.Finan. Analystsj.January-Febuary, 58-66.
WILLIAMS, A.D. and P.E. PFEIFER. 1982. Riskestimation in active investment management. j.Finan. 37(1): 339-411.
(Received 4 November 1992)
186 PertanikaJ. Soc. Sci. & Hum. Vol. I TO. 2 1993