factors affecting ultrasonic extraction of lead from household
TRANSCRIPT

Factors Affecting Ultrasonic Extraction of Lead from Household Paint Films:
Further Investigations
Walter J. Rossiter, Jr. Blaza Toman
Mary E. McKnight Ijeoma Emenanjo
Mana Baghai Anaraki
Prepared for: U.S. Department of Housing and Urban Development
Office of Healthy Homes and Lead Hazard Control
NISTIR 6948

NISTIR 6948
Factors Affecting Ultrasonic Extraction of Lead from Household Paint Films:
Further Investigations
Walter J. Rossiter, Jr.* Blaza Toman**
Mary E. McKnight*
Ijeoma Emenanjo*
Mana Baghai Anaraki*
*Building and Fire Research Laboratory **Information Technology Laboratory
National Institute of Standards and Technology Gaithersburg, MD 20899-8615
March 2003
U.S. Department of Commerce Donald L. Evans, Secretary
Technology Administration
Phillip J. Bond, Under Secretary for Technology
National Institute of Standards and Technology Arden L. Bement, Jr., Director
Prepared for:
U.S. Department of Housing and Urban Development Mel Martinez, Secretary
Office of Healthy Homes and Lead Hazard Control David E. Jacobs, Director

iii
ABSTRACT Previous studies at NIST on the use of ultrasonic extraction/anodic stripping voltammetry (UE/ASV) for determining lead in household paint found that the particle size of the ground specimen plays an important role in lead extraction efficiency, particularly when the extraction is performed under the commonly used sonication conditions of 45 °C and 30 min. Consequently, it was proposed that, in conducting an UE/ASV analysis of a paint-film specimen in the field, the specimen particle size should be estimated prior to selecting an appropriate combination of sonication temperature and time. This report presents the results of a follow-up study performed to evaluate the reliability and practicality of the particle size recommendation. In the laboratory phase, specimens from lead-containing paint-film panels were prepared using 16 commercial paints and analyzed using UE/ASV. Experimental variables were: grinding method, sonication temperature, sonication time, paint manufacturer, paint type, gloss level, and binder type. The laboratory-prepared paint-film specimens were difficult to grind manually. The combination of specimen particle size, sonication temperature and sonication time had a highly significant effect on UE/ASV lead extraction efficiency. When particle size was small (passing through a No. 40, 425 μm mesh sieve), and sonication temperature and sonication time were 45 °C and 30 min, respectively, lead recovery was quantitative. When particle size was large (> 425 μm), lead recovery was quantitative only upon 65 °C and 90 min extractions. Paint manufacturer, paint type, gloss level, and binder type generally had little or no effect on UE/ASV lead recovery. In the field phase, NIST research staff and four certified lead inspectors and risk assessors (i.e., operators) trained to perform UE/ASV analyses sampled lead-containing paint from houses and similar buildings. The field samples included older lead-containing paint films that had been recently overcoated. Such samples were taken to determine whether they would be difficult to grind manually into small particles. It was found in the laboratory that manual grinding of the dry ice cooled field specimens readily produced a powder. Appropriate conditions of temperature and time for extracting lead from the field specimens were successfully selected by visually comparing the particle size of the ground specimens against that of a black pepper reference powder (i.e., known to pass through a No. 40, 425 μm mesh sieve). Estimating particle size through sieve analyses of ground field specimens did not result in selecting appropriate extraction temperature and time. It was recommended that, if a ground specimen appears to have adequately small particle size when compared against that of a reference powder, then extraction during a UE/ASV analysis may be performed at 45 °C and 30 min, as is presently carried out in common practice. Key Words: analysis; anodic stripping voltammetry (ASV); building technology; lead-based paint; lead recovery; particle size; sonication conditions; testing; ultrasonic extraction (UE)

iv
TABLE OF CONTENTS
Page ABSTRACT ....................................................................................................................................... iii 1. INTRODUCTION...........................................................................................................................1
1.1 Background.............................................................................................................................1 1.1.1 Preliminary Recommendation on UE Temperature and Time for Field Analysis .......3
1.2 Objective and Scope ...............................................................................................................4 2. EXPERIMENTAL ..........................................................................................................................4
2.1 UE/ASV Apparatus.................................................................................................................4 2.1.1 ASV Instrument............................................................................................................4 2.1.2 Sonicator.......................................................................................................................5
2.2 UE/ASV Test Protocol............................................................................................................5 2.3 Paint-Film Samples.................................................................................................................5
2.3.1 Laboratory-Prepared Paint-Film Panels .......................................................................5 2.3.2 Field Samples ...............................................................................................................7 2.3.3 Sampling Procedure .....................................................................................................7
2.4 Specimen Mass, Thickness, and Sieving ................................................................................8 3. RESULTS, ANALYSIS, AND DISCUSSION...............................................................................8
3.1 Laboratory-Prepared Paint-Film Panels..................................................................................8 3.2 Field Samples........................................................................................................................16
3.2.1 Samples Obtained by NIST Research Staff ...............................................................16 3.2.2 Samples Obtained by the Operators ...........................................................................19 3.2.3 Comparison of the UE/ASV Results with the NLLAP ICP Results ..........................19 3.2.4 Estimating Particle Size Before Conducting UE/ASV Field Analysis ......................19
4. SUMMARY, CONCLUSIONS, AND RECOMMENDATIONS................................................23 5. ACKNOWLEDGMENTS.............................................................................................................25 6. REFERENCES..............................................................................................................................25 APPENDIX A. LOG-LOG PLOTS COMPARING THE RESULTS OF ICP AND ASV
ANALYSES ...........................................................................................................A1

v
LIST OF TABLES
Page Table 1. Descriptions of the laboratory-prepared paint film panels....................................................6 Table 2. Characterization of the mass, thickness, and sieving of laboratory-prepared paint-film
samples ..................................................................................................................................9 Table 3. Directive for selecting the extraction temperature and time based on estimating the
particle size of the ground specimen .....................................................................................9 Table 4. Results of the UE/ASV analyses of the laboratory-prepared paint-film samples ...............11 Table 5. Analysis of variance on lead recovery for the laboratory-prepared paint-film samples
prepared with latex paint .....................................................................................................13 Table 6. Analysis of variance on lead recovery for the laboratory-prepared paint-film samples
prepared with latex paint; grinding method and combined temperature and time were the primary factors examined ..............................................................................................14
Table 7. Analysis of variance on lead recovery for all laboratory-prepared paint-film samples;
paint type was the primary factor examined .......................................................................14 Table 8. Characterization of field paint-film samples obtained by NIST research staff...................17 Table 9. Characterization of field paint-film samples obtained by operators ...................................18

vi
LIST OF FIGURES
Page Figure 1. UE/ASV Measured Lead Recovery Versus Known Panel Lead Level, as
Determined in the 2001 NIST Study ...................................................................................1 Figure 2. Lead Recovery for the Combinations of Specimen Particle Size, Sonication Time,
and Sonication Temperature, as Determined in the 2002 NIST Study................................2 Figure 3. Lead Recovery for the Laboratory-Prepared Paint-Film Samples as Related to
Extraction Conditions ........................................................................................................12 Figure 4. Box Plots of Lead Recovery as a Function of: (A) Grinding Method, (B) Temperature-
Time Combination, (C), Gloss Level and (D) Binder Type for the Latex Paint Samples.15 Figure 6. Comparison of the Lead Measurements Performed on Extract Solutions Using ASV
and ICP Methods ...............................................................................................................20 Figure A. log-log Plot Comparing the Lead Analyses of Extract Solutions by ASV and ICP
Methods ............................................................................................................................A1
1
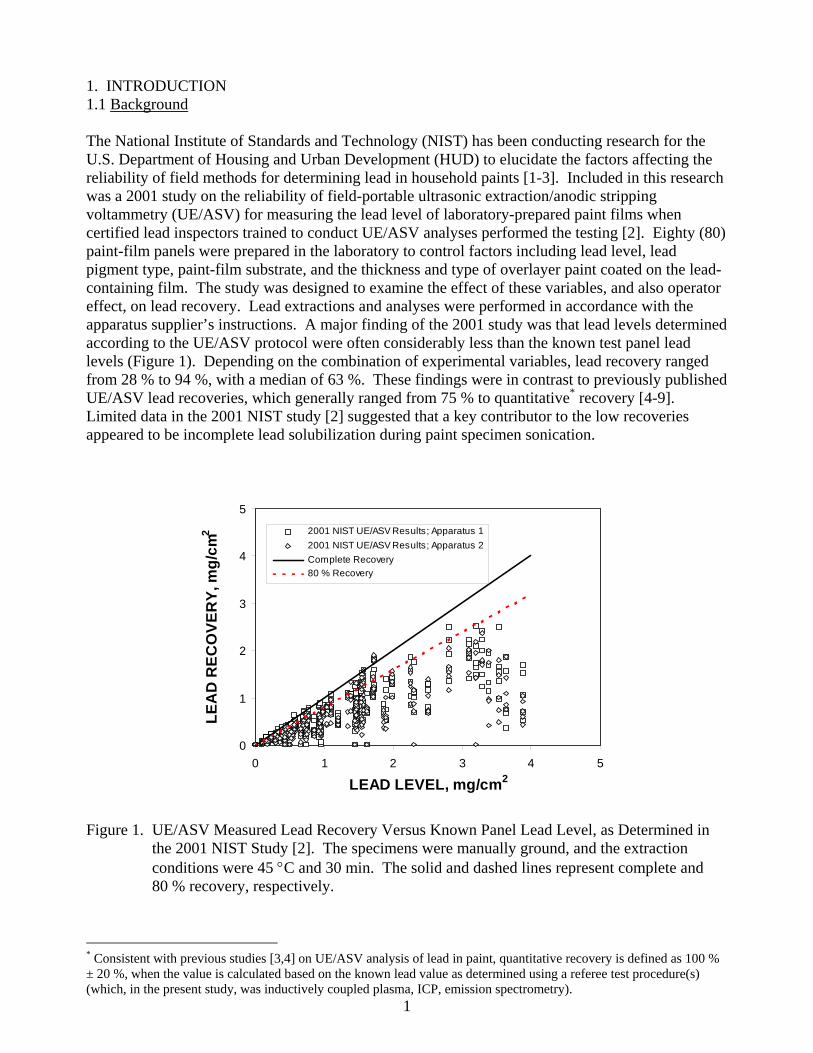
1. INTRODUCTION 1.1 Background The National Institute of Standards and Technology (NIST) has been conducting research for the U.S. Department of Housing and Urban Development (HUD) to elucidate the factors affecting the reliability of field methods for determining lead in household paints [1-3]. Included in this research was a 2001 study on the reliability of field-portable ultrasonic extraction/anodic stripping voltammetry (UE/ASV) for measuring the lead level of laboratory-prepared paint films when certified lead inspectors trained to conduct UE/ASV analyses performed the testing [2]. Eighty (80) paint-film panels were prepared in the laboratory to control factors including lead level, lead pigment type, paint-film substrate, and the thickness and type of overlayer paint coated on the lead-containing film. The study was designed to examine the effect of these variables, and also operator effect, on lead recovery. Lead extractions and analyses were performed in accordance with the apparatus supplier’s instructions. A major finding of the 2001 study was that lead levels determined according to the UE/ASV protocol were often considerably less than the known test panel lead levels (Figure 1). Depending on the combination of experimental variables, lead recovery ranged from 28 % to 94 %, with a median of 63 %. These findings were in contrast to previously published UE/ASV lead recoveries, which generally ranged from 75 % to quantitative* recovery [4-9]. Limited data in the 2001 NIST study [2] suggested that a key contributor to the low recoveries appeared to be incomplete lead solubilization during paint specimen sonication.
Figure 1. UE/ASV Measured Lead Recovery Versus Known Panel Lead Level, as Determined in
the 2001 NIST Study [2]. The specimens were manually ground, and the extraction conditions were 45 °C and 30 min. The solid and dashed lines represent complete and 80 % recovery, respectively.
* Consistent with previous studies [3,4] on UE/ASV analysis of lead in paint, quantitative recovery is defined as 100 % ± 20 %, when the value is calculated based on the known lead value as determined using a referee test procedure(s) (which, in the present study, was inductively coupled plasma, ICP, emission spectrometry).
0
1
2
3
4
5
0 1 2 3 4 5
LEAD LEVEL, mg/cm2
LEA
D R
ECO
VER
Y, m
g/cm
2 2001 NIST UE/ASV Results; Apparatus 1 2001 NIST UE/ASV Results; Apparatus 2 Complete Recovery 80 % Recovery

2
0
20
40
60
80
100
High Long
High Short
Low Long
Low Short
High Long
High Short
Low Long
Low Short
LEA
D R
ECO
VER
Y, %
Particle Size: Small Particle Size: Large
T emp:
T ime:
Understanding why the UE method used in the NIST UE/ASV study resulted in low lead recovery is important for practical use of ASV in the field. Consequently, NIST conducted a follow-up study in 2002 [3]. Five experimental variables⎯sonicator power, specimen mass, specimen particle size, sonication temperature, and sonication time⎯were systematically varied in a controlled two-level full factorial experiment. Three significant main effects⎯small particle size*, high sonication temperature, and long sonication time⎯were found along with two interaction effects⎯particle size with temperature and particle size with time. Small particle size was achieved by freezer mill grinding; high temperature and long time were 65 °C† and 90 min, respectively. The effect of particle size on lead recovery was quite strong⎯when the particle size was small (< 425 μm), mean lead recovery was quantitative (i.e., 100 % ± 20 %) regardless of the conditions of sonication temperature and sonication time (Figure 2). In contrast, when the particle size was large (achieved by manual grinding after dry-ice cooling of the specimen), the mean recovery was quantitative only in the case of high sonication temperature and long sonication time. The lowest recoveries (Figure 2) were obtained for the combination of large particle size, low sonication temperature (45 °C‡) and short sonication time (30 min). The 45 °C and 30 min extraction conditions, which are given in the UE/ASV supplier’s instructions, are relatively convenient. Consequently, they are generally used in practice for the UE/ASV analysis of lead in paint. In the 2001 NIST study [2], the 45 °C and 30 min extractions conditions produced the low lead recoveries from the laboratory-prepared paint-film panels (Figure 1). Figure 2. Lead Recovery for the Combinations of Specimen Particle Size, Sonication Time, and
Sonication Temperature, as Determined in the 2002 NIST Study [3]. Small particles are < 425 μm, with the majority < 180 μm; whereas large particles are, for the most part, > 425 μm, with the majority > 850 μm. Low and high sonication temperatures are 45 °C and 65 °C, respectively. Short and long sonication times are 30 min and 90 min, respectively. The error bars represent one standard deviation.
* For purposes of the NIST study, “small particle” size was designated as less than 425 μm, with the majority (≈ 60 %) of particles produced by freezer-mill grinding being less than 180 μm [3]. In contrast, “large particle” size was, for the most part, greater than 425 μm with the majority being greater than 850 μm. † High temperature extraction was performed within the range of 62 °C to 67 °C. This range is designated as 65 °C in the present report. ‡ Low temperature extraction was performed within the range of 42 °C to 47 °C. This range is designated as 45 °C in the present report.

3
1.1.1 Preliminary Recommendation on UE Temperature and Time for Field Analysis. The finding that extraction conditions of large particle size, high sonication temperature and long sonication time produced quantitative lead recovery provided important clues for improving lead extraction efficiency. In cases where paint samples cannot be manually ground to small particle size, extraction conditions of high sonication temperature and long sonication time should help to ensure quantitative lead recovery. In the 2002 NIST study, a recommendation was proposed to estimate particle size of the ground specimen as the basis for selecting an appropriate combination of sonication temperature and time [3]. The recommendation was that the ground paint specimen should first be visually compared with a reference powder (such as another paint film or black pepper*) known to pass through a No. 40, 425 μm mesh sieve. Based on this comparison, the appropriate combination of sonication temperature and time would be selected as follows:
• When the particle sizes of the ground paint-film specimen and the reference powder appear comparable, extraction would proceed at 45 °C and 30 min.
• When the particle size of the ground paint-film specimen appears to be slightly larger than that of the reference powder, the extraction conditions would be 65 °C and 90 min.
• When the particle size of the ground paint-film specimen is seen to be considerably larger than the reference powder, field extraction would only be performed if it would be carried out for a relatively long time (i.e., at least 4.5 h). If such a time period was unacceptable, then extraction would be conducted in a laboratory using a method other than sonication.
• When the comparison of the ground paint specimen and reference powder was inconclusive precluding a visual estimation of particle size, then the UE/ASV analyst would select the extraction conditions only after sieving a surrogate ground paint-film specimen to estimate its particle size†.
It was recommended that the ground specimen taken for ASV analysis not be sieved [3], because sieving might cause specimen loss or contamination. As an alternative, it was recommended that another paint-film specimen (i.e., a surrogate specimen) be removed from a location adjacent to the specimen taken for analysis. After manual grinding, this surrogate specimen would be sieved using No. 20 and No. 40 sieves (850 μm and 425 μm meshes, respectively). The extraction conditions would be based on the sieve analysis:
• If the particles pass through a No. 40 sieve, then extraction would be performed at 45 °C and 30 min.
• If the particles pass through a No. 20 sieve but not a No. 40 sieve, then extraction would be performed at 65 °C and 90 min.
• If some particles do not pass through a No. 20 sieve, then field sonication time would be lengthened to 4.5 h.
The preliminary recommendation was based on limited data developed from UE/ASV tests of specimens obtained from the NIST laboratory-prepared paint-film panels. As a consequence, the NIST authors [3] suggested that the recommendation be the subject of further study including extraction and analysis of field paint-film samples.
* The use of ground black pepper as a reference powder was initially proposed by ASTM Subcommittee E06.23 on Lead Hazards Associated with Buildings. † In making the recommendation to base particle size estimation on the results of sieving, it was considered that a field sieve analysis could be performed with minimal increase in the time required for an UE/ASV analysis. Relatively small sieves (75 mm diameter) are available that can be readily transported with the UE/ASV apparatus.

4
1.2 Objective and Scope This report presents the results of a HUD-sponsored study to evaluate the reliability and practicality of the 2002 NIST recommendation on estimating specimen particle size before conducting an UE/ASV field analysis, and to improve the recommendation, if warranted. The study was performed in two phases. In the laboratory phase, lead-containing paint-film panels were prepared from 16 commercial paints. The “true” lead levels of these paint-films were characterized by digestion of specimens sampled from the panels followed by inductively coupled plasma (ICP) emission spectrometry analyses of the digestion solutions. For the experiments associated with particle size estimation, lead analysis was conducted using UE/ASV, and percent recovery was determined in relation to the ICP analyses. Factors examined were: grinding method, sonication temperature, sonication time, and paint manufacturer, type, binder, and gloss. In the field phase, NIST research staff, or certified lead inspectors and risk assessors trained to perform UE/ASV analyses, sampled lead-containing paint from houses and similar buildings. These field samples were returned to the NIST laboratories for UE/ASV analysis. Extraction of both laboratory-prepared and field specimens was performed using a sonicator* at temperatures and times selected after estimating the particle size of the manually ground specimen. 2. EXPERIMENTAL 2.1 UE/ASV Apparatus A commercial, field-portable UE/ASV apparatus† was used in this study. It was designated Apparatus 1 in the 2001 NIST UE/ASV study [2]. 2.1.1 ASV Instrument. The field-portable ASV instrument is battery operated, uses disposable electrodes, and is factory-calibrated. Results of lead analysis for paint specimens are given in units of either milligrams per centimeter squared (mg/cm2) or milligrams (mg). The limit of detection for lead in paint reported in the supplier’s instruction booklet is 0.04 mg/cm2 or 0.02 mg. Factory calibration was checked in the previous NIST UE/ASV studies using six standard solutions of lead nitrate in 2.5 % (volume fraction) nitric acid [2,3]. Because the results of the lead analyses of the test panels were generally recorded in mg/cm2, the calibration checks were conducted in units of mg/cm2. The six standard solutions (lead contents ranging from 1 mg/L to 50 mg/L) covered a concentration range corresponding to an ASV range of 0.1 mg/cm2 to 5 mg/cm2, which bracketed the lead levels of the laboratory-prepared paint-film panels. A repeat calibration check performed at the beginning of the current study using six standard lead nitrate solutions confirmed that the instrument remained in calibration; the ASV response versus lead concentration was linear (r2 = 0.998). In addition, two calibration checks were normally performed at the beginning and end of each day’s analyses using one of the six standard solutions of lead nitrate in 2.5 % nitric acid. These checks confirmed that the ASV instrument was in calibration, and that instrument drift did not occur over the course of testing. Exception to the two-calibration checks per day was made when only a few UE/ASV analyses (normally less than 6) were performed. In this case, a single
* It was found during the 2002 NIST UE/ASV study [3] that lead extractions of specimens from a limited number of the NIST paint-film panels, and also from reference material samples, gave comparable lead recoveries when performed with and without ultrasound under the same conditions of temperature and time. It was, nevertheless, recommended that use of sonicators is acceptable for lead extraction in the field, as they provide for a practical and generally affordable means of agitating and heating specimens during lead extraction. Consequently, a sonicator was used in the present study. † In this report, the term, “apparatus,” refers to the combination of UE sonicator and ASV electrochemical instrument that was purchased from a single supplier as part of a field-portable kit. For the individual pieces of equipment, the terms, “[UE] sonicator” and “[ASV] instrument” are used.

5
calibration check was carried out. The uncertainty of the ASV measurements, estimated from published data on analyzing lead in Standard Reference Material (SRM) 1579, is ± 10 % [4]. 2.1.2 Sonicator. The commercial sonicator is specified as having 45 W average power. The bath dimensions are 146 mm by 133 mm by 100 mm (length, width, and depth). A set of seven specimens can be simultaneously extracted using this sonicator. 2.2 UE/ASV Test Protocol All UE/ASV analyses were conducted in the NIST laboratories. The test protocol [2] was in accordance with the instructions provided by the UE/ASV supplier. This protocol entails: sampling the paint-film from its substrate, manually grinding the specimen in a 50 mL plastic centrifuge tube, covering the specimen with 5 mL of 25 % (volume fraction) nitric acid, extracting the lead using a sonicator, and analyzing the extract for lead using ASV. All manually ground specimens were cooled for 2 min to 4 min using dry ice prior to grinding, and again during grinding as needed. Such cooling was used throughout the previous NIST studies and is intended to embrittle the specimens and, thus, assist grinding [2,3,6]. In the current study, specimens were also mechanically ground for about 5 min at liquid nitrogen temperatures using a freezer mill (Spex Model 6700*). Consistent with the 2002 NIST recommendation for selecting UE temperature and time based on particle size (Section 1.1.1), the sonicator was operated at one of two temperature-time combinations: (1) 45 °C and 30 min, and (2) 65 °C and 90 min. The sonicator was not equipped with temperature control. Consequently, for a 30 min extraction, the 45 °C temperature was achieved by filling the sonicator bath with warm tap water. When the total extraction time was 90 min, the bath was filled with preheated water to achieve the 65 °C temperature. During 30 min of operation, the water cooled about 3 °C to 4 °C. Thus, to maintain the 65 °C temperature, about a quarter of the cooled bath water was replaced with heated water after each 30 min period. 2.3 Paint-Film Samples 2.3.1 Laboratory-Prepared Paint-Film Panels. Paint-films having lead levels of approximately 1.8 mg/cm2 and thickness of approximately 75 μm were available from a previous NIST study [1]†. Two of these paint films had been prepared on thin (75 μm) Mylar sheets. One other was prepared on a sheet of release paper. These paint-films were cut into 150 mm by 175 mm sections from which 4 paint-film panels were prepared. It was assumed that each of the four panels had a uniform lead level across the paint-film area. For Panel Nos. 1 through 3, the Mylar backing of the films were adhered to plywood substrates using spray adhesive (Elmer’s E-451). For Panel No. 4, the exposed paint surface of a release-paper backed paint film was adhered to a drywall substrate using the spray adhesive. The release paper was subsequently removed from the paint-film panel. After allowing the spray adhesive to cure overnight, the lead-containing paint films on each of the four panels were divided into four quadrants using 13 mm wide masking tape. Each of the resulting 16 quadrants (i.e., 4 panels each having 4 quadrants) was overcoated by brush with eight layers of
* Certain trade names or company products are mentioned in the text to specify adequately the experimental procedure and equipment used. In no case does such identification imply recommendation or endorsement by the National Institute of Standards and Technology, nor does it imply that the equipment is the best available for the purpose. † These paint films were prepared during a prior NIST study on evaluating spot tests for detecting lead in household paint. For details regarding preparation of these films, the reader is referred to NISTIR 6398 [1].

6
one of 16 typical household paints. Experimental variables were paint manufacturer, paint type, binder type, and gloss level (Table 1). Consistent with current use of household paint, the 12 quadrants (i.e., 75 %) of the plywood panels were overcoated with high or low gloss latex paint having either an acrylic-based or vinyl-based binder. The 4 quadrants of the drywall panel were overcoated with high or low gloss oil-based (alkyd) paint. A sample of each of the 16 paints was sent to a National Lead Laboratory Accreditation Program (NLLAP) [10] accredited laboratory for lead analysis. In all cases, the lead content was less than the regulatory allowed limit of 0.06 % (mass fraction), based on paint solids*. In overcoating the lead-containing films, each layer of commercial paint was applied at the beginning of the workday. The wet-film coated panels were kept at room temperature (22 °C) for 6 h to 7 h, after which they were placed in an oven overnight (approximately 16 h) at 70 °C ± 2 °C. Upon removal from the oven, the panels cooled to room temperature before receiving the next Table 1. Descriptions of the laboratory-prepared paint film panels
Panel Lead LevelaSample
Designation Panel
Number Panel
Quadrant Panel
SubstratePaint
Manufacturer Paint Type
Binder Type
Gloss Level mg/cm2 CoVb
L1-1-1-1 1 1 Plywood 1 Latex Acrylic Low 1.57 1.8 %
L1-1-1-2 2 1 Latex Acrylic High
L1-1-2-1 3 1 Latex Vinyl Low
L1-1-2-2 4 1 Latex Vinyl High
L2-1-1-1 2 1 Plywood 2 Latex Acrylic Low 1.55 6.5 %
L2-1-1-2 2 2 Latex Acrylic High
L2-1-2-1 3 2 Latex Vinyl Low
L2-1-2-2 4 2 Latex Vinyl High
L3-1-1-1 3 1 Plywood 3 Latex Acrylic Low 1.62 13.5 %
L3-1-1-2 2 3 Latex Acrylic High
L3-1-2-1 3 3 Latex Vinyl Low
L3-1-2-2 4 3 Latex Vinyl High
L1-2-3-1 4 1 Dry Wall 1 Oil Alkyd Low 1.71 10.4 %
L1-2-3-2 2 1 Oil Alkyd High
L2-2-3-1 3 2 Oil Alkyd Low
L2-2-3-2 4 2 Oil Alkyd High a Based on the mean of three measurements for each panel. b CoV indicates coefficient of variation; CoV = (standard deviation/mean) x 100.
* For all specimens, the lead contents were reported as < 0.012 % (mass fraction).

7
overcoat layer. After application of the final overcoat, a grid was inscribed onto each quadrant surface. The paint-film specimens were removed from the panels from a randomly selected section of the grid. In measuring the lead level of each of the four panels, three 21 mm diameter paint-film disks were randomly sampled from each panel using a circular punch attached to a milling machine. Each disk was weighed on an analytical balance, and mechanically ground for about 5 min at liquid nitrogen temperature using the freezer mill. The ground samples were sent to a NLLAP laboratory for lead extraction using a digestion procedure (EPA* Method 3050B [11]) followed by lead analysis of the digestion solution using ICP (EPA Method 6010B [12]). The lead levels determined for each of the four panels are given in Table 1. 2.3.2 Field Samples. NIST research staff and four certified lead inspectors and risk assessors sampled paint films, known to contain lead, from the interiors of vacant row houses in Baltimore, MD. These houses were awaiting rehabilitation, and little maintenance had been performed on the painted surfaces in recent years. NIST research staff also sampled lead-containing paint films from exteriors and interiors of well-maintained buildings of a Department of Defense facility in Monterey, CA. In the case of three Monterey buildings (Nos. 1 through 3), lead-hazard abatement had been performed by overcoating the lead-containing paint films with encapsulant coatings applied within 7 months or less before sampling. The fourth and fifth buildings had been painted about 2 weeks and 2 years, respectively, before sampling. The field samples had wooden substrates except one Baltimore sample that had a plaster substrate. The amount of lead in the field samples was unknown and needed to be determined by a referee test method. After conducting an UE/ASV analysis of a field specimen, the UE extract solution was decanted in 10 mL portions through a 10 mL disposable syringe to which was attached a disposable 0.45 μm hydrophilic polytetrafluoroethylene (PTFE) filter cassette (Millipore Millex LCR). In this manner, the extract was separated and filtered from undissolved paint-film residue remaining in the centrifuge tube (Section 2.2) used for the UE/ASV analysis. After filtering the entire UE extract solution, the PTFE filter was removed from its cassette and placed in the centrifuge tube. An aliquot (approximately 20 mL) of the filtered UE extract along with the centrifuge tube was sent to an NLLAP laboratory for lead analysis. Lead in the paint-film residue and on the PTFE filter was extracted by digestion using EPA Method 3050B [11]. Lead in the digestion solution and UE extract solution was determined using ICP according to EPA Method 6010B [12]. The total lead (i.e., UE extract and residue/filter) determined by the NLLAP laboratory was taken as the “true” lead level of the field paint-film specimen. Thus, the percent lead recovery (LR %) determined by an UE/ASV analysis was calculated as: LR % = [(Results of UE/ASV Analysis)/(Total Lead by NLLAP Analyses) x 100]. 2.3.3 Sampling Procedure. The UE/ASV supplier’s instructions were followed in removing the paint-film samples from their substrates in both the laboratory and the field. Using a 7.9 mm (inside diameter) No. 4 cork borer, a circle was inscribed through the paint film to the substrate. With the cork borer pressed into the paint film, any loose chips surrounding the cork borer were brushed aside. A sheet of “self-stick sample collection paper” (3M Post-it Notes) was adhered on the paint-film surface next to the cork borer, which was then carefully removed from the paint film such that loose paint chips fell onto the collection paper. Any paint sample remaining within the cork borer was dislodged onto the paper using the wooden end of a 150 mm long cotton-tipped swab. * U.S. Environmental Protection Agency.

8
In the case of the field samples, some paint within the inscribed circle generally remained on the wooden substrate and was scraped onto the collection paper using the blade of a utility knife. All material on the collection paper was transferred to a 50 mL plastic, screw-cap centrifuge tube for UE/ASV analyses. In sampling the laboratory-prepared samples, a specimen “plug,” held within the cork borer, was generally removed from the panel. No additional paint was left on the substrate. The “plug” generally consisted of the paint film adhered to either the Mylar backing from the plywood panels (Nos. 1 through 3) or some cardboard facing from the dry wall panel (No. 4). The Mylar backing or cardboard* was removed from the specimen using a utility knife. Moistening the cardboard with 2 to 3 drops of distilled water eased its removal. 2.4 Specimen Mass, Thickness, and Sieving Specimen mass was determined using an analytical balance (Mettler Model AT201) having a sensitivity of 0.01 mg. Specimen thickness was measured using calipers (Mitutoyo Model No. CD-8C) having a resolution of 0.01 mm. The uncertainties of the mass and thickness on a single specimen were estimated to be ± 0.1 % and ± 5 %, respectively. The sieving of manually ground specimens was performed using No. 20 and No. 40 sieves (Tyler Inc.) having mesh sizes of 850 μm and 425 μm, respectively. The uncertainty in the sieve measurements (i.e., mass of specimen passing through the sieve) was estimated to be ± 6 %. 3. RESULTS, ANALYSIS, AND DISCUSSION 3.1 Laboratory-Prepared Paint-Film Panels Before performing UE/ASV analyses, the mass and thickness of typical specimens sampled from the paint-film panels using the cork borer were determined. Mean mass and thickness for the different paint-film samples varied by a factor slightly greater than 2, and ranged from 62 mg to 138 mg, and 0.75 mm to 1.8 mm, respectively (Table 2). Previous NIST research has indicated that specimens having such mass and thickness are acceptable for UE/ASV analysis. The maximum mean mass, 138 mg (Sample L3-1-1-1 in Table 2), was below the maximum limit suggested by the UE/ASV supplier, whose instructions state that specimen mass should not exceed 200 mg†. Before performing UE/ASV analysis, a “Directive” for following the 2002 NIST recommendation on selecting the UE temperature and time on the basis of the estimated particle size of the ground specimen (Section 1.1.1) was developed (Table 3). The Directive differs from the recommendation in Section 1.1.1 in that, for specimens that are too large to pass through a No. 20 sieve, extraction using a sonicator is not performed. An extraction time of 4.5 h was considered to be impractical for the study. Such specimens can be analyzed using another procedure such as hotplate or microwave digestion. One specimen from each laboratory-prepared paint-film sample was ground manually. Grinding was difficult, and the resultant particle sizes were generally large. In visually comparing the ground specimens with a reference powder (i.e., black pepper known to pass through a No. 40 sieve), many of the particles appeared too large to pass through a No. 20 sieve. In accordance with the Directive
* An exception was Sample L2-2-3-1, which crumbled when sampled from the drywall panel. In this case, UE/ASV analysis was conducted with the cardboard present. † The limitation on specimen mass (i.e., 200 mg) is only given in the ASV supplier’s instructions for analyses for which results are to be reported as percent lead by mass fraction. These instructions indicate that, for results to be reported in mg/cm2, the sample collected is to be sonicated.

9
Table 2. Characterization of the mass, thickness, and sieving of laboratory-prepared paint-film samplesa
Mass Thickness Sieve Resultsc,d Sample Design. Meanb, mg CoV, % Meanb, mm CoV, % % Passing No. 20 % Passing No. 40
L1-1-1-1 92 6.7 1.1 9.1 21 14 L1-1-1-2 60 5.2 0.79 4.7 15 8 L1-1-2-1 83 11 1.3 16 46 24 L1-1-2-2 62 8.5 0.75 7.0 9 3 L2-1-1-1 ---e --- --- --- --- --- L2-1-1-2 75 3.8 1.0 7.5 8 5 L2-1-2-1 117 3.0 1.5 4.8 1 0 L2-1-2-2 64 8.2 0.99 14 21 8 L3-1-1-1 138 3.6 1.8 4.7 6 4 L3-1-1-2 64 4.0 0.79 3.9 11 2 L3-1-2-1 82 6.3 1.2 5.5 45 22 L3-1-2-2 74 9.8 0.87 9.7 2 2 L1-2-3-1 122 7.4 1.2 15 70 45 L1-2-3-2 64 3.5 0.77 7.3 65 20 L2-2-3-1 ---f --- --- --- --- --- L2-2-3-2 65 7.1 0.79 10 63 16
a The mass and thickness measurements were performed on unground specimens; whereas the sieving was carried out on manually ground specimens. b Mean of six measurements. c Results of sieving one specimen only; they were taken as an indication of the ease of grinding the sample. d The No. 20 and No. 40 sieves have mesh size of 850 μm and 425 μm, respectively. e The dash indicates that analyses were not performed for this sample; in this case, the paint-film could not be removed from the Mylar backing. f The dash indicates that analyses were not performed for this sample; in this case, the specimen crumbled when removed from the drywall panel, which precluded removal of the cardboard backing. Table 3. Directive for selecting the extraction temperature and time based on estimating the particle
size of the ground specimen 1. Visually compare the particle size of the ground specimen with that of the black pepper reference powder having a
particle size < 425 μm. 2. If particles appear: Then select these sonicator conditions:
• Small enough to pass a No. 40 sieve (425 μm mesh) 45 °C temperature and 30 min time • Small enough to pass a No. 20 sieve (850 μm mesh), but
too large to pass a No. 40 sieve 65 °C temperature and 90 min time
• Too large to pass a No. 20 sieve Do not extract using the sonicatora
• Indeterminate; particle size cannot be visually judged Obtain a second specimen, manually grind it, and then sieve it (step 3 below)
3. When warranted, sieve the second specimen through a No. 20 and a No. 40 sieve; select the sonicator conditions depending on whether the particles pass each sieve in accordance with the criteria given in step 2 above.
a In such cases, extraction would be conducted using another method such as hotplate or microwave digestion.

10
(Table 3), such specimens should not be extracted using a sonicator. However, because these specimens were being tested as part of the research project on the reliability and practicality of the recommendation in Section 1.1.1, UE/ASV analysis and sieving were performed. One specimen from each paint-film sample was sieved through both the No. 20 and No. 40 sieves to estimate particle size. The results of the sieving (Table 2) supported the observation that the specimens were difficult to grind and the resultant particle sizes were relatively large. Observe in Table 2 that, for about 80 % of the specimens sieved, less than 50 % of the mass passed through a No. 20 sieve. Moreover, in no case did the percent mass passing through a No. 40 sieve surpass 50 %. In contrast, for specimens that were well ground using a freezer-mill, all particles passed through a No. 40 sieve. UE/ASV analyses using each of three combinations of extractions conditions were conducted on two specimens sampled from each of the paint-film panels:
Extraction Grinding Sonication Sonication
Conditions Method Temperature Time No. 1 Freezer-Mill (FM) 45 °C 30 min No. 2 Manual (MG) 65 °C 90 min No. 3 Manual (MG) 45 °C 30 min The results are given in Table 4. Note in this table that, for Sample L3-1-1-1 and Sample L1-2-3-1 analyzed using Extraction Conditions No. 2, the data tabulation includes a value listed parenthetically. In these two cases, the originally determined lead recovery was quite low (approximately 20 %) in comparison to the other recoveries obtained under Extraction Conditions No. 2. The low lead recoveries for Sample L3-1-1-1 and Sample L1-2-3-1 were considered to be outliers, defined as values that were more than three standard deviations distant from the mean lead recovery determined under Extraction Conditions No. 2. Consequently, an additional specimen for Sample L3-1-1-1 and Sample L1-2-3-1 was subjected to UE/ASV analysis using Extraction Conditions No. 2. The lead recoveries for the additional analyses are included parenthetically in Table 4. Data analysis was first performed using lead recoveries that included the low, but excluded the parenthetical, values for Sample L3-1-1-1 and Sample L1-2-3-1. A second analysis followed using lead recoveries that included the parenthetical, but excluded the low, values for these two samples. The results of the two analyses showed no major differences, and lead to the same overall conclusions. Thus, presentation of the data analysis is only given for the lead recoveries that included the parenthetical values for Sample L3-1-1-1 and Sample L1-2-3-1. The reason(s) for the low lead recoveries for these two samples was not determined. Figure 3 shows plots of lead recovery versus sample designation for the three sets of extraction conditions. The effect of the extraction conditions is quite evident (statistical analyses follow below). For Extraction Conditions No. 1 (Figure 3A), with one exception, the recoveries were quantitative and, in the case of the exception, recovery was 79 %. For Extraction Conditions No. 2 (Figure 3B), the majority (90 %) of recoveries was quantitative and the lowest value was approximately 70 %. In contrast, for Extraction Conditions No. 3 (Figure 3C), only three recoveries (or 10 % of the total) were quantitative and, for these three data points, the highest value was 84 %.

11
Table 4. Results of the UE/ASV analyses of the laboratory-prepared paint-film samplesa
Extraction Conditions No. 1 Extraction Conditions No. 2 Extraction Conditions No. 3 Grinding Temp. Time Grinding Temp. Time Grinding Temp. Time FMb 45 °C 30 min MGc 65 °C 90 min MGc 45 °C 30 min
Lead Recovery, % Lead Recovery, % Lead Recovery, % Sample Design. Rep. 1d Rep. 2 Rep. 1 Rep. 2 Rep. 1 Rep. 2
L1-1-1-1 102.9 104.7 105.4 112.1 68.8 77.8 L1-1-1-2 93.3 96.3 99.0 107.8 56.4 69.8 L1-1-2-1 99.3 99.5 98.2 90.3 67.4 73.1 L1-1-2-2 98.9 92.9 77.8 80.9 55.3 53.0
L2-1-1-1 ---e --- --- --- --- --- L2-1-1-2 98.0 95.5 107.9 84.9 55.9 56.8 L2-1-2-1 91.3 116.5 81.2 92.5 42.5 40.1 L2-1-2-2 112.2 110.7 90.0 98.7 57.9 54.7
L3-1-1-1 96.8 107.3 82.8 22.7 (112.5)f 42.7 83.8 L3-1-1-2 96.1 95.3 102.4 68.6 80.0 45.2 L3-1-2-1 99.0 100.0 106.6 83.1 67.4 66.7 L3-1-2-2 88.1 97.1 95.2 80.0 53.1 51.1
L1-2-3-1 86.8 91.8 18.3 (101.8)f 92.4 54.2 70.9 L1-2-3-2 84.3 79.3 76.0 80.9 49.8 51.5 L2-2-3-1 81.5 83.2 87.7 90.4 81.1 65.0 L2-2-3-2 89.3 86.8 95.9 83.3 79.2 69.4
a Temp and time refer to the UE extraction temperature and time. b FM indicates freezer-mill grinding at liquid nitrogen temperatures for 5 min. c MG indicates manual grinding at dry ice temperatures. d Rep indicates replicate; two replicate specimens were subjected to UE/ASV analyses for each set of extraction conditions. e The dash indicates that analyses were not performed for this sample; the paint-film could not be removed from the Mylar backing. f Value in parentheses represents the results of a repeat measurement. Analysis of variance of the lead recovery was performed to evaluate the effect of the experimental parameters, i.e., paint manufacturer, paint type, binder type, gloss level, and extraction conditions. Because the data set was highly unbalanced with respect to paint type, the most complete analysis was performed using the data for latex paints. The results are summarized in Table 5. A measure of how unlikely an observed effect is due to chance is provided by the p-value. Conventionally, effects that have p-values less than 0.05 are considered to be statistically significant. The summary in Table 5 shows that extraction condition was highly significant. Gloss level and binder type were respectively considered to be marginally significant and insignificant, particularly in comparison to the highly significant effect of extraction condition. There was no effect of a two-way interaction of gloss level and binder type. In addition, no effect due to paint manufacturer was found. Because the effect of gloss level was marginal, no practical significance was attributed to the finding. The highly significant parameter, extraction condition, incorporates three factors: grinding method, extraction temperature and extraction time. Further analysis of variance was performed to examine the effect of these factors, although temperature and time were examined as a combined, single variable for the pairs of extraction conditions, 65 °C and 90 min and

12
Figure 3. Lead Recovery for the Laboratory-Prepared Paint-Film Samples as Related to Extraction
Conditions. Two analyses were conducted for each paint-film sample for each set of extraction conditions. Adjacent sets of bars represent the replicate data. Three sets of extraction conditions were used: (A) freezer-mill grinding with sonication at 45 °C and 30 min, (B) manual grinding with sonication at 65 °C and 90 min, and (C) manual grinding with sonication at 45 °C and 30 min.
Manual Grind, 45 oC, 30 min
0
20
40
60
80
100
120
L1-1-
1-1
L1-1-
1-2
L1-1-
2-1
L1-1-
2-2
L2-1-
1-2
L2-1-
2-1
L2-1-
2-2
L3-1-
1-1
L3-1-
1-2
L3-1-
2-1
L3-1-
2-2
L1-2-
3-1
L1-2-
3-2
L2-2-
3-1
L2-2-
3-2
LEA
D R
ECO
VER
Y, %
OilLatex (C)
SPECIMEN DESIGNATION
Freezer Mill Grind, 45 oC, 30 min
0
20
40
60
80
100
120
LEA
D R
ECO
VER
Y, % OilLatex (A)
Manual Grind, 65 oC, 90 min
0
20
40
60
80
100
120
LEA
D R
ECO
VER
Y, % OilLatex (B)

13
Table 5. Analysis of variance on lead recovery for the laboratory-prepared paint-film samples prepared with latex paint
Analysis Resultsa
Effects F-Statistic P-Valueb
Paint Manufacturer 0.5944 0.5552 Binder Type 3.8758 0.0538 Gloss Level 4.3333 0.0418 Extraction Condition 88.8509 0.0000 Binder Type-Gloss Level Interaction 0.4949 0.4846
a Data set is from Table 4 using parenthetical, but excluding low, values for Sample L3-1-1-1 and Sample L1-2-3. b Values 0f 0.0000 indicate an extremely small probability that the effect is due to chance. 45 °C and 30 min. Gloss level and binder type were also included in this analysis, because these two factors were found to be marginally significant (or insignificant) in the first analysis. The results of the further analyses are given in Table 6. Grinding method and temperature/time combination were both highly significant. In the case of gloss level and binder type, the results mirrored those in Table 5, notably that the effects of the two parameters were considered marginally significant and insignificant, respectively, in comparison to the effects of grinding method and combined temperature and time. Box plots (Figure 4) were used to illustrate the magnitudes of the effects given in Table 6. Figure 4A is for grinding method, and shows the effect of freezer mill grinding versus manual grinding. Recall that, as discussed above, freezer-mill grinding yielded relatively small particles, whereas manual grinding provided relatively large particle size. In Figure 4A, the shaded boxes represent the range of recovery for 50 % of the data points. The white line in each shaded box indicates the median recovery. The brackets (often called “whiskers”) above and below the box represent the smallest and largest points except for the outliers*, which are represented by solid lines. It is evident in Figure 4A that freezer-mill grinding (i.e., small particles) resulted in significantly higher recovery. The size of the box and spread of the whiskers indicate the influence of the other experimental factors examined (i.e., combined time and temperature, gloss, and binder) on the recovery. In this case, the relatively small box shows that the high lead recovery for freezer-mill grinding was generally unaffected by the other four factors. Figure 4B shows the effect of combined temperature and time. In this case, lead recovery was less under 45 °C and 30 min extraction, and was more affected by the other factors included in the analyses, than that determined under 65 °C and 90 min extraction. Figures 4C and 4D are for binder and gloss. Differences in lead recovery due to gloss level or binder type are not nearly as pronounced as differences due to grinding method or combined temperature and time extraction conditions. To examine the effect of paint type on lead recovery, analysis of variance was run using the data for both latex and oil-based paints. Two factors, paint manufacturer and the two-way interaction of gloss level and binder type, were not included because both were not significant in the previous analyses of the latex data. The results of the analysis addressing paint type are given in Table 7. Paint type was marginally significant, and no practical importance was attached to the finding. As is evident from Figure 3, latex paint generally yielded higher recovery than oil-based paint when the * Outliers identified in developing the box plots (Figure 4) were included in the analyses of variance.

14
Table 6. Analysis of variance on lead recovery for the laboratory-prepared paint-film samples prepared with latex paint; grinding method and combined temperature and time were the primary factors examined
Analysis Resultsa
Effects F-Statistic P-Valueb
Binder Type 3.8923 0.0530 Gloss Level 4.3676 0.0408 Grinding Method 112.1207 0.0000 Combined Temperature and Time 156.4353 0.0000
a Data set is from Table 4 using parenthetical, but excluding low, values for Sample L3-1-1-1 and Sample L1-2-3. b Values 0f 0.0000 indicate an extremely small probability that the effect is due to chance.
Table 7. Analysis of variance on lead recovery for all laboratory-prepared paint-film samples; paint type was the primary factor examined
Analysis Resultsa
Effects F-Statistic P-Valueb
Paint Type 4.2177 0.0431 Binder Type 3.8623 0.0527 Gloss Level 5.7360 0.0188 Grinding Method 160.1864 0.0000 Combined Temperature and Time 128.3356 0.0000
a Data set is from Table 4 using parenthetical, but excluding low, values for Sample L3-1-1-1 and Sample L1-2-3. b Values 0f 0.0000 indicate an extremely small probability that the effect is due to chance.
specimens were ground using the freezer-mill. In contrast, due to the variability in the data, little difference in recovery was observed between the latex and oil-based paints when the specimens were ground manually. As found for the latex paint analyses, extraction condition, as determined by grinding method and the temperature-time combination, was highly significant. Gloss level was also significant, but the effect was considered to be minor in comparison to the highly significant, major effects of grinding method and combined temperature and time. In summary, the statistical analyses of the UE/ASV measurements of the laboratory-prepared paint-film panels indicated that, by far, the most important factor affecting lead recovery was extraction condition as defined by the grinding method, extraction temperature, and extraction time. Effects of other factors associated with the paint, such as manufacturer, type, gloss level and binder type, when found significant, were generally marginal in comparison. Consequently, the recovery data were averaged for each of the three sets of extraction conditions and plotted (Figure 5) to show the overall effect of the extraction conditions. Mean lead recovery was quantitative for Extraction Conditions Nos. 1 and 2; whereas, for Extraction Conditions No. 3, it was only approximately 60 %. These findings agree with those of the previous NIST study [3]: Quantitative recoveries are achievable using the UE/ASV field-portable apparatus provided that either (1) the paint specimens are ground to a sufficiently small particle size, or that (2) extractions of specimens having large particles are performed at sufficiently high temperature and for long times.

15
0
20
40
60
80
100
120
1 2 3
EXTRACTION CONDITIONS
LEA
D R
ECO
VER
Y, %
Conditions 1: Freezer-Mill Grind (45 oC & 30 min) Conditions 2: Manual Grind (65 oC & 90 min) Conditions 3: Manual Grind (45 oC & 30 min)
4060
8010
0
lead
.reco
very
FreezerMill Manual
Grinding.method
4060
8010
0
lead
.reco
very
Low High
Gloss.level
Figure 4. Box Plots of Lead Recovery as a Function of: (A) Grinding Method, (B) Temperature-
Time Combination, (C), Gloss Level and (D) Binder Type for the Latex Paint Samples. Figure 5. Mean Lead Recovery as a Function of Extraction Conditions. Values in parenthesis are
the sonication temperature and sonication time. The error bars represent one standard deviation.
4060
8010
0
lead
.reco
very
45c+30min 65c+90min
Temperature.Time
4060
8010
0
lead
.reco
very
AcrylicBased VinylBased
Binder.type

16
3.2 Field Samples 3.2.1 Samples Obtained by NIST Research Staff. Specimens from the field samples obtained by NIST research staff were manually ground in the laboratory and then analyzed for lead using UE/ASV under extractions at both 45 °C and 30 min and 65 °C and 90 min. One additional specimen from each field sample was also manually ground and then sieved. Table 8 presents all results. Also included in Table 8 are the percentages of lead in the UE extract relative to the total lead in the specimen, as measured by the NLLAP laboratory. In the case of the paint-films sampled in Baltimore, it was not known when the last coats of paint had been applied. Visual examination of the painted surfaces gave no indication of recent painting. Manual grinding of specimens from these Baltimore samples was readily accomplished in the laboratory after they were cooled in dry ice. In about 2 min or less, the ground paint-films were powdery. In contrast to the paint-film samples obtained in Baltimore, those from Monterey had been recently overcoated. The question was whether recently overcoated specimens would behave similarly to newly fabricated laboratory specimens (Section 3.1) and be difficult to grind manually into small particles. NIST research staff subjectively noted that the Monterey samples were more difficult to grind manually than the Baltimore specimens. Nevertheless, grinding times of 3 min to 5 min yielded powdery specimens. It is also interesting to note that NIST research staff considered that the Monterey field specimens were generally easier to grind manually than those taken from the laboratory-prepared paint-film panels tested in the current (Section 3.1) and past [2,3] NIST studies. The manually ground paint-film specimens were visually compared to the black pepper reference powder (Table 3). The particle sizes of the ground paint films and black pepper were comparable. If the Directive in Table 3 had been followed explicitly, sonication conditions of 45 °C and 30 min would have been selected for all Baltimore and Monterey samples. However, because the objective of the study was to examine the reliability and practicality of the 2002 NIST recommendation on selecting sonication extraction conditions (Section 1.1.1 and Table 3), some specimens were sieved and others were extracted at both 45 °C and 30 min and 65 °C and 90 min before conducting ASV analysis. From Table 8, it is evident that the UE/ASV lead recoveries were generally quantitative (i.e., 100 % ± 20 %) regardless of the extraction conditions. For each Baltimore specimen set (Bldg. Nos. 1 and 2) and for the set of Monterey specimens, the differences between mean recoveries at 45 °C and 30 min and at 65 °C and 90 min were not statistically significant. NLLAP data (Table 8) also showed that both of these extraction conditions were effective in extracting lead from the manually ground specimens. The lead found by the NLLAP laboratory in the UE extracts was, for the majority of the specimens, 95 % or more of the total lead*, with the lowest value being 90 %. Comparing the NIST UE/ASV results and those of the NLLAP analyses of the extract solutions supports the assertion that extraction conditions of 45 °C and 30 min were appropriate for these field specimens⎯which was also the determination reached by a visual comparison of the manually ground specimens with the reference powder. In contrast to the UE/ASV analysis results, sieve analyses of specimens from the Baltimore and Monterey samples did not support selecting the 45 °C and 30 min extraction conditions. Recall
* It was expected that some lead would be found in the extracts. Decanting was used to separate the UE extract solution from the residue and, generally, some extract solution (up to 1 mL) was left with the residue.

17
Table 8. Characterization of field paint-film samples obtained by NIST research staff NIST UE/ASV Analysisa NLLAP Analysis Sieve Results Lead Recovery⎯Paint Film Lead in UE Extract
% Passing % Passing 45 °C/30 min 65 °C/90 min 45 °C/30 min 65 °C/90 min Building Location
Bldg No.
Sampling Location No. 20 No. 40 % % % %
Baltimore 1 1 100 83 88 89 99 98 2 100 85 73 100 98 97 3 100 77 82 100 97 98 4 100 78 94 100 97 97 5 100 84 94 100 97 96 6 100 75 94 97 98 99 7 100 76 97 101 97 99
Baltimore 2 1 100 91 91 94 98 99 2 100 89 114 114 99 99 3 96 81 96 95 99 99 4 100 82 101 122 99 99 5 100 82 82 87 99 99 6 100 73 97 100 99 99
Monterey 1 1 81 51 131 98 96 98 2 94 53 120 64 95 96 3 96 80 110 104 98 96 4 86 61 108 100 96 98 5 88 72 116 138 98 98
Monterey 2 1 96 68 77 103 99 98 2 71 57 109 107 97 99 3 97 73 116 114 97 97
Monterey 3 1 86 59 99 105 98 97 2 98 68 111 101 98 98 3 84 57 99 102 95 97
Monterey 4 1 91 57 97 98 97 98 2 89 72 123 104 97 98
Monterey 5 1 92 84 106 113 90 98 2 96 64 105 115 94 96
a Italicized data indicate recoveries that were not quantitative; i.e., outside the range of 100 % " 20 %. from Table 3 that, if sieving is conducted as the basis of choosing extraction conditions, then UE conditions of 45 °C and 30 min are only selected if the resultant particles are small enough to pass through a No. 40 sieve. In the case of the Baltimore samples, the results of sieving (Table 8) showed that, although essentially all particles of the ground paint films passed through a No. 20 sieve, only about 70 % to 90 % passed through the No. 40 sieve. Thus, if UE conditions had been based on sieving results, then UE conditions of 65 °C and 90 min would have been chosen. However, as discussed above, the more convenient conditions of 45 °C and 30 min sufficed. In the case of the Monterey samples, the specimens were not generally ground as fine as those from Baltimore. Sieve analyses of the Monterey specimens (Table 8) indicated that the ground particles

18
Table 9. Characterization of field paint-film samples obtained by operators
Operator No. Building Location
Bldg. No.
Sampling Location
Operator UE/ASV Analysisa
Lead Recovery⎯Paint Film %
NLLAP Analysis Lead in UE Extract
%
1 Baltimore 1 1 74 99
2 112 99
3 85 97
4 99 98
2 1 108 98
2 80 97
3 108 99
4 103 98
2 Baltimore 1 1 93 99
2 105 99
3 75 98
4 92 98
2 1 91 99
2 95 98
3 89 99
4 95 99
3 Baltimore 1 1 106 99
2 116 99
3 125 98
4 116 98
2 1 110 98
2 110 99
3 117 99
4 116 98
4 Baltimore 1 1 79 98
2 98 98
3 89 96
4 89 96
2 1 98 97
2 106 95
3 102 99
4 103 98 a Italicized data indicate recoveries that were not quantitative; i.e., outside the range of 100 % " 20 %.
did not totally pass through a No. 20 sieve and only 51 % to 84 % passed through a No. 40 sieve. If the UE conditions had been chosen based on these sieving results, the Monterey samples would not have been extracted using a sonicator. However, acceptable UE/ASV analyses of the Monterey samples were achieved with extraction conditions of 45 °C and 30 min.

19
In summary, the results of the sieving and UE/ASV analyses of the NIST obtained field samples suggested that visual comparison of the particle size of the manually ground specimens with that of the black pepper reference powder was sufficient for selection of the UE conditions of 45 °C and 30 min. The sieve analyses were not reliable in selecting the appropriate extraction temperature and time. That is, use of sieve analysis results in accordance with the 2002 NIST recommendation in Section 1.1.1 would have led to selection of extraction conditions that are generally not practical for field use. Further discussion on selecting UE conditions based on particle size of the ground specimen is given in Section 3.2.4. 3.2.2 Samples Obtained by the Operators. The four certified lead inspectors or risk assessors (i.e., the operators) who performed the Baltimore sampling had been previously trained [2] to conduct UE/ASV analyses. For the current study, they were trained at NIST to follow the Directive given in Table 3. In the laboratory, each operator manually ground specimens taken from the field samples and subjected them to UE/ASV analyses under UE conditions selected using the Directive. Table 9 includes the results of the operator UE/ASV analysis and the percent of the total NLLAP-measured lead found in the UE extract. All operators noted that the field samples were easy to grind manually. Consistent with this observation, they judged that the particle sizes of the ground specimens and the black pepper reference powder were comparable. They consequently selected extraction conditions of 45 °C and 30 min (Table 3). Their subsequent UE/ASV analyses resulted in generally acceptable lead recoveries. Eighty-eight percent (88 %) of the measurements were quantitative with the lowest value being 74 % (Table 9). In addition, the NLLAP analyses of the extract and residue supported the finding that these extraction conditions were suitable, as essentially all (≥ 96 %) of the NLLAP determined lead was found in the extract (Table 9). The results for the operator UE/ASV analyses provided further evidence that quantitative lead recoveries could be achieved when the manually ground specimens appeared to have particle sizes comparable to those known to pass through a No. 40 sieve. The results also indicated that the operators could readily follow the Directive in Table 3, although they encountered no instances where sieving of a ground specimen was required to select the appropriate UE conditions. 3.2.3 Comparison of the UE/ASV Results with the NLLAP ICP Results. Figure 6 presents comparisons of the results of the ASV lead measurements made by NIST research staff (Figure 6A) and by the operators (Figure 6B) with those of NLLAP ICP lead measurements. The solid line in each plot represents ideal correlation between the results of the ASV and ICP measurements. Linear regression analysis comparing the ASV and ICP data sets showed that the results from two methods were well correlated for both the NIST research staff data (r2 = 0.964) and for the operator data (r2 = 0.954). For those readers who have interest in comparing the ASV and ICP results using log-log plots, they are presented in Appendix A. 3.2.4 Estimating Particle Size Before Conducting UE/ASV Field Analysis. This investigation confirmed the results of the past NIST study [3] of the importance of achieving small particle size during grinding of paint-film samples for UE/ASV analysis. As previously discussed (Section 3.1), when laboratory-prepared paint-film samples were manually ground, the resultant particles were relatively large (often > 850 μm) and lead recovery was generally low (40 % to 80 %) when the extractions were conducted at the commonly used, and practically convenient, conditions of 45 °C and 30 min. In contrast, freezer-mill ground specimens from these paint films had relatively small

20
Figure 6. Comparison of the Lead Measurements Performed on Extract Solutions Using ASV and
ICP Methods. Plot A is for the sample set obtained and ASV-analyzed by NIST research staff. Plot B is for the sample sets obtained and ASV-analyzed by the four operators. The solid lines represent ideal correlation between the results of the two measurements.
particle sizes (< 425 μm) and provided quantitative lead recovery under extraction at 45 °C and 30 min.
0
200
400
600
800
1000
0 200 400 600 800 1000
ICP RESULTS, mg/L
OPE
RA
TOR
ASV
RES
ULT
S, m
g/L Operator 1
Operator 2
Operator 3
Operator 4
(B)
0
200
400
600
800
1000
0 200 400 600 800 1000
ICP RESULTS, mg/L
NIS
T A
SV R
ESU
LTS,
mg/
L
(A)

21
Given the importance of particle size, the issue is how to ensure that particle size is adequately small in the field. It was for this reason that the 2002 NIST recommendation (Section 1.1.1 and Table 3) was made for estimating particle size through comparison with that of a reference powder (i.e., material of known particle size) and/or sieving a ground paint-film sample was made. The current study examining the reliability and practicality of the recommendation has provided further data regarding particle size. First, both NIST research staff and the operators found that field specimens, including those with recently applied encapsulant coatings, could be ground to a powdery texture. Successful grinding of the field specimens was not unexpected, particularly for older ones, as other authors [13-15] have reported that manual grinding of “real-world” paint-films has yielded particle sizes within a range of 1 μm to 250 μm. A concern, which was not borne out for paint films in the current study, was that field samples having a freshly applied coating such as an encapsulant might behave similar to a laboratory-prepared paint film and be difficult, if not impossible, to grind into small particles. Because the manually ground field specimens in the current study were visually judged by both NIST research staff and the operators to have particle sizes comparable to that of the reference powder (i.e., particle size < 425 μm), as proposed in the Directive given in Table 3, 45 °C and 30 min extraction conditions were selected as adequate for extraction. Subsequent UE/ASV analyses showed the decision to be sound, as the lead recoveries were generally quantitative. The finding leads to the conclusion that, if a ground paint-film specimen appears to have adequately small particle size when compared to a reference powder, then it may be extracted at the convenient conditions 45 °C and 30 min. There is no need for further particle size characterization using sieving. With regard to sieving, the data from the Baltimore and Monterey field samples obtained and characterized by NIST research staff indicate that the recommendations in Section 1.1.1 and Table 3 for selecting the extraction conditions on the basis of sieving are conservative. This possibility was acknowledged when the recommendations were proposed in the previous NIST study [3], but sufficient data were not developed in that study to support other proposals for ensuring the adequacy of the grinding. In the current study, the results from sieving manually ground Baltimore specimens suggested that they be extracted at higher temperature and needlessly long conditions of 65 °C and 90 min. Even worse, results of sieving Monterey specimens suggested that they should not be extracted using sonication (unless extremely long times, e.g., > 4 h, were to be used). In these two cases, using the extraction conditions selected on the basis of sieving is unnecessary. Such errors in selecting extraction conditions would have little consequence on the lead analysis, because extraction at higher temperature and for longer time would be expected to assist lead recovery [3]. Nevertheless, errors leading to selecting extraction conditions having higher temperature and longer time are still significant, because they have a negative impact on the practical use of the field-portable UE/ASV method. Thus, it is recommended that sieve analysis should not be used at this time as the basis for selecting extraction conditions. Further research needs to be conducted for revising the methodology for selecting extraction conditions on the basis of sieve analysis. For example, determining particle size distributions of the manually ground specimens subjected to ASV analyses might assist in refining the recommendation. Based on the findings from the UE/ASV analysis and sieving of the field specimens, a revised recommendation on estimating particle size of the ground field specimen before performing UE/ASV analysis is proposed as follows:

22
In conducting UE/ASV analysis of a paint-film specimen in the field, the particle size of the ground specimen should be estimated before initiating the extraction. Particle size estimation is performed by visually comparing the ground paint-film specimen against a reference powder (i.e., a material known to pass through a No. 40, 425 μm mesh sieve)*. If the visual comparison indicates that the particle size of the ground specimen is no larger than that of reference powder, then lead analysis using field-portable UE/ASV may be performed using extraction conditions of 45 °C and 30 min. If the particle size of the ground paint-film specimen appears larger than that of the reference powder material, then UE/ASV field analysis should not be performed. In such cases, extraction should be accomplished by other means such as microwave or hotplate digestion.
This revised recommendation differs little from common practice for conducting UE/ASV field analysis. The advancement to practice is the comparison of the ground paint specimen and reference powder for helping to ensure adequately small particle size. The recommendation is consistent with the findings of other authors [6,16,17], who have indicated that satisfactory analyses are achieved when paint-film specimens are ground sufficiently small. Moreover, Ashley, Hunter, Tait, Dozier, Seaman, and Berry [6] showed concern that manual grinding might not always be satisfactory, as they reported that grinding of some UE/ASV field samples could be problematic. They stated: “In cases where paint samples are not easily ground and homogenized (which can be assessed visually), it may be advisable to analyze these samples in the laboratory.” Ensuring adequately small particle size is not an integral part of common practice. For example, the UE/ASV supplier’s instructions state that grinding should proceed “as necessary until all large particles have been broken down,” but give no specific guidance on particle size. In contrast, ASTM Standard Practice E 1979, “Ultrasonic Extraction of Paint, Soil, and Air Samples for Subsequent Determination of Lead,” provides guidance on particle size in directing that, when preparing a paint sample for ultrasonic extraction, “… grind and homogenize the … paint sample to a fine powder” [18]. However, means to assist judging that the particle size is “a fine powder” are not suggested in the standard. Revision and harmonization of the supplier’s instructions and ASTM standard to incorporate the particle size comparison would be beneficial. As a final comment, note that the revised particle size recommendation from the current study does not include, as was given in the 2002 NIST recommendation, an alternative for performing extractions at 65 °C and 90 min for certain circumstances wherein 45 °C and 30 min extraction was considered to be inappropriate. Elimination of the 65 °C and 90 min extraction conditions is suggested as a simplification. Sufficient data are not available to provide the basis for distinguishing when particle size is inadequate for extraction at 45 °C and 30 min, but appropriate for extraction at 65 °C and 90 min. Furthermore, it is believed that few, if any, UE/ASV practitioners would “wait” 90 min in the field for an extraction to be completed†.
* Use of a No. 40 sieve for characterizing the maximum particle size (i.e., 425 μm) of the comparison material is conservative. Data developed in the present study indicated that some manually ground specimens were quantitatively analyzed for lead although they contained particles that did not pass through a No. 40 sieve. † In the laboratory, extractions using ultrasonication for times exceeding 30 min are not necessarily impractical and may be applicable in cases where ground specimens have relatively large particle size.

23
4. SUMMARY, CONCLUSIONS, AND RECOMMENDATIONS Previous studies at NIST on the use of UE/ASV for determining lead in household paint found that the particle size of the ground specimen plays a significant role in lead extraction efficiency. Based on tests of laboratory-prepared paint films, small particles (< 425 μm) provided quantitative recovery whether the extractions were performed at low or high (45 °C or 65 °C) sonication temperatures, and short or long (30 min or 90 min) sonication times. In contrast, large particles (> 425 μm) afforded quantitative recovery only under high sonication temperature and long sonication time. Moreover, under the 45 °C and 30 min extraction conditions commonly used in practice, large particles provided generally low lead recoveries. Given the importance of particle size, the issue is how to ensure in the field that it is adequately small before performing UE/ASV analysis. Consequently, a recommendation was made in 2002 proposing that the particle size of the ground specimen should be first estimated and then an appropriate combination of sonication temperature and time should be selected. First, the particle size of the ground specimen was to be compared to that of a reference powder (i.e., a ground material such as black pepper known to pass through a No. 40, 425 μm mesh, sieve). Second, if the visual comparison was inconclusive, the particle size of the ground specimen was to be estimated from a sieve analysis. This recommendation was based on limited data developed from UE/ASV analyses of lead in laboratory-prepared paint-film specimens. Consequently, a follow-up study using additional laboratory-prepared and field-sampled paint films was performed to examine the reliability and practicality of the recommendation. This report presented the results of the follow-up study, which was performed in two phases. In the laboratory phase, lead-containing paint-film panels were prepared from 16 commercial paints. The “true” lead levels of these paint-films were characterized by digestion of specimens sampled from the panels followed by ICP analyses of the digestion solutions. For the experiments on particle size estimation, lead analysis was conducted using UE/ASV, and recovery was calculated in relation to ICP measurements. Experimental variables examined for potential effect on lead extraction were: grinding method, sonication temperature, sonication time, paint manufacturer, paint type, gloss level, and binder type. Freezer-mill and manually ground specimens were subjected to UE/ASV analysis at 45 °C and 30 min or at 65 °C and 90 min. The majority of the paint films samples was prepared using high gloss and low gloss acrylic-based or vinyl-based latex paints from three manufacturers. Others samples were prepared using high gloss and low gloss oil-based paints from two manufacturers. In the field phase, NIST research staff, and four certified lead inspectors and risk assessors (i.e., operators) trained to perform UE/ASV analyses, sampled lead-containing paint from housing and similar buildings. Many of the field samples were from neglected housing units where no evidence of recent repainting was observed. In other cases, the surfaces from which the field samples were obtained had been well maintained and recently repainted or overlaid with an encapsulant coating. Inclusion of recently overcoated field samples addressed a concern that such samples might be difficult to manually grind into relatively small particles and, thus, lead recoveries determined using ASV analysis after extraction at 45 °C and 30 min might be low. In both phases, NIST research staff and the four operators estimated the particle size of the manually ground specimens through visual comparison with a black pepper reference powder. Sonication temperatures and sonication times were selected based on the particle size comparisons. NIST research staff also performed sieve analyses of manually ground specimens using No. 20, 850 μm mesh and No. 40, 425 μm mesh sieves, and carried out additional UE/ASV analyses at

24
extraction temperatures and times other than those selected on the basis of the particle size comparisons. The data from these sieve and additional UE/ASV analyses contributed to the basis for revising the 2002 NIST recommendation on estimating the particle size of the ground paint-film specimen before conducting an UE/ASV analysis. The main conclusions of the study are:
• Laboratory-prepared paint-film specimens cooled in dry ice were difficult to manually grind. The resultant particle sizes were relatively large with many particles too large to pass through a No. 20 sieve.
• Particle size and the combination of sonication temperature and sonication time had a significant effect on UE/ASV lead recovery from the laboratory-prepared paint films. When particle size was small (achieved by freezer-mill grinding), and sonication temperature and sonication time were 45 °C and 30 min, respectively, lead recovery was quantitative. In contrast, when particle size was large (provided by manually grinding), lead recovery was quantitative only under 65 °C and 90 min extractions; large particles extracted at 45 °C and 30 min resulted in lead recoveries that were, on the average, approximately 60 %.
• Paint manufacturer, paint type, gloss level, and binder type generally had little, or no, effect on UE/ASV lead recovery.
• Dry-ice cooled field specimens, including those that had been recently repainted or overlaid with an encapsulant coating, were readily manually ground to a powder.
• The particle size of the manually ground, powdery field specimens appeared to be comparable to that of the black pepper reference powder. Consequently, extraction conditions of 45 °C and 30 min were selected for UE/ASV analysis of these field specimens. The UE/ASV lead recoveries and the results of complementary ICP analyses of the UE/ASV extracts and residues confirmed that these extraction conditions were appropriate.
• Sieve analysis of manually ground field specimens suggested, in accordance with the 2002 NIST recommendation on estimating the particle size, that the 45 °C and 30 min were inappropriate for the field specimens. This finding suggested that sieve analysis should not be used at this time for selection of sonication temperature and sonication time. Further research is needed to improve the protocol for selecting extraction conditions on the basis of sieve analysis.
Based on the results of the study, the following revised recommendation on estimating the particle size of the ground paint-film specimen before conducting an UE/ASV field analysis is proposed:
In conducting UE/ASV analysis of a paint-film specimen in the field, the particle size of the ground specimen should be estimated before initiating the extraction. Particle size estimation is performed by visually comparing the ground paint-film specimen against a reference powder (i.e., a material known to pass through a No. 40, 425 μm mesh sieve)*. If the visual comparison indicates that the particle size of the ground specimen is no larger than that of reference powder, then lead analysis using field-portable UE/ASV may be performed using extraction conditions of 45 °C and 30 min. If the particle size of the ground paint-film specimen appears larger than that of the reference powder material, then UE/ASV field analysis should not be performed. In such cases, extraction should be accomplished by other means such as microwave or hotplate digestion.
* Use of a No. 40 sieve for characterizing the maximum particle size (i.e., 425 μm) of the comparison material is conservative. Data developed in the present study indicated that some manually ground specimens were quantitatively analyzed for lead although they contained particles that did not pass through a No. 40 sieve.

25
This revised recommendation differs little from common practice for conducting UE/ASV field analysis. The advancement to practice is the comparison of the ground paint-film specimen and the reference powder. Inclusion of this small step in procedures for conducting UE/ASV field analysis would greatly help to ensure that the particle size of a ground paint-film specimen is adequately small for carrying out a reliable analysis. 5. ACKNOWLEDGMENTS The U. S. Department of Housing and Urban Development (HUD) sponsored this study. The authors appreciate the support and encouragement of Peter Ashley, Warren Friedman, David Jacobs, and Eugene Pinzer of the HUD Office of Healthy Homes and Lead Hazard Control. Thanks are expressed to Susan Drozdz, U.S. Army Construction Engineering Research Laboratories (CERL), and George Thomas, Confidential Compliance Consultants, for their assistance in obtaining the Monterey field samples. Thanks are also expressed to NIST colleagues, Chiara Ferraris, Steven Fick, Jonathan Martin, and Tinh Nguyen, for reviews of this report. The noteworthy comments given by Robert Vanderslice, HUD, are also very much appreciated.
6. REFERENCES
[1] Rossiter, W.J., Jr., Vangel, M.G., McKnight, M.E., and Dewalt, G., “Spot Test Kits For Detecting Lead in Household Paint: A Laboratory Evaluation,” NISTIR 6398, National Institute of Standards and Technology, Gaithersburg, MD (March 2000), 97 pages.
[2] Rossiter, W.J., Jr., Vangel, M.G., McKnight, M.E., Signor, A., and Byrd, W. E., “Ultrasonic
Extraction/Anodic Stripping Voltammetry for Determining Lead in Household Paint: A Laboratory Evaluation,” NISTIR 6571, National Institute of Standards and Technology, Gaithersburg, MD (May 2001), 66 pages.
[3] Rossiter, W.J., Jr., Toman, B., McKnight, Baghai Anaraki, M., “Factors Affecting
Ultrasonic Extraction of Lead from Laboratory-Prepared Household Paint Films,” NISTIR 6834, National Institute of Standards and Technology, Gaithersburg, MD (May 2002), 48 pages.
[4] Ashley, K., “Ultrasonic Extraction and Field-Portable Anodic Stripping Voltammetry of
Lead from Environmental Samples, Electroanalysis, Vol. 7, No. 12 (1995), pp. 1189-1192. [5] Williams, E.E., Van Hise, C.C., and Gutknecht, W.F., “Evaluation of the Performance of
Reflectance and Electrochemical Technologies for the Measurements of Lead in Characterized Paints, Bulk Dusts, and Soils,” EPA 600/R-95/003, Environmental Protection Agency, Research Triangle Park (April 1996).
[6] Ashley, K., Hunter, M., Tait, L.H., Dozier, J., Seaman, J.L., and Berry, P.F., “Field
Evaluation of On-Site Techniques for the Measurement of Lead in Paint Films,” Field Analytical Chemistry and Technology, Vol. 2, No. 1 (1998), pp. 39-50.
[7] Ashley, K., “On-Site Extraction and Anodic Stripping Voltammetric Determination of
Lead,” Woebkenberg, Mary Lynn, Ed., Applied Occupational and Environmental Hygiene, Vol. 13, No. 2 (February 1998), pp. 94-98.

26
[8] Ashley, K., Mapp, K.J., and Millson, M., “Ultrasonic Extraction and Field-Portable Anodic Stripping Voltammetry for the Determination of Lead in Workplace Air Samples,” American Industrial Hygiene Association Journal, Vol. 59 (October 1998), pp. 671-679.
[9] Ashley, K., Song, R., Esche, C.A., Schlecht, P.C., Baron, P.A., and Wise, T.J., “Ultrasonic
Extraction and Portable Anodic Stripping Voltammetric Measurement of Lead in Paint, Dust Wipes, Soil, and Air: An Interlaboratory Evaluation,” Journal of Environmental Monitoring, Vol. 1 (1999), pp. 459-464.
[10] “EPA National Lead Laboratory Accreditation Program Laboratory Quality System
Requirements (LQSR), Revision 2.0,” (August 1, 1996); available on the web at: www.hud.gov/offices/lead/labs/LQSR.pdf.
[11] U.S. Environmental Protection Agency, Test Methods SW-846, Test Method 3050B, “Acid
Digestion of Sediments, Sludges, and Soils,” available on the web at: www.epa.gov/SW-846/pdfs/3050b.pdf. [12] U.S. Environmental Protection Agency, Test Methods SW-846, Test Method 6010B,
“Inductively Coupled Plasma-Atomic Emission Spectrometry,” available on the web at: www.epa.gov/SW-846/pdfs/6010b.pdf.
[13] Grohse, P.M., Luk, K.K., Hodson, L.L., Wilson, B.M., Gutknecht, W.F., Harper, S.L.,
Beard, M.E., Lim, B.S., and Breen, J.J., “Development of a Field-Test Method for the Determination of Lead in Paint and Paint-Contaminated Dust and Soil,” Chapter 20, Lead Poisoning: Exposure, Abatement, Regulation, Eds., J.J. Breen and C.R. Stoup, CRC Press, Lewis Publishers, Boca Raton (1995), pp. 161-168.
[14] Hodson, L.L., Hardison, E.D., Leinbach, A.A., Messner, M.J., Binstock, D.A., and
Gutknecht, W.F., “An Intercomparison of Grinding Techniques Used for the Preparation of Lead-in-Paint Samples, EPA 600/R-95/112 (September 1997), 79 pages.
[15] Harper, S.L. and Gutknecht, W.F., “Sources of Variability in Collection and Preparation of
Paint and Lead-Coating Samples,” Journal of Environmental Monitoring, Vol. 3 (2001), 335-340.
[16] Grohse, P.M., Gutknecht, W.F., Luk, K.K., Wilson, B.M., and Van Hise, C.C., “Standard
Operating Procedure for Laboratory Analysis of Lead in Paint, Bulk Dust, and Soil by Ultrasonic, Acid Digestion and Inductively Coupled Plasma Emission Spectrometric Measurement,” EPA 600/R-95/111 (September 1997), 36 pages.
[17] Luk, K.K., Grohse, P.M., Hodson, L.L., Binstock, D.A., Van Hise, C.C., and Gutknecht,
W.F., “Standard Operating Procedure for Field Analysis of Lead in Paint, Bulk Dust, and Soil by Ultrasonic, Acid Digestion and Colorimetric Measurement,” EPA 600/R-93/200 (September 1993), 34 pages.
[18] “Ultrasonic Extraction of Paint, Dust, Soil, and Air Samples for Subsequent Determination
of Lead,” ASTM Standard Practice E 1979, Annual Book of Standards, Vol. 04.11, American Society for Testing and Materials, West Conshohocken, PA (2002).

A1
ICP RESULTS, mg/L
NIS
T A
SV R
ESU
LTS,
mg/
L
105 10050 500 1000
1000
100
10
(A1)
APPENDIX A. LOG-LOG PLOTS COMPARING THE RESULTS OF ICP AND ASV ANALYSES
Figure 6 in the main text presented comparisons of the results of the ASV lead measurements made by NIST research staff (Figure 6A) and by the operators (Figure 6B) with those of NLLAP ICP lead measurements. Another way to present these comparisons is with log-log plots, which allow a wider distribution of the data points along the x-axis. This Appendix presents these log-log plots. Figure A1 is for the specimens subjected to ASV analyses by NIST research staff, and Figure A2 is for specimens subjected to ASV analyses by the operators. The solid line in each plot represents ideal correlation between the results of the ASV and ICP measurements.
Figure A. log-log Plot Comparing the Lead Analyses of Extract Solutions by ASV and ICP
Methods. Plot A1 is for the sample set obtained and ASV-analyzed by NIST research staff. Plot A2 is for the sample sets obtained and ASV-analyzed by the four operators. The solid lines represent ideal correlation between the results of the two measurements.
ICP RESULTS, mg/L
NIS
T A
SV R
ESU
LTS,
mg/
L Operator 1
Operator 2
Operator 3
Operator 4
105 10050 500 1000
1000
100
10
(A2)