factors affecting safety performance of construction ... · factors affecting safety performance of...
TRANSCRIPT

Factors Affecting Safety Performance of Construction Workers: Safety Climate, Interpersonal Conflicts at Work,
and Resilience
by
Yuting Chen
A thesis submitted in conformity with the requirements for the degree of Doctor of Philosophy
Graduate Department of Civil Engineering University of Toronto
© Copyright by Yuting Chen 2017
ii
Factors Affecting Safety Performance of Construction Workers:
Safety Climate, Interpersonal Conflicts at Work, and Resilience
Yuting Chen
Doctor of Philosophy
Graduate Department of Civil Engineering University of Toronto
2017
Abstract
A safety plateau in safety performance has been observed in many countries or regions. In
order to continuously improve safety performance, the key is to identifying factors affecting
safety performance. This research examined four factors, namely, safety climate, individual
resilience (IR), interpersonal conflicts at work (ICW), and organizational resilience (OR) that
may contribute to explaining safety outcomes. A self-administered survey was used. From 2013
to 2016, 1281 surveys were collected from 180 construction sites of Ontario, Canada.
This thesis composed three papers, which leads to the following conclusions:
Safety climate not only affects physical safety outcomes but also employees’ job stress
level.
ICW is a risk factor for safety performance.
IR has the potential to mitigate post-trauma job stress and interpersonal conflicts of
construction workers.
Management commitment is the key to promoting a good safety culture.
Safety awareness is the most important individual factor affecting construction workers’
safety performance.
Team support, especially the support from coworkers, has a significant positive impact
on construction worker’s safety awareness.
Several original contributions were made:
This study designed and tested questions of individual resilience.
This study is the first empirical study investigating the impact of individual resilience on
safety outcomes.

iii
This study is the first study testing the antecedents of interpersonal conflicts at work and
the resulting safety outcomes in the construction industry.
This study designed and tested organizational resilience questions in the context of
construction industry.
This is the first study testing the mechanism about how the resilience factors interact
with each other and eventually affect safety outcomes.
This study is the first study using structural equation modeling (SEM) to quantify
organizational resilience.
Accordingly, the following recommendations were provided:
Construction organizations need to not only monitor employees’ safety performance but
also their psychological well-being.
Safety professionals may consider adding coping skill training programs to improve the
individual resilience of their workforce and reduce conflict-related safety outcomes.
Construction organizations can improve employees’ safety awareness by promoting a
good team-level safety culture, and by building a good reporting and learning culture.

iv
Acknowledgments
I have been enjoying my life in the University of Toronto, where I met lots of genius professors,
kind friends, and smart colleagues. However, life is not always easy. I started my Ph.D. in 2012,
and I was lost in the beginning. I did not know where my research could go, and I was not sure
whether I am a person who can do research and who can do research well. Language was also
a problem for me then.
Fortunately, life is beautiful in spite of bumps. In 2014 June, I was fortunate enough to join Dr.
McCabe’s group when I was on the edge of quitting. Since then, suddenly, the door of a new life
was opened for me. I worked with Dr. McCabe on a safety research project, where my Ph.D.
thesis was based. Dr. McCabe has been teaching me how to write proposal, how to write
papers, and demonstrating how to be a good teacher. She works so hard and always used her
weekend and vacation time to modify my papers and thesis. Her engagement, encouragement
and patience has helped me not only progress my research but also build my confidence. There
are so many things I want to list but cannot exhaust. I really want to express my sincere
gratitude to Dr. McCabe for her generous support and for her love to students. Without her, I
wouldn’t have finished my Ph.D.
My special thanks also go to Prof. Douglas Hyatt. As a co-investigator of my research project
and a member of my doctoral committee, he provided so many constructive and valuable
suggestions, especially on quantitative research methods. I am also very grateful for the advice
received from Prof. Kim Pressnail and Prof. Daman Panesar. As members of my doctoral
committee, they reviewed my thesis very thoroughly and provided their insights into my
research from different perspectives. I would also like to thank Prof. Aminah Robinson Fayek
from the University of Alberta for her thoughtful advice, especially her advice on safety
performance measures.
I am very grateful for the support of colleagues and friends in our research group: Hesam
Hamledari, Patrick Marquis, Hiba Ali, Pouya Zangeneh, Farid Mirahadi, Arash Shahi, Kamelia
Shahi, and Eric Junting Li. Especially, I would like to thank Hesam for his encouragement and
inspiration. Hesam is a great friend and sometimes a good teacher. He is very talented and
productive. I am impressed by his hard work. I always learned a lot from him during our
discussion of logic development in academic research. He is studying in Standford as a Ph.D.
student now. I wish him best wishes for his bright future. I would also like to thank Patrick for his
support and efforts to collect safety data from Ottawa, and I would also like to thank Hiba for her

v
great advice on my defense presentation slides. I am also very grateful that I always learn a lot
from Farid and Pouya during our discussion of working conditions on remote construction sites.
My special thanks also go to Bangbiao Wu, Ze Wang, and Ruochen Nan. They are great
friends. I am very happy and lucky to meet them in Toronto and have them being with me. I am
very grateful for the help and support from them. I really enjoyed the time when we played board
games together, when we had hot pots together, and when we played in Treetop treckking
zipline parks, etc. My dull Ph.D. life becomes more colorful because of them.
A deep and heartfelt thank you go to my families, especially my parents. They always support
me for any decisions I made. I am very happy to live in such a love family!
Finally, I would like to thank Sheng, my love and friend. His encouragement and support made
me overcome all bumps and difficulties in the past four years. I also wish him best wishes for his
fascinating research journey.

vi
Table of Contents
Acknowledgments ...................................................................................................................... iv
Table of Contents ....................................................................................................................... vi
List of Tables .............................................................................................................................. x
List of Figures ........................................................................................................................... xii
List of Acronyms and Abbreviations ......................................................................................... xiii
List of Symbols.......................................................................................................................... xv
Chapter 1 Introduction ................................................................................................................ 1
1.1. Research objectives ..................................................................................................... 3
1.2. Thesis overview ........................................................................................................... 4
1.2.1. Data collection ...................................................................................................... 7
1.2.2. Data analysis ........................................................................................................ 8
1.3. Chapter Summaries ....................................................................................................12
1.3.1. Chapter 2 “Impact of individual resilience and safety climate on safety
performance and psychological stress of construction workers: a case study of the Ontario
construction industry” .........................................................................................................13
1.3.2. Chapter 3 “The relationship between individual resilience, interpersonal conflicts at
work, safety outcomes of construction workers” .................................................................14
1.3.3. Chapter 4 “Resilience on construction sites: testing a structural equation model” 15
Chapter 2 Impact of individual resilience and safety climate on safety performance and
psychological stress of construction workers: a case study of the Ontario construction industry
.................................................................................................................................................20
2.1. Introduction .................................................................................................................21
2.1.1. Safety climate dimensions ...................................................................................23
2.1.2. Safety climate and safety outcomes .....................................................................24

vii
2.1.3. Individual resilience, safety outcomes, and psychological stress..........................24
2.1.4. Injuries and psychological stress ..........................................................................25
2.2. Methods ......................................................................................................................25
2.2.1. Data and procedure .............................................................................................25
2.2.2. Measures .............................................................................................................29
2.2.2.1. Individual resilience ..........................................................................................29
2.2.2.2. Safety climate ...................................................................................................30
2.2.3. Data analysis .......................................................................................................31
2.3. Results ........................................................................................................................33
2.3.1. Measurement model ............................................................................................33
2.3.2. Inter-correlations among the variables .................................................................34
2.3.3. Structural model ...................................................................................................38
2.4. Discussion ..................................................................................................................40
2.5. Conclusions ................................................................................................................41
Chapter 3 The relationship between individual resilience, interpersonal conflicts at work, safety
outcomes of construction workers .............................................................................................42
3.1. Introduction .................................................................................................................42
3.1.1. ICW, safety outcomes, and stress ........................................................................44
3.1.2. Antecedents of ICW .............................................................................................45
3.2. Methods ......................................................................................................................46
3.2.1. Data and collection procedures ............................................................................46
3.2.2. Data analysis .......................................................................................................51
3.3. Results ........................................................................................................................53
3.3.1. Measurement model ............................................................................................53

viii
3.3.2. Descriptive statistics ............................................................................................54
3.3.3. Structural model ...................................................................................................56
3.4. Discussion ..................................................................................................................58
3.5. Conclusions ................................................................................................................60
Chapter 4 Resilience on construction sites: testing a structural equation model ........................61
4.1. Introduction .................................................................................................................61
4.1.1. Resilience indicators ............................................................................................63
4.1.2. Hypotheses ..........................................................................................................64
4.2. Methods ......................................................................................................................65
4.2.1. Data and procedures ...........................................................................................65
4.2.2. Measures .............................................................................................................69
4.2.3. Data analysis .......................................................................................................70
4.3. Results ........................................................................................................................72
4.3.1. Measurement model ............................................................................................72
4.3.2. Descriptive statistics ............................................................................................75
4.3.3. Structural model ...................................................................................................77
4.4. Discussion ..................................................................................................................81
4.5. Conclusions ................................................................................................................83
4.6. Limitations and future work .........................................................................................83
Chapter 5 Conclusions, recommendations, and future work......................................................85
5.1. Conclusions ................................................................................................................85
5.1.1. Impacts on physical injuries and unsafe events ...................................................85
5.1.2. Impacts on job stress ...........................................................................................86
5.2. Conference paper conclusions ....................................................................................86

ix
5.3. Contributions ...............................................................................................................87
5.4. Recommendations ......................................................................................................87
5.5. Future work .................................................................................................................87
References ...............................................................................................................................89
Appendix A ............................................................................................................................. 100
Appendix B ............................................................................................................................. 111
Appendix C ............................................................................................................................. 112
x
List of Tables
Table 1-1. Focus of this research ............................................................................................... 4
Table 1-2. Survey details ........................................................................................................... 6
Table 1-3. Number of surveys by year and location ................................................................... 7
Table 1-4. SEM model fit indices ...............................................................................................12
Table 1-5. Hypotheses and testing results ................................................................................16
Table 2-1. Demographics of respondents ..................................................................................27
Table 2-2. Data representativeness ..........................................................................................27
Table 2-3. Frequency of safety outcomes .................................................................................28
Table 2-4. Frequency of job stress ............................................................................................29
Table 2-5. Comparisons of the hypothesized six-factor model of safety climate with selected
alternative models .....................................................................................................................35
Table 2-6. Measurement model: squared multiple correlations (SMCs) and factor loadings ......35
Table 2-7. Descriptive statistics and correlations .......................................................................37
Table 2-8. Comparisons of model 1 and model 2 ......................................................................39
Table 2-9. Direct and indirect effect testing of the hypothesized model relationships ................40
Table 3-1. Demographics of respondents ..................................................................................48
Table 3-2. Frequency of physical safety outcomes ....................................................................50
Table 3-3. Frequency of job stress ............................................................................................51
Table 3-4. Fit indices for the measurement models ...................................................................53
Table 3-5. Measurement model: square multiple correlations (SMC) and factor loadings .........53
Table 3-6. Descriptive statistics of variables ..............................................................................54
Table 3-7. ICW individual statement frequency distribution (%) .................................................55
Table 3-8. Direct and indirect effect testing of the hypothesized model relationships ................58

xi
Table 4-1. Hypotheses in the study ...........................................................................................65
Table 4-2. Demographics of respondents ..................................................................................67
Table 4-3. Frequency of safety outcomes .................................................................................68
Table 4-4. Frequency of job stress ............................................................................................69
Table 4-5. Fit indices for the measurement models ...................................................................73
Table 4-6. Measurement model: square multiple correlations (SMCs) and factor loadings ........74
Table 4-7. Descriptive statistics and correlations .......................................................................76
Table 4-8. Indirect effect analysis ..............................................................................................80
Table 4-9. Summary of testing results .......................................................................................81
Table B-1. Scale statements ................................................................................................... 111
Table C-1. Measurement model: square multiple correlations (SMCs) and factor loadings ..... 112
xii
List of Figures
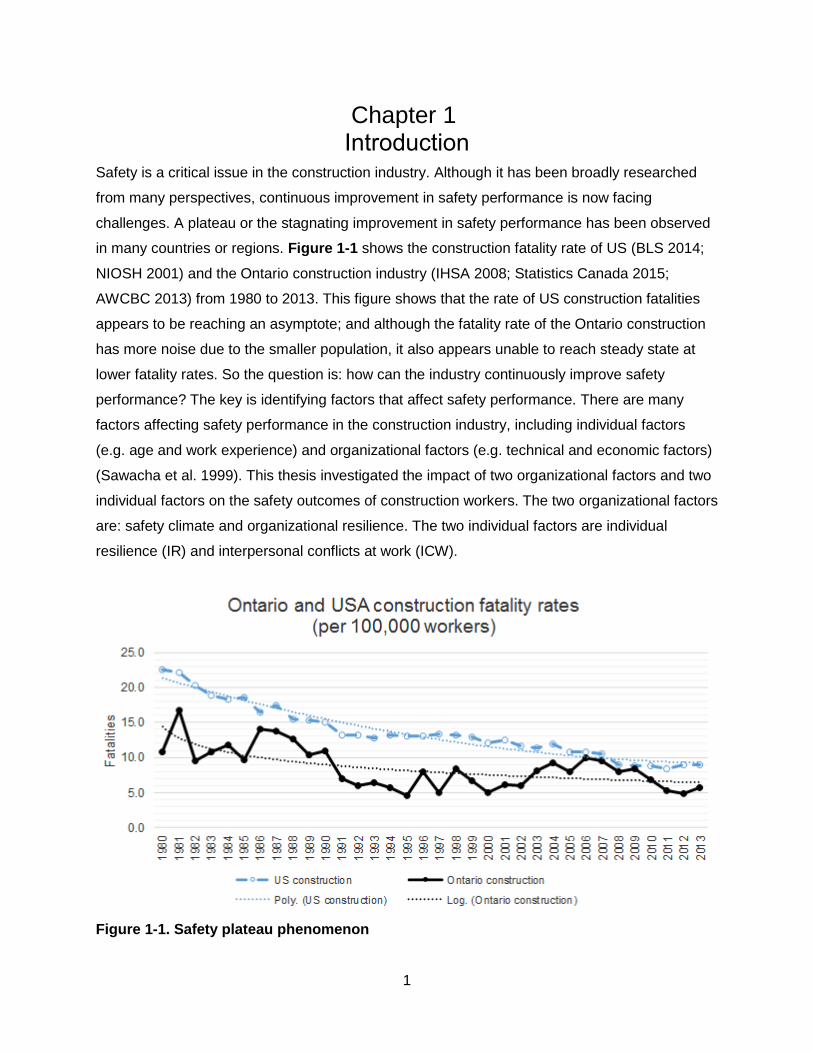
Figure 1-1. Safety plateau phenomenon .................................................................................... 1
Figure 1-2. Safety performance terminology hierarchy ............................................................... 3
Figure 1-3. Organization of the research questions .................................................................... 5
Figure 1-4. Data analysis process .............................................................................................. 9
Figure 1-5. Example of SEM .....................................................................................................11
Figure 1-6. Example of mediation analysis ................................................................................11
Figure 1-7. Safety climate, individual resilience, and safety outcomes ......................................13
Figure 1-8. Individual resilience, interpersonal conflicts at work, and safety performance .........15
Figure 1-9. Resilience model .....................................................................................................17
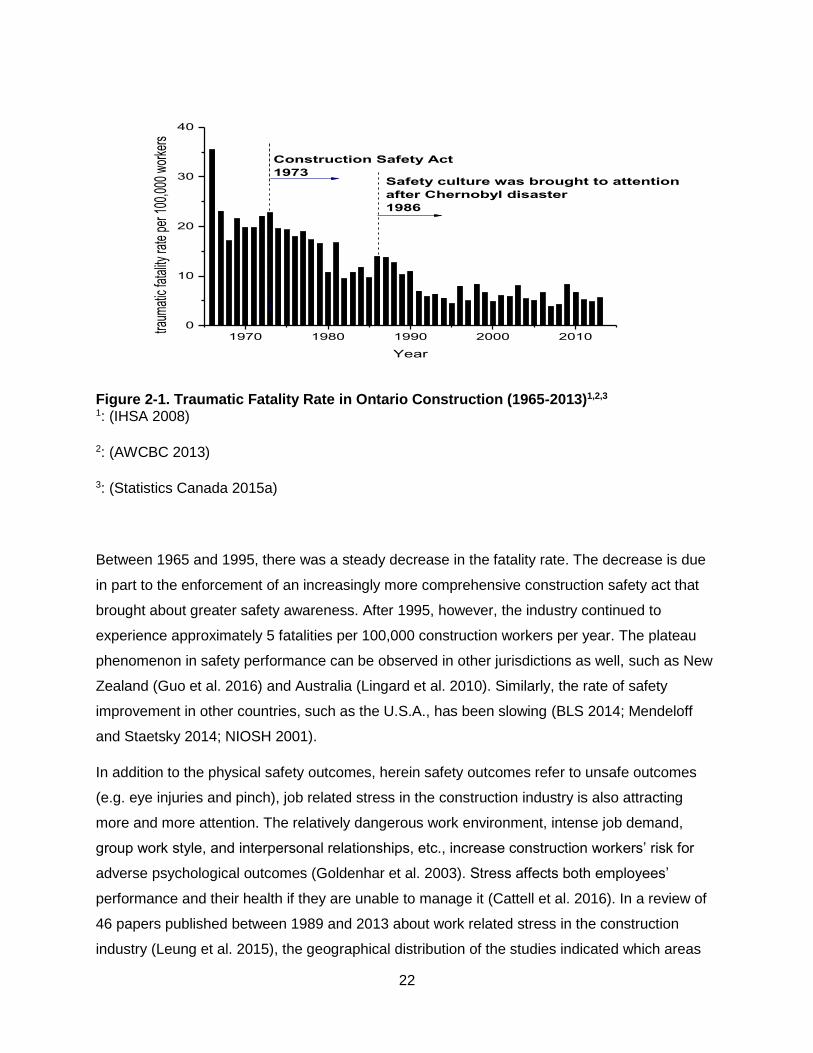
Figure 2-1. Traumatic Fatality Rate in Ontario Construction (1965-2013)1,2,3 .............................22
Figure 2-2. Structural equation model. Model 1: without non-significant coefficients from
individual resilience to physical injuries and unsafe events. Model 2 shown by dashed line and
by italic numbers: with non-significant coefficients from individual resilience to physical injuries
and unsafe events .....................................................................................................................38
Figure 3-1. Safety performance terminology hierarchy ..............................................................44
Figure 3-2. Frequency of interpersonal conflict..........................................................................56
Figure 3-3. Structural model depicting the relationships between the studied variables ............57
Figure 4-1. Structural model depicting the relationships between the studied variables ............78
xiii
List of Acronyms and Abbreviations
AN anticipation (a subfactor of organizational resilience (OR))
AW awareness (a subfactor of OR)
CFI comparative fit index
C.I. confidence intervals
CS coworker safety perception (factor)
CWB counterproductive work behaviors
DA dominance analysis
DEA data envelopment analysis
GTA Greater Toronto Area
ICI industrial, commercial, and institutional sectors of the construction industry
ICW interpersonal conflicts at work
ICWS interpersonal conflicts at work with supervisors (factor)
ICWC interpersonal conflicts at work with coworkers (factor)
IR individual resilience (factor)
LN learning (a subfactor of OR)
M mean value
MC management commitment to safety (a subfactor of OR)
MOE margin of error
OR organizational resilience
PNFI parsimonious normed fit index
PTSD post-traumatic stress disorder
RA research assistant
RMSEA root mean square error of approximation

xiv
RO role overload (factor)
ROP Research Opportunities Program in the Ministry of Labour Ontario
RP reporting (a subfactor of OR)
SC safety climate
SD standard deviation
SEM structural equation modeling
SK safety knowledge (factor)
SMC squared multiple correlation
SRMR standardized root mean square residual
SS supervisor safety perception (factor)
WP work pressure (factor)
xv
List of Symbols
d.f. degree of freedom
d.f. diff degree of freedom difference
p p value that is defined as the probability of obtaining a result equal to or more
extreme than what was actually observed, when the null hypothesis is true
r bivariate correlation
R2 The percent variance of dependent variables explained by independent variables
in regression models.
β standardized regression coefficient
2 Chi square - a measure of the goodness of fit between observed values and
those expected theoretically
2 diff Chi square difference
Standard deviation of a population
0.025z Critical value when confidence level is 95%
1
Chapter 1 Introduction
Safety is a critical issue in the construction industry. Although it has been broadly researched
from many perspectives, continuous improvement in safety performance is now facing
challenges. A plateau or the stagnating improvement in safety performance has been observed
in many countries or regions. Figure 1-1 shows the construction fatality rate of US (BLS 2014;
NIOSH 2001) and the Ontario construction industry (IHSA 2008; Statistics Canada 2015;
AWCBC 2013) from 1980 to 2013. This figure shows that the rate of US construction fatalities
appears to be reaching an asymptote; and although the fatality rate of the Ontario construction
has more noise due to the smaller population, it also appears unable to reach steady state at
lower fatality rates. So the question is: how can the industry continuously improve safety
performance? The key is identifying factors that affect safety performance. There are many
factors affecting safety performance in the construction industry, including individual factors
(e.g. age and work experience) and organizational factors (e.g. technical and economic factors)
(Sawacha et al. 1999). This thesis investigated the impact of two organizational factors and two
individual factors on the safety outcomes of construction workers. The two organizational factors
are: safety climate and organizational resilience. The two individual factors are individual
resilience (IR) and interpersonal conflicts at work (ICW).
Figure 1-1. Safety plateau phenomenon

2
Safety climate refers to the shared perception of people toward safety in their work environment
(Zohar 1980). Safety climate may be affected by a country’s social culture (Ali 2006), because
management’s decisions on how they manage safety are likely influenced by cultural norms.
Examining the geographic distribution of construction safety climate research, most of the
existing research were conducted in Hong Kong (Fang et al. 2006; Hon et al. 2014), Australia,
Queensland or New Zealand (Guo et al. 2016; Mohamed 2002) and U.S.A. (Cigularov et al.
2013; Dedobbeleer and Béland 1991; Gillen et al. 2002; Probst et al. 2008). However, few
research studies have assessed safety climate and its impact on safety performance in the
Canadian construction industry. While most regulatory jurisdictions regularly publish statistical
reports focused on the historic safety performance of all industries, only McCabe et al. (2008)
investigated safety climate factors specific to safety performance in the Ontario construction
industry. Unfortunately, that study was over a decade ago. Given that all systems tend to
deteriorate (Costella et al. 2009), it is necessary to regularly investigate the safety performance
of the Canadian construction industry and the factors that affect it if the safety plateau is to be
overcome. Therefore, the first research question is whether safety climate can explain the safety
plateau phenomenon in the Canadian construction industry. Secondly, given that safety climate
explained only 23 to 28 percent of the variance in safety outcomes 10 years ago (McCabe et al.
2008), it is necessary to explore other factors and investigate what additional contributions they
make to the overall safety performance. The literature suggested three factors, namely,
individual resilience (IR) (Eid et al. 2012), interpersonal conflicts at work (ICW) (Bruk-Lee and
Spector 2006), and organizational resilience (OR) (Hollnagel 2015) that may contribute to
predicting or explaining safety outcomes. IR is people’s proactive psychological capability that
helps them to deal with adverse events and risks (Stewart et al. 1997). ICW refers to negative
interactions with others in the workplace (Nixon et al. 2011), which can range from momentary
disagreements and disrespectful behaviors from coworkers or supervisors to heated arguments.
OR is regarded as a capacity for positive responses and healing capabilities to maintain normal
operations and a high level of safety during stress and disturbance (Bruyelle et al. 2014; Ross et
al. 2014), which is fundamental for human and organizational functioning and viability (Carmeli
et al. 2013). The hierarchy of safety performance terminology used herein is provided in Figure
1-2.

3
Safety outcomes
Physical safety
outcomes
Job stress
Physical injuries
Unsafe events
Figure 1-2. Safety performance terminology hierarchy
1.1. Research objectives
Four research objectives were identified:
1. Validate the role of safety climate in affecting safety performance in the Canadian
construction industry
2. Determine the impact of individual resilience on safety performance in the construction
industry
3. Examine the impact of interpersonal conflicts at work on safety performance of construction
workers
4. Determine whether organizational resilience is related to safety performance of construction
workers
The starting point of this research is validating the role of safety climate in affecting safety
performance. However, safety climate explained less than 30% of the variance of safety
outcomes, thus, three additional factors, namely ICW, OR, and IR, were identified and
investigated.
Although ICW was used previously as one dimension of safety climate (McCabe et al. 2008), it
is technically a risk factor affecting job performance (Bruk-Lee and Spector 2006), not a safety
climate factor. Few studies have examined the role of ICW in the safety performance of
construction workers.
OR has been proposed as a new approach for the next generation of safety improvement
(Hollnagel 2015). Its efforts focus on enhancing the organization’s ability to respond, monitor,
anticipate, and learn (Nemeth et al. 2008, Hollnagel 2009). Current resilience studies on safety
have mainly focused on two themes: defining resilience and quantifying resilience. Resilience
measures in most of the existing literature include management commitment, reporting culture,
learning culture, anticipation, awareness, and flexibility (Hollnagel 2015; Woods and Hollnagel

4
2006). Compared with qualitative studies focused on defining resilience measures, relatively few
quantitative studies have been done to quantify OR, providing a gap that needs to be explored.
To the knowledge of the author, only four papers focused on quantitative analysis of resilience
in the industrial sectors. They used three methods: principal component analysis and numerical
taxonomy (Shirali et al. 2013, 2016); fuzzy cognitive mapping (Azadeh et al. 2014a); and data
envelope analysis (Azadeh et al. 2014b). Further, no study has investigated interactions of the
resilience indicators and how they affect individual safety performance, e.g. how top
management affects reporting and learning, and ultimately accidents.
It is believed that IR may facilitate safety focused behaviors (Eid et al. 2012). However, no
empirical studies have examined the impact of IR on safety performance.
Table 1-1 shows the focus of this research and the research time frame for each factor. Safety
climate and interpersonal conflict at work were examined from 2014 to 2016. Organizational
resilience and individual resilience were examined in 2015 and 2016.
Table 1-1. Focus of this research
Previous research (McCabe et al. 2008)
This research
Years 2004-2006 2013-14 2015 2016
No. of surveys
911 444 406 431
Major findings
23-28% variance of safety outcomes explained by safety climate
Focus
Safety climate and interpersonal conflicts at work
Organizational and individual resilience
1.2. Thesis overview
This thesis consists of three chapters, which resulted in three papers for academic journals. The
organization of these three papers is shown in Figure 1-3. The circled numbers 2, 3, and 4
represent Chapter 2, Chapter 3, and Chapter 4.

5
Safety climate
Dimensions?Conflicts at work is not a
safety climate dimension,
but it is a job stressor
Safety outcomes:Physical injuries
Unsafe events
Job stress
Organizational
resilience
④
③
Individual
resilience ②
Management commitment to
safety
Supervisor safety perception
Coworker safety perception...
What about?
②
Figure 1-3. Organization of the research questions
The major research instrument employed is a self-administered survey that is adapted from
previous research (McCabe et al. 2008). As summarized in Table 1-2, from 2013 to 2016, 1281
surveys were collected in Ontario, Canada, among which 62 surveys were collected from 2013,
382 from 2014, 406 from 2015, and 431 from 2016. The surveys collected from 2013 to 2015
were used for a co-authored paper (McCabe et al. 2016). The remaining 837 surveys from 2015
and 2016 were used for this thesis.
The surveys were modified in 2015 and 2016 using questions designed to test IR and OR.
Appendix A shows three versions of the surveys: version 1 is the original survey from (McCabe
et al. 2008); version 2 tests IR and OR; version 3 tests OR. For the original survey, 13 factors
were used:
Conscientiousness
Fatalism
Management commitment to safety
Safety program perception
Supervisor safety perception
Supervisor Leadership
Co-worker safety perception
Safety consciousness (knowledge)
Role overload
Work pressure
Job safety perception
Interpersonal conflict at work
Job involvement

6
For the version 2 survey, questions of conscientiousness and leadership were removed.
Questions of new five factors were introduced, including IR, reporting, learning, awareness and
anticipation. Four more questions for management commitment to safety were added, and three
questions of job involvement were removed. Based on the factor analysis results from 2015, no
clear structure of OR factors was found. Therefore, in 2016 May, OR questions were re-
designed based on questions from the literature.
Chapter 2 and Chapter 3 used version 2 surveys, which included the 837 surveys from 2015
and 2016. Chapter 4 used version 3 surveys, which included the 431 surveys from 2016.
Chapter 2 used six factors: management commitment to safety, supervisor safety perception,
co-worker safety perception, safety consciousness (knowledge), role overload, and work
pressure. Chapter 3 used two factors, IR and ICW, the second of which was split into conflicts
with coworkers (ICWC) and conflicts with supervisors (ICWS). Chapter 4 used management
commitment to safety, supervisor safety perception, co-worker safety perception, reporting,
learning, anticipation, and awareness. Factors including fatalism, safety program perception, job
safety perception, and job involvement were used in the quasi-longitudinal study (McCabe et al.
2016).
Table 1-2. Survey details
Factors Factors in survey versions
2013-14 version 1
2015 version 2
2016 version 3
Used in chapter #
Number of copies 444 406 431
Conscientiousness Removed
Leadership Removed
Fatalism
Safety program perception
Job safety perception
Job involvement modified
Management commitment to safety
modified 2,4
Supervisor safety perception modified 2,4
Co-worker safety perception 2,4
Safety consciousness (knowledge)
2
Role overload 2
Work pressure 2
Interpersonal conflict at work 3
Individual resilience introduced 2,3
Reporting introduced modified 4

7
Factors Factors in survey versions
2013-14 version 1
2015 version 2
2016 version 3
Used in chapter #
Learning introduced modified 4
Anticipation introduced modified 4
Awareness introduced modified 4
Chapter 2
Chapter 3
Chapter 4
1.2.1. Data collection Considerable efforts were made to collect the surveys to cover most of the province. Table 1-3
shows our data collection team members in each summer and the surveyed areas. Thirteen
undergraduate students and eight graduate students including Ph.D. and MSc students were
involved in the data collection. During the data collection process, support from other
universities was provided, including Lakehead University, Queens University, University of
Ottawa, and University of Windsor. Approximately half of the surveys were collected from the
Toronto area, 10 percent from Milton, 8 percent from Ottawa, and the remaining areas
contributed 30 percent. For the summer 2013-2014, the surveyed areas were mainly in GTA
and Thunder Bay. For 2015, the surveyed areas were extended to Guelph, Kingston, Kitchener-
Cambridge-Waterloo, Ottawa, Windsor. In 2016, the GTA was surveyed to test the OR
questions.
Table 1-3. Number of surveys by year and location
2013-2014 2015 2016 Total
Data collection team* 2 G; 3 U/G 5 G ; 3 U/G 1 G ; 7 U/G 8G ; 13 U/G
Aurora 5 5
Brampton 4 9 13
Cambridge 15 15 30
Guelph 14 14
Kingston 45 45
London 17 17
Markham 33 28 61
Milton 115 115
Mississauga 16 33 49
North York 15 5 20
Ottawa 105 105
Richmond Hill 6 6
Scarborough 10 19 29
Thunder Bay 12 37 49
Toronto 260 77 310 647

8
2013-2014 2015 2016 Total
Vaughan 7 15 22
Waterloo 10 21 11 42
Windsor 12 12
Total 444 402 435 1281
* U/G: undergraduate student; G: graduate student
Before data were collected, a minimum sample size was determined by the following equation
(Brase and Brase 2016):
2
2
0.025
2n
MOE
z
Where n is the estimated sample size;
0.025z is the critical value when confidence level is 95%;
is the estimated population standard deviation;
MOE is margin of error.
According to (Bartlett et al. 2001), can be estimated using data from previous studies of the
same or a similar population. Thus, the maximum standard deviation of data (only for questions
using 1-5 Likert scale) from 2004 (McCabe et al. 2008) was used, i.e. 1.36 of the question “I
cannot avoid taking risks in my work”. For ordinal data, 3% margin of error is acceptable, which
would result in the researcher being confident that the true mean of a five point scale is within
±.15 (.03 times five points on the scale) of the mean calculated from the research sample. The
minimum n was determined to be 316. Therefore, 1281 is large enough for Ontario safety
research.
1.2.2. Data analysis
All three chapters used a similar analysis approach, as shown in Figure 1-4. The statistical
analyses were performed using IBM SPSS Statistics and Amos (Windows version 23). First,
data cleaning was done. For chapter 2 and chapter 3, approximately 50 cases were removed
because a high proportion of data were missing (>10%). For chapter 4, 28 cases were removed.
After data cleaning, confirmatory factor analysis was used to test whether the factors used for
each paper were conceptually distinct. Internal-consistency reliability tests were then conducted
to show how well the individual scale statements reflected a common, underlying construct.
Finally, structural equation modeling (SEM) techniques were used to build the models in each

9
paper. The round corner rectangles in Figure 1-4 represent the product and the right angle
rectangles represent the analysis actions. In the following paragraphs, a more detailed
introduction of each method used is given.
Raw
data
Data cleaningMeasurement
scalesMissing value > 10%
Recode injuries
Reverse questions
Models
Confirmatory factor
analysis Internal-consistency reliability test
Structural equation
modeling
Figure 1-4. Data analysis process
Confirmatory factor analysis (CFA) is a method to examine whether previously identified
factor structures work in new data. The analysis accounts for the relationships (i.e. correlations,
covariation, and variation) among the items (i.e. the observed variables in the survey)
(Harrington 2009). It is based on a common factor model, where each observed variable is a
linear function of one or more common factors (i.e. the underlying latent variables) and one
unique factor (i.e. the error). It partitions item variance into two components: (1) common
variance, which is accounted for by underlying latent factors, and (2) unique variance, which is a
combination of indicator-specific reliable variance and random error. For instance, work
pressure was previously measured by two question items (McCabe et al. 2008). For each item,
its variance was split into two parts: common variance accounted for by the latent variable “work
pressure”, and unique variance mainly explained by the error. In my work, work pressure was
confirmed using CFA.
Internal-consistency describes the extent to which all the items in a test measure the same
concept or construct and hence it is connected to the inter-relatedness of the items within the
test (Tavakol and Dennick 2011). Alpha is used to measure the internal-consistency of a factor,
and it is expressed as a number between 0 and 1. If the items of a factor are correlated to each
other, the value of alpha is increased. However, a high coefficient alpha does not always mean
a high degree of internal consistency. This is because alpha is also affected by the length of the
test. If the test length is too short, the value of alpha is reduced. Thus, to increase alpha, more
related items testing the same construct should be added to the test. It is also important to note
that alpha is a property of the scores on a test from a specific sample. Therefore, alpha
estimates should be measured each time the test is administered.
Structural equation modeling (SEM) is a combination of factor analysis and regression or
path analysis (Hox and Bechger 1998). There are two major reasons why SEM were chosen.
First, it is a good approach to testing a potential causal relationship between latent constructs.

10
Second, in contrast to ordinary regression analysis, SEM considers several equations
simultaneously. The same variable may represent an independent variable in one equation and
a dependent variable in another equation. Basic assumptions of SEM are the univariate
normality and multivariate normality of all the variables. Robust maximum likelihood estimation
technique was used to handle the multivariate non-normality (Brown 2015; Byrne 2001a). In
Amos, the robust estimation was achieved by a bootstrapping procedure (10000 bootstrap
samples and 95% confidence intervals). The key idea underlying bootstrapping is that it creates
multiple subsamples from an original data set and the bootstrapping sampling distribution is
rendered free from normality assumptions (Byrne 2001b). In my work, bootstrap samples were
randomly selected 10,000 times and the sample size for each selection is the same as the
number of valid cases after data cleaning. For example, in chapter 4, there were 403 cases after
data cleaning. Thus, for each random selection, 403 random observations were selected from
the original data. Some data points may be selected more than once, while others may be not at
al. For each newly generated data, parameters (e.g. path coefficients) and their associated
standard errors were calculated. Finally, the average of parameter estimates across the
bootstrap samples were calculated.
SEM assesses both the measurement model and the structural model (Gefen et al. 2000). In
the measurement model, loadings of observed items on their expected latent variables
(constructs) are obtained. The structural model describes the causation among a set of
dependent and independent constructs. It is worth noting that the structural model only implies
the causation when the data are longitudinal data. In SEM, latent constructs are represented by
ellipses, and observed variables are represented by rectangles. The item loadings of observed
items are the correlation coefficients (r) and the causation relationships are defined by
standardized regression coefficients (β). Figure 1-5 gives an example of SEM. In the model,
interpersonal conflicts at work (ICWC) is a latent construct defined by three observed questions
in the survey. This part is the measurement model. Item loadings of CC1, CC2, and CC3 on
ICWC are represented by the correlation coefficients r1, r2, and r3. After obtaining ICWC, the
structural model defines the causation relationship between ICWC and unsafe events, where
unsafe events (dependent variable) are predicted by ICWC (independent variable).

11
CC1
ICWCCC2
CC3
Unsafe eventsβ
r1
r2
r3
Figure 1-5. Example of SEM
Mediation is a hypothesized causal chain in which one variable affects a second variable that,
in turn, affects a third variable (Kenny 2016). Mediation analysis is a regression-based
approach, which is conducted by several steps. For example, in Figure 1-6 (a part of the model
in chapter 3), ICWs fully mediates the impact of IR on ICWc. This is because if ICWc is only
predicted by IR (blue dashed line), then the standardized regression coefficient is -0.31; if ICWs
is predicted by IR, then the standardized regression coefficient is -0.29; however, if ICWc is
correlated with IR and ICWs simutenously, then only ICWs is a significnat predictor while IR not.
In addition, if the IR regression coeffecint in step (3) (Figure 1-7) is less than that in step (1) but
still significant, then ICWs partially mediates the impact of IR on ICWc.
Figure 1-6. Example of mediation analysis
Regarding model fit indices of SEM, there is no consensus about which fit indices to use.
Hooper et al. (2008) suggested reporting a variety of indices because different aspects of model
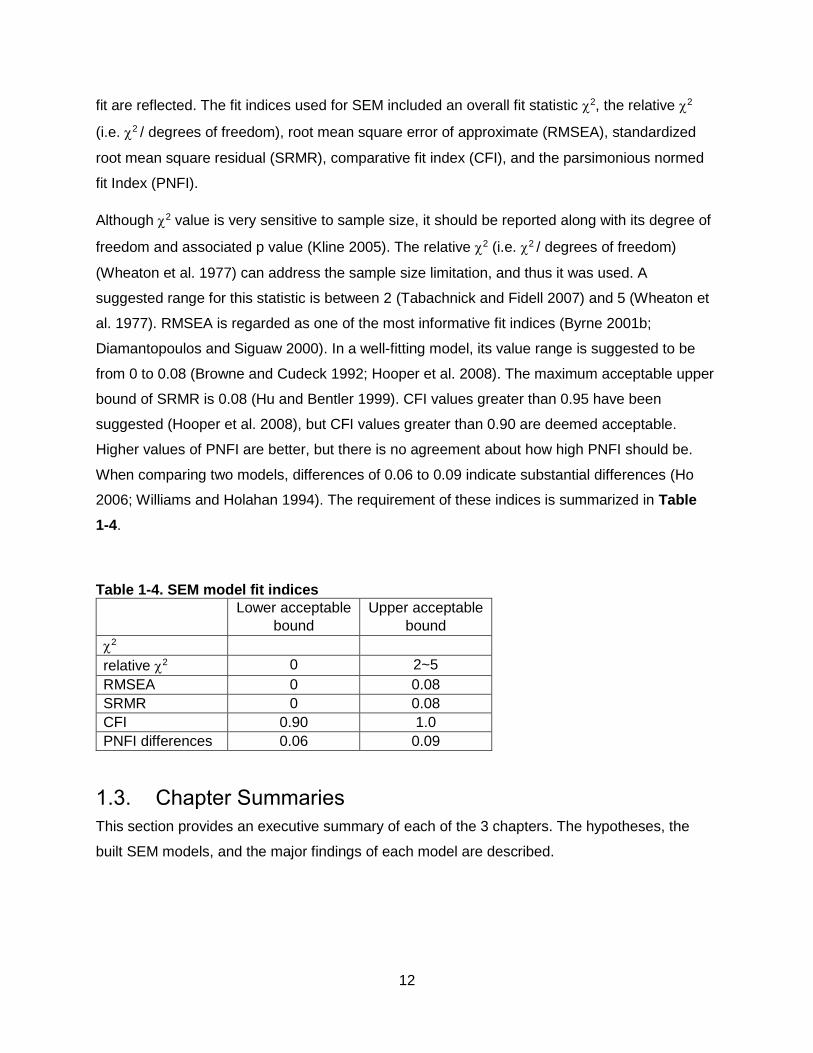
12
fit are reflected. The fit indices used for SEM included an overall fit statistic 2, the relative 2
(i.e. 2 / degrees of freedom), root mean square error of approximate (RMSEA), standardized
root mean square residual (SRMR), comparative fit index (CFI), and the parsimonious normed
fit Index (PNFI).
Although 2 value is very sensitive to sample size, it should be reported along with its degree of
freedom and associated p value (Kline 2005). The relative 2 (i.e. 2 / degrees of freedom)
(Wheaton et al. 1977) can address the sample size limitation, and thus it was used. A
suggested range for this statistic is between 2 (Tabachnick and Fidell 2007) and 5 (Wheaton et
al. 1977). RMSEA is regarded as one of the most informative fit indices (Byrne 2001b;
Diamantopoulos and Siguaw 2000). In a well-fitting model, its value range is suggested to be
from 0 to 0.08 (Browne and Cudeck 1992; Hooper et al. 2008). The maximum acceptable upper
bound of SRMR is 0.08 (Hu and Bentler 1999). CFI values greater than 0.95 have been
suggested (Hooper et al. 2008), but CFI values greater than 0.90 are deemed acceptable.
Higher values of PNFI are better, but there is no agreement about how high PNFI should be.
When comparing two models, differences of 0.06 to 0.09 indicate substantial differences (Ho
2006; Williams and Holahan 1994). The requirement of these indices is summarized in Table
1-4.
Table 1-4. SEM model fit indices
Lower acceptable
bound
Upper acceptable
bound
2
relative 2 0 2~5
RMSEA 0 0.08
SRMR 0 0.08
CFI 0.90 1.0
PNFI differences 0.06 0.09
1.3. Chapter Summaries
This section provides an executive summary of each of the 3 chapters. The hypotheses, the
built SEM models, and the major findings of each model are described.

13
1.3.1. Chapter 2 “Impact of individual resilience and safety climate on safety performance and psychological stress of construction workers: a case study of the Ontario construction industry”
Chapter 2 investigated the impact of individual resilience and safety climate on safety
performance of the Ontario construction workers. Six most cited factors in the literature on
construction safety climate including management commitment to safety, supervisor safety
perception, co-worker safety perception, work pressure, role overload, and safety knowledge
were used to define safety climate. Four hypotheses were tested, among which three were
supported as shown by the check marks. A SEM model was built, as shown in Figure 1-7.
H1: safety climate is negatively related to physical safety outcomes
H2: IR is negatively related to physical safety outcomes
H3: IR is negatively related to job stress
H4: Safety outcomes are positively related to job stress.
Safety climate
Management
commitment
to safety
Supervisor
safety
perception
Coworker
safety
perception
Work
pressure
Role overload
Safety
knowledge
Individual
resilience
0.8
50.77
0.51
-0.78
-0.40
0.61
Physical injuries
Unsafe events
Job stress
0..60
-0.11
-0.17
-0.24
0.58
0.39
0.15
Figure 1-7. Safety climate, individual resilience, and safety outcomes
The major findings of this paper are that safety climate affects not only physical safety outcomes
but also job stress, and individual resilience affects job stress of construction workers, especially
post-trauma psychological health. Given these findings, construction organizations need to not

14
only monitor employees’ safety performance but also their psychological well-being. Promoting
a positive safety climate together with developing training programs focusing on improving
employees’ psychological health, especially post-trauma psychological health, can improve
organizations’ safety performance. This chapter has been published in Journal of Safety
Research.
1.3.2. Chapter 3 “The relationship between individual resilience,
interpersonal conflicts at work, safety outcomes of construction workers”
Interpersonal conflicts at work (ICW) mainly has two forms on a construction site: conflicts with
supervisors (ICWS) and conflicts with coworkers (ICWC). Chapter 3 examined the occurrence of
ICWS and ICWC on construction sites, and investigated the relationship among ICWS, ICWC and
physical safety outcomes together with job stress. In addition, possible antecedents of ICWS
and ICWC including workhours, mobility, and individual resilience were examined. Six major
hypotheses were tested, and four of them were supported as shown by the check marks. A
SEM model was built, as shown in Figure 1-8.
H1: ICW is positively associated with physical safety outcomes
H1(a): ICWS is positively associated with physical injuries
H1(b): ICWS is positively associated with unsafe events
H1©: ICWC is positively associated with physical injuries
H1(d): ICWC is positively associated with unsafe events
H2: ICW is positively associated with job stress
H2(a): ICWS is positively associated with job stress
H2(b): ICWC is positively associated with job stress
H3: number of hours worked in the previous month is positively associated with ICW
H3(a): weekly workhours is positively associated with ICWS
H3(b): weekly workhours is positively associated with ICWC
H4: number of employers in the previous 3 years is positively associated with ICW
H4(a): number of employers is positively associated with ICWS
H4(b): number of employers is positively associated with ICWC
H5: number of projects in the previous 3 years is positively associated with ICW
H5(a): number of projects is positively associated with ICWS
H5(b): number of projects is positively associated with ICWC
H6: IR is negatively associated with ICW
H6(a): IR is negatively associated with ICWS
H6(b): IR is negatively associated with ICWC

15
IR
ICWs ICWc
Weekly workhours Job stress
Physical injuries
Unsafe events
-0.29
0.81 0.24
0.61
0.1
3
0.09
0.39
-0.08
0.15
0.0
9
Figure 1-8. Individual resilience, interpersonal conflicts at work, and safety performance
This chapter leads to several conclusions. Although ICW was reported as quite often or very
often by only 6.3% of respondents, it had a significant effect on both physical safety outcomes
including physical injuries and unsafe events, and job stress. Individual resilience (IR) had a
significant negative correlation with both ICWS and ICWC, which in turn could decrease the
frequency of physical safety outcomes and job stress. The contributions to the Body of
Knowledge are: safety professionals may consider adding coping skill training safety programs
to improve the individual resilience of their workforce and reduce conflict-related safety
outcomes. This chapter has been accepted for publication in Journal of Construction
Engineering and Management.
1.3.3. Chapter 4 “Resilience on construction sites: testing a structural
equation model”
Chapter 4 investigated the impact of organizational resilience on safety performance of
construction workers. Seven factors were used to measure resilience, including management
commitment to safety (MC), supervisor safety perception (SS), coworker safety perception (CS),
reporting (RP), learning (LN), anticipation (AN), and awareness (AW). Eight hypotheses were
proposed and supported, as shown in Table 1-5. Some of the hypotheses were directly
supported as shown by the check marks, and the remaining ones were indirectly supported as
shown by the arrow marks. A SEM model describing all the hypothesized relationships was
shown in Figure 1-9.

16
Table 1-5. Hypotheses and testing results
Hypothesis number
Investigated factors
relation Potential correlated factors
(a) (b)
H1 MC positive LN RP
H2 SS positive LN RP
H3 LN positive AN AW
H4 RP positive AN AW
H5 SS positive AN AW
H6 CS positive AN AW
H7 AN negative Unsafe events -
H8 AW negative Unsafe events -
: direct impact supported : indirect impact supported The major findings of this paper are that safety improvement needs effort from all organizational
levels including management, supervisors, and front line workers. Management commitment to
safety is the key to promoting a good site-level safety culture via the impact on supervisors.
Safety awareness is the final variable that affects not only physical injuries, unsafe events, but
also job stress. In addition to supervisor safety perception, co-worker safety perception was a
critical factor affecting employee’s awareness. Given these findings, construction organizations
can improve employees’ safety awareness by promoting a good reporting and learning culture,
and enhancing the safety perceptions of workers’ supervisors and coworkers. This chapter has
been submitted to Safety Science.

17
Management
commitment to safety
Reporting
Learning
Supervisor safety
perception
Coworker safety
perception
Awareness
Anticipation
Physical
injuries
Unsafe events
Job stress
ns
0.29
0.71 0.68
0.2
40.5
8
0.17
0.41
0.57
0.1
5
0.4
3
-0.16
ns
0.63
0.17
-0.26
Figure 1-9. Resilience model

18

19

20
Chapter 2 Impact of individual resilience and safety climate on safety
performance and psychological stress of construction workers: a case study of the Ontario construction industry
Yuting Chen, Brenda McCabe and Douglas Hyatt
Abstract
Introduction
The construction industry has reached a plateau in terms of safety performance. Safety climate
is regarded as a leading indicator of safety performance; however, relatively little safety climate
research has been done in the Canadian construction industry. Given that safety climate may
be geographically sensitive, it is necessary to examine how the construct of safety climate is
defined and used to improve safety performance in different countries and regions. On the other
hand, more and more attention has been paid to job related stress in the construction industry.
Previous research proposed that individual resilience may be associated with a better safety
performance and may help employees manage stress. Unfortunately, few empirical research
studies have examined this hypothesis. This paper aims to examine the role of safety climate
and individual resilience in safety performance and job stress in the Canadian construction
industry.
Method
The research was based on 837 surveys collected in Ontario between June, 2015 and June,
2016. Structural equation modeling (SEM) techniques were used to explore the impact of
individual resilience and safety climate on physical safety outcomes and on psychological stress
among construction workers.
Results
The results show that safety climate not only affected construction workers’ safety performance
but also indirectly affects their psychological stress. In addition, it was found that individual

21
resilience has a direct negative impact on psychological stress but had no impacts on safety
outcomes.
Conclusions
These findings highlight the roles of both organizational and individual factors in individual
safety performance and in psychological well-being.
Practical applications
Given these findings, construction organizations need to not only monitor employees’ safety
performance, but also to assess their employees’ psychological well-being. Promoting a positive
safety climate together with developing training programs focusing on improving employees’
psychological health – especially post-trauma psychological health - can improve the safety
performance of an organization.
2.1. Introduction
The construction industry plays an important role in Ontario’s economic growth and
employment. Since 2003, the Ontario government invested nearly $3 billion in the residential
sector, which created 60,000 jobs (Ontario 2014). However, safety remains one of the biggest
challenges in construction (Becerik-Gerber and Siddiqui 2014). Over the 10 year period from
2004 to 2013, the construction sector accounted for 26.6% of all workplace traumatic fatalities in
Ontario, the highest percentage of any industry (WSIB 2013). Meanwhile, the fatality rate in the
Ontario construction has shown little improvement since the 1990s, as shown in Figure 2-1.
22
1970 1980 1990 2000 2010
0
10
20
30
40
Construction Safety Act
1973tra
umat
ic fa
talit
y ra
te p
er 1
00,0
00 w
orke
rs
Year
Safety culture was brought to attention
after Chernobyl disaster
1986
Figure 2-1. Traumatic Fatality Rate in Ontario Construction (1965-2013)1,2,3
1: (IHSA 2008)
2: (AWCBC 2013)
3: (Statistics Canada 2015a)
Between 1965 and 1995, there was a steady decrease in the fatality rate. The decrease is due
in part to the enforcement of an increasingly more comprehensive construction safety act that
brought about greater safety awareness. After 1995, however, the industry continued to
experience approximately 5 fatalities per 100,000 construction workers per year. The plateau
phenomenon in safety performance can be observed in other jurisdictions as well, such as New
Zealand (Guo et al. 2016) and Australia (Lingard et al. 2010). Similarly, the rate of safety
improvement in other countries, such as the U.S.A., has been slowing (BLS 2014; Mendeloff
and Staetsky 2014; NIOSH 2001).
In addition to the physical safety outcomes, herein safety outcomes refer to unsafe outcomes
(e.g. eye injuries and pinch), job related stress in the construction industry is also attracting
more and more attention. The relatively dangerous work environment, intense job demand,
group work style, and interpersonal relationships, etc., increase construction workers’ risk for
adverse psychological outcomes (Goldenhar et al. 2003). Stress affects both employees’
performance and their health if they are unable to manage it (Cattell et al. 2016). In a review of
46 papers published between 1989 and 2013 about work related stress in the construction
industry (Leung et al. 2015), the geographical distribution of the studies indicated which areas

23
around the world are leading this emerging field. Half of the work on work related stress was
from Hong Kong (50%), with the remaining research distributed between Europe (22%),
Australia (15%), Africa (11%), and USA (2%). More research on job stress in the North
American construction industry may identify factors that are associated with psychological
stress of workers, and thus may uncover ways to escape the safety plateau.
Safety culture has been shown to improve safety performance. Safety culture is a set of beliefs,
norms, attitudes, roles, and social and technical practices focused on minimizing the exposure
of employees to dangerous conditions (Pidgeon 1991; Turner et al. 1989). It is an abstract
phenomenon and therefore challenging to measure. One indicator of safety culture is safety
climate, which refers to the shared perception of people toward safety in their work environment
(Zohar 1980). Measuring safety climate gives insight into safety culture in its current state (Cox
and Cheyne 2000; Glendon and Stanton 2000). In addition, individual resilience is associated
with higher coping abilities (Wanberg and Banas 2000); thus, it is believed that individual
resilience is associated with lower job stress and better safety performance. The remainder of
Section 1 discusses the dimensions of construction safety climate and the definition of individual
resilience, and proposes four hypotheses.
2.1.1. Safety climate dimensions
Safety climate has been widely recognized as a leading indicator for measuring safety
performance versus lagging indicators such as lost time injury and accident rates (Flin et al.
2000). Although there is no agreement on the dimensions of safety climate, management
commitment to safety is a widely acknowledged organizational level safety climate factor across
industries. For example, perceived management attitudes toward safety was originally proposed
as a leading safety climate factor based on surveys from 20 industrial organizations (Zohar
1980). More recent work used four factors to measure safety climate: management commitment
to safety, return to work policies, post-injury administration, and safety training (Huang et al.
2006). In addition to management commitment to safety in the construction industry research
(Cigularov et al. 2013; Dedobbeleer and Béland 1991; Gillen et al. 2002; Guo et al. 2016; Hon
et al. 2014; Tholén et al. 2013), a set of dimensions have been proposed, mainly including work
pressure focusing on the balance between production and safety (Cigularov et al. 2013;
Glendon and Litherland 2001; Guo et al. 2016), support from supervisors and/or coworkers
(Cigularov et al. 2013; Guo et al. 2016; Kines et al. 2010), and, safety equipment or knowledge
needed to have control over safety (Cigularov et al. 2013; Gillen et al. 2002; Glendon and
Litherland 2001; Guo et al. 2016). It is worth noting that statements of a scale with the same

24
name may be different and the same statement may be put into different factors. For instance,
safety communications may fall under the scale of management commitment to occupational
health and safety (OHS) and employee involvement (Hon et al. 2014), while others may use a
separate scale to measure safety communication (Tholén et al. 2013).
2.1.2. Safety climate and safety outcomes
Safety climate is regarded a leading indicator of safety outcomes and positive evidence has
been identified in the construction industry. For example, it has been found that safety climate
was negatively related to near misses and injuries in the Hong Kong construction industry (Fang
et al. 2006; Hon et al. 2014) and positively related to safety behavior in the Queensland
construction sites (Mohamed 2002). Safety climate was also found to be inversely related to
underreporting of workplace injuries and illness in a northwestern US construction site (Probst
et al. 2008). Moreover, some research found that safety climate may be affected by the country
of a culture (Ali 2006), because a manager’s decision on safety management may be influenced
by his/her cultural norms. From this point of view, safety climate may be geographically
different. Given that relatively little evidence of the safety climate in the Canadian construction
industry was reported in the past decade, there is clear value in assessing the safety climate in
the Canadian construction and exploring its relationship with safety outcomes. This leads to
hypothesis 1:
H1: safety climate is negatively related to safety outcomes
2.1.3. Individual resilience, safety outcomes, and psychological stress
Individual resilience (IR) is “the capacity of individuals to cope successfully in the face of
significant change, adversity, or risk. This capacity changes over time and is enhanced by
protective factors in the individual and environment” (Stewart et al. 1997). It is regarded as one
type of positive psychological capacity for performance improvement (Luthans 2002; Youssef
and Luthans 2007). To extend an individual's physical and psychological resources, IR may
help individuals deal with stressors that are inherent in the work environment but cannot be
changed, e.g., work pressure (Cooper and Cartwright 1997), thus it may improve employees’
performance by reducing counter-productive behaviors and help manage their work related
stress (Avey et al. 2011). Several studies found evidence to support its positive role. For
example, IR was found to be directly related to job satisfaction, work happiness, and
organizational commitment (Youssef and Luthans 2007). It was also found to be indirectly
associated with less work irritation, and weaker intentions to quit given that IR is associated with

25
higher change acceptance (Wanberg and Banas 2000). IR was also reported to be negatively
related to depressive symptoms of frontline correctional officers (Liu et al. 2013). It is further
believed that positive psychological resource capacities may facilitate safety focused behaviors
(Eid et al. 2012). However, the authors were unable to find any empirical studies that have
examined if IR is associated with better safety performance and lower job stress in the
construction industry. This leads to two more hypotheses:
H2: IR is negatively related to safety outcomes
H3: IR is negatively related to psychological stress
2.1.4. Injuries and psychological stress
Serious injuries, exposure to actual or threatened death, and other traumatic experiences may
result in post-traumatic stress disorder (PTSD) (Ontario Centre for Suicide Prevention 2015). A
study of 41 male construction workers in China found that workers exposed to a fatal accident
had significantly higher symptoms of depression, such as insomnia and decreased interest in
work and other activities (Hu et al. 2000). In turn, individuals under high psychological stress
tend to have more incidents; psychological stress has been found to predict accidents rates (Siu
et al. 2004) or safety behaviors (Leung et al. 2016) in the Hong Kong construction industry. This
is a vicious spiral. Finding ways to help employees manage job related stress is important. It is
reasonable to expect that injuries and job stress are positively correlated. This leads to another
hypothesis:
H4: Safety outcomes are positively associated with job stress.
2.2. Methods
2.2.1. Data and procedure
2.2.1.1. Survey instrument
To test the four hypotheses developed, this research used a self-administered questionnaire
adapted from the previous research (McCabe et al. 2008). Minor modifications to the survey
questions were done, such as adding individual resilience questions. The self-administered
questionnaires comprised three sections: demographics, attitude statements, and incident
reporting. The demographics section included questions, such as age and working time with the
current employer. In the attitudinal section, respondents indicated the degree to which they
agree with the statements using a Likert scale between 1 (strongly disagree) and 5 (strongly

26
agree). In the incident reporting part, the respondents were asked how frequently they
experienced incidents on the job in the 3 months previous to the survey. There are three
categories of incidents: physical injuries, unsafe events, and job stress. Physical injuries and
unsafe events are regarded as physical safety outcomes. Job stress describe job related stress.
Physical injuries, such as respiratory injuries, may be associated with certain jobs in the
construction industry. Unsafe events comprise events that respondents may have experienced
without necessarily resulting in an injury, such as “slip/trip/fall on same level”. One example of
job stress is “lost sleep due to work-related worries”.
2.2.1.2. Data collection
A multi-site data collection strategy was employed. In total, 837 surveys were collected from 112
construction sites between July 2015 and July 2016. For each site, at least two research
assistants were on site to distribute surveys to workers. They provided immediate help to
workers if they had a question, which improved the reliability and completeness of the data. No
follow up was undertaken as the questionnaires were strictly anonymous. The number of
surveys collected from each site ranged from 1 to 42, with an average around 8 workers. Each
survey required approximately 4 person-hours of research time, including finding sites,
communicating with corporate employees and site superintendents, transportation to site, and
data collection. This is consistent with findings from 2014 (Chen et al. 2015).
2.2.1.3. Demographics of the respondents
The respondents were from the high-rise residential, low-rise residential, heavy civil,
institutional, and commercial sectors. Among the respondents, 69.3% were from construction
sites in the Greater Toronto Area (GTA) with the remainder from areas outside the GTA but
within the Province of Ontario area, extending from Ottawa to Thunder Bay. Table 2-1 shows
demographic information of the respondents. The mean age of the respondents was 37 years
(SD=12) and 98% were male; 69% of workers were journeymen or apprentices. The
respondents had been employed by their current employers for just over 6 years on average,
but half of them had worked with their employers less than 4 years. Respondents reported
relatively high mobility between projects. The weekly working hours of the respondents were
approximately 44 hours, and 37.8% worked more than 44 hours, which is considered overtime
(Ontario Ministry of Labour 2015). The respondents also reported a very high safety training
percentage (97.7%) and 38.1% reported that they had the experience of being a safety
committee member. Finally, approximately 61% of the respondents were union members.

27
Table 2-1. Demographics of respondents
Demographic factors Response
range Mean or percent
Median
Gender Male / Female 98% male -
Age 16 to 67 37.11 36.00
Years in construction 0.01 to 46 14.30 11.00
Years with the current employer 0.01 to 45 6.30 3.70
Number of construction employers in previous 3 yrs 1 to 100 2.33 1.00
Number of projects worked in previous 3 yrs 1 to 300 9.85 5.00
Average hours worked per week in previous month 9 to 100 44.24 42.00
Did respondent have any job-related safety training Yes or No 97.7% yes -
Was respondent ever a safety committee member Yes or No 38.1% yes -
Was respondent a member of a union Yes or No 60.7% yes -
Job position
Supervisor 31.3% -
Journeyman 50.5% -
Apprentice 18.2% -
Our data were also compared to Statistics Canada Ontario construction workforce data on
gender, age, and employee distribution by company size from 2011 to 2015, as shown in Table
2-2. Age distribution is reasonably similar, while our data had a lower percentage of female
workers and a lower percentage of workers from micro-sized companies. One possible reason
for fewer female respondents is that our data is site focused while the government data may
include administration employees in site offices. It is very challenging to capture the employees
of micro-sized companies as they are typically less motivated to participate in any activities that
distract from their work, including research.
Table 2-2. Data representativeness
Category Our Sample Verification data1,2
2011-2015
Gender distribution
Male 98.0% 88.9%
Female 2.0% 11.1%
Age distribution
15-24 years 14.7% 11.9%
25-54 years 75.8% 71.6%
55 years & over 9.4% 16.5%
Employee distribution by employer size
Micro (1-4 employees) 5.1% 16.6%
Small (5-99 employees) 55.7% 57.4%

28
Medium (100-499 employees) 25.7% 13.8%
Large (500+ employees) 13.5% 12.3% 1:(Statistics Canada 2015b)
2: (Statistics Canada 2015c)
2.2.1.4. Incidents
Incident reporting responses were discrete choices of ‘never’, ‘once’, ‘two to three times’, ‘four to
five times’, and ‘more than 5 times. For each of the incident questions, these were transcribed
as 0, 1, 2, 4, and 5 respectively. As such, incident counts reported herein are conservative.
Then, for each of the three incident categories, namely, physical injuries, job stress, and unsafe
events, the incident counts were summed for each respondent.
Table 2-3 shows the frequency of safety outcomes. In total, 80.6% and 66.7% of the
respondents reported at least one occurrence of physical injuries and unsafe events in the
previous 3 months. This number is not surprising, because the aggregated value of physical
injuries and unsafe events included incidents like cuts that are not severe but have very high
occurrences. Cut or puncture, headache/dizziness, strains or sprains, and persistent fatigue are
the most frequently experienced physical injuries and approximately 50% of the participants
experienced at least one of these four symptoms in the previous 3 months. In terms of unsafe
events, 42% of the respondents experienced overexertion, and approximately 34% experienced
slip/trip/fall on the same level, pinch, and exposure to chemicals at least once in the previous 3
months. With regard to the more severe incidents, such as dislocated or fractured bone and fall
from height, it is very surprising that 30 to 40 respondents experienced these incidents recently.
Table 2-3. Frequency of safety outcomes
Report at least one
occurrence in previous 3 months (%)
Physical injuries 80.6
cut/puncture 53.4
headache/dizziness 52.8
strains/sprains 50.8
persistent fatigue 47.7
skin rash/burn 24.7
eye injury 11.8
respiratory injuries 10.7
temporary loss of hearing 8.9
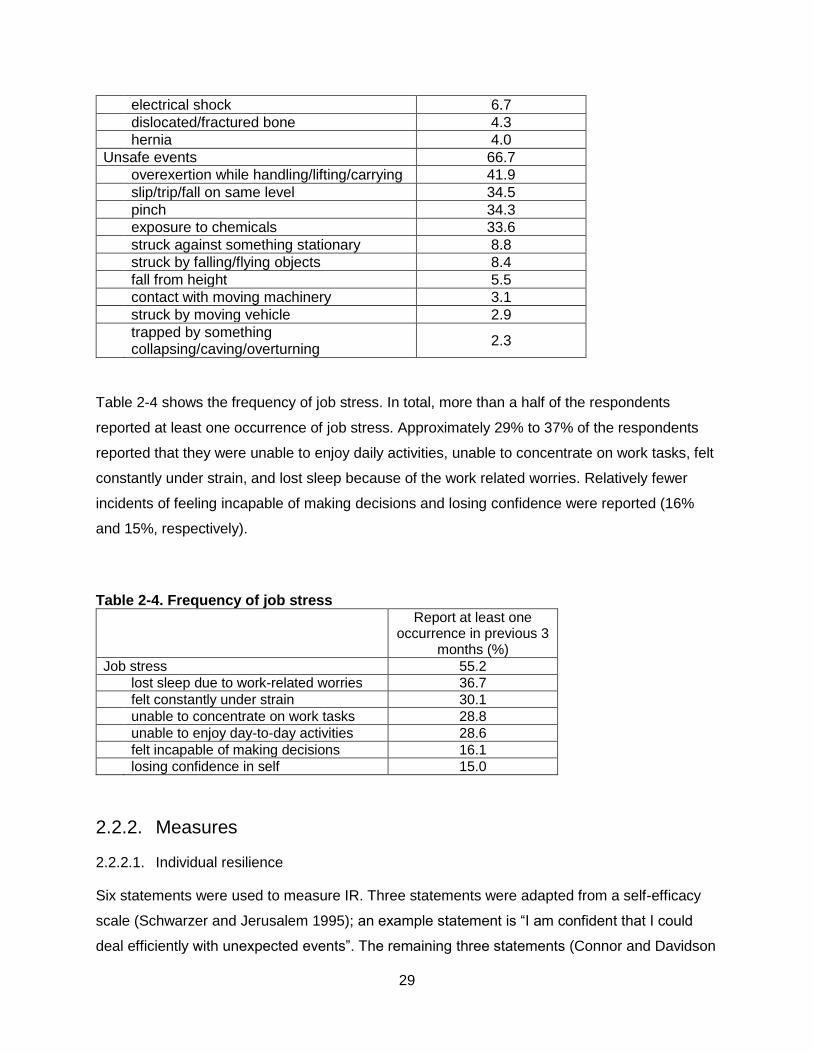
29
electrical shock 6.7
dislocated/fractured bone 4.3
hernia 4.0
Unsafe events 66.7
overexertion while handling/lifting/carrying 41.9
slip/trip/fall on same level 34.5
pinch 34.3
exposure to chemicals 33.6
struck against something stationary 8.8
struck by falling/flying objects 8.4
fall from height 5.5
contact with moving machinery 3.1
struck by moving vehicle 2.9
trapped by something collapsing/caving/overturning
2.3
Table 2-4 shows the frequency of job stress. In total, more than a half of the respondents
reported at least one occurrence of job stress. Approximately 29% to 37% of the respondents
reported that they were unable to enjoy daily activities, unable to concentrate on work tasks, felt
constantly under strain, and lost sleep because of the work related worries. Relatively fewer
incidents of feeling incapable of making decisions and losing confidence were reported (16%
and 15%, respectively).
Table 2-4. Frequency of job stress
Report at least one
occurrence in previous 3 months (%)
Job stress 55.2
lost sleep due to work-related worries 36.7
felt constantly under strain 30.1
unable to concentrate on work tasks 28.8
unable to enjoy day-to-day activities 28.6
felt incapable of making decisions 16.1
losing confidence in self 15.0
2.2.2. Measures
2.2.2.1. Individual resilience
Six statements were used to measure IR. Three statements were adapted from a self-efficacy
scale (Schwarzer and Jerusalem 1995); an example statement is “I am confident that I could
deal efficiently with unexpected events”. The remaining three statements (Connor and Davidson
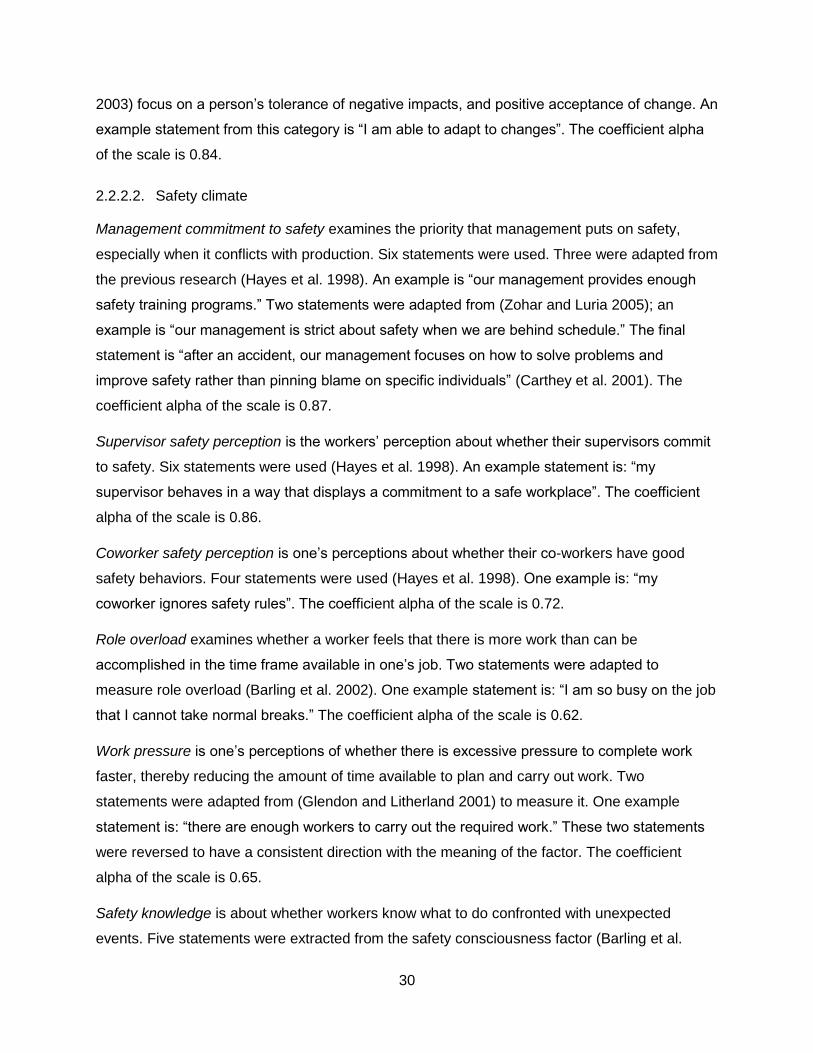
30
2003) focus on a person’s tolerance of negative impacts, and positive acceptance of change. An
example statement from this category is “I am able to adapt to changes”. The coefficient alpha
of the scale is 0.84.
2.2.2.2. Safety climate
Management commitment to safety examines the priority that management puts on safety,
especially when it conflicts with production. Six statements were used. Three were adapted from
the previous research (Hayes et al. 1998). An example is “our management provides enough
safety training programs.” Two statements were adapted from (Zohar and Luria 2005); an
example is “our management is strict about safety when we are behind schedule.” The final
statement is “after an accident, our management focuses on how to solve problems and
improve safety rather than pinning blame on specific individuals” (Carthey et al. 2001). The
coefficient alpha of the scale is 0.87.
Supervisor safety perception is the workers’ perception about whether their supervisors commit
to safety. Six statements were used (Hayes et al. 1998). An example statement is: “my
supervisor behaves in a way that displays a commitment to a safe workplace”. The coefficient
alpha of the scale is 0.86.
Coworker safety perception is one’s perceptions about whether their co-workers have good
safety behaviors. Four statements were used (Hayes et al. 1998). One example is: “my
coworker ignores safety rules”. The coefficient alpha of the scale is 0.72.
Role overload examines whether a worker feels that there is more work than can be
accomplished in the time frame available in one’s job. Two statements were adapted to
measure role overload (Barling et al. 2002). One example statement is: “I am so busy on the job
that I cannot take normal breaks.” The coefficient alpha of the scale is 0.62.
Work pressure is one’s perceptions of whether there is excessive pressure to complete work
faster, thereby reducing the amount of time available to plan and carry out work. Two
statements were adapted from (Glendon and Litherland 2001) to measure it. One example
statement is: “there are enough workers to carry out the required work.” These two statements
were reversed to have a consistent direction with the meaning of the factor. The coefficient
alpha of the scale is 0.65.
Safety knowledge is about whether workers know what to do confronted with unexpected
events. Five statements were extracted from the safety consciousness factor (Barling et al.
31
2002). One example statement is “I know what to do if an emergency occurred on my shift.” The
coefficient alpha of the scale is 0.79.
The suggested alpha values range from 0.7 to 0.90 (Tavakol and Dennick 2011). Although the
alpha values of work pressure and role overload are less than 0.7, lower alpha values can be
accepted (Loewenthal 2001).
2.2.3. Data analysis
2.2.3.1. Data screening
Before performing any analysis, some data management was undertaken. Fifty four cases were
removed because of a high proportion of data missing (>10%). Thus, 783 cases were used for
the analysis (672 surveys complete and 111 with on average 5% missing information). Four
statement responses were reversed to have the same perception direction as other statements
in the same scale. For example, “My coworkers ignore safety rules” was reversed to be
directionally consistent with “My coworkers encourage others to be safe”. Finally, missing values
of one variable were replaced with the means of that variable across all subjects.
Regarding the univariate normality of all the variables, none of the observed variables were
significantly skewed or highly kurtotic. The absolute values of the skewness of the variables
were less than or equal to 2 and the kurtosis was less than or equal to 7 (Kim 2013). However,
the original data had multivariate non-normality and outlier issues, hence, variable
transformations using log10 function were attempted based on their distributions (Tabachnick
and Fidell 2007). For example, one variable “I always wear the protective equipment or clothing
required on my job” was transformed using log10 function because it had substantial negative
skewness. Although there was a slight improvement after variable transformations, multivariate
non-normality and outliers still existed. One hundred cases with extreme values were reported
via Mahalanobis distance detection. Thus, data transformations were not considered for the
following analysis. After examination, it is believed that the outliers are the natural variation of
the data. Thus, the cases with extreme values were kept.
2.2.3.2. Analysis procedure
The statistical analyses were performed using IBM SPSS Statistics and Amos (Windows version
23). The first step was to determine whether the proposed six dimensions of safety climate were
conceptually distinct. Considering that the measures used in the present study were adapted
from the research completed ten years ago (McCabe et al. 2008), a set of confirmatory factor

32
analyses were used to assess the adequacy of the previously mentioned scales. Robust
maximum likelihood estimation technique was used to handle the multivariate non-normality
(Brown 2015; Byrne 2001a). In Amos, the robust estimation was achieved by a bootstrapping
procedure (10000 bootstrap samples and 95% confidence intervals). The key idea underlying
bootstrapping is that it creates multiple subsamples from an original data set and the
bootstrapping sampling distribution is rendered free from normality assumptions (Byrne 2001b).
Internal-consistency reliability tests were also conducted to show how well the individual scale
statements reflected a common, underlying construct. Then descriptive statistics and
correlations of the studied variables were analyzed. Finally, structural equation modeling
techniques were used to examine IR and the six hypothesized safety climate factors in relation
to safety outcomes and job stress.
2.2.3.3. Model fit indices
There is no consensus about which indices to use. Hooper et al. (2008) have suggested
reporting different types of indices because different indices reflect different aspects of model fit.
The fit indices used for structural equation modeling included an overall fit statistic 2, the
relative 2 (i.e. 2 / degrees of freedom), root mean square error of approximate (RMSEA),
standardized root mean square residual (SRMR), comparative fit index (CFI), and the
parsimonious normed fit Index (PNFI).
Although 2 value is very sensitive to sample size, it should be reported along with its degree of
freedom and associated p value (Kline 2005). The relative 2 (i.e. 2 / degrees of freedom)
(Wheaton et al. 1977) can address the sample size limitation, and thus it was used. A
suggested range for this statistic is between 2 (Tabachnick and Fidell 2007) and 5 (Wheaton et
al. 1977). RMSEA is regarded as one of the most informative fit indices (Byrne 2001b;
Diamantopoulos and Siguaw 2000). In a well-fitting model, its value range is suggested to be
from 0 to 0.08 (Browne and Cudeck 1992; Hooper et al. 2008). The maximum acceptable upper
bound of SRMR is 0.08 (Hu and Bentler 1999). CFI values greater than 0.95 have been
suggested (Hooper et al. 2008), but CFI values greater than 0.90 are deemed acceptable.
Higher values of PNFI are better, but there is no agreement about how high PNFI should be.
When comparing two models, differences of 0.06 to 0.09 indicate substantial differences (Ho
2006; Williams and Holahan 1994).
33
2.3. Results
2.3.1. Measurement model
A hypothesized six factor model was examined, composed of management commitment to
safety, supervisor safety perception, coworker safety perception, work pressure, role overload,
and safety knowledge. Five selected alternative competing models were also assessed (Table
2-5). These alternative models included a one-factor model, two-factor model, three-factor
model, four-factor model, and five-factor model.
All of the alternative competing models are nested in the proposed six-factor model, so the
hypothesized six-factor model was compared to each of the competing models based on the
Chi-square difference (2 diff) associated with the models. The 2 difference also follows a 2
distribution. For instance, the 2 value of the hypnotized six-factor model is 778.37 with a degree
of freedom is 252 and the 2 value of the alternative model 1 is 2119.35 with a degree of
freedom is 267. The 2 difference between these two models is 1340.98 with a degree of
freedom of 15, which is significant. This suggests that the six-factor model is superior to model
1. The results in Table 2-5 suggest that the hypothesized six-factor model performs better than
all the alternative models. The findings also show that the six scales are conceptually different.
Following these steps, individual resilience in relation to the six proposed factors of safety
climate were further examined. In the final measurement model (a total of seven factors, MC,
SS, CS, WP, RO, SK, and IR), 2 (405) =1124.68, P<0.01. The fit indices have the following
values: 2/ d.f.=2.78, RMSEA=0.048, SRMR=0.06, CFI=0.93, PNFI=0.78. Overall, the fit indices
suggest the final measurement model fits the data well.
Table 2-6 shows the factor loadings and squared multiple correlation (SMC) of each scale
statement. Table B-1 in Appendix B shows the detailed scale questions. All the estimates in
Table 2-6 are significant (p<0.001). The factor loadings are the correlation coefficients, ranging
from 0.42 to 0.82. In Amos, SMC of a statement variable is the proportion of its variance that is
accounted for by its predictors (Arbuckle 2012), which is actually R2. For example, SMC of
statement MC1 is 0.47, i.e. 47% variance of MC1 was explained by the factor “management
commitment to safety”. Lower and upper bound of SMC estimates were also given based on
10000 bootstrap samples with 95% confidence intervals. On the whole, SMCs ranged from 0.18
to 0.68. Accordingly, the adequacy of the measurement model was supported.

34
2.3.2. Inter-correlations among the variables
Table 2-7 displays descriptive statistics and the inter-correlations between the studied variables.
In general, management commitment to safety, supervisor safety perception, coworker safety
perception, safety knowledge, and individual resilience had significantly negative correlations
with physical injuries, unsafe events, and job stress. Work pressure and role overload were
positively related to physical injuries, unsafe events, and job stress. In addition, management
commitment to safety, supervisor safety perception, coworker safety perception, safety
knowledge, and individual resilience positively correlated with each other. Work pressure was
positively related to role overload. Physical injuries, unsafe events, and psychological stress
also positively correlated with each other. Finally, management commitment to safety and
supervisor safety perception had the strongest negative correlations with physical injuries and
unsafe events; and coworker safety perception had the strongest negative correlation with job
stress. Work pressure had the strongest positive correlations with physical injuries, unsafe
events, and psychological stress.
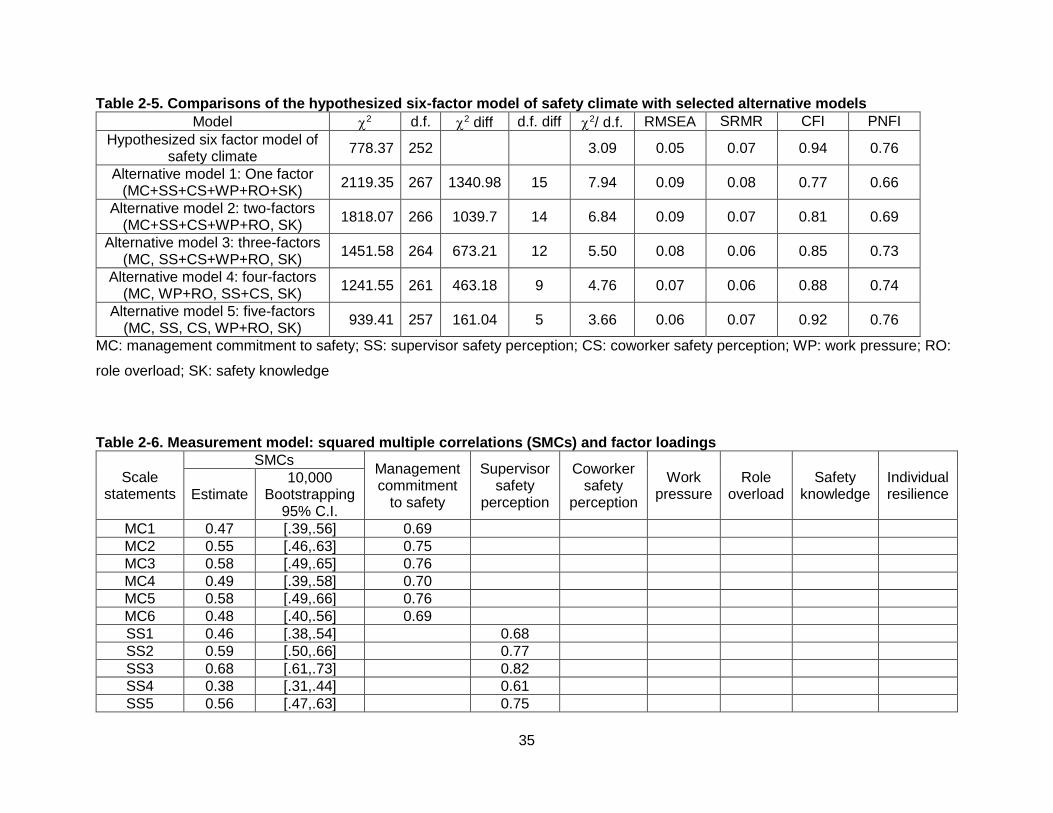
35
Table 2-5. Comparisons of the hypothesized six-factor model of safety climate with selected alternative models
Model 2 d.f. 2 diff d.f. diff 2/ d.f. RMSEA SRMR CFI PNFI
Hypothesized six factor model of safety climate
778.37 252 3.09 0.05 0.07 0.94 0.76
Alternative model 1: One factor (MC+SS+CS+WP+RO+SK)
2119.35 267 1340.98 15 7.94 0.09 0.08 0.77 0.66
Alternative model 2: two-factors (MC+SS+CS+WP+RO, SK)
1818.07 266 1039.7 14 6.84 0.09 0.07 0.81 0.69
Alternative model 3: three-factors (MC, SS+CS+WP+RO, SK)
1451.58 264 673.21 12 5.50 0.08 0.06 0.85 0.73
Alternative model 4: four-factors (MC, WP+RO, SS+CS, SK)
1241.55 261 463.18 9 4.76 0.07 0.06 0.88 0.74
Alternative model 5: five-factors (MC, SS, CS, WP+RO, SK)
939.41 257 161.04 5 3.66 0.06 0.07 0.92 0.76
MC: management commitment to safety; SS: supervisor safety perception; CS: coworker safety perception; WP: work pressure; RO:
role overload; SK: safety knowledge
Table 2-6. Measurement model: squared multiple correlations (SMCs) and factor loadings
Scale statements
SMCs Management commitment
to safety
Supervisor safety
perception
Coworker safety
perception
Work pressure
Role overload
Safety knowledge
Individual resilience Estimate
10,000 Bootstrapping
95% C.I.
MC1 0.47 [.39,.56] 0.69
MC2 0.55 [.46,.63] 0.75
MC3 0.58 [.49,.65] 0.76
MC4 0.49 [.39,.58] 0.70
MC5 0.58 [.49,.66] 0.76
MC6 0.48 [.40,.56] 0.69
SS1 0.46 [.38,.54] 0.68
SS2 0.59 [.50,.66] 0.77
SS3 0.68 [.61,.73] 0.82
SS4 0.38 [.31,.44] 0.61
SS5 0.56 [.47,.63] 0.75
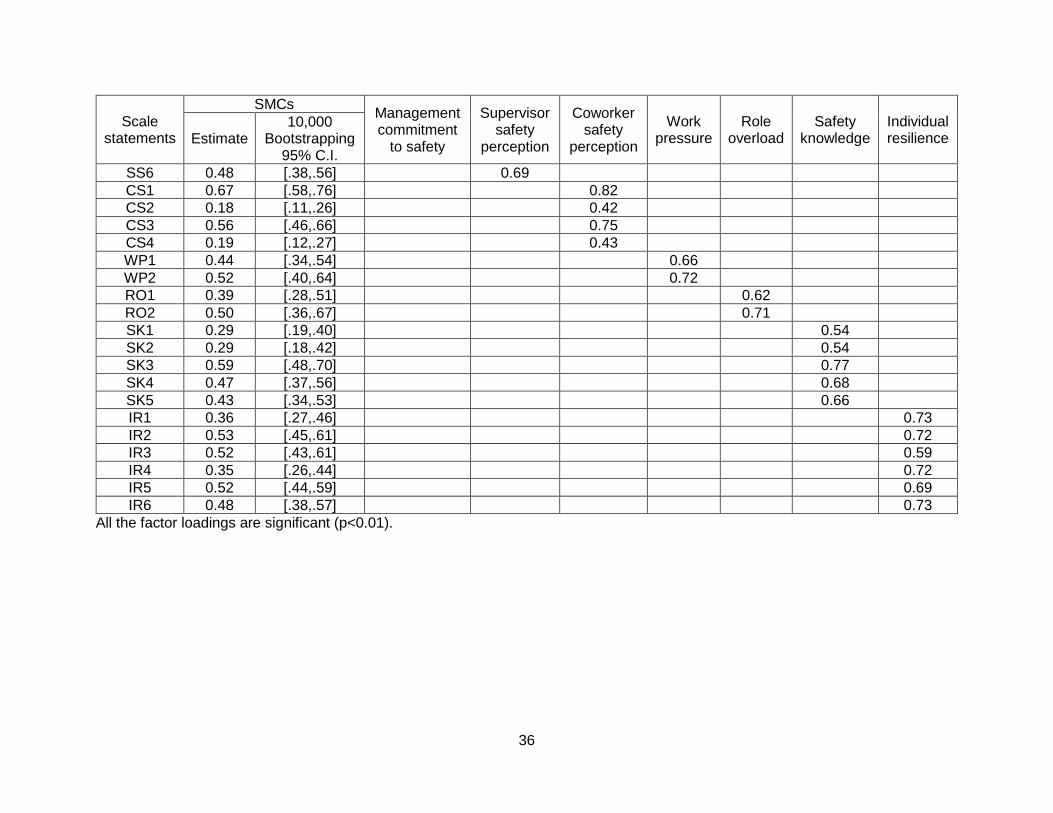
36
Scale statements
SMCs Management commitment
to safety
Supervisor safety
perception
Coworker safety
perception
Work pressure
Role overload
Safety knowledge
Individual resilience Estimate
10,000 Bootstrapping
95% C.I.
SS6 0.48 [.38,.56] 0.69
CS1 0.67 [.58,.76] 0.82
CS2 0.18 [.11,.26] 0.42
CS3 0.56 [.46,.66] 0.75
CS4 0.19 [.12,.27] 0.43
WP1 0.44 [.34,.54] 0.66
WP2 0.52 [.40,.64] 0.72
RO1 0.39 [.28,.51] 0.62
RO2 0.50 [.36,.67] 0.71
SK1 0.29 [.19,.40] 0.54
SK2 0.29 [.18,.42] 0.54
SK3 0.59 [.48,.70] 0.77
SK4 0.47 [.37,.56] 0.68
SK5 0.43 [.34,.53] 0.66
IR1 0.36 [.27,.46] 0.73
IR2 0.53 [.45,.61] 0.72
IR3 0.52 [.43,.61] 0.59
IR4 0.35 [.26,.44] 0.72
IR5 0.52 [.44,.59] 0.69
IR6 0.48 [.38,.57] 0.73
All the factor loadings are significant (p<0.01).

37
Table 2-7. Descriptive statistics and correlations
Number of
statements in each scale
M S.D. 1 2 3 4 5 6 7 8 9 10
1. Physical injuries - 6.01 6.12 - 0.59 0.46 -0.29 -0.29 -0.24 0.35 0.16 -0.18 -0.18
2. Unsafe events - 3.59 5.19 - 0.41 -0.23 -0.23 -0.22 0.26 0.14 -0.17 -0.15
3. Job stress - 3.62 4.56 - -0.19 -0.20 -0.25 0.30 0.26 -0.15 -0.20
4. Management commitment to safety
6 3.48 0.54 - 0.87 0.69 0.41 -0.68 -0.25 0.55 0.48
5. Supervisor safety perception
6 2.99 0.51 0.86 0.42 -0.57 -0.24 0.48 0.44
6. Coworker safety perception
4 3.41 0.74 0.72 -0.40 -0.47 0.27 0.23
7. Work pressure 2 0.57 0.52 0.65 0.48 -0.34 -0.51
8. Role overload 2 0.70 0.54 0.62 -0.22 -0.32
9. Safety knowledge 5 3.19 0.42 0.79 0.53
10. Individual resilience
6 3.14 0.37 0.84
All the correlations are significant (p<0.01), two tailed; numbers underlined in the diagonal of the matrix are the Cronbach’s alpha of
the scales; physical injuries, unsafe events, and job stress are observed variables, so Cronbach’s alpha is not applicable.
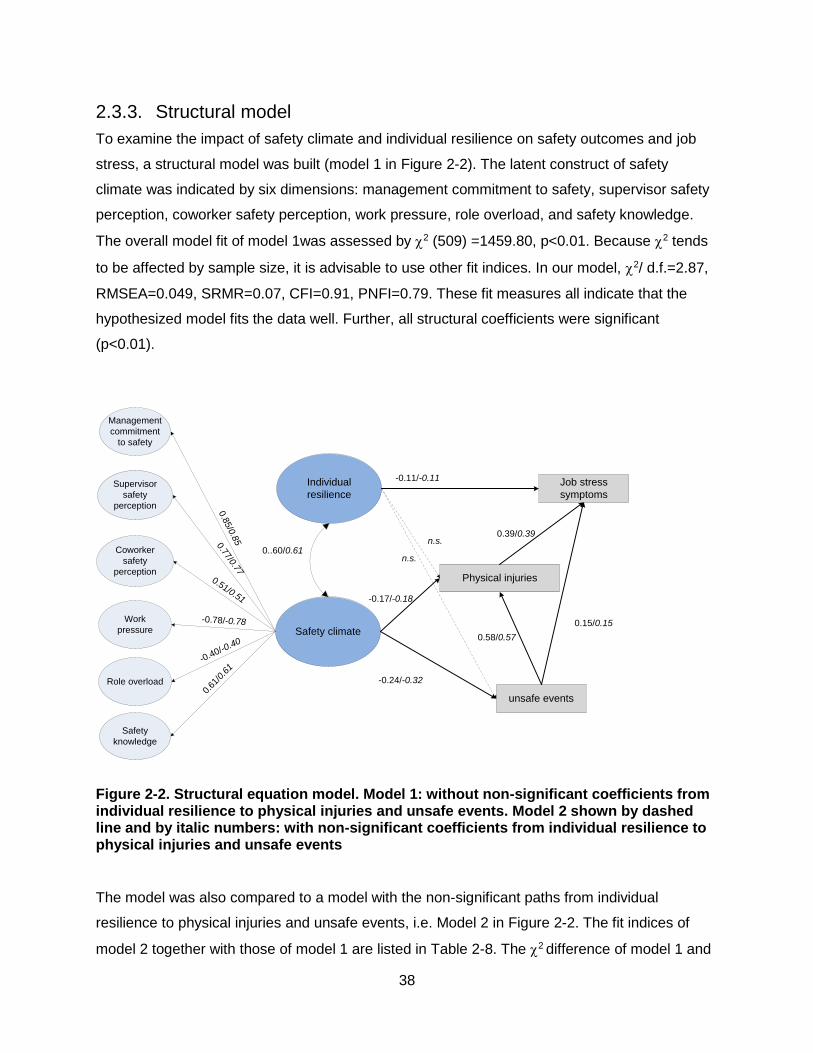
38
2.3.3. Structural model
To examine the impact of safety climate and individual resilience on safety outcomes and job
stress, a structural model was built (model 1 in Figure 2-2). The latent construct of safety
climate was indicated by six dimensions: management commitment to safety, supervisor safety
perception, coworker safety perception, work pressure, role overload, and safety knowledge.
The overall model fit of model 1was assessed by 2 (509) =1459.80, p<0.01. Because 2 tends
to be affected by sample size, it is advisable to use other fit indices. In our model, 2/ d.f.=2.87,
RMSEA=0.049, SRMR=0.07, CFI=0.91, PNFI=0.79. These fit measures all indicate that the
hypothesized model fits the data well. Further, all structural coefficients were significant
(p<0.01).
Safety climate
Management
commitment
to safety
Supervisor
safety
perception
Coworker
safety
perception
Work
pressure
Role overload
Safety
knowledge
Individual
resilience
0.8
5/0
.850.77/0.77
0.51/0.51
-0.78/-0.78
-0.40/-0.40
0.61
/0.6
1
Physical injuries
unsafe events
Job stress
symptoms
0..60/0.61
-0.11/-0.11
-0.17/-0.18
-0.24/-0.32
0.58/0.57
0.39/0.39n.s.
n.s.
0.15/0.15
Figure 2-2. Structural equation model. Model 1: without non-significant coefficients from individual resilience to physical injuries and unsafe events. Model 2 shown by dashed line and by italic numbers: with non-significant coefficients from individual resilience to physical injuries and unsafe events
The model was also compared to a model with the non-significant paths from individual
resilience to physical injuries and unsafe events, i.e. Model 2 in Figure 2-2. The fit indices of
model 2 together with those of model 1 are listed in Table 2-8. The 2 difference of model 1 and

39
model 2 is 4.34 with 2 degrees of freedom, which was not significant. It suggested that the
parsimonious model (i.e. model 1) is the better choice. It is also worth mentioning that other
models, such as a model with direct path from safety climate to job stress, were also compared.
All the findings showed that model 1 is the best-fit model.
Table 2-8. Comparisons of model 1 and model 2
Model 2 d.f. 2 diff d.f. diff 2/ d.f. RMSEA SRMR CFI PNFI
Model 1 1459.80 509 2.87 0.05 0.07 0.91 0.79
Model 2 1455.46 507 4.34 2 2.87 0.05 0.07 0.91 0.79
Path analysis of model 1 was conducted to determine whether safety climate has indirect effects
on job stress. As shown in Table 2-9, besides the direct effects displayed in Figure 2-2, safety
climate had significantly indirect negative effects on physical injuries via unsafe events; and
unsafe events had significantly indirect positive effects on job stress via physical injuries. More
interestingly is that safety climate had a significant indirect negative impact (i.e. -0.16) on job
stress via both physical injuries and unsafe events. This indirect effect was achieved through
three paths: SC -> physical injuries -> job stress; SC -> unsafe events -> job stress; SC ->
unsafe events -> physical injuries -> job stress. Thus, the indirect effect was decomposed into
three parts, -0.07, -0.04, and -0.05, respectively. In addition, because AMOS only reported the
total indirect effect from one variable to another variable, the decomposition of the indirect effect
was conducted manually by the authors; therefore, the corresponding bootstrapping results
were not available here.
Moreover, R2 of unsafe events, physical injuries, and job stress were 0.06, 0.41, and 0.29,
respectively. Although it has been argued that it is difficult to decompose the R2 contribution of
correlated predictors, Dominance Analysis (DA) is a well-known approach to determining the
relative importance of each predictor (Budescu and V. 1993). The novelty of DA is that
“predictors are compared in a pairwise fashion across all subset models, and a hierarchy of
levels of dominance can be established” (Azen and Budescu 2006). Table 2-9 gives the
estimates of the R2 contribution from each predictor based on DA. Matlab R2015b was used
and the code employed was from (Broomell et al. 2010). As displayed, safety climate explained
7% and 6% variance of physical injuries and unsafe events, respectively. IR contributed 3%
variance of job stress, physical injuries contributed 17%, and unsafe events contributed 9%.

40
Table 2-9. Direct and indirect effect testing of the hypothesized model relationships
Path R2
contribution Direct effects
Indirect effects
10,000 Bootstrapping
95% C.I.
Direct effects
SC -> physical injuries 0.07 -0.17
SC -> unsafe events 0.06 -0.24
IR -> job stress 0.03 -0.11
Unsafe events -> physical injuries 0.34 0.58
Unsafe events -> job stress 0.09 0.15
Physical injuries -> job stress 0.17 0.39
Indirect effects
SC -> unsafe events -> physical injuries -0.14 [-0.19, -0.09]
SC -> (physical injuries and unsafe events) -> job stress
-0.16 [-0.21, -0.11]
SC -> physical injuries -> job stress -0.07 -
SC -> unsafe events -> job stress -0.04 -
SC -> unsafe events -> physical injuries -> job stress
-0.05 -
Unsafe events->physical injuries ->job stress
0.23 [0.17, 0.29]
Direct effects, indirect effects, and 95% bootstrapped confidence intervals denoting indirect
effects are significant (p<0.01).
2.4. Discussion
The objective of this study was to examine the impacts of safety climate and individual
resilience on safety outcomes and job stress of construction workers. Six dimensions of safety
climate were adapted from previous research. Each of these dimensions was found to be
significant, and to be important components of the latent construct of safety climate including
management commitment to safety climate, supervisor safety perception, coworker safety
perception, work pressure, role overload, and safety knowledge. Our findings validate the H1
hypothesis and confirm that safety climate is a critical factor predicting the occurrence of safety
outcomes in the construction industry (Fang et al. 2006; Hon et al. 2014; Mohamed 2002).
Among the six factors of safety climate, management commitment to safety and supervisor
safety perception had the strongest positive correlations with safety climate; work pressure had
the strongest negative correlation with safety climate This validates that management
commitment to safety and the balance between safety and production are essential aspects of
workplace safety climate (Flin et al. 2000; Glendon and Litherland 2001; Huang et al. 2006;
Zohar 2000; Zohar and Luria 2005).
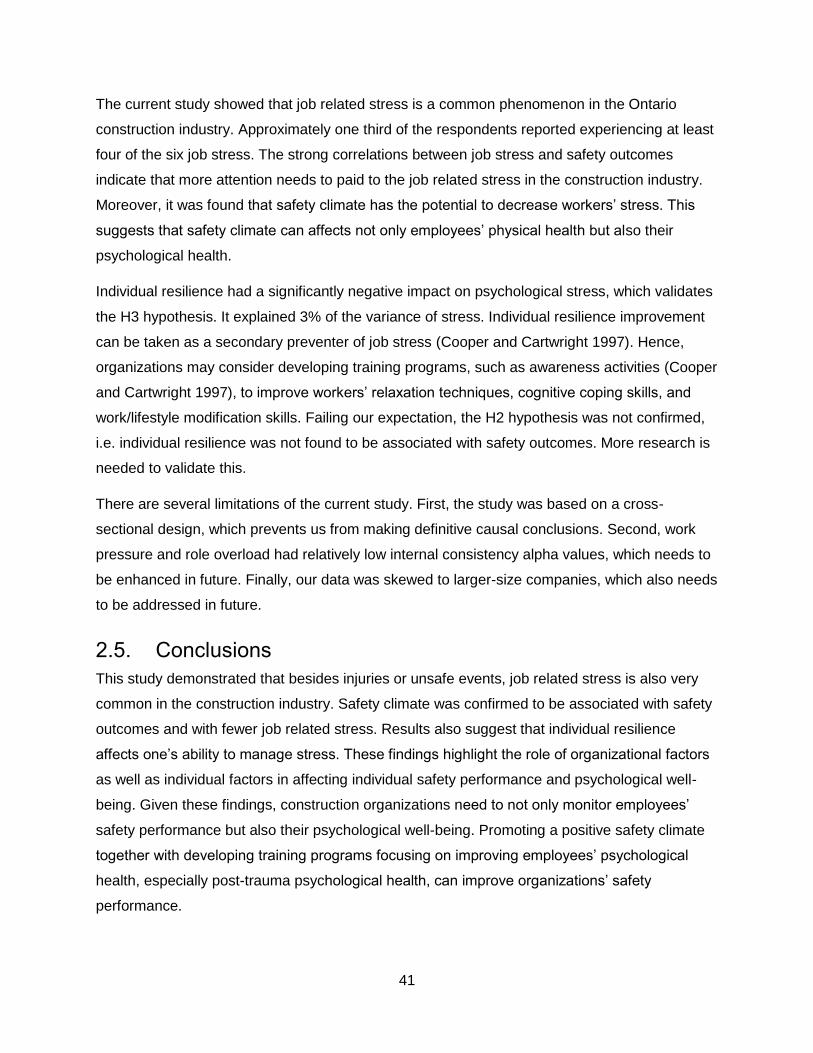
41
The current study showed that job related stress is a common phenomenon in the Ontario
construction industry. Approximately one third of the respondents reported experiencing at least
four of the six job stress. The strong correlations between job stress and safety outcomes
indicate that more attention needs to paid to the job related stress in the construction industry.
Moreover, it was found that safety climate has the potential to decrease workers’ stress. This
suggests that safety climate can affects not only employees’ physical health but also their
psychological health.
Individual resilience had a significantly negative impact on psychological stress, which validates
the H3 hypothesis. It explained 3% of the variance of stress. Individual resilience improvement
can be taken as a secondary preventer of job stress (Cooper and Cartwright 1997). Hence,
organizations may consider developing training programs, such as awareness activities (Cooper
and Cartwright 1997), to improve workers’ relaxation techniques, cognitive coping skills, and
work/lifestyle modification skills. Failing our expectation, the H2 hypothesis was not confirmed,
i.e. individual resilience was not found to be associated with safety outcomes. More research is
needed to validate this.
There are several limitations of the current study. First, the study was based on a cross-
sectional design, which prevents us from making definitive causal conclusions. Second, work
pressure and role overload had relatively low internal consistency alpha values, which needs to
be enhanced in future. Finally, our data was skewed to larger-size companies, which also needs
to be addressed in future.
2.5. Conclusions
This study demonstrated that besides injuries or unsafe events, job related stress is also very
common in the construction industry. Safety climate was confirmed to be associated with safety
outcomes and with fewer job related stress. Results also suggest that individual resilience
affects one’s ability to manage stress. These findings highlight the role of organizational factors
as well as individual factors in affecting individual safety performance and psychological well-
being. Given these findings, construction organizations need to not only monitor employees’
safety performance but also their psychological well-being. Promoting a positive safety climate
together with developing training programs focusing on improving employees’ psychological
health, especially post-trauma psychological health, can improve organizations’ safety
performance.

42
Chapter 3 The relationship between individual resilience,
interpersonal conflicts at work, safety outcomes of construction workers
Yuting Chen, Brenda McCabe, and Douglas Hyatt
Abstract
Interpersonal conflicts at work (ICW) has been widely regarded as a job stressor; however, it is
rarely linked to physical safety outcomes. ICW mainly has two forms on a construction site:
conflicts with supervisors (ICWS) and conflicts with coworkers (ICWC). This study examined the
occurrences of ICWS and ICWC on construction sites, and investigated the relationship among
ICWS, ICWS and physical safety outcomes together with job stress. In addition, possible
antecedents of ICWS and ICWC including workhours, mobility, and individual resilience were
also examined. The research was based on 837 surveys collected from more than 100
construction sites in Ontario, Canada between 2015 June and 2016 June. Structural equation
modeling (SEM) techniques were used to test the hypothesized relationships. This paper leads
to the following conclusions: although ICW was reported as quite often or very often by only
6.3% of respondents, it had a significant effect on both physical safety outcomes including
physical injuries and unsafe events, and job stress. Individual resilience (IR) had a significant
negative correlation with both ICWS and ICWC, which in turn could decrease the frequency of
physical safety outcomes and job stress. The contributions to the Body of Knowledge are: safety
professionals may consider adding coping skill training safety programs to improve the
individual resilience of their workforce and reduce conflict-related safety outcomes.
Keywords: interpersonal conflict, safety performance, individual resilience, job stress,
construction industry
3.1. Introduction
The nature of construction work, e.g. working in groups under intense job demand, is associated
with higher job stress and may result in interpersonal conflicts at work (ICW) (Neuman and
Baron 1998; Salin 2003; Zapf 1999). ICW refers to negative interactions with others in the

43
workplace (Nixon et al. 2011), which can range from momentary disagreements and
disrespectful behaviors from coworkers or supervisors to heated arguments. ICW is directly
associated with workplace bullying (Ayoko et al. 2003; Hauge et al. 2009; Spector and Fox
2005), which may cause depressive symptoms (Meier et al. 2014), general health problems (De
Raeve et al. 2009), and counterproductive work behaviors (Bruk-Lee and Spector 2006). It is
also associated with considerable unproductive time and financial cost. The average time and
cost expended to manage a conflict incident in the construction industry in a northern Midwest
state in the United States is 161.25 hours and US $10 948 (Brockman 2014), respectively. As a
risk factor of job performance, however, few research studies have examined the role of ICW in
affecting safety performance of construction workers. In addition, research studies have shown
that conflicts with coworkers and supervisors are conceptually distinct (Bruk-Lee and Spector
2006).
The first aim of this paper is to assess how common ICW is in the construction industry by
examining the frequency of conflicts with supervisors (ICWS) and with coworkers (ICWC) on
construction sites. Secondly, to validate that ICW is a risk factor of safety performance, this
study will investigate the relationship between ICW, physical safety outcomes, and job stress of
construction workers. The final purpose of this study is to examine possible antecedents of ICW,
including mobility, working overtime, and individual resilience (IR), which is the capacity of
individuals to cope with significant change, adversity, or risk (Stewart et al. 1997). The hierarchy
of safety performance terminology used herein is provided in Figure 3-1. Safety outcomes refer
to all outcomes, including job stress and physical outcomes, which are further subdivided into
physical injuries and unsafe events. Stress is defined as a “negative emotional experience
accompanied by predictable biochemical, physiological, and behavioral changes that are
directed toward adaptation either by manipulating the situation to alter the stressor or by
accommodating its effects” (Andrew Baum 1990). It is a lack of fit between the needs and
demands of the individual and his/her environment (Cooper and Cartwright 1997). Stress is very
subjective because it is associated with both the individual’s work environment and his/her
personalities (Lazarus 1966). Physical injuries and unsafe events are the most frequently
mentioned physical safety outcomes in previous research (Clarke 2010; Huang et al. 2004;
Mullen and Kelloway 2009; Nahrgang et al. 2011).

44
Figure 3-1. Safety performance terminology hierarchy
3.1.1. ICW, safety outcomes, and stress
ICW is a widely acknowledged job stressor (Schaufeli and Taris 2014; Spector and Jex 1998;
Zapf 1999). It is one of the most cited sources of stress (Bruk-Lee and Spector 2006). The
existing research on ICW and job performance focused on its relationship with
counterproductive work behaviors (CWB) (Bruk-Lee and Spector 2006). CWB refers to any
intentional behavior on the part of an organization member viewed by the organization as
contrary to its legitimate interests (Sackett 2002). From this point of view, unsafe behaviors on
construction sites (e.g. walking behind heavy equipment without informing the operator) are
defined as CWB due to the indirect cost of injuries or accidents. The most widely used CWB
scales (Spector et al. 2006) include CWB directed against people (i.e. abuse), and four scales
related to CWB directed against organizations, namely, production deviance, sabotage, theft,
and withdraw. Unfortunately, these CWB scales are insufficient to measure safety-related
counterproductive behaviors of employees.
Compared with other widely researched job stressors of safety performance, including risk and
hazards (Goldenhar et al. 2003; Nahrgang et al. 2011), physical demands and work complexity
(Goldenhar et al. 2003; Hemingway and Smith 1999; Li et al. 2013; Nahrgang et al. 2011), role
conflict and role ambiguity (Hemingway and Smith 1999), job certainty or insecurity (Probst and
Brubaker 2001), job control (Goldenhar et al. 2003; Leung et al. 2016), and organizational
factors such as coworker and supervisor support (Goldenhar et al. 2003; Hemingway and Smith
1999; Li et al. 2013), little is known about the impact of ICW on safety performance. Only one
study examined the impact of ICW on safety outcomes (Nixon et al. 2011), which found that
interpersonal conflicts had strong relationships with a set of individual physical injuries. To
examine the relationship between ICW and safety outcomes, the following hypotheses are
proposed.
H1: ICW is positively associated with physical safety outcomes
Safety Outcomes
Physical Safety Outcomes
Physical Injuries
Unsafe Events
Job Stress

45
H1(a): ICWS is positively associated with physical injuries
H1(b): ICWS is positively associated with unsafe events
H1(c): ICWC is positively associated with physical injuries
H1(d): ICWC is positively associated with unsafe events
H2: ICW is positively associated with job stress
H2(a): ICWS is positively associated with job stress
H2(b): ICWC is positively associated with job stress
3.1.2. Antecedents of ICW
3.1.2.1. Mobility, working overtime, and ICW
Construction workers are more likely to work longer hours than workers in other sectors, have
irregular work schedules, and change jobs (Dong 2005). Long workhours and irregular work
schedules are risk factors of injury occurrences and psychological health (Dong 2005; Härmä
2006). Construction projects are temporary, so the work typically has high mobility, which varies
by trade depending on the nature of their work. For example, sprinkler fitter and window
installation workers have a relatively higher mobility than electricians. Research has shown that
ICW is directly related to overtime work and external mobility ( i.e. changing employers) (De
Raeve et al. 2008, 2009). In this paper, weekly workhours in the previous month and two
indicators of mobility were used, namely, number of employers and number of projects in the
previous 3 years. The following additional hypotheses are presented.
H3: weekly workhours in the previous month is positively associated with ICW
H3(a): weekly workhours is positively associated with ICWS
H3(b): weekly workhours is positively associated with ICWC
H4: number of employers in the previous 3 years is positively associated with ICW
H4(a): number of employers is positively associated with ICWS
H4(b): number of employers is positively associated with ICWC
H5: number of projects in the previous 3 years is positively associated with ICW
H5(a): number of projects is positively associated with ICWS

46
H5(b): number of projects is positively associated with ICWC
3.1.2.2. Individual resilience (IR) and ICW
IR is regarded as one type of positive psychological capacity for performance improvement
(Luthans 2002; Youssef and Luthans 2007). It changes over time and is enhanced by protective
factors in the individual and environment (Stewart et al. 1997). IR is associated with higher
coping abilities related to large organizational changes (Wanberg and Banas 2000), and is
regarded as a secondary preventer of job stress (Cooper and Cartwright 1997). Research also
found that positive psychological states can moderate the effect of job stress on rudeness and
disrespectful behaviors in the workplace (Penney and Spector 2005). More recently, it was
hypothesized but not tested that IR may facilitate safety focused behaviors (Eid et al. 2012).
However, little research has examined the impact of IR on ICW in the construction industry.
Thus, the final hypothesis is presented.
H6: IR is negatively associated with ICW
H6(a): IR is negatively associated with ICWS
H6(b): IR is negatively associated with ICWC
3.2. Methods
3.2.1. Data and collection procedures
A multi-site data collection strategy was employed. The target sample size was 500, which was
to achieve a sample size large enough to conduct structural equation modeling (SEM). There is
no agreement on the minimum sample size for conducting SEM, e.g. a set value of 500
(MacCallum et al. 1999) and a ratio of 20:1 between sample size and number of model factors
(Hair et al. 1995). In total, 837 surveys were collected from 112 construction sites in Ontario,
Canada between July 2015 and July 2016, thereby meeting the requirements for SEM.
3.2.1.1. Survey instrument
A self-administered questionnaire that comprised demographics, attitude statements, and
incident reporting was used to collect data. With the exception of individual resilience questions,
the questionnaire was adapted from previous research (McCabe et al. 2008). The
demographics section included questions about the individual’s characteristics, such as job
tenure and number of projects in the previous 3 years. The incident reporting section asked the

47
respondents how frequently they experienced safety-related incidents on the job in the 3 months
previous to the survey. There are three categories of incidents: physical injuries, unsafe events,
and job stress. Each category comprises 6 to 11 specific incident types, as shown in Table 3-2
and Table 3-3. Physical injuries, such as a cut or hernia, may be associated with an unsafe
event, but no connection was made by the respondents. Similarly, unsafe events, such as a trip
or fall, comprise events that respondents experienced but may or may not have resulted in an
injury. Job stress relate to one’s ability to concentrate; one example is “felt constantly under
strain”.
In the attitude section, six statements were used to measure IR and six statements were used to
measure ICW. For IR, respondents indicated the degree to which they agree with statements
using a Likert scale between 1 (strongly disagree) and 5 (strongly agree). Three statements of
IR were adapted from a self-efficacy scale (Schwarzer and Jerusalem 1995); an example
statement is “I am confident that I could deal efficiently with unexpected events”. The remaining
three statements (Connor and Davidson 2003) focus on a person’s tolerance of negative
impacts, and positive acceptance of change. An example statement from this category is “When
confronted with a problem, I can usually find several solutions”. The coefficient alpha of IR is
0.83. For ICW, ICWS and ICWC were measured by three statements each (Spector and Jex
1998). It assesses how well respondents get along with their coworkers and supervisors at
work. The questions asked about the frequency of the respondents getting into arguments with
their coworkers and supervisors, and how often their coworkers or supervisors do rude or mean
things to them. Five response choices are given: 1 (never), 2 (rarely), 3 (sometimes), 4 (quite
often), and 5 (very often). High scores represent frequent conflicts with others. The internal
consistence alpha of ICWS and ICWC statements are 0.85 and 0.81, respectively.
3.2.1.2. Data collection
Both top-down and bottom-up methods were used to collect surveys (Chen et al. 2015). Top-
down means that the team first contacted the head office management. If top management
were enthusiastic about the project, they would engage their site managers and schedule data
collection visits. The bottom-up method involved engaging the site managers first, who then
worked to gain corporate permission. The process entailed four main steps by our research
assistants (RAs): initiate contact at the site, follow-up and communicate with the site and/or the
corporate management until approval is given, schedule site visits, and collect data.

48
At least two RAs were on site to administer the surveys to workers. A procedure was strictly
followed wherein the RAs arrived at the site and met the workers in a lunch trailer or other
comfortable location. After the consent forms were collected, surveys were distributed. RAs
provided immediate help to workers if they had a question, which improved the reliability and
completeness of the data. Surveys were strictly anonymous and were immediately collected
upon their completion; no unfinished surveys were left behind and no follow-up was undertaken.
As such, the response rate was 100% as all participants submitted a survey. However, 56 or
6.7% of surveys were removed from the sample because the maximum threshold for missing
data (10%) was exceeded.
3.2.1.3. Sample characteristics and validation
The respondents were from a variety of construction sectors, including residential (61.4%),
heavy civil (17.2%), and industrial, commercial, and institutional (ICI) sector (21.4%). Among the
respondents, 69.3% were from construction sites in the Greater Toronto Area (GTA) with the
remainder from areas outside the GTA but within the Province of Ontario, extending from
Ottawa to Thunder Bay. Table 3-1 shows demographic information of the respondents. Laborer,
carpenter, and electrician are the top three trades in terms of number of surveys completed
(20%, 14%, and 11%, respectively). The mean age of the respondents was 37 years and 98%
were male; 69% of workers were journeymen or apprentices. The respondents had been
employed by their current employer for just over 6 years on average, but half of them had
worked with their employers less than 3.5 years. Respondents reported relatively high mobility
between projects. The weekly working hours of the respondents were approximately 44 hours,
and 38% worked more than 44 hours, which is considered overtime (Ontario Ministry of Labour
2015). The respondents also reported a very high safety training percentage (97.8%) and 37.6%
reported that they had experience as a safety committee member; 60% of the respondents were
union members.
Table 3-1. Demographics of respondents
Demographic factors Response range Mean / median or percent
Gender Male / Female 98% male
Age 16 to 67 36.72 / 35.00
Years in construction 0.01 to 46 14.15 / 11.00
Years with the current employer 0.01 to 45 6.22 / 3.50
Number of construction employers in previous 3 yrs 1 to 100 2.25 / 1.00
Number of projects worked in previous 3 yrs 1 to 300 10.09 / 5.00

49
Average hours worked per week in previous month 9 to 100 44.35 / 42.00
Did respondent have any job-related safety training Yes or No 97.8% yes
Was respondent ever a safety committee member Yes or No 37.6% yes
Was respondent a member of a union Yes or No 60.0% yes
Trade type
Laborer 20.1%
Carpenter 14.2%
Electrician 10.6%
Plumber 8.6%
Ironwork 8.2%
Operator 7.2%
others 31.1%
Job position
Supervisor 30.7%
Journeyman 50.9%
Apprentice 18.4%
To validate the sample, two demographic characteristics were compared to publically available
data. The age distribution of construction workers in Ontario are 11.5% (15 to 24 years)
(Statistics Canada 2015b), 70.2% (25 to 54 years), and 18.4% (55 years or more). The sample
percentages are 7.3%, 74.5%, and 18.1% respectively, indicating that the sample has 4% fewer
young workers and 4% more middle aged workers than those estimated by Statistics Canada.
Employment by size of employer (Statistics Canada 2015c) in Ontario is estimated as 16.7%
micro, 57.1% small, 13.6% medium, and 12.8% large –sized employers. The sample
percentages are 5.1%, 55.7%, 25.7%, 13.5%, respectively. These values indicate that the
sample is skewed away from micro-employers and toward medium-sized employers. The
research team found that accessing the micro-employers was very challenging as they tended
to be paid by unit prices, and as a result they were less willing to take time from their work to
participate in the survey. The effect of this skewness on the survey results is unknown.
3.2.1.4. Incidents
Incident reporting responses were discrete choices of ‘never’, ‘once’, ‘two to three times’, ‘four to
five times’, and ‘more than 5 times’ in the previous 3 months. These were transcribed as 0, 1, 2,
4, and 5 respectively. As such, incident counts reported herein are conservative. Then, for each
of the three incident categories, namely, physical injuries, job stress, and unsafe events, the
incident counts were summed for each respondent.
Table 3-2 shows the frequency of physical safety outcomes. In total, 80.6% and 66.7% of the
respondents reported at least one occurrence of physical injuries and unsafe events in the
previous 3 months. This number is not surprising, because the aggregated value of physical
injuries and unsafe events included incidents like cuts that are not severe but have very high

50
occurrences. Cut or puncture, headache/dizziness, strains or sprains, and persistent fatigue are
the most frequently experienced physical injuries (symptoms) and approximately 50% of the
participants experienced at least one of these four symptoms in the previous 3 months. In terms
of unsafe events, 42% of the respondents experienced overexertion, and approximately 34%
experienced slip/trip/fall on the same level, pinch, and exposure to chemicals at least once in
the previous 3 months. With regard to the more severe incidents, such as dislocated or
fractured bone and fall from height, it is very surprising that 30 to 40 respondents, or
approximately 4% experienced these incidents recently.
Table 3-2. Frequency of physical safety outcomes
Reported at least one occurrence in previous 3 months (%)
Physical injuries 80.6
cut/puncture 53.4
headache/dizziness 52.8
strains/sprains 50.8
persistent fatigue 47.7
skin rash/burn 24.7
eye injury 11.8
respiratory injuries 10.7
temporary loss of hearing 8.9
electrical shock 6.7
dislocated/fractured bone 4.3
hernia 4.0
Unsafe events 66.7
overexertion while handling/lifting/carrying 41.9
slip/trip/fall on same level 34.5
pinch 34.3
exposure to chemicals 33.6
struck against something stationary 8.8
struck by falling/flying objects 8.4
fall from height 5.5
contact with moving machinery 3.1
struck by moving vehicle 2.9
trapped by something collapsing, caving, or overturning 2.3
Table 3-3 shows the frequency of job stress. More than a half of the respondents reported at
least one occurrence of job stress. Approximately 29% to 37% of the respondents reported that
they were unable to enjoy daily activities, unable to concentrate on work tasks, felt constantly
under strain, and lost sleep because of work related worries. Relatively fewer incidents of

51
feeling incapable of making decisions and losing confidence were reported (16% and 15%,
respectively).
Table 3-3. Frequency of job stress
Reported at least one occurrence in previous 3 months (%)
Job stress 55.2
lost much sleep due to work-related worries 36.7
felt constantly under strain 30.1
been unable to concentrate on work related tasks 28.8
been unable to enjoy my normal day-to-day activities 28.6
felt incapable of making decisions 16.1
been losing confidence in myself 15.0
3.2.2. Data analysis
In total, 781 cases were used for the analysis (670 surveys complete and 111 with on average
5% missing information). Missing values were replaced with the variable means. Regarding the
univariate normality of all the variables, none of the observed variables were significantly
skewed or highly kurtotic. The absolute values of the skewness of the variables were less than
or equal to 2 and the kurtosis was less than or equal to 7 (Kim 2013). However, the original data
had multivariate non-normality and outlier issues, hence, variable transformations using log10
function were attempted based on their distributions (Tabachnick and Fidell 2007). Although
there was a slight improvement after variable transformations, multivariate non-normality and
outliers still existed. One hundred cases with extreme values were reported via Mahalanobis
distance detection. After examination, it is believed that the outliers are the natural variation of
the data, thus, the cases with extreme values were considered important and kept.
3.2.2.2. Analysis procedure
The statistical analyses were performed using IBM SPSS Statistics and Amos (Windows version
23). The first step was to determine whether ICWS and ICWC were conceptually distinct.
Confirmatory factor analysis was used to assess the adequacy of the previously mentioned
scales. Robust maximum likelihood estimation technique was used to handle the multivariate
non-normality (Brown 2015; Byrne 2001a). In Amos, the robust estimation was achieved by a
bootstrapping procedure (10000 bootstrap samples and 95% confidence intervals). The key

52
idea underlying bootstrapping is that it creates multiple subsamples from an original data set
and the bootstrapping sampling distribution is rendered free from normality assumptions (Byrne
2001b). Square multiple correlation (SMC) of the statement variables was provided as a
communality estimate, indicating the amount of variance in the scale variable explained by the
common factor. Internal-consistency reliability tests were also conducted to show how well the
individual scale statements reflected a common, underlying construct. Then descriptive statistics
and correlations of the variables were analyzed.
Finally, structural equation modeling (SEM) techniques were used to examine the relationships
between the studied variables. SEM is a very general statistical modeling technique widely used
in the behavior sciences (Hox and Bechger 1998), and the relationships between the studied
variables are represented by regression or path coefficients in SEM.
3.2.2.3. SEM fit indices
There is no consensus about which index to use to determine the best fit of a model. Hooper et
al. (2008) have suggested reporting multiple indices because they reflect different aspects of
model fit. The fit indices used for SEM included an overall fit statistic 2, the relative 2 (2 /
degrees of freedom), root mean square error of approximate (RMSEA), standardized root mean
square residual (SRMR), comparative fit index (CFI), and the parsimonious normed fit index
(PNFI).
Although 2 is very sensitive to sample size, it should be reported along with its degree of
freedom (d.f.) and associated p value (Kline 2005). The relative 2 (Wheaton et al. 1977) can
address the sample size limitation, and thus it was included. A suggested range for the upper
bound of this statistic is between 2 (Tabachnick and Fidell 2007) and 5 (Wheaton et al. 1977).
RMSEA is regarded as one of the most informative fit indices (Byrne 2001b; Diamantopoulos
and Siguaw 2000). In a well-fitting model, RMSEA should be between 0 and 0.08 (Browne and
Cudeck 1992; Hooper et al. 2008). The maximum acceptable upper bound of SRMR is 0.08 (Hu
and Bentler 1999). CFI values greater than 0.95 have been suggested (Hooper et al. 2008), but
CFI values as low as 0.90 are deemed acceptable. Higher values of PNFI are better, but there
is no agreement about how high PNFI should be. When comparing two models, differences of
0.06 to 0.09 indicate substantial differences (Ho 2006; Williams and Holahan 1994).

53
3.3. Results
3.3.1. Measurement model
A hypothesized three-factor model was examined, composed of ICWC, ICWs, and IR. Two
competing models including a one-factor model and a two-factor model (ICWS and ICWC
combined to one factor: ICW) were also assessed (Table 3-4). Both of the alternative competing
models are nested in the proposed three-factor model, so the hypothesized three-factor model
was compared with each of the two competing models based on the Chi-square difference (2
diff) associated with the models. The 2 difference also follows a 2 distribution. For instance,
the 2 value and d.f. for the hypnotized three-factor model and the alternative two-factor model
are 196.99, 49 and 387.68, 51 respectively. The 2 difference between these two models is
190.69 with 2 d.f., which is significant. This suggests that the three-factor model is superior to
the two-factor model. Following this, it was found that three-factor model also performed much
better than the one-factor model. Thus, the hypothesized three-factor model is the best option.
The findings also show that the ICWC and ICWs are conceptually distinct.
Table 3-4. Fit indices for the measurement models
Model 2 d.f. 2 diff d.f. diff
2/ d.f.
RMSEA SRMR CFI PNFI
Hypothesized three-factor model: ICWC + ICWs + IR
196.99 49 4.02 0.06 0.04 0.97 0.71
Alternative two-factor model: ICW+IR
387.68 51 190.69 2 7.60 0.09 0.04 0.92 0.70
Alternative one-factor model
1410.70 52 1213.71 3 27.12 0.18 0.17 0.68 0.53
Table 3-5 shows the square multiple correlation (SMC) of each scale statement and factor
loadings. Note that CS is short for ICWS and CC is short for ICWC. The factor loadings are the
correlation coefficients, ranging from 0.58 to 0.88. SMC of statement CS1 is 0.55, i.e. 55% of
the variance of CS1 was explained by the factor “ICWS”. On the whole, SMC ranged from 0.34
to 0.77, thus, the adequacy of the measurement model was supported.
Table 3-5. Measurement model: square multiple correlations (SMC) and factor loadings

54
No. Scale statements SMC IR ICWS ICWC
IR1 It is so easy for me to stay focused and accomplish my goals
0.38 0.61
IR2 I am confident that I could deal efficiently with unexpected events
0.55 0.74
IR3 I remain calm when facing difficulties because I can rely on my coping abilities
0.56 0.75
IR4 When confronted with a problem, I can usually find several solutions
0.34 0.58
IR5 I can cope with stress 0.43 0.66
IR6 I can focus and think clearly when I am under pressure 0.39 0.62
CS1 How often do you get into arguments with your supervisors (subordinates)?
0.55 0.74
CS2 How often are your supervisors (subordinates) rude to you at work?
0.77 0.88
CS3 How often do your supervisors (subordinates) do mean things to you at work?
0.64 0.80
CC1 How often do you get into arguments with your coworkers? 0.45 0.67
CC2 How often are your coworkers rude to you at work? 0.68 0.83
CC3 How often do your coworkers do mean things to you at work?
0.67 0.82
All the estimates are significant (p<0.001).
3.3.2. Descriptive statistics
Table 3-6 shows the mean and standard deviation of the variables, along with bivariate
correlations (r) between them. The mean of ICWS and ICWC were 1.19 and 1.23, respectively,
which means that, on average, workers believed interpersonal conflicts rarely occurred in their
workplace. For the three demographic variables, only weekly workhours had a very weak but
significant correlation with ICWS (r=0.09, 0.01< p<0.05) and job stress (r=0.07, 0.01< p<0.05).
Individual resilience had significant negative correlations with ICWS and ICWC, physical safety
outcomes, and job stress. Further, ICWS and ICWC had significant correlations with physical
safety outcomes and job stress. It is also noteworthy that ICWS and ICWC had a relatively high
correlation with each other (r=0.81, p<0.01).
Table 3-6. Descriptive statistics of variables Variables M SD 1 2 3 4 5 6 7 8 9
1 Weekly working hours 44.35 8.05 - -
0.05 0.04 0.03 0.09 0.05 -
0.06 -0.05
0.07
2 No. of employers in the past 3 years
2.25 6.34 - 0.16 -0.05
0.02 0.03 0.06 0.03 -0.02
3 No. of projects in the past 3 years
10.09 21.14 - -0.01
0.00 0.02 0.06 0.05 -0.01
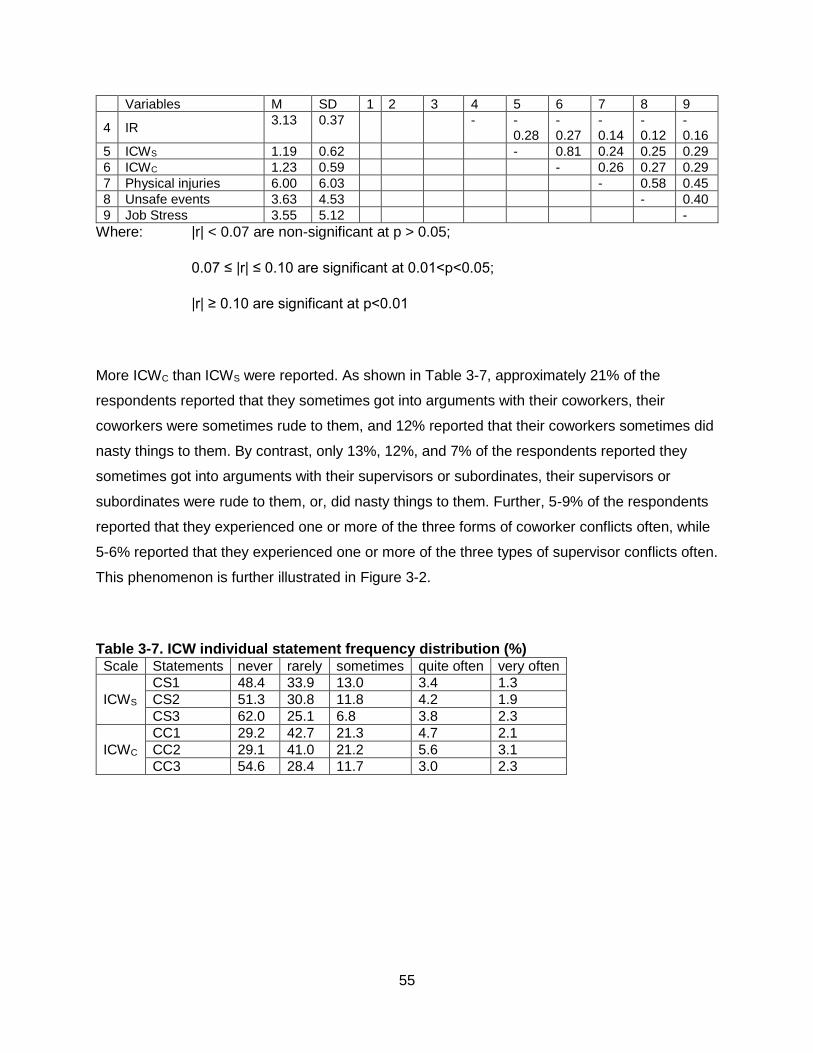
55
Variables M SD 1 2 3 4 5 6 7 8 9
4 IR 3.13 0.37 - -
0.28 -0.27
-0.14
-0.12
-0.16
5 ICWS 1.19 0.62 - 0.81 0.24 0.25 0.29
6 ICWC 1.23 0.59 - 0.26 0.27 0.29
7 Physical injuries 6.00 6.03 - 0.58 0.45
8 Unsafe events 3.63 4.53 - 0.40
9 Job Stress 3.55 5.12 -
Where: |r| < 0.07 are non-significant at p > 0.05;
0.07 ≤ |r| ≤ 0.10 are significant at 0.01<p<0.05;
|r| ≥ 0.10 are significant at p<0.01
More ICWC than ICWS were reported. As shown in Table 3-7, approximately 21% of the
respondents reported that they sometimes got into arguments with their coworkers, their
coworkers were sometimes rude to them, and 12% reported that their coworkers sometimes did
nasty things to them. By contrast, only 13%, 12%, and 7% of the respondents reported they
sometimes got into arguments with their supervisors or subordinates, their supervisors or
subordinates were rude to them, or, did nasty things to them. Further, 5-9% of the respondents
reported that they experienced one or more of the three forms of coworker conflicts often, while
5-6% reported that they experienced one or more of the three types of supervisor conflicts often.
This phenomenon is further illustrated in Figure 3-2.
Table 3-7. ICW individual statement frequency distribution (%) Scale Statements never rarely sometimes quite often very often
ICWS
CS1 48.4 33.9 13.0 3.4 1.3
CS2 51.3 30.8 11.8 4.2 1.9
CS3 62.0 25.1 6.8 3.8 2.3
ICWC
CC1 29.2 42.7 21.3 4.7 2.1
CC2 29.1 41.0 21.2 5.6 3.1
CC3 54.6 28.4 11.7 3.0 2.3

56
Figure 3-2. Frequency of interpersonal conflict
3.3.3. Structural model
To examine the antecedents and the consequences of ICWS and ICWC, a structural model was
built (Figure 3-3). The overall model fit was assessed by 2 (95) =317.30, p<0.01. 2 tends to be
influenced by sample size, thus alternative fit indices were provided. In our model, 2/ d.f.=3.34,
RMSEA=0.06, SRMR=0.04, CFI=0.96, PNFI=0.74. These fit indices all indicate that the
hypothesized model fits the data well. The path coefficients of the model were standardized
regression coefficients. Coefficients of the path from weekly workhours to job stress and the
path from IR to physical injuries were significant to 0.01<p<0.05; all the remaining path
coefficients were significant to p<0.01. R2 for the endogenous variables, i.e. variables that serve
as a dependent variable in at least one regression equation in the SEM, were 0.09 for ICWS,
0.65 for ICWC, 0.06 for unsafe events, 0.38 for physical injuries, and 0.29 for job stress.

57
IR
ICWs ICWc
Weekly workhours Job stress
Physical injuries
Unsafe events
-0.29
0.81 0.24
0.61
0.1
3
0.09
0.39
-0.08
0.15
0.0
9
Figure 3-3. Structural model depicting the relationships between the studied variables
The two mobility variables, number of employers and number of projects worked in the previous
3 years, had no relationship with ICWS, ICWC, physical outcomes or job stress. When building
the model, the square and cubic of the number of employers and projects were calculated to
determine whether there is a linear relationship between them and ICWS, ICWC, physical
outcomes or job stress. However, no relationship was found. Hence, H4 and H5 are not
supported.
The model in Figure 3-3 was compared to a set of models with IR linked to unsafe events and
job stress, and (or) with weekly workhours linked to physical injuries and unsafe events, etc.
Based on the 2 differences and the associated significance, the model in Figure 3-3 was
determined the best option.
Path analysis of the model was conducted to test H1, H2, H3, and H6. As shown in Table 3-8,
ICWS and ICWC had a direct positive impact on job stress and unsafe events, respectively.
ICWS had an indirect positive impact on physical injuries and unsafe events via ICWC; and ICWC
had an indirect positive impact on physical injuries and stress via unsafe events. Weekly
workhours had a direct positive impact on ICWS and an indirect impact on ICWC, but with a
weaker significance (0.01<p<0.05). Finally, IR had a direct negative impact on ICWS, and an
indirect impact on ICWC via ICWS. Moreover, SEM mediation analysis was conducted, where a
hypothesized causal chain in which one variable affects a second variable that, in turn, affects a
third variable was tested. Mediation analysis is used to understand a known relationship by
exploring the underlying mechanism or process by which one variable influences another

58
variable through a mediator variable. It was found that ICWS fully mediated the impact of IR on
ICWC, and partially mediated the impact of IR on job stress. ICWC fully mediated the impact of
ICWS on unsafe events.
Table 3-8. Direct and indirect effect testing of the hypothesized model relationships
Path Direct effects
Indirect effects
10,000 Bootstrapping 95% C.I.
Direct effects
Weekly workhours -> ICWS 0.09* [ 0.01, 0.15]
Weekly workhours -> stress 0.09 [ 0.03, 0.15]
IR -> ICWS -0.29 [-0.37, -0.20]
IR -> physical injuries -0.08* [-0.14, -0.01]
ICWS -> ICWC 0.81 [0.74, 0.87 ]
ICWS -> stress 0.15 [0.07, 0.23]
ICWC -> unsafe events 0.24 [0.17, 0.31]
Unsafe events -> physical injuries 0.61 [0.54, 0.67]
Unsafe events -> stress 0.13 [0.04, 0.23]
Physical injuries -> stress 0.39 [0.31, 0.48]
Indirect effects
Weekly workhours -> ICWC 0.07* [0.01, 0.12]
Weekly workhours -> unsafe events 0.02* [0.00, 0.03]
Weekly workhours -> physical injuries 0.01* [0.00, 0.02]
Weekly workhours -> stress 0.02* [0.00, 0.04]
IR -> ICWC -0.23 [-0.31, -0.16]
IR -> unsafe events -0.06 [-0.09, -0.03]
IR -> physical injuries -0.03 [-0.05, -0.02]
IR -> stress -0.09 [-0.14, -0.05]
ICWS -> unsafe events 0.19 [0.14, 0.25]
ICWS -> physical injuries 0.12 [0.08, 0.16]
ICWS -> stress 0.07 [0.05, 0.10]
ICWC -> physical injuries 0.15 [0.10, 0.19]
ICWC -> stress 0.09 [0.06, 0.13]
Unsafe events -> stress 0.24 [0.18, 0.31]
*: the standardized coefficients are significant with 0.01<p<0.05; the remained coefficients and
95% bootstrapped confidence intervals (C.I.) are significant with p<0.01.
3.4. Discussion
The objectives of this study are to determine whether interpersonal conflict at work (ICW) is
common on construction sites, to investigate its relationships with physical safety outcomes and
job stress of construction workers, and to examine the impact of workhours, mobility, and
individual resilience (IR) on ICW. Although, on average, only 6.3% of respondents reported that
conflicts at work occurred quite often or very often, ICW had a significant impact on all three
types of safety outcomes as demonstrated by the correlation coefficients of 0.24 to 0.29 in Table

59
3-6 and the direct and indirect effect analysis in Table 3-8. It extended what was known about
ICW and injuries in construction, and showed that ICW is also a source of job stress on
construction site. From this, it is concluded that hypotheses 1 and 2 were supported. The
conflict identified herein clearly goes beyond friendly banter. Management and supervisors are
encouraged to address situations of potential conflict amongst workers as quickly as possible to
avoid negative effects on safety.
Individual resilience (IR) had a significant negative correlation with both ICWS and ICWC, which
in turn could decrease the frequency of physical safety outcomes and job stress. Through this
finding, hypothesis 6 was supported. The model in Figure 3-3 provided additional insights to the
pathways of impact between the model factors. The pathway for IR to impact injuries is twofold:
1) a weak but direct path, and, 2) a more circuitous but stronger path that first works to
decrease ICWs and ICWc, which in turn decreases unsafe events and injuries. Job stress was
also found to be affected by IR through ICWs, injuries, and unsafe events. As much as two
decades ago, improving one’s IR was thought to be a secondary preventer of job stress (Cooper
and Cartwright 1997), and the findings herein support it. The mediating effect of ICWS allowed
IR to influence ICWC and safety outcomes, further emphasized the importance of IR on reducing
conflict-related outcomes. As a result, organizations may consider expanding their safety
training programs to include situational awareness activities that improve workers’ relaxation
techniques and cognitive coping skills to weaken the impact of ICW on their safety performance
and psychological health.
Work hours were confirmed to be a risk factor for the occurrence of both ICWS and ICWC in the
construction industry (Brockman 2014), but more research is needed to strengthen this finding.
On the other hand, mobility was not related to ICW, which is not consistent with previous
research (De Raeve et al. 2008, 2009). One possible explanation is that due to the temporary
nature of the work, construction workers may establish relationships and stay with a supervisor
or foreman for years although they change employers or projects. In this case, the impact of
organizational change on ICW may not exist. Future research may further validate this by
investigating the impact of changing supervisors on ICW.
There are several limitations of this study. First, the data were cross-sectional data. Future
researchers may consider using diaries to conduct longitudinal studies to examine the degree to
which one day’s conflict affects conflict, stress, and safety outcomes in subsequent days and
weeks. Second, the current research was based on data from contracting companies. As the job
stressors of people from consulting companies and contracting companies may be different (Yip

60
and Rowlinson 2009), it is possible that the conflict level may be different in consulting
companies even if they work in construction-related activities. Thus, future research may survey
people from consulting companies.
3.5. Conclusions
In this study, 837 surveys were collected from more than 100 construction sites in Ontario,
Canada. It was found that while only 6.3 % of participants reported experiencing interpersonal
conflict quite or very often, it had a significant effect on physical safety outcomes and job stress.
Structural equation modeling (SEM) was used to test the relationships between the antecedents
of interpersonal conflict at work (ICW) i.e. workhours, mobility, and individual resilience (IR), and
its consequences on safety performance. Six major hypotheses were presented, four of which
were supported by the data.
H1: ICW is positively associated with physical safety outcomes
H2: ICW is positively associated with job stress
H3: number of hours worked in the previous month is positively associated with ICW
H4: number of employers in the previous 3 years is positively associated with ICW
H5: number of projects in the previous 3 years is positively associated with ICW
H6: IR is negatively associated with ICW
Specially, ICW was validated as being positively associated with physical safety outcomes and
job stress; workhours was positively related to ICW; and, IR was negatively related to ICW. This
study indicated a causal chain between IR, ICW, and self-reported safety performance and
psychological health of construction workers. Safety professionals may consider expanding
safety training to include skill development to improve their employees’ coping abilities and
individual resilience to reduce the occurrence and impacts of interpersonal conflict at work.

61
Chapter 4 Resilience on construction sites: testing a structural
equation model
Yuting Chen, Brenda McCabe and Douglas Hyatt
Abstract
Resilience has been proposed to be a proactive approach to safety management for the next
generation. Qualitative studies on defining resilience and using resilience rules to interpret
safety practices have been widely conducted; however, relatively few quantitative studies have
been done to measure resilience. Further, no empirical studies have investigated the
interactions between resilience factors and safety outcomes. This paper aims to identify the
interactions among resilience factors, and their impact on individual safety performance on
construction sites. The research was based on 431 self-administered surveys from 68 sites in
Ontario, Canada. Structural equation modelling (SEM) techniques were used to test the
hypotheses. This paper leads to several conclusions. First, management commitment is the key
to promoting a strong safety culture, and safety awareness is the most important individual
factor affecting the safety performance of construction workers. Second, support from team
members, especially coworkers, has a significant positive impact on improving the safety
awareness of construction workers. Finally, reporting practices did not perform well, although it
is viewed as a fundamental component of a safety culture. The contributions to the Body of
Knowledge are twofold. The relationship between construction safety outcomes and
organizational resilience is quantified for the first time, and the pivotal role that management has
in the safety performance of workers is demonstrated. Secondly, this is the first empirical study
to validate the direct impact of awareness on construction workers’ safety performance.
Keywords: organizational resilience; safety awareness; safety performance in the construction
industry; proactive safety management
4.1. Introduction
Resilience has been proposed as a new approach for the next generation of safety
improvement (Hollnagel 2015). It is regarded as a capacity for positive response and healing
capabilities to normal operations as well as maintaining high level safety during stress and
disturbance (Bruyelle et al. 2014; Ross et al. 2014), which is fundamental for human and
62
organizational functionality and viability (Carmeli et al. 2013). Compared to traditional safety
methods, it is a proactive approach to safety management that recognizes the complexity in an
ever-changing environment (Bergstrom et al. 2015; Carmeli et al. 2013); and its efforts focus on
enhancing the organization’s ability to respond, monitor, anticipate, and learn (Nemeth et al.
2008, Hollnagel 2009).
Current resilience studies on safety have mainly focused on two themes: defining resilience
measures and quantifying resilience. Regarding resilience measures, most of the existing
research used the scales summarized by (Woods and Wreathall 2003), which include
management commitment, reporting culture, learning culture, anticipation, awareness, and
flexibility. These scales may vary depending on the industry. For example, (Azadeh et al.
2014a) added self-organization, team work, redundancy, fault-tolerant to the six scales.
Compared with qualitative studies focused on defining resilience measures, relatively few
quantitative studies have been done, providing a gap that needs to be explored. To the
knowledge of the authors, only four papers in the literature focused on quantitative analysis of
resilience in the industrial sectors. They used three methods: principal component analysis and
numerical taxonomy (Shirali et al. 2013; 2016); fuzzy cognitive mapping (Azadeh et al. 2014a);
and data envelope analysis (Azadeh et al. 2014b).
The application of resilience is particularly suitable for high-risk systems with complex
characteristics, namely, (a) a high degree of inter-connection between the components of the
system; (b) uncertainty and variability (Costella et al. 2009). As a complex, dynamic, and
unstable system, a construction site needs resilience to develop prevention strategies (Costella
et al. 2009). There are several qualitative studies applying resilience to the construction
industry, including a safety culture model based on resilience engineering (Han et al. 2010a; b),
re-interpreting safety management practices using resilience principles (Saurin et al. 2008), a
task demand model for construction safety risks (Mitropoulos et al. 2009), and using resilience
principles to help disaster management during construction (Bosher 2011; Bosher et al. 2007).
However, no quantitative studies have been conducted in the construction industry. Further, no
study has investigated the interactions amongst resilience indicators and individual safety
performance. For example, can top management affect accidents on site by supporting a culture
of reporting and learning? This paper aims to investigate the interactions among the resilience
indicators and their impact on individual safety performance on construction sites. The
quantitative approach used in the study is structural equation modeling (SEM). The following
sections define resilience indicators used in this paper and propose hypotheses.

63
4.1.1. Resilience indicators
Many resilience indicators have been proposed to measure the adaptive capabilities of
organizations. The most widely acknowledged six scales were summarized from previous work
by (Woods and Wreathall 2003):
Management commitment. The commitment of the management to balance production
and protection is a core measure of resilience.
Reporting culture. The degree to which the workers are openly encouraged to report
safety concerns provides a critical source of resilience within an organization.
Learning culture. How much the organization learns from the events (denial or true
reform) is a key sign of resilience.
Preparedness/anticipation. Proactiveness in detecting or assessing evidence of
developing problems versus only reacting after problems become significant is desired.
Flexibility. The ability of the organization to adapt to varying conditions in a way that
maximizes problem solving without disrupting overall functionality requires that people at
the field level (particularly first-level supervisors) are able to make important decisions
without having to wait unnecessarily for management instructions.
Awareness. The organization monitors safety boundaries and recognizes how close it is
to the “edge”. Awareness is also affected by the extent to which information about safety
concerns are distributed throughout the organization at all levels versus closely held by a
few individuals.
In addition to these six indicators, researchers working in different sectors may vary their focus.
Resilience in rail engineering planning focused on preparedness and anticipation (Ferreira
2011). In a petrochemical plant, the most important resilience factors were found to be
awareness, preparedness, and flexibility (Azadeh et al. 2014a). In a refinery, change
management was highlighted (Shirali et al. 2012).
To achieve resilience, efforts from all organizational levels including organizations, groups, and
individuals are needed (Johnsen and Veen 2013; Patterson et al. 2007). For a construction site,
resilience stakeholders are top management, site supervisors, and construction workers.
Management commitment is achieved by both the top management and site supervisors.
Coworkers’ support is also critical for a safe work environment. Regular safety meetings are the
most common formal approach to promoting a good reporting and learning culture. In this
paper, the resilience indicators include management commitment, supervisor safety perception,

64
coworker safety perception, reporting, learning, anticipation, and awareness. The reasons we
did not include flexibility is that measurements found in previous studies were for the
manufacturing and industrial sectors, and are not appropriate for construction industry due to its
continuously changing work environment and stakeholders.
4.1.2. Hypotheses
Top management commitment is widely considered an essential positive factor affecting safety
(Flin et al. 2000). As a core of resilience, management commitment may come in the form of a
higher safety budget, full-time trained first aid personnel, or an enhanced in-house safety
program. It is believed that management commitment plays a positive role in establishing a
good reporting and learning culture; however, to our knowledge, no empirical studies in the
construction industry have tested these hypotheses. Thus, the H1 hypothesis was proposed:
management commitment is positively related to reporting and learning.
The impact of top management on site safety is achieved through supervisors. On a
construction site, supervisors set the work atmosphere and therefore significantly influence the
safety of their site. Safety perceptions of supervisors can have a lasting impact on safety by
including safety in their daily verbal exchanges with workers (Kines et al. 2010). Incident
reporting and learning from past events are considered one of the foundations of a true safety
culture (Wiegmann et al. 2004). Further, incident reporting and learning from past events is the
major safety communication approach on a construction site, which must be affected by safety
perceptions of site supervisors. That is to say, if a site supervisor truly cares about safety, he or
she may hold regular safety meetings; and then it is likely that construction workers will be
encouraged to report incidents without being seen as trouble makers. Likewise, no empirical
studies have validated these hypotheses. Thus, the H2 hypothesis was proposed: supervisor
safety perception is positively related to reporting and learning.
Construction workers are directly involved in the building process, and their ability to anticipate
and maintain a high safety awareness is critical. However, continuous anticipation and
assessment of the work environment may be difficult to achieve, given that construction workers
have multiple goals to satisfy in addition to safety, such as a tight project schedule (Mitropoulos
and Cupido 2009). So a question is raised: under a high work demand, what factors can
positively affect an employee’s anticipation and safety awareness? Sneddon et al. (2006) found
that maintaining a good communication in a rig is the best method of increasing awareness of
offshore drill crews. For construction, little has been reported. Raising safety concerns during

65
safety meetings and getting feedback or finding solutions to problems could mitigate the risk of
incidents. Thus, H3 and H4 were proposed: learning and reporting are positively related to
anticipation and awareness. The social exchange between supervisors and coworkers has an
impact on the communication of safety (Hofmann and Morgeson 1999). A study about the
trackside workers found that perceived coworker support for safety was most important for
keeping employees safe in the face of high job demands (Turner et al. 2010). Therefore, a
construction worker’s supervisor and coworkers’ safety perception likely affect his/her
anticipation and awareness. For example, if a coworker encourages him or her to work safely,
this worker may work more safely than if they didn’t receive the encouragement. Conversely, if a
coworker ignores safety, the worker may be negatively affected. Based on this, hypotheses H5
and H6 were proposed: supervisor and coworker safety perception are positively related to
anticipation and awareness. Finally, anticipation and awareness are related to safety
performance (Sneddon et al. 2013). However, little has been reported in the construction
industry. Thus, H7 and H8 were proposed: anticipation and awareness are negatively related to
unsafe events. Table 4-1 summarizes the hypotheses.
Table 4-1. Hypotheses in the study
Hypothesis number
Investigated factors
Hypothesized relation
Potential correlated factors
(a) (b)
H1 MC positive LN RP
H2 SS positive LN RP
H3 LN positive AN AW
H4 RP positive AN AW
H5 SS positive AN AW
H6 CS positive AN AW
H7 AN negative Unsafe events -
H8 AW negative Unsafe events -
MC: management commitment to safety; LN: learning; RP: reporting; SS: supervisor safety
perception; CS: coworker safety perception; AN: anticipation; AW: awareness
4.2. Methods
4.2.1. Data and procedures
A multi-site data collection strategy was employed. In total, 431 surveys were collected from 68
construction sites between May and July 2016. Before performing any analysis, 28 cases were
removed because a high proportion (>10%) of data were missing. Thus, 403 cases were used
for the analysis. Missing values were replaced with the variable means in the remaining cases.

66
A self-administered questionnaire that comprised demographics, attitude statements, and
incident reporting was used to collect data. The demographics and incident reporting were
adapted from the previous research (McCabe et al. 2008). The demographics section included
questions about the individual’s characteristics, such as age and trade type. In the attitudinal
section, respondents indicated the degree to which they agreed with statements using a Likert
scale between 1 (strongly disagree) and 5 (strongly agree). The incident reporting section asked
the respondents how frequently they experienced unsafe incidents on the job in the 3 months
previous to the survey. There are three categories of incidents: physical injuries, unsafe events,
and job stress. Physical injuries and unsafe events are regarded as physical safety outcomes.
Job stress describes symptoms of job-related stress. Physical injuries, such as an eye injury,
may be associated with an unsafe event, but no connection is made by the respondent. Unsafe
events, such as struck against something fixed, comprise events that respondents experienced
but may or may not have resulted in an injury. One example of job stress is unable to
concentrate on work related tasks.
4.2.1.1. Data collection
At least two research assistants (RA) were on site to administer the surveys to workers. A
procedure was strictly followed wherein the RAs arrived at the site and met the workers in a
lunch trailer or other comfortable location. As each consent form was reviewed, signed, and
collected, the survey was distributed. RAs provided immediate help to workers if they had a
question, which improved the reliability and completeness of the data. The surveys took 15-20
minutes to complete and were collected immediately upon their completion. They were strictly
anonymous and no follow up was undertaken. The number of surveys collected from each site
ranged from 1 to 35, with an average around 6. Each survey required approximately 4 research-
hours, including finding sites, communicating with corporate managers and site
superintendents, transportation to site, and data collection.
4.2.1.2. Demographics of the respondents
The respondents were from a variety of construction sectors, including residential, heavy civil,
institutional, and commercial. Table 4-2 summarizes the demographic information of the
respondents. The mean age of the respondents was 37 years and 98% were male; 68% of
workers were journeymen or apprentices. The respondents had been employed by their current
employer for 6 years on average, but half of them had worked with their employers less than 4
years. Respondents reported relatively high mobility between projects. The weekly working

67
hours of the respondents were approximately 44 hours, and 32% worked more than 44 hours,
which is considered overtime (Ontario Ministry of Labour 2015). Finally, 60% of the respondents
were union members.
Table 4-2. Demographics of respondents
Demographic factors Response
range Mean or percent
Median
Gender Male / Female 98% male -
Age 16 to 67 37.00 36.00
Years in construction 0.5 to 46 14.29 11.00
Years with the current employer 0.01 to 45 6.01 4.00
No. of construction employers in previous 3 years 1 to 100 2.62 1.00
No. of projects worked in previous 3 years 1 to 300 9.79 4.00
Average hours worked per week in previous month 17 to 85 43.57 40.00
Was respondent a member of a union Yes or No 65.0% yes -
Job position
Supervisor 32.1% -
Journeyman 50.3% -
Apprentice 17.7% -
Size of employers
Micro (1-4) 5.6 % -
Small (5-99) 51.0% -
Medium (100-499)
28.6% -
Large (500+) 14.8% -
4.2.1.3. Incidents
Incident reporting responses were discrete choices of ‘never’, ‘once’, ‘two to three times’, ‘four to
five times’, and ‘more than 5 times’. For each of the incident questions, these were transcribed as
0, 1, 2, 4, and 5 respectively. As such, incident counts reported herein are conservative. Then,
for each of the three incident categories, namely, physical injuries, job stress, and unsafe events,
the incident counts were summed for each respondent.
Table 4-3 shows the frequency of physical safety outcomes. In total, 79.2% and 68.2% of the
respondents reported at least one occurrence of physical injuries and unsafe events in the
previous 3 months. This number is not surprising, because the aggregated value of physical
injuries and unsafe events included incidents like cuts that are not severe but may occur often.
Cut or puncture, strains or sprains, persistent fatigue, and headache/dizziness are the most
frequently experienced physical injuries and approximately 50% of the participants experienced
at least one of these four symptoms in the previous 3 months. In terms of unsafe events, 44% of
the respondents experienced overexertion, 39% reported being exposed to chemicals, and
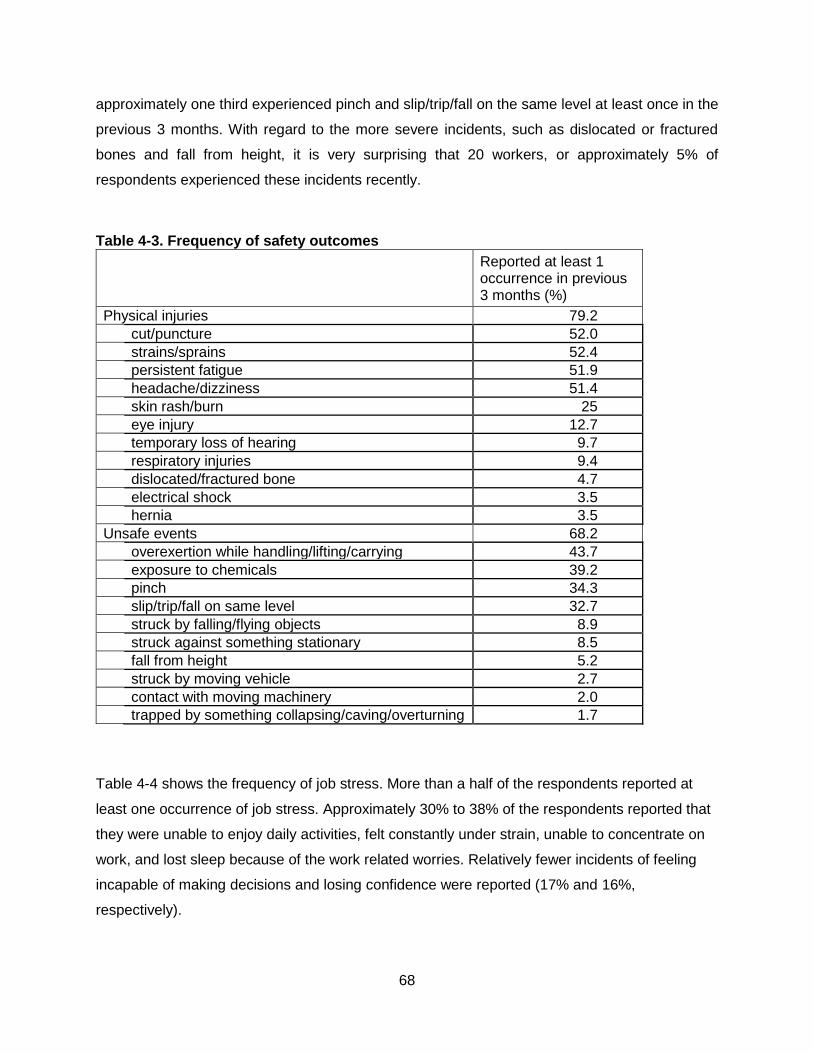
68
approximately one third experienced pinch and slip/trip/fall on the same level at least once in the
previous 3 months. With regard to the more severe incidents, such as dislocated or fractured
bones and fall from height, it is very surprising that 20 workers, or approximately 5% of
respondents experienced these incidents recently.
Table 4-3. Frequency of safety outcomes
Reported at least 1 occurrence in previous 3 months (%)
Physical injuries 79.2
cut/puncture 52.0
strains/sprains 52.4
persistent fatigue 51.9
headache/dizziness 51.4
skin rash/burn 25
eye injury 12.7
temporary loss of hearing 9.7
respiratory injuries 9.4
dislocated/fractured bone 4.7
electrical shock 3.5
hernia 3.5
Unsafe events 68.2
overexertion while handling/lifting/carrying 43.7
exposure to chemicals 39.2
pinch 34.3
slip/trip/fall on same level 32.7
struck by falling/flying objects 8.9
struck against something stationary 8.5
fall from height 5.2
struck by moving vehicle 2.7
contact with moving machinery 2.0
trapped by something collapsing/caving/overturning 1.7
Table 4-4 shows the frequency of job stress. More than a half of the respondents reported at
least one occurrence of job stress. Approximately 30% to 38% of the respondents reported that
they were unable to enjoy daily activities, felt constantly under strain, unable to concentrate on
work, and lost sleep because of the work related worries. Relatively fewer incidents of feeling
incapable of making decisions and losing confidence were reported (17% and 16%,
respectively).
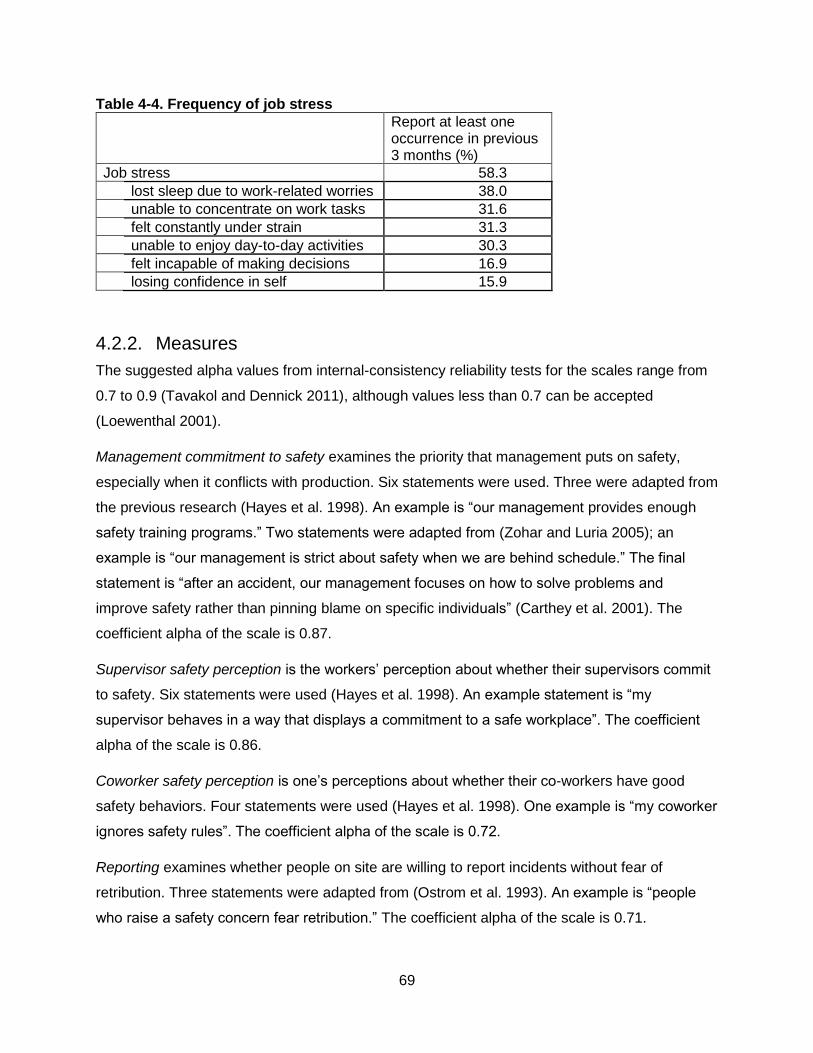
69
Table 4-4. Frequency of job stress
Report at least one occurrence in previous 3 months (%)
Job stress 58.3
lost sleep due to work-related worries 38.0
unable to concentrate on work tasks 31.6
felt constantly under strain 31.3
unable to enjoy day-to-day activities 30.3
felt incapable of making decisions 16.9
losing confidence in self 15.9
4.2.2. Measures
The suggested alpha values from internal-consistency reliability tests for the scales range from
0.7 to 0.9 (Tavakol and Dennick 2011), although values less than 0.7 can be accepted
(Loewenthal 2001).
Management commitment to safety examines the priority that management puts on safety,
especially when it conflicts with production. Six statements were used. Three were adapted from
the previous research (Hayes et al. 1998). An example is “our management provides enough
safety training programs.” Two statements were adapted from (Zohar and Luria 2005); an
example is “our management is strict about safety when we are behind schedule.” The final
statement is “after an accident, our management focuses on how to solve problems and
improve safety rather than pinning blame on specific individuals” (Carthey et al. 2001). The
coefficient alpha of the scale is 0.87.
Supervisor safety perception is the workers’ perception about whether their supervisors commit
to safety. Six statements were used (Hayes et al. 1998). An example statement is “my
supervisor behaves in a way that displays a commitment to a safe workplace”. The coefficient
alpha of the scale is 0.86.
Coworker safety perception is one’s perceptions about whether their co-workers have good
safety behaviors. Four statements were used (Hayes et al. 1998). One example is “my coworker
ignores safety rules”. The coefficient alpha of the scale is 0.72.
Reporting examines whether people on site are willing to report incidents without fear of
retribution. Three statements were adapted from (Ostrom et al. 1993). An example is “people
who raise a safety concern fear retribution.” The coefficient alpha of the scale is 0.71.

70
Learning is the workers’ perception about whether they are informed of past lessons and
whether they can learn from past events. Four statements were used. Two statements were
from the previous research (Ostrom et al. 1993). An example is “timely feedback is provided
when a safety hazard is reported.” The remaining two statements were adapted from (Carthey
et al. 2001). An example is “safety is discussed at regular meetings, not just after an accident.”
The coefficient alpha of the scale is 0.83.
Anticipation examines whether workers on site assess the potential safety impacts caused by
their decisions and detect the potential failures or errors before they create problems. Two
statements were used to measure this scale (Ferreira 2011). One example is “I detect failures or
errors in my job before they create problems.” The coefficient alpha of the scale is 0.68.
Awareness is about whether people on site are clear about their safety responsibilities and
aware of potential safety hazards. Three statements were adapted from previous research (Cox
and Cheyne 2000; Ostrom et al. 1993; Shirali et al. 2013). One example is “people are careful to
minimize and avoid safety hazards.” The coefficient alpha of the scale is 0.80.
4.2.3. Data analysis
4.2.3.1. Data screening
Regarding the univariate normality of the observed variables, none were significantly skewed or
highly kurtotic. The absolute values of the skewness of the variables were less than or equal to
2 and the kurtosis was less than or equal to 7 (Kim 2013). However, the original data had
multivariate non-normality and outlier issues, hence, variable transformations using log10
function were attempted based on their distributions (Tabachnick and Fidell 2007). Although
there was a slight improvement after variable transformations, multivariate non-normality and
outliers still existed. One hundred cases with extreme values were reported via Mahalanobis
distance detection. Thus, data transformations were not considered for the following analysis.
After examination, it is believed that the outliers are the natural variation of the data, thus, the
cases with extreme values were considered important and kept.
4.2.3.2. Analysis procedure
The statistical analyses were performed using IBM SPSS Statistics and Amos (Windows version
23). Confirmatory factor analysis was used to assess the adequacy of the previously mentioned
scales. Robust maximum likelihood estimation technique was used to handle the multivariate
non-normality (Byrne 2001a) (Brown 2015). In Amos, the robust estimation was achieved by a
71
bootstrapping procedure (10000 bootstrap samples and 95% confidence intervals). The key
idea underlying bootstrapping is that it creates multiple subsamples from an original data set
and the bootstrapping sampling distribution is rendered free from normality assumptions (Byrne
2001b). Square multiple correlations (SMCs) of the statement variables were provided as
communality estimates, indicating the amount of variance in the scale variable explained by the
common factor. Internal-consistency reliability tests were also conducted to show how well the
individual scale statements reflected a common, underlying construct, resulting in the coefficient
alpha for each scale. Then descriptive statistics and correlations of the studied variables were
analyzed. Finally, structural equation modeling techniques were used to examine the
relationships between variables.
4.2.3.3. Model fit indices
There is no consensus about which indices to use, but it is suggested to report different types of
indices because they reflect different aspects of model fit (Hooper et al. 2008). The fit indices
used for structural equation modeling included an overall fit statistic 2, the relative 2 (i.e. 2 /
degrees of freedom), root mean square error of approximate (RMSEA), standardized root mean
square residual (SRMR), comparative fit index (CFI), and the parsimonious normed fit index
(PNFI).
Although 2 is very sensitive to sample size, it should be reported along with its degree of
freedom and associated p value (Kline 2005). The relative 2 (i.e. 2 / degrees of freedom)
(Wheaton et al. 1977) can address the sample size limitation, and thus it was used. A
suggested range for this statistic is between 2 (Tabachnick and Fidell 2007) and 5 (Wheaton et
al. 1977). RMSEA is regarded as one of the most informative fit indices (Byrne 2001b)
(Diamantopoulos and Siguaw 2000). In a well-fitting model, its value range is suggested to be
from 0 to 0.08 (Browne and Cudeck 1992; Hooper et al. 2008). The maximum acceptable upper
bound of SRMR is 0.08 (Hu and Bentler 1999). CFI values greater than 0.95 have been
suggested (Hooper et al. 2008), but CFI values greater than 0.90 are deemed acceptable.
Higher values of PNFI are better, but there is no agreement about how high PNFI should be.
When comparing two models, differences of 0.06 to 0.09 indicate substantial differences (Ho
2006; Williams and Holahan 1994)

72
4.3. Results
4.3.1. Measurement model
A hypothesized seven-factor model was examined, composed of management commitment to
safety, supervisor safety perception, coworker safety perception, reporting, learning, anticipation
and awareness. A set of selected alternative competing models were also assessed (Table 4-5).
These alternative models included one-factor model, two-factor model, three-factor model, four-
factor model, five-factor model, and six-factor model.
The hypothesized seven-factor model was compared with each of the competing models based
on the Chi-square difference (2 diff) associated with the models. The 2 difference also follows
a 2 distribution. For instance, the 2 value of the hypnotized seven-factor model is 663.62 with
a degree of freedom is 326 and the 2 value of the alternative model six-factor model (a) is
757.23 with a degree of freedom is 332. The 2 difference between these two models is 93.61
with a degree of freedom of 6, which is significant. This suggests that the seven-factor model is
better than the six-factor model (a). Following this rule, we found that the hypothesized seven-
factor model performed better than all of the alternative models. In the seven-factor model, 2
(381) =663.62, p<0.01. The fit indices have the following values: 2/ d.f.=2.04, RMSEA=0.05,
SRMR=0.05, CFI=0.93, PNFI=0.76. Overall, the fit indices suggest the seven-factor
measurement model fits the data well.
Table 4-6 shows the factor loadings and square multiple correlations (SMCs) of each scale
statement. Table C-1 in the Appendix C shows the detailed scale questions. All the estimates in
Table 4-6 are significant (p<0.001). The factor loadings are the correlation coefficients, ranging
from 0.43 to 0.90. SMCs for the scale statements indicate the amount of variance in the scale
statement explained by the common factor. For example, SMCs of statement MC1 is 0.64, i.e.
64% variance of MC1 was explained by the factor “management commitment to safety”. On the
whole, SMCs ranged from 0.18 to 0.81. Accordingly, the adequacy of the measurement model
was supported.

73
Table 4-5. Fit indices for the measurement models
Model 2 d.f. 2 diff d.f. diff
2/ d.f.
RMSEA SRMR CFI PNFI
Hypothesized seven-factor model: MC+SS+CS+RP+LN+AN+AW
663.62 326 2.04 0.05 0.05 0.93 0.76
Alternative six-factor model (a): MC + RP + LN + AN + AW 757.23 332 93.61 6 2.28 0.06 0.06 0.92 0.76
Alternative six-factor model (b): MC + RP + LN + SS + CS 768.15 332 104.53 6 2.31 0.06 0.05 0.91 0.76
Alternative six-factor model (c): CS + RP + LN + AN + AW 940.90 332 277.28 6 2.83 0.07 0.06 0.88 0.73
Alternative six-factor model (d): MC + SS + CS + AN + AW 970.20 332 306.58 6 2.92 0.07 0.07 0.87 0.72
Alternative five-factor model (a): RP + AN + AW + CS 1084.88 337 421.26 11 3.22 0.07 0.06 0.85 0.71
Alternative five-factor model (b): MC + CS + AN + AW 1098.56 337 434.94 11 3.26 0.08 0.07 0.85 0.71
Alternative five-factor model (c): SS + CS + AN + AW 1184.94 337 521.32 11 3.52 0.08 0.07 0.83 0.70
Alternative five-factor model (d): CS + LN + AN + AW 1212.11 337 548.49 11 3.60 0.08 0.07 0.83 0.69
Alternative four-factor model (a): MC + AN + AW 1184.97 341 521.35 15 3.48 0.08 0.07 0.83 0.71
Alternative four-factor model (b): LN + AN + AW 1310.49 341 646.87 15 3.84 0.08 0.07 0.81 0.69
Alternative four-factor model (c): SS + AN + AW 1311.68 341 648.06 15 3.85 0.08 0.07 0.81 0.69
Alternative four-factor model (d):CS + AN + AW 1355.78 341 692.16 15 3.98 0.09 0.07 0.80 0.68
Alternative three-factor model (a): MC + RP 1177.30 344 513.68 18 3.42 0.08 0.07 0.84 0.71
Alternative three-factor model (b): MC + AW 1269.26 344 605.64 18 3.69 0.08 0.07 0.82 0.70
Alternative three-factor model (c): MC + AN 1352.46 344 688.84 18 3.93 0.09 0.07 0.80 0.68
Alternative three-factor model (d): AN + AW 1452.54 344 788.92 18 4.22 0.09 0.08 0.78 0.67
Alternative two-factor model (a):MC 1431.76 346 768.14 20 4.14 0.09 0.07 0.79 0.68
Alternative two-factor model (b):RP 1464.49 346 800.87 20 4.23 0.09 0.08 0.78 0.67
Alternative two-factor model (c):AW 1541.60 346 877.98 20 4.46 0.09 0.08 0.76 0.66
Alternative two-factor model (d):CS 1649.33 346 985.71 20 4.77 0.10 0.08 0.74 0.64
Alternative one-factor model 1717.31 347 1053.69 21 4.95 0.10 0.08 0.73 0.63
TMC: top management commitment to safety; SS: supervisor safety perception; CS: coworker safety perception; RP: reporting; LN:
learning; AN: anticipation; AW: awareness

74
Table 4-6. Measurement model: square multiple correlations (SMCs) and factor loadings
Scale statement
s
SMCs Top management commitment
to safety
Supervisor safety
perception
Coworker safety
perception Reporting Learning Anticipation Awareness
MC1 0.64 0.80
MC2 0.60 0.77
MC3 0.55 0.74
MC4 0.48 0.69
MC5 0.45 0.67
MC6 0.41 0.64
SS1 0.68 0.83
SS2 0.65 0.81
SS3 0.61 0.78
SS4 0.44 0.66
SS5 0.33 0.57
SS6 0.31 0.56
CS1 0.50 0.71
CS2 0.43 0.65
CS3 0.24 0.49
CS4 0.18 0.43
RP1 0.20 0.90
RP2 0.81 0.82
RP3 0.54 0.45
LN1 0.67 0.82
LN2 0.56 0.75
LN3 0.54 0.74
LN4 0.45 0.67
AN1 0.57 0.76
AN2 0.47 0.69
AW1 0.62 0.79
AW2 0.61 0.78
AW3 0.52 0.72
All the factor loadings are significant (p<0.01).

75
4.3.2. Descriptive statistics
Table 4-7 displays descriptive statistics and the correlations between the studied variables. In
general, management commitment to safety, supervisor safety perception, coworker safety
perception, reporting, learning, and awareness had significant negative correlations with
physical injuries, unsafe events, and job stress. Anticipation is an exception, because it is only
negatively correlated with unsafe events.
Management commitment to safety, supervisor safety perception, coworker safety perception,
reporting, learning, anticipation, and awareness were all positively correlated with each other. It
is also worth noting that management commitment had a relatively high correlation with
supervisor safety perception (r=0.70) and learning (r=0.70); supervisor safety perception had a
relatively high correlation with coworker safety perception (r=0.66), learning (r=0.77), and
awareness (r=0.64). Reporting seemed very distinct from other variables, because it had a
relatively low correlation with the remained scales, with the correlation coefficients ranging from
0.21 to 0.38. In terms of the mean values of all the studied variables, reporting and coworker
safety perception were the lowest.
Finally, management commitment to safety and supervisor safety perception had the strongest
negative correlations with physical injuries; management commitment to safety, supervisor
safety perception, and awareness had the strongest correlations with unsafe events; supervisor
safety perception, coworker safety perception, and awareness had the strongest correlations
with job stress.

76
Table 4-7. Descriptive statistics and correlations M S.D. 1 2 3 4 5 6 7 8 9 10
1. Physical injuries 6.08 6.22
2. Unsafe events 3.66 4.34 0.59
3. Job stress 3.65 5.00 0.48 0.43
4. Management commitment to safety
3.65 0.52 -0.20 -0.25 -0.14 -
5. Supervisor safety perception
3.92 0.63 -0.21 -0.24 -0.19 0.70 -
6. Coworker safety perception
2.75 0.42 -0.16 -0.18 -0.19 0.49 0.66 -
7. Reporting 1.86 0.46 -0.15 -0.14 -0.12 0.30 0.33 0.33 -
8. Learning 4.64 0.74 -0.18 -0.20 -0.17 0.70 0.77 0.58 0.21 -
9. Anticipation 3.51 0.51 -0.09 -0.15 -0.07 0.38 0.50 0.39 0.21 0.56 -
10. Awareness 3.89 0.53 -0.18 -0.25 -0.19 0.51 0.64 0.67 0.38 0.63 0.49 -
Absolute values of the correlation coefficients less than or equal to 0.09, non-significant (p > 0.05); absolute values equal to 0.12,
significant (0.01<p<0.05); absolute values larger than 0.12, significant (p<0.01).

77
4.3.3. Structural model
Figure 4-1 shows the final structural model. The overall model was assessed by 2 (418)
=770.11, p<0.01, 2/ d.f.=1.84, RMSEA=0.05, SRMR=0.05, CFI=0.94, PNFI=0.78. These
indices suggest that the proposed model fits the data well. The path coefficients in the model
are standardized regression coefficients. All the paths except the paths from management
commitment to reporting and the path from anticipation to unsafe events are significant to
p<0.01. R2 for the endogenous variables, i.e. variables that serve as a dependent variable in at
least one regression equation in the SEM, were 0.12 for reporting, 0.50 for supervisor safety
perception, 0.66 for learning, 0.52 for coworker safety perception, 0.60 for awareness, 0.35 for
anticipation, 0.11 for unsafe events, 0.40 for physical injuries, and 0.32 for job stress.
The model in Figure 4-1 was compared to models with management commitment linked to
reporting and (or) with anticipation linked to unsafe events. Based on the 2 differences and the
associated significance, the model in Figure 4-1 was determined the best option.
Figure 4-1 shows that management commitment has a significant positive impact on learning
(β=0.29), thus, H1(a) is supported. The impacts of supervisor safety perception on reporting
(β=0.24) and learning (β=0.58) are significantly positive. Hence, H2(a) and H2(b) are supported.
The effect of learning on anticipation is positively significant (β=0.57). Thus, H3(a) is supported.
The impact of reporting on awareness is also significantly positive (β=0.17). Hence, H4(b) is
supported. Coworker safety perception has a direct impact on awareness. Hence, H6(b) is
supported. Awareness has a direct negative impact on unsafe events (β=-0.16). Therefore, H7
is supported. No direct impact of anticipation on unsafe events was found. Table 4-9
summarizes the testing results, which show that seven out of fourteen hypotheses have been
validated. It is also worth noting that management commitment has a significant negative impact
on unsafe events (β=-0.26).

78
Top management
commitment to safety
Reporting
Learning
Supervisor safety
perception
Coworker safety
perception
Awareness
Anticipation
Physical
injuries
unsafe events
Job stress
ns
0.29
0.71 0.68
0.2
40
.58
0.17
0.41
0.57
0.1
5
0.4
3
-0.16
ns
0.63
0.17
-0.26
Figure 4-1. Structural model depicting the relationships between the studied variables
79
No direct impact does not mean no impact. In addition to the direct effect analysis, Table 4-8
demonstrates the indirect effect of one variable on another. For example, management
commitment has a significant positive impact on reporting via supervisor safety perception
(β=0.17). Supervisor safety perception has a very strong significant positive impact on
awareness via reporting, coworker safety perception, learning, and anticipation (β=0.54), and a
significant positive impact on anticipation via learning (β=0.35). Anticipation has a significant
negative impact on unsafe events via awareness. Accordingly, all of the hypotheses are
supported, as summarized in Table 4-9.

80
Table 4-8. Indirect effect analysis LN AN CS RP AW Unsafe events Physical injuries Job stress
TMC β 0.41 0.42 0.51 0.17* 0.46 ns -0.18 -0.13
95%C.I. [.31, .54] [.31, .53] [.42, .61] [.04, .33] [.36, .55] [-.25, -.11] [-.19, -.08]
SS β 0.35 0.54 ns ns ns
95%C.I. [.24, .48] [.42, .66]
LN β 0.17 ns ns ns
95%C.I. [.08, .33]
AN β -0.05* ns ns
95%C.I. [-.14, -.01]
CS β -0.09* -0.06* -0.04*
95%C.I. [-.19, -.01] [-.13, -.01] [-.09, -.01]
RP β -0.03* -0.02* -0.01*
95%C.I. [-.07, -.01] [-.05, .00] [-.04,.00]
AW β -0.11* -0.08*
95%C.I. [-.22, -.01] [-.16, -.01]
Unsafe events β 0.27
95%C.I. [.20,.36]
ns: non-significant; *: the standardized coefficients are significant with 0.01<p<0.05; the remained coefficients and 95% bootstrapped
confidence intervals (C.I.) are significant with p<0.01.
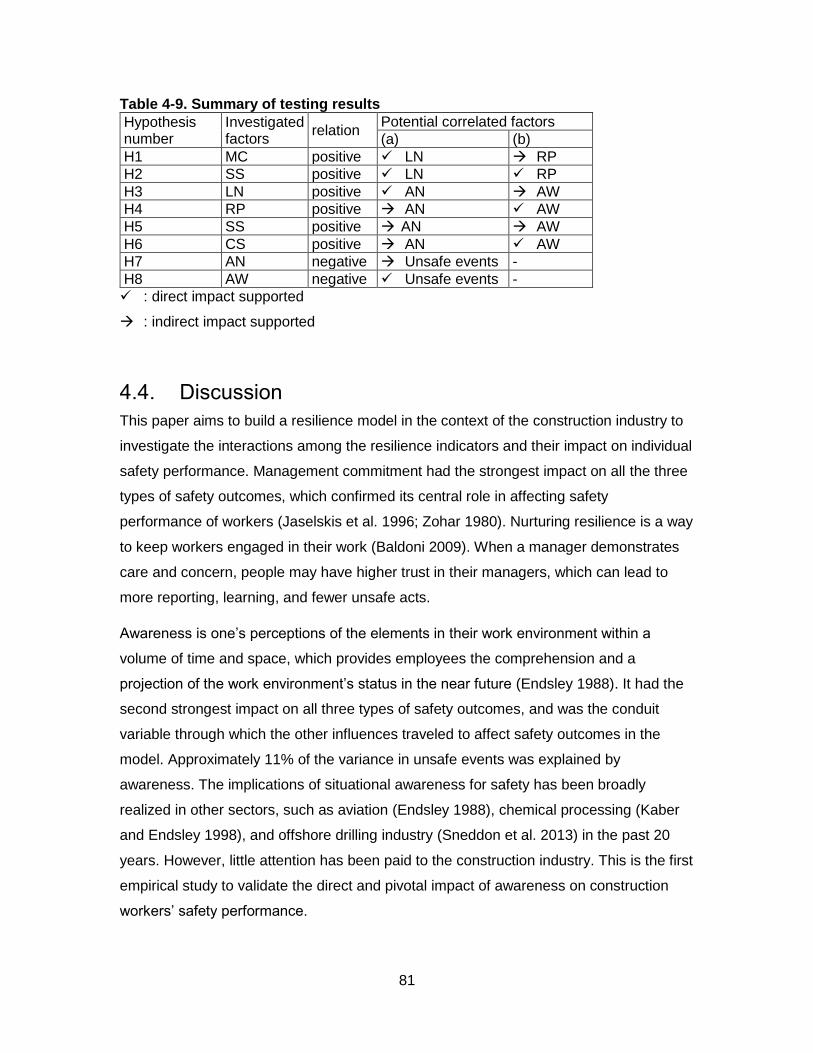
81
Table 4-9. Summary of testing results
Hypothesis number
Investigated factors
relation Potential correlated factors
(a) (b)
H1 MC positive LN RP
H2 SS positive LN RP
H3 LN positive AN AW
H4 RP positive AN AW
H5 SS positive AN AW
H6 CS positive AN AW
H7 AN negative Unsafe events -
H8 AW negative Unsafe events -
: direct impact supported
: indirect impact supported
4.4. Discussion
This paper aims to build a resilience model in the context of the construction industry to
investigate the interactions among the resilience indicators and their impact on individual
safety performance. Management commitment had the strongest impact on all the three
types of safety outcomes, which confirmed its central role in affecting safety
performance of workers (Jaselskis et al. 1996; Zohar 1980). Nurturing resilience is a way
to keep workers engaged in their work (Baldoni 2009). When a manager demonstrates
care and concern, people may have higher trust in their managers, which can lead to
more reporting, learning, and fewer unsafe acts.
Awareness is one’s perceptions of the elements in their work environment within a
volume of time and space, which provides employees the comprehension and a
projection of the work environment’s status in the near future (Endsley 1988). It had the
second strongest impact on all three types of safety outcomes, and was the conduit
variable through which the other influences traveled to affect safety outcomes in the
model. Approximately 11% of the variance in unsafe events was explained by
awareness. The implications of situational awareness for safety has been broadly
realized in other sectors, such as aviation (Endsley 1988), chemical processing (Kaber
and Endsley 1998), and offshore drilling industry (Sneddon et al. 2013) in the past 20
years. However, little attention has been paid to the construction industry. This is the first
empirical study to validate the direct and pivotal impact of awareness on construction
workers’ safety performance.

82
All of the other six factors, namely, coworker safety perception (β=0.56), supervisor
safety perception (β=0.54), management commitment (β=0.46), anticipation (β=0.29),
reporting (β=0.17) and learning (β=0.17), had a significant positive impact on
awareness. Among the pathways leading to better safety awareness, the link from
supervisor safety perception to coworker safety perception to awareness had the
strongest positive impact. Further, coworker safety perception mediated the impact of
supervisor safety perception on awareness. This means that a supervisor’s safety
perception can positively affect one’s perceptions about the safety behaviors of
coworkers, which in turn increases safety awareness. This suggests not only the
importance of the supervisor serving as mentor and leader on site, but also the
importance of individuals in promoting safety awareness. Literature suggests feedback
and information sharing within or among teams (Kaber and Endsley 1998) can improve
the individual, intra-team, and inter-team levels safety awareness. A structured feedback
system can inform the employees that their suggestions or concerns have been
reviewed and what kind of actions, if any, will be taken to address the problem, which
has the potential to improve workers’ reporting, learning, and safety performance. Our
findings suggest the critical role of team members in one’s safety awareness, and
confirm the role of an efficient communication channel (i.e. reporting and learning) in
promoting a higher level of safety awareness.
The score of coworker safety perception was 2.75 out of 5 (Table 4-7), which reflects
that the participants had a relatively low perception of the safety behavior of their
coworkers. Construction organizations should continuously improve their employees’
safety perception through a higher level of management commitment and engaging
training programs. As one of the foundations of safety culture (Wiegmann et al. 2004),
reporting is very important. However, it had the lowest score (1.86 out of 5 in Table 4-7)
among all the resilience factors, which means that construction workers are not
encouraged to report safety incidents and that they believe that reporting safety
concerns would have negative consequences for them. Considering the positive impact
of reporting on awareness, it is important to ensure that employees will not experience
reprisals or negative outcomes as a result of using the reporting system (Wiegmann et
al. 2004). In addition, the impact of management on reporting was achieved via
supervisor safety perception, which highlights the important role of supervisors in the
operation level of promoting a good reporting culture.

83
4.5. Conclusions
In this study, 431 surveys were collected from 68 construction sites in Ontario, Canada.
It is the first study to build a resilience framework in the construction industry and the first
study using structural equation modelling techniques. Fourteen hypotheses were
presented and supported by our data. This study demonstrated that management
commitment is critical to promoting a strong safety culture. As a conduit for the other
factors, awareness is the most important individual factor affecting the safety
performance of construction workers. Support from team members has a significant
positive impact on improving safety awareness of construction workers. Further, it was
found that reporting did not perform well, although it is a fundamental component of a
safety culture. Given these findings, construction organizations may consider focusing
safety programs to improve employees’ safety awareness, and building a better
reporting culture where everyone feels comfortable reporting their safety concerns. A
consistent and demonstrable level of organizational commitment is the key.
4.6. Limitations and future work
The scale of resilience research ranges from global resilience (Hirota et al. 2011),
community resilience (Cutter et al. 2008), plant resilience (Azadeh et al. 2014b), and
team resilience (Carmeli et al. 2013) in different research fields. This work is a multi-site
scale, which may be closer to a community or industry scale. This was based on the
assumption that all the surveyed sites are homogeneous in terms of their resilience level
and safety performance. However, because these sites were from different contracting
companies, they might vary in their resilience level and safety performance. Thus, future
work may focus on site-level analysis to examine whether these sites are indeed
heterogeneous regarding both resilience and safety performance levels.
On the other hand, this paper linked resilience to three types of safety outcomes,
namely, physical injuries, job stress, and unsafe events. However, these safety
outcomes are sometimes referred to lagging indicators of safety performance, whereas
leading indicators, such as safety compliance and safety participation, have been
suggested (Guo et al. 2016). Therefore, future research may explore the link between
resilience indicators, safety compliance, and safety participation. Moreover, this work
was based on cross-sectional data, which prevented making definitive causal

84
conclusions. Future research may explore the possibility of conducting longitudinal
research.

85
Chapter 5 Conclusions, recommendations, and future work
In this chapter, the conclusions and contributions of this thesis are summarized. The
directions of future work are also outlined.
5.1. Conclusions
This thesis investigated the impact of safety climate, individual resilience, interpersonal
conflicts at work, and organizational resilience on safety outcomes in the construction
industry. From 2013 to 2016, 1281 surveys were collected from 134 sites in the Ontario
province. Questions of individual resilience and organizational resilience were developed
and tested in the research.
Based on the findings, the following major conclusions were made:
Safety climate not only affects physical safety outcomes but also an employee’s job
stress level.
Although ICW was reported as “quite often” or “very often” by only 6.3% of
respondents, it had a significant effect on both physical safety outcomes including
physical injuries and unsafe events, and job stress.
Individual resilience has the potential to mitigate post-trauma job stress and
interpersonal conflicts of construction workers.
Management commitment to safety is the key to promoting a good safety culture.
Safety awareness is the most important individual factor affecting construction
workers’ safety performance.
Team support, especially from coworkers, has a significant positive impact on
construction worker’s safety awareness.
5.1.1. Impacts on physical injuries and unsafe events
Factors affecting physical injuries and unsafe events were in descending order by
correlation coefficients. Factors that have a positive impact on physical injuries and
unsafe events, from the greatest impact to the smallest impact, are: work pressure, ICW,
and role overload. Factors that have a negative impact on physical injuries and unsafe
events, from the greatest impact to the smallest impact, are: management commitment,

86
supervisor safety perception, learning, awareness, coworker safety perception, reporting
and anticipation.
5.1.2. Impacts on job stress
In a similar way, factors affecting job stress were ranked in descending order by
correlation coefficients. Factors that have a positive impact on job stress, from the
greatest impact to the smallest impact, are: work pressure, role overload, and ICW.
Factors that have a negative impact on job stress, from the greatest impact to the
smallest impact, are: coworker safety perception, supervisor safety perception,
awareness, management commitment, reporting, and anticipation.
5.2. Conference paper conclusions
The author also finished two conference papers that are not shown in the thesis:
Chen, Y., McCabe, B., and Hyatt, D. (2016). “Safety and Age: A Longitudinal Study
of Ontario Construction Workers.” Construction Research Congress 2016, American
Society of Civil Engineers, San Juan, Puerto Rico.
Chen, Y., Alderman, E., McCabe, B., and Hyatt, D. (2015). “Data Collection
Framework for Construction Safety.” ICSC15 – The Canadian Society for Civil
Engineering’s 5th International/11th Construction Specialty Conference, Vancouver,
Canada.
The major conclusions of the two conference papers were:
Safety tends to be a sensitive topic associated with liability.
It is challenging to access construction sites and collect surveys. Support of top
management and site management are the key to getting access to construction
sites.
Recruitment time per survey is approximately 4 hours, which is surprisingly high.
For high impact incidents, compared with data collected ten years ago (McCabe et
al. 2008), overexertion, and two struck-by incidents (struck against something fixed
or stationary, and struck by flying/falling object(s)) had a significant decrease, while,
no significant changes of strains or sprains, slipping tripping and fractured bone were
found.
Although overexertion decreased, it still has large frequency. There were 37% of the
workers reporting at least 1 incident in the previous 3 months before the survey time
based on data collected from 2013 to 2014, which is still a huge percentage.

87
5.3. Contributions
This thesis resulted in several original contributions:
This study designed and tested questions of individual resilience.
This study is the first empirical study that investigated the impact of individual
resilience on safety outcomes.
This study is the first study testing the antecedents of interpersonal conflicts at work
and the resulting safety outcomes in the construction industry.
This study designed and tested organizational resilience questions in the context of
construction industry.
This is the first study testing the mechanism about how the resilience factors interact
with each other and eventually affect safety outcomes.
This study is the first study using SEM to quantify organizational resilience.
5.4. Recommendations
Given these findings, the following recommendations were provided. First, construction
organizations need to not only monitor employees’ safety performance but also their
psychological well-being. Promoting a positive safety climate together with developing
training programs focusing on improving employees’ psychological health, especially
post-trauma psychological health, can improve safety performance of organizations.
Second, safety professionals may consider adding coping skill training programs to
improve the individual resilience of their workforce and reduce conflict-related safety
outcomes. Finally, construction organizations can improve employees’ safety awareness
by promoting a good team-level safety culture, and by building a good reporting and
learning culture.
5.5. Future work
Based on the results of this research, the following recommendations for future work are
outlined. First, given that all the three SEM models in the research were built based on
the survey data, future work needs to incorporate safety experts’ opinions to interpret
and justify the models in practice. Second, future work can focus on benchmarking
safety climate and safety performance at the site level using data envelopment analysis
(DEA). DEA is a powerful benchmarking technique. It identifies the best practice units
after comparing all service units considering all resources used and services provided
88
(Sherman and Zhu 2006). Thus, it is possible to improve inefficient units. For 134
participated construction sites in the research, the best practice site with regards to
safety performance and safety climate can be identified using DEA and safety
performance of inefficient sites can be improved accordingly. Third, from a probability
perspective, belief network (BN) model can be built in future to identify the key factors
leading to safety outcomes. BN is a directed acyclic graph (DAG) which encodes the
causal relationships between particular variables, represented in the DAG as nodes
(Cheng and Greiner 2001) . BN can learn the structure of the model automatically based
on the data, incorporate the prior knowledge of the experts, and give occurrence
possibilities. Thus, it is a good technique for research in future.

89
References Ali, T. H. (2006). “Influence of National Culture on Construction Safety Climate in
Pakistan.” Griffith University.
Andrew Baum. (1990). “Stress, Intrusive Imagery, and Chronic Distress.” Health Psychology, 9(6), 653–675.
Arbuckle, J. L. (2012). “IBM® SPSS® AmosTM 21 User’s Guide.” IBM Corporation, <ftp://public.dhe.ibm.com/software/analytics/spss/documentation/amos/21.0/en/Manuals/IBM_SPSS_Amos_Users_Guide.pdf> (May 1, 2016).
Avey, J. B., Reichard, R. J., Luthans, F., and Mhatre, K. H. (2011). “Meta-analysis of the impact of positive psychological capital on employee attitudes, behaviors, and performance.” Human Resource Development Quarterly, 22(2), 127–152.
Ayoko, O. B., Callan, V. J., and Härtel, C. E. J. (2003). “Workplace conflict, bullying, and counterproductive behaviors.” The International Journal of Organizational Analysis, 11(4), 283–301.
Azadeh, A., Salehi, V., Arvan, M., and Dolatkhah, M. (2014a). “Assessment of resilience engineering factors in high-risk environments by fuzzy cognitive maps: A petrochemical plant.” Safety Science, Elsevier Ltd, 68, 99–107.
Azadeh, A., Salehi, V., Ashjari, B., and Saberi, M. (2014b). “Performance evaluation of integrated resilience engineering factors by data envelopment analysis: The case of a petrochemical plant.” Process Safety and Environmental Protection, 92(3), 231–241.
Azen, R., and Budescu, D. V. (2006). “Comparing Predictors in Multivariate Regression Models: An Extension of Dominance Analysis.” Journal of Educational and Behavioral Statistics, SAGE Publications, 31(2), 157–180.
Baldoni, J. (2009). “Help Your Team Build Resilience.” Harvard Business Review.
Barling, J., Loughlin, C., and Kelloway, E. K. (2002). “Development and test of a model linking safety-specific transformational leadership and occupational safety.” Journal of Applied Psychology, 87(3), 488–496.
Bartlett, J. E., Kotrlik, J. W., and Higgins, C. C. (2001). “Organizational Research: Determining Appropriate Sample Size in Survey Research.” Information Technology, Learning, and Performance Journal, 19(1), 43–50.
Becerik-Gerber, B., and Siddiqui, M. (2014). “Civil Engineering Grand Challenges: Opportunities for Data Sensing, Information Analysis, and Knowledge Discovery.” Journal of Computing in Civil Engineering, 28(4), 1–13.
Bergstrom, J., van Winsen, R., and Henriqson, E. (2015). “On the rationale of resilience in the domain of safety: A literature review.” Reliability Engineering and System Safety, Elsevier, 141, 131–141.
Bosher, L. (2011). “Disaster risk reduction and ‘built‐in’ resilience: towards overarching principles for construction practice.” Disasters, 35(1), 1–18.
Bosher, L., Dainty, A., Carrillo, P., and Glass, J. (2007). “Built‐in resilience to disasters: a

90
pre‐emptive approach.” Engineering, Construction and Architectural Management, Emerald Group Publishing Limited, 14(5), 434–446.
Brase, C. H., and Brase, C. P. (2016). Understandable Statistics: Concepts and Methods. Cengage Learning, Boston, MA.
Brockman, J. L. (2014). “Interpersonal Conflict in Construction: Cost, Cause, and Consequence.” Journal of Construction Engineering and Management, American Society of Civil Engineers, 140(2), 4013050.
Broomell, S., Lorenz, F., and Helwig, N. E. (2010). “Dominance function in Matlab.” <http://www.andrew.cmu.edu/user/sbb59/code.html> (Oct. 1, 2016).
Brown, T. A. (2015). Confirmatory Factor Analysis for Applied Research. The Guilford Press, New York.
Browne, M. W., and Cudeck, R. (1992). “Alternative Ways of Assesing Model Fit.” Sociological Methods & Research, (K. A. Bollen and J. S. Long, eds.), SAGE Publications, 21(2), 230–258.
Bruk-Lee, V., and Spector, P. E. (2006). “The Social Stressors-Counterproductive Work Behaviors Link: Are Conflicts With Supervisors and Coworkers the Same?” Journal of Occupational Health Psychology, 11(2), 145–156.
Bruyelle, J.-L., O’Neill, C., El-Koursi, E.-M., Hamelin, F., Sartori, N., and Khoudour, L. (2014). “Improving the resilience of metro vehicle and passengers for an effective emergency response to terrorist attacks.” Safety Science, 62, 37–45.
Budescu, D. V., and V., D. (1993). “Dominance analysis: A new approach to the problem of relative importance of predictors in multiple regression.” Psychological Bulletin, American Psychological Association, 114(3), 542–551.
Bureau of Labor Statistics (BLS). (2014). “Number, percent, and rate of fatal occupational injuries by selected worker characteristics, industry, and occupation, 1996-2014.” <http://www.bls.gov/iif/> (Oct. 10, 2016).
Byrne, B. M. (2001a). “Structural Equation Modeling With AMOS, EQS, and LISREL: Comparative Approaches to Testing for the Factorial Validity of a Measuring Instrument.” International Journal of Testing, 1(1), 55–86.
Byrne, B. M. (2001b). Structural Equation Modeling With AMOS: Basic Concepts, Applications, and Programming. Lawrence Erlbaum Associations, Inc., Mahwah, NJ.
Carmeli, A., Friedman, Y., and Tishler, A. (2013). “Cultivating a resilient top management team: The importance of relational connections and strategic decision comprehensiveness.” Safety Science, 51(1), 148–159.
Carthey, J., de Leval, M. R., and Reason, J. T. (2001). “Institutional resilience in healthcare systems.” Quality in health care : QHC, 10(1), 29–32.
Cattell, K., Bowen, P., and Edwards, P. (2016). “Stress among South African construction professionals: a job demand-control-support survey.” Construction Management and Economics, Routledge, 34(10), 700–723.
Chen, Y., Alderman, E., and McCabe, B. (2015). “Data Collection Framework for

91
Construction Safety.” ICSC15 – The Canadian Society for Civil Engineering’s 5th International/11th Construction Specialty Conference, Vancouver, Canada.
Cheng, J., and Greiner, R. (2001). “Learning Bayesian Belief Network Classifiers: Algorithms and System.” Conference of the Canadian Society for Computational Studies of Intelligence, 141–151.
Cigularov, K. P., Lancaster, P. G., Chen, P. Y., Gittleman, J., and Haile, E. (2013). “Measurement equivalence of a safety climate measure among Hispanic and White Non-Hispanic construction workers.” Safety Science, 54, 58–68.
Clarke, S. (2010). “An integrative model of safety climate: Linking psychological climate and work attitudes to individual safety outcomes using meta-analysis.” Journal of Occupational and Organizational Psychology, Blackwell Publishing Ltd, 83(3), 553–578.
Connor, K. M., and Davidson, J. R. T. (2003). “Development of a new Resilience scale: The Connor-Davidson Resilience scale (CD-RISC).” Depression and Anxiety, 18(2), 76–82.
Cooper, C. L., and Cartwright, S. (1997). “An intervention strategy for workplace stress.” Journal of Psychosomatic Research, 43(1), 7–16.
Costella, M. F., Saurin, T. A., and de Macedo Guimaraes, L. B. (2009). “A method for assessing health and safety management systems from the resilience engineering perspective.” Safety Science, 47(8), 1056–1067.
Cox, S. J., and Cheyne, A. J. T. (2000). “Assessing safety culture in offshore environments.” Safety Science, 34(1–3), 111–129.
Cutter, S. L., Barnes, L., Berry, M., Burton, C., Evans, E., Tate, E., and Webb, J. (2008). “A place-based model for understanding community resilience to natural disasters.” Global Environmental Change, 18(4), 598–606.
Dedobbeleer, N., and Béland, F. (1991). “A safety climate measure for construction sites.” Journal of Safety Research, 22(2), 97–103.
Demerouti, E., Bakker, A. B., Nachreiner, F., and Schaufeli, W. B. (2001). “The Job Demands–Resources Model of Burnout.” Journal of Applied Psychology, 86(3), 499–512.
Diamantopoulos, A., and Siguaw, J. A. (2000). Introducing LISREL. SAGE Publications, London.
Dong, X. (2005). “Long workhours, work scheduling and work-related injuries among construction workers in the United States.” Scandinavian Journal of Work, Environment & Health, 31(5), 329–335.
Eid, J., Mearns, K., Larsson, G., Laberg, J. C., and Johnsen, B. H. (2012). “Leadership, psychological capital and safety research: Conceptual issues and future research questions.” Safety Science, 50(1), 55–61.
Endsley, M. (1988). “Design and evaluation for situational awareness enhancement.” Proceedings of the Human Factors Society 32nd Annual Meeting, Santa Monica.
Fang, D., Chen, Y., and Wong, L. (2006). “Safety Climate in Construction Industry: A

92
Case Study in Hong Kong.” Journal of Construction Engineering and Management, 132(6), 573–584.
Ferreira, P. N. P. (2011). “Resilience in the planning of rail engineering work.” University of Nottingham.
Flin, R., Mearns, K., O’Connor, P., and Bryden, R. (2000). “Measuring safety climate: Identifying the common features.” Safety Science, 34(1–3), 177–192.
Gefen, D., Straub, D. W., and Boudreau, M.-C. (2000). “Structural equation modeling and regression: guidelines for research practice.” Communications of AIS, 4, 1–77.
Gillen, M., Baltz, D., Gassel, M., Kirsch, L., and Vaccaro, D. (2002). “Perceived safety climate, job demands, and coworker support among union and nonunion injured construction workers.” Journal of Safety Research, 33(1), 33–51.
Glendon, A. I., and Litherland, D. K. (2001). “Safety climate factors, group differences and safety behaviour in road construction.” Safety Science, 39(3), 157–188.
Glendon, A. I., and Stanton, N. A. (2000). “Perspectives on safety culture.” Safety Science, 34(1–3), 193–214.
Goldenhar, L. M., Williams, L. J., and Swanson, N. G. (2003). “Modelling relationships between job stressors and injury and near-miss outcomes for construction labourers.” Work & Stress, Taylor & Francis Group, 17(3), 218–240.
Guo, B., Yiu, T., and González, V. (2016). “Predicting safety behavior in the construction industry: Development and test of an integrative model.” Safety Science, 84, 1–11.
Hair, J. F., Anderson, R., Tahthan, R., and Black, W. (1995). Multivariate data analysis with readings. Macmillan Pub., New York.
Han, S., Lee, S., and Pena-Mora, F. (2010a). “Framework for a resilience safety management system: a simulation and visualization approach.” Proceedings of the International Conference on Computing in Civil and Building Engineering, Nottingham, UK.
Han, S., Lee, S., and Peña-Mora, F. (2010b). “System Dynamics Modeling of a Safety Culture Based on Resilience Engineering.” Construction Research Congress 2010, American Society of Civil Engineers, Reston, VA, 389–397.
Härmä, M. (2006). “Workhours in relation to work stress, recovery and health.” candinavian Journal of Work, Environment & Health, 32(6), 502–514.
Harrington, D. (2009). Confirmatory Factor Analysis. Oxford Scholarship Online.
Hauge, L. J., Skogstad, A., and Einarsen, S. (2009). “Individual and situational predictors of workplace bullying: Why do perpetrators engage in the bullying of others?” Work & Stress, Taylor & Francis Group, 23(4), 349–358.
Hayes, B. E., Perander, J., Smecko, T., and Trask, J. (1998). “Measuring Perceptions of Workplace Safety: Development and Validation of the Work Safety Scale.” Journal of Safety Research, 29(3), 145–161.
Hemingway, M. A., and Smith, C. S. (1999). “Organizational climate and occupational stressors as predictors of withdrawal behaviours and injuries in nurses.” Journal of Occupational and Organizational Psychology, Blackwell Publishing Ltd, 72(3), 285–

93
299.
Hirota, M., Holmgren, M., Van Nes, E. H., and Scheffer, M. (2011). “Global Resilience of Tropical Forest and Savanna to Critical Transitions.” Science, 334(6053), 232–235.
Ho, R. (2006). Handbook of univariate and multivariate data analysis and interpretation with SPSS. CRC Press, New York.
Hofmann, D. A., and Morgeson, F. P. (1999). “Safety-related behavior as a social exchange: The role of perceived organizational support and leader–member exchange.” Journal of Applied Psychology, 84(2), 286–296.
Hollnagel, E. (2015). Safety-I and Safety-II, the past and future of safety management. Ashgate.
Hon, C. K. H., Chan, A. P. C., and Yam, M. C. H. (2014). “Relationships between safety climate and safety performance of building repair, maintenance, minor alteration, and addition (RMAA) works.” Safety Science, 65, 10–19.
Hooper, D., Couglan, J., and Mullen, M. R. (2008). “Structural equation modelling: guidelines for determining model fit.” Electronic Journal of Business Research Methods, 6(1), 53–60.
Hox, J. J., and Bechger, T. M. (1998). “An introduction to structural equation modeling.” Family Science Review, 11, 354–373.
Hu, B. S., Liang, Y. X., Hu, X. Y., Long, Y. F., and Ge, L. N. (2000). “Posttraumatic Stress Disorder in Co-workers following Exposure to a Fatal Construction Accident in China.” International Journal of Occupational and Environmental Health, Taylor & Francis, 6(3), 203–207.
Hu, L., and Bentler, P. M. (1999). “Cutoff criteria for fit indexes in covariance structure analysis: Conventional criteria versus new alternatives.” Structural Equation Modeling: A Multidisciplinary Journal, 6(1), 1–55.
Huang, Y.-H., Chen, P. Y., Krauss, A. D., and Rogers, D. A. (2004). “Quality of the Execution of Corporate Safety Policies and Employee Safety Outcomes: Assessing the Moderating Role of Supervisor Safety Support and the Mediating Role of Employee Safety Control.” Journal of Business and Psychology, Kluwer Academic Publishers-Plenum Publishers, 18(4), 483–506.
Huang, Y.-H., Ho, M., Smith, G. S., and Chen, P. Y. (2006). “Safety climate and self-reported injury: Assessing the mediating role of employee safety control.” Accident Analysis & Prevention, 38(3), 425–433.
Jaselskis, E. J., Anderson, S. D., and Russell, J. S. (1996). “Strategies for Achieving Excellence in Construction Safety Performance.” Journal of Construction Engineering and Management, 122(1), 61–70.
Johnsen, S. O., and Veen, M. (2013). “Risk assessment and resilience of critical communication infrastructure in railways.” Cognition, Technology and Work, 15(1), 95–107.
Kaber, D. B., and Endsley, M. R. (1998). “Team situation awareness for process control safety and performance.” Process Safety Progress, American Institute of Chemical Engineers, 17(1), 43–48.

94
Kenny, D. A. (2016). “Mediation.” <http://davidakenny.net/cm/mediate.htm>.
Kim, H.-Y. (2013). “Statistical notes for clinical researchers: assessing normal distribution (2) using skewness and kurtosis.” Restorative dentistry & endodontics, Korean Academy of Conservative Dentistry, 38(1), 52–4.
Kines, P., Andersen, L. P. S., Spangenberg, S., Mikkelsen, K. L., Dyreborg, J., and Zohar, D. (2010). “Improving construction site safety through leader-based verbal safety communication.” Journal of Safety Research, 41(5), 399–406.
Kline, R. B. (2005). Principles and Practice of Structural Equation Modeling. The Guilford Press, New York.
Lazarus, R. S. (1966). “Psychological stress and the coping process.” McGraw-Hill, New York.
Leung, M.-Y., Liang, Q., and Olomolaiye, P. (2016). “Impact of Job Stressors and Stress on the Safety Behavior and Accidents of Construction Workers.” Journal of Management in Engineering, American Society of Civil Engineers, 32(1), 1943–5479.
Leung, M., Chan, I. Y. S., and Cooper, C. L. (2015). Stress management in the construction industry. John Wiley & Sons, Ltd., Chichester, West Sussex, UK.
Li, F., Jiang, L., Yao, X., and Li, Y. (2013). “Job demands, job resources and safety outcomes: The roles of emotional exhaustion and safety compliance.” Accident Analysis & Prevention, 51, 243–251.
Lingard, H. C., Cooke, T., and Blismas, N. (2010). “Safety climate in conditions of
construction subcontracting: a multi‐level analysis.” Construction Management and Economics, Routledge , 28(8), 813–825.
Liu, L., Hu, S., Wang, L., Sui, G., and Ma, L. (2013). “Positive resources for combating depressive symptoms among Chinese male correctional officers: perceived organizational support and psychological capital.” BMC Psychiatry, BioMed Central, 13(1), 89.
Loewenthal, K. M. (2001). An Introduction to Psychological Tests and Scales. Psychology Press, Hove, UK.
Luthans, F. (2002). “The need for and meaning of positive organizational behavior.” Journal of Organizational Behavior, John Wiley & Sons, Ltd., 23(6), 695–706.
MacCallum, R. C., Widaman, K. F., Zhang, S., and Hong, S. (1999). “Sample size in factor analysis.” Psychological Methods, American Psychological Association, 4(1), 84–99.
McCabe, B., Loughlin, C., Munteanu, R., Tucker, S., and Lam, A. (2008). “Individual safety and health outcomes in the construction industry.” Canadian Journal of Civil Engineering, 35(12), 1455–1467.
McCabe, B. Y., Alderman, E., Chen, Y., Hyatt, D. E., and Shahi, A. (2016). “Safety Performance in the Construction Industry: Quasi-Longitudinal Study.” Journal of Construction Engineering and Management, 4016113.
Meier, L. L., Semmer, N. K., and Gross, S. (2014). “The effect of conflict at work on well-

95
being: Depressive symptoms as a vulnerability factor.” Work & Stress, 28(1), 31–48.
Mendeloff, J., and Staetsky, L. (2014). “Occupational fatality risks in the United States and the United Kingdom.” American journal of industrial medicine, 57(1), 4–14.
Mitropoulos, P., Cupido, G., and Namboodiri, M. (2009). “Cognitive Approach to Construction Safety: Task Demand-Capability Model.” Journal of Construction Engineering and Management, 135(9), 881–889.
Mitropoulos, P. T., and Cupido, G. (2009). “The role of production and teamwork practices in construction safety: A cognitive model and an empirical case study.” Journal of Safety Research, 40(4), 265–275.
Mohamed, S. (2002). “Safety Climate in Construction Site Environments.” Journal of Construction Engineering and Management, 128(5), 375–384.
Mullen, J. E., and Kelloway, E. K. (2009). “Safety leadership: A longitudinal study of the effects of transformational leadership on safety outcomes.” Journal of Occupational and Organizational Psychology, Blackwell Publishing Ltd, 82(2), 253–272.
Nahrgang, J. D., Morgeson, F. P., and Hofmann, D. A. (2011). “Safety at work: A meta-analytic investigation of the link between job demands, job resources, burnout, engagement, and safety outcomes.” Journal of Applied Psychology, 96(1), 71–94.
National Institute for Occupational Safety and Health (NIOSH). (2001). “Fatal Injuries to Civilian Workers in the United States, 1980-1995.” <http://www.cdc.gov/niosh/docs/2001-129/pdfs/2001-129.pdf> (Oct. 10, 2016).
Neuman, J. H., and Baron, R. A. (1998). “Workplace Violence and Workplace Aggression: Evidence Concerning Specific Forms, Potential Causes, and Preferred Targets.” Journal of Management, SAGE Publications, 24(3), 391–419.
Nixon, A. E., Mazzola, J. J., Bauer, J., Krueger, J. R., and Spector, P. E. (2011). “Can work make you sick? A meta-analysis of the relationships between job stressors and physical injuries.” Work & Stress, Taylor & Francis Group, 25(1), 1–22.
Ontario. (2014). “Progress Report : jobs and economy.” <https://www.ontario.ca/government/progress-report-2014-jobs-and-economy> (Dec. 12, 2015).
Ontario Centre for Suicide Prevention. (2015). “First Responders & Trauma Intervention and Suicide Prevention.” <https://www.suicideinfo.ca/wp-content/uploads/2015/05/First-Responders-Toolkit-WEB.pdf> (Oct. 10, 2016).
Ontario Infrastructure Health & Safety Association (IHSA). (2008). “Fatalities, injuries, and disease.” <http://ihsa.ca/pdfs/research_docs/Injury_Statistics_2008.pdf>.
Ontario Ministry of Labour. (2015). “Overtime Pay.” <https://www.labour.gov.on.ca/english/es/pubs/guide/overtime.php> (May 15, 2016).
Ontario Workplace Safety and Insurance Board (WSIB). (2013). “By the Numbers : 2012 WSIB Statistical Report Table of Contents.” <http://www.wsibstatistics.ca/wp-content/uploads/2015/05/WSIB_BTN_SCHED1.pdf> (Mar. 20, 2003).

96
Ostrom, L., Wilhelmsen, C., and Kaplan, B. (1993). “Assessing safety culture.” Nuclear Safety, 34(2), 163–172.
Patterson, E. S., Woods, D. D., Cook, R. I., and Render, M. L. (2007). “Collaborative cross-checking to enhance resilience.” Cognition, Technology and Work, 9(3), 155–162.
Penney, L. M., and Spector, P. E. (2005). “Job stress, incivility, and counterproductive work behavior (CWB): the moderating role of negative affectivity.” Journal of Organizational Behavior, John Wiley & Sons, Ltd., 26(7), 777–796.
Pidgeon, N. F. (1991). “Safety Culture and Risk Management in Organizations.” Journal of Cross-Cultural Psychology, 22(1), 129–140.
Probst, T. M., and Brubaker, T. L. (2001). “The Effects of Job Insecurity on Employee Safety Outcomes: Cross-Sectional and Longitudinal Explorations.” Journal of Occupational Health Psychology, 6(2).
Probst, T. M., Brubaker, T. L., and Barsotti, A. (2008). “Organizational injury rate underreporting: The moderating effect of organizational safety climate.” Journal of Applied Psychology, American Psychological Association, 93(5), 1147–1154.
De Raeve, L., Jansen, N. W. H., van den Brandt, P. A., Vasse, R., and Kant, I. J. (2009). “Interpersonal conflicts at work as a predictor of self-reported health outcomes and occupational mobility.” Occupational Environmental Medicine, 66, 16–22.
De Raeve, L., Jansen, N. W. H., van den Brandt, P. A., Vasse, R. M., and Kant, I. J. (2008). “Risk factors for interpersonal conflicts at work.” Scandinavian Journal of Work, Environment & Health, 34(2), 96–106.
Ross, A. J., Anderson, J. E., Kodate, N., Thompson, K., Cox, A., and Malik, R. (2014). “Inpatient diabetes care: complexity, resilience and quality of care.” Cognition, Technology & Work, 16(1), 91–102.
Sackett, P. R. (2002). “The Structure of Counterproductive Work Behaviors: Dimensionality and Relationships with Facets of Job Performance.” International Journal of Selection and Assessment, Blackwell Publishers Ltd, 10(1&2), 5–11.
Salin, D. (2003). “Ways of Explaining Workplace Bullying: A Review of Enabling, Motivating and Precipitating Structures and Processes in the Work Environment.” Human Relations, SAGE Publications, 56(10), 1213–1232.
Saurin, T. A., Formoso, C. T., and Cambraia, F. B. (2008). “An analysis of construction safety best practices from a cognitive systems engineering perspective.” Safety Science, 46(8), 1169–1183.
Sawacha, E., Naoum, S., and Fong, D. (1999). “Factors affecting safety performance on construction sites.” International Journal of Project Management, 17(5), 309–315.
Schaufeli, W. B., and Taris, T. W. (2014). “A Critical Review of the Job Demands-Resources Model: Implications for Improving Work and Health.” Bridging
Occupational, Organizational and Public Health: A Transdisciplinary Approach, G.
F. Bauer and O. Hämmig, eds., Springer Netherlands, Dordrecht, 43–68.
Schwarzer, R., and Jerusalem, M. (1995). “Generalized Self-Efficacy Scale.” Measures in health psychology: A user’s portfolio, J. Weinman, S. Wright, and M. Johnston,
97
eds., NFER-NELSON, Windsor, UK, 35–37.
Sherman, H. D., and Zhu, J. (2006). Service Productivity Management: Improving Service Performance using Data Envelope Analysis (DEA). Springer, New York.
Shirali, G. A., Mohammadfam, I., and Ebrahimipour, V. (2013). “A new method for quantitative assessment of resilience engineering by PCA and NT approach: A case study in a process industry.” Reliability Engineering and System Safety, 119, 88–94.
Shirali, G., Mohammadfam, I., Motamedzade, M., Ebrahimipour, V., and Moghimbeigi, A. (2012). “Assessing resilience engineering based on safety culture and managerial factors.” Process Safety Progress, 31(1), 17–18.
Shirali, G., Shekari, M., and Angali, K. (2016). “Quantitative assessment of resilience safety culture using principal components analysis and numerical taxonomy: A case study in a petrochemical plant.” Journal of Loss Prevention in the Process, 40, 277–284.
Siu, O., Phillips, D. R., and Leung, T. (2004). “Safety climate and safety performance among construction workers in Hong Kong. The role of psychological strains as mediators.” Accident; analysis and prevention, 36(3), 359–66.
Sneddon, A., Mearns, K., and Flin, R. (2006). “Situation awareness and safety in offshore drill crews.” Cognition, Technology & Work, Springer-Verlag, 8(4), 255–267.
Sneddon, A., Mearns, K., and Flin, R. (2013). “Stress, fatigue, situation awareness and safety in offshore drilling crews.” Safety Science, 56, 80–88.
Spector, P. E., and Fox, S. (2005). “The Stressor-Emotion Model of Counterproductive Work Behavior.” Counterproductive work behavior: Investigations of actors and targets., S. Fox and P. E. Spector, eds., American Psychological Association, Washington, DC, 151–174.
Spector, P. E., Fox, S., Penney, L. M., Bruursema, K., Goh, A., and Kessler, S. (2006). “The dimensionality of counterproductivity: Are all counterproductive behaviors created equal?” Journal of Vocational Behavior, 68(3), 446–460.
Spector, P. E., and Jex, S. M. (1998). “Development of four self-report measures of job stressors and strain: Interpersonal Conflict at Work Scale, Organizational Constraints Scale, Quantitative Workload Inventory, and Physical injuries Inventory.” Journal of occupational health psychology, 3(4), 356–67.
Statistics Canada. (2015a). “Labour force survey estimates (LFS), by North American Industry Classification System (NAICS), sex and age group.” Cansim, <http://www5.statcan.gc.ca/cansim/a26?lang=eng&retrLang=eng&id=2820008&tabMode=dataTable&srchLan=-1&p1=-1&p2=9> (Jun. 14, 2015).
Statistics Canada. (2015b). “Table 282-0008, 2011-2015, Labour force survey estimates (LFS), by North American Industry Classification System (NAICS), sex and age group annual (persons x 1,000).” <http://www5.statcan.gc.ca/> (Jun. 14, 2015).
Statistics Canada. (2015c). “Table 281-0042, 2011-2015, Survey of Employment, Payrolls and Hours (SEPH), employment for all employees, by enterprise size and North American Industry Classification System (NAICS), annual (persons).”
98
<http://www5.statcan.gc.ca/> (Jun. 14, 2016).
Stewart, M., Reid, G., and Mangham, C. (1997). “Fostering children’s resilience.” Journal of Pediatric Nursing, W.B. Saunders, 12(1), 21–31.
Tabachnick, B. G., and Fidell, L. S. (2007). Using Multivariate Statistics. Pearson Education, Inc., Boston, MA.
Tavakol, M., and Dennick, R. (2011). “Making sense of Cronbach’s alpha.” International Journal of Medical Education, IJME, 2, 53–55.
The Association of Workers’ Compensation Boards of Canada (AWCBC). (2013). Number of Fatalities, by Industry and Jurisdiction, 2011-2013.
Tholén, S. L., Pousette, A., and Törner, M. (2013). “Causal relations between psychosocial conditions, safety climate and safety behaviour – A multi-level investigation.” Safety Science, 55, 62–69.
Turner, B., Pidgeon, N., Blockley, D., and Toft, B. (1989). “Safety culture: its importance in future risk management.” Second World Bank Workshop on Safety Control and Risk Management, Karlstad, Sweden.
Turner, N., Chmiel, N., Hershcovis, M. S., and Walls, M. (2010). “Life on the line: Job demands, perceived co-worker support for safety, and hazardous work events.” Journal of occupational health psychology, 15(4), 482–493.
Wanberg, C. R., and Banas, J. T. (2000). “Predictors and outcomes of openness to changes in a reorganizing workplace.” Journal of Applied Psychology, American Psychological Association, 85(1), 132–142.
Wheaton, B., Muthén, B., Alwin, D. F., and Summers, G. F. (1977). “Assessing Reliability and Stability in Panel Models.” Sociological Methodology, 8, 84–136.
Wiegmann, D., Zhang, H., and Thaden, T. Von. (2004). “Safety culture: An integrative review.” The International Journal of Aviation Psychology, 14(2), 117–134.
Williams, L. J., and Holahan, P. J. (1994). “Parsimony-based fit indices for multiple‐indicator models: Do they work?” Structural Equation Modeling: A Multidisciplinary Journal, Taylor & Francis Group, 1(2), 161–189.
Woods, D. D., and Hollnagel, E. (2006). “Prologue: Resilience engineering concepts.” Resilience Engineering: Concepts and Precepts, E. Hollnagel and D. D. Woods, eds., Ashgate, Aldershot, UK, 1–6.
Woods, D. D., and Wreathall, J. (2003). “Managing Risk Proactively : The Emergence of Resilience Engineering.” Psychology, (November).
Yip, B., and Rowlinson, S. (2009). “Job Burnout among Construction Engineers Working within Consulting and Contracting Organizations.” Journal of Management in Engineering, American Society of Civil Engineers, 25(3), 122–130.
Youssef, C. M., and Luthans, F. (2007). “Positive Organizational Behavior in the Workplace: The Impact of Hope, Optimism, and Resilience.” Journal of Management, SAGE Publications, 33(5), 774–800.
Zapf, D. (1999). “Organisational, work group related and personal causes of mobbing/bullying at work.” International Journal of Manpower, 20(1/2), 70–85.

99
Zohar, D. (1980). “Safety climate in industrial organizations: theoretical and applied implications.” The Journal of Applied Psychology, 65(1), 96–102.
Zohar, D. (2000). “A group-level model of safety climate: testing the effect of group climate on microaccidents in manufacturing jobs.” The Journal of applied psychology, 85(4), 587–596.
Zohar, D., and Luria, G. (2005). “A multilevel model of safety climate: cross-level relationships between organization and group-level climates.” The Journal of applied psychology, 90(4), 616–628.

100
Appendix A Survey-worker version1
1: original survey from (McCabe et al. 2008)
2: version 2 modified in 2015 May
3: version 3 modified in 2016 May
SAFETY SURVEY
Worker Survey
We would like to ask you questions about your job, safety, and interpersonal relations at work. This questionnaire is anonymous and there is no way to identify you personally. Therefore, please be completely honest and respond as you really feel and think. Thank you for your participation.
GENERAL INFORMATION:
1. Gender: (circle) Male Female (1, 2, 3) 2. Age: __________ (1, 2, 3) 3. What is your trade? ______________________________________(1, 2, 3) 4. How long have you worked in construction? __________YEARS (1, 2, 3) 5. How long have you worked for this employer? __________ YEARS (1, 2, 3) 6. How many construction employers have you worked for in the last 3 years?
________(1, 2, 3) 7. How many projects have you worked on in the last 3 years? ___________(1, 2, 3) 8. What is the average number of hours worked per week in the last month?
_________(1, 2, 3) 9. Have you received any job-related safety training? YES NO (1, 2) 10. Have you ever served on a safety committee? YES NO (1, 2) 11. Are you a member of a union? YES NO (1, 2, 3) 12. What is your job position? (1, 2, 3)
1 Only worker version survey is attached here. The major differences between supervisor and worker version survey are questions 44-57, and questions 71-73, where for supervisor survey, “I” was used, and for worker survey, “my supervisor” was used. For example, for question 44, in a supervisor survey, it becomes “I encourage workers to express their ideas and opinions about safety at work”.

101
Supervisors fill out a different survey
Journeyman or equivalent– those people responsible for the physical labour on the site including operation of equipment, maintenance, trades and other non supervisory workers. Apprentice or equivalent – a new entrant to the industry who is receiving training on the job under the supervision of a master craft worker or member of a construction trade. Apprentices receive wages while training on the job.
12b) What is the size of your employer? (1, 2, 3)
1-4 employees
5-99 employees
100-499 employees
500 or more employees
12c) Did you complete the survey 10 years ago? YES NO (1, 2)

102
I would describe myself as... Extr
em
ely
Wro
ng
Wro
ng
Neither
Corr
ect
Extr
em
ely
Corr
ect
1
2
3
13. Careful 1 2 3 4 5
14. Efficient 1 2 3 4 5
15. Systematic 1 2 3 4 5
16. Sloppy 1 2 3 4 5
17. Disorganized 1 2 3 4 5
18. Prompt 1 2 3 4 5
19. Thorough 1 2 3 4 5
20. Not dependable 1 2 3 4 5
21. Inconsistent 1 2 3 4 5
22. Conscientious 1 2 3 4 5
Str
on
gly
dis
agre
e
Dis
agre
e
Uncert
ain
Agre
e
Str
on
gly
agre
e
1
2
3
23. It is easy for me to stay focused and accomplish my goals
1 2 3 4 5
24. I am confident that I could deal efficiently with unexpected events
1 2 3 4 5
25. I can remain calm when facing difficulties because I can rely on my coping abilities
1 2 3 4 5
26. When I am confronted with a problem, I can usually find several solutions
1 2 3 4 5
27. I can cope with stress 1 2 3 4 5
28. I can focus and think clearly when I am under pressure
1 2 3 4 5
29. I am able to adapt to changes
1 2 3 4 5
30. I tend to bounce back after illness or hardship
1 2 3 4 5

103
Str
on
gly
dis
agre
e
Dis
agre
e
Uncert
ain
Agre
e
Str
on
gly
agre
e
1
2
3
31. I have mastered the required tasks of my job
1 2 3 4 5
32. I have not fully developed the appropriate skills and abilities to successfully perform my job
1 2 3 4 5
33. I have received necessary training to do my job properly and safely
1 2 3 4 5
Str
on
gly
dis
agre
e
Dis
agre
e
Uncert
ain
Agre
e
Str
on
gly
agre
e
1
2
3
34. If I worry about safety all the time I would not get my job done
1 2 3 4 5
35. I cannot avoid taking risks in my job 1 2 3 4 5
36. Accidents will happen no matter what I do
1 2 3 4 5
37. I can’t do anything to improve safety in my workplace
1 2 3 4 5
38. I always wear the protective equipment or clothing required on my job
1 2 3 4 5
39. I do not use equipment that I feel is unsafe
1 2 3 4 5
40. If I find some safety issues in my job, I will not continue the work until the problem is fixed
1 2 3 4 5
41. I inform management of any potential hazards I notice on the job
1 2 3 4 5
42. I know what procedures to follow if a worker is injured on my shift
1 2 3 4 5
43. I would know what to do if an emergency occurred on my shift
1 2 3 4 5
Str
on
gly
dis
agre
e
Dis
agre
e
Uncert
ain
Agre
e
Str
on
gly
agre
e
1
2
3
44. My supervisor encourages workers to express their ideas and opinions about safety at work
1 2 3 4 5

104
Str
on
gly
dis
agre
e
Dis
agre
e
Uncert
ain
Agre
e
Str
on
gly
agre
e
1
2
3
45. People are willing to report safety issues in my workplace
1 2 3 4 5
46. Workers are informed about lessons learned from past accidents in my workplace
1 2 3 4 5
47. My supervisor delays in responding to safety questions or requests for assistance
1 2 3 4 5
48. My supervisor spends time showing workers the safest way to do things at work
1 2 3 4 5
49. My supervisor avoids making decisions that affect safety on the job
1 2 3 4 5
50. My supervisor suggests new ways of doing jobs more safely
1 2 3 4 5
51. My supervisor expresses satisfaction when a worker performs his/her job safely
1 2 3 4 5
52. My supervisor talks about my values and beliefs in the importance of safety
1 2 3 4 5
53. My supervisor makes sure that workers receive appropriate rewards for achieving safety targets on the job
1 2 3 4 5
54. My supervisor behaves in a way that displays a commitment to a safe workplace
1 2 3 4 5
55. My supervisor provides continuous encouragement to workers to do their jobs safely
1 2 3 4 5
56. My supervisor listens to workers concerns about safety on the job
1 2 3 4 5
57. My supervisor shows determination to maintain a safe work environment
1 2 3 4 5
Str
on
gly
dis
agre
e
Dis
agre
e
Uncert
ain
Agre
e
Str
on
gly
agre
e
1
2
3
58. I am so busy on the job that I can't get to take normal breaks
1 2 3 4 5
59. There is too much work to do in my job for it all to be done well
1 2 3 4 5
60. There are enough workers to carry out the required work
1 2 3 4 5
61. There is sufficient “thinking time” to enable me to plan and carry out the required work
1 2 3 4 5
62. Our jobs are dangerous 1 2 3 4 5
63. In our jobs you could get hurt easily 1 2 3 4 5
64. I am clear about what my responsibilities are for safety in my job
1 2 3 4 5

105
65. I am aware of major worries and concerns about safety in my workplace
1 2 3 4 5
66. I can identify when my decisions or behaviors are pushing the boundaries of safe performance
1 2 3 4 5
67. My coworkers ignore safety rules 1 2 3 4 5
68. My coworkers encourage others to be safe 1 2 3 4 5
69. My coworkers take chances with safety 1 2 3 4 5
70. My coworkers keep work areas clean 1 2 3 4 5
71. My supervisor keeps workers informed of safety rules
1 2 3 4 5
72. My supervisor involves workers in setting safety goals
1 2 3 4 5
73. My supervisor acts on safety suggestions 1 2 3 4 5
Str
on
gly
dis
agre
e
Dis
agre
e
Uncert
ain
Agre
e
Str
on
gly
agre
e
1
2
3
74. Our management provides enough safety training programs
1 2 3 4 5
75. Our management conducts frequent safety inspections
1 2 3 4 5
76. Our management investigates safety problems quickly
1 2 3 4 5
77. Our management rewards safe workers 1 2 3 4 5
78. Our management provides safe equipment 1 2 3 4 5
79. Our management provides safe working conditions
1 2 3 4 5
80. Our management keeps workers informed of hazards
1 2 3 4 5
81. Does your company have a formal safety program (policies)?
Yes No Don’t know 1 2 3 4 5
82. Our management is strict about working
safely when work falls behind schedule
1 2 3 4 5
83. Our management gives safety personnel the power they need to do their job
1 2 3 4 5
84. Our management can adjust strategies when faced with unexpected events
1 2 3 4 5
85. After some unsafe events, our management focuses on how to solve problems and improve safety, rather than seeking to pin blame on specific individuals
1 2 3 4 5
86. Our safety program is worthwhile 1 2 3 4 5
87. Our safety program helps prevent accidents
1 2 3 4 5
88. Our safety program is unclear 1 2 3 4 5

106
Str
on
gly
dis
agre
e
Dis
agre
e
Uncert
ain
Agre
e
Str
on
gly
agre
e
1
2
3
89. Safety related issues are considered at high level meetings on a regular basis, not just after some unsafe events
1 2 3 4 5
90. I need permission from my management if I want to stop work in an emergency
1 2 3 4 5
Never
Rare
ly
Som
etim
es
Quite o
fte
n
Very
oft
en
1
2
3
91. How often do you get into arguments with your coworkers?
1 2 3 4 5
92. How often are your coworkers rude to you at work?
1 2 3 4 5
93. How often do your coworkers do nasty things to you at work?
1 2 3 4 5
94. How often do you get into arguments with your subordinates at work?
1 2 3 4 5
95. How often are your subordinates rude to you at work?
1 2 3 4 5
96. How often do your subordinates do nasty things to you at work?
1 2 3 4 5
97. How often do you assist others to make sure they perform their work safely
1 2 3 4 5
98. How often do you speak up and encourage others to get involved in safety issues
1 2 3 4 5
99. How often do you try to change the way the job is done to make it safer?
1 2 3 4 5
100. How often do you take action to stop safety violations in order to protect the well-being of coworkers?
1 2 3 4 5
Str
on
gly
dis
agre
e
Modera
tely
dis
agre
e
Slig
htly
dis
agre
e
Slig
htly
agre
e
Modera
tely
agre
e
Str
on
gly
agre
e
1
2
3
101. The most important things that happen to me involve my present job
1 2 3 4 5 6
102. Most of my interests are centred around my job
1 2 3 4 5 6

107
103. To me, my job is a very large part of who I am
1 2 3 4 5 6
104. I am very much personally involved with my job
1 2 3 4 5 6
105. My job is a very important part of my life
1 2 3 4 5 6
106. Workers are told about changes in working procedures and their effects on safety in a timely manner
1 2 3 4 5 1
107. Workers are told when changes are made to the working environment
1 2 3 4 5 1
108. I can detect failures or errors in my job before they create problems
1 2 3 4 5 1
109. I assess the potential safety impacts for each of my decisions or behaviors
1 2 3 4 5 1
110. I speak or act without thinking
1 2 3 4 5 1
Never
Rare
ly
Som
etim
es
Quite o
fte
n
Very
oft
en
1
2
3
111. People are encouraged to report incidents in my workplace
1 2 3 4 5
112. People hesitate to report minor injuries and incidents in my workplace
1 2 3 4 5
113. People who raise a safety concern fear of retribution
1 2 3 4 5
114. People who raise safety concerns are seen as trouble makers
1 2 3 4 5
115. Workers are informed about lessons learned from past accidents
1 2 3 4 5
116. Safety is discussed at meetings, not just after an accident
1 2 3 4 5
117. Timely feedback is provided when a safety hazard is reported
1 2 3 4 5
118. Workers’ ideas and opinions on safety are solicited and used
1 2 3 4 5
119. People are clear about their responsibilities for safety in my workplace
1 2 3 4 5
120. People are aware of the safety hazards in their work area
1 2 3 4 5
121. People are careful to minimize and avoid safety hazards in my workplace
1 2 3 4 5

108
Never
Rare
ly
Som
etim
es
Quite o
fte
n
Very
oft
en
1
2
3
122. People ignore safety in my workplace 1 2 3 4 5

109
In the last 3 months, how frequently have you experienced these on the job?
Never Once 2-3
times 4-5
times
More than
5 times
1 2 3
123. Headache or dizziness
124. Persistent fatigue
125. Skin rash / burn
126. Strain or sprain (e.g. back pain)
127. Cut or puncture (open wound)
128. Temporary loss of hearing
129. Eye injury
130. Electrical shock
131. Respiratory injuries (e.g. difficulty breathing)
132. Dislocated / fractured bone
133. Hernia
Never Once 2-3
times 4-5
times
More than
5 times
1 2 3
134. Lost much sleep due to work related worries.
135. Been unable to concentrate on work related tasks.
136. Felt incapable of making decisions.
137. Felt constantly under strain.
138. Been losing confidence in myself.
139. Been unable to enjoy my normal day-to-day activities.
140. Was exposed to chemicals such as gases and fumes
Never Once 2-3
times 4-5
times
More than
5 times
1 2 3
141. Over exerted myself while handling, lifting or carrying
142. Slipped, tripped or fell on the same level
143. Fell from height
144. Was struck by a moving vehicle
145. Was struck by flying/falling object(s)

110
146. Struck against something fixed or stationary
147. Was trapped by something collapsing, caving in or overturning
148. Contacted moving machinery
149. Pinch ( Finger or hand was caught between two objects)
150. Other (Please specify)

111
Appendix B Table B-1. Scale statements
Management commitment to safety
MC1 Our management provides enough safety training programs
MC2 Our management conducts frequent safety inspections
MC3 Our management provides safe equipment
MC4 Our management is strict about working safely when work falls behind schedule
MC5 Our management gives safety personnel the power they need to do their job
MC6 After an unsafety event, our management focuses on how to solve problems and improve safety, rather than seeking to pin blame on specific individuals
Supervisor safety perception
SS1 My supervisor spends time showing me the safest way to do things at work
SS2 My supervisor expresses satisfaction when I perform my job safely
SS3 My supervisor talks about values and beliefs in the importance of safety
SS4 My supervisor makes sure that we receive appropriate rewards for achieving safety targets on the job
SS5 My supervisor behaves in a way that displays a commitment to a safe workplace
SS6 My supervisor keeps workers informed of safety rules
Coworker safety perception
CS1 My coworkers ignore safety rules (R)
CS2 My coworkers encourage others to be safe
CS3 My coworkers take chances with safety (R)
CS4 My coworkers keep work area clean
Work pressure
WP1 There are enough workers to carry out the required work (R)
WP2 There is sufficient “thinking time” to enable workers to plan and carry out the required work (R)
Role overload
RO1 I am so busy on the job that I can't take normal breaks.
RO2 There is too much work to do in my job for it all to be done well
Safety knowledge
SK1 I always wear the protective equipment or clothing required on my job
SK2 I do not use equipment that I feel is unsafe
SK3 I inform management of any potential hazards I notice on the job
SK4 I know what procedures to follow if a worker is injured on my shift
SK5 I would know what to do if an emergency occurred on my shift
Individual resilience
IR1 It is so easy for me to stay focused and accomplish my goals
IR2 I am confident that I could deal efficiently with unexpected events
IR3 I remain calm when facing difficulties because I can rely on my coping abilities
IR4 When confronted with a problem, I can usually find several solutions
IR5 I can cope with stress
IR6 I can focus and think clearly when I am under pressure
R: reverse

112
Appendix C Table C-1. Measurement model: square multiple correlations (SMCs) and factor loadings
Scale statements
MC1 Our management conducts frequent safety inspections
MC2 Our management provides safety equipment
MC3 Our management is strict about working safely when work falls behind schedule
MC4 Our management gives safety personnel the power they need to do their job
MC5 After an accident, our management focuses on how to solve problems and improve safety rather than pinning blame on specific individuals
MC6 Our management provides enough safety programs
SS1 My supervisor behaves in a way that displays a commitment to a safe workplace
SS2 My supervisor talks about values and beliefs in the importance of safety
SS3 My supervisor keeps workers informed of safety rules
SS4 My supervisor expresses satisfaction when workers perform their job safely
SS5 My supervisor spends time showing workers the safest way to do things
SS6 My supervisor makes sure that workers receive appropriate rewards for achieving safety targets on the job
CS1 My coworkers encourage others to be safe
CS2 My coworkers keep work area clean
CS3 My coworkers ignore safety rules (R)
CS4 My coworkers take chances with safety (R)
RP1 People hesitate to report minor injuries and incidents in my workplace (R)
RP2 People who raise a safety concern fear of retribution (R)
RP3 People who raise safety concerns are seen as trouble-makers (R)
LN1 Workers’ ideas and opinions on safety are solicited and used
LN2 Timely feedback is provided when a safety hazard is reported
LN3 Safety is discussed at regular meetings, not just after an accident
LN4 Workers are informed about lessons learned from past events
AN1 I assess the potential safety impacts for each of my decision or behaviors
AN2 I detect failures or errors in my job before they create problems
AW1 People are aware of the safety hazards in their work area
AW2 People are clear about their responsibilities for safety in my workplace
AW3 People are careful to minimize and avoid safety hazards in my workplace
R: reverse