factors affecting modal choice in urban mobility - springer · factors affecting modal choice in...
TRANSCRIPT

ORIGINAL PAPER
Factors affecting modal choice in urban mobility
Yannis Tyrinopoulos & Constantinos Antoniou
Received: 24 February 2012 /Accepted: 21 November 2012 /Published online: 18 December 2012# The Author(s) 2012. This article is published with open access at SpringerLink.com
AbstractPurpose This paper addresses the urban transit sector inves-tigating variables affecting the habitual modal choices ofcommuters aiming to gain insight into the key factors af-fecting these choices and the reasons that discourage themfrom using public transport services.Methods Probit and structural equation models have beenestimated, while additional statistical analysis was performedto gain better insight of the commuters’ mobility behavior.Results The analysis showed that the main factor affectingthe preference of commuters toward passenger car is theavailability of parking space. A preference of femalerespondents towards public transport was also evident,while, compared to the other age groups, respondents betweenthe ages of 35 and 44 show a higher preference for car.Furthermore, crowding is the factor that most discouragesrespondents from the use of public transport. High fare, lackof public transport information and bad accessibility to thetransit network do not seem to discourage respondents’ use ofpublic transport in the particular situation that was analyzed inthis research.Conclusions The paper demonstrated how the results drawnfrom the analysis can be used for tactical and strategicplanning. For example, the fact that high fare levels do notdiscourage commuters from using public transport, mayallow policy makers to slightly increase fares and redirect
additional revenue to improve other public transport serv-ices. Therefore, such findings may be quite useful for policymakers to better tackle commuters’ perception and to definethe appropriate urban mobility management actions andpolicies.
Keywords Urban mobility . Mode choice . Mobilitybehavior . Probit models . Structural equation models
1 Introduction
Sustainable mobility in urban areas is essential for thesmooth operation of the local and national economy. Con-gestion, accidents, delays, air pollution and noise as well asinfrastructure damage are some of the major adverseimpacts associated with urban mobility. Urban traffic isresponsible for 40% of CO2 emissions and 70% of emis-sions of other pollutants arising from road transport [16].Furthermore, the number of road traffic accidents in townsand cities is also growing every year: one in three fatalaccidents now happen in urban areas, and it is the mostvulnerable people, namely pedestrians and cyclists, whoare the main victims [16].
Increasingly over the recent years, particular attention hasbeen paid to urban mobility by governmental bodies, policymakers, transport operators, researchers and user groups. Ithas been acknowledged that this issue requires collectiveeffort and cooperative initiatives to be solved. The EuropeanCommission issued the Green Paper for urban mobility [16],which addresses the main challenges related to urban mo-bility through five core themes: Free-flowing towns andcities; Greener towns and cities; Smarter urban transport;Accessible urban transport; and Safe and secure urban trans-port. In addition, the Green Paper looks at means in order tohelp the creation of a new culture for urban mobility, in-cluding knowledge development and data collection, and
Y. Tyrinopoulos (*)Department of Civil Works and Infrastructure Technology,Faculty of Technological Applications, Technological EducationalInstitute of Athens, Aghiou Spyridonos,12210 Egaleo, Greecee-mail: [email protected]
C. AntoniouLaboratory of Transportation Engineering, National TechnicalUniversity of Athens (NTUA), 9 Heroon Polytechniou,15780 Zografou, Athens, Greecee-mail: [email protected]
Eur. Transp. Res. Rev. (2013) 5:27–39DOI 10.1007/s12544-012-0088-3

addresses the issue of financing. With this Green Paper, theCommission wishes to launch a broad public debate as towhat a European policy on this issue should contain.
The research community around the globe investigatesurban mobility from various angles in an attempt to findnew innovative tools, emerging ideas and approaches. Theyalso aim to gain insight on the key aspects and elements thataffect mobility and transit in urban areas. The eventual goalof all these efforts is to facilitate commuters’ mobility andpublic transport, decongest road networks, reduce accidentsand finally create a sustainable and environmentally friendlyurban transport system. More practical solutions developedto address this issue, which are already operational in dif-ferent forms and cities are infomobility services, advancedpublic transport systems and mobility centers. A mobilitycenter is, in general, a service or facility that facilitates themobility of citizens and travelers, and guides their modalchoices in an urban environment.
This paper sheds light on the key factors and attributes thathave particular impact on the choice of the available means oftransport in urban areas and could encourage citizens in usingpublic transport. More specifically, the paper addresses theurban transit sector investigating the key factors that affect themodal choice of commuters in their urbanmobility and transit.Probit Models [47] have been estimated to determine thecoefficients affecting modal choice, while a structural equa-tion model has been estimated to better model the impact ofthe underlying mobility behavior of the travelers, using theirresponses as indicators. The research goes one step forwardplacing particular emphasis on public transport and analyzingthe main reasons that discourage commuters from using localpublic transport services. The statistical analysis conducted inthis research reveals useful information about the mobilitybehavior of commuters of different market segments. The dataused were collected in a research project in Greece during thedevelopment of a mobility centre. The paper also presents astate-of-the-art review of major research and technologicaldevelopment initiatives, and scientific results on urbanmobility.
2 Literature and state-of-the-art review
The research and academic communities as well as thevarious research and development projects have examinedurban mobility from various standpoints. A brief overviewof the most relevant and notable efforts is presented nextclassified in thematic topics.
2.1 The role of spatial planning and land use
In their research, Meurs and Haaijers [34] contributed to theclearer understanding of the extent to which the spatial
structure and planning of the residential environment canexplain mobility, in general, and the choice of transportmode, in particular, and what planning and traffic manage-ment aspects play a significant role in this. Their researchdemonstrated that mobility and the choice of transportmodes are directly linked with the characteristics of thespatial environment. According to their conclusions, the“impact of the characteristics arising from the residentialenvironment is considerable at 20%, although this relativeeffect differs by mode of transport, from about 10% for cartrips to 40% for journeys on foot” [34].
In a similar direction, Schwanen and Mokhtarian [42]studied the degree to which commute mode choice differsby residential neighborhood and by neighborhood type dis-sonance. The authors found that “neighborhood type disso-nance is statistically significantly associated with commutemode choice: dissonant urban residents are more likely tocommute by private vehicle than consonant urbanites butnot quite as likely as true suburbanites” [42].
The consortium of the European project TRANSPLUS[12] was concerned with best practices about the integrationof transport and land use plans and policies towards sustain-ability. It created a framework for the analysis of land-useand transport case studies in Europe and experiences of real-life planning initiatives.
The PLUME project created a thematic network for theoptimization of scientific networking, management, co-ordination, monitoring, exchange of information and exploi-tation and dissemination activities with main mission theintegration of land-use and mobility planning, involving avariety of stakeholders from the research community tolocal experts in the cities of Europe [8].
2.2 The wider environment (external factors)
Goldman and Gorham [23] examined the concept and im-plementation of sustainable urban transport. According tothis research, to be successful, “sustainable transport policymust avoid the common transportation policy pitfall ofignoring the larger systems in which transportation activityis embedded”. Innovation is a key contributor in achievingsustainable transportation. The authors recognized fouremerging areas of innovation: New Mobility, City Logistics,Intelligent System Management, and Livability.
Taylor et al. [46] conducted an interesting cross-sectionalanalysis of transit use in 265 urbanized areas in the US andconstructed two-stage simultaneous equation regressionmodels to account for simultaneity between transit servicesupply and consumption. The most important finding oftheir analysis is that four general factors outside the controlof public transport systems explain most of the variation intransit ridership in urbanized areas: regional geography,metropolitan economy, population characteristics and auto/
28 Eur. Transp. Res. Rev. (2013) 5:27–39

highway system characteristics. Another interesting result oftheir survey is that fare levels and service frequency couldaccount for at least a doubling (or halving) of transit use in agiven urbanized area. According to the authors, “the ob-served influence of these two factors is consistent with boththe literature and intuition: frequent service attracts passen-gers, and high fares drive them away” [46].
Nicolas et al. [36] applied the theme of sustainable de-velopment to the case of urban transport and daily mobilityof the inhabitants of a city to verify the feasibility and theusefulness of elaborating such sustainable mobility indica-tors. The authors propose a set of indicators, which simul-taneously takes into account the three dimensions ofsustainability - environmental, economic and social.
2.3 Market segmentation and user oriented approaches
Cherchi and Cirillo [7] used panel data to estimate a modechoice model that accounts for systematic heterogeneityover individual preferences and responses, and correlationacross individuals over three time periods and across indi-viduals and members of the families over six weeks. Theirresults suggest that “individual tastes for time and cost, andin particular the subjective value of time (SVT) point esti-mates, are fairly stable but there is a significant systematicand random heterogeneity around these mean values and inthe preferences for the different alternatives” [7].
In their work aiming to develop an attitudinal marketsegmentation approach to mode choice and ridership fore-casting, Outwater et al. [37] concluded that “individualsmore aware of environmental issues are more motivated touse public transport, while on the contrary travelers moresensitive to stress tend to prefer car over public transport fornon-work trips”.
Siddall et al. [43] conducted a user-centered design re-search to better understand how people use transit productsand services throughout Northeastern Illinois, and to facili-tate future improvements. Their targeted research produceddetailed information about the characteristics and goals ofusers of various information products, how they are usingthe different sources, and what modifications might bestserve specific customer needs. Furthermore, their “founda-tional research findings are more general and comprehen-sive in nature, and will inform and guide future efforts toestablish regional information design standards for transit”[43]. In a similar context, Minser and Webb [35] exploredthe influencing factors of public transportation customerloyalty using structural equation modeling. One of theirmost important findings is that passengers’ preconceivedknowledge about a transit agency greatly influences theirassessment on service delivery and value. For example, pooragency communication with stakeholders may negativelyaffect service ratings.
In their survey conducted in the San Francisco Bay Areain 1998, Collantes and Mokhtarian [9] explored the deter-minants of individuals’ subjective assessments of their mo-bility. Their study provides insight into the way individualsmentally process the amount of travel they do, which willincrease the understanding of travel behavior and its moti-vations. A variety of personal factors were found to signif-icantly influence such assessments: personality traits, travel-related attitudes, lifestyle characteristics, and affinity fortravel.
2.4 Transport demand and travel behavior
The driving factors of passenger transport were examined byde Jong and van de Riet [14]. Their research aimed at(re)structuring the many different insights in a single con-ceptual model, reviewing the key drivers, and how eachaffects the various choices that travelers make (activity type,destination, mode, time-of-day and route) and the resultingimpact on overall passenger transport demand. According totheir conclusions, the most important determinant of pas-senger transport demand in total, and of kilometres by car inparticular, is household disposable income. The authorshighlight that the availability of private modes (car ownership)is crucial as well, but their future development depends to alarge extent on income growth.
Peirce and Lappin [38] assessed the levels of awarenessand use of low- and high-tech sources of traveler informa-tion in a panel survey of Seattle-area residents. The authorsfound that despite large increases in respondents’ access tomobile phones and the Internet frequent use of travelerinformation is still largely concentrated among employedcommuters, who tend to use conventional radio trafficreports.
Fujii and Taniguchi [20] reviewed the literature on travelfeedback programs (TFPs), involving soft measuresdesigned to change travel behavior, mainly from automobileto non-automobile travel, in mobility management. Theyclassified TFPs using four main factors: place, technique,procedure, and communication media, and reviewed theeffectiveness of 10 TFPs in Japan. They found that “TFPsreduced CO2 emissions by about 19% and car use by about18%, while increasing the use of public transport by about50%” [20].
2.5 Transit integration to other modes
Bos et al. [4] conducted an analysis using a Context-Dependent Hierarchical Choice Experiment to examine thechoice of Park and Ride (P&R) facilities. Their resultsindicate that “safety, quality of public transport and relativetravel times by transport modes are key attributes to thesuccess of P&R facilities. Contextual variables seem to have
Eur. Transp. Res. Rev. (2013) 5:27–39 29

only a minor impact” [4]. Bos et al. [5] used a P&R choicemodel to assess the impacts of policy measures on P&Rchoice. According to their research, “the implementation ofcombined policy measures to improve the quality of both theP&R facility and the connecting public transport and to dis-courage car drivers to use their car for door-to-door trips havelarge, positively effects on the use of the P&R alternative” [5].
The integration of cycling to public transport has receivedmajor attention in recent years by researchers worldwide.Bachand-Marleau et al. [2] conducted a survey in Montrealexploring the potential integration of the local public bike-sharing system with transit. According to their results, bring-ing the bicycle onboard the transit vehicles is the preferredform of integration followed by bike&ride schemes. In thesame context, Krizek and Stonebraker [30] described andevaluated four common bicycle and transit integration strate-gies and assessed their cost-effectiveness. Their results con-firm the findings of the previous researchers, since cyclistsprefer the bicycle onboard transit strategy. However, enhanc-ing bicycle parking at a transit stop proved more cost effectivewhen compared against bicycle onboard transit configuration.
2.6 Know-how and best practices transfer
The establishment of mobility centers in urban areas aimingto facilitate commuters’ and travelers’ mobility is one of themeasures that has gained recognition in recent years. In thiscontext, the recently completed project MOBI-NET aimedat creating a European Network of know-how on sustainablemobility promoting the concept of mobility centers. Thepurpose of the know-how transfer among mobility centersis to learn from each other and to optimize the implementa-tion of local actions. The project produced a guidebook forsetting up a mobility centre [18].
The SMILE project aimed to help local authorities copewith the challenge of reconciling citizens’ mobility needswith quality of life and environment by presenting goodpractices and introducing innovative approaches on a per-manent basis [11]. The project compiled the results andexperiences of European cities and towns in designing proj-ects and measures according to the needs of specific targetgroups and presented successful models on how to involvecitizens.
2.7 Innovation and guidance for the implementationof measures
The mission of the NICHES project was to stimulate a widedebate on innovative urban transport and mobility betweenrelevant stakeholders from different sectors and disciplinesacross Europe [10]. NICHES promoted the most promisingnew concepts, initiatives and projects, to move them fromtheir current ‘niche’ position to a ‘mainstream’ urban
transport policy application. Some of the innovative con-cepts promoted by this project refer to Call-a-bus Services,Biogas in Captive Fleets, Public Bicycles and Urban Lift-sharing Services.
In order to assess mobility management measures, aMonitoring and Evaluation Toolkit (MET) was developedwithin the MOST research project. MOST-MET offers astep-by-step guide to what one should do in the monitoringand evaluation process of the mobility management measuresthat one plans to implement [19]. It includes both a way todescribe the measures (and the rationale for their selection)and the means to build-in a Monitoring and Evaluation pro-cess to assess impacts once the measures are implemented.
2.8 Other initiatives
In addition to the above projects, EPOMM (the EuropeanPlatform on Mobility Management, http://www.epomm.eu/)provides a forum for all those interested in mobility man-agement: representatives from EU member governmentsand other European countries, local and regional authorities,knowledge institutes, universities, researchers, transportoperators and other user and interest groups. EPOMM de-veloped itself as a strong, co-operative and balanced net-work of all actors involved in mobility management inEurope, which provides a well-known network and refer-ence point for all interested actors [17].
Additional knowledge in the field has been developed inother countries around the world, such as the innovativemobility management project conducted by MIT [33],which has issued reports about best practices implementedworldwide and has recently started the Future Urban Mo-bility initiative within the SMART research initiative inSingapore (http://smart.mit.edu). A second initiative carriedout in the U.S. is the Innovative Mobility Research (IMR)group [28]. IMR is based at the Transportation Sustainabil-ity Research Center (TSRC) at the University of California,Berkeley, and the current research areas include: goodsmovement, intelligent transportation systems (ITS), transitconnections, mobility for special population groups, andalternative land use and transport futures. IMR designsresearch projects and conducts evaluations throughout theState of California, the U.S.A., and internationally.
2.9 Synthesis
The summary of the literature and state-of-the-art reviewprovided above testifies that extensive and outstanding aca-demic and R&D efforts have been made worldwide. Theyhave derived models, systems, methodologies, techniques,guidelines and awareness campaigns addressing differentaspects of mobility management. Their ultimate objectivesare to contribute to innovation and to create a sustainable
30 Eur. Transp. Res. Rev. (2013) 5:27–39

urban mobility, as well as to make public transport systemsand services more suitable to the transport demand profiles ofthe cities.
According to the review, particular attention has beenpaid to the relationship between the spatial environmentand urban mobility, and mainly the choice of the transportmode. The external factors that affect and explain the vari-ation in transit ridership have been addressed, as well as thedriving factors of passenger transport. The needs and pref-erences of particular market segments and user groups havebeen thoroughly examined. More focused research has alsobeen conducted on traveler information systems, Part &Ride schemes and others.
The present paper adds another dimension to the existingliterature. Using statistical methods, the paper contributes toa better understanding of the factors effecting commuters’choice in the use of transport modes and the main reasonsthat discourage them in using public transport. The researchdemonstrates how probit and structural equation models, aswell as additional statistical analysis can be used to gainbetter insight of the commuters’ mobility behavior and toapply adaptive and more effective mobility managementpolicies. The gender- and age-based market segmentationanalysis will shed further light on the mobility behavior ofspecific target groups.
3 Methodology
3.1 Case study setup
The data used in this research were collected in the contextof the project “Development and operation of a pilot mobil-ity center in the Municipality of Kalamaria in the frameworkof the project MOBI-NET”. The project aimed at establish-ing a mobility center in the Municipality of Kalamaria(Thessaloniki, Greece, a map of which is shown in Fig. 1)providing those services to the citizens that will assist theirmobility in the greater urban area.
The main services of the mobility center established inthe Municipality of Kalamaria are: point-to-point mobilityguidance and support; mobility guidance to predefinedpoints of interest and the region’s gateways (port, airport,etc.); information provision about urban transport and pointsof interest; support for mobility impaired people; and tick-eting services for urban and interurban transport. The mo-bility center is in operation since July 2008.
3.2 Survey organization and questionnaire design
A questionnaire survey was conducted prior to the mobilitycentre development in March 2008 aiming to acquire the
Fig. 1 The study area –Municipality of Kalamaria
Eur. Transp. Res. Rev. (2013) 5:27–39 31

mobility characteristics in the Municipality of Kalamaria,the needs and requirements of the citizens, the factors thataffect the choice of the mode to be used in their trips, theirpreferences on the services of a mobility center, and othermobility oriented attributes. 600 adult citizens responded tothe survey (driving is only allowed to people above 18 yearsof age in Greece, and excluding younger participants wasessential in making the mode choice realistic).
The survey was organized in two parts. First, a series ofquestions pertaining to the travel choices of the respondentsand the mobility center were asked. Then, demographicand socioeconomic questions were asked, including age,gender, marital status, number of kids, education leveland occupation. An advantage of this ordering of the twoparts of the survey, i.e., asking socioeconomic questionsafter the main part of the survey, is that the respondentsare not made explicitly aware of their socioeconomicstatus when answering the questions, and as such responsebias and anchoring may be reduced. The questions includedin the first part of the questionnaire address the followingtopics:
& Transport mode(s) the respondents use in their dailytrips
& Frequency of the use of each transport mode& Indication of the three most important destinations
– The degree that a list of factors affect the choice ofmode the respondents use for their daily trips (top partof Table 1)
– The degree that a list of factors discourage therespondents from using public transport (bottom partof Table 1)
& Level of effectiveness of several means of awareness(tables of journeys located in the stops, Internet, VMS,etc.) in support of the respondents’ mobility
& Usefulness of a series of services of a mobility center& Frequency in the potential use of a mobility center
Two of the above questions (marked with (-)) were ofparticular interest for the research conducted in the frame-work of this article. Table 1 outlines these two questions.
While a detailed presentation of the sample is not within thescope of this paper, some key statistics are provided next. 9.4%of the sample was between 18 and 24 years of age, 14.1%werebetween 25 and 34 years old, 23.3% were between 35 and 44years old, 21.1% were between 45 and 54 years old, 19.6%were between 55 and 64 years old and 12.5% were older than64 years. 34% of the respondents were male, while 66% of thesample was female. This disparity is due to the way the surveywas completed (random phone interviews) and reflects theincreased probability of finding a female person at homeduring the day. Several steps were taken in the model devel-opment and data analysis to mitigate the potential impact of theunbalanced (in terms of gender) sample in the model resultsand subsequent analysis. First, the gender was introduced as anexplanatory variable in the model development and additionalmodels have been developed, in which the observations havebeen weighted by female participation in the sample. Further-more, market segmentation with respect to the gender wasperformed, developing separate models for male and femalerespondents. Finally, 62% of the retained observations indicat-ed car as their habitual mode, with the remaining 38% usingbus. Seven respondents who indicated taxi as their habitualmode and seven respondents who indicated two-wheeler were
Table 1 Part of the questionnaire, including the key questions
Not at all A little Somewhat A lot Very much No answer
To what degree do the following factors affect the choice of mode that you use for your daily trips?
Availability of parking space 1 2 3 4 5 9
Availability of good transport links 1 2 3 4 5 9
Traffic congestion 1 2 3 4 5 9
Travel distance and time 1 2 3 4 5 9
Cost of travel (gas or fare) 1 2 3 4 5 9
Other 1 2 3 4 5 9
To what degree do the following factors discourage you from using public transport (PT)?
Lack of information for PT schedules and lines 1 2 3 4 5 9
Lack of good transport links and services 1 2 3 4 5 9
Bad accessibility to public transport means 1 2 3 4 5 9
High public transport fare 1 2 3 4 5 9
Long transport time 1 2 3 4 5 9
Substandard in-vehicle services conditions (crowding) 1 2 3 4 5 9
Unreliability of transport services (e.g. in services frequency) 1 2 3 4 5 9
32 Eur. Transp. Res. Rev. (2013) 5:27–39

removed from the sample to avoid model specification andestimation (i.e., numerical) issues.
3.3 Analysis plan
The analysis presented in the next section is based on the twomain questions of the questionnaire, presented in Table 1. Theobjective of this analysis is two-fold, i.e. to gain insight intothe factors that:
& Affect the habitual mode choice, used by the respond-ents for their daily trips; and
& Discourage the use of public transport.
The analysis was performed using the R Software for Sta-tistical Computing (R [40]) version 2.15.1 with the “lavaan”package [41] for the structural equation model and the “gplots”package [51] for Fig. 3.
4 Analysis
This section presents the main statistical modeling performedwithin this research, in particular the probit choice models, thestructural equation model and the summary analysis of thefactors discouraging the use of public transport.
4.1 Probit choice models
For the first step of the analysis, binary probit models werespecified and estimated. The dependent variable in these mod-els was the habitual mode choice (passenger car vs. publictransport, which in the case of Thessaloniki currently amountsto bus). Table 2 presents the estimation results for themodel for
all respondents, as well as the results of another model inwhich the observations has been weighted to account for theimbalance between male and female respondents in the sam-ple. A large number of explanatory variables was considered,including the questions on the degree that each factor affectsthe habitual mode choice (top of Table 1), demographic andsocioeconomic data. The retained variables in the final modelwere based both on goodness-of-fit statistics (such as theirsignificance, as indicated by the t-test, and their contributionto the model fit, as indicated by the Akaike Information Crite-rion, AIC, [1]), as well as on the sign and relative magnitude ofthe estimated coefficients. Note that in interpreting the estimat-ed coefficients, the explanatory variable is coded as a binary (0/1) factor with car being zero and bus being one. Therefore, theresulting probabilities can be interpreted as probabilities tochoose bus. The first four parameters (“Degree …”), whichtake integer values between 1 and 5, cannot be directly incor-porated into the model [50]. Therefore, binary (0/1) dummyvariables have been created and evaluated. For example, theretained variable “Parking availability affects significantly”takes the value 1 if the respondents indicated that parkingavailability affects “A lot” and “Very much” (i.e. the twohigher levels) and 0 otherwise. Other variables, such as Gender(Female), Internet familiarity, and the age groups were alsocoded as binary (0/1) factors, with 1 meaning that the respon-dent falls into this category and 0 otherwise. Trip purposes bymode were also coded as dummy variables. Note that the trippurpose was collected using two different questions: one forthe trip purpose if the mode chosen is car and one if the modechosen is bus. Not all trip purposes were retained.
A negative intercept in the model suggests that – asexpected – ceteris paribus a preference for car exists. Basedon the presented model estimation results, a key factor
Table 2 Model estimation results (all respondents)
ALL RESPONDENTS ALL RESPONDENTS Weighted by gender
Estimate t-test Estimate t-test
(Intercept) −1.706 −5.780 −1.725 −7.240
Parking availability affects significantly −0.623 −3.038 −0.562 −3.085
Female 0.579 2.450 0.574 3.135
No Kids 0.531 2.053 0.461 1.962
Trip purpose: leisure (for car trips) 1.095 4.012 1.193 4.897
Trip purpose: personal affair (for car trips) 0.503 1.896 0.489 2.010
Trip purpose: other/no answer (for car trips) 3.672 11.472 3.592 13.399
Trip purpose: other/no answer (for bus trips) −1.111 −2.664 −1.154 −2.889
Observations 511 511
Null deviance (d.o.f) 663.10 (510 d.o.f.) 863.06 (510 d.o.f.)
Residual deviance (d.o.f) 196.01 (503 d.o.f.) 246.79 (503 d.o.f.)
AIC 212.01 262.79
Eur. Transp. Res. Rev. (2013) 5:27–39 33

affecting the preference of respondents toward passenger caris the existence of parking space. This is an expected finding,confirming that parking is a major concern for commuters.Furthermore, the fact that no other parameter (from the groupof service oriented factors that were considered) enters themodel indicates that – among these factors – parking avail-ability in essence dominates the mode choice of drivers. Thismight appear to be a simplistic approach to handling thesituation, but on the other hand it may mean that the effortsof policy makers and administrators could more effectively befocused on this single factor. It is worth noting, at this point,that illegal parking is not well-enforced in Greece [44].
The gender-based dummy variable (female) indicates thatfemale respondents and respondents without kids have a lowerpreference (than other respondents) for car. This seems like areasonable finding and is consistent with the literature [42].Turner and Niemeier [49] suggest that public transport and“slow”modes of transport may be more acceptable to womenthan to men, because their commutes tend to be shorter thanmen’s. The estimation results may also reflect women’s lowerbargaining power in household negotiations of auto use[31,39]. The existence of kids adds further constraints andtherefore it is reasonable to find that respondents without kidsare more likely to choose bus for their trips. However, itshould be stressed that considering the relative magnitude ofthe estimated coefficients (intercept – “female” coefficient –“no kids” coefficient), even female respondents without kidshave a preference for car over bus, albeit lower than otherrespondents. Additional constraints, such as car ownershipinformation could perhaps provide further insight into thisparameter (if e.g. a higher use of public transport by womencould be observed for families with a single car).
Trip purpose is commonly used in modeling habitual modechoice, especially for car trips. Note that the question wasworded in this survey as “please indicate the most commontrip purpose for your car trips” (and respectively the publictransport trips). As mentioned above, in this model, trip pur-pose for a given model is entered as 0/1 binary dummyvariables. It is therefore implied that the value for the optionsthat are not included is not significantly different from zero.The fact that the other trip purposes are associated with apositive coefficient (for car) indicates that people are lesslikely to use car for these trip purposes. Similarly, the negativecoefficient for “other trips” by bus indicates that there is asmaller preference towards bus for this category of trips.
Finally, it is noted that while there are some changes in theestimated coefficient values between the two models presentedin Table 2 (base one and one where the observations have beenweighted to account for the underrepresentation of malerespondents in the sample), the underlying trends still apply.
A gender-based market segmentation analysis follows(Table 3). The results for the model estimated using onlyfemale respondents are similar and consistent with those for
the entire sample. However, some observations can be madefrom the relative magnitude of the obtained coefficients.Based on the magnitude of the intercept, it can be argued thatfemale respondents show a lower tendency towards the car,whichmight be a reflection of lower female labor participationand the fact that women in general tend to do shorter trips (thatcan be more easily accommodated by public transport). Thevalue of the intercept in this model is roughly the same as thedifference of the intercept and the “female” coefficient in themodel for all respondents (Table 2).
One of the main limitations of the presented probit mod-els is that travel cost and travel time do not appear in themodel specification due to the orientation of the initialsurvey. This may lead to confounding and its associatedeffects [24]. However, this data is not available in thissurvey; in practice, it is not uncommon, when repurposingdata from a survey, to have to deal with data limitations. Toovercome this, further analysis using structural equationmodels is presented in the next subsection.
4.2 A structural equation model
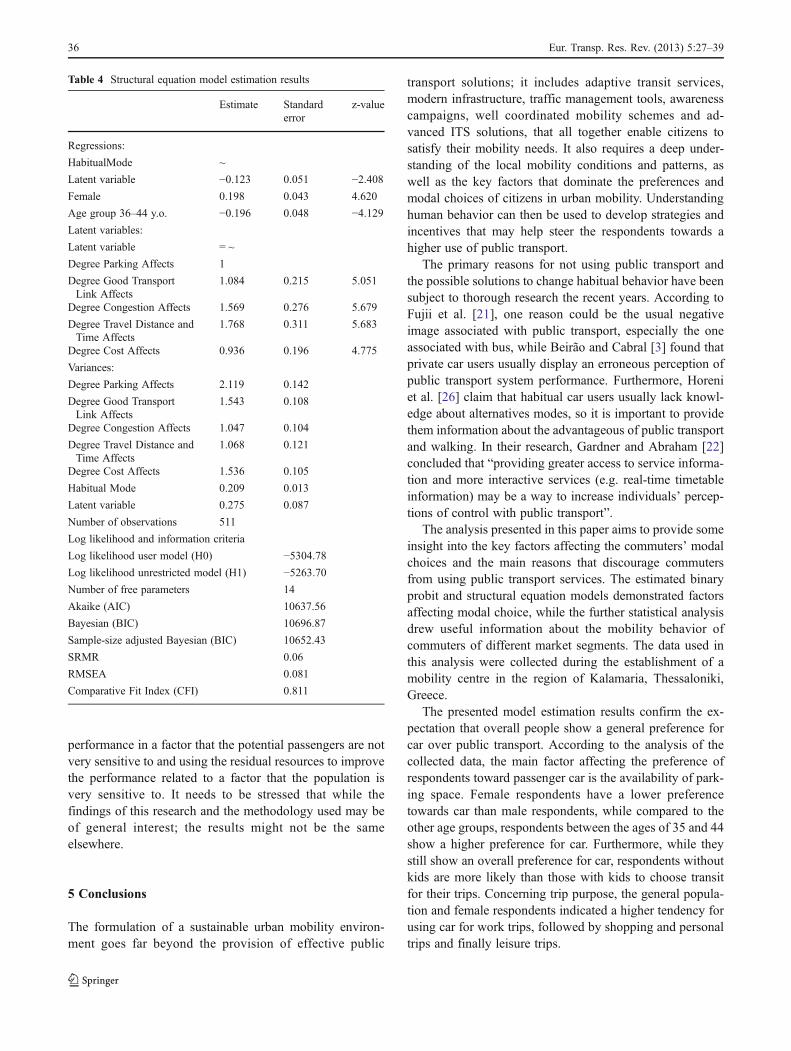
Besides the probit models, a structural equation model hasalso been estimated, the structure of which is shown ingraphical form in Fig. 2. The latent variable reflects theunderlying mobility behavior of the respondents and isbased on five indicators, i.e. the degree that parking, goodtransport link, congestion, travel distance and time andtravel cost affect their mode choice. Besides the latentvariable, gender and age play a role. The estimation resultsare presented in Table 4. The top part of Table 4 shows theestimation results for the regression equation.
As before, female respondents show a higher tendencytowards bus. Furthermore, respondents in the age group 36–
Table 3 Model estimation results (gender-based market segmentation)
Female
Estimate t-test
(Intercept) −1.082 −4.085
Parking availability affects significantly −0.771 −3.144
No Kids 0.668 2.278
Trip purpose: shopping (for car trips) 0.929 2.912
Trip purpose: leisure (for car trips) 0.536 1.792
Trip purpose: personal affair (for car trips) 3.971 8.585
Trip purpose: other/no answer (for car trips) −1.074 −2.388
Observations 335
Null deviance (d.o.f) 454.66 (334 d.o.f.)
Residual deviance (d.o.f) 142.84 (328 d.o.f.)
AIC 156.84
34 Eur. Transp. Res. Rev. (2013) 5:27–39

44 years old, show a higher tendency towards car. This is anintuitive finding, as these respondents are in the prime oftheir professional life and therefore can benefit from theincreased mobility offered by the private automobile.
Three summary measures of goodness of fit are reported:Standardized Root Mean Square Residual (SRMR), RootMean Square Error of Approximation (RMSEA) and theComparative Fit Index (CFI). Hooper et al. [25] provide adetailed overview of the measures of goodness of fit forstructural equation models and how they can be interpreted.Values of the SRMR range between zero and one, with well-fitting models having values less than 0.06 [6,15], whilevalues up to 0.08 can be considered acceptable [27]. Theobtained value of 0.06 for this model can therefore bereasonably accepted. The appropriate acceptable cut-offpoint for the RMSEA has been a topic of debate, but ingeneral lies within 0.06 [27] and 0.08 [32], while 0.07 isoften considered as having the general consensus [45]. Assuch, the obtained value for this model (0.081) is marginallyacceptable. The third goodness of fit measure, the Compar-ative Fit Index (CFI) is the one that provides worse perfor-mance (with a value of 0.811), as values larger of 0.90 oreven 0.95 are advised [27].
4.3 Factors discouraging use of public transport
Having obtained some insight into the impact of variousparameters in the habitual mode choice of commuters in anarea of Thessaloniki, it is interesting to obtain further insightinto the degree that various factors discourage the use ofpublic transport. Figure 3 summarizes the findings of this
survey with respect to the extent that various factors dis-courage the use of public transport, both for all respondents,as well as for market segmentation by gender.
Looking first at the entire sample, it seems that the factorthat discourages most respondents is crowding, followed byservice unreliability. The least concern is the high fare,which reflects the relatively low public transport fare inGreece (80 cents normal fare for a single trip for the busservices in Thessaloniki). In the same direction, the lack ofpublic transport information and the bad accessibility to thetransit network do not seem to affect respondents’ prefer-ence to public transport either. The first finding reflects thegeneral behavior of the Greek passengers, who traditionallypay little attention on transit information tables, while thesecond may be justified by the sufficient coverage of thestudy area with public transportation.
Looking at the market segmentation figures, severalobservations can be made. For example, it seems that femalerespondents indicated a higher sensitivity (i.e. tendency tobe discouraged) overall, as opposed to the male respondents.
These findings can be useful in developing strategies forthe promotion of urban mobility through public transport.For example, given the high acceptability that the respond-ents show to the current fare levels, one could argue thatmodest fare increases might not discourage the use of thepublic transport services. If the additional revenue could beredirected to improve other aspects that according to therespondents discourage their use of public transport, thenthere could be a significant net overall benefit. The ideawould be to investigate whether it would be possible andpractical to find a trade-off between decreasing the
Latent variable
parkinggood
transport link
congestiontravel
distance and time
cost
Habitual mode
Female
Age: 35-44
Fig. 2 Path diagram of thestructural equation model
Eur. Transp. Res. Rev. (2013) 5:27–39 35
performance in a factor that the potential passengers are notvery sensitive to and using the residual resources to improvethe performance related to a factor that the population isvery sensitive to. It needs to be stressed that while thefindings of this research and the methodology used may beof general interest; the results might not be the sameelsewhere.
5 Conclusions
The formulation of a sustainable urban mobility environ-ment goes far beyond the provision of effective public
transport solutions; it includes adaptive transit services,modern infrastructure, traffic management tools, awarenesscampaigns, well coordinated mobility schemes and ad-vanced ITS solutions, that all together enable citizens tosatisfy their mobility needs. It also requires a deep under-standing of the local mobility conditions and patterns, aswell as the key factors that dominate the preferences andmodal choices of citizens in urban mobility. Understandinghuman behavior can then be used to develop strategies andincentives that may help steer the respondents towards ahigher use of public transport.
The primary reasons for not using public transport andthe possible solutions to change habitual behavior have beensubject to thorough research the recent years. According toFujii et al. [21], one reason could be the usual negativeimage associated with public transport, especially the oneassociated with bus, while Beirão and Cabral [3] found thatprivate car users usually display an erroneous perception ofpublic transport system performance. Furthermore, Horeniet al. [26] claim that habitual car users usually lack knowl-edge about alternatives modes, so it is important to providethem information about the advantageous of public transportand walking. In their research, Gardner and Abraham [22]concluded that “providing greater access to service informa-tion and more interactive services (e.g. real-time timetableinformation) may be a way to increase individuals’ percep-tions of control with public transport”.
The analysis presented in this paper aims to provide someinsight into the key factors affecting the commuters’ modalchoices and the main reasons that discourage commutersfrom using public transport services. The estimated binaryprobit and structural equation models demonstrated factorsaffecting modal choice, while the further statistical analysisdrew useful information about the mobility behavior ofcommuters of different market segments. The data used inthis analysis were collected during the establishment of amobility centre in the region of Kalamaria, Thessaloniki,Greece.
The presented model estimation results confirm the ex-pectation that overall people show a general preference forcar over public transport. According to the analysis of thecollected data, the main factor affecting the preference ofrespondents toward passenger car is the availability of park-ing space. Female respondents have a lower preferencetowards car than male respondents, while compared to theother age groups, respondents between the ages of 35 and 44show a higher preference for car. Furthermore, while theystill show an overall preference for car, respondents withoutkids are more likely than those with kids to choose transitfor their trips. Concerning trip purpose, the general popula-tion and female respondents indicated a higher tendency forusing car for work trips, followed by shopping and personaltrips and finally leisure trips.
Table 4 Structural equation model estimation results
Estimate Standarderror
z-value
Regressions:
HabitualMode ~
Latent variable −0.123 0.051 −2.408
Female 0.198 0.043 4.620
Age group 36–44 y.o. −0.196 0.048 −4.129
Latent variables:
Latent variable 0 ~
Degree Parking Affects 1
Degree Good TransportLink Affects
1.084 0.215 5.051
Degree Congestion Affects 1.569 0.276 5.679
Degree Travel Distance andTime Affects
1.768 0.311 5.683
Degree Cost Affects 0.936 0.196 4.775
Variances:
Degree Parking Affects 2.119 0.142
Degree Good TransportLink Affects
1.543 0.108
Degree Congestion Affects 1.047 0.104
Degree Travel Distance andTime Affects
1.068 0.121
Degree Cost Affects 1.536 0.105
Habitual Mode 0.209 0.013
Latent variable 0.275 0.087
Number of observations 511
Log likelihood and information criteria
Log likelihood user model (H0) −5304.78
Log likelihood unrestricted model (H1) −5263.70
Number of free parameters 14
Akaike (AIC) 10637.56
Bayesian (BIC) 10696.87
Sample-size adjusted Bayesian (BIC) 10652.43
SRMR 0.06
RMSEA 0.081
Comparative Fit Index (CFI) 0.811
36 Eur. Transp. Res. Rev. (2013) 5:27–39

A point of particular interest in trying to influence modechoice is the understanding of the degree to which each factordiscourages the use of public transport. It seems that the factorthat discourages most respondents is crowding followed byservice unreliability. The high fare, the lack of public transportinformation and the bad accessibility to the transit network donot seem to discourage respondents’ use of public transport inthe particular situation that was analyzed in this research.
Statistics is always a powerful tool that can be used bypolicy and decision makers to gain a better insight of thecommuters’ and travelers’ mobility behavior, and to applyadaptive and more effective mobility management policies.The binary probit and structural equation models and theadditional statistical analysis conducted in this researchrevealed some important findings for further research andexploitation. For example, the fact that high fare levels do
not discourage commuters from using public transport, mayallow policy makers to slightly increase fares and redirectadditional revenue to improve other public transport services,which are more essential according to the commuters, such ascrowding and service unreliability. Furthermore, the fact thatparking availability dominates the mode choice of drivers canbe used to widely implement police campaigns in order toenforce illegal parking and steer car drivers to use publictransport, thus increasing transit ridership and opening theroad for service improvements. Therefore, such findingsmay be quite useful for tactical and strategic planning to bettertackle commuters’ perception and to define the appropriateurban mobility management actions and policies.
Finally, it is recognized that more advanced models,such as an integrated latent variable and choice model[50] could provide an improved representation of the
Not at all A little Somewhat A lot Very much
Lack of public transit information
Lack of good transport links
Bad accessibility
High fare
Long Transport time
Crowding
Unreliability
All
Male
Female
All
Male
Female
All
Male
Female
All
Male
Female
All
Male
Female
All
Male
Female
All
Male
Female
Degree
44 19 15 9 13
52 19 10 9 10
40 19 17 10 14
24 15 22 17 21
31 14 22 14 18
20 16 22 18 23
41 17 17 11 14
44 15 18 11 11
40 18 16 10 15
69 17 8 2 4
73 16 6 1 4
67 18 9 3 4
25 14 24 16 22
29 13 22 15 21
23 14 25 16 22
17 11 17 18 37
22 12 15 19 31
15 10 18 17 40
21 15 21 13 30
22 17 23 15 23
20 13 20 13 34
How much does each of the following factors discourage your use of public transport?
(Figures represent percentage of respondents)
Fig. 3 Impact of factors indiscouraging use of publictransport
Eur. Transp. Res. Rev. (2013) 5:27–39 37

modeled phenomenon. Tsirimpa et al. [48] present an appli-cation of such models in modeling the impact of risk aversionon drivers’ route switching perception, Kitrinou et al. [29] useit to model residential relocation decisions in island areas,while Daly et al. [13] apply the approach to assess the impactof security on rail travel behavior.
Open Access This article is distributed under the terms of the CreativeCommons Attribution License which permits any use, distribution andreproduction in any medium, provided the original author(s) and thesource are credited.
References
1. Akaike H (1973) Information theory and an extension of the maxi-mum likelihood principle. In Second International Symposium onInformation Theory (B. Petrox and F. Caski, eds.), Akademia Kiado,Budapest, 267–281. (Reprinted in Breakthroughs in Statistics, edsKotz, S. & Johnson, N. L. (1992), volume I, pp. 599–624. Springer,New York)
2. Bachand-Marleau J, Larsen J, El-Geneidy AM (2011) The muchappreciated marriage of cycling and transit: But how will it work?Proceedings of the 90th Annual Meeting of the TransportationResearch Board, Washington DC
3. Beirão G, Cabral JAS (2007) Understanding attitudes towardspublic transport and private car: A qualitative study. TransportPolicy 14:478–489
4. Bos I, van der Heijden R, Molin E, Timmermans H (2004) Thechoice of park & ride facilities: An analysis using a context-dependent hierarchical choice experiment. Proceedings of the83rd Annual Meeting of the Transportation Research Board,Washington, DC
5. Bos I, van der Heijden R, Molin E, Timmermans H (2005) Theimpact of policy measures on P&R choice: Simulations based on aP&R choice model. Proceedings of the 84th Annual Meeting of theTransportation Research Board, Washington, DC
6. Byrne BM (1998) Structural equation modeling with LISREL,PRELIS and SIMPLIS: Basic concepts, applications and program-ming. Lawrence Erlbaum Associates, Mahwah, New Jersey
7. Cherchi E, Cirillo C (2008) A modal mixed logit choice model onpanel data: Accounting for systematic and random variations onresponses and preferences. Proceedings of the 87th AnnualMeeting of the Transportation Research Board, Washington DC
8. Clifford S, Blackledge D, May T, Jopson A, Sessa C, Haon S(2005) Final Report. Deliverable 11 of the project PLUME(PLanning and Urban Mobility in Europe), European Commission,5th Framework Programme.
9. Collantes GO, Mokhtarian PL (2007) Subjective assessments ofpersonal mobility: What makes the difference between a little and alot? Transport Policy 14:181–192
10. Consortium of the European project NICHES (2006) InnovativeUrban Transport Concepts, Deliverable of the project NICHES,European Commission, 6th Framework Programme.
11. Consortium of the European project SMILE (2004) TowardsSustainable Urban Transport Policies: Recommendations forLocal Authorities, Deliverable of the project SMILE (SustainableMobility Initiatives for Local Environment), European Commission,LIFE Programme
12. Consortium of the European project TRANSPLUS (2002)Assessment of Barriers and Solutions, Deliverable 4.1 of theproject TRANSPLUS (Transport Planning Land-Use andSustainability), European Commission.
13. Daly AJ, Hess S, Patruni B, Potoglou D, Rohr C (2012) Usingordered attitudinal indicators in a latent variable choice model: A studyof the impact of security on rail travel behaviour. Transportation 39(2):267–297
14. De Jong G, Van de Riet O (2008) The driving factors of passengertransport. European Journal of Transport and InfrastructureResearch 8(3):227–250
15. Diamantopoulos A, Siguaw JA (2000) Introducing LISREL. SagePublications, London
16. European Commission (2007) Green Paper: Towards a new culturefor urban mobility. Publication of the European Commission,COM(2007) 551 final, Brussels.
17. European Platform on Mobility Management website: http://www.epomm.org/. Accessed: July 20, 2008.
18. Farias, T., Taborda, S. and Stussi, R. (2007) How to set up asuccessful Mobility Centre? Deliverable 3.a of the projectMOBI-NET (Mobility Centres Network), European Commission,Intelligent Energy Programme.
19. Finke T (2003) Monitoring and evaluation toolkit: A guide for theassessment of mobility management approaches, report of theproject MOST (Mobility Management Strategies for the nextDecades), European Commission, Competitive and SustainableGrowth Programme
20. Fujii S, Taniguchi A (2006) Determinants of the effectiveness oftravel feedback programs - a review of communicative mobilitymanagement measures for changing travel behaviour in Japan.Transport Policy 13:339–348
21. Fujii S, Gärling T, Kitamura R (2001) Changes in drivers’ percep-tions and use of public transport during a freeway closure: Effectsof temporary structural change on cooperation in a real-life socialdilemma. Environ Behav 6:796–808
22. Gardner B, Abraham C (2007) What drives car use? A groundedtheory analysis of commuters' reasons for driving. Transport Res F:Traffic Psychol Behav 3:187–200
23. Goldman T, Gorham R (2006) Sustainable urban transport: Fourinnovative directions. Technology in Science 28:261–273
24. Hess S (2005). Advanced discrete choice models with applicationsto transport demand, PhD dissertation, Imperial College London,Center for Transport Studies
25. Hooper D, Coughlan J, Mullen MR (2008) Structural equationmodelling: Guidelines for determining model fit. The ElectronicJournal of Business Research Methods 6(1):53–60
26. Horeni O, Garling T, Loukopoulos P, Fujii S (2007) An experi-mental simulation of adaptations to increased car-use costs.Transport Res F: Traffic Psychol Behav 4:300–320
27. Hu LT, Bentler PM (1999) Cutoff criteria for fit indexes in covari-ance structure analysis: Conventional criteria versus new alterna-tives. Struct Equ Model 6(1):1–55
28. Innovative Mobility Research website: http://www.innovativemobility.org/. Accessed: July 27, 2008.
29. Kitrinou, E. A. Polydoropoulou, and D. Bolduc (2010).Development if Integrated Choice and Latent Variable Modelsfor the Residential Relocations Decision in Island Areas. ChoiceModelling: The State of the art and the state of practice.Proceedings from the Inaugural International Choice ModelingConference. Chapter 27, pp 593–618. Edited by Stephane Hessand Andrew Daly. 2010 Emerald Group Publishing Limited 2010.ISBN: 978-1-84950-772-1.
30. Krizek KJ, Stonebraker EW (2011) Assessing options to enhancebicycle and transit integration. Proceedings of the 90th AnnualMeeting of the Transportation Research Board, Washington DC
31. Law R (1999) Beyond “women and transport”: Towards new geog-raphies of gender and daily mobility. Prog Hum Geogr 23:567–588
32. MacCallum RC, Browne MW, Sugawara HM (1996) PowerAnalysis and Determination of Sample Size for CovarianceStructure Modeling. Psychological Methods 1(2):130–49
38 Eur. Transp. Res. Rev. (2013) 5:27–39
33. Massachusetts Institute of Technology, Center for Technology,Policy and Industrial Development (2000) International MobilityObservatory. Cooperative Mobility Program, USA
34. Meurs H, Haaijers R (2001) Spatial structure and mobility.Transportation Research Part D 6:429–446
35. Minser J, Webb V (2010) Quantifying the benefits: Application ofcustomer loyalty modeling in a public transportation context.Proceedings of the 89th Annual Meeting of the TransportationResearch Board, Washington DC
36. Nicolas J-P, Pocheta P, Poimboeuf H (2003) Towards sustainablemobility indicators: Application to the Lyons conurbation. TransportPolicy 10:197–208
37. Outwater M, Castleberry S, Shiftan Y, Ben-Akiva M, Shuang ZhouY, Kuppam A (2003) Attitudinal market segmentation approach tomode choice and ridership forecasting: Structural equation model-ing. Transp Res Rec 1854:32–42
38. Peirce S, Lappin J (2003) Evolving awareness, use, and opinionsof Seattle region commuters concerning traveler information:Findings from the Puget Sound Transportation Panel Survey,1997 and 2000. Proceedings of the 82nd Annual Meeting of theTransportation Research Board, Washington D.C
39. Pickup L (1984) Women’s gender role and its influence on travelbehaviour. Built Environment 10:61–68
40. Development Core Team R (2012) R: A language and environmentfor statistical computing. R Foundation for Statistical Computing,Vienna, Austria
41. Rosseel Y (2012) lavaan: An R package for structural equationmodeling. J Stat Softw 48(2):1–36, Available online: http://www.jstatsoft.org/v48/i02/ (accessed: 10 October, 2012)
42. Schwanen T, Mokhtarian P (2005) What affects commute modechoice: Neighborhood physical structure or preferences towardneighbourhoods? J Transp Geogr 13:83–99
43. Siddall A, Pitstick M, Allen JG (2006) Transit products, services,and environments in a complex system: User-centered designresearch in Chicago. Proceedings of the 85th Annual Meeting ofthe Transportation Research Board, Washington DC
44. Spiliopoulou C, Antoniou C (2012) Analysis of illegal parkingbehavior in Greece. Proceedings of the Transport Research Arena(TRA) 2012 Conference, Athens
45. Steiger JH (2007) Understanding the limitations of global fitassessment in structural equation modeling. Personal IndividDiffer 42(5):893–98
46. Taylor DB, Miller D, Iseki H, Fink C (2008) Nature and/or nur-ture? Analyzing the determinants of transit ridership in urbanizedareas. Transportation Research Part A 43:60–77
47. Train K (2009) Discrete choice models with simulation, SecondEdition, Cambridge University Press
48. Tsirimpa A, Polydoropoulou A, Antoniou C (2010) Developmentof a latent variable model to capture the impact of risk aversion ontravelers‘ switching behavior. Journal of Choice Modeling 3(1):127–148
49. Turner T, Niemeier D (1997) Travel to work and household re-sponsibility: new evidence. Transportation 24:397–419
50. Walker J (2001) Extended discrete choice models: Integratedframework, flexible error structures, and 3Variables. DoctoralDissertation. Department of Civil and Environmental Engineering,Massachusetts Institute of Technology
51. Warnes GR (2012) gplots: Various R programming tools for plot-ting data. R package version 2.11.0. http://CRAN.R-project.org/package0gplots [Includes R source code and/or documentationcontributed by: Ben Bolker, Lodewijk Bonebakker, RobertGentleman, Wolfgang Huber Andy Liaw, Thomas Lumley, MartinMaechler, Arni Magnusson, SteffenMoeller, Marc Schwartz and BillVenables]
Eur. Transp. Res. Rev. (2013) 5:27–39 39