factors affecting growth of micro and small enterprises in
TRANSCRIPT

Factors Affecting Growth of Micro andSmall Enterprises in Kenya
Anne Gitonga
Productive Sector DivisionKenya Institute for Public Policy
Research and Analysis
KIPPRA Discussion Paper No. 88January 2008
ii
Factors affecting growth of micro and small enterprises in Kenya
KIPPRA IN BRIEF
The Kenya Institute for Public Policy Research and Analysis (KIPPRA)is an autonomous institute whose primary mission is to conduct publicpolicy research leading to policy advice. KIPPRA�s mission is to produceconsistently high-quality analysis of key issues of public policy and tocontribute to the achievement of national long-term developmentobjectives by positively influencing the decision-making process. Thesegoals are met through effective dissemination of recommendationsresulting from analysis and by training policy analysts in the publicsector. KIPPRA, therefore, produces a body of well-researched anddocumented information on public policy, and in the process assistsin formulating long-term strategic perspectives. KIPPRA serves as acentralized source from which the Government and the private sectormay obtain information and advice on public policy issues.
Published 2008© Kenya Institute for Public Policy Research and AnalysisBishops Garden Towers, Bishops RoadPO Box 56445, Nairobi, Kenyatel: +254 20 2719933/4; fax: +254 20 2719951email: [email protected]: http://www.kippra.orgISBN 9966 777 36 9
The Discussion Paper Series disseminates results and reflections fromongoing research activities of the Institute�s programmes. The papersare internally refereed and are disseminated to inform and invokedebate on policy issues. Opinions expressed in the papers are entirelythose of the authors and do not necessarily reflect the views of theInstitute.
This paper is produced under the KIPPRA Young Professionals (YPs)programme. The programme targets young scholars from the publicand private sector, who undertake an intensive one-year course onpublic policy research and analysis, and during which they write aresearch paper on a selected public policy issue, with supervision fromsenior researchers at the Institute.
KIPPRA acknowledges generous support from the European Union(EU), the African Capacity Building Foundation (ACBF), the UnitedStates Agency for International Development (USAID), the Departmentfor International Development of the United Kingdom (DfID) and theGovernment of Kenya (GoK).

iii
Abstract
The study analyzes the current status of micro and small enterprises(MSEs) in Kenya and the factors affecting their growth. Analysis ofthe 1999 MSE National Baseline Survey data is done using multipleregression, where firm growth is the dependent variable. The overallaim of the study is to identify mechanisms that would enable the sectormake significant contributions in employment creation, innovation,industrial development, economic growth and poverty reduction. Thestudy established that those enterprises that are registered; those thatsub-contract; those where the owner has at least secondary schooleducation, those operating in the services sector, and those with a largecapital base achieve higher levels of growth. The study recommendsdifferent policy approaches that could be considered to encourage thegrowth and development of MSEs in Kenya.
iv
Factors affecting growth of micro and small enterprises in Kenya
Abbreviations and Acronyms
CBS Central Bureau of Statistics
DfID Department for International Development
DMSED Department of Micro and Small EnterpriseDevelopment
ERSWEC Economic Recovery Strategy for Wealth andEmployment Creation
GDP Gross Domestic Product
ICEG International Centre for Economic Growth
ICT Information and Communication Technology
ILO International Labour Organization
JBIC Johannesburg Business Information Centre
KEBS Kenya Bureau of Standards
KIRDI Kenya Industrial Research Development InstituteKIE Kenya Industrial Estates
KIPI Kenya Industrial Property Institute
LPE Law of Proportionate Effect
MDG Millennium Development Goal
MFI Micro Finance Institution
MSE Micro and Small Enterprise
NCSE National Council for Small Enterprises
OLS Ordinary Least Squares
SME Small and Medium Enterprise
SMEA Small and Medium Enterprise Agency
SSI Small Scale Industry
UN United Nations

v
Table of Contents
Abstract .............................................................................. (iii)Abbreviations and Acronyms ............................................. (iv)
1. Introduction ........................................................................... 11.1 Research Problem ............................................................ 21.2 Study Objectives .............................................................. 4
2. Micro and Small Enterprises in Kenya ................................. 52.1 Characteristics of MSEs in Kenya .................................... 52.2 Legal and Regulatory Framework .................................. 11
3. Theoretical and Empirical Literature .................................. 153.1 Theoretical Literature ..................................................... 153.2 Empirical Analysis .......................................................... 173.3 Best Practices from Selected Countries ........................ 20
4. Methodology ........................................................................ 224.1 Model Specification ....................................................... 224.2 Data ................................................................................ 25
5. Results and Discussions ...................................................... 265.1 Age and Size of the Enterprise ....................................... 275.2 Sex of the Entrepreneur ................................................ 275.3 MSEs with a Business Registration ............................... 285.4 Partnerships and Networks ........................................... 285.5 Marketing ....................................................................... 295.6 Reasons for Starting the MSE Business ........................ 295.7 Capital ............................................................................ 295.8 Growth-Oriented and Survivalist Enterprises .............. 29
6. Conclusions and Recommendations................................... 306.1 Conclusions .................................................................... 306.2 Recommendations .......................................................... 316.3 Issues for Further Research .......................................... 33References ............................................................................ 34Annex ................................................................................... 38

vi
Factors affecting growth of micro and small enterprises in Kenya
1
1. Introduction
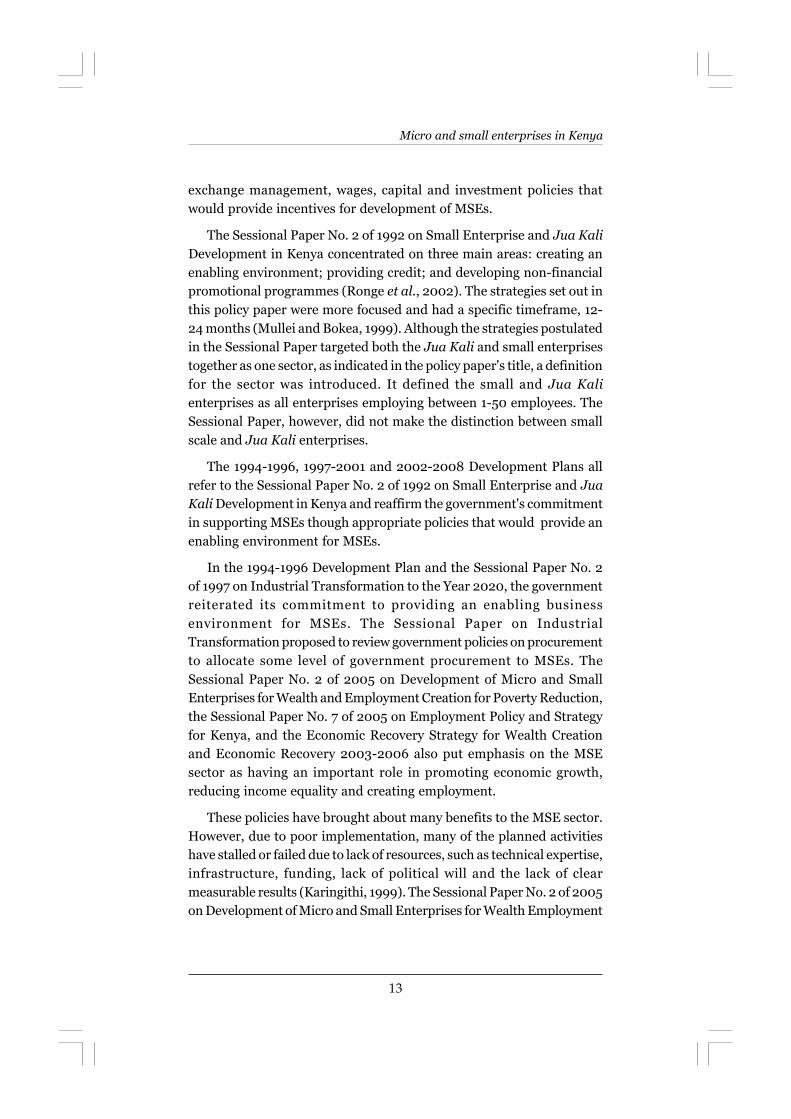
The Kenyan economy has been on a recovery path since 2003, achieving6.1 per cent GDP growth in 2006 (Government of Kenya, 2007).However, increasing unemployment is still a major concern. Micro andSmall Enterprises (MSEs) emerged two decades ago and have beenincreasing gradually and employing a big number of the workingpopulation in Kenya. MSEs are formal or informal non-primaryenterprises employing 1-50 workers. As of 1999, the MSE sectoremployed 2.3 million people (CBS et al., 1999), while the informal sectoremployed 3.7 million people in the same year (Government of Kenya,2000). The number of people employed in the informal sector hasdoubled since 1999 when the National Baseline Survey on MSEs wascarried out. In 2007, the informal sector employed about 6.8 millionpeople (Government of Kenya, 2007) despite the fact that a large numberof MSEs operate informally.
Over the years, the government has recognized the importance ofthe MSE sector as a source of employment, income and inexpensivegoods and services, making a contribution to the country's social andeconomic development and poverty reduction. As a result, thegovernment has introduced policies to develop the micro and smallenterprises, for instance Sessional Paper No. 2 of 1992 on SmallEnterprise and Jua Kali Development in Kenya, and Sessional PaperNo. 2 of 2005 on Development of Micro and Small Enterprises for WealthEmployment Creation for Poverty Reduction, which recognized the needto create an enabling environment for MSEs.
According to Patricof et al (2005), small and medium scaleenterprises in high income countries contribute more than 50 per centof Gross Domestic Product (GDP) and are an important source ofemployment. In low income countries, however, the contribution to GDPaverages 16 per cent while in most low income African countries, thiscontribution is usually less than 10 per cent. A study by Liedholm (2001)revealed that MSEs are a major source of employment in Africancountries. Over 70 per cent of the population in Kenya, Botswana,Lesotho, Malawi, Swaziland and Zimbabwe, which are low and middleincome countries, were engaged in MSE activities. In fact, total personsemployed by micro and small enterprises is almost double that of largeenterprises. In Kenya, micro and small enterprises contributedapproximately 18.9 per cent of GDP, providing employment for 2.3million people as mentioned earlier (CBS et al, 1999), thus accounting

2
Factors affecting growth of micro and small enterprises in Kenya
for approximately 42 per cent of the total employed persons in Kenya in1999.1 Therefore, considering that 42 per cent of Kenya's total recordedemployed persons were in the MSE sector, a sector which has anestimated annual growth rate of 24.0 per cent annually with an overallannual MSE new start average of 21.2 per cent (Liedholm, 2001), it isclear that MSEs are a key and growing sector.2
The Economic Recovery Strategy for Wealth and EmploymentCreation (ERSWEC) targeted creating 500,000 new jobs in Kenyaannually between 2003 and 2007. The 2006 Economic Survey revealsthat in 2005, Kenya almost met this target by creating 458,900 jobs, 90per cent of which were in the informal sector. As of 2006, 87 per cent ofall new jobs outside small scale agriculture were generated from theinformal sector (Government of Kenya, 2007). It is important to notethat although the MSE sector and the informal sector are two distinctterms, there are overlaps between the two sectors, which results in theterms being used interchangeably in the literature and in some of Kenya'spolicy papers. The statistics provided in the annual Economic Survey,for instance, are on enterprises that operate in the informal sector butare often used to represent MSEs. "The Kenyan informal sector coversall small scale activities that are normally semi-organized, unregulatedand use low and simple technologies and employ few persons. Majorityof the small businesses such as retailers, hawkers and other serviceproviders fall in this sector" (Government of Kenya, 2007:90). Bothterms, however, exclude large incorporated enterprises.
1.1 Research Problem
According to Liedholm (2001), 50 per cent of MSEs in Kenya (as well asin Botswana, Swaziland and Zimbabwe) closed within the first threeyears of operation. Of the MSEs that survived, only 34.8 per cent grewat an annual rate averaging 24.0 per cent. The MSE sector, therefore,has low survival rates. Majority of MSEs are owner-operated and lackadequate human capital, have limited financial capital and workspace,
1 This per cent is obtained from the 2000 Economic Survey, which estimates that thetotal recorded employment in 1999 was 5.4 million, while the 1999 National MSE BaselineSurvey estimates that 2.3 million persons are employed in the MSE sector. Therefore,the MSE sector accounted for 42 per cent of the total number of employed persons.
2 Liedholm (2001) calculated the compound growth rate as follows: [(current employment/initial employment) (1/firm age)]-1.

3
and are at risk of occupational hazards (Omolo and Omiti, 2005). The1999 MSE National Baseline Survey revealed that majority of MSEsoperate informally, with a large number of them do not have permanentworksites and do not keep proper records. The survey also revealed thatmost MSEs were not technologically advanced. Many started as microenterprises, with a small per cent graduating to small enterprises. A studyby Biggs and Srivastava (1996) found that the manufacturing sector isthe fastest growing sector among MSEs in Kenya, yet only 26 per centof them graduated from 1-9 employees to 10-49 employees. In summary,the sector is largely under-developed.
There have been several policies in Kenya that address micro andsmall enterprises. The ERSWEC, for instance, targets the creation of500,000 jobs annually and spells out several measures to enhance therole of MSEs in generating economic growth, creating jobs and reducingpoverty. The Sessional Paper No. 2 of 1999 and Sessional Paper No. 2 of2005 specifically address the challenges faced by the sector and lay downpolicies to stimulate the growth of MSEs. However, due to innapropriatedesign and poor implementation, these policies do not seem to encouragethe sector to achieve its full potential. The MSE policies are designed toapply to the MSE sector as a whole and do not specify which MSEs arebeing targeted by the policies, yet MSEs in Kenya are distinctly different.Therefore, the contribution of MSEs in Kenya to economic growth hasbeen insignificant compared with other developing countries. Peru, forexample, with a lower middle income economy with a population of27.6 million, which is comparable to Kenya's population of 33.5 million,achieved GDP growth of 4.8 per cent in 2004, which is slightly higherthan Kenya's GDP growth in the same year at 4.3 per cent (World Bank,2006). MSEs in Peru generate 75.9 per cent of the country's GDP andaccount for 42.1 per cent of employment (Francisco, 2004; Tarmidi,2005). In South Africa, an upper middle income country with apopulation of 47 million, small enterprises contribute 35 per cent of thecountry's GDP, which is significant compared to the MSE contributionin Kenya at 18.9 per cent.3
It is, therefore, important to establish the factors that lead to lowcontribution of MSEs in economic growth and identify the factors thatwould promote growth in MSEs to a stage where they can makesignificant contributions to the economy. It is also important to identify,
3 According to Small Enterprise Development Agency available from http://www.seda.org.za
Introduction

4
Factors affecting growth of micro and small enterprises in Kenya
design and implement appropriate policies for the two types of MSEs:growth-oriented enterprises, and survivalist enterprises, based on theirneeds and requirements. Previous policy papers have failed to do so.The policies should focus on creating a favourable environment fornurturing MSEs and to ensure that they meaningfully contribute togrowth, create jobs and contribute to poverty reduction.
This study draws from best practices from selected countries,literature review and empirical studies to try and realize growthpossibilities of MSEs in Kenya.
1.2 Study Objectives
The overall objective of this study is to develop a framework that wouldpromote the effective and efficient development of all MSEs in Kenya.The specific objectives are to:
(i) Review and analyze the features and characteristics of MSEs inKenya;
(ii) Identify factors that affect the growth of MSEs in Kenya; and
(iii) Suggest mechanisms and structures that need to be put in placeto encourage growth-oriented enterprises.
MSEs in Kenya have an important role to play in employmentcreation, income generation, promotion of innovation and competitionand provision of inexpensive goods and services. The sector also developsindigenous and entrepreneurial skills, thus making a significantcontribution to Kenya's industrial development, economic growth andpoverty reduction. There is need to tackle the issue of unemploymentand poverty in Kenya in the MSE framework through the developmentof dynamic MSEs that promote efficient allocation of resources. This isespecially important with the introduction of financial initiativestargeting the micro, small and medium sector, such as the Youth Fundand Women Enterprise Fund, which have been recently introduced bythe Government. For these resources to be utilized effectively andefficiently, it is important to understand the most efficient growthpathway for profitable, productive, competitive micro and smallenterprises in order to develop appropriate and effective policies thathave a positive contribution to MSEs and the economy.

5
2. Micro and Small Enterprises in Kenya
2.1 Characteristics of MSEs in Kenya
For purposes of this study, micro and small enterprises (MSEs) aredefined as non-primary enterprises employing 1-50 workers(Government of Kenya, 1992; CBS et al., 1999). MSEs in Kenya haveunique characteristics and features, which are expounded on in thissection.
Historical perspective
Many of the MSEs in Kenya originated from the Indian labour thatstayed behind and became entrepreneurs on completion of theconstruction of the Mombasa-Lake Victoria railway. Many MSEsadopted Indian technologies to develop their products (Bigsten et al.,2004). The initial growth of the sector came about after Kenya attainedindependence and the government introduced policies aimed at'Africanization' to allow Kenyan Africans establish businesses (Rongeet al., 2002). Rural-urban migration has further contributed to thegrowth of MSEs. The sector was brought into the limelight by the 1972International Labour Organization (ILO) report and has since beensubject of development debate (Mullei and Bokea, 1999).
Informal operations in the MSE sector
According to the 1999 National MSE baseline survey data, the majorityof Kenyan MSEs operate informally, with 88.6 per cent of them havingno business registration and 60.7 per cent of them operating withoutany licence. The most rapid growth of the informal sector, commonlyreferred to as the Jua Kali industry was in the 1960s and 1970s whenKenya was experiencing high population growth, poor economic growth,increasing unemployment and a shrinking public sector due to the effectsof liberalization and structural adjustment programmes.4 The formalsector was inadequate in absorbing the growing labour force due to lowdemand, poor infrastructure, inadequate human capital and poorgovernance (Bigsten et al., 2004).
4 The term �Jua kali� is �hot sun� in Swahili. The term refers to the informal artisans whowork under the hot sun.

6
Factors affecting growth of micro and small enterprises in Kenya
The informal sector was often regarded as a traditional sector thatwould die out with economic and industrial growth (Chen, 2003). Properrecognition was only given to the informal sector in 1972 after anInternational Labour Organization (ILO) employment mission to Kenya,the first of a series of "employment missions" to various countries,started addressing the issue of unemployment (ILO, 2002). The officialreport that resulted from this mission emphasized the growingimportance of the expanding informal sector. 5 The report used the term'informal sector' rather than 'traditional sector' and referred to the sectorin a positive note, implying that the sector was here to stay and was nota marginal activity that would eventually disappear. The view embracedby ILO of the informal sector is regarded as the dualist view, one of thethree schools of dominant thought regarding the informal sector thatemerged over the years. Dualists generally view the informal sector asdistinct from the formal sector and only existing due to limited formaljob opportunities, slow economic growth and high population growth(Chen et al., 2004). The other schools of thought are the structuralistsand legalists. Structuralists regard the informal sector as micro firmsthat co-exist with larger formal firms by providing them with inputsand labour, while the legalists perceive the informal sector as consistingof entrepreneurs who chose to work informally to avoid cumbersomeand costly government rules and regulations. In contrast to the dualistswho believe people operate in the informal sector out of necessity, thelegalists believe people operate in the informal sector by choice. Dualistsalso believed that the informal sector would die out but it has, in fact,been growing over the years as shown in Figure 2.1.
Over a period of 14 years, employment in the informal sector in Kenyahas almost doubled in size from 40 per cent of total employment in1991 to almost 80 per cent in 2005, while formal employment share hasdeclined significantly (Figure 2.1), illustrating the importance of thesector in filling in for the shrinking formal sector. The growth of theinformal sector was not only felt in Kenya. In the 1980s, a new patternemerged in Northern American and Europe, where production shiftedto small-scale production units. Asia also witnessed a growth in theinformal sector after the economic crisis (the Asian Crisis of 1997/8)when many people lost their jobs and had to rely on the informal sectorfor employment (ILO, 2002). Many developing countries and countries
5 ILO (1972), Employment, incomes and equality: A strategy for increasing productiveemployment in Kenya. Geneva: International Labour Organization.

7
undergoing transition experienced, and are still experiencing, theexpansion of the informal sector, and it is now considered to be agrowing, permanent, modern, capitalist sector (Chen et al., 2004). InIndia, the informal sector employs 93 per cent of the total workforce,accounting for 60 per cent of Net Domestic Product (Chen, 2003), whilein Kenya employment in the informal sector accounted for 77 per centin 2006 (Government of Kenya, 2007). Table 2.1 gives informal sectoremployment statistics in different regions.
It is costly and time consuming to formally start a business in Kenya.This may be part of the reason why MSEs choose to operate informally.According to the Doing Business (World Bank, 2007), 12 procedurestaking an average of 44 days had to be followed to start a business in
Micro and small enterprises in Kenya
Figure 2.1: Employment in the informal and formal sector inKenya, 1991-2005
Source: Economic Survey (various)
0
10
20
30
40
50
60
70
80
%
1991 1993 1995 1997 1999 2001 2003 2005
Year
Informal sector employment
Formal sector employment
Table 2.1: Comparison of informal sector employment indifferent regions
RegionInformal sector
labour force (%)
Population
(in 2004)
% GDP growth (in
2004)
Sub-Saharan
Africa
70
South Asia
Latin America &
the Caribbean
50-80
55
725,820,096
1,446,798,848
545,923,520
Source: Hafkin (2002) and World Bank (2006)
4.8
6.7
5.9

8
Factors affecting growth of micro and small enterprises in Kenya
Kenya in 2007. In India, the procedures to be followed are 13. However,the time it takes to start a business is 11 days less than in Kenya. InThailand, South Africa and Japan, there are only 8 procedures to start abusiness, covering a period of 33 days, 31 days and 23 days, respectively.The Doing Business survey ranked Kenya at position 72 in 2007 (out ofthe 175 countries) in terms of ease of doing business, which is betterthan Tanzania (ranked at 130) and Uganda (ranked at 118) but lagsbehind countries such as South Africa (35th).
Composition of MSE activities
MSEs in Kenya are heterogeneous, with a majority operating in trade.Figure 2.2 below shows the breakdown of the different economicactivities MSEs in Kenya operate in.
Spatial dimension of MSEs
According to the National MSE Baseline Survey (1999), 74 per cent ofenterprises are located in rural areas, 29 per cent of them operate in theopen market, open ground or Jua Kali sheds while 57 per cent own orrent their worksites. About 36 per cent of MSEs operate from temporarystructures, which are usually erected in a haphazard manner. MSEs
Source: 1999 National MSE Baseline Survey
Figure 2.2: Economic activities of MSEs in Kenya
Trade74%
Construction1%
Services13%
Manufacturing12%

9
operating in temporary worksites or open ground have limited accessto water and electricity and other public services and amenities,consequently limiting their technological abilities.
Size and ownership
About three quarters (72%) of MSEs in Kenya are run by a soleproprietor, the rest are family owned businesses and partnerships, witha small number of them operating as a co-operative or corporatebusiness. Consequently, majority (99%) of MSEs in Kenya are microenterprises (employing 1-10 persons). The MSEs that employ between11-50 persons only make up 0.7 per cent of the total number of MSEs inKenya (CBS et al., 1999). Kenya operates in a dual industrial structurewith large formal enterprises and micro enterprises. The large and themicro enterprises are more in number and employ majority of Kenya'slabour force, but small and medium scale enterprises are few. This ischaracteristic of the 'missing middle' phenomenon (Bigsten et al., 2004).There are a number of large enterprises because industrial policies inKenya favour larger enterprises in terms of access to credit, exportopportunities, support services, market information, subsidies, pricecontrols and so on (Kahuthu, 2005). Micro enterprises are also more innumber due to ease of entry, which makes the process of starting andoperating a micro enterprise relatively easier.
Markets and marketing
The market segments for MSEs are those that are not well served by theformal sector or the government in some instances (for exampleprovision of waste collection services). These markets are usually smallin size because they are often localized to meet specific local tastes(Fafchamps, 1994). Generally, there is poor market information andresearch within the sector, which renders the marketing services forMSEs inadequate (Moyi et al., 2006).
Technology
The level of productivity and use of technology among MSEs is low.According to the National MSE Baseline Survey (1999), 93.1 per cent ofMSEs do not own machines. The ones that use machines use outdatedmachinery, and traditional or intermediate technology.
Micro and small enterprises in Kenya

10
Factors affecting growth of micro and small enterprises in Kenya
Labour force
The labour force and labour costs of most MSEs are low, becausemajority of MSE operators are self-employed. Other MSEs have accessto family manpower and young unskilled, inexperienced people whowant to acquire some skills and do not mind low or no pay (Fafchamps,1994). Majority (65%) of MSE owners have not received formaleducation after primary school level (Figure 2.3) and 58 per cent of themhave not received further training in management, technical training,marketing or counselling (CBS et al., 1999).
Finance and income levels
According to the National MSE Baseline Survey (1999), only 3.2 percent of MSEs have a complete set of accounts records. Majority (64.2%)do not keep proper business records, thus rendering them unattractiveto credit facilities. This is probably why only 10.6 per cent of the creditsources is from commercial banks. The main source of capital (90.7%)is from the family and entrepreneur's own funds. Lack of capital is oneof the major constraints faced by MSEs (CBS et al., 1999).
Figure 2.3: Levels of education attained by MSE owners
Source: 1999 National MSE Baseline Survey data
0
10
20
30
40
50
60
No education Primary Secondary Higher
Level of Education
%

11
The average income for Kenyan entrepreneurs in 1999 was Ksh 6,008per month (CBS et al., 1999). However, over half (59.1%) of MSEsreceived a net income of Ksh 3,000 or less per month, according to theNational MSE Baseline Survey data. The income from MSEs is ofteninsufficient in fighting poverty, especially in situations where the MSEsare operating out of necessity.
In summary, majority of MSEs in Kenya are small, operateinformally, have low levels of technology and business skills, have limitedmarkets and lack finance. They are largely underdeveloped, with amajority of them operating in survivalist activities. There is a high closurerate among MSEs, with many of them starting and staying small(Liedholm, 2001). Moreover, MSEs in Kenya have a tendency of growinghorizontally as opposed to vertically. According to Moyi (2005),horizontal growth refers to the emergence of new MSEs while verticalgrowth is the graduation of small enterprises into medium scaleenterprises. This brings about a vicious cycle where, due to theircharacteristics and operations, MSEs lack the resources andopportunities to grow and expand.
2.2 Legal and Regulatory Framework
When Kenya gained independence in 1963, "Kenyanization" polices topromote the country's entrepreneurs and enterprises were adopted.These policies have been addressed in policy papers such as SessionalPaper No. 10 of 1965 on African Socialism and its Application to Planningin Kenya. Ikiara et al (2004) gives an example of one such policy whereserving civil servants were encouraged to undertake entrepreneurialactivities as provided in the Ndegwa Commission.6 The "Kenyanization"policies introduced during this post-independence period were alsogeared at encouraging the establishment of parastatals such as theIndustrial and Commercial Development Corporation (ICDC), theDevelopment Finance Company of Kenya (DFCK), the Kenya IndustrialEstates (KIE) and the Industrial Development Bank (IDB) to supportindigenous entrepreneurs with their financial and infrastructure needs(Ikiara et al., 2004).
The micro and small enterprise sector received official recognitionfollowing the 1972 ILO mission to Kenya. The National Development
Micro and small enterprises in Kenya
6 The Ndegwa Commission of Inquiry, 1970-1971, findings report.

12
Factors affecting growth of micro and small enterprises in Kenya
Plan of 1974-1978 was the first policy paper to spell out measures topromote the MSEs sector, which included stopping the officialharassment of small industry operators; provision of direct assistanceto small industry operators; introduction of extension services; andprovision of loan facilities and training for MSEs. The 1979-1983Development Plan had several policies that sought to promote small-scale industries: the expansion of Kenya Industrial Estates (KIE), theencouragement of sub-contracting and exporting, the introduction oftraining programmes; and credit guarantee schemes for enhancedcommercial bank loans.
Prior to the 1984-1988 Development Plan, the terms small scale,micro and small enterprise, informal sector and Jua Kali enterpriseswere used interchangeably in policies. The 1984-1988 Development Planintroduced the concept of cottage industries and went on to give adefinition to distinguish between small and cottage industries, whichconsidered cottage industries as a smaller unit of small scale industriesand often employing fewer workers and with a fixed investment of lessthan Ksh 50,000. The Development Plan encouraged the developmentof handicraft and cottage industries through support services to helpthem diversify, and the development of small scale industries byreserving certain production items to be developed by such small scaleindustries. These policies were, however, not properly implemented,resulting in policy recommendations being repeated in severalsubsequent policy papers (Ronge et al., 2002).
The Sessional Paper No. 2 of 1985 on Unemployment and theSessional Paper No. 1 of 1986 on Economic Management for RenewedGrowth both postulated policies to promote an enabling environmentfor the MSE sector (Mullei and Bokea, 1999). The Sessional Paper No. 1of 1986 was the first policy paper to recognize the importance andproblems of the small scale enterprises and was the first policy paper toprovide proper programmed support. The policies proposed were aimedat improving the supply of goods and services, supply of finance,improving market information, improving production techniques andimproving technical training programmes (Ronge et al., 2002). The1989-1993 National Development Plan used the term small scale andinformal sector jointly and considered the two types of enterprises asone and the same. The policies proposed were geared at developing anenabling environment for the sector through policy restructuring andliberalization of the price structure, trade regime liberalization, foreign
13
exchange management, wages, capital and investment policies thatwould provide incentives for development of MSEs.
The Sessional Paper No. 2 of 1992 on Small Enterprise and Jua KaliDevelopment in Kenya concentrated on three main areas: creating anenabling environment; providing credit; and developing non-financialpromotional programmes (Ronge et al., 2002). The strategies set out inthis policy paper were more focused and had a specific timeframe, 12-24 months (Mullei and Bokea, 1999). Although the strategies postulatedin the Sessional Paper targeted both the Jua Kali and small enterprisestogether as one sector, as indicated in the policy paper's title, a definitionfor the sector was introduced. It defined the small and Jua Kalienterprises as all enterprises employing between 1-50 employees. TheSessional Paper, however, did not make the distinction between smallscale and Jua Kali enterprises.
The 1994-1996, 1997-2001 and 2002-2008 Development Plans allrefer to the Sessional Paper No. 2 of 1992 on Small Enterprise and JuaKali Development in Kenya and reaffirm the government's commitmentin supporting MSEs though appropriate policies that would provide anenabling environment for MSEs.
In the 1994-1996 Development Plan and the Sessional Paper No. 2of 1997 on Industrial Transformation to the Year 2020, the governmentreiterated its commitment to providing an enabling businessenvironment for MSEs. The Sessional Paper on IndustrialTransformation proposed to review government policies on procurementto allocate some level of government procurement to MSEs. TheSessional Paper No. 2 of 2005 on Development of Micro and SmallEnterprises for Wealth and Employment Creation for Poverty Reduction,the Sessional Paper No. 7 of 2005 on Employment Policy and Strategyfor Kenya, and the Economic Recovery Strategy for Wealth Creationand Economic Recovery 2003-2006 also put emphasis on the MSEsector as having an important role in promoting economic growth,reducing income equality and creating employment.
These policies have brought about many benefits to the MSE sector.However, due to poor implementation, many of the planned activitieshave stalled or failed due to lack of resources, such as technical expertise,infrastructure, funding, lack of political will and the lack of clearmeasurable results (Karingithi, 1999). The Sessional Paper No. 2 of 2005on Development of Micro and Small Enterprises for Wealth Employment
Micro and small enterprises in Kenya
14
Factors affecting growth of micro and small enterprises in Kenya
Creation for Poverty Reduction observes that inappropriate policies,weak policy design and poor coordination and implementation have beena major challenge. The Sessional Paper also acknowledges that therewere no mechanisms for coordination, monitoring and evaluating theeffect of previous policies.
Many of the previous policies also failed to define the roles of differentgovernment organs that dealt with the MSE sector. Additionally, therewas no central coordinating body prior to the establishment of theDepartment of Micro and Small Enterprise Development (DMSED).There were MSE policies and programmes developed for the Ministryof Trade and Industry (formally Ministry of Commerce and Industry),Ministry of Planning, Ministry of Labour and Human ResourceDevelopment, Ministry of Education, Science and Technology andMinistry of Gender, Sports, Culture and Social Services, to name a few,but there was no coordinating or monitoring body. This lack ofcoordination contributed to poor implementation, wastage of resourcesand poor targeting (Omolo and Omiti, 2005).
To ensure that this did not happen again, Sessional Paper No. 2 of2005 provided a breakdown of coordination and implementationmechanisms to be followed, which indicated the roles andresponsibilities of the different institutions as well as the timeframe.The policy paper also called for strengthening of DMSED andestablishment of a National Council for Small Enterprises (NCSE) toimprove coordination, implementation and monitoring mechanisms.The policy spells out appropriate measures to promote the sector,focusing on the following key areas: legal and regulatory environment;marketing; business linkages; financial services; skills and technology;infrastructure development; gender equity and health and safety inworkplaces. The Sessional Paper also introduced a more tangibleprocurement policy where 25 per cent of public procurement is allocatedto MSEs.
Another weakness with the government policies on the MSE sectoris that they provided uniformly, generic interventions to the sector as awhole. The policies did not adequately define the target group for thepolicies. They, therefore, did not distinguish between small enterprisesand informal enterprises. For policy purposes, a further distinction formicro and small enterprises should be made between survivalist andgrowth-oriented enterprises.
15
3. Theoretical and Empirical Literature
3.1 Theoretical Literature
According to McMahon (1998), existing theory on small and microenterprise (SME) growth can be summarized into four main groups.The first classification is the Static Equilibrium Theory that concentrateson the achievement of economies of scale and minimization of long-run unit average costs. The theory denotes that growth is achieved bylarger firms. The Stochastic Model of firm growth is the second theory,which suggests that there are random factors that contribute to firmgrowth. The third theory is the Strategic Management Perspective,whereby SMEs respond to the motives, policies and strategies of theowner or manager. In this context, not all enterprises aim or desire forgrowth; some are developed for subsistence purposes and arecomfortable maintaining their size. Their aim is, therefore, to survive.In such instances, the entrepreneur is 'pushed' into survival activitiesin the search for income generating activities to support family income(Harvie, 2003). The last category as presented by McMahon (1998) isthe enterprise Life-Cycle Theory, which is widely used to explain growthof SMEs. The main life-cycle stages are start-up or launch, expansion orgrowth, maturity then diversification or regeneration or decline.Jovanovic's Learning Model is an important theory based on the life-cycle theory. 7 It states that firm growth is inversely related to firm ageand size; younger firms grow faster than older larger firms (Elhiraikaand Nkurunziza, 2006).
However, the most sighted firm growth theory is Gibrat's Law. 8 It isthe oldest (published in 1931) and most referred to theory of firm growth.Gibrat's Law of Proportionate Effect-LPE states that firm growth isindependent of the firm's initial size. Gibrat's law is, therefore, aStochastic Model that infers that the growth of firms is based on randomfactors (Elhiraika and Nkurunziza, 2006).
Other than the Static Equilibrium Theory, the Stochastic Model andStrategic Management Perspective and the Life-Cycle Theory of firmgrowth, there are other theories explaining the growth of micro and smallenterprises as presented by Green et al (2006). Green et al (2006) bring
7 The model was presented in Jovanovic�s article, �Selection and the evaluation ofindustry�, Econometrica 50, pp649-670.
8 Gibrat�s Law was published in Les Inégalités Economiques, Paris Sirey, 1931.

16
Factors affecting growth of micro and small enterprises in Kenya
out the three main theories regarding the growth of MSEs. The first isbased on the Lewis Theory, which postulates that MSEs grow due tothe inability of the public sector or large private enterprises to absorbthe surplus labour. These surplus labourers are, therefore, forced intoMSE activities. According to the Lewis model, a developing economyhas two sectors; the traditional rural subsistence sector with surpluslow productivity labour and the modern urban industrial sector withhigh labour productivity (Todaro, 2000). The second theory, accordingto Green et al (2006) is based on market output and demand. It statesthat there must be a market and demand for products and services thatare sourced from MSEs, thus introducing competition and growth. Thethird theory is known as Firm Growth Theory, which states thatindustrialization and economic growth will lead to the growth of modernlarge scale industries and the disappearance of micro and smallenterprises.
The literature on the role of the MSE sector on developmentemphasises their importance in contributing to a more equitableallocation of resources, poverty reduction and economic growth. Microand small enterprises provide specialized goods and services usingminimal capital and locally available material. They are innovative,flexible, and willing to experiment and exploit new markets comparedto larger enterprises (Fafchamps, 1994). MSEs are able to be flexibleand exploit new markets because they are able to respond to demandand consumption (Ranis and Stewart, 1999). The sector providesinexpensive goods and services, which are not offered by the formalsector (Bigsten et al., 2004) and promotes competition and innovation,which is necessary for industrialization, employment creation, povertyreduction and economic growth (Government of Kenya, 2005). The MSEsector can also encourage the development of entrepreneurial skills andcreativity, which brings about innovation, productivity, creativity andintroduces competition (UN, 2004).
Literature on the MSE sector further reveals that the sector has twodistinctly different types of enterprises. Harvie (2003) described microenterprises as being involved in either livelihood (survival or subsistence)activity of growth (viable) activity. Ranis and Stewart (1999) alsodistinguishes between the two types of enterprises, indicating thatdynamic enterprises produce intermediate, capital or modern consumergoods; have linkages with the formal sector; have skilled workers withcompetitive incomes; are capital intensive; and are predominantly a

17
family enterprise employing 10 workers. According to DfID (2000),dynamic MSEs can contribute to income distribution, poverty reduction,the achievement of Millennium Development Goals (MDGs) and cancontribute to economic growth. The traditional enterprises, on the otherhand, produce simple goods; have no significant link with the formalsector; have low incomes; utilize low capital; and employ 3 or lessworkers, usually unskilled family workers who are unable to find formalemployment (Ranis and Stewart, 1999). Table 3.1 summarizes the typicalcharacteristics of the two types of enterprises based on the literaturereviewed.
The study analyzed the 1999 MSE Baseline Survey data to determineif a similar distinction can be made for MSEs in Kenya. The study alsoexamines if Gibrat�s Law holds for MSEs in Kenya.
3.2 Empirical Analysis
There are a number of other empirical studies that try to analyze thedeterminants of firm growth. This review specifically looks at studies ofMSEs in Kenya and other African countries. Studies by Mead andLiedholm (1998) and Liedholm (2001), which estimated thedeterminants of enterprise growth in six African countries using annualjobs generated since start-up as the dependent variable, found thatyounger enterprises are more likely to grow and generate employmentopportunities, suggesting that Gibrat's Law does not always hold. Thestudy by Liedholm (2001) also found that young growing enterpriseshave greater chances of surviving than enterprises that have remainedthe same size. Some studies (Bigsten et al., 1999; Kimuyu, 2002),however, discovered a positive age efficiency or productivity relationshipin older, more experienced enterprises and that productivity improveswith age.
Omolo and Omiti (2005) used a growth model to analyze therelationship between firm growth in terms of sales and factors such asownership of the enterprise, effects of entrepreneurship training,security and membership to a MSE association. Kimuyu (2002) used aCobb-Douglas production model to show the relationship between anassortment of micro level institutional variables and revenue. All thestudies reviewed applied the Ordinary Least Squares (OLS) methodologyand made various observations.
Theoretical and empirical literature

18
Fa
ctor
s a
ffec
tin
g g
row
th o
f m
icro
an
d s
ma
ll e
nte
rpri
ses
in K
enya
Table 3.1: Differences between survivalist and growth-oriented enterprises
Survivalist/Traditional enterprises Growth-oriented enterprises
Grows mainly horizontally with multiple enterprises to compensate for
seasonality and low returns
Non-profitable Profitable and sustainable
Stagnant Dynamic and entrepreneurial
Self employed Employs more than three people
Exits or dies out; average lifespan of four years Grows and expands
Generally unskilled labour Skilled labour
Low productivity Productive
Low income Competitive wages
Use traditional, simple or obsolete technology Use modern technology
Haphazard development Organized development
Disguised employment/Informal employment Decent employment
Unregulated, with a majority operating without registration, licenses or
permanent worksites Operate with the necessary registration, licenses or permanent worksites
Compiled by author from various sources: Ranis and Stewart (1999); Harvie (2003), Bigsten et al (2004) and Kahuthu(2005)
Grows vertically and horizontally; expand and branch into new enterprises

19
Kimuyu (2002), Omolo and Omiti (2005) and Liedholm (2001)discovered that owner-operated, self-employed enterprises, oneemployee enterprises are inefficient, least remunerative, and less likelyto grow or create further employment opportunities. The returns perhour for enterprises with 2-5 workers is significantly higher than thosewith only one person working (Mead and Liedholm, 1998).
Enterprises located in urban centres, those that have a permanentworksite, those that operate on a regular basis and those that belong toMSE associations have higher revenue, are more productive and have ahigher potential for creating employment (Omolo and Omiti, 2005;Kimuyu, 2002). Access to finance and access to formal training(improved human capital) have a positive influence on enterprise growth(Liedholm, 2001 and Omolo and Omiti, 2005). On gender, Mead andLiedholm (1998), Liedholm (2001) and Kimuyu (2002) found that male-owned enterprises are more likely to grow or have higher revenuescompared to female-owned enterprises. Bigsten et al (1999) and Kimuyu(2002) found that informal enterprises are less efficient, are financiallyrestricted and have less educated managers compared to formalenterprises, which were more productive.
The study by Liedholm (2001) goes on to conclude that the economicenvironment of a country also plays an important role in the growth ofan enterprise. In Botswana, one of the six countries surveyed, MSEswere found to grow at a faster rate than MSEs in other countries,including Kenya. The reason may be due to high levels of per-capitaincome and growth in per capita income that Botswana experienced atthe time of the study. The study also concludes that MSEs that operatein the manufacturing and service sector seem more likely to grow andthat MSEs operating in retail trading are less likely to grow. About 30per cent of the MSEs operating in retail trade are likely to close in a year(Liedholm, 2001). MSEs in manufacturing sector grow at a faster ratewith some even graduating into SMEs as detailed in the study by Biggsand Srivastava (1996). The study found that in Kenya, less than 5 percent of MSEs grow into the 100 and more employee size. This meansthat in Kenyan manufacturing, enterprises with 1-9 employees have thegreatest potential of creating employment opportunities as indicated inTable 3.2.
Theoretical and empirical literature

20
Factors affecting growth of micro and small enterprises in Kenya
This study builds on this existing empirical analysis to determinethe effect of certain factors previously estimated on the growth of MSEsin Kenya. Using the 1999 National MSE survey dataset, the studyincluded additional factors that were not previously estimated. Thesefactors are extracted from the lessons learnt in countries that have asuccessful MSE sector.
3.3 Best Practices from Selected Countries
There are important explanatory variables that are not brought out inthe theoretical literature and empirical studies reviewed, which can beextracted from countries such as India, Peru, and Japan. These countrieshave thriving small and medium scale enterprises. Small scaleenterprises in Japan account for 87 per cent of all enterprises and SMEs,employing 77.6 per cent of the population (Tarmidi, 2005). It is,therefore, important to analyze the unique features available in Japanthat support the growth of the sector. Japan, for instance, has Prefectual,Regional and SME/Venture SME support centres, which providebusiness support services such as marketing, and assist small andmedium enterprises to grow and become more competitive (SMEA,2002).9
9 According to the World Bank Micro, Small and Medium Enterprises; A Collection ofPublished data (2007), Japan small and medium scale enterprises have 4-299 employees.
Table 3.2: Firm mobility between start and present in Kenya
Current size Start-up size (%)
1-9 10-49 50-99 100+
1-9 55 14 0 11
10-49 26 29 14 11
50-99 14 27 21 0
100+ 5 30 65 78
N 43 62 26 31
Interpretation: Of the enterprises that started with 1-9 employees, 55% ofthem remained and 26% graduated to 10-49 employees, 14% graduated intoenterprises with 50-99 employees and 5% into larger enterprises with 100+
employees
Source: Biggs and Srivastava (1996)

21
The Government Stores Purchase Programme in India is aimed atproviding market support by reserving certain products for exclusivepurchase by small scale sector. There is also a price preference of up to15 per cent for items produced in large scale and small scale units. Thishas contributed to the growth of the sector to a point where 40 per centof the country's industrial output comes from the sector, which alsocontributes 45 per cent of total direct exports and 34 per cent overallexports.10
In Japan, the government is legally obligated to place a certainnumber of orders with small and medium enterprises (SMEA, 2002),as well as Peru, which has in place legal measures that favour enterpriseswith less then 40 workers (Francisco, 2004). 11 Peru also has a thrivingMSE sector where 98.6 per cent of all enterprises in Peru are micro andsmall enterprises accounting for 75.9 per cent of total employment and42.1 per cent of GDP as of 1997 (Tarmidi, 2005). Linking with the publicand private sector through sub-contracting, for instance, is importantfor the development of a thriving MSE sector.
It can, therefore, be concluded that forming business partnershipsand networks such as sub-contracts with the private and public sectoris important for encouraging growth.
10 Information from the Office of Development Commissioner (MSME), Ministry of Micro,Small and Medium Enterprise, Government of India available online fromwww.smallindustryindia.com
11 MSEs in Peru employ 0-50 people, according to the World Bank Micro, Small andMedium Enterprises: A collection of published data (2007).
Theoretical and empirical literature

22
Factors affecting growth of micro and small enterprises in Kenya
4. Methodology
The main aim of this study is to determine the factors affecting thegrowth of MSEs in Kenya. A multiple regression analysis using OrdinaryLeast Squares (OLS) was undertaken to establish this.
4.1 Model Specification
To determine the growth of MSEs in Kenya, the study used change inemployment of the firm as a measure of firm growth. Due to datalimitations, this study will not use revenue or sales as the measure ofgrowth. Change in number of workers since start-up or acquisition ofthe business will give an adequate indication of the direction of thefirm's growth.
As summarized in Figure 4.1, literature, empirical analysis reviewedand best practices from countries with a thriving MSE sector revealseveral factors that affect firm growth.
Figure 4.1: Firm growth
������������� ���� ���������� � ������������������������ �� ��������� ����� ��� ���
����������� �� ������ ���� �� �� ������ ���� � ����� ��������������� ����� ���� � ����� ��� ����� � ������ ���������!��������"�# ��������� ��$� � �������� ��� �� ���� ����� ���� ��������� ��
���������� ������������ ��� � %���� � ��� ���������� ���� � ������������� � ����� &����� ����� ������ ��� ��������������� ����� ���������� ��
'�� � ����������������� ����� ���( ���

23
Jovanovic's Learning Model theory states that firm growth isinversely related to firm age and size. This study tested this theory byanalyzing the effect of age and size of an enterprise on growth to assessif the theory will stand for micro and small enterprises in Kenya.Empirical analysis reveals several factors that contribute to the growthand development of small scale enterprises. The study measured theeffect of some of the factors on growth of MSEs in Kenya. These includethe sex and level of education of the owner, formality of the enterprise(enterprises that are registered with the registrar of companies), businesssector that the MSE operates in, and access to capital. The effect of sub-contracting on MSEs' growth is one factor that is not included in theliterature and empirical evidence reviewed, yet the case studies revealthat it has a positive impact on the growth of MSEs. It is, therefore,expected that MSEs that sub-contract will have a positive effect ongrowth of MSEs.
The study adopts the firm growth relationship postulated in Evans(1987) study, which examines the relationship between firm growth,size and age of manufacturing enterprises in the US. This relationshipcan be specified as:
G = f(CAt' S
t) +u
t(1)
Where:
G = a growth function
A = the age of the enterprise
S= the size of the enterprise, in this study measured by the numberof employees
t=start-up year or first year of operation
t'=1999 (year when the MSE survey was conducted)
ut = is the error term
The model (1) can therefore be expanded, taking non-lineality byincluding the squares of size and age. The interaction term (lnsize *lnage) is also included to access the joint effect of age and size of theMSE on growth. The age and size variable will be in log form (Evans,1987).
12 Bigsten et al (1999) use a similar measure of firm growth given as log (Lt/Lt-1) whereL=No. of workers and t=the measurement period.
Methodology

24
Factors affecting growth of micro and small enterprises in Kenya
The dependent variable is given as the difference between thelogarithm of firm size in 1999 (the time of survey) and when the firmstarted, or was acquired (Briy and Kohaut, 1999).12
The model (1) can further be developed by including otherexplanatory factors summarized in Figure 4 derived from theoreticaland empirical literature reviewed earlier. This yields a growth model ofthe form:
Firm growth=f(size, age, sex of owner, formality of the enterprise,business linkages, education level of MSE owner, secto, capital) (2)
The estimated equation is therefore given as follows:
Growth = β0
+ β1 lnsize + β
2 lnage + β
3 (lnsize)2 + β
4(lnage)2 + β
5
(lnsize*lnage) + β6 dfemown + β
7dbusreg + β
8dsubcont + β
9deduc
+ β10
dservice + β11
lncapital + µ (3)
Where:
� growth is employment growth given asthe difference betweenlogarithm size of the enterprise as of the time of the survey andthe size of the time the business started or was acquired (lnS
t'-
lnSt.
� lnage is the natural log of the age of the enterprises representingthe number of years the enterprise has been in operation.
� lnsize is the natural log of the initial size of the enterpriserepresenting the initial number of employees at the start ofbusiness.
� dfemown is a dummy variable representing the sex of the MSEowner where 1 is for female owner(s) and 0 male.
� dbusreg is a dummy variable indicating whether or not the MSEhas a business registration, where 1 is for registered business and0 for no business registration.
� dsubcont is a dummy variable denoting whether or not the MSEsub-contracts for inputs, orders, products or services from MSEs,non-MSEs, farmers and the government, where 1 is for sub-contracting and 0 for those that do not sub-contract.
� deduc is a dummy variable representing the level of education ofthe MSE owner where 1 is MSE owner with at least secondaryschool education and 0 otherwise.

25
� dservice is a dummy variable representing the sector the businessoperates in, where 1 is MSEs operating in the services sector.
� lcapital is the natural log of the total capital injected into the MSE.
4.2 Data
The data used is obtained from the 1999 National Micro and SmallEnterprise Baseline Survey conducted by the Central Bureau of Statistics(CBS) in collaboration with the International Centre for EconomicGrowth (ICEG) and K-Rep Holdings Kenya. The cross-sectional datasetconsists of 1,945 micro and small enterprises, which were obtained usinga detailed structured questionnaire applied to a sample of householdsin 37 districts in Kenya to capture different economic activities. Thedataset contained detailed information but was mainly descriptive.Therefore, dummy variables are created to represent the importantqualitative variables. Apart from capital, age and size, the five otherindependent variables were entered as dummy variables, which are usedto represent important non-quantitative variables. The data used wascollected in 1999 and may, therefore, not be representative of thesituation but is the most comprehensive dataset available to date.
Methodology
26
Factors affecting growth of micro and small enterprises in Kenya
5. Results and Discussions
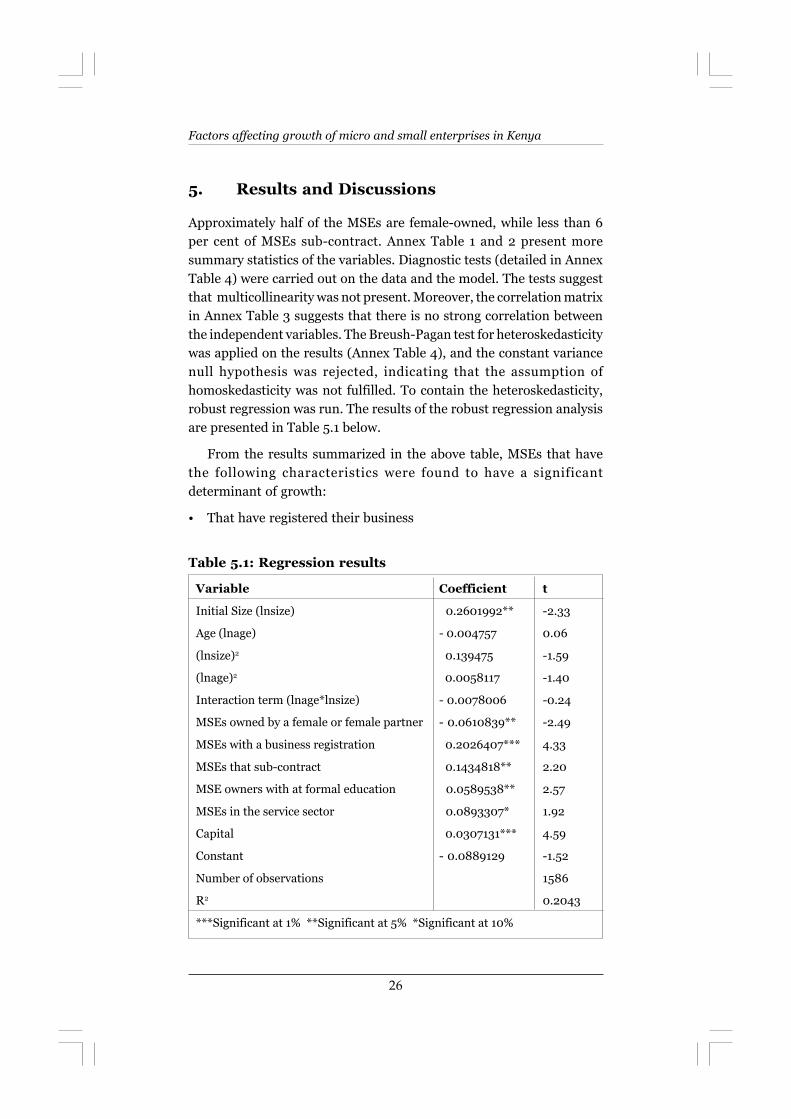
Approximately half of the MSEs are female-owned, while less than 6per cent of MSEs sub-contract. Annex Table 1 and 2 present moresummary statistics of the variables. Diagnostic tests (detailed in AnnexTable 4) were carried out on the data and the model. The tests suggestthat multicollinearity was not present. Moreover, the correlation matrixin Annex Table 3 suggests that there is no strong correlation betweenthe independent variables. The Breush-Pagan test for heteroskedasticitywas applied on the results (Annex Table 4), and the constant variancenull hypothesis was rejected, indicating that the assumption ofhomoskedasticity was not fulfilled. To contain the heteroskedasticity,robust regression was run. The results of the robust regression analysisare presented in Table 5.1 below.
From the results summarized in the above table, MSEs that havethe following characteristics were found to have a significantdeterminant of growth:
� That have registered their business
Table 5.1: Regression results
Variable Coefficient t
Initial Size (lnsize) 0.2601992** -2.33
Age (lnage) - 0.004757 0.06
(lnsize)2 0.139475 -1.59
(lnage)2 0.0058117 -1.40
Interaction term (lnage*lnsize) - 0.0078006 -0.24
MSEs owned by a female or female partner - 0.0610839** -2.49
MSEs with a business registration 0.2026407*** 4.33
MSEs that sub-contract 0.1434818** 2.20
MSE owners with at formal education 0.0589538** 2.57
MSEs in the service sector 0.0893307* 1.92
Capital 0.0307131*** 4.59
Constant - 0.0889129 -1.52
Number of observations 1586
R2 0.2043
***Significant at 1% **Significant at 5% *Significant at 10%

27
� That sub-contract
� Operating in the services sector
� Whose owner has at least secondary school education.
On the other hand, MSEs owned by females and those that start largeare most likely to experience declining growth.
5.1 Age and Size of the Enterprise
The initial size of the firm is significant and inversely related to growth.This confirms the findings of the study by Liedholm (2001), which foundthat smaller enterprises during starting up tend to grow faster than theother bigger firms. This result contradicts Gibrat�s Law, which statedthat firm growth is not dependent on the initial size of the firm. Theeffect of the age of the enterprise on growth is insignificant, contrary toother studies of business in developing countries, which show thatyounger firms are more likely to grow.
5.2 Sex of the Entrepreneur
The results reveal that female-owned enterprises are growing less. TheNational MSE Baseline Survey (1999) indicates that 47.7 per cent of theenterprises are female-owned, 74.7 per cent of which operate in trade.This could be an important statistic in explaining the lower growth offemale-owned enterprises as the literature reviewed indicates that retailtraders are least likely to survive. Looking at more statistics, we findthat only 3.7 per cent of the MSEs registered by the Registrar ofCompanies were female-owned. Additionally, women face moreconstraints than men when it comes to business, especially due to limitedaccess to education, finance and land. From the data, we find that of theMSEs surveyed, only 27 per cent of those that had capital of Ksh 10,000and over were female-owned. Further, women usually have more familycommitments and responsibilities compared to men, which may lowertheir productivity in business.
5.3 MSEs with a Business Registration
MSEs with a business registration are likely to grow more, yet only 13per cent of MSEs surveyed have a business registration. MSEs that have
Results and discussions

28
Factors affecting growth of micro and small enterprises in Kenya
their business registered by the Registrar of Companies are legal entities,which are recognized formally. They, therefore, have improved accessto finance, water, electricity, worksites and other services that areimportant for growth of enterprises. Informal enterprises, on the otherhand, face problems due to their lack of legal status, including problemswith access to credit, land and social or public goods or services. Theymay also come into problems with the local authorities, which couldaffect their operations and productivity.
5.4 Partnerships and Networks
Forming partnerships and networks through sub-contracts was foundto be an important contributor to the growth of MSEs. Sub-contractingcreates linkages and partnerships that are important for transferringskills, knowledge and technology, which would enhance productivityand improve quality of MSE products, hence promoting competitiveness.MSEs partnering with each other can also transfer information,experiences and skills between themselves. At the moment, less than 6per cent of MSEs sub-contract and the ones that do, do so with otherMSEs. Only 0.3 per cent of the purchases made to MSEs came from thegovernment. Currently, the MSE sector that benefits the most from sub-contracts, tenders or other partnerships are Jua Kali furniture makerswho manufacture and supply furniture to households, the private sectorand the government. Sub-contracting would improve market access andfill market demand for goods or services required by other largerenterprises.
5.5 Education Level of Owner
Results reveal that there is a significant positive relationship betweenthe growth and the level of education of the MSE owner. Owners withhigher levels of skills are more beneficial to the MSE.
5.6 Business Sector
According to the results, MSEs operating in the services sector are morelikely to achieve growth. This is an interesting finding given that thelabour market in Kenya is largely labour-intensive. Additionally, MSEsbenefit from low labour costs.

29
5.7 Capital
Capital was found to have a positive impact on the growth of MSEs.Lack of capital had been a major problem facing MSEs, with majority(89.6%) of them having not received any form of credit and 88.6 percent of them sourcing their initial business capital from family, friendsand their own contributions. The 1999 National Micro and SmallEnterprise Baseline Survey reported that lack of collateral for credit isone of the major constraints being faced by MSEs in Kenya.
5.8 Growth-Oriented and Survivalist Enterprises
The distinction between growth-oriented and survivalist enterprises,according to literature, was summarized in Table 2. It is now possible totest the contents of Table 5.2 from the findings of this study using the1999 National Micro and Small Enterprise Baseline Survey data. Thefindings reveal that growth-oriented enterprises are registered, havecapital and have owners with formal education, which is in accordancewith literature. A further discovery is that growth-oriented enterprisessub-contract and participate in marketing, as summarized in the tablebelow.
Results and discussions
Description Growth-oriented enterprise
Initial size of the firm Starts small
Legal form Is registered with relevant authorities
Ownership Solely female-owned enterprises tend toachieve negative growth
Business contracts and linkages Sub-contracts for inputs and orders
Education level of owner MSE owner had formal education (atleast secondary school education)
Business sector Service Sector
Capital base Has a high capital base
Source: Author's compilation
Table 5.2: Characteristics of growth-oriented enterprises inKenya

30
Factors affecting growth of micro and small enterprises in Kenya
6. Conclusions and Recommendations
6.1 Conclusions
The aim of the study was to establish the factors affecting growth ofMSEs in Kenya in order to identify mechanisms and structures forensuring growth of enterprises. This is especially important in ensuringthat resources are utilized efficiently to achieve national developmentgoals. Well developed MSEs can create employment opportunities, leadto industrial development and innovation, reduce poverty reduction andensure economic growth, while providing inexpensive quality goods andservices to local, regional and international markets.
The study established that the factors affecting MSEs� growth inKenya include the legal status of the enterprise, where those that had abusiness registration grew more than those that did not. Sub-contractinghas a positive effect on growth of MSEs, while those owned by womenwere found to be less likely to grow. An interesting finding, which canmake an important contribution to employment creation opportunities,is that enterprises that start small, that sub-contract and in the servicessector have a positive impact on the growth of MSEs. Lastly, the findingsalso confirm that MSEs with capital and a more educated owner achievemore growth.
The study established that MSEs in Kenya are very heterogeneousand face different problems, have different needs, and make differentcontributions to the economy. Growth-oriented enterprises participatein viable activities that make a contribution to economic growth anddevelopment. Survivalist enterprises participate in subsistence, low valueadding activities, and provide low quality goods and services, thus havinglow growth potential. It is important for the government to clearly definethe MSE sector and ensure that policies are targeted. Further, there isneed to make a distinction between enterprises with growth potentialand those that are survivalist when it comes to policy formulation anddistribution of resources. This is because their needs and requirementsdiffer. For instance, there are some enterprise owners who may not wantto grow and are comfortable with their size. Such enterprises may notuse the resources allocated to them effectively. Policies should, therefore,be developed to target the appropriate enterprise group to ensure thatscarce resources are used effectively.

31
6.2 Recommendations
The following policy recommendations could be considered toencourage the growth of MSEs.
Empower women entrepreneurs: Women have an important roleto play in the economy but they face many obstacles in running abusiness. The government should, therefore, support womenentrepreneurs further to enable them access credit, access education,access land and worksites while addressing other factors that maydiscriminate against women entrepreneurs. The Department of Microand Small Enterprise Development (DMSED) should strengthencollaboration with Department of Gender in the Ministry of Gender,Sports, Culture and Social Services and other relevant stakeholders, suchas women self-help groups, to address issues and concerns unique towomen entrepreneurs. The Women Enterprise Fund and other similarsources of finance for women should also include a component ofcapacity building in order to support women in entrepreneurialinitiatives.
Business registration: The government should reduce red tape, timeand costs to registering a business. The government should also hastenthe computerization of the Registrar of Companies' office and thedecentralization of the business registration process. Currently,businesses can register only in Nairobi with the Registrar of Companies,which means that businesses located outside Nairobi bear additionalcompliance costs brought about by having to travel to Nairobi to register.
Promoting partnerships and linkages: Forward and backwardlinkages and partnerships with the private sector, development agenciesand the government should be encouraged through sub-contracts andtenders. This could include purchase orders by local, regional andinternational markets for locally manufactured products such as ceramicjikos, hurricane lanterns, local handicrafts, apparels, accessories andother local products. Sub-contracting is beneficial because it wouldimprove the quality and standards of goods and services. Largecompanies should also be encouraged to sub-contract certain servicesto MSEs. The Sessional Paper No.2 of 2005 suggests that incentivesshould be put in place to encourage partnerships with the MSE sector,one of which mandates the government to allocate 25 per cent of itsprocurement requirements to MSEs. However, the mechanisms andmodalities for the incentives for partnerships with the private sector

32
Factors affecting growth of micro and small enterprises in Kenya
are not well spelt out. The incentives should be formulated andinstitutionalized to encourage business partnerships and linkages.Apprenticeships, internships and mentorship programmess betweenlarger or more experienced enterprises or industry should be encouraged.The government and the private sector should continue striving to formpartnerships with MSE operators. Examples of such partnerships includethe Coca Cola shipping containers used by Coca Cola wholesalers, theCoca Cola Kiosks, or the Safaricom and Celtel booths observablethroughout Kenya.
Level of education: Given that education of the MSE owner has apositive effect on the growth of the enterprise, it is important for schoolsand universities to be encouraged to impart entrepreneurial skills andknowledge to the students. Continued training and technical assistanceshould also be provided to entrepreneurs.
Business sector: Kenya�s services sector is an important and growingsector, especially the tourism sector. However, a number of sub-sectorssuch as business process outsourcing (BPOs) are emerging, whereinvestments are increasingly being made in labour-intensive industriessuch as call centres. The government should continue encouraging thegrowth and development of such industries locally as there is a lot ofpotential growth. Businesses locally and internatinally are increasinglyopting to outsource certain processes to firms that have the relevantskills in order to improve overall efficiency.
Access to capital: Supply of credit to MSEs has been increasing withthe emergence and growth of micro finance institutions (MFIs), whichhave improved entrepreneur's access to capital. The MFIs should beencouraged to provide integrated financial advice and business advisoryservices to ensure that the credit is utilized properly.
Business support services: The DMSED should take a central role insupporting and coordinating business support and technical servicesprovided to MSEs. This would encourage the growth and expansion ofMSEs by improving their access to land, capital, inputs, markets,information (for instance on intellectual property rights, internationaltrade requirements) and technology. One important function of suchbusiness support services would be to provide access to suitableworksites and in a planned and coordinated manner. Business supportcentres should encourage the development of small scale formalenterprises by providing special tax reductions or subsidies, providing

33
raw materials and conducting research on behalf of MSEs, as is the casein India and Japan. This would lower production and operation costs.The business support centres should have resources and should belocated at the district level to offer direct essential services to cater forthe specific needs of enterprises. Countries such as Japan havedecentralized business support services for small and mediumenterprises.
6.3 Issues for Further Research
It is important to understand the problems facing growth-oriented andsurvivalist enterprises at the different stages within the firm cycle. Sucha study would be very useful in assisting policy makers in understandingthe different needs for the different types of enterprises at their differentstages of maturity. Secondly, since 1999, there have been several changesthat may have impacted on MSEs growth. These include advancementsin information and communication technology, such as mobiletelephones and the Internet. It would be important to assess, using upto date data, the impacts of such factors on MSEs� growth.
Conclusions and recommendations
34
Factors affecting growth of micro and small enterprises in Kenya
References
Biggs T. and Srivastava P. (1996), Structural aspects of manufacturingin sub-Saharan Africa: Findings from a seven country enterprisesurvey. World Bank Discussion Paper No. 346.
Bigsten, A., Kimuyu P. and Lundvall K. (1999), Are formal and informalsmall firms really different? Evidence from Kenyanmanufacturing. IPAR Discussion Paper Series.
Bigsten, A., Kimuyu P. and Lundvall K. (2004), "What to do with theinformal sector?" Development Policy Review, 2004, 22 (6) pp:701-715.
Briscy, U. and Kohaut, S. (1999), �Employment growth determinantsin new firms in Eastern Germany�, Small Business Economics,Vol. 13, pp155-170.
CBS, ICEG and K-Rep Holdings(1999), National micro and smallenterprise baseline survey 1999: Survey results. Central Bureauof Statistics (CBS), International Center for Economic Growth(ICEG), K-Rep Holdings, Kenya.
Chen, M. A. (2003), Rethinking the informal economy for footlooselabour: A symposium on livelihood struggles of the informalworkforce http://www.india-seminar.com/2003.
Chen, M. A., Vanek J. and Carr M. (2004), Mainstreaming informalemployment and gender in poverty reduction: A handbook forpolicy-makers and other stakeholders. London: CommonwealthSecretariat http://www.wiego.org/publications/
DfID (2000), Eliminating world poverty: Making globalisation work forthe poor, London: Department for International DevelopmentLondon http://www.dfid.gov.uk
Elhiraika, A. and Nkurunziza J. (2006), Facilitating firm entry: Growthand survival with special attention to SMEs. African Trade PolicyCentre, Work in Progress No. 46 Economic Commission forAfrica. http://www.uneca.org/atpc/Work%20in%20progress/46.pdf
Evans, D. (1987), "Test alternative theories of firm growth." Journal ofPolitical Economy, Vol. 95(4), pp 657-74.

35
Fafchamps, M. (1994), "Industrial structure and micro-enterprises inAfrica." Journal of Developing Areas, Vol. 29, pp. 1-30.
Francisco, J. P. (2004), Expanding state purchases from micro and smallenterprises: A promising approach from Peru, in Badshah A.,Khan S. and Garrido M. (eds), Connected for development:Information kiosks and sustainability, UNICT taskforce andDigital Partners. http://www.unicttaskforce.org/perl/documents.pl?id=1361
Government of Kenya (1992), Sessional Paper No. 2 of 1992 on SmallEnterprise and Jua Kali Development in Kenya, Nairobi: Ministryof Labour and Human Resource Development.
Government of Kenya (2000), Economic Survey, Nairobi: Ministry ofPlanning and National Development.
Government of Kenya (2003), Economic Recovery Strategy for Wealthand Employment Creation 2003-2007, Nairobi: Ministry ofPlanning and National Development.
Government of Kenya (2005), Sessional Paper on Development of Microand Small Enterprises for Wealth and Employment Creation forPoverty Reduction, Nairobi: Ministry of Labour and HumanResource Development.
Government of Kenya (2007), Economic Survey, Nairobi: Ministry ofPlanning and National Development.
Green, C. J., Kirkpatrick C. N., and Murinde V. (2006), "Finance forSmall Enterprise Growth ad Poverty Reduction in DevelopingCountries." Journal of International Development, Issue No. 18:1017-1030.
Hafkin, N. (2002), A policy response to the informal economy:Addressing informality, reducing poverty women in informalemployment globalizing and organizing (WIEGO), CambridgeUSA http://www.wiego.org/publications/policybooklet.pdf
Harvie, C. (2003), The contribution of micro-enterprises to economicrecovery and poverty alleviation in East Africa. Economic WorkingPaper Series, University of Wollongong.
Ikiara, G., Olewe-Nyunya J. and Odhiambo W. (2004), �Kenya:Formulation and implementation of strategic trade and industrialpolicies�, in Soludo C., Ogbu O. and Chang H. (eds), The politics
References
36
Factors affecting growth of micro and small enterprises in Kenya
of trade and industrial policy in Africa: Forced consensus? AfricaWorld Press/IDRC.
ILO (2002), Women and men in the informal sector: A statistical picture.International Labour Organization.
Kahuthu, C. (2005), Small and medium enterprises. Finance Magazine,January-March 2005, pp 59-64. Nairobi.
Karingithi, W. (1999), �The legal and regulatory framework�, in MulleiA. and Bokea C. (eds), Micro and small enterprises in Kenya:Agenda for improving the policy environment, Nairobi: TheInternational Centre for Economic Growth (ICEG).
Kimuyu, P. (2002), Micro-level institutions and revenue generation,Nairobi: Institute of Policy Analysis and Research.
Liedholm, C. (2001), Small firm dynamics: Evidence from Africa andLatin America, World Bank Institute. http://siteresources.worldbank.org/WBI/Resources/wbi37189.pdf
McMahon, R. (1998), Stage models of SME growth reconsidered. TheFlinders University of South Australia, School of Commerce,Research Paper Series: 98-5.
Mead, D. C. and Liedholm C. (1998), "The dynamics of micro and smallenterprises in developing countries", World Development, Vol.26 No. 1: 61-74.
Mishra V. (2004), Size, age and firm growth: The computer industry inIndia Manash University Department of Economics, Australia.
Moyi, E. (2005), Micro and small enterprises in Kenya: Can they deliverthe anticipated employment targets? KIPPRA Policy MonitorIssue No. 1, July-September.
Moyi, E., Otieno G., Mumo, I. and Ronge E. (2006), Developing amarketing framework for micro and small enterprises in Kenya.KIPPRA DP No. 60, Nairobi: Kenya Institute for Public PolicyResearch and Analysis.
Mullei, A. and Bokea C. (1999), Micro and small enterprises in Kenya:Agenda for improving the policy environment, Nairobi:International Centre for Economic Growth.
37
Omolo, J.O. and Omiti J.M. (2005), Difficulties of employment creationin micro and small enterprises in Kenya. IPAR DP No. 071/2005,Nairobi: Institute for Policy Analysis and Research.
Patricof, A. J., Apax P. and Sunderland J. E. (2005), Venture capital fordevelopment. Prepared for the Brookings Blum Roundtable: Theprivate sector in the fight against global poverty. http://www.brookings.edu/
Ranis, G. and Stewart F. (1999), "V-goods and the role of the urbaninformal sector in development." Economic Development andCultural Change 47(2): 259-288.
Ronge, E., Ndirangu L. and Nyangito H. (2002), Review of governmentpolicies for the promotion of micro and small scale enterprisesin Kenya. KIPPRA Discussion Paper No. 20, Nairobi: KenyaInstitute for Public Policy Research and Analysis.
Small Enterprise Development Agency (SEDA), Department of Tradeand Industry, South Africa [online] http://www.seda.org.za
SMEA (2002), Outline of Japan's SME policies. Small and MediumEnterprise Agency (SMEA), Government of Japan.
Tarmidi, L. (2005), The importance of MSEs in economic developmentof developing APEC countries. Paper presented at the APEC StudyCenter Consortium Conference in Korea in May 2005. http://www.apec.org.au/docs/koreapapers2/SVII-LT-Paper.pdf
Todaro, M. (2000), Economic Development, London: Addison-Wesley.
UN (2004), Unleashing entrepreneurship: Making business work forthe poor. Report to the Secretary-General of the United Nations,New York: United Nations Commission on the Private Sector andDevelopment.
World Bank (2006), World Development Indicators, World Bank.
World Bank (2007), Doing business in 2008, World Bank.www.doingbusiness.org.
World Bank (2007), Micro, small and medium enterprises: A collectionof published data http://rru.worldbank.org/Documents/other/MSMEdatabase/msme_database.htm
References

38
Factors affecting growth of micro and small enterprises in Kenya
Annex
Annex 1: Summary Statistics
Variable Observations Mean Std. Dev Min Max
growth 1857 .1331863 .500184 -2.99 3.61
lnsize 1871 .1729189 .4043179 0 3.61
lnage 1910 .9718664 1.405267 -2.30 4.38
(lnsize)2 1871 .1932866 .7065873 0 13.03
(lnage)2 1910 2.918267 2.990375 0 19.20
lnsize*lnage 1843 .1860762 .7381485 -3.71 7.07
dfemown 1878 .498935 .500132 0 1
dbusreg 1868 .132227 .3388281 0 1
dsubcont 1749 .0520297 .2221505 0 1
deduc 1894 ..436114 .4960328 0 1
dservice 1945 .1321337 .3387231 0 1
lncapital 1805 8.471539 2.207943 2.30 18.29
Annex 2: Tabulation of Dummy Variables
Dummy Variable Frequency %
dfeown 0 941 50.11
1 937 49.89
dbusreg 0 1,621 86.78
1 247 13.22
dsubcont 0 1,658 94.80
1 91 5.20
deduc 0 1,068 56.39
1 826 43.61
dservice 0 1,688 86.79
1 257 13.21

39
An
nex
Annex 3: Correlation matrix
growth lnsize lnage (lnsize*lnage) (lnsize)2 (lnage)2 dfemown dbusreg dsubcont deduc dservice lncapital
growth 1.0000
lnsize -0.3146 1.0000
lnage 0.0353 0.0252 1.0000
lnsize*lnage -0.1887 0.6362 0.3301 1.0000
(lnsize)2 -0.3348 0.8713 0.0295 0.5844 1.0000
(lnage)2 -0.0001 0.0087 0.5001 0.1891 -0.0052 1.0000
dfemown -0.0855 -0.2068 -0.1356 -0.1549 -0.1306 -0.0760 1.0000
dbusreg 0.1628 0.1686 0.0785 0.1729 0.1377 0.0392 -0.1680 1.0000
dsubcont 0.0719 0.0819 0.0131 0.0709 0.0650 -0.0302 -0.0758 0.1136 1.0000
deduc 0.1124 0.0941 -0.0508 0.0653 0.0582 -0.1423 -0.1334 0.1865 0.0460 1.0000
dservice 0.0869 0.0991 0.1307 0.1207 0.0686 0.0891 -0.1835 0.1570 0.0183 0.0350 1.0000
lncapital 0.1509 0.2481 0.2983 0.2646 0.1899 0.2265 -0.3697 0.3849 0.1058 0.2964 0.2263 1.0000

40
Factors affecting growth of micro and small enterprises in Kenya
Annex 4: Diagnostic tests
4.1 Heteroskedasticity
Breusch-Pagan / Cook-Weisberg test for heteroskedasticity
Ho: Constant variance
Variables: fitted values of growth
chi2(1) = 50.24
Prob > chi2 = 0.0000
Explanation: The Breusch-Pagan test will detect any linear form ofheteroskedasticity. Since the p-value is <0.05, we reject the nullhypothesis of constant variance. Therefore, there is heteroskedasicty. Arobust regression was run to contain the heteroskedasticity.
4.2 Muticollinearity
Variable VIF 1/VIF
lnsize 4.95 0.202015(lnsize)2 4.24 0.235591(lnsize*lnage) 2.05 0.488934lncapital 1.62 0.616450lnage 1.59 0.628343(lnage)2 1.40 0.714413dbusreg 1.21 0.827377dfemown 1.21 0.829571deduc 1.17 0.855371dservice 1.08 0.924481dsubcont 1.02 0.975803Mean VIF 1.96
Explanation: The variance inflation factor (VIF) values are less then 10and the 1/VIF values are over 0.1, which indicates there is no collinearity.Therefore, there is no risk of multicollinearity.

41
Annex 6: Small and medium scale industries in Japan
Estimated No. of units 4.69 million (99.7% of all enterprises)
Employment 29,960 thousand (70.2% of all employed persons)
Value of exports in manufacturing 137,776 (51.1%)
Figures for the year 2002
Size of Small and Medium Industries Employing 4-299 workers
Source: http://www.chusho.meti.go.jp and World Bank (2007)
Annex 7: Micro and small scale industries in Peru
Percentage of MSEs in Peru 98.3% of all enterprises
Employment 75.9% of total employment
GDP contribution 42.1%
Figures for the year 1997
Size of Micro and Small Scale Industries Employing 1-50 workers
Source: Tarmidi, L (2005) and World Bank (2007), World Bank
Annex 5: Small scale industries in India
Estimated No. of units 3.57 million 12.3 million
Employment 19.96 million 26.5 million
Share in industrial value added 39%
Share in total exports (overall) 34% 34%
Total number of items produced Over 8000
Number of reserved items 675
Figures for the years 2002-2003 2005-2006
Size of small scale industries in India Employing 6-9 workers
Source: http://www.smallindustryindia.com and World Bank (2007)
Annex

42
Factors affecting growth of micro and small enterprises in Kenya
Other Related KIPPRA Publications
Ronge E, Ndirangu L and Nyangito H (2002), Review of governmentpolicies for the promotion of micro and smallscale enterprises inKenya, KIPPRA DP No. 20.
Moyi E and Njiraini P (2005), Towards technology models for MSEs inKenya: Common principles and best practices, KIPPRA DP No. 51.
Moyi E and Njiraini P (2005), Misallocation of workspaces for MSEs inKenya: Some lessons and models, KIPPRA DP No. 53.
Moyi E, Otieno G, Mumo I and Ronge E (2006), Developing a marketingframework for MSEs in Kenya, KIPPRA DP No. 60.
Owegi, F and Aligula E (2006), Public sector procurement in Kenya:The need for a coherent policy framework, KIPPRA DP No. 62.
Njiraini P and Moyi E (2006), Supporting MSEs to access publicprocurement market in Kenya, KIPPRA DP No. 65.
Moyi E (2006), Policy advocacy needs of MSE associations in Kenya: Asurvey of MSE associations in Nairobi, Mombasa, Kisumu andNakuru, KIPPRA SP No. 8.
Core capacity building programme (KIPPRA TM No. 1-1)
Guidelines on policy analysis and formulation (Module 1, KIPPRA TMNo. 1-2) - Course Book.
Guidelines on policy analysis and formulation (Module 1, KIPPRA TMNo. 1-2) - Trainer's Guide.
Micro and small enterprises development (Module 2, KIPPRA TM No.1-3) - forthcoming.
Research methodology and communication (Module 3, KIPPRA TM No.1-4) - Course Book.
Research methodology and communication (Module 3, KIPPRA TM No.1-4) - Trainer's Guide
Micro and small enterprise programme management (Module 4,KIPPRA TM No. 1-5).
Monitoring and evaluation of micro and small enterprises policies(Module 5, KIPPRA TM No. 1-6) - Course Book.
Monitoring and evaluation of micro and small enterprises policies(Module 5, KIPPRA TM No. 1-6) - Trainer's Guide.