factor structure and cross-validation of a professionalism
TRANSCRIPT

Factor Structure and Cross-Validationof a Professionalism Scale
in Pharmacy Students
Sanguan Lerkiatbundit
ABSTRACT. The objectives of this study were to investigate factor struc-tures of an attitudinal professionalism scale revised from the Schack-Hepler scale and cross-validate the findings. The students at a pharmacyschool completed the scale twice, i.e., in 1998 (N = 464) and again in1999 (N = 301). In 2004, another group of students (N = 486) at the sameschool also responded to the same scale. Factorial validity of the scalewas assessed using structural equation modeling. The results showedthat six subscales of the instrument were reliable (Cronbach alpha >0.70). Based on 1998 data, the fit of the six-correlated factor model wasbetter than those of the competing models. The parameter estimates sug-gested the convergent and discriminant validity of the scale. The six-cor-related factor model had the highest degree of replicability in the 2004sample. The analysis of panel data (using 1998-1999 samples) and themulti-group analysis indicated the invariance of factor loadings overtime and across groups and classes. In conclusion, the professionalismscale is best represented by the six-correlated factor model. The respon-dents interpreted the scale items the same way across groups, time andclasses. [Article copies available for a fee from The Haworth Document Deliv-ery Service: 1-800-HAWORTH. E-mail address: <[email protected]> Website: <http://www.HaworthPress.com> © 2005 by The HaworthPress, Inc. All rights reserved.]
KEYWORDS. Professionalism scale, professionalism, pharmacy stu-dents, socialization, construct validity
Sanguan Lerkiatbundit, Ph.D., is Associate Professor in the Department of Phar-macy Administration, Faculty of Pharmaceutical Sciences, Prince of Songkla Univer-sity, Hadyai Songkla, Thailand 90112.
Journal of Pharmacy Teaching, Vol. 12(2) 2005Available online at http://www.haworthpress.com/web/JPT
© 2005 by The Haworth Press, Inc. All rights reserved.doi:10.1300/J060v12n02_03 25

INTRODUCTION
Several forces drive the concern over pharmacy professionalism. Themovement toward pharmaceuticalcare as the practice standard requires ahigher level of professionalism from practitioners.Critical issues regard-ing current practice include patient safety, workload, limited manpower,and the sentiment that there has been a decline in the professionalism ofpharmacists over the years as well as within society in general (1).
Professionalism can be measured in terms of structural, attitudinal orbehavioral attributes. The structural attributes of a profession include theprovision of socially necessary and important functions, the possessionof specialized knowledge and skills requiring advanced theoretical train-ing,an individualized,unstandardizedservicedirectly toclients/patients,autonomy for the definition, organization, and performance of work, in-ternal controls of the behavior of its practitioners and formal organiza-tions, code of ethics, and licensure requirements (1). However, thestructural definition operates on the occupational level, attempts to rea-son from the occupational level to the individual level are seldom fruitful(2). The attitudinal and behavioral definitions operate on the individuallevel. They are logically and empirically more valid for the assessment ofan individual’s professionalism.
In terms of attitudinal attributes, professionalism could be describedas: (1) Use of the professional organization as a major referent, (2) beliefin public service or the belief that professional work is indispensable andbeneficial to society, (3) belief in self-regulation or the belief that the per-formanceof theprofessionals shouldbe judgedonlybypeers, (4) senseofcalling or professional commitment, (5) autonomy or the belief that onehas a right to make a professional decision without external pressuresfrom clients, non-professionals, and employers, and (6) belief in continu-ing education or the belief that to maintain an adequate level of compe-tence one must commit to the continuing extension of professionalknowledge (2).
Hammer et al. defined behavioral professionalism as “behaving in amanner topotentiallyachieveoptimaloutcomes inprofessional tasksandinteractions” (3). Theyemployedexploratory factoranalysis todevelopascale for this construct in pharmacy students. Four dimensions of behav-ioralaspectsofprofessionalismemergedin theirstudy: responsibility, in-terpersonal/social skills, communication skills, and appearance (3).
To enhance professionalism, colleges of pharmacy should “de-velop/utilize valid assessment instruments to measure professionaldevelopment in the didactic and experiential components of the cur-
26 JOURNAL OF PHARMACY TEACHING

riculum” (1). The assessment should be comprehensive, including bothattitudinal and behavioral aspects of professionalism. An instrument tomeasure behavioral professionalism has been recently developed (3).This study focuses on an instrument to measure attitudinal professional-ism. The measurement of this aspect of professionalism is briefly re-viewed below.
Measurement of Attitudinal Professionalism
Hallwas the first researcherwho developeda scale tomeasureattitudi-nalprofessionalism(4).Snizek,SchackandHepler later refinedthisscale(2,5). Schack and Hepler modified the Hall-Snizek scale by replacing all“other-referent” items (such as “The dedication of people in this field ismost gratifying”) with “self-referent” items (such as “The practice ofpharmacy is gratifying and satisfying to me”) because the presence ofother-referent items created ambiguity and confused the validity of thescale (5). They also added a sixth dimension (belief in continuing educa-tion) to the original set of five. The Schack-Hepler scale had been used inmanystudiesofpharmacists (6-8)andpharmacystudents (9).However,aconfirmatory factor analytic study suggested the scale appeared in needof a significant revision before it could be recommended for widespreaduse (10). In one study, Cronbach alpha of all subscales was less than 0.7,except for sense of calling and belief in professional organization (11). Astudy using the Schack-Hepler scale questioned its sensitivity to detectchanges in professionalism among students (9).
Lerkiatbundit revised the Schack-Hepler scale, but maintained itsoriginal six dimensions and meanings (11). The revision of the scale wasdescribed indetail in thestudiesbyLerkiatbundit (11,12).Thescalemod-ificationisbrieflyreviewedhere.TheSchack-Heplerscalewas translatedinto Thai language using the translation-back translation method. Apre-test of the translated scale in 197 pharmacy students showed that theCronbach alpha of all subscales was less than 0.7, except for sense of call-ing and belief in professional organization. Poor reliability may resultfrom the fact that the Schack-Hepler scale was developed for use withpharmacists.Thescalewasmodifiedbychangingordeleting theambigu-ous items or items with low inter-itemcorrelations, and adding new ques-tions. Many questions in the Schack-Hepler scale were changed fromself-referent to other-referent items in order to make the items more rele-vant to student subjects. For example, the question “My daily practice isall the continuing education I need” was changed to “Daily pharmacypractice isall thecontinuingeducationapharmacistneeds.” Interviewing
Lerkiatbundit 27

subjects during the pilot study revealed the presence of other-referentitems did not create confusion. Sense of calling scale was replaced withthe modified version of the Blau’s professional commitment scale (13)becauseof itsexcellentpsychometricpropertieswhen tested inpharmacystudents (14). Moreover, the scores from the Blau’s scale could becompared to those reported by previous studies.
The revised scale is in the appendix of this article. The test of the re-vised scale in 508 pharmacy students showed Cronbach alpha of the sixsubscales ranged from 0.76 to 0.86. This scale has been used in manystudies, such as a study of change of attitudinal professionalism levels inpharmacy students and pharmacists, factors affecting the change and theeffects of externship on attitudinal professionalism levels (12,15,16).These studies provided the evidence for construct validity of the scale be-cause the pattern of the correlation between attitudinal professionalismsubscales and various variables (e.g., academic development, facultyconcern, satisfaction with peers and satisfaction with pharmacy job) wasconsistent to the theoretical predictions. A study in pharmacy studentsshowed that the scale was sensitive to changes in the levels of attitudinalprofessionalism over the year (12).
However, some questions regarding thevalidityof the revisedattitudi-nal professionalism scale still exist. What is the underlying factor struc-ture of the instrument? For example, does the scale measure six distinctdimensions or one unitary concept of attitudinal professionalism? Is thescale invariantacrossgroupsofsubjectsandtime?Does thescalehavethesame meaning when tested in a new group of subjects? Do students per-ceive attitudinal professionalism (as measured by the scale) differentlyaftergoingthroughthesocializationprocess in theschool?Thefourthandfifthyearsof thepharmacycurriculumexposestudents tomorepharmacypractice experience than in earlier years of the program. As a result, theymay or may not share the same concept of attitudinal professionalism.Therefore, the study also tested whether the professionalism scale mea-sures the same thing when administered to upper classmen and lowerclassmen. This study was designed to answer these questions. The studyresults will provide insight on the psychometric properties of theattitudinal professionalism scale, which are useful to judge the merits ofthe scale.
Attitudinal professionalism and the revised attitudinal professional-ism scale will be referred to as “professionalism” and “the professional-ism scale,” respectively, in the rest of the article. The methodology andresults are divided into four studies according to research objectives. The
28 JOURNAL OF PHARMACY TEACHING

studies were reviewed and approved by the institutional review board atthe study site.
STUDY 1
Objective: To determine the factor structure underlying the profes-sionalism scale.
Subjects and data collection: The professionalism scale (as shown inthe Appendix) was distributed in classes as a part of a larger survey to allpharmacy students (Classes of 1999-2003) at the Prince of Songkla Uni-versity (PSU) in Thailand. The pharmacy curriculum at PSU was de-scribed in detail in a previous article (11). Each question was rated on afive-point Likert-type scale, from “1” = Strongly disagree to “5” =Strongly agree. Reliabilityand validityof the scale were mentioned in theintroduction section.
The survey was in Thai language and conducted during the first twoweeks of the academic year 1998 (June 1998). The researchers explainedto the student subjects that the objective of the study was to investigatetheirattitudes toward thepharmacyprofession, and thatparticipationwasvoluntary. The students were asked to independently complete the ques-tionnaires whenever they wanted and return them within one week. An-other copy of the questionnaire was sent to the non-respondents after oneweek. The data from this study is referred to as the “1998 sample” in thispaper.
Model specification: Four models were hypothesized to represent theunderlying structure of the professionalism scale.
Model 1 (six correlated factor model): Six factors as indicated by thesixcircles inFigure1represent thebelief inprofessionalorganization,be-lief in public service, belief in self-regulation, professional commitment,autonomyandbelief incontinuingeducation.Eachfactor ishypothesizedto correlate with the others, as indicated by the two-headed arrows. Eachitem loads on (measures) one and only one factor. For example, items 1-7load onto belief in professional organization. Measurement error associ-ated with each item, represented by short arrows pointing to items, isuncorrelated.Thismodelhypothesizes that thescalemeasuressixdistinctbut correlated concepts.
Model 2 (six uncorrelated factor model): This model is the same asmodel 1, but all factors are hypothesized to be independent. Graphic rep-resentation of model 2 is not shown because it is the same as Figure 1 but
Lerkiatbundit 29

without the two-headed arrows connecting between factors. This modeltests the interdependency among six hypothesized factors.
Model3 (one-factormodel): In thismodel, it ishypothesized thatall42items of the scale are indicators of one concept called professionalism. Inother words, the scale measures one unitary concept of professionalism,not six distinct attitudes. If this model holds, the scores from all 42 itemscould be summed to give a single score of professionalism. Figure 2a dis-plays the structure of this model.
30 JOURNAL OF PHARMACY TEACHING
Prof org Cont edu Autonomy
Pub serve Self reg Prof comm
I15 I16 I17 I18 I19 I20 I21
I36 I37 I38 I39 I40 I41 I42I1
I2
I3
I4
I5
I6
I8
I7
I9
I10
I11
I12
I13
I14
I22
I23
I24
I25
I26
I27
I28
I29
I30
I31
I32
I33
I34
I35
FIGURE 1
Note:1. Prof org: Belief in professional organization Pub serv: Belief in public service
Self reg: Belief in self regulation Prof comm: Professional commitmentAutonomy: Belief in professional autonomy Cont edu: Belief in continuing education
2. I is abbreviated for item, for example, I1 is question number 1 in the scale.3 Each factor or circle should be connected by double-headed arrows to other circles to represent their cor-relations. However, six double-headed arrows (such as the one connecting ‘public service’ and ‘profes-sional commitment’) are omitted to simplify the figure.4. Measurement errors are represented by arrows pointing from outside the model to indicators.

Model 4 (second order factor model): This model is the same as model2. However, all factors are hypothesized to have a common higher factorwhich is representedbyasecondorder factorcalledprofessionalism.Fig-ure2bshows themeasurementmodelofmodel4. If thismodelbest fits thedata, it implies that the six hypothesized factors are distinct and measurethe same underlying higher order factor.
Data analysis: The variance-covariance matrix of items in the scalewas analyzedusing confirmatory factor analysis by maximumlikelihood(ML) method of estimation in LISREL 8.52 (17). This method places an
Lerkiatbundit 31
Profess
Profess
I1 I2 I41 I42
Figure 2b
Figure 2a
Prof org Pub serv Self reg Prof comm Autonomy Cont edu
FIGURE 2. (a) Model 3 (one factor model) and (b) Model 4 (second order fac-tor model)
Note:1. Profess stands for professionalism.2. Figure 2a is a simplified version by displaying only some of the indicators. The complete figure shoulddisplay all 42 items of the professionalism scale.3. Figure 2b is simplified version by displaying only the measurement model of ‘self reg.’ The complete fig-ure should display measurement models of all six factors.

assumption of multi-variate normality of the data. Mardia’s estimates of“multivariate kurtosis and skewness” for the data were 22.06, and 46.92.This indicated a departure from the assumption. However, previous re-search indicates the ML is robust in situations of uni-variate ormulti-variate non-normality (18). For sample size in the range of200-500, ML is recommended when the distributions are not substan-tially non-normal (univariate skewness < 2 and univariate kurtosis < 7)(18). The distribution of the data in this study conformed to this require-ment. As a result, ML was used as the estimation method.
Goodness-of-fit of the models to the data was evaluated usingchi-square statistics and various indices as suggested by Hu and Bentler,(i.e., the root mean square error of approximation (RMSEA) and its 90%confidence interval, standardized root mean square residual (SRMR),comparativefit index(CFI), and theTucker-Lewis index(TLI)) (19).Thechi-square statistic is sample size dependent. Even if the discrepancy be-tween the model and data is very small, almost any model with a largesample size will be rejected by the chi-square test (20). Therefore, thechi-square statistic was used with the other indices in selecting the bestmodel.RMSEA, SRMR, CFI and TLIare indices recommendedas sensi-tive to model misspecifications (19). For RMSEA, Browne and Cudecksuggested thatvaluesof0.05or lesswould indicatea“close fit,”avalueof0.08or lesswould indicatea“reasonable fit,”andvaluesgreater than0.10would indicate“unacceptablefit”(21).TheCFIandTLIwithvaluescloseto 0.95 and SRMR less than 0.08 reflect a good fit of model to the data(19). Comparative fits of nested models were evaluated by chi-squaredifference tests.
Results and Discussion of Study 1
Of 519 pharmacy students, 464 students (89.4%) fully completed thequestionnaire. The rest of the students partially answered the question-naires or did not return their surveys. The response rates ranged from80.8% for second-year students to 94.7% for first-year students. The ageof the participants was between 18 to 22 years. About 78 percent of thesubjectswere female.Cronbach alphas of the six subscales of profession-alism were acceptable, ranging from 0.76-0.86.
Goodness-of-fit indices for the 1998 sample are shown in Table 1. Formodels 1, 2 and 4, RMSEAs were near 0.05 and the upper bounds of 90%CIswere less than0.08, indicatinganacceptablefit to thedata.Formodels1and4,SRMRs were less than0.08andTLIsandCFIs wereclose to0.95,suggesting a good fit of the model. It was apparent that model 2
32 JOURNAL OF PHARMACY TEACHING

(uncorrelated model) and model 3 (one-factor model) had a poor fit to thedata (SRMR > 0.10 and CFIs-TLIs < 0.95). The results suggest a good fitfor models 1 and 4.
Given that models 2-4 are nested versions of model 1, they can be di-rectly compared to model 1 using the chi-square difference test (22). Asignificant result implies that the model with the lower chi-square statis-tics (and the lowerdf) shows abetter fit.Anon-significant result indicatesequivalenceof fit between thecomparisonmodels.According to this test,the fit of model 2 (6 uncorrelated factors) was significantly worse thanthat of model 1 (∆χ2 = 313, df = 15, P < 0.001) (Table 1). This implies thatthe factor structure of the professionalism scale was not well representedby thesix uncorrelated factormodel (model2) compared to thecorrelatedfactor model (model 1). In other words, correlations among six factorswere statistically significant. The comparison between models 1 and 3(∆χ2 = 3567, df = 15, P < 0.001) strongly rejected the hypothesis of a onefactor model. The fit of the six-correlated factors model (model 1) wasalso superior to that of model 4 (the second order model) (∆χ2 = 83, df = 9,P < 0.001). However, the fit indices for the second order model (model 4)was acceptable (RMSEA = 0.046, SRMR = 0.068, CFI and TLI close to0.95), and comparable to those of model 1. The findings could not com-pletelyruleout thepossibilityofahierarchicalmodelofprofessionalism.
Based on the chi-square difference tests, attitudinal professionalism,as measured by this scale, is a multidimensional construct which com-prises six correlated dimensions of belief in professional organization,
Lerkiatbundit 33
TABLE 1. Confirmatory factor analyses of the professionalism scale (N = 464)
Model χ2 a df ∆χ2 b ∆df RMSEA(90% CI)
SRMR TLI CFI
Null 15677 861 - - - - - -
1) 6 correlated factors 1549 804 - - 0.044(0.041-0.048)
0.056 0.946 0.950
2) 6 uncorrelated factors 1862 819 313c 15 0.052(0.049-0.055)
0.118 0.926 0.930
3) One factor 5116 819 3567c 15 0.106(0.103-0.109)
0.123 0.695 0.710
4) Second order factor 1632 813 83c 9 0.046(0.043-0.049)
0.068 0.941 0.945
aMaximum likelihood chi-square and P < 0.001b χ2 of model 1 was used as a baseline to calculate ∆χ2 for models 2-4 .c P < 0.001

belief in public service, belief in self-regulation, professional commit-ment, autonomy, and belief in continuing education.
LISREL provided the indices which could be used to inform modifica-tion of the model to gain a better fit to the data. However, MacCallum,Roznowski and Necowitz have cautioned that “when an initial model fitswell, it is probably unwise to modify it to achieve even better fit becausemodification may simply be fitting small idiosyncratic characteristics ofthe sample” (23). Therefore, the modification indices were not used tofurthermodifymodel1because itsRMSEA,SRMR,CFIandTLIalreadysuggested an acceptable fit.
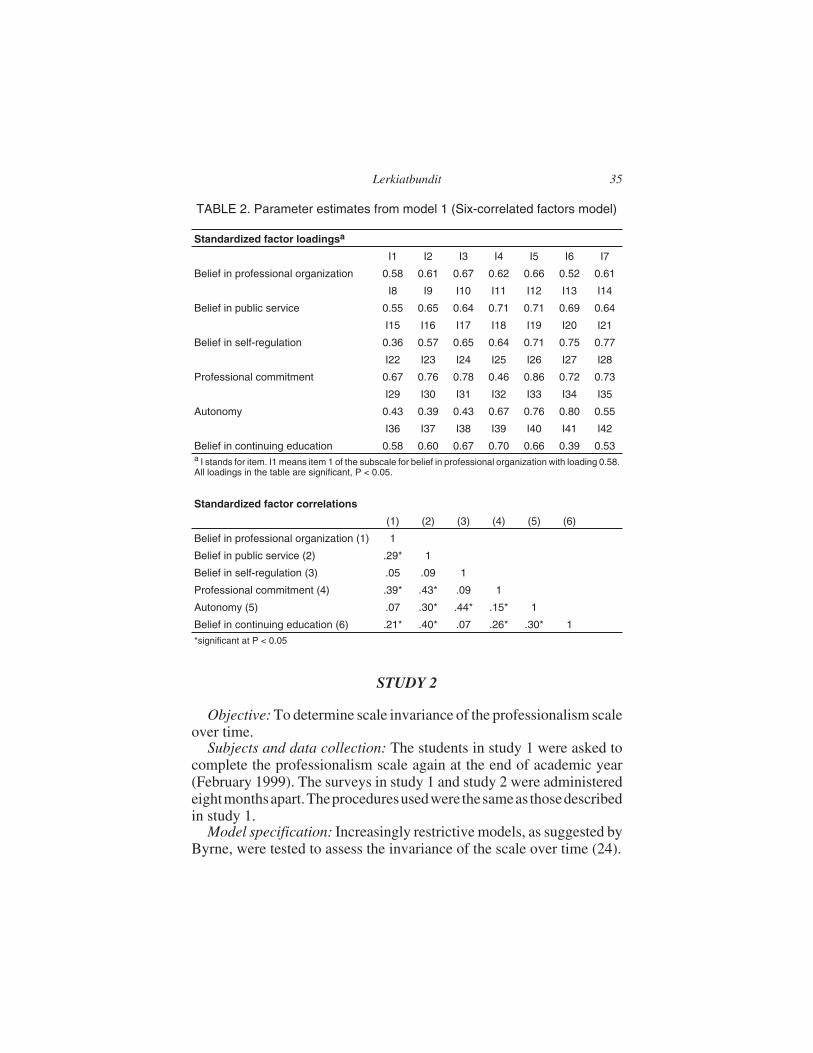
In model 1, each item measures a single factor (Figure 1). Therefore,the standardized loadings could be interpreted as the correlations be-tween items and factors. High loadings on the hypothesized factors (orhigh item-factorcorrelation) indicateconvergentvalidityof the itemsorahigh probability that all items measure the same factor. The squared load-ingsare theproportionsof explained itemvariancesor theextent towhicheach item measures its underlying factor. For the majority of items, stan-dardized factor loadings were more than 0.50 (Table 2). Support for con-vergent validity was moderate for six items (I15, I25, I29, I30, I31, andI41) because their loadings ranged from 0.36-0.46.
Low tomoderatecorrelationsamongfactors implydiscriminantvalid-ity; the factors are distinct. The estimated correlations among six factorsranged from the low (0.05) to moderate (0.44) levels (Table2) which sug-gested discriminant validity. Standard errors of these estimated correla-tions rangedfrom0.046 to0.056.Addingandsubtracting thecorrelationsin Table 2 with two times their corresponding standard errors will give95%confidence intervals.The95%CIof the largestcorrelation(betweenbelief in self-regulation and autonomy) was 0.44 ± 0.046 or 0.348- 0.532.Thecorrelationat thesizeof0.532wasnothighenough toassumethatbe-lief in self-regulationandautonomywere thesameconstruct.Overall, theresult implies discriminant validity of the scale.
At this point, it was determined to submit model 1 to a more restrictivetest using panel models with the data collected from the same sample ofrespondents at different points in time. This method was used to testwhether thescalehad thesame“meaning”over timeorwhether themean-ing of professionalism in the students’ view changes in the course of so-cialization.
34 JOURNAL OF PHARMACY TEACHING
STUDY 2
Objective: To determine scale invariance of the professionalism scaleover time.
Subjects and data collection: The students in study 1 were asked tocomplete the professionalism scale again at the end of academic year(February 1999). The surveys in study 1 and study 2 were administeredeightmonthsapart.Theproceduresusedwere thesameas thosedescribedin study 1.
Model specification: Increasingly restrictive models, as suggested byByrne, were tested to assess the invariance of the scale over time (24).
Lerkiatbundit 35
TABLE 2. Parameter estimates from model 1 (Six-correlated factors model)
Standardized factor loadingsa
I1 I2 I3 I4 I5 I6 I7
Belief in professional organization 0.58 0.61 0.67 0.62 0.66 0.52 0.61
I8 I9 I10 I11 I12 I13 I14
Belief in public service 0.55 0.65 0.64 0.71 0.71 0.69 0.64
I15 I16 I17 I18 I19 I20 I21
Belief in self-regulation 0.36 0.57 0.65 0.64 0.71 0.75 0.77
I22 I23 I24 I25 I26 I27 I28
Professional commitment 0.67 0.76 0.78 0.46 0.86 0.72 0.73
I29 I30 I31 I32 I33 I34 I35
Autonomy 0.43 0.39 0.43 0.67 0.76 0.80 0.55
I36 I37 I38 I39 I40 I41 I42
Belief in continuing education 0.58 0.60 0.67 0.70 0.66 0.39 0.53a I stands for item. I1 means item 1 of the subscale for belief in professional organization with loading 0.58.All loadings in the table are significant, P < 0.05.
Standardized factor correlations
(1) (2) (3) (4) (5) (6)
Belief in professional organization (1) 1
Belief in public service (2) .29* 1
Belief in self-regulation (3) .05 .09 1
Professional commitment (4) .39* .43* .09 1
Autonomy (5) .07 .30* .44* .15* 1
Belief in continuing education (6) .21* .40* .07 .26* .30* 1
*significant at P < 0.05

Model 5 (correlated error model): This model is partially displayed inFigure 3. All factors at time 1 are hypothesized to affect the levels of thefactors at time 2. The arrows pointing from the factors at time 1 to those attime 2 represent this effect. Because the same item was used repeatedlyover time, the uniqueness in each item (e.g., negative worded content orcontent related to money in I25) might have systematic influence on theobserved scores. This might occur because an item may have a specificmeaning other than the underlying factor (25). Therefore, it is necessaryto postulate item-specific factors by allowing correlated errors (twoheaded curved arrows) between the same items at time 1 and time 2, suchas that for I1 at time 1 and time 2. In model 5, the factors at time 1 areintercorrelated. Residual variances of the factors at time 2 are alsointercorrelated.
Model 6 (uncorrelated error model): This model is the same as model5, but there are no correlated errors between pairs of same items at differ-ent times. The test of this model answers the question whether the corre-lated errors or item uniqueness contribute to the model fit. If they are
36 JOURNAL OF PHARMACY TEACHING
I1 I2 I3 I4 I5 I6 I7 I1 I2 I3 I4 I5 I6 I7
Prof orgtime 1
Prof orgtime 2 E1
Pub servtime 1
Pub servtime 2
E2
FIGURE 3. Panel model of professionalism scale
Note:1. In order to simplify the figure, the measurement model and correlated errors are shown for belief in pro-fessional organization only. The complete figure should include measurement model and correlated errorsof all six factors.2. E stands for residual.3. All six factors at time 1 and all six residuals at time 2 are modeled to be correlated. These correlations arerepresented by the double-headed arrows connecting between Prof org and Pub serv. The complete figureshould include the correlation among six factors.

significant, they should be included in the model in order to properly esti-mate the model parameters (such as factor loadings).
Model7 (model with the invarianceof factor loadings): In model7, theequalityconstraints are placedon all factor loadings over time.For exam-ple, the loading from belief in organization to I1 at time 1 is constrained tobe equal to that from belief in organization to I1 at time 2. The test of thismodel answers the question whether items of the scale are measuring thesamesix factors inexactly thesamewayforboth timeorwhether thescalehas the same “meaning” over time. If the factor loadings are notinvariance across time, it is possible that the professionalism in the stu-dents’ view changes during the course of socialization.
Model 8 (model with the invariance of measurement errors): Thismodel is model 7 with an additional equality constraint on all measure-ment error variances over time. For example, the error variance of I1 attime 1 is constrained to be equal to that of I1 at time 2. The model tests ifthescale isaparallelmeasure(havingequal factor loadingsanderrorvari-ances) over time or if the item variances are stable over time.
Data analysis: Responses of the same subjects at time 1 and 2 werelinked.Thecovariancematrixofall itemsat time1and2wasanalyzedus-ing the same procedure as described in study 1. Listwise deletionwas em-ployed to handle the missing data. Multiple indices were used todetermine model fit. Because the tested models are nested, the compara-tive fits were evaluated by chi-square difference tests.
Results and Discussion of Study 2
Three hundred and one students completed both surveys in 1998 and1999. The overall rate of participation was 58% (301/519). Cronbachalphas of the six subscales of the instrument in the second survey were ac-ceptable, ranging from 0.77-0.86.
According to RMSEAs, SRMRs, TLIs and CFIs, models 5-8 had ex-cellent fit to the data (Table 3). The chi-square difference between model5 (with correlated error) and model 6 (without correlated error) indicateda better fit for model 5 (∆χ2 = 252 df = 42, P < 0.001). This suggests thatcorrelated errors between pairs of the same items should be included inthe model to better represent the data. The ∆χ2 between model 5 andmodel 7 (with equality constraints on factor loadings) was non-signifi-cant (∆χ2 = 47 df = 36, P = 0.104). Therefore, all items comprising the sixfactors of professionalism scale were measuring the same facets in ex-actly the same way for both time 1 and time 2. In other words, the subjects
Lerkiatbundit 37

interpreted the content comprising each item in the scale in the same wayacross time. This property is a prerequisite for a valid comparison of thefactor means and the relationship among factors across times.
The difference in chi-square values between model 7 and model 8(model 7 with equality constraints on error variances) was significant(∆χ2 = 106 df = 42, P < 0.001). Therefore, thehypothesis of the invarianceoferrorvariancesmustberejected.Theresult implies that thevariancesofitems of the scale changed over time.
Model7 is considered thebest-fittingmodelbecause its fitwas compa-rable to the model with lowest chi-square (model 5), but having more de-grees of freedom. Therefore, the discussion of factor loadings andrelationships among factors is based on those in model 7. The parameterestimates (such as factor loadings and factor correlation) in the panelmodel (Figure 3) reflect the corrections for random and item specific er-rors and should be more reliable than those from cross-sectional modelssuch as those in study 1(26). All factor loadings at time 1 and time 2 weresignificant and showed the same pattern as those in the study 1 (similar toTable 2). Standardized factor loadings ranged from 0.52-0.83 for all but 6items (I15, I25, I29, I30, I31, and I41). These six items had moderate andsignificant loadings ranging from 0.35-0.48. These results imply conver-gent validity of the professionalism scale. The inspection of factor corre-lationsat time1andresidualcorrelationsat time2canassessdiscriminantvalidity (26). At time 1, the correlations among six factors of profession-
38 JOURNAL OF PHARMACY TEACHING
TABLE 3. Goodness-of-fit indices in the analysis of the panel model (N = 301)
Model χ2 a df ∆χ2 ∆df RMSEA(90% CI)
SRMR TLI CFI
Null 30407 3486 - - - - - -
5) Correlated er-rors
4071 3324 - - 0.027(0.024-0.030)
0.061 0.971 0.972
6) Uncorrelated er-rors
4323 3366 252b 42 0.030(0.028-0.033)
0.062 0.963 0.964
7) Model 5 withequality constraintson factor loadings
4118 3360 47c 36 0.027(0.024-0.030)
0.063 0.971 0.972
8) Model 7 withequality constraintson error variances
4224 3402 106d 42 0.031(0.028-0.034)
0.063 0.969 0.969
a Maximum likelihood chi-square and P < 0.001b Model 5 as a baseline for calculating ∆χ2, P < 0.001c Model 5 as a baseline for calculating ∆χ2, P = 0.104d Model 7 as a baseline for calculating ∆χ2, P < 0.001

alism showed the same profile as those in study 1 with the significant cor-relations ranging from 0.15-0.43 and the insignificant correlationsranging from 0.05-0.08. For time 2, significant residual correlationsranged from 0.11-0.27, while insignificant correlations were 0.0-0.09.Residual correlations at time 2 also reflect corrections for random andspecific errors (26). Relatively low correlations among factors at time 1and low correlations among residuals at time 2 imply the distinctivenessof six factors or the discriminant validity of the scale.
Finally, it is interesting to examine the relationships of same factorsacross time.Thepathcoefficients fromtime1 to time2 of belief inprofes-sionalorganization,belief inpublic service,belief in self-regulation,pro-fessional commitment, autonomy and belief in continuing educationwere 0.52, 0.43, 0.36, 0.70, 0.44 and 0.50, respectively. The coefficientswere moderate to high, indicating a moderate to strong influence of fac-tors at time 1 to those at time 2. The result suggests studies of factors af-fecting the change of professionalism levels should include the previouslevels of professionalism as predictors, or the results may be biased be-cause of misspecification or error of omitting important independentvariables from the model.
STUDY 3
Objectives: (1) To cross-validate results from study 1 with an inde-pendent sample, i.e., to test whether the better fit of model 1, compared tothose of the other models (models 2-4) is replicate in another sample, and(2) To determine the invariance of the professionalism scale in an inde-pendent sample.
Subjects and data collection: A new group of pharmacy students(Classesof2004-2009)at thePrinceofSongklaUniversitycompletedtheprofessionalism scale in 2004 with the same procedures described instudy 1. The subjects in study 3 did not overlap with those in studies 1 and2. The data is referred to as the “2004 sample.”
Model specification: In the cross-validation study, factor structures asspecified in models 1-4 (in study 1) were tested using the “2004 sample”as a validation sample. In the study of invariance of the scale (the secondobjectiveof this study), the covariancematricesamong items from “1998sample” and “2004 sample” were analyzed simultaneously using themulti-group technique (24). Four models with increasingly restrictiveconstraints (models 9-12) were compared.
Lerkiatbundit 39

Model 9 (no constraint): This model is the six-correlated factor model(model 1) with no equality constraints of parameter imposed.
Model 10 (with the constraint of factor loadings): This model is model9 with factor loadings across two samples constrained to be equal. Themodel tests whether the patterns of factor loadings are equivalent acrossthe samples.
Model 11 (model 10 with an additional equality constraint on errorvariances): This model tests if error variances of items are equivalentacross the samples. If the model fits well, it implies the equality of itemvariances across samples.
Model 12 (model 10 with an additional constraint on factor variancesand covariances): This model tests if factor variances and the relation-shipamongsixfactorsofprofessionalismareequivalentacrossgroups.
Data analysis: For the cross-validation study (the first objective), aCross-Validation Index (CVI) was calculated by LISREL v 8.54 (17) todetermine which model from study 1 replicates best for the “2004 sam-ple.” For each model in study 1, a reconstructed covariance matrix wascalculatedfromparameterestimatesof themodel.TheCVI is thedistancebetween the reconstructed covariance matrix in the calibration sample(1998 sample) and observed covariance matrix in the validation sample(2004 sample). The model that best replicates the validation sample is theone with the lowest CVI value (27). For the test of scale invariance acrosssamples (the second objective), the same procedures as those in study 2were used for model comparison.
Results and Discussion of Study 3
Of 622 pharmacy students surveyed in 2004, 509 (81.8%) completedthe survey. Response rates ranged from 70.0% for second-year studentsto 89.1% for fifth-year students. Listwise deletion for handling missingdata reduced the sample size to 486 (Table 4). The age of the participantsranged from 18 to 23 years. Approximately 71% of the subjects were fe-male. Cronbach alphas of the six subscales of professionalism were ac-ceptable, ranging from 0.72-0.86.
Cross-Validation Indices (CVI) of models 1-4 were 5.81, 6.63, 12.98and 5.91, respectively, suggesting that model 1 (six-correlated factormodel) had the highest degree of replicability across samples. Therefore,results fromstudy1werewellcross-validatedwiththe“2004sample.”
Thesix-correlatedfactormodelseemedtobe thebestmodeloverall forrepresenting the factor structure underlying the professionalism scale fortwo reasons. First, it showed the lowest CVI in study 3. Second, it had an
40 JOURNAL OF PHARMACY TEACHING

acceptable fit to the data and its fit was better than those of the competingmodels (models 2-4) as indicated in study 1 by RMSEA, SRMR, TLI CFIand chi-square difference test (Table 1).
For the test of scale invariance across samples, four competing modelsshowed an acceptable fit to the data with RMSEA and its upper bound of90%CIclose to0.05, andSRMRless than0.08.TLIandCFIofallmodelswere slightly lower than 0.95 (Table 4). In model 9, all parameter esti-mates were allowed to be different across samples. In model 10, factorloadings were constrained to be equal across samples. The difference inchi-squarevaluesbetweenmodels9and10wasnon-significant (∆χ2 =46df = 36, P = 0.122), suggesting that the fit of two models was comparable.The model with a higher degree of freedom (or the simplest model, model10) was chosen for parsimony reason. The result supports the hypothesisof an invariant pattern of factor loadings. In other words, all items of thescale operated in the same way for both groups. This property of the scaleis essential for making valid comparison of scores across groups. If factorloadings are not invariant, it is not appropriate to compare the scoresacross groups.
Thecomparisonofmodels10and11showedasignificantdifferenceinchi-square (∆χ2 = 296 df = 42, P < 0.001), suggesting difference of vari-
Lerkiatbundit 41
TABLE 4. Multiple group analysis of the professionalism scale: 1998 sample(N = 464) and 2004 sample (N = 486)
Model χ2 a df ∆χ2 ∆df RMSEAd
(90% CI)SRMRe TLId CFId
Null 36989 1722 - - - - - -
9) No constraint 3545 1608 - - 0.050(0.048-0.052)
0.0560.044
0.941
0.945
10) Constrain allloadings
3591 1644 46b 36 0.050(0.048-0.052)
0.0580.070
0.942
0.945
11) Model 10 withconstrains on errorvariances
3887 1686 296c 42 0.052(0.050-0.054)
0.0620.072
0.936
0.938
12) Model 10 withconstraints on factorvariances andcovariances
3657 1665 66c 21 0.050(0.048-0.052)
0.0640.077
0.942
0.944
a Maximum likelihood chi-square and P < 0.001b Model 9 as a baseline for calculating ∆χ2, P = 0.122c Model 10 as a baseline for calculating ∆χ2, P < 0.001d RMSEAs, CFIs and TLIs are pooled for two samples.e The first and second numbers are SRMRs in the 1998 sample and the 2004 sample, respectively.

ances and error variances of the scale items across samples. Thechi-square difference between models 10 and 12 was significant (∆χ2 =66 df = 21, P < 0.001). This result suggests the difference of factor vari-ances and covariances across samples. These findings were not unex-pected. It is very likely that different samples have different variances inscale items and different variances of factors. The difference of the rela-tionship among factors (factor covariances) may result from the changesof curriculum and professional environments between 1998 and 2004.Such changes included the mandatory continuing education for Thaipharmacists in2002, theadventofPharmDprogramat theschool in2002,the compulsory license examination for new pharmacy graduates in2003, and theannulmentof the requirement for new graduates towork forthe government for two years. Additionally, the increasinglyvisible rolesof the Thai Pharmacy Council since 1998 may contribute to the highercorrelationofbelief inpharmacyorganizationandbelief inpublic servicein the 2004 sample (factor correlation was 0.29 in the 1998 sample and0.46 in 2004 sample). Even though there have been many changes in Thaipharmacy, thesubjects in the1998and2004samples interpretedtheitemsin thescale in thesamewayas indicatedby the invariancepatternof factorloadings.
STUDY 4
Objective: To determine whether the scale items measure profession-alism in the same way for upperclassmen and newer students. Social-ization processes may change the meaning or conceptualization of pro-fessionalism. However, it is also possible that socialization changes onlythe ‘quantity’ of professionalism (i.e., students become more profes-sional, but their conceptualization of professionalism remains un-changed).The invarianceof thescaleamongmoreadvancedstudentsandstudents in the early years of their education provides evidence support-ing the hypothesis that pharmacy socialization does not change the con-ceptualization of professionalism as measured by the scale.
Subjects and data collection: Data from the 1998 and 2004 sampleswere used in this study. Two data sets were not pooled because it was evi-dent instudy3 that itemvariancesandfactorcovariancesbetween the twosamples were different. Each data set generated two covariance matricesamong scale items, one for the newer students (students in their first, sec-ond and third years) and the other for the upperclassmen (fourth- and
42 JOURNAL OF PHARMACY TEACHING

fifth-year students). The data of the fourth- and fifth-year students werepooled into thesamegroupbecause,comparedto thenewerstudents, theyhad more formal exposure to pharmacy practice through the externshipand profession-related coursework.
Model specification: The covariance matrices generated from “1998sample” and “2004 sample” were analyzed using the multi-group tech-nique (24). Four competing models with increasingly restrictive con-straints (models 13-16) were tested.
Model 13 (no constraint): This model is the six-correlated factormodel (model 1) without the equality constraints of parameters.
Model 14 (with the constraint of factor loadings): This model is model13 with factor loadings for upperclassmen and newer students con-strained to be equal.
Model 15 (model 14 with an additional equality constraint on errorvariances)
Model 16 (model 14 with an additional constraint on factor variancesand covariances)
Data analysis: The test of scale invariance between upperclassmennewer students was done separately for “1998 sample” and “2004 sam-ple.” The same procedures as those described for study 2 were used formodel comparison.
Results and Discussion of Study 4
The results of the multi-group analysis based on the 1998 sample are inTable 5. For models 13-16, RMSEAs and their upper bounds were closeto 0.05. SRMRs were lower than 0.08 for all models except for that of theupperclassmen in model 15. TLIs and CFIs for all models were slightlylower than 0.95 (Table 5). Therefore, all models except for model 15 ap-peared to have a satisfactory fit.
The difference in chi-square between models 13 and 14 was non-sig-nificant (∆χ2 = 47 df = 36, P = 0.104). The result suggests that the patternof factor loadings was invariant across the groups of students, meaningthat they interpreted scale items in the same way. As a result, scores fromupperclassmen and newer students could be compared.
The error variances among items for the upperclassmen sample weredifferent from those in the newer students sample as indicated by the sig-nificant chi-square difference between models 14 and 15 (∆χ2 = 106 df =42, P < 0.001). The factor variances and covariances between the studentgroupswerenotsignificantlydifferent (∆χ2 ofmodels14-16=21,df=21,
Lerkiatbundit 43
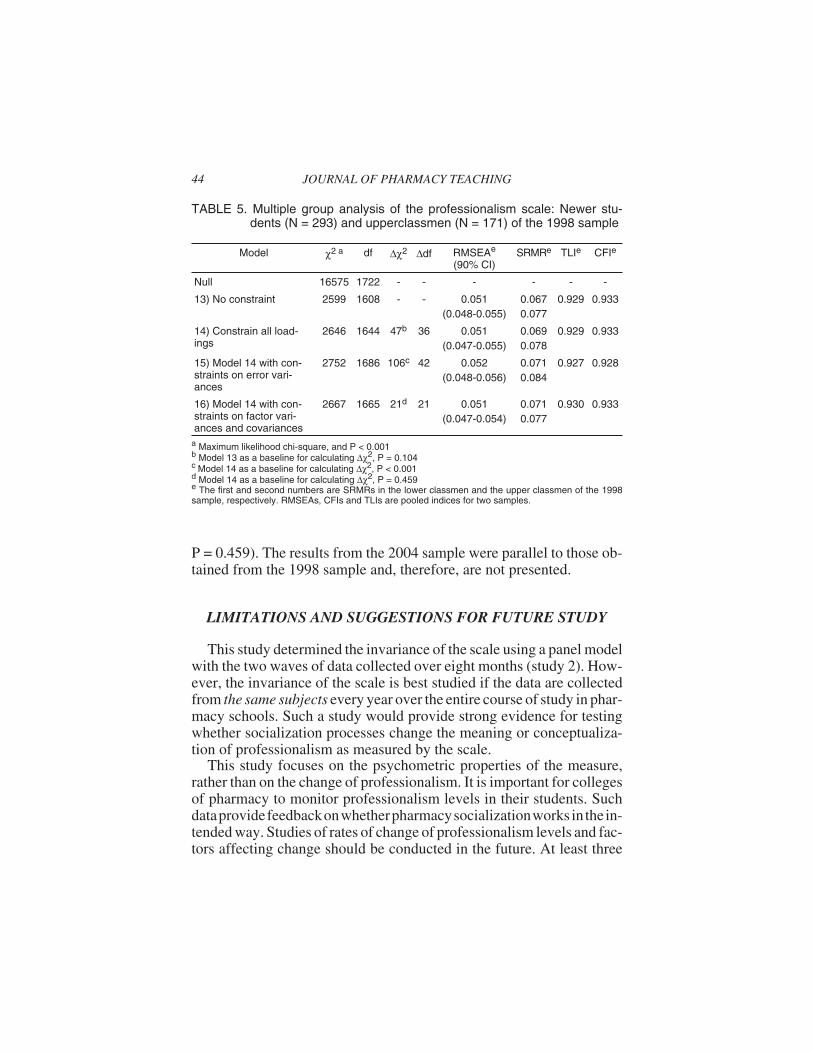
P = 0.459). The results from the 2004 sample were parallel to those ob-tained from the 1998 sample and, therefore, are not presented.
LIMITATIONS AND SUGGESTIONS FOR FUTURE STUDY
This study determined the invariance of the scale using a panel modelwith the two waves of data collected over eight months (study 2). How-ever, the invariance of the scale is best studied if the data are collectedfrom the same subjects every year over the entire course of study in phar-macy schools. Such a study would provide strong evidence for testingwhether socialization processes change the meaning or conceptualiza-tion of professionalism as measured by the scale.
This study focuses on the psychometric properties of the measure,rather than on the change of professionalism. It is important for collegesof pharmacy to monitor professionalism levels in their students. Suchdataprovidefeedbackonwhetherpharmacysocializationworks in the in-tended way. Studies of rates of change of professionalism levels and fac-tors affecting change should be conducted in the future. At least three
44 JOURNAL OF PHARMACY TEACHING
TABLE 5. Multiple group analysis of the professionalism scale: Newer stu-dents (N = 293) and upperclassmen (N = 171) of the 1998 sample
Model χ2 a df ∆χ2 ∆df RMSEAe
(90% CI)SRMRe TLIe CFIe
Null 16575 1722 - - - - - -
13) No constraint 2599 1608 - - 0.051(0.048-0.055)
0.0670.077
0.929 0.933
14) Constrain all load-ings
2646 1644 47b 36 0.051(0.047-0.055)
0.0690.078
0.929 0.933
15) Model 14 with con-straints on error vari-ances
2752 1686 106c 42 0.052(0.048-0.056)
0.0710.084
0.927 0.928
16) Model 14 with con-straints on factor vari-ances and covariances
2667 1665 21d 21 0.051(0.047-0.054)
0.0710.077
0.930 0.933
a Maximum likelihood chi-square, and P < 0.001b Model 13 as a baseline for calculating ∆χ2, P = 0.104c Model 14 as a baseline for calculating ∆χ2, P < 0.001d Model 14 as a baseline for calculating ∆χ2, P = 0.459e The first and second numbers are SRMRs in the lower classmen and the upper classmen of the 1998sample, respectively. RMSEAs, CFIs and TLIs are pooled indices for two samples.

waves of data should be collected in order to be able to take advantage ofan advanced technique like latent growth curve modeling (28).
Psychometric properties of the scale were investigated with the stu-dents in one school of pharmacy in Thailand. A topic for future researchcouldbe thestudyof scaleproperties in thestudentsat theother schoolsofpharmacy, or pharmacists in Thailand or in other cultures or countries.Another interesting question is whether the conceptualization of profes-sionalism changes once a pharmacist enters practice. Similar evidence aspresented in this study is needed before comparing professionalismscores of pharmacists and pharmacy students.
It was surprising to find recent studies that used the Hall-Snizek scale(29-30) whichhas beencriticizedfor itsvalidity (2). Thecontentof theat-titudinalprofessionalismscale in thisstudyis relativelygenericandcouldbe easily modified for using in the other health professionals. However,the psychometric properties of the scale should be examined before theintensive use in other professions.
Thenumberof items in this scale is42,which is considered large, espe-ciallywhen this scale is administeredwith other scales. A short version ofthis scale isneeded to reduce theburdenof subjectsand improveresponserates.
CONCLUSION
The study tested the factor structure of an attitudinal professionalismscale, which was modified by Lerkiatbundit from the Schack-HeplerscaleandBlau’sProfessionalCommitmentscale (12).Thesix-correlatedfactor model better described the structure underlying the scale than thesix-uncorrelated factor model, the one factor model or the second orderfactormodel.Thesix-correlatedfactormodelwasalso themodelwith thehighest degree of replicability across samples.
The scale exhibited good psychometric properties. Reliabilities of thesix subscales were greater than 0.70 for all samples. The relatively highfactor loadings imply the convergent validity of the scale. The low tomoderatecorrelationsamongsixfactorssuggest thediscriminantvalidityof thescale.Subjects interpreted thecontentofeachscale itemin thesameway over time and across groups of subjects (1998 and 2004 samples),andclasses(upperclassmenandnewerstudents).Thisstudyprovidesevi-dence regarding the validity for the comparison of factor means and therelationship of factors over time and across classes. The results from the
Lerkiatbundit 45

study support the use of this scale for monitoring the change ofprofessionalism levels in pharmacy students.
Received: August 28, 2004Reviewed: January 18, 2005
Revised: April 29, 2005Accepted: July 15, 2005
REFERENCES
1. Hammer DP, Berger BA, Beardsley RS, Easton MR. Student professionalism.Am J Pharm Educ 2003; 67:96-125.
2. Schack DW, Hepler CD. Modification of Hall’s professionalism scale for usewith pharmacists. Am J Pharm Educ 1979; 43:98-104.
3. Hammer DP, Mason HL, Chalmers RK, Popovich NG, Rupp MT. Developmentand testing of an instrument to assess behavioral professionalism of pharmacy stu-dents. Am J Pharm Educ 2000; 64:141-51.
4. Hall RH. Professionalism and bureaucratization. Am Sociol Rev 1968; 63:92-104.
5. Snizek WE. Hall’s professionalism scale: An empirical reassessment. AmSociol Rev 1972; 37:109-14.
6. Whitmore CK, Hadsall RS. Professionalism and activity profile in oncologypharmacy practice. J Soc Adm Pharm 1985; 3:102-11.
7. Segal R, Jacobs E, Funk PA. Professional attitudes of Ohio pharmacists work-ing in three practice settings. Am J Hosp Pharm 1987; 44:795-99.
8. Robers PA. The externship experience: A comparison of externs’ and precep-tors’ beliefs about professionalism. Am J Pharm Educ 1989; 53:24-7.
9. Thomas SG, Beck DE, Janes A. Effect of a continuous community pharmacypractice experiences on student attitudes, motivation and communication skills. Am JPharm Educ 1997; 61:125-31.
10. Rupp MT, Segal R. Confirmatory factor analysis of a professionalism scale inpharmacy. J Soc Adm Pharm 1989; 6:31-8.
11. Lerkiatbundit S. The development of professionalism scale for pharmacy stu-dents. Mahidol J Pharm Sci 1998; 25:17-26.
12. Lerkiatbundit S. Professionalism in Thai pharmacy students. J Soc Adm Pharm2000; 17:51-8.
13. Blau GJ. The measurement and prediction of career commitment. J OccupPsychol 1985; 58:277-87.
14. Rascati KL. Career choice, plans and commitment of pharmacy students. Am JPharm Educ 1989; 53:228-33.
15. Lerkiatbundit S. The effects of pharmacy commitment on the development ofjob satisfaction and organizational commitment. Int J Pharm Pract 2000; 4:260-4.
16. Lerkiatbundit S. Professionalism and motivation to work in pharmacy externs.Thai J Pharm Sci 2000; 24:131-40.
46 JOURNAL OF PHARMACY TEACHING

17. Jöreskog KG, Sörbom D. LISREL 8.52 [Computer software]. Chicago: Scien-tific Software International, 2003.
18. West SG, Finch JF, Curran PJ. Structural equation model with nonnormal vari-ables. In: Structural equation modeling. Concepts, issues, and applications. Hoyle RH,ed. London: Sage, 1995:56-75.
19. Hu LT, Bentler P. Cutoff criteria for fit indexes in covariance structure analysis:Conventional criteria versus new alternatives. Struct Equ Modeling 1999; 6:1-55.
20. Hu LT, Bentler P. Evaluating model fit. In: Structural equation modeling. Con-cepts, issues, and applications. Hoyle RH, ed. London: Sage, 1995:76-99.
21. Browne MW, Cudeck R. Alternative ways of assessing model fit. In: Testingstructural equation models. Bollen KA and Long JS, eds. Beverly Hills, CA: Sage,1992:136-62.
22. Rindskopf D, Rose T. Some theory and applications of confirmatory second-or-der factor analysis. Mul Behav Res 1988; 23:51-67.
23. MacCallum RC, Roznowski M, Necowitz LB. Model modifications in Co-variance structure analysis: The problem of capitalization on chance. Psychol Bull1992; 111:490-504.
24. Byrne BM. Structural equation modeling with LISREL, PRELIS and SIMPLIS:Basic concepts, applications and programming. Mahwah, New Jersey: Erlbaum, 1998:259-86
25. Sörbom D. Detection of correlated errors in longitudinal data. Brit J Math StatPsy 1975; 28:138-51.
26. Bagozzi RP, Yi Y, Nassen KD. Representation of measurement error in market-ing variables: Review of approaches and extension to three facet designs. J Economet-rics. 1999; 89:393-421.
27. Cudeck R, Browne MW. Cross-validation of covariance structures. MultivarBehav Res 1983; 18:147-67.
28. Duncan TE, Duncan SC, Stycker LA, Fuzhong L, Alpert A. An introduction tolatent variable growth curve modeling: Concepts, issues, and applications. Mahwah,NJ: Erlbaum, 1999.
29. Wynd CA. Current factors contributing to professionalism in nursing. J ProfNurs 2003; 19:251-61.
30. Hampton GM, Hampton DL. Relationship of professionalism, rewards, marketorientation and job satisfaction among medical professionals: The case of certifiednurse-midwives. J Bus Res 2004; 57(9):1042-53.
Lerkiatbundit 47

APPENDIX. Professionalism scale (12)
Note: Pleasechoose the answer that matches your level ofagreement. Anyrefer-ence to the professional organization refers to the single organization you mostclosely identify with.
Response items: Strongly disagree (1), Disagree (2), Uncertain or no opinion(3), Agree (4) and Strongly agree (5).
1. My professional organization competently represents my views on pharmacyissues.2. My professional organization plays a major part in promoting the advance-ment of the profession.3. My professional organization provides me with a better understanding of thevalues and belief of my profession.4. I would be willing to use the official statements and standards issued by myprofessional organization as guides to my practice.5. I agree with the pharmacy practice promoted by my professional organiza-tion.6. I am (or intend to become) a member of a professional organization.7. I agree to thestatementsandstandards issuedbyprofessionalorganization.8. If pharmacists fail to instruct patients concerning the proper use of medica-tion, patients probably would be harmed.9. The patient care would suffer without pharmacy services.10. If there were no pharmacists to provide drug information to the physician,patient care would suffer.11. Patient care would be inadequate without pharmacy services.12. The pharmacy profession is essential for the society.13. The pharmacy practices play a major role in patient care.14. The pharmacists can help reduce the irrational drug use.15. The pharmacy profession should be the only one who has an authority to reg-ulate its members.16. Only another pharmacist is qualified to judge the competence of a pharma-cist.17. The pharmacists who violate professional standards should be judged onlyby their pharmacy colleagues.18. The pharmacy profession should be the one who establishes professionalregulation.19. Organizations outside pharmacy should not play a part in judging the phar-macists who violate professional standards.20.Pharmacycolleagues shouldbe theonlyoneswhodetermine thestandard forpharmacy practices.21. Organizations outside pharmacy should not intervene with the self-regula-tion of the pharmacy profession.
48 JOURNAL OF PHARMACY TEACHING

22. If I could pick a different occupation that paid the same amount, I wouldprobably change majors.23. I definitely want a career in pharmacy.24. If I could do it over again, I would still choose the same profession.25. If I had all the money I needed without working. I would continue with mypharmacy education.26. I like theprofessionofpharmacy toowell togiveupmypharmacystudies.27. This is the ideal profession for a life’s work.28. I am disappointed that I ever entered pharmacy school.29. The employer should have the right to change the professional decision of apharmacist.30. The employer should have the right to influence the pharmacy practice be-cause employer is the one who pays salary.31. The employer has no right to place limitations on the professional decisionsof a pharmacist.32. Professional work would result in a more favorable outcome if there is nopressure from the employer.33. Influence of an employer over professional work is not desirable.34. Pharmacists should have a right to exercise professional judgment withoutthe interference from the employer.35. Professional work would probably suffer if pharmacists follow employer’sguidelines for making professional decisions.36.Aftergraduation, Icouldmaintainanacceptable standardofpracticewithouthaving any continuing education activities.37. Continuing education after graduation such as seminars or journal reading isessential for working as a pharmacist.38.Dailypharmacypractice isall thecontinuing education apharmacistneeds.39. After graduation I would not attend continuing education seminars unless itis required for licensing or relicensing.40. Continuing education is of little importance to pharmacy practice.41. If a pharmacist does not have any continuing activities, his/her professionalwork would suffer.42.Aftergraduation, pharmacists should participate incontinuing education ac-tivities.
Items for the use of the professional organization as a major referent: 1-7Items for belief in public service: 8-14Items for belief in self-regulation: 15-21Items for professional commitment: 22-28. These items are the Blau’s profes-sional commitment scale as modified by Rascati (14).Items for belief in autonomy: 29-35.Items for belief in continuing education: 36-42Items needing recoding: 22, 24, 28, 29, 30, 36, 38, 39, 40.
Note: The original scale is in Thai. The English version was translated by the au-thor and has not been validated.
Lerkiatbundit 49