factbook 2013 first half of 2013/2014 - hornbach … · factbook englisch nach q3 2014/2015...
TRANSCRIPT
HO
RN
BAC
H 2
014
Factbook englisch nach Q3 2014/2015
FACTBOOK 2014/2015 9 Months

HO
RN
BAC
H 2
014
2
1877 Foundation
1968 1st DIY store with
garden center
1980 1st DIY megastore
1987 Going public HORNBACH
HOLDING Group
1993 Going public HORNBACH-
Baumarkt Subgroup
1996 Austria
1997 Netherlands
1998 Czech Republic
2001 „Zuckerhut“ Award
2002 Switzerland
2003 Sweden
2004 Slovakia
2004 Emission High Yield bond (6,125%)
2006 HORNBACH wins German
„Handelspreis“
2007 Romania
2007 Lifetime Award for Otmar Hornbach
2008 Retailer of the Year in Germany
2010 Start of Multi-Channel Retailing
2013 Emission Eurobond (3,875%)
HORNBACH HOLDING Group A leading European DIY retailer

HO
RN
BAC
H 2
014
3
Neustadt/Weinstraße
Ordinary shares2 (ISIN DE0006083405)
HORNBACH Familien Treuhand GmbH
100%
voting rights
HORNBACH Baustoff Union GmbH3
Neustadt/Weinstraße
HORNBACH Immobilien AG3
Bornheim
100% 100% 76.4%1
Preference shares1
(ISIN DE0006083439)
Free Float
50% 50%
HORNBACH-Baumarkt-AG3 Bornheim
Ordinary shares1 (ISIN DE0006084403)
Free Float
23.6%
1 listed on the stock exchange (number of shares: 8,000,000 HBH3 / resp. 31,807,000 HBM) 2 not listed (number of shares: 8,000,000 HBH3) 3 plus other subsidiary companies in Germany and abroad
N
ovem
ber
2014
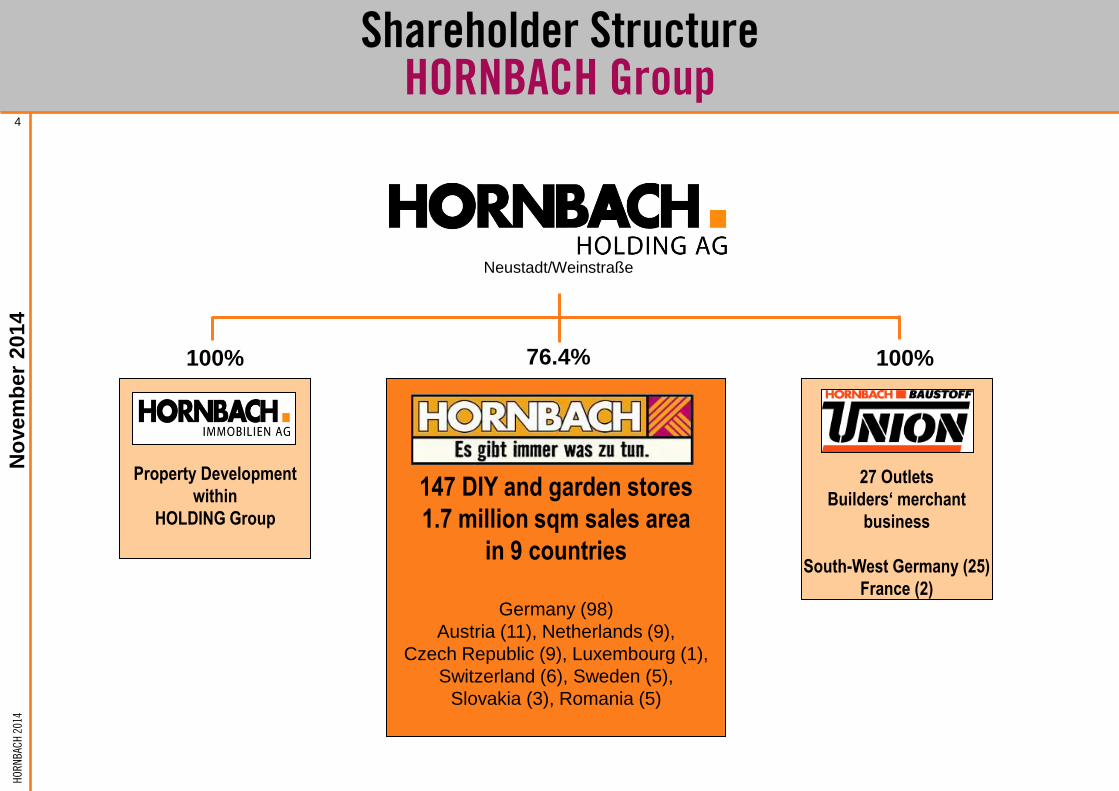
Shareholder Structure
HORNBACH Group
HO
RN
BAC
H 2
014
4
147 DIY and garden stores
1.7 million sqm sales area
in 9 countries
Germany (98)
Austria (11), Netherlands (9),
Czech Republic (9), Luxembourg (1),
Switzerland (6), Sweden (5),
Slovakia (3), Romania (5)
Neustadt/Weinstraße
100% 100% 76.4%
Property Development
within
HOLDING Group
27 Outlets
Builders‘ merchant
business
South-West Germany (25)
France (2)
No
vem
ber
2014
Shareholder Structure
HORNBACH Group

HO
RN
BAC
H 2
014
5
Germany
98 stores
1,043,400 sqm
147 DIY stores
in 9 countries
sales area:
1.7 million sqm
store size:
Ø 11,600 sqm
European Network of HORNBACH Group N
ovem
ber
2014
Netherlands
9 stores
108,700 sqm
Luxembourg
1 store
12,100 sqm
Switzerland
6 stores
78,600 sqm
Austria
11 stores
140,300 sqm
Sweden
5 stores
73,100 sqm
Czech Republic
9 stores
124,700 sqm
Slovakia
3 stores
46,300 sqm
Romania
5 stores
77,500 sqm
25 x
2 x

HO
RN
BAC
H 2
014
6
Sustainable Sales Growth HORNBACH Group
€ 3.37 bn
€ 132 m
19
87
19
88
19
89
19
90
19
91
19
92
19
93
19
94
19
95
19
96
19
97
19
98
19
99
20
00
20
01
20
02
20
03
20
04
20
05
20
06
20
07
20
08
20
09
20
10
20
11
20
12
20
13

HO
RN
BAC
H 2
014
7
0
500
1000
1500
2000
2500
3000
3500
19
93
19
94
19
95
19
96
19
97
19
98
19
99
20
00
20
01
20
02
20
03
20
04
20
05
20
06
20
07
20
08
20
09
20
10
20
11
20
12
20
13
Germany International
Successful International Expansion Key market entries of HORNBACH-Baumarkt-AG Subgroup
FY 2013/2014:
3.15 bn €
A NL
CZ
CH
SE SK
RO
L
32%
68%
42%
58%

HO
RN
BAC
H 2
014
613
1,372
3,924
7,386
12,014
15,712
19
87
19
88
19
89
19
90
19
91
19
92
19
93
19
94
19
95
19
96
19
97
19
98
19
99
20
00
20
01
20
02
20
03
20
04
20
05
20
06
20
07
20
08
20
09
20
10
20
11
20
12
20
13
8
Jobmachine HORNBACH Group* 1987/1988 - 2013/2014
* end of financial year

HO
RN
BAC
H 2
014
9
Market Position – Strategy – Growth Opportunities

HO
RN
BAC
H 2
014
10
1,9932,0142,0802,3202,6073,152
4,572
5,623
13,90013,560
Gro
upe Adeo
Kingfis
herO
BI
Bauhaus
Hornbach
Kesko
Praktik
er
Toom
Zeus/Hageb
au
Mr.
Bric
olage
[Source: Dähne, Company information]
Top Ranking of the European DIY Retailers 2013

HO
RN
BAC
H 2
014
11
1,169
2,0142,0802,320
4,572
5,623
3,152
OBI
Bauhaus
HORNBACH
Praktiker G
roup
Toom/Marktkauf
ZEUS/Hagebau
Globus/Hela
9.9
20.0
12.6
3.96.0
10.4
22.4
OBI
Bau
haus
HO
RNBACH
Prakt
iker
Gro
up
Toom/M
arkt
kauf
Zeus/
Hag
ebau
Glo
bus/Hel
a
Net Sales (Europe): HORNBACH ranks #3 …
…but is #1 in sales per store (€ million) … and sales per sqm (€)
951
1,622
1,008
1,443
1,750
1,345
1,940
OBI
Bauhaus
HO
RNBACH
Praktik
er G
roup
Toom/M
arktk
auf
Zeus/Hag
ebau
Glo
bus/Hel
a
[Source: Dähne, HORNBACH]
Top Ranking of German DIY Retailers 2013

HO
RN
BAC
H 2
014
12
DIY Top 10 Germany 2013 average store size, net sales and sales densities
0
2000
4000
6000
8000
10000
12000
14000
750 1000 1250 1500 1750 2000
avera
ge s
tore
siz
e (
in s
qm
)
Net sales / sqm
OBI
Praktiker/Max Bahr
Bauhaus
HORNBACH
Toom/Marktkauf
Globus/Hela
Zeus/Hagebau
Eurobaustoff
EMV-Profi
Hellweg
Megastore
Bubble size = total net sales (Europe)
[Source: Dähne, HORNBACH; Hellweg incl. Baywa]

HO
RN
BAC
H 2
014
0%
2%
4%
6%
8%
10%
12%
14%
16%
18%
20%
0 2 4 6 8 10 12 14 16 18 20 22 250%
2%
4%
6%
8%
10%
12%
14%
16%
18%
20%
0 2 4 6 8 10 12 14 16 18 20 22 25
0%
2%
4%
6%
8%
10%
12%
14%
16%
18%
20%
0 2 4 6 8 10 12 14 16 18 20 22 25
13
Store portfolio of the largest German DIY players Distribution (%) of sales area by size category
0%
2%
4%
6%
8%
10%
12%
14%
16%
18%
20%
22%
24%
26%
0 2 4 6 8 10 12 14 16 18 20 22 25
0%
2%
4%
6%
8%
10%
12%
14%
16%
18%
20%
22%
24%
26%
0 2 4 6 8 10 12 14 16 18 20 22 250%
2%
4%
6%
8%
10%
12%
14%
16%
18%
20%
22%
24%
26%
0 2 4 6 8 10 12 14 16 18 20 22 25
Source: Dähne (as of end-December 2013) in % of total sales area of DIY player
Stor
e si
ze in
ste
ps
of 1
,00
0 s
qm
HO
RN
BAC
H 2
014
80
85
90
95
100
105
110
115
120
125
1998 1999 2000 2001 2002 2003 2004 2005 2006 2007 2008 2009 2010 2011 2012 2013
19
98
= 1
00%
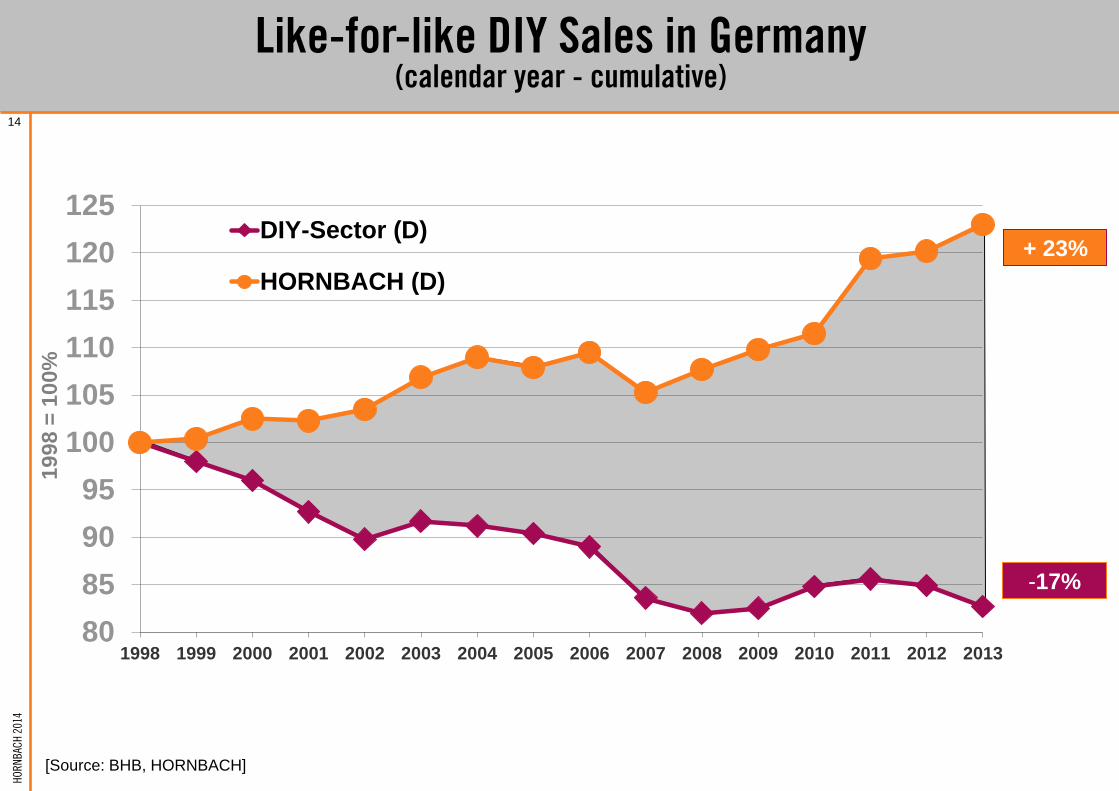
DIY-Sector (D)
HORNBACH (D)
14
-17%
+ 23%
[Source: BHB, HORNBACH]
Like-for-like DIY Sales in Germany (calendar year - cumulative)

HO
RN
BAC
H 2
014
15
Like-for-like Sales DIY in Germany – Calendar Year 2013
dif
fere
nce H
BM
vs.D
IY s
ecto
r in
%
HORNBACH‘s outperformance in the German DIY sector
-2.6
2.3

HO
RN
BAC
H 2
014
16
HORNBACH‘s Market Share in Germany M
ark
et
sh
are
in
% o
f D
IY s
tore
sa
les
4.9 5.3
5.6
6.1
6.7 7.1
7.6 7.7 8.1
8.3 8.5
8.7 8.8 9.2 9.3
10.0
1998 1999 2000 2001 2002 2003 2004 2005 2006 2007 2008 2009 2010 2011 2012 2013
[Source: BHB, HORNBACH]

HO
RN
BAC
H 2
014
17
Our Strategy for the DIY World
Megastore network
& multi-channel retailing
Sophisticated
logistics & IT
Continuing
internationalisation
Outperforming the DIY market &
delivering a unique customer experience
Every-day-
low-price
Project-oriented
services
Superior
product offering
HORNBACH is the top address for DIY projects

HO
RN
BAC
H 2
014
18
Top Position in „Kundenmonitor Deutschland 2014“
Overall Customer Satisfaction
HORNBACH comes top once again, even beating last year‘s results Top position in categories including:
Value for money – Prices compared with competitors – Product selection and variety – Services
Product quality – Up-to-dateness of product range – Private labels – Willingness to repeat purchase
Ranked 1st in 6 of 9 product range disciplines
Overall: 20x 1st position and 7x 2nd position in 35 different categories

HO
RN
BAC
H 2
014
19
“We’re a Project DIY Store”
Partner for project customers
and professionals.
Top quality specialist advice.
Added value with our product range
and service offerings.
Everything in stock.
Making shopping easier.
Unique advertising campaigns.
Every-Day-Low-Price.

HO
RN
BAC
H 2
014
20
High Quality Store Network
Prime locations
Focus on big catchment areas
Large store format
Homogeneous store network
Generates economies of scale
in store operation and store development
Meets customers needs and provides
superior shopping experience

HO
RN
BAC
H 2
014
21
E-business gaining in significance
Since launching its webshop in December 2010, HORNBACH has Germany’s most extensive online range of construction and renovation products.
More than 80,000 articles in the virtual DIY store
Catalyst for EDLP transparency and price awareness
Time-saving: “Reserve online & collect in-store”
Spill-over benefits for our stores
Additionally addressing customers living outside the catchment areas of our stationary stores
International roll-out

HO
RN
BAC
H 2
014
22
Elaborated supply chain management
ensures Europe-wide logistics
Sophisticated merchandise management in
conjunction with our homogeneous store
network
Our logistics system combines direct
supplies to stores and indirect deliveries via
4 logistics centers
Enhanced import possibilities
Group-wide integrated IT and merchandise
systems

HO
RN
BAC
H 2
014
23
4 distribution centers
for the supply of goods throughout Europe Locations of distribution centers
Vilshofen
24,350 sqm
since 2005
Essingen
45,034 sqm
since 1999
Lehrte
37,919 sqm
since 1994
Soltau
22,990 sqm
since 2012

HO
RN
BAC
H 2
014
24
Growth drivers
Cocooning (retreat-to-home lifestyle trend)
New target groups („women-at-work“, Do-it-for-me, seniors)
Increasing need
for renovation (80% of houses/flats > 20 years)
Sustainability and
energy efficiency
International expansion
Strong private labels
Multi-channel retailing
• Insulation of facades
•Replacement of outdated boilers
•Use of rainwater
•FSC timber products

HO
RN
BAC
H 2
014
25
Financial Figures
Financial Year 2013/2014

HO
RN
BAC
H 2
014
26
166 180 202 207
15771641
1729 1741
216
1325127912721195
1109
1827
2009/10 2010/11 2011/12 2012/13 2013/14
HORNBACH Baustoff Union HORNBACH-Baumarkt-AG [International] HORNBACH-Baumarkt-AG [Germany]
+3.5%
+5.0%
+4.3%
+4.1% rounding differences
%chg.
2,853 3,017
3,204 3,229
Constant Growth in Net Sales HORNBACH HOLDING AG Group
3,369

HO
RN
BAC
H 2
014
27
99 105
2012/2013 2013/2014
EBIT
146 160
2012/2013 2013/2014
Margin 4.5% 3.3% 4.8% 3.3%
HORNBACH Group HORNBACH-Baumarkt Subgroup
International Germany
based on International Financial Reporting Standards (IFRS)
70%
30%
65%
35%
+10.0%
+5.8%

HO
RN
BAC
H 2
014
28
85.6
60.3
89.1
71.2
46.4
4.6
99.3
51.1
5.5
105.1
Germany
44%
EBIT
Inter-
national
56%
Germany
60%
Inter-
national
40%
2012/13
2013/14
+4% +18%
Operating Breakdown Geographical Breakdown
EBIT Breakdown HORNBACH Group
EBIT vs. Sales Breakdown FY 2013/2014
Sales
Germany International HBM HBU HI
HBM: HORNBACH-Baumarkt-AG HBU: HORNBACH Baustoff Union HI: HORNBACH Immobilien AG
+6% +18%
+10%

HO
RN
BAC
H 2
014
29
69.8
29.6
68.3
36.742.8
74.2
51.3
71.2
EBIT vs. Sales Breakdown FY 2013/2014
Germany
35%
EBIT Sales
Inter-
national
65%
Germany
58% Inter-
national
42%
2012/13
2013/14
+20%
-4%
+24%
-2%
EBIT Breakdown HORNBACH-Baumarkt Subgroup
Operating Breakdown Geographical Breakdown
Retail Real Estate Germany International

HO
RN
BAC
H 2
014
30
52 56
2012/2013 2013/2014
Group Net Income
77 86
2012/2013 2013/2014
2.4% 1.7% 2.6% 1.8%
+11.3%
+7.7%
HORNBACH Group HORNBACH-Baumarkt Subgroup
Margin
HO
RN
BAC
H 2
014
31
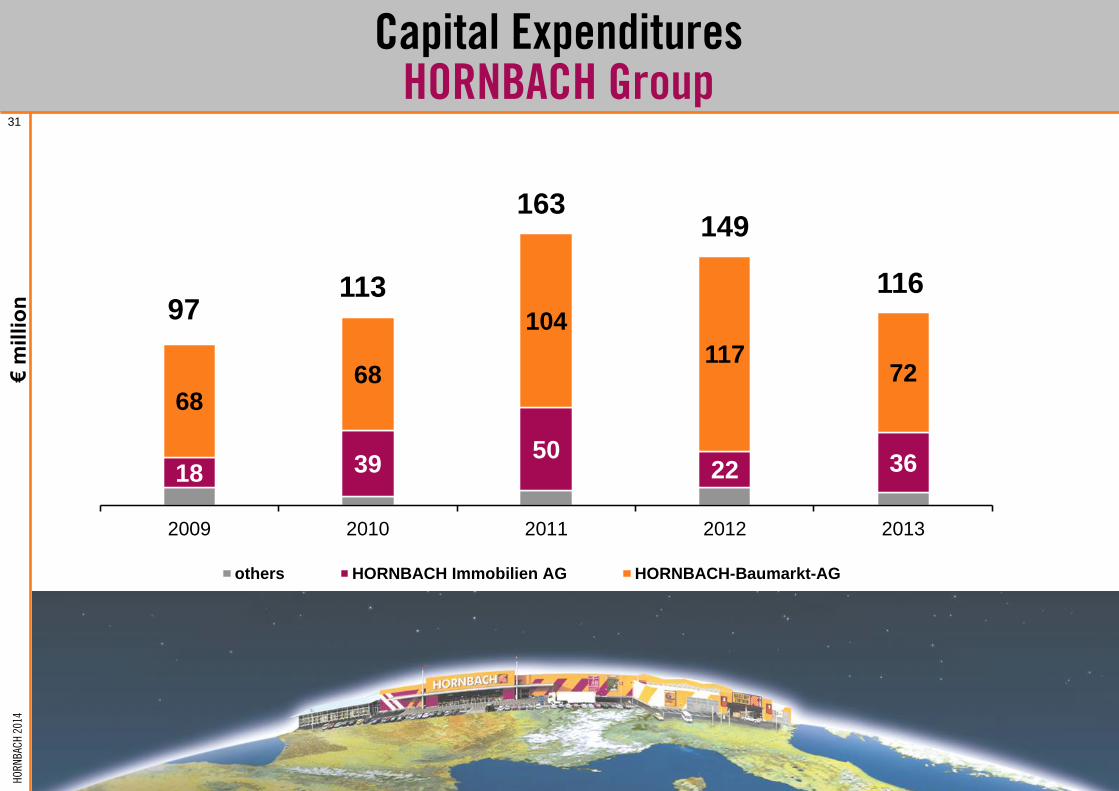
18 39 50
22 36
68 68
104
117 72
2009 2010 2011 2012 2013
others HORNBACH Immobilien AG HORNBACH-Baumarkt-AG
Capital Expenditures HORNBACH Group
Olomouc
97 113
163 149
116

HO
RN
BAC
H 2
014
32
Financial Year 2014/2015
3rd Quarter / 9 Months

HO
RN
BAC
H 2
014
33
892.0 938.6 851.1
1,035.1 940.4
875.8
Q 1 Q 2 Q 3
2013/14
2014/15
Net Sales HORNBACH Group
838.9 873.5 788.1
976.7 878.3
814.9
Q 1 Q 2 Q 3
52.7 64.7 62.5 58.0 61.7 60.5
Q 1 Q 2 Q 3
HORNBACH HOLDING AG Group
HORNBACH-Baumarkt-AG Subgroup HORNBACH Baustoff Union GmbH Subgroup
+ 0.2% + 16.0% + 2.9%
+ 0.5% + 16.4% + 3.4% - 4.6% + 10.1% - 3.2%

HO
RN
BAC
H 2
014
34
+4.8%
+8.2%
2,422
+6.3% 2,582
+0.2%
2,607
Growth in Net Sales – nine months HORNBACH HOLDING Group
2,682
[rounding differences]
2,851
154 172 178 180 180
953 1.025 1.033 1.058 1.109
1,315 1,385 1,395 1,443
1,561
2010/11 2011/12 2012/13 2013/14 2014/15
HORNBACH Baustoff Union HORNBACH-Baumarkt-AG [International] HORNBACH-Baumarkt-AG [Germany]

HO
RN
BAC
H 2
014
35
Like-for-like Sales* HORNBACH-Baumarkt Subgroup
* in constant currencies
FY
2013/14
Q 1
2014/15
Q 2
2014/15
H 1
2014/15
Q 3
2014/15
9 M
2014/15
Total 2.7 14.6 -1.0 6.7 1.0 4.9
Germany 4.9 19.4 -1.0 8.9 1.4 6.5
International -0.1 8.2 -1.0 3.6 0.6 2.6
(Financial Year)

HO
RN
BAC
H 2
014
36
Like-for-like Sales (net)
HORNBACH‘s outperformance in the German DIY sector
-5
0
5
10
Nov Dec Jan 14 Feb Mar Apr May Jun Jul Aug 14 Sep Oct Nov
source: BHB monthly survey dif
fere
nc
e H
BM
vs.D
IY s
ecto
r in
pe
rce
nta
ge p
oin
ts

HO
RN
BAC
H 2
014
37
nine months
€ m
illio
n
based on International Financial Reporting Standards (IFRS)
EBIT HORNBACH HOLDING Group
51.1
87.1
35.3
87.3
65.3
36.5
Q 1 Q 2 Q 3
2013/14
2014/15
+ 70.8% - 25.1% + 3.6%
173.5 189.2
2013/14 2014/15
+ 9.0%

HO
RN
BAC
H 2
014
38
EBIT Breakdown – nine months
HBM: HORNBACH-Baumarkt Subgroup
HBU: HORNBACH Baustoff Union Subgroup
HI: HORNBACH Immobilien Subgroup
€ m
illio
n
128.7
8.6
38.6
141.4
8.7
41.6
HBM HBU HI
2013/14
2014/15
+ 1.6%
+ 9.8%
+ 7.7%
HO
RN
BAC
H 2
014
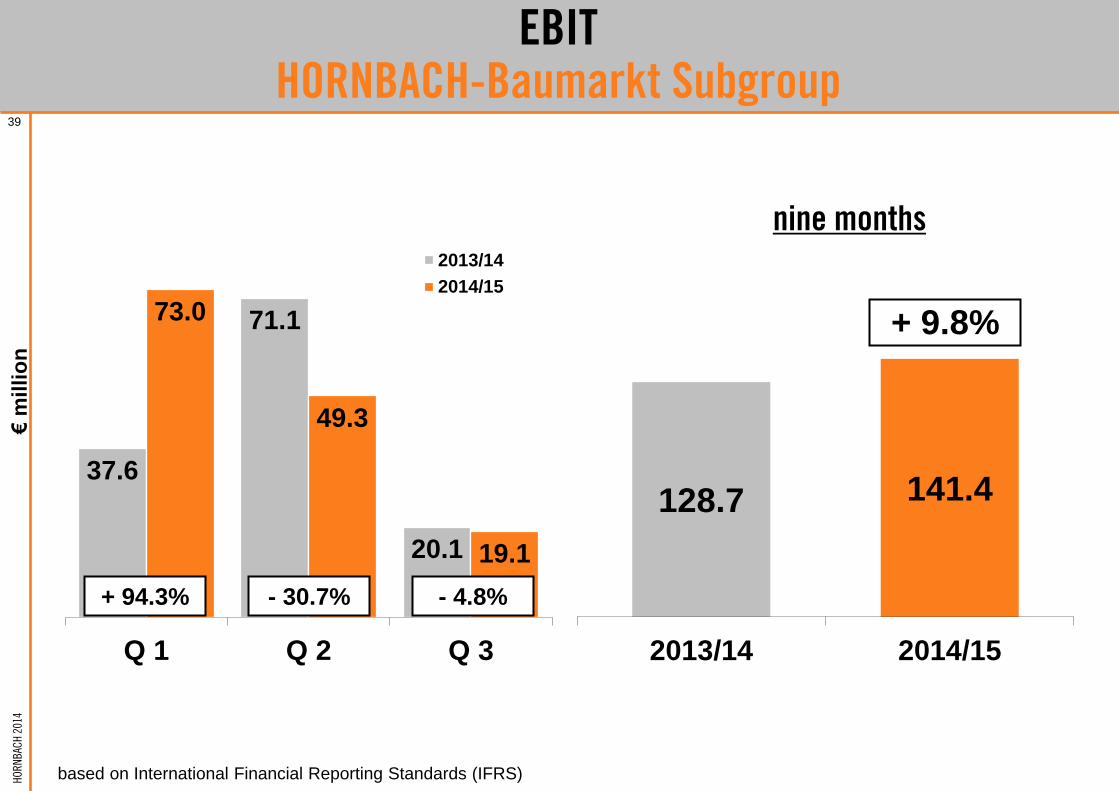
39
128.7 141.4
2013/14 2014/15
37.6
71.1
20.1
73.0
49.3
19.1
Q 1 Q 2 Q 3
2013/14
2014/15
nine months
+ 9.8%
EBIT HORNBACH-Baumarkt Subgroup
+ 94.3% - 30.7% - 4.8%
€ m
illio
n
based on International Financial Reporting Standards (IFRS)

HO
RN
BAC
H 2
014
40
Net Income before Minority Interest
HORNBACH HOLDING Group
nine months
€ m
illio
n
based on International Financial Reporting Standards (IFRS)
105.3 119.0
2013/14 2014/15
31.2
55.2
18.9
55.2
41.8
22.0
Q 1 Q 2 Q 3
2013/14
2014/15 + 13.1%
+ 77.0% - 24.3% + 16.6%

HO
RN
BAC
H 2
014
41
nine months
Net Income HORNBACH-Baumarkt Subgroup
based on International Financial Reporting Standards (IFRS)
79.7 91.7
2013/14 2014/15
23.2
45.7
10.9
47.0
33.5
11.2
Q 1 Q 2 Q 3
2013/14
2014/15
+ 15.0%
+ 102.8% - 26.6% + 2.5%

HO
RN
BAC
H 2
014
42
Cash Flow Statement HORNBACH HOLDING Group
Cash flow statement (abridged) 2014/2015 2013/2014
€ million 9 months 9 months
Cash flow from operating activities 198.0 212.8
of which: funds from operations 171.6 162.8
of which: change in working capital 26.3 50.0
Cash flow from investing activities -86.9 -72.7
Cash flow from financing activities -51.9 -2.7
Cash-effective change in cash and cash equivalents 59.1 137.4
Change in cash and cash equivalents due to changes in
exchange rates -0.2 -0.6
Cash and cash equivalents at March 1 428.8 356.9
Cash and cash equivalents at November 30 487.7 493.8
rounding differences

HO
RN
BAC
H 2
014
43
Cash flow statement (abridged) 2014/2015 2013/2014
€ million 9 months 9 months
Cash flow from operating activities 164.8 176.3
of which: funds from operations 130.7 121.0
of which: change in working capital 34.1 55.3
Cash flow from investing activities -75.9 -46.1
Cash flow from financing activities -36.2 -13.0
Cash-effective change in cash and cash equivalents 52.7 117.1
Change in cash and cash equivalents due to changes in
exchange rates -0.1 -0.4
Cash and cash equivalents at March 1 371.1 317.2
Cash and cash equivalents at November 30 423.7 433.9
Cash Flow Statement HORNBACH-Baumarkt Subgroup
rounding differences

HO
RN
BAC
H 2
014
44
698
1,1641,260
679
520500
49.3%
623
429
1,310 1,337
634
488
2,362 2,459
November 30, 2014 November 30, 2014
51.2%
2,362 2,459
Group Balance Sheet Structure (IFRS) HORNBACH HOLDING Group
ASSETS EQUITY and LIABILITIES
February 28, 2014 February 28, 2014
Total assets
Liquid funds
Inventories,
accounts receivable
and other assets
Non-current assets
Total assets
Shareholders‘ equity
Current liabilities
Non-current liabilities

HO
RN
BAC
H 2
014
45
425
930 862
405
383420
51.6%
740 774
559 557
371424
1,670 1,755 1,670 1,755
53.0%
Group Balance Sheet Structure (IFRS) HORNBACH-Baumarkt Subgroup
ASSETS EQUITY and LIABILITIES
Total assets Total assets
Liquid funds
Inventories,
accounts receivable
and other assets
Non-current assets
Shareholders‘ equity
Current liabilities
Non-current liabilities
February 28, 2014 November 30, 2014 November 30, 2014 February 28, 2014

HO
RN
BAC
H 2
014
46
Gross Margin - nine months
37.2 37.4 37.3 37.2
37.9
36.4 36.5 36.5 36.4
37.2
2010/11 2011/12 2012/13 2013/14 2014/15
HORNBACH-Baumarkt Subgroup HORNBACH HOLDING Group

HO
RN
BAC
H 2
014
47
average earnings per share
Earnings per Share - nine months
5.71 5.90
5.24 5.41
6.09
2.88 3.17
2.58 2.51 2.88
2010/11 2011/12 2012/13 2013/14 2014/15
HORNBACH HOLDING Group HORNBACH-Baumarkt Subgroup

HO
RN
BAC
H 2
014
48
Highlights in the 9-months Earnings 2014/2015 HORNBACH Group
Strong 9-month like-for-like consolidated sales growth,
especially in Germany
Germany +6.5% cumulative
International +2.6% cumulative
Strong E-Business sales growth
8 store openings and 2 closings (replacements)
Gross margin up on previous year
Store expense ratio slightly up on previous year
(renovations, personnel)
Administration expense ratio slightly up on previous year
Pleasing overall performance in 9-month period
Outlook unchanged, but facing strong comp sales
in the 4th quarter

HO
RN
BAC
H 2
014
49
Outlook

HO
RN
BAC
H 2
014
50
Schwabach
Kamen
Ulm
Prag Cestlice
Lübeck
Lüneburg
Trier
Kassel
Saarbrücken
Bad Bzb
Store Openings 2014/2015
Prag Cestlice (CZ)
Lübeck
Trier (replacement)
Schwabach
Bad Bergzabern
Ulm
Lüneburg
Kamen
Kassel (conversion), June 2015
Saarbrücken (replacement),
August 2015

HO
RN
BAC
H 2
014
51
Financial Calendar 2015
March 24, 2015 Trading Statement for the 2014/2015 Financial Year May 28, 2015 Publication of Annual Report 2014/2015 and DVFA Analyst‘s Conference of HORNBACH-Baumarkt-AG June 26, 2015 Interim Report 1st Quarter 2015/2016 as of May 31, 2015 Annual General Meeting July 8, 2015 HORNBACH-Baumarkt-AG July 9, 2015 HORNBACH HOLDING AG September 29, 2015 Half-Year Financial Report 2015/2016 as of August 31, 2015 DVFA Analyst’s Conference of HORNBACH HOLDING AG
HO
RN
BAC
H 2
014
52
Opening Kamen October 2014
DISCLAIMER
This presentation is to be read in the context of the audited financial data of the HORNBACH HOLDING AG Group and the disclosures made in the notes to the
consolidated financial statements contained in the annual report. It contains statements relating to the future based on assumptions and estimates made by
HORNBACH’s Board of Management. Forward-looking statements are only valid at the time at which they are made. Although we assume that the expectations
reflected in these forecast statements are realistic, the company can provide no guarantee that these expectations will turn out to be accurate. The
assumptions may involve risks and uncertainties which could result in actual events differing significantly from the forecast statements. Such factors include
those discussed in the “Risk Report” and “Outlook” of the annual report. We do not assume any obligation to update the forward-looking statements
contained in this presentation.