fact book q3/2017 - nykredit · head of investor relations chief investor relations manager ......
TRANSCRIPT
Fact Book Q3/2017The Nykredit Group
Unaudited
Table of contents
Group chart 3 Write-offs 37
Contacts and other information 4 Bank lending 38
The Nykredit Group history 5 Loans, advances and guarantees 38
Rating 6 Provisions 39
Market share 7 Non-performing loans (NPL) 40
The Nykredit Group 8 Market value derivatives 40
Results 8 Weak customers and non-performing loans (NPL) – mortgage lending 41
Balance sheet summary 9 Business areas 42
Lending and deposits 11 Income – business areas 43
Breakdown of income 12 Retail 44
Breakdown of costs 13 Totalkredit Partners 45
The Nykredit Realkredit Group 14 Wholesale clients 46
Results 14 Wealth Management 47
Balance sheet summary 15 Group items 48
The Nykredit Bank Group 16 The Danish economy 49
Results 16 Regional housing prices 49
Balance sheet summary 17 Key figures 50
Key figures and ratios 18 Covered Bond Investor Report - the Nykredit Realkredit Group 51
Key figures and financial ratios 18 Overview 52
Risk weights and capital ratios - the Nykredit Group 19 Concepts and calculations 54
CET1, MDA and ADI 20 Mortgage lending 55
Bond portfolio 21 Current LTV 65
Mortgage lending 22 LTV owner-occupied dwellings 68
Mortgage lending by property type 22 Appendix 70
Mortgage lending by geography 24 Corporate structure 71
Mortgage lending by loan and interest type 26 Capital requirements and leverage ratio 72
Arrears 27 Own funds 73
Geographical distribution of arrears 28 Credit exposure 74
Repossessed properties and forced sales 29 Credit exposure by rating 75
Risk relating to mortgage lending 30 Risk weights by rating 76
LTV 32 Loss given default (LGD) by rating 77
Expiry of interest-only period 33 Conversion factor (CF) by rating 78
Impairment provisions and write-offs 34 Unutilised commitments by rating 79
Impairment provisions and charges 34 Definitions 80
Geographical distribution of write-offs 36
Fact Book Q3/2017 - The Nykredit Group 2/80
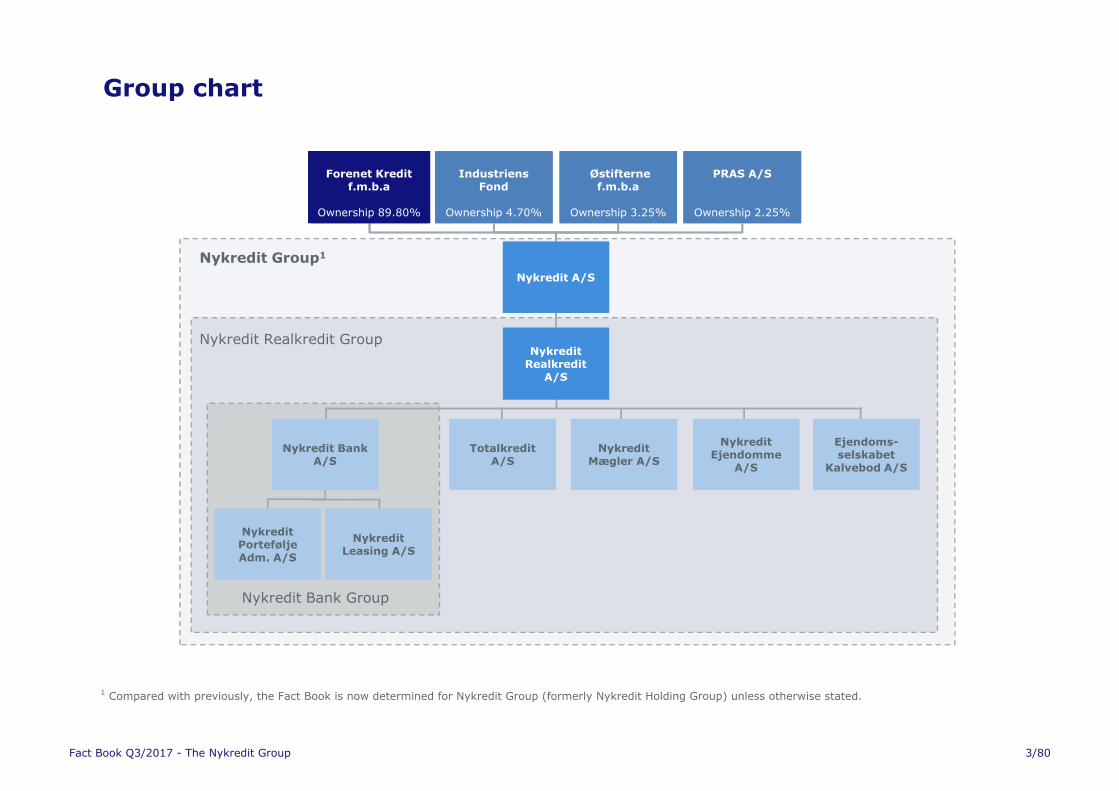
Group chart
1 Compared with previously, the Fact Book is now determined for Nykredit Group (formerly Nykredit Holding Group) unless otherwise stated.
Foreningen Nykredit
Ownership 89.80%
Industriens Fond
Ownership 4.70%
Foreningen Østifterne
Ownership 3.25%
PRAS A/S
Ownership 2.25%
Nykredit Holding
A/S
Nykredit Realkredit
A/S
Nykredit Realkredit Group
Forenet Kreditf.m.b.a
Ownership 89.80%
Industriens Fond
Ownership 4.70%
Østifterne f.m.b.a
Ownership 3.25%
PRAS A/S
Ownership 2.25%
Nykredit A/S
Nykredit Realkredit Group
Nykredit Group1
Nykredit Bank Group
Nykredit Portefølje Adm. A/S
Totalkredit A/S
Nykredit Bank A/S
Nykredit Mægler A/S
Nykredit Ejendomme
A/S
Ejendoms-selskabet
Kalvebod A/S
Nykredit Realkredit
A/S
Nykredit Leasing A/S
Fact Book Q3/2017 - The Nykredit Group 3/80
Contacts and other information
Morten Bækmand Nielsen Erik Holbek
Head of Investor Relations Chief Investor Relations Manager
Tel: +45 44 55 15 21 Tel: +45 44 55 49 87
Mobile: +45 23 39 41 68 Mobile: +45 22 22 20 94
E-mail: [email protected] E-mail: [email protected]
Our investor website www.nykredit.com/ir contains:
� General information
� Press releases
� Financial and CSR reports
� Risk and capital reports
� Bond data
� Prospectuses
� Publications on markets
� Cover pool data
Fact Book Q3/2017 - The Nykredit Group 4/80
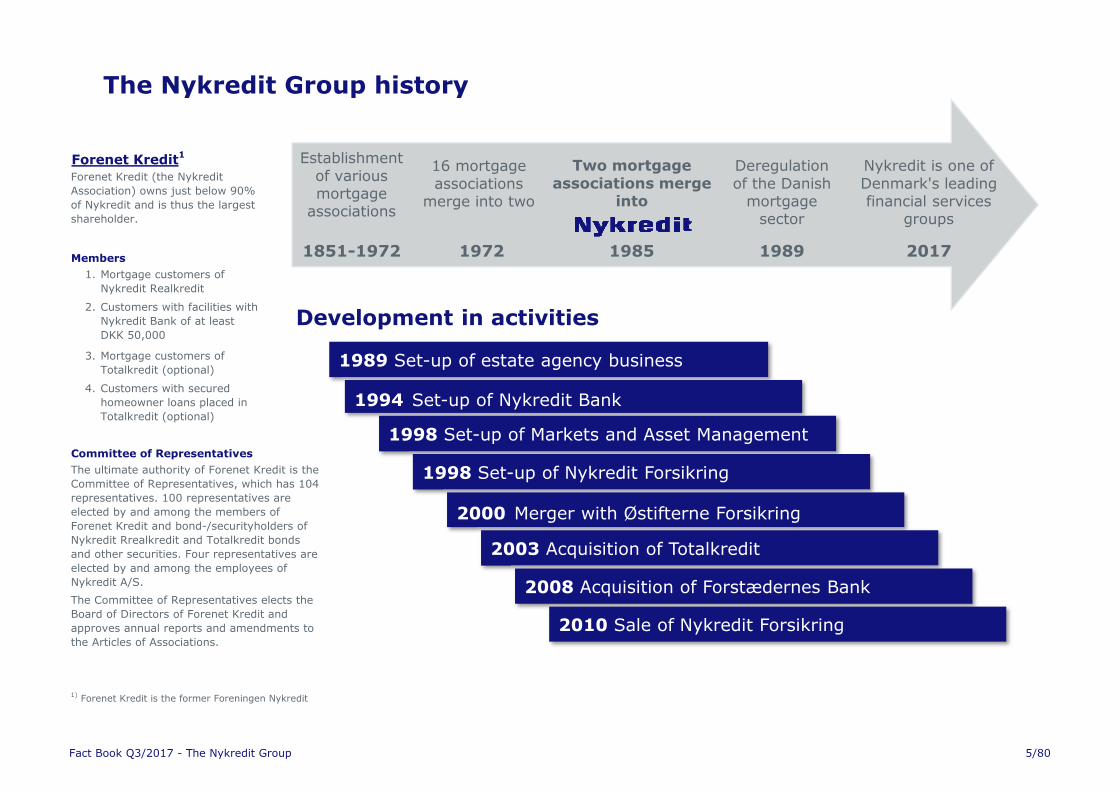
The Nykredit Group history
Forenet Kredit1
1.
2.
3.
4.
Committee of Representatives
1) Forenet Kredit is the former Foreningen Nykredit
The Committee of Representatives elects the
Board of Directors of Forenet Kredit and
approves annual reports and amendments to
the Articles of Associations.
Mortgage customers of
Totalkredit (optional)
Customers with secured
homeowner loans placed in
Totalkredit (optional)
Forenet Kredit (the Nykredit
Association) owns just below 90%
of Nykredit and is thus the largest
shareholder.
Members
Mortgage customers of
Nykredit Realkredit
Customers with facilities with
Nykredit Bank of at least
DKK 50,000
The ultimate authority of Forenet Kredit is the
Committee of Representatives, which has 104
representatives. 100 representatives are
elected by and among the members of
Forenet Kredit and bond-/securityholders of
Nykredit Rrealkredit and Totalkredit bonds
and other securities. Four representatives are
elected by and among the employees of
Nykredit A/S.
1972
16 mortgage associations
merge into two
1851-1972
Establishment of various mortgage
associations
1985
Two mortgage associations merge
into
1989
Deregulation of the Danish
mortgage sector
2017
Nykredit is one of Denmark's leading financial services
groups
Development in activities
1989 Set-up of estate agency business
1994 Set-up of Nykredit Bank
1998 Set-up of Markets and Asset Management
1998 Set-up of Nykredit Forsikring
2000 Merger with Østifterne Forsikring
2003 Acquisition of Totalkredit
2008 Acquisition of Forstædernes Bank
2010 Sale of Nykredit Forsikring
Fact Book Q3/2017 - The Nykredit Group 5/80
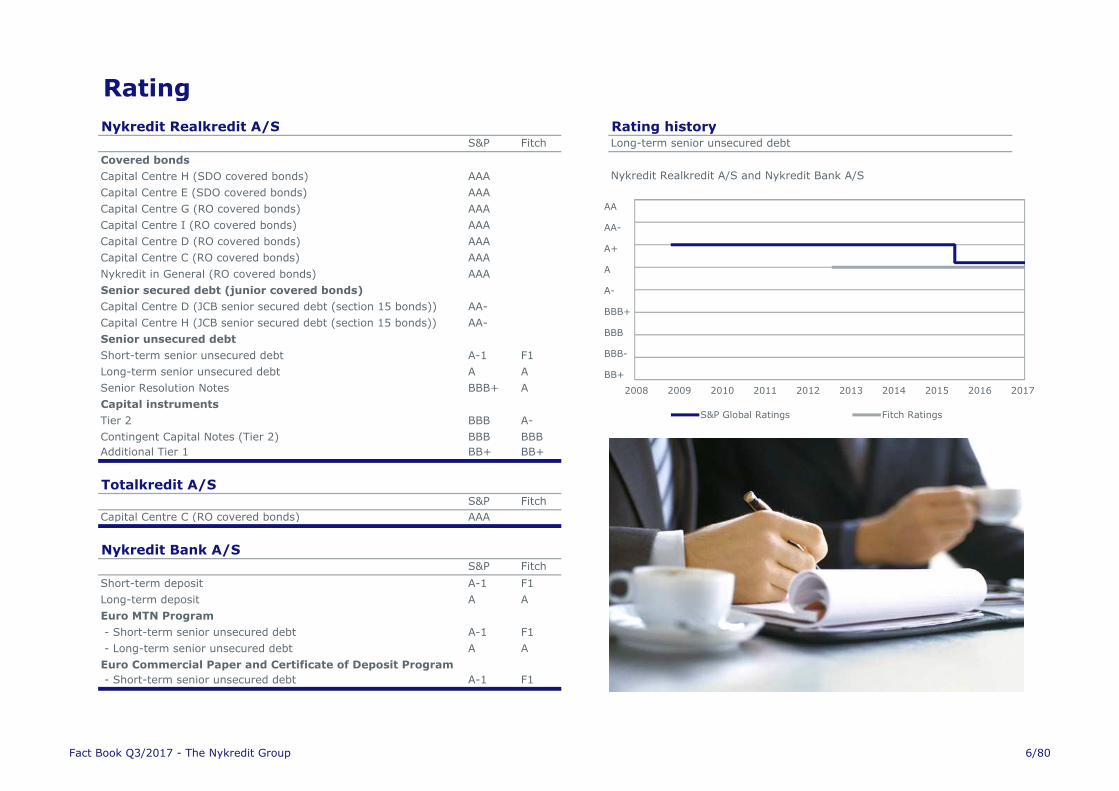
Rating
Nykredit Realkredit A/S Rating historyS&P Fitch
Covered bonds
Capital Centre H (SDO covered bonds) AAA
Capital Centre E (SDO covered bonds) AAA
Capital Centre G (RO covered bonds) AAA
Capital Centre I (RO covered bonds) AAA
Capital Centre D (RO covered bonds) AAA
Capital Centre C (RO covered bonds) AAA
Nykredit in General (RO covered bonds) AAA
Senior secured debt (junior covered bonds)
Capital Centre D (JCB senior secured debt (section 15 bonds)) AA-
Capital Centre H (JCB senior secured debt (section 15 bonds)) AA-
Senior unsecured debt
Short-term senior unsecured debt A-1 F1
Long-term senior unsecured debt A A
Senior Resolution Notes BBB+ A
Capital instruments
Tier 2 BBB A-
Contingent Capital Notes (Tier 2) BBB BBB
Additional Tier 1 BB+ BB+
Totalkredit A/SS&P Fitch
Capital Centre C (RO covered bonds) AAA
Nykredit Bank A/SS&P Fitch
Short-term deposit A-1 F1
Long-term deposit A A
Euro MTN Program
- Short-term senior unsecured debt A-1 F1
- Long-term senior unsecured debt A A
Euro Commercial Paper and Certificate of Deposit Program
- Short-term senior unsecured debt A-1 F1
Long-term senior unsecured debt
Nykredit Realkredit A/S and Nykredit Bank A/S
2008 2009 2010 2011 2012 2013 2014 2015 2016 2017
S&P Global Ratings Fitch Ratings
AA
AA-
A+
A
A-
BBB+
BBB
BBB-
BB+
Fact Book Q3/2017 - The Nykredit Group 6/80
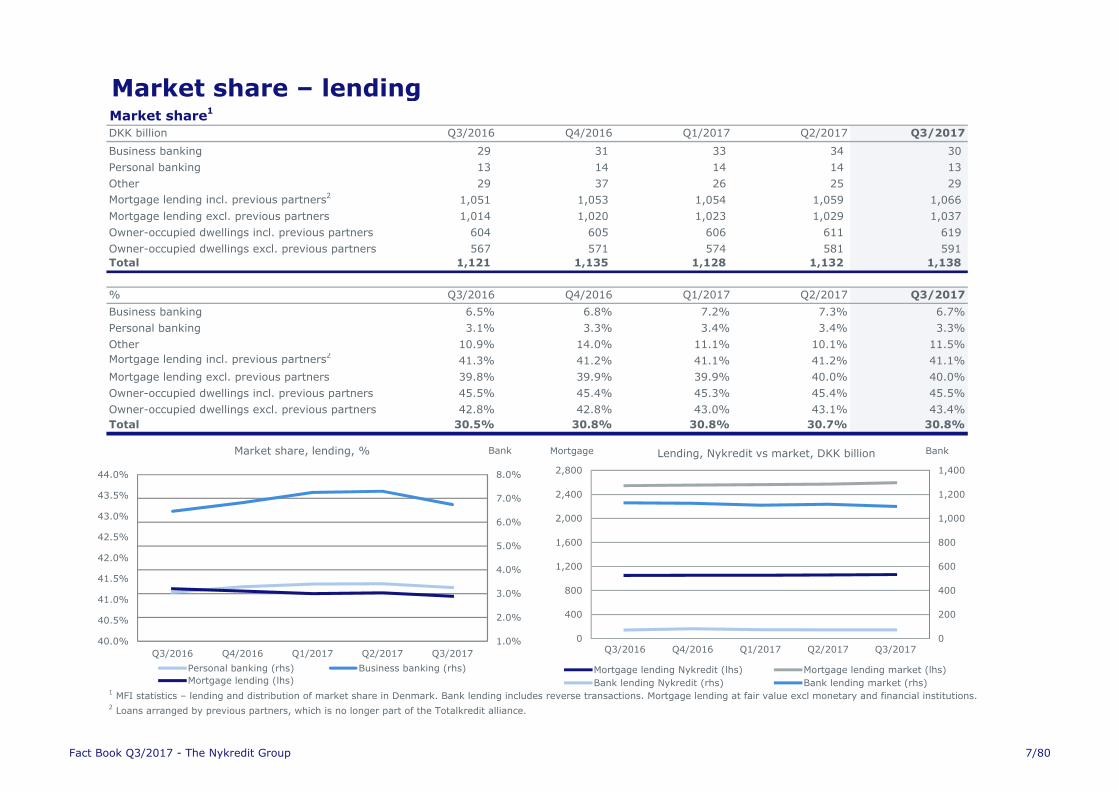
Market share – lendingMarket share
1
DKK billion Q3/2016 Q4/2016 Q1/2017 Q2/2017 Q3/2017
Business banking 29 31 33 34 30
Personal banking 13 14 14 14 13
Other 29 37 26 25 29
Mortgage lending incl. previous partners21,051 1,053 1,054 1,059 1,066
Mortgage lending excl. previous partners 1,014 1,020 1,023 1,029 1,037
Owner-occupied dwellings incl. previous partners 604 605 606 611 619
Owner-occupied dwellings excl. previous partners 567 571 574 581 591
Total 1,121 1,135 1,128 1,132 1,138
% Q3/2016 Q4/2016 Q1/2017 Q2/2017 Q3/2017
Business banking 6.5% 6.8% 7.2% 7.3% 6.7%
Personal banking 3.1% 3.3% 3.4% 3.4% 3.3%
Other 10.9% 14.0% 11.1% 10.1% 11.5%
Mortgage lending incl. previous partners241.3% 41.2% 41.1% 41.2% 41.1%
Mortgage lending excl. previous partners 39.8% 39.9% 39.9% 40.0% 40.0%
Owner-occupied dwellings incl. previous partners 45.5% 45.4% 45.3% 45.4% 45.5%
Owner-occupied dwellings excl. previous partners 42.8% 42.8% 43.0% 43.1% 43.4%
Total 30.5% 30.8% 30.8% 30.7% 30.8%
1 MFI statistics – lending and distribution of market share in Denmark. Bank lending includes reverse transactions. Mortgage lending at fair value excl monetary and financial institutions.
2 Loans arranged by previous partners, which is no longer part of the Totalkredit alliance.
40.0%
40.5%
41.0%
41.5%
42.0%
42.5%
43.0%
43.5%
44.0%
Q3/2016 Q4/2016 Q1/2017 Q2/2017 Q3/2017
1.0%
2.0%
3.0%
4.0%
5.0%
6.0%
7.0%
8.0%
BankMarket share, lending, %
Personal banking (rhs) Business banking (rhs)
Mortgage lending (lhs)
0
200
400
600
800
1,000
1,200
1,400
0
400
800
1,200
1,600
2,000
2,400
2,800
Q3/2016 Q4/2016 Q1/2017 Q2/2017 Q3/2017
BankMortgage Lending, Nykredit vs market, DKK billion
Mortgage lending Nykredit (lhs) Mortgage lending market (lhs)
Bank lending Nykredit (rhs) Bank lending market (rhs)
Fact Book Q3/2017 - The Nykredit Group 7/80

Results – the Nykredit Group
The Nykredit GroupDKK million Q3/2016 Q4/2016 Q1/2017 Q2/2017 Q3/2017
Net interest income 2,240 2,272 2,239 2,259 2,276
Net fee income 672 618 582 584 640
Wealth management income 283 328 342 349 356
Net interest from capitalisation -152 -85 -107 -97 -70
Trading, investment portfolio and other income 495 654 752 516 425
Income 3,539 3,788 3,808 3,612 3,628
Costs -1,258 -1,578 -1,181 -1,193 -1,216
Business profit before impairment charges 2,280 2,210 2,627 2,419 2,412
Impairment charges on mortgage lending 233 378 33 -274 -42
Impairment charges on bank lending 28 -82 -55 -152 -60
Business profit 2,019 1,915 2,648 2,846 2,514
Legacy derivatives 66 422 337 1,029 122
Profit before tax 2,085 2,336 2,985 3,875 2,637
Tax 437 471 639 794 509
Profit for the period 1,648 1,865 2,346 3,081 2,128
Note: Largely all the Group's investment activities are marked to market, for which reason group earnings exhibit a certain degree of volatility.
Fact Book Q3/2017 - The Nykredit Group 8/80
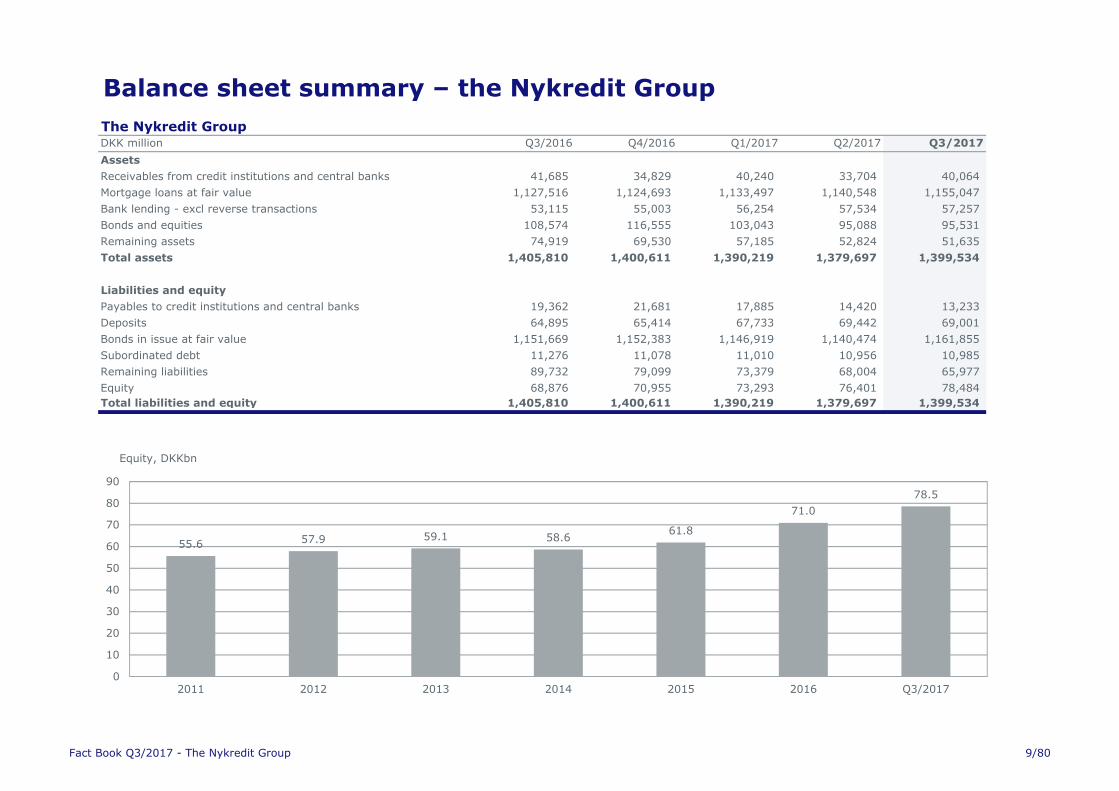
Balance sheet summary – the Nykredit Group
The Nykredit GroupDKK million Q3/2016 Q4/2016 Q1/2017 Q2/2017 Q3/2017
Assets
Receivables from credit institutions and central banks 41,685 34,829 40,240 33,704 40,064
Mortgage loans at fair value 1,127,516 1,124,693 1,133,497 1,140,548 1,155,047
Bank lending - excl reverse transactions 53,115 55,003 56,254 57,534 57,257
Bonds and equities 108,574 116,555 103,043 95,088 95,531
Remaining assets 74,919 69,530 57,185 52,824 51,635
Total assets 1,405,810 1,400,611 1,390,219 1,379,697 1,399,534
Liabilities and equity
Payables to credit institutions and central banks 19,362 21,681 17,885 14,420 13,233
Deposits 64,895 65,414 67,733 69,442 69,001
Bonds in issue at fair value 1,151,669 1,152,383 1,146,919 1,140,474 1,161,855
Subordinated debt 11,276 11,078 11,010 10,956 10,985
Remaining liabilities 89,732 79,099 73,379 68,004 65,977
Equity 68,876 70,955 73,293 76,401 78,484
Total liabilities and equity 1,405,810 1,400,611 1,390,219 1,379,697 1,399,534
55.6 57.9 59.1 58.661.8
71.0
78.5
0
10
20
30
40
50
60
70
80
90
2011 2012 2013 2014 2015 2016 Q3/2017
Equity, DKKbn
Fact Book Q3/2017 - The Nykredit Group 9/80
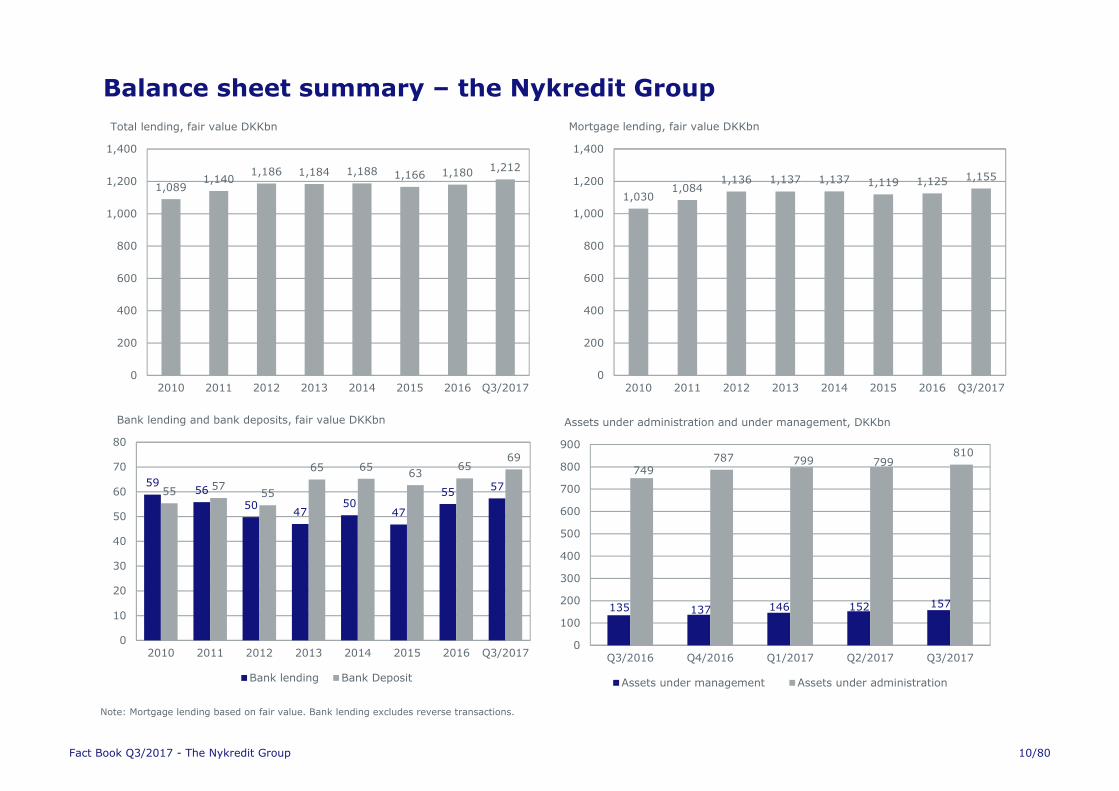
Balance sheet summary – the Nykredit Group
Note: Mortgage lending based on fair value. Bank lending excludes reverse transactions.
1,0891,140
1,186 1,184 1,188 1,166 1,180 1,212
0
200
400
600
800
1,000
1,200
1,400
2010 2011 2012 2013 2014 2015 2016 Q3/2017
Total lending, fair value DKKbn
1,0301,084
1,136 1,137 1,137 1,119 1,125 1,155
0
200
400
600
800
1,000
1,200
1,400
2010 2011 2012 2013 2014 2015 2016 Q3/2017
Mortgage lending, fair value DKKbn
5956
5047
5047
555755 57
55
65 6563
6569
0
10
20
30
40
50
60
70
80
2010 2011 2012 2013 2014 2015 2016 Q3/2017
Bank lending and bank deposits, fair value DKKbn
Bank lending Bank Deposit
135 137 146 152 157
749 787 799 799
810
0
100
200
300
400
500
600
700
800
900
Q3/2016 Q4/2016 Q1/2017 Q2/2017 Q3/2017
Assets under administration and under management, DKKbn
Assets under management Assets under administration
Fact Book Q3/2017 - The Nykredit Group 10/80
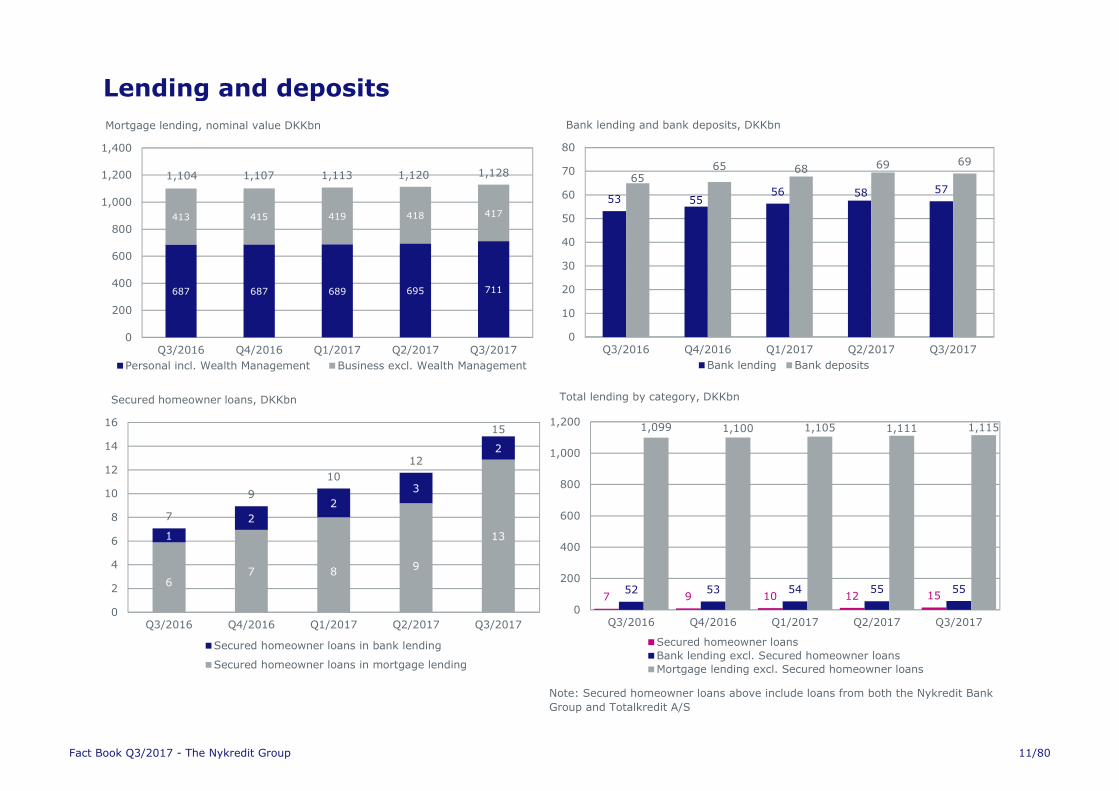
Lending and deposits
Note: Secured homeowner loans above include loans from both the Nykredit Bank
Group and Totalkredit A/S
687 687 689 695 711
413 415 419 418 417
1,104 1,107 1,113 1,120 1,128
0
200
400
600
800
1,000
1,200
1,400
Q3/2016 Q4/2016 Q1/2017 Q2/2017 Q3/2017
Mortgage lending, nominal value DKKbn
Personal incl. Wealth Management Business excl. Wealth Management
53 55 56 58 57
65 65 68 69 69
0
10
20
30
40
50
60
70
80
Q3/2016 Q4/2016 Q1/2017 Q2/2017 Q3/2017
Bank lending and bank deposits, DKKbn
Bank lending Bank deposits
67 8
9
131
2
2
3
2
7
9
10
12
15
0
2
4
6
8
10
12
14
16
Q3/2016 Q4/2016 Q1/2017 Q2/2017 Q3/2017
Secured homeowner loans, DKKbn
Secured homeowner loans in bank lending
Secured homeowner loans in mortgage lending
7 9 10 12 1552 53 54 55 55
1,099 1,100 1,105 1,111 1,115
0
200
400
600
800
1,000
1,200
Q3/2016 Q4/2016 Q1/2017 Q2/2017 Q3/2017
Total lending by category, DKKbn
Secured homeowner loans
Bank lending excl. Secured homeowner loans
Mortgage lending excl. Secured homeowner loans
Fact Book Q3/2017 - The Nykredit Group 11/80
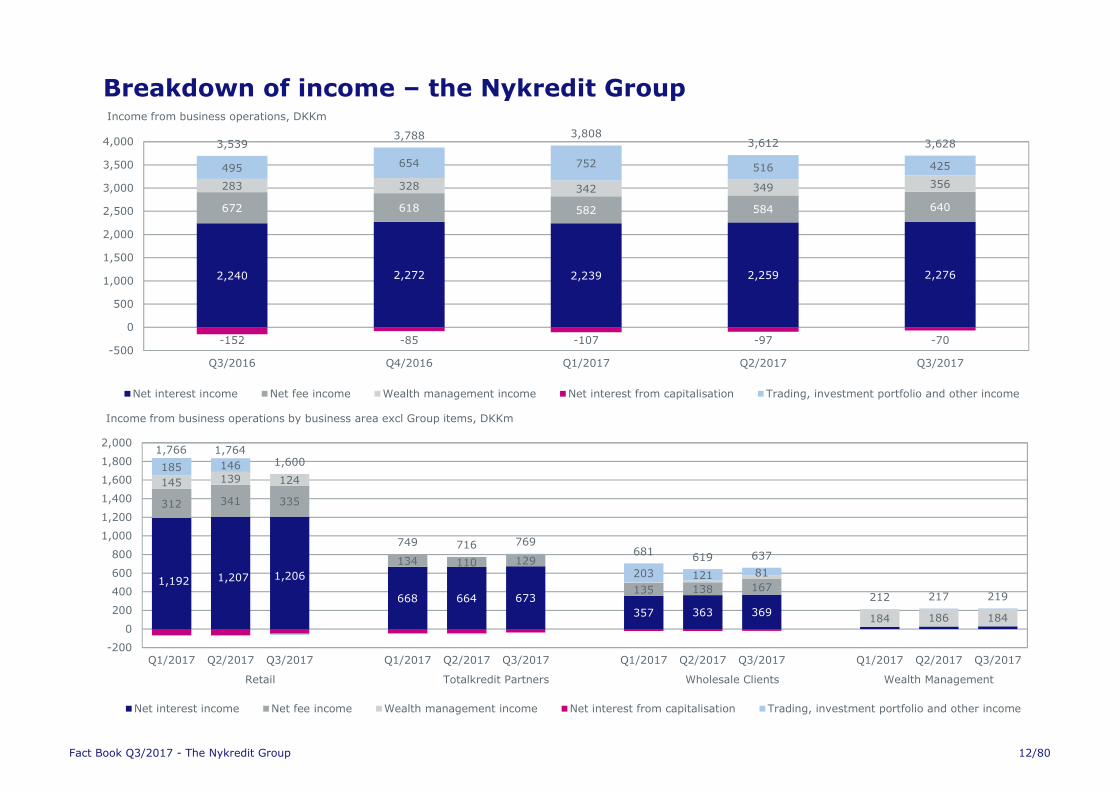
Breakdown of income – the Nykredit Group
2,240 2,272 2,239 2,259 2,276
672 618 582 584 640
283 328 342 349 356
-152 -85 -107 -97 -70
495 654 752 516 425
3,5393,788 3,808
3,612 3,628
-500
0
500
1,000
1,500
2,000
2,500
3,000
3,500
4,000
Q3/2016 Q4/2016 Q1/2017 Q2/2017 Q3/2017
Net interest income Net fee income Wealth management income Net interest from capitalisation Trading, investment portfolio and other income
Income from business operations, DKKm
1,192 1,207 1,206
668 664 673
357 363 369
312 341 335
134 110 129
135 138 167
145 139 124
184 186 184
185 146
203 121 81
1,766 1,764 1,600
749 716 769 681
619 637
212 217 219
-200
0
200
400
600
800
1,000
1,200
1,400
1,600
1,800
2,000
Q1/2017 Q2/2017 Q3/2017 Q1/2017 Q2/2017 Q3/2017 Q1/2017 Q2/2017 Q3/2017 Q1/2017 Q2/2017 Q3/2017
Retail Totalkredit Partners Wholesale Clients Wealth Management
Income from business operations by business area excl Group items, DKKm
Net interest income Net fee income Wealth management income Net interest from capitalisation Trading, investment portfolio and other income
Fact Book Q3/2017 - The Nykredit Group 12/80
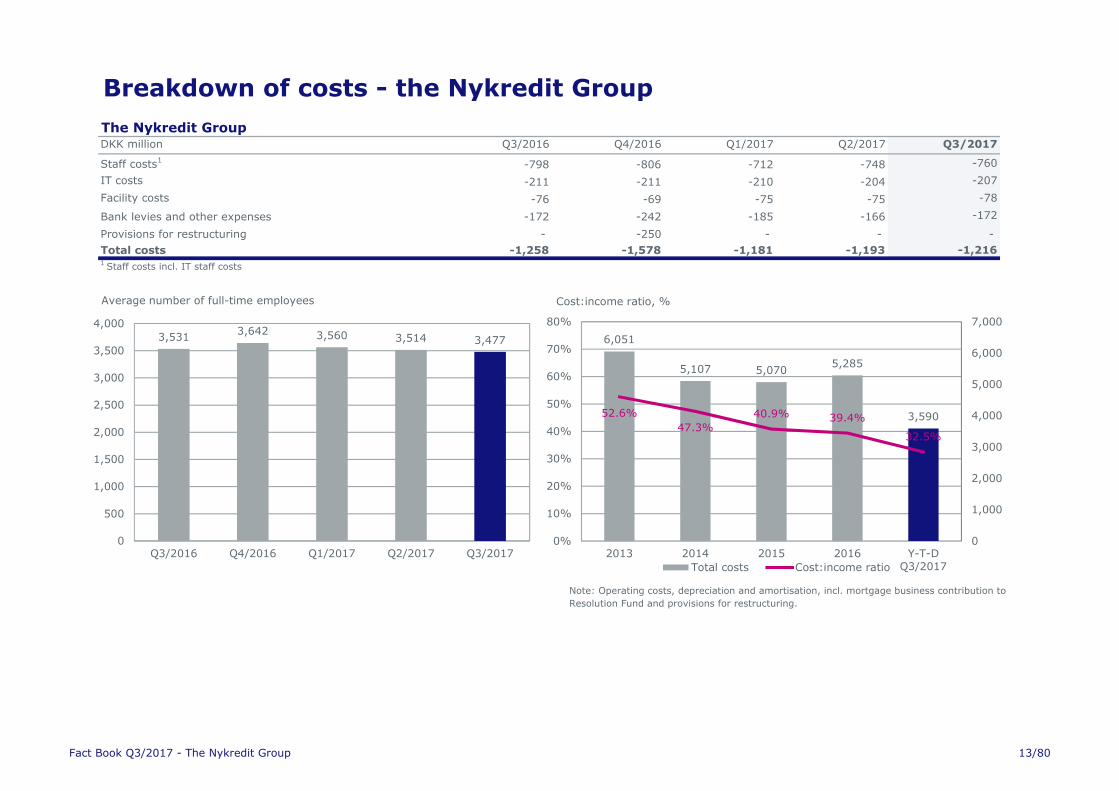
Breakdown of costs - the Nykredit Group
The Nykredit GroupDKK million Q3/2016 Q4/2016 Q1/2017 Q2/2017 Q3/2017
Staff costs1-798 -806 -712 -748 -760
IT costs -211 -211 -210 -204 -207
Facility costs -76 -69 -75 -75 -78
Bank levies and other expenses -172 -242 -185 -166 -172
Provisions for restructuring - -250 - - -
Total costs -1,258 -1,578 -1,181 -1,193 -1,2161 Staff costs incl. IT staff costs
Note: Operating costs, depreciation and amortisation, incl. mortgage business contribution to
Resolution Fund and provisions for restructuring.
3,5313,642 3,560 3,514 3,477
0
500
1,000
1,500
2,000
2,500
3,000
3,500
4,000
Q3/2016 Q4/2016 Q1/2017 Q2/2017 Q3/2017
Average number of full-time employees
6,051
5,107 5,070 5,285
3,590 52.6%
47.3%
40.9% 39.4%
32.5%
0
1,000
2,000
3,000
4,000
5,000
6,000
7,000
0%
10%
20%
30%
40%
50%
60%
70%
80%
2013 2014 2015 2016 Y-T-DQ3/2017
Cost:income ratio, %
Total costs Cost:income ratio
Fact Book Q3/2017 - The Nykredit Group 13/80
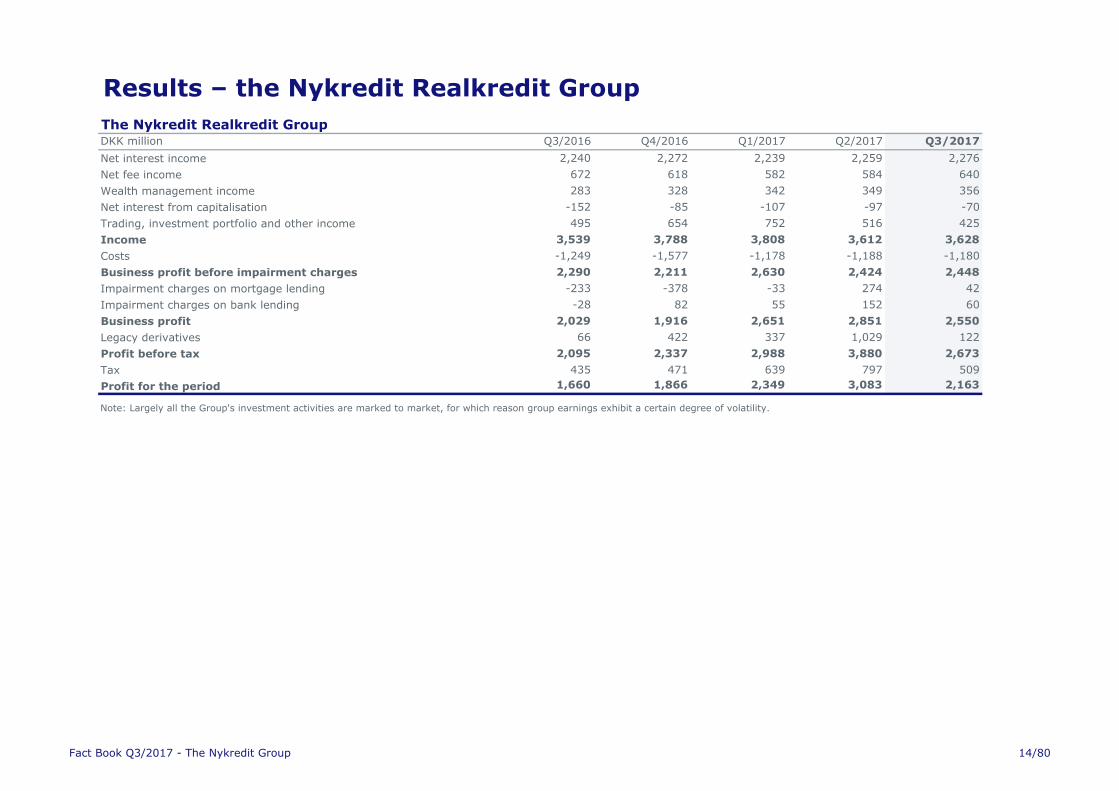
Results – the Nykredit Realkredit Group
The Nykredit Realkredit GroupDKK million Q3/2016 Q4/2016 Q1/2017 Q2/2017 Q3/2017
Net interest income 2,240 2,272 2,239 2,259 2,276
Net fee income 672 618 582 584 640
Wealth management income 283 328 342 349 356
Net interest from capitalisation -152 -85 -107 -97 -70
Trading, investment portfolio and other income 495 654 752 516 425
Income 3,539 3,788 3,808 3,612 3,628
Costs -1,249 -1,577 -1,178 -1,188 -1,180
Business profit before impairment charges 2,290 2,211 2,630 2,424 2,448
Impairment charges on mortgage lending -233 -378 -33 274 42
Impairment charges on bank lending -28 82 55 152 60
Business profit 2,029 1,916 2,651 2,851 2,550
Legacy derivatives 66 422 337 1,029 122
Profit before tax 2,095 2,337 2,988 3,880 2,673
Tax 435 471 639 797 509
Profit for the period 1,660 1,866 2,349 3,083 2,163
Note: Largely all the Group's investment activities are marked to market, for which reason group earnings exhibit a certain degree of volatility.
Fact Book Q3/2017 - The Nykredit Group 14/80
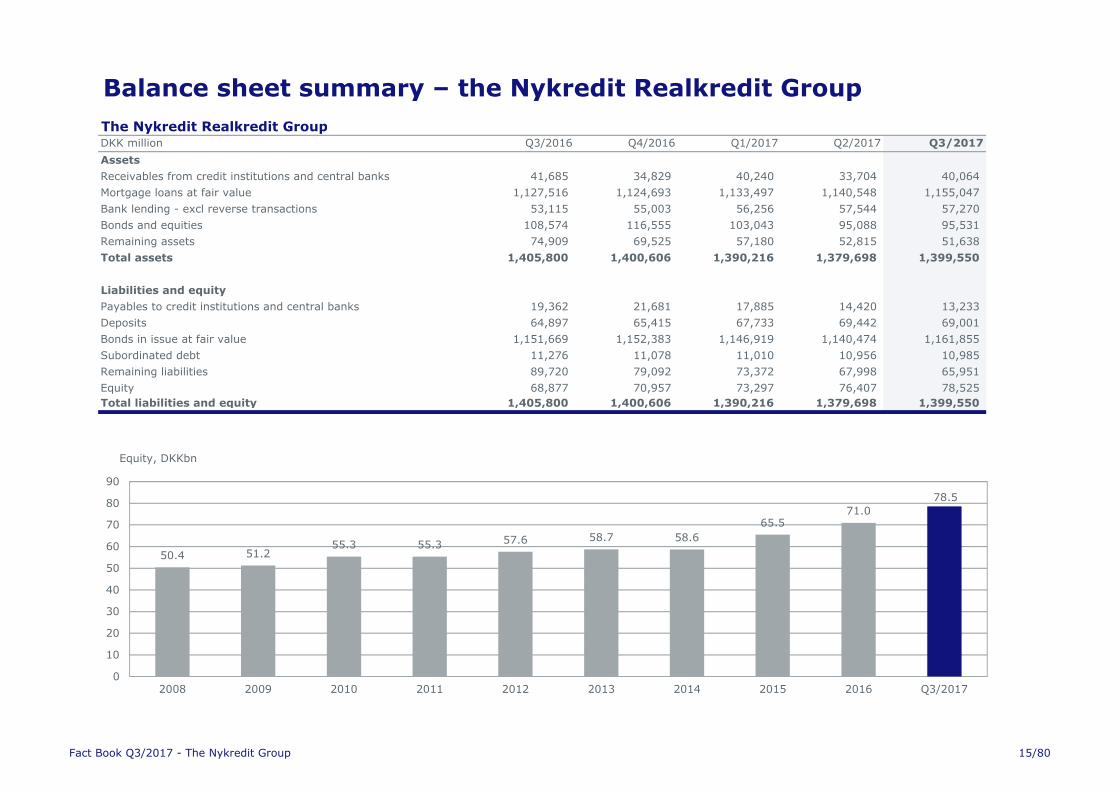
Balance sheet summary – the Nykredit Realkredit Group
The Nykredit Realkredit GroupDKK million Q3/2016 Q4/2016 Q1/2017 Q2/2017 Q3/2017
Assets
Receivables from credit institutions and central banks 41,685 34,829 40,240 33,704 40,064
Mortgage loans at fair value 1,127,516 1,124,693 1,133,497 1,140,548 1,155,047
Bank lending - excl reverse transactions 53,115 55,003 56,256 57,544 57,270
Bonds and equities 108,574 116,555 103,043 95,088 95,531
Remaining assets 74,909 69,525 57,180 52,815 51,638
Total assets 1,405,800 1,400,606 1,390,216 1,379,698 1,399,550
Liabilities and equity
Payables to credit institutions and central banks 19,362 21,681 17,885 14,420 13,233
Deposits 64,897 65,415 67,733 69,442 69,001
Bonds in issue at fair value 1,151,669 1,152,383 1,146,919 1,140,474 1,161,855
Subordinated debt 11,276 11,078 11,010 10,956 10,985
Remaining liabilities 89,720 79,092 73,372 67,998 65,951
Equity 68,877 70,957 73,297 76,407 78,525
Total liabilities and equity 1,405,800 1,400,606 1,390,216 1,379,698 1,399,550
50.4 51.255.3 55.3 57.6 58.7 58.6
65.571.0
78.5
0
10
20
30
40
50
60
70
80
90
2008 2009 2010 2011 2012 2013 2014 2015 2016 Q3/2017
Equity, DKKbn
Fact Book Q3/2017 - The Nykredit Group 15/80
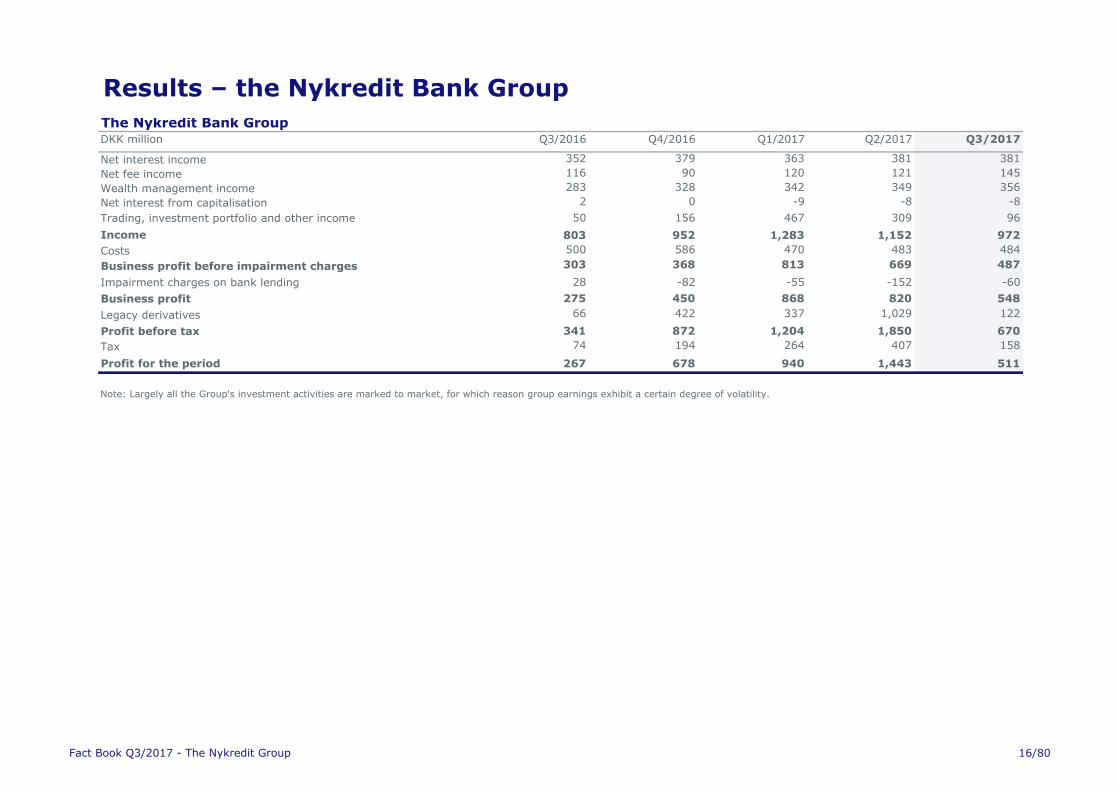
Results – the Nykredit Bank Group
The Nykredit Bank GroupDKK million Q3/2016 Q4/2016 Q1/2017 Q2/2017 Q3/2017
Net interest income 352 379 363 381 381
Net fee income 116 90 120 121 145
Wealth management income 283 328 342 349 356
Net interest from capitalisation 2 0 -9 -8 -8
Trading, investment portfolio and other income 50 156 467 309 96
Income 803 952 1,283 1,152 972
Costs 500 586 470 483 484
Business profit before impairment charges 303 368 813 669 487
Impairment charges on bank lending 28 -82 -55 -152 -60
Business profit 275 450 868 820 548
Legacy derivatives 66 422 337 1,029 122
Profit before tax 341 872 1,204 1,850 670
Tax 74 194 264 407 158
Profit for the period 267 678 940 1,443 511
Note: Largely all the Group's investment activities are marked to market, for which reason group earnings exhibit a certain degree of volatility.
Fact Book Q3/2017 - The Nykredit Group 16/80
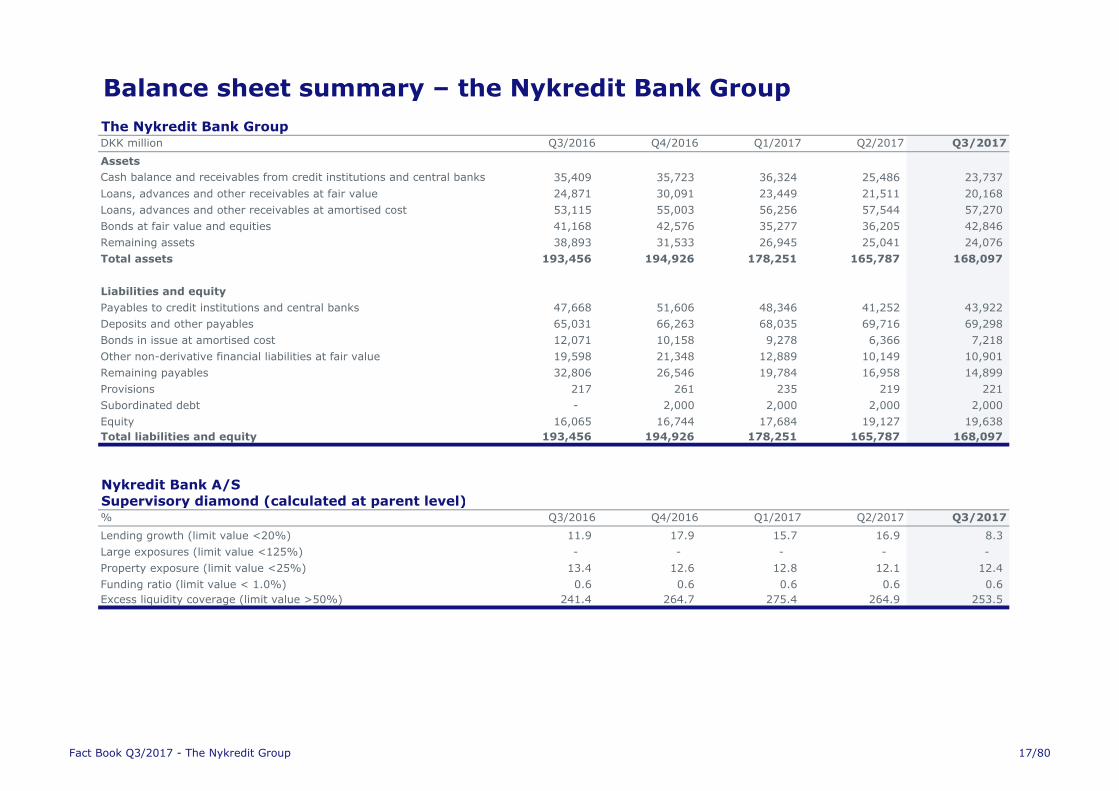
Balance sheet summary – the Nykredit Bank Group
The Nykredit Bank GroupDKK million Q3/2016 Q4/2016 Q1/2017 Q2/2017 Q3/2017
Assets
Cash balance and receivables from credit institutions and central banks 35,409 35,723 36,324 25,486 23,737
Loans, advances and other receivables at fair value 24,871 30,091 23,449 21,511 20,168
Loans, advances and other receivables at amortised cost 53,115 55,003 56,256 57,544 57,270
Bonds at fair value and equities 41,168 42,576 35,277 36,205 42,846
Remaining assets 38,893 31,533 26,945 25,041 24,076
Total assets 193,456 194,926 178,251 165,787 168,097
Liabilities and equity
Payables to credit institutions and central banks 47,668 51,606 48,346 41,252 43,922
Deposits and other payables 65,031 66,263 68,035 69,716 69,298
Bonds in issue at amortised cost 12,071 10,158 9,278 6,366 7,218
Other non-derivative financial liabilities at fair value 19,598 21,348 12,889 10,149 10,901
Remaining payables 32,806 26,546 19,784 16,958 14,899
Provisions 217 261 235 219 221
Subordinated debt - 2,000 2,000 2,000 2,000
Equity 16,065 16,744 17,684 19,127 19,638
Total liabilities and equity 193,456 194,926 178,251 165,787 168,097
Nykredit Bank A/SSupervisory diamond (calculated at parent level)% Q3/2016 Q4/2016 Q1/2017 Q2/2017 Q3/2017
Lending growth (limit value <20%) 11.9 17.9 15.7 16.9 8.3
Large exposures (limit value <125%) - - - - -
Property exposure (limit value <25%) 13.4 12.6 12.8 12.1 12.4
Funding ratio (limit value < 1.0%) 0.6 0.6 0.6 0.6 0.6
Excess liquidity coverage (limit value >50%) 241.4 264.7 275.4 264.9 253.5
Fact Book Q3/2017 - The Nykredit Group 17/80
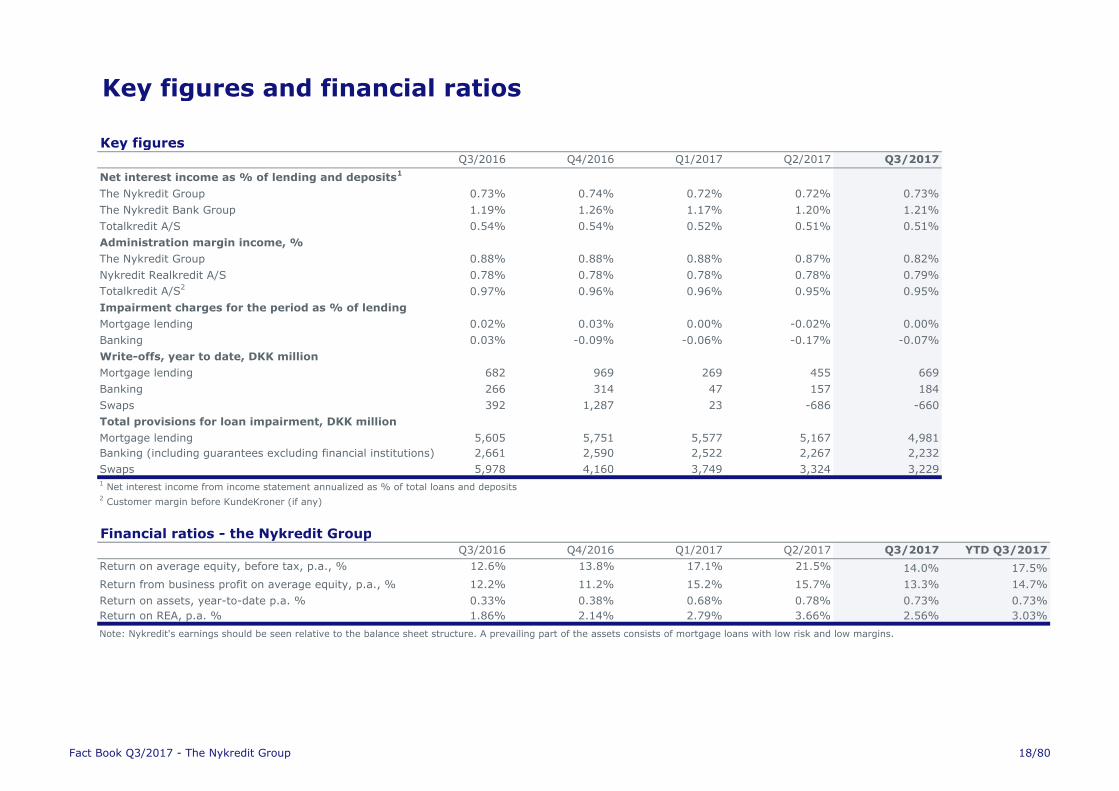
Key figures and financial ratios
Key figuresQ3/2016 Q4/2016 Q1/2017 Q2/2017 Q3/2017
Net interest income as % of lending and deposits1
The Nykredit Group 0.73% 0.74% 0.72% 0.72% 0.73%
The Nykredit Bank Group 1.19% 1.26% 1.17% 1.20% 1.21%
Totalkredit A/S 0.54% 0.54% 0.52% 0.51% 0.51%
Administration margin income, %
The Nykredit Group 0.88% 0.88% 0.88% 0.87% 0.82%
Nykredit Realkredit A/S 0.78% 0.78% 0.78% 0.78% 0.79%
Totalkredit A/S20.97% 0.96% 0.96% 0.95% 0.95%
Impairment charges for the period as % of lending
Mortgage lending 0.02% 0.03% 0.00% -0.02% 0.00%
Banking 0.03% -0.09% -0.06% -0.17% -0.07%
Write-offs, year to date, DKK million
Mortgage lending 682 969 269 455 669
Banking 266 314 47 157 184
Swaps 392 1,287 23 -686 -660
Total provisions for loan impairment, DKK million
Mortgage lending 5,605 5,751 5,577 5,167 4,981
Banking (including guarantees excluding financial institutions) 2,661 2,590 2,522 2,267 2,232
Swaps 5,978 4,160 3,749 3,324 3,2291 Net interest income from income statement annualized as % of total loans and deposits
2 Customer margin before KundeKroner (if any)
Financial ratios - the Nykredit GroupQ3/2016 Q4/2016 Q1/2017 Q2/2017 Q3/2017 YTD Q3/2017
Return on average equity, before tax, p.a., % 12.6% 13.8% 17.1% 21.5% 14.0% 17.5%
Return from business profit on average equity, p.a., % 12.2% 11.2% 15.2% 15.7% 13.3% 14.7%
Return on assets, year-to-date p.a. % 0.33% 0.38% 0.68% 0.78% 0.73% 0.73%
Return on REA, p.a. % 1.86% 2.14% 2.79% 3.66% 2.56% 3.03%
Note: Nykredit's earnings should be seen relative to the balance sheet structure. A prevailing part of the assets consists of mortgage loans with low risk and low margins.
Fact Book Q3/2017 - The Nykredit Group 18/80
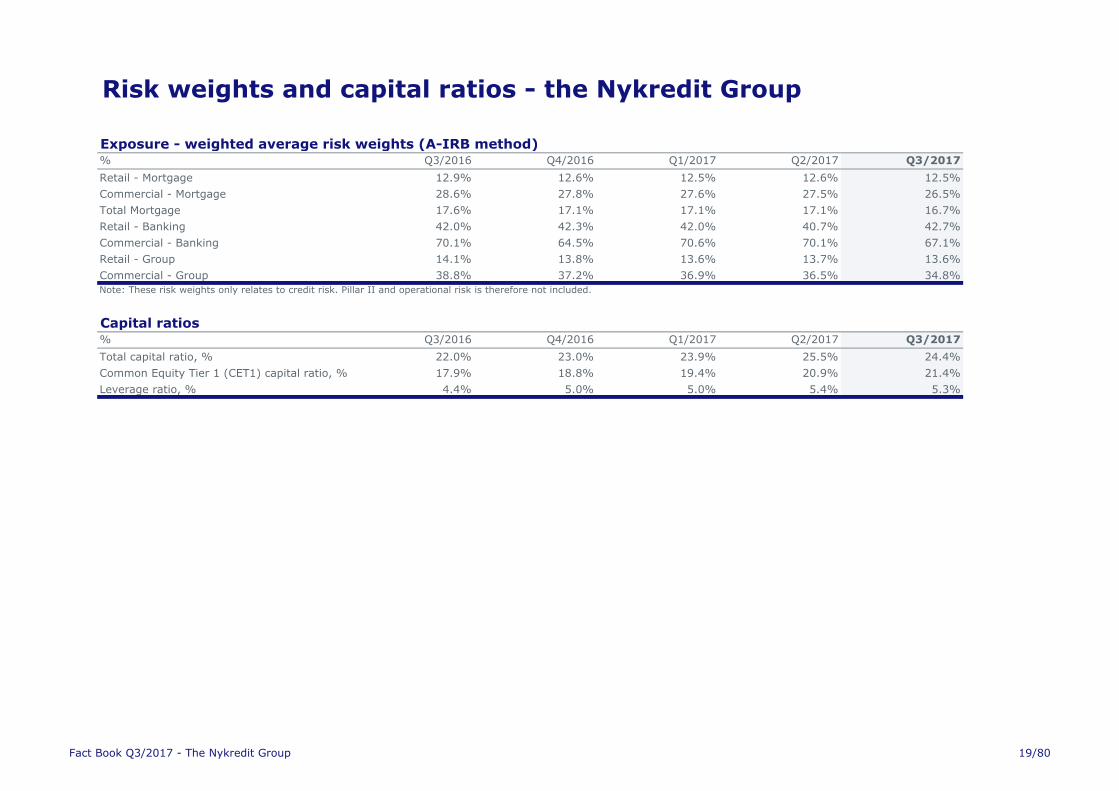
Risk weights and capital ratios - the Nykredit Group
Exposure - weighted average risk weights (A-IRB method)% Q3/2016 Q4/2016 Q1/2017 Q2/2017 Q3/2017
Retail - Mortgage 12.9% 12.6% 12.5% 12.6% 12.5%
Commercial - Mortgage 28.6% 27.8% 27.6% 27.5% 26.5%
Total Mortgage 17.6% 17.1% 17.1% 17.1% 16.7%
Retail - Banking 42.0% 42.3% 42.0% 40.7% 42.7%
Commercial - Banking 70.1% 64.5% 70.6% 70.1% 67.1%
Retail - Group 14.1% 13.8% 13.6% 13.7% 13.6%
Commercial - Group 38.8% 37.2% 36.9% 36.5% 34.8%
Note: These risk weights only relates to credit risk. Pillar II and operational risk is therefore not included.
Capital ratios% Q3/2016 Q4/2016 Q1/2017 Q2/2017 Q3/2017
Total capital ratio, % 22.0% 23.0% 23.9% 25.5% 24.4%
Common Equity Tier 1 (CET1) capital ratio, % 17.9% 18.8% 19.4% 20.9% 21.4%
Leverage ratio, % 4.4% 5.0% 5.0% 5.4% 5.3%
Fact Book Q3/2017 - The Nykredit Group 19/80
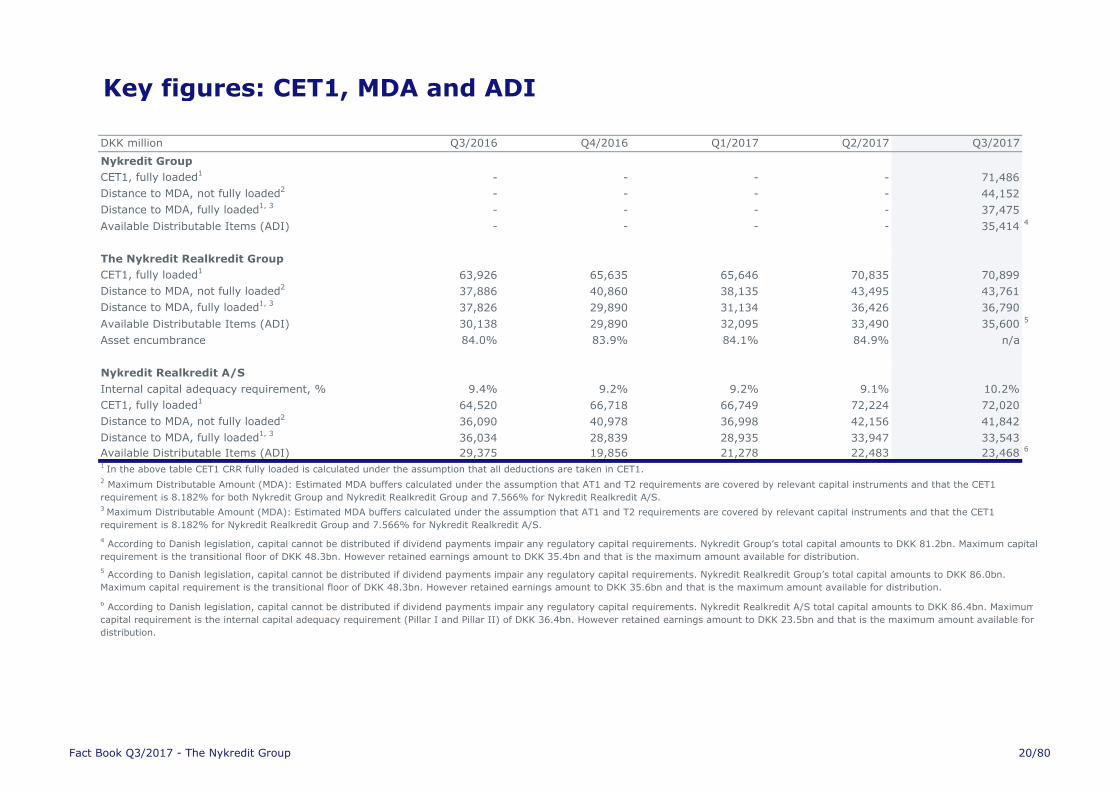
Key figures: CET1, MDA and ADI
DKK million Q3/2016 Q4/2016 Q1/2017 Q2/2017 Q3/2017
Nykredit Group
CET1, fully loaded1- - - - 71,486
Distance to MDA, not fully loaded2- - - - 44,152
Distance to MDA, fully loaded1, 3- - - - 37,475
Available Distributable Items (ADI) - - - - 35,414 4
The Nykredit Realkredit Group
CET1, fully loaded163,926 65,635 65,646 70,835 70,899
Distance to MDA, not fully loaded237,886 40,860 38,135 43,495 43,761
Distance to MDA, fully loaded1, 337,826 29,890 31,134 36,426 36,790
Available Distributable Items (ADI) 30,138 29,890 32,095 33,490 35,600 5
Asset encumbrance 84.0% 83.9% 84.1% 84.9% n/a
Nykredit Realkredit A/S
Internal capital adequacy requirement, % 9.4% 9.2% 9.2% 9.1% 10.2%
CET1, fully loaded164,520 66,718 66,749 72,224 72,020
Distance to MDA, not fully loaded236,090 40,978 36,998 42,156 41,842
Distance to MDA, fully loaded1, 336,034 28,839 28,935 33,947 33,543
Available Distributable Items (ADI) 29,375 19,856 21,278 22,483 23,468 6
1 In the above table CET1 CRR fully loaded is calculated under the assumption that all deductions are taken in CET1.
3 Maximum Distributable Amount (MDA): Estimated MDA buffers calculated under the assumption that AT1 and T2 requirements are covered by relevant capital instruments and that the CET1
requirement is 8.182% for Nykredit Realkredit Group and 7.566% for Nykredit Realkredit A/S.
4 According to Danish legislation, capital cannot be distributed if dividend payments impair any regulatory capital requirements. Nykredit Group’s total capital amounts to DKK 81.2bn. Maximum capital
requirement is the transitional floor of DKK 48.3bn. However retained earnings amount to DKK 35.4bn and that is the maximum amount available for distribution.
5 According to Danish legislation, capital cannot be distributed if dividend payments impair any regulatory capital requirements. Nykredit Realkredit Group’s total capital amounts to DKK 86.0bn.
Maximum capital requirement is the transitional floor of DKK 48.3bn. However retained earnings amount to DKK 35.6bn and that is the maximum amount available for distribution.
6 According to Danish legislation, capital cannot be distributed if dividend payments impair any regulatory capital requirements. Nykredit Realkredit A/S total capital amounts to DKK 86.4bn. Maximum
capital requirement is the internal capital adequacy requirement (Pillar I and Pillar II) of DKK 36.4bn. However retained earnings amount to DKK 23.5bn and that is the maximum amount available for
distribution.
2 Maximum Distributable Amount (MDA): Estimated MDA buffers calculated under the assumption that AT1 and T2 requirements are covered by relevant capital instruments and that the CET1
requirement is 8.182% for both Nykredit Group and Nykredit Realkredit Group and 7.566% for Nykredit Realkredit A/S.
Fact Book Q3/2017 - The Nykredit Group 20/80
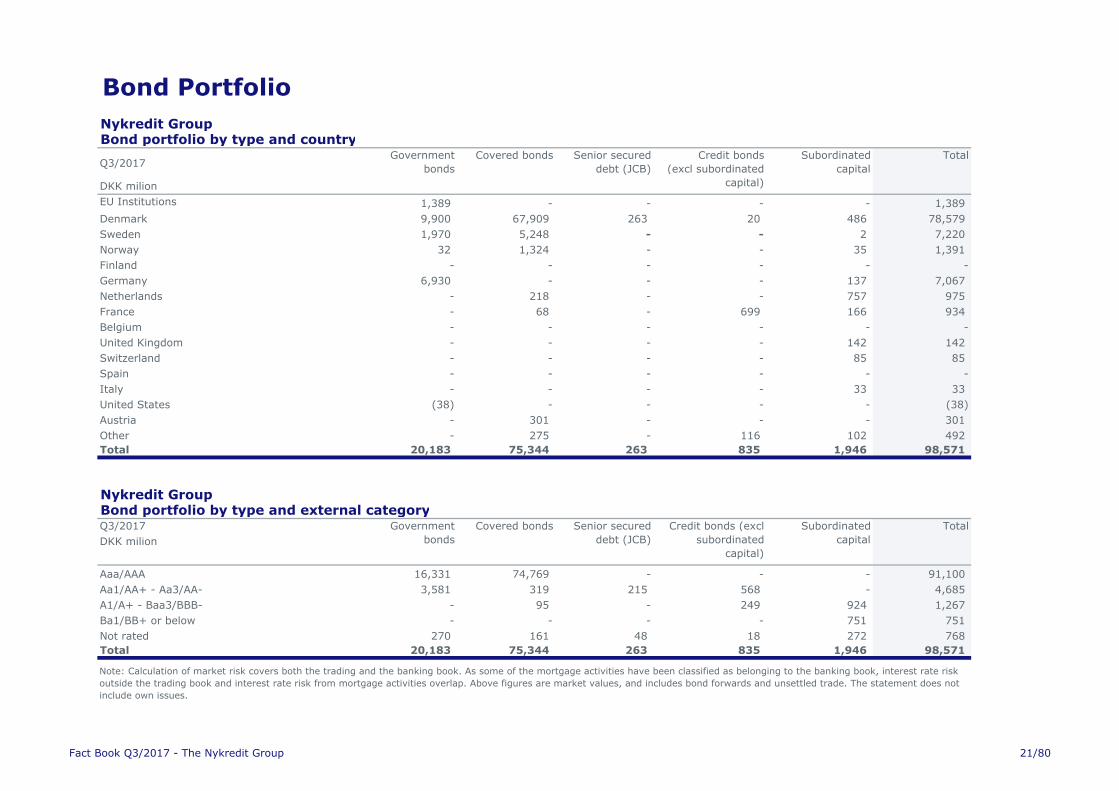
Bond Portfolio
Nykredit GroupBond portfolio by type and country
DKK milion
EU Institutions 1,389 - - - - 1,389
Denmark 9,900 67,909 263 20 486 78,579
Sweden 1,970 5,248 - - 2 7,220
Norway 32 1,324 - - 35 1,391
Finland - - - - - -
Germany 6,930 - - - 137 7,067
Netherlands - 218 - - 757 975
France - 68 - 699 166 934
Belgium - - - - - -
United Kingdom - - - - 142 142
Switzerland - - - - 85 85
Spain - - - - - -
Italy - - - - 33 33
United States (38) - - - - (38)
Austria - 301 - - - 301
Other - 275 - 116 102 492
Total 20,183 75,344 263 835 1,946 98,571
Nykredit GroupBond portfolio by type and external categoryQ3/2017
DKK milion
Aaa/AAA 16,331 74,769 - - - 91,100
Aa1/AA+ - Aa3/AA- 3,581 319 215 568 - 4,685
A1/A+ - Baa3/BBB- - 95 - 249 924 1,267
Ba1/BB+ or below - - - - 751 751
Not rated 270 161 48 18 272 768
Total 20,183 75,344 263 835 1,946 98,571
Government
bonds
Covered bonds Senior secured
debt (JCB)
Credit bonds
(excl subordinated
capital)
Total
Government
bonds
Covered bonds Senior secured
debt (JCB)
Subordinated
capital
Total
Subordinated
capitalQ3/2017
Note: Calculation of market risk covers both the trading and the banking book. As some of the mortgage activities have been classified as belonging to the banking book, interest rate risk
outside the trading book and interest rate risk from mortgage activities overlap. Above figures are market values, and includes bond forwards and unsettled trade. The statement does not
include own issues.
Credit bonds (excl
subordinated
capital)
Fact Book Q3/2017 - The Nykredit Group 21/80
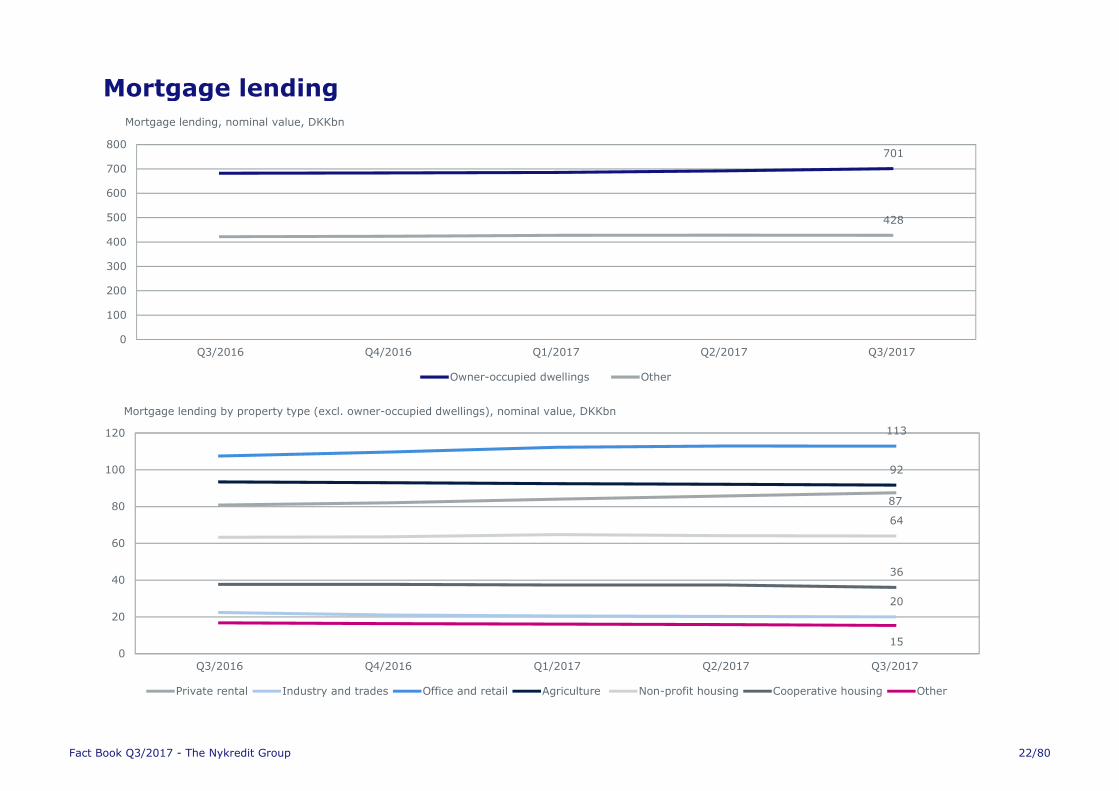
Mortgage lending
701
428
0
100
200
300
400
500
600
700
800
Q3/2016 Q4/2016 Q1/2017 Q2/2017 Q3/2017
Mortgage lending, nominal value, DKKbn
Owner-occupied dwellings Other
87
20
113
92
64
36
15 0
20
40
60
80
100
120
Q3/2016 Q4/2016 Q1/2017 Q2/2017 Q3/2017
Mortgage lending by property type (excl. owner-occupied dwellings), nominal value, DKKbn
Private rental Industry and trades Office and retail Agriculture Non-profit housing Cooperative housing Other
Fact Book Q3/2017 - The Nykredit Group 22/80
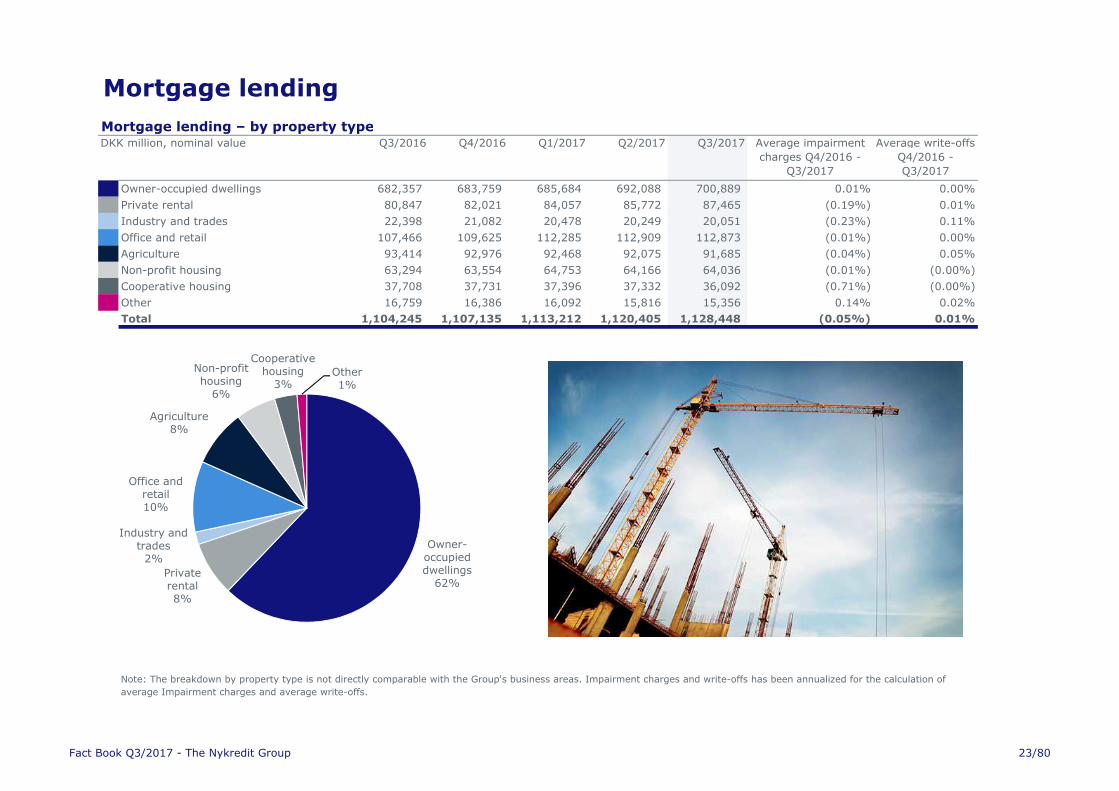
Mortgage lending
Mortgage lending – by property typeDKK million, nominal value Q3/2016 Q4/2016 Q1/2017 Q2/2017 Q3/2017 Average impairment
charges Q4/2016 -
Q3/2017
Average write-offs
Q4/2016 -
Q3/2017
Owner-occupied dwellings 682,357 683,759 685,684 692,088 700,889 0.01% 0.00%
Private rental 80,847 82,021 84,057 85,772 87,465 (0.19%) 0.01%
Industry and trades 22,398 21,082 20,478 20,249 20,051 (0.23%) 0.11%
Office and retail 107,466 109,625 112,285 112,909 112,873 (0.01%) 0.00%
Agriculture 93,414 92,976 92,468 92,075 91,685 (0.04%) 0.05%
Non-profit housing 63,294 63,554 64,753 64,166 64,036 (0.01%) (0.00%)
Cooperative housing 37,708 37,731 37,396 37,332 36,092 (0.71%) (0.00%)
Other 16,759 16,386 16,092 15,816 15,356 0.14% 0.02%
Total 1,104,245 1,107,135 1,113,212 1,120,405 1,128,448 (0.05%) 0.01%
Note: The breakdown by property type is not directly comparable with the Group's business areas. Impairment charges and write-offs has been annualized for the calculation of
average Impairment charges and average write-offs.
Owner-occupied dwellings
62%Private rental8%
Industry and trades
2%
Office and retail10%
Agriculture 8%
Non-profit housing
6%
Cooperative housing
3%Other1%
Fact Book Q3/2017 - The Nykredit Group 23/80
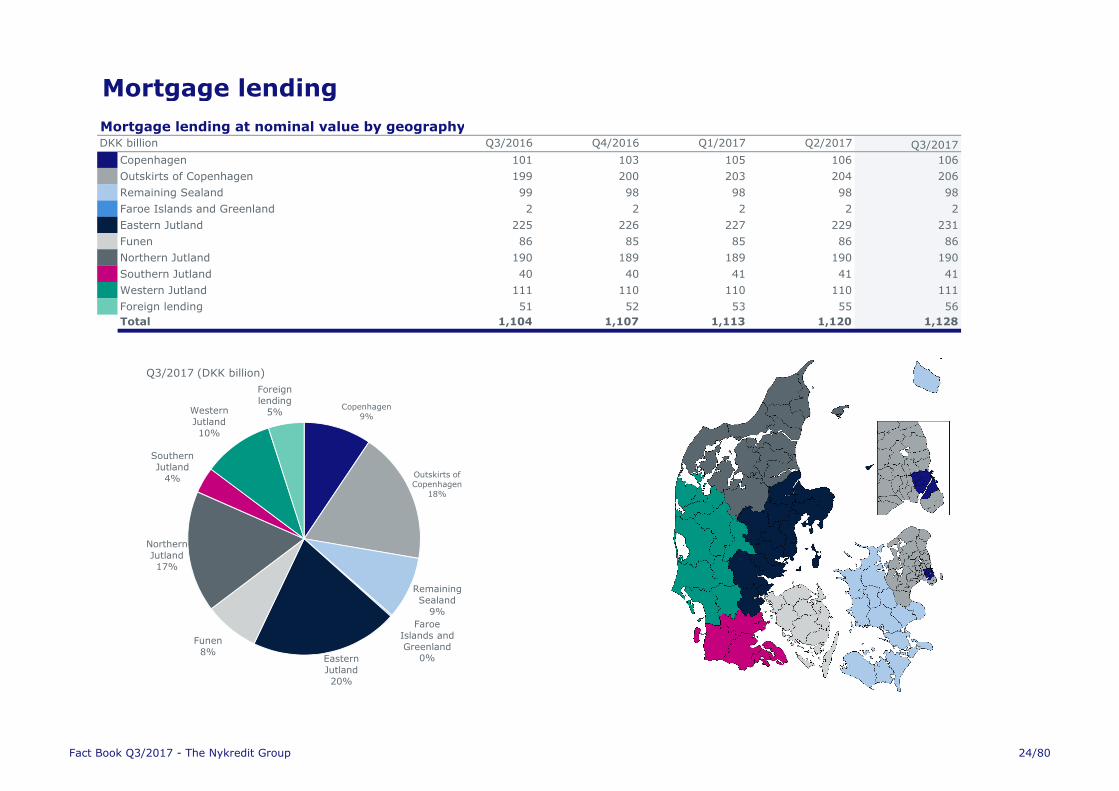
Mortgage lending
Mortgage lending at nominal value by geographyDKK billion Q3/2016 Q4/2016 Q1/2017 Q2/2017 Q3/2017
Copenhagen 101 103 105 106 106
Outskirts of Copenhagen 199 200 203 204 206
Remaining Sealand 99 98 98 98 98
Faroe Islands and Greenland 2 2 2 2 2
Eastern Jutland 225 226 227 229 231
Funen 86 85 85 86 86
Northern Jutland 190 189 189 190 190
Southern Jutland 40 40 41 41 41
Western Jutland 111 110 110 110 111
Foreign lending 51 52 53 55 56
Total 1,104 1,107 1,113 1,120 1,128
Copenhagen9%
Outskirts of Copenhagen
18%
Remaining Sealand
9%
Faroe Islands and Greenland
0%Eastern Jutland20%
Funen8%
Northern Jutland17%
Southern Jutland
4%
Western Jutland10%
Foreign lending
5%
Q3/2017 (DKK billion)
Fact Book Q3/2017 - The Nykredit Group 24/80
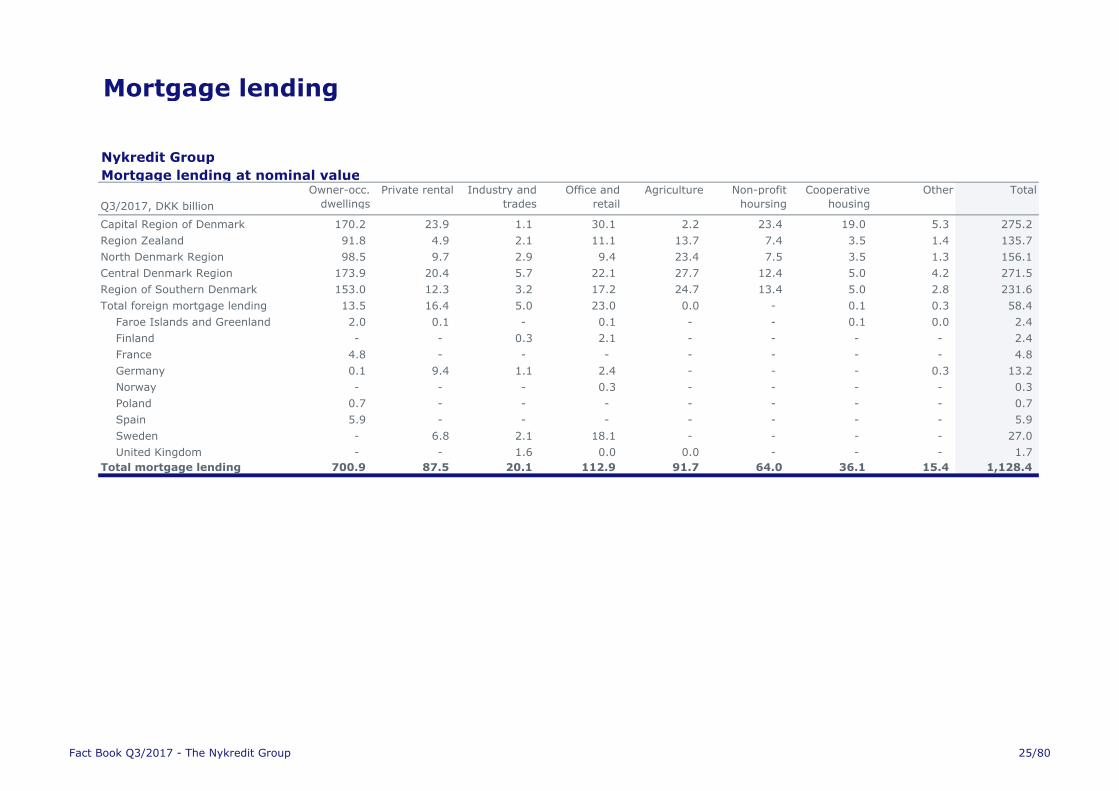
Mortgage lending
Nykredit Group
Mortgage lending at nominal value
Q3/2017, DKK billion
Capital Region of Denmark 170.2 23.9 1.1 30.1 2.2 23.4 19.0 5.3 275.2
Region Zealand 91.8 4.9 2.1 11.1 13.7 7.4 3.5 1.4 135.7
North Denmark Region 98.5 9.7 2.9 9.4 23.4 7.5 3.5 1.3 156.1
Central Denmark Region 173.9 20.4 5.7 22.1 27.7 12.4 5.0 4.2 271.5
Region of Southern Denmark 153.0 12.3 3.2 17.2 24.7 13.4 5.0 2.8 231.6
Total foreign mortgage lending 13.5 16.4 5.0 23.0 0.0 - 0.1 0.3 58.4
Faroe Islands and Greenland 2.0 0.1 - 0.1 - - 0.1 0.0 2.4
Finland - - 0.3 2.1 - - - - 2.4
France 4.8 - - - - - - - 4.8
Germany 0.1 9.4 1.1 2.4 - - - 0.3 13.2
Norway - - - 0.3 - - - - 0.3
Poland 0.7 - - - - - - - 0.7
Spain 5.9 - - - - - - - 5.9
Sweden - 6.8 2.1 18.1 - - - - 27.0
United Kingdom - - 1.6 0.0 0.0 - - - 1.7
Total mortgage lending 700.9 87.5 20.1 112.9 91.7 64.0 36.1 15.4 1,128.4
Owner-occ.
dwellings
Private rental Industry and
trades
Office and
retail
Agriculture Non-profit
hoursing
Cooperative
housing
Other Total
Fact Book Q3/2017 - The Nykredit Group 25/80
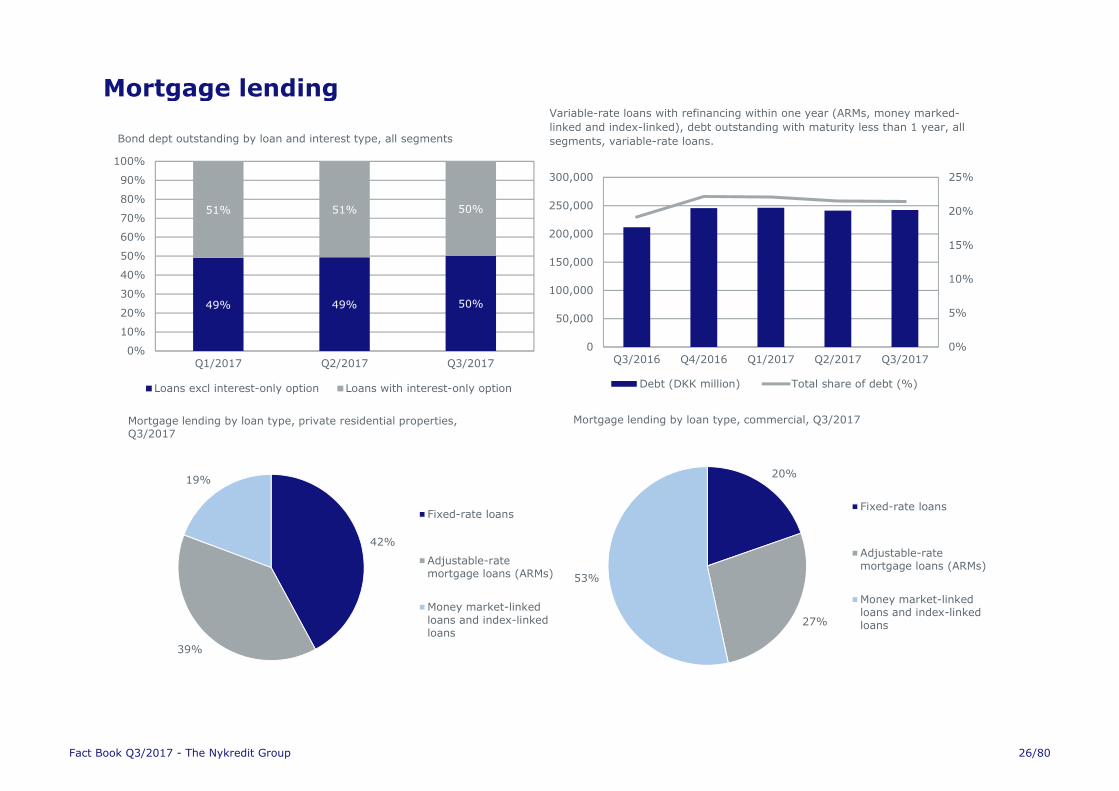
Mortgage lendingVariable-rate loans with refinancing within one year (ARMs, money marked-
linked and index-linked), debt outstanding with maturity less than 1 year, all
segments, variable-rate loans.
49% 49% 50%
51% 51% 50%
0%
10%
20%
30%
40%
50%
60%
70%
80%
90%
100%
Q1/2017 Q2/2017 Q3/2017
Bond dept outstanding by loan and interest type, all segments
Loans excl interest-only option Loans with interest-only option
42%
39%
19%
Mortgage lending by loan type, private residential properties, Q3/2017
Fixed-rate loans
Adjustable-ratemortgage loans (ARMs)
Money market-linkedloans and index-linkedloans
20%
27%
53%
Mortgage lending by loan type, commercial, Q3/2017
Fixed-rate loans
Adjustable-ratemortgage loans (ARMs)
Money market-linkedloans and index-linkedloans
0%
5%
10%
15%
20%
25%
0
50,000
100,000
150,000
200,000
250,000
300,000
Q3/2016 Q4/2016 Q1/2017 Q2/2017 Q3/2017
Debt (DKK million) Total share of debt (%)
Fact Book Q3/2017 - The Nykredit Group 26/80
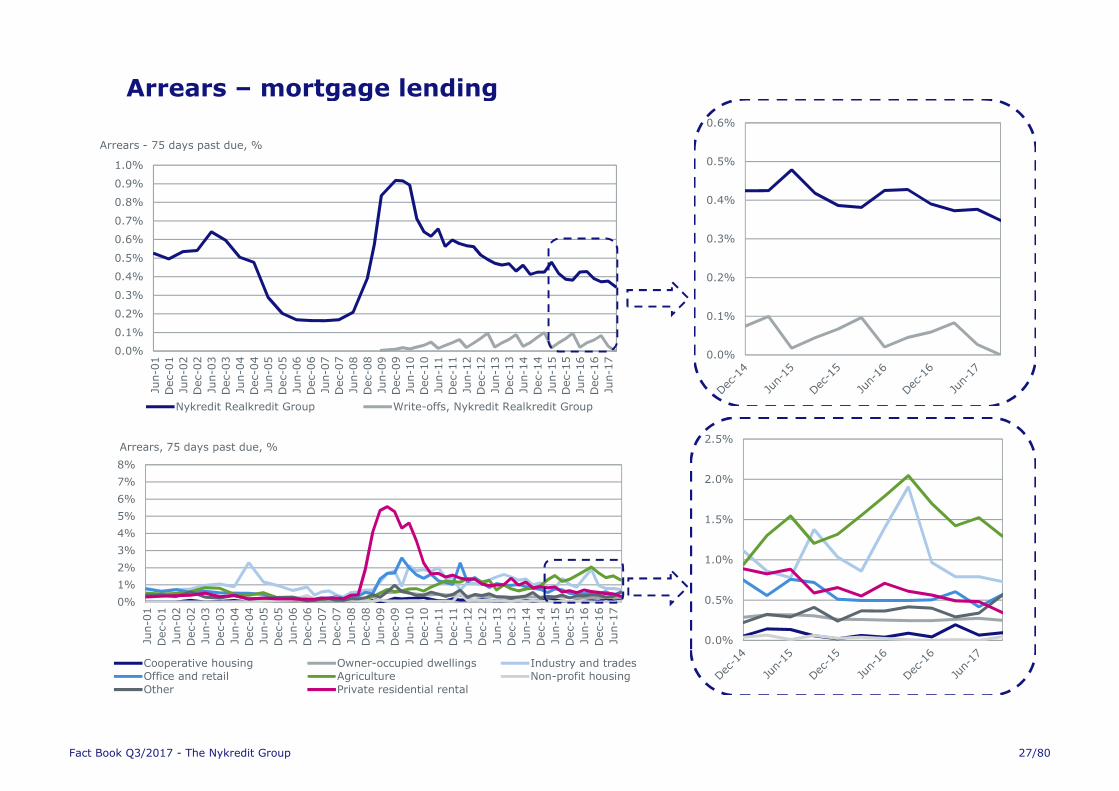
Arrears – mortgage lending
0.0%
0.1%
0.2%
0.3%
0.4%
0.5%
0.6%
0%
1%
2%
3%
4%
5%
6%
7%
8%
Jun-0
1
Dec-0
1
Jun-0
2
Dec-0
2
Jun-0
3
Dec-0
3
Jun-0
4
Dec-0
4
Jun-0
5
Dec-0
5
Jun-0
6
Dec-0
6
Jun-0
7
Dec-0
7
Jun-0
8
Dec-0
8
Jun-0
9
Dec-0
9
Jun-1
0
Dec-1
0
Jun-1
1
Dec-1
1
Jun-1
2
Dec-1
2
Jun-1
3
Dec-1
3
Jun-1
4
Dec-1
4
Jun-1
5
Dec-1
5
Jun-1
6
Dec-1
6
Jun-1
7
Arrears, 75 days past due, %
Cooperative housing Owner-occupied dwellings Industry and tradesOffice and retail Agriculture Non-profit housingOther Private residential rental
0.0%
0.5%
1.0%
1.5%
2.0%
2.5%
0.0%
0.1%
0.2%
0.3%
0.4%
0.5%
0.6%
0.7%
0.8%
0.9%
1.0%Ju
n-0
1
Dec-0
1
Jun-0
2
Dec-0
2
Jun-0
3
Dec-0
3
Jun-0
4
Dec-0
4
Jun-0
5
Dec-0
5
Jun-0
6
Dec-0
6
Jun-0
7
Dec-0
7
Jun-0
8
Dec-0
8
Jun-0
9
Dec-0
9
Jun-1
0
Dec-1
0
Jun-1
1
Dec-1
1
Jun-1
2
Dec-1
2
Jun-1
3
Dec-1
3
Jun-1
4
Dec-1
4
Jun-1
5
Dec-1
5
Jun-1
6
Dec-1
6
Jun-1
7
Arrears - 75 days past due, %
Nykredit Realkredit Group Write-offs, Nykredit Realkredit Group
Fact Book Q3/2017 - The Nykredit Group 27/80
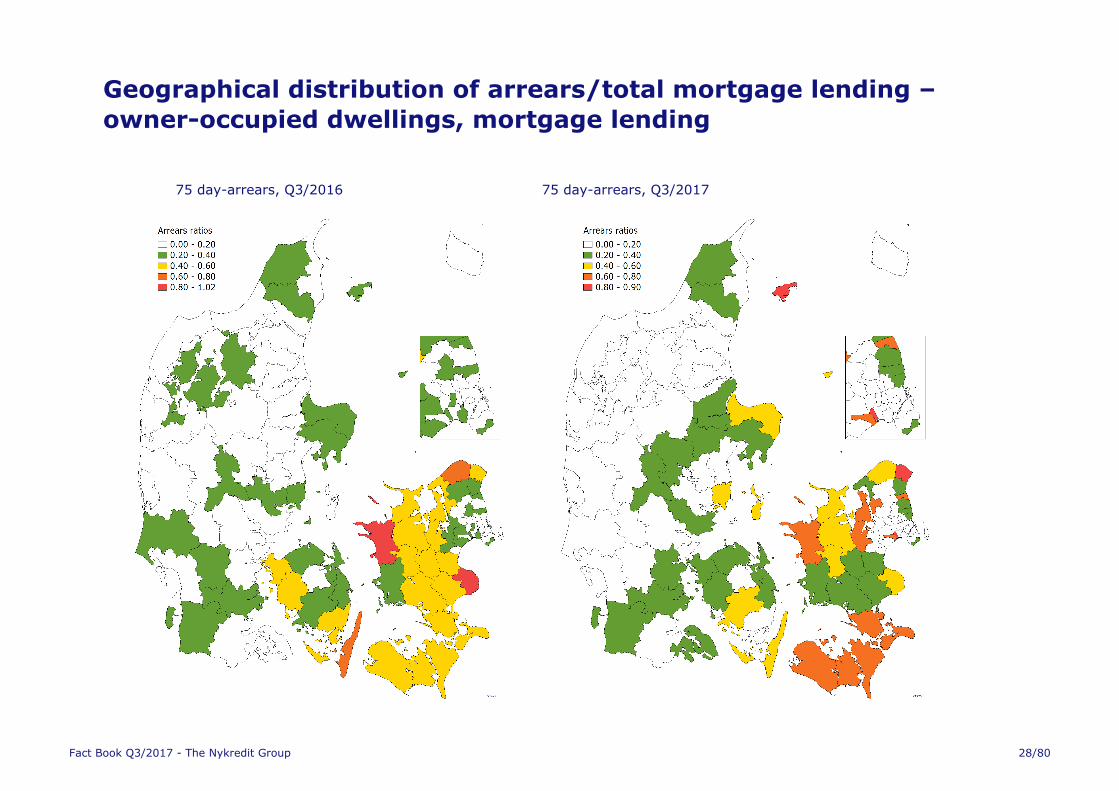
Geographical distribution of arrears/total mortgage lending –
owner-occupied dwellings, mortgage lending
75 day-arrears, Q3/2016 75 day-arrears, Q3/2017
Fact Book Q3/2017 - The Nykredit Group 28/80
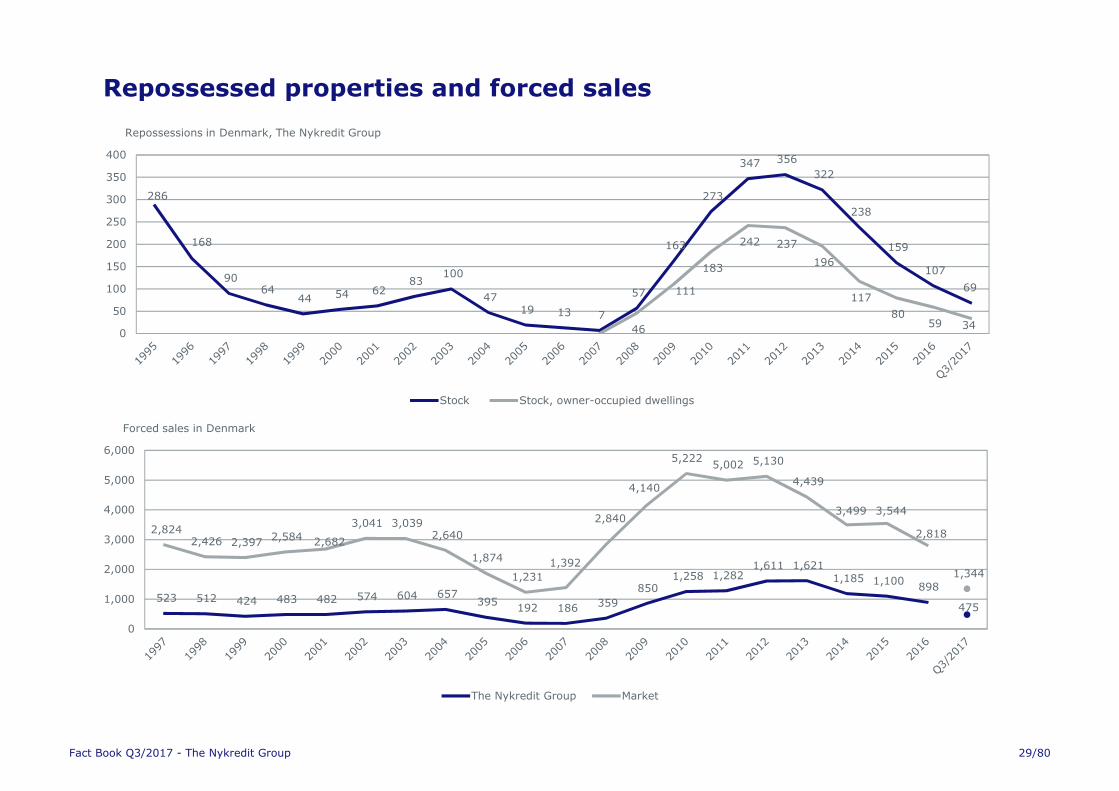
Repossessed properties and forced sales
286
168
90 64
44 54 62 83
100
47 19 13 7
57
163
273
347 356
322
238
159
107
69
46
111
183
242 237
196
117
80 59 34
0
50
100
150
200
250
300
350
400
Repossessions in Denmark, The Nykredit Group
Stock Stock, owner-occupied dwellings
523 512 424 483 482 574 604 657 395
192 186 359
850 1,258 1,282
1,611 1,621 1,185 1,100
898
475
2,824 2,426 2,397
2,584 2,682
3,041 3,039 2,640
1,874
1,231
1,392
2,840
4,140
5,222 5,002 5,130
4,439
3,499 3,544
2,818
1,344
0
1,000
2,000
3,000
4,000
5,000
6,000
Forced sales in Denmark
The Nykredit Group Market
Fact Book Q3/2017 - The Nykredit Group 29/80
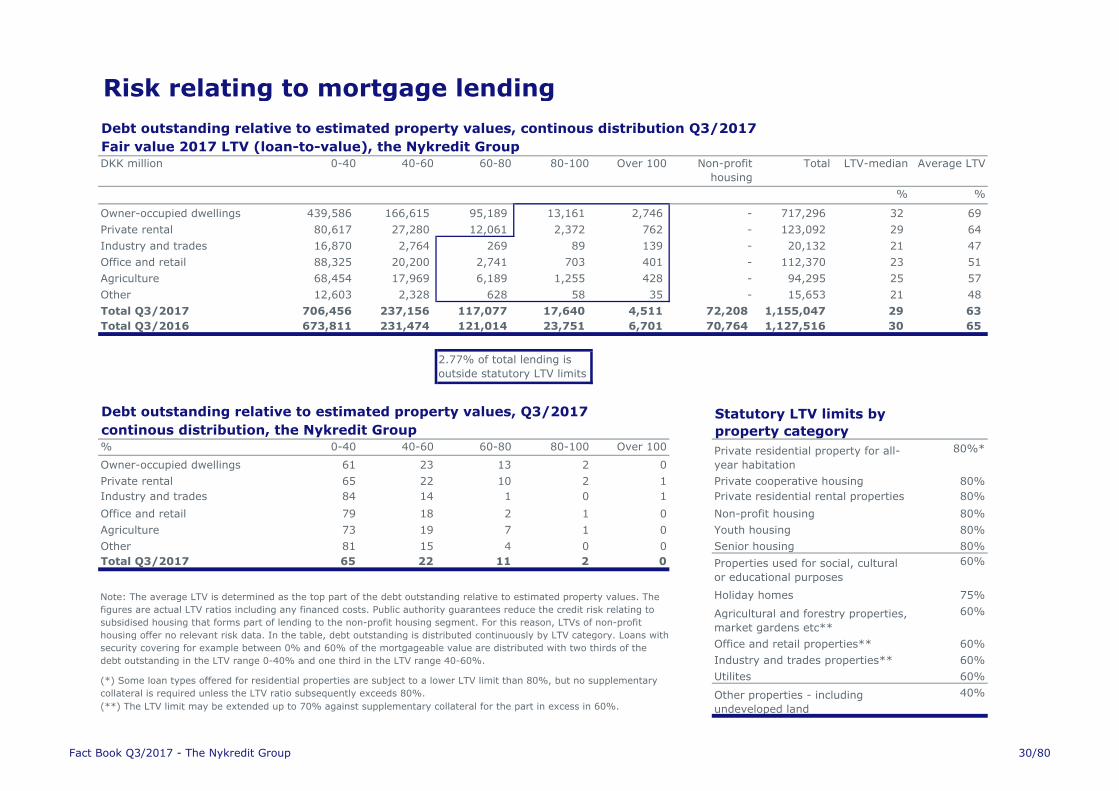
Risk relating to mortgage lending
Debt outstanding relative to estimated property values, continous distribution Q3/2017
DKK million 0-40 40-60 60-80 80-100 Over 100 Total LTV-median Average LTV
% %
Owner-occupied dwellings 439,586 166,615 95,189 13,161 2,746 717,296 32 69
Private rental 80,617 27,280 12,061 2,372 762 123,092 29 64
Industry and trades 16,870 2,764 269 89 139 20,132 21 47
Office and retail 88,325 20,200 2,741 703 401 112,370 23 51
Agriculture 68,454 17,969 6,189 1,255 428 94,295 25 57
Other 12,603 2,328 628 58 35 15,653 21 48
Total Q3/2017 706,456 237,156 117,077 17,640 4,511 1,155,047 29 63
Total Q3/2016 673,811 231,474 121,014 23,751 6,701 1,127,516 30 65
% 0-40 40-60 60-80 80-100 Over 100 80%*
Owner-occupied dwellings 61 23 13 2 0
Private rental 65 22 10 2 1 80%
Industry and trades 84 14 1 0 1 80%
Office and retail 79 18 2 1 0 80%
Agriculture 73 19 7 1 0 80%
Other 81 15 4 0 0 80%
Total Q3/2017 65 22 11 2 0 60%
75%
60%
60%
60%
60%
40%(**) The LTV limit may be extended up to 70% against supplementary collateral for the part in excess in 60%.
Industry and trades properties**
Utilites
Other properties - including
undeveloped land
Office and retail properties**
Note: The average LTV is determined as the top part of the debt outstanding relative to estimated property values. The
figures are actual LTV ratios including any financed costs. Public authority guarantees reduce the credit risk relating to
subsidised housing that forms part of lending to the non-profit housing segment. For this reason, LTVs of non-profit
housing offer no relevant risk data. In the table, debt outstanding is distributed continuously by LTV category. Loans with
security covering for example between 0% and 60% of the mortgageable value are distributed with two thirds of the
debt outstanding in the LTV range 0-40% and one third in the LTV range 40-60%.
(*) Some loan types offered for residential properties are subject to a lower LTV limit than 80%, but no supplementary
collateral is required unless the LTV ratio subsequently exceeds 80%.
Properties used for social, cultural
or educational purposes
Holiday homes
Agricultural and forestry properties,
market gardens etc**
Private residential property for all-
year habitation
Youth housing
Senior housing
Private cooperative housing
Private residential rental properties
Non-profit housing
2.77% of total lending is
outside statutory LTV limits
Fair value 2017 LTV (loan-to-value), the Nykredit Group
continous distribution, the Nykredit Group
Debt outstanding relative to estimated property values, Q3/2017
-
Non-profit
housing
-
-
-
-
-
72,208
70,764
Statutory LTV limits by
property category
Fact Book Q3/2017 - The Nykredit Group 30/80
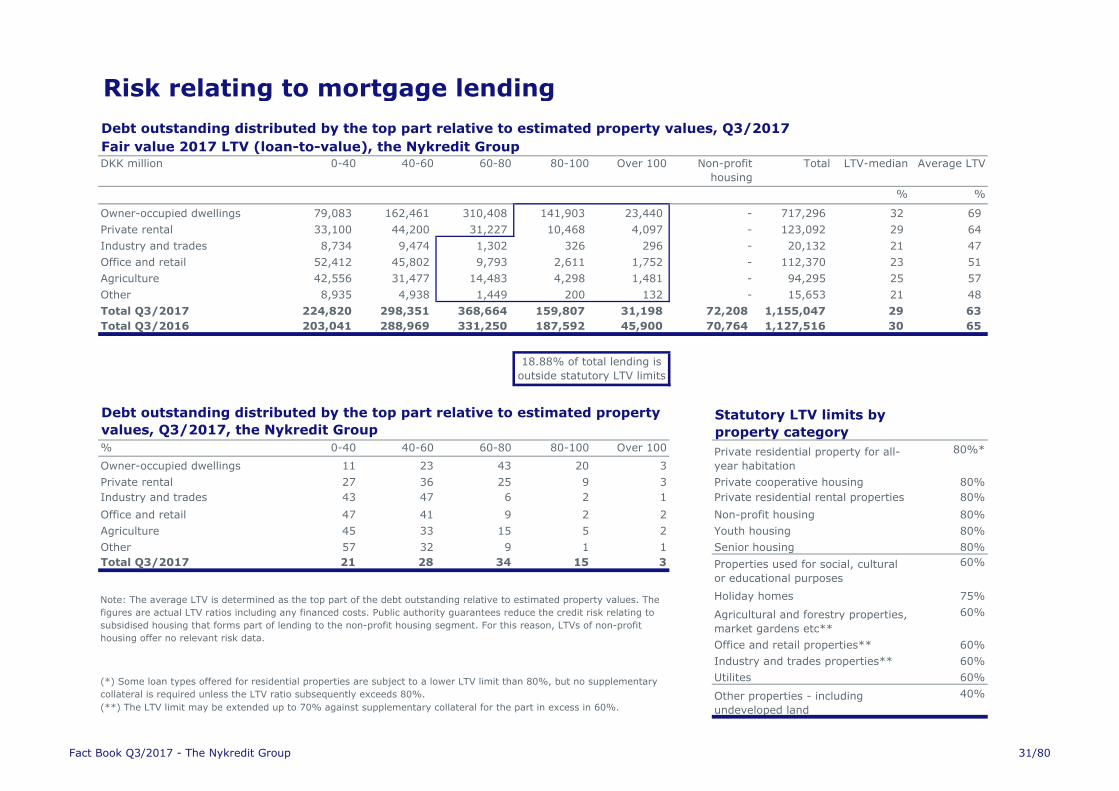
Risk relating to mortgage lending
DKK million 0-40 40-60 60-80 80-100 Over 100 Total LTV-median Average LTV
% %
Owner-occupied dwellings 79,083 162,461 310,408 141,903 23,440 717,296 32 69
Private rental 33,100 44,200 31,227 10,468 4,097 123,092 29 64
Industry and trades 8,734 9,474 1,302 326 296 20,132 21 47
Office and retail 52,412 45,802 9,793 2,611 1,752 112,370 23 51
Agriculture 42,556 31,477 14,483 4,298 1,481 94,295 25 57
Other 8,935 4,938 1,449 200 132 15,653 21 48
Total Q3/2017 224,820 298,351 368,664 159,807 31,198 1,155,047 29 63
Total Q3/2016 203,041 288,969 331,250 187,592 45,900 1,127,516 30 65
% 0-40 40-60 60-80 80-100 Over 100 80%*
Owner-occupied dwellings 11 23 43 20 3
Private rental 27 36 25 9 3 80%
Industry and trades 43 47 6 2 1 80%
Office and retail 47 41 9 2 2 80%
Agriculture 45 33 15 5 2 80%
Other 57 32 9 1 1 80%
Total Q3/2017 21 28 34 15 3 60%
75%
60%
60%
60%
60%
40%
Statutory LTV limits by
property category
Private residential property for all-
year habitation
Debt outstanding distributed by the top part relative to estimated property
values, Q3/2017, the Nykredit Group
18.88% of total lending is
outside statutory LTV limits
-
-
-
-
72,208
Debt outstanding distributed by the top part relative to estimated property values, Q3/2017
Other properties - including
undeveloped land(**) The LTV limit may be extended up to 70% against supplementary collateral for the part in excess in 60%.
(*) Some loan types offered for residential properties are subject to a lower LTV limit than 80%, but no supplementary
collateral is required unless the LTV ratio subsequently exceeds 80%.
Note: The average LTV is determined as the top part of the debt outstanding relative to estimated property values. The
figures are actual LTV ratios including any financed costs. Public authority guarantees reduce the credit risk relating to
subsidised housing that forms part of lending to the non-profit housing segment. For this reason, LTVs of non-profit
housing offer no relevant risk data.
Properties used for social, cultural
or educational purposes
Non-profit housing
Youth housing
Senior housing
Fair value 2017 LTV (loan-to-value), the Nykredit GroupNon-profit
housing
-
-
70,764
Private cooperative housing
Private residential rental properties
Holiday homes
Agricultural and forestry properties,
market gardens etc**
Office and retail properties**
Industry and trades properties**
Utilites
Fact Book Q3/2017 - The Nykredit Group 31/80
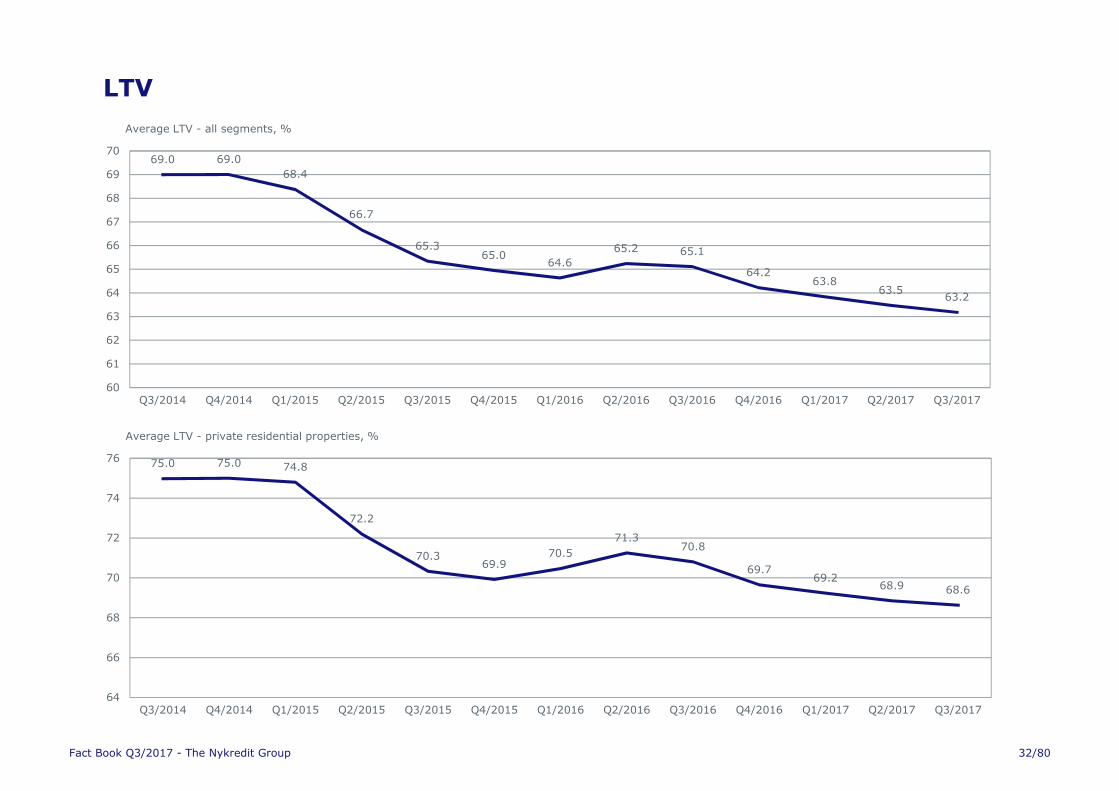
LTV
69.0 69.0
68.4
66.7
65.365.0
64.6
65.2 65.1
64.263.8
63.563.2
60
61
62
63
64
65
66
67
68
69
70
Q3/2014 Q4/2014 Q1/2015 Q2/2015 Q3/2015 Q4/2015 Q1/2016 Q2/2016 Q3/2016 Q4/2016 Q1/2017 Q2/2017 Q3/2017
Average LTV - all segments, %
75.0 75.0 74.8
72.2
70.369.9
70.5
71.370.8
69.769.2
68.9 68.6
64
66
68
70
72
74
76
Q3/2014 Q4/2014 Q1/2015 Q2/2015 Q3/2015 Q4/2015 Q1/2016 Q2/2016 Q3/2016 Q4/2016 Q1/2017 Q2/2017 Q3/2017
Average LTV - private residential properties, %
Fact Book Q3/2017 - The Nykredit Group 32/80
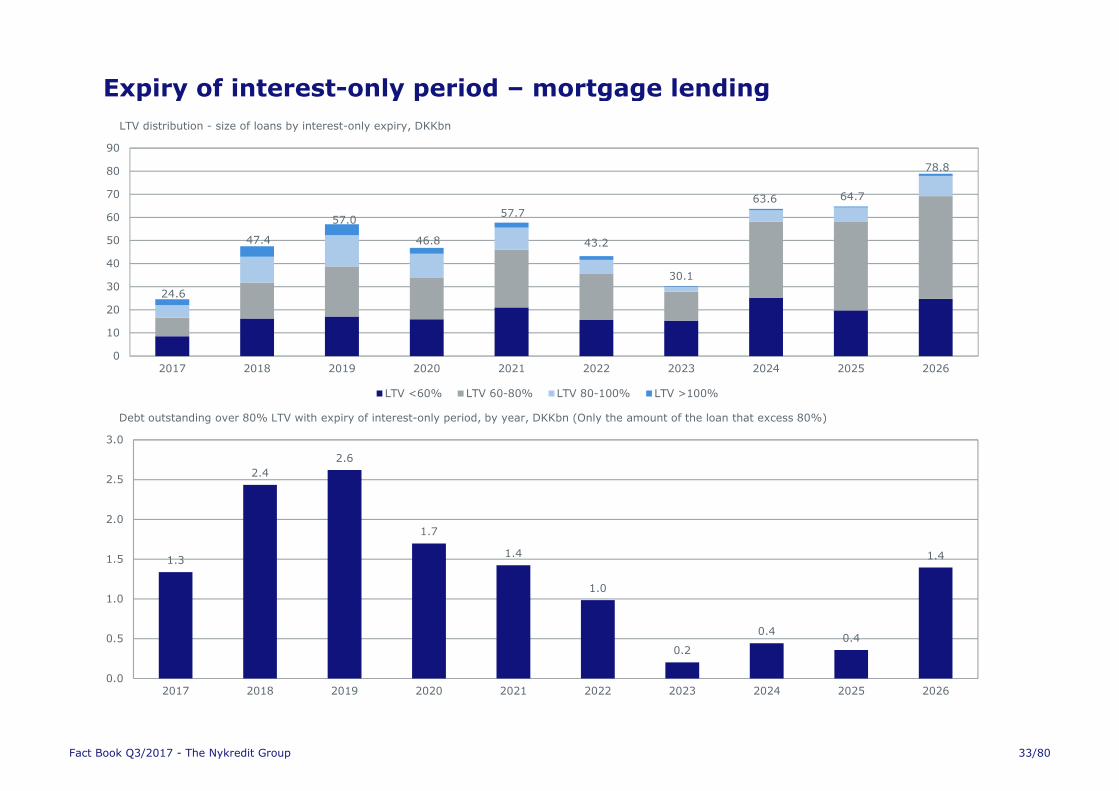
Expiry of interest-only period – mortgage lending
24.6
47.4
57.0
46.8
57.7
43.2
30.1
63.6 64.7
78.8
0
10
20
30
40
50
60
70
80
90
2017 2018 2019 2020 2021 2022 2023 2024 2025 2026
LTV distribution - size of loans by interest-only expiry, DKKbn
LTV <60% LTV 60-80% LTV 80-100% LTV >100%
1.3
2.4
2.6
1.7
1.4
1.0
0.2
0.40.4
1.4
0.0
0.5
1.0
1.5
2.0
2.5
3.0
2017 2018 2019 2020 2021 2022 2023 2024 2025 2026
Debt outstanding over 80% LTV with expiry of interest-only period, by year, DKKbn (Only the amount of the loan that excess 80%)
Fact Book Q3/2017 - The Nykredit Group 33/80
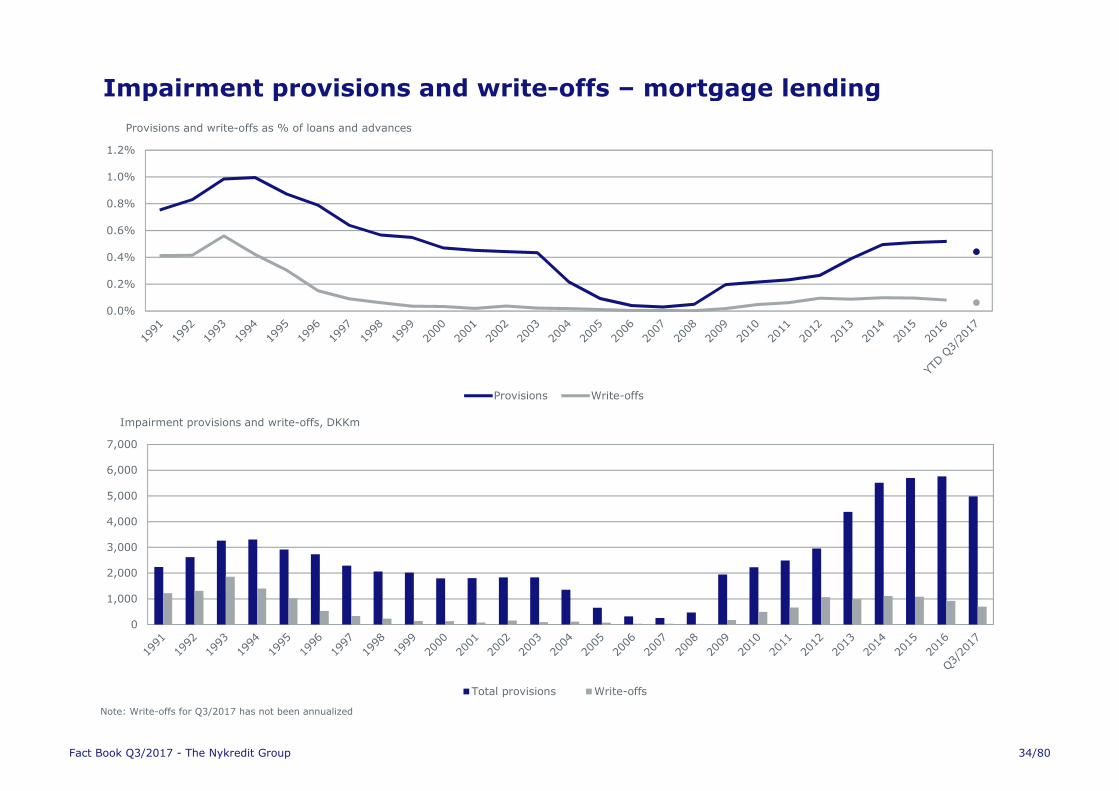
Impairment provisions and write-offs – mortgage lending
Note: Write-offs for Q3/2017 has not been annualized
0
1,000
2,000
3,000
4,000
5,000
6,000
7,000
Impairment provisions and write-offs, DKKm
Total provisions Write-offs
0.0%
0.2%
0.4%
0.6%
0.8%
1.0%
1.2%
Provisions and write-offs as % of loans and advances
Provisions Write-offs
Fact Book Q3/2017 - The Nykredit Group 34/80
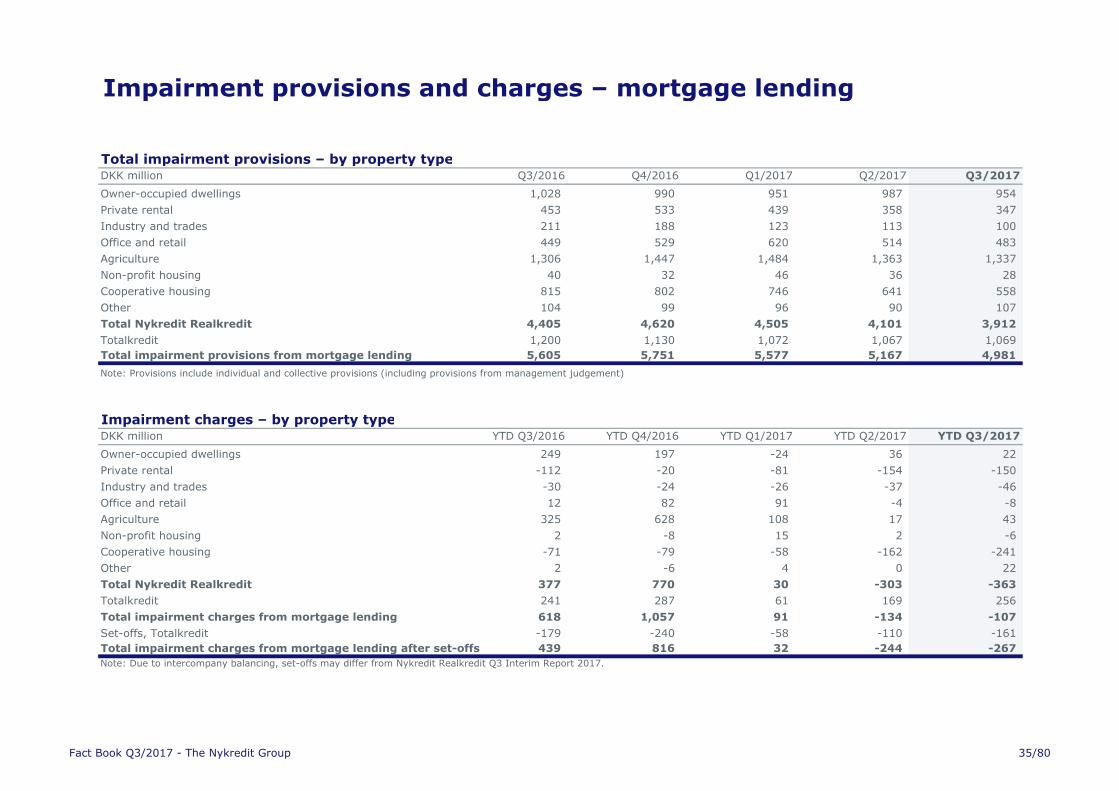
Impairment provisions and charges – mortgage lending
Total impairment provisions – by property typeDKK million Q3/2016 Q4/2016 Q1/2017 Q2/2017 Q3/2017
Owner-occupied dwellings 1,028 990 951 987 954
Private rental 453 533 439 358 347
Industry and trades 211 188 123 113 100
Office and retail 449 529 620 514 483
Agriculture 1,306 1,447 1,484 1,363 1,337
Non-profit housing 40 32 46 36 28
Cooperative housing 815 802 746 641 558
Other 104 99 96 90 107
Total Nykredit Realkredit 4,405 4,620 4,505 4,101 3,912
Totalkredit 1,200 1,130 1,072 1,067 1,069
Total impairment provisions from mortgage lending 5,605 5,751 5,577 5,167 4,981
Note: Provisions include individual and collective provisions (including provisions from management judgement)
Impairment charges – by property typeDKK million YTD Q3/2016 YTD Q4/2016 YTD Q1/2017 YTD Q2/2017 YTD Q3/2017
Owner-occupied dwellings 249 197 -24 36 22
Private rental -112 -20 -81 -154 -150
Industry and trades -30 -24 -26 -37 -46
Office and retail 12 82 91 -4 -8
Agriculture 325 628 108 17 43
Non-profit housing 2 -8 15 2 -6
Cooperative housing -71 -79 -58 -162 -241
Other 2 -6 4 0 22
Total Nykredit Realkredit 377 770 30 -303 -363
Totalkredit 241 287 61 169 256
Total impairment charges from mortgage lending 618 1,057 91 -134 -107
Set-offs, Totalkredit -179 -240 -58 -110 -161
Total impairment charges from mortgage lending after set-offs 439 816 32 -244 -267
Note: Due to intercompany balancing, set-offs may differ from Nykredit Realkredit Q3 Interim Report 2017.
Fact Book Q3/2017 - The Nykredit Group 35/80
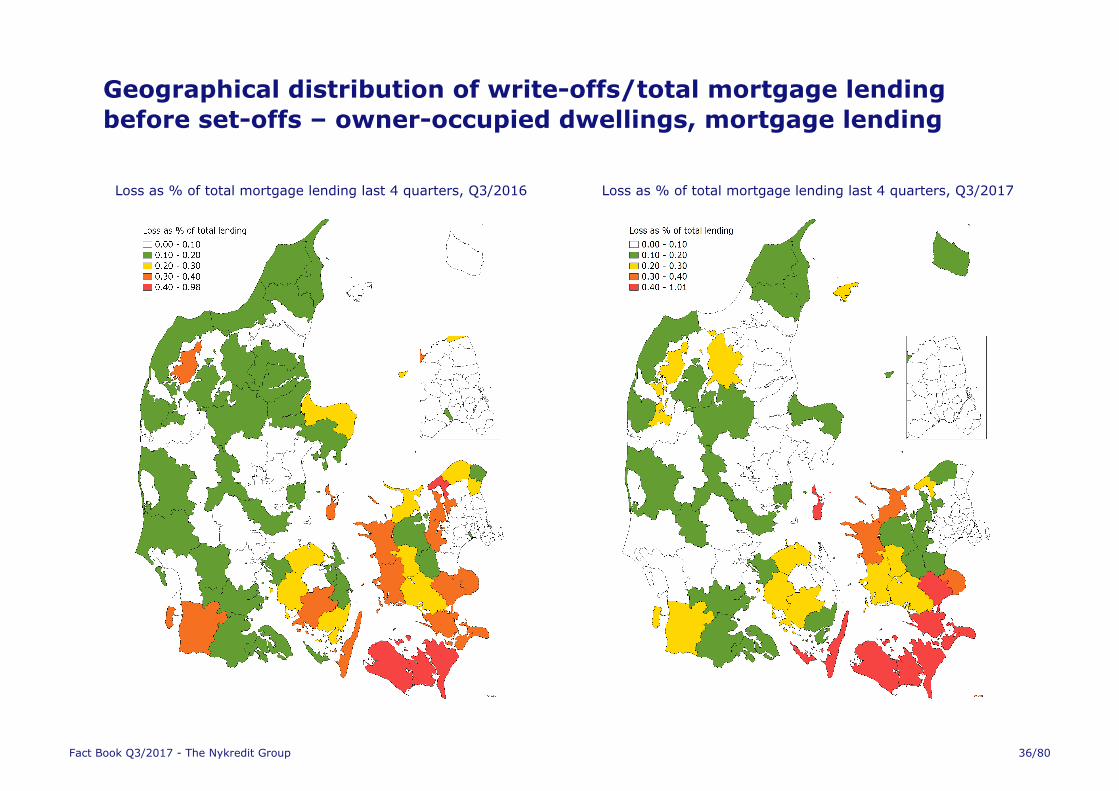
Geographical distribution of write-offs/total mortgage lending
before set-offs – owner-occupied dwellings, mortgage lending
Loss as % of total mortgage lending last 4 quarters, Q3/2016 Loss as % of total mortgage lending last 4 quarters, Q3/2017
Fact Book Q3/2017 - The Nykredit Group 36/80
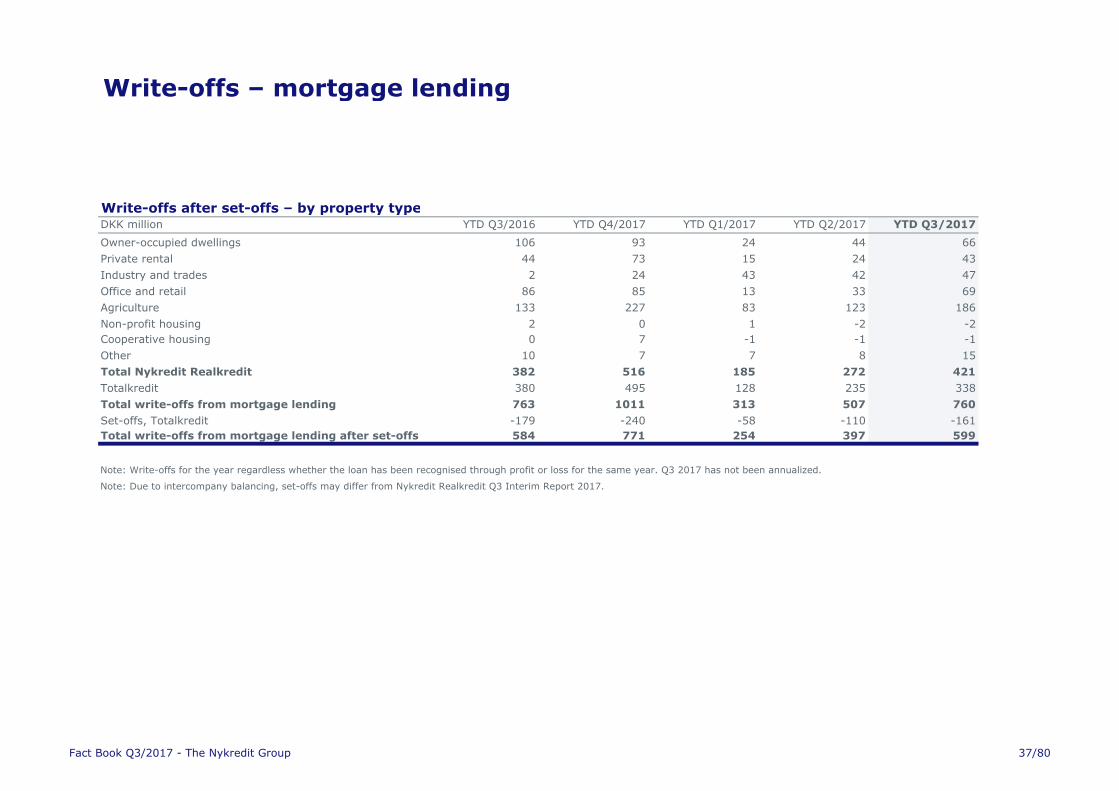
Write-offs – mortgage lending
Write-offs after set-offs – by property typeDKK million YTD Q3/2016 YTD Q4/2017 YTD Q1/2017 YTD Q2/2017 YTD Q3/2017
Owner-occupied dwellings 106 93 24 44 66
Private rental 44 73 15 24 43
Industry and trades 2 24 43 42 47
Office and retail 86 85 13 33 69
Agriculture 133 227 83 123 186
Non-profit housing 2 0 1 -2 -2
Cooperative housing 0 7 -1 -1 -1
Other 10 7 7 8 15
Total Nykredit Realkredit 382 516 185 272 421
Totalkredit 380 495 128 235 338
Total write-offs from mortgage lending 763 1011 313 507 760
Set-offs, Totalkredit -179 -240 -58 -110 -161
Total write-offs from mortgage lending after set-offs 584 771 254 397 599
Note: Write-offs for the year regardless whether the loan has been recognised through profit or loss for the same year. Q3 2017 has not been annualized.
Note: Due to intercompany balancing, set-offs may differ from Nykredit Realkredit Q3 Interim Report 2017.
Fact Book Q3/2017 - The Nykredit Group 37/80
Bank Lending: Loans, advances and guarantees
Loans and advances - the Nykredit Bank GroupDKK million Q3/2016 Q4/2016 Q1/2017 Q2/2017 Q3/2017
Public sector 379 446 428 583 825
Agriculture, hunting and forestry 2,016 2,091 2,230 2,352 2,369
Other corporate 64,361 70,352 64,875 63,832 62,085
Total commercial 66,377 72,443 67,105 66,184 64,454
Personal customers 11,230 12,205 12,172 12,287 12,159
Total 77,986 85,094 79,705 79,054 77,438
Note: Above figures includes reverse transactions
Guarantees - the Nykredit GroupDKK million Q3/2016 Q4/2016 Q1/2017 Q2/2017 Q3/2017
Public sector - - - - -
Agriculture, hunting and forestry 146 85 72 81 75
Other corporate 3,785 3,791 3,320 3,294 3,655
Total commercial 3,931 3,876 3,392 3,375 3,730
Personal customers 2,788 2,818 3,793 3,849 3,759
Total 6,720 6,694 7,185 7,224 7,488
Fact Book Q3/2017 - The Nykredit Group 38/80
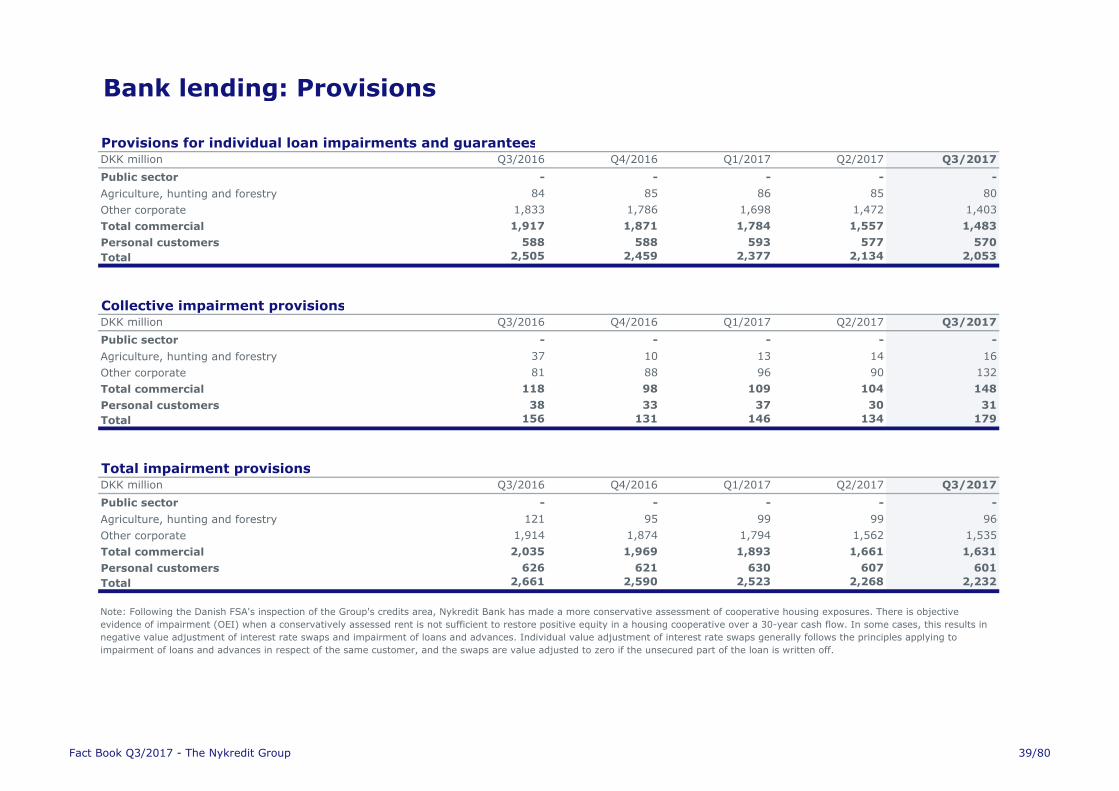
Bank lending: Provisions
Provisions for individual loan impairments and guaranteesDKK million Q3/2016 Q4/2016 Q1/2017 Q2/2017 Q3/2017
Public sector - - - - -
Agriculture, hunting and forestry 84 85 86 85 80
Other corporate 1,833 1,786 1,698 1,472 1,403
Total commercial 1,917 1,871 1,784 1,557 1,483
Personal customers 588 588 593 577 570
Total 2,505 2,459 2,377 2,134 2,053
Collective impairment provisionsDKK million Q3/2016 Q4/2016 Q1/2017 Q2/2017 Q3/2017
Public sector - - - - -
Agriculture, hunting and forestry 37 10 13 14 16
Other corporate 81 88 96 90 132
Total commercial 118 98 109 104 148
Personal customers 38 33 37 30 31
Total 156 131 146 134 179
Total impairment provisionsDKK million Q3/2016 Q4/2016 Q1/2017 Q2/2017 Q3/2017
Public sector - - - - -
Agriculture, hunting and forestry 121 95 99 99 96
Other corporate 1,914 1,874 1,794 1,562 1,535
Total commercial 2,035 1,969 1,893 1,661 1,631
Personal customers 626 621 630 607 601
Total 2,661 2,590 2,523 2,268 2,232
Note: Following the Danish FSA's inspection of the Group's credits area, Nykredit Bank has made a more conservative assessment of cooperative housing exposures. There is objective
evidence of impairment (OEI) when a conservatively assessed rent is not sufficient to restore positive equity in a housing cooperative over a 30-year cash flow. In some cases, this results in
negative value adjustment of interest rate swaps and impairment of loans and advances. Individual value adjustment of interest rate swaps generally follows the principles applying to
impairment of loans and advances in respect of the same customer, and the swaps are value adjusted to zero if the unsecured part of the loan is written off.
Fact Book Q3/2017 - The Nykredit Group 39/80
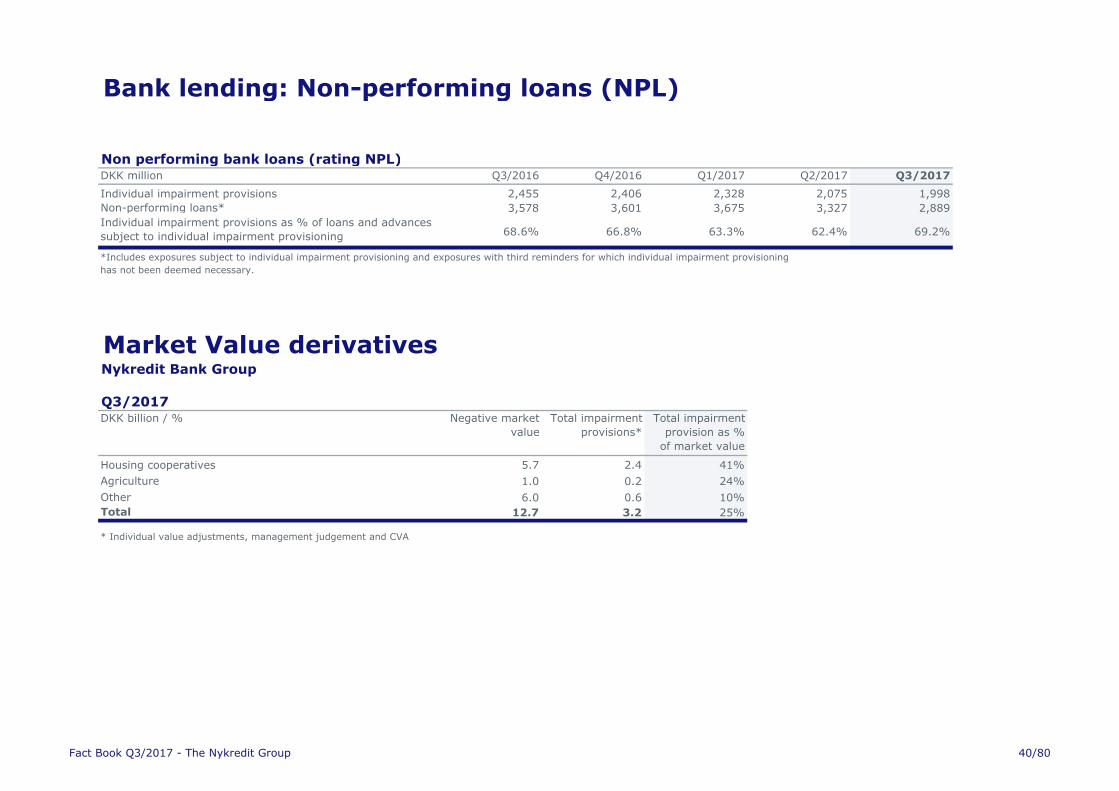
Bank lending: Non-performing loans (NPL)
Non performing bank loans (rating NPL)DKK million Q3/2016 Q4/2016 Q1/2017 Q2/2017 Q3/2017
Individual impairment provisions 2,455 2,406 2,328 2,075 1,998
Non-performing loans* 3,578 3,601 3,675 3,327 2,889
Individual impairment provisions as % of loans and advances
subject to individual impairment provisioning 68.6% 66.8% 63.3% 62.4% 69.2%
Market Value derivativesNykredit Bank Group
Q3/2017DKK billion / % Negative market
value
Total impairment
provisions*
Total impairment
provision as %
of market value
Housing cooperatives 5.7 2.4 41%
Agriculture 1.0 0.2 24%
Other 6.0 0.6 10%
Total 12.7 3.2 25%
* Individual value adjustments, management judgement and CVA
*Includes exposures subject to individual impairment provisioning and exposures with third reminders for which individual impairment provisioning
has not been deemed necessary.
Fact Book Q3/2017 - The Nykredit Group 40/80
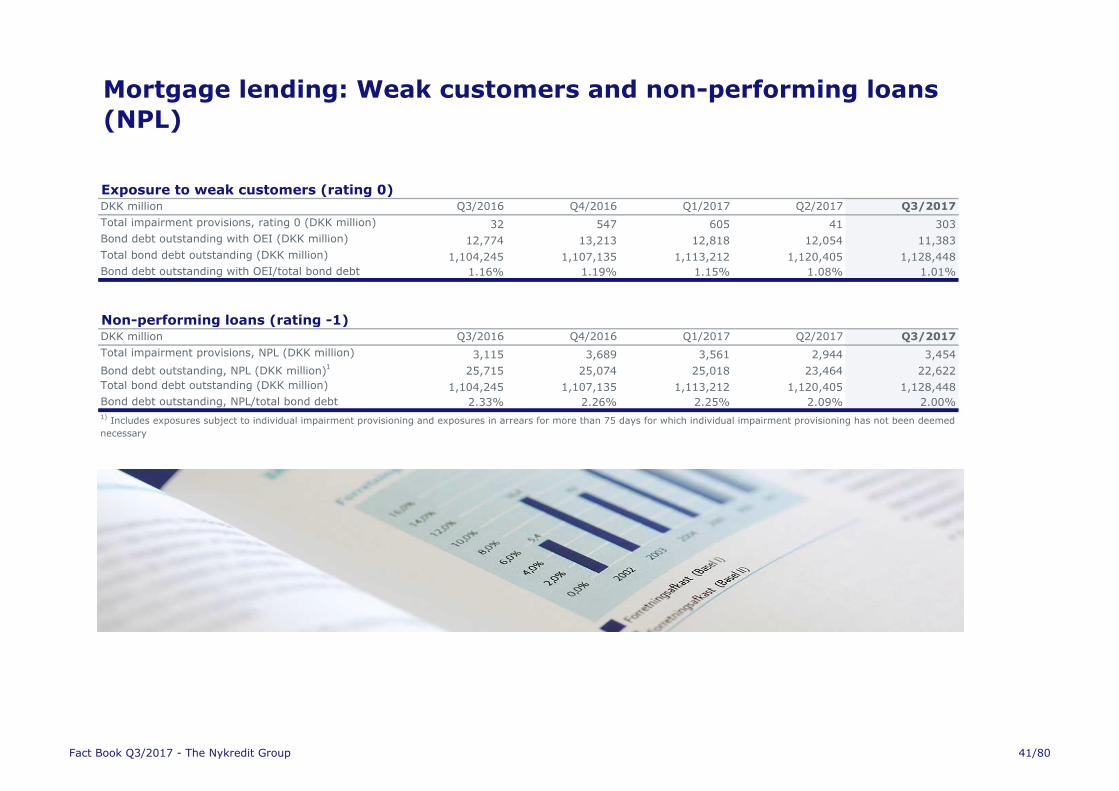
Exposure to weak customers (rating 0)DKK million Q3/2016 Q4/2016 Q1/2017 Q2/2017 Q3/2017
Total impairment provisions, rating 0 (DKK million) 32 547 605 41 303
Bond debt outstanding with OEI (DKK million) 12,774 13,213 12,818 12,054 11,383
Total bond debt outstanding (DKK million) 1,104,245 1,107,135 1,113,212 1,120,405 1,128,448
Bond debt outstanding with OEI/total bond debt
outstanding (%)
1.16% 1.19% 1.15% 1.08% 1.01%
Non-performing loans (rating -1)DKK million Q3/2016 Q4/2016 Q1/2017 Q2/2017 Q3/2017
Total impairment provisions, NPL (DKK million) 3,115 3,689 3,561 2,944 3,454
Bond debt outstanding, NPL (DKK million)125,715 25,074 25,018 23,464 22,622
Total bond debt outstanding (DKK million) 1,104,245 1,107,135 1,113,212 1,120,405 1,128,448
Bond debt outstanding, NPL/total bond debt
outstanding (%)
2.33% 2.26% 2.25% 2.09% 2.00%1)
Includes exposures subject to individual impairment provisioning and exposures in arrears for more than 75 days for which individual impairment provisioning has not been deemed
necessary
Mortgage lending: Weak customers and non-performing loans
(NPL)
Fact Book Q3/2017 - The Nykredit Group 41/80
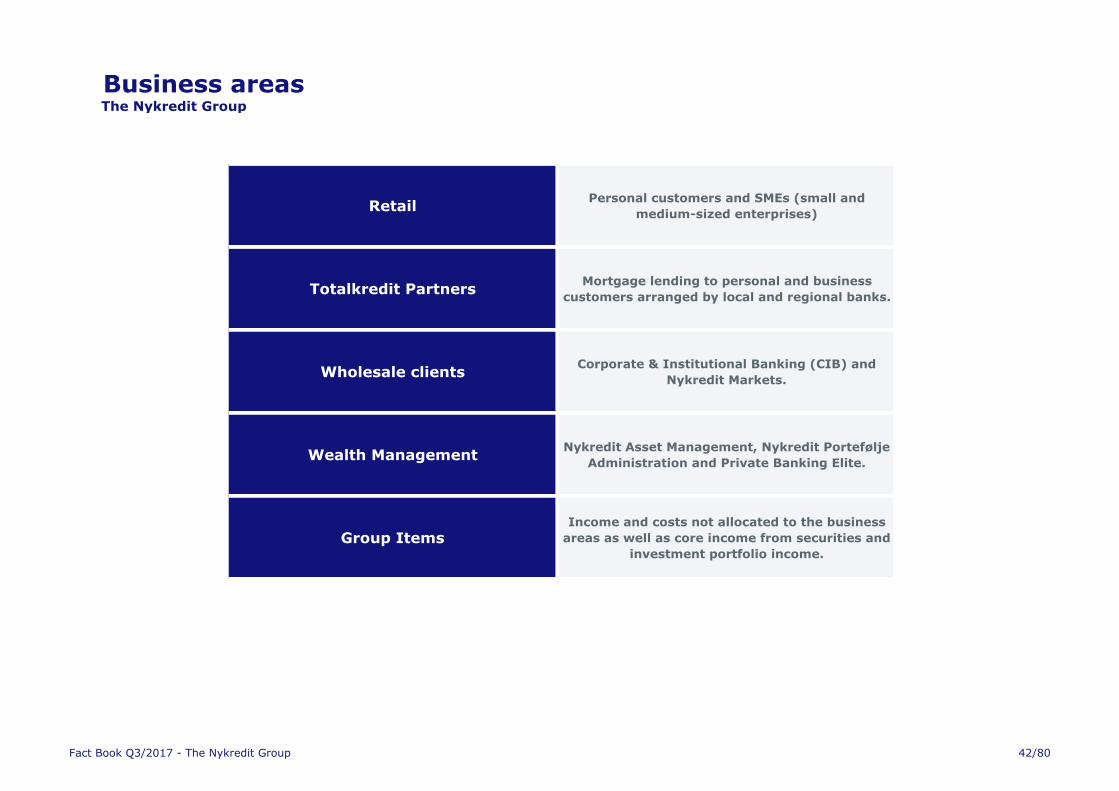
The Nykredit Group
RetailPersonal customers and SMEs (small and
medium-sized enterprises)
Totalkredit PartnersMortgage lending to personal and business
customers arranged by local and regional banks.
Wholesale clientsCorporate & Institutional Banking (CIB) and
Nykredit Markets.
Wealth ManagementNykredit Asset Management, Nykredit Portefølje
Administration and Private Banking Elite.
Group ItemsIncome and costs not allocated to the business
areas as well as core income from securities and
investment portfolio income.
Business areas
Fact Book Q3/2017 - The Nykredit Group 42/80
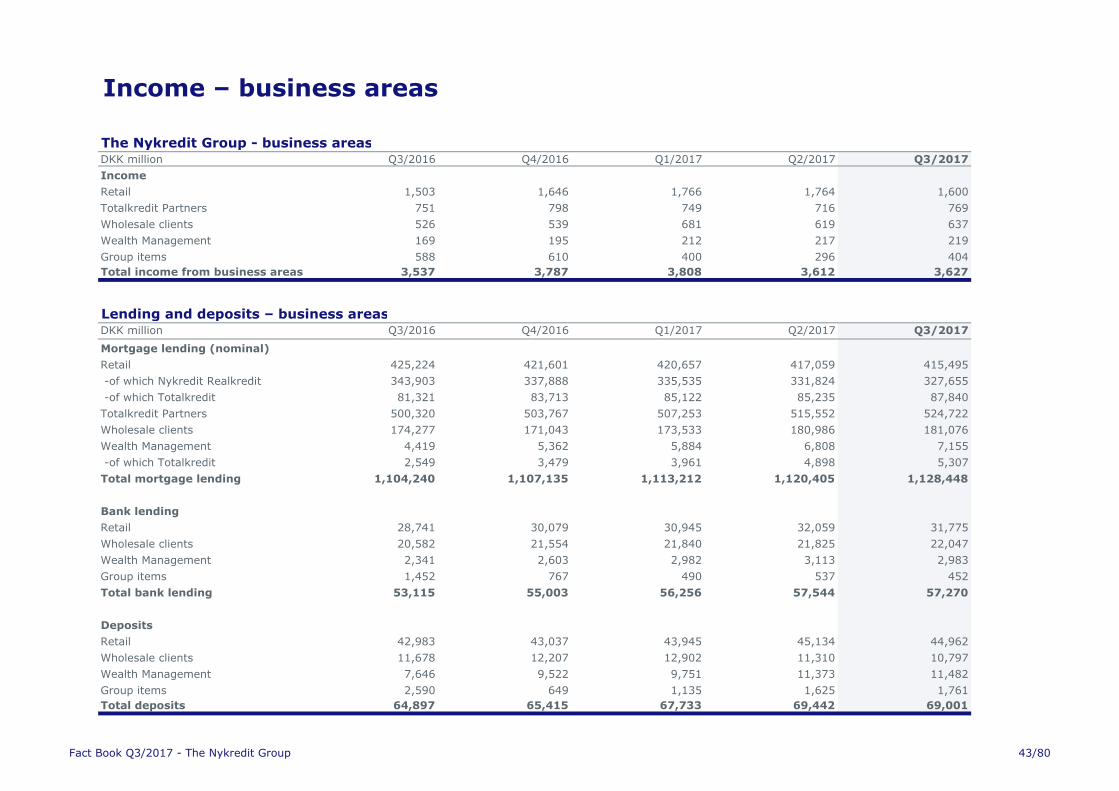
Income – business areas
The Nykredit Group - business areasDKK million Q3/2016 Q4/2016 Q1/2017 Q2/2017 Q3/2017
Income
Retail 1,503 1,646 1,766 1,764 1,600
Totalkredit Partners 751 798 749 716 769
Wholesale clients 526 539 681 619 637
Wealth Management 169 195 212 217 219
Group items 588 610 400 296 404
Total income from business areas 3,537 3,787 3,808 3,612 3,627
Lending and deposits – business areasDKK million Q3/2016 Q4/2016 Q1/2017 Q2/2017 Q3/2017
Mortgage lending (nominal)
Retail 425,224 421,601 420,657 417,059 415,495
-of which Nykredit Realkredit 343,903 337,888 335,535 331,824 327,655
-of which Totalkredit 81,321 83,713 85,122 85,235 87,840
Totalkredit Partners 500,320 503,767 507,253 515,552 524,722
Wholesale clients 174,277 171,043 173,533 180,986 181,076
Wealth Management 4,419 5,362 5,884 6,808 7,155
-of which Totalkredit 2,549 3,479 3,961 4,898 5,307
Total mortgage lending 1,104,240 1,107,135 1,113,212 1,120,405 1,128,448
Bank lending
Retail 28,741 30,079 30,945 32,059 31,775
Wholesale clients 20,582 21,554 21,840 21,825 22,047
Wealth Management 2,341 2,603 2,982 3,113 2,983
Group items 1,452 767 490 537 452
Total bank lending 53,115 55,003 56,256 57,544 57,270
Deposits
Retail 42,983 43,037 43,945 45,134 44,962
Wholesale clients 11,678 12,207 12,902 11,310 10,797
Wealth Management 7,646 9,522 9,751 11,373 11,482
Group items 2,590 649 1,135 1,625 1,761
Total deposits 64,897 65,415 67,733 69,442 69,001
Fact Book Q3/2017 - The Nykredit Group 43/80
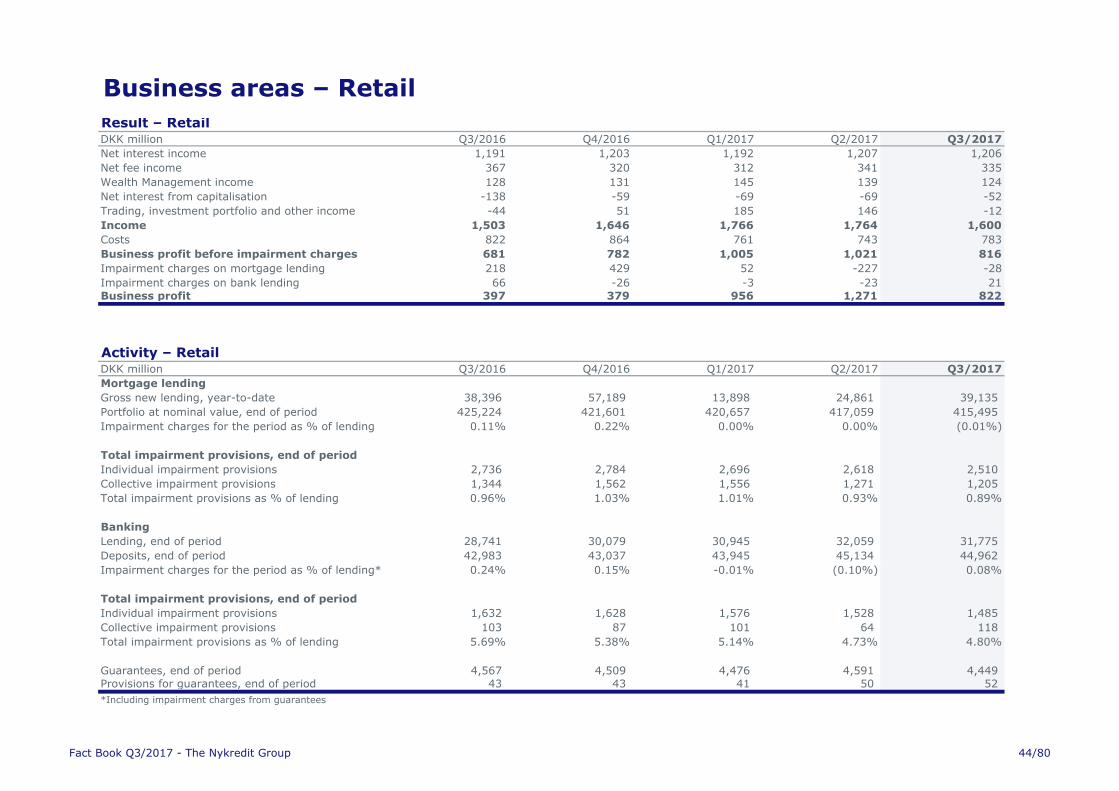
Business areas – Retail
Result – RetailDKK million Q3/2016 Q4/2016 Q1/2017 Q2/2017 Q3/2017
Net interest income 1,191 1,203 1,192 1,207 1,206
Net fee income 367 320 312 341 335
Wealth Management income 128 131 145 139 124
Net interest from capitalisation -138 -59 -69 -69 -52
Trading, investment portfolio and other income -44 51 185 146 -12
Income 1,503 1,646 1,766 1,764 1,600
Costs 822 864 761 743 783
Business profit before impairment charges 681 782 1,005 1,021 816
Impairment charges on mortgage lending 218 429 52 -227 -28
Impairment charges on bank lending 66 -26 -3 -23 21Business profit 397 379 956 1,271 822
Activity – RetailDKK million Q3/2016 Q4/2016 Q1/2017 Q2/2017 Q3/2017
Mortgage lending
Gross new lending, year-to-date 38,396 57,189 13,898 24,861 39,135
Portfolio at nominal value, end of period 425,224 421,601 420,657 417,059 415,495
Impairment charges for the period as % of lending 0.11% 0.22% 0.00% 0.00% (0.01%)
Total impairment provisions, end of period
Individual impairment provisions 2,736 2,784 2,696 2,618 2,510
Collective impairment provisions 1,344 1,562 1,556 1,271 1,205
Total impairment provisions as % of lending 0.96% 1.03% 1.01% 0.93% 0.89%
Banking
Lending, end of period 28,741 30,079 30,945 32,059 31,775
Deposits, end of period 42,983 43,037 43,945 45,134 44,962
Impairment charges for the period as % of lending* 0.24% 0.15% -0.01% (0.10%) 0.08%
Total impairment provisions, end of period
Individual impairment provisions 1,632 1,628 1,576 1,528 1,485
Collective impairment provisions 103 87 101 64 118
Total impairment provisions as % of lending 5.69% 5.38% 5.14% 4.73% 4.80%
Guarantees, end of period 4,567 4,509 4,476 4,591 4,449 Provisions for guarantees, end of period 43 43 41 50 52
*Including impairment charges from guarantees
Fact Book Q3/2017 - The Nykredit Group 44/80
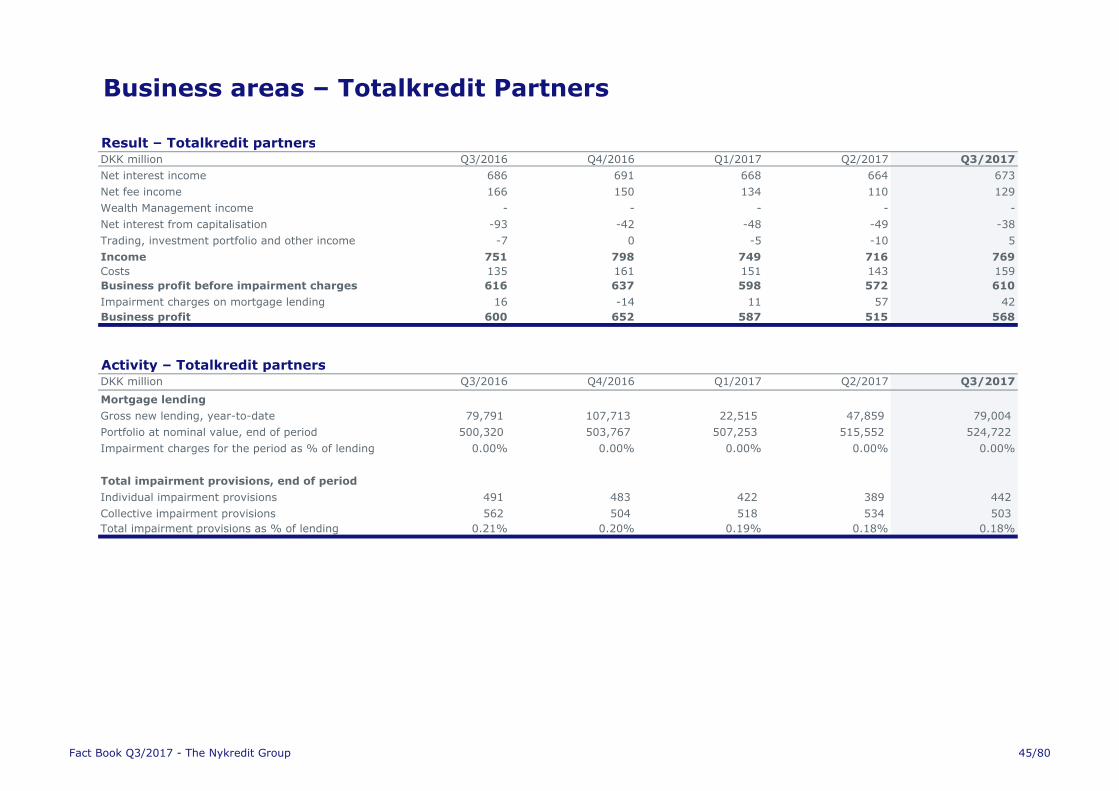
Business areas – Totalkredit Partners
Result – Totalkredit partnersDKK million Q3/2016 Q4/2016 Q1/2017 Q2/2017 Q3/2017
Net interest income 686 691 668 664 673
Net fee income 166 150 134 110 129
Wealth Management income - - - - -
Net interest from capitalisation -93 -42 -48 -49 -38
Trading, investment portfolio and other income -7 0 -5 -10 5
Income 751 798 749 716 769
Costs 135 161 151 143 159
Business profit before impairment charges 616 637 598 572 610
Impairment charges on mortgage lending 16 -14 11 57 42
Business profit 600 652 587 515 568
Activity – Totalkredit partnersDKK million Q3/2016 Q4/2016 Q1/2017 Q2/2017 Q3/2017
Mortgage lending
Gross new lending, year-to-date 79,791 107,713 22,515 47,859 79,004
Portfolio at nominal value, end of period 500,320 503,767 507,253 515,552 524,722
Impairment charges for the period as % of lending 0.00% 0.00% 0.00% 0.00% 0.00%
Total impairment provisions, end of period
Individual impairment provisions 491 483 422 389 442
Collective impairment provisions 562 504 518 534 503
Total impairment provisions as % of lending 0.21% 0.20% 0.19% 0.18% 0.18%
Fact Book Q3/2017 - The Nykredit Group 45/80
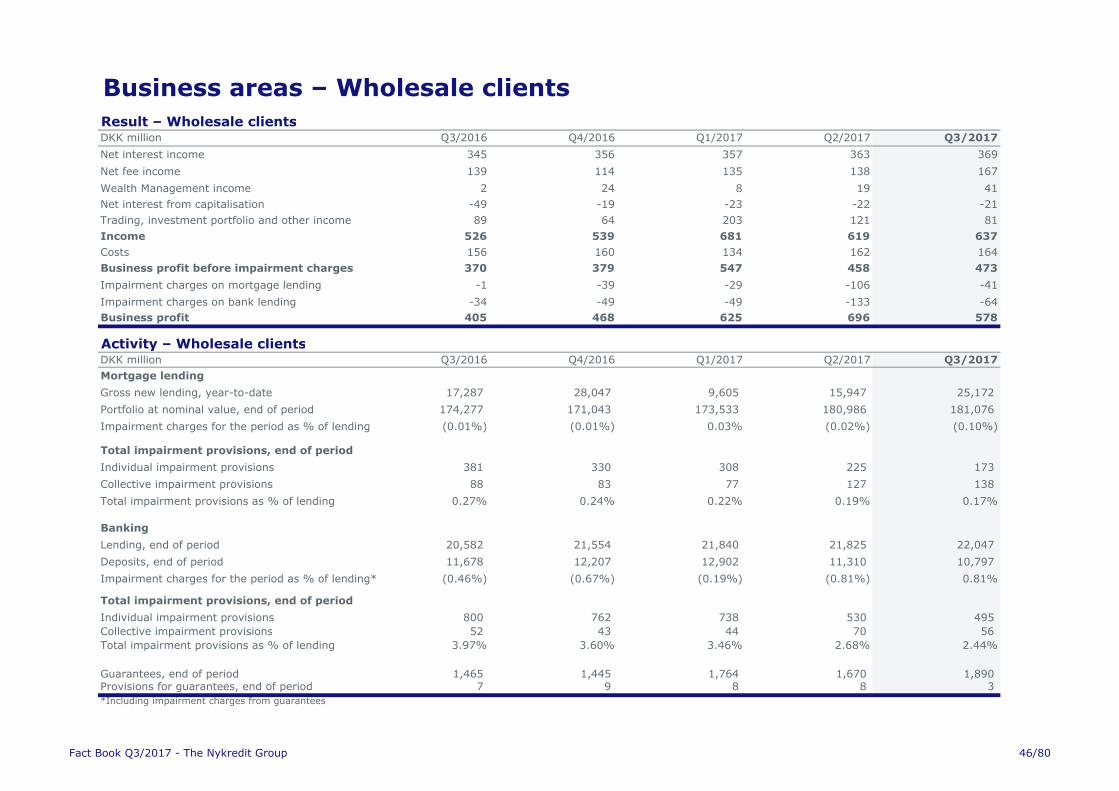
Business areas – Wholesale clients
Result – Wholesale clientsDKK million Q3/2016 Q4/2016 Q1/2017 Q2/2017 Q3/2017
Net interest income 345 356 357 363 369
Net fee income 139 114 135 138 167
Wealth Management income 2 24 8 19 41
Net interest from capitalisation -49 -19 -23 -22 -21
Trading, investment portfolio and other income 89 64 203 121 81
Income 526 539 681 619 637
Costs 156 160 134 162 164
Business profit before impairment charges 370 379 547 458 473
Impairment charges on mortgage lending -1 -39 -29 -106 -41
Impairment charges on bank lending -34 -49 -49 -133 -64
Business profit 405 468 625 696 578
Activity – Wholesale clientsDKK million Q3/2016 Q4/2016 Q1/2017 Q2/2017 Q3/2017
Mortgage lending
Gross new lending, year-to-date 17,287 28,047 9,605 15,947 25,172
Portfolio at nominal value, end of period 174,277 171,043 173,533 180,986 181,076
Impairment charges for the period as % of lending (0.01%) (0.01%) 0.03% (0.02%) (0.10%)
Total impairment provisions, end of period
Individual impairment provisions 381 330 308 225 173
Collective impairment provisions 88 83 77 127 138
Total impairment provisions as % of lending 0.27% 0.24% 0.22% 0.19% 0.17%
Banking
Lending, end of period 20,582 21,554 21,840 21,825 22,047
Deposits, end of period 11,678 12,207 12,902 11,310 10,797
Impairment charges for the period as % of lending* (0.46%) (0.67%) (0.19%) (0.81%) 0.81%
Total impairment provisions, end of period
Individual impairment provisions 800 762 738 530 495
Collective impairment provisions 52 43 44 70 56
Total impairment provisions as % of lending 3.97% 3.60% 3.46% 2.68% 2.44%
Guarantees, end of period 1,465 1,445 1,764 1,670 1,890 Provisions for guarantees, end of period 7 9 8 8 3
*Including impairment charges from guarantees
Fact Book Q3/2017 - The Nykredit Group 46/80
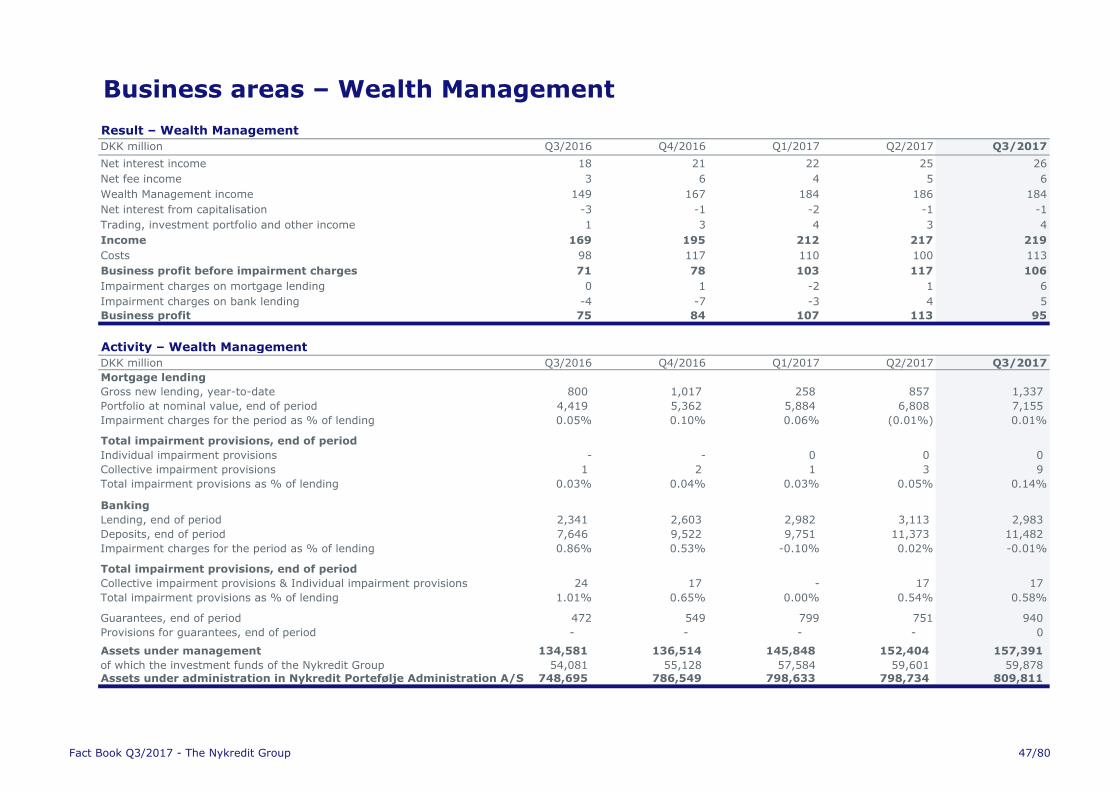
Business areas – Wealth Management
Result – Wealth Management
DKK million Q3/2016 Q4/2016 Q1/2017 Q2/2017 Q3/2017
Net interest income 18 21 22 25 26
Net fee income 3 6 4 5 6
Wealth Management income 149 167 184 186 184
Net interest from capitalisation -3 -1 -2 -1 -1
Trading, investment portfolio and other income 1 3 4 3 4
Income 169 195 212 217 219
Costs 98 117 110 100 113
Business profit before impairment charges 71 78 103 117 106
Impairment charges on mortgage lending 0 1 -2 1 6
Impairment charges on bank lending -4 -7 -3 4 5
Business profit 75 84 107 113 95
Activity – Wealth Management
DKK million Q3/2016 Q4/2016 Q1/2017 Q2/2017 Q3/2017
Mortgage lending
Gross new lending, year-to-date 800 1,017 258 857 1,337
Portfolio at nominal value, end of period 4,419 5,362 5,884 6,808 7,155
Impairment charges for the period as % of lending 0.05% 0.10% 0.06% (0.01%) 0.01%
Total impairment provisions, end of period
Individual impairment provisions - - 0 0 0
Collective impairment provisions 1 2 1 3 9
Total impairment provisions as % of lending 0.03% 0.04% 0.03% 0.05% 0.14%
Banking
Lending, end of period 2,341 2,603 2,982 3,113 2,983
Deposits, end of period 7,646 9,522 9,751 11,373 11,482
Impairment charges for the period as % of lending 0.86% 0.53% -0.10% 0.02% -0.01%
Total impairment provisions, end of period
Collective impairment provisions & Individual impairment provisions 24 17 - 17 17
Total impairment provisions as % of lending 1.01% 0.65% 0.00% 0.54% 0.58%
Guarantees, end of period 472 549 799 751 940
Provisions for guarantees, end of period - - - - 0
Assets under management 134,581 136,514 145,848 152,404 157,391
of which the investment funds of the Nykredit Group 54,081 55,128 57,584 59,601 59,878 Assets under administration in Nykredit Portefølje Administration A/S 748,695 786,549 798,633 798,734 809,811
Fact Book Q3/2017 - The Nykredit Group 47/80
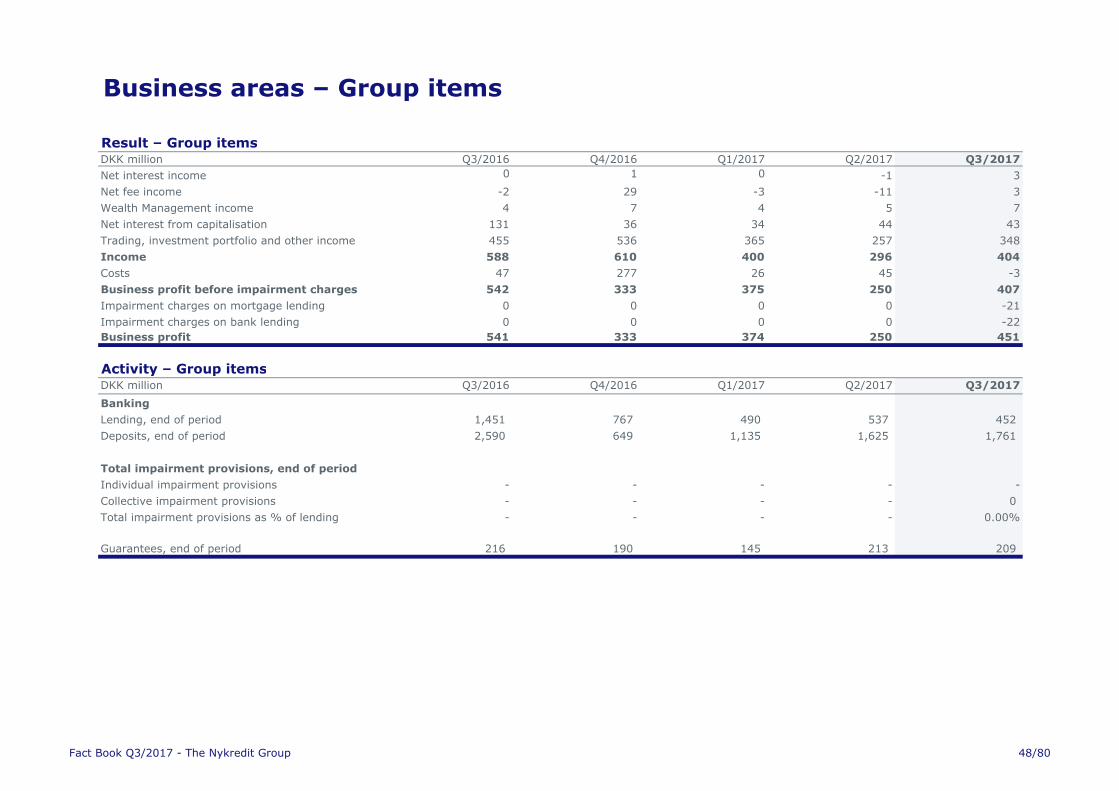
Business areas – Group items
Result – Group itemsDKK million Q3/2016 Q4/2016 Q1/2017 Q2/2017 Q3/2017
Net interest income 0 1 0 -1 3
Net fee income -2 29 -3 -11 3
Wealth Management income 4 7 4 5 7
Net interest from capitalisation 131 36 34 44 43
Trading, investment portfolio and other income 455 536 365 257 348
Income 588 610 400 296 404
Costs 47 277 26 45 -3
Business profit before impairment charges 542 333 375 250 407
Impairment charges on mortgage lending 0 0 0 0 -21
Impairment charges on bank lending 0 0 0 0 -22
Business profit 541 333 374 250 451
Activity – Group itemsDKK million Q3/2016 Q4/2016 Q1/2017 Q2/2017 Q3/2017
Banking
Lending, end of period 1,451 767 490 537 452
Deposits, end of period 2,590 649 1,135 1,625 1,761
Total impairment provisions, end of period
Individual impairment provisions - - - - -
Collective impairment provisions - - - - 0
Total impairment provisions as % of lending - - - - 0.00%
Guarantees, end of period 216 190 145 213 209
Fact Book Q3/2017 - The Nykredit Group 48/80
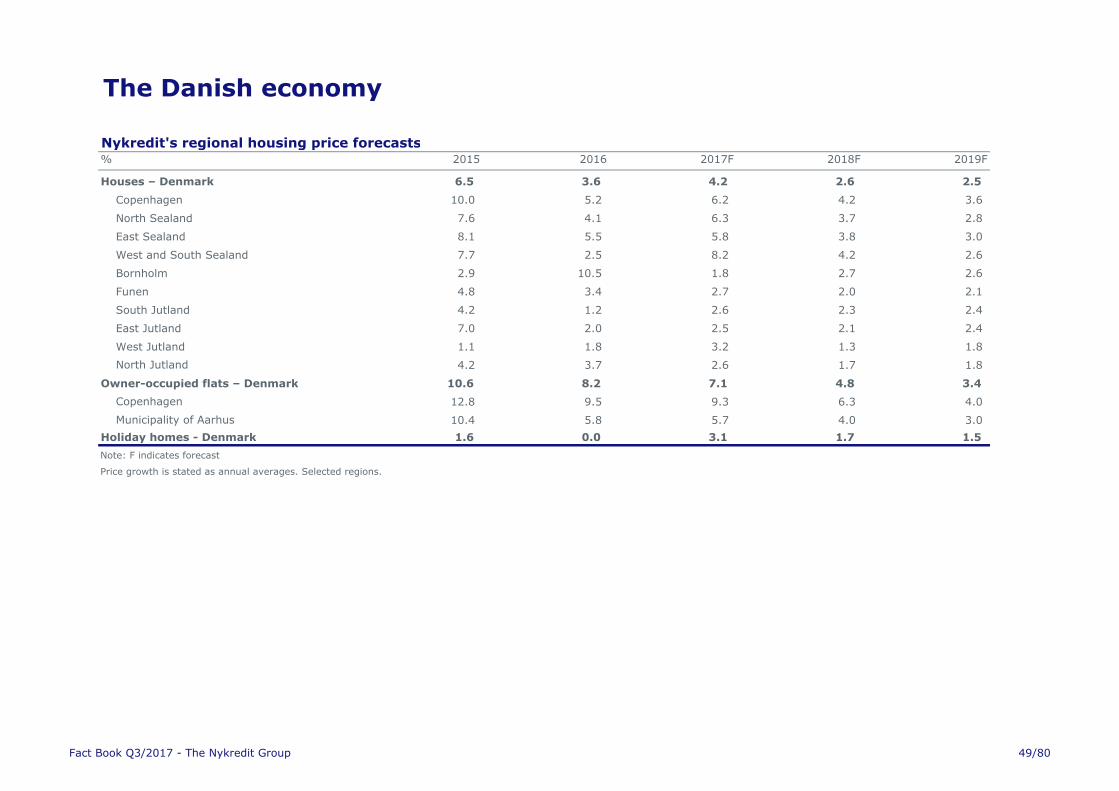
The Danish economy
Nykredit's regional housing price forecasts% 2015 2016 2017F 2018F 2019F
Houses – Denmark 6.5 3.6 4.2 2.6 2.5
Copenhagen 10.0 5.2 6.2 4.2 3.6
North Sealand 7.6 4.1 6.3 3.7 2.8
East Sealand 8.1 5.5 5.8 3.8 3.0
West and South Sealand 7.7 2.5 8.2 4.2 2.6
Bornholm 2.9 10.5 1.8 2.7 2.6
Funen 4.8 3.4 2.7 2.0 2.1
South Jutland 4.2 1.2 2.6 2.3 2.4
East Jutland 7.0 2.0 2.5 2.1 2.4
West Jutland 1.1 1.8 3.2 1.3 1.8
North Jutland 4.2 3.7 2.6 1.7 1.8
Owner-occupied flats – Denmark 10.6 8.2 7.1 4.8 3.4
Copenhagen 12.8 9.5 9.3 6.3 4.0
Municipality of Aarhus 10.4 5.8 5.7 4.0 3.0
Holiday homes - Denmark 1.6 0.0 3.1 1.7 1.5
Note: F indicates forecast
Price growth is stated as annual averages. Selected regions.
Fact Book Q3/2017 - The Nykredit Group 49/80
The Danish economy
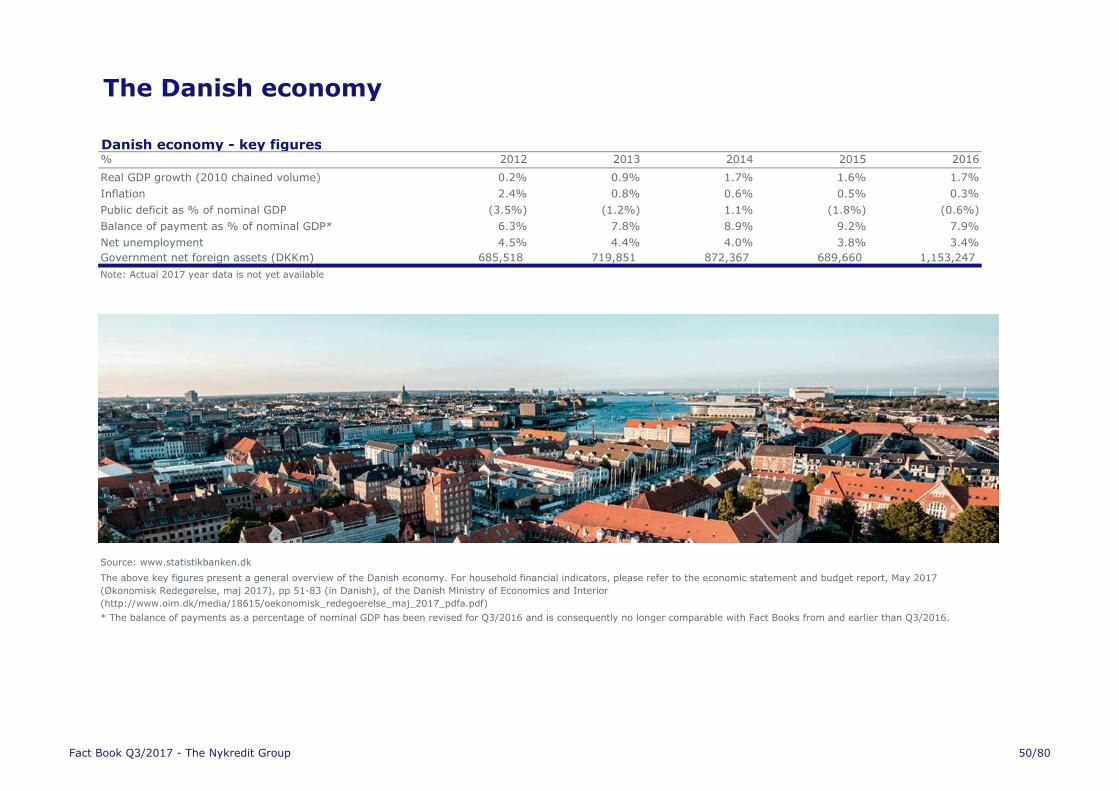
Danish economy - key figures% 2012 2013 2014 2015 2016
Real GDP growth (2010 chained volume) 0.2% 0.9% 1.7% 1.6% 1.7%
Inflation 2.4% 0.8% 0.6% 0.5% 0.3%
Public deficit as % of nominal GDP (3.5%) (1.2%) 1.1% (1.8%) (0.6%)
Balance of payment as % of nominal GDP* 6.3% 7.8% 8.9% 9.2% 7.9%
Net unemployment 4.5% 4.4% 4.0% 3.8% 3.4%
Government net foreign assets (DKKm) 685,518 719,851 872,367 689,660 1,153,247
Note: Actual 2017 year data is not yet available
Source: www.statistikbanken.dk
The above key figures present a general overview of the Danish economy. For household financial indicators, please refer to the economic statement and budget report, May 2017
(Økonomisk Redegørelse, maj 2017), pp 51-83 (in Danish), of the Danish Ministry of Economics and Interior
(http://www.oim.dk/media/18615/oekonomisk_redegoerelse_maj_2017_pdfa.pdf)
* The balance of payments as a percentage of nominal GDP has been revised for Q3/2016 and is consequently no longer comparable with Fact Books from and earlier than Q3/2016.
Fact Book Q3/2017 - The Nykredit Group 50/80
Covered Bond Investor Report Q3/2017
The Nykredit Realkredit Group
Fact Book Q3/2017 - The Nykredit Group 51/80
Overview
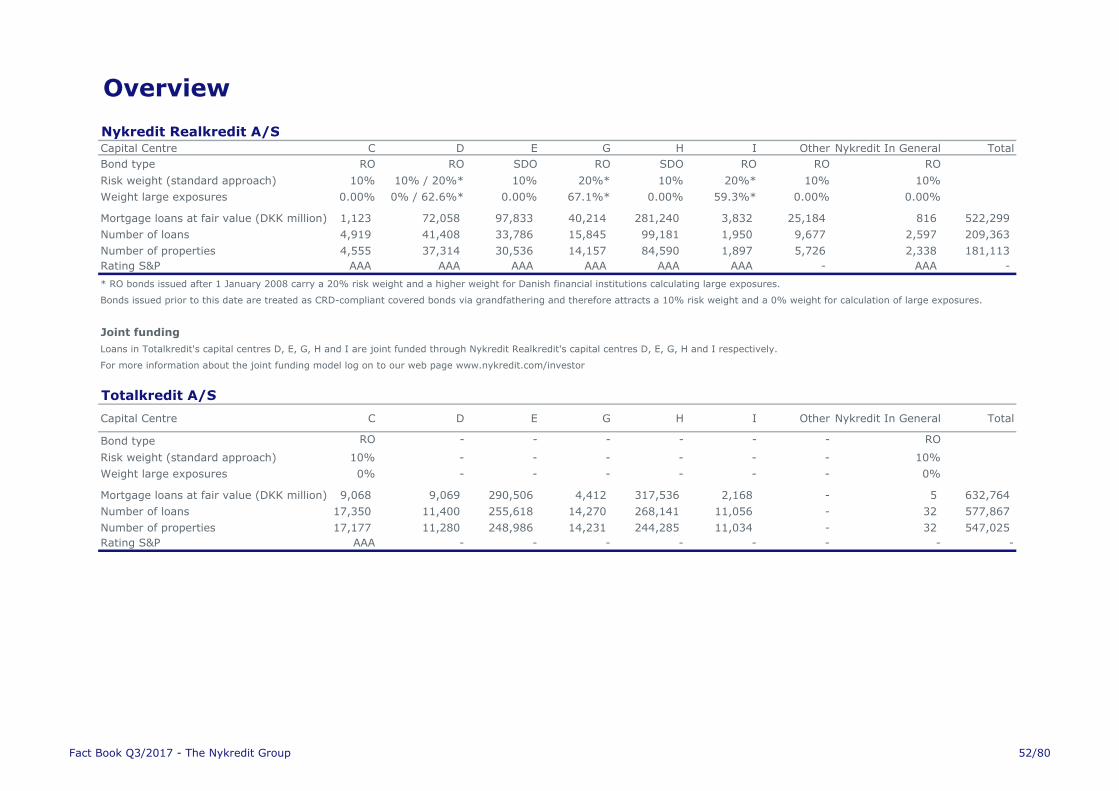
Nykredit Realkredit A/SCapital Centre C D E G H I Other Nykredit In General Total
Bond type RO RO SDO RO SDO RO RO RO
Risk weight (standard approach) 10% 10% / 20%* 10% 20%* 10% 20%* 10% 10%
Weight large exposures 0.00% 0% / 62.6%* 0.00% 67.1%* 0.00% 59.3%* 0.00% 0.00%
Mortgage loans at fair value (DKK million) 1,123 72,058 97,833 40,214 281,240 3,832 25,184 816 522,299
Number of loans 4,919 41,408 33,786 15,845 99,181 1,950 9,677 2,597 209,363
Number of properties 4,555 37,314 30,536 14,157 84,590 1,897 5,726 2,338 181,113
Rating S&P AAA AAA AAA AAA AAA AAA - AAA -
* RO bonds issued after 1 January 2008 carry a 20% risk weight and a higher weight for Danish financial institutions calculating large exposures.
Bonds issued prior to this date are treated as CRD-compliant covered bonds via grandfathering and therefore attracts a 10% risk weight and a 0% weight for calculation of large exposures.
Joint funding
Loans in Totalkredit's capital centres D, E, G, H and I are joint funded through Nykredit Realkredit's capital centres D, E, G, H and I respectively.
For more information about the joint funding model log on to our web page www.nykredit.com/investor
Totalkredit A/S
Capital Centre C D E G H I Other Nykredit In General Total
Bond type RO - - - - - - RO
Risk weight (standard approach) 10% - - - - - - 10%
Weight large exposures 0% - - - - - - 0%
Mortgage loans at fair value (DKK million) 9,068 9,069 290,506 4,412 317,536 2,168 - 5 632,764
Number of loans 17,350 11,400 255,618 14,270 268,141 11,056 - 32 577,867
Number of properties 17,177 11,280 248,986 14,231 244,285 11,034 - 32 547,025
Rating S&P AAA - - - - - - - -
Fact Book Q3/2017 - The Nykredit Group 52/80
Overview
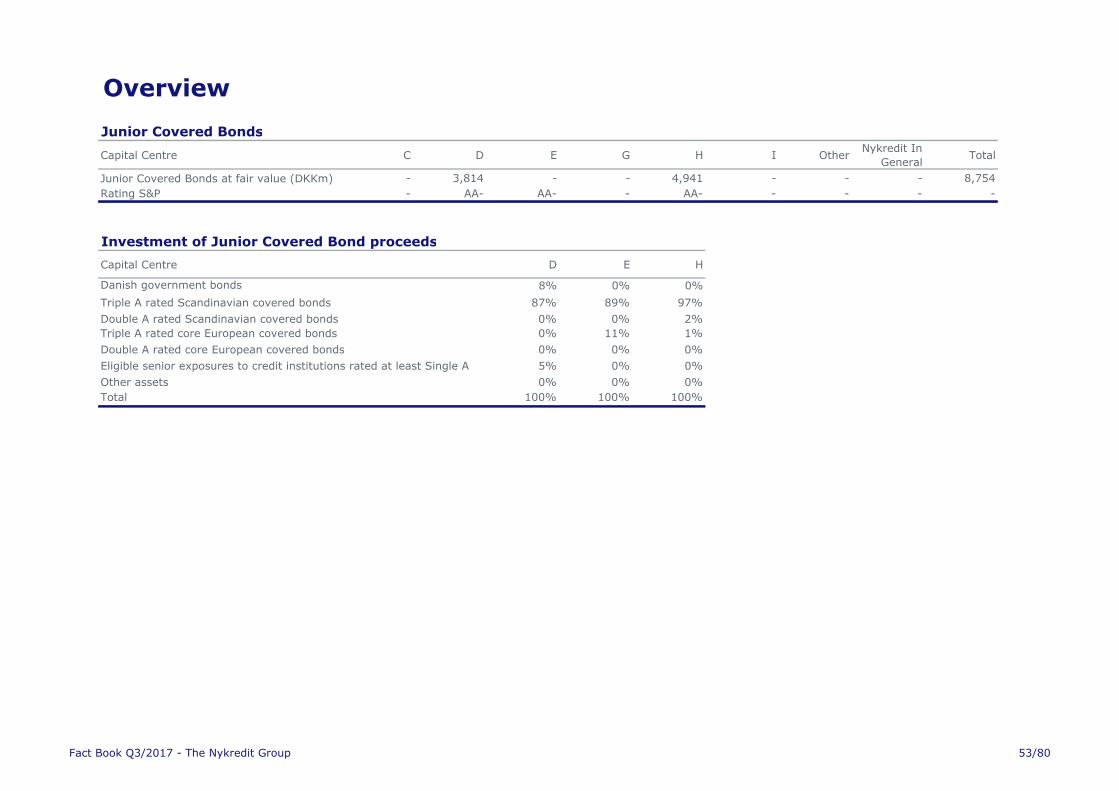
Junior Covered Bonds
Capital Centre C D E G H I OtherNykredit In
GeneralTotal
Junior Covered Bonds at fair value (DKKm) - 3,814 - - 4,941 - - - 8,754
Rating S&P - AA- AA- - AA- - - - -
Investment of Junior Covered Bond proceeds
Capital Centre D E H
Danish government bonds 8% 0% 0%
Triple A rated Scandinavian covered bonds 87% 89% 97%
Double A rated Scandinavian covered bonds 0% 0% 2%
Triple A rated core European covered bonds 0% 11% 1%
Double A rated core European covered bonds 0% 0% 0%
Eligible senior exposures to credit institutions rated at least Single A 5% 0% 0%
Other assets 0% 0% 0%
Total 100% 100% 100%
Fact Book Q3/2017 - The Nykredit Group 53/80
Concept and calculations
• LTV is calculated on each property on a loan-by-loan basis.
• LTV is calculated based on prior-ranking loans and mortgage loans at fair value relative to the estimated property value.
• Average and median LTV ratios are weighted against the fair value of the loan.
• Average LTV ratios are calculated on the basis of the top part of debts outstanding relative to estimated property values.
• Median LTV ratios are calculated on the basis of the mid-part of debts outstanding relative to estimated property values.
•
• Entire loan entered under the top LTV bracket: The full amount of the loan of the example above is included in the 20-40% LTV bracket.
••
LTV calculation
• Prior ranking loans = all loans secured on prior mortgages on the property – including loans raised in other credit institutions.
• Fair value = nominal bond debt outstanding * current market price.
Estimated property values
• Estimated property values are always based on local property valuations and inspections.
•
• Projection models are used for the ongoing estimation of property values in Industry and trade, Office and rental and Agriculture.
• Statistical valuations and projections are performed centrally and supplemented by ongoing local valuations and LTV monitoring.
• Property values are updated with the price development of Q2/2017.
Estimated property value
Statistical models are used for the ongoing estimation of property values in owner-occupied dwellings. These models are approved by the Danish FSA and based on
indicies from Boligmarkedsstatistikken. For further information, please see:
http://www.realkreditraadet.dk/Statistics/Prices_and_trades_of_owner_occupied_homes.aspx
Public authority guarantees reduce the credit risk relating to subsidised housing that is included in the lending for the category "Public housing". For this reason, LTV
figures for public housing contain no relevant information on risk.
Loans at fair value distributed continuously by LTV range up to the top LTV bracket: In the table, loans with security covering for example between 0% and 30% of
the mortgageable value are distributed with two thirds of the debt outstanding in the LTV range of 0-20% and one third in the LTV range of 20-40%.
LTV =Prior ranking loans + Mortgage loan at fair value
Mortgages may include loan costs. Eg a fully mortgaged owner-occupied dwelling with financed costs of 2% of the principal will appear at 82% in the following table.
Fact Book Q3/2017 - The Nykredit Group 54/80
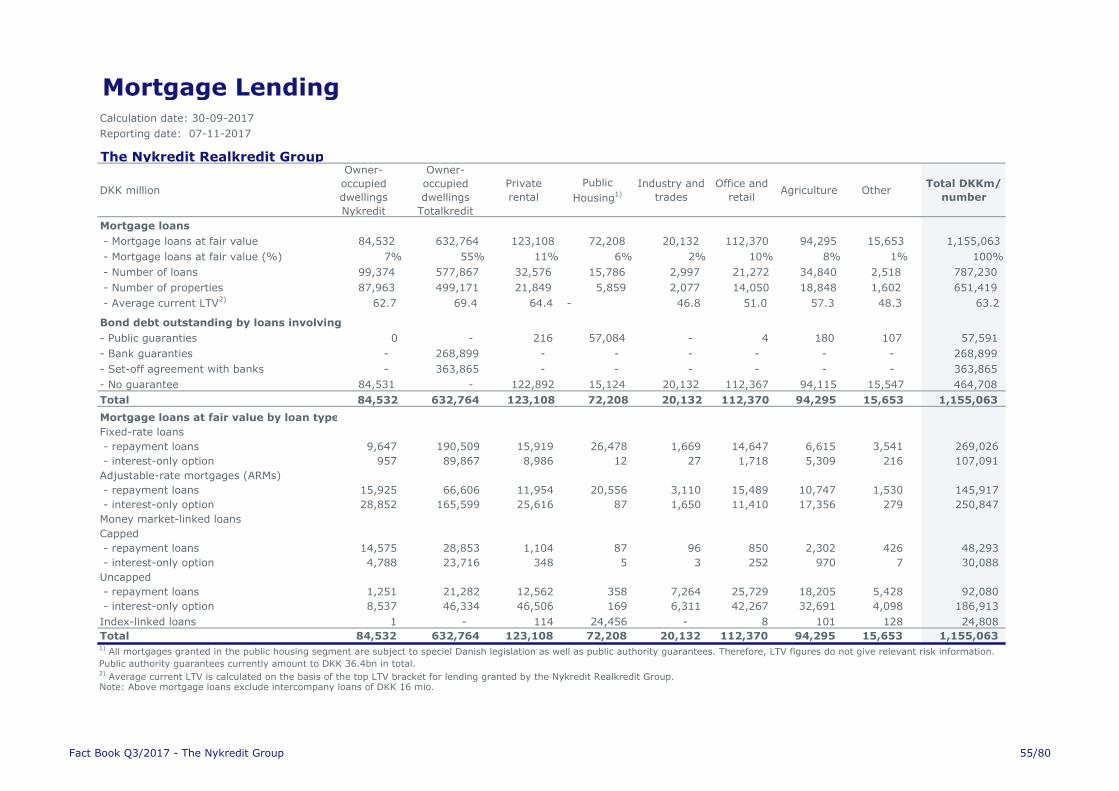
Mortgage LendingCalculation date: 30-09-2017
Reporting date: 07-11-2017
The Nykredit Realkredit Group
DKK million
Owner-
occupied
dwellings
Nykredit
Owner-
occupied
dwellings
Totalkredit
Private
rental
Public
Housing1)
Industry and
trades
Office and
retailAgriculture Other
Total DKKm/
number
Mortgage loans
- Mortgage loans at fair value 84,532 632,764 123,108 72,208 20,132 112,370 94,295 15,653 1,155,063
- Mortgage loans at fair value (%) 7% 55% 11% 6% 2% 10% 8% 1% 100%
- Number of loans 99,374 577,867 32,576 15,786 2,997 21,272 34,840 2,518 787,230
- Number of properties 87,963 499,171 21,849 5,859 2,077 14,050 18,848 1,602 651,419
- Average current LTV2) 62.7 69.4 64.4 - 46.8 51.0 57.3 48.3 63.2
Bond debt outstanding by loans involving
- Public guaranties 0 - 216 57,084 - 4 180 107 57,591
- Bank guaranties - 268,899 - - - - - - 268,899
- Set-off agreement with banks - 363,865 - - - - - - 363,865
- No guarantee 84,531 - 122,892 15,124 20,132 112,367 94,115 15,547 464,708
Total 84,532 632,764 123,108 72,208 20,132 112,370 94,295 15,653 1,155,063
Mortgage loans at fair value by loan type
Fixed-rate loans
- repayment loans 9,647 190,509 15,919 26,478 1,669 14,647 6,615 3,541 269,026
- interest-only option 957 89,867 8,986 12 27 1,718 5,309 216 107,091
Adjustable-rate mortgages (ARMs)
- repayment loans 15,925 66,606 11,954 20,556 3,110 15,489 10,747 1,530 145,917
- interest-only option 28,852 165,599 25,616 87 1,650 11,410 17,356 279 250,847
Money market-linked loans
Capped
- repayment loans 14,575 28,853 1,104 87 96 850 2,302 426 48,293
- interest-only option 4,788 23,716 348 5 3 252 970 7 30,088
Uncapped
- repayment loans 1,251 21,282 12,562 358 7,264 25,729 18,205 5,428 92,080
- interest-only option 8,537 46,334 46,506 169 6,311 42,267 32,691 4,098 186,913
Index-linked loans 1 - 114 24,456 - 8 101 128 24,808
Total 84,532 632,764 123,108 72,208 20,132 112,370 94,295 15,653 1,155,063
Note: Above mortgage loans exclude intercompany loans of DKK 16 mio.
2) Average current LTV is calculated on the basis of the top LTV bracket for lending granted by the Nykredit Realkredit Group.
1) All mortgages granted in the public housing segment are subject to speciel Danish legislation as well as public authority guarantees. Therefore, LTV figures do not give relevant risk information.
Public authority guarantees currently amount to DKK 36.4bn in total.
Fact Book Q3/2017 - The Nykredit Group 55/80
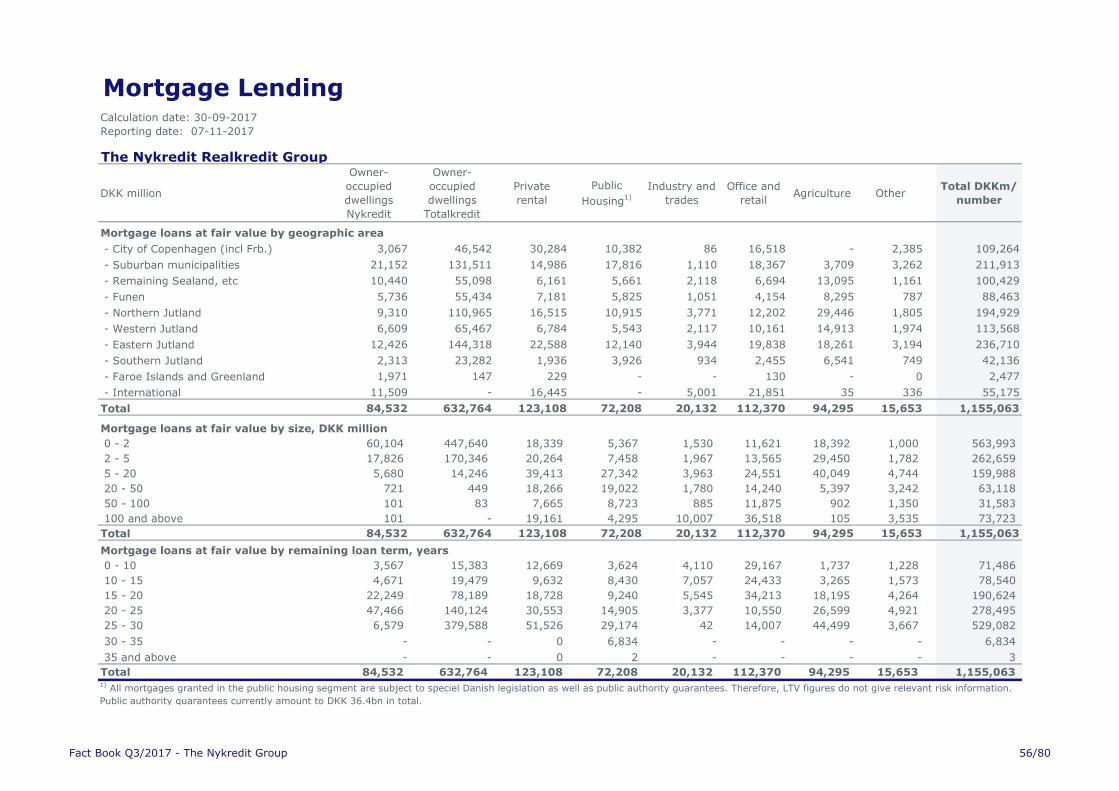
Mortgage LendingCalculation date: 30-09-2017
Reporting date: 07-11-2017
The Nykredit Realkredit Group
DKK million
Owner-
occupied
dwellings
Nykredit
Owner-
occupied
dwellings
Totalkredit
Private
rental
Public
Housing1)
Industry and
trades
Office and
retailAgriculture Other
Total DKKm/
number
Mortgage loans at fair value by geographic area
- City of Copenhagen (incl Frb.) 3,067 46,542 30,284 10,382 86 16,518 - 2,385 109,264
- Suburban municipalities 21,152 131,511 14,986 17,816 1,110 18,367 3,709 3,262 211,913
- Remaining Sealand, etc 10,440 55,098 6,161 5,661 2,118 6,694 13,095 1,161 100,429
- Funen 5,736 55,434 7,181 5,825 1,051 4,154 8,295 787 88,463
- Northern Jutland 9,310 110,965 16,515 10,915 3,771 12,202 29,446 1,805 194,929
- Western Jutland 6,609 65,467 6,784 5,543 2,117 10,161 14,913 1,974 113,568
- Eastern Jutland 12,426 144,318 22,588 12,140 3,944 19,838 18,261 3,194 236,710
- Southern Jutland 2,313 23,282 1,936 3,926 934 2,455 6,541 749 42,136
- Faroe Islands and Greenland 1,971 147 229 - - 130 - 0 2,477
- International 11,509 - 16,445 - 5,001 21,851 35 336 55,175
Total 84,532 632,764 123,108 72,208 20,132 112,370 94,295 15,653 1,155,063
Mortgage loans at fair value by size, DKK million
0 - 2 60,104 447,640 18,339 5,367 1,530 11,621 18,392 1,000 563,993
2 - 5 17,826 170,346 20,264 7,458 1,967 13,565 29,450 1,782 262,659
5 - 20 5,680 14,246 39,413 27,342 3,963 24,551 40,049 4,744 159,988
20 - 50 721 449 18,266 19,022 1,780 14,240 5,397 3,242 63,118
50 - 100 101 83 7,665 8,723 885 11,875 902 1,350 31,583
100 and above 101 - 19,161 4,295 10,007 36,518 105 3,535 73,723
Total 84,532 632,764 123,108 72,208 20,132 112,370 94,295 15,653 1,155,063
Mortgage loans at fair value by remaining loan term, years
0 - 10 3,567 15,383 12,669 3,624 4,110 29,167 1,737 1,228 71,486
10 - 15 4,671 19,479 9,632 8,430 7,057 24,433 3,265 1,573 78,540
15 - 20 22,249 78,189 18,728 9,240 5,545 34,213 18,195 4,264 190,624
20 - 25 47,466 140,124 30,553 14,905 3,377 10,550 26,599 4,921 278,495
25 - 30 6,579 379,588 51,526 29,174 42 14,007 44,499 3,667 529,082
30 - 35 - - 0 6,834 - - - - 6,834
35 and above - - 0 2 - - - - 3
Total 84,532 632,764 123,108 72,208 20,132 112,370 94,295 15,653 1,155,063 1)
All mortgages granted in the public housing segment are subject to speciel Danish legislation as well as public authority guarantees. Therefore, LTV figures do not give relevant risk information.
Public authority guarantees currently amount to DKK 36.4bn in total.
Fact Book Q3/2017 - The Nykredit Group 56/80

Mortgage Lending - Capital Centre DCalculation date: 30-09-2017
Reporting date: 07-11-2017
The Nykredit Realkredit Group
DKK million
Owner-
occupied
dwellings
Nykredit
Owner-
occupied
dwellings
Totalkredit
Private
rental
Public
Housing1)
Industry and
trades
Office and
retailAgriculture Other
Total DKKm/
number
Mortgage loans
- Mortgage loans at fair value 14,444 9,069 15,616 1,014 9,831 8,812 19,464 2,878 81,127
- Mortgage loans at fair value (%) 18% 11% 19% 1% 12% 11% 24% 4% 100%
- Number of loans 26,121 11,400 3,783 1,099 728 3,163 5,793 721 52,808
- Number of properties 24,713 11,280 3,353 810 625 2,853 4,436 590 48,660
- Average current LTV2) 52.4 72.7 62.4 - 44.4 42.6 45.4 38.1 52.0
Bond debt outstanding by loans involving
- Public guaranties - - 63 275 - - 44 34 415
- Bank guaranties - 616 - - - - - - 616
- Set-off agreement with banks - 8,453 - - - - - - 8,453
- No guarantee 14,444 - 15,553 739 9,831 8,812 19,420 2,844 71,643
Total 14,444 9,069 15,616 1,014 9,831 8,812 19,464 2,878 81,127
Mortgage loans at fair value by loan type
Fixed-rate loans
- repayment loans 3,750 1,916 552 723 173 579 581 239 8,512
- interest-only option 11 33 - - - - 0 - 45
Adjustable-rate mortgages (ARMs)
- repayment loans 2 5 820 17 512 800 639 280 3,075
- interest-only option 1 27 1,457 2 1,217 353 721 16 3,795
Money market-linked loans
Capped
- repayment loans 10,057 6,102 715 87 69 488 1,281 332 19,131
- interest-only option 410 986 22 - - 25 66 - 1,508
Uncapped
- repayment loans 157 - 3,032 117 3,995 4,383 6,221 1,694 19,600
- interest-only option 56 - 9,019 67 3,864 2,182 9,956 317 25,462
Index-linked loans - - - - - - - - -
Total 14,444 9,069 15,616 1,014 9,831 8,812 19,464 2,878 81,127 1)
All mortgages granted in the public housing segment are subject to speciel Danish legislation as well as public authority guarantees. Therefore, LTV figures do not give relevant risk information.
Public authority guarantees currently amount to DKK 0.2bn in Capital Centre D.2)
Average current LTV is calculated on the basis of the top LTV bracket for the loans in the capital centre.
Fact Book Q3/2017 - The Nykredit Group 57/80
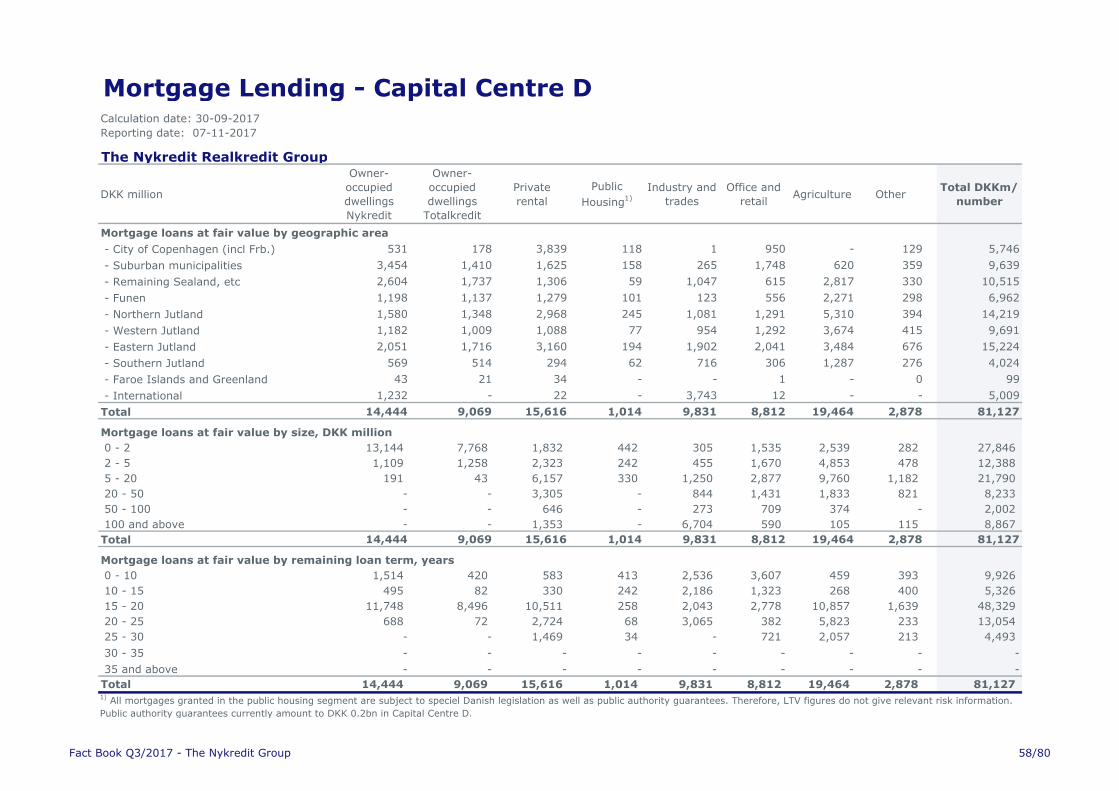
Mortgage Lending - Capital Centre DCalculation date: 30-09-2017
Reporting date: 07-11-2017
The Nykredit Realkredit Group
DKK million
Owner-
occupied
dwellings
Nykredit
Owner-
occupied
dwellings
Totalkredit
Private
rental
Public
Housing1)
Industry and
trades
Office and
retailAgriculture Other
Total DKKm/
number
Mortgage loans at fair value by geographic area
- City of Copenhagen (incl Frb.) 531 178 3,839 118 1 950 - 129 5,746
- Suburban municipalities 3,454 1,410 1,625 158 265 1,748 620 359 9,639
- Remaining Sealand, etc 2,604 1,737 1,306 59 1,047 615 2,817 330 10,515
- Funen 1,198 1,137 1,279 101 123 556 2,271 298 6,962
- Northern Jutland 1,580 1,348 2,968 245 1,081 1,291 5,310 394 14,219
- Western Jutland 1,182 1,009 1,088 77 954 1,292 3,674 415 9,691
- Eastern Jutland 2,051 1,716 3,160 194 1,902 2,041 3,484 676 15,224
- Southern Jutland 569 514 294 62 716 306 1,287 276 4,024
- Faroe Islands and Greenland 43 21 34 - - 1 - 0 99
- International 1,232 - 22 - 3,743 12 - - 5,009
Total 14,444 9,069 15,616 1,014 9,831 8,812 19,464 2,878 81,127
Mortgage loans at fair value by size, DKK million
0 - 2 13,144 7,768 1,832 442 305 1,535 2,539 282 27,846
2 - 5 1,109 1,258 2,323 242 455 1,670 4,853 478 12,388
5 - 20 191 43 6,157 330 1,250 2,877 9,760 1,182 21,790
20 - 50 - - 3,305 - 844 1,431 1,833 821 8,233
50 - 100 - - 646 - 273 709 374 - 2,002
100 and above - - 1,353 - 6,704 590 105 115 8,867
Total 14,444 9,069 15,616 1,014 9,831 8,812 19,464 2,878 81,127
Mortgage loans at fair value by remaining loan term, years
0 - 10 1,514 420 583 413 2,536 3,607 459 393 9,926
10 - 15 495 82 330 242 2,186 1,323 268 400 5,326
15 - 20 11,748 8,496 10,511 258 2,043 2,778 10,857 1,639 48,329
20 - 25 688 72 2,724 68 3,065 382 5,823 233 13,054
25 - 30 - - 1,469 34 - 721 2,057 213 4,493
30 - 35 - - - - - - - - -
35 and above - - - - - - - - -
Total 14,444 9,069 15,616 1,014 9,831 8,812 19,464 2,878 81,127 1)
All mortgages granted in the public housing segment are subject to speciel Danish legislation as well as public authority guarantees. Therefore, LTV figures do not give relevant risk information.
Public authority guarantees currently amount to DKK 0.2bn in Capital Centre D.
Fact Book Q3/2017 - The Nykredit Group 58/80
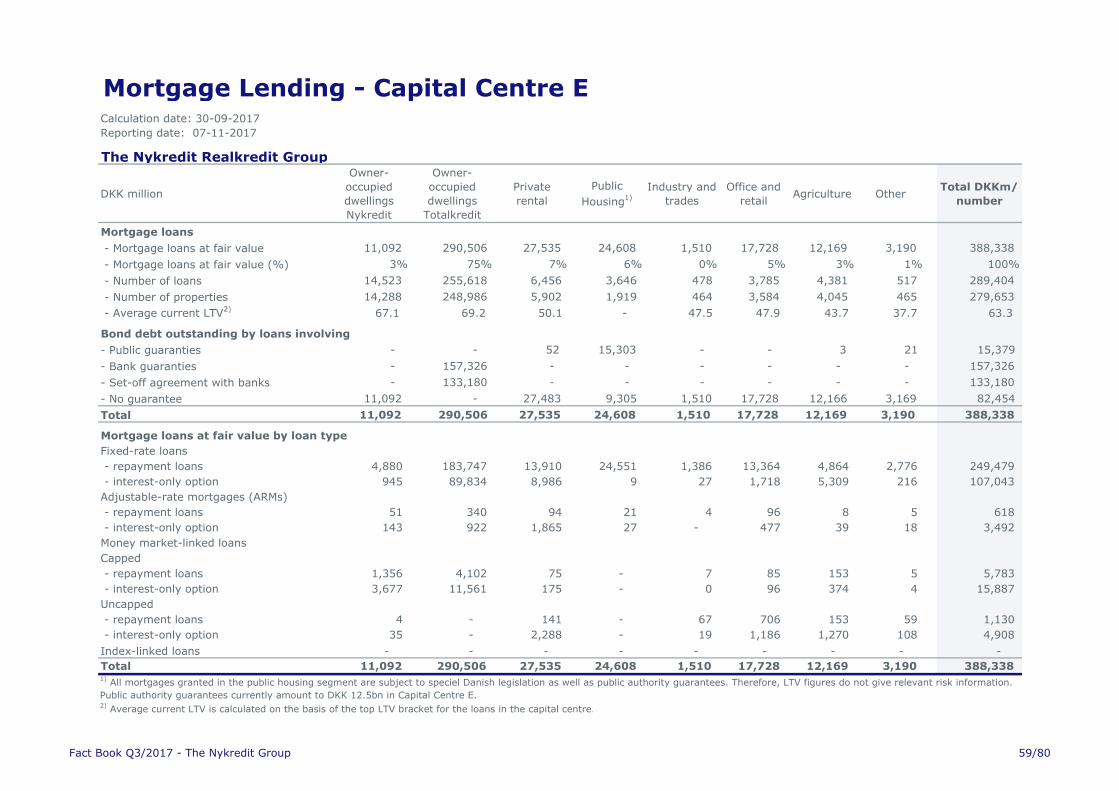
Mortgage Lending - Capital Centre ECalculation date: 30-09-2017
Reporting date: 07-11-2017
The Nykredit Realkredit Group
DKK million
Owner-
occupied
dwellings
Nykredit
Owner-
occupied
dwellings
Totalkredit
Private
rental
Public
Housing1)
Industry and
trades
Office and
retailAgriculture Other
Total DKKm/
number
Mortgage loans
- Mortgage loans at fair value 11,092 290,506 27,535 24,608 1,510 17,728 12,169 3,190 388,338
- Mortgage loans at fair value (%) 3% 75% 7% 6% 0% 5% 3% 1% 100%
- Number of loans 14,523 255,618 6,456 3,646 478 3,785 4,381 517 289,404
- Number of properties 14,288 248,986 5,902 1,919 464 3,584 4,045 465 279,653
- Average current LTV2) 67.1 69.2 50.1 - 47.5 47.9 43.7 37.7 63.3
Bond debt outstanding by loans involving
- Public guaranties - - 52 15,303 - - 3 21 15,379
- Bank guaranties - 157,326 - - - - - - 157,326
- Set-off agreement with banks - 133,180 - - - - - - 133,180
- No guarantee 11,092 - 27,483 9,305 1,510 17,728 12,166 3,169 82,454
Total 11,092 290,506 27,535 24,608 1,510 17,728 12,169 3,190 388,338
Mortgage loans at fair value by loan type
Fixed-rate loans
- repayment loans 4,880 183,747 13,910 24,551 1,386 13,364 4,864 2,776 249,479
- interest-only option 945 89,834 8,986 9 27 1,718 5,309 216 107,043
Adjustable-rate mortgages (ARMs)
- repayment loans 51 340 94 21 4 96 8 5 618
- interest-only option 143 922 1,865 27 - 477 39 18 3,492
Money market-linked loans
Capped
- repayment loans 1,356 4,102 75 - 7 85 153 5 5,783
- interest-only option 3,677 11,561 175 - 0 96 374 4 15,887
Uncapped
- repayment loans 4 - 141 - 67 706 153 59 1,130
- interest-only option 35 - 2,288 - 19 1,186 1,270 108 4,908
Index-linked loans - - - - - - - - -
Total 11,092 290,506 27,535 24,608 1,510 17,728 12,169 3,190 388,338 1)
All mortgages granted in the public housing segment are subject to speciel Danish legislation as well as public authority guarantees. Therefore, LTV figures do not give relevant risk information.
Public authority guarantees currently amount to DKK 12.5bn in Capital Centre E.2)
Average current LTV is calculated on the basis of the top LTV bracket for the loans in the capital centre.
Fact Book Q3/2017 - The Nykredit Group 59/80
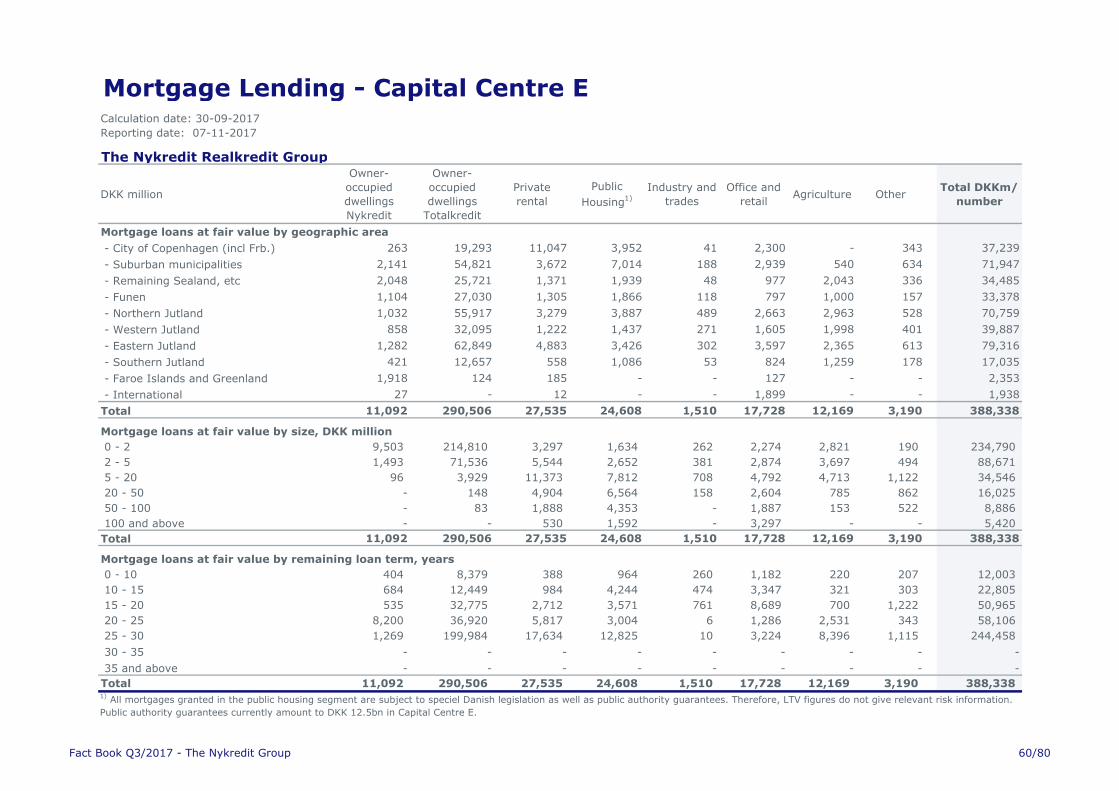
Mortgage Lending - Capital Centre ECalculation date: 30-09-2017
Reporting date: 07-11-2017
The Nykredit Realkredit Group
DKK million
Owner-
occupied
dwellings
Nykredit
Owner-
occupied
dwellings
Totalkredit
Private
rental
Public
Housing1)
Industry and
trades
Office and
retailAgriculture Other
Total DKKm/
number
Mortgage loans at fair value by geographic area
- City of Copenhagen (incl Frb.) 263 19,293 11,047 3,952 41 2,300 - 343 37,239
- Suburban municipalities 2,141 54,821 3,672 7,014 188 2,939 540 634 71,947
- Remaining Sealand, etc 2,048 25,721 1,371 1,939 48 977 2,043 336 34,485
- Funen 1,104 27,030 1,305 1,866 118 797 1,000 157 33,378
- Northern Jutland 1,032 55,917 3,279 3,887 489 2,663 2,963 528 70,759
- Western Jutland 858 32,095 1,222 1,437 271 1,605 1,998 401 39,887
- Eastern Jutland 1,282 62,849 4,883 3,426 302 3,597 2,365 613 79,316
- Southern Jutland 421 12,657 558 1,086 53 824 1,259 178 17,035
- Faroe Islands and Greenland 1,918 124 185 - - 127 - - 2,353
- International 27 - 12 - - 1,899 - - 1,938
Total 11,092 290,506 27,535 24,608 1,510 17,728 12,169 3,190 388,338
Mortgage loans at fair value by size, DKK million
0 - 2 9,503 214,810 3,297 1,634 262 2,274 2,821 190 234,790
2 - 5 1,493 71,536 5,544 2,652 381 2,874 3,697 494 88,671
5 - 20 96 3,929 11,373 7,812 708 4,792 4,713 1,122 34,546
20 - 50 - 148 4,904 6,564 158 2,604 785 862 16,025
50 - 100 - 83 1,888 4,353 - 1,887 153 522 8,886
100 and above - - 530 1,592 - 3,297 - - 5,420
Total 11,092 290,506 27,535 24,608 1,510 17,728 12,169 3,190 388,338
Mortgage loans at fair value by remaining loan term, years
0 - 10 404 8,379 388 964 260 1,182 220 207 12,003
10 - 15 684 12,449 984 4,244 474 3,347 321 303 22,805
15 - 20 535 32,775 2,712 3,571 761 8,689 700 1,222 50,965
20 - 25 8,200 36,920 5,817 3,004 6 1,286 2,531 343 58,106
25 - 30 1,269 199,984 17,634 12,825 10 3,224 8,396 1,115 244,458
30 - 35 - - - - - - - - -
35 and above - - - - - - - - -
Total 11,092 290,506 27,535 24,608 1,510 17,728 12,169 3,190 388,338 1)
All mortgages granted in the public housing segment are subject to speciel Danish legislation as well as public authority guarantees. Therefore, LTV figures do not give relevant risk information.
Public authority guarantees currently amount to DKK 12.5bn in Capital Centre E.
Fact Book Q3/2017 - The Nykredit Group 60/80
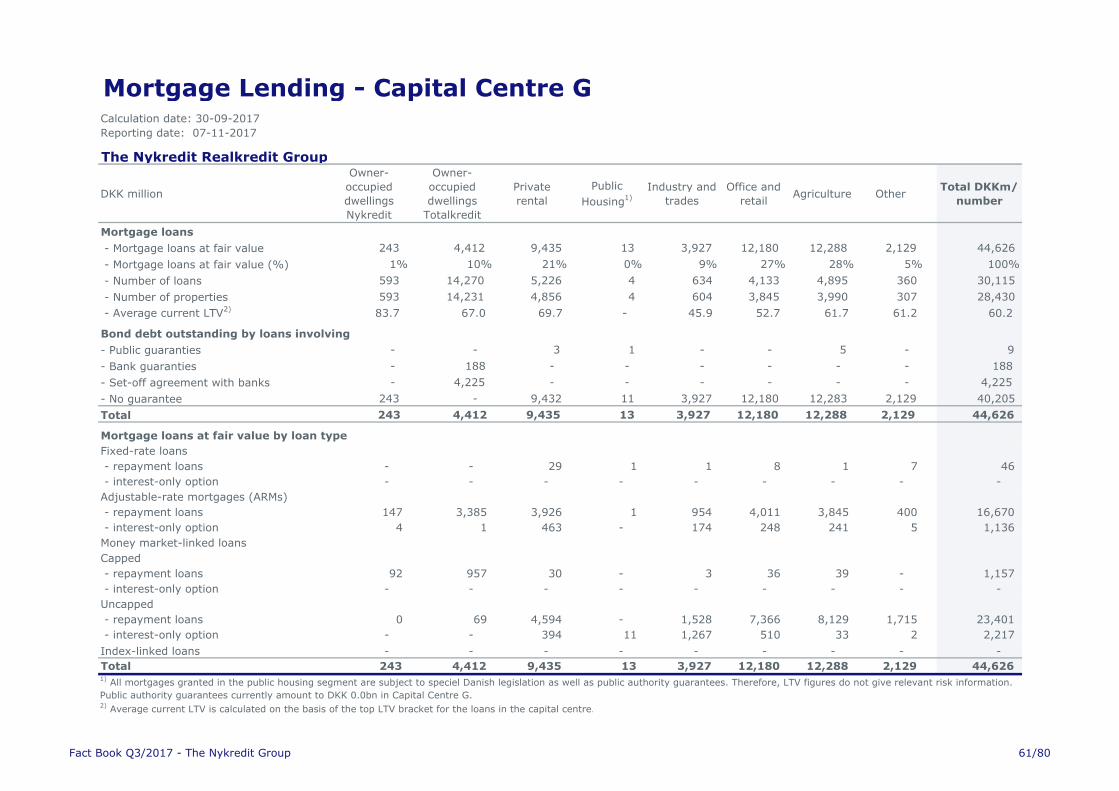
Mortgage Lending - Capital Centre GCalculation date: 30-09-2017
Reporting date: 07-11-2017
The Nykredit Realkredit Group
DKK million
Owner-
occupied
dwellings
Nykredit
Owner-
occupied
dwellings
Totalkredit
Private
rental
Public
Housing1)
Industry and
trades
Office and
retailAgriculture Other
Total DKKm/
number
Mortgage loans
- Mortgage loans at fair value 243 4,412 9,435 13 3,927 12,180 12,288 2,129 44,626
- Mortgage loans at fair value (%) 1% 10% 21% 0% 9% 27% 28% 5% 100%
- Number of loans 593 14,270 5,226 4 634 4,133 4,895 360 30,115
- Number of properties 593 14,231 4,856 4 604 3,845 3,990 307 28,430
- Average current LTV2) 83.7 67.0 69.7 - 45.9 52.7 61.7 61.2 60.2
Bond debt outstanding by loans involving
- Public guaranties - - 3 1 - - 5 - 9
- Bank guaranties - 188 - - - - - - 188
- Set-off agreement with banks - 4,225 - - - - - - 4,225
- No guarantee 243 - 9,432 11 3,927 12,180 12,283 2,129 40,205
Total 243 4,412 9,435 13 3,927 12,180 12,288 2,129 44,626
Mortgage loans at fair value by loan type
Fixed-rate loans
- repayment loans - - 29 1 1 8 1 7 46
- interest-only option - - - - - - - - -
Adjustable-rate mortgages (ARMs)
- repayment loans 147 3,385 3,926 1 954 4,011 3,845 400 16,670
- interest-only option 4 1 463 - 174 248 241 5 1,136
Money market-linked loans
Capped
- repayment loans 92 957 30 - 3 36 39 - 1,157
- interest-only option - - - - - - - - -
Uncapped
- repayment loans 0 69 4,594 - 1,528 7,366 8,129 1,715 23,401
- interest-only option - - 394 11 1,267 510 33 2 2,217
Index-linked loans - - - - - - - - -
Total 243 4,412 9,435 13 3,927 12,180 12,288 2,129 44,626 1)
All mortgages granted in the public housing segment are subject to speciel Danish legislation as well as public authority guarantees. Therefore, LTV figures do not give relevant risk information.
Public authority guarantees currently amount to DKK 0.0bn in Capital Centre G.2)
Average current LTV is calculated on the basis of the top LTV bracket for the loans in the capital centre.
Fact Book Q3/2017 - The Nykredit Group 61/80
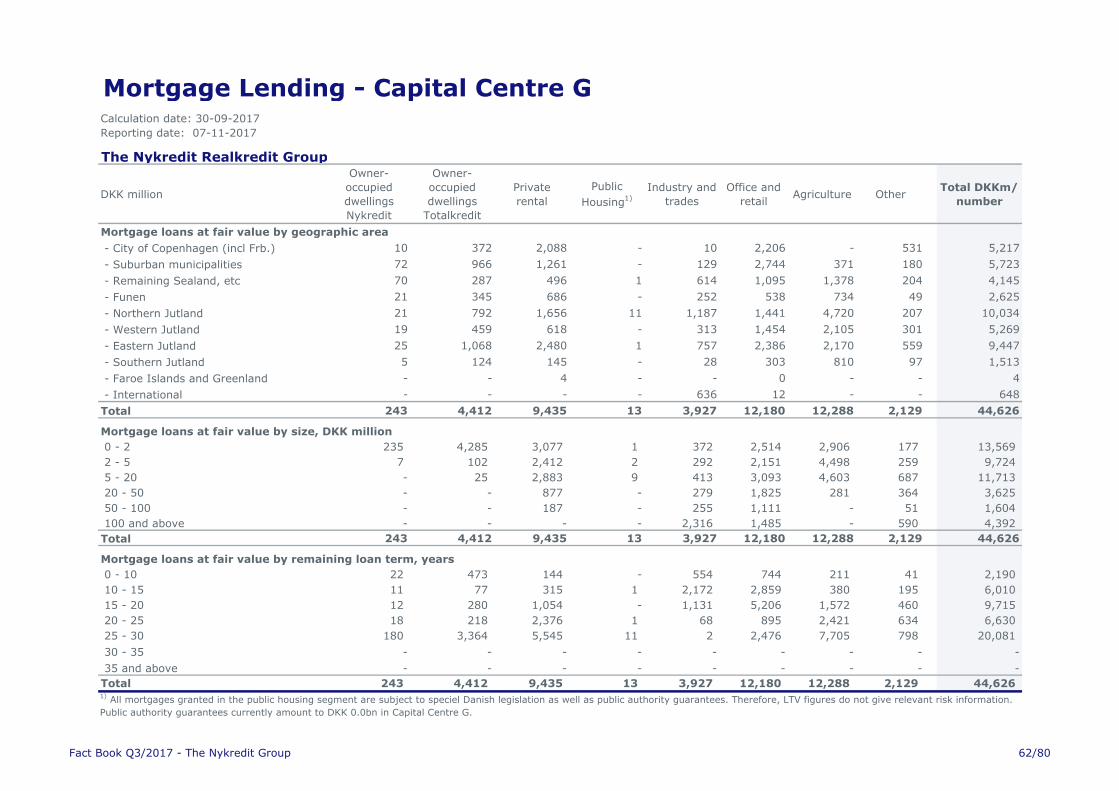
Mortgage Lending - Capital Centre GCalculation date: 30-09-2017
Reporting date: 07-11-2017
The Nykredit Realkredit Group
DKK million
Owner-
occupied
dwellings
Nykredit
Owner-
occupied
dwellings
Totalkredit
Private
rental
Public
Housing1)
Industry and
trades
Office and
retailAgriculture Other
Total DKKm/
number
Mortgage loans at fair value by geographic area
- City of Copenhagen (incl Frb.) 10 372 2,088 - 10 2,206 - 531 5,217
- Suburban municipalities 72 966 1,261 - 129 2,744 371 180 5,723
- Remaining Sealand, etc 70 287 496 1 614 1,095 1,378 204 4,145
- Funen 21 345 686 - 252 538 734 49 2,625
- Northern Jutland 21 792 1,656 11 1,187 1,441 4,720 207 10,034
- Western Jutland 19 459 618 - 313 1,454 2,105 301 5,269
- Eastern Jutland 25 1,068 2,480 1 757 2,386 2,170 559 9,447
- Southern Jutland 5 124 145 - 28 303 810 97 1,513
- Faroe Islands and Greenland - - 4 - - 0 - - 4
- International - - - - 636 12 - - 648
Total 243 4,412 9,435 13 3,927 12,180 12,288 2,129 44,626
Mortgage loans at fair value by size, DKK million
0 - 2 235 4,285 3,077 1 372 2,514 2,906 177 13,569
2 - 5 7 102 2,412 2 292 2,151 4,498 259 9,724
5 - 20 - 25 2,883 9 413 3,093 4,603 687 11,713
20 - 50 - - 877 - 279 1,825 281 364 3,625
50 - 100 - - 187 - 255 1,111 - 51 1,604
100 and above - - - - 2,316 1,485 - 590 4,392
Total 243 4,412 9,435 13 3,927 12,180 12,288 2,129 44,626
Mortgage loans at fair value by remaining loan term, years
0 - 10 22 473 144 - 554 744 211 41 2,190
10 - 15 11 77 315 1 2,172 2,859 380 195 6,010
15 - 20 12 280 1,054 - 1,131 5,206 1,572 460 9,715
20 - 25 18 218 2,376 1 68 895 2,421 634 6,630
25 - 30 180 3,364 5,545 11 2 2,476 7,705 798 20,081
30 - 35 - - - - - - - - -
35 and above - - - - - - - - -
Total 243 4,412 9,435 13 3,927 12,180 12,288 2,129 44,626 1)
All mortgages granted in the public housing segment are subject to speciel Danish legislation as well as public authority guarantees. Therefore, LTV figures do not give relevant risk information.
Public authority guarantees currently amount to DKK 0.0bn in Capital Centre G.
Fact Book Q3/2017 - The Nykredit Group 62/80
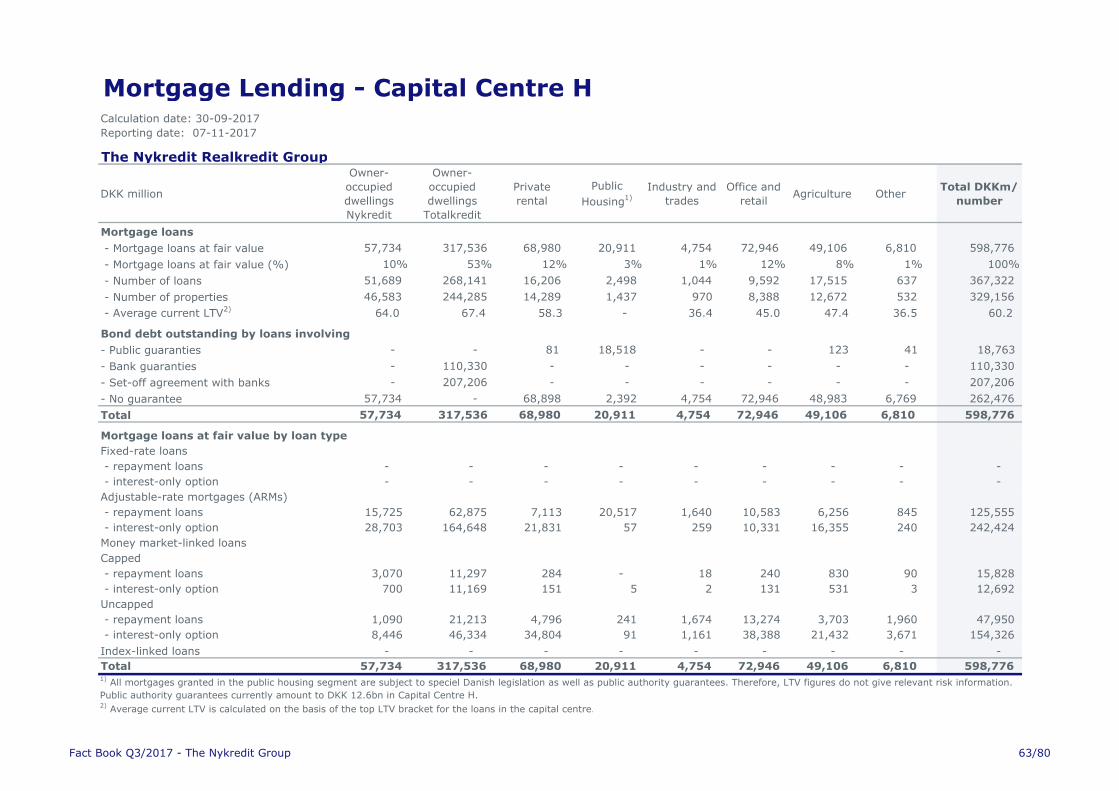
Mortgage Lending - Capital Centre HCalculation date: 30-09-2017
Reporting date: 07-11-2017
The Nykredit Realkredit Group
DKK million
Owner-
occupied
dwellings
Nykredit
Owner-
occupied
dwellings
Totalkredit
Private
rental
Public
Housing1)
Industry and
trades
Office and
retailAgriculture Other
Total DKKm/
number
Mortgage loans
- Mortgage loans at fair value 57,734 317,536 68,980 20,911 4,754 72,946 49,106 6,810 598,776
- Mortgage loans at fair value (%) 10% 53% 12% 3% 1% 12% 8% 1% 100%
- Number of loans 51,689 268,141 16,206 2,498 1,044 9,592 17,515 637 367,322
- Number of properties 46,583 244,285 14,289 1,437 970 8,388 12,672 532 329,156
- Average current LTV2) 64.0 67.4 58.3 - 36.4 45.0 47.4 36.5 60.2
Bond debt outstanding by loans involving
- Public guaranties - - 81 18,518 - - 123 41 18,763
- Bank guaranties - 110,330 - - - - - - 110,330
- Set-off agreement with banks - 207,206 - - - - - - 207,206
- No guarantee 57,734 - 68,898 2,392 4,754 72,946 48,983 6,769 262,476
Total 57,734 317,536 68,980 20,911 4,754 72,946 49,106 6,810 598,776
Mortgage loans at fair value by loan type
Fixed-rate loans
- repayment loans - - - - - - - - -
- interest-only option - - - - - - - - -
Adjustable-rate mortgages (ARMs)
- repayment loans 15,725 62,875 7,113 20,517 1,640 10,583 6,256 845 125,555
- interest-only option 28,703 164,648 21,831 57 259 10,331 16,355 240 242,424
Money market-linked loans
Capped
- repayment loans 3,070 11,297 284 - 18 240 830 90 15,828
- interest-only option 700 11,169 151 5 2 131 531 3 12,692
Uncapped
- repayment loans 1,090 21,213 4,796 241 1,674 13,274 3,703 1,960 47,950
- interest-only option 8,446 46,334 34,804 91 1,161 38,388 21,432 3,671 154,326
Index-linked loans - - - - - - - - -
Total 57,734 317,536 68,980 20,911 4,754 72,946 49,106 6,810 598,776 1)
All mortgages granted in the public housing segment are subject to speciel Danish legislation as well as public authority guarantees. Therefore, LTV figures do not give relevant risk information.
Public authority guarantees currently amount to DKK 12.6bn in Capital Centre H.2)
Average current LTV is calculated on the basis of the top LTV bracket for the loans in the capital centre.
Fact Book Q3/2017 - The Nykredit Group 63/80

Mortgage Lending - Capital Centre HCalculation date: 30-09-2017
Reporting date: 07-11-2017
The Nykredit Realkredit Group
DKK million
Owner-
occupied
dwellings
Nykredit
Owner-
occupied
dwellings
Totalkredit
Private
rental
Public
Housing1)
Industry and
trades
Office and
retailAgriculture Other
Total DKKm/
number
Mortgage loans at fair value by geographic area
- City of Copenhagen (incl Frb.) 2,232 26,433 12,974 1,985 27 10,964 - 1,340 55,955
- Suburban municipalities 15,331 72,768 8,224 5,511 518 10,835 2,116 1,969 117,271
- Remaining Sealand, etc 5,593 25,633 2,795 1,660 406 3,970 6,720 261 47,038
- Funen 3,293 25,702 3,778 1,469 550 2,206 4,160 267 41,425
- Northern Jutland 6,523 50,608 8,433 3,530 1,005 6,618 16,096 596 93,408
- Western Jutland 4,464 30,538 3,728 1,658 556 5,778 6,924 812 54,458
- Eastern Jutland 8,930 76,584 11,712 4,031 932 11,643 10,011 1,037 124,880
- Southern Jutland 1,251 9,269 919 1,068 137 1,004 3,044 192 16,885
- Faroe Islands and Greenland 9 1 6 - - 1 - - 18
- International 10,108 - 16,410 - 622 19,928 35 336 47,439
Total 57,734 317,536 68,980 20,911 4,754 72,946 49,106 6,810 598,776
Mortgage loans at fair value by size, DKK million
0 - 2 36,211 209,830 9,774 642 558 5,074 9,503 245 271,837
2 - 5 15,207 97,170 9,581 1,152 809 6,706 16,057 452 147,134
5 - 20 5,393 10,236 18,290 7,235 1,545 13,573 20,771 1,562 78,604
20 - 50 721 301 9,112 6,353 498 8,334 2,454 1,097 28,869
50 - 100 101 - 4,945 3,261 358 8,114 321 623 17,722
100 and above 101 - 17,278 2,267 987 31,146 - 2,830 54,609
Total 57,734 317,536 68,980 20,911 4,754 72,946 49,106 6,810 598,776
Mortgage loans at fair value by remaining loan term, years
0 - 10 1,193 3,647 11,466 1,548 715 23,501 583 473 43,127
10 - 15 3,037 6,207 7,957 3,211 2,214 16,829 2,219 606 42,279
15 - 20 9,897 29,132 4,386 5,409 1,557 17,237 5,010 864 73,492
20 - 25 38,493 102,673 19,512 7,816 237 7,961 15,809 3,653 196,155
25 - 30 5,114 175,877 25,659 2,927 30 7,418 25,484 1,213 243,722
30 - 35 - - - - - - - - -
35 and above - - - - - - - - -
Total 57,734 317,536 68,980 20,911 4,754 72,946 49,106 6,810 598,776 1)
All mortgages granted in the public housing segment are subject to speciel Danish legislation as well as public authority guarantees. Therefore, LTV figures do not give relevant risk information.
Public authority guarantees currently amount to DKK 12.6bn in Capital Centre H.
Fact Book Q3/2017 - The Nykredit Group 64/80
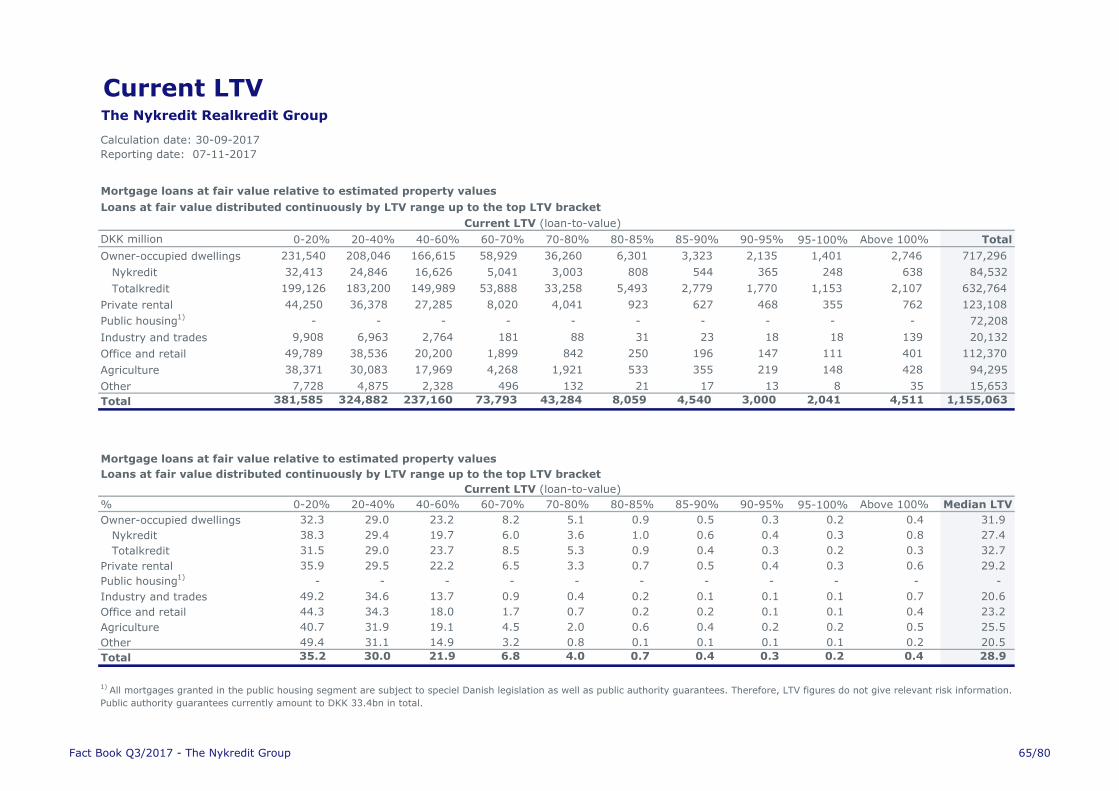
Current LTVThe Nykredit Realkredit Group
Calculation date: 30-09-2017
Reporting date: 07-11-2017
Mortgage loans at fair value relative to estimated property values
Loans at fair value distributed continuously by LTV range up to the top LTV bracket
Current LTV (loan-to-value)
DKK million 0-20% 20-40% 40-60% 60-70% 70-80% 80-85% 85-90% 90-95% 95-100% Above 100% Total
Owner-occupied dwellings 231,540 208,046 166,615 58,929 36,260 6,301 3,323 2,135 1,401 2,746 717,296
Nykredit 32,413 24,846 16,626 5,041 3,003 808 544 365 248 638 84,532
Totalkredit 199,126 183,200 149,989 53,888 33,258 5,493 2,779 1,770 1,153 2,107 632,764
Private rental 44,250 36,378 27,285 8,020 4,041 923 627 468 355 762 123,108
Public housing1) - - - - - - - - - - 72,208
Industry and trades 9,908 6,963 2,764 181 88 31 23 18 18 139 20,132
Office and retail 49,789 38,536 20,200 1,899 842 250 196 147 111 401 112,370
Agriculture 38,371 30,083 17,969 4,268 1,921 533 355 219 148 428 94,295
Other 7,728 4,875 2,328 496 132 21 17 13 8 35 15,653
Total 381,585 324,882 237,160 73,793 43,284 8,059 4,540 3,000 2,041 4,511 1,155,063
Mortgage loans at fair value relative to estimated property values
Loans at fair value distributed continuously by LTV range up to the top LTV bracket
Current LTV (loan-to-value)
% 0-20% 20-40% 40-60% 60-70% 70-80% 80-85% 85-90% 90-95% 95-100% Above 100% Median LTV
Owner-occupied dwellings 32.3 29.0 23.2 8.2 5.1 0.9 0.5 0.3 0.2 0.4 31.9
Nykredit 38.3 29.4 19.7 6.0 3.6 1.0 0.6 0.4 0.3 0.8 27.4
Totalkredit 31.5 29.0 23.7 8.5 5.3 0.9 0.4 0.3 0.2 0.3 32.7
Private rental 35.9 29.5 22.2 6.5 3.3 0.7 0.5 0.4 0.3 0.6 29.2
Public housing1) - - - - - - - - - - -
Industry and trades 49.2 34.6 13.7 0.9 0.4 0.2 0.1 0.1 0.1 0.7 20.6
Office and retail 44.3 34.3 18.0 1.7 0.7 0.2 0.2 0.1 0.1 0.4 23.2
Agriculture 40.7 31.9 19.1 4.5 2.0 0.6 0.4 0.2 0.2 0.5 25.5
Other 49.4 31.1 14.9 3.2 0.8 0.1 0.1 0.1 0.1 0.2 20.5
Total 35.2 30.0 21.9 6.8 4.0 0.7 0.4 0.3 0.2 0.4 28.9
1) All mortgages granted in the public housing segment are subject to speciel Danish legislation as well as public authority guarantees. Therefore, LTV figures do not give relevant risk information.
Public authority guarantees currently amount to DKK 33.4bn in total.
Fact Book Q3/2017 - The Nykredit Group 65/80
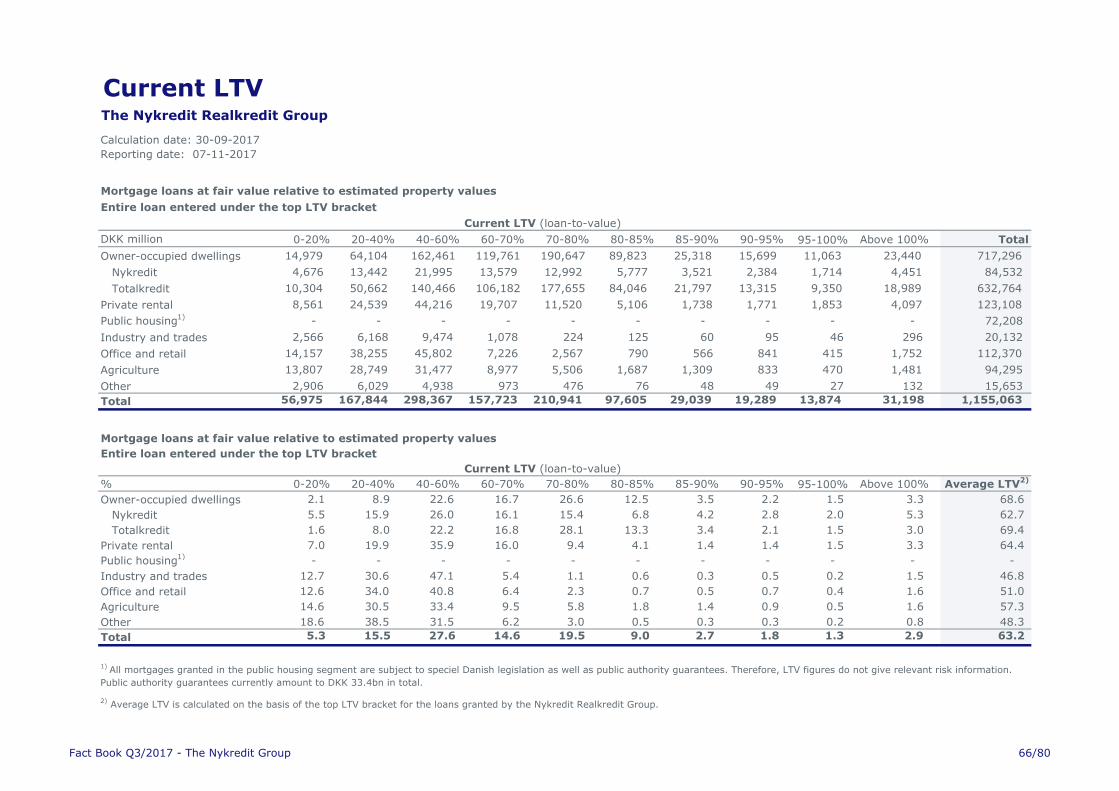
Current LTVThe Nykredit Realkredit Group
Calculation date: 30-09-2017
Reporting date: 07-11-2017
Mortgage loans at fair value relative to estimated property values
Entire loan entered under the top LTV bracket
Current LTV (loan-to-value)
DKK million 0-20% 20-40% 40-60% 60-70% 70-80% 80-85% 85-90% 90-95% 95-100% Above 100% Total
Owner-occupied dwellings 14,979 64,104 162,461 119,761 190,647 89,823 25,318 15,699 11,063 23,440 717,296
Nykredit 4,676 13,442 21,995 13,579 12,992 5,777 3,521 2,384 1,714 4,451 84,532
Totalkredit 10,304 50,662 140,466 106,182 177,655 84,046 21,797 13,315 9,350 18,989 632,764
Private rental 8,561 24,539 44,216 19,707 11,520 5,106 1,738 1,771 1,853 4,097 123,108
Public housing1) - - - - - - - - - - 72,208
Industry and trades 2,566 6,168 9,474 1,078 224 125 60 95 46 296 20,132
Office and retail 14,157 38,255 45,802 7,226 2,567 790 566 841 415 1,752 112,370
Agriculture 13,807 28,749 31,477 8,977 5,506 1,687 1,309 833 470 1,481 94,295
Other 2,906 6,029 4,938 973 476 76 48 49 27 132 15,653
Total 56,975 167,844 298,367 157,723 210,941 97,605 29,039 19,289 13,874 31,198 1,155,063
Mortgage loans at fair value relative to estimated property values
Entire loan entered under the top LTV bracket
Current LTV (loan-to-value)
% 0-20% 20-40% 40-60% 60-70% 70-80% 80-85% 85-90% 90-95% 95-100% Above 100% Average LTV2)
Owner-occupied dwellings 2.1 8.9 22.6 16.7 26.6 12.5 3.5 2.2 1.5 3.3 68.6
Nykredit 5.5 15.9 26.0 16.1 15.4 6.8 4.2 2.8 2.0 5.3 62.7
Totalkredit 1.6 8.0 22.2 16.8 28.1 13.3 3.4 2.1 1.5 3.0 69.4
Private rental 7.0 19.9 35.9 16.0 9.4 4.1 1.4 1.4 1.5 3.3 64.4
Public housing1) - - - - - - - - - - -
Industry and trades 12.7 30.6 47.1 5.4 1.1 0.6 0.3 0.5 0.2 1.5 46.8
Office and retail 12.6 34.0 40.8 6.4 2.3 0.7 0.5 0.7 0.4 1.6 51.0
Agriculture 14.6 30.5 33.4 9.5 5.8 1.8 1.4 0.9 0.5 1.6 57.3
Other 18.6 38.5 31.5 6.2 3.0 0.5 0.3 0.3 0.2 0.8 48.3
Total 5.3 15.5 27.6 14.6 19.5 9.0 2.7 1.8 1.3 2.9 63.2
1) All mortgages granted in the public housing segment are subject to speciel Danish legislation as well as public authority guarantees. Therefore, LTV figures do not give relevant risk information.
Public authority guarantees currently amount to DKK 33.4bn in total.
2) Average LTV is calculated on the basis of the top LTV bracket for the loans granted by the Nykredit Realkredit Group.
Fact Book Q3/2017 - The Nykredit Group 66/80
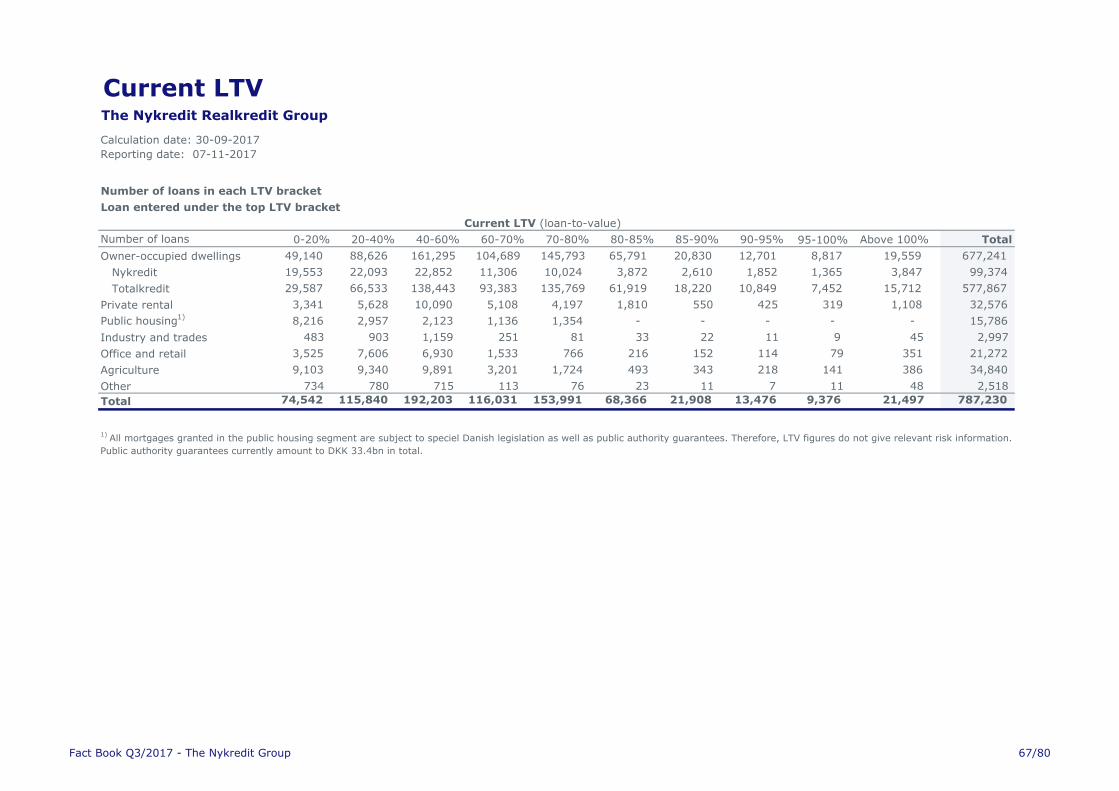
Current LTVThe Nykredit Realkredit Group
Calculation date: 30-09-2017
Reporting date: 07-11-2017
Number of loans in each LTV bracket
Loan entered under the top LTV bracket
Current LTV (loan-to-value)
Number of loans 0-20% 20-40% 40-60% 60-70% 70-80% 80-85% 85-90% 90-95% 95-100% Above 100% Total
Owner-occupied dwellings 49,140 88,626 161,295 104,689 145,793 65,791 20,830 12,701 8,817 19,559 677,241
Nykredit 19,553 22,093 22,852 11,306 10,024 3,872 2,610 1,852 1,365 3,847 99,374
Totalkredit 29,587 66,533 138,443 93,383 135,769 61,919 18,220 10,849 7,452 15,712 577,867
Private rental 3,341 5,628 10,090 5,108 4,197 1,810 550 425 319 1,108 32,576
Public housing1) 8,216 2,957 2,123 1,136 1,354 - - - - - 15,786
Industry and trades 483 903 1,159 251 81 33 22 11 9 45 2,997
Office and retail 3,525 7,606 6,930 1,533 766 216 152 114 79 351 21,272
Agriculture 9,103 9,340 9,891 3,201 1,724 493 343 218 141 386 34,840
Other 734 780 715 113 76 23 11 7 11 48 2,518
Total 74,542 115,840 192,203 116,031 153,991 68,366 21,908 13,476 9,376 21,497 787,230
1) All mortgages granted in the public housing segment are subject to speciel Danish legislation as well as public authority guarantees. Therefore, LTV figures do not give relevant risk information.
Public authority guarantees currently amount to DKK 33.4bn in total.
Fact Book Q3/2017 - The Nykredit Group 67/80
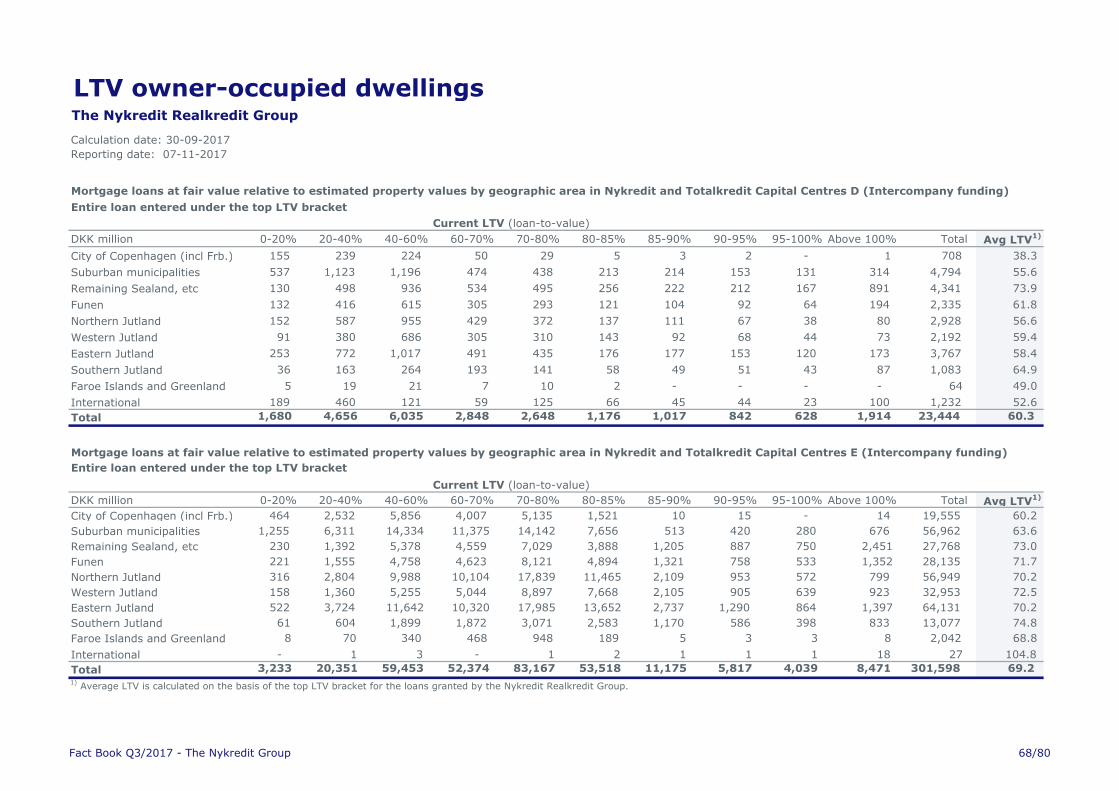
LTV owner-occupied dwellingsThe Nykredit Realkredit Group
Calculation date: 30-09-2017
Reporting date: 07-11-2017
Mortgage loans at fair value relative to estimated property values by geographic area in Nykredit and Totalkredit Capital Centres D (Intercompany funding)
Entire loan entered under the top LTV bracket
Current LTV (loan-to-value)
DKK million 0-20% 20-40% 40-60% 60-70% 70-80% 80-85% 85-90% 90-95% 95-100% Above 100% Total Avg LTV1)
City of Copenhagen (incl Frb.) 155 239 224 50 29 5 3 2 - 1 708 38.3
Suburban municipalities 537 1,123 1,196 474 438 213 214 153 131 314 4,794 55.6
Remaining Sealand, etc 130 498 936 534 495 256 222 212 167 891 4,341 73.9
Funen 132 416 615 305 293 121 104 92 64 194 2,335 61.8
Northern Jutland 152 587 955 429 372 137 111 67 38 80 2,928 56.6
Western Jutland 91 380 686 305 310 143 92 68 44 73 2,192 59.4
Eastern Jutland 253 772 1,017 491 435 176 177 153 120 173 3,767 58.4
Southern Jutland 36 163 264 193 141 58 49 51 43 87 1,083 64.9
Faroe Islands and Greenland 5 19 21 7 10 2 - - - - 64 49.0
International 189 460 121 59 125 66 45 44 23 100 1,232 52.6
Total 1,680 4,656 6,035 2,848 2,648 1,176 1,017 842 628 1,914 23,444 60.3
Mortgage loans at fair value relative to estimated property values by geographic area in Nykredit and Totalkredit Capital Centres E (Intercompany funding)
Entire loan entered under the top LTV bracket
Current LTV (loan-to-value)
DKK million 0-20% 20-40% 40-60% 60-70% 70-80% 80-85% 85-90% 90-95% 95-100% Above 100% Total Avg LTV1)
City of Copenhagen (incl Frb.) 464 2,532 5,856 4,007 5,135 1,521 10 15 - 14 19,555 60.2
Suburban municipalities 1,255 6,311 14,334 11,375 14,142 7,656 513 420 280 676 56,962 63.6
Remaining Sealand, etc 230 1,392 5,378 4,559 7,029 3,888 1,205 887 750 2,451 27,768 73.0
Funen 221 1,555 4,758 4,623 8,121 4,894 1,321 758 533 1,352 28,135 71.7
Northern Jutland 316 2,804 9,988 10,104 17,839 11,465 2,109 953 572 799 56,949 70.2
Western Jutland 158 1,360 5,255 5,044 8,897 7,668 2,105 905 639 923 32,953 72.5
Eastern Jutland 522 3,724 11,642 10,320 17,985 13,652 2,737 1,290 864 1,397 64,131 70.2
Southern Jutland 61 604 1,899 1,872 3,071 2,583 1,170 586 398 833 13,077 74.8
Faroe Islands and Greenland 8 70 340 468 948 189 5 3 3 8 2,042 68.8
International - 1 3 - 1 2 1 1 1 18 27 104.8
Total 3,233 20,351 59,453 52,374 83,167 53,518 11,175 5,817 4,039 8,471 301,598 69.2 1)
Average LTV is calculated on the basis of the top LTV bracket for the loans granted by the Nykredit Realkredit Group.
Fact Book Q3/2017 - The Nykredit Group 68/80
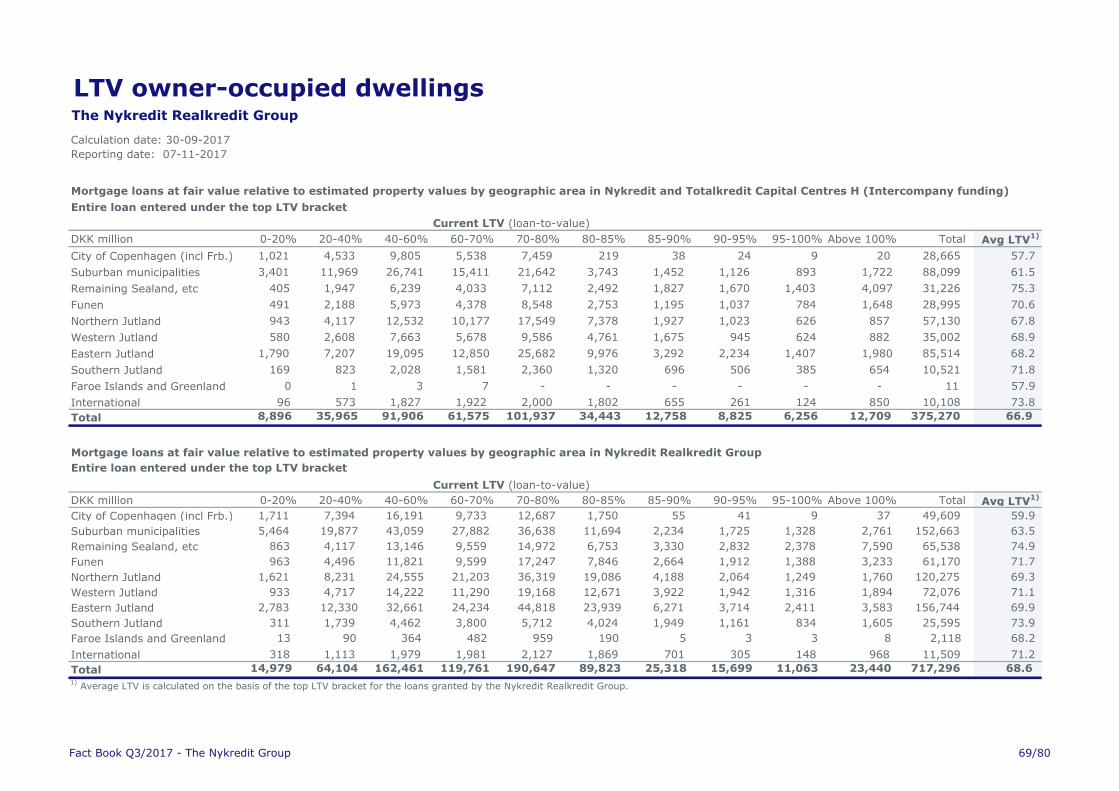
LTV owner-occupied dwellingsThe Nykredit Realkredit Group
Calculation date: 30-09-2017
Reporting date: 07-11-2017
Mortgage loans at fair value relative to estimated property values by geographic area in Nykredit and Totalkredit Capital Centres H (Intercompany funding)
Entire loan entered under the top LTV bracket
Current LTV (loan-to-value)
DKK million 0-20% 20-40% 40-60% 60-70% 70-80% 80-85% 85-90% 90-95% 95-100% Above 100% Total Avg LTV1)
City of Copenhagen (incl Frb.) 1,021 4,533 9,805 5,538 7,459 219 38 24 9 20 28,665 57.7
Suburban municipalities 3,401 11,969 26,741 15,411 21,642 3,743 1,452 1,126 893 1,722 88,099 61.5
Remaining Sealand, etc 405 1,947 6,239 4,033 7,112 2,492 1,827 1,670 1,403 4,097 31,226 75.3
Funen 491 2,188 5,973 4,378 8,548 2,753 1,195 1,037 784 1,648 28,995 70.6
Northern Jutland 943 4,117 12,532 10,177 17,549 7,378 1,927 1,023 626 857 57,130 67.8
Western Jutland 580 2,608 7,663 5,678 9,586 4,761 1,675 945 624 882 35,002 68.9
Eastern Jutland 1,790 7,207 19,095 12,850 25,682 9,976 3,292 2,234 1,407 1,980 85,514 68.2
Southern Jutland 169 823 2,028 1,581 2,360 1,320 696 506 385 654 10,521 71.8
Faroe Islands and Greenland 0 1 3 7 - - - - - - 11 57.9
International 96 573 1,827 1,922 2,000 1,802 655 261 124 850 10,108 73.8
Total 8,896 35,965 91,906 61,575 101,937 34,443 12,758 8,825 6,256 12,709 375,270 66.9
Mortgage loans at fair value relative to estimated property values by geographic area in Nykredit Realkredit Group
Entire loan entered under the top LTV bracket
Current LTV (loan-to-value)
DKK million 0-20% 20-40% 40-60% 60-70% 70-80% 80-85% 85-90% 90-95% 95-100% Above 100% Total Avg LTV1)
City of Copenhagen (incl Frb.) 1,711 7,394 16,191 9,733 12,687 1,750 55 41 9 37 49,609 59.9
Suburban municipalities 5,464 19,877 43,059 27,882 36,638 11,694 2,234 1,725 1,328 2,761 152,663 63.5
Remaining Sealand, etc 863 4,117 13,146 9,559 14,972 6,753 3,330 2,832 2,378 7,590 65,538 74.9
Funen 963 4,496 11,821 9,599 17,247 7,846 2,664 1,912 1,388 3,233 61,170 71.7
Northern Jutland 1,621 8,231 24,555 21,203 36,319 19,086 4,188 2,064 1,249 1,760 120,275 69.3
Western Jutland 933 4,717 14,222 11,290 19,168 12,671 3,922 1,942 1,316 1,894 72,076 71.1
Eastern Jutland 2,783 12,330 32,661 24,234 44,818 23,939 6,271 3,714 2,411 3,583 156,744 69.9
Southern Jutland 311 1,739 4,462 3,800 5,712 4,024 1,949 1,161 834 1,605 25,595 73.9
Faroe Islands and Greenland 13 90 364 482 959 190 5 3 3 8 2,118 68.2
International 318 1,113 1,979 1,981 2,127 1,869 701 305 148 968 11,509 71.2
Total 14,979 64,104 162,461 119,761 190,647 89,823 25,318 15,699 11,063 23,440 717,296 68.6 1)
Average LTV is calculated on the basis of the top LTV bracket for the loans granted by the Nykredit Realkredit Group.
Fact Book Q3/2017 - The Nykredit Group 69/80
Appendix Q3/2017
The Nykredit Group
Figures in the appendix on disclosures are calculated in accordance with the capital requirements regulation, and credit exposures for
Nykredit Realkredit Group, including non-mortgage loans, unutilized credits, exposures to financial counterparties etc.
Fact Book Q3/2017 - The Nykredit Group 70/80
Corporate structureCapital adequacy differences between the Groups
1. Common Equity Tier 1 (CET1) capital:
2. Additional Tier 1 (AT1) capital in subsidiaries:
3. Tier 2 capital in subsidiaries:
Nykredit's Tier 2 capital was also issued by Nykredit Realkredit A/S. It has the same consequences as described for AT1 capital above.
4. Risk exposure amount – credit risk:
5. Risk exposure amount – operational risk:
CET1 capital totalled DKK 65.9bn in the Nykredit Group and DKK 65.6bn in the Nykredit Realkredit Group at end-2016. The difference is caused by a
deduction from CET1 capital for intercompany balances with PRAS A/S and its indirect ownership interest in Nykredit A/S.
As mentioned under 1) above, intercompany balances and indirect ownership interests are eliminated in the Nykredit Group. This reduces total REA
for credit risk in the Nykredit Group by around DKK 1bn.
Nykredit applies the basic indicator approach to determine REA for operational risk. This means that Nykredit applies profit for the year to calculate
REA, and as profit for the year of Nykredit A/S is lower than that of Nykredit Realkredit, so is REA.
Nykredit's AT1 capital was issued by Nykredit Realkredit A/S and therefore cannot be included 100% in the capital determination of the Nykredit
Group. This is laid down in the rules on minority interests in the Capital Requirements Regulation (CRR), which stipulate that AT1 capital may only be
included at an amount corresponding to the regulatory requirement for the group concerned, in this case the Nykredit Group.
Although the sole activity of Nykredit A/S is its ownership of Nykredit Realkredit A/S, the determination of own funds and total REA is not identical for
the Nykredit Group and the Nykredit Realkredit Group. The differences are due to five factors:
Fact Book Q3/2017 - The Nykredit Group 71/80

Capital requirementsNykredit Group
REA and capital requirements
DKK million Q2/2017 Q3/2017 Q2/2017 Q3/2017
Credit risk
Standardised approach:
Central governments or central banks 76 78 6 6
Institutions 5,723 5,396 458 432
Corporates 5,002 5,354 400 428
Retail 432 508 35 41
Secured by mortgages on immovable property 250 239 20 19
Exposures in default 27 38 2 3
Covered bonds 1,542 1,558 123 125
Equity 88 259 7 21
Standardised approach total 13,139 13,431 1,051 1,074
IRB approach:
Corporates - SME 96,835 95,328 7,747 7,626
Corporates - Other 56,609 50,580 4,529 4,046
Retail - Secured by real estate SME 14,507 14,132 1,161 1,131
Retail - Secured by real estate non-SME 90,849 92,088 7,268 7,367
Retail - Other non-SME 4,631 4,412 370 353
Other non credit-obligation assets 3,364 3,282 269 263
IRB approach total 266,794 259,823 21,344 20,786
Contributions to the default fund of a CCP 100 58 8 5
Credit Value Adjustment 650 684 52 55
Equity IRB 13,289 13,869 1,063 1,109
Total credit risk 293,973 287,865 23,518 23,029
Market risk
Internal models 11,998 14,586 960 1,167
Standardised approach 9,894 8,695 792 696
Settlement risks - 1 - -
Total market risk 21,892 23,282 1,751 1,863
Operational risk 21,246 21,246 1,700 1,700
Total REA 337,110 332,392
Total minimum capital requirement 26,969 26,591
Leverage ratioNykredit Group
DKK million Q2/2017 Q3/2017
Tier 1 capital 72,817 73,380
Leverage ratio exposures 1,357,958 13,747,168
Leverage ratio 5.4% 5.3%
Risk Exposure Amount Capital requirements
Fact Book Q3/2017 - The Nykredit Group 72/80
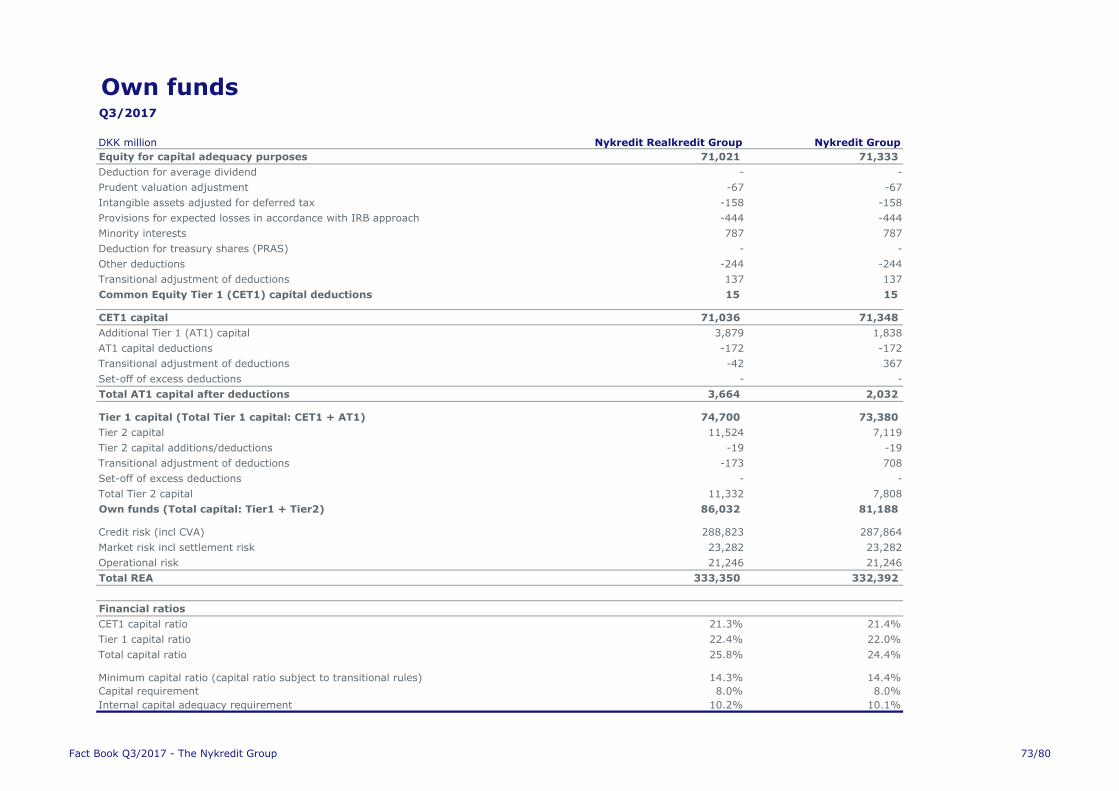
Own fundsQ3/2017
DKK million Nykredit Realkredit Group Nykredit Group
Equity for capital adequacy purposes 71,021 71,333
Deduction for average dividend - -
Prudent valuation adjustment -67 -67
Intangible assets adjusted for deferred tax -158 -158
Provisions for expected losses in accordance with IRB approach -444 -444
Minority interests 787 787
Deduction for treasury shares (PRAS) - -
Other deductions -244 -244
Transitional adjustment of deductions 137 137
Common Equity Tier 1 (CET1) capital deductions 15 15
CET1 capital 71,036 71,348
Additional Tier 1 (AT1) capital 3,879 1,838
AT1 capital deductions -172 -172
Transitional adjustment of deductions -42 367
Set-off of excess deductions - -
Total AT1 capital after deductions 3,664 2,032
Tier 1 capital (Total Tier 1 capital: CET1 + AT1) 74,700 73,380
Tier 2 capital 11,524 7,119
Tier 2 capital additions/deductions -19 -19
Transitional adjustment of deductions -173 708
Set-off of excess deductions - -
Total Tier 2 capital 11,332 7,808
Own funds (Total capital: Tier1 + Tier2) 86,032 81,188
Credit risk (incl CVA) 288,823 287,864
Market risk incl settlement risk 23,282 23,282
Operational risk 21,246 21,246
Total REA 333,350 332,392
Financial ratios
CET1 capital ratio 21.3% 21.4%
Tier 1 capital ratio 22.4% 22.0%
Total capital ratio 25.8% 24.4%
Minimum capital ratio (capital ratio subject to transitional rules) 14.3% 14.4%
Capital requirement 8.0% 8.0%
Internal capital adequacy requirement 10.2% 10.1%
Fact Book Q3/2017 - The Nykredit Group 73/80
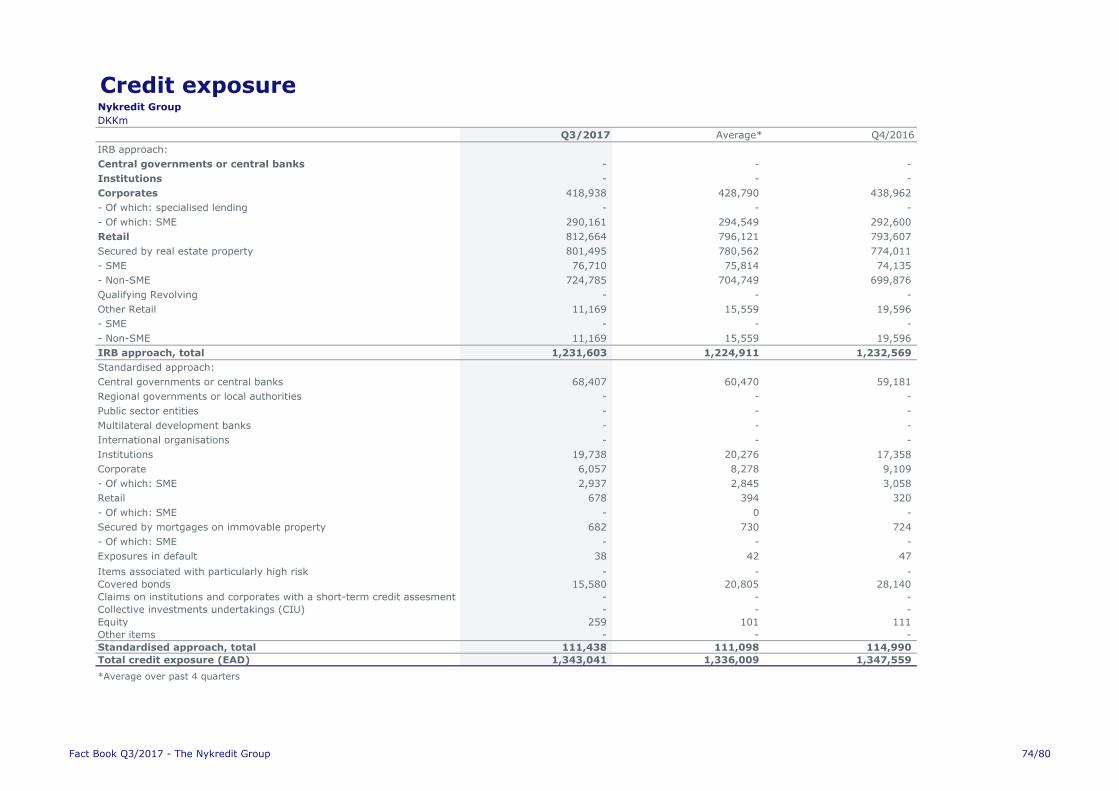
Credit exposureNykredit Group
DKKm
Q3/2017 Average* Q4/2016
IRB approach:
Central governments or central banks - - -
Institutions - - -
Corporates 418,938 428,790 438,962
- Of which: specialised lending - - -
- Of which: SME 290,161 294,549 292,600
Retail 812,664 796,121 793,607
Secured by real estate property 801,495 780,562 774,011
- SME 76,710 75,814 74,135
- Non-SME 724,785 704,749 699,876
Qualifying Revolving - - -
Other Retail 11,169 15,559 19,596
- SME - - -
- Non-SME 11,169 15,559 19,596
IRB approach, total 1,231,603 1,224,911 1,232,569
Standardised approach:
Central governments or central banks 68,407 60,470 59,181
Regional governments or local authorities - - -
Public sector entities - - -
Multilateral development banks - - -
International organisations - - -
Institutions 19,738 20,276 17,358
Corporate 6,057 8,278 9,109
- Of which: SME 2,937 2,845 3,058
Retail 678 394 320
- Of which: SME - 0 -
Secured by mortgages on immovable property 682 730 724
- Of which: SME - - -
Exposures in default 38 42 47
Items associated with particularly high risk - - -
Covered bonds 15,580 20,805 28,140
Claims on institutions and corporates with a short-term credit assesment - - -
Collective investments undertakings (CIU) - - -
Equity 259 101 111
Other items - - -
Standardised approach, total 111,438 111,098 114,990
Total credit exposure (EAD) 1,343,041 1,336,009 1,347,559
*Average over past 4 quarters
Fact Book Q3/2017 - The Nykredit Group 74/80

Credit exposure by ratingNykredit Group
AIRB credit exposure (EAD) by rating category*
Q3/2017
DKKmRetail - Secured by real
estate non-SME
Retail - Secured by real
estate SMERetail - Other Corporates - SME Corporates - Other Total
10 61,331 9,172 2,275 14,823 18,898 106,499
9 97,007 6,750 969 22,730 25,169 152,625
8 178,024 9,278 1,263 48,319 20,379 257,263
7 145,637 11,021 1,065 65,533 29,701 252,957
6 92,388 12,031 1,177 60,340 23,862 189,798
5 43,051 7,997 1,277 26,768 4,996 84,088
4 33,457 8,595 1,286 13,005 1,431 57,774
3 21,786 6,710 730 11,427 1,167 41,821
2 22,842 1,169 260 5,308 254 29,833
1 17,335 854 173 2,380 157 20,900
0 3,624 986 82 6,568 264 11,524
Defaulted 8,303 2,145 611 12,960 2,500 26,519
Total 724,785 76,710 11,169 290,161 128,778 1,231,603
Fact Book Q3/2017 - The Nykredit Group 75/80
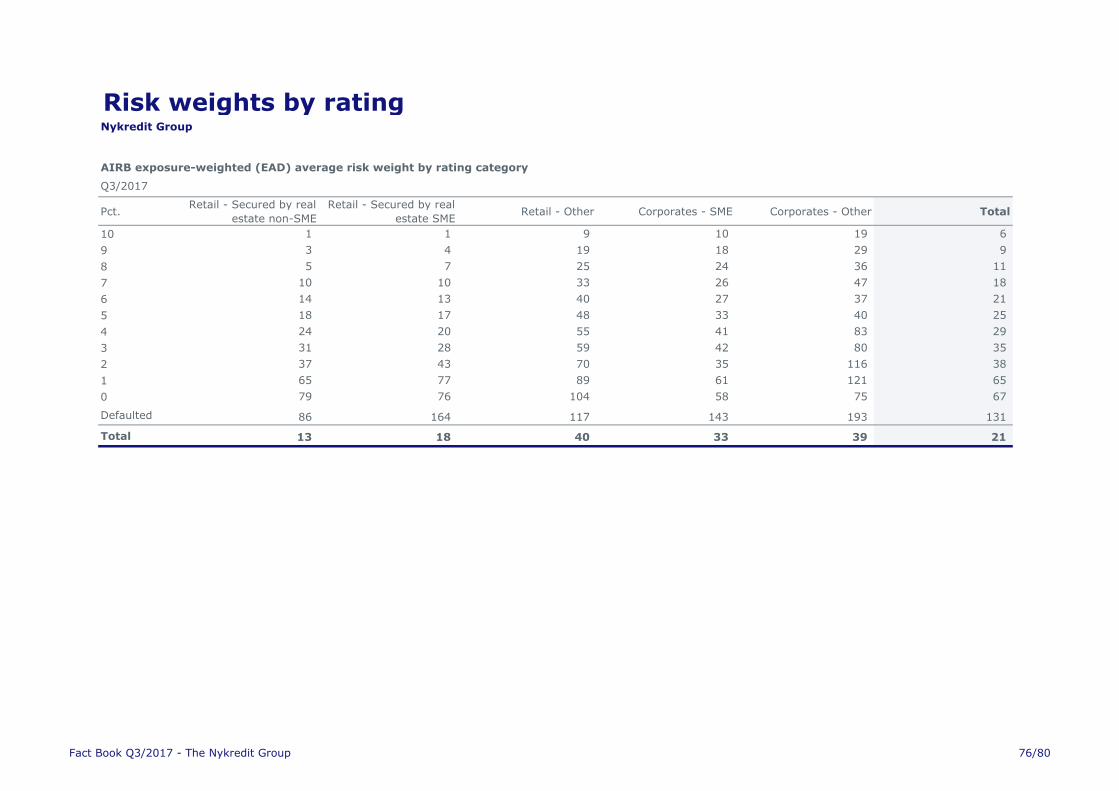
Risk weights by ratingNykredit Group
AIRB exposure-weighted (EAD) average risk weight by rating category
Q3/2017
Pct.Retail - Secured by real
estate non-SME
Retail - Secured by real
estate SMERetail - Other Corporates - SME Corporates - Other Total
10 1 1 9 10 19 6
9 3 4 19 18 29 9
8 5 7 25 24 36 11
7 10 10 33 26 47 18
6 14 13 40 27 37 21
5 18 17 48 33 40 25
4 24 20 55 41 83 29
3 31 28 59 42 80 35
2 37 43 70 35 116 38
1 65 77 89 61 121 65
0 79 76 104 58 75 67
Defaulted 86 164 117 143 193 131
Total 13 18 40 33 39 21
Fact Book Q3/2017 - The Nykredit Group 76/80
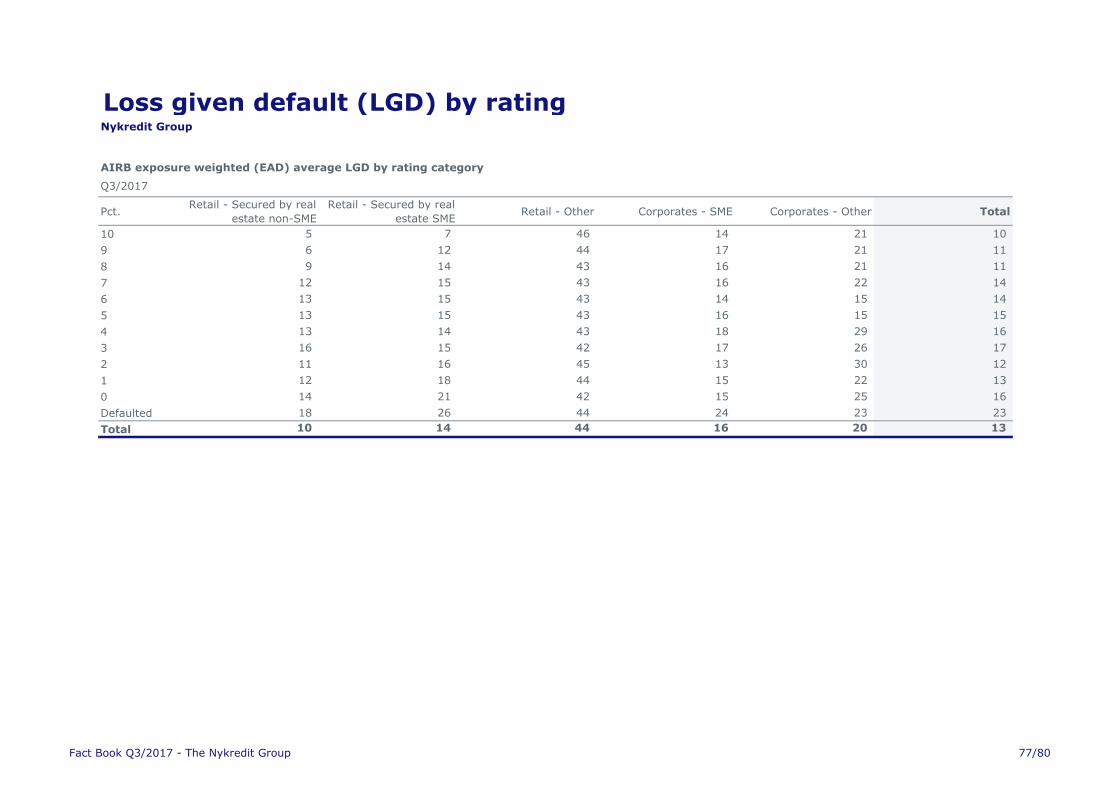
Loss given default (LGD) by ratingNykredit Group
AIRB exposure weighted (EAD) average LGD by rating category
Q3/2017
Pct.Retail - Secured by real
estate non-SME
Retail - Secured by real
estate SMERetail - Other Corporates - SME Corporates - Other Total
10 5 7 46 14 21 10
9 6 12 44 17 21 11
8 9 14 43 16 21 11
7 12 15 43 16 22 14
6 13 15 43 14 15 14
5 13 15 43 16 15 15
4 13 14 43 18 29 16
3 16 15 42 17 26 17
2 11 16 45 13 30 12
1 12 18 44 15 22 13
0 14 21 42 15 25 16
Defaulted 18 26 44 24 23 23
Total 10 14 44 16 20 13
Fact Book Q3/2017 - The Nykredit Group 77/80
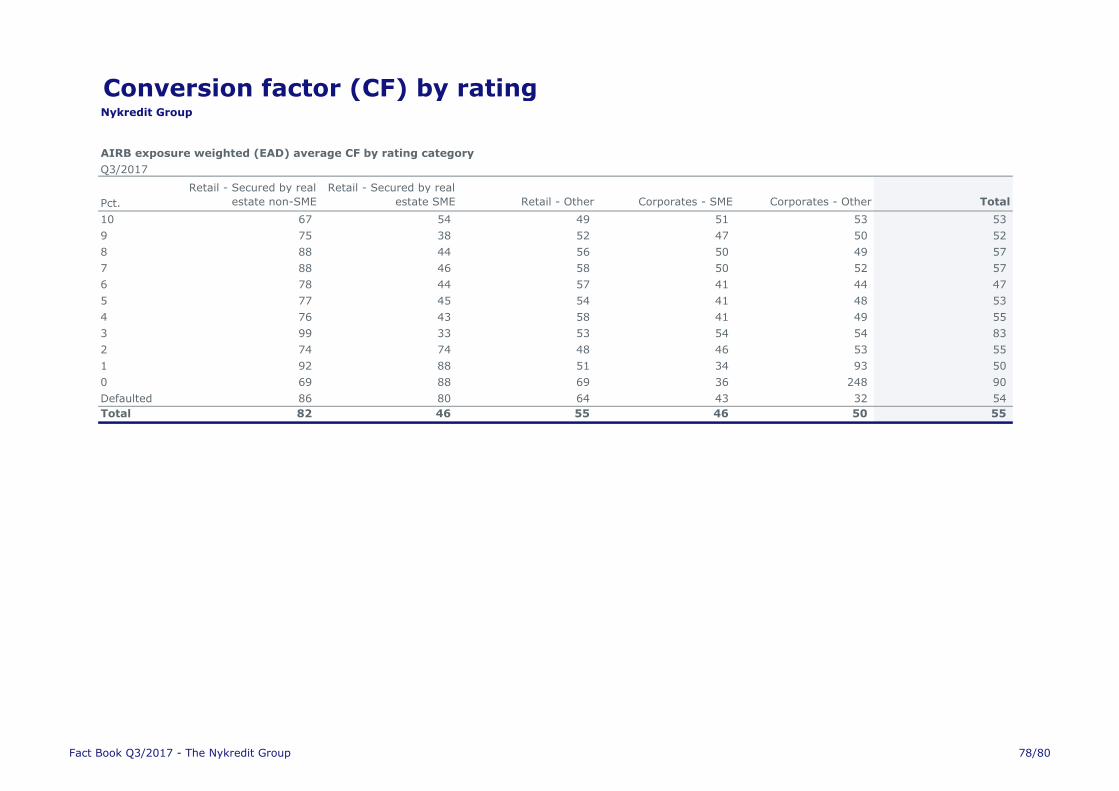
Conversion factor (CF) by ratingNykredit Group
AIRB exposure weighted (EAD) average CF by rating category
Q3/2017
Pct.
Retail - Secured by real
estate non-SME
Retail - Secured by real
estate SME Retail - Other Corporates - SME Corporates - Other Total
10 67 54 49 51 53 53
9 75 38 52 47 50 52
8 88 44 56 50 49 57
7 88 46 58 50 52 57
6 78 44 57 41 44 47
5 77 45 54 41 48 53
4 76 43 58 41 49 55
3 99 33 53 54 54 83
2 74 74 48 46 53 55
1 92 88 51 34 93 50
0 69 88 69 36 248 90
Defaulted 86 80 64 43 32 54
Total 82 46 55 46 50 55
Fact Book Q3/2017 - The Nykredit Group 78/80
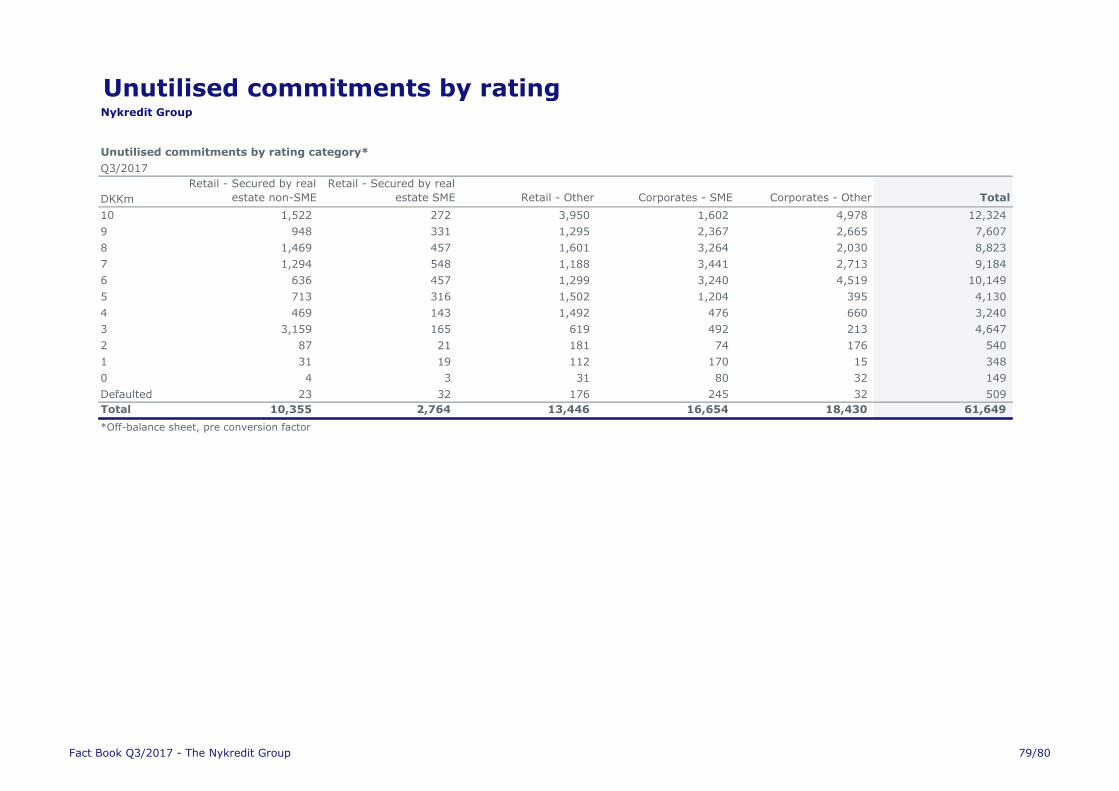
Unutilised commitments by ratingNykredit Group
Unutilised commitments by rating category*
Q3/2017
DKKm
Retail - Secured by real
estate non-SME
Retail - Secured by real
estate SME Retail - Other Corporates - SME Corporates - Other Total
10 1,522 272 3,950 1,602 4,978 12,324
9 948 331 1,295 2,367 2,665 7,607
8 1,469 457 1,601 3,264 2,030 8,823
7 1,294 548 1,188 3,441 2,713 9,184
6 636 457 1,299 3,240 4,519 10,149
5 713 316 1,502 1,204 395 4,130
4 469 143 1,492 476 660 3,240
3 3,159 165 619 492 213 4,647
2 87 21 181 74 176 540
1 31 19 112 170 15 348
0 4 3 31 80 32 149
Defaulted 23 32 176 245 32 509
Total 10,355 2,764 13,446 16,654 18,430 61,649
*Off-balance sheet, pre conversion factor
Fact Book Q3/2017 - The Nykredit Group 79/80
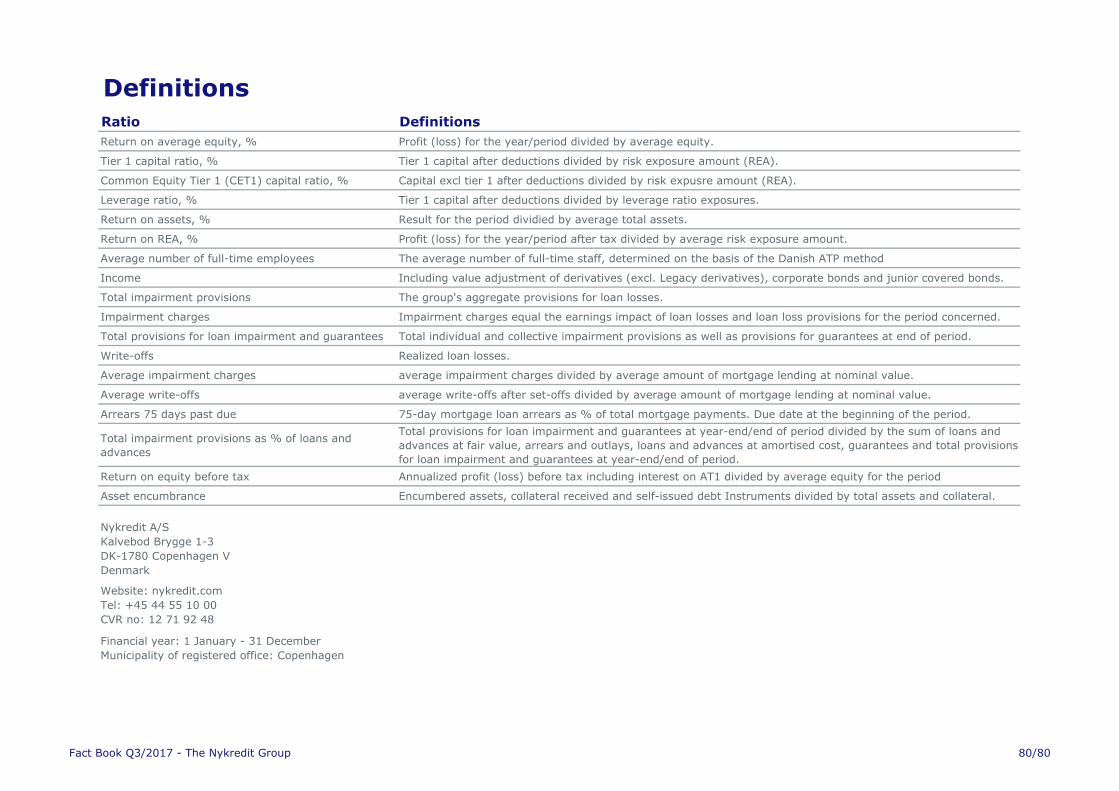
Definitions
Ratio Definitions
Return on average equity, % Profit (loss) for the year/period divided by average equity.
Tier 1 capital ratio, % Tier 1 capital after deductions divided by risk exposure amount (REA).
Common Equity Tier 1 (CET1) capital ratio, % Capital excl tier 1 after deductions divided by risk expusre amount (REA).
Leverage ratio, % Tier 1 capital after deductions divided by leverage ratio exposures.
Return on assets, % Result for the period dividied by average total assets.
Return on REA, % Profit (loss) for the year/period after tax divided by average risk exposure amount.
Average number of full-time employees The average number of full-time staff, determined on the basis of the Danish ATP method
Income Including value adjustment of derivatives (excl. Legacy derivatives), corporate bonds and junior covered bonds.
Total impairment provisions The group's aggregate provisions for loan losses.
Impairment charges Impairment charges equal the earnings impact of loan losses and loan loss provisions for the period concerned.
Total provisions for loan impairment and guarantees Total individual and collective impairment provisions as well as provisions for guarantees at end of period.
Write-offs Realized loan losses.
Average impairment charges average impairment charges divided by average amount of mortgage lending at nominal value.
Average write-offs average write-offs after set-offs divided by average amount of mortgage lending at nominal value.
Arrears 75 days past due 75-day mortgage loan arrears as % of total mortgage payments. Due date at the beginning of the period.
Total impairment provisions as % of loans and
advances
Total provisions for loan impairment and guarantees at year-end/end of period divided by the sum of loans and
advances at fair value, arrears and outlays, loans and advances at amortised cost, guarantees and total provisions
for loan impairment and guarantees at year-end/end of period.
Return on equity before tax Annualized profit (loss) before tax including interest on AT1 divided by average equity for the period
Asset encumbrance Encumbered assets, collateral received and self-issued debt Instruments divided by total assets and collateral.
Nykredit A/S
Kalvebod Brygge 1-3
DK-1780 Copenhagen V
Denmark
Website: nykredit.com
Tel: +45 44 55 10 00
CVR no: 12 71 92 48
Financial year: 1 January - 31 December
Municipality of registered office: Copenhagen
Fact Book Q3/2017 - The Nykredit Group 80/80