fact book 2015-16 - onu.edu · pdf filefact book 2015-16 the onu fact book is ... full-time,...
TRANSCRIPT
Fact Book 2015-16

Fact Book 2015-16
The ONU Fact Book is the official source of statistical information about ONU. This information is distributed on an annual basis and is also available from the Office of Institutional Research website
at http://www.onu.edu/institutional_research
Compiled by the
Office of Institutional Research Ohio Northern University
525 S. Main St. Ada, Ohio 45810
419-772-2529
Staff
Omer Minhas Sue VanDyne Director, Institutional Research Senior Specialist, Institutional Research

Table of Contents Page # About ONU ............................................................................................................................................... iii Admission Statistics and First-Year Class Profiles
Admission Statistics .............................................................................................................................. 1 Annual Tuition, Room and Board Charges ............................................................................................ 2 First-Year Class Profile ......................................................................................................................... 3
First-Time Freshmen ACT Mean Scores ................................................................................................................. 4 Rank in High School Graduating Class ................................................................................. 5 By State .................................................................................................................................. 6 By County ............................................................................................................................... 7 Parental Education and Income .............................................................................................. 9
First-Year Law Students - LSAT Scores ...................................................................................... 10
Enrollment, Majors, and Credit Hours
Student Enrollment Profile .................................................................................................................... 11 By College and Class ................................................................................................................... 12 Gender Distribution by College .................................................................................................... 13 Ethnic Distribution by College ...................................................................................................... 14 International Students .................................................................................................................. 16 Student Type ................................................................................................................................ 18 Full-Time, Part-Time, Full-Time Equivalent (FTE) ....................................................................... 19
Numbers of Declared Majors ................................................................................................................ 20 Student Credit Hours Taught ................................................................................................................ 23
Student Life
Housing Capacity and Occupancy ...................................................................................................... 24 Student Health Services ...................................................................................................................... 25 Student Conduct Incidents ................................................................................................................... 26 Fraternity and Sorority Membership ..................................................................................................... 27 Religious Preference of Students ......................................................................................................... 28 Summer Camps and Conferences ...................................................................................................... 29

Student Outcomes
Graduation and Persistence Rates ..................................................................................................... 30 Number of Graduates by College ......................................................................................................... 31 Number of Majors Completed by Graduates ........................................................................................ 32 Testing Outcomes ................................................................................................................................ 35 Placement Assessment Report ............................................................................................................ 38 Placement of Law Graduates by Class ................................................................................................ 39
Staffing
Employee and Staff Profiles All Employees ............................................................................................................................... 40 Faculty .......................................................................................................................................... 41 Non-instructional Staff .................................................................................................................. 42 Employees by Assigned Position ................................................................................................. 43
Financial
Average Salary and Compensation for Full-Time Faculty .................................................................... 44 Year End Revenues, Expenditures and Value of Endowment Assets ................................................. 46 Institutional Financial Aid Summary .................................................................................................... 47
Alumni and Advancement
Living Alumni by Class Year and College ........................................................................................... 48 Living Alumni by State and College ...................................................................................................... 50 Living Alumni in Ohio by County and College ..................................................................................... 51 Living Alumni by Country and College ................................................................................................. 53 Giving by Donor Category ................................................................................................................... 55 Constituent, Organization and Planned Giving ................................................................................... 56 Alumni Giving by College .................................................................................................................... 57 Alumni Giving by Fund and College ..................................................................................................... 58

About ONU
Ohio Northern University is an independent, comprehensive University located in the scenic village of Ada, Ohio. The University comprises five colleges: Arts & Sciences, Business Administration, Engineering, Pharmacy and Law. Since our inception in 1871, we’ve been devoted to developing students who are ready to immerse themselves and progress to the next level in everything they do. ONU has a rich history of academic excellence, and we’re always evolving to meet society’s ever-changing needs. We’ve most recently been recognized for teaching quality, high graduation rates, commitment to volunteer service and, most impressively, providing a high return on investment for our graduates. Evidence of Excellence (2015)
Ranked No. 2 among Midwest regional colleges by U.S. News & World Report in Best Colleges 2016. Featured as one of the nation’s top schools in The Princeton Review’s annual college guide, The Best 380 Colleges: 2016 Edition.
Ranked No. 38 nationally (2014) by Washington Monthly.
Named in 2014-15 Colleges of Distinction, a guide profiling America’s most distinguished teaching-centered colleges and universities.
Ranked first in both the state of Ohio and the Great Lakes region and second in the nation by College Factual in its 2016 “Best Colleges for the Money” rankings.
Ranked fourth in the “Best Colleges in Ohio” rankings, and in the top 10 percent nationally, in the 2015-16 PayScale College Salary Report.
Ranked among the top schools in the nation and in the state of Ohio for student tuition return on investment (ROI), according to the 2015 PayScale College ROI Report. ONU ranked in the top third for private schools in the state of Ohio and 112th for private universities out of 407 institutions nationwide. Ranking 156 out of 550 private institutions places ONU in the top third for salary potential.
Ranked No. 10 by BestColleges.com in its list of “Best Colleges in Ohio.”
Ranked among the top 50 in BestColleges.com’s national “Best Small Town Colleges” rankings.
Named one of the nation’s best universities in terms of “value-added,” and fourth in the state of Ohio, according to a 2015 report published by a unit of the Brookings Institution.
Location Our scenic, safe and modern campus rests on nearly 342 acres in the village of Ada, Ohio. Our location provides a small town atmosphere that complements the friendly environment found on campus. Ada offers an array of restaurants, shopping and culture. Athletics ONU competes successfully at the NCAA Division III level as part of the highly respected Ohio Athletic Conference. There are 23 varsity sports (12 for men and 11 for women), and nearly as many club and intramural sports. ONU has won a combined total of 16 OAC All-Sports Trophies. Our school colors are orange and black, and our mascot is Klondike the Polar Bear.
iii

Student Life Students choose from a variety of campus activities, including more than 200 student organizations; four national sororities and five national fraternities; intercollegiate, intramural and club sports; music and theatrical events. ONU Sustainability Ohio Northern is making considerable efforts to realize the full benefits of a comprehensive approach to sustainability at the University. Since 2009, ONU has been recognized as a Tree Campus USA by the nonprofit Arbor Day Foundation. The campus is home to two electric-vehicle charging stations as well as a PepsiCo Dream Machine recycling kiosk. Our on-campus housing derives 30 percent of its
heating and cooling from geothermal technology. Our fleet of hybrid and electric campus vehicles reduces our dependence on fossil fuels, and our many environmentally themed student organizations consistently find new ways to make ONU a greener place to live, learn and work. The Inn at Ohio Northern University Ada's world-class hotel offers more than 70 deluxe guest rooms, luxurious amenities and more than 3,000 square feet of flexible meeting spaces. Guests of The Inn enjoy everything that the ONU campus has to offer: athletics, fine art, theatre performances and so much more.
iv
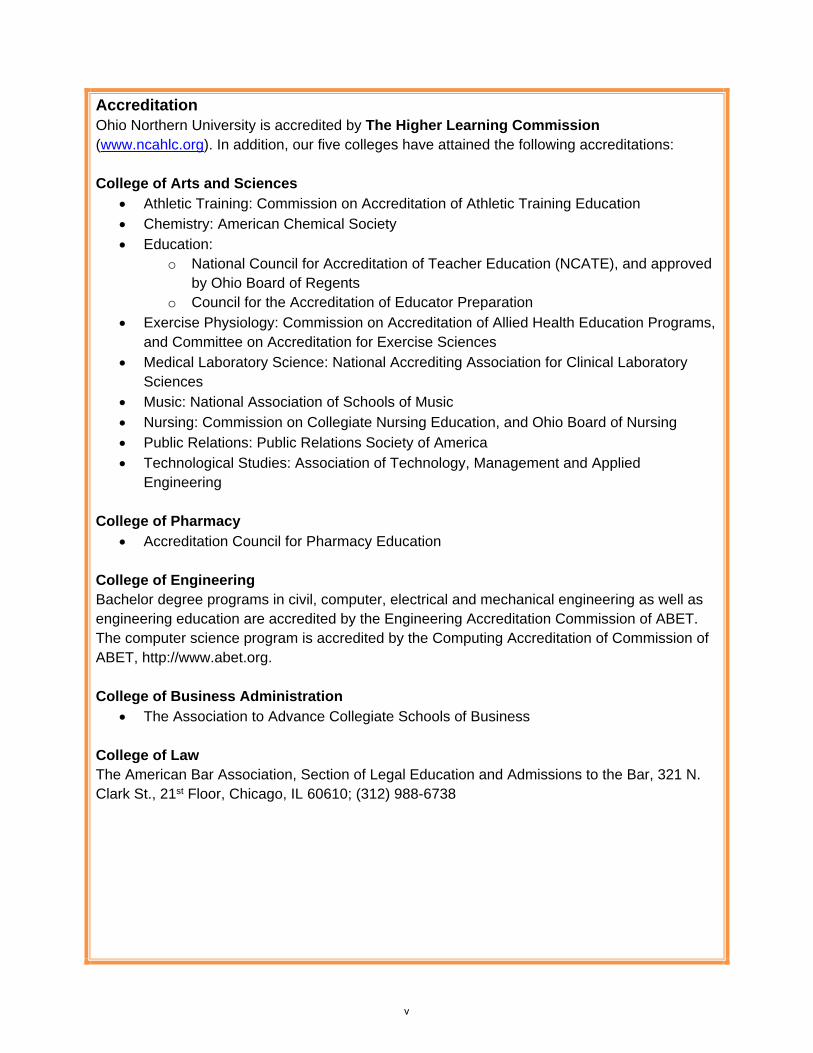
Accreditation Ohio Northern University is accredited by The Higher Learning Commission (www.ncahlc.org). In addition, our five colleges have attained the following accreditations: College of Arts and Sciences
Athletic Training: Commission on Accreditation of Athletic Training Education Chemistry: American Chemical Society Education:
o National Council for Accreditation of Teacher Education (NCATE), and approved by Ohio Board of Regents
o Council for the Accreditation of Educator Preparation Exercise Physiology: Commission on Accreditation of Allied Health Education Programs,
and Committee on Accreditation for Exercise Sciences Medical Laboratory Science: National Accrediting Association for Clinical Laboratory
Sciences Music: National Association of Schools of Music Nursing: Commission on Collegiate Nursing Education, and Ohio Board of Nursing Public Relations: Public Relations Society of America Technological Studies: Association of Technology, Management and Applied
Engineering
College of Pharmacy Accreditation Council for Pharmacy Education
College of Engineering
Bachelor degree programs in civil, computer, electrical and mechanical engineering as well as engineering education are accredited by the Engineering Accreditation Commission of ABET. The computer science program is accredited by the Computing Accreditation of Commission of ABET, http://www.abet.org. College of Business Administration
The Association to Advance Collegiate Schools of Business College of Law The American Bar Association, Section of Legal Education and Admissions to the Bar, 321 N. Clark St., 21st Floor, Chicago, IL 60610; (312) 988-6738
v

President’s Cabinet Colleges/Deans President Daniel A. DiBiasio Provost / VP for Academic Affairs David C. Crago VP for Financial Affairs William H. Ballard VP and Dean for Student Affairs Adriane L. Thompson-Bradshaw VP for Enrollment Management William T. Eilola VP for University Advancement Shannon M. Spencer Associate VP for Academic Affairs Juliet K. Hurtig Executive Director of Communications & Marketing Amy M. Prigge Executive Assistant to the President Ann E. Donnelly Hamilton
Getty College of Arts & Sciences Catherine A. Albrecht The James F. Dicke College of Business Administration James W. Fenton, Jr. Thomas J. Smull College of Engineering Eric T. Baumgartner
Pettit College of Law Richard A. Bales Rudolph H. Raabe College of Pharmacy Steven J. Martin
Board of Trustees Officers of the Board of Trustees and the University
Chairman of the Board Oscar J. Mifsud President and CEO The Mifsud Group, LLC Wadsworth, Ohio
Vice Chairman of the Board Daniel B. Walker President Kokosing Construction Company Westerville, Ohio President of the University Daniel A. DiBiasio President Ohio Northern University Ada, Ohio
Chief Financial Officer and Treasurer William H. Ballard Vice President for Financial Affairs Ohio Northern University Ada, Ohio
Secretary of the Board & University Sharon A. Stechschulte Secretary of the Board and University Ohio Northern University Ada, Ohio Provost / VP for Academic Affairs David C. Crago Provost / VP for Academic Affairs Ohio Northern University Ada, Ohio
vi

Active Trustees
Greg M. Allenby Professor, Marketing and Statistics Max M. Fisher College of Business The Ohio State University Columbus, Ohio
John J. Bishop Chairman of the Board The Motorists Insurance Group Columbus, Ohio
Larry F. Boord President Boord and Associates Worthington, Ohio Donald J. Campbell Special Asst. to NASA Deputy Admin. (retired) NASA Glenn Research Center Westlake, Ohio Thomas A. Compton Chairman (retired) Precision Strip Incorporated Troy, Ohio Cheryl B. Cotner Executive Director (retired) The Future Begins Today Greenville, South Carolina Daniel A. DiBiasio President Ohio Northern University Ada, Ohio Jason S. Duff Founder/CEO Community Storage and Properties Huntsville, Ohio Melissa M. Eddings-Mancuso Chair, University Council Associate Professor of Art Department of Art & Design Ohio Northern University Ada, Ohio
Jennifer A. Frommer Vice President HDR Engineering, Inc. Columbus, Ohio Kenneth B. Hall President Alumni Association Vice President Merchandising (retired) Scot Lad Foods Lima, Ohio Reverend David C. Harris Senior Pastor Trinity United Methodist Church Lima, Ohio Pamela S. Hershberger Partner Ernst & Young LLP Toledo, Ohio John H. Hull Chairman Hull & Associates Toledo, Ohio Michael C. Kaufmann Chief Financial Officer Cardinal Health, Inc. Dublin, Ohio James Lehr Kennedy Founder & CEO Next Future, LLC Dublin, Ohio Robert D. Kerscher President and CEO (retired) Lexi-Comp, Inc. Hudson, Ohio
Carla F. Kim Principal Investigator Children’s Hospital Boston Boston, Massachusetts Frederick C. Kucklick President IMT Consulting, Inc. Cassopolis, Michigan
vii
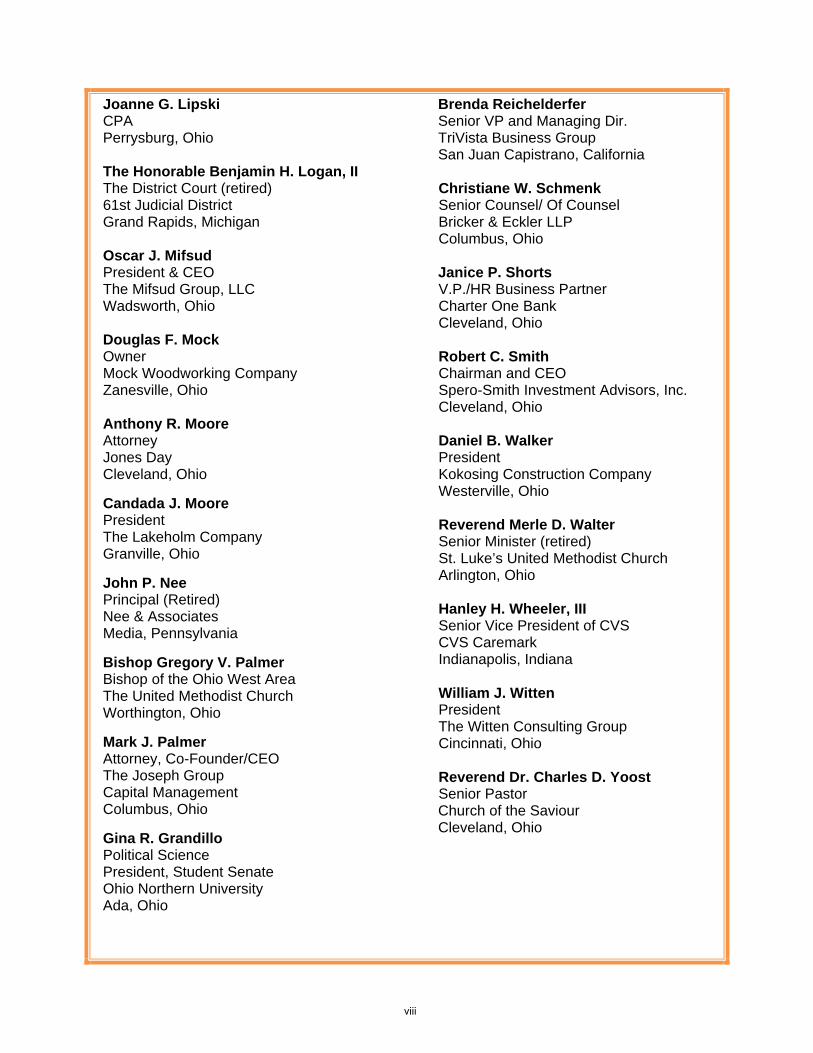
Joanne G. Lipski CPA Perrysburg, Ohio The Honorable Benjamin H. Logan, II The District Court (retired) 61st Judicial District Grand Rapids, Michigan Oscar J. Mifsud President & CEO The Mifsud Group, LLC Wadsworth, Ohio Douglas F. Mock Owner Mock Woodworking Company Zanesville, Ohio Anthony R. Moore Attorney Jones Day Cleveland, Ohio
Candada J. Moore President The Lakeholm Company Granville, Ohio
John P. Nee Principal (Retired) Nee & Associates Media, Pennsylvania
Bishop Gregory V. Palmer Bishop of the Ohio West Area The United Methodist Church Worthington, Ohio
Mark J. Palmer Attorney, Co-Founder/CEO The Joseph Group Capital Management Columbus, Ohio
Gina R. Grandillo Political Science President, Student Senate Ohio Northern University Ada, Ohio
Brenda Reichelderfer Senior VP and Managing Dir. TriVista Business Group San Juan Capistrano, California Christiane W. Schmenk Senior Counsel/ Of Counsel Bricker & Eckler LLP Columbus, Ohio Janice P. Shorts V.P./HR Business Partner Charter One Bank Cleveland, Ohio Robert C. Smith Chairman and CEO Spero-Smith Investment Advisors, Inc. Cleveland, Ohio Daniel B. Walker President Kokosing Construction Company Westerville, Ohio Reverend Merle D. Walter Senior Minister (retired) St. Luke’s United Methodist Church Arlington, Ohio Hanley H. Wheeler, III Senior Vice President of CVS CVS Caremark Indianapolis, Indiana William J. Witten President The Witten Consulting Group Cincinnati, Ohio Reverend Dr. Charles D. Yoost Senior Pastor Church of the Saviour Cleveland, Ohio
viii

Life Trustees Carl D. Clay Dir. of Transportation & Logistics (retired) Marathon Oil Company Montgomery, Texas Frank R. Cosiano Physician (retired) Findlay, Ohio DeBow Freed President Emeritus Ohio Northern University Ada, Ohio Charles B. Hedrick Manager, Employee Relations (retired) The Procter and Gamble Company Cincinnati, Ohio F. Michael Herrel Partner, Regency Software Marketing (retired) Columbus, Ohio Gordon E. Hughes Administrative Vice President (retired) Armco, Inc. Middletown, Ohio Susan J. Insley
Reverend Leonard W. Mann Pastor (retired) United Methodist Church Saint Simons Island, Georgia Thomas P. Moore President (retired) WBCO/WQEL Delaware, Ohio Robin R. Obetz Attorney (retired) Vorys, Sater, Seymour & Pease Columbus, Ohio Ervin W. Pierstorf Chairman of the Board (retired) Fairview Photo Service Pinellas Park, Florida Allen P. Reinhardt Chairman and CEO (retired) A C Products Inc. Orlando, Florida Harrison E. Shutt President Kewpee Hamburger Lima, Ohio
Executive Vice President (retired) Cochran Publications Palmetto, Florida
ix
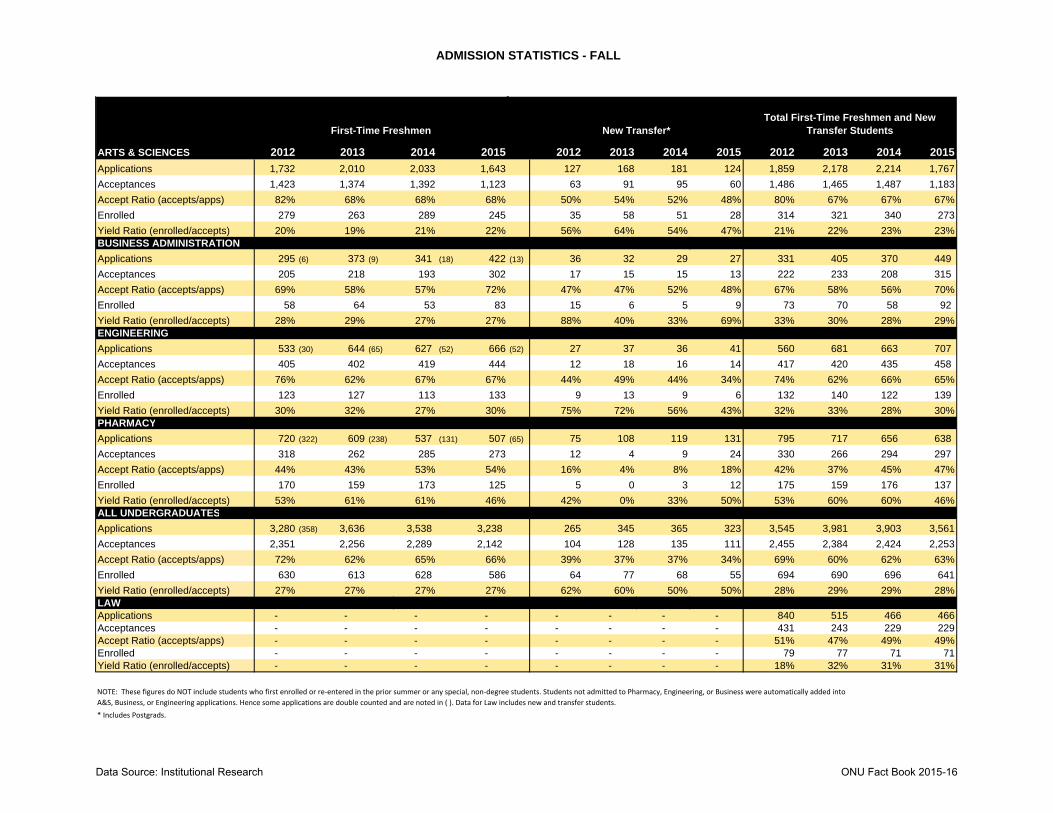
ADMISSION STATISTICS - FALL
ARTS & SCIENCES 2012 2013 2014 2015 2012 2013 2014 2015 2012 2013 2014 2015
Applications 1,732 2,010 2,033 1,643 127 168 181 124 1,859 2,178 2,214 1,767
Acceptances 1,423 1,374 1,392 1,123 63 91 95 60 1,486 1,465 1,487 1,183
Accept Ratio (accepts/apps) 82% 68% 68% 68% 50% 54% 52% 48% 80% 67% 67% 67%
Enrolled 279 263 289 245 35 58 51 28 314 321 340 273
Yield Ratio (enrolled/accepts) 20% 19% 21% 22% 56% 64% 54% 47% 21% 22% 23% 23%BUSINESS ADMINISTRATION
Applications 295 (6) 373 (9) 341 (18) 422 (13) 36 32 29 27 331 405 370 449
Acceptances 205 218 193 302 17 15 15 13 222 233 208 315
Accept Ratio (accepts/apps) 69% 58% 57% 72% 47% 47% 52% 48% 67% 58% 56% 70%
Enrolled 58 64 53 83 15 6 5 9 73 70 58 92
Yield Ratio (enrolled/accepts) 28% 29% 27% 27% 88% 40% 33% 69% 33% 30% 28% 29%ENGINEERING
Applications 533 (30) 644 (65) 627 (52) 666 (52) 27 37 36 41 560 681 663 707
Acceptances 405 402 419 444 12 18 16 14 417 420 435 458
Accept Ratio (accepts/apps) 76% 62% 67% 67% 44% 49% 44% 34% 74% 62% 66% 65%
Enrolled 123 127 113 133 9 13 9 6 132 140 122 139
Yield Ratio (enrolled/accepts) 30% 32% 27% 30% 75% 72% 56% 43% 32% 33% 28% 30%PHARMACY
Applications 720 (322) 609 (238) 537 (131) 507 (65) 75 108 119 131 795 717 656 638
Acceptances 318 262 285 273 12 4 9 24 330 266 294 297
Accept Ratio (accepts/apps) 44% 43% 53% 54% 16% 4% 8% 18% 42% 37% 45% 47%
Enrolled 170 159 173 125 5 0 3 12 175 159 176 137
Yield Ratio (enrolled/accepts) 53% 61% 61% 46% 42% 0% 33% 50% 53% 60% 60% 46%ALL UNDERGRADUATES
Applications 3,280 (358) 3,636 3,538 3,238 265 345 365 323 3,545 3,981 3,903 3,561
Acceptances 2,351 2,256 2,289 2,142 104 128 135 111 2,455 2,384 2,424 2,253
Accept Ratio (accepts/apps) 72% 62% 65% 66% 39% 37% 37% 34% 69% 60% 62% 63%
Enrolled 630 613 628 586 64 77 68 55 694 690 696 641
Yield Ratio (enrolled/accepts) 27% 27% 27% 27% 62% 60% 50% 50% 28% 29% 29% 28%LAW Applications - - - - - - - - 840 515 466 466Acceptances - - - - - - - - 431 243 229 229Accept Ratio (accepts/apps) - - - - - - - - 51% 47% 49% 49%Enrolled - - - - - - - - 79 77 71 71Yield Ratio (enrolled/accepts) - - - - - - - - 18% 32% 31% 31%
* Includes Postgrads.
NOTE: These figures do NOT include students who first enrolled or re‐entered in the prior summer or any special, non‐degree students. Students not admitted to Pharmacy, Engineering, or Business were automatically added into A&S, Business, or Engineering applications. Hence some applications are double counted and are noted in ( ). Data for Law includes new and transfer students.
First-Time Freshmen New Transfer*Total First-Time Freshmen and New
Transfer Students
Data Source: Institutional Research ONU Fact Book 2015-16

ANNUAL TUITION, ROOM AND BOARD CHARGES
TUITION * 2011-12 2012-13 2013-14 2014-15 2015-16Arts & Sciences $34,140 $35,438 $36,720 $28,050 $28,810Business Administration $34,140 $35,438 $36,720 $28,050 $28,810Engineering $36,466 $37,850 $39,200 $32,050 $32,910Pharmacy $38,376 $39,834 $41,240 $33,050 $33,960Law $32,450 $33,684 $33,934 $25,350 $26,030University Average $35,114 $36,449 $37,563 $29,310 $30,104% Change from previous year 4.1% 3.8% 3.1% -22.0% 2.7%CPI for previous year 1.6% 3.2% 2.1% 1.5% 1.6%
ROOM AND BOARD 2011-12 2012-13 2013-14 2014-15 2015-16ROOM $4,960 $5,150 $5,300 $5,430 $5,490BOARD $4,884 $5,070 $5,220 $5,350 $5,400ROOM & BOARD $9,844 $10,220 $10,520 $10,780 $10,890 * 2013-14 through 2015-16 figures include Technology Fees.
Data Source: Financial Aid ONU Fact Book 2015-16

FIRST-YEAR CLASS PROFILE - FALL 2015
First-Time FreshmenHeadcount = 586 (Does Not Include Law College)
Arts & Sciences BusinessAdministration
Engineering Pharmacy
21.3%22.7%
14.2%
41.8%
College
English Math Reading ScienceReasoning
Composite
25.325.926.225.724.8
Average ACT Scores by Test
Ohio
Indiana
Michigan
Pennsylvania
Florida
Illinois
New York
Other States and Foreign Countries
74.9%
8.4%
2.4%
1.7%
2.2%
1.9%
4.9%
3.6%
Geographic Distribution
39.1%
60.9%
Gender Women
Men
Other
White, Non-Hispanic
0% 10% 20% 30%
Top 5%
6-10%
11-25%
26-50%
51-75%
76-100%
18.1%
13.9%
28.0%
24.7%
11.7%
3.5%
High School Rank in Class
15.4%
84.6%
Ethnicity
58.0%42.0%
Gender
Women
Men
30.4%
69.6%
Ethnicity
Other
White, Non-Hispanic
Ohio
Pennsylvania
Florida
Georgia
Indiana
Other States and ForeignCountries
38.8%
11.9%
34.3%
6.0%
4.5%
4.5%
Geographic Distribution
First-Year Law StudentsHeadcount = 69
Data Source: Institutional Research ONU Fact Book 2015-16

FIRST-TIME FRESHMEN - FALLACT Mean Scores
2011 2012 2013 2014 2015ARTS & SCIENCES English 25.3 24.2 23.9 24.7 23.7 Mathematics 25.0 24.3 24.2 24.5 24.0 Reading 26.0 25.5 25.5 25.4 25.2 Science Reasoning 25.5 24.8 24.9 25.0 24.5 Composite 25.3 24.5 24.4 24.6 24.0
BUSINESS ADMINISTRATION English 23.5 23.2 24.3 23.6 23.4 Mathematics 25.6 24.5 24.9 25.4 25.2 Reading 24.5 24.9 25.4 25.2 24.8 Science Reasoning 24.9 24.2 24.6 25.0 25.3 Composite 24.3 23.8 24.4 24.6 24.4
ENGINEERING English 26.2 25.3 25.9 26.6 26.0 Mathematics 28.3 27.6 28.0 28.1 27.9 Reading 26.1 25.8 27.1 27.2 27.3 Science Reasoning 27.5 27.1 27.6 27.6 27.5 Composite 26.7 26.1 26.8 27.1 26.9
PHARMACY English 29.3 28.8 28.9 27.8 26.7 Mathematics 29.2 29.0 28.7 28.0 27.2 Reading 29.4 29.2 29.4 28.4 27.9 Science Reasoning 28.8 28.1 28.3 27.9 27.2 Composite 28.8 28.5 28.6 27.6 26.9
UNIVERSITY English 26.5 25.5 25.7 25.8 24.8 Mathematics 26.9 26.2 26.3 26.2 25.7 Reading 26.9 26.5 26.9 26.5 26.2 Science Reasoning 26.8 26.1 26.3 26.3 25.9 Composite 26.5 25.8 26.0 25.9 25.3
23
24
25
26
27
28
29
30
2011 2012 2013 2014 2015
ACT MEAN COMPOSITE SCORES
A&S
Business
Engineering
Pharmacy
University
Data Source: Institutional Research ONU Fact Book 2015-16

FIRST-TIME FRESHMEN - FALLRank in High School Graduating Class
(of those who submitted rank information)
2011 2012 2013 2014 2015% in Range % in Range % in Range % in Range % in Range
ARTS & SCIENCES Upper 5% 19.1 11.0 12.2 11.2 11.4 6-10% 10.1 11.9 11.7 12.0 9.5 11-25% 28.4 34.7 34.1 28.9 30.3 26-50% 29.6 22.9 25.7 33.1 25.9 51-75% 9.3 16.5 13.1 12.4 15.9 76-100% 3.5 3.0 3.3 2.5 7.0
Upper 5% 8.5 10.2 12.5 11.6 7.3 6-10% 5.1 20.4 8.3 14.0 5.5 11-25% 37.3 20.4 27.1 18.6 30.9 26-50% 35.6 26.5 39.6 39.5 40.0 51-75% 11.9 18.4 8.3 14.0 14.5 76-100% 1.7 4.1 4.2 2.3 1.8ENGINEERING Upper 5% 21.9 21.6 16.5 13.8 17.5 6-10% 13.3 9.8 20.4 14.9 14.6 11-25% 39.0 42.2 32.0 29.9 32.0 26-50% 19.0 22.5 22.3 36.8 26.2 51-75% 6.7 2.9 7.8 3.4 8.7 76-100% 0.0 1.0 1.0 1.1 1.0PHARMACY Upper 5% 55.4 50.4 49.6 32.6 39.4 6-10% 14.0 23.6 23.1 31.1 27.7 11-25% 22.3 17.1 24.0 23.5 17.0 26-50% 7.0 7.3 3.3 12.9 11.7 51-75% 0.6 0.8 0.0 0.0 4.3 76-100% 0.6 0.8 0.0 0.0 0.0UNIVERSITY Upper 5% 28.4 22.5 22.4 17.3 18.1 6-10% 11.2 15.1 16.0 17.7 13.9 11-25% 29.6 30.6 30.5 26.8 28.0 26-50% 22.1 19.4 20.8 29.0 24.7 51-75% 6.7 10.2 8.2 7.7 11.7 76-100% 1.9 2.2 2.1 1.6 3.5
BUSINESS ADMINISTRATION
40
50
60
70
80
90
100
2011 2012 2013 2014 2015
% OF FRESHMEN IN TOP 25% OF H.S. CLASS
A&S
Business
Engineering
Pharmacy
University
Data Source: Institutional Research ONU Fact Book 2015-16

FIRST-TIME FRESHMEN - FALLby State
2011 2012 2013 2014 2015STATEAlabama 2 2 - - -Alaska - - - - -Arizona 1 1 1 1 2Arkansas - - - - -California 3 4 3 4 6Colorado 1 1 - - 1Connecticut - - - - 1Delaware - - - - -Dist. of Columbia - - - - -Florida 18 12 11 4 13Georgia 1 1 - 4 1Hawaii - - - - -Idaho - - - - -Illinois 12 16 8 8 10Indiana 27 27 25 25 21Iowa - - 1 2 -Kansas 1 - - 1 -Kentucky 4 3 1 3 2Louisiana - - - - -Maine - - - - -Maryland 1 3 - 1 2Massachusetts 2 1 - - -Michigan 26 20 19 24 29Minnesota 2 3 1 - 1Mississippi - - - - -Missouri - 1 - 1 -Montana - - - - -Nebraska - - - - -Nevada - - - - 1New Hampshire - - - - -New Jersey 1 - 1 - 2New Mexico - 1 - 1 -New York 11 10 5 5 14North Carolina 2 1 3 1 -North Dakota - - 1 - 3Ohio 526 479 501 512 439Oklahoma - - - - -Oregon - 1 - - 1Pennsylvania 20 19 14 16 11Rhode Island - - - - -South Carolina - 1 - - -South Dakota - - - - -Tennessee - - - - -Texas 4 2 3 4 4Utah 1 - - - -Vermont 1 - - - -Virginia 2 1 2 2 4Washington 1 - - - 1West Virginia - 2 1 -Wisconsin 4 1 - 1 1Wyoming - - - - -Unknown - 1 - - -International 12 16 12 8 16TOTAL 686 630 613 628 586% OHIO 77% 76% 82% 82% 75%
Data Source: Institutional Research ONU Fact Book 2015-16

FIRST-TIME FRESHMEN - FALL by County
(of those from Ohio)
2011 2012 2013 2014 2015
COUNTYAdams 1 - - - -Allen 30 38 28 26 33Ashland 4 2 2 1 4Ashtabula - 4 4 5 3Athens - 1 2 2 -Auglaize 12 8 18 8 10Belmont 4 - 1 1 -Brown 2 o - - -Butler 12 6 15 2 2Carroll - - 2 3 1Champaign 5 4 7 2 4Clark 4 6 6 10 3Clermont 4 7 3 4 4Clinton 1 1 1 2 1Columbiana - 4 3 1 1Coshocton 2 - 1 - -Crawford 2 3 2 6 5Cuyahoga 36 28 32 32 31Darke 1 7 3 6 -Defiance 2 5 2 2 1Delaware 6 12 10 17 5Erie - 2 5 5 6Fairfield 9 4 11 8 9Fayette 2 2 1 - 1Franklin 23 26 34 21 19Fulton 6 2 1 - 1Gallia - - - - -Geauga 7 1 3 5 3Greene 4 4 13 7 5Guernsey - 1 - 3 -Hamilton 9 13 8 18 8Hancock 16 9 15 14 20Hardin 15 11 26 19 17Harrison 2 2 - 1 -Henry 6 7 5 1 2Highland 1 2 - - 2Hocking - 1 - - -Holmes 1 - 2 2 -Huron 3 3 7 1 3Jackson - - - 2 1Jefferson 1 2 - - -Knox 2 2 1 3 6Lake 13 17 - 8 7Lawrence - - 7 - 1Licking 6 5 7 3 4Logan 7 8 13 9 9Lorain 10 11 7 9 13Lucas 16 12 12 11 13Madison 4 2 1 2 4Mahoning 16 7 3 8 3Marion 6 5 4 2 5Medina 14 15 16 13 10Meigs - - - - -Mercer 15 4 9 8 6Miami 13 12 11 2 8
Continued on next page
Data Source: Institutional Research ONU Fact Book 2015-16

FIRST-TIME FRESHMEN - FALL by County
(of those from Ohio)
2011 2012 2013 2014 2015
COUNTYMonroe - - - 1Montgomery 16 17 12 24 12Morgan - 1 - 2 -Morrow 2 2 - 2 1Muskingum 4 - 6 1 5Noble - - - - -Ottawa 2 5 1 3 4Paulding 3 1 1 3 -Perry 1 2 - 2 1Pickaway 4 1 1 3 5Pike - - - - 2Portage 5 3 5 8 1Preble - - - 3 1Putnam 16 5 5 10 9Richland 7 5 6 3 5Ross 2 4 2 2 3Sandusky 7 3 7 5 3Scioto - - 1 2 -Seneca 5 5 5 5 10Shelby 6 9 7 5 2Stark 14 7 7 12 14Summit 25 18 6 15 17Trumbull 4 5 5 3 2Tuscarawas 1 3 1 5 3Union 5 3 4 2 6Van Wert 5 4 14 10 6Vinton - - - - -Warren 15 13 10 12 15Washington - 2 2 5 -Wayne 8 5 9 10 4Williams - 4 4 4 3Wood 11 7 12 8 5Wyandot 3 4 4 4 5Unknown - 13 - 23 1TOTAL 526 479 501 512 439
Data Source: Institutional Research ONU Fact Book 2015-16
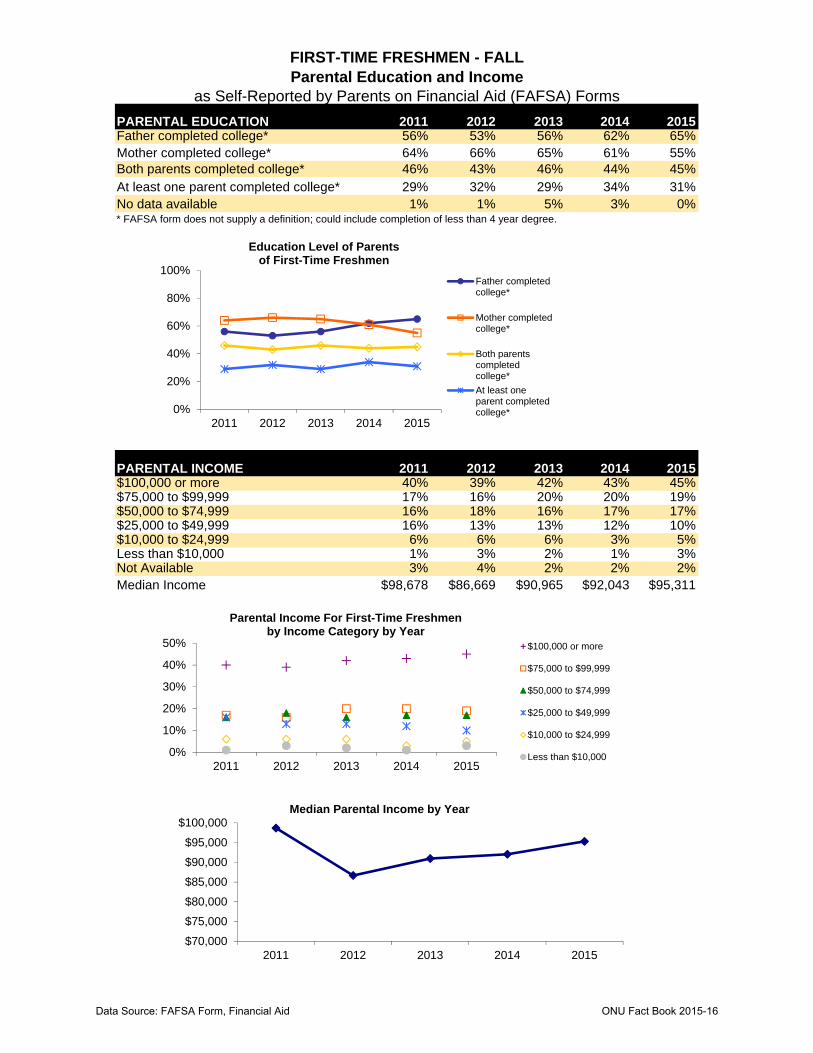
FIRST-TIME FRESHMEN - FALLParental Education and Income
as Self-Reported by Parents on Financial Aid (FAFSA) Forms
PARENTAL EDUCATION 2011 2012 2013 2014 2015Father completed college* 56% 53% 56% 62% 65%Mother completed college* 64% 66% 65% 61% 55%Both parents completed college* 46% 43% 46% 44% 45%At least one parent completed college* 29% 32% 29% 34% 31%No data available 1% 1% 5% 3% 0%* FAFSA form does not supply a definition; could include completion of less than 4 year degree.
2011 2012 2013 2014 2015$100,000 or more 40% 39% 42% 43% 45%$75,000 to $99,999 17% 16% 20% 20% 19%$50,000 to $74,999 16% 18% 16% 17% 17%$25,000 to $49,999 16% 13% 13% 12% 10%$10,000 to $24,999 6% 6% 6% 3% 5%Less than $10,000 1% 3% 2% 1% 3%Not Available 3% 4% 2% 2% 2%Median Income $98,678 $86,669 $90,965 $92,043 $95,311
PARENTAL INCOME
0%
20%
40%
60%
80%
100%
2011 2012 2013 2014 2015
Education Level of Parentsof First-Time Freshmen
Father completedcollege*
Mother completedcollege*
Both parentscompletedcollege*
At least oneparent completedcollege*
0%
10%
20%
30%
40%
50%
2011 2012 2013 2014 2015
Parental Income For First-Time Freshmenby Income Category by Year
$100,000 or more
$75,000 to $99,999
$50,000 to $74,999
$25,000 to $49,999
$10,000 to $24,999
Less than $10,000
$70,000
$75,000
$80,000
$85,000
$90,000
$95,000
$100,000
2011 2012 2013 2014 2015
Median Parental Income by Year
Data Source: FAFSA Form, Financial Aid ONU Fact Book 2015-16

FIRST-YEAR LAW STUDENTS - FALLMedian LSAT Scores For Entering Classes
Median Score National Percentile
2011 154 60
2012 152 52
2013 150 44
2014 150 44
2015 149 40
60
52
44 44
4040
45
50
55
60
2011 2012 2013 2014 2015
National Percentile of Median Score
154
152
150 150149
145146147148149150151152153154155156
2011 2012 2013 2014 2015
Median LSAT Score of Entering Class
Data Source: College of Law ONU Fact Book 2015-16
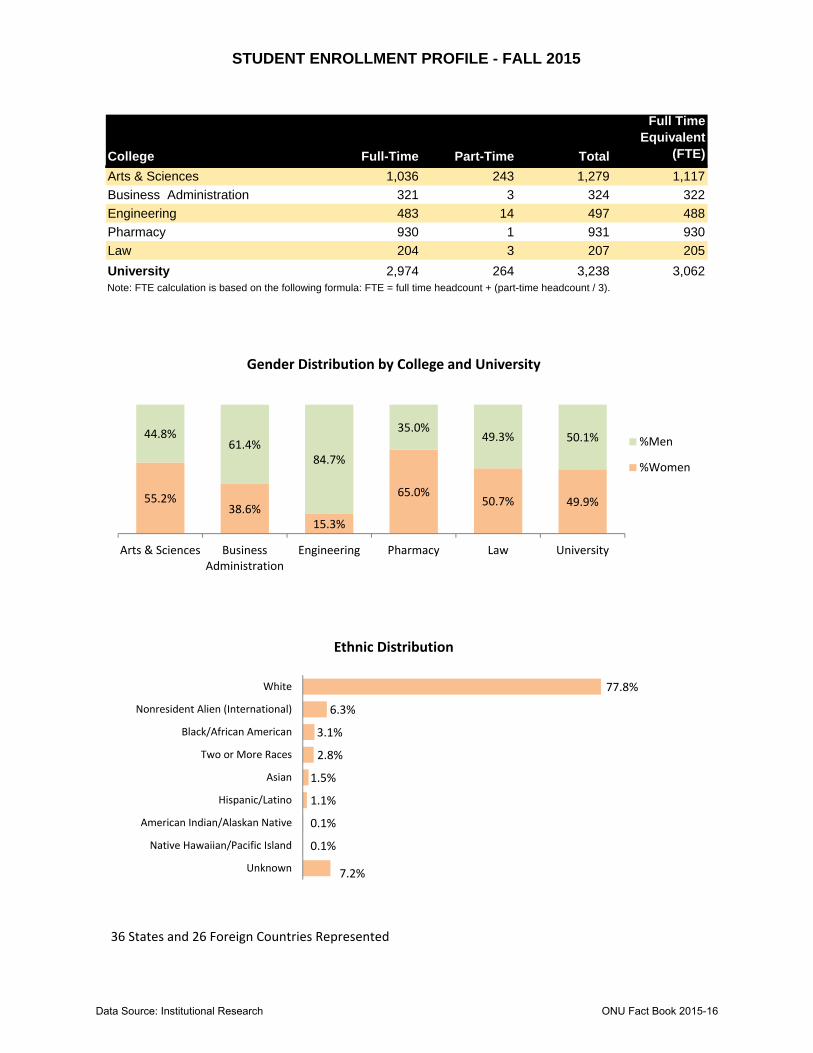
STUDENT ENROLLMENT PROFILE - FALL 2015
College Full-Time Part-Time Total
Full Time Equivalent
(FTE)
Arts & Sciences 1,036 243 1,279 1,117
Business Administration 321 3 324 322
Engineering 483 14 497 488
Pharmacy 930 1 931 930
Law 204 3 207 205
University 2,974 264 3,238 3,062Note: FTE calculation is based on the following formula: FTE = full time headcount + (part-time headcount / 3).
36 States and 26 Foreign Countries Represented
55.2%38.6%
15.3%
65.0%50.7% 49.9%
44.8%61.4%
84.7%
35.0%49.3% 50.1%
Arts & Sciences BusinessAdministration
Engineering Pharmacy Law University
Gender Distribution by College and University
%Men
%Women
7.2%
0.1%
0.1%
1.1%
1.5%
2.8%
3.1%
6.3%
77.8%
Unknown
Native Hawaiian/Pacific Island
American Indian/Alaskan Native
Hispanic/Latino
Asian
Two or More Races
Black/African American
Nonresident Alien (International)
White
Ethnic Distribution
Data Source: Institutional Research ONU Fact Book 2015-16

STUDENT ENROLLMENT PROFILE - FALLby College and Class
5 Year 1 year
2011 2012 2013 2014 2015 % Change % changeARTS & SCIENCESFreshman 356 339 344 346 308Sophomore 265 251 240 255 233Junior 240 232 276 226 214Senior 309 296 282 305 267ESL Program 14 23 33 22 3High School 5 7 - 14 -High School Cooperative Program 316 323 387 481 217Post Graduate 14 10 10 9 12Exchange Student 5 16 8 8 20Special 9 5 13 23 4Transient - - - 2 1TOTAL 1,533 1,502 1,593 1,691 1,279 -16.6% -24.4%BUSINESS ADMINISTRATIONFreshman 82 89 86 69 97Sophomore 50 60 60 63 55Junior 76 59 65 72 65Senior 90 73 62 72 75Graduate Student - 6 12 9 21Post Graduate 2 - 2 2 3Exchange Student 5 6 10 11 8Special - - - 1 -TOTAL 305 293 297 299 324 6.2% 8.4%ENGINEERINGFreshman 126 136 134 117 139Sophomore 88 101 110 119 94Junior 77 81 89 97 108Senior 118 106 112 116 133Post Graduate - - 1 1 1Exchange Student - - 2 - 22Special - - - 25 -TOTAL 409 424 448 475 497 21.5% 4.6%PHARMACYPharmacy - First Year 219 227 213 241 179Pharmacy - Second Year 169 160 134 128 142Pharmacy - Third Year 159 162 194 157 173Pharmacy - Fourth Year 161 158 140 144 114Pharmacy - Fifth Year 163 156 152 157 169Pharmacy - Sixth Year 154 157 168 152 153Pharmacy - PharmD Didactic 5 1 - - -Exchange Student - - - - 1Special - - - 4 -TOTAL 1,030 1,021 1,001 983 931 -9.6% -5.3%LAWLaw - First Year 111 80 77 72 71Law - Second Year 102 94 63 71 55Law - Third Year 98 99 96 64 71LLM 9 15 15 11 10TOTAL 320 288 251 218 207 -35.3% -5.0%SPECIAL PROGRAMSPrison Management Certificate Prog. 14 29 29 29 -UNIVERSITY TOTAL 3,611 3,557 3,619 3,695 3,238 -10.3% -12.4%
0
250
500
750
1000
1250
1500
1750
2011 2012 2013 2014 2015
Fall Enrollment by College5 Year Trends
A&S
Business
Pharmacy
Law
Engineering
Data Source: Institutional Research ONU Fact Book 2015-16

STUDENT ENROLLMENT PROFILE - FALLGender Distribution by College
2011 2012 2013 2014 2015ARTS & SCIENCESMen 703 696 687 744 573Women 830 806 906 947 706Total 1,533 1,502 1,593 1,691 1,279%Men 45.9% 46.3% 43.1% 44.0% 44.8%%Women 54.1% 53.7% 56.9% 56.0% 55.2%BUSINESS ADMINISTRATIONMen 189 179 182 173 199Women 116 114 115 126 125Total 305 293 297 299 324%Men 62.0% 61.1% 61.3% 57.9% 61.4%%Women 38.0% 38.9% 38.7% 42.1% 38.6%ENGINEERINGMen 358 374 392 405 421Women 51 50 56 70 76Total 409 424 448 475 497%Men 87.5% 88.2% 87.5% 85.3% 84.7%%Women 12.5% 11.8% 12.5% 14.7% 15.3%PHARMACYMen 386 372 352 340 326Women 644 649 649 643 605Total 1,030 1,021 1,001 983 931%Men 37.5% 36.4% 35.2% 34.6% 35.0%%Women 62.5% 63.6% 64.8% 65.4% 65.0%LAWMen 188 167 138 115 102Women 132 121 113 103 105Total 320 288 251 218 207%Men 58.8% 58.0% 55.0% 52.8% 49.3%%Women 41.3% 42.0% 45.0% 47.2% 50.7%SPECIAL PROGRAMSMen 14 29 29 29 - Women - - - - - Total 14 29 29 29 - %Men 100.0% 100.0% 100.0% 100.0% - %Women 0.0% 0.0% 0.0% 0.0% - UNIVERSITY TOTALMen 1,838 1,817 1,780 1,806 1,621Women 1,773 1,740 1,839 1,889 1,617Total 3,611 3,557 3,619 3,695 3,238%Men 50.9% 51.1% 49.2% 48.9% 50.1%%Women 49.1% 48.9% 50.8% 51.1% 49.9%
Data Source: Institutional Research ONU Fact Book 2015-16

STUDENT ENROLLMENT PROFILE - FALLEthnic Distribution by College
2011 2012 2013 2014 2015% in
2015
ARTS & SCIENCESBlack/African American 67 59 62 62 49 3.8%American Indian/Alaskan Native 2 1 1 1 1 0.1%Asian 16 10 13 11 9 0.7%Hispanic/Latino 41 33 31 21 12 0.9%Nonresident Alien (International) 39 65 83 72 48 3.8%Two or More Races 32 44 51 55 52 4.1%Native Hawaiian/Pacific Islander 2 2 2 2 - 0.0%White 1,323 1,269 1,336 1,229 1,013 79.2%Unknown 11 19 14 238 95 7.4%Total 1,533 1,502 1,593 1,691 1,279 100.0%BUSINESS ADMINISTRATIONBlack/African American 19 23 18 14 14 4.3%American Indian/Alaskan Native - 1 - - - 0.0%Asian 6 4 5 5 5 1.5%Hispanic/Latino 5 6 2 1 3 0.9%Nonresident Alien (International) 20 20 28 30 30 9.3%Two or More Races 8 11 12 12 5 1.5%Native Hawaiian/Pacific Islander - - - - - 0.0%White 247 228 232 233 260 80.2%Unknown - - - 4 7 2.2%Total 305 293 297 299 324 100.0%ENGINEERINGBlack/African American 5 5 7 8 8 1.6%American Indian/Alaskan Native - - - 1 1 0.2%Asian 1 2 3 2 2 0.4%Hispanic/Latino 3 3 4 5 4 0.8%Nonresident Alien (International) 14 11 15 41 40 8.0%Two or More Races 6 5 8 10 10 2.0%Native Hawaiian/Pacific Islander - - - - - 0.0%White 380 398 410 398 420 84.5%Unknown - - 1 10 12 2.4%Total 409 424 448 475 497 100.0%PHARMACYBlack/African American 17 16 14 16 17 1.8%American Indian/Alaskan Native 1 - - - - 0.0%Asian 39 39 36 35 31 3.3%Hispanic/Latino 5 7 8 8 8 0.9%Nonresident Alien (International) 37 45 43 45 45 4.8%Two or More Races 14 22 22 25 27 2.9%Native Hawaiian/Pacific Islander - - - - - 0.0%White 917 891 877 843 789 84.7%Unknown - 1 1 11 14 1.5%Total 1,030 1,021 1,001 983 931 100.0%
Data Source: Institutional Research ONU Fact Book 2015-1614
STUDENT ENROLLMENT PROFILE - FALLEthnic Distribution by College
2011 2012 2013 2014 2015% in
2015LAWBlack/African American 18 19 18 13 19 9.2%American Indian/Alaskan Native 1 1 1 2 5 2.4%Asian 6 2 2 3 3 1.4%Hispanic/Latino 5 3 4 5 9 4.3%Nonresident Alien (International) 9 16 15 15 13 6.3%Two or More Races 5 6 5 3 1 0.5%Native Hawaiian/Pacific Islander - - - 1 1 0.5%White 273 236 199 172 153 73.9%Unknown 3 5 7 4 3 1.4%Total 320 288 251 218 207 100.0%SPECIAL PROGRAMSBlack/African American - - - - - - American Indian/Alaskan Native - - - - - - Asian - - - - - - Hispanic/Latino - - - - - - Nonresident Alien (International) 14 29 29 29 - - Two or More Races - - - - - - Native Hawaiian/Pacific Islander - - - - - - White - - - - - - Unknown - - - - - - Total 14 29 29 29 - - UNIVERSITYBlack/African American 126 122 119 113 107 3.3%American Indian/Alaskan Native 4 3 2 4 7 0.2%Asian 68 57 59 56 50 1.5%Hispanic/Latino 59 52 49 40 36 1.1%Nonresident Alien (International) 133 186 213 232 176 5.4%Two or More Races 65 88 98 105 95 2.9%Native Hawaiian/Pacific Islander 2 2 2 3 1 0.0%White 3,140 3,022 3,054 2,875 2,635 81.4%Unknown 14 25 23 267 131 4.0%Total 3,611 3,557 3,619 3,695 3,238 100.0%
Note: Starting in 2010-11, enrollments are reported using the new IPEDS race/ethnicity categories.
Data Source: Institutional Research ONU Fact Book 2015-1615

STUDENT ENROLLMENT PROFILE - FALLInternational Students
2011 2012 2013 2014 2015By GenderMale 86 122 134 143 84Female 49 64 79 89 92TOTAL 135 186 213 232 176By CollegeArts & Sciences 39 65 83 72 48Business Administration 22 20 28 30 30Engineering 14 11 15 41 40Pharmacy 37 45 43 45 45Law 9 16 15 15 13Special Programs 14 29 29 29 -By Degree StatusNon-Degree Seeking 38 75 84 106 54Degree Seeking 97 111 129 126 122By CountryAlbania - - - - -Afghanistan 2 4 6 3 4Australia - - - 1 1Azerbaijan - - - - -Bahrain 1 1 1 - -Bangladesh - - 1 - -Bhutan - - - - -Bosnia-Herzegovina - - - - -Botswana - - - - 1Brazil - 7 26 50 35Cameroon 1 1 - - 1Canada 5 4 5 5 8Colombia 1 - - - -China 12 13 15 16 13Denmark - - 1 1 1Ecuador - - - - 1Egypt - - - 1 -Eeitrea - - - - 1Ethiopia - 1 - 1 -Finland - 1 4 3 3France 1 - 1 - -Georgia 1 2 2 1 1Germany - - - - -Ghana 3 1 1 - -Guyana - - - - -Hong Kong 1 1 - - -Iceland - 1 - 1 -India 2 2 1 - -Iran 1 1 - - 2Jamaica 1 1 1 - -Japan 18 20 20 21 26Jordan 1 - - 1 -Kenya - - 1 - 1Kosovo 1 - - - -Kuwait 1 2 2 - 1Kyrgyzstan - - - - -Lebanon 1 - 1 - -Liberia - 1 - 1 -Malawi - - 1 - -Maldives - 1 - - -Mexico - - - - -
Continued on next page
Data Source: Institutional Research ONU Fact Book 2015-16
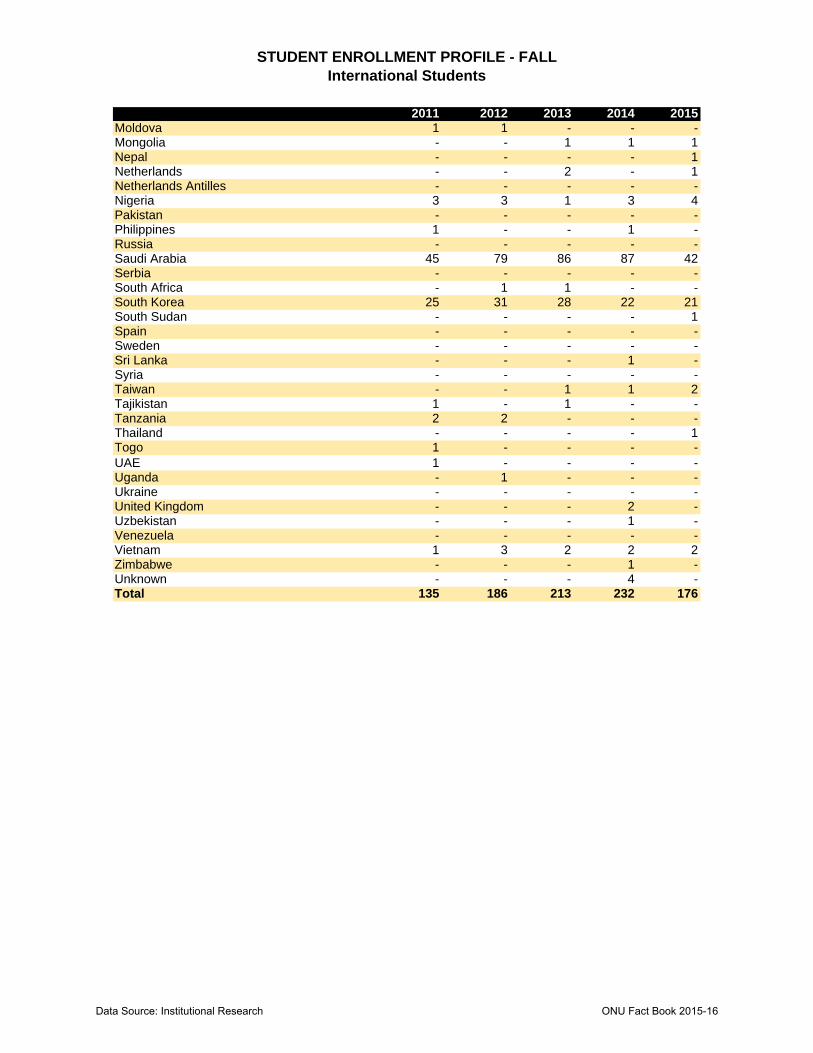
STUDENT ENROLLMENT PROFILE - FALLInternational Students
2011 2012 2013 2014 2015Moldova 1 1 - - -Mongolia - - 1 1 1Nepal - - - - 1Netherlands - - 2 - 1Netherlands Antilles - - - - -Nigeria 3 3 1 3 4Pakistan - - - - -Philippines 1 - - 1 -Russia - - - - -Saudi Arabia 45 79 86 87 42Serbia - - - - -South Africa - 1 1 - -South Korea 25 31 28 22 21South Sudan - - - - 1Spain - - - - -Sweden - - - - -Sri Lanka - - - 1 -Syria - - - - -Taiwan - - 1 1 2Tajikistan 1 - 1 - -Tanzania 2 2 - - -Thailand - - - - 1Togo 1 - - - -UAE 1 - - - -Uganda - 1 - - -Ukraine - - - - -United Kingdom - - - 2 -Uzbekistan - - - 1 -Venezuela - - - - -Vietnam 1 3 2 2 2Zimbabwe - - - 1 -Unknown - - - 4 -Total 135 186 213 232 176
Data Source: Institutional Research ONU Fact Book 2015-16

STUDENT ENROLLMENT PROFILE - FALLby Student Type
2011 2012 2013 2014 2015ARTS & SCIENCESContinuing 819 817 809 787 745New Freshman 297 279 263 289 245Post Graduate 5 3 2 5 5Readmission 6 10 8 9 5Transfer 55 35 56 46 28ESL Program - - - 17 3Unclassified 351 358 455 538 248Total 1,533 1,502 1,593 1,691 1,279BUSINESS ADMINISTRATIONContinuing 218 206 200 213 200New Freshman - 58 64 53 83Post Graduate 1 - 1 2 2Readmission 2 3 1 2 1Transfer 7 15 5 3 9Graduate Student - 5 10 8 16Unclassified 5 6 16 18 13Total 305 293 297 299 324ENGINEERINGContinuing 283 291 303 326 334New Freshman 122 123 127 113 133Post Graduate - - 1 - -Readmission - 1 3 - -Transfer 4 9 12 9 6Unclassified - - 2 27 24Total 409 424 448 475 497PHARMACYContinuing 814 841 840 799 785New Freshman 195 170 159 173 125Post Graduate 8 2 - 2 5Readmission 4 3 1 3 2Transfer 9 5 - 1 12Unclassified - - 1 5 2Total 1,030 1,021 1,001 983 931LAWContinuing 194 193 158 134 125Readmission 4 1 1 1 -Transfer 3 1 - - 2Masters (LLM) 8 14 15 11 10New Law 111 78 77 71 69Unclassified - 1 - 1 1Total 320 288 251 218 207SPECIAL PROGRAMSPrison Management Certificate Program 14 29 29 29 -
UNIVERSITY TOTAL 3,611 3,557 3,619 3,695 3,238
Data Source: Institutional Research ONU Fact Book 2015-16
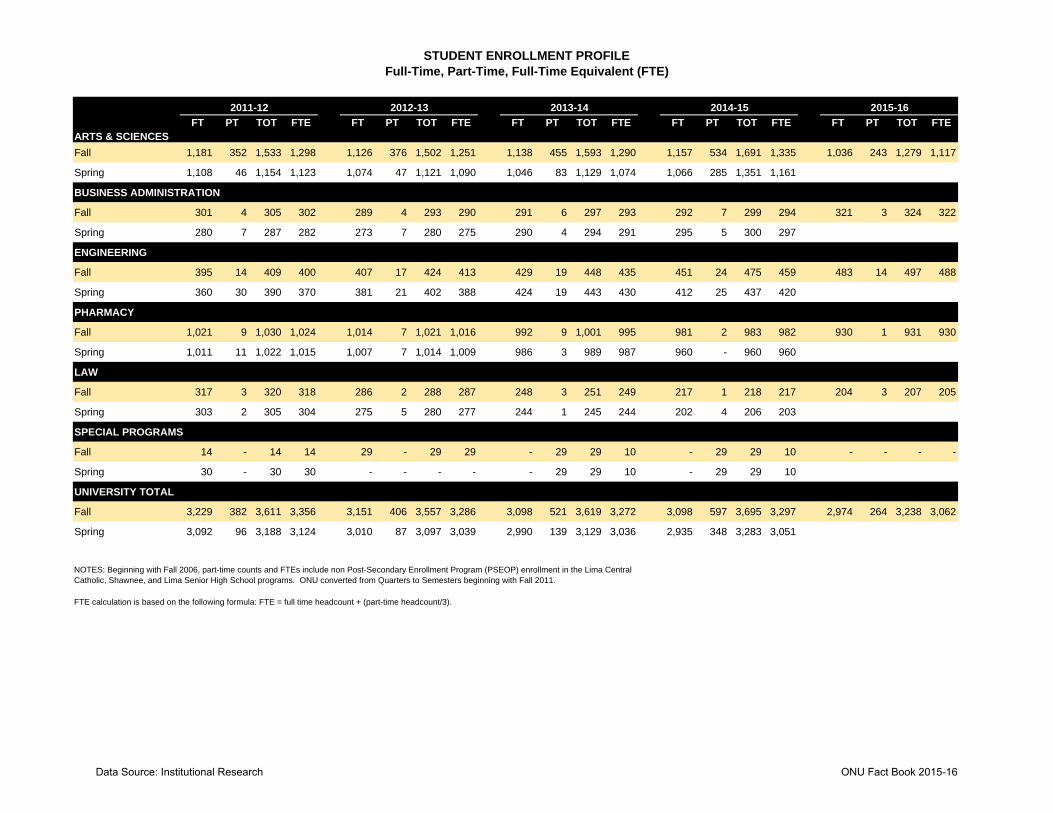
STUDENT ENROLLMENT PROFILEFull-Time, Part-Time, Full-Time Equivalent (FTE)
FT PT TOT FTE FT PT TOT FTE FT PT TOT FTE FT PT TOT FTE FT PT TOT FTEARTS & SCIENCES
Fall 1,181 352 1,533 1,298 1,126 376 1,502 1,251 1,138 455 1,593 1,290 1,157 534 1,691 1,335 1,036 243 1,279 1,117
Spring 1,108 46 1,154 1,123 1,074 47 1,121 1,090 1,046 83 1,129 1,074 1,066 285 1,351 1,161
BUSINESS ADMINISTRATION
Fall 301 4 305 302 289 4 293 290 291 6 297 293 292 7 299 294 321 3 324 322
Spring 280 7 287 282 273 7 280 275 290 4 294 291 295 5 300 297
ENGINEERING
Fall 395 14 409 400 407 17 424 413 429 19 448 435 451 24 475 459 483 14 497 488
Spring 360 30 390 370 381 21 402 388 424 19 443 430 412 25 437 420
PHARMACY
Fall 1,021 9 1,030 1,024 1,014 7 1,021 1,016 992 9 1,001 995 981 2 983 982 930 1 931 930
Spring 1,011 11 1,022 1,015 1,007 7 1,014 1,009 986 3 989 987 960 - 960 960
LAW
Fall 317 3 320 318 286 2 288 287 248 3 251 249 217 1 218 217 204 3 207 205
Spring 303 2 305 304 275 5 280 277 244 1 245 244 202 4 206 203
SPECIAL PROGRAMS
Fall 14 - 14 14 29 - 29 29 - 29 29 10 - 29 29 10 - - - -
Spring 30 - 30 30 - - - - - 29 29 10 - 29 29 10
UNIVERSITY TOTAL
Fall 3,229 382 3,611 3,356 3,151 406 3,557 3,286 3,098 521 3,619 3,272 3,098 597 3,695 3,297 2,974 264 3,238 3,062
Spring 3,092 96 3,188 3,124 3,010 87 3,097 3,039 2,990 139 3,129 3,036 2,935 348 3,283 3,051
FTE calculation is based on the following formula: FTE = full time headcount + (part-time headcount/3).
2015-162014-15
NOTES: Beginning with Fall 2006, part-time counts and FTEs include non Post-Secondary Enrollment Program (PSEOP) enrollment in the Lima Central Catholic, Shawnee, and Lima Senior High School programs. ONU converted from Quarters to Semesters beginning with Fall 2011.
2013-142012-132011-12
Data Source: Institutional Research ONU Fact Book 2015-16

College Major Degree 2011 2012 2013 2014 2015
Arts & Sciences Applied Mathematics BS
Art BA
BFA
Athletic Training BA
BS
Biochemistry BS
Biochemistry ACS Certified BS
Biology BS
Bluffton Students Attending ONU Non-Degree
Chemistry BA
BS
Clinical Laboratory Science BSCLS
CERTIF
Communication Studies BA
Electronic Media BA
Public Relations BA
Non-Degree
Communication Arts BA
BFA
Construction Management BS
Creative Writing BA
Criminal Justice BA
Non-Degree
Design BA
BFA
Early Childhood Education BA
BS
LICNS
Education Studies BA
Environmental and Field Biology BS
Environmental Studies BS
Exercise Physiology BA
BS
Forensic Biology BS
French BA
German BA
Health Education BA
BS
History BA
Intensive English CERTIF
International Studies BA
Journalism BA
Language Arts Education BA
Literature BA
Manufacturing Technology BS
Mathematical Statistics BA
BS
Mathematics BA
BSBSMLS
11
3
5
2
7
4
7
5
6
8
6
18
12
26
3
20
2
15
4
22
1
152224
2226
99128140148154
98
24
4
32
2
33
3
31
1
31
34
5
8
111315174
1332
11161314
1
4
1
3
3
8
14
23
32
3741373625
1419181913
45363436
2
42
9
10
10
12
7
8
10
8
14
7
1
14
11
8
14
8
21
1
2327
1
262822153
611
6064
2
53
5
49
8
46
7
4747383545
11111
111
12
1
5
1
1418212022
322332314
125
25
7871112
32598
3847413746
810986
1
6
1
8811
2
11
4
NUMBERS OF DECLARED MAJORS - FALL(Includes Primary Majors Only)
Data Source: Institutional Research ONU Fact Book 2015-16

College Major Degree 2011 2012 2013 2014 2015Arts & Sciences
Mathematics BSMedical Laboratory Science BSMLS
CERTIF
Medicinal Chemistry BS
Middle Childhood Education BA
BS
LICNS
Molecular Biology BS
Multimedia Journalism BA
Music BA
Music Composition BM
Music Education BM
Music Performance BM
Music with Electives in Busine BM
Musical Theatre BFA
Nursing BSN
Performance BM
Philosophy BA
Physical Education BA
BS
Physics BS
Political Science BA
Non-Degree
Professional Writing BA
Psychology BA
BS
Religion BA
Social Studies BA
Non-Degree
Sociology BA
Spanish BA
Sport Management BA
BS
Technology Education BS
Theatre BA
Theatre Design and Production BFA
Youth Ministry BA
Undecided General Sciences BS
Undecided General Studies BA
Non-Degree
Philosphy Politics & Economics BA
Statistics BS
Total
Business Administration Accounting BSBA
MPPA
Finance BSBA
Non-Degree
International Business & Economics BSBA
Non-Degree
Management BSBANon-Degree
6
9
3
17
2
14
2
6
26
1
8
10
1
6
6
1
5
4
1
1
1318
1410777
54
11131385
45
2736323236
21156913
1
5042292610
103129150119119
993
11113
11
2
1
6
2
4
3
79455
37303126
1
26
469104
16
31
18
31
15
31
11
42
3
57
2221
1171314
1
17
77868
14244
7
36
14
25
9
29
11
25
14
35
85324
111412108
6111295
2465
32658
245
19
519
41
414
53
350
47
329
54
1
4
1,2791,6911,5931,5021,533
21
97
9
89
12
97
6
8579
12413
1
23
13821
1
27
6050404455
NUMBERS OF DECLARED MAJORS - FALL(Includes Primary Majors Only)
Data Source: Institutional Research ONU Fact Book 2015-16
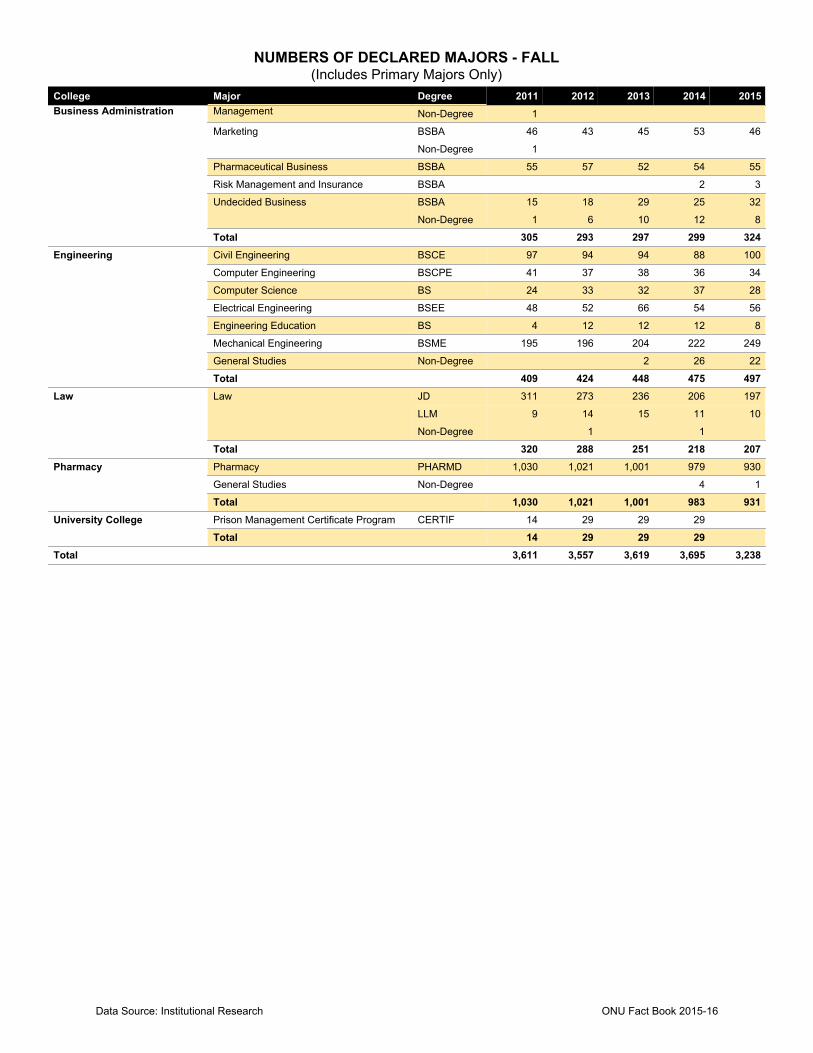
College Major Degree 2011 2012 2013 2014 2015Business Administration Management
BSBANon-Degree
Marketing BSBA
Non-Degree
Pharmaceutical Business BSBA
Risk Management and Insurance BSBA
Undecided Business BSBA
Non-Degree
Total
Engineering Civil Engineering BSCE
Computer Engineering BSCPE
Computer Science BS
Electrical Engineering BSEE
Engineering Education BS
Mechanical Engineering BSME
General Studies Non-Degree
Total
Law Law JD
LLM
Non-Degree
Total
Pharmacy Pharmacy PHARMD
General Studies Non-Degree
Total
University College Prison Management Certificate Program CERTIF
Total
Total
1
46534543
1
46
5554525755
32
8
32
12
25
10
29
6
18
1
15
324299297293305
10088949497
3436383741
2837323324
5654665248
81212124
249222204196195
22262
497475448424409
10
197
1
11
206
15
236
1
14
273
9
311
207218251288320
9309791,0011,0211,030
14
9319831,0011,0211,030
29292914
29292914
3,2383,6953,6193,5573,611
NUMBERS OF DECLARED MAJORS - FALL(Includes Primary Majors Only)
Data Source: Institutional Research ONU Fact Book 2015-16

STUDENT CREDIT HOURS TAUGHT
2010-11 2011-12 2012-13 2013-14 2014-15
UNIVERSITY 108,276 110,947 108,827 106,208 106,663
ARTS & SCIENCES * 61,410 61,156 59,593 57,414 58,770
BUSINESS ADMINISTRATION 8,193 7,713 8,287 8,858 8,904
ENGINEERING 7,395 6,747 7,050 7,268 7,766
PHARMACY 21,114 23,651 22,283 22,391 21,501
LAW 9,447 10,103 9,026 7,930 6,968
SPECIAL PROGRAMS ** 717 1,577 2,588 2,347 2,754
ARTS & SCIENCES DEPARTMENTS
Art and Design 1,554 1,514 1,357 1,351 1,490
Biological & Allied Health Sciences 8,746 8,735 8,616 8,622 8,506
Chemistry & Biochemistry 5,749 6,509 6,229 5,813 5,809
Communication Arts 4,293 4,455 4,099 - -
Communication and Media Studies - - - 2,994 3,253
Education 1,852 1,945 1,886 1,720 1,507
English 4,311 4,322 3,879 3,773 3,556
History, Politics and Justice 5,127 4,384 3,717 3,315 3,633
Human Performance and Sport Sciences 3,932 3,068 3,030 2,986 2,790
Intensive English Program - 751 878 632 400
International Scholar Transition Program - - 442 463 496
Mathematics 6,441 6,775 7,053 6,714 7,408
Modern Languages 2,029 1,663 1,343 1,201 1,168
Music 3,079 3,592 3,376 3,112 3,245
Nursing 1,799 1,671 1,754 1,966 1,695
Philosophy & Religion 3,462 2,753 2,663 2,444 2,253
Physics & Astronomy 2,355 1,975 2,102 1,895 2,296
Psychology, Sociology & Criminal Justice 4,144 4,230 4,396 3,879 4,260
Technological Studies 1,941 1,656 1,554 1,690 1,950
Theatre Arts - - - 1,636 1,712Source: ONU_CENSUS_SECTION_INSTRUCTOR
Notes: ONU converted from quarters to semesters beginning with Fall 2011. Quarter hours for all previous years have therefore been converted to equivalent semester hours. Prior to 2009, Nursing hours are reported under Biological & Allied Health Sciences. Nursing became a separate department in 2009. Credit Hours for Department of Communication and Media Studies and Department of Theatre Arts were previously reported under Communication Arts.
* Includes Aerospace Studies, ROTC, ESL, General Arts & Sciences, and Institute for Social Research credit hours not included in any department.
** Includes hours taught in PMCP, Overseas Programs, ONU Honors Programs, etc.
Data Source: Institutional Research ONU Fact Book 2015-16
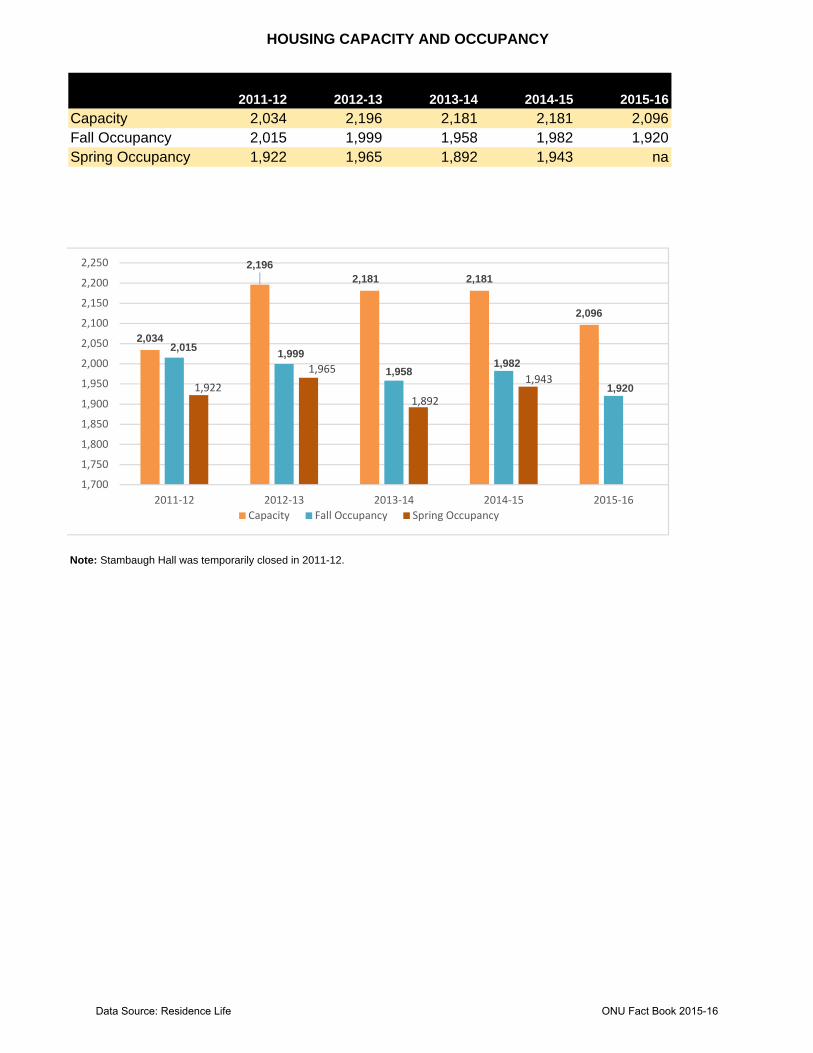
HOUSING CAPACITY AND OCCUPANCY
2011-12 2012-13 2013-14 2014-15 2015-16
Capacity 2,034 2,196 2,181 2,181 2,096Fall Occupancy 2,015 1,999 1,958 1,982 1,920Spring Occupancy 1,922 1,965 1,892 1,943 na
Note: Stambaugh Hall was temporarily closed in 2011-12.
2,034
2,1962,181 2,181
2,096
2,0151,999
1,9581,982
1,9201,9221,965
1,892
1,943
1,700
1,750
1,800
1,850
1,900
1,950
2,000
2,050
2,100
2,150
2,200
2,250
2011‐12 2012‐13 2013‐14 2014‐15 2015‐16Capacity Fall Occupancy Spring Occupancy
Data Source: Residence Life ONU Fact Book 2015-16

STUDENT HEALTH SERVICESNumber of Student Visits
2010-11 2011-12 2012-13 2013-14 2014-15
August - 330 368 325 229
September 563 829 814 1,018 1,095
October 1,114 901 1,436 1,531 1,475
November 541 870 859 877 753
December 317 351 331 427 431
January 571 416 525 348 533
February 525 1,119 629 530 602
March 847 700 939 999 947
April 1,142 1,176 1,557 1,053 1,237
May 637 360 374 350 288
TOTAL 6,257 7,052 7,832 7,458 7,590
Note: The Student Health Service is open in the summer months on a reduced schedule.
6,257
7,052
7,8327,458 7,590
0
2,000
4,000
6,000
8,000
10,000
2010-11 2011-12 2012-13 2013-14 2014-15
Student Visits in Health Center
Data Source: Health Services ONU Fact Book 2015-16

STUDENT CONDUCT INCIDENTS
Incidents / Student Involved for 2014-2015 Aug Sept Oct Nov Dec Jan Feb Mar Apr May June July 2014-15 2013-14 2012-13 2011-12 2010-11Alcohol Policy by Students Involved 12 14 17 19 6 19 5 27 28 1 0 0 148 171 94 156 120Alcohol Policy Incidents 3 5 7 6 2 3 2 10 7 1 0 0 46 68 46 63 36Fighting\Assault by Incidents 0 0 0 0 0 0 0 0 1 0 0 0 1 3 4 11 1Damage to University Property\Vandalism by Incident 3 2 8 4 3 0 2 12 5 4 0 1 44 59 35 41 20Disorderly Conduct by Students Involved 12 11 17 17 3 0 24 11 13 7 0 0 115 169 94 82 46Disorderly Conduct by Incidents 5 6 6 8 2 0 9 6 5 2 0 0 49 97 48 49 36Drug Use or Possession Students Involved 0 3 4 1 0 3 3 2 4 1 0 0 21 56 13 16 10Drug Use or Possession by Incidents 0 3 2 1 0 1 3 2 2 1 0 0 15 22 11 13 7Fire Alarms by Incidents 3 7 4 3 0 4 7 2 6 2 2 0 40 47 57 55 56Weapons by Incidents 0 0 0 0 1 0 0 1 1 0 0 0 3 4 3 0 0Hazing by Incidents 0 1 0 0 0 0 0 0 0 0 0 0 1 1 1 2 1Sexual Misconduct by Incidents 0 1 0 0 0 0 1 0 0 0 0 0 2 3 2 1 3Visitation by Individuals 0 24 16 18 10 10 8 5 5 0 0 0 96 59 97 71 91Alcohol Abuse\Public Intoxication by Incident 1 1 1 2 0 1 1 1 0 0 0 0 8 10 3 6 1Computers and University Network Policy 0 0 0 0 0 0 0 0 0 0 0 0 0 0 0 0 0Creating a Safety Hazard 4 5 5 2 2 0 1 5 1 0 0 0 25 47 12 15 9Bomb Threat 0 0 0 0 0 0 0 0 0 0 0 0 0 0 0 0 0Fire Safety 2 2 4 2 1 0 0 1 0 0 0 0 12 7 2 8 4Unauthorized Entry 0 1 1 0 0 0 12 1 0 0 0 0 15 21 3 6 5Failure to Comply 2 2 0 0 0 0 0 1 1 0 0 0 6 7 3 2 2Dishonesty 0 1 0 1 1 0 1 3 3 0 0 0 10 8 7 18 10Fleeing and Eluding 1 0 0 0 0 0 0 0 0 0 0 0 1 2 4 2 1Gambling 0 0 0 0 0 0 0 0 0 0 0 0 0 0 0 0 0Guest Policy 2 2 0 0 0 0 0 2 1 0 0 0 7 0 1 0 1Harassment 0 1 3 2 1 0 1 1 3 0 0 0 12 19 15 12 7Motor Vehicle Regulations 0 1 0 0 0 0 3 0 0 0 0 0 4 0 0 0 20Fraternity/Sorority Life Policies 0 2 1 0 0 0 0 2 1 0 0 0 6 3 0 2 1University Affiliated Groups & Organizations Policies 0 0 0 0 0 0 0 0 0 0 0 0 0 1 2 2 0Stalking 0 0 0 0 0 0 0 0 0 0 0 0 0 0 0 0 0Telephone: Fradulent & Prank Calls 0 0 0 0 0 0 0 0 0 0 0 0 0 0 0 0 0Theft 2 4 5 3 0 0 4 0 0 0 0 0 18 48 23 24 18Tobacco and Smoking 1 4 1 0 0 0 0 1 0 2 0 0 9 13 8 6 2Residence Hall Policy: Pet Policy 0 0 0 1 1 2 1 0 0 1 0 0 6 7 7 9 8Residence Hall Policy: Other 0 0 1 5 2 2 6 1 0 5 0 0 22 64 7 9 5Violation of Law 0 0 0 0 0 0 0 0 0 0 0 0 0 1 0 0 0Dismissals 0 0 0 0 0 0 0 0 0 0 0 0 0 1 0 0 0Suspensions 0 0 0 0 0 0 0 0 0 0 0 0 0 0 1 1 0Suspensions Temporary 0 0 0 0 0 0 0 0 0 0 0 0 0 0 1 0 0Suspensions Withheld 0 1 1 1 2 2 4 2 7 0 0 0 20 31 23 24 23Social Probation 6 11 20 17 14 14 6 9 15 4 0 0 116 131 109 155 90University Discipline Board of Appeals 0 0 0 0 0 0 0 0 0 0 0 0 0 1 0 0 0Student Behavioral Intervention Reports 3 26 16 11 7 6 8 6 20 2 0 0 105 41 N/A N/A N/AStudent Conduct Meetings 7 57 51 33 31 26 32 32 63 7 0 0 339 433 325 441 N/ATotal Incidents * 21 77 62 57 26 34 54 48 58 17 6 3 463 472 343 337 310* Incident totals do not sum to column totals as column figures include both incidents and number of students involved
Data Source: Student Affairs ONU Fact Book 2015-16

FRATERNITY/SORORITY MEMBERSHIP - FALLActive Members Only
2011 2012 2013 2014 2015SororitiesAlpha Xi Delta 35 46 59 72 74Delta Zeta 81 81 70 72 70Kappa Alpha Theta 76 78 70 76 66Zeta Tau Alpha 79 83 75 73 70Sorority Total 271 288 274 293 280FraternitiesDelta Sigma Phi 34 45 51 53 47Phi Delta Chi 41 42 43 - -Phi Mu Delta - - - 17 32Sigma Phi Epsilon 46 45 52 54 30Sigma Pi 35 31 - - -Theta Chi 34 35 36 39 41Phi Gamma Delta 22 31 46 35Fraternity Total 190 220 213 209 185
TOTAL 461 508 487 502 465
271
288274
293280
190
220213 209
185
150
200
250
300
350
2011 2012 2013 2014 2015
Fraternity/Sorority Membership
Sorority Total Fraternity Total
Data Source: Student Affairs ONU Fact Book 2015-16

RELIGIOUS PREFERENCE OF STUDENTS - FALL
# % # % # % # % # %No Preference 1,032 28.6% 1,000 28.1% 949 26.2% 804 21.8% 622 19.2%Catholic 886 24.5% 821 23.1% 795 22.0% 740 20.0% 709 21.9%Other Denomination 936 25.9% 1,004 28.2% 1,146 31.7% 1,403 38.0% 1,261 38.9%United Methodist 361 10.0% 306 8.6% 299 8.3% 301 8.1% 280 8.6%Lutheran 175 4.8% 167 4.7% 163 4.5% 164 4.4% 148 4.6%Baptist 98 2.7% 102 2.9% 96 2.7% 102 2.8% 95 2.9%Presbyterian 61 1.7% 56 1.6% 63 1.7% 79 2.1% 67 2.1%Islam 39 1.1% 75 2.1% 80 2.2% 79 2.1% 38 1.2%United Church of Christ 15 0.4% 13 0.4% 12 0.3% 11 0.3% 11 0.3%Jewish 8 0.2% 13 0.4% 16 0.4% 12 0.3% 7 0.2%Total 3,611 100.0% 3,557 100.0% 3,619 100.0% 3,695 100.0% 3,238 100.0%
2014201320122011 2015
622709
1,261
280
14895
6738
11 70
200
400
600
800
1,000
1,200
1,400
Religious Preference - Fall 2015
-9.4%
-2.6%
13.0%
-1.4%-0.2%
0.2% 0.4% 0.1%
-0.1%
0.0%
-15.0%
-10.0%
-5.0%
0.0%
5.0%
10.0%
15.0%
Difference in Distribution of Religious Preference2011-2015
Data Source: Institutional Research ONU Fact Book 2015-16

SUMMER CAMPS AND CONFERENCES
2011 2012 2013 2014 2015CAMPSFootball 1,110 1,112 369 602 803Basketball 722 361 363 371 287Soccer 503 623 859 1,114 1,105Summer Honors Institute 164 144 142 160 130Band na na 127 130 126OH High School Athletic Asso. Volleyball 95 95 105 95 100Music 156 206 160 140 126Girls in Engineering, Math & Science (GEMS) 80 80 69 86 92 Subtotal 2,830 2,621 2,194 2,698 2,769CONFERENCESSchool of Christian Missions 430 437 402 475 460NEW STUDENT ORIENTATION(Students and Parents) 1,750 1,750 1,619 1,569 1471OTHERAmerican Youth Basketball 600 600 600 600 600Chemistry Refresher 171 186 178 130 85UCA Cheerleading Camps 258 532 454 425 434Sakae Institute 24 29 28 32 22Kasukabe/US-Japan 24 12 30 27 20Alumni Weekend 200 200 200 200 200Young's Ice Cream Charity Ride 175 185 149 190 172Chemistry Teacher Workshop na 16 16 16 12Hugh O'Brien Youth Leadership 281 285 284 286 272The Cadets - - - - 200Biology Refresher - - - - 29Point Guard College - - - - 117
Subtotal 1768 2,123 1,987 1,906 2078
TOTAL 6,778 6,931 6,202 6,173 6307
* There was a conscious effort to reduce the number of camps in 2010- 2011 with the heavy construction taking place in the Lima Hall complex.
2,830 2,621 2,194 2,698 2,769
1768 2,1231,987
1,906 2078
1,750 1,7501,619
1,569 1471
0
1,000
2,000
3,000
4,000
5,000
6,000
7,000
8,000
2011 2012 2013 2014 2015
Individuals Participating in Summer Campus Activities
NEW STUDENTORIENTATION
OTHER
CAMPS
Data Source: McIntosh Center ONU Fact Book 2015-16
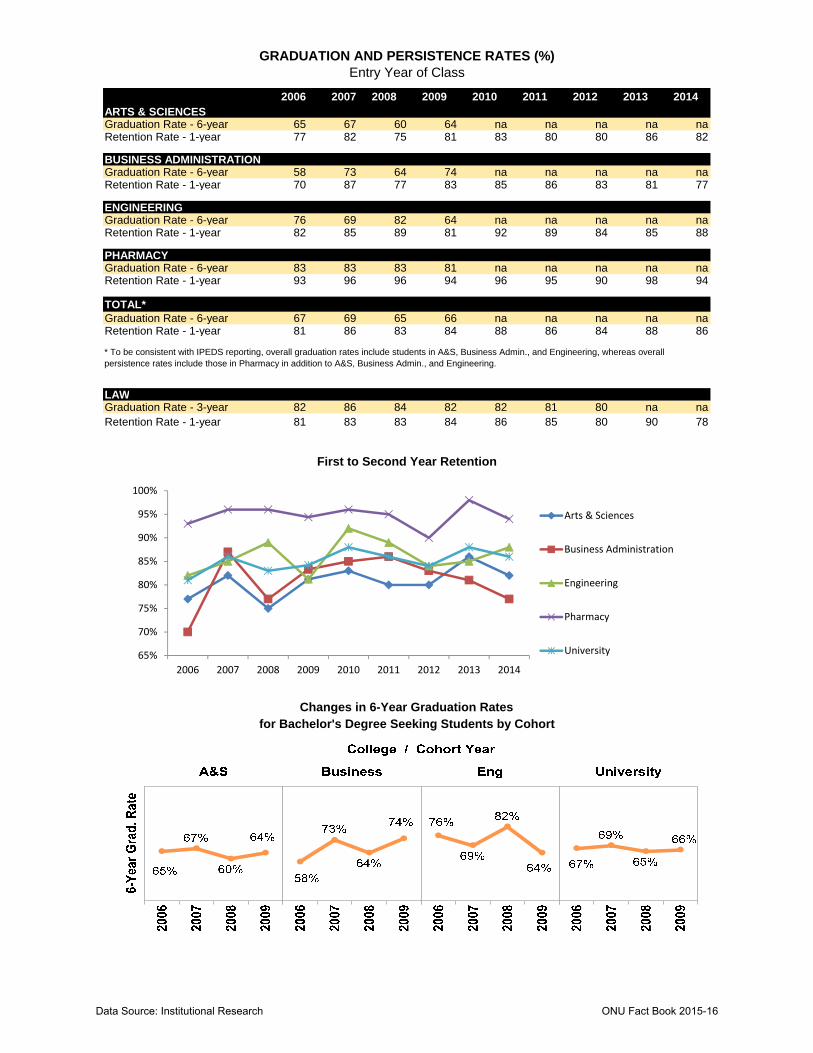
GRADUATION AND PERSISTENCE RATES (%)Entry Year of Class
2006 2007 2008 2009 2010 2011 2012 2013 2014ARTS & SCIENCESGraduation Rate - 6-year 65 67 60 64 na na na na naRetention Rate - 1-year 77 82 75 81 83 80 80 86 82
BUSINESS ADMINISTRATIONGraduation Rate - 6-year 58 73 64 74 na na na na naRetention Rate - 1-year 70 87 77 83 85 86 83 81 77
ENGINEERINGGraduation Rate - 6-year 76 69 82 64 na na na na naRetention Rate - 1-year 82 85 89 81 92 89 84 85 88
PHARMACYGraduation Rate - 6-year 83 83 83 81 na na na na naRetention Rate - 1-year 93 96 96 94 96 95 90 98 94
TOTAL*Graduation Rate - 6-year 67 69 65 66 na na na na naRetention Rate - 1-year 81 86 83 84 88 86 84 88 86
LAWGraduation Rate - 3-year 82 86 84 82 82 81 80 na naRetention Rate - 1-year 81 83 83 84 86 85 80 90 78
for Bachelor's Degree Seeking Students by CohortChanges in 6-Year Graduation Rates
* To be consistent with IPEDS reporting, overall graduation rates include students in A&S, Business Admin., and Engineering, whereas overall persistence rates include those in Pharmacy in addition to A&S, Business Admin., and Engineering.
First to Second Year Retention
65%
70%
75%
80%
85%
90%
95%
100%
2006 2007 2008 2009 2010 2011 2012 2013 2014
Arts & Sciences
Business Administration
Engineering
Pharmacy
University
Data Source: Institutional Research ONU Fact Book 2015-16

NUMBER OF GRADUATES BY COLLEGE(Headcount)
2010-2011 2011-2012 2012-2013 2013-2014 2014-2015
Arts & Sciences 294 287 280 262 253
Business Administration 96 96 83 74 86
Engineering 89 86 73 79 72
Pharmacy 149 167 154 168 142
Law 107 107 117 113 77
University 735 743 707 696 630
Note: Figures represent headcount of those who completed degree requirements between July 1 and June 30.
0
50
100
150
200
250
300
350
2010‐2011 2011‐2012 2012‐2013 2013‐2014 2014‐2015
Number of Graduates by College
Arts & Sciences Business Administration
Engineering Pharmacy
Law
Data Source: Institutional Research ONU Fact Book 2015-16

NUMBER OF MAJORS COMPLETED BY GRADUATES(Includes primary and secondary majors)
2010-11 2011-12 2012-13 2013-14 2014-15ARTS & SCIENCES Humanities Division Dept. of English Creative Writing 7 4 6 4 6 Journalism * 1 3 2 - - Language Arts Education 4 3 2 1 3 Literature 2 1 5 3 6 Professional Writing 4 2 3 4 5 Total 18 13 18 12 20 Dept. of Modern Languages French 1 1 2 - 1 Spanish 8 6 9 7 6 German 2 2 1 3 - Total 11 9 12 10 7 Dept. of Philosophy & Religion Philosophy 2 3 3 - 1 Religion 1 - 2 1 1 Youth Ministry 2 1 - 2 1 Total 5 4 5 3 3 Humanities Division Total 34 26 35 25 30 Fine Arts Division Dept. of Art and Design Advertsing Design - - - 1 1 Art Education - - - 1 2 Graphic Design - 4 8 2 3 Studio Arts - 3 3 2 - Total 11 7 11 6 6 Dept. of Music Music 3 2 3 5 6 Music Education 8 9 5 5 Music Composition 3 1 2 1 - Music Performance 7 2 5 6 4 Music w/ Business * 2 1 - - - Total 23 6 19 17 15 Dept. of Theatre Arts Theatre - - 1 1 2 Musical Theatre - - - 6 6 Theatre Design and Production - - - - 5 Total - - 1 7 13 Fine Arts Division Total 34 13 31 30 34 Natural Science/Math. Division Dept. of Biological and Allied Health Sciences Biology 32 42 18 40 33 Medical Laboratory Sciences 1 2 - 2 3 Environmental Studies 1 4 3 5 6 Molecular Biology 2 1 2 5 2 Forensic Biology 11 18 10 6 2 Total 47 67 33 58 46 Dept. of Nursing 40 44 30 25 44 Dept. of Chemistry & Biochemistry Chemistry 7 5 5 8 13 Biochemistry 3 5 3 3 7 Medicinal Chemistry - 1 - - - Total 10 11 8 11 20 Dept. of Physics & Astronomy 2 2 2 2 2
Data Source: Institutional Research ONU Fact Book 2015-16
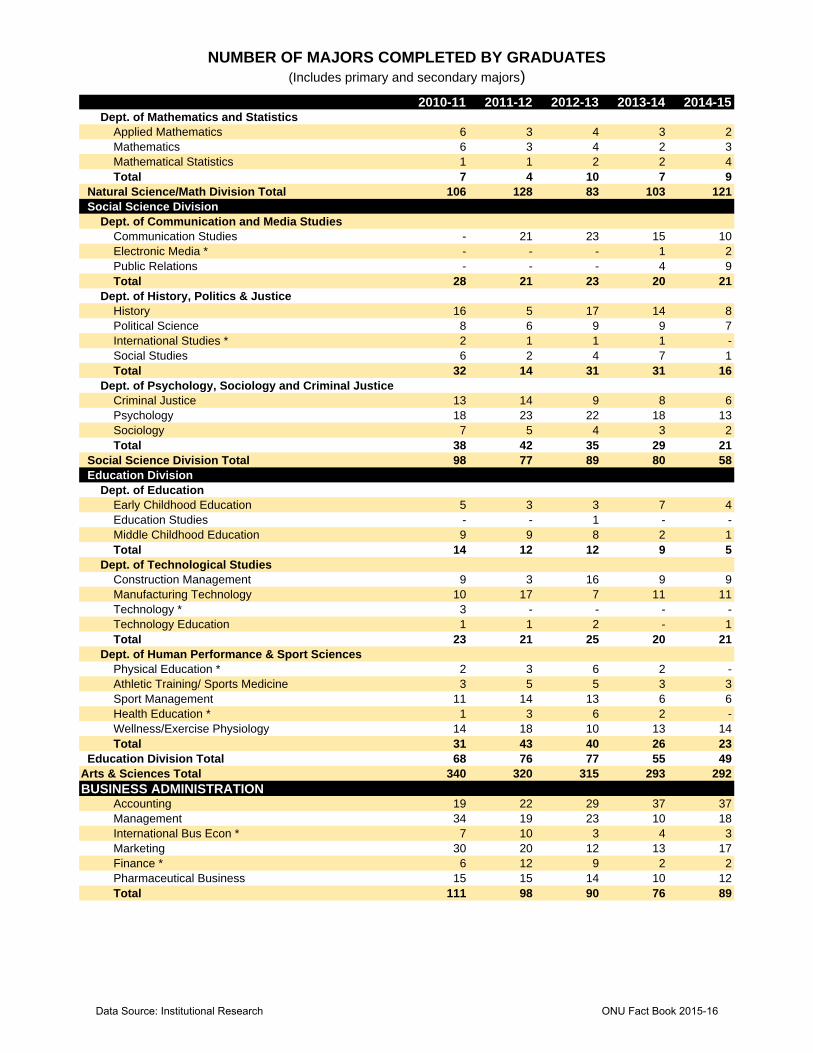
NUMBER OF MAJORS COMPLETED BY GRADUATES(Includes primary and secondary majors)
2010-11 2011-12 2012-13 2013-14 2014-15 Dept. of Mathematics and Statistics Applied Mathematics 6 3 4 3 2 Mathematics 6 3 4 2 3 Mathematical Statistics 1 1 2 2 4 Total 7 4 10 7 9 Natural Science/Math Division Total 106 128 83 103 121 Social Science Division Dept. of Communication and Media Studies Communication Studies - 21 23 15 10 Electronic Media * - - - 1 2 Public Relations - - - 4 9 Total 28 21 23 20 21 Dept. of History, Politics & Justice History 16 5 17 14 8 Political Science 8 6 9 9 7 International Studies * 2 1 1 1 - Social Studies 6 2 4 7 1 Total 32 14 31 31 16 Dept. of Psychology, Sociology and Criminal Justice Criminal Justice 13 14 9 8 6 Psychology 18 23 22 18 13 Sociology 7 5 4 3 2 Total 38 42 35 29 21 Social Science Division Total 98 77 89 80 58 Education Division Dept. of Education Early Childhood Education 5 3 3 7 4 Education Studies - - 1 - - Middle Childhood Education 9 9 8 2 1 Total 14 12 12 9 5 Dept. of Technological Studies Construction Management 9 3 16 9 9 Manufacturing Technology 10 17 7 11 11 Technology * 3 - - - - Technology Education 1 1 2 - 1 Total 23 21 25 20 21 Dept. of Human Performance & Sport Sciences Physical Education * 2 3 6 2 - Athletic Training/ Sports Medicine 3 5 5 3 3 Sport Management 11 14 13 6 6 Health Education * 1 3 6 2 - Wellness/Exercise Physiology 14 18 10 13 14 Total 31 43 40 26 23 Education Division Total 68 76 77 55 49Arts & Sciences Total 340 320 315 293 292BUSINESS ADMINISTRATION Accounting 19 22 29 37 37 Management 34 19 23 10 18 International Bus Econ * 7 10 3 4 3 Marketing 30 20 12 13 17 Finance * 6 12 9 2 2 Pharmaceutical Business 15 15 14 10 12 Total 111 98 90 76 89
Data Source: Institutional Research ONU Fact Book 2015-16

NUMBER OF MAJORS COMPLETED BY GRADUATES(Includes primary and secondary majors)
2010-11 2011-12 2012-13 2013-14 2014-15ENGINEERING Civil Engineering 16 25 20 21 11 Computer Engineering 14 9 9 8 3 Computer Science 4 3 4 3 10 Electrical Engineering 22 9 9 13 9 Engineering Education - - - 1 3 Mechanical Engineering 33 40 31 33 38 Total 89 86 73 79 74PHARMACY Total 149 167 154 168 142LAW Total 107 107 117 114 77UNIVERSITY TOTAL 796 778 749 730 674
* Majors no longer offered.
Notes: Starting in 2012-13, Criminal Justice moved to Dept. of Psychology, Sociology, & Criminal Justice. Effective 2013-14, Department of Communications Studies split into the following 2 departments: 1) Department of Theatre Arts, and 2) Department of Communication Arts and Media Studies.
Data Source: Institutional Research ONU Fact Book 2015-16

TESTING OUTCOMES
Number Number ONU NationwideYear Attempting Passing Pass Rate Pass Rate2010-2011 5 5 100.0% 60.7%
2011-2012 2 2 100.0% 82.3%
2012-2013 5 5 100.0% 80.9%
2013-2014 6 6 100.0% 86.3%
2014-2015 3 3 100.0% 80.7%Data Source: A & S College-Human Performance and Sport Sciences Dept.
ONU Course/SectionACS Cooperative Exam 2011 2012 2013 2014 2015
Chem 171,2,3 Introductory Chemistry 83% 73% 73% 70% 68%
Chem 251,2,3 Organic Chemistry 61% 69% 69% 67% 66%
Data Source: A & S College-Chemistry Dept
Number Number ONU State
Year Attempting Passing Pass Rate Pass Rate
2010-2011 20 20 100.0% 87.9%
2011-2012 20 18 90.0% 88.9%
2012-2013 19 18 94.7% 82.3%
2013-2014 25 24 96.0% 78.3%
2014-2015 21 21 100.0% 80.9% *
* As of 3rd qtr 2015
Data Source: A & S College-Nursing Dept.
Number Number ONU State National
Year Attempting Passing Pass Rate Pass Rate Pass Rate
2010 153 152 99.35% 98.69% 95.31%
2011 145 142 97.93% 98.33% 96.57%
2012 152 151 99.34% 98.27% 97.19%
2013 147 143 97.28% 98.32% 96.57%
2014 160 156 97.50% 97.77% 95.61%Data Source: Pharmacy College
NORTH AMERICAN PHARMACIST LICENSURE EXAMINATION ® (NAPLEX) ®First-time candidates only (reporting period 5/1 through 8/31)
NURSING GRADUATES' PERFORMANCE ON STATE BOARD EXAMS
AMERICAN CHEMICAL SOCIETY (ACS)
ATHLETIC TRAINING BOARD OF CERTIFICATION
Average percentile scores for ONU students taking exams
Continued on next page
ONU Fact Book 2015-16

TESTING OUTCOMES
Number Number ONU National
Year Attempting Passing Pass Rate Pass Rate
2010-2011 64 55 85.9% 71.0%
2011-2012 61 56 91.8% 77.0%
2012-2013 53 45 84.9% 80.1%
2013-2014 35 29 82.9% 79.0%
2014-2015 15 13 87.0% 75.0%
Data Source: College of Engineering
Institutional Percentile Rank Among Participating Schools
YearONU Percentile
Rank
# of Participating
Schools# of ONU Students
2010-2011 89 438 87
2011-2012 85 585 88
2012-2013 86 662 73
2013-2014 89 489 56
2014-2015 77 489 73
Discipline Areas 2010 2011 2012 2013 2014
Accounting 68 61 67 92 73
Economics 93 90 78 81 81
Management 93 94 97 84 64Quantitative Analysis 81 90 96 87 92
Finance 83 78 76 81 32
Marketing 94 79 81 94 86
Legal & Social 90 79 82 85 76
International 96 88 91 96 65
Information Systems 87 60 85 85 78
Data Source: College of Business Administration
Number Number ONU StatewideYear* Attempting Passing Pass Rate Pass Rate2010 47 41 87% 86%2011 55 51 93% 86%2012 51 46 90% 84%
2013 30 27 90% 82%
2014 45 34 76% 81%
2015 24 15 63% 75%
Data Source: Law College
First-time candidates only (February and July exams)
National Percentile Rank of ONU Mean Sub-Scores
Notes: Many graduates do not take the Bar exam in Ohio. Results from other state exams not necessarily available.
LAW GRADUATES' PERFORMANCE ON OHIO BAR EXAMS
ENGINEERING FUNDAMENTALS OF ENGINEERING EXAMINATION
(Taken as seniors in ABET accredited engineering programs)
Notes: Includes those test results only for those engineering disciplines taught at ONU. State benchmarks used in the past are no longer available.
BUSINESS ADMINISTRATION
ETS MAJOR FIELD TEST FOR ONU SENIORS(Based on Mean Overall Student Scores)
ONU Fact Book 2015-16
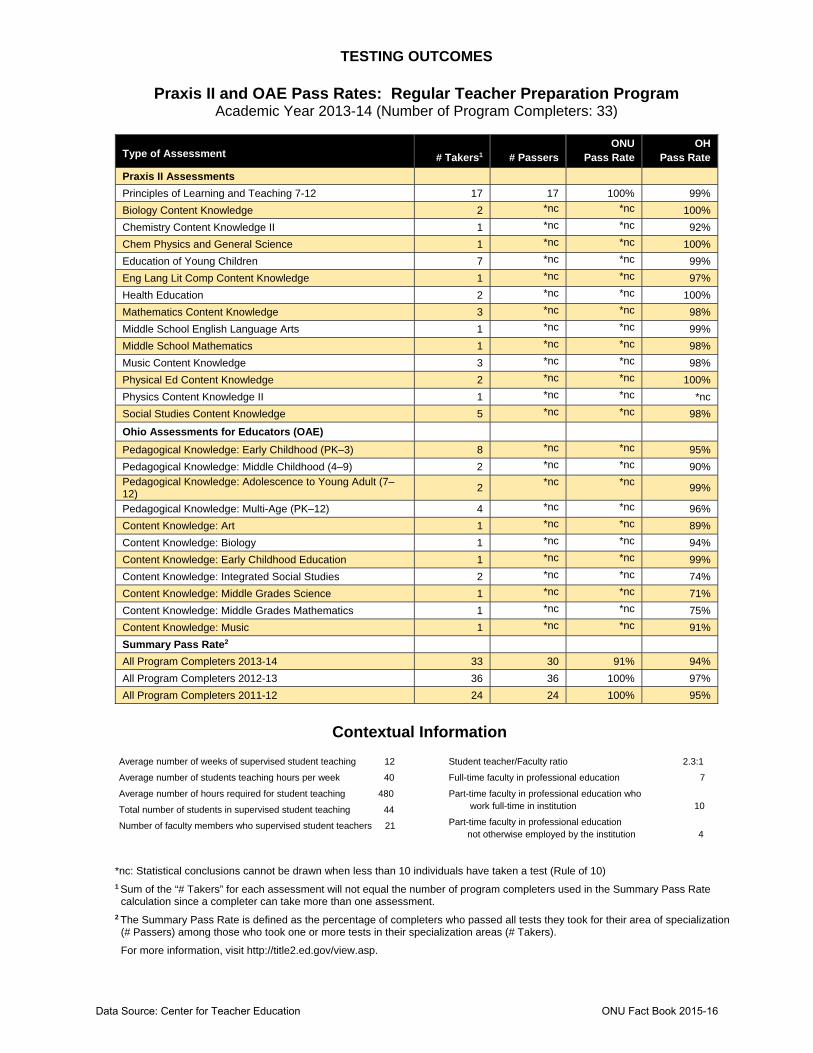
TESTING OUTCOMES
Praxis II and OAE Pass Rates: Regular Teacher Preparation Program Academic Year 2013-14 (Number of Program Completers: 33)
Type of Assessment
# Takers1
# Passers
ONU Pass Rate
OH Pass Rate
Praxis II Assessments
Principles of Learning and Teaching 7-12 17 17 100% 99%
Biology Content Knowledge 2 *nc *nc 100%
Chemistry Content Knowledge II 1 *nc *nc 92%
Chem Physics and General Science 1 *nc *nc 100%
Education of Young Children 7 *nc *nc 99%
Eng Lang Lit Comp Content Knowledge 1 *nc *nc 97%
Health Education 2 *nc *nc 100%
Mathematics Content Knowledge 3 *nc *nc 98%
Middle School English Language Arts 1 *nc *nc 99%
Middle School Mathematics 1 *nc *nc 98%
Music Content Knowledge 3 *nc *nc 98%
Physical Ed Content Knowledge 2 *nc *nc 100%
Physics Content Knowledge II 1 *nc *nc *nc
Social Studies Content Knowledge 5 *nc *nc 98%
Ohio Assessments for Educators (OAE)
Pedagogical Knowledge: Early Childhood (PK–3) 8 *nc *nc 95%
Pedagogical Knowledge: Middle Childhood (4–9) 2 *nc *nc 90%
Pedagogical Knowledge: Adolescence to Young Adult (7–12)
2 *nc *nc
99%
Pedagogical Knowledge: Multi-Age (PK–12) 4 *nc *nc 96%
Content Knowledge: Art 1 *nc *nc 89%
Content Knowledge: Biology 1 *nc *nc 94%
Content Knowledge: Early Childhood Education 1 *nc *nc 99%
Content Knowledge: Integrated Social Studies 2 *nc *nc 74%
Content Knowledge: Middle Grades Science 1 *nc *nc 71%
Content Knowledge: Middle Grades Mathematics 1 *nc *nc 75%
Content Knowledge: Music 1 *nc *nc 91%
Summary Pass Rate2
All Program Completers 2013-14 33 30 91% 94%
All Program Completers 2012-13 36 36 100% 97%
All Program Completers 2011-12 24 24 100% 95%
Contextual Information
Average number of weeks of supervised student teaching 12
Average number of students teaching hours per week 40
Average number of hours required for student teaching 480
Total number of students in supervised student teaching 44
Number of faculty members who supervised student teachers 21
Student teacher/Faculty ratio 2.3:1
Full-time faculty in professional education 7
Part-time faculty in professional education who work full-time in institution 10
Part-time faculty in professional education not otherwise employed by the institution 4
*nc: Statistical conclusions cannot be drawn when less than 10 individuals have taken a test (Rule of 10) 1 Sum of the “# Takers” for each assessment will not equal the number of program completers used in the Summary Pass Rate calculation since a completer can take more than one assessment. 2 The Summary Pass Rate is defined as the percentage of completers who passed all tests they took for their area of specialization (# Passers) among those who took one or more tests in their specialization areas (# Takers).
For more information, visit http://title2.ed.gov/view.asp.
Data Source: Center for Teacher Education ONU Fact Book 2015-16

PLACEMENT ASSESSMENT REPORT(Six Months After Graduation)
# # % # % # % # %2011 Arts & Sciences 267 223 84% 67 30% 138 62% 205 92%
Business Admin. 91 84 92% 8 10% 69 82% 77 92%Engineering 87 82 94% 10 12% 67 82% 77 94%Pharmacy 146 146 100% 1 1% 145 99% 146 100%
University 591 535 91% 86 16% 419 78% 505 94%
2012 Arts & Sciences 263 227 86% 62 27% 137 60% 199 88%Business Admin. 95 92 97% 10 11% 77 84% 87 95%Engineering 89 87 98% 11 13% 71 82% 82 94%Pharmacy 158 157 99% 3 2% 149 95% 152 97%
University 605 563 93% 86 15% 434 77% 520 92%
2013 Arts & Sciences 234 213 91% 59 28% 135 63% 194 91%Business Admin. 77 76 99% 13 17% 59 78% 72 95%Engineering 72 71 99% 2 3% 62 87% 64 90%Pharmacy 154 153 99% 1 1% 151 99% 152 99%University 537 513 96% 75 15% 407 79% 482 94%
2014 Arts & Sciences 246 232 94% 67 29% 146 63% 213 92%Business Admin. 55 54 98% 7 13% 46 85% 53 98%Engineering 78 78 100% 7 9% 69 88% 76 97%Pharmacy 168 168 100% 3 2% 159 95% 162 96%University 547 532 97% 84 16% 420 79% 504 95%
2015 Arts & Sciences 230 220 96% 69 31% 127 58% 196 89%Business Admin. 75 74 99% 11 15% 61 82% 72 97%Engineering 72 72 100% 2 3% 66 92% 68 94%Pharmacy 142 142 100% 0 0% 136 96% 136 96%University 519 508 98% 82 16% 390 77% 472 93%
Notes:
Pharmacy Residency (PGY-1) students are included in 'Employed Full-time' figures as they are paid a salary and benefits.
Employed Full-time or in Graduate/Prof. School
AttendingGraduate/Prof. School
A student graduating with more than one major is only counted once and is included in the college with the major in which his/her placement is most identifiable.
Class Year
CollegeSurvey Respondents
Total Graduates
Employed Full-time
Data Source: Institutional Resource ONU Fact Book 2015-16
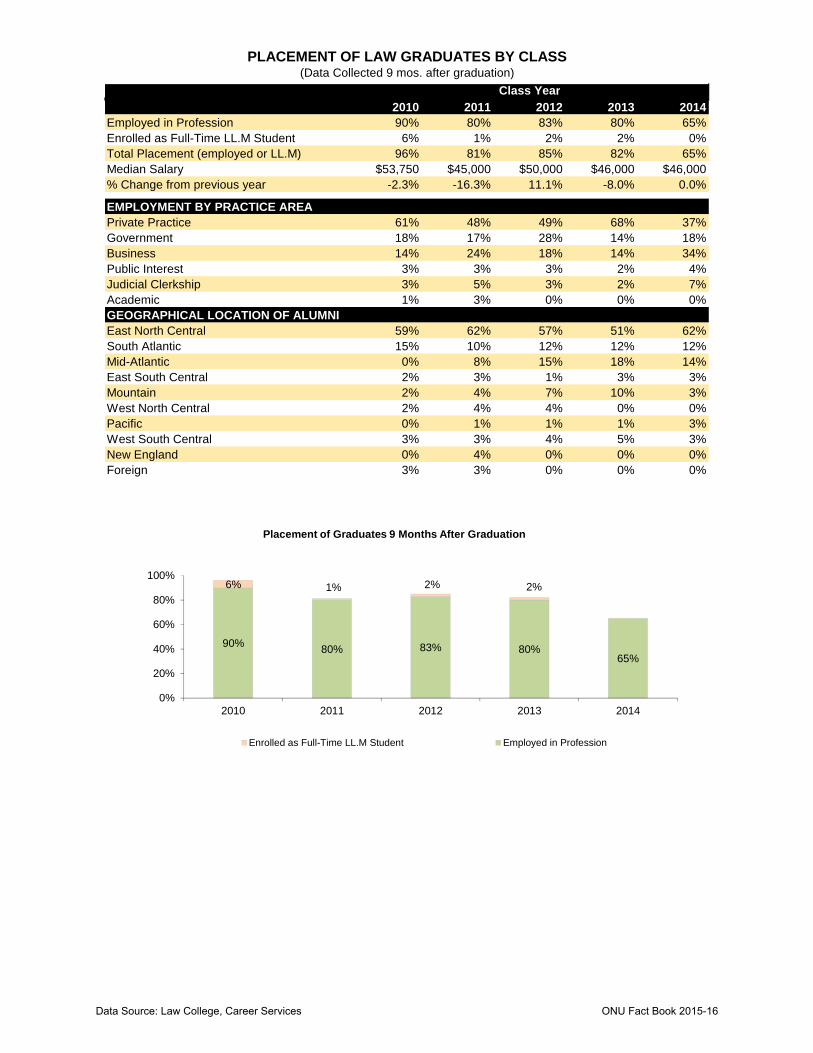
PLACEMENT OF LAW GRADUATES BY CLASS(Data Collected 9 mos. after graduation)
2010 2011 2012 2013 2014Employed in Profession 90% 80% 83% 80% 65%Enrolled as Full-Time LL.M Student 6% 1% 2% 2% 0%Total Placement (employed or LL.M) 96% 81% 85% 82% 65%Median Salary $53,750 $45,000 $50,000 $46,000 $46,000% Change from previous year -2.3% -16.3% 11.1% -8.0% 0.0%
EMPLOYMENT BY PRACTICE AREAPrivate Practice 61% 48% 49% 68% 37%Government 18% 17% 28% 14% 18%Business 14% 24% 18% 14% 34%Public Interest 3% 3% 3% 2% 4%Judicial Clerkship 3% 5% 3% 2% 7%Academic 1% 3% 0% 0% 0%GEOGRAPHICAL LOCATION OF ALUMNIEast North Central 59% 62% 57% 51% 62%South Atlantic 15% 10% 12% 12% 12%Mid-Atlantic 0% 8% 15% 18% 14%East South Central 2% 3% 1% 3% 3%Mountain 2% 4% 7% 10% 3%West North Central 2% 4% 4% 0% 0%Pacific 0% 1% 1% 1% 3%West South Central 3% 3% 4% 5% 3%New England 0% 4% 0% 0% 0%Foreign 3% 3% 0% 0% 0%
Class Year
90%80% 83% 80%
65%
6% 1% 2% 2%
0%
20%
40%
60%
80%
100%
2010 2011 2012 2013 2014
Placement of Graduates 9 Months After Graduation
Enrolled as Full-Time LL.M Student Employed in Profession
Data Source: Law College, Career Services ONU Fact Book 2015-16

EMPLOYEE PROFILE - FALL 2015
All EmployeesHeadcount = 653
0 200 400 600Number of employees
American Indian/Alaskan Native
Asian
Black/African American
Hispanic/Latino
Nonresident Alien
Two or More Races
White
Unknown 7
591
5
11
4
22
12
1
Race/Ethnicity
35854.8%
29545.2%
Gender Women
Men
Age
0 50 100 150 200Number of employees
20-24
25-30
31-40
41-50
51-60
60+
146
100
174
151
18
64
Age
0 100 200 300 400 500
Full-time
Part-time
503
150
Full-time/Part-time Status
Length of Service
0 50 100 150 200 250 300 350 400
Number of employees
0-10
11-20
21-30
31-40
40+
146
394
15
90
8
Length of Service (in years)
Data Source: Institutional Research ONU Fact Book 2015-16

EMPLOYEE PROFILE - FALL 2015
0 50 100 150 200Number of faculty
Arts and Sciences
Business Admn.
Engineering
Law
Pharmacy
University College
193
23
23
26
22
1
College
12844.4%
16055.6%
Gender Women
Men
0 50 100 150 200 250Number of faculty
Asian
Black/African American
Hispanic/Latino
Nonresident Alien
Two or More Races
White
Unknown 1
253
2
11
2
9
10
Race/Ethnicity
0 20 40 60 80
Professor
Associate Professor
Assistant Professor
Instructor
Lecturer 73
10
80
72
53
Rank
Length ofService
0 50 100 150Number of faculty
0-10
11-20
21-30
31-40
40+
164
45
68
9
2
Length of Service (in years)
Age
0 20 40 60 80Number of faculty
25-30
31-40
41-50
51-60
60+
19
69
64
84
52
Age
0 50 100 150 200Number of faculty
Full-time
Part-time
211
77
Full-time/Part-time Status
0 50 100Number of faculty
Tenured
On Tenure Track
Not on Tenure Track
119
102
67
Tenure Status
FacultyHeadcount = 288
Data Source: Institutional Research ONU Fact Book 2015-16
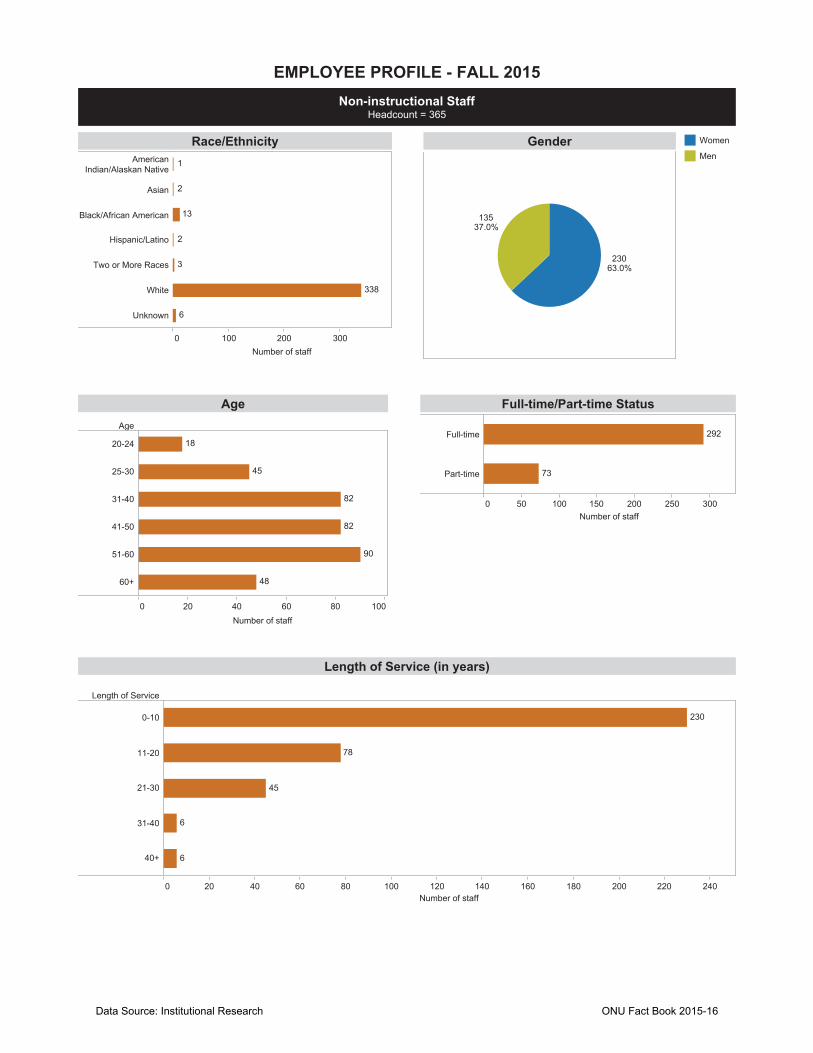
EMPLOYEE PROFILE - FALL 2015Non-instructional Staff
Headcount = 365
0 100 200 300Number of staff
AmericanIndian/Alaskan Native
Asian
Black/African American
Hispanic/Latino
Two or More Races
White
Unknown 6
338
3
2
13
2
1
Race/Ethnicity
23063.0%
13537.0%
Gender Women
Men
Age
0 20 40 60 80 100Number of staff
20-24
25-30
31-40
41-50
51-60
60+
45
18
48
90
82
82
Age
0 50 100 150 200 250 300Number of staff
Full-time
Part-time
292
73
Full-time/Part-time Status
Length of Service
0 20 40 60 80 100 120 140 160 180 200 220 240Number of staff
0-10
11-20
21-30
31-40
40+
230
45
78
6
6
Length of Service (in years)
Data Source: Institutional Research ONU Fact Book 2015-16
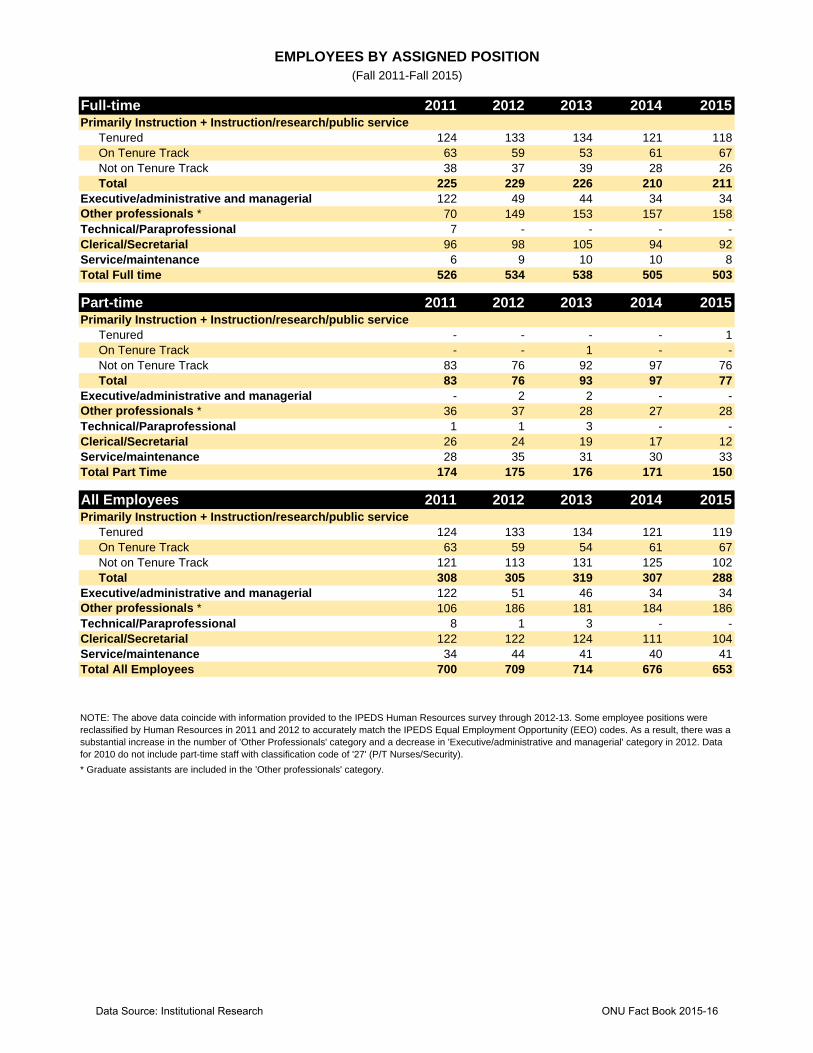
EMPLOYEES BY ASSIGNED POSITION(Fall 2011-Fall 2015)
Full-time 2011 2012 2013 2014 2015Primarily Instruction + Instruction/research/public service
Tenured 124 133 134 121 118On Tenure Track 63 59 53 61 67Not on Tenure Track 38 37 39 28 26Total 225 229 226 210 211
Executive/administrative and managerial 122 49 44 34 34Other professionals * 70 149 153 157 158Technical/Paraprofessional 7 - - - -Clerical/Secretarial 96 98 105 94 92Service/maintenance 6 9 10 10 8Total Full time 526 534 538 505 503
Part-time 2011 2012 2013 2014 2015Primarily Instruction + Instruction/research/public service
Tenured - - - - 1On Tenure Track - - 1 - -Not on Tenure Track 83 76 92 97 76Total 83 76 93 97 77
Executive/administrative and managerial - 2 2 - -Other professionals * 36 37 28 27 28Technical/Paraprofessional 1 1 3 - -Clerical/Secretarial 26 24 19 17 12Service/maintenance 28 35 31 30 33Total Part Time 174 175 176 171 150
All Employees 2011 2012 2013 2014 2015Primarily Instruction + Instruction/research/public service
Tenured 124 133 134 121 119On Tenure Track 63 59 54 61 67Not on Tenure Track 121 113 131 125 102Total 308 305 319 307 288
Executive/administrative and managerial 122 51 46 34 34Other professionals * 106 186 181 184 186Technical/Paraprofessional 8 1 3 - -Clerical/Secretarial 122 122 124 111 104Service/maintenance 34 44 41 40 41Total All Employees 700 709 714 676 653
* Graduate assistants are included in the 'Other professionals' category.
NOTE: The above data coincide with information provided to the IPEDS Human Resources survey through 2012-13. Some employee positions were reclassified by Human Resources in 2011 and 2012 to accurately match the IPEDS Equal Employment Opportunity (EEO) codes. As a result, there was a substantial increase in the number of 'Other Professionals' category and a decrease in 'Executive/administrative and managerial' category in 2012. Data for 2010 do not include part-time staff with classification code of '27' (P/T Nurses/Security).
Data Source: Institutional Research ONU Fact Book 2015-16

AVERAGE SALARY AND COMPENSATION FOR FULL-TIME FACULTY
I. Arts & Sciences, Business Administration, Engineering, and Pharmacy Combined:
Average Salary by Rank
Rank # Avg. Sal. # Avg. Sal. # Avg. Sal. # Avg. Sal. # Avg. Sal.
Professor 54 $86,041 59 $87,723 55 $89,959 46 $88,104 43 $91,981
Associate Professor 61 $71,084 66 $71,084 67 $73,068 69 $73,848 68 $74,608
Assistant Professor 80 $61,298 73 $64,149 72 $64,613 72 $66,391 76 $69,806
Instructor 8 $42,379 5 $45,115 7 $58,082 6 $47,816 7 $48,717
Lecturer 0 - 2 * 2 * 0 - 0 -
Non-standard 0 - 0 - 0 - 1 * 0 -
Total 203 $70,075 205 $72,613 203 $73,958 194 $73,568 194 $75,643
Average Compensation by Rank
Rank # Avg. Sal. # Avg. Sal. # Avg. Sal. # Avg. Sal. # Avg. Sal.
Professor 54 $106,994 59 $109,546 55 $112,456 46 $112,409 43 $117,370
Associate Professor 61 $89,636 66 $92,289 67 $92,871 69 $95,878 68 $97,225
Assistant Professor 80 $78,279 73 $82,188 72 $83,068 72 $87,232 76 $91,657
Instructor 8 $56,324 5 $60,098 7 $75,494 6 $65,693 7 $67,204
Lecturer 0 - 2 * 2 * 0 - 0 -
Non-standard 0 - 0 - 0 - 1 * 0 -
Total 203 $88,465 205 $92,671 203 $93,903 194 $95,161 194 $98,426
NOTES:
The above data coincides with the information provided to AAUP through 2015-16.
* Due to privacy concerns, average salaries are not reported when there are fewer than five faculty within that rank.
2015-162014-152013-142012-132011-12
$50,000
$60,000
$70,000
$80,000
$90,000
$100,000
$110,000
$120,000
$130,000
11-12 12-13 13-14 14-15 15-16
Average Salary by Rank
Professor Asso. Prof. Asst. Prof.
$50,000
$60,000
$70,000
$80,000
$90,000
$100,000
$110,000
$120,000
$130,000
11-12 12-13 13-14 14-15 15-16
Average Compensation by Rank
Data Source: Institutional Research ONU Fact Book 2015-16

AVERAGE SALARY AND COMPENSATION FOR FULL-TIME FACULTY
II. All Colleges Combined (Includes Law)
Average Salary by Rank
Rank # Avg. Sal. # Avg. Sal. # Avg. Sal. # Avg. Sal. # Avg. Sal.
Professor 67 $94,910 72 $96,415 68 $97,902 55 $94,571 51 $97,672
Associate Professor 64 $72,691 68 $71,084 70 $74,321 72 $75,522 72 $76,198
Assistant Professor 83 $62,016 79 $65,628 77 $65,853 75 $67,066 79 $70,750
Instructor 11 $47,823 8 $52,275 9 $58,938 7 $49,471 9 $51,878
Lecturer 0 - 2 * 2 * 0 - 0 -
Non-standard 0 - 0 - 0 - 1 * 0 -
Total 225 $74,153 229 $74,224 226 $77,754 210 $76,519 211 $78,311
Average Compensation by Rank
Rank # Avg. Sal. # Avg. Sal. # Avg. Sal. # Avg. Sal. # Avg. Sal.
Professor 67 $117,286 72 $119,634 68 $121,667 55 $119,845 51 $123,969
Associate Professor 64 $91,501 68 $93,470 70 $94,324 72 $97,819 72 $99,069
Assistant Professor 83 $79,112 79 $83,904 77 $84,506 75 $88,015 79 $92,752
Instructor 11 $62,641 8 $68,408 9 $76,487 7 $67,613 9 $70,870
Lecturer 0 - 2 * 2 * 0 - 0 -
Non-standard 0 - 0 - 0 - 1 * 0 -
Total 225 $93,198 229 $93,198 226 $98,305 210 $98,613 211 $101,519
NOTES:
The above data coincides with the information provided to AAUP through 2015-16.
* Due to privacy concerns, average salaries are not reported when there are fewer than five faculty within that rank.
2015-162014-152013-142012-132011-12
$50,000
$60,000
$70,000
$80,000
$90,000
$100,000
$110,000
$120,000
$130,000
11-12 12-13 13-14 14-15 15-16
Average Salary by Rank
Professor Asso. Prof. Asst. Prof.
$50,000
$60,000
$70,000
$80,000
$90,000
$100,000
$110,000
$120,000
$130,000
11-12 12-13 13-14 14-15 15-16
Average Compensation by Rank
Data Source: Institutional Research ONU Fact Book 2015-16
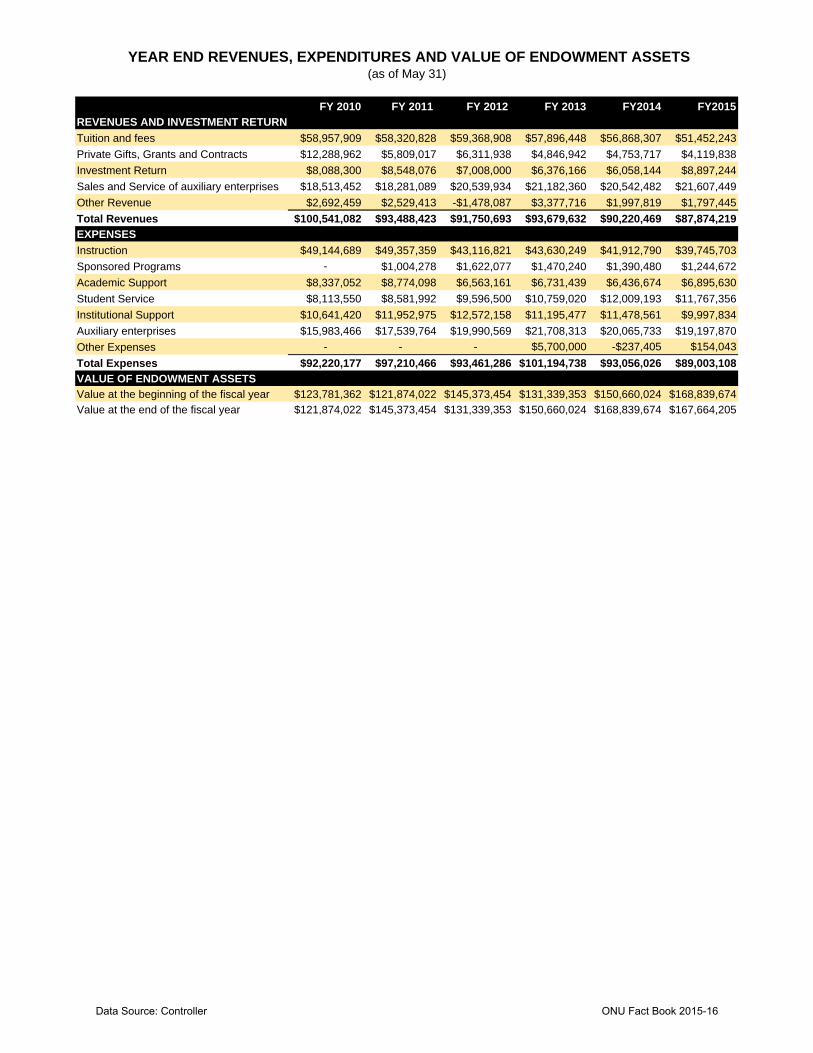
YEAR END REVENUES, EXPENDITURES AND VALUE OF ENDOWMENT ASSETS(as of May 31)
FY 2010 FY 2011 FY 2012 FY 2013 FY2014 FY2015
REVENUES AND INVESTMENT RETURN
Tuition and fees $58,957,909 $58,320,828 $59,368,908 $57,896,448 $56,868,307 $51,452,243
Private Gifts, Grants and Contracts $12,288,962 $5,809,017 $6,311,938 $4,846,942 $4,753,717 $4,119,838
Investment Return $8,088,300 $8,548,076 $7,008,000 $6,376,166 $6,058,144 $8,897,244
Sales and Service of auxiliary enterprises $18,513,452 $18,281,089 $20,539,934 $21,182,360 $20,542,482 $21,607,449
Other Revenue $2,692,459 $2,529,413 -$1,478,087 $3,377,716 $1,997,819 $1,797,445
Total Revenues $100,541,082 $93,488,423 $91,750,693 $93,679,632 $90,220,469 $87,874,219
EXPENSES
Instruction $49,144,689 $49,357,359 $43,116,821 $43,630,249 $41,912,790 $39,745,703
Sponsored Programs - $1,004,278 $1,622,077 $1,470,240 $1,390,480 $1,244,672
Academic Support $8,337,052 $8,774,098 $6,563,161 $6,731,439 $6,436,674 $6,895,630
Student Service $8,113,550 $8,581,992 $9,596,500 $10,759,020 $12,009,193 $11,767,356
Institutional Support $10,641,420 $11,952,975 $12,572,158 $11,195,477 $11,478,561 $9,997,834
Auxiliary enterprises $15,983,466 $17,539,764 $19,990,569 $21,708,313 $20,065,733 $19,197,870
Other Expenses - - - $5,700,000 -$237,405 $154,043
Total Expenses $92,220,177 $97,210,466 $93,461,286 $101,194,738 $93,056,026 $89,003,108
VALUE OF ENDOWMENT ASSETS
Value at the beginning of the fiscal year $123,781,362 $121,874,022 $145,373,454 $131,339,353 $150,660,024 $168,839,674
Value at the end of the fiscal year $121,874,022 $145,373,454 $131,339,353 $150,660,024 $168,839,674 $167,664,205
Data Source: Controller ONU Fact Book 2015-16

OHIO NORTHERN UNIVERSITYInstitutional Financial Aid Summary
2011-12 2012-13 2013-14 2014-15 2015-16DISCRETIONARYArts & Sciences, Business Administration, Engineering and PharmacyTotal Aid $50,264,196 $54,162,841 $55,731,913 $40,353,916 $40,760,381
LawTotal Aid $4,374,044 $4,163,536 $3,894,103 $2,324,938 $2,196,727
University Total $54,638,240 $58,326,377 $59,626,016 $42,678,854 $42,957,108
NON-DISCRETIONARY (Tuition Remission Benefits and Entitlements)ONU Employee Benefits $2,167,954 $2,256,057 $2,332,957 $1,728,122 $1,803,872
Other Tuition Remission* $2,152,000 $2,969,429 $2,321,868 $1,565,848 $1,335,164
Total Tuition Remission $4,319,954 $5,225,486 $4,654,825 $3,293,970 $3,139,036
GRAND TOTAL $58,958,194 $63,551,863 $64,280,841 $45,972,824 $46,096,144
AVERAGE AID PER STUDENTUndergraduate
Per aided new student $21,885 $24,297 $25,491 $18,502 $17,757
Per enrolled new student $19,190 $22,581 $23,743 $17,654 $17,483
Law
Per aided new student $24,586 $26,423 $30,997 $18,818 $17,229
Per enrolled new student $14,634 $14,336 $19,323 $12,022 $13,589
Note: Change from 2013-14 to 2014-15 reflects adjustments in financial aid following the Ohio Northern Promise tuition reset.* Previous to 2014-15 (includes Ministerial, Ada H.S., sibling, tuition and international exchange, OH high school credits, Sodexo, Barnes & Noble), 2014-15 forward (includes Sodexo, Barnes & Noble, tuition and international exchange)
Data Source: Financial Aid ONU Fact Book 2015-16

LIVING ALUMNI BY CLASS YEAR AND COLLEGE(as of August 2015)
Year AS BU EN LW PH Total1922 10 - 16 6 3 351923 12 - 11 3 6 321924 16 - 17 5 12 501925 20 - 15 2 9 461926 21 - 6 1 5 331927 15 - 2 2 4 231928 22 - 5 5 2 341929 17 - 4 9 6 361930 26 - 2 1 6 351931 15 - 6 - 10 311932 16 - 3 2 6 271933 11 - 5 - 2 181934 15 - 2 3 5 251935 13 - 6 1 1 211936 12 - 2 1 1 161937 16 - 2 3 - 211938 15 - 1 - 1 171939 21 1 3 - - 251940 20 - 7 1 4 321941 15 - 4 - 1 201942 5 - 2 2 7 161943 18 - 2 - 2 221944 18 1 - 1 - 201945 13 - 4 - 2 191946 13 - 9 - 2 241947 11 - 8 - 3 221948 18 - 6 2 7 331949 23 1 29 5 5 631950 42 3 8 2 25 801951 33 2 30 11 25 1011952 33 2 11 11 28 851953 32 - 14 10 38 941954 28 - 4 10 35 771955 43 - 6 2 32 831956 35 1 11 2 28 771957 47 - 16 6 40 1091958 54 2 13 8 34 1111959 88 6 35 12 45 1861960 90 2 31 13 49 1851961 112 3 38 10 64 2271962 112 4 20 22 53 2111963 168 3 36 8 64 2791964 167 7 22 16 19 2311965 212 9 32 24 40 3171966 207 8 24 38 26 3031967 197 13 35 26 34 3051968 271 17 23 48 12 3711969 342 18 52 43 29 4841970 302 17 41 39 32 4311971 222 11 50 32 53 368
Continued on next page
Data Source: Alumni Relations ONU Fact Book 2015-16

LIVING ALUMNI BY CLASS YEAR AND COLLEGE(as of August 2015)
Year AS BU EN LW PH Total1972 224 18 46 54 54 3961973 263 11 48 69 73 4641974 209 10 41 121 110 4911975 200 21 50 126 158 5551976 208 18 41 132 100 4991977 193 19 49 136 138 5351978 221 22 61 148 133 5851979 141 69 69 148 113 5401980 127 62 55 147 116 5071981 126 68 56 156 125 5311982 150 69 66 119 148 5521983 137 74 88 160 116 5751984 126 88 87 147 120 5681985 115 81 105 137 91 5291986 125 90 108 133 77 5331987 133 81 88 126 96 5241988 131 73 81 106 98 4891989 116 77 74 98 117 4821990 144 71 74 104 110 5031991 148 89 62 108 109 5161992 184 86 73 112 106 5611993 152 78 75 145 116 5661994 163 45 78 135 139 5601995 181 63 75 118 134 5711996 207 68 78 109 144 6061997 223 66 81 115 162 6471998 187 57 77 112 141 5741999 214 73 61 91 129 5682000 217 50 51 74 109 5012001 261 72 78 94 157 6622002 261 58 98 86 146 6492003 309 73 108 72 125 6872004 263 70 101 82 148 6642005 320 73 60 82 98 6332006 244 66 96 94 118 6182007 341 83 76 99 161 7602008 261 83 105 93 185 7272009 317 113 88 112 164 7942010 312 79 106 104 164 7652011 272 88 89 88 151 6882012 287 93 86 96 161 7232013 263 78 75 105 158 6792014 238 60 79 103 167 6472015 259 77 72 71 143 622TOTAL 12,457 2,994 4,046 5,315 6,545 31,357
Note: Qualified A&S alumni who graduated prior to 1980 had the option to receive a BSBA degree at a re-degreeing ceremony in 2006. Figures provided are as accurate as we can confirm, but it is often difficult to track alumni deaths via obituary and family notices.
Data Source: Alumni Relations ONU Fact Book 2015-16

LIVING ALUMNI BY STATE AND COLLEGE(as of August 2015)
State AS BU EN LW PH TotalAlabama 26 6 13 11 10 66Alaska 6 1 2 6 13 28Arizona 128 35 45 58 94 360Arkansas 13 2 9 4 5 33Armed Forces Europe 7 3 1 7 1 19Armed Forces Pacific 3 - - - - 3California 221 37 99 90 118 565Colorado 115 18 43 58 59 293Connecticut 47 6 8 62 14 137Delaware 24 2 8 10 9 53District of Columbia 21 3 6 19 6 55Florida 503 84 131 287 263 1,268Georgia 131 46 34 70 45 326Guam - - - 1 - 1Hawaii 7 1 2 8 3 21Idaho 9 2 2 12 7 32Illinois 169 52 60 83 89 453Indiana 290 52 98 206 166 812Iowa 24 4 11 14 5 58Kansas 16 5 7 9 9 46Kentucky 116 29 31 74 59 309Louisiana 18 3 11 5 2 39Maine 12 2 4 12 9 39Maryland 94 20 51 72 70 307Massachusetts 77 5 19 40 15 156Michigan 323 66 127 117 150 782Minnesota 29 3 15 17 19 83Mississippi 8 2 7 4 4 25Missouri 47 7 20 23 23 120Montana 20 1 2 5 5 33Nebraska 15 2 5 4 - 26Nevada 34 7 7 26 25 99New Hampshire 14 1 7 15 2 39New Jersey 76 14 16 172 37 315New Mexico 25 2 5 9 10 51New York 219 39 43 299 77 677North Carolina 219 61 75 95 157 607North Dakota 3 1 - 3 - 7Northern Mariana Islands - - - 1 - 1Nova Scotia 1 - - - - 1Ohio 7,658 2,042 2,344 1,889 4,081 18,014Oklahoma 18 4 5 5 5 37Ontario 5 - 1 - 12 18Oregon 31 9 11 11 12 74Pennsylvania 272 61 114 632 291 1,370Puerto Rico 1 - 2 - - 3Quebec - - - - 1 1Rhode Island 5 1 3 8 1 18Saskatchewan - - - - 1 1South Carolina 117 24 39 56 65 301South Dakota 8 2 2 5 1 18Tennessee 104 33 24 49 60 270Texas 210 56 95 91 81 533Utah 11 1 5 12 9 38Vermont 7 1 3 2 8 21Virgin Islands 1 - - 2 1 4Virginia 181 40 77 174 90 562Washington 63 8 19 24 11 125West Virginia 36 7 10 108 67 228Wisconsin 49 10 18 36 17 130Wyoming 5 1 1 3 2 12Total Alumni by State 11,892 2,924 3,797 5,115 6,396 30,123International Alumni 49 27 44 66 17 203Missing Alumni 516 43 205 134 132 1,031TOTAL 12,457 2,994 4,046 5,315 6,545 31,357
Data Source: Alumni Relations ONU Fact Book 2015-16

LIVING ALUMNI IN OHIO BY COUNTY AND COLLEGE(as of August 2015)
County AS BU EN LW PH TotalAdams 2 - - 5 4 11Allen 597 129 121 103 105 1,055Ashland 43 7 18 10 25 103Ashtabula 21 7 9 13 35 85Athens 7 2 1 4 8 22Auglaize 189 33 39 19 44 324Belmont 15 5 5 18 31 74Brown 7 1 1 3 12Butler 126 34 40 31 73 304Carroll 10 3 3 2 16 34Champaign 50 8 16 7 14 95Clark 77 33 22 22 41 195Clermont 63 15 27 19 36 160Clinton 18 8 2 5 9 42Columbiana 20 4 5 14 24 67Coshocton 7 1 4 2 8 22Crawford 45 5 12 14 17 93Cuyahoga 429 175 155 107 385 1,251Darke 58 8 8 15 25 114Defiance 39 11 8 7 2 67Delaware 238 100 127 55 151 671Erie 60 16 13 12 36 137Fairfield 99 30 28 15 68 240Fayette 21 2 2 4 12 41Franklin 767 262 246 230 324 1,829Fulton 37 7 7 2 4 57Gallia 3 - 2 6 6 17Geauga 49 20 25 11 46 151Greene 84 21 44 21 89 259Guernsey 6 6 2 9 15 38Hamilton 161 60 48 75 87 431Hancock 316 73 149 71 58 667Hardin 451 89 51 69 68 728Harrison 6 1 2 3 10 22Henry 38 12 15 - 9 74Highland 14 - 3 3 13 33Hocking 8 - 1 2 9 20Holmes 10 6 4 2 11 33Huron 56 11 15 5 21 108Jackson 8 4 2 5 11 30Jefferson 13 5 7 30 12 67Knox 37 19 26 9 21 112Lake 101 29 39 22 89 280Lawrence 6 - - 8 16 30Licking 118 27 40 18 59 262Logan 181 31 23 29 31 295Lorain 152 40 40 33 96 361Lucas 215 50 54 23 40 382Madison 50 7 11 6 26 100Mahoning 33 17 5 51 116 222Marion 97 13 18 23 21 172Medina 128 30 63 19 100 340Meigs 1 1 - 4 3 9Mercer 133 25 17 18 32 225Miami 139 39 40 32 93 343Monroe 6 1 2 7 3 19
Continued on next page
Data Source: Alumni Relations ONU Fact Book 2015-16

LIVING ALUMNI IN OHIO BY COUNTY AND COLLEGE(as of August 2015)
County AS BU EN LW PH TotalMontgomery 274 68 68 90 163 663Morgan 6 2 1 2 2 13Morrow 27 7 9 4 8 55Muskingum 40 14 11 25 41 131Noble 2 1 1 3 5 12Ottawa 56 10 9 13 14 102Paulding 24 5 6 8 5 48Perry 18 2 8 3 11 42Pickaway 37 3 7 6 14 67Pike - - 3 2 3 8Portage 56 13 23 12 40 144Preble 16 1 3 9 16 45Putnam 104 31 44 12 39 230Richland 68 22 28 37 44 199Ross 42 6 7 10 36 101Sandusky 55 11 12 9 21 108Scioto 12 - 1 15 30 58Seneca 61 15 17 10 26 129Shelby 99 24 30 10 32 195Stark 121 37 59 56 170 443Summit 193 52 98 42 225 610Trumbull 34 4 2 28 92 160Tuscarawas 48 9 16 13 51 137Union 79 26 43 17 42 207Van Wert 67 22 15 18 15 137Vinton 1 - 1 2 4 8Warren 129 33 52 31 86 331Washington 17 2 3 7 23 52Wayne 78 21 33 9 40 181Williams 25 3 8 - 7 43Wood 132 40 43 21 34 270Wyandot 71 15 16 16 31 149Unknown Counties 1 - - - - 1TOTAL 7,658 2,042 2,344 1,889 4,081 18,014
Data Source: Alumni Relations ONU Fact Book 2015-16

LIVING ALUMNI BY COUNTRY AND COLLEGE(as of August 2015)
Nation AS BU EN LW PH TotalAfghanistan - - - 10 - 10Australia 3 1 - 1 - 5Azerbaijan - - - 1 - 1Bahrain - 1 - - - 1Bermuda 1 - - - - 1Bhutan - - - 1 - 1Botswana - - - 1 - 1Brazil 1 - - 1 - 2Cameroon - 1 - - - 1Canada 6 - 1 - 14 21China 1 6 - - - 7Cyprus - - 1 - - 1Egypt - - - 1 - 1England - 1 - 2 - 3Ethiopia - - - 3 - 3France 2 2 - - - 4Georgia - - - 5 - 5Germany 1 - - 1 - 2Ghana - 1 - - - 1Greece - 1 - - - 1Guyana - - - 1 - 1Honduras - - - - 1 1Iceland - - - 1 - 1India 1 - - - - 1Japan 11 6 1 - - 18Jordan - - 1 - - 1Kazakhstan - - - 1 - 1Kenya - - - 4 - 4Kuwait - - 1 - - 1Lebanon - - 1 - - 1Liberia - - - 1 - 1Malawi - - - 4 - 4Malaysia - - 5 - - 5Maldives - - - 1 - 1Mexico - - - 1 - 1Netherlands 3 1 - - - 4New Zealand 2 - - - - 2Nicaragua 1 - - - 1Nigeria - 1 - 1 1 3Oman 2 1 - - - 3Pakistan - - 1 - - 1Philippines - - - 1 - 1Saudi Arabia 2 1 2 1 - 6Scotland 1 - - - - 1Singapore 1 - 21 - - 22South Korea - 1 - - - 1Sweden 1 - - 1 - 2Switzerland 1 - 1 1 - 3Taiwan (Republic of China) 2 - 1 3 - 6Tajikistan - - - 1 - 1
Continue on next page
Data Source: Alumni Relations ONU Fact Book 2015-16
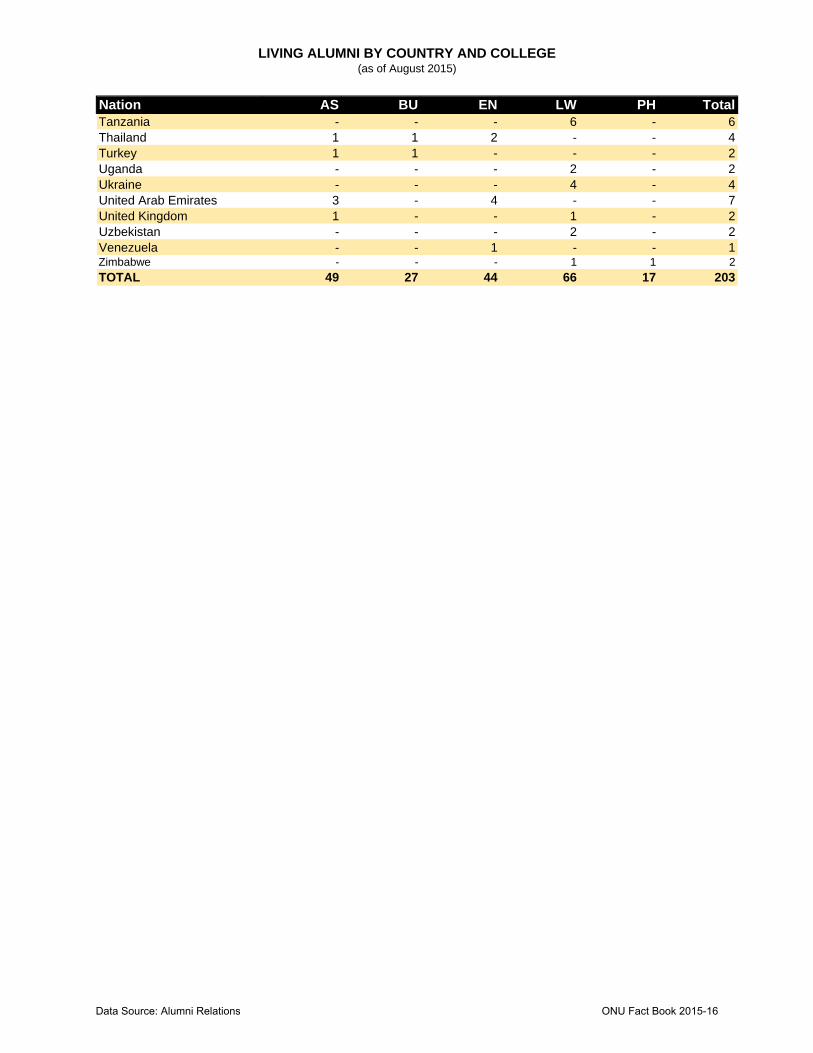
LIVING ALUMNI BY COUNTRY AND COLLEGE(as of August 2015)
Nation AS BU EN LW PH TotalTanzania - - - 6 - 6Thailand 1 1 2 - - 4Turkey 1 1 - - - 2Uganda - - - 2 - 2Ukraine - - - 4 - 4United Arab Emirates 3 - 4 - - 7United Kingdom 1 - - 1 - 2Uzbekistan - - - 2 - 2Venezuela - - 1 - - 1Zimbabwe - - - 1 1 2TOTAL 49 27 44 66 17 203
Data Source: Alumni Relations ONU Fact Book 2015-16

GIVING BY DONOR CATEGORY(Non-government)
5 yearFiscal Year 2010-11 2011-12 2012-13 2013-14 2014-15 Change (%)
CURRENT OPERATIONS (Northern Fund)
Alumni* $605,956 $622,350 $654,682 $629,423 $679,354 12.1%Trustees $142,680 $160,123 $176,512 $161,957 $145,467 2.0%Parents $22,197 $21,380 $25,322 $11,500 $21,185 -4.6%Friends/Others $152,972 $171,684 $113,075 $126,265 $107,971 -29.4%Corporations $104,383 $98,063 $97,319 $99,881 $103,572 -0.8%Foundations $280,835 $286,403 $239,847 $373,094 $205,516 -26.8%Church $5,595 $745 $835 $2,120 $5,625 0.5%OFIC $79,644 $71,335 $81,154 $84,826 $84,749 6.4%TOTAL $1,394,262 $1,432,083 $1,388,746 $1,489,066 $1,353,439 -2.9%BEQUESTS (Unrestricted by Donor)Alumni* $8,443 $17,211 $13,043 $376,035 $467,468 5436.8%Friends/Others $113,636 $598 - $100,481 $343,775 5436.8%TOTAL $122,079 $17,809 $13,043 $476,516 $811,243 564.5%CAPITAL/ENDOWMENTAlumni* $1,122,911 $506,488 $1,013,644 $1,643,127 $888,470 -20.9%Trustees $405,899 $351,205 $491,910 $933,945 $366,159 -9.8%Parents $2,404 $839 $3,596 $75 $1,255 -47.8%Friends/Others $478,143 $1,346,707 $324,314 $112,111 $279,673 -41.5%Corporations $85,044 $180,831 $201,697 $76,748 $136,406 60.4%Foundations $165,056 $35,308 $820,375 $504,787 $1,344,758 714.7%Church $2,437 $1,818 $114 - 133 -94.5%Bequests (Restricted) $381,771 $1,292,082 $1,881,055 $386,719 $2,755,540 621.8%TOTAL $2,643,665 $3,715,278 $4,736,705 $3,657,513 $5,772,394 118.3%OTHER (outside budget)Alumni* $367,963 $207,558 $519,772 $517,637 $609,294 65.6%Trustees $116,050 $57,745 $1,143,425 $1,008,751 $66,062 -43.1%Parents $15,025 $4,150 $6,156 $8,280 $10,070 -33.0%Friends/Others $150,302 $109,450 $71,730 $329,893 $165,801 10.3%Corporations $322,559 $181,112 $403,567 $205,743 $199,647 -38.1%Foundations $81,497 $256,523 $224,474 $457,985 $276,711 239.5%Church - - $1,500 $6,872 $550 -Bequests (Restricted) $12,000 $105,854 $26,654 $69,744 $26,071 117.3%TOTAL $1,065,396 $922,392 $2,397,278 $2,604,905 $1,354,206 27.1%TOTAL PRIVATE SUPPORT (By Source)Alumni* $2,414,337 $2,573,026 $4,069,963 $3,577,374 $5,050,019 109.2%Trustees $664,629 $569,073 $1,811,847 $2,104,653 $577,688 -13.1%Parents $39,625 $26,369 $35,074 $19,855 $32,510 -18.0%Friends/Others $979,627 $1,806,956 $548,006 $714,061 $1,273,399 30.0%Corporations $511,986 $460,006 $702,583 $382,372 $439,624 -14.1%Foundations $527,388 $578,234 $1,284,696 $1,335,867 $1,826,985 246.4%Church $8,166 $2,563 $2,449 $8,992 $6,308 -22.8%OFIC $79,644 $71,335 $81,154 $84,826 $84,749 6.4%TOTAL $5,225,402 $6,087,562 $8,535,772 $8,227,999 $9,291,282 77.8%ALUMNI DONORS* 4,688 4,139 3,924 3,323 3,719 -20.7%TOTAL DONORS 9,205 8,072 7,564 6,481 6,878 -25.3%* Includes giving from honorary alumni
$0
$1,000,000
$2,000,000
$3,000,000
$4,000,000
$5,000,000
$6,000,000
$7,000,000
$8,000,000
$9,000,000
$10,000,000
2010-11 2011-12 2012-13 2013-14 2014-15
Total Giving
$6,308
$32,510
$84,749
$439,624
$577,688
$1,273,399
$1,826,985
$5,050,019
Church
Parents
OFIC
Corporations
Trustees
Friends/Others
Foundations
Alumni
2014-15 Giving
Data Source: Advancement ONU Fact Book 2015-16

CONSTITUENT AND ORGANIZATIONTOTAL GIVING FOR CAPITAL PURPOSES, AND PLANNED GIVING
5 YearFiscal Year 2010-11 2011-12 2012-13 2013-14 2014-15 % Change
CONSTITUENTS
Endowment/Loan Funds $1,187,779 $1,311,611 $2,746,133 $860,742 $2,676,389 125.3%
Plant & Equipment $200,164 $557,791 $194,937 $798,697 $1,643,605 721.1%
Unrestricted Capital Funds $515,785 $18,845 $527,539 $779,855 $7,511 -98.5%
Gifts-in-Kind $19,481 $32,332 $34,024 $16,486 $26,133 34.1%
TOTAL $1,923,209 $1,920,579 $3,502,633 $2,455,780 $4,353,638 126.4%
ORGANIZATIONS
Foundations $348,556 $241,308 $1,030,375 $752,340 $1,344,758 285.8%
Corporations $105,044 $200,931 $206,697 $289,423 $142,655 35.8%
Other $117,450 $1,261,950 $3,455 $26,150 $109,825 -6.5%
Religious $2,571 $1,818 $114 - $133 -94.8%
TOTAL $573,621 $1,706,007 $1,240,641 $1,067,913 $1,597,371 178.5%
TOTAL OUTRIGHT GIVINGFOR CAPITAL PURPOSES $2,496,830 $3,626,586 $4,743,274 $3,523,693 $5,951,009 138.3%(Total figures match the Voluntary Support of Education survey, submitted annually to the Council for the Aid to Education at CAE.org)
5 Year 2010-11 2011-12 2012-13 2013-14 2014-15 % Change
PLANNED GIVINGBequests $455,196 $1,362,943 $1,927,114 $933,979 $3,255,143 615.1%
(Includes realized bequests, not bequest intentions)Irrevocable / Deferred Giving $145,335 $96,192 $219,481 $143,820 $10,000 -93.1%
(Charitable Remainder Trusts, Pooled Income Funds, Gift Annuities and other planned gifts received, at Face Value)New Testamentary Commitments $11,237,044 $10,576,125 $250,000 $1,885,000 $7,120,000 -36.6%
(Provisions made in wills/revocable trusts for which the institution has documentation)New Testamentary Commitments Received ($57,000) ($26,000) $0 $0 $0 $0
(Amount paid on a new TE need subtracted off if received in the same fiscal year)TOTAL PLANNED GIVING $11,780,575 $12,009,259 $2,396,595 $2,962,799 $10,385,143 -11.8%
$2,496,830 $3,626,586
$4,743,274
$3,523,693
$5,951,009
$0
$1,000,000
$2,000,000
$3,000,000
$4,000,000
$5,000,000
$6,000,000
$7,000,000
2010-11 2011-12 2012-13 2013-14 2014-15
Total Giving for Capital Purposes
Data Source: Advancement ONU Fact Book 2015-16

ALUMNI GIVING BY COLLEGEFiscal Year 2010-11 2011-12 2012-13 2013-14 2014-15
ARTS & SCIENCES# of Alumni 11,222 11,557 11,767 12,011 12,109# of Donors 1,732 1,584 1,506 1,274 1,446% Who Gave 15% 14% 13% 11% 12%Total Giving $773,597 $317,592 $2,625,572 $1,544,494 $2,251,643
BUSINESS ADMINISTRATION# of Alumni 2,696 2,810 2,885 2,923 2,974# of Donors 411 399 370 341 334% Who Gave 15% 14% 13% 12% 11%Total Giving $182,414 $460,724 $712,697 $850,405 $267,593
ENGINEERING# of Alumni 3,612 3,751 3,806 3,854 3,888# of Donors 673 613 622 541 608% Who Gave 19% 16% 16% 14% 16%Total Giving $772,356 $873,801 $1,072,971 $1,499,851 $2,319,028
PHARMACY# of Alumni 6,063 6,289 6,424 6,513 6,565# of Donors 1,260 1,011 946 776 864% Who Gave 21% 16% 15% 12% 13%Total Giving $373,079 $736,729 $299,266 $539,910 $257,377
LAW# of Alumni 4,945 5,015 5,080 5,134 5,188# of Donors 590 525 477 408 473% Who Gave 12% 10% 9% 8% 9%Total Giving $257,337 $246,720 $150,803 $195,086 $382,805
UNIVERSITY*# of Alumni 28,190 28,833 29,341 29,886 29,886# Solicited 22,170 22,391 22,455 22,146 22,146# of Donors 4,688 4,151 3,938 3,323 3,719Solic. Effect 21% 19% 18% 15% 17%Total Alumni Giving $2,414,337 $2,847,194 $4,909,754 $4,856,989 $5,543,157 *Giving from honorary alumni is included in this section but not above
0%
5%
10%
15%
20%
25%
2010-11 2011-12 2012-13 2013-14 2014-15
Percent Who Gave by College
Arts & Sciences
Business
Engineering
Pharmacy
Law
Data Source: Advancement ONU Fact Book 2015-16

ALUMNI GIVING BY FUND AND COLLEGE5 Year
Fiscal Year 2010-11 2011-12 2012-13 2013-14 2014-15 % ChangeNORTHERN FUNDArts & Sciences $280,872 $247,337 $295,863 $1,000,173 $581,739 107.1%Business Administration $120,238 $131,535 $540,030 $650,491 $148,577 23.6%Engineering $200,436 $269,544 $283,642 $362,285 $636,680 217.6%Pharmacy $312,925 $206,238 $244,538 $205,207 $208,085 -33.5%Law $143,492 $154,134 $124,998 $120,384 $118,012 -17.8%TOTAL $1,057,964 $1,008,788 $1,489,071 $2,338,540 $1,693,093 60.0%CAPITAL & ENDOWMENTArts & Sciences $492,725 $70,255 $2,329,709 $544,321 $1,669,904 238.9%Business Administration $62,176 $329,189 $172,667 $199,914 $119,016 91.4%Engineering $571,920 $604,257 $789,329 $1,137,566 $1,682,348 194.2%Pharmacy $60,155 $530,491 $54,728 $334,703 $49,292 -18.1%Law $113,845 $92,586 $25,805 $74,702 $264,793 132.6%TOTAL $1,300,821 $1,626,778 $3,372,238 $2,291,206 $3,785,353 191.0%TOTAL ALUMNI GIVING BY COLLEGEArts & Sciences $773,597 $317,592 $2,625,572 $1,544,494 $2,251,643 191.1%Business Administration $182,414 $460,724 $712,697 $850,405 $267,593 46.7%Engineering $772,356 $873,801 $1,072,971 $1,499,851 $2,319,028 200.3%Pharmacy $373,080 $736,729 $299,266 $539,910 $257,377 -31.0%Law $257,337 $246,720 $150,803 $195,086 $382,805 48.8%TOTAL $2,358,785 $2,635,566 $4,861,309 $4,629,746 $5,478,446 132.3% Note: Giving from honorary alumni is NOT included in this report.
Northern Fund31%
Capital & Endowment
69%
Alumni Giving by Fund 2014-15
$0$500,000
$1,000,000$1,500,000$2,000,000$2,500,000$3,000,000$3,500,000$4,000,000
2010-11 2011-12 2012-13 2013-14 2014-15
Alumni Giving By Fund
Northern Fund Capital & Endowment
Data Source: Advancement ONU Fact Book 2015-16

OHIO NORTHERN UNIVERSITY ADA, OHIO