fact book 2008-2009 cover page.ppt
TRANSCRIPT

Fact BookFact Book20082008--2009200920082008 20092009
Fayetteville State UniversityFayetteville State UniversityOffice of Institutional ResearchOffice of Institutional Research
i
TABLE OF CONTENTS
General Information
Statement of Educational Mission, Philosophy and Values ................................................2 Administration .....................................................................................................................3 History of Fayetteville State University ..............................................................................7 University of North Carolina Board of Governors ............................................................10 Institutional Memberships, Accreditation, Centers and Special Programs ........................11 Fayetteville State University Organizational Chart ...........................................................12 Academic Program Inventory ............................................................................................13
Students
Narrative Summary of Student Data .............................................................................16
First Time Freshmen Enrolled 2003-2009 by Gender ...................................................18 By Age ...............................................................................................................................19 By Residency .....................................................................................................................20 By Race ..............................................................................................................................21 By SAT Verbal ..................................................................................................................22 By SAT Math .....................................................................................................................23 By SAT Combined .............................................................................................................24 By High School GPA .........................................................................................................25 By Class Rank in Quintiles ................................................................................................26 By Class Rank in Quartiles ................................................................................................27 By Predicted GPA ..............................................................................................................28
Total Student Enrollment 2003-2009 by Gender ...........................................................29 By Age ...............................................................................................................................30 By Enrolled Residency ......................................................................................................31 By Race ..............................................................................................................................32 By Status ............................................................................................................................33 By Citizenship ....................................................................................................................34 By Housing Status..............................................................................................................35 By Semester Credit Hours .................................................................................................36 By Transfer Hours Applied ................................................................................................37 By Classification ................................................................................................................38 Undergraduate and Graduate By Major .............................................................................44 Upper Division (junior, senior, and graduate) Enrollment 2003-2009 ..............................52
Degrees Conferred 2004-2009 Comparison by Level and Month .................................53 By Residency and Race .....................................................................................................54 By Gender and Citizenship ................................................................................................55
ii
By Teacher Certification ....................................................................................................56 Degrees Awarded By Major ..............................................................................................57 Degrees Awarded By County 2006-2009 ..........................................................................58 Degrees Awarded By State 2006-2009 .............................................................................61 Retention, Graduation, and Persistence Rates ...................................................................64
Faculty and Staff
Full-Time Faculty 2005-2008 CUPA HR By Gender and Race ......................................66 By Tenure Status and Position ...........................................................................................67 By Degree and Average Salary ..........................................................................................68 Full-Time Faculty 2005-2008 AAUP By Gender and Race ............................................71 By Tenure Status and Position ...........................................................................................72 By Degree and Average Salary ..........................................................................................73
Employees 2003-2008 By Race and Gender.....................................................................76 By Status and Classification ..............................................................................................77 Employee Statistics Fall 2005-Fall 2008 ...........................................................................78
Finances
Finance Report Fiscal Years 2004-2008 ............................................................................81 IPEDS Finance Survey Fiscal Years 2004-2008 ...............................................................82 Detailed Tuition and Fees Fall 2008-Spring 2009 .............................................................87 Financial Aid 2003-2008 By Type and Dollars .................................................................90 Financial Aid Comparative Statistics 2005-2008 ..............................................................91 Summary of Financial Need Not Met by Financial Aid Awards 2005-2008 ....................94 Economic Impact of Fayetteville State University ..........................................................124
Facilities
Facilities Inventory ..........................................................................................................131 Fayetteville State University 2000 Bond Program Distribution ......................................132 Fayetteville State University 2000 Bond Projects Updates ............................................................................................133

General Information Institutional Profile Fall 2008
Established: 1867
Control: State
Highest Degree Offering: Doctorate
Accreditation: Southern Association of Colleges and Schools
FICE Code: 002928
Level: Comprehensive I
School Motto: Res Non Verba “Deeds not Words”
School Colors: White & Blue
School Song: “Old White and Blue” by Mary T. Eldridge
School Mascot: Bronco
Fall Enrollment: 6,217 (5,602 undergraduate)
Top Majors: Business Administration, Criminal Justice, Psychology and Nursing
Degree Areas: Bachelor – 43, Master – 23, Doctor – 1
Estimated Annual In State $3,703 – undergraduate (room & board $8,863)Costs: $3,617 – graduate
Demographics: Female – 69%, Black – 72%, In State – 95%
Employees:
Facilities:
Total – 1,000, Full-Time Faculty – 255 (80 % hold a doctorate or 1st professional degree) 38 buildings on 156 acres
Annual Budget (FY 2008): $111,257,164
Fayetteville State University

2
General Information
Statement of Educational Mission
Fayetteville State University (FSU) is a public comprehensive regional university that promotes the educational, social, cultural, and economic transformation of southeastern North Carolina and beyond. The primary mission of FSU is to provide students with the highest quality learning experiences that will produce global citizens and leaders as change agents for shaping the future of the State. Awarding degrees at the baccalaureate,
master's, and doctoral levels, FSU offers programs in teacher education, the arts and sciences, health professions, business and economics, and unique and emerging fields. FSU is an institution of opportunity and diversity. Committed to excellence in teaching, research, scholarship, and service, the university extends its services and programs to the community, including the military, and other educational institutions throughout North Carolina, the nation, and the world.
Philosophy and Values
Fayetteville State University is committed to educating students in the liberal arts tradition and to the belief that the intellectual life of the student is to be cultivated for the good of the individual and humankind. The university embraces the philosophical and educational beliefs that a strong liberal arts education should foster in students the independence of mind, clarity of thought, and depth of spiritual vision that will inspire them to contribute integrally to the good of society and the quality of life for all of humankind. In keeping with these beliefs, Fayetteville State University strives to prepare students to think critically, to appreciate the arts, to express themselves creatively, and to make independent and rational judgments. The university also endeavors to cultivate in students a respect for the earth and its peoples, engendering in them both an appreciation of the diverse cultures around the globe and a sense of responsibility for preserving the earth and its treasures.
Through disciplined scholarship and creativity, students are prepared to compete in and contribute to both the artistic world and the world of the marketplace while maintaining high standards in their personal and professional lives. In short, Fayetteville State University aspires to cultivate intellectual growth and excellence of scholarship, inculcating in students a love of truth, of beauty, and of goodness to attune them to a lifelong pursuit of the ideals of learning, of humane values, and of selfless service to humankind.

3
Administration Board of Trustees
Mrs. Gloria A. Moore-Carter, Chair Ms. Juanita Pilgrim, Vice Chair Ms. Sylvia Ray, Secretary Suzetta M. Perkins, Staff liaison/Assistant Secretary Ms. Linda Lee Allan Dr. Lucy Vidal-Barreto Mr. John B. Brown, Jr. Dr. W. T. Brown-Emeritus Mr. Felton J. Capel-Emeritus Mr. Jerry C. Dean Dr. Shirish D. Devasthali Mr. Julius A. Fulmore, Jr.- Emeritus Dr. John R. Griffin, Jr. Dr. Jack V. Hill- Emeritus Mr. James Jefferson (Ex Officio-SGA 2008-2009) Mr. Terrence Murchison Mr. James M. Paige- Emeritus Dr. Ruth Dial Woods Mr. Roosevelt Wright
Administrative Officers and Department Chairs
James A. Anderson, B.A., Ph.D. Chancellor Thomas Conway, B.S., M.S., Ph.D. Vice Chancellor and Chief of Staff
Jon Young, B.A., M.A., Ph.D. Interim Provost and Vice Chancellor for Academic Affairs Janice Haynie, B.A., Ph.D. Vice Chancellor for Student Affairs Arasu “Nick” Ganesan, B.A., M.B.A. Vice Chancellor for Inform. Tech. & Telecom Services Wendy Jones, B.A. Vice Chancellor for Development and University Relations Robert Botley, B.A. Vice Chancellor for Business and Finance
***** Wanda D. Jenkins, B.B.A., M.B.A., J.D. Chief Compliance Officer and General Counsel Edward McLean, B.S., M.S., Ed.D. Director of Athletics Suzetta Perkins, A.A.S., B.S. Secretary of the University
4
***** David E. Barlow, B.S., M.S., Ph.D. Dean, College of Arts and Sciences Leontye L. Lewis, B.S., M.Ed., Ed.D. Dean, School of Education LaDelle Olion, B.S., Ph.D. Dean of Graduate School Assad Tavakoli, B.S., M.S., M.B.A., Ph.D. Dean, School of Business and Economics
***** David Allen
Associate Vice Chancellor for Military Education
Travis Bryant Associate Vice Chancellor for Police and Public Safety
Rudolph Cardenas Associate Vice Chancellor for Facilities Management Curtis B. Charles Associate Vice Chancellor for Academic Affairs Yunkai Chen Assistant Vice Chancellor for International Education Juanette Council Associate Vice Chancellor for Student Affairs
Jolene Elkins Associate Vice Chancellor for Business and Finance Landon Hadley Dean of Students Tendai Johnson
Associate Vice Chancellor for Institutional Effectiveness and the Director of Title III
Greg Moyd Assistant Vice Chancellor for Student Affairs Angela Revels-Bullard Associate Vice Chancellor for Human Resources Roxie Shabazz Associate Vice Chancellor for Enrollment Management
***** Joe Alston Director of Business Services Booker T. Anthony Director of Honors Program Sarah Baker Registrar Hattie B. Bazemore Director of Teacher Education David Beach Director of Systems and Procedures for Business and Finance Ulisa Bowles Director of Admissions Matthew Bowman Director of Early Childhood Learning Center
John Brooks III Director of University College Kimberly Smith-Burton
Director of Math/Science Education Center
Helen Cameron Director of Career Services Center Geraldine Campbell-Munn Assistant Dean, School of Education David Camps Director of Sponsored Research Program Lena Clayton Director of Health Services Emily Dickens
Director of Community and Government Affairs
5
Kamesia Ewing Director of Financial Aid Patricia Heath Director of University Testing Services Doreen Hilton Assistant Dean of Graduate Studies Dorothy Holmes Executive Director of Special Programs Pamela Jackson
Assistant Dean and Director for Pre-Business Program
Barbara Jones Interim Director of Extended Learning and Summer School
Trasey Lamotte Treasurer/Bursar Yali Li Director of the Foreign Language Lab Willie Mae McIntyre Director of Purchasing Ben Minter Director of Marketing and Events Daniel Okunbor
Assistant Dean, College of Arts and Sciences
Victor Pace Director of Alumni Affairs Adrina Russell Director of Student Life and Housing
Fred Sapp Director of Center for Personal Development
Carlton Spellman Director of Budget Floyd Shorter Director of Business Center Gregory Taylor Director of the Small Business and Technology Development Center John Nworie
Director of Teaching and Learning Center
Darrell Vickers Director of Fayetteville State University at Seymour Johnson Air Force Base Joseph Vittorelli Director of IT Infrastructure Ivan Walker Director of Institutional Research Jenny Washington Director of Teacher Education Michelle Whitaker Director of IT Operations Dawn Wilson Interim Director of MBA Program Linda Wilson-Jones Director of the E.d.D Program Jeffery Womble Director of Public Relations/WFSS Bobby Wynn Director of Library Services
***** Adegoke Ademiluyi Chair, Department of Government and History Samuel Adu-Mireku Chair, Department of Sociology Vinod Arya Chair, Department of Math/Computer Science Charletta Barringer-Brown Interim Chair, Department of Middle Grades, Secondary and Special Education Terri Moore-Brown Chair, Department of Social Work
Gloria Elliott Interim Chair, Department of Health, P.E., and Human Services Lori Guevara Chair, Department of Criminal Justice Roderick Haley Chair, Department of Aerospace Studies Terence Hicks Chair, Department of Educational Leadership and Foundations Ronald Johnston Chair, Department of Natural Sciences

6
Petur Jonsson Chair, Department of Finance, Economics, Entrepreneurship and Marketing
Connie Lightner Interim Chair, Department of Management Kernaa D. McFarlin, III Chair, Department of Military Science Edward McShane Chair, Department of English and Foreign Languages Saundra Shorter Chair, Department of Elementary Education Ulysses Taylor Chair, Department of Accounting Thomas Van Cantfort Interim Chair, Department of Psychology Harmon Watson Chair, Department of Performing and Fine Arts Phyllis Morgan Chair, Department of Nursing
7
History of Fayetteville State University In 1867, seven Black men - Matthew N. Leary, A. J. Chesnutt, Robert Simmons, George
Grainger, Thomas Lomax, Nelson Carter, and David A. Bryant - paid $136 for two lots on Gillespie Street and converted themselves into a self-perpetuating Board of Trustees to maintain this property permanently as a site for the education of Black children in Fayetteville. General O. O. Howard of the Freedman's Bureau, one of the bestknown friends of Black education, erected a building on this site, and the institution became known as the Howard School.
By a legislative act of 1877, the North Carolina General Assembly provided for the establishment of a Normal School for the education of Black teachers. The Howard School was chosen as the most promising because of its successful record during the previous ten years. It was designated a teacher training institution, and its name was changed to the State Colored Normal School. Five Administrative Officers served for relatively short periods until 1899: Robert L. Harris, Charles W. Chesnutt, Ezekiel E. Smith, George Williams, and the Rev. L. E. Fairley.
In 1899, Dr. Smith returned to the institution. Under his administration, the school grew from three rooms in a small frame structure to a physical plant of ten buildings on a fifty-acre tract of land. In order to pay for the land, Dr. Smith, along with F. D. Williston, E. N. Williams, J. G. Smith and Dr. P. N. Melchor, endorsed a note for $3,000.00. The note was renewed several times and eventually paid off by Dr. Smith, who later deeded the land to the State. Dr. Smith retired in 1933 at the age of 80 with more than 40 years of service to the institution.
Dr. J. Ward Seabrook succeeded Dr. Smith and under his presidency the school became Fayetteville State Teachers College, thereafter being authorized to grant the Bachelor of Science degree in Education. The college received both state and regional accreditation in 1947.
Dr. Seabrook retired in 1956 and was succeeded by Dr. Rudolph Jones. During his administration, the curriculum was expanded to include majors in secondary education and programs leading to degrees outside the teaching field. The name of the school was changed to Fayetteville State College in 1963. Also, under the leadership of Dr. Jones, six additions were made to the physical plant to accommodate a rapidly expanding enrollment.
In 1969, the institution acquired its present name, "Fayetteville State University," and Dr. Charles "A" Lyons, Jr. was elected president. By a legislative act, Fayetteville State University became a constituent institution of the University of North Carolina System in 1972 and Dr. Lyons became its first chancellor. During his tenure, the curriculum was expanded to include a variety of both baccalaureate and master's level programs. In addition, the Fort Bragg-Pope AFB Extension Center, in conjunction with the Weekend and Evening College, was established in order to provide military personnel and other persons employed full-time with the opportunity to further their education. The general academic structure took its present configuration in 1985 when the university became a Comprehensive Level I Institution. In addition to expanding program offerings and services, eight buildings were added to the physical plant during this period.
On January 1, 1988, Dr. Lloyd V. Hackley became the seventh Chief Executive Officer of the university. In his seven years as Chancellor, the university expanded its master's level program offerings to include biology, business administration, education, English, history, mathematics, psychology, sociology, and teaching; FSU's first doctoral program in Educational
8
Leadership was established; and, baccalaureate program offerings were also increased to include 36 disciplines in the arts and sciences, business and economics, and education. The addition of the $6.3 million ultra-modern School of Business and Economics Building, and the new $10.9 million Health and Physical Education Building, underscored Dr. Hackley's commitment to FSU's continued expansion and growth.
Chancellor Hackley strengthened FSU's community outreach to at-risk children in the public schools, establishing numerous scholarship and tutoring/mentoring programs to encourage more young people to aspire to academic excellence and a college education. FSU's first major public capital campaign was also completed during Dr. Hackley's tenure, which enabled the university to increase the number of privately funded scholarships. On December 31, 1995, Dr. Hackley left his post to become President of the North Carolina Department of Community Colleges, the first African-American to lead the state's system of 59 community colleges. Dr. Donna J. Benson, Associate Vice President for Academic Affairs of the University of North Carolina served as Interim Chancellor from January 1, 1995 to November 15, 1995.
Dr. Willis McLeod, a 1964 graduate of Fayetteville State University, was appointed Chancellor on November 15, 1995. Dr. McLeod was the ninth Chief Executive Officer of the 130-year-old institution, and the first alumnus to serve as Chancellor since FSU became a constituent of The University of North Carolina in 1972. Dr. McLeod earned his master's and doctoral degrees in school administration from the University of Virginia, and has over 30 years of experience in education as a teacher, assistant superintendent, and superintendent of public school systems in Virginia, Louisiana, and North Carolina.
Several major initiatives were established by Dr. McLeod. The “Freshman Year Initiative,” (or F.Y.I.) a program designed to enhance students’ educational outcomes, was initiated in fall 1996; new outreach efforts aimed at forging stronger community ties and involving the community in University life were undertaken; campus improvements such as expansion of the Rudolph Jones Student Center and master planning to accommodate an expected enrollment increase of 50%; and Dr. McLeod was instrumental in forming a regional partnership of public school, community college, and university leaders to focus on strengthening the educational pipeline from pre-school to post-graduate studies.
Dr. T. J. Bryan assumed the position of Chancellor on July 1, 2003. The tenth chief executive officer of the university, Dr. Bryan was the first woman to serve as chancellor and the first African-American woman selected to lead a constituent institution of the University of North Carolina. Dr. Bryan earned the B.A. and M.A. from Morgan State College and the Ph.D. from the University of Maryland at College Park. Prior to appointment as chancellor, she served as a faculty member, department chair, and dean at Coppin State College. She also served as Associate Vice President for Academic Affairs for the University System of Maryland and Vice President for Academic and Student Affairs for the Pennsylvania State System of Higher Education.
Dr. Bryan’s top priorities included developing new academic programs, obtaining specialized accreditation, strengthening student recruitment and support programs, establishing a first-rate international studies program, increasing funding from external sources, and improving physical facilities. Under her leadership, a four-year nursing program and an Honors Program were established.
Dr. James A. Anderson was named the 11th Chief Executive Officer of Fayetteville State University on April 3, 2009. Dr. Anderson, who comes to FSU from the University of Albany in

9
New York, began his duties as Chancellor of the state’s second-oldest public institution on June 9, 2008. The appointment was made by Erskine Bowles, President of the 17-campus University of North Carolina System.
10
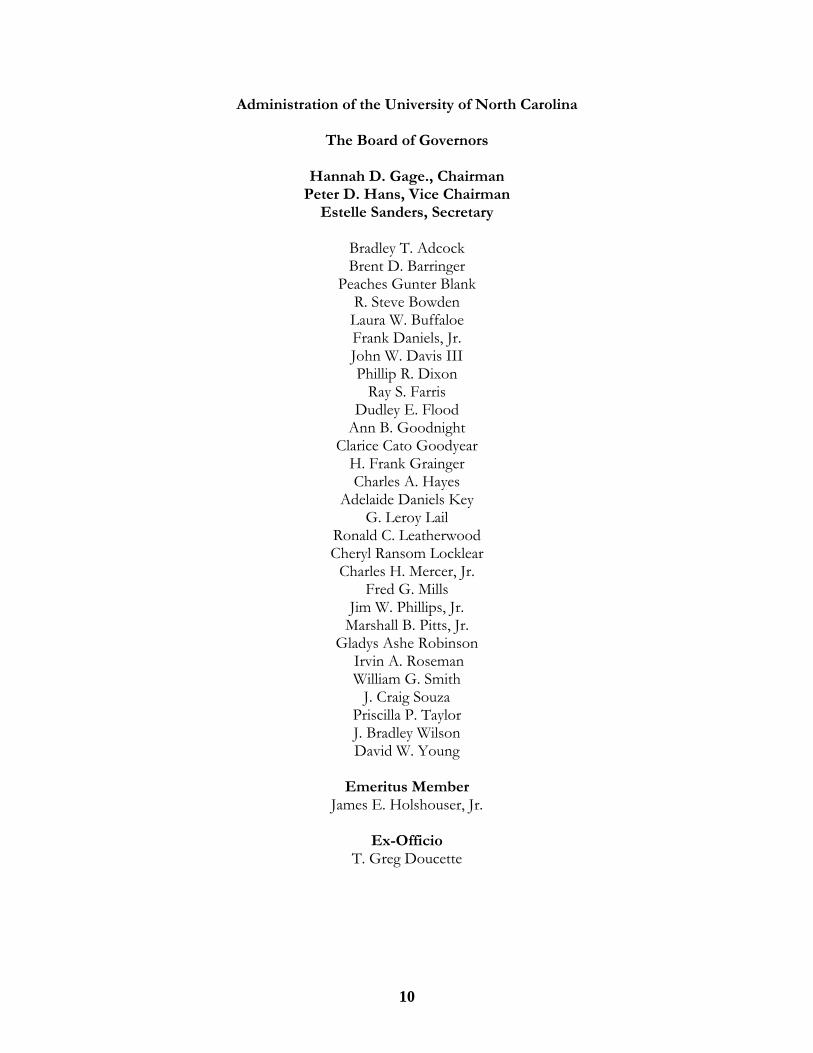
Administration of the University of North Carolina
The Board of Governors
Hannah D. Gage., Chairman Peter D. Hans, Vice Chairman
Estelle Sanders, Secretary
Bradley T. Adcock Brent D. Barringer
Peaches Gunter Blank R. Steve Bowden Laura W. Buffaloe Frank Daniels, Jr. John W. Davis III Phillip R. Dixon
Ray S. Farris Dudley E. Flood
Ann B. Goodnight Clarice Cato Goodyear
H. Frank Grainger Charles A. Hayes
Adelaide Daniels Key G. Leroy Lail
Ronald C. Leatherwood Cheryl Ransom Locklear
Charles H. Mercer, Jr. Fred G. Mills
Jim W. Phillips, Jr. Marshall B. Pitts, Jr.
Gladys Ashe Robinson Irvin A. Roseman William G. Smith
J. Craig Souza Priscilla P. Taylor J. Bradley Wilson David W. Young
Emeritus Member
James E. Holshouser, Jr.
Ex-Officio T. Greg Doucette

11
Institutional Memberships and Accreditations The university holds institutional membership and/or accreditation in the following agencies and professional organizations: The Adult Education Association, U.S.A. American Association for Counseling and Development The American Association of Colleges and Schools for Teacher Education (AACTE) The American Association of State Colleges and Universities (AASCU) The American Council on Education (ACE) Association for Continuing and Higher Education (ACHE) The Central Intercollegiate Athletic Association (CIAA) Commission on Collegiate Nursing Education (CCNE) Council for Advancement and Support of Education (CASE) Council on Social Work Education The National Alliance of Business National Association for Equal Opportunity in Higher Education (NAFEO) National Association for Student Financial Aid Administrators (NASFAA) The National Association of Business Teacher Education The National Collegiate Athletic Association (NCAA) The National Council for Accreditation of Teacher Education (NCATE) The National League of Nursing (NLN) The North Carolina Association of Colleges and Universities North Carolina Day Care Association The North Carolina Department of Public Instruction (DPI) The Servicemen’s Opportunity College (SOC) The Southern Association of Colleges and Schools (SACS) The Southern Conference of Graduate Schools (SCGS)
Centers and Special Programs Center for Extended Learning Center for Economic Education Curriculum Learning Resource Laboratory Distance Learning Center Early Childhood Learning Center Educational Opportunity Centers Program Educational Talent Search Program Fine Arts Resource Center FSU Theatre Company Mathematics and Science Education Center Office of School Services Public Radio WFSS 91.9 FM Rosenthal Gallery Servicemen’s Opportunity College Seymour Johnson AFB Center Small Business and Technology Development Center Fort Bragg-Pope Air Force Base University Center. University Testing Services Upward Bound Program Veterans Affairs
Draft Copy Only
Provost and VC for Academic Affairs
Vice Chancellor and Chief of Staff
Vice Chancellor for Information Technology and Telecommunication
Services
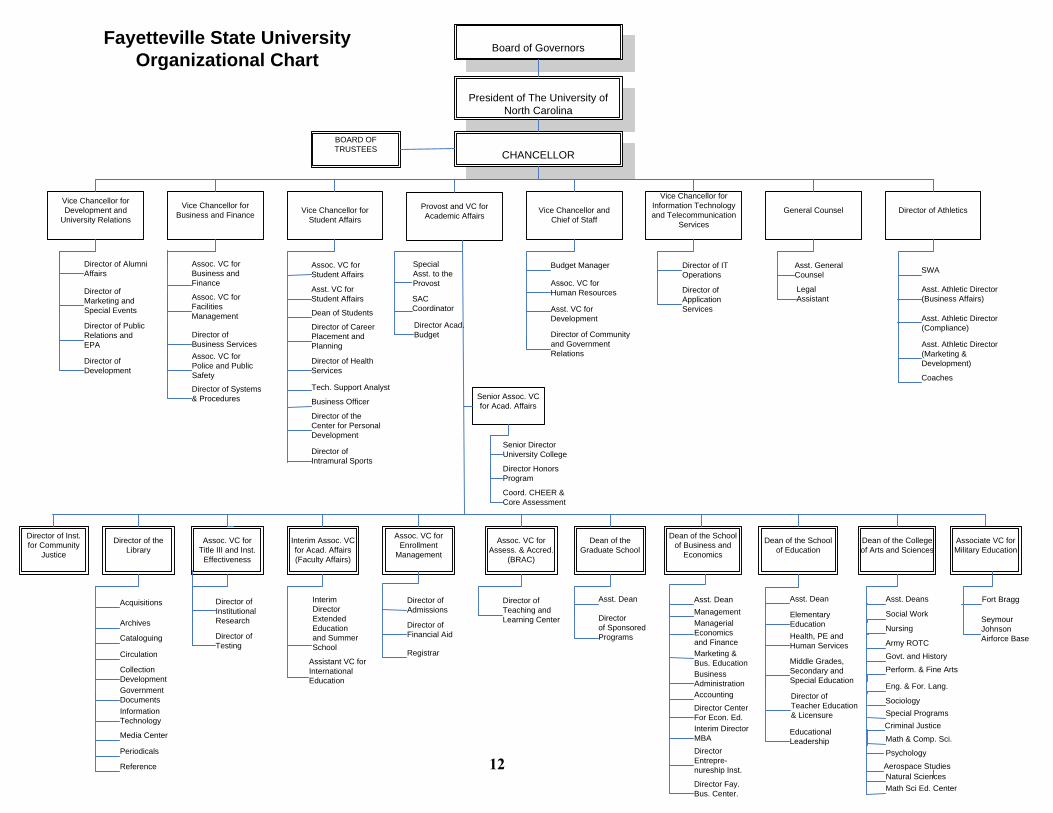
Board of Governors
President of The University of North Carolina
CHANCELLORBOARD OF TRUSTEES
Vice Chancellor for Student Affairs
Vice Chancellor for Development and
University RelationsGeneral Counsel Director of AthleticsVice Chancellor for
Business and Finance
Director of Alumni Affairs
Director of Marketing and Special Events
Director of Public Relations and EPA
Director of Development
Assoc. VC for Facilities Management
Assoc. VC for Business and Finance
Director of Business Services
Assoc. VC for Student Affairs
Asst. VC for Student Affairs
Dean of Students
Director of Career Placement and Planning
Director of Health Services
Business Officer
Director of the Center for Personal Development
Director of Intramural Sports
Budget Manager
Assoc. VC for Human Resources
Asst. VC for Development
Director of Community and Government Relations
Director of IT Operations
Director of Application Services
Asst. General Counsel
Legal Assistant
SWA
Asst. Athletic Director (Business Affairs)
Asst. Athletic Director (Compliance)
Asst. Athletic Director (Marketing & Development)
Assoc. VC for Assess. & Accred.
(BRAC)
Assoc. VC for Enrollment
Management
Interim Assoc. VC for Acad. Affairs(Faculty Affairs)
Assoc. VC for Title III and Inst.
Effectiveness
Director of the Library
Dean of the Graduate School
Dean of the School of Business and
Economics
Dean of the School of Education
Dean of the College of Arts and Sciences
Acquisitions
Archives
Cataloguing
Circulation
Collection DevelopmentGovernment DocumentsInformation Technology
Media Center
Periodicals
Reference 12
Director of Institutional Research
Director of Testing
Director of Admissions
Director of Financial Aid
Registrar
Director of Teaching and Learning Center
Asst. Dean
Accounting
Managerial Economics and FinanceMarketing &Bus. EducationBusiness Administration
Asst. Dean
Elementary EducationHealth, PE and Human Services
Middle Grades, Secondary and Special Education
Asst. Deans
Social Work
Nursing
Army ROTCGovt. and History
Perform. & Fine Arts
Eng. & For. Lang.
SociologySpecial ProgramsCriminal Justice
Math & Comp. Sci.
Psychology
Natural Sciences
Senior Assoc. VC for Acad. Affairs
Assoc. VC for Police and Public Safety
Director of Systems & Procedures
Tech. Support Analyst
Assistant VC for International Education
Interim Director Extended Education and Summer School
Director of Inst. for Community
Justice
Associate VC for Military Education
Senior Director University College
Director Honors Program
Coord. CHEER & Core Assessment
Special Asst. to the Provost
SAC Coordinator
Director Acad. Budget
Coaches
Math Sci Ed. Center
Fort Bragg
Seymour Johnson Airforce Base
Fayetteville State University Organizational Chart 12
Educational Leadership
Director of Teacher Education & Licensure
Asst. Dean
Director of Sponsored Programs
Aerospace Studies
Interim Director MBA Director Entrepre-nureship Inst.
Management
Director Center For Econ. Ed.
Director Fay. Bus. Center.

Fayetteville State University Office of Institutional Research 07/06/2009 13
Academic Program Inventory, 2009Fayetteville State University
===============================================================================================Discipline Division, CIP Code, CIP Discipline, Discipline Division, CIP Code, CIP Discipline,Degree Abbreviation, and Degree Program Title Degree Abbreviation, and Degree Program Title
____________________________________________________________________________________________________________
090101 Communication Studies/Speech Communication andRhetoric 090101 018 000 A BA Communication
110701 Computer Science
110701 027 000 A BS Computer Science
130401 Educational Leadership and Administration, General
130401 124 047 A MSA School Administration
130401 403 048 A EdD Educational Leadership
131202 Elementary Education and Teaching
131202 027 017 A BS Elementary Education (K-6)
131203 Junior High/Intermediate/Middle School Education andTeaching 131203 027 200 A BS Middle Grades (6-9)
131210 Early Childhood Education and Teaching (NEW)
131210 027 000 A BS Birth-Kindergarten
131299 Teacher Education and Professional Development,Specific Levels and Methods, Other 131299 106 300 A MAT Master of Arts in Teaching
131299 109 400 A MEd Master of Education
131302 Art Teacher Education
131302 027 000 A BS Art Education
131305 English/Language Arts Teacher Education
131305 027 018 A BS English Language and Literature, SecondaryEducation
131311 Mathematics Teacher Education
131311 027 034 A BS Mathematics, Secondary Education
131312 Music Teacher Education
131312 027 039 A BS Music Education (K-12)
131314 Physical Education Teaching and Coaching
131314 027 040 A BS Physical Education (K-12)
131317 Social Science Teacher Education
131317 027 053 A BS Social Sciences, Secondary Education
131322 Biology Teacher Education
131322 027 007 A BS Biology, Secondary Education
131330 Spanish Language Teacher Education
131330 027 055 A BS Spanish Education (K-12)
160905 Spanish Language and Literature
160905 018 000 A BA Spanish
230101 English Language and Literature, General
230101 001 000 A 1C Professional Writing Certificate
230101 018 000 A BA English, Language and Literature
230101 102 000 A MA English
260101 Biology/Biological Sciences, General
260101 027 000 A BS Biology
260101 123 000 A MS Biology
261201 Biotechnology
261201 027 000 A BS Biotechnology
270101 Mathematics, General
270101 027 000 A BS Mathematics
270101 123 000 A MS Mathematics
Fayetteville State University Office of Institutional Research 07/06/2009 14
Academic Program Inventory, 2009Fayetteville State University
===============================================================================================Discipline Division, CIP Code, CIP Discipline, Discipline Division, CIP Code, CIP Discipline,Degree Abbreviation, and Degree Program Title Degree Abbreviation, and Degree Program Title
____________________________________________________________________________________________________________
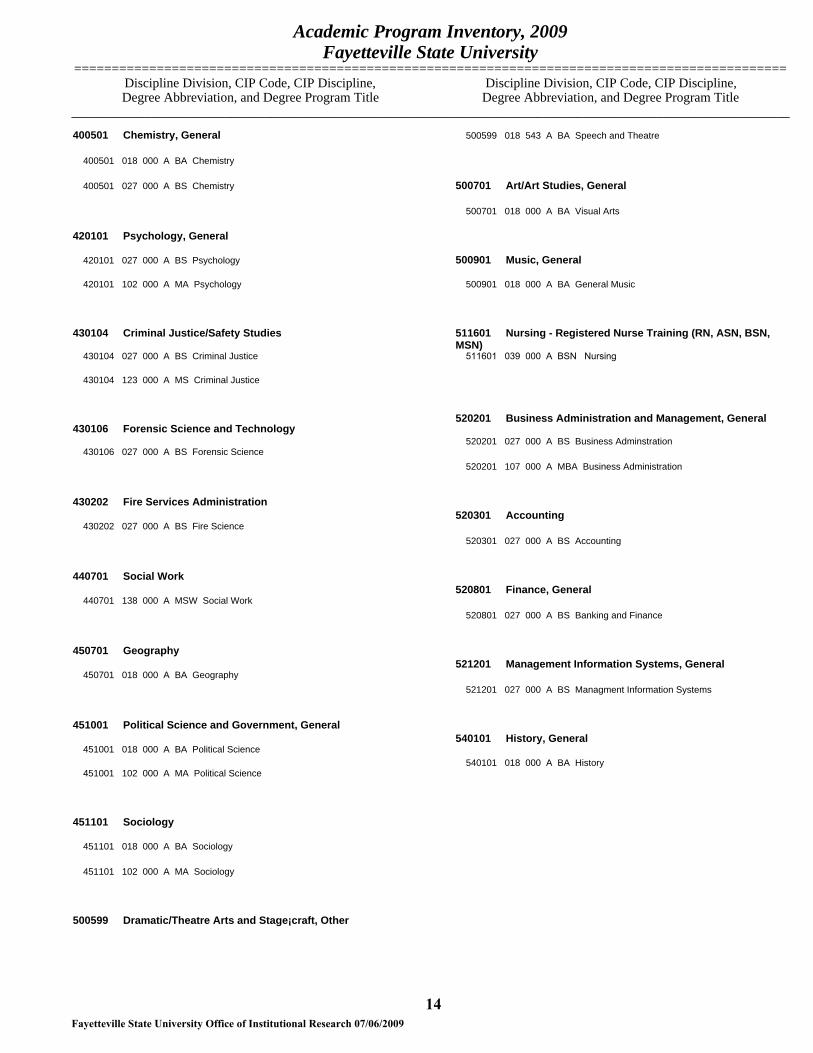
400501 Chemistry, General
400501 018 000 A BA Chemistry
400501 027 000 A BS Chemistry
420101 Psychology, General
420101 027 000 A BS Psychology
420101 102 000 A MA Psychology
430104 Criminal Justice/Safety Studies
430104 027 000 A BS Criminal Justice
430104 123 000 A MS Criminal Justice
430106 Forensic Science and Technology
430106 027 000 A BS Forensic Science
430202 Fire Services Administration
430202 027 000 A BS Fire Science
440701 Social Work
440701 138 000 A MSW Social Work
450701 Geography
450701 018 000 A BA Geography
451001 Political Science and Government, General
451001 018 000 A BA Political Science
451001 102 000 A MA Political Science
451101 Sociology
451101 018 000 A BA Sociology
451101 102 000 A MA Sociology
500599 Dramatic/Theatre Arts and Stage¡craft, Other
500599 018 543 A BA Speech and Theatre
500701 Art/Art Studies, General
500701 018 000 A BA Visual Arts
500901 Music, General
500901 018 000 A BA General Music
511601 Nursing - Registered Nurse Training (RN, ASN, BSN,MSN) 511601 039 000 A BSN Nursing
520201 Business Administration and Management, General
520201 027 000 A BS Business Adminstration
520201 107 000 A MBA Business Administration
520301 Accounting
520301 027 000 A BS Accounting
520801 Finance, General
520801 027 000 A BS Banking and Finance
521201 Management Information Systems, General
521201 027 000 A BS Managment Information Systems
540101 History, General
540101 018 000 A BA History

Finances
In order to make textbooks more affordable to our students, Fayetteville State University reinstated a Textbook Rental Program beginning with the fall semester 2008. This program includes an across the board charge to all students and allows for a two year textbook adoption policy for faculty members. An exception is added to apply to graduate students only.
Students
Fayetteville State University

16 Fayetteville State University
Office of Institutional Research 07/06/2009
Narrative Summary of Student Data Fall 2008 First Time Freshmen Applications: 1,524 first time freshmen were accepted from a pool of 2,361 applicants for a 64% acceptance rate. Undergraduate Transfer Applications: 945 undergraduate transfer students were accepted from a pool of 1,123 applicants for an 84% acceptance rate. Graduate Applications: 151 graduate applicants were accepted from a pool of 170 applicants for an 89% acceptance rate. First Time Freshmen Enrolled: 582 first time freshmen were enrolled from a pool of 1,524 accepted (or 38%). Males represented 38% of first time enrolled freshmen, higher than the 31% of males who `represented the total student population. Ninety-two percent of first time freshmen enrolled had in-state residency. Ninety-five percent of total enrolled students had in-state residency. Whites and Blacks composed 90% percent of first time freshmen enrolled. Blacks composed 85% percent of the first time enrolled freshmen, higher than the 72% of Blacks representing total enrollment for the same period. The typical first time freshmen enrolled student was female (62%), under 20 (98%), in-state (92%), and Black (85%). Most first time enrolled freshmen (85%) had an SAT score of 1000 or less and a HSGPA ranging between 2.01 and 3.00 (58%). Total Student Enrollment: The total enrollment of 6,217 decreased by 475 (8.0%) from Fall 2007. During Fall 2003 - Fall 2008 total enrollment ranged from 5,040 to 6,217. Sixty-nine percent of the student population was female. Black enrollment was 72% and White individuals represented 17%. Ninety-five percent of the students were from North Carolina, 42% were non-traditional students over the age of 24, and 83% were undergraduates. Seventy-six percent of all students were commuters. The typical enrolled student was female (69%), under 25 (58%), in-state (95%), and Black (72%). Degrees Awarded 2007-2008: Top three undergraduate degrees awarded were Criminal Justice (99) Business Administration (99), and Psychology (92). Of 23 graduate programs, the top three were Master of Education (54), Master of Social Work (28), and Master of School Administration (20).
17 Fayetteville State University
Office of Institutional Research 07/06/2009
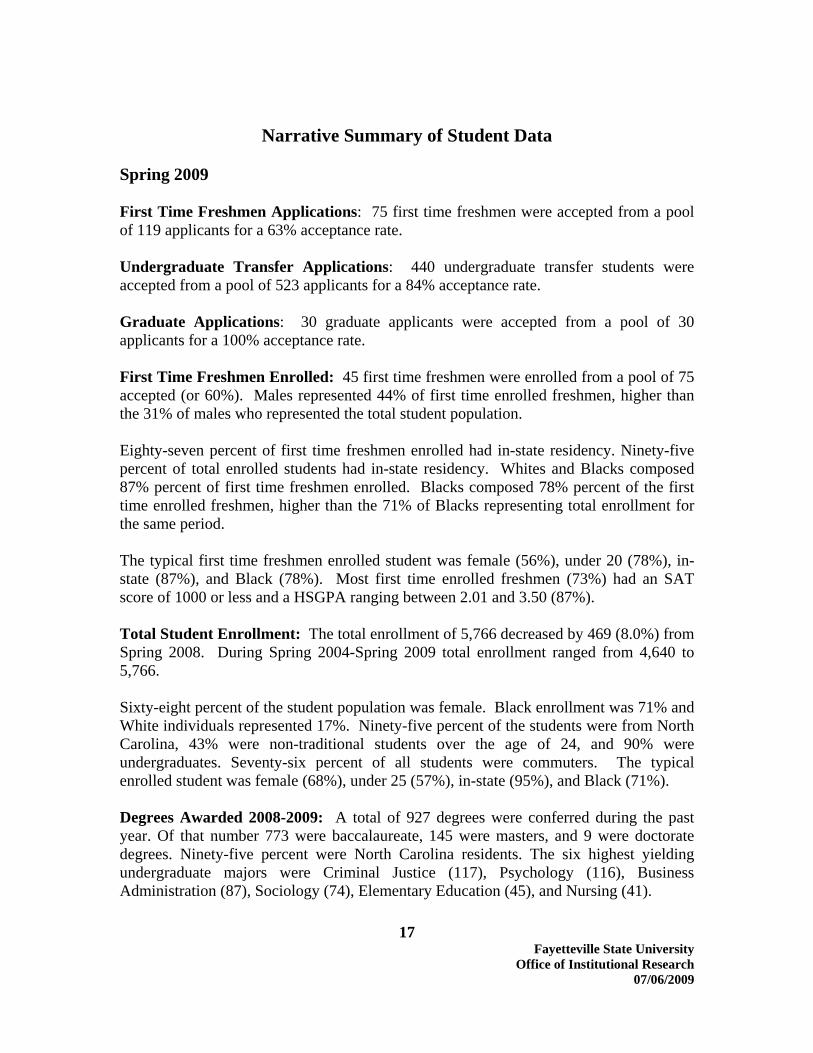
Narrative Summary of Student Data Spring 2009 First Time Freshmen Applications: 75 first time freshmen were accepted from a pool of 119 applicants for a 63% acceptance rate. Undergraduate Transfer Applications: 440 undergraduate transfer students were accepted from a pool of 523 applicants for a 84% acceptance rate. Graduate Applications: 30 graduate applicants were accepted from a pool of 30 applicants for a 100% acceptance rate. First Time Freshmen Enrolled: 45 first time freshmen were enrolled from a pool of 75 accepted (or 60%). Males represented 44% of first time enrolled freshmen, higher than the 31% of males who represented the total student population. Eighty-seven percent of first time freshmen enrolled had in-state residency. Ninety-five percent of total enrolled students had in-state residency. Whites and Blacks composed 87% percent of first time freshmen enrolled. Blacks composed 78% percent of the first time enrolled freshmen, higher than the 71% of Blacks representing total enrollment for the same period. The typical first time freshmen enrolled student was female (56%), under 20 (78%), in-state (87%), and Black (78%). Most first time enrolled freshmen (73%) had an SAT score of 1000 or less and a HSGPA ranging between 2.01 and 3.50 (87%). Total Student Enrollment: The total enrollment of 5,766 decreased by 469 (8.0%) from Spring 2008. During Spring 2004-Spring 2009 total enrollment ranged from 4,640 to 5,766. Sixty-eight percent of the student population was female. Black enrollment was 71% and White individuals represented 17%. Ninety-five percent of the students were from North Carolina, 43% were non-traditional students over the age of 24, and 90% were undergraduates. Seventy-six percent of all students were commuters. The typical enrolled student was female (68%), under 25 (57%), in-state (95%), and Black (71%). Degrees Awarded 2008-2009: A total of 927 degrees were conferred during the past year. Of that number 773 were baccalaureate, 145 were masters, and 9 were doctorate degrees. Ninety-five percent were North Carolina residents. The six highest yielding undergraduate majors were Criminal Justice (117), Psychology (116), Business Administration (87), Sociology (74), Elementary Education (45), and Nursing (41).
18 Fayetteville State University
Office of Institutional Research 07/06/2009
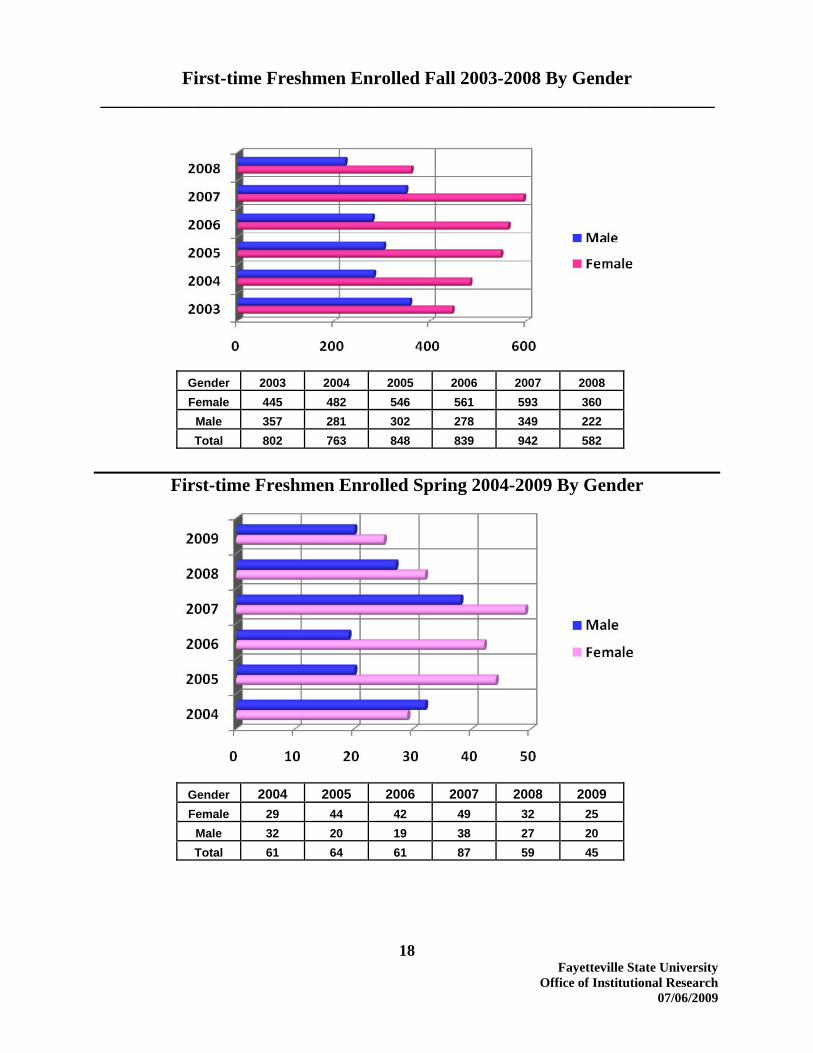
First-time Freshmen Enrolled Fall 2003-2008 By Gender __________________________________________________________________
Gender 2003 2004 2005 2006 2007 2008 Female 445 482 546 561 593 360
Male 357 281 302 278 349 222 Total 802 763 848 839 942 582
First-time Freshmen Enrolled Spring 2004-2009 By Gender
Gender 2004 2005 2006 2007 2008 2009 Female 29 44 42 49 32 25
Male 32 20 19 38 27 20 Total 61 64 61 87 59 45

19 Fayetteville State University
Office of Institutional Research 07/06/2009
First-time Freshmen Enrolled Fall 2003-2008 By Age _________________________________________________________________
Age 2003 2004 2005 2006 2007 2008 <=18 645 628 623 670 778 470
19 116 107 148 115 134 99 20 20 13 26 14 14 6 21 6 3 14 9 5 3
22-24 4 7 11 10 4 1 25-40 9 4 20 16 5 3 41-64 2 1 6 5 2 0 Total 802 763 848 839 942 582
First-time Freshmen Enrolled Spring 2004-2009 By Age
Age 2004 2005 2006 2007 2008 2009 <=18 26 37 21 50 28 18
19 19 15 19 26 22 17 20 6 1 9 3 4 3 21 3 2 5 3 1 1
22-24 5 4 4 2 2 1 25-40 2 5 3 2 2 5 41-64 0 0 0 1 0 0 Total 61 64 61 87 59 45

20 Fayetteville State University
Office of Institutional Research 07/06/2009
First-time Freshmen Enrolled Fall 2003-2008 By Residency _____________________________________________________________
Residency 2003 2004 2005 2006 2007 2008
In-State 722 624 756 770 863 537 Out-of-State 80 139 92 69 79 45
Total 802 763 848 839 942 582
First-time Freshmen Enrolled Spring 2004-2009 By Residency
Residency 2004 2005 2006 2007 2008 2009 In-State 56 56 58 80 57 39
Out-of-State 5 8 3 7 2 6 Total 61 64 61 87 59 45

21 Fayetteville State University
Office of Institutional Research 07/06/2009
First-time Freshmen Enrolled Fall 2003-2008 By Race _____________________________________________________________
Race 2003 2004 2005 2006 2007 2008 White 65 47 56 49 44 32 Black 697 663 709 684 792 494
American Indian 3 4 3 5 3 3 Asian 9 6 7 7 7 3
Hispanic 23 29 25 42 23 17 NR Alien 5 13 0 3 0 4
Missing/Other 0 1 48 49 73 29 Total 802 763 848 839 942 582
First-time Freshmen Enrolled Spring 2004-2009 By Race
Race 2004 2005 2006 2007 2008 2009 White 7 7 3 9 5 4 Black 51 51 48 67 44 35
American Indian 2 1 1 0 1 0 Asian 0 2 0 0 1 0
Hispanic 1 1 4 4 2 2 NR Alien 0 0 0 1 1 0
Missing/Other 0 2 5 6 5 4 Total 61 64 61 87 59 45

22 Fayetteville State University
Office of Institutional Research 07/06/2009
First-time Freshmen Enrolled Fall 2003-2008 By SAT Verbal _____________________________________________________________
SAT Verbal 2003 2004 2005 2006 2007 2008
>200 & <=300 15 26 29 19 16 6 >300 & <=400 280 310 353 283 380 229 >400 & <=500 395 323 326 393 397 255 >500 & <=600 104 88 92 87 87 60 >600 & <=700 8 15 10 8 5 6 Not Available 0 1 38 49 57 26
Total 802 763 848 839 942 582
First-time Freshmen Enrolled Spring 2004-2009 By SAT Verbal
SAT Verbal 2004 2005 2006 2007 2008 2009
>200 & <=300 1 3 3 3 0 0 >300 & <=400 28 26 22 34 18 9 >400 & <=500 25 26 27 32 28 25 >500 & <=600 7 7 5 10 5 4 >600 & <=700 0 1 1 2 2 0 Not Available 0 1 3 6 6 7
Total 61 64 61 87 59 45

23 Fayetteville State University
Office of Institutional Research 07/06/2009
First-time Freshmen Enrolled Fall 2003-2008 By SAT Math __________________________________________________________________
SAT Math 2003 2004 2005 2006 2007 2008
>200 & <=300 2 24 23 15 12 0 >300 & <=400 319 311 316 271 329 158 >400 & <=500 361 340 356 410 438 317 >500 & <=600 108 76 107 83 99 71 >600 & <=700 12 11 11 10 7 10 >700 & <=800 0 0 2 1 0 0 Not Available 0 1 33 49 57 26
Total 802 763 848 839 942 582
First-time Freshmen Enrolled Spring 2004-2009 By SAT Math
SAT Math 2004 2005 2006 2007 2008 2009
>200 & <=300 2 1 4 0 0 0 >300 & <=400 27 24 25 36 17 9 >400 & <=500 27 32 23 36 29 24 >500 & <=600 2 4 6 8 6 5 >600 & <=700 2 2 0 1 1 0 >700 & <=800 1 0 0 0 0 0 Not Available 0 1 3 6 6 7
Total 61 64 61 87 59 45
24 Fayetteville State University
Office of Institutional Research 07/06/2009
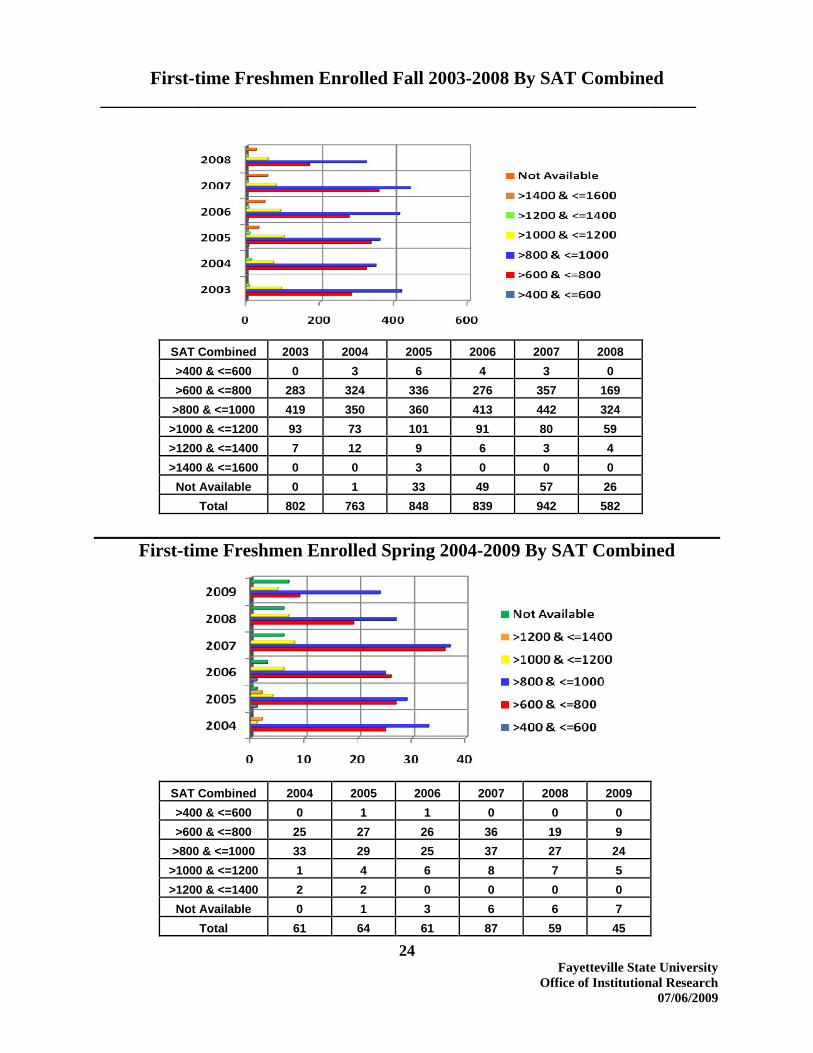
First-time Freshmen Enrolled Fall 2003-2008 By SAT Combined ________________________________________________________________
SAT Combined 2003 2004 2005 2006 2007 2008 >400 & <=600 0 3 6 4 3 0 >600 & <=800 283 324 336 276 357 169 >800 & <=1000 419 350 360 413 442 324
>1000 & <=1200 93 73 101 91 80 59 >1200 & <=1400 7 12 9 6 3 4 >1400 & <=1600 0 0 3 0 0 0
Not Available 0 1 33 49 57 26 Total 802 763 848 839 942 582
First-time Freshmen Enrolled Spring 2004-2009 By SAT Combined
SAT Combined 2004 2005 2006 2007 2008 2009 >400 & <=600 0 1 1 0 0 0 >600 & <=800 25 27 26 36 19 9 >800 & <=1000 33 29 25 37 27 24
>1000 & <=1200 1 4 6 8 7 5 >1200 & <=1400 2 2 0 0 0 0
Not Available 0 1 3 6 6 7 Total 61 64 61 87 59 45

25 Fayetteville State University
Office of Institutional Research 07/06/2009
First-time Freshmen Enrolled Fall 2003-2008 By High School GPA __________________________________________________________________
High School GPA 2003 2004 2005 2006 2007 2008
>=1.00 & <=1.5 0 0 1 0 0 0 >=1.51 & <=2.0 50 27 48 62 43 13 >=2.01 & <=2.5 243 227 234 237 318 167 >=2.51 & <=3.0 251 246 280 237 293 170 >=3.01 &<=3.5 158 152 164 194 164 139 >=3.51 & <=4.0 85 102 74 107 124 90
Missing 4 9 47 2 0 3 Error >4.00 11 0 0 0 0 0
Total 802 763 848 839 942 582
First-time Freshmen Enrolled Spring 2004-2009 By High School GPA
High School GPA 2004 2005 2006 2007 2008 2009
>=1.51 & <=2.0 4 2 7 4 4 1 >=2.01 & <=2.5 27 20 22 33 16 17 >=2.51 & <=3.0 17 19 20 26 17 11 >=3.01 &<=3.5 4 17 7 14 14 11 >=3.51 & <=4.0 2 4 4 9 4 3
Missing 7 1 1 1 4 2 Error >4.00 0 1 0 0 0 0
Total 61 64 61 87 59 45

26 Fayetteville State University
Office of Institutional Research 07/06/2009
First-time Freshmen Enrolled Fall 2003-2008 By High School Class Rank in Quintiles
__________________________________________________________________
Quintile Rank 2003 2004 2005 2006 2007 2008
0-19% 85 49 71 77 95 22 20-39% 157 151 189 200 228 138 40-59% 219 199 227 201 278 170 60-79% 179 192 191 208 189 153 80-100% 110 99 99 108 118 80
Missing/Other 52 73 71 45 34 19 Total 802 763 848 839 942 582
First-time Freshmen Enrolled Spring 2004-2009 By High School Class Rank in
Quintiles
Quintile Rank 2004 2005 2006 2007 2008 2009
0-19% 5 2 6 5 5 2 20-39% 20 16 13 24 13 16 40-59% 22 14 17 27 10 8 60-79% 5 19 10 17 20 11 80-100% 2 7 4 9 2 2
Missing/Other 7 6 11 5 9 6 Total 61 64 61 87 59 45

27 Fayetteville State University
Office of Institutional Research 07/06/2009
First-time Freshmen Enrolled Fall 2003-2008 By High School Class Rank in Quartiles
_________________________________________________________________
Quartile Rank 2003 2004 2005 2006 2007 2008
0-24% 127 74 104 113 147 50 25-49% 232 217 269 259 316 195 50-74% 244 251 269 278 291 201
75-100% 147 148 135 144 154 117 Missing/Other 52 73 71 45 34 19
Total 802 763 848 839 942 582
First-time Freshmen Enrolled Spring 2004-2009 By High School Class Rank in Quartiles
Quartile Rank 2004 2005 2006 2007 2008 2009
0-24% 8 3 11 7 9 4 25-49% 32 22 16 37 15 17 50-74% 12 23 18 27 19 12
75-100% 2 10 5 11 7 6 Missing/Other 7 6 11 5 9 6
Total 61 64 61 87 59 45
28 Fayetteville State University
Office of Institutional Research 07/06/2009
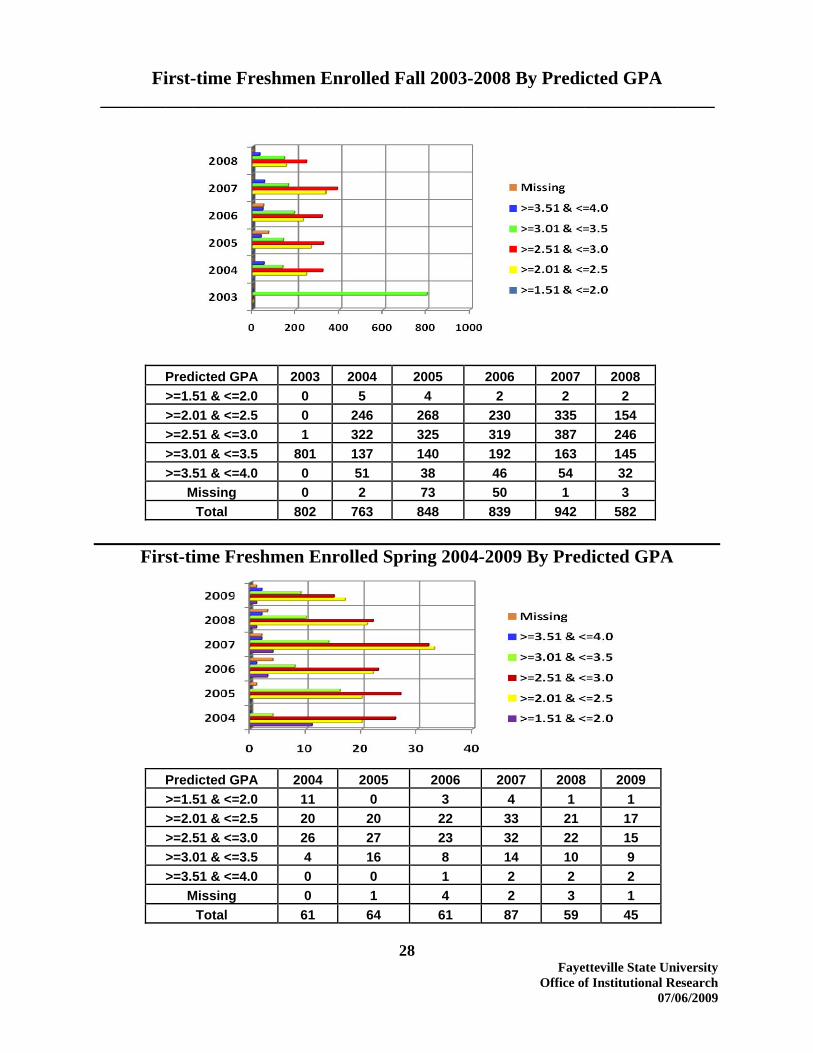
First-time Freshmen Enrolled Fall 2003-2008 By Predicted GPA __________________________________________________________________
Predicted GPA 2003 2004 2005 2006 2007 2008 >=1.51 & <=2.0 0 5 4 2 2 2 >=2.01 & <=2.5 0 246 268 230 335 154 >=2.51 & <=3.0 1 322 325 319 387 246 >=3.01 & <=3.5 801 137 140 192 163 145 >=3.51 & <=4.0 0 51 38 46 54 32
Missing 0 2 73 50 1 3 Total 802 763 848 839 942 582
First-time Freshmen Enrolled Spring 2004-2009 By Predicted GPA
Predicted GPA 2004 2005 2006 2007 2008 2009 >=1.51 & <=2.0 11 0 3 4 1 1 >=2.01 & <=2.5 20 20 22 33 21 17 >=2.51 & <=3.0 26 27 23 32 22 15 >=3.01 & <=3.5 4 16 8 14 10 9 >=3.51 & <=4.0 0 0 1 2 2 2
Missing 0 1 4 2 3 1 Total 61 64 61 87 59 45
29 Fayetteville State University
Office of Institutional Research 07/06/2009
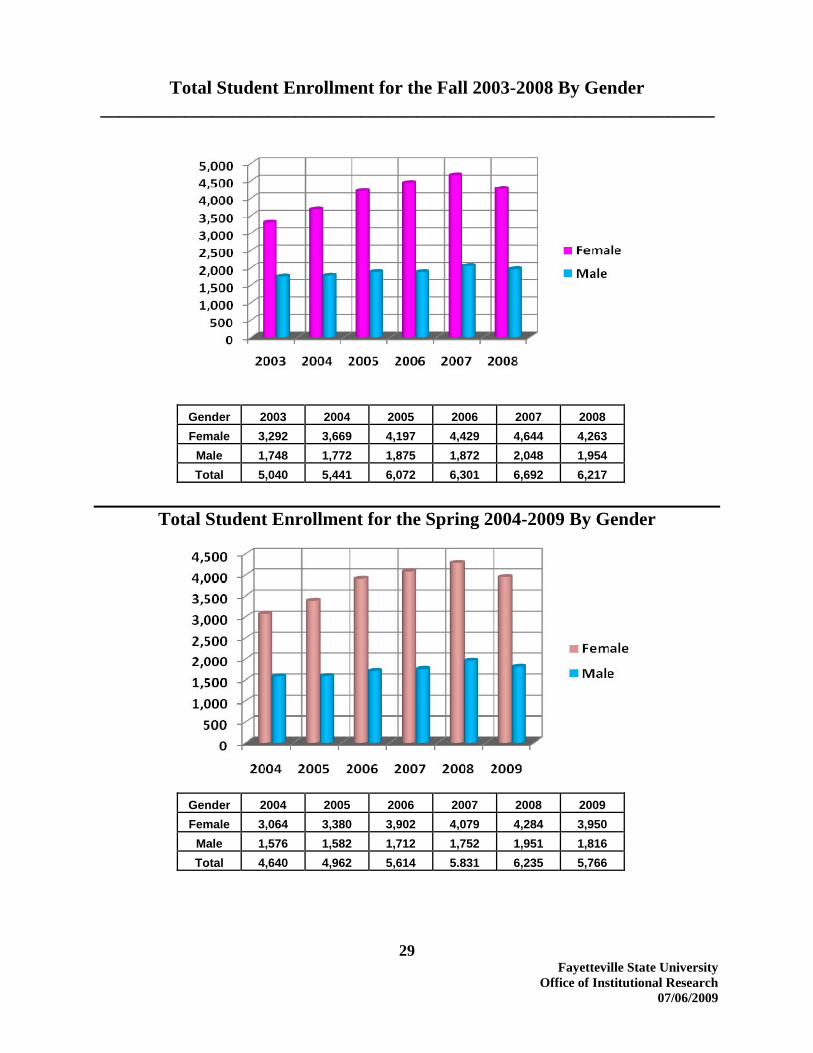
Total Student Enrollment for the Fall 2003-2008 By Gender __________________________________________________________________
Gender 2003 2004 2005 2006 2007 2008 Female 3,292 3,669 4,197 4,429 4,644 4,263
Male 1,748 1,772 1,875 1,872 2,048 1,954 Total 5,040 5,441 6,072 6,301 6,692 6,217
Total Student Enrollment for the Spring 2004-2009 By Gender
Gender 2004 2005 2006 2007 2008 2009 Female 3,064 3,380 3,902 4,079 4,284 3,950
Male 1,576 1,582 1,712 1,752 1,951 1,816 Total 4,640 4,962 5,614 5.831 6,235 5,766
30 Fayetteville State University
Office of Institutional Research 07/06/2009
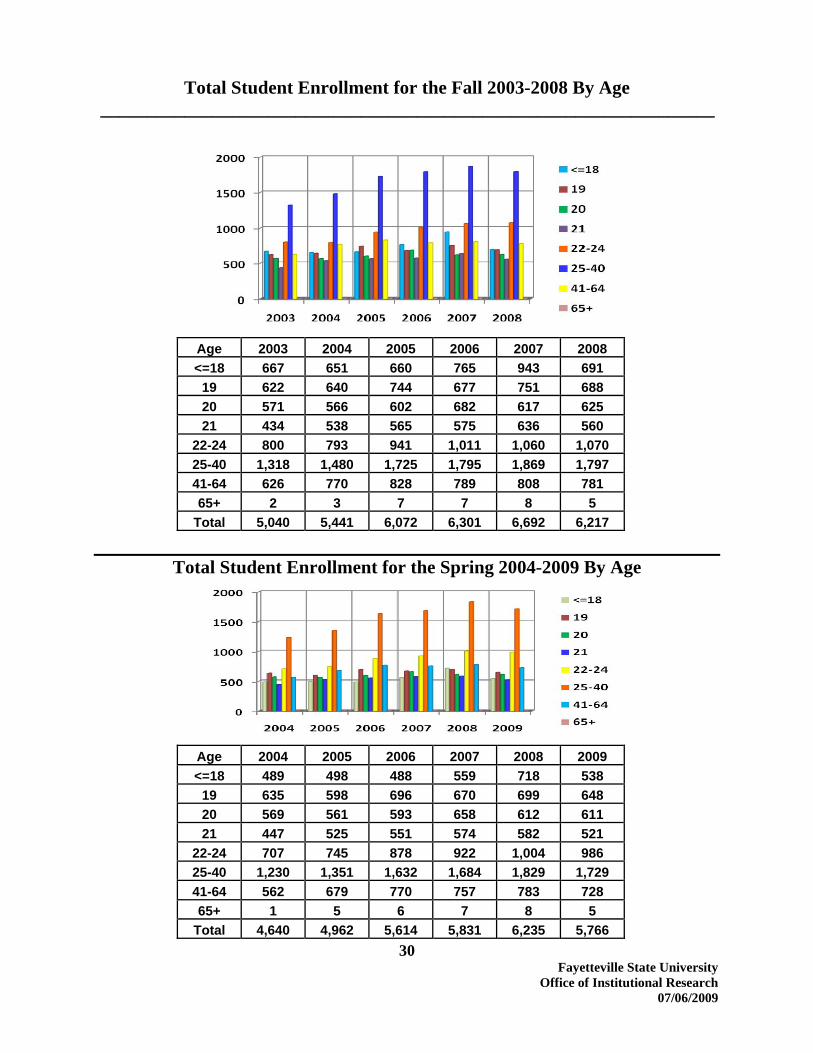
Total Student Enrollment for the Fall 2003-2008 By Age __________________________________________________________________
Age 2003 2004 2005 2006 2007 2008 <=18 667 651 660 765 943 691
19 622 640 744 677 751 688 20 571 566 602 682 617 625 21 434 538 565 575 636 560
22-24 800 793 941 1,011 1,060 1,070 25-40 1,318 1,480 1,725 1,795 1,869 1,797 41-64 626 770 828 789 808 781 65+ 2 3 7 7 8 5
Total 5,040 5,441 6,072 6,301 6,692 6,217
Total Student Enrollment for the Spring 2004-2009 By Age
Age 2004 2005 2006 2007 2008 2009 <=18 489 498 488 559 718 538
19 635 598 696 670 699 648 20 569 561 593 658 612 611 21 447 525 551 574 582 521
22-24 707 745 878 922 1,004 986 25-40 1,230 1,351 1,632 1,684 1,829 1,729 41-64 562 679 770 757 783 728 65+ 1 5 6 7 8 5
Total 4,640 4,962 5,614 5,831 6,235 5,766
31 Fayetteville State University
Office of Institutional Research 07/06/2009
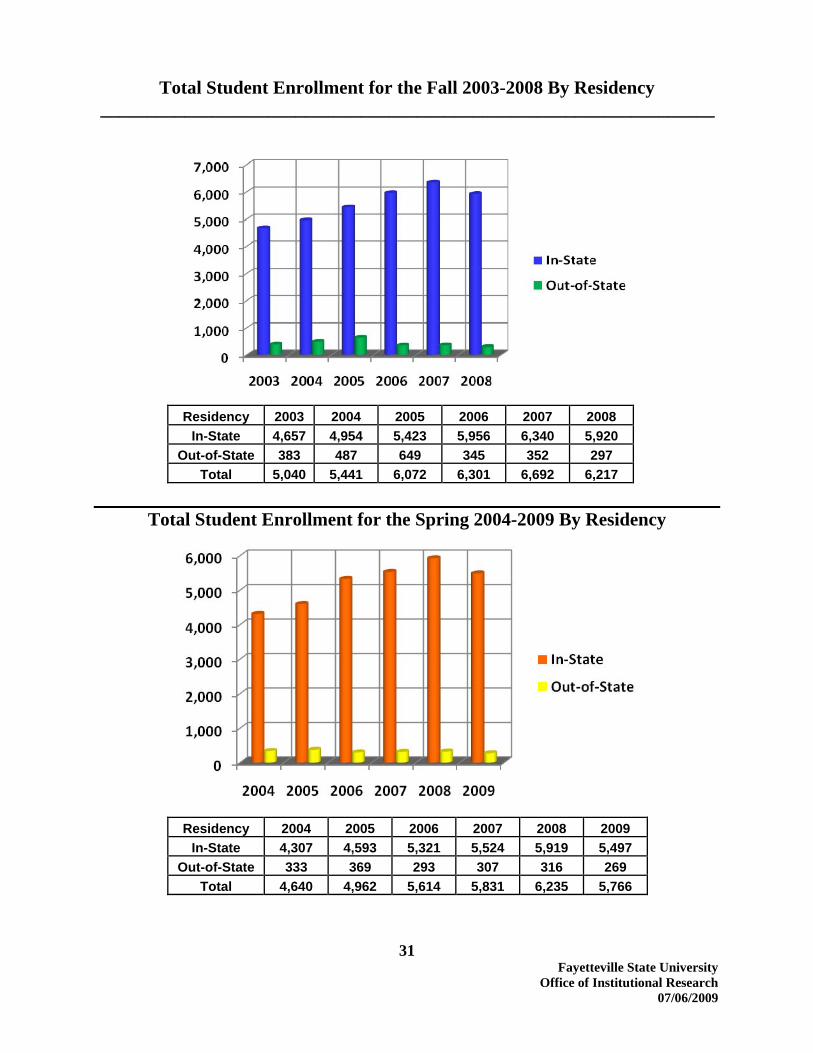
Total Student Enrollment for the Fall 2003-2008 By Residency __________________________________________________________________
Residency 2003 2004 2005 2006 2007 2008
In-State 4,657 4,954 5,423 5,956 6,340 5,920 Out-of-State 383 487 649 345 352 297
Total 5,040 5,441 6,072 6,301 6,692 6,217
Total Student Enrollment for the Spring 2004-2009 By Residency
Residency 2004 2005 2006 2007 2008 2009
In-State 4,307 4,593 5,321 5,524 5,919 5,497 Out-of-State 333 369 293 307 316 269
Total 4,640 4,962 5,614 5,831 6,235 5,766

32 Fayetteville State University
Office of Institutional Research 07/06/2009
Total Student Enrollment for the Fall 2003-2008 By Race __________________________________________________________________
Race 2003 2004 2005 2006 2007 2008 White 848 961 1,082 1,091 1,120 1,031 Black 3,857 4,079 4,457 4,544 4,799 4,459
American Indian 57 70 59 74 76 73 Asian 57 55 85 80 77 74
Hispanic 200 221 250 285 278 266 NR Alien 17 31 137 28 37 29
Missing/Other 4 24 2 199 305 285 Total 5,040 5,441 6,072 6,301 6,692 6,217
Total Student Enrollment for the Spring 2004-2009 By Race
Race 2004 2005 2006 2007 2008 2009 White 762 836 1,007 988 1,053 960 Black 3,579 3,745 4,103 4,222 4,447 4,116
American Indian 52 60 57 67 72 67 Asian 51 58 78 61 74 66
Hispanic 174 199 225 270 257 246 NR Alien 16 27 7 25 29 32
Missing/Other 6 37 137 198 303 279 Total 4,640 4,962 5,614 5,831 6,235 5,766
33 Fayetteville State University
Office of Institutional Research 07/06/2009
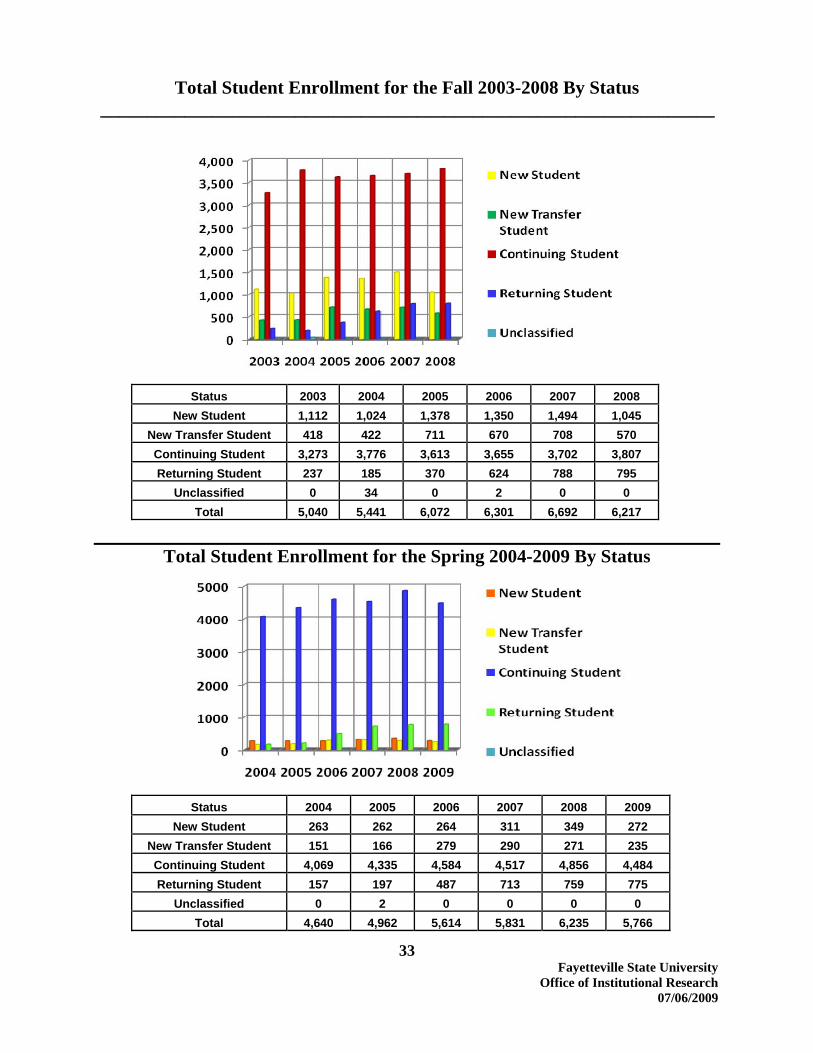
Total Student Enrollment for the Fall 2003-2008 By Status __________________________________________________________________
Status 2003 2004 2005 2006 2007 2008
New Student 1,112 1,024 1,378 1,350 1,494 1,045 New Transfer Student 418 422 711 670 708 570 Continuing Student 3,273 3,776 3,613 3,655 3,702 3,807 Returning Student 237 185 370 624 788 795
Unclassified 0 34 0 2 0 0 Total 5,040 5,441 6,072 6,301 6,692 6,217
Total Student Enrollment for the Spring 2004-2009 By Status
Status 2004 2005 2006 2007 2008 2009
New Student 263 262 264 311 349 272 New Transfer Student 151 166 279 290 271 235 Continuing Student 4,069 4,335 4,584 4,517 4,856 4,484 Returning Student 157 197 487 713 759 775
Unclassified 0 2 0 0 0 0 Total 4,640 4,962 5,614 5,831 6,235 5,766
34 Fayetteville State University
Office of Institutional Research 07/06/2009
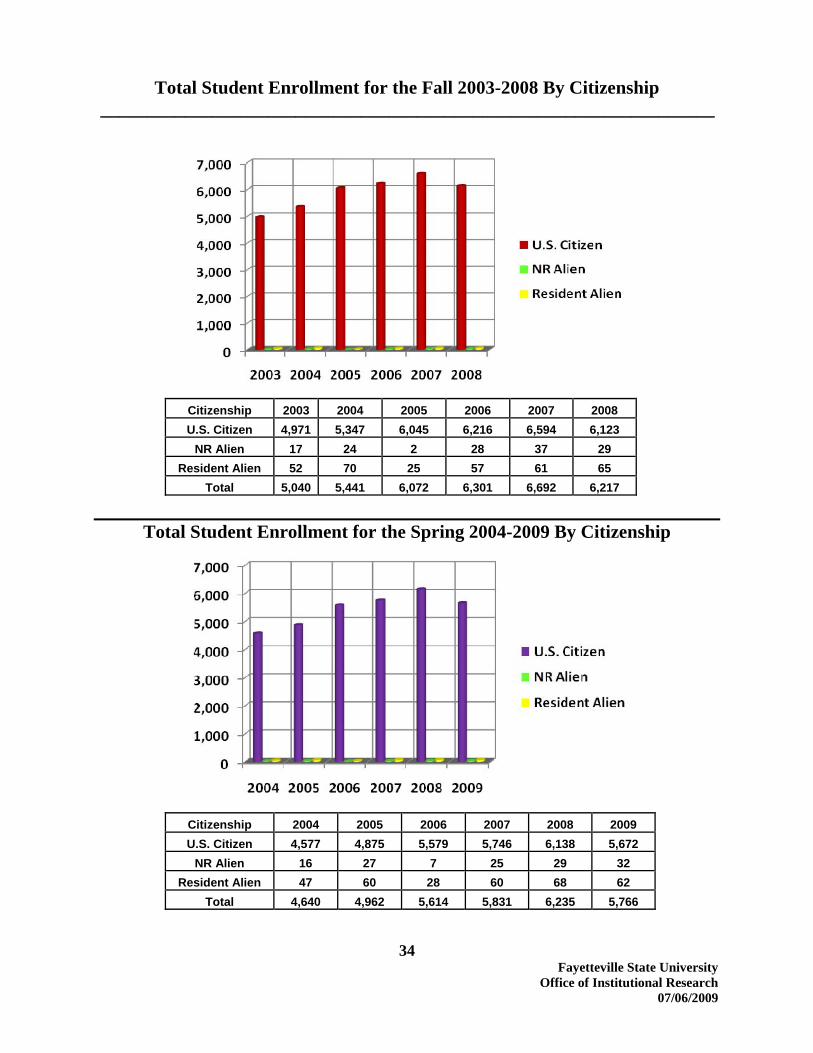
Total Student Enrollment for the Fall 2003-2008 By Citizenship __________________________________________________________________
Citizenship 2003 2004 2005 2006 2007 2008 U.S. Citizen 4,971 5,347 6,045 6,216 6,594 6,123
NR Alien 17 24 2 28 37 29 Resident Alien 52 70 25 57 61 65
Total 5,040 5,441 6,072 6,301 6,692 6,217
Total Student Enrollment for the Spring 2004-2009 By Citizenship
Citizenship 2004 2005 2006 2007 2008 2009 U.S. Citizen 4,577 4,875 5,579 5,746 6,138 5,672
NR Alien 16 27 7 25 29 32 Resident Alien 47 60 28 60 68 62
Total 4,640 4,962 5,614 5,831 6,235 5,766
35 Fayetteville State University
Office of Institutional Research 07/06/2009
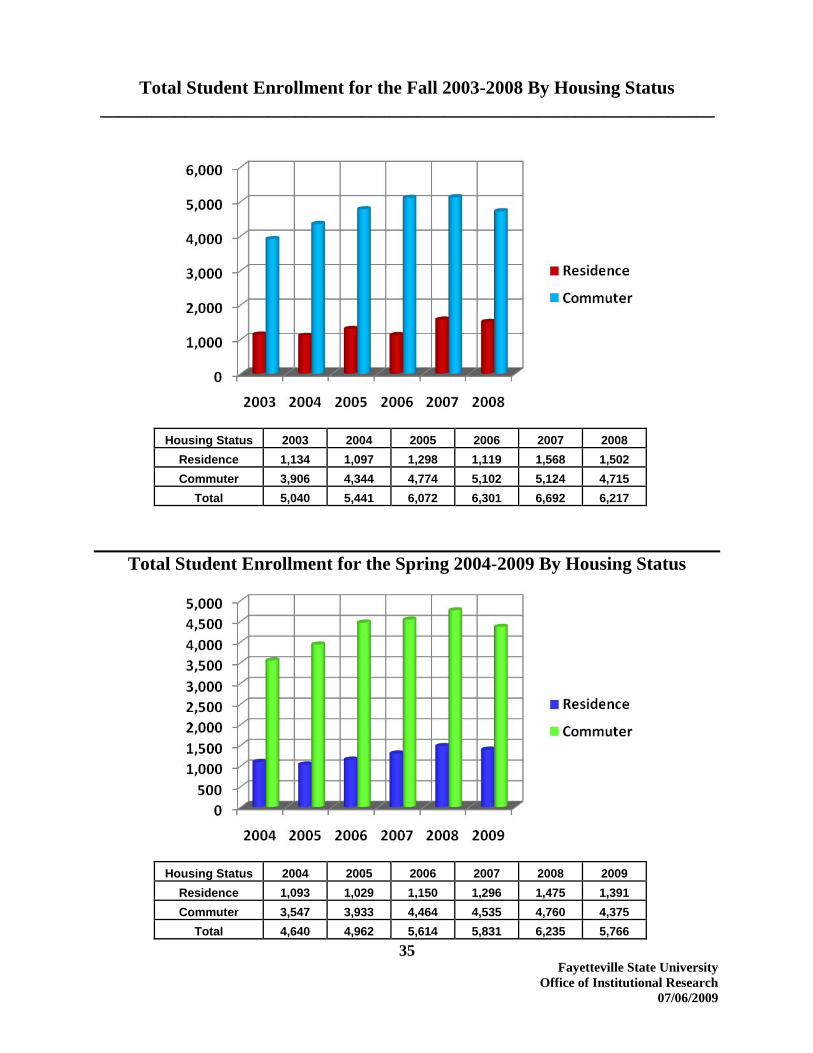
Total Student Enrollment for the Fall 2003-2008 By Housing Status __________________________________________________________________
Housing Status 2003 2004 2005 2006 2007 2008
Residence 1,134 1,097 1,298 1,119 1,568 1,502 Commuter 3,906 4,344 4,774 5,102 5,124 4,715
Total 5,040 5,441 6,072 6,301 6,692 6,217
Total Student Enrollment for the Spring 2004-2009 By Housing Status
Housing Status 2004 2005 2006 2007 2008 2009
Residence 1,093 1,029 1,150 1,296 1,475 1,391 Commuter 3,547 3,933 4,464 4,535 4,760 4,375
Total 4,640 4,962 5,614 5,831 6,235 5,766
36 Fayetteville State University
Office of Institutional Research 07/06/2009
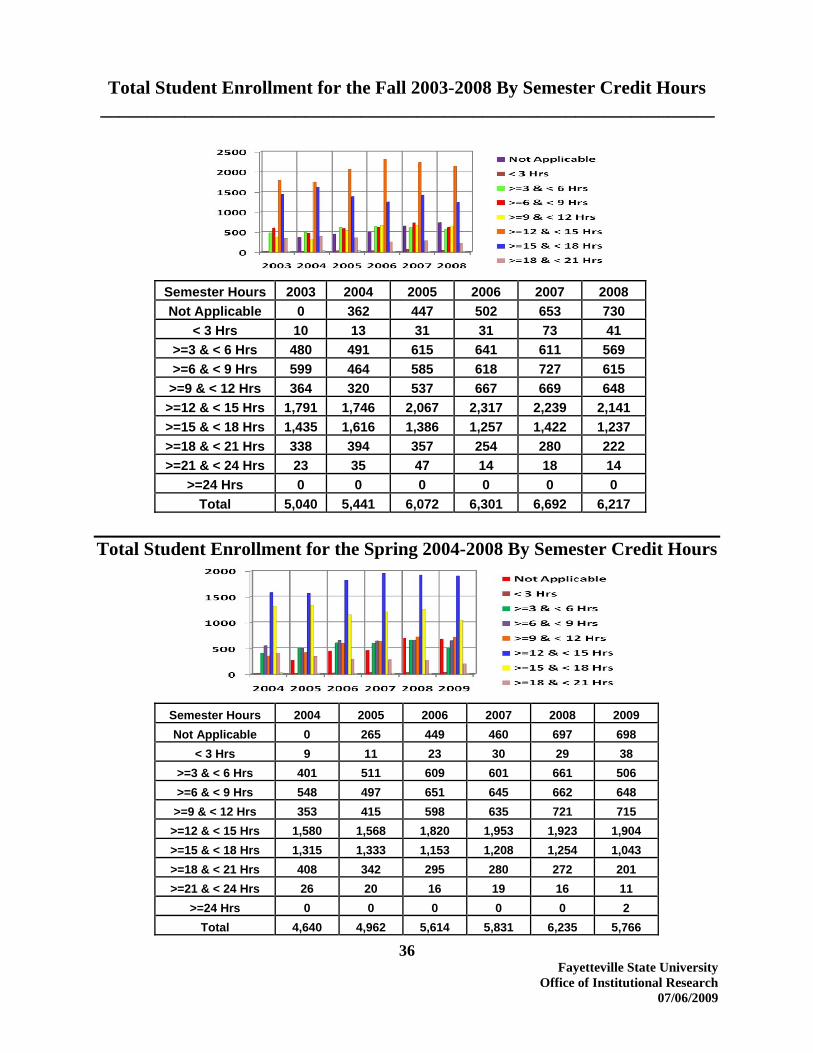
Total Student Enrollment for the Fall 2003-2008 By Semester Credit Hours __________________________________________________________________
Semester Hours 2003 2004 2005 2006 2007 2008 Not Applicable 0 362 447 502 653 730
< 3 Hrs 10 13 31 31 73 41 >=3 & < 6 Hrs 480 491 615 641 611 569 >=6 & < 9 Hrs 599 464 585 618 727 615 >=9 & < 12 Hrs 364 320 537 667 669 648 >=12 & < 15 Hrs 1,791 1,746 2,067 2,317 2,239 2,141 >=15 & < 18 Hrs 1,435 1,616 1,386 1,257 1,422 1,237 >=18 & < 21 Hrs 338 394 357 254 280 222 >=21 & < 24 Hrs 23 35 47 14 18 14
>=24 Hrs 0 0 0 0 0 0 Total 5,040 5,441 6,072 6,301 6,692 6,217
Total Student Enrollment for the Spring 2004-2008 By Semester Credit Hours
Semester Hours 2004 2005 2006 2007 2008 2009 Not Applicable 0 265 449 460 697 698
< 3 Hrs 9 11 23 30 29 38 >=3 & < 6 Hrs 401 511 609 601 661 506 >=6 & < 9 Hrs 548 497 651 645 662 648 >=9 & < 12 Hrs 353 415 598 635 721 715
>=12 & < 15 Hrs 1,580 1,568 1,820 1,953 1,923 1,904 >=15 & < 18 Hrs 1,315 1,333 1,153 1,208 1,254 1,043 >=18 & < 21 Hrs 408 342 295 280 272 201 >=21 & < 24 Hrs 26 20 16 19 16 11
>=24 Hrs 0 0 0 0 0 2 Total 4,640 4,962 5,614 5,831 6,235 5,766

37 Fayetteville State University
Office of Institutional Research 07/06/2009
Total Student Enrollment for the Fall 2003-2008 By Transfer Hours Applied Towards Degree
__________________________________________________________________
Transfer Hours 2003 2004 2005 2006 2007 2008 Not Applicable 3,344 3,963 119 1 6 0
0 Hrs 403 209 5,791 3,905 3,977 3,664 1-30 Hrs 521 447 63 869 849 737 31-60 Hrs 384 380 41 612 693 655 61-90 Hrs 290 322 41 588 738 723
Over 90 Hrs 98 120 17 326 429 438 Total 5,040 5,441 6,072 6,301 6,692 6,217
Total Student Enrollment for the Spring 2004-2009 By Transfer Hours
Applied Towards Degree
Transfer Hours 2004 2005 2006 2007 2008 2009 Not Applicable 3,253 3,321 198 19 1 1
0 Hrs 115 139 4,420 3,478 3,666 3,345 1-30 Hrs 485 546 318 830 777 695 31-60 Hrs 395 416 277 586 639 596 61-90 Hrs 296 391 249 577 713 682
Over 90 Hrs 96 149 152 341 439 447 Total 4,640 4,962 5,614 5,831 6,235 5,766

38 Fayetteville State University
Office of Institutional Research 07/06/2009
Fall 2003 Students By Classification _________________________________________________
0500
1,0001,5002,0002,5003,000
3,5004,000
Full-Time Undergraduate
Full-Time GraduatePart-Time UndergraduatePart-Time Graduate
Full-Time Part-Time Total Classification # % # % # % First-time Freshmen 794 99.0 8 1.0 802 15.9 Freshmen 638 82.6 134 17.3 772 15.3 Sophomores 728 90.4 77 9.6 805 16.0 Juniors 595 84.4 110 15.6 705 14.0 Seniors 732 68.9 331 31.1 1,063 21.1 Special/Unclassified 36 35.6 65 64.3 101 2.0 Total Undergraduate 3,523 82.9 725 17.1 4,248 84.3 Graduate Students 166 20.9 626 79 792 15.7 Total Students 3,689 73.2 1,351 26.8 5,040 100.0
Spring 2004 Students By Classification
0
5001,000
1,500
2,0002,500
3,000
3,500 Full-TimeUndergraduateFull-Time Graduate
Part-TimeUndergraduatePart-Time Graduate
Full-Time Part-Time Total Classification # % # % # % First-time Freshmen 60 98.4 1 1.6 61 1.3 Freshmen 949 92.9 73 7.1 1,022 22.0 Sophomores 800 90.9 80 9.1 880 19.0 Juniors 702 84.4 130 15.6 832 17.9 Seniors 727 71.6 289 28.4 1,016 21.9 Special/Unclassified 30 36.1 53 63.9 83 1.8 Total Undergraduate 3,268 83.9 626 16.1 3,894 83.9 Graduate Students 170 22.8 576 77.2 746 16.1 Total Students 3,438 74.1 1,202 25.9 4,640 100.0

39 Fayetteville State University
Office of Institutional Research 07/06/2009
Fall 2004 Students By Classification __________________________________________________________________
0
1000
2000
3000
4000
Part-TimeUndergraduatePart-Time Graduate
Full-TimeUndergraduateFull-TimeGraduates
Spring 2005 Students By Classification
0500
1,0001,5002,0002,5003,0003,500 Full-Time
UndergraduateFull-Time Graduate
Part-TimeUndergraduatePart-Time Graduate
Full-Time Part-Time Total Classification # % # % # % First-time Freshmen 760 99.6 3 0.4 763 14.0 Freshmen 1,349 94.5 78 5.5 1,427 26.2 Sophomores 773 88.9 97 11.1 870 16.0 Juniors 707 84.4 131 15.6 838 15.4 Seniors 867 72.7 326 27.3 1,193 21.9 Special/Unclassified 19 23.2 63 76.8 82 1.5 Total Undergraduates 3,715 84.2 695 15.8 4,410 81.1 Graduate Students 220 21.3 811 78.7 1,031 18.9 Total Students 3,935 72.3 1,506 27.7 5,441 100.0
Full-Time Part-Time Total Classification # % # % # % First-time Freshmen 60 93.7 4 6.3 64 1.3 Freshmen 898 93.1 67 6.9 965 19.4 Sophomores 798 89.1 98 10.9 896 18.1 Juniors 714 85.7 119 14.3 833 16.8 Seniors 933 77.4 272 22.6 1,205 24.3 Special/Unclassified 16 21.9 57 78.1 73 1.5 Total Undergraduates 3,419 84.7 617 15.3 4,036 81.3 Graduate Students 192 20.7 734 79.3 926 18.7 Total Students 3,611 72.8 1,351 27.2 4,962 100.0
40 Fayetteville State University
Office of Institutional Research 07/06/2009
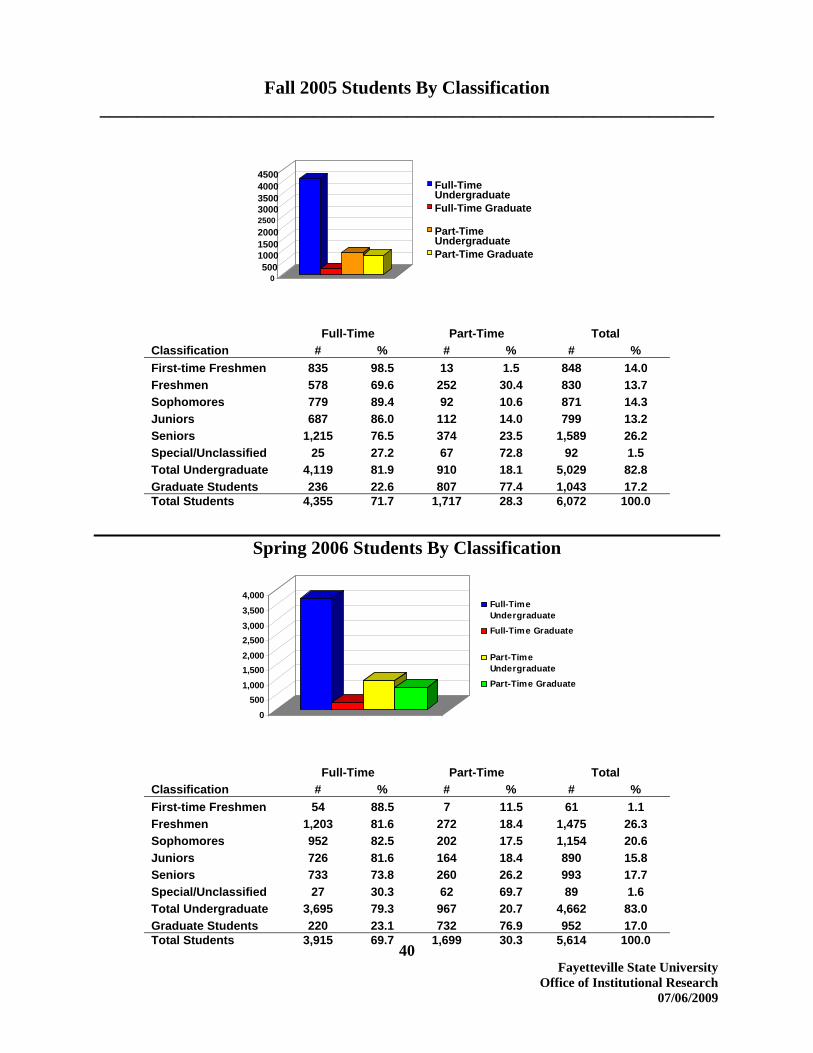
Fall 2005 Students By Classification __________________________________________________________________
Spring 2006 Students By Classification
0500
1,0001,5002,000
2,5003,000
3,5004,000
Full-TimeUndergraduateFull-Time Graduate
Part-TimeUndergraduatePart-Time Graduate
Full-Time Part-Time Total Classification # % # % # % First-time Freshmen 835 98.5 13 1.5 848 14.0 Freshmen 578 69.6 252 30.4 830 13.7 Sophomores 779 89.4 92 10.6 871 14.3 Juniors 687 86.0 112 14.0 799 13.2 Seniors 1,215 76.5 374 23.5 1,589 26.2 Special/Unclassified 25 27.2 67 72.8 92 1.5 Total Undergraduate 4,119 81.9 910 18.1 5,029 82.8 Graduate Students 236 22.6 807 77.4 1,043 17.2 Total Students 4,355 71.7 1,717 28.3 6,072 100.0
Full-Time Part-Time Total Classification # % # % # % First-time Freshmen 54 88.5 7 11.5 61 1.1 Freshmen 1,203 81.6 272 18.4 1,475 26.3 Sophomores 952 82.5 202 17.5 1,154 20.6 Juniors 726 81.6 164 18.4 890 15.8 Seniors 733 73.8 260 26.2 993 17.7 Special/Unclassified 27 30.3 62 69.7 89 1.6 Total Undergraduate 3,695 79.3 967 20.7 4,662 83.0 Graduate Students 220 23.1 732 76.9 952 17.0 Total Students 3,915 69.7 1,699 30.3 5,614 100.0
0500
1000150020002500 3000350040004500
Full-TimeUndergraduateFull-Time Graduate
Part-TimeUndergraduatePart-Time Graduate

41 Fayetteville State University
Office of Institutional Research 07/06/2009
Fall 2006 Students By Classification _____________________________________________________________________
Spring 2007 Students By Classification
0500
1,000
1,5002,000
2,5003,000
3,500
4,000Full-TimeUndergraduateFull-Time Graduate
Part-TimeUndergraduatePart-Time Graduate
Full-Time Part-Time Total Classification # % # % # % First-time Freshmen 823 98.1 16 1.9 839 13.3 Freshmen 629 82.8 131 17.2 760 12.1 Sophomores 928 84.7 167 15.2 1,095 17.4 Juniors 832 78.2 232 21.8 1,064 16.9 Seniors 1,034 69.7 449 30.3 1,483 23.5 Special/Unclassified 14 8.9 144 91.1 158 2.5 Total Undergraduate 4,260 78.9 1,139 21.1 5,399 85.7 Graduate Students 236 26.2 666 73.8 902 14.3 Total Students 4,496 71.3 1,805 28.6 6,301 100.0
Full-Time Part-Time Total Classification # % # % # % First-time Freshmen 78 89.7 9 10.3 87 1.5 Freshmen 1,034 89.7 119 10.3 1,153 19.8 Sophomores 928 86.4 146 13.6 1,074 18.4 Juniors 835 79.3 218 20.7 1,053 18.1 Seniors 1,069 70.3 452 29.7 1,521 26.1 Special/Unclassified 19 10.5 161 89.5 180 3.1 Total Undergraduate 3,963 78.2 1,105 21.8 5,068 86.9 Graduate Students 195 25.6 568 74.4 763 13.1 Total Students 4,158 71.3 1,673 28.7 5,831 100.0
0500
1000 1500200025003000350040004500
Full-Time Undergraduate Full-Time GraduatePart-Time Undergraduate Part-Time Graduate
42 Fayetteville State University
Office of Institutional Research 07/06/2009
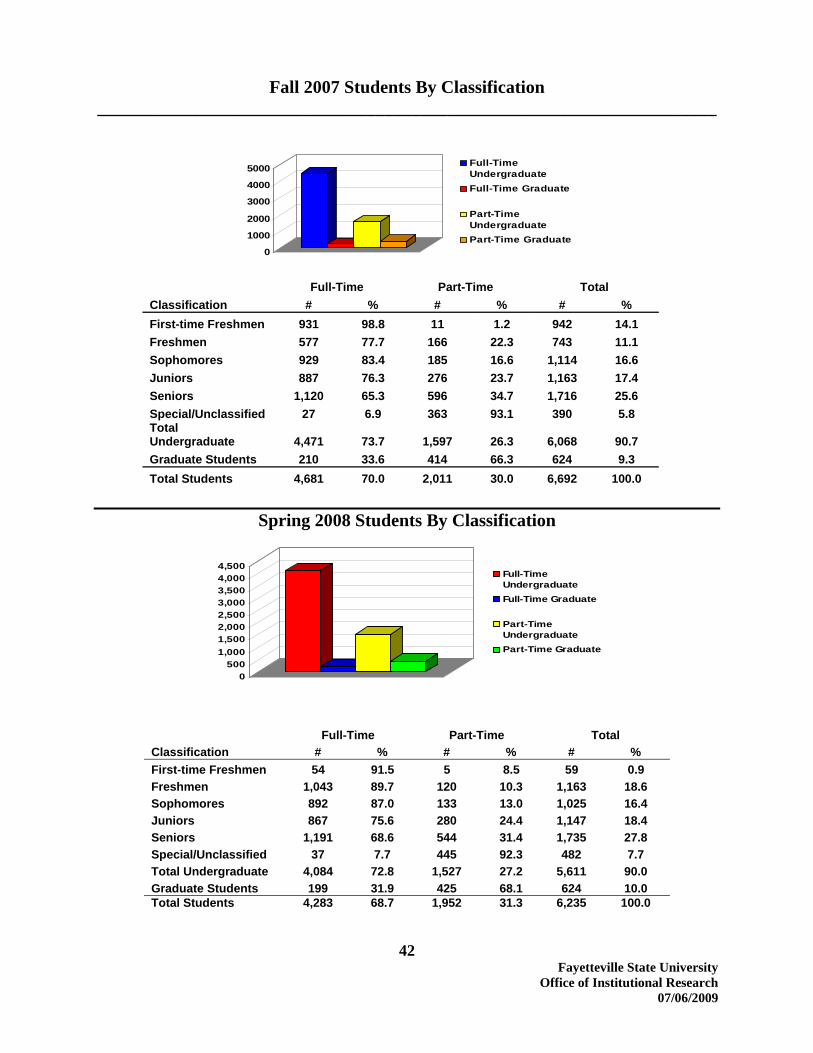
Fall 2007 Students By Classification _____________________________________________________________________
0
1000
2000
3000
4000
5000 Full-TimeUndergraduateFull-Time Graduate
Part-TimeUndergraduatePart-Time Graduate
Full-Time Part-Time Total Classification # % # % # % First-time Freshmen 931 98.8 11 1.2 942 14.1 Freshmen 577 77.7 166 22.3 743 11.1 Sophomores 929 83.4 185 16.6 1,114 16.6 Juniors 887 76.3 276 23.7 1,163 17.4 Seniors 1,120 65.3 596 34.7 1,716 25.6 Special/Unclassified 27 6.9 363 93.1 390 5.8 Total Undergraduate 4,471 73.7 1,597 26.3 6,068 90.7 Graduate Students 210 33.6 414 66.3 624 9.3 Total Students 4,681 70.0 2,011 30.0 6,692 100.0
Spring 2008 Students By Classification
0500
1,0001,5002,0002,5003,0003,5004,0004,500
Full-TimeUndergraduateFull-Time Graduate
Part-TimeUndergraduatePart-Time Graduate
Full-Time Part-Time Total Classification # % # % # % First-time Freshmen 54 91.5 5 8.5 59 0.9 Freshmen 1,043 89.7 120 10.3 1,163 18.6 Sophomores 892 87.0 133 13.0 1,025 16.4 Juniors 867 75.6 280 24.4 1,147 18.4 Seniors 1,191 68.6 544 31.4 1,735 27.8 Special/Unclassified 37 7.7 445 92.3 482 7.7 Total Undergraduate 4,084 72.8 1,527 27.2 5,611 90.0 Graduate Students 199 31.9 425 68.1 624 10.0 Total Students 4,283 68.7 1,952 31.3 6,235 100.0
43 Fayetteville State University
Office of Institutional Research 07/06/2009
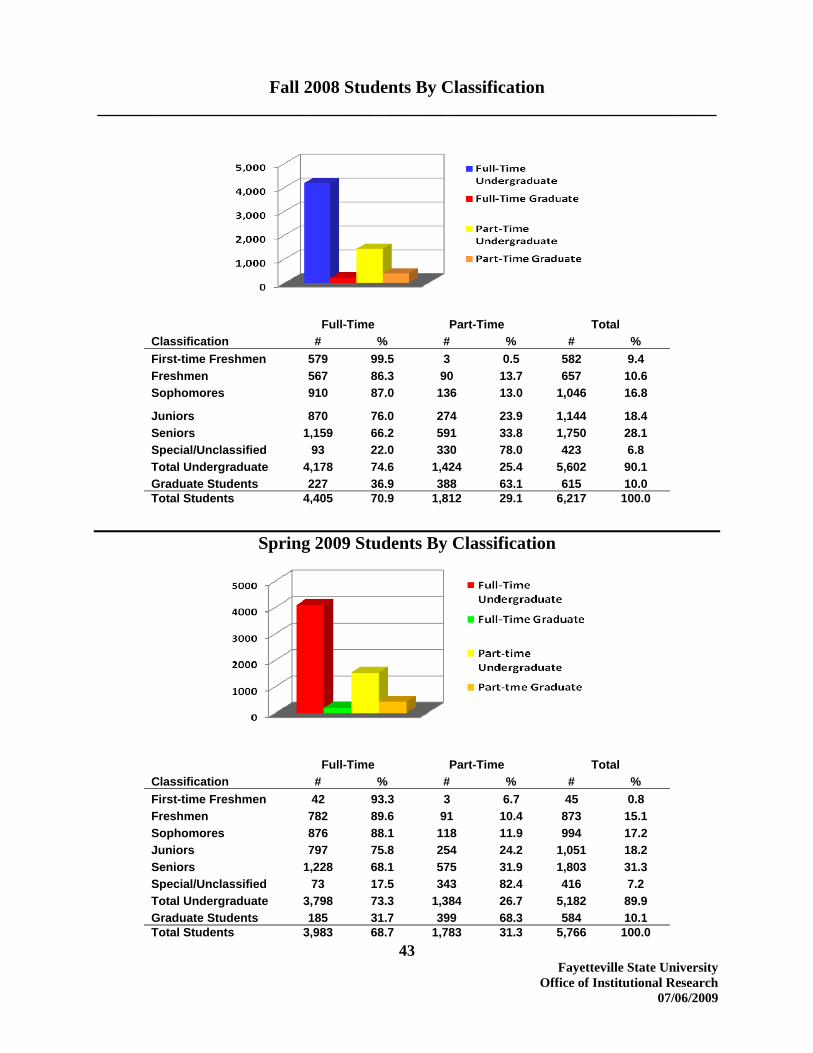
Fall 2008 Students By Classification _____________________________________________________________________
Spring 2009 Students By Classification
Full-Time Part-Time Total Classification # % # % # % First-time Freshmen 579 99.5 3 0.5 582 9.4 Freshmen 567 86.3 90 13.7 657 10.6 Sophomores 910 87.0 136 13.0 1,046 16.8
Juniors 870 76.0 274 23.9 1,144 18.4 Seniors 1,159 66.2 591 33.8 1,750 28.1 Special/Unclassified 93 22.0 330 78.0 423 6.8 Total Undergraduate 4,178 74.6 1,424 25.4 5,602 90.1 Graduate Students 227 36.9 388 63.1 615 10.0 Total Students 4,405 70.9 1,812 29.1 6,217 100.0
Full-Time Part-Time Total Classification # % # % # % First-time Freshmen 42 93.3 3 6.7 45 0.8 Freshmen 782 89.6 91 10.4 873 15.1 Sophomores 876 88.1 118 11.9 994 17.2 Juniors 797 75.8 254 24.2 1,051 18.2 Seniors 1,228 68.1 575 31.9 1,803 31.3 Special/Unclassified 73 17.5 343 82.4 416 7.2 Total Undergraduate 3,798 73.3 1,384 26.7 5,182 89.9 Graduate Students 185 31.7 399 68.3 584 10.1 Total Students 3,983 68.7 1,783 31.3 5,766 100.0

______
1
1
2
2
MajCSCEDUSPAENGBIOMACHEPSYCRJ
SOCSPEHeaNURBADHISUNDTot
Fall 200_________
0
500
1000
1500
2000
2500
jor Title CI CompUC EducAN SpanGL Engli
OL BioloATH Mathe
EM ChemYC PsychJC Crimi
CI SocioScien
EE Speecalth HealtRS NursiDM Busin
ST HistoDC Undetal
03-2005 E_________
2003
puter Sciencation ish Languagsh Languagegy ematics
mistry hology inal Justice ology/Geogrance/History* ch/Theater/Vh Professioning ness Adminisory* ecided
nrolled St__________
2
ce
ge e
aphy/Politica
Visual Arts ns
stration
44
tudents Un_________
2004
al
ndergradu_________
*He
2005
200164721632234291829
3510330
620
1624,24
FayetteviOffice of Ins
uate By M_________
ealth Professions *Nursing *Histo
5
03 200467 186 74 535 1 21 3 69 24 243 4 30 9 38 88 274 97 397
59 305 06 121 3 0
0 127 26 764 0 78 27 1,22248 4,410
ille State Univstitutional Res
07/06
Major _________
Not Applicable fNot Applicable fry Separated Aft
CSCI
EDUC
SPAN
ENGL
BIOL
MATH
CHEM
PSYC
CRJC
SOCI
SPEE
Health
NURS
2005 134 493 15 48 170 4 28 256 315
261 138 0 87 579 71
2 2,430 0 5,029
versity search 6/2009
____
for 2004 for 2003 ter 2004

45 Fayetteville State University
Office of Institutional Research 07/06/2009
Fall 2006-2008 Enrolled Students Undergraduate By Major __________________________________________________________________
Major Title 2006 2007 2008
COMM Communication Studies/Speech Comm* 0 37 40
CSCI Computer Science 80 69 38 EDUC Education 339 426 579 SPAN Spanish Language 16 13 4 ENGL English Language 54 46 50 BIOL Biology 145 151 216 MATH Mathematics 14 18 13 CHEM Chemistry 24 29 14 PSYC Psychology 253 269 414 CRJC Criminal Justice 243 283 382 SWRK Social Work 0 1 0
SOCI Sociology/Geography/Political Science 290 258 295
SPEE Speech/Theater/Visual Arts 104 68 64 NURS Nursing 172 285 169 BADM Business Administration 511 485 475 HIST History 91 74 69 UNDC Undecided 3,063 3,556 2,780 Total 5,399 6,068 5,602 *Communication Studies Not Applicable Before 2007

46 Fayetteville State University
Office of Institutional Research 07/06/2009
Fall 2003-2005 Enrolled Students Graduate By Major __________________________________________________________________
Major Title 2003 2004 2005 EDUC Education 199 225 173 ENGL English Language 14 13 8 BIOL Biology 12 11 9 MATH Mathematics 11 10 0 PSYC Psychology 38 31 30 SWRK Social Work* 0 38 46
SOCI Sociology/Geography/Political Science/History* 65 42 24
BADM Business Administration 55 38 54 HIST History 0 8 7 PROF Professional Development 398 615 692 Total 792 1,031 1,043
*History Separated After 2004
*Social Work Not Applicable Before 2004

47 Fayetteville State University
Office of Institutional Research 07/06/2009
Fall 2006-2008 Enrolled Students Graduate By Major __________________________________________________________________
Major Title 2006 2007 2008 EDUC Education 202 214 181 ENGL English Language 7 9 7 BIOL Biology 13 10 5 MATH Mathematics 5 8 5 PSYC Psychology 42 39 44 CRJC Criminal Justice 20 22 24 SWRK Social Work 62 70 96 SOCI Sociology/Geography/Political Science 28 25 19 BADM Business Administration 62 57 48 HIST History 6 5 1 PROF Professional Development 455 165 185 Total 902 624 615

48 Fayetteville State University
Office of Institutional Research 07/06/2009
Spring 2004-2006 Enrolled Students Undergraduate By Major __________________________________________________________________
*Health Professions Not Applicable for 2004/2005 *Nursing Not Applicable for 2003 *History Separated After 2004
Major Title 2004 2005 2006 CSCI Computer Science 137 163 0 EDUC Education 464 569 113 SPAN Spanish Language 18 22 410 ENGL English Language 60 64 11 BIOL Biology 211 213 34 MATH Mathematics 28 27 128 CHEM Chemistry 31 37 8 PSYC Psychology 192 256 24 CRJC Criminal Justice 313 367 224
SOCI Sociology/Geography/Political Science/History* 350 297 279
SPEE Speech/Theater/Visual Arts 109 152 268 HEALTH Health Professions* 0 0 122 NURS Nursing* 31 106 63 BADM Business Administration 579 735 465 HIST History* 0 79 61 UNDC Undecided 1,371 949 2,452 Total 3,894 4,036 4,662

49 Fayetteville State University
Office of Institutional Research 07/06/2009
Spring 2007-2009 Enrolled Students Undergraduate By Major __________________________________________________________________
Major Title 2007 2008 2009 COMM Communication Studies/Speech Comm* 0 83 114 CSCI Computer Science 71 89 91 EDUC Education 348 692 672 SPAN Spanish Language 20 18 17 ENGL English Language 47 50 48 BIOL Biology 155 206 227 MATH Mathematics 16 38 35 CHEM Chemistry 26 39 31 PSYC Psychology 258 351 398 CRJC Criminal Justice 270 399 444 SOCI Sociology/Geography/Political Science 277 341 344 SPEE Speech/Theater/Visual Arts 86 85 96 NURS Nursing 329 342 270 BADM Business Administration 472 564 561 HIST History 91 78 60 UNDC Undecided 2,602 2,236 1774 Total 5,068 5,611 5182
*Communication Studies Not Applicable for 2006/2007

50 Fayetteville State University
Office of Institutional Research 07/06/2009
Spring 2004-2006 Enrolled Students Graduate By Major __________________________________________________________________
Major Title 2004 2005 2006 CSCI Computer Science* 0 1 0 EDUC Education 200 190 169 ENGL English Language 11 9 4 BIOL Biology 9 9 7 MATH Mathematics 8 6 3 PSYC Psychology 32 31 32 SWRK Social Work* 0 35 45
SOCI Sociology/Geography/Political Science/History 61 28 20
BADM Business Administration 40 38 47 HIST History* 0 8 6 PROF Professional Development 385 571 619 Total 746 926 952
* Computer Science Only Applicable for 2005
* Social Work Not Applicable for 2003/2004 *History Separated After 2004
51 Fayetteville State University
Office of Institutional Research 07/06/2009
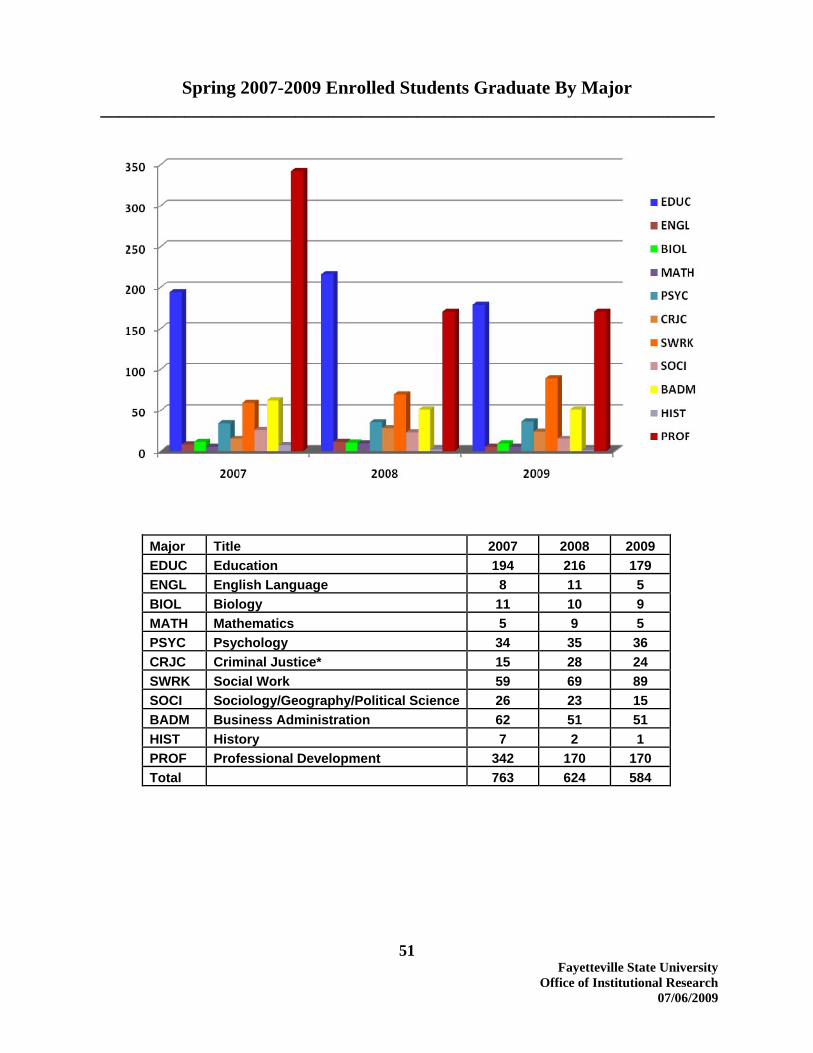
Spring 2007-2009 Enrolled Students Graduate By Major __________________________________________________________________
Major Title 2007 2008 2009 EDUC Education 194 216 179 ENGL English Language 8 11 5 BIOL Biology 11 10 9 MATH Mathematics 5 9 5 PSYC Psychology 34 35 36 CRJC Criminal Justice* 15 28 24 SWRK Social Work 59 69 89 SOCI Sociology/Geography/Political Science 26 23 15 BADM Business Administration 62 51 51 HIST History 7 2 1 PROF Professional Development 342 170 170 Total 763 624 584

Fall 03 Spr 04 Fall 04 Spr 05 Fall 05 Spr 06 Fall 06 Spr 07 Fall 07 Fall 08 Spr 09090101 Communication Studies/Speech Commun 018 BA . . . . . . . . 15 16 76110701 Computer Science 027 BS 95 81 93 87 94 71 55 54 55 11 53
124 MSA 63 61 61 62 58 55 63 61 56 48 45403 EdD 43 37 48 40 45 40 45 44 51 44 45
131005 Education/Teaching of Individuals with Emotional Disturbances 104 MAEd . . . 0 0 0 0 0 0 0 0131006 Education/Teaching of Individuals with Mental Retardation 104 MAEd . . . 0 0 0 0 0 0 0 0131011 Education/Teaching of Individuals with Specific Learning Dis. 104 MAEd . . . 0 0 0 0 0 0 0 0
027 BS 105 120 148 173 163 88 87 86 134 211 206104 MAEd . 32 26 18 26 24 32 19 0 0 0027 BS 43 35 32 40 44 30 29 25 32 22 34104 MAEd . 6 5 9 0 0 3 4 0 0 0
131210 Early Childhood Education and Teaching (NEW) 027 BS . . 10 16 22 16 21 25 35 139 155106 MAT . 8 5 . . . . . . .109 MEd 58 15 10 31 44 49 59 65 107 89 89
131302 Art Teacher Education 027 BS . . . . . . . . . 5 6131303 Business Teacher Education 027 BS 12 19 20 20 18 9 14 9 9 5 6131305 English/Language Arts Teacher Education 027 BS 19 19 23 27 39 28 31 30 25 10 34131307 Health Teacher Education 027 BS 11 8 8 5 5 2 1 5 4 0 0131310 Sales & Marketing Operations & Distribution Teacher Education 027 BS 2 3 1 0 1 1 4 4 3 0 0131311 Mathematics Teacher Education 027 BS 16 21 25 30 25 15 16 19 25 8 23131312 Music Teacher Education 027 BS 24 23 22 20 20 12 11 16 17 0 1131314 Physical Education Teaching and Coaching 027 BS 32 33 33 35 36 25 19 20 22 52 53131317 Social Science Teacher Education 027 BS 25 24 28 23 21 13 23 20 24 13 18131322 Biology Teacher Education 027 BS 2 8 4 5 4 3 6 9 11 6 7131330 Spanish Language Teacher Education 027 BS 4 4 6 7 11 6 6 9 7 3 6160905 Spanish Language and Literature 018 BA 10 15 13 14 13 6 14 17 11 3 13
018 BA 41 46 50 47 40 22 35 34 27 35 38102 MA 7 7 9 9 8 4 7 8 9 7 5027 BS 96 102 116 115 126 76 90 104 106 121 128123 MS 3 4 6 6 9 7 12 11 10 4 9
261201 Biotechnology 027 BS . . . . . . . . . 3 8027 BS 19 18 16 15 2 4 8 11 16 4 18123 MS 4 7 3 3 0 3 5 5 8 5 5018 BA . . . . . . . . . . 2027 BS 19 20 18 20 21 14 19 21 19 3 15027 BS 134 130 167 152 173 134 174 186 210 311 312102 MA 18 15 15 24 30 32 42 34 39 44 36
430104 Criminal Justice/Safety Studies 027 BS 200 204 226 229 257 196 199 225 239 287 287123 MS . . . . . . 20 15 22 24 24
430106 Forensic Science and Technology 027 BS . . . . . . . . 1 6 23430202 Fire Services Administration 027 BS . . . . . . . . 1 0 36440701 Social Work 138 MSW . . 38 . 46 44 62 59 70 96 89450701 Geography 018 BA 10 3 5 6 3 7 9 10 10 8 9
018 BA 43 47 37 46 47 41 48 49 43 20 62102 MA 2 5 7 6 8 8 10 9 10 7 6018 BA 130 131 150 132 141 104 148 157 156 200 212102 MA 16 20 18 14 15 12 18 16 15 12 9
500501 Drama and Dramatics/Theatre Arts, General 027 BS . . . 0 0 . 0 . 0 0 0500599 Dramatic/Theatre Arts and Stagecraft, Other 018 BA 41 43 45 55 66 50 43 35 27 15 19500701 Art/Art Studies, General 018 BA 20 23 27 35 32 26 31 29 27 32 35500901 Music, General 018 BA . . . . . . . . 2 2 10511601 Nursing - Registered Nurse Training (RN, ASN, BSN, MSN) 039 BSN 23 26 49 40 49 20 85 202 207 95 178
027 BS 286 281 307 310 295 172 259 232 247 221 270107 MBA 34 30 32 35 54 47 0 0 56 48 51
520301 Accounting 027 BS 61 58 63 63 68 47 75 79 83 74 78520601 Business/Managerial Economics 027 BS 13 11 13 13 13 6 1 1 2 1 0520801 Finance, General 027 BS 35 40 41 39 47 35 33 29 30 50 55521201 Management Information Systems, Genera 027 BS . . . . . . . . 15 33 33
018 BA 61 65 61 66 63 52 76 73 63 51 47102 MA 3 4 2 5 6 6 48 7 5 1 1
52
520201 Business Administration and Management, General
540101 History, General
270101 Mathematics, General
420101 Psychology, General
451001 Political Science and Government, General
131203 Junior High/Intermediate/Middle School Education and Teaching
131299 Teacher Education and Professional Development, Specific Levels and Methods, Other
400501 Chemistry, General
230101 English Language and Literature, General
260101 Biology/Biological Sciences, General
Upper Division (junior, senior, and graduate) Enrollment
130401 Educational Leadership and Administration, General
131202 Elementary Education and Teaching
451101 Sociology

53 Fayetteville State University
Office of Institutional Research 07/06/2009
Degrees Conferred Between 2004-2009 Comparison By Degree Level __________________________________________________________________
Degree Type 2004 2005 2006 2007 2008 2009
Bachelor 689 701 709 685 775 773 Master 82 123 122 162 160 145
Doctorate 7 11 2 2 13 9 Total 778 835 833 849 948 927
By Month
Month 2004 2005 2006 2007 2008 2009 May 381 454 465 466 550 524
December 397 381 368 383 398 403
54 Fayetteville State University
Office of Institutional Research 07/06/2009
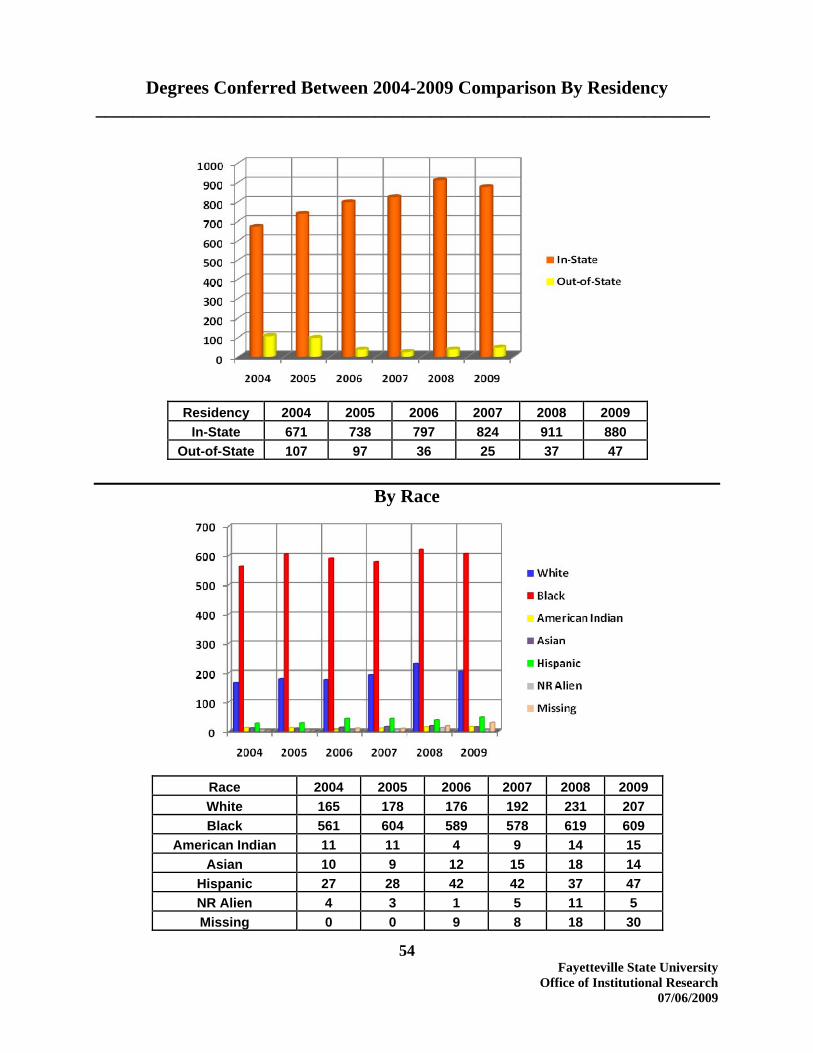
Degrees Conferred Between 2004-2009 Comparison By Residency __________________________________________________________________
Residency 2004 2005 2006 2007 2008 2009
In-State 671 738 797 824 911 880 Out-of-State 107 97 36 25 37 47
By Race
Race 2004 2005 2006 2007 2008 2009 White 165 178 176 192 231 207 Black 561 604 589 578 619 609
American Indian 11 11 4 9 14 15 Asian 10 9 12 15 18 14
Hispanic 27 28 42 42 37 47 NR Alien 4 3 1 5 11 5 Missing 0 0 9 8 18 30
55 Fayetteville State University
Office of Institutional Research 07/06/2009
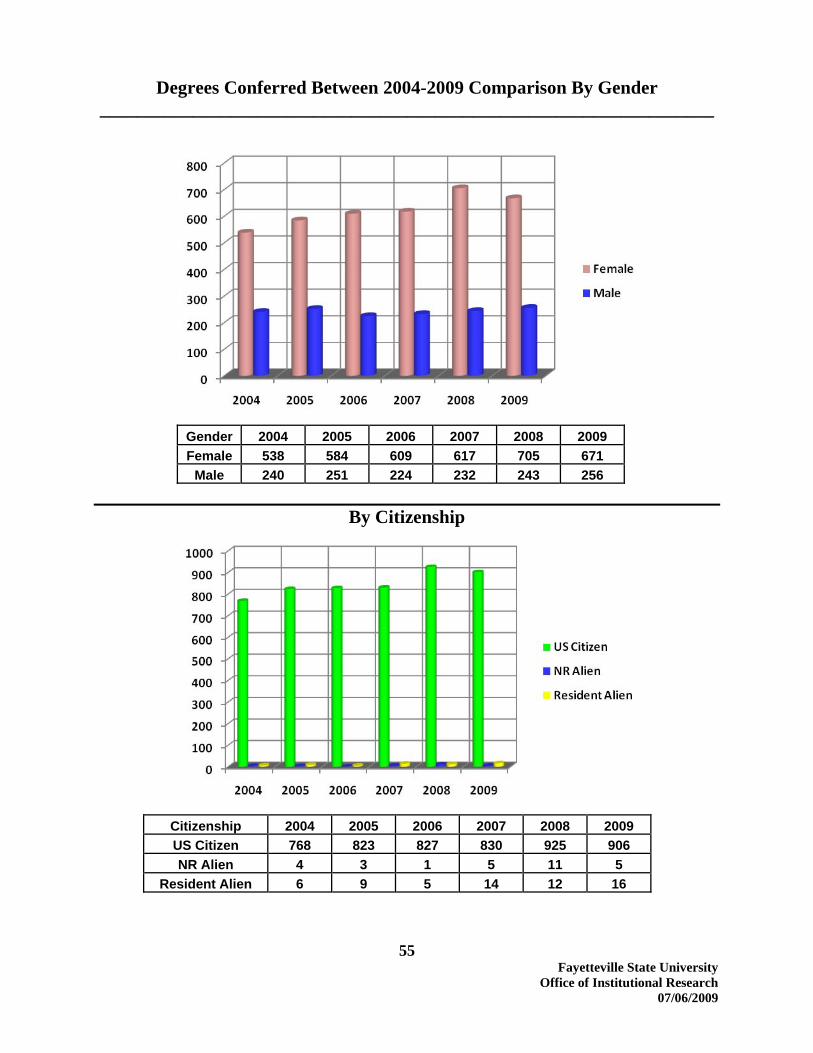
Degrees Conferred Between 2004-2009 Comparison By Gender __________________________________________________________________
Gender 2004 2005 2006 2007 2008 2009 Female 538 584 609 617 705 671
Male 240 251 224 232 243 256
By Citizenship
Citizenship 2004 2005 2006 2007 2008 2009 US Citizen 768 823 827 830 925 906 NR Alien 4 3 1 5 11 5
Resident Alien 6 9 5 14 12 16

56 Fayetteville State University
Office of Institutional Research 07/06/2009
Degrees Conferred Between 2004-2009 Comparison By Teacher Certification __________________________________________________________________
Certification 2004 2005 2006 2007 2008 2009 No 665 693 709 717 781 749 Yes 113 142 124 132 167 178

2002-2003 2003-2004 2004-2005 2005-2006 2006-2007 2007-2008 2008-200990101 Communication Studies/Speech Communication and Rhe 018 BA . . . . 4 9 21110701 Computer Science 027 BS 41 31 20 27 14 14 8
124 MSA 31 25 26 21 22 20 31403 EdD 4 7 11 2 2 13 9
131005 Education/Teaching of Individuals with Emotional Disturbances 104 MAEd . . . . . . .131006 Education/Teaching of Individuals with Mental Retardation 104 MAEd
. . . . . . .131011 Education/Teaching of Individuals with Specific Learning Dis. 104 MAEd . . . . . . .
027 BS 36 27 40 47 34 33 45104 MAEd
. . . 17 . . .027 BS 10 19 6 13 6 6 10104 MAEd
. . . . . . .131210 Early Childhood Education and Teaching 027 BS . . 1 3 12 20 25
106 MAT 1 3 . . . 3 7109 MEd 21 30 34 27 41 51 25
131302 Art Teacher Education 027 BS . . . . . 2 .131303 Business Teacher Education 027 BS 1 4 2 1 3 2 .131305 English/Language Arts Teacher Education 027 BS 7 2 7 7 3 4 5131307 Health Teacher Education 027 BS 1 3 1 . . . .131310 Sales & Marketing Operations & Distribution Teacher Education 027 BS . . . . . . .131311 Mathematics Teacher Education 027 BS 4 5 5 10 3 4 7131312 Music Teacher Education 027 BS 1 7 2 1 3 2 3131314 Physical Education Teaching and Coaching 027 BS 3 3 5 4 3 3 7131317 Social Science Teacher Education 027 BS 2 1 6 5 2 4 2131322 Biology Teacher Education 027 BS . 1 2 . 1 2 2131330 Spanish Language Teacher Education 027 BS . . . 4 1 . .160905 Spanish Language and Literature 018 BA 9 5 7 6 5 3 6
018 BA 21 20 22 13 27 13 17102 MA 2 . 5 3 2 5 .027 BS 45 32 24 39 30 37 36123 MS 3 3 . 1 2 4 .
261201 Biotechnology 027 BS . . . . . 1 .027 BS 9 5 3 3 7 6 5123 MS 6 3 8 1 . 5 2018 BA . . 3 . . . 9027 BS 5 7 7 3 7 9 .027 BS 66 65 80 83 88 92 116102 MA 2 1 . 7 14 9 8027 BS 90 93 98 101 112 99 117123 MS . . . . . 1 2
430202 Fire Services Administration 027 BS . . . . . . 9440701 Social Work 138 MSW . . 19 21 40 28 38450701 Geography 018 BA 2 4 3 5 4 8 5
018 BA 29 24 15 22 24 16 26102 MA 1 1 5 1 2 6 2018 BA 60 72 74 58 59 76 74102 MA 3 1 10 3 6 6 2
500599 Dramatic/Theatre Arts and Stagecraft, Other 018 BA 21 21 15 15 25 8 6500701 Art/Art Studies, General 018 BA 9 7 16 11 12 7 17500901 Music, General 018 BA . . 5 7 1 2 .511601 Nursing - Registered Nurse Training (RN, ASN, BSN, MSN) 039 BSN 5 6 19 10 14 86 41
027 BS 142 122 119 103 95 99 87107 MBA 8 11 17 18 27 19 28
520301 Accounting 027 BS 30 20 13 21 23 32 14520601 Business/Managerial Economics 027 BS 5 5 3 10 3 0 .520801 Finance, General 027 BS 14 17 19 22 16 14 15521201 Management Information Systems, General 027 BS . . . . 1 10 9
018 BA 52 61 58 55 43 52 29102 MA 1 4 . 2 6 3 .
Total 803 778 835 833 849 948 927
451001 Political Science and Government, General
451101 Sociology
520201 Business Administration and Management, General
540101 History, General
270101 Mathematics, General
400501 Chemistry, General
420101 Psychology, General
430104 Criminal Justice/Safety Studies
131203 Junior High/Intermediate/Middle School Education and Teaching
131299 Teacher Education and Professional Development, Specific Levels and Methods, Other
230101 English Language and Literature, General
260101 Biology/Biological Sciences, General
Number of Degrees Awarded
130401 Educational Leadership and Administration, General
131202 Elementary Education and Teaching
57

Degree's Awarded 2006-2007By County
Bachelor's Master's Doctorate TotalCount Percent Count Percent Count Percent Count Percent
Alexander 1 0.12% 0 0.00% 0 0.00% 1 0.12%Anson 2 0.24% 0 0.00% 0 0.00% 2 0.24%Beaufort 1 0.12% 0 0.00% 0 0.00% 1 0.12%Bladen 3 0.35% 1 0.12% 0 0.00% 4 0.47%Brunswick 0 0.00% 2 0.24% 0 0.00% 2 0.24%Cabarrus 1 0.12% 0 0.00% 0 0.00% 1 0.12%Chatham 1 0.12% 0 0.00% 0 0.00% 1 0.12%Chowan 1 0.12% 0 0.00% 0 0.00% 1 0.12%Cleveland 1 0.12% 0 0.00% 0 0.00% 1 0.12%Columbus 6 0.71% 0 0.00% 0 0.00% 6 0.71%Craven 5 0.59% 0 0.00% 0 0.00% 5 0.59%Cumberland 489 57.60% 113 13.31% 0 0.00% 602 70.91%Duplin 1 0.12% 0 0.00% 0 0.00% 1 0.12%Durham 4 0.47% 0 0.00% 0 0.00% 4 0.47%Forsyth 5 0.59% 0 0.00% 0 0.00% 5 0.59%Franklin 1 0.12% 0 0.00% 0 0.00% 1 0.12%Gaston 1 0.12% 0 0.00% 0 0.00% 1 0.12%Guilford 3 0.35% 1 0.12% 0 0.00% 4 0.47%Halifax 4 0.47% 0 0.00% 0 0.00% 4 0.47%Harnett 16 1.88% 8 0.94% 0 0.00% 24 2.83%Hoke 9 1.06% 3 0.35% 0 0.00% 12 1.41%Johnston 5 0.59% 0 0.00% 0 0.00% 5 0.59%Jones 1 0.12% 0 0.00% 0 0.00% 1 0.12%Lee 10 1.18% 6 0.71% 0 0.00% 16 1.88%Lenoir 4 0.47% 0 0.00% 0 0.00% 4 0.47%Martin 0 0.00% 1 0.12% 0 0.00% 1 0.12%Mecklenburg 7 0.82% 0 0.00% 0 0.00% 7 0.82%Moore 3 0.35% 2 0.24% 0 0.00% 5 0.59%Nash 3 0.35% 0 0.00% 0 0.00% 3 0.35%New Hanover 4 0.47% 2 0.24% 1 0.12% 7 0.82%Northampton 1 0.12% 0 0.00% 0 0.00% 1 0.12%Onslow 7 0.82% 0 0.00% 0 0.00% 7 0.82%Orange 2 0.24% 0 0.00% 0 0.00% 2 0.24%Pender 1 0.12% 0 0.00% 0 0.00% 1 0.12%Person 0 0.00% 1 0.12% 0 0.00% 1 0.12%Randolph 1 0.12% 0 0.00% 0 0.00% 1 0.12%Richmond 4 0.47% 0 0.00% 0 0.00% 4 0.47%Robeson 20 2.36% 6 0.71% 1 0.12% 27 3.18%Rockingham 1 0.12% 0 0.00% 0 0.00% 1 0.12%Sampson 14 1.65% 3 0.35% 0 0.00% 17 2.00%Scotland 2 0.24% 1 0.12% 0 0.00% 3 0.35%Stanly 2 0.24% 0 0.00% 0 0.00% 2 0.24%Union 1 0.12% 0 0.00% 0 0.00% 1 0.12%Vance 1 0.12% 0 0.00% 0 0.00% 1 0.12%Wake 5 0.59% 6 0.71% 0 0.00% 11 1.30%Wayne 6 0.71% 4 0.47% 0 0.00% 10 1.18%Wilson 2 0.24% 0 0.00% 0 0.00% 2 0.24%Total County 662 78.02% 160 18.87% 2 0.24% 824 97.10%
58
Fayetteville State UniversityOffice of Instiutional Research
07/06/2009

Degree's Awarded 2007-2008By County
Bachelor's Master's Doctorate TotalCount Percent Count Percent Count Percent Count Percent
Alamance 1 0.11% 0 0.00% 0 0.00% 1 0.11%Anson 2 0.21% 0 0.00% 0 0.00% 2 0.21%Beaufort 1 0.11% 0 0.00% 0 0.00% 1 0.11%Bertie 1 0.11% 0 0.00% 0 0.00% 1 0.11%Bladen 15 1.58% 2 0.21% 0 0.00% 17 1.79%Brunswick 2 0.21% 0 0.00% 0 0.00% 2 0.21%Buncombe 1 0.11% 0 0.00% 0 0.00% 1 0.11%Cabarrus 2 0.21% 0 0.00% 0 0.00% 2 0.21%Carteret 1 0.11% 0 0.00% 0 0.00% 1 0.11%Columbus 2 0.21% 2 0.21% 0 0.00% 4 0.42%Craven 5 0.53% 1 0.11% 0 0.00% 6 0.63%Cumberland 507 53.48% 102 10.76% 10 1.05% 619 65.30%Duplin 7 0.74% 2 0.21% 0 0.00% 9 0.95%Durham 2 0.21% 2 0.21% 0 0.00% 4 0.42%Edgecombe 1 0.11% 0 0.00% 0 0.00% 1 0.11%Forsyth 5 0.53% 0 0.00% 0 0.00% 5 0.53%Franklin 1 0.11% 0 0.00% 0 0.00% 1 0.11%Gaston 2 0.21% 0 0.00% 0 0.00% 2 0.21%Guilford 1 0.11% 0 0.00% 0 0.00% 1 0.11%Halifax 3 0.32% 1 0.11% 0 0.00% 4 0.42%Harnett 19 2.00% 7 0.74% 1 0.11% 27 2.85%Hertford 1 0.11% 1 0.11% 0 0.00% 2 0.21%Hoke 17 1.79% 1 0.11% 0 0.00% 18 1.90%Johnston 4 0.42% 0 0.00% 0 0.00% 4 0.42%Jones 1 0.11% 0 0.00% 0 0.00% 1 0.11%Lee 9 0.95% 4 0.42% 0 0.00% 13 1.37%Lenoir 3 0.32% 0 0.00% 0 0.00% 3 0.32%Martin 2 0.21% 0 0.00% 0 0.00% 2 0.21%Mecklenburg 16 1.69% 1 0.11% 0 0.00% 17 1.79%Montgomery 1 0.11% 0 0.00% 0 0.00% 1 0.11%Moore 5 0.53% 3 0.32% 1 0.11% 9 0.95%Nash 3 0.32% 0 0.00% 0 0.00% 3 0.32%New Hanover 3 0.32% 1 0.11% 0 0.00% 4 0.42%Onslow 6 0.63% 0 0.00% 0 0.00% 6 0.63%Pamlico 1 0.11% 0 0.00% 0 0.00% 1 0.11%Pender 3 0.32% 0 0.00% 0 0.00% 3 0.32%Pitt 3 0.32% 0 0.00% 0 0.00% 3 0.32%Richmond 6 0.63% 3 0.32% 0 0.00% 9 0.95%Robeson 27 2.85% 8 0.84% 1 0.11% 36 3.80%Rowan 1 0.11% 1 0.11% 0 0.00% 2 0.21%Sampson 17 1.79% 5 0.53% 0 0.00% 22 2.32%Scotland 8 0.84% 0 0.00% 0 0.00% 8 0.84%Stanly 1 0.11% 0 0.00% 0 0.00% 1 0.11%Vance 3 0.32% 0 0.00% 0 0.00% 3 0.32%Wake 9 0.95% 5 0.53% 0 0.00% 14 1.48%Warren 2 0.21% 0 0.00% 0 0.00% 2 0.21%Wayne 4 0.42% 3 0.32% 0 0.00% 7 0.74%Wilson 5 0.53% 1 0.11% 0 0.00% 6 0.63%Total County 742 78.34% 156 16.50% 13 1.38% 911 96.15%
59
Fayetteville State UniversityOffice of Instiutional Research
07/06/2009

Degree's Awarded 2008-2009By County
Bachelor's Master's Doctorate TotalCount Percent Count Percent Count Percent Count Percent
Alamance 1 0.11% 0 0.00% 0 0.00% 1 0.11%Anson 2 0.22% 0 0.00% 0 0.00% 2 0.22%Avery 1 0.11% 0 0.00% 0 0.00% 1 0.11%Bertie 3 0.32% 0 0.00% 0 0.00% 3 0.32%Bladen 13 1.40% 2 0.22% 0 0.00% 15 1.62%Brunswick 1 0.11% 0 0.00% 0 0.00% 1 0.11%Buncombe 1 0.11% 0 0.00% 0 0.00% 1 0.11%Cabarrus 2 0.22% 0 0.00% 0 0.00% 2 0.22%Caswell 2 0.22% 0 0.00% 0 0.00% 2 0.22%Chatam 2 0.22% 0 0.00% 0 0.00% 2 0.22%Columbus 5 0.54% 1 0.00% 0 0.00% 6 0.65%Craven 4 0.43% 0 0.00% 0 0.00% 4 0.43%Cumberland 484 52.21% 90 9.71% 4 0.43% 578 62.35%Duplin 4 0.43% 1 0.11% 0 0.00% 5 0.54%Durham 5 0.54% 0 0.00% 0 0.00% 5 0.54%Edgecombe 1 0.11% 0 0.00% 0 0.00% 1 0.11%Forsyth 6 0.65% 0 0.00% 0 0.00% 6 0.65%Granville 1 0.11% 0 0.00% 1 0.00% 2 0.22%Guilford 3 0.32% 0 0.00% 0 0.00% 3 0.32%Halifax 4 0.43% 0 0.00% 0 0.00% 4 0.43%Harnett 29 3.13% 10 1.08% 0 0.00% 39 4.21%Henderson 1 0.11% 1 0.11% 0 0.00% 2 0.22%Hertford 1 0.11% 0 0.00% 0 0.00% 1 0.11%Hoke 22 2.37% 6 0.65% 0 0.00% 28 3.02%Iredell 1 0.11% 0 0.00% 0 0.00% 1 0.11%Johnston 5 0.54% 1 0.11% 0 0.00% 6 0.65%Jones 2 0.22% 0 0.00% 0 0.00% 2 0.22%Lee 17 1.83% 5 0.54% 0 0.00% 22 2.37%Lenoir 6 0.65% 0 0.00% 0 0.00% 6 0.65%Martin 2 0.22% 0 0.00% 0 0.00% 2 0.22%Mecklenburg 6 0.65% 0 0.00% 0 0.00% 6 0.65%Montgomery 1 0.11% 0 0.00% 0 0.00% 1 0.11%Moore 7 0.76% 2 0.22% 1 0.11% 10 1.08%Nash 3 0.32% 0 0.00% 0 0.00% 3 0.32%New Hanover 3 0.32% 0 0.00% 1 0.11% 4 0.43%Northhampton 1 0.11% 0 0.00% 0 0.00% 1 0.11%Onslow 5 0.54% 0 0.00% 0 0.00% 5 0.54%Pender 1 0.11% 1 0.11% 0 0.00% 2 0.22%Pitt 3 0.32% 0 0.00% 1 0.11% 4 0.43%Randolph 1 0.11% 0 0.00% 0 0.00% 1 0.11%Richmond 3 0.32% 3 0.32% 0 0.00% 6 0.65%Robeson 17 1.83% 4 0.43% 0 0.00% 21 2.27%Rockingham 1 0.11% 0 0.00% 0 0.00% 1 0.11%Sampson 20 2.16% 2 0.22% 0 0.00% 22 2.37%Scotland 7 0.76% 1 0.11% 0 0.00% 8 0.86%Stanly 3 0.32% 0 0.00% 0 0.00% 3 0.32%Surry 3 0.32% 0 0.00% 0 0.00% 3 0.32%Union 1 0.11% 0 0.00% 0 0.00% 1 0.11%Wake 9 0.97% 6 0.65% 1 0.11% 16 1.73%Wayne 3 0.32% 4 0.43% 0 0.00% 7 0.76%Wilson 2 0.22% 0 0.00% 0 0.00% 2 0.22%Total County 731 78.89% 140 15.02% 9 0.87% 880 95.00%
60
Fayetteville State UniversityOffice of Instiutional Research
07/06/2009

Count Percent Count Percent Count Percent Count PercentConnecticut 1 0.12% 0 0.00% 0 0.00% 1 0.12%Dist. Of Columbia 3 0.35% 0 0.00% 0 0.00% 3 0.35%Florida 1 0.12% 0 0.00% 0 0.00% 1 0.12%Georgia 1 0.12% 0 0.00% 0 0.00% 1 0.12%Hawaii 1 0.12% 0 0.00% 0 0.00% 1 0.12%Missouri 1 0.12% 0 0.00% 0 0.00% 1 0.12%New York 1 0.12% 0 0.00% 0 0.00% 1 0.12%South Carolina 7 0.82% 0 0.00% 0 0.00% 7 0.82%Texas 1 0.12% 0 0.00% 0 0.00% 1 0.12%Virginia 3 0.35% 0 0.00% 0 0.00% 3 0.35%OTHER 3 0.35% 2 0.24% 0 0.00% 5 0.59%Total State 23 2.71% 2 0.24% 0 0.00% 25 2.95%Total Residence 685 80.68% 162 19.08% 2 0.24% 849 100.00%
61
Degrees Awarded 2006-2007By State
Bachelor's Master's Doctorate Total
Fayetteville State UniversityOffice of Instiutional Research
07/06/2009

Count Percent Count Percent Count Percent Count PercentArizona 1 0.11% 0 0.00% 0 0.00% 1 0.11%Dist. Of Columbia 1 0.11% 0 0.00% 0 0.00% 1 0.11%Georgia 1 0.11% 0 0.00% 0 0.00% 1 0.11%Kansas 1 0.11% 0 0.00% 0 0.00% 1 0.11%Maryland 8 0.84% 0 0.00% 0 0.00% 8 0.84%New Jersey 1 0.11% 0 0.00% 0 0.00% 1 0.11%New York 2 0.21% 0 0.00% 0 0.00% 2 0.21%Ohio 1 0.11% 0 0.00% 0 0.00% 1 0.11%Pennsylvania 1 0.11% 0 0.00% 0 0.00% 1 0.11%South Carolina 4 0.42% 0 0.00% 0 0.00% 4 0.42%Virginia 3 0.32% 0 0.00% 0 0.00% 3 0.32%Unkonwn 2 0.21% 0 0.00% 0 0.00% 2 0.21%Foreign Countries 7 0.74% 4 0.42% 0 0.00% 11 1.16%Total State 33 3.51% 4 0.42% 0 0.00% 37 3.93%Total Residence 775 81.75% 160 16.88% 13 1.37% 948 100.00%
62
Degrees Awarded 2007-2008By State
Bachelor's Master's Doctorate Total
Fayetteville State UniversityOffice of Instiutional Research
07/06/2009
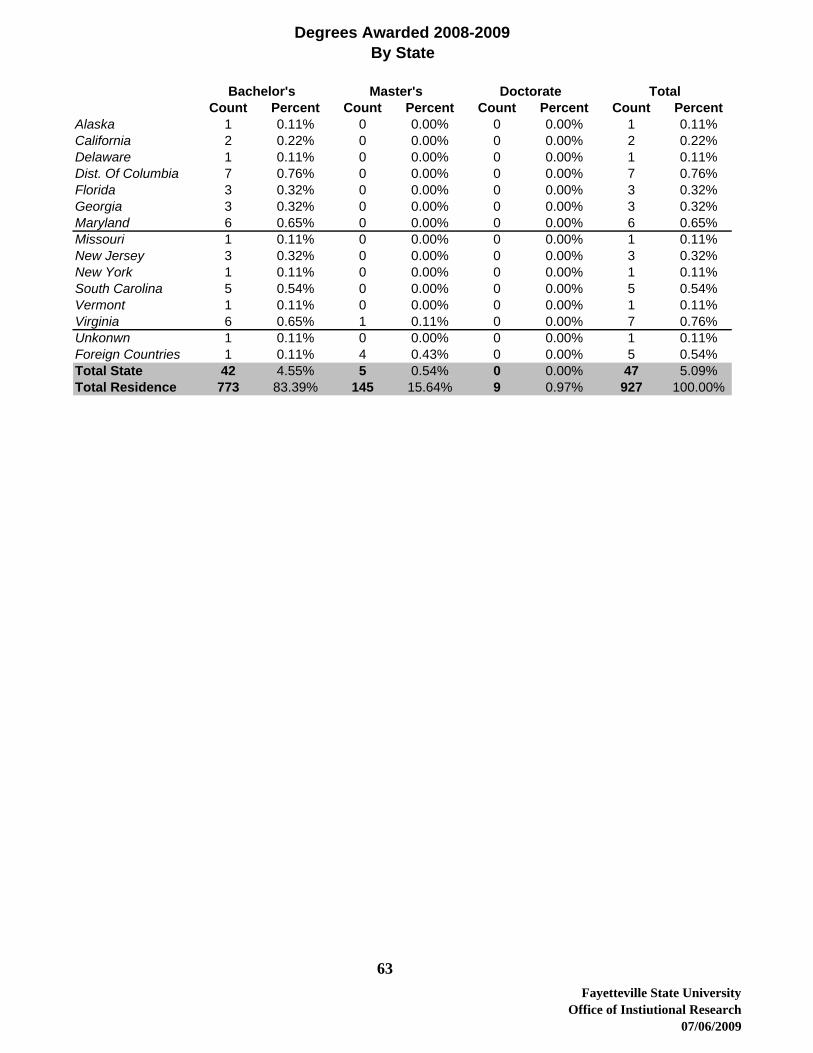
Count Percent Count Percent Count Percent Count PercentAlaska 1 0.11% 0 0.00% 0 0.00% 1 0.11%California 2 0.22% 0 0.00% 0 0.00% 2 0.22%Delaware 1 0.11% 0 0.00% 0 0.00% 1 0.11%Dist. Of Columbia 7 0.76% 0 0.00% 0 0.00% 7 0.76%Florida 3 0.32% 0 0.00% 0 0.00% 3 0.32%Georgia 3 0.32% 0 0.00% 0 0.00% 3 0.32%Maryland 6 0.65% 0 0.00% 0 0.00% 6 0.65%Missouri 1 0.11% 0 0.00% 0 0.00% 1 0.11%New Jersey 3 0.32% 0 0.00% 0 0.00% 3 0.32%New York 1 0.11% 0 0.00% 0 0.00% 1 0.11%South Carolina 5 0.54% 0 0.00% 0 0.00% 5 0.54%Vermont 1 0.11% 0 0.00% 0 0.00% 1 0.11%Virginia 6 0.65% 1 0.11% 0 0.00% 7 0.76%Unkonwn 1 0.11% 0 0.00% 0 0.00% 1 0.11%Foreign Countries 1 0.11% 4 0.43% 0 0.00% 5 0.54%Total State 42 4.55% 5 0.54% 0 0.00% 47 5.09%Total Residence 773 83.39% 145 15.64% 9 0.97% 927 100.00%
63
Degrees Awarded 2008-2009By State
Bachelor's Master's Doctorate Total
Fayetteville State UniversityOffice of Instiutional Research
07/06/2009
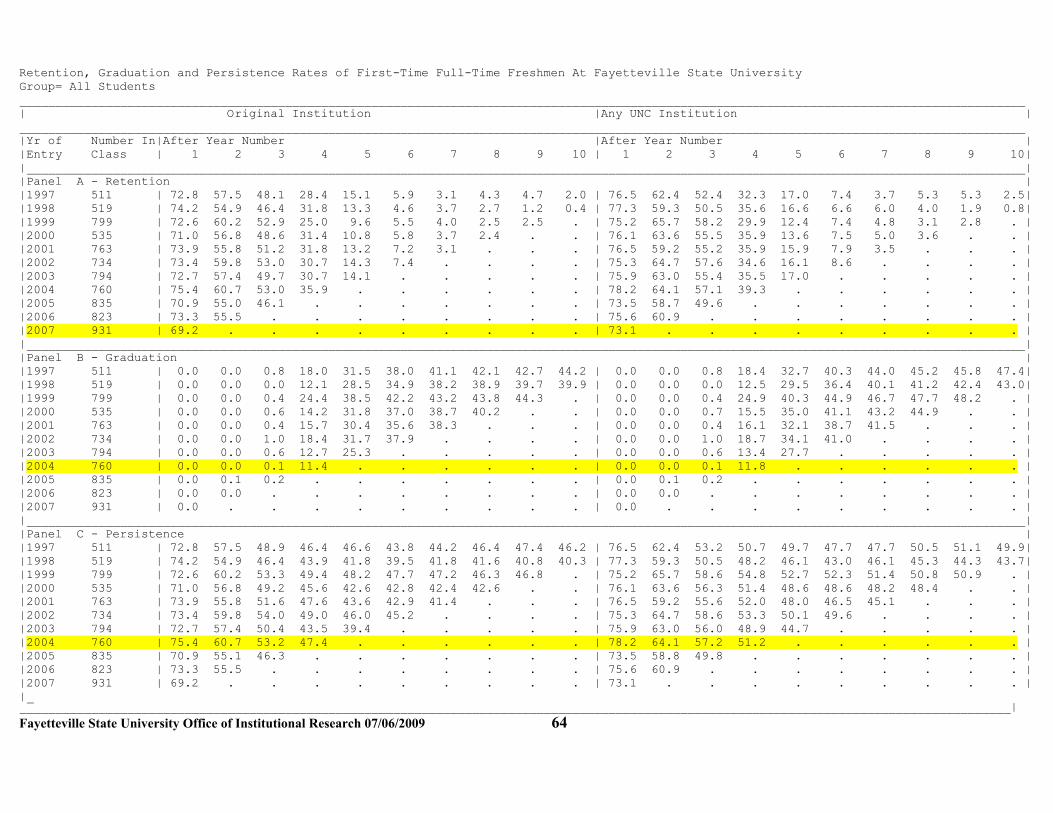
Retention, Graduation and Persistence Rates of First-Time Full-Time Freshmen At Fayetteville State University
Group= All Students
____________________________________________________________________________________________________________________________________________
| Original Institution |Any UNC Institution |
____________________________________________________________________________________________________________________________________________
|Yr of Number In|After Year Number |After Year Number |
|Entry Class | 1 2 3 4 5 6 7 8 9 10 | 1 2 3 4 5 6 7 8 9 10|
|___________________________________________________________________________________________________________________________________________|
|Panel A - Retention |
|1997 511 | 72.8 57.5 48.1 28.4 15.1 5.9 3.1 4.3 4.7 2.0 | 76.5 62.4 52.4 32.3 17.0 7.4 3.7 5.3 5.3 2.5|
|1998 519 | 74.2 54.9 46.4 31.8 13.3 4.6 3.7 2.7 1.2 0.4 | 77.3 59.3 50.5 35.6 16.6 6.6 6.0 4.0 1.9 0.8|
|1999 799 | 72.6 60.2 52.9 25.0 9.6 5.5 4.0 2.5 2.5 . | 75.2 65.7 58.2 29.9 12.4 7.4 4.8 3.1 2.8 . |
|2000 535 | 71.0 56.8 48.6 31.4 10.8 5.8 3.7 2.4 . . | 76.1 63.6 55.5 35.9 13.6 7.5 5.0 3.6 . . |
|2001 763 | 73.9 55.8 51.2 31.8 13.2 7.2 3.1 . . . | 76.5 59.2 55.2 35.9 15.9 7.9 3.5 . . . |
|2002 734 | 73.4 59.8 53.0 30.7 14.3 7.4 . . . . | 75.3 64.7 57.6 34.6 16.1 8.6 . . . . |
|2003 794 | 72.7 57.4 49.7 30.7 14.1 . . . . . | 75.9 63.0 55.4 35.5 17.0 . . . . . |
|2004 760 | 75.4 60.7 53.0 35.9 . . . . . . | 78.2 64.1 57.1 39.3 . . . . . . |
|2005 835 | 70.9 55.0 46.1 . . . . . . . | 73.5 58.7 49.6 . . . . . . . |
|2006 823 | 73.3 55.5 . . . . . . . . | 75.6 60.9 . . . . . . . . |
|2007 931 | 69.2 . . . . . . . . . | 73.1 . . . . . . . . . |
|___________________________________________________________________________________________________________________________________________|
|Panel B - Graduation |
|1997 511 | 0.0 0.0 0.8 18.0 31.5 38.0 41.1 42.1 42.7 44.2 | 0.0 0.0 0.8 18.4 32.7 40.3 44.0 45.2 45.8 47.4|
|1998 519 | 0.0 0.0 0.0 12.1 28.5 34.9 38.2 38.9 39.7 39.9 | 0.0 0.0 0.0 12.5 29.5 36.4 40.1 41.2 42.4 43.0|
|1999 799 | 0.0 0.0 0.4 24.4 38.5 42.2 43.2 43.8 44.3 . | 0.0 0.0 0.4 24.9 40.3 44.9 46.7 47.7 48.2 . |
|2000 535 | 0.0 0.0 0.6 14.2 31.8 37.0 38.7 40.2 . . | 0.0 0.0 0.7 15.5 35.0 41.1 43.2 44.9 . . |
|2001 763 | 0.0 0.0 0.4 15.7 30.4 35.6 38.3 . . . | 0.0 0.0 0.4 16.1 32.1 38.7 41.5 . . . |
|2002 734 | 0.0 0.0 1.0 18.4 31.7 37.9 . . . . | 0.0 0.0 1.0 18.7 34.1 41.0 . . . . |
|2003 794 | 0.0 0.0 0.6 12.7 25.3 . . . . . | 0.0 0.0 0.6 13.4 27.7 . . . . . |
|2004 760 | 0.0 0.0 0.1 11.4 . . . . . . | 0.0 0.0 0.1 11.8 . . . . . . |
|2005 835 | 0.0 0.1 0.2 . . . . . . . | 0.0 0.1 0.2 . . . . . . . |
|2006 823 | 0.0 0.0 . . . . . . . . | 0.0 0.0 . . . . . . . . |
|2007 931 | 0.0 . . . . . . . . . | 0.0 . . . . . . . . . |
|___________________________________________________________________________________________________________________________________________|
|Panel C - Persistence |
|1997 511 | 72.8 57.5 48.9 46.4 46.6 43.8 44.2 46.4 47.4 46.2 | 76.5 62.4 53.2 50.7 49.7 47.7 47.7 50.5 51.1 49.9|
|1998 519 | 74.2 54.9 46.4 43.9 41.8 39.5 41.8 41.6 40.8 40.3 | 77.3 59.3 50.5 48.2 46.1 43.0 46.1 45.3 44.3 43.7|
|1999 799 | 72.6 60.2 53.3 49.4 48.2 47.7 47.2 46.3 46.8 . | 75.2 65.7 58.6 54.8 52.7 52.3 51.4 50.8 50.9 . |
|2000 535 | 71.0 56.8 49.2 45.6 42.6 42.8 42.4 42.6 . . | 76.1 63.6 56.3 51.4 48.6 48.6 48.2 48.4 . . |
|2001 763 | 73.9 55.8 51.6 47.6 43.6 42.9 41.4 . . . | 76.5 59.2 55.6 52.0 48.0 46.5 45.1 . . . |
|2002 734 | 73.4 59.8 54.0 49.0 46.0 45.2 . . . . | 75.3 64.7 58.6 53.3 50.1 49.6 . . . . |
|2003 794 | 72.7 57.4 50.4 43.5 39.4 . . . . . | 75.9 63.0 56.0 48.9 44.7 . . . . . |
|2004 760 | 75.4 60.7 53.2 47.4 . . . . . . | 78.2 64.1 57.2 51.2 . . . . . . |
|2005 835 | 70.9 55.1 46.3 . . . . . . . | 73.5 58.8 49.8 . . . . . . . |
|2006 823 | 73.3 55.5 . . . . . . . . | 75.6 60.9 . . . . . . . . |
|2007 931 | 69.2 . . . . . . . . . | 73.1 . . . . . . . . . |
|_ __________________________________________________________________________________________________________________________________________|
Fayetteville State University Office of Institutional Research 07/06/2009 64

Faculty & Staff
Personnel A total of 1,000 individuals worked at Fayetteville State University as of October 1, 2008. For the past year, of this number, 441 were faculty (includes full or part-time faculty, administrators with faculty status, retirees on contract, visiting faculty, and coaches with faculty status). The remaining 559 were administrators or support personnel. Approximately, 87% are permanent employees, while 44% are in the instructional category. About 24% of the employees are white and 51% are women. Faculty Fayetteville State University had a total of 441 teaching faculty (255 full-time and 186 part-time) as of October 1, 2008. Of the 255 full-time faculty, 80% hold the doctorate or 1st professional degree. Of this number, 27% have earned tenure, while 58% are on track. Most faculty members were male, with about 40% being female. With respect to race distribution of faculty, 42% of the faculty body was black. The assistant professor rank accounted for 51% of the faculty, while close to 3% was classified as an instructor. The mean salary of AAUP Faculty (with 11/12 month converted to 9 month) is $69,335 for males and $65,152 for females.
Fayetteville State University
2008-09 Board of Governors’ Award for Excellence in Teaching Dr. Constance Lightner
2008-09 Teacher of the Year Award
Dr. Booker Anthony
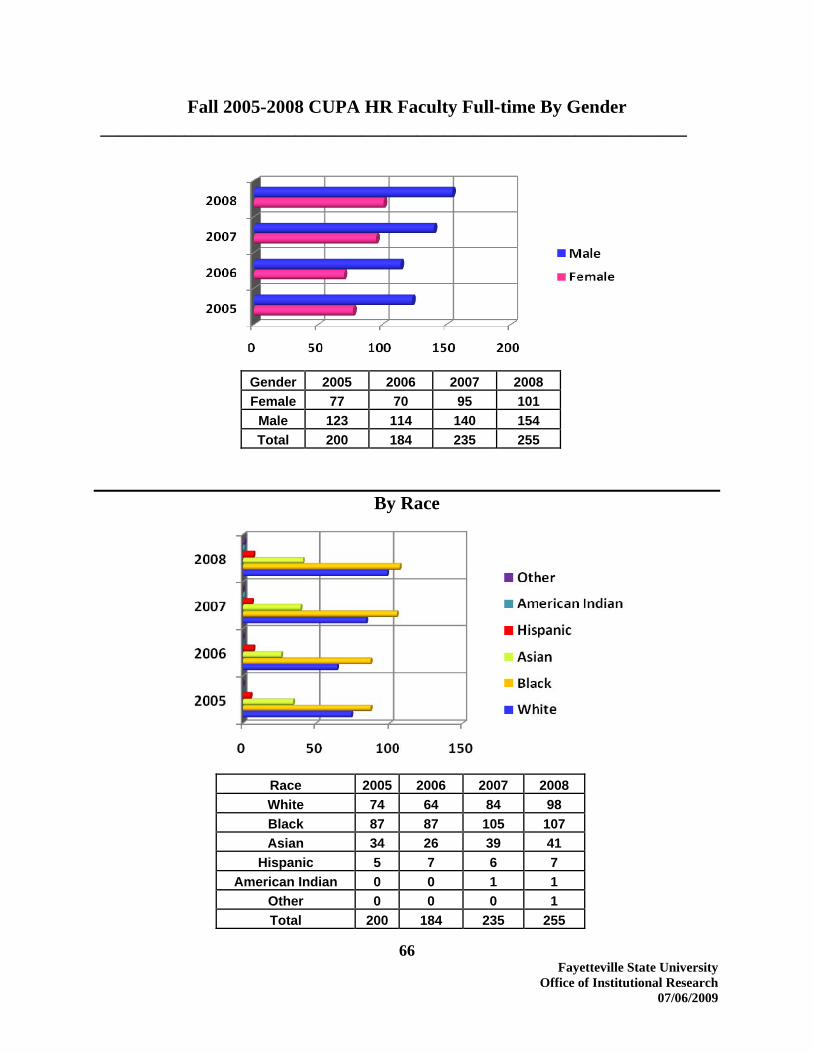
66 Fayetteville State University
Office of Institutional Research 07/06/2009
Fall 2005-2008 CUPA HR Faculty Full-time By Gender _______________________________________________________________
Gender 2005 2006 2007 2008 Female 77 70 95 101
Male 123 114 140 154 Total 200 184 235 255
By Race
Race 2005 2006 2007 2008 White 74 64 84 98 Black 87 87 105 107 Asian 34 26 39 41
Hispanic 5 7 6 7 American Indian 0 0 1 1
Other 0 0 0 1 Total 200 184 235 255
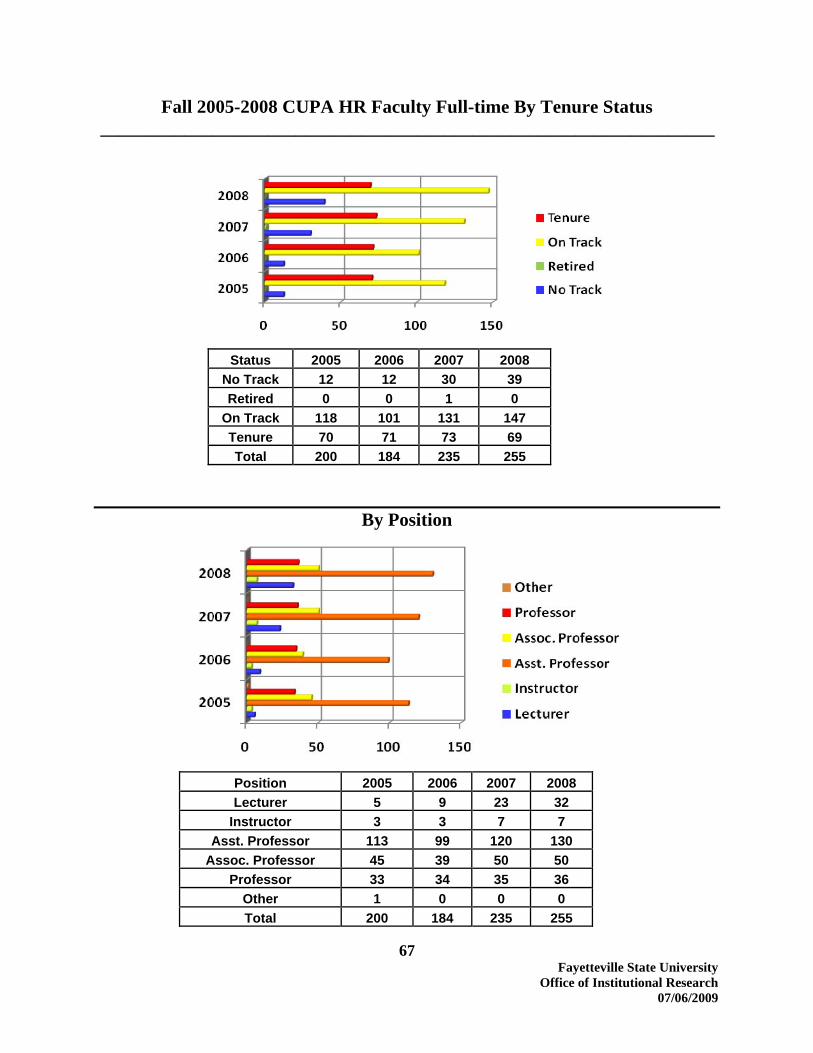
67 Fayetteville State University
Office of Institutional Research 07/06/2009
Fall 2005-2008 CUPA HR Faculty Full-time By Tenure Status __________________________________________________________________
Status 2005 2006 2007 2008
No Track 12 12 30 39 Retired 0 0 1 0
On Track 118 101 131 147 Tenure 70 71 73 69 Total 200 184 235 255
By Position
Position 2005 2006 2007 2008 Lecturer 5 9 23 32
Instructor 3 3 7 7 Asst. Professor 113 99 120 130
Assoc. Professor 45 39 50 50 Professor 33 34 35 36
Other 1 0 0 0 Total 200 184 235 255

68 Fayetteville State University
Office of Institutional Research 07/06/2009
Fall 2005-2008 CUPA HR Faculty Full-time By Degree __________________________________________________________________
Degree 2005 2006 2007 2008 Doctor 178 162 190 201
1st Professional 3 3 2 2 Master 19 19 42 52
Bachelor 0 0 1 0 Total 200 184 235 255
By Fall 2005 CUPA HR Faculty Full-time By Average Salary
Salary Male Female Lecturer $42,000 $47,106
Instructor $66,000 $40,000 Asst. Professor $54,122 $54,257
Assoc. Professor $57,775 $60,469 Professor $71,032 $72,475
Other $38,499 $0 All Ranks $58,094 $57,271
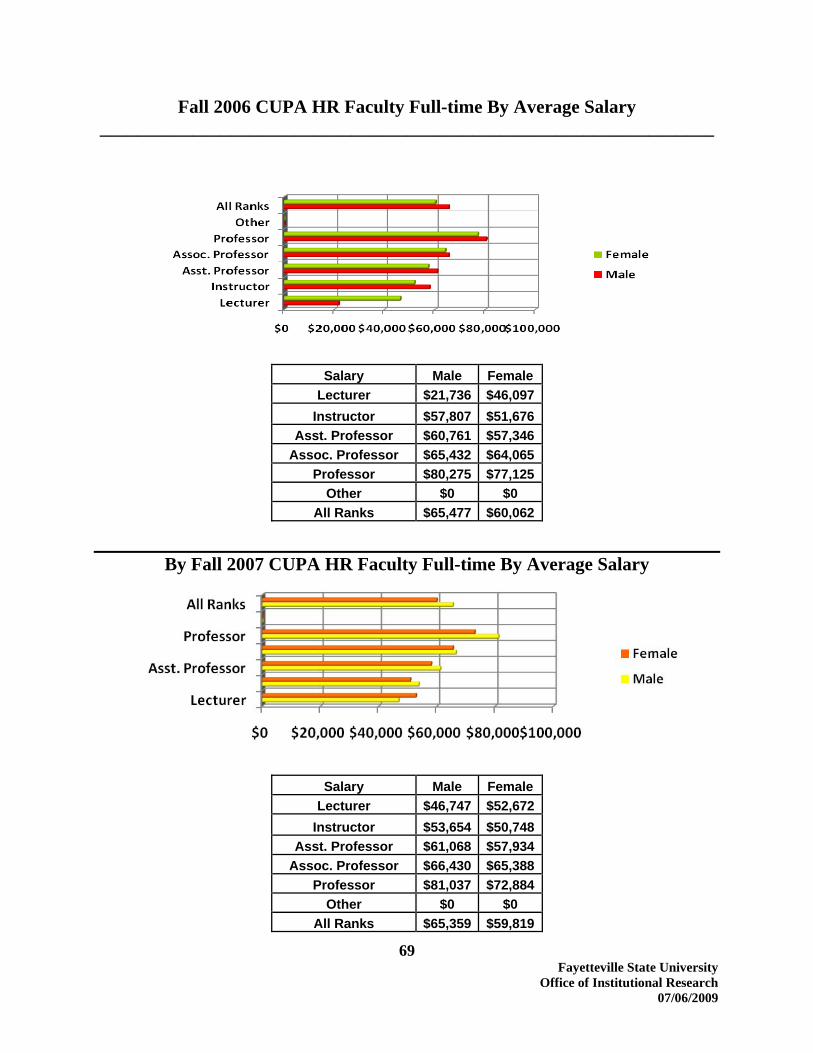
69 Fayetteville State University
Office of Institutional Research 07/06/2009
Fall 2006 CUPA HR Faculty Full-time By Average Salary __________________________________________________________________
By Fall 2007 CUPA HR Faculty Full-time By Average Salary
Salary Male Female Lecturer $21,736 $46,097
Instructor $57,807 $51,676 Asst. Professor $60,761 $57,346
Assoc. Professor $65,432 $64,065 Professor $80,275 $77,125
Other $0 $0 All Ranks $65,477 $60,062
Salary Male Female Lecturer $46,747 $52,672
Instructor $53,654 $50,748Asst. Professor $61,068 $57,934
Assoc. Professor $66,430 $65,388Professor $81,037 $72,884
Other $0 $0 All Ranks $65,359 $59,819

70 Fayetteville State University
Office of Institutional Research 07/06/2009
Fall 2008 CUPA HR Faculty Full-time By Average Salary __________________________________________________________________
Salary Male Female Lecturer $56,494 $54,217
Instructor $60,656 $56,473Asst. Professor $65,686 $62,335
Assoc. Professor $73,721 $73,899Professor $87,901 $93,734All Ranks $68,892 $68,132
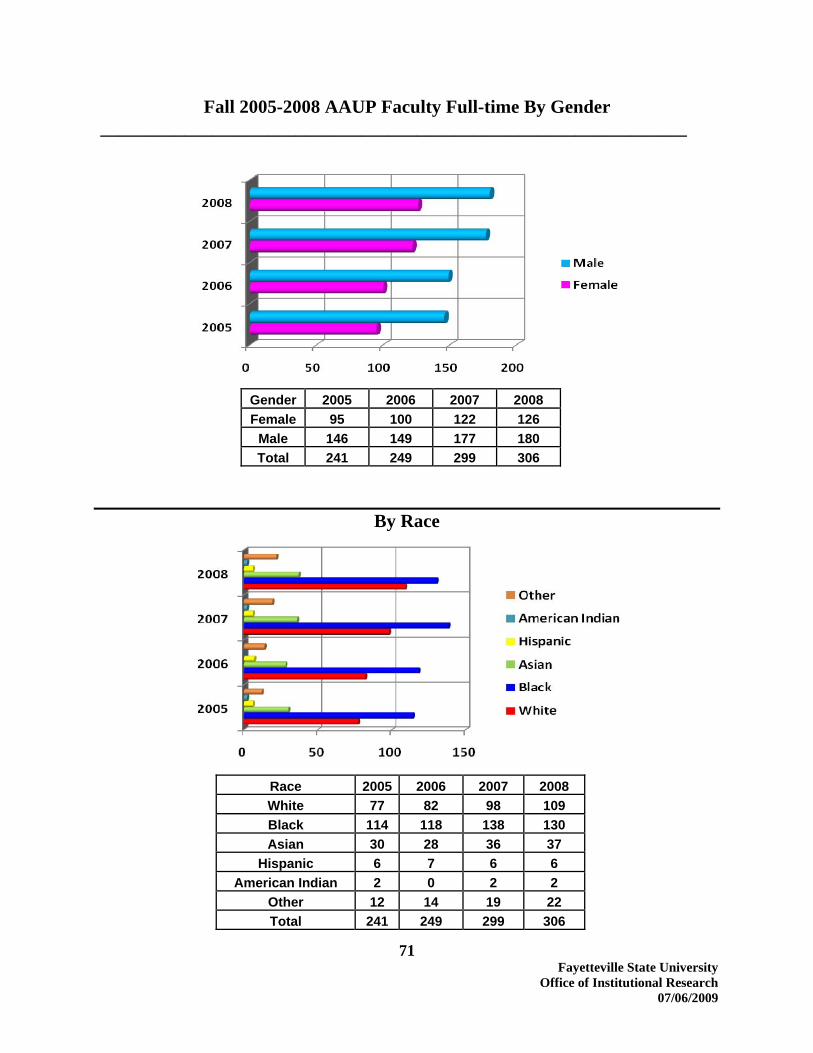
71 Fayetteville State University
Office of Institutional Research 07/06/2009
Fall 2005-2008 AAUP Faculty Full-time By Gender _______________________________________________________________
Gender 2005 2006 2007 2008 Female 95 100 122 126
Male 146 149 177 180 Total 241 249 299 306
By Race
Race 2005 2006 2007 2008 White 77 82 98 109 Black 114 118 138 130 Asian 30 28 36 37
Hispanic 6 7 6 6 American Indian 2 0 2 2
Other 12 14 19 22 Total 241 249 299 306

72 Fayetteville State University
Office of Institutional Research 07/06/2009
Fall 2005-2008 AAUP Faculty Full-time By Tenure Status __________________________________________________________________
Status 2005 2006 2007 2008
No Track 44 49 60 61 On Track 114 112 145 162 Tenure 83 88 94 83 Total 241 249 299 306
By Position
Position 2005 2006 2007 2008
Instructor 4 4 7 8 Lecturer 29 20 29 38
Asst. Professor 108 109 133 145 Assoc. Professor 53 49 59 60
Professor 36 42 48 40 No Rank 11 25 23 15
Total 241 249 299 306

73 Fayetteville State University
Office of Institutional Research 07/06/2009
Fall 2005-2008 AAUP Faculty Full-time By Degree __________________________________________________________________
Degree 2005 2006 2007 2008 Doctor 192 202 237 233
1st Professional 3 5 5 5 Master 46 42 57 68 Total 241 249 299 306
By Fall 2005 AAUP Faculty Full-time By Average Salary
Salary Male Female Instructor $56,301 $0 Lecturer $48,469 $45,366
Asst. Professor $56,225 $55,257 Assoc. Professor $61,231 $64,064
Professor $70,936 $70,822 No Rank $49,980 $47,790 All Ranks $59,598 $55,494
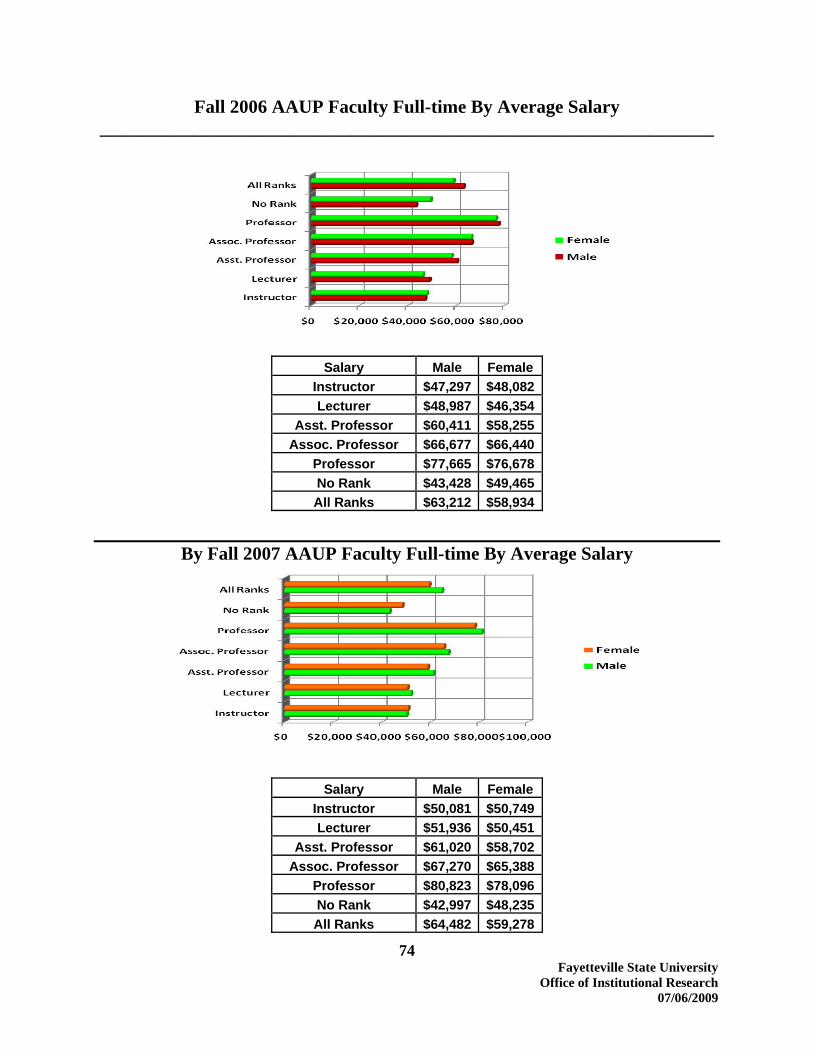
74 Fayetteville State University
Office of Institutional Research 07/06/2009
Fall 2006 AAUP Faculty Full-time By Average Salary __________________________________________________________________
By Fall 2007 AAUP Faculty Full-time By Average Salary
Salary Male Female Instructor $47,297 $48,082Lecturer $48,987 $46,354
Asst. Professor $60,411 $58,255Assoc. Professor $66,677 $66,440
Professor $77,665 $76,678No Rank $43,428 $49,465All Ranks $63,212 $58,934
Salary Male Female Instructor $50,081 $50,749Lecturer $51,936 $50,451
Asst. Professor $61,020 $58,702Assoc. Professor $67,270 $65,388
Professor $80,823 $78,096No Rank $42,997 $48,235All Ranks $64,482 $59,278

75 Fayetteville State University
Office of Institutional Research 07/06/2009
Fall 2008 AAUP Faculty Full-time By Average Salary __________________________________________________________________
Salary Male Female
Lecturer $49,194 $52,402Instructor $59,333 $52,664
Asst. Professor $65,553 $65,152Assoc. Professor $74,950 $72,232
Professor $86,668 $92,576No Rank $57,484 $51,681All Ranks $69,335 $65,152
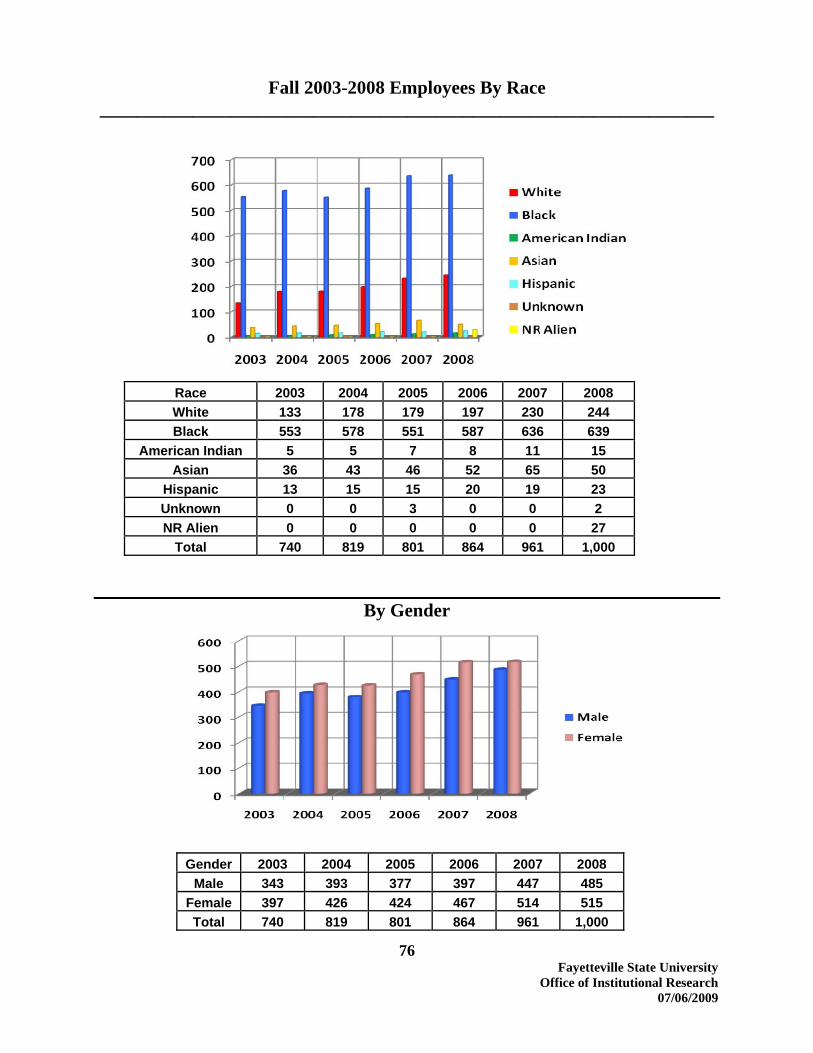
76 Fayetteville State University
Office of Institutional Research 07/06/2009
Fall 2003-2008 Employees By Race __________________________________________________________________
Race 2003 2004 2005 2006 2007 2008 White 133 178 179 197 230 244 Black 553 578 551 587 636 639
American Indian 5 5 7 8 11 15 Asian 36 43 46 52 65 50
Hispanic 13 15 15 20 19 23 Unknown 0 0 3 0 0 2 NR Alien 0 0 0 0 0 27
Total 740 819 801 864 961 1,000
By Gender
Gender 2003 2004 2005 2006 2007 2008 Male 343 393 377 397 447 485
Female 397 426 424 467 514 515 Total 740 819 801 864 961 1,000

77 Fayetteville State University
Office of Institutional Research 07/06/2009
Fall 2003-2008 Employees By Status __________________________________________________________________
Status 2003 2004 2005 2006 2007 2008
Permanent 671 717 731 793 838 874 Temporary 62 96 69 63 112 119
On Leave with pay 1 0 0 1 2 1 On Leave without pay 6 6 1 7 9 6
Total 740 819 801 864 961 1,000
By Classification
Classification 2003 2004 2005 2006 2007 2008 Administrative 38 39 47 63 71 75 Instructional 256 324 328 331 435 441 Professional 131 137 152 126 113 79
Technical 48 53 38 72 78 98 Clerical 147 137 127 149 153 188
Skilled Crafts 11 12 36 37 36 34 Service/Maint. 109 117 73 86 75 85
Total 703 740 819 801 961 1,000
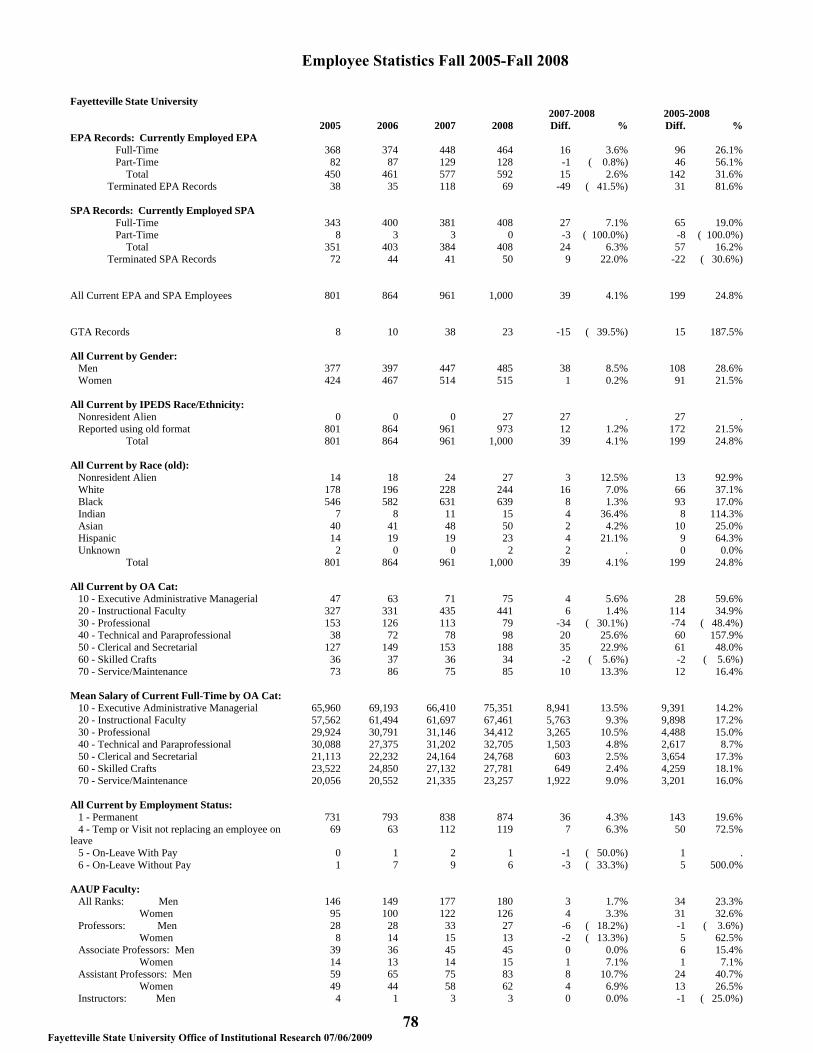
78Fayetteville State University Office of Institutional Research 07/06/2009
Employee Statistics Fall 2005-Fall 2008
Fayetteville State University2007-2008 2005-2008
2005 2006 2007 2008 Diff. % Diff. %EPA Records: Currently Employed EPA Full-Time 368 374 448 464 16 3.6% 96 26.1% Part-Time 82 87 129 128 -1 ( 0.8%) 46 56.1% Total 450 461 577 592 15 2.6% 142 31.6% Terminated EPA Records 38 35 118 69 -49 ( 41.5%) 31 81.6%
SPA Records: Currently Employed SPA Full-Time 343 400 381 408 27 7.1% 65 19.0% Part-Time 8 3 3 0 -3 ( 100.0%) -8 ( 100.0%) Total 351 403 384 408 24 6.3% 57 16.2% Terminated SPA Records 72 44 41 50 9 22.0% -22 ( 30.6%)
All Current EPA and SPA Employees 801 864 961 1,000 39 4.1% 199 24.8%
GTA Records 8 10 38 23 -15 ( 39.5%) 15 187.5%
All Current by Gender: Men 377 397 447 485 38 8.5% 108 28.6% Women 424 467 514 515 1 0.2% 91 21.5%
All Current by IPEDS Race/Ethnicity: Nonresident Alien 0 0 0 27 27 . 27 . Reported using old format 801 864 961 973 12 1.2% 172 21.5% Total 801 864 961 1,000 39 4.1% 199 24.8%
All Current by Race (old): Nonresident Alien 14 18 24 27 3 12.5% 13 92.9% White 178 196 228 244 16 7.0% 66 37.1% Black 546 582 631 639 8 1.3% 93 17.0% Indian 7 8 11 15 4 36.4% 8 114.3% Asian 40 41 48 50 2 4.2% 10 25.0% Hispanic 14 19 19 23 4 21.1% 9 64.3% Unknown 2 0 0 2 2 . 0 0.0% Total 801 864 961 1,000 39 4.1% 199 24.8%
All Current by OA Cat: 10 - Executive Administrative Managerial 47 63 71 75 4 5.6% 28 59.6% 20 - Instructional Faculty 327 331 435 441 6 1.4% 114 34.9% 30 - Professional 153 126 113 79 -34 ( 30.1%) -74 ( 48.4%) 40 - Technical and Paraprofessional 38 72 78 98 20 25.6% 60 157.9% 50 - Clerical and Secretarial 127 149 153 188 35 22.9% 61 48.0% 60 - Skilled Crafts 36 37 36 34 -2 ( 5.6%) -2 ( 5.6%) 70 - Service/Maintenance 73 86 75 85 10 13.3% 12 16.4%
Mean Salary of Current Full-Time by OA Cat: 10 - Executive Administrative Managerial 65,960 69,193 66,410 75,351 8,941 13.5% 9,391 14.2% 20 - Instructional Faculty 57,562 61,494 61,697 67,461 5,763 9.3% 9,898 17.2% 30 - Professional 29,924 30,791 31,146 34,412 3,265 10.5% 4,488 15.0% 40 - Technical and Paraprofessional 30,088 27,375 31,202 32,705 1,503 4.8% 2,617 8.7% 50 - Clerical and Secretarial 21,113 22,232 24,164 24,768 603 2.5% 3,654 17.3% 60 - Skilled Crafts 23,522 24,850 27,132 27,781 649 2.4% 4,259 18.1% 70 - Service/Maintenance 20,056 20,552 21,335 23,257 1,922 9.0% 3,201 16.0%
All Current by Employment Status: 1 - Permanent 731 793 838 874 36 4.3% 143 19.6% 4 - Temp or Visit not replacing an employee onleave
69 63 112 119 7 6.3% 50 72.5%
5 - On-Leave With Pay 0 1 2 1 -1 ( 50.0%) 1 . 6 - On-Leave Without Pay 1 7 9 6 -3 ( 33.3%) 5 500.0%
AAUP Faculty: All Ranks: Men 146 149 177 180 3 1.7% 34 23.3% Women 95 100 122 126 4 3.3% 31 32.6% Professors: Men 28 28 33 27 -6 ( 18.2%) -1 ( 3.6%) Women 8 14 15 13 -2 ( 13.3%) 5 62.5% Associate Professors: Men 39 36 45 45 0 0.0% 6 15.4% Women 14 13 14 15 1 7.1% 1 7.1% Assistant Professors: Men 59 65 75 83 8 10.7% 24 40.7% Women 49 44 58 62 4 6.9% 13 26.5% Instructors: Men 4 1 3 3 0 0.0% -1 ( 25.0%)

Employee Statistics Fall 2005-Fall 2008
Fayetteville State University Office of Institutional Research 07/06/2009 79
Fayetteville State University2007-2008 2005-2008
2005 2006 2007 2008 Diff. % Diff. %AAUP Faculty: Women 0 3 4 5 1 25.0% 5 . Lecturers: Men 10 8 10 14 4 40.0% 4 40.0% Women 19 12 19 24 5 26.3% 5 26.3% No Rank: Men 6 11 11 8 -3 ( 27.3%) 2 33.3% Women 5 14 12 7 -5 ( 41.7%) 2 40.0%
Mean Salary of AAUP Faculty (with 11/12 month converted to 9 month) : All Ranks: Men 59,598 63,212 64,482 69,335 4,852 7.5% 9,737 16.3% Women 55,494 58,934 59,278 65,152 5,873 9.9% 9,657 17.4% Professors: Men 70,936 77,665 80,823 86,668 5,845 7.2% 15,731 22.2% Women 70,822 76,678 78,096 92,576 14,480 18.5% 21,754 30.7% Associate Professors: Men 61,231 66,677 67,270 74,950 7,680 11.4% 13,718 22.4% Women 64,064 66,440 65,388 72,232 6,844 10.5% 8,169 12.8% Assistant Professors: Men 56,225 60,411 61,020 65,553 4,533 7.4% 9,328 16.6% Women 55,257 58,255 58,702 65,152 6,450 11.0% 9,895 17.9% Instructors: Men 56,301 47,297 50,081 59,333 9,252 18.5% 3,033 5.4% Women . 48,082 50,749 52,664 1,915 3.8% . . Lecturers: Men 48,469 48,987 51,936 49,194 -2,742 ( 5.3%) 725 1.5% Women 45,366 46,354 50,451 52,402 1,950 3.9% 7,035 15.5% No Rank: Men 49,980 43,428 42,997 57,484 14,487 33.7% 7,504 15.0% Women 47,790 49,465 48,235 51,681 3,446 7.1% 3,890 8.1%
CUPA Administrator Title Codes: CUPA Code 0 0 78 86 8 10.3% 86 .
EPA Type: F - Faculty 327 331 435 441 6 1.4% 114 34.9% A - SAAO Tier I 11 12 11 12 1 9.1% 1 9.1% B - SAAO Tier II 56 47 58 62 4 6.9% 6 10.7% L - Professional Librarian 5 7 10 9 -1 ( 10.0%) 4 80.0% I - Instructional 51 64 63 68 5 7.9% 17 33.3%
Tenure Status of Current EPA Employees: Tenured 96 104 104 96 -8 ( 7.7%) 0 0.0% On Track 118 118 149 165 16 10.7% 47 39.8% Not On Track 231 233 318 326 8 2.5% 95 41.1% Retired 2 4 5 4 -1 ( 20.0%) 2 100.0% Phased Retirement Program Participant 3 2 1 1 0 0.0% -2 ( 66.7%)
Higest Earned Degree Level of All Current EPA Employees: 1 - Doctoral 236 252 287 294 7 2.4% 58 24.6% 2 - First Professional 7 11 12 13 1 8.3% 6 85.7% 3 - Master's Degree 151 153 215 220 5 2.3% 69 45.7% 4 - Baccalaureate 54 45 60 62 2 3.3% 8 14.8% 5 - Associate Degree 1 0 0 0 0 . -1 ( 100.0%) 9 - No Degree 1 0 3 3 0 0.0% 2 200.0%
All Current by Citizenship: Resident foreign national 10 11 18 24 6 33.3% 14 140.0% Non-resident foreign national 14 18 24 27 3 12.5% 13 92.9% Citizen of the United States of America 777 835 919 949 30 3.3% 172 22.1%
All Current by Total Salaries: Total State Salaries 25,547,022 28,231,917 32,624,004 36,510,248 3,886,245 11.9% 10,963,226 42.9% Total Non-state Salaries 3,407,836 3,998,710 3,982,319 4,893,214 910,895 22.9% 1,485,378 43.6%

Finances
Finances Finance The financial statements report information about the university as a whole. The university’s financial position remained relatively stable during the fiscal year ending June 30, 2008. Its combined net assets increased $12.0 million from the previous year.
Fayetteville State University

81 Fayetteville State University
Office of Institutional Research 07/06/2009
Finance Report Fiscal Years 2004-2008
__________________________________________________________________
Type 2004 2005 2006 2007 2008 Operating Revenue $16,495,452 $19,351,152 $20,847,020 $24,829,149 $24,969,167 Non-operating Revenue $54,201,597 $57,088,831 $63,054,865 $67,379,229 $78,053,730 Other Revenue $6,276,177 $10,865,738 $14,479,229 $13,159,405 $8,234,267 Total Revenue $76,973,226 $87,305,721 $98,381,114 $105,367,783 $111,257,164 Operating Expenses $72,668,754 $80,131,201 $85,961,813 $97,500,607 $104,944,440 Non-operating Exp./Deduct. $380,695 $618,819 $297,569 $295,463 $298,490 Total Expenses $73,049,449 $80,750,020 $86,259,382 $97,796,070 $105,242,930

Fayetteville State UniversityIPEDS Finance Survey
Fiscal Year 2004Line Current Year
Number Revenues and other Additions AmountOperating Revenue
01 Tuition & Fees, after deducting discounts and allowances 10,152,117 Grants & contracts - operating:
02 Federal operating grants & contracts 1,729,00603 State operating grants & contracts 40,82204 Local/private operating grants & contracts 005 Sales & services of auxiliary enterprises after deducting discounts & allowances 4,513,43106 Sales & services of hospitals, after deducting discounts and allowances 007 Independent operations 008 Other sources 60,07609 Total operating revenues 16,495,452
Non-Operating Revenues10 Federal appropriations 011 State appropriations 37,418,31012 Local appropriations, education district taxes 0
Grants - non-operating13 Federal non-operating grants 8,053,34314 State non-operating grants 015 Local non-operating grants 016 Gifts, including contributions from affiliated organizations 404,24517 Investment income 957,49218 Other non-operating revenues 7,368,20719 Total non-operating revenues 54,201,597
Other Revenues and additions20 Capital appropriations 021 Capital grants and gifts 6,137,56622 Additions to permanent endowments 138,61123 Other revenues and additions 024 Total other revenues and additions 6,276,17725 Total all revenues and other additions 76,973,226
Expenses and other DeductionsOperating Expenses
01 Instruction 23,002,32602 Research 457,44203 Public service 3,841,40205 Academic support 7,822,02806 Student services 2,927,82107 Institutional support 10,828,64708 Operation and maintenance of plant 8,101,13709 Depreciation 2,139,24810 Scholarships and fellowships expenses, excluding discounts and allowances 4,113,82711 Auxiliary enterprises 9,108,27912 Hospital services 013 Independent operations 014 Other expenses and deductions 326,59715 Total operating expenses 72,668,754
Non-Operating Expenses and Deductions16 Interest 380,69517 Other non-operating expenses and deductions 018 Total non-operating expenses and deductions 380,69519 Total expenses and deductions 73,049,449
Fayetteville State UniversityOffice of Institutional Research07/06/2009 82

Line Current Year Prior Year# Revenues and other Additions Amount Amount
Operating Revenue01 Tuition & Fees, after deducting discounts and allowances 12,692,314 10,152,117 Grants & contracts - operating:
02 Federal operating grants & contracts 1,586,368 1,729,00603 State operating grants & contracts 11,859 40,82204 Local/private operating grants & contracts 0 0 05 Sales & services of auxiliary enterprises after deducting discounts & allowances 4,912,266 4,513,43106 Sales & services of hospitals, after deducting discounts and allowances 0 0 07 Independent operations 0 08 Other Sources 148,345 60,07609 Total operating revenues 19,351,152 16,495,452
Non-Operating Revenues10 Federal appropriations 0 0 11 State appropriations 38,340,345 37,418,31012 Local appropriations, education district taxes 0 0
Grants - non-operating 13 Federal non-operating grants 16,853,780 8,053,34314 State non-operating grants 398,115 015 Local non-operating grants 37,132 016 Gifts, including contributions from affiliated organizations 558,103 404,24517 Investment income 599,248 957,49218 Other non-operating revenues 302,108 7,368,20719 Total non-operating revenues 57,088,831 54,201,597
Other Revenues and additions20 Capital appropriations 604,200 0 21 Capital grants and gifts 10,201,114 6,137,56622 Additions to permanent endowments 60,424 138,61123 Other revenues and additions 0 024 Total other revenues and additions 10,865,738 6,276,17725 Total all revenues and other additions 87,305,721 76,973,226
Expenses and other DeductionsOperating Expenses
01 Instruction 26,860,609 23,002,32602 Research 569,484 457,44203 Public service 3,893,027 3,841,40205 Academic support 7,819,815 7,822,02806 Student services 3,526,034 2,927,82107 Institutional support 9,979,180 10,828,64708 Operation and maintenance of plant 9,895,538 8,101,13709 Depreciation 2,185,832 2,139,24810 Scholarships and fellowships expenses, excluding discounts and allowances 6,221,349 4,113,82711 Auxiliary enterprises 9,180,333 9,108,27912 Hospital services 0 013 Independent operations 0 014 Other expenses and deductions 0 326,59715 Total operating expenses 80,131,201 72,668,754
Non-Operating Expenses and Deductions16 Interest 618,819 380,69517 Other non-operating expenses and deductions 0 018 Total non-operating expenses and deductions 618,819 380,69519 Total expenses and deductions 80,750,020 73,049,449
Fayetteville State UniversityIPEDS Finance Survey
Fiscal Year 2005
Fayetteville State UniversityOffice of Institutional Research07/06/2009 83
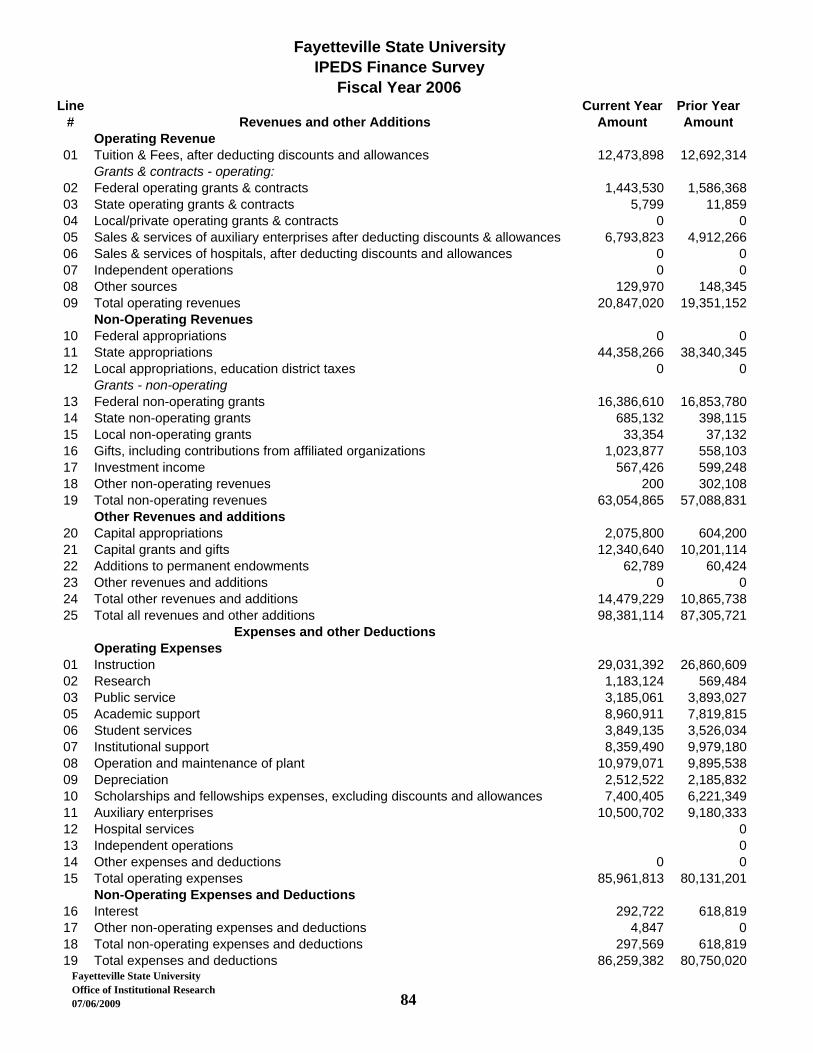
Line Current Year Prior Year# Revenues and other Additions Amount Amount
Operating Revenue01 Tuition & Fees, after deducting discounts and allowances 12,473,898 12,692,314 Grants & contracts - operating:
02 Federal operating grants & contracts 1,443,530 1,586,36803 State operating grants & contracts 5,799 11,85904 Local/private operating grants & contracts 0 005 Sales & services of auxiliary enterprises after deducting discounts & allowances 6,793,823 4,912,26606 Sales & services of hospitals, after deducting discounts and allowances 0 007 Independent operations 0 008 Other sources 129,970 148,34509 Total operating revenues 20,847,020 19,351,152
Non-Operating Revenues10 Federal appropriations 0 011 State appropriations 44,358,266 38,340,34512 Local appropriations, education district taxes 0 0
Grants - non-operating13 Federal non-operating grants 16,386,610 16,853,78014 State non-operating grants 685,132 398,11515 Local non-operating grants 33,354 37,13216 Gifts, including contributions from affiliated organizations 1,023,877 558,10317 Investment income 567,426 599,24818 Other non-operating revenues 200 302,10819 Total non-operating revenues 63,054,865 57,088,831
Other Revenues and additions20 Capital appropriations 2,075,800 604,20021 Capital grants and gifts 12,340,640 10,201,11422 Additions to permanent endowments 62,789 60,42423 Other revenues and additions 0 024 Total other revenues and additions 14,479,229 10,865,73825 Total all revenues and other additions 98,381,114 87,305,721
Expenses and other DeductionsOperating Expenses
01 Instruction 29,031,392 26,860,60902 Research 1,183,124 569,48403 Public service 3,185,061 3,893,02705 Academic support 8,960,911 7,819,81506 Student services 3,849,135 3,526,03407 Institutional support 8,359,490 9,979,18008 Operation and maintenance of plant 10,979,071 9,895,53809 Depreciation 2,512,522 2,185,83210 Scholarships and fellowships expenses, excluding discounts and allowances 7,400,405 6,221,34911 Auxiliary enterprises 10,500,702 9,180,33312 Hospital services 013 Independent operations 014 Other expenses and deductions 0 015 Total operating expenses 85,961,813 80,131,201
Non-Operating Expenses and Deductions16 Interest 292,722 618,81917 Other non-operating expenses and deductions 4,847 018 Total non-operating expenses and deductions 297,569 618,81919 Total expenses and deductions 86,259,382 80,750,020
Fayetteville State UniversityIPEDS Finance Survey
Fiscal Year 2006
Fayetteville State UniversityOffice of Institutional Research07/06/2009 84

Line Current Year Prior Year# Revenues and other Additions Amount Amount
Operating Revenue01 Tuition & Fees, after deducting discounts and allowances 15,380,206 12,473,898 Grants & contracts - operating:
02 Federal operating grants & contracts 2,808,636 1,443,53003 State operating grants & contracts 0 5,79904 Local/private operating grants & contracts 0 005 Sales & services of auxiliary enterprises after deducting discounts & allowances 5,901,363 6,793,82306 Sales & services of hospitals, after deducting discounts and allowances 0 007 Independent Operations 0 008 Other Sources 738,944 129,97009 Total operating revenues 24,829,149 20,847,020
Non-Operating Revenues10 Federal appropriations 0 011 State appropriations 49,198,094 44,358,26612 Local appropriations, education district taxes 0 0
Grants - non-operating13 Federal non-operating grants 15,316,178 16,386,61014 State non-operating grants 802,755 685,13215 Local non-operating grants 25,834 33,35416 Gifts, including contributions from affiliated organizations 752,912 1,023,87717 Investment income 1,265,037 567,42618 Other non-operating revenues 18,419 20019 Total non-operating revenues 67,379,229 63,054,865
Other Revenues and additions20 Capital appropriations 3,394,300 2,075,80021 Capital grants and gifts 9,532,961 12,340,64022 Additions to permanent endowments 232,144 62,78923 Other revenues and additions 0 024 Total other revenues and additions 13,159,405 14,479,22925 Total all revenues and other additions 105,367,783 98,381,114
Expenses and other DeductionsOperating Expenses
01 Instruction 31,669,256 29,031,39202 Research 1,051,645 1,183,12403 Public service 2,111,453 3,185,06105 Academic support 10,543,152 8,960,91106 Student services 3,993,186 3,849,13507 Institutional Support 10,159,547 8,359,49008 Operation and maintenance of plant 13,366,852 10,979,07109 Depreciation 2,919,683 2,512,52210 Scholarships and fellowships expenses, excluding discounts and allowances 9,521,294 7,400,40511 Auxiliary enterprises 12,164,539 10,500,70212 Hospital services 013 Independent operations 014 Other expenses and deductions 0 015 Total operating expenses 97,500,607 85,961,813
Non-Operating Expenses and Deductions16 Interest 269,358 292,72217 Other non-operating expenses and deductions 26,105 4,84718 Total non-operating expenses and deductions 295,463 297,56919 Total expenses and deductions 97,796,070 86,259,382
Fayetteville State UniversityIPEDS Finance Survey
Fiscal Year 2007
Fayetteville State UniversityOffice of Institutional Research07/06/2009 85
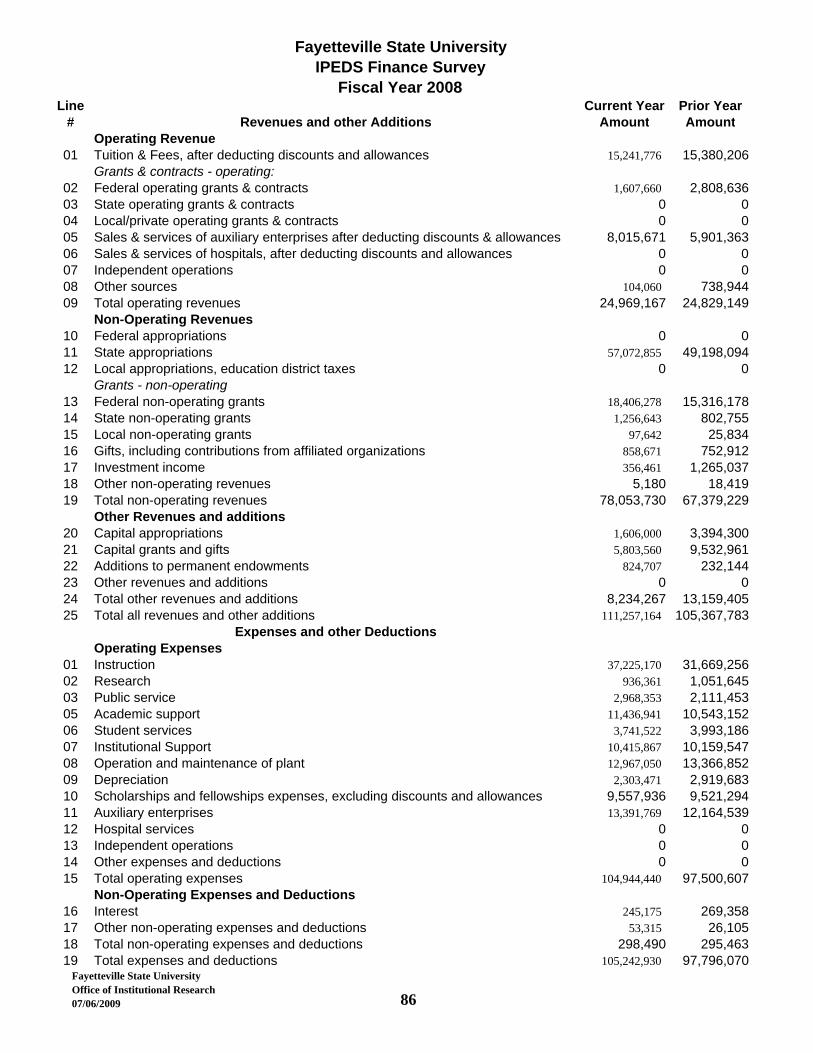
Line Current Year Prior Year# Revenues and other Additions Amount Amount
Operating Revenue01 Tuition & Fees, after deducting discounts and allowances 15,241,776 15,380,206 Grants & contracts - operating:
02 Federal operating grants & contracts 1,607,660 2,808,63603 State operating grants & contracts 0 004 Local/private operating grants & contracts 0 005 Sales & services of auxiliary enterprises after deducting discounts & allowances 8,015,671 5,901,36306 Sales & services of hospitals, after deducting discounts and allowances 0 007 Independent operations 0 008 Other sources 104,060 738,94409 Total operating revenues 24,969,167 24,829,149
Non-Operating Revenues10 Federal appropriations 0 011 State appropriations 57,072,855 49,198,09412 Local appropriations, education district taxes 0 0
Grants - non-operating13 Federal non-operating grants 18,406,278 15,316,17814 State non-operating grants 1,256,643 802,75515 Local non-operating grants 97,642 25,83416 Gifts, including contributions from affiliated organizations 858,671 752,91217 Investment income 356,461 1,265,03718 Other non-operating revenues 5,180 18,41919 Total non-operating revenues 78,053,730 67,379,229
Other Revenues and additions20 Capital appropriations 1,606,000 3,394,30021 Capital grants and gifts 5,803,560 9,532,96122 Additions to permanent endowments 824,707 232,14423 Other revenues and additions 0 024 Total other revenues and additions 8,234,267 13,159,40525 Total all revenues and other additions 111,257,164 105,367,783
Expenses and other DeductionsOperating Expenses
01 Instruction 37,225,170 31,669,25602 Research 936,361 1,051,64503 Public service 2,968,353 2,111,45305 Academic support 11,436,941 10,543,15206 Student services 3,741,522 3,993,18607 Institutional Support 10,415,867 10,159,54708 Operation and maintenance of plant 12,967,050 13,366,85209 Depreciation 2,303,471 2,919,68310 Scholarships and fellowships expenses, excluding discounts and allowances 9,557,936 9,521,29411 Auxiliary enterprises 13,391,769 12,164,53912 Hospital services 0 013 Independent operations 0 014 Other expenses and deductions 0 015 Total operating expenses 104,944,440 97,500,607
Non-Operating Expenses and Deductions16 Interest 245,175 269,35817 Other non-operating expenses and deductions 53,315 26,10518 Total non-operating expenses and deductions 298,490 295,46319 Total expenses and deductions 105,242,930 97,796,070
Fayetteville State UniversityIPEDS Finance Survey
Fiscal Year 2008
Fayetteville State UniversityOffice of Institutional Research07/06/2009 86

Draft Copy Only
1-5 6-8 9-11 12+ Yearly
In State Tuition 228.25
456.50
684.75
913.00
1,826.00
Out of State Tuition
1,501.00
3,002.00
4,503.00
6,004.00
12,008.00
Athletic
46.63
93.25 139.88
186.50
373.00
Health
14.38
28.75
43.13
57.50 115.00
Education and Technology Fee
28.13
56.25
84.38
112.50 225.00
Student Activities
48.25
96.50 144.75
193.00
386.00
Book Rental Fee 70 70 70 140 280 Student Government Association 0.12 0.25 0.38 0.5 1
Sub-Total General Fees 207.51 345 482.52 690 1,380.00
Indebtedness Fee
11.88
23.75
35.63
47.50
95.00
Bronco Card Fee
3.00
6.00
9.00
12.00
24.00
Student Medical Insurance 189.00
189.00
189.00
189.00
378.00
Sub-Total Other Fees 203.88
218.75
233.63
248.50
497.00
Sub-Total Fees 411.39
563.75
716.15
938.50
1,877.00
In State 639.64
1,020.25
1,400.90
1,851.50
3,703.00
Out of State
1,912.39
3,565.75
5,219.15
6,942.50
13,885.00
1,070.00
1,070.00
1,070.00
1,070.00
2,140.00
1,017.00
1,017.00
1,017.00
1,017.00
2,034.00
FAYETTEVILLE STATE UNIVERSITYDetailed Tuition and Fee Schedule for Fall 2008-Spring 2009
Undergraduate Semester CostCredit hours taken
Fees
Total Tuition and Fees (Non Boarder)
Meal Plans Declining Balance
21 Meal Plan $100 per year
17 Meal Plan $120 per year
87
FAyetteville State UniversityOffice of Institutional Research
07/06/2009
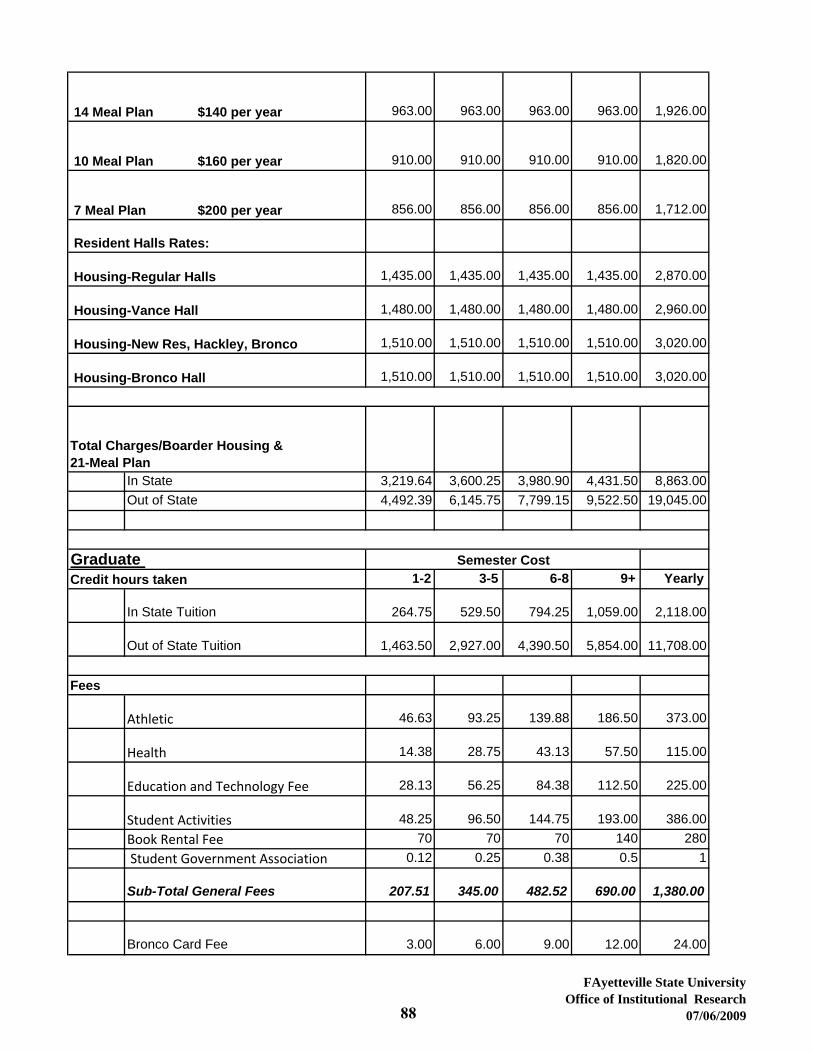
Draft Copy Only
963.00
963.00
963.00
963.00
1,926.00
910.00
910.00
910.00
910.00
1,820.00
856.00
856.00
856.00
856.00
1,712.00
1,435.00
1,435.00
1,435.00
1,435.00
2,870.00
1,480.00
1,480.00
1,480.00
1,480.00
2,960.00
1,510.00
1,510.00
1,510.00
1,510.00
3,020.00
1,510.00
1,510.00
1,510.00
1,510.00
3,020.00
In State 3,219.64 3,600.25 3,980.90 4,431.50 8,863.00Out of State 4,492.39 6,145.75 7,799.15 9,522.50 19,045.00
1-2 3-5 6-8 9+ Yearly
In State Tuition 264.75
529.50
794.25
1,059.00 2,118.00
Out of State Tuition
1,463.50
2,927.00
4,390.50
5,854.00 11,708.00
Athletic
46.63
93.25 139.88
186.50
373.00
Health
14.38
28.75
43.13
57.50 115.00
Education and Technology Fee
28.13
56.25
84.38
112.50 225.00
Student Activities
48.25
96.50 144.75
193.00
386.00
Book Rental Fee 70 70 70 140 280 Student Government Association 0.12 0.25 0.38 0.5 1
Sub-Total General Fees 207.51
345.00
482.52
690.00
1,380.00
Bronco Card Fee
3.00
6.00
9.00
12.00
24.00
Graduate Semester Cost
14 Meal Plan $140 per year
10 Meal Plan $160 per year
7 Meal Plan $200 per year
Resident Halls Rates:
Housing-Regular Halls
Housing-Vance Hall
Credit hours taken
Fees
Housing-New Res, Hackley, Bronco
Housing-Bronco Hall
Total Charges/Boarder Housing & 21-Meal Plan
88
FAyetteville State UniversityOffice of Institutional Research
07/06/2009

Draft Copy Only
Indebtedness Fee
11.88
23.75
35.63
47.50
95.00
Sub-Total Other Fees
14.88
29.75
44.63
59.50
119.00
Sub-Total Fees 222.39
374.75
527.15
749.50
1,499.00
In State 487.14 904.25 1,321.40 1,808.50 3,617.00Out of State 1,685.89 3,301.75 4,917.15 6,603.50 13,207.00
Total Tuition and Fees
89
FAyetteville State UniversityOffice of Institutional Research
07/06/2009

Fayetteville State University Office of Institutional Research
07/06/2009
90
Financial Aid 2003-2008 By Dollars __________________________________________________________________
Year Financial Aid (Dollars) 2003 33,390,183 2004 37,208,218 2005 44,630,951 2006* 51,588,666 2007* 43,914,890 2008* 51,015,641
*Modifications were made to the Financial Aid File categories
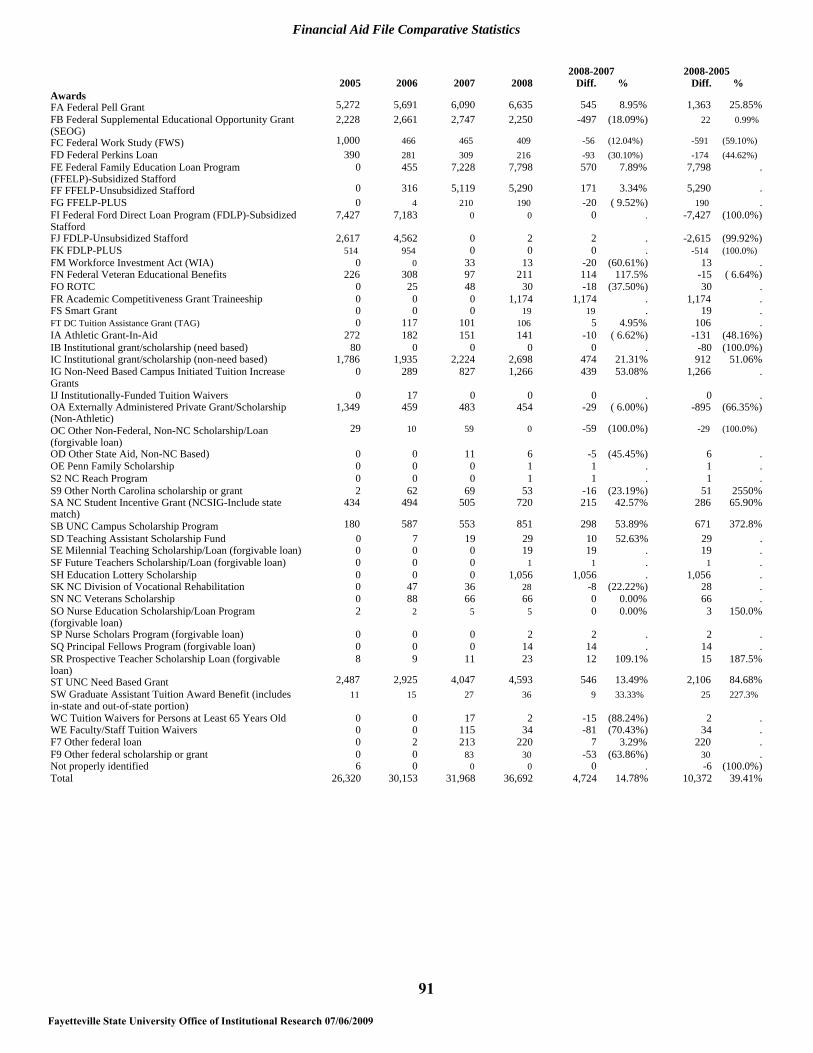
Financial Aid File Comparative Statistics
2008-2007
2008-2005
Awards FA Federal Pell Grant FB Federal Supplemental Educational Opportunity Grant (SEOG) FC Federal Work Study (FWS) FD Federal Perkins Loan
2005
5,272 2,228
1,000 390
2006
5,691 2,661
466 281
2007
6,090 2,747
465 309
2008
6,635 2,250
409 216
Diff. %
545 8.95% -497 (18.09%)
-56 (12.04%) -93 (30.10%)
Diff. %
1,363 25.85% 22 0.99%
-591 (59.10%) -174 (44.62%)
FE Federal Family Education Loan Program (FFELP)-Subsidized Stafford FF FFELP-Unsubsidized Stafford FG FFELP-PLUS
0
0 0
455
316 4
7,228
5,119 210
7,798
5,290 190
570 7.89%
171 3.34% -20 ( 9.52%)
7,798
5,290 190
.
.
. FI Federal Ford Direct Loan Program (FDLP)-Subsidized Stafford
7,427 7,183 0 0 0 . -7,427 (100.0%)
FJ FDLP-Unsubsidized Stafford FK FDLP-PLUS
2,617 514
4,562 954
0 0
2 0
2 0
.
. -2,615 (99.92%)
-514 (100.0%) FM Workforce Investment Act (WIA) 0 0 33 13 -20 (60.61%) 13 . FN Federal Veteran Educational Benefits 226 308 97 211 114 117.5% -15 ( 6.64%) FO ROTC 0 25 48 30 -18 (37.50%) 30 . FR Academic Competitiveness Grant Traineeship FS Smart Grant
0 0
0 0
0 0
1,174 19
1,174 19
.
. 1,174
19 . .
FT DC Tuition Assistance Grant (TAG) 0 117 101 106 5 4.95% 106 . IA Athletic Grant-In-Aid 272 182 151 141 -10 ( 6.62%) -131 (48.16%) IB Institutional grant/scholarship (need based) 80 0 0 0 0 . -80 (100.0%) IC Institutional grant/scholarship (non-need based) 1,786 1,935 2,224 2,698 474 21.31% 912 51.06% IG Non-Need Based Campus Initiated Tuition Increase Grants
0 289 827 1,266 439 53.08% 1,266 .
IJ Institutionally-Funded Tuition Waivers 0 17 0 0 0 . 0 . OA Externally Administered Private Grant/Scholarship (Non-Athletic) OC Other Non-Federal, Non-NC Scholarship/Loan (forgivable loan)
1,349
29
459
10
483
59
454
0
-29 ( 6.00%)
-59 (100.0%)
-895 (66.35%)
-29 (100.0%)
OD Other State Aid, Non-NC Based) 0 0 11 6 -5 (45.45%) 6 . OE Penn Family Scholarship S2 NC Reach Program
0 0
0 0
0 0
1 1
1 1
.
. 1 1
.
. S9 Other North Carolina scholarship or grant SA NC Student Incentive Grant (NCSIG-Include state match) SB UNC Campus Scholarship Program
2 434
180
62 494
587
69 505
553
53 720
851
-16 (23.19%) 215 42.57%
298 53.89%
51 2550% 286 65.90%
671 372.8% SD Teaching Assistant Scholarship Fund 0 7 19 29 10 52.63% 29 . SE Milennial Teaching Scholarship/Loan (forgivable loan) SF Future Teachers Scholarship/Loan (forgivable loan) SH Education Lottery Scholarship
0 0 0
0 0 0
0 0 0
19 1
1,056
19 1
1,056
.
.
.
19 1
1,056
.
.
. SK NC Division of Vocational Rehabilitation SN NC Veterans Scholarship
0 0
47 88
36 66
28 66
-8 (22.22%) 0 0.00%
28 66
.
. SO Nurse Education Scholarship/Loan Program (forgivable loan)
2 2 5 5 0 0.00% 3 150.0%
SP Nurse Scholars Program (forgivable loan) SQ Principal Fellows Program (forgivable loan)
0 0
0 0
0 0
2 14
2 14
.
. 2
14 . .
SR Prospective Teacher Scholarship Loan (forgivable loan) ST UNC Need Based Grant SW Graduate Assistant Tuition Award Benefit (includes in-state and out-of-state portion)
8
2,487 11
9
2,925 15
11
4,047 27
23
4,593 36
12 109.1%
546 13.49% 9 33.33%
15 187.5%
2,106 84.68% 25 227.3%
WC Tuition Waivers for Persons at Least 65 Years Old WE Faculty/Staff Tuition Waivers F7 Other federal loan F9 Other federal scholarship or grant
0 0 0 0
0 0 2 0
17 115 213
83
2 34
220 30
-15 (88.24%) -81 (70.43%)
7 3.29% -53 (63.86%)
2 34
220 30
.
.
.
. Not properly identified 6 0 0 0 0 . -6 (100.0%) Total 26,320 30,153 31,968 36,692 4,724 14.78% 10,372 39.41%
91 Fayetteville State University Office of Institutional Research 07/06/2009

Financial Aid File Comparative Statistics
2008-2007
2008-2005
Recipients FA Federal Pell Grant FB Federal Supplemental Educational Opportunity Grant (SEOG) FC Federal Work Study (FWS) FD Federal Perkins Loan
2005
2,835 1,202
532 213
2006
3,113 1,431
209 159
2007
3,326 1,488
268 227
2008
3,603 1,292
234 163
Diff. %
277 8.33% -196 (13.17%)
-34 (12.69%) -64 (28.19%)
Diff. %
768 27.09% 90 7.49%
-298 (56.02%) -50 (23.47%)
FE Federal Family Education Loan Program (FFELP)-Subsidized Stafford FF FFELP-Unsubsidized Stafford FG FFELP-PLUS
0
0 0
455
316 4
3,613
2,653 119
3,860
2,716 101
247 6.84%
63 2.37% -18 (15.13%)
3,860
2,716 101
.
.
. FI Federal Ford Direct Loan Program (FDLP)-Subsidized Stafford
3,109 3,494 0 0 0 . -3,109 (100.0%)
FJ FDLP-Unsubsidized Stafford FK FDLP-PLUS
1,082 240
2,195 447
0 0
1 0
1 0
.
. -1,081 (99.91%)
-240 (100.0%) FM Workforce Investment Act (WIA) 0 0 18 9 -9 (50.00%) 9 . FN Federal Veteran Educational Benefits 226 246 37 174 137 370.3% -52 (23.01%) FO ROTC 0 15 27 21 -6 (22.22%) 21 . FR Academic Competitiveness Grant Traineeship FS Smart Grant
0 0
0 0
0 0
629 12
629 12
.
. 629
12 . .
FT DC Tuition Assistance Grant (TAG) 0 50 52 56 4 7.69% 56 . IA Athletic Grant-In-Aid 120 101 79 80 1 1.27% -40 (33.33%) IB Institutional grant/scholarship (need based) 55 0 0 0 0 . -55 (100.0%) IC Institutional grant/scholarship (non-need based) 909 1,062 1,243 1,380 137 11.02% 471 51.82% IG Non-Need Based Campus Initiated Tuition Increase Grants
0 167 576 694 118 20.49% 694 .
IJ Institutionally-Funded Tuition Waivers 0 15 0 0 0 . 0 . OA Externally Administered Private Grant/Scholarship (Non-Athletic) OC Other Non-Federal, Non-NC Scholarship/Loan (forgivable loan)
617
15
239
9
242
39
258
0
16 6.61%
-39 (100.0%)
-359 (58.18%)
-15 (100.0%)
OD Other State Aid, Non-NC Based) 0 0 5 3 -2 (40.00%) 3 . OE Penn Family Scholarship S2 NC Reach Program
0 0
0 0
0 0
1 1
1 1
.
. 1 1
.
. S9 Other North Carolina scholarship or grant SA NC Student Incentive Grant (NCSIG-Include state match) SB UNC Campus Scholarship Program
1 235
93
28 245
427
33 281
425
33 385
487
0 0.00% 104 37.01%
62 14.59%
32 3200% 150 63.83%
394 423.7% SD Teaching Assistant Scholarship Fund 0 6 10 29 19 190.0% 29 . SE Milennial Teaching Scholarship/Loan (forgivable loan) SF Future Teachers Scholarship/Loan (forgivable loan) SH Education Lottery Scholarship
0 0 0
0 0 0
0 0 0
19 1
574
19 1
574
.
.
.
19 1
574
.
.
. SK NC Division of Vocational Rehabilitation SN NC Veterans Scholarship
0 0
31 39
20 30
15 32
-5 (25.00%) 2 6.67%
15 32
.
. SO Nurse Education Scholarship/Loan Program (forgivable loan)
1 2 3 3 0 0.00% 2 200.0%
SP Nurse Scholars Program (forgivable loan) SQ Principal Fellows Program (forgivable loan)
0 0
0 0
0 0
1 7
1 7
.
. 1 7
.
. SR Prospective Teacher Scholarship Loan (forgivable loan) ST UNC Need Based Grant SW Graduate Assistant Tuition Award Benefit (includes in-state and out-of-state portion)
4
1,305 7
5
1,404 10
6
2,127 14
13
2,416 19
7 116.7%
289 13.59% 5 35.71%
9 225.0%
1,111 85.13% 12 171.4%
WC Tuition Waivers for Persons at Least 65 Years Old WE Faculty/Staff Tuition Waivers F7 Other federal loan F9 Other federal scholarship or grant
0 0 0 0
0 0 2 0
11 71
127 55
1 26
126 19
-10 (90.91%) -45 (63.38%)
-1 ( 0.79%) -36 (65.45%)
1 26
126 19
.
.
.
. Not properly identified 3 0 0 0 0 . -3 (100.0%) Total Recipients 12,804 15,926 17,225 19,494 2,269 13.17% 6,690 52.25%
92 Fayetteville State University Office of Institutional Research 07/06/2009

Financial Aid File Comparative Statistics
2008-2007
2008-2005
Dollars Awarded
2005 2006 2007 2008 Diff. % Diff. %
FA Federal Pell Grant $8,314,543 $8,885,030 $9,750,543 $11,271,205 $1,520,662 15.60% $2,956,662 35.56% FB Federal Supplemental Educational Opportunity Grant (SEOG)
811,825 818,702 881,631 763,636 -117,995 (13.38%) -48,189 ( 5.94%)
FC Federal Work Study (FWS) 470,750 306,977 373,860 295,886 -77,974 (20.86%) -174,864 (37.15%) FD Federal Perkins Loan 484,411 459,247 536,228 361,093 -175,135 (32.66%) -123,318 (25.46%) FE Federal Family Education Loan Program (FFELP)-Subsidized Stafford
0 770,795 12,926,459 15,534,647 2,608,188 20.18% 15,534,647 .
FF FFELP-Unsubsidized Stafford 0 439,582 9,388,840 10,055,988 667,148 7.11% 10,055,988 . FG FFELP-PLUS 0 7,719 662,683 506,658 -156,025 (23.54%) 506,658 . FI Federal Ford Direct Loan Program (FDLP)-Subsidized Stafford FJ FDLP-Unsubsidized Stafford FK FDLP-PLUS
11,170,325 11,415,747
3,569,370 7,228,363 1,376,311 2,414,289
0
0 0
0
4,950 0
0
4,950 0
. -11,170,325 (100.0%)
. -3,564,420 (99.86%)
. -1,376,311 (100.0%) FM Workforce Investment Act (WIA) 0 0 44,879 10,914 -33,965 (75.68%) 10,914 . FN Federal Veteran Educational Benefits 1,913,523 1,735,586 178,448 1,262,833 1,084,385 607.7% -650,690 (34.00%) FO ROTC 0 46,356 103,090 69,087 -34,003 (32.98%) 69,087 . FR Academic Competitiveness Grant Traineeship 0 0 0 446,993 446,993 . 446,993 . FS Smart Grant 0 0 0 30,093 30,093 . 30,093 . FT DC Tuition Assistance Grant (TAG) 0 488,567 483,975 526,454 42,479 8.78% 526,454 . IA Athletic Grant-In-Aid 515,116 413,371 369,376 386,511 17,135 4.64% -128,605 (24.97%) IB Institutional grant/scholarship (need based) 61,264 0 0 0 0 . -61,264 (100.0%) IC Institutional grant/scholarship (non-need based) 1,380,576 679,835 911,377 984,350 72,973 8.01% -396,226 (28.70%) IG Non-Need Based Campus Initiated Tuition Increase Grants
0 260,352 698,156 1,036,334 338,178 48.44% 1,036,334 .
IJ Institutionally-Funded Tuition Waivers 0 4,932 0 0 0 . 0 . OA Externally Administered Private Grant/Scholarship (Non-Athletic)
1,662,345 403,695 424,108 379,286 -44,822 (10.57%) -1,283,059 (77.18%)
OC Other Non-Federal, Non-NC Scholarship/Loan (forgivable loan)
49,389 55,700 107,395 0 -107,395 (100.0%) -49,389 (100.0%)
OD Other State Aid, Non-NC Based) 0 0 21,408 14,779 -6,629 (30.97%) 14,779 . OE Penn Family Scholarship S2 NC Reach Program
0 0
0 0
0 0
3,000 3,038
3,000 3,038
.
. 3,000 3,038
.
. S9 Other North Carolina scholarship or grant 765 78,361 109,102 86,734 -22,368 (20.50%) 85,969 11238% SA NC Student Incentive Grant (NCSIG-Include state match) SB UNC Campus Scholarship Program
151,797 162,866 175,053 250,251
177,697 374,439 404,533 381,878
75,198 42.96%
-22,655 ( 5.60%)
98,454 64.86%
204,181 114.9% SD Teaching Assistant Scholarship Fund 0 11,200 22,800 78,000 55,200 242.1% 78,000 . SE Milennial Teaching Scholarship/Loan (forgivable loan) 0 0 0 117,000 117,000 . 117,000 . SF Future Teachers Scholarship/Loan (forgivable loan) 0 0 0 3,250 3,250 . 3,250 . SH Education Lottery Scholarship 0 0 0 690,605 690,605 . 690,605 . SK NC Division of Vocational Rehabilitation 0 61,782 31,632 27,585 -4,047 (12.79%) 27,585 . SN NC Veterans Scholarship 0 128,957 147,291 169,893 22,602 15.35% 169,893 . SO Nurse Education Scholarship/Loan Program (forgivable loan)
5,000 3,250 3,000 6,673 3,673 122.4% 1,673 33.46%
SP Nurse Scholars Program (forgivable loan) 0 0 0 5,000 5,000 . 5,000 . SQ Principal Fellows Program (forgivable loan) 0 0 0 202,960 202,960 . 202,960 . SR Prospective Teacher Scholarship Loan (forgivable loan)
5,500 14,050 13,750 43,000 29,250 212.7% 37,500 681.8%
ST UNC Need Based Grant 1,329,122 1,736,436 3,031,021 4,174,578 1,143,557 37.73% 2,845,456 214.1% SW Graduate Assistant Tuition Award Benefit (includes in-state and out-of-state portion)
8,697 13,551 66,171 91,638 25,467 38.49% 82,941 953.7%
WC Tuition Waivers for Persons at Least 65 Years Old WE Faculty/Staff Tuition Waivers
0 0
0 0
17,543 49,761
1,900 13,917
-15,643 (89.17%) -35,844 (72.03%)
1,900 13,917
.
. F7 Other federal loan 0 4,263 696,753 690,190 -6,563 ( 0.94%) 690,190 . F9 Other federal scholarship or grant 0 0 82,832 32,854 -49,978 (60.34%) 32,854 . Not properly identified 2,300 0 0 0 0 . -2,300 (100.0%) Total 33,460,626 39,424,000 42,713,698 51,015,641 8,301,943 19.44% 17,555,015 52.46%
93 Fayetteville State University Office of Institutional Research 07/06/2009

For this report, need calculated for the academic year is reduced to represent the number of semesters attended. 94
Summary of Financial Need Not Met by Financial Aid Awardsfor Enrolled Students in the 2004-05 Academic Year
FSUUndergraduate Students Graduate Students All Students
In-StateStudents
Out-Of-StateStudents
TotalIn-State &
Out-of-StateStudents
In-StateStudents
Out-Of-StateStudents
TotalIn-State &
Out-of-StateStudents
In-StateStudents
Out-Of-StateStudents
TotalIn-State &
Out-of-StateStudents
Total Average Annual FTE 3,541 366 3,906 627 22 648 4,167 387 4,554Total Need $32,697,430 $5,037,177 $37,734,606 $3,067,976 $87,667 $3,155,643 $35,765,405 $5,124,844 $40,890,249Per FTE 9,235 13772 23007 4,896 4,078 8,974 14131 17850 31981Need Less Gift Aid $26,008,454 $3,905,165 $29,913,619 $3,017,254 $86,358 $3,103,612 $29,025,707 $3,991,523 $33,017,230Per FTE 7,346 10677 18023 4,815 4,017 8,832 12161 14694 26855Need Less Gift, CWS & Subsidized Loans $21,204,109 $3,377,941 $24,582,050 $1,887,226 $52,514 $1,939,740 $23,091,335 $3,430,455 $26,521,790Per FTE 5,989 9,236 15225 3,012 2,443 5,454 9,001 11678 20679Need Less Aid From All Sources $19,812,498 $2,881,978 $22,694,476 $1,565,503 $38,726 $1,604,229 $21,378,001 $2,920,704 $24,298,704Per FTE 5,596 7,880 13476 2,498 1,801 4,300 8,094 9,681 17775Total Unduplicated Headcount 4,405 469 4,874 1,232 44 1,276 5,637 513 6,150Number of Students With Need 3,041 295 3,336 315 8 323 3,356 303 3,659% of Students With Need 69.0 62.9 68.4 25.6 18.2 25.3 59.5 59.1 59.5Number of Students With Need After Gift Aid 2,959 275 3,234 313 8 321 3,272 283 3,555% of Students With Need After Gift Aid 67.2 58.6 66.4 25.4 18.2 25.2 58.0 55.2 57.8Number of Students With Need After Gift,CWS, & Subsidized Loans 2,908 270 3,178 295 8 303 3,203 278 3,481% of Students With Need After Gift,CWS, & Subsidized Loans 66.0 57.6 65.2 23.9 18.2 23.7 56.8 54.2 56.6Number of Students With Need After Aid From AllSources 2,793 247 3,040 260 8 268 3,053 255 3,308% of Students With Need After Aid From AllSources 63.4 52.7 62.4 21.1 18.2 21.0 54.2 49.7 53.8
Fayetteville State University Office of Institutional Research 07/06/2009
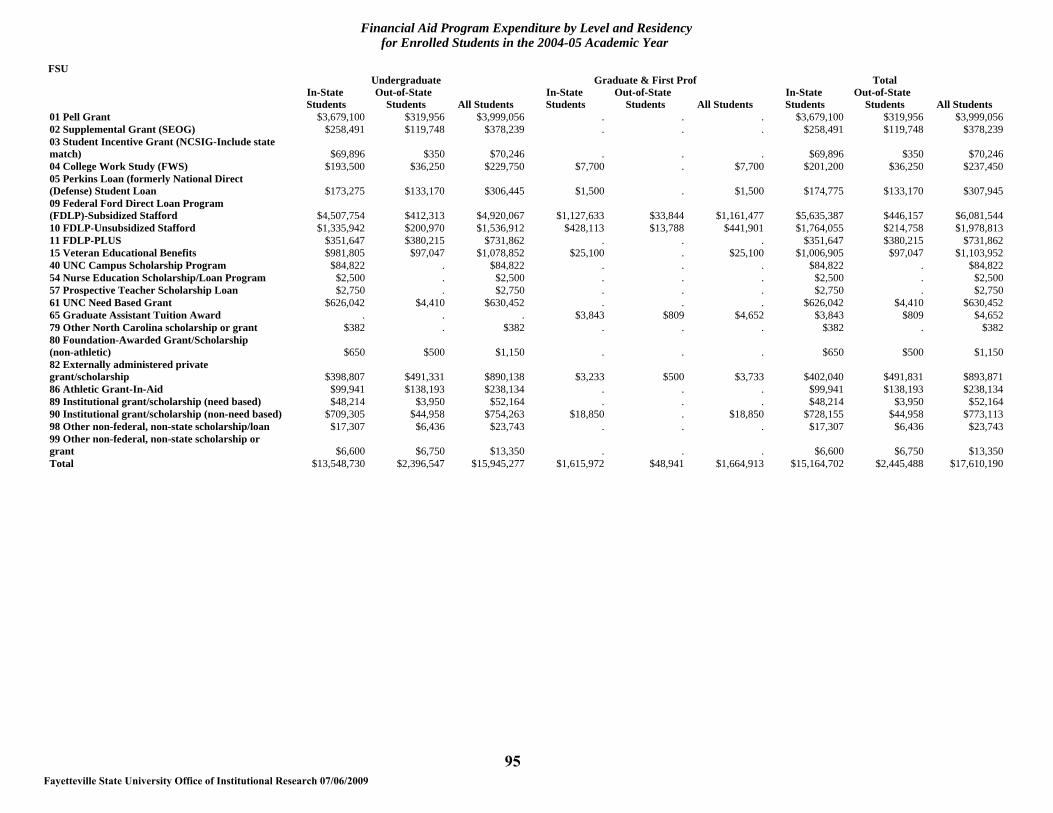
Financial Aid Program Expenditure by Level and Residencyfor Enrolled Students in the 2004-05 Academic Year
FSUUndergraduate Graduate & First Prof Total
In-StateStudents
Out-of-StateStudents All Students
In-StateStudents
Out-of-StateStudents All Students
In-StateStudents
Out-of-StateStudents All Students
01 Pell Grant $3,679,100 $319,956 $3,999,056 . . . $3,679,100 $319,956 $3,999,05602 Supplemental Grant (SEOG) $258,491 $119,748 $378,239 . . . $258,491 $119,748 $378,23903 Student Incentive Grant (NCSIG-Include statematch) $69,896 $350 $70,246 . . . $69,896 $350 $70,24604 College Work Study (FWS) $193,500 $36,250 $229,750 $7,700 . $7,700 $201,200 $36,250 $237,45005 Perkins Loan (formerly National Direct(Defense) Student Loan $173,275 $133,170 $306,445 $1,500 . $1,500 $174,775 $133,170 $307,94509 Federal Ford Direct Loan Program(FDLP)-Subsidized Stafford $4,507,754 $412,313 $4,920,067 $1,127,633 $33,844 $1,161,477 $5,635,387 $446,157 $6,081,54410 FDLP-Unsubsidized Stafford $1,335,942 $200,970 $1,536,912 $428,113 $13,788 $441,901 $1,764,055 $214,758 $1,978,81311 FDLP-PLUS $351,647 $380,215 $731,862 . . . $351,647 $380,215 $731,86215 Veteran Educational Benefits $981,805 $97,047 $1,078,852 $25,100 . $25,100 $1,006,905 $97,047 $1,103,95240 UNC Campus Scholarship Program $84,822 . $84,822 . . . $84,822 . $84,82254 Nurse Education Scholarship/Loan Program $2,500 . $2,500 . . . $2,500 . $2,50057 Prospective Teacher Scholarship Loan $2,750 . $2,750 . . . $2,750 . $2,75061 UNC Need Based Grant $626,042 $4,410 $630,452 . . . $626,042 $4,410 $630,45265 Graduate Assistant Tuition Award . . . $3,843 $809 $4,652 $3,843 $809 $4,65279 Other North Carolina scholarship or grant $382 . $382 . . . $382 . $38280 Foundation-Awarded Grant/Scholarship(non-athletic) $650 $500 $1,150 . . . $650 $500 $1,15082 Externally administered privategrant/scholarship $398,807 $491,331 $890,138 $3,233 $500 $3,733 $402,040 $491,831 $893,87186 Athletic Grant-In-Aid $99,941 $138,193 $238,134 . . . $99,941 $138,193 $238,13489 Institutional grant/scholarship (need based) $48,214 $3,950 $52,164 . . . $48,214 $3,950 $52,16490 Institutional grant/scholarship (non-need based) $709,305 $44,958 $754,263 $18,850 . $18,850 $728,155 $44,958 $773,11398 Other non-federal, non-state scholarship/loan $17,307 $6,436 $23,743 . . . $17,307 $6,436 $23,74399 Other non-federal, non-state scholarship orgrant $6,600 $6,750 $13,350 . . . $6,600 $6,750 $13,350Total $13,548,730 $2,396,547 $15,945,277 $1,615,972 $48,941 $1,664,913 $15,164,702 $2,445,488 $17,610,190 95
Fayetteville State University Office of Institutional Research 07/06/2009
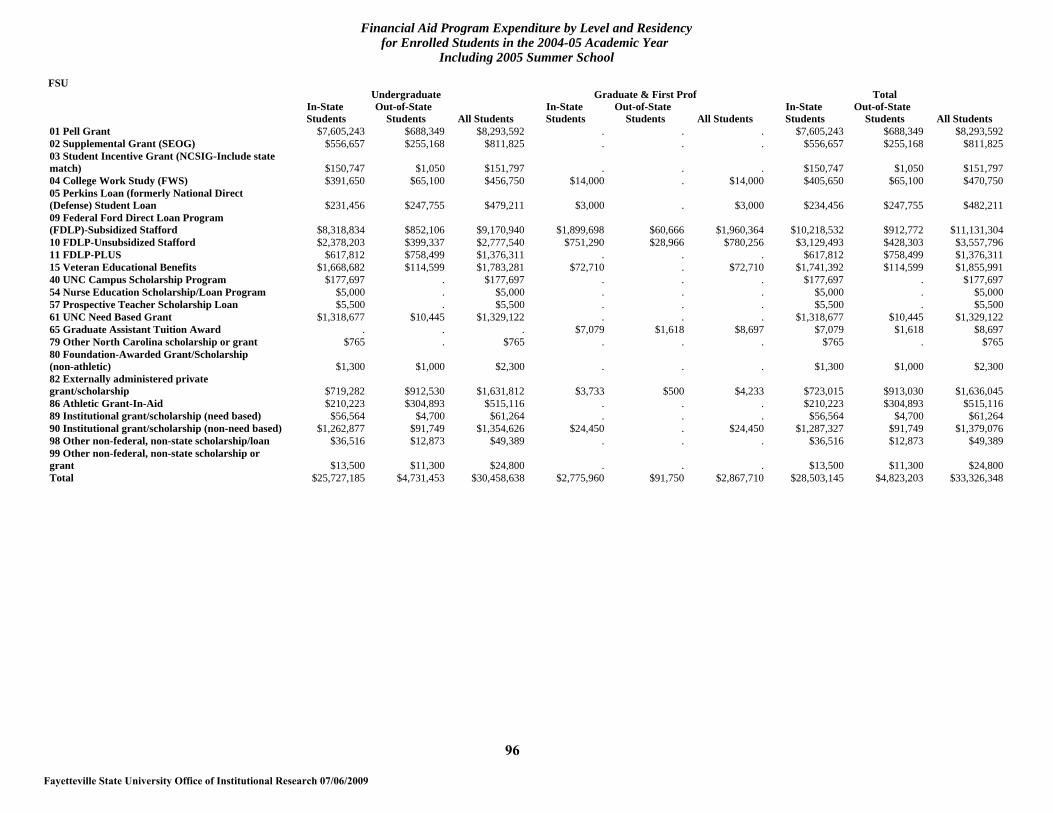
Financial Aid Program Expenditure by Level and Residencyfor Enrolled Students in the 2004-05 Academic Year
Including 2005 Summer School
FSUUndergraduate Graduate & First Prof Total
In-StateStudents
Out-of-StateStudents All Students
In-StateStudents
Out-of-StateStudents All Students
In-StateStudents
Out-of-StateStudents All Students
01 Pell Grant $7,605,243 $688,349 $8,293,592 . . . $7,605,243 $688,349 $8,293,59202 Supplemental Grant (SEOG) $556,657 $255,168 $811,825 . . . $556,657 $255,168 $811,82503 Student Incentive Grant (NCSIG-Include statematch) $150,747 $1,050 $151,797 . . . $150,747 $1,050 $151,79704 College Work Study (FWS) $391,650 $65,100 $456,750 $14,000 . $14,000 $405,650 $65,100 $470,75005 Perkins Loan (formerly National Direct(Defense) Student Loan $231,456 $247,755 $479,211 $3,000 . $3,000 $234,456 $247,755 $482,21109 Federal Ford Direct Loan Program(FDLP)-Subsidized Stafford $8,318,834 $852,106 $9,170,940 $1,899,698 $60,666 $1,960,364 $10,218,532 $912,772 $11,131,30410 FDLP-Unsubsidized Stafford $2,378,203 $399,337 $2,777,540 $751,290 $28,966 $780,256 $3,129,493 $428,303 $3,557,79611 FDLP-PLUS $617,812 $758,499 $1,376,311 . . . $617,812 $758,499 $1,376,31115 Veteran Educational Benefits $1,668,682 $114,599 $1,783,281 $72,710 . $72,710 $1,741,392 $114,599 $1,855,99140 UNC Campus Scholarship Program $177,697 . $177,697 . . . $177,697 . $177,69754 Nurse Education Scholarship/Loan Program $5,000 . $5,000 . . . $5,000 . $5,00057 Prospective Teacher Scholarship Loan $5,500 . $5,500 . . . $5,500 . $5,50061 UNC Need Based Grant $1,318,677 $10,445 $1,329,122 . . . $1,318,677 $10,445 $1,329,12265 Graduate Assistant Tuition Award . . . $7,079 $1,618 $8,697 $7,079 $1,618 $8,69779 Other North Carolina scholarship or grant $765 . $765 . . . $765 . $76580 Foundation-Awarded Grant/Scholarship(non-athletic) $1,300 $1,000 $2,300 . . . $1,300 $1,000 $2,30082 Externally administered privategrant/scholarship $719,282 $912,530 $1,631,812 $3,733 $500 $4,233 $723,015 $913,030 $1,636,04586 Athletic Grant-In-Aid $210,223 $304,893 $515,116 . . . $210,223 $304,893 $515,11689 Institutional grant/scholarship (need based) $56,564 $4,700 $61,264 . . . $56,564 $4,700 $61,26490 Institutional grant/scholarship (non-need based) $1,262,877 $91,749 $1,354,626 $24,450 . $24,450 $1,287,327 $91,749 $1,379,07698 Other non-federal, non-state scholarship/loan $36,516 $12,873 $49,389 . . . $36,516 $12,873 $49,38999 Other non-federal, non-state scholarship orgrant $13,500 $11,300 $24,800 . . . $13,500 $11,300 $24,800Total $25,727,185 $4,731,453 $30,458,638 $2,775,960 $91,750 $2,867,710 $28,503,145 $4,823,203 $33,326,348 96
Fayetteville State University Office of Institutional Research 07/06/2009
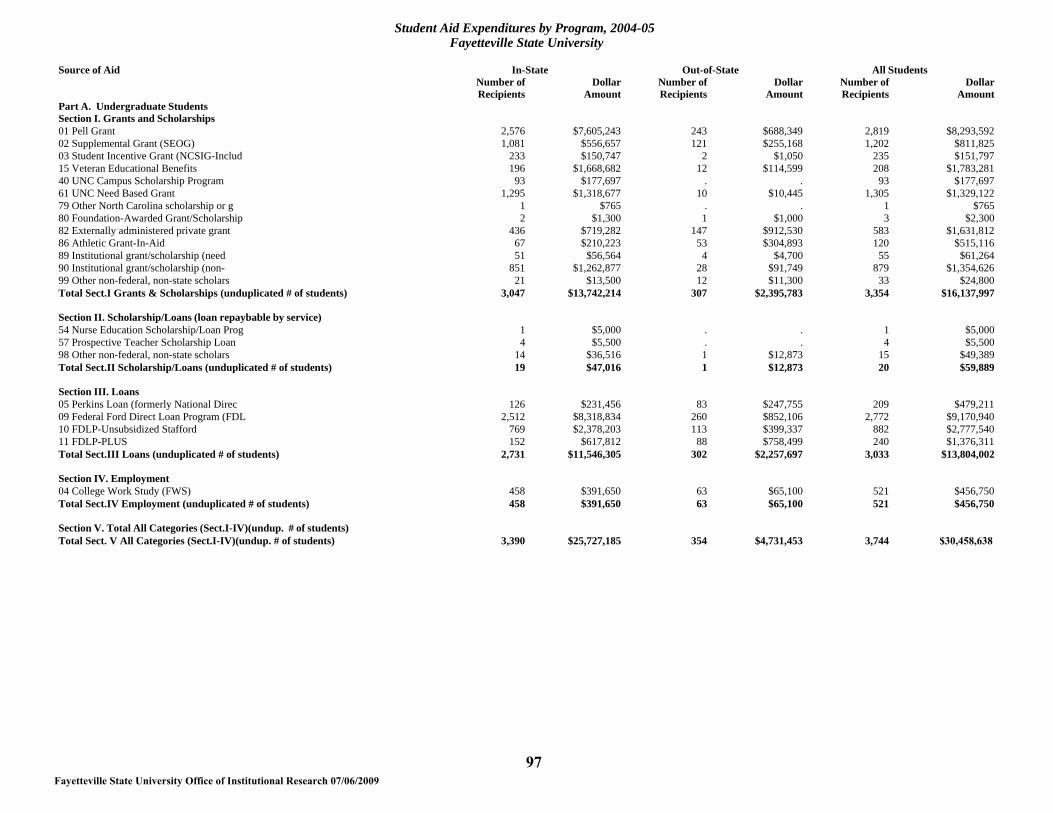
Student Aid Expenditures by Program, 2004-05Fayetteville State University
Source of Aid In-State Out-of-State All StudentsNumber ofRecipients
DollarAmount
Number ofRecipients
DollarAmount
Number ofRecipients
DollarAmount
Part A. Undergraduate StudentsSection I. Grants and Scholarships01 Pell Grant 2,576 $7,605,243 243 $688,349 2,819 $8,293,59202 Supplemental Grant (SEOG) 1,081 $556,657 121 $255,168 1,202 $811,82503 Student Incentive Grant (NCSIG-Includ 233 $150,747 2 $1,050 235 $151,79715 Veteran Educational Benefits 196 $1,668,682 12 $114,599 208 $1,783,28140 UNC Campus Scholarship Program 93 $177,697 . . 93 $177,69761 UNC Need Based Grant 1,295 $1,318,677 10 $10,445 1,305 $1,329,12279 Other North Carolina scholarship or g 1 $765 . . 1 $76580 Foundation-Awarded Grant/Scholarship 2 $1,300 1 $1,000 3 $2,30082 Externally administered private grant 436 $719,282 147 $912,530 583 $1,631,81286 Athletic Grant-In-Aid 67 $210,223 53 $304,893 120 $515,11689 Institutional grant/scholarship (need 51 $56,564 4 $4,700 55 $61,26490 Institutional grant/scholarship (non- 851 $1,262,877 28 $91,749 879 $1,354,62699 Other non-federal, non-state scholars 21 $13,500 12 $11,300 33 $24,800Total Sect.I Grants & Scholarships (unduplicated # of students) 3,047 $13,742,214 307 $2,395,783 3,354 $16,137,997
Section II. Scholarship/Loans (loan repaybable by service)54 Nurse Education Scholarship/Loan Prog 1 $5,000 . . 1 $5,00057 Prospective Teacher Scholarship Loan 4 $5,500 . . 4 $5,50098 Other non-federal, non-state scholars 14 $36,516 1 $12,873 15 $49,389Total Sect.II Scholarship/Loans (unduplicated # of students) 19 $47,016 1 $12,873 20 $59,889
Section III. Loans05 Perkins Loan (formerly National Direc 126 $231,456 83 $247,755 209 $479,21109 Federal Ford Direct Loan Program (FDL 2,512 $8,318,834 260 $852,106 2,772 $9,170,94010 FDLP-Unsubsidized Stafford 769 $2,378,203 113 $399,337 882 $2,777,54011 FDLP-PLUS 152 $617,812 88 $758,499 240 $1,376,311Total Sect.III Loans (unduplicated # of students) 2,731 $11,546,305 302 $2,257,697 3,033 $13,804,002
Section IV. Employment04 College Work Study (FWS) 458 $391,650 63 $65,100 521 $456,750Total Sect.IV Employment (unduplicated # of students) 458 $391,650 63 $65,100 521 $456,750
Section V. Total All Categories (Sect.I-IV)(undup. # of students)Total Sect. V All Categories (Sect.I-IV)(undup. # of students) 3,390 $25,727,185 354 $4,731,453 3,744 $30,458,638 97
Fayetteville State University Office of Institutional Research 07/06/2009

Student Aid Expenditures by Program, 2004-05Fayetteville State University
Source of Aid In-State Out-of-State All StudentsNumber ofRecipients
DollarAmount
Number ofRecipients
DollarAmount
Number ofRecipients
DollarAmount
Part B. Graduate StudentsSection I. Grants and Scholarships15 Veteran Educational Benefits 12 $72,710 . . 12 $72,71065 Graduate Assistant Tuition Award 6 $7,079 1 $1,618 7 $8,69782 Externally administered private grant 4 $3,733 1 $500 5 $4,23390 Institutional grant/scholarship (non- 28 $24,450 . . 28 $24,450Total Sect.I Grants & Scholarships (unduplicated # of students) 50 $107,972 2 $2,118 52 $110,090
Section III. Loans05 Perkins Loan (formerly National Direc 2 $3,000 . . 2 $3,00009 Federal Ford Direct Loan Program (FDL 315 $1,899,698 10 $60,666 325 $1,960,36410 FDLP-Unsubsidized Stafford 190 $751,290 6 $28,966 196 $780,256Total Sect.III Loans (unduplicated # of students) 343 $2,653,988 10 $89,632 353 $2,743,620
Section IV. Employment04 College Work Study (FWS) 11 $14,000 . . 11 $14,000Total Sect.IV Employment (unduplicated # of students) 11 $14,000 . . 11 $14,000
Section V. Total All Categories (Sect.I-IV)(undup. # of students)Total Sect. V All Categories (Sect.I-IV)(undup. # of students) 350 $2,775,960 10 $91,750 360 $2,867,710 98
Fayetteville State University Office of Institutional Research 07/06/2009
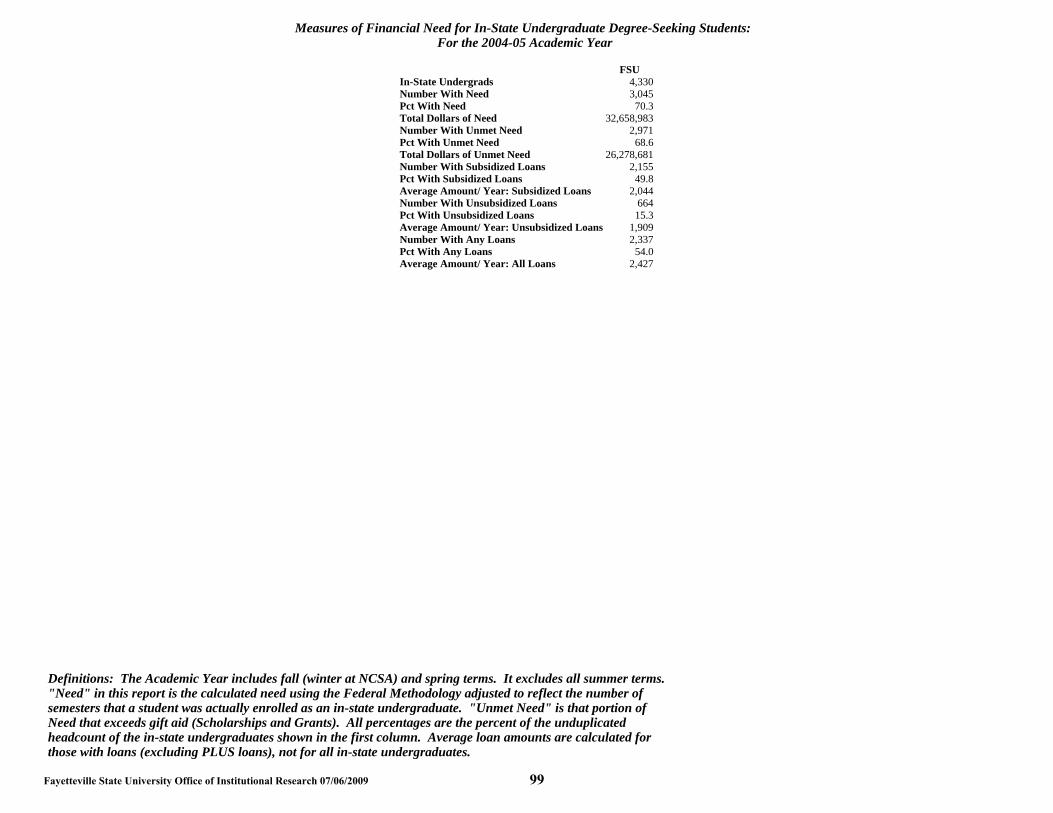
those with loans (excluding PLUS loans), not for all in-state undergraduates.headcount of the in-state undergraduates shown in the first column. Average loan amounts are calculated forNeed that exceeds gift aid (Scholarships and Grants). All percentages are the percent of the unduplicatedsemesters that a student was actually enrolled as an in-state undergraduate. "Unmet Need" is that portion of"Need" in this report is the calculated need using the Federal Methodology adjusted to reflect the number ofDefinitions: The Academic Year includes fall (winter at NCSA) and spring terms. It excludes all summer terms.
Measures of Financial Need for In-State Undergraduate Degree-Seeking Students:For the 2004-05 Academic Year
FSUIn-State Undergrads 4,330Number With Need 3,045Pct With Need 70.3Total Dollars of Need 32,658,983Number With Unmet Need 2,971Pct With Unmet Need 68.6Total Dollars of Unmet Need 26,278,681Number With Subsidized Loans 2,155Pct With Subsidized Loans 49.8Average Amount/ Year: Subsidized Loans 2,044Number With Unsubsidized Loans 664Pct With Unsubsidized Loans 15.3Average Amount/ Year: Unsubsidized Loans 1,909Number With Any Loans 2,337Pct With Any Loans 54.0Average Amount/ Year: All Loans 2,427
Fayetteville State University Office of Institutional Research 07/06/2009 99

be called UNC Campus Scholarships in the future.combined and added to category 45. Category 45 willNote: In 2003-04 categories 41,42,44,46, and 60 were
Financial Aid Program Expenditure forEnrolled Students in the 2004-05 Academic Year
Plus 2005 Summer SchoolComparison between amounts reported via Financial Aid File (FAF)
and amounts reported by SEAA
FSUFAF
DollarsSEAADollars
DollarDifference Percent
03 Student Incentive Grant (NCSIG-Include state match) 70,246 155,750 -85,504 -54.940 UNC Campus Scholarship Program 84,822 396,107 -311,285 -78.642 Teaching Assistant Scholarship Fund 0 59,200 -59,200 -100.061 UNC Need Based Grant 630,452 1,354,878 -724,426 -53.5Total 785,520 1,965,935 -1,180,415 -60.0
Fayetteville State University Office of Institutional Research 07/06/2009 100
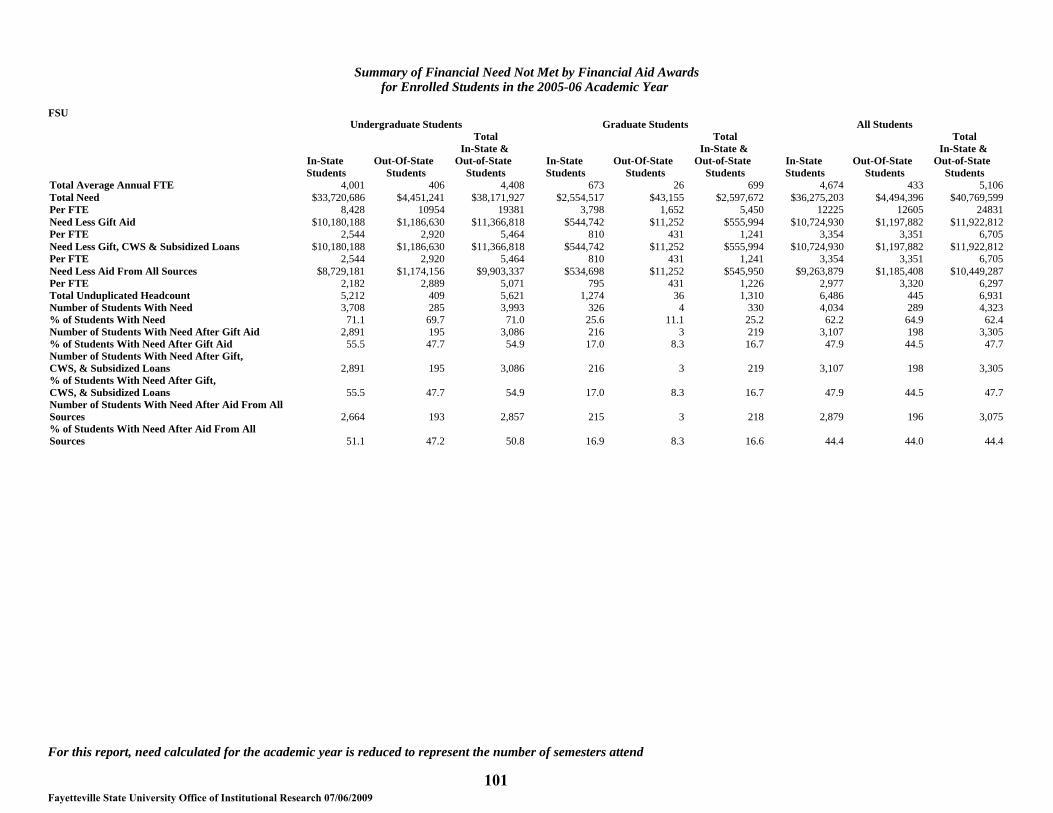
For this report, need calculated for the academic year is reduced to represent the number of semesters attend 101 Fayetteville State University Office of Institutional Research 07/06/2009
Summary of Financial Need Not Met by Financial Aid Awardsfor Enrolled Students in the 2005-06 Academic Year
FSUUndergraduate Students Graduate Students All Students
In-StateStudents
Out-Of-StateStudents
TotalIn-State &
Out-of-StateStudents
In-StateStudents
Out-Of-StateStudents
TotalIn-State &
Out-of-StateStudents
In-StateStudents
Out-Of-StateStudents
TotalIn-State &
Out-of-StateStudents
Total Average Annual FTE 4,001 406 4,408 673 26 699 4,674 433 5,106Total Need $33,720,686 $4,451,241 $38,171,927 $2,554,517 $43,155 $2,597,672 $36,275,203 $4,494,396 $40,769,599Per FTE 8,428 10954 19381 3,798 1,652 5,450 12225 12605 24831Need Less Gift Aid $10,180,188 $1,186,630 $11,366,818 $544,742 $11,252 $555,994 $10,724,930 $1,197,882 $11,922,812Per FTE 2,544 2,920 5,464 810 431 1,241 3,354 3,351 6,705Need Less Gift, CWS & Subsidized Loans $10,180,188 $1,186,630 $11,366,818 $544,742 $11,252 $555,994 $10,724,930 $1,197,882 $11,922,812Per FTE 2,544 2,920 5,464 810 431 1,241 3,354 3,351 6,705Need Less Aid From All Sources $8,729,181 $1,174,156 $9,903,337 $534,698 $11,252 $545,950 $9,263,879 $1,185,408 $10,449,287Per FTE 2,182 2,889 5,071 795 431 1,226 2,977 3,320 6,297Total Unduplicated Headcount 5,212 409 5,621 1,274 36 1,310 6,486 445 6,931Number of Students With Need 3,708 285 3,993 326 4 330 4,034 289 4,323% of Students With Need 71.1 69.7 71.0 25.6 11.1 25.2 62.2 64.9 62.4Number of Students With Need After Gift Aid 2,891 195 3,086 216 3 219 3,107 198 3,305% of Students With Need After Gift Aid 55.5 47.7 54.9 17.0 8.3 16.7 47.9 44.5 47.7Number of Students With Need After Gift,CWS, & Subsidized Loans 2,891 195 3,086 216 3 219 3,107 198 3,305% of Students With Need After Gift,CWS, & Subsidized Loans 55.5 47.7 54.9 17.0 8.3 16.7 47.9 44.5 47.7Number of Students With Need After Aid From AllSources 2,664 193 2,857 215 3 218 2,879 196 3,075% of Students With Need After Aid From AllSources 51.1 47.2 50.8 16.9 8.3 16.6 44.4 44.0 44.4

102 Fayetteville State University Office of Institutional Research 07/06/2009
Financial Aid Program Expenditure by Level and Residencyfor Enrolled Students in the 2005-06 Academic Year
FSUUndergraduate Graduate & First Prof Total
In-StateStudents
Out-of-StateStudents All Students
In-StateStudents
Out-of-StateStudents All Students
In-StateStudents
Out-of-StateStudents All Students
FA Federal Pell Grant $7,956,423 $831,544 $8,787,967 $2,025 . $2,025 $7,958,448 $831,544 $8,789,992FB Federal Supplemental Educational OpportunityGrant (SEOG) $635,859 $181,418 $817,277 . . . $635,859 $181,418 $817,277FC Federal Work Study (FWS) $212,543 $47,800 $260,343 $4,500 . $4,500 $217,043 $47,800 $264,843FD Federal Perkins Loan $109,611 $347,636 $457,247 . $2,000 $2,000 $109,611 $349,636 $459,247FI Federal Ford Direct Loan Program(FDLP)-Subsidized Stafford $7,544,773 $985,300 $8,530,073 $1,263,124 $60,695 $1,323,819 $8,807,897 $1,045,995 $9,853,892FJ FDLP-Unsubsidized Stafford $4,381,326 $563,452 $4,944,778 $1,065,140 $51,481 $1,116,621 $5,446,466 $614,933 $6,061,399FK FDLP-PLUS $1,430,047 $717,116 $2,147,163 . . . $1,430,047 $717,116 $2,147,163FN Federal Veteran Educational Benefits $1,427,737 $225,121 $1,652,858 $53,107 . $53,107 $1,480,844 $225,121 $1,705,965FO ROTC $26,613 $19,743 $46,356 . . . $26,613 $19,743 $46,356FP Bureau of Indian Affairs (BIA) Scholarship $11,670 . $11,670 . . . $11,670 . $11,670FT DC Tuition Assistance Grant (TAG) . $483,493 $483,493 . . . . $483,493 $483,493IA Athletic Grant-In-Aid $174,195 $263,314 $437,509 $2,000 . $2,000 $176,195 $263,314 $439,509IC Institutional grant/scholarship (non-needbased) $617,744 $47,966 $665,710 $3,300 . $3,300 $621,044 $47,966 $669,010IF Need Based Campus Initiated Tuition IncreaseGrants $208,110 $172,767 $380,877 $1,295 . $1,295 $209,405 $172,767 $382,172IJ Institutionally-Funded Tuition Waivers $1,314 . $1,314 $1,896 . $1,896 $3,210 . $3,210OA Externally Administered PrivateGrant/Scholarship (Non-Athletic) $315,692 $84,315 $400,007 $4,700 . $4,700 $320,392 $84,315 $404,707OC Other Non-Federal, Non-NCScholarship/Loan (forgivable loan) $52,000 $3,700 $55,700 . . . $52,000 $3,700 $55,700S9 Other North Carolina scholarship or grant $32,358 $18,358 $50,716 $10,000 . $10,000 $42,358 $18,358 $60,716SA NC Student Incentive Grant (NCSIG-Includestate match) $155,402 $4,374 $159,776 $700 . $700 $156,102 $4,374 $160,476SB UNC Campus Scholarship Program $93,650 . $93,650 . . . $93,650 . $93,650SK NC Division of Vocational Rehabilitation $51,598 $5,973 $57,571 $4,211 . $4,211 $55,809 $5,973 $61,782SN NC Veterans Scholarship $109,331 $4,947 $114,278 . . . $109,331 $4,947 $114,278SO Nurse Education Scholarship/Loan Program(forgivable loan) $3,250 . $3,250 . . . $3,250 . $3,250SR Prospective Teacher Scholarship Loan(forgivable loan) $10,850 . $10,850 . . . $10,850 . $10,850ST UNC Need Based Grant $1,636,000 $44,126 $1,680,126 $902 . $902 $1,636,902 $44,126 $1,681,028SW Graduate Assistant Tuition Award Benefit(includes in-state and out-of-state portion) . . . $13,551 . $13,551 $13,551 . $13,551Total $27,198,096 $5,052,463 $32,250,559 $2,430,451 $114,176 $2,544,627 $29,628,547 $5,166,639 $34,795,186
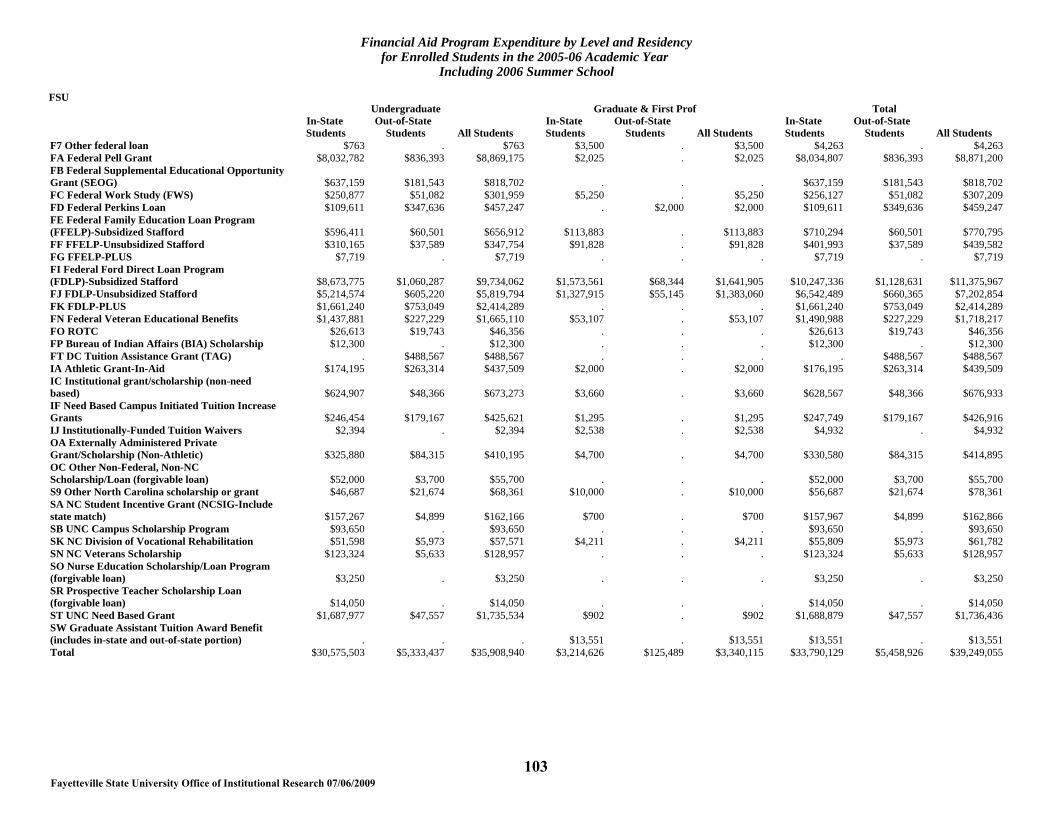
103 Fayetteville State University Office of Institutional Research 07/06/2009
Financial Aid Program Expenditure by Level and Residencyfor Enrolled Students in the 2005-06 Academic Year
Including 2006 Summer School
FSUUndergraduate Graduate & First Prof Total
In-StateStudents
Out-of-StateStudents All Students
In-StateStudents
Out-of-StateStudents All Students
In-StateStudents
Out-of-StateStudents All Students
F7 Other federal loan $763 . $763 $3,500 . $3,500 $4,263 . $4,263FA Federal Pell Grant $8,032,782 $836,393 $8,869,175 $2,025 . $2,025 $8,034,807 $836,393 $8,871,200FB Federal Supplemental Educational OpportunityGrant (SEOG) $637,159 $181,543 $818,702 . . . $637,159 $181,543 $818,702FC Federal Work Study (FWS) $250,877 $51,082 $301,959 $5,250 . $5,250 $256,127 $51,082 $307,209FD Federal Perkins Loan $109,611 $347,636 $457,247 . $2,000 $2,000 $109,611 $349,636 $459,247FE Federal Family Education Loan Program(FFELP)-Subsidized Stafford $596,411 $60,501 $656,912 $113,883 . $113,883 $710,294 $60,501 $770,795FF FFELP-Unsubsidized Stafford $310,165 $37,589 $347,754 $91,828 . $91,828 $401,993 $37,589 $439,582FG FFELP-PLUS $7,719 . $7,719 . . . $7,719 . $7,719FI Federal Ford Direct Loan Program(FDLP)-Subsidized Stafford $8,673,775 $1,060,287 $9,734,062 $1,573,561 $68,344 $1,641,905 $10,247,336 $1,128,631 $11,375,967FJ FDLP-Unsubsidized Stafford $5,214,574 $605,220 $5,819,794 $1,327,915 $55,145 $1,383,060 $6,542,489 $660,365 $7,202,854FK FDLP-PLUS $1,661,240 $753,049 $2,414,289 . . . $1,661,240 $753,049 $2,414,289FN Federal Veteran Educational Benefits $1,437,881 $227,229 $1,665,110 $53,107 . $53,107 $1,490,988 $227,229 $1,718,217FO ROTC $26,613 $19,743 $46,356 . . . $26,613 $19,743 $46,356FP Bureau of Indian Affairs (BIA) Scholarship $12,300 . $12,300 . . . $12,300 . $12,300FT DC Tuition Assistance Grant (TAG) . $488,567 $488,567 . . . . $488,567 $488,567IA Athletic Grant-In-Aid $174,195 $263,314 $437,509 $2,000 . $2,000 $176,195 $263,314 $439,509IC Institutional grant/scholarship (non-needbased) $624,907 $48,366 $673,273 $3,660 . $3,660 $628,567 $48,366 $676,933IF Need Based Campus Initiated Tuition IncreaseGrants $246,454 $179,167 $425,621 $1,295 . $1,295 $247,749 $179,167 $426,916IJ Institutionally-Funded Tuition Waivers $2,394 . $2,394 $2,538 . $2,538 $4,932 . $4,932OA Externally Administered PrivateGrant/Scholarship (Non-Athletic) $325,880 $84,315 $410,195 $4,700 . $4,700 $330,580 $84,315 $414,895OC Other Non-Federal, Non-NCScholarship/Loan (forgivable loan) $52,000 $3,700 $55,700 . . . $52,000 $3,700 $55,700S9 Other North Carolina scholarship or grant $46,687 $21,674 $68,361 $10,000 . $10,000 $56,687 $21,674 $78,361SA NC Student Incentive Grant (NCSIG-Includestate match) $157,267 $4,899 $162,166 $700 . $700 $157,967 $4,899 $162,866SB UNC Campus Scholarship Program $93,650 . $93,650 . . . $93,650 . $93,650SK NC Division of Vocational Rehabilitation $51,598 $5,973 $57,571 $4,211 . $4,211 $55,809 $5,973 $61,782SN NC Veterans Scholarship $123,324 $5,633 $128,957 . . . $123,324 $5,633 $128,957SO Nurse Education Scholarship/Loan Program(forgivable loan) $3,250 . $3,250 . . . $3,250 . $3,250SR Prospective Teacher Scholarship Loan(forgivable loan) $14,050 . $14,050 . . . $14,050 . $14,050ST UNC Need Based Grant $1,687,977 $47,557 $1,735,534 $902 . $902 $1,688,879 $47,557 $1,736,436SW Graduate Assistant Tuition Award Benefit(includes in-state and out-of-state portion) . . . $13,551 . $13,551 $13,551 . $13,551Total $30,575,503 $5,333,437 $35,908,940 $3,214,626 $125,489 $3,340,115 $33,790,129 $5,458,926 $39,249,055

104 Fayetteville State University Office of Institutional Research 07/06/2009
Student Aid Expenditures by Program, 2005-06Fayetteville State University
Source of Aid In-State Out-of-State All StudentsNumber ofRecipients
DollarAmount
Number ofRecipients
DollarAmount
Number ofRecipients
DollarAmount
Part A. Undergraduate StudentsSection I. Grants and ScholarshipsTotal Sect.I Grants & Scholarships (unduplicated # of students) 3,277 $13,408,001 360 $1,726,896 3,637 $15,134,897FA Federal Pell Grant 2,798 $8,032,782 301 $836,393 3,099 $8,869,175FB Federal Supplemental Educational Oppo 1,277 $637,159 154 $181,543 1,431 $818,702FN Federal Veteran Educational Benefits 207 $1,437,881 29 $227,229 236 $1,665,110FP Bureau of Indian Affairs (BIA) Schola 10 $12,300 . . 10 $12,300IA Athletic Grant-In-Aid 67 $174,195 33 $263,314 100 $437,509IC Institutional grant/scholarship (non- 948 $624,907 80 $48,366 1,028 $673,273IJ Institutionally-Funded Tuition Waiver 10 $2,394 . . 10 $2,394OA Externally Administered Private Grant 194 $325,880 48 $84,315 242 $410,195S9 Other North Carolina scholarship or g 21 $46,687 6 $21,674 27 $68,361SA NC Student Incentive Grant (NCSIG-Inc 235 $157,267 9 $4,899 244 $162,166SB UNC Campus Scholarship Program 60 $93,650 . . 60 $93,650SK NC Division of Vocational Rehabilitat 26 $51,598 3 $5,973 29 $57,571SN NC Veterans Scholarship 37 $123,324 2 $5,633 39 $128,957ST UNC Need Based Grant 1,365 $1,687,977 38 $47,557 1,403 $1,735,534
Section II. Scholarship/Loans (loan repaybable by service)Total Sect.II Scholarship/Loans (unduplicated # of students) 27 $95,913 4 $23,443 31 $119,356FO ROTC 12 $26,613 3 $19,743 15 $46,356OC Other Non-Federal, Non-NC Scholarship 8 $52,000 1 $3,700 9 $55,700SO Nurse Education Scholarship/Loan Prog 2 $3,250 . . 2 $3,250SR Prospective Teacher Scholarship Loan 5 $14,050 . . 5 $14,050
Section III. LoansTotal Sect.III Loans (unduplicated # of students) 2,112 $7,900,483 307 $1,803,995 2,419 $9,704,478F7 Other federal loan 1 $763 . . 1 $763FD Federal Perkins Loan 43 $109,611 115 $347,636 158 $457,247FE Federal Family Education Loan Program 375 $596,411 31 $60,501 406 $656,912FF FFELP-Unsubsidized Stafford 243 $310,165 26 $37,589 269 $347,754FG FFELP-PLUS 4 $7,719 . . 4 $7,719FJ FDLP-Unsubsidized Stafford 1,697 $5,214,574 191 $605,220 1,888 $5,819,794FK FDLP-PLUS 360 $1,661,240 87 $753,049 447 $2,414,289
Section IV. EmploymentTotal Sect.IV Employment (unduplicated # of students) 174 $250,877 33 $51,082 207 $301,959FC Federal Work Study (FWS) 174 $250,877 33 $51,082 207 $301,959
Section V. Total All Categories (Sect.I-IV)(undup. # of students)Total Sect. V All Categories (Sect.I-IV)(undup. # of students) 936 $21,655,274 99 $3,605,416 1,035 $25,260,690
Section VI. Other AidTotal Sect.VI Other Miscellaneous Programs (unduplicated # of students) 2,894 $8,920,229 363 $1,728,021 3,257 $10,648,250FI Federal Ford Direct Loan Program (FDL 2,835 $8,673,775 331 $1,060,287 3,166 $9,734,062FT DC Tuition Assistance Grant (TAG) . . 50 $488,567 50 $488,567IF Need Based Campus Initiated Tuition I 292 $246,454 86 $179,167 378 $425,621
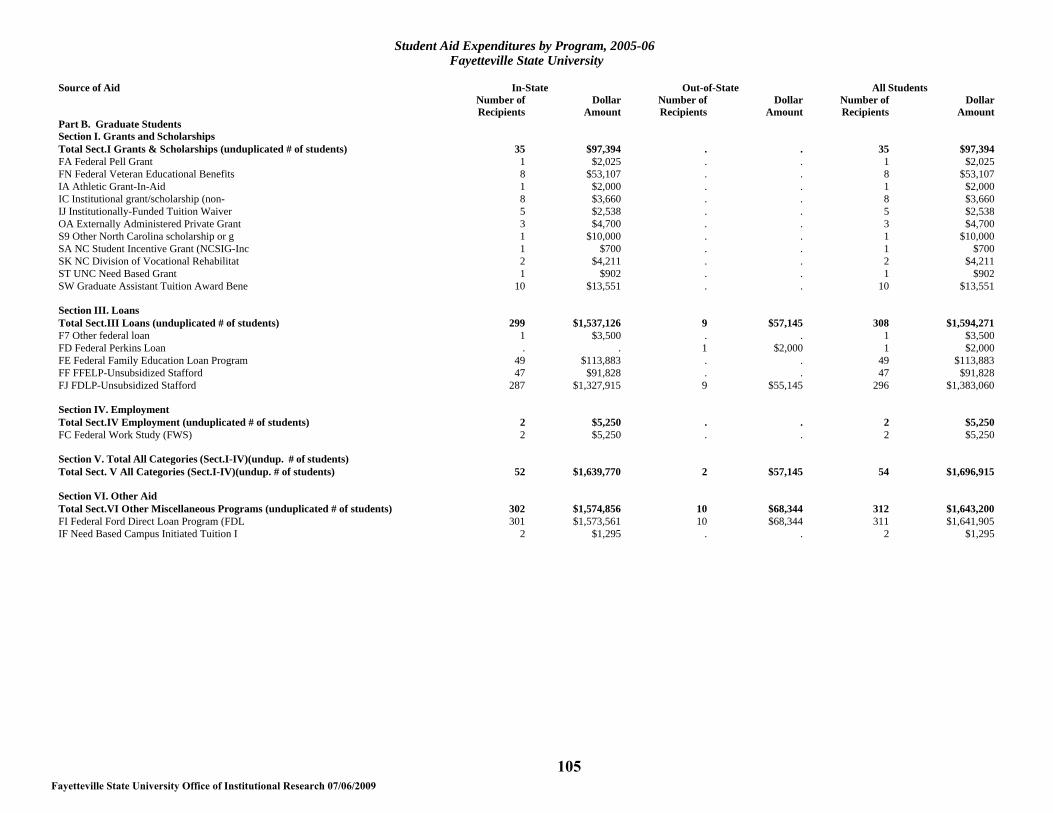
105 Fayetteville State University Office of Institutional Research 07/06/2009
Student Aid Expenditures by Program, 2005-06Fayetteville State University
Source of Aid In-State Out-of-State All StudentsNumber ofRecipients
DollarAmount
Number ofRecipients
DollarAmount
Number ofRecipients
DollarAmount
Part B. Graduate StudentsSection I. Grants and ScholarshipsTotal Sect.I Grants & Scholarships (unduplicated # of students) 35 $97,394 . . 35 $97,394FA Federal Pell Grant 1 $2,025 . . 1 $2,025FN Federal Veteran Educational Benefits 8 $53,107 . . 8 $53,107IA Athletic Grant-In-Aid 1 $2,000 . . 1 $2,000IC Institutional grant/scholarship (non- 8 $3,660 . . 8 $3,660IJ Institutionally-Funded Tuition Waiver 5 $2,538 . . 5 $2,538OA Externally Administered Private Grant 3 $4,700 . . 3 $4,700S9 Other North Carolina scholarship or g 1 $10,000 . . 1 $10,000SA NC Student Incentive Grant (NCSIG-Inc 1 $700 . . 1 $700SK NC Division of Vocational Rehabilitat 2 $4,211 . . 2 $4,211ST UNC Need Based Grant 1 $902 . . 1 $902SW Graduate Assistant Tuition Award Bene 10 $13,551 . . 10 $13,551
Section III. LoansTotal Sect.III Loans (unduplicated # of students) 299 $1,537,126 9 $57,145 308 $1,594,271F7 Other federal loan 1 $3,500 . . 1 $3,500FD Federal Perkins Loan . . 1 $2,000 1 $2,000FE Federal Family Education Loan Program 49 $113,883 . . 49 $113,883FF FFELP-Unsubsidized Stafford 47 $91,828 . . 47 $91,828FJ FDLP-Unsubsidized Stafford 287 $1,327,915 9 $55,145 296 $1,383,060
Section IV. EmploymentTotal Sect.IV Employment (unduplicated # of students) 2 $5,250 . . 2 $5,250FC Federal Work Study (FWS) 2 $5,250 . . 2 $5,250
Section V. Total All Categories (Sect.I-IV)(undup. # of students)Total Sect. V All Categories (Sect.I-IV)(undup. # of students) 52 $1,639,770 2 $57,145 54 $1,696,915
Section VI. Other AidTotal Sect.VI Other Miscellaneous Programs (unduplicated # of students) 302 $1,574,856 10 $68,344 312 $1,643,200FI Federal Ford Direct Loan Program (FDL 301 $1,573,561 10 $68,344 311 $1,641,905IF Need Based Campus Initiated Tuition I 2 $1,295 . . 2 $1,295

Fayetteville State University Office of Institutional Research 07/06/2009 106those with loans (excluding PLUS loans), not for all in-state undergraduates.headcount of the in-state undergraduates shown in the first column. Average loan amounts are calculated forNeed that exceeds gift aid (Scholarships and Grants). All percentages are the percent of the unduplicatedsemesters that a student was actually enrolled as an in-state undergraduate. "Unmet Need" is that portion of"Need" in this report is the calculated need using the Federal Methodology adjusted to reflect the number ofDefinitions: The Academic Year includes fall (winter at NCSA) and spring terms. It excludes all summer terms.
Measures of Financial Need for In-State Undergraduate Degree-Seeking Students:For the 2005-06 Academic Year
FSUIn-State Undergrads 5,102Number With Need 3,706Pct With Need 72.6Total Dollars of Need 33,692,833Number With Unmet Need 2,938Pct With Unmet Need 57.6Total Dollars of Unmet Need 10,857,644Number With Subsidized Loans 0Pct With Subsidized Loans 0.0Average Amount/ Year: Subsidized Loans .Number With Unsubsidized Loans 0Pct With Unsubsidized Loans 0.0Average Amount/ Year: Unsubsidized Loans .Number With Any Loans 0Pct With Any Loans 0.0Average Amount/ Year: All Loans .

Fayetteville State University Office of Institutional Research 07/06/2009 107those with loans (excluding PLUS loans), not for all in-state undergraduates.headcount of the in-state undergraduates shown in the first column. Average loan amounts are calculated forNeed that exceeds gift aid (Scholarships and Grants). All percentages are the percent of the unduplicatedsemesters that a student was actually enrolled as an in-state undergraduate. "Unmet Need" is that portion of"Need" in this report is the calculated need using the Federal Methodology adjusted to reflect the number ofDefinitions: The Academic Year includes fall (winter at NCSA) and spring terms. It excludes all summer terms.
Financial Aid Program Expenditure forEnrolled Students in the 2005-06 Academic Year
Plus 2006 Summer SchoolComparison between amounts reported via Financial Aid File (FAF)
and amounts reported by SEAA
FSUFAF
DollarsSEAADollars
DollarDifference Percent
SA NC Student Incentive Grant (NCSIG-Include state mat 160,476 164,150 -3,674 -2.2SB UNC Campus Scholarship Program 93,650 0 93,650 100.0SC NCSSM Tuition Grant for UNC 0 0 0 .SD Teaching Assistant Scholarship Fund 0 0 0 .SP Nurse Scholars Program (forgivable loan) 0 8,750 -8,750 -100.0ST UNC Need Based Grant 1,681,028 1,785,135 -104,107 -5.8Total 1,935,154 1,958,035 -22,881 -1.2

Fayetteville State University Office of Institutional Research 07/06/2009 108For this report, need calculated for the academic year is reduced to represent the number of semesters attended.
Summary of Financial Need Not Met by Financial Aid Awardsfor Enrolled Students in the 2006-07 Academic Year
FSUUndergraduate Students Graduate Students All Students
In-StateStudents
Out-Of-StateStudents
TotalIn-State &
Out-of-StateStudents
In-StateStudents
Out-Of-StateStudents
TotalIn-State &
Out-of-StateStudents
In-StateStudents
Out-Of-StateStudents
TotalIn-State &
Out-of-StateStudents
Total Average Annual FTE 4,409 291 4,700 573 19 591 4,981 310 5,291Total Need $31,689,661 $4,138,686 $35,828,347 $1,908,184 $78,491 $1,986,675 $33,597,845 $4,217,177 $37,815,022Per FTE 7,188 14222 21410 3,332 4,186 7,519 10520 18408 28929Need Less Gift Aid $8,222,146 $1,113,626 $9,335,772 $209,150 $17,743 $226,893 $8,431,296 $1,131,369 $9,562,665Per FTE 1,865 3,827 5,692 365 946 1,312 2,230 4,773 7,003Need Less Gift, CWS & Subsidized Loans $8,072,295 $936,973 $9,009,268 $195,650 $17,743 $213,393 $8,267,945 $954,716 $9,222,661Per FTE 1,831 3,220 5,051 342 946 1,288 2,173 4,166 6,339Need Less Aid From All Sources $5,884,084 $934,233 $6,818,317 $181,574 $17,743 $199,317 $6,065,658 $951,976 $7,017,634Per FTE 1,335 3,210 4,545 317 946 1,263 1,652 4,157 5,808Total Unduplicated Headcount 5,771 353 6,124 1,024 32 1,056 6,795 385 7,180Number of Students With Need 3,887 270 4,157 275 5 280 4,162 275 4,437% of Students With Need 67.4 76.5 67.9 26.9 15.6 26.5 61.3 71.4 61.8Number of Students With Need After Gift Aid 2,516 186 2,702 63 5 68 2,579 191 2,770% of Students With Need After Gift Aid 43.6 52.7 44.1 6.2 15.6 6.4 38.0 49.6 38.6Number of Students With Need After Gift,CWS, & Subsidized Loans 2,495 166 2,661 61 5 66 2,556 171 2,727% of Students With Need After Gift,CWS, & Subsidized Loans 43.2 47.0 43.5 6.0 15.6 6.3 37.6 44.4 38.0Number of Students With Need After Aid From AllSources 2,012 165 2,177 60 5 65 2,072 170 2,242% of Students With Need After Aid From AllSources 34.9 46.7 35.5 5.9 15.6 6.2 30.5 44.2 31.2

Fayetteville State University Office of Institutional Research 07/06/2009
Financial Aid Program Expenditure by Level and Residencyfor Enrolled Students in the 2006-07 Academic Year
FSUUndergraduate Graduate & First Prof Total
In-StateStudents
Out-of-StateStudents All Students
In-StateStudents
Out-of-StateStudents All Students
In-StateStudents
Out-of-StateStudents All Students
FA Federal Pell Grant $9,066,680 $539,488 $9,606,168 . . . $9,066,680 $539,488 $9,606,168FB Federal Supplemental Educational OpportunityGrant (SEOG) $701,519 $176,862 $878,381 . . . $701,519 $176,862 $878,381FC Federal Work Study (FWS) $303,651 $62,599 $366,250 . . . $303,651 $62,599 $366,250FD Federal Perkins Loan $96,506 $218,901 $315,407 $6,518 . $6,518 $103,024 $218,901 $321,925FE Federal Family Education Loan Program(FFELP)-Subsidized Stafford $8,886,462 $724,576 $9,611,038 $1,292,482 $38,167 $1,330,649 $10,178,944 $762,743 $10,941,687FF FFELP-Unsubsidized Stafford $6,137,666 $496,030 $6,633,696 $1,230,188 $33,135 $1,263,323 $7,367,854 $529,165 $7,897,019FG FFELP-PLUS $362,453 $274,459 $636,912 . . . $362,453 $274,459 $636,912FM Workforce Investment Act (WIA) $33,555 . $33,555 $8,275 . $8,275 $41,830 . $41,830FN Federal Veteran Educational Benefits $105,107 $24,879 $129,986 $16,883 . $16,883 $121,990 $24,879 $146,869FO ROTC $82,309 $20,781 $103,090 . . . $82,309 $20,781 $103,090FT DC Tuition Assistance Grant (TAG) $9,736 $474,239 $483,975 . . . $9,736 $474,239 $483,975IA Athletic Grant-In-Aid $223,924 $144,827 $368,751 . . . $223,924 $144,827 $368,751IC Institutional grant/scholarship (non-needbased) $835,296 $46,450 $881,746 $13,176 . $13,176 $848,472 $46,450 $894,922IG Non-Need Based Campus Initiated TuitionIncrease Grants $440,184 $248,285 $688,469 $2,338 . $2,338 $442,522 $248,285 $690,807OA Externally Administered PrivateGrant/Scholarship (Non-Athletic) $360,184 $44,774 $404,958 $8,356 . $8,356 $368,540 $44,774 $413,314OC Other Non-Federal, Non-NCScholarship/Loan (forgivable loan) $30,307 $61,590 $91,897 $1,879 $9,621 $11,500 $32,186 $71,211 $103,397OD Other State Aid, Non-NC Based) $7,452 $12,964 $20,416 . . . $7,452 $12,964 $20,416SA NC Student Incentive Grant (NCSIG-Includestate match) $172,524 $700 $173,224 . . . $172,524 $700 $173,224SB UNC Campus Scholarship Program $306,346 $1,040 $307,386 . . . $306,346 $1,040 $307,386SD Teaching Assistant Scholarship Fund $12,000 . $12,000 $1,200 . $1,200 $13,200 . $13,200SK NC Division of Vocational Rehabilitation $26,721 . $26,721 $1,032 . $1,032 $27,753 . $27,753SN NC Veterans Scholarship $126,772 . $126,772 $1,553 . $1,553 $128,325 . $128,325SO Nurse Education Scholarship/Loan Program(forgivable loan) $3,000 . $3,000 . . . $3,000 . $3,000SR Prospective Teacher Scholarship Loan(forgivable loan) $13,750 . $13,750 . . . $13,750 . $13,750ST UNC Need Based Grant $3,011,499 $4,900 $3,016,399 . . . $3,011,499 $4,900 $3,016,399SW Graduate Assistant Tuition Award Benefit(includes in-state and out-of-state portion) . . . $14,342 $51,829 $66,171 $14,342 $51,829 $66,171WC Tuition Waivers for Persons at Least 65 YearsOld $6,576 . $6,576 $6,188 . $6,188 $12,764 . $12,764WE Faculty/Staff Tuition Waivers $18,276 . $18,276 $22,182 $529 $22,711 $40,458 $529 $40,987F7 Other federal loan $299,345 $303,749 $603,094 $27,039 . $27,039 $326,384 $303,749 $630,133F9 Other federal scholarship or grant $56,085 . $56,085 $6,853 . $6,853 $62,938 . $62,938S9 Other North Carolina scholarship or grant $92,505 . $92,505 . . . $92,505 . $92,505Total $31,828,390 $3,882,093 $35,710,483 $2,660,484 $133,281 $2,793,765 $34,488,874 $4,015,374 $38,504,248
109
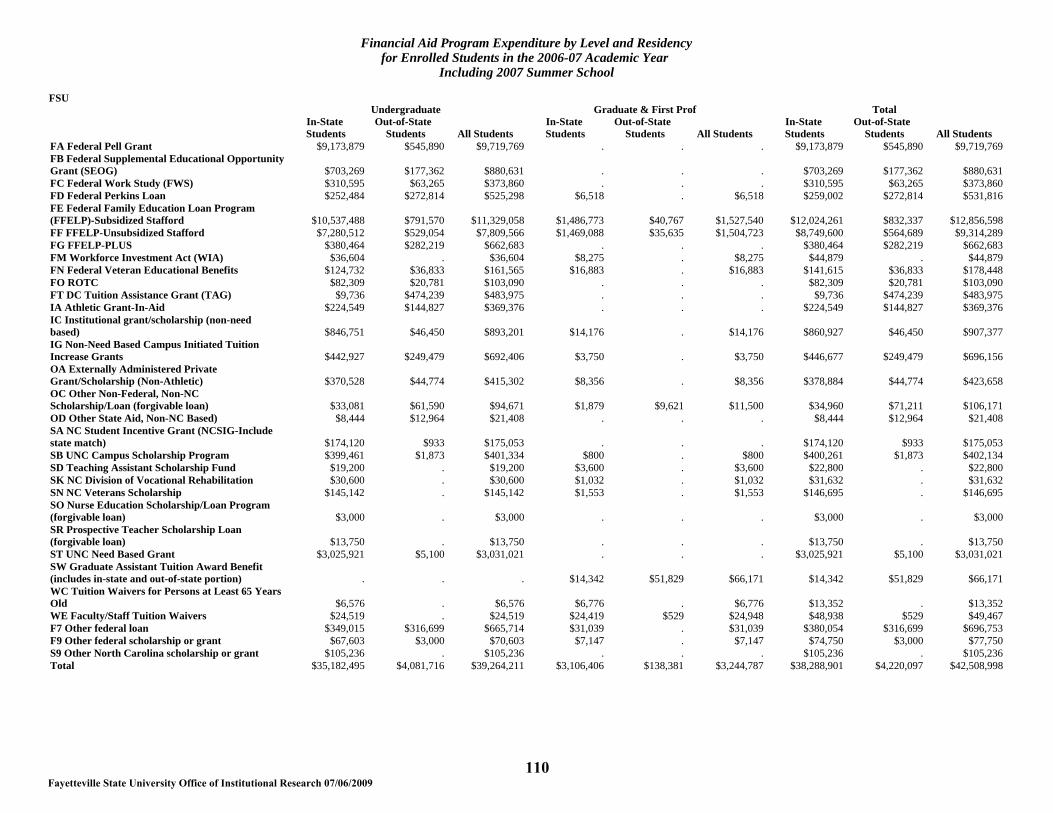
Fayetteville State University Office of Institutional Research 07/06/2009
Financial Aid Program Expenditure by Level and Residencyfor Enrolled Students in the 2006-07 Academic Year
Including 2007 Summer School
FSUUndergraduate Graduate & First Prof Total
In-StateStudents
Out-of-StateStudents All Students
In-StateStudents
Out-of-StateStudents All Students
In-StateStudents
Out-of-StateStudents All Students
FA Federal Pell Grant $9,173,879 $545,890 $9,719,769 . . . $9,173,879 $545,890 $9,719,769FB Federal Supplemental Educational OpportunityGrant (SEOG) $703,269 $177,362 $880,631 . . . $703,269 $177,362 $880,631FC Federal Work Study (FWS) $310,595 $63,265 $373,860 . . . $310,595 $63,265 $373,860FD Federal Perkins Loan $252,484 $272,814 $525,298 $6,518 . $6,518 $259,002 $272,814 $531,816FE Federal Family Education Loan Program(FFELP)-Subsidized Stafford $10,537,488 $791,570 $11,329,058 $1,486,773 $40,767 $1,527,540 $12,024,261 $832,337 $12,856,598FF FFELP-Unsubsidized Stafford $7,280,512 $529,054 $7,809,566 $1,469,088 $35,635 $1,504,723 $8,749,600 $564,689 $9,314,289FG FFELP-PLUS $380,464 $282,219 $662,683 . . . $380,464 $282,219 $662,683FM Workforce Investment Act (WIA) $36,604 . $36,604 $8,275 . $8,275 $44,879 . $44,879FN Federal Veteran Educational Benefits $124,732 $36,833 $161,565 $16,883 . $16,883 $141,615 $36,833 $178,448FO ROTC $82,309 $20,781 $103,090 . . . $82,309 $20,781 $103,090FT DC Tuition Assistance Grant (TAG) $9,736 $474,239 $483,975 . . . $9,736 $474,239 $483,975IA Athletic Grant-In-Aid $224,549 $144,827 $369,376 . . . $224,549 $144,827 $369,376IC Institutional grant/scholarship (non-needbased) $846,751 $46,450 $893,201 $14,176 . $14,176 $860,927 $46,450 $907,377IG Non-Need Based Campus Initiated TuitionIncrease Grants $442,927 $249,479 $692,406 $3,750 . $3,750 $446,677 $249,479 $696,156OA Externally Administered PrivateGrant/Scholarship (Non-Athletic) $370,528 $44,774 $415,302 $8,356 . $8,356 $378,884 $44,774 $423,658OC Other Non-Federal, Non-NCScholarship/Loan (forgivable loan) $33,081 $61,590 $94,671 $1,879 $9,621 $11,500 $34,960 $71,211 $106,171OD Other State Aid, Non-NC Based) $8,444 $12,964 $21,408 . . . $8,444 $12,964 $21,408SA NC Student Incentive Grant (NCSIG-Includestate match) $174,120 $933 $175,053 . . . $174,120 $933 $175,053SB UNC Campus Scholarship Program $399,461 $1,873 $401,334 $800 . $800 $400,261 $1,873 $402,134SD Teaching Assistant Scholarship Fund $19,200 . $19,200 $3,600 . $3,600 $22,800 . $22,800SK NC Division of Vocational Rehabilitation $30,600 . $30,600 $1,032 . $1,032 $31,632 . $31,632SN NC Veterans Scholarship $145,142 . $145,142 $1,553 . $1,553 $146,695 . $146,695SO Nurse Education Scholarship/Loan Program(forgivable loan) $3,000 . $3,000 . . . $3,000 . $3,000SR Prospective Teacher Scholarship Loan(forgivable loan) $13,750 . $13,750 . . . $13,750 . $13,750ST UNC Need Based Grant $3,025,921 $5,100 $3,031,021 . . . $3,025,921 $5,100 $3,031,021SW Graduate Assistant Tuition Award Benefit(includes in-state and out-of-state portion) . . . $14,342 $51,829 $66,171 $14,342 $51,829 $66,171WC Tuition Waivers for Persons at Least 65 YearsOld $6,576 . $6,576 $6,776 . $6,776 $13,352 . $13,352WE Faculty/Staff Tuition Waivers $24,519 . $24,519 $24,419 $529 $24,948 $48,938 $529 $49,467F7 Other federal loan $349,015 $316,699 $665,714 $31,039 . $31,039 $380,054 $316,699 $696,753F9 Other federal scholarship or grant $67,603 $3,000 $70,603 $7,147 . $7,147 $74,750 $3,000 $77,750S9 Other North Carolina scholarship or grant $105,236 . $105,236 . . . $105,236 . $105,236Total $35,182,495 $4,081,716 $39,264,211 $3,106,406 $138,381 $3,244,787 $38,288,901 $4,220,097 $42,508,998
110
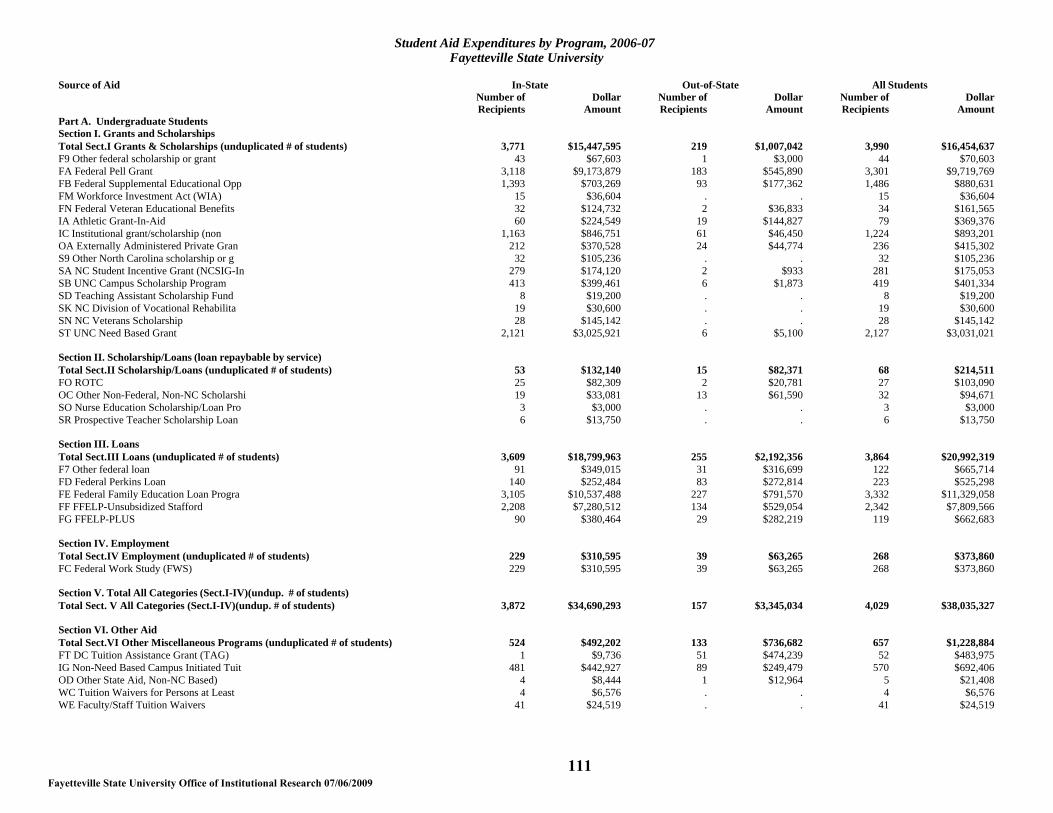
Fayetteville State University Office of Institutional Research 07/06/2009
Student Aid Expenditures by Program, 2006-07Fayetteville State University
Source of Aid In-State Out-of-State All StudentsNumber ofRecipients
DollarAmount
Number ofRecipients
DollarAmount
Number ofRecipients
DollarAmount
Part A. Undergraduate StudentsSection I. Grants and ScholarshipsTotal Sect.I Grants & Scholarships (unduplicated # of students) 3,771 $15,447,595 219 $1,007,042 3,990 $16,454,637F9 Other federal scholarship or grant 43 $67,603 1 $3,000 44 $70,603FA Federal Pell Grant 3,118 $9,173,879 183 $545,890 3,301 $9,719,769FB Federal Supplemental Educational Opp 1,393 $703,269 93 $177,362 1,486 $880,631FM Workforce Investment Act (WIA) 15 $36,604 . . 15 $36,604FN Federal Veteran Educational Benefits 32 $124,732 2 $36,833 34 $161,565IA Athletic Grant-In-Aid 60 $224,549 19 $144,827 79 $369,376IC Institutional grant/scholarship (non 1,163 $846,751 61 $46,450 1,224 $893,201OA Externally Administered Private Gran 212 $370,528 24 $44,774 236 $415,302S9 Other North Carolina scholarship or g 32 $105,236 . . 32 $105,236SA NC Student Incentive Grant (NCSIG-In 279 $174,120 2 $933 281 $175,053SB UNC Campus Scholarship Program 413 $399,461 6 $1,873 419 $401,334SD Teaching Assistant Scholarship Fund 8 $19,200 . . 8 $19,200SK NC Division of Vocational Rehabilita 19 $30,600 . . 19 $30,600SN NC Veterans Scholarship 28 $145,142 . . 28 $145,142ST UNC Need Based Grant 2,121 $3,025,921 6 $5,100 2,127 $3,031,021
Section II. Scholarship/Loans (loan repaybable by service)Total Sect.II Scholarship/Loans (unduplicated # of students) 53 $132,140 15 $82,371 68 $214,511FO ROTC 25 $82,309 2 $20,781 27 $103,090OC Other Non-Federal, Non-NC Scholarshi 19 $33,081 13 $61,590 32 $94,671SO Nurse Education Scholarship/Loan Pro 3 $3,000 . . 3 $3,000SR Prospective Teacher Scholarship Loan 6 $13,750 . . 6 $13,750
Section III. LoansTotal Sect.III Loans (unduplicated # of students) 3,609 $18,799,963 255 $2,192,356 3,864 $20,992,319F7 Other federal loan 91 $349,015 31 $316,699 122 $665,714FD Federal Perkins Loan 140 $252,484 83 $272,814 223 $525,298FE Federal Family Education Loan Progra 3,105 $10,537,488 227 $791,570 3,332 $11,329,058FF FFELP-Unsubsidized Stafford 2,208 $7,280,512 134 $529,054 2,342 $7,809,566FG FFELP-PLUS 90 $380,464 29 $282,219 119 $662,683
Section IV. EmploymentTotal Sect.IV Employment (unduplicated # of students) 229 $310,595 39 $63,265 268 $373,860FC Federal Work Study (FWS) 229 $310,595 39 $63,265 268 $373,860
Section V. Total All Categories (Sect.I-IV)(undup. # of students)Total Sect. V All Categories (Sect.I-IV)(undup. # of students) 3,872 $34,690,293 157 $3,345,034 4,029 $38,035,327
Section VI. Other AidTotal Sect.VI Other Miscellaneous Programs (unduplicated # of students) 524 $492,202 133 $736,682 657 $1,228,884FT DC Tuition Assistance Grant (TAG) 1 $9,736 51 $474,239 52 $483,975IG Non-Need Based Campus Initiated Tuit 481 $442,927 89 $249,479 570 $692,406OD Other State Aid, Non-NC Based) 4 $8,444 1 $12,964 5 $21,408WC Tuition Waivers for Persons at Least 4 $6,576 . . 4 $6,576WE Faculty/Staff Tuition Waivers 41 $24,519 . . 41 $24,519
111

Fayetteville State University Office of Institutional Research 07/06/2009
Student Aid Expenditures by Program, 2006-07Fayetteville State University
Source of Aid In-State Out-of-State All StudentsNumber ofRecipients
DollarAmount
Number ofRecipients
DollarAmount
Number ofRecipients
DollarAmount
Part B. Graduate StudentsSection I. Grants and ScholarshipsTotal Sect.I Grants & Scholarships (unduplicated # of students) 39 $76,164 6 $51,829 45 $127,993F9 Other federal scholarship or grant 6 $7,147 . . 6 $7,147FM Workforce Investment Act (WIA) 3 $8,275 . . 3 $8,275FN Federal Veteran Educational Benefits 3 $16,883 . . 3 $16,883IC Institutional grant/scholarship (non 13 $14,176 . . 13 $14,176OA Externally Administered Private Gran 5 $8,356 . . 5 $8,356SB UNC Campus Scholarship Program 1 $800 . . 1 $800SD Teaching Assistant Scholarship Fund 2 $3,600 . . 2 $3,600SK NC Division of Vocational Rehabilita 1 $1,032 . . 1 $1,032SN NC Veterans Scholarship 1 $1,553 . . 1 $1,553SW Graduate Assistant Tuition Award Ben 8 $14,342 6 $51,829 14 $66,171
Section II. Scholarship/Loans (loan repaybable by service)Total Sect.II Scholarship/Loans (unduplicated # of students) 3 $1,879 1 $9,621 4 $11,500OC Other Non-Federal, Non-NC Scholarshi 3 $1,879 1 $9,621 4 $11,500
Section III. LoansTotal Sect.III Loans (unduplicated # of students) 315 $2,993,418 6 $76,402 321 $3,069,820F7 Other federal loan 5 $31,039 . . 5 $31,039FD Federal Perkins Loan 2 $6,518 . . 2 $6,518FE Federal Family Education Loan Progra 251 $1,486,773 6 $40,767 257 $1,527,540FF FFELP-Unsubsidized Stafford 279 $1,469,088 6 $35,635 285 $1,504,723
Section V. Total All Categories (Sect.I-IV)(undup. # of students)Total Sect. V All Categories (Sect.I-IV)(undup. # of students) 334 $3,071,461 12 $137,852 346 $3,209,313
Section VI. Other AidTotal Sect.VI Other Miscellaneous Programs (unduplicated # of students) 36 $34,945 1 $529 37 $35,474IG Non-Need Based Campus Initiated Tuit 4 $3,750 . . 4 $3,750WC Tuition Waivers for Persons at Least 4 $6,776 . . 4 $6,776WE Faculty/Staff Tuition Waivers 28 $24,419 1 $529 29 $24,948
112
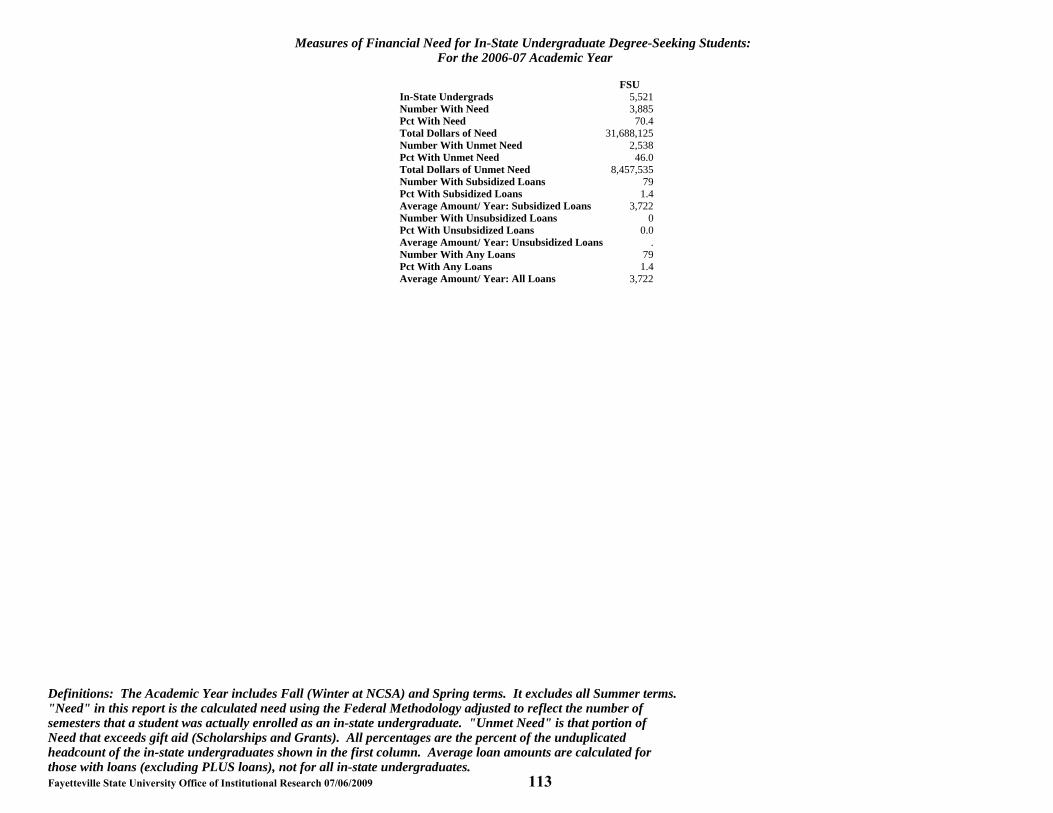
Fayetteville State University Office of Institutional Research 07/06/2009 113those with loans (excluding PLUS loans), not for all in-state undergraduates.headcount of the in-state undergraduates shown in the first column. Average loan amounts are calculated forNeed that exceeds gift aid (Scholarships and Grants). All percentages are the percent of the unduplicatedsemesters that a student was actually enrolled as an in-state undergraduate. "Unmet Need" is that portion of"Need" in this report is the calculated need using the Federal Methodology adjusted to reflect the number ofDefinitions: The Academic Year includes Fall (Winter at NCSA) and Spring terms. It excludes all Summer terms.
Measures of Financial Need for In-State Undergraduate Degree-Seeking Students:For the 2006-07 Academic Year
FSUIn-State Undergrads 5,521Number With Need 3,885Pct With Need 70.4Total Dollars of Need 31,688,125Number With Unmet Need 2,538Pct With Unmet Need 46.0Total Dollars of Unmet Need 8,457,535Number With Subsidized Loans 79Pct With Subsidized Loans 1.4Average Amount/ Year: Subsidized Loans 3,722Number With Unsubsidized Loans 0Pct With Unsubsidized Loans 0.0Average Amount/ Year: Unsubsidized Loans .Number With Any Loans 79Pct With Any Loans 1.4Average Amount/ Year: All Loans 3,722

Fayetteville State University Office of Institutional Research 07/06/2009 114those with loans (excluding PLUS loans), not for all in-state undergraduates.headcount of the in-state undergraduates shown in the first column. Average loan amounts are calculated forNeed that exceeds gift aid (Scholarships and Grants). All percentages are the percent of the unduplicatedsemesters that a student was actually enrolled as an in-state undergraduate. "Unmet Need" is that portion of"Need" in this report is the calculated need using the Federal Methodology adjusted to reflect the number ofDefinitions: The Academic Year includes Fall (Winter at NCSA) and Spring terms. It excludes all Summer terms.
Financial Aid Program Expenditure forEnrolled Students in the 2006-07 Academic Year
Plus 2007 Summer SchoolComparison between amounts reported via Financial Aid File (FAF)
and amounts reported by SEAA
FSUFAF
DollarsSEAADollars
DollarDifference Percent
SA NC Student Incentive Grant (NCSIG-Include state ma 173,224 0 173,224 100.0SB UNC Campus Scholarship Program 307,386 0 307,386 100.0SC NCSSM Tuition Grant for UNC 0 0 0 .SD Teaching Assistant Scholarship Fund 13,200 0 13,200 100.0SP Nurse Scholars Program (forgivable loan) 0 0 0 .ST UNC Need Based Grant 3,016,399 0 3,016,399 100.0Total 3,510,209 0 3,510,209 100.0

Summary of Financial Need Not Met by Financial Aid Awards for Enrolled Students in the 2007-08 Academic Year
FSU
Undergraduate Students Graduate Students All Students Total Total Total
In-State & In-State & In-State & In-State Out-Of-State Out-of-State In-State Out-Of-State Out-of-State In-State Out-Of-State Out-of-State Students Students Students Students Students Students Students Students Students
Total Average Annual FTE 4,752 298 5,051 452 17 469 5,205 315 5,520 Total Need $39,790,305 $4,625,972 $44,416,277 $1,987,039 $196,225 $2,183,264 $41,777,344 $4,822,197 $46,599,540 Per FTE 8,373 15510 23883 4,395 11628 16023 12768 27139 39906 Need Less Gift Aid $10,767,601 $1,340,754 $12,108,354 $252,091 $114,343 $366,434 $11,019,691 $1,455,097 $12,474,788 Per FTE 2,266 4,495 6,761 558 6,776 7,333 2,823 11271 14095 Need Less Gift, CWS & Subsidized Loans $6,580,955 $785,648 $7,366,603 $127,364 $113,227 $240,591 $6,708,318 $898,875 $7,607,193 Per FTE 1,385 2,634 4,019 282 6,710 6,991 1,666 9,344 11010 Need Less Aid From All Sources $2,357,592 $515,381 $2,872,973 $92,188 $44,847 $137,035 $2,449,780 $560,228 $3,010,008 Per FTE 496 1,728 2,224 204 2,658 2,861 700 4,386 5,086 Total Unduplicated Headcount 6,424 363 6,787 728 23 751 7,152 386 7,538 Number of Students With Need 4,335 272 4,607 244 11 255 4,579 283 4,862 % of Students With Need 67.5 74.9 67.9 33.5 47.8 34.0 64.0 73.3 64.5 Number of Students With Need After Gift Aid 2,917 199 3,116 53 7 60 2,970 206 3,176 % of Students With Need After Gift Aid 45.4 54.8 45.9 7.3 30.4 8.0 41.5 53.4 42.1 Number of Students With Need After Gift, CWS, & Subsidized Loans 1,560 105 1,665 32 6 38 1,592 111 1,703 % of Students With Need After Gift, CWS, & Subsidized Loans 24.3 28.9 24.5 4.4 26.1 5.1 22.3 28.8 22.6 Number of Students With Need After Aid From All Sources 706 58 764 18 6 24 724 64 788 % of Students With Need After Aid From All Sources 11.0 16.0 11.3 2.5 26.1 3.2 10.1 16.6 10.5
115
Fayetteville State University Office of Institutional Research 07/06/2009

Financial Aid Program Expenditure by Level and Residency for Enrolled Students in the 2007-08 Fall and Spring
FSU
Undergraduate Graduate & First Prof Total In-State Out-of-State In-State Out-of-State In-State Out-of-State Students Students All Students Students Students All Students Students Students All Students
FA Federal Pell Grant $10,576,334 $549,919 $11,126,253 $10,576,334 $549,919 $11,126,253 FB Federal Supplemental Educational Opportunity Grant (SEOG) $563,531 $185,668 $749,199 $563,531 $185,668 $749,199 FC Federal Work Study (FWS) $237,190 $48,300 $285,490 $237,190 $48,300 $285,490 FD Federal Perkins Loan $83,647 $260,969 $344,616 $83,647 $260,969 $344,616 FE Federal Family Education Loan Program (FFELP)-Subsidized Stafford $11,530,105 $820,651 $12,350,756 $1,297,791 $38,187 $1,335,978 $12,827,896 $858,838 $13,686,734 FF FFELP-Unsubsidized Stafford $6,557,178 $499,974 $7,057,152 $1,154,040 $49,826 $1,203,866 $7,711,218 $549,800 $8,261,018 FG FFELP-PLUS $291,743 $173,985 $465,728 $291,743 $173,985 $465,728 FJ FDLP-Unsubsidized Stafford $4,950 $4,950 $4,950 $4,950 FM Workforce Investment Act (WIA) $6,366 $6,366 $6,366 $6,366 FN Federal Veteran Educational Benefits $1,163,015 $25,693 $1,188,708 $53,916 $53,916 $1,216,931 $25,693 $1,242,624 FO ROTC $55,672 $13,415 $69,087 $55,672 $13,415 $69,087 FT DC Tuition Assistance Grant (TAG) $10,000 $516,454 $526,454 $10,000 $516,454 $526,454 IA Athletic Grant-In-Aid $216,922 $162,164 $379,086 $6,800 $6,800 $223,722 $162,164 $385,886 IC Institutional grant/scholarship (non-need based) $940,162 $40,485 $980,647 $600 $600 $940,762 $40,485 $981,247 IG Non-Need Based Campus Initiated Tuition Increase Grants $630,715 $371,378 $1,002,093 $21,008 $21,008 $651,723 $371,378 $1,023,101 OA Externally Administered Private Grant/Scholarship (Non-Athletic) $293,149 $61,251 $354,400 $4,300 $4,300 $297,449 $61,251 $358,700 OD Other State Aid, Non-NC Based) $3,135 $11,644 $14,779 $3,135 $11,644 $14,779 OE Penn Family Scholarship $3,000 $3,000 $3,000 $3,000 S9 Other North Carolina scholarship or grant $81,904 $1,711 $83,615 $81,904 $1,711 $83,615 SA NC Student Incentive Grant (NCSIG-Include state match) $250,251 $250,251 $250,251 $250,251 SB UNC Campus Scholarship Program $377,383 $950 $378,333 $377,383 $950 $378,333 SD Teaching Assistant Scholarship Fund $73,200 $73,200 $3,600 $3,600 $76,800 $76,800 SE Milennial Teaching Scholarship/Loan (forgivable loan) $117,000 $117,000 $117,000 $117,000 SF Future Teachers Scholarship/Loan (forgivable loan) $3,250 $3,250 $3,250 $3,250 SH Education Lottery Scholarship $690,605 $690,605 $690,605 $690,605 SK NC Division of Vocational Rehabilitation $24,401 $24,401 $24,401 $24,401 SN NC Veterans Scholarship $158,725 $158,725 $158,725 $158,725 SO Nurse Education Scholarship/Loan Program (forgivable loan) $6,673 $6,673 $6,673 $6,673 SP Nurse Scholars Program (forgivable loan) $5,000 $5,000 $5,000 $5,000 SQ Principal Fellows Program (forgivable loan) $202,960 $202,960 $202,960 $202,960 SR Prospective Teacher Scholarship Loan (forgivable loan) $41,000 $2,000 $43,000 $41,000 $2,000 $43,000 ST UNC Need Based Grant $4,158,501 $7,049 $4,165,550 $4,158,501 $7,049 $4,165,550 SW Graduate Assistant Tuition Award Benefit (includes in-state and out-of-state portion) $456 $456 $18,577 $68,380 $86,957 $19,033 $68,380 $87,413 WC Tuition Waivers for Persons at Least 65 Years Old $1,900 $1,900 $1,900 $1,900 WE Faculty/Staff Tuition Waivers $5,180 $5,180 $2,688 $2,688 $7,868 $7,868 F7 Other federal loan $376,485 $240,196 $616,681 $21,026 $21,026 $397,511 $240,196 $637,707 F9 Other federal scholarship or grant $475,750 $26,050 $501,800 $5,594 $5,594 $481,344 $26,050 $507,394 Total $40,014,478 $4,019,906 $44,034,384 $2,792,900 $156,393 $2,949,293 $42,807,378 $4,176,299 $46,983,677
116 Fayetteville State University Office of Institutional Research 07/06/2009
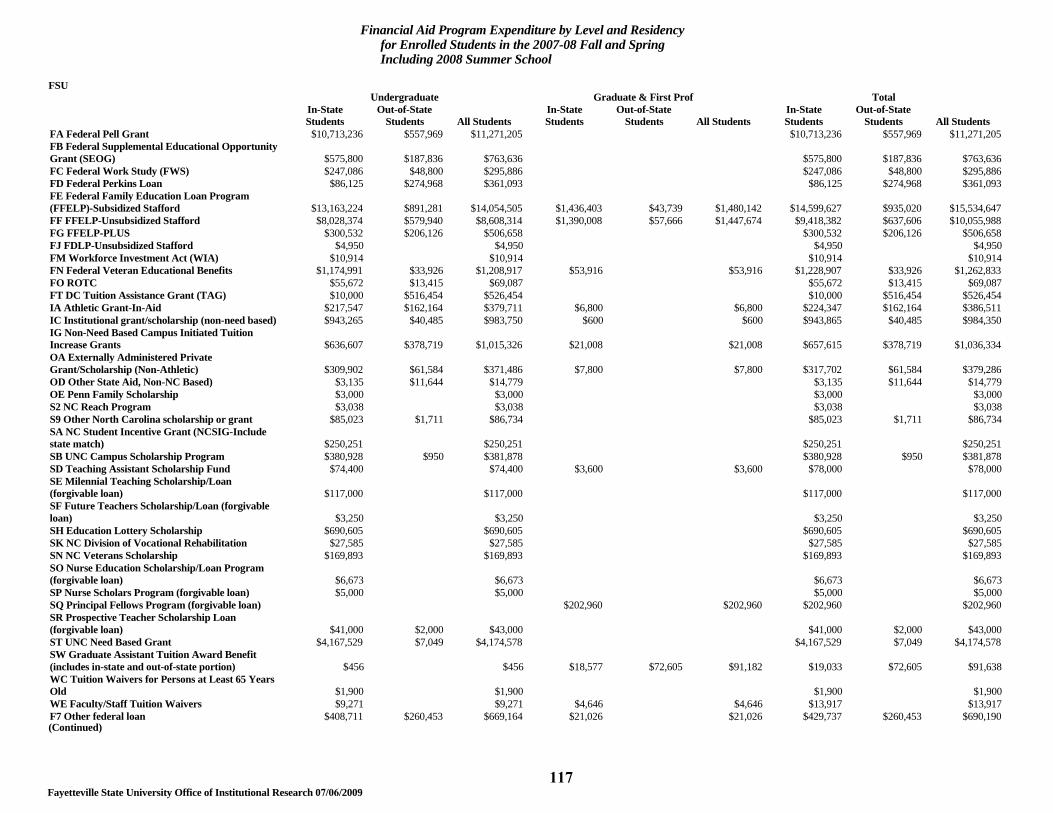
Financial Aid Program Expenditure by Level and Residency for Enrolled Students in the 2007-08 Fall and Spring Including 2008 Summer School
FSU
Undergraduate Graduate & First Prof Total In-State Out-of-State In-State Out-of-State In-State Out-of-State Students Students All Students Students Students All Students Students Students All Students
FA Federal Pell Grant $10,713,236 $557,969 $11,271,205 $10,713,236 $557,969 $11,271,205 FB Federal Supplemental Educational Opportunity Grant (SEOG) $575,800 $187,836 $763,636 $575,800 $187,836 $763,636 FC Federal Work Study (FWS) $247,086 $48,800 $295,886 $247,086 $48,800 $295,886 FD Federal Perkins Loan $86,125 $274,968 $361,093 $86,125 $274,968 $361,093 FE Federal Family Education Loan Program (FFELP)-Subsidized Stafford $13,163,224 $891,281 $14,054,505 $1,436,403 $43,739 $1,480,142 $14,599,627 $935,020 $15,534,647 FF FFELP-Unsubsidized Stafford $8,028,374 $579,940 $8,608,314 $1,390,008 $57,666 $1,447,674 $9,418,382 $637,606 $10,055,988 FG FFELP-PLUS $300,532 $206,126 $506,658 $300,532 $206,126 $506,658 FJ FDLP-Unsubsidized Stafford $4,950 $4,950 $4,950 $4,950 FM Workforce Investment Act (WIA) $10,914 $10,914 $10,914 $10,914 FN Federal Veteran Educational Benefits $1,174,991 $33,926 $1,208,917 $53,916 $53,916 $1,228,907 $33,926 $1,262,833 FO ROTC $55,672 $13,415 $69,087 $55,672 $13,415 $69,087 FT DC Tuition Assistance Grant (TAG) $10,000 $516,454 $526,454 $10,000 $516,454 $526,454 IA Athletic Grant-In-Aid $217,547 $162,164 $379,711 $6,800 $6,800 $224,347 $162,164 $386,511 IC Institutional grant/scholarship (non-need based) $943,265 $40,485 $983,750 $600 $600 $943,865 $40,485 $984,350 IG Non-Need Based Campus Initiated Tuition Increase Grants $636,607 $378,719 $1,015,326 $21,008 $21,008 $657,615 $378,719 $1,036,334 OA Externally Administered Private Grant/Scholarship (Non-Athletic) $309,902 $61,584 $371,486 $7,800 $7,800 $317,702 $61,584 $379,286 OD Other State Aid, Non-NC Based) $3,135 $11,644 $14,779 $3,135 $11,644 $14,779 OE Penn Family Scholarship $3,000 $3,000 $3,000 $3,000 S2 NC Reach Program $3,038 $3,038 $3,038 $3,038 S9 Other North Carolina scholarship or grant $85,023 $1,711 $86,734 $85,023 $1,711 $86,734 SA NC Student Incentive Grant (NCSIG-Include state match) $250,251 $250,251 $250,251 $250,251 SB UNC Campus Scholarship Program $380,928 $950 $381,878 $380,928 $950 $381,878 SD Teaching Assistant Scholarship Fund $74,400 $74,400 $3,600 $3,600 $78,000 $78,000 SE Milennial Teaching Scholarship/Loan (forgivable loan) $117,000 $117,000 $117,000 $117,000 SF Future Teachers Scholarship/Loan (forgivable loan) $3,250 $3,250 $3,250 $3,250 SH Education Lottery Scholarship $690,605 $690,605 $690,605 $690,605 SK NC Division of Vocational Rehabilitation $27,585 $27,585 $27,585 $27,585 SN NC Veterans Scholarship $169,893 $169,893 $169,893 $169,893 SO Nurse Education Scholarship/Loan Program (forgivable loan) $6,673 $6,673 $6,673 $6,673 SP Nurse Scholars Program (forgivable loan) $5,000 $5,000 $5,000 $5,000 SQ Principal Fellows Program (forgivable loan) $202,960 $202,960 $202,960 $202,960 SR Prospective Teacher Scholarship Loan (forgivable loan) $41,000 $2,000 $43,000 $41,000 $2,000 $43,000 ST UNC Need Based Grant $4,167,529 $7,049 $4,174,578 $4,167,529 $7,049 $4,174,578 SW Graduate Assistant Tuition Award Benefit (includes in-state and out-of-state portion) $456 $456 $18,577 $72,605 $91,182 $19,033 $72,605 $91,638 WC Tuition Waivers for Persons at Least 65 Years Old $1,900 $1,900 $1,900 $1,900 WE Faculty/Staff Tuition Waivers $9,271 $9,271 $4,646 $4,646 $13,917 $13,917 F7 Other federal loan $408,711 $260,453 $669,164 $21,026 $21,026 $429,737 $260,453 $690,190 (Continued)
117 Fayetteville State University Office of Institutional Research 07/06/2009

Financial Aid Program Expenditure by Level and Residency for Enrolled Students in the 2007-08 Fall and Spring Including 2008 Summer School
FSU
Undergraduate Graduate & First Prof Total In-State Out-of-State In-State Out-of-State In-State Out-of-State Students Students All Students Students Students All Students Students Students All Students
F9 Other federal scholarship or grant $478,296 $26,050 $504,346 $5,594 $5,594 $483,890 $26,050 $509,940 Total $43,405,169 $4,263,524 $47,668,693 $3,172,938 $174,010 $3,346,948 $46,578,107 $4,437,534 $51,015,641
118 Fayetteville State University Office of Institutional Research 07/06/2009

Student Aid Expenditures by Program, 2007-08 Fayetteville State University
Source of Aid In-State Out-of-State All Students
Number of Dollar Number of Dollar Number of Dollar Recipients Amount Recipients Amount Recipients Amount
Part A. Undergraduate Students Section I. Grants and Scholarships Total Sect.I Grants & Scholarships (unduplicated # of students) 4,239 $20,920,266 255 $1,974,897 4,494 $22,895,163 F9 Other federal scholarship or grant 620 $478,296 36 $26,050 656 $504,346 FA Federal Pell Grant 3,423 $10,713,236 180 $557,969 3,603 $11,271,205 FB Federal Supplemental Educational Opp 1,190 $575,800 102 $187,836 1,292 $763,636 FM Workforce Investment Act (WIA) 9 $10,914 9 $10,914 FN Federal Veteran Educational Benefits 163 $1,174,991 3 $33,926 166 $1,208,917 FT DC Tuition Assistance Grant (TAG) 1 $10,000 55 $516,454 56 $526,454 IA Athletic Grant-In-Aid 60 $217,547 18 $162,164 78 $379,711 IC Institutional grant/scholarship (non 1,347 $943,265 32 $40,485 1,379 $983,750 IG Non-Need Based Campus Initiated Tuit 561 $636,607 126 $378,719 687 $1,015,326 OA Externally Administered Private Gran 218 $309,902 35 $61,584 253 $371,486 S2 NC Reach Program 1 $3,038 1 $3,038 S9 Other North Carolina scholarship or 32 $85,023 1 $1,711 33 $86,734 SA NC Student Incentive Grant (NCSIG-In 385 $250,251 385 $250,251 SB UNC Campus Scholarship Program 485 $380,928 2 $950 487 $381,878 SD Teaching Assistant Scholarship Fund 28 $74,400 28 $74,400 SH Education Lottery Scholarship 574 $690,605 574 $690,605 SK NC Division of Vocational Rehabilita 15 $27,585 15 $27,585 SN NC Veterans Scholarship 32 $169,893 32 $169,893 ST UNC Need Based Grant 2,411 $4,167,529 5 $7,049 2,416 $4,174,578 SW Graduate Assistant Tuition Award Ben 1 $456 1 $456
Section II. Scholarship/Loans (loan repaybable by service) Total Sect.II Scholarship/Loans (unduplicated # of students) 55 $228,595 3 $15,415 58 $244,010 FO ROTC 19 $55,672 2 $13,415 21 $69,087 SE Milennial Teaching Scholarship/Loan 19 $117,000 19 $117,000 SF Future Teachers Scholarship/Loan (fo 1 $3,250 1 $3,250 SO Nurse Education Scholarship/Loan Pro 3 $6,673 3 $6,673 SP Nurse Scholars Program (forgivable l 1 $5,000 1 $5,000 SR Prospective Teacher Scholarship Loan 12 $41,000 1 $2,000 13 $43,000
Section III. Loans Total Sect.III Loans (unduplicated # of students) 3,836 $21,991,916 243 $2,212,768 4,079 $24,204,684 F7 Other federal loan 97 $408,711 27 $260,453 124 $669,164 FD Federal Perkins Loan 50 $86,125 113 $274,968 163 $361,093 FE Federal Family Education Loan Progra 3,423 $13,163,224 213 $891,281 3,636 $14,054,505 FF FFELP-Unsubsidized Stafford 2,336 $8,028,374 139 $579,940 2,475 $8,608,314 FG FFELP-PLUS 74 $300,532 27 $206,126 101 $506,658 FJ FDLP-Unsubsidized Stafford 1 $4,950 1 $4,950
Section IV. Employment Total Sect.IV Employment (unduplicated # of students) 204 $247,086 30 $48,800 234 $295,886 FC Federal Work Study (FWS) 204 $247,086 30 $48,800 234 $295,886
Section V. Total All Categories (Sect.I-IV)(undup. # of students) Total Sect. V All Categories (Sect.I-IV)(undup. # of students) 4,698 $43,387,863 292 $4,251,880 4,990 $47,639,743
Section VI. Other Aid Total Sect.VI Other Miscellaneous Programs (unduplicated # of students) 20 $17,306 2 $11,644 22 $28,950
119 Fayetteville State University Office of Institutional Research 07/06/2009
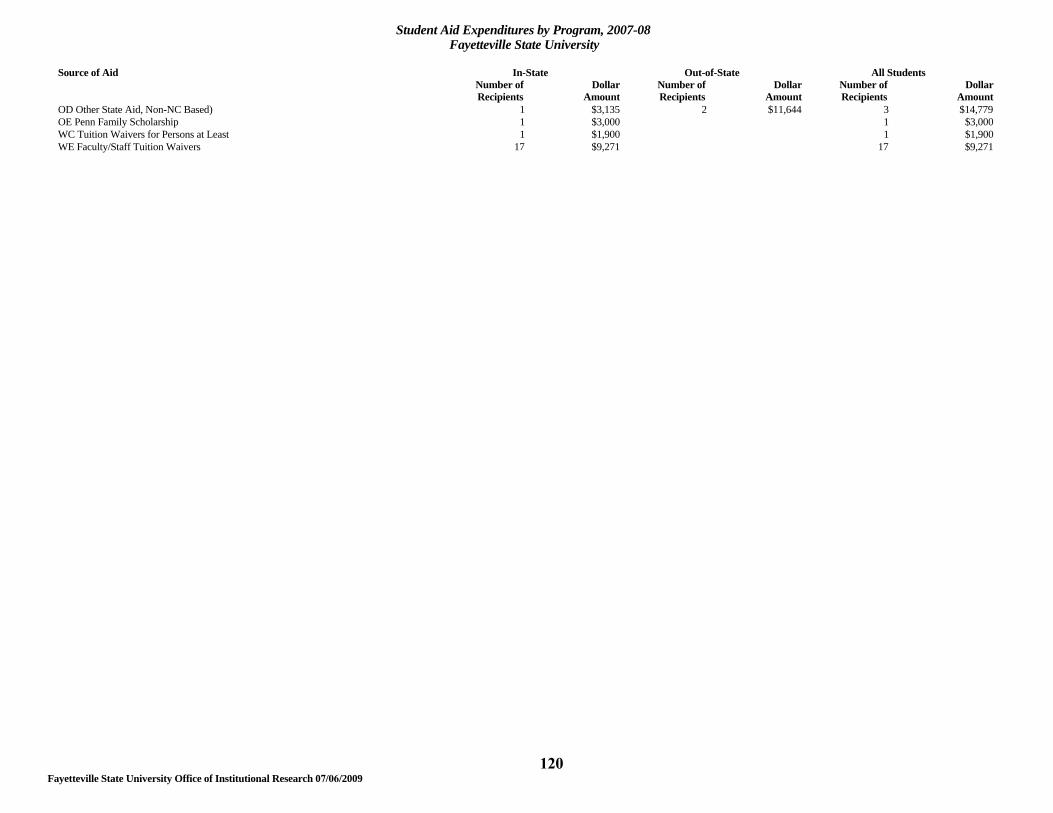
Student Aid Expenditures by Program, 2007-08 Fayetteville State University
Source of Aid In-State Out-of-State All Students
Number of Dollar Number of Dollar Number of Dollar Recipients Amount Recipients Amount Recipients Amount
OD Other State Aid, Non-NC Based) 1 $3,135 2 $11,644 3 $14,779 OE Penn Family Scholarship 1 $3,000 1 $3,000 WC Tuition Waivers for Persons at Least 1 $1,900 1 $1,900 WE Faculty/Staff Tuition Waivers 17 $9,271 17 $9,271
120 Fayetteville State University Office of Institutional Research 07/06/2009
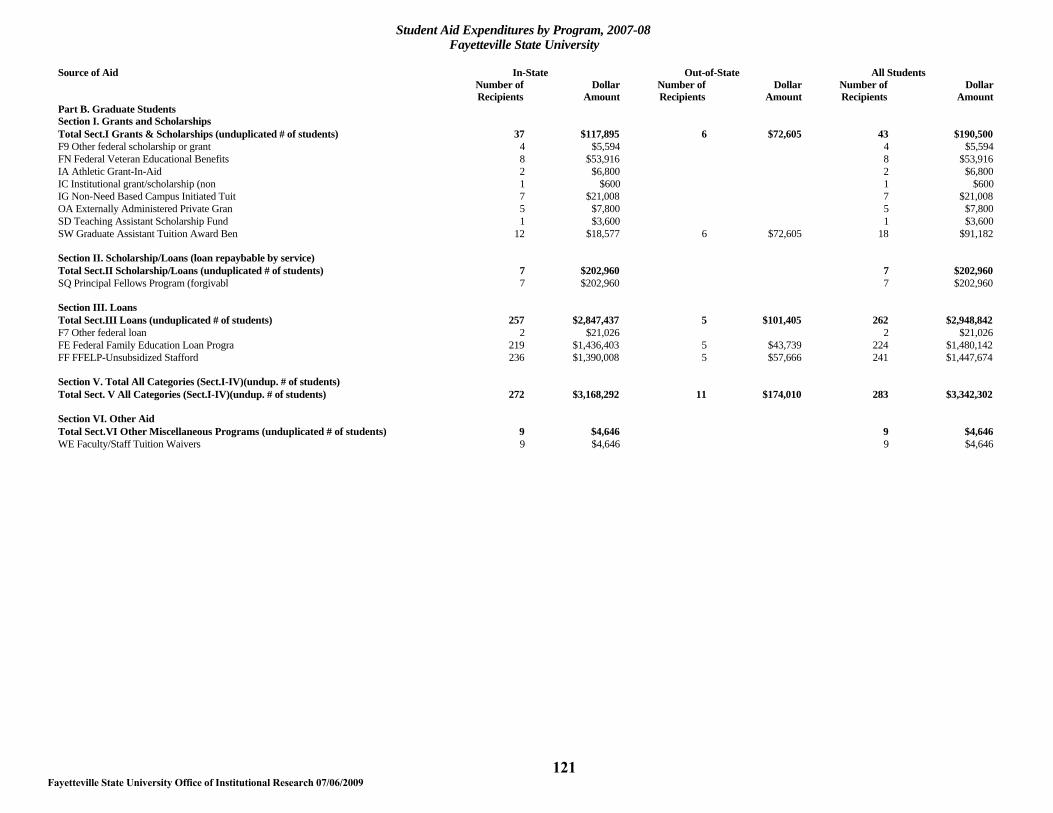
Student Aid Expenditures by Program, 2007-08 Fayetteville State University
Source of Aid In-State Out-of-State All Students
Number of Dollar Number of Dollar Number of Dollar Recipients Amount Recipients Amount Recipients Amount
Part B. Graduate Students Section I. Grants and Scholarships Total Sect.I Grants & Scholarships (unduplicated # of students) 37 $117,895 6 $72,605 43 $190,500 F9 Other federal scholarship or grant 4 $5,594 4 $5,594 FN Federal Veteran Educational Benefits 8 $53,916 8 $53,916 IA Athletic Grant-In-Aid 2 $6,800 2 $6,800 IC Institutional grant/scholarship (non 1 $600 1 $600 IG Non-Need Based Campus Initiated Tuit 7 $21,008 7 $21,008 OA Externally Administered Private Gran 5 $7,800 5 $7,800 SD Teaching Assistant Scholarship Fund 1 $3,600 1 $3,600 SW Graduate Assistant Tuition Award Ben 12 $18,577 6 $72,605 18 $91,182
Section II. Scholarship/Loans (loan repaybable by service) Total Sect.II Scholarship/Loans (unduplicated # of students) 7 $202,960 7 $202,960 SQ Principal Fellows Program (forgivabl 7 $202,960 7 $202,960
Section III. Loans Total Sect.III Loans (unduplicated # of students) 257 $2,847,437 5 $101,405 262 $2,948,842 F7 Other federal loan 2 $21,026 2 $21,026 FE Federal Family Education Loan Progra 219 $1,436,403 5 $43,739 224 $1,480,142 FF FFELP-Unsubsidized Stafford 236 $1,390,008 5 $57,666 241 $1,447,674
Section V. Total All Categories (Sect.I-IV)(undup. # of students) Total Sect. V All Categories (Sect.I-IV)(undup. # of students) 272 $3,168,292 11 $174,010 283 $3,342,302
Section VI. Other Aid Total Sect.VI Other Miscellaneous Programs (unduplicated # of students) 9 $4,646 9 $4,646 WE Faculty/Staff Tuition Waivers 9 $4,646 9 $4,646
121 Fayetteville State University Office of Institutional Research 07/06/2009

Measures of Financial Need for In-State Undergraduate Degree-Seeking Students: For the 2007-08 Academic Year
FSU
In-State Undergrads 5,911 Number With Need 4,280 Pct With Need 72.4 Total Dollars of Need 39,242,994 Number With Unmet Need 2,898 Pct With Unmet Need 49.0 Total Dollars of Unmet Need 10,816,996 Number With Subsidized Loans 3,304 Pct With Subsidized Loans 55.9 Average Amount/ Year: Subsidized Loans 3,518 Number With Unsubsidized Loans 2,079 Pct With Unsubsidized Loans 35.2 Average Amount/ Year: Unsubsidized Loans 3,155 Number With Any Loans 3,668 Pct With Any Loans 62.1 Average Amount/ Year: All Loans 4,957
Definitions: The Academic Year includes Fall (Winter at NCSA) and Spring terms. It excludes all Summer terms. "Need" in this report is the calculated need using the Federal Methodology adjusted to reflect the number of semesters that a student was actually enrolled as an in-state undergraduate. "Unmet Need" is that portion of Need that exceeds gift aid (Scholarships and Grants). All percentages are the percent of the unduplicated headcount of the in-state undergraduates shown in the first column. Average loan amounts are calculated for those with loans (excluding PLUS loans), not for all in-state undergraduates.
122 Fayetteville State University Office of Institutional Research 07/06/2009

Financial Aid Program Expenditure for Enrolled Students in the 2007-08 Academic Year Plus 2008 Summer School
Comparison between amounts reported via Financial Aid File (FAF) and amounts reported by SEAA FSU
FAF SEAA Dollar Dollars Dollars Difference Percent
OE Penn Family Scholarship 3,000 3,000 0 0.0 OF Project Health 0 0 0 S2 NC Reach Program 3,038 3,038 0 0.0 SA NC Student Incentive Grant (NCSIG-In 250,251 238,350 11,901 5.0 SD Teaching Assistant Scholarship Fund 78,000 92,400 -14,400 -15.6 SE Milennial Teaching Scholarship/Loan 117,000 130,000 -13,000 -10.0 SF Future Teachers Scholarship/Loan (fo 3,250 3,250 0 0.0 SG Physical Education/Coaching Scholars 0 0 0 SH Education Lottery Scholarship 690,605 670,206 20,399 3.0 SI NC Board of Governors Medical Schola 0 0 0 SJ NC Board of Governors Dental Scholar 0 0 0 SL NC Scholarships for Health, Science, 0 0 0 SO Nurse Education Scholarship/Loan Pro 6,673 6,673 0 0.0 SP Nurse Scholars Program (forgivable l 5,000 5,000 0 0.0 SQ Principal Fellows Program (forgivabl 202,960 202,960 0 0.0 SR Prospective Teacher Scholarship Loan 43,000 42,250 750 1.8 ST UNC Need Based Grant 4,174,5784,034,179 140,399 3.5 SX Graduate Nurse Scholarship Program f 0 0 0 Total 5,577,3555,431,306 146,049 2.7
Definitions: The Academic Year includes Fall (Winter at NCSA) and Spring terms. It excludes all Summer terms. "Need" in this report is the calculated need using the Federal Methodology adjusted to reflect the number of semesters that a student was actually enrolled as an in-state undergraduate. "Unmet Need" is that portion of Need that exceeds gift aid (Scholarships and Grants). All percentages are the percent of the unduplicated headcount of the in-state undergraduates shown in the first column. Average loan amounts are calculated for those with loans (excluding PLUS loans), not for all in-state undergraduates. 123 Fayetteville State University Office of Institutional Research 07/06/2009

124 Fayetteville State University
Office of Institutional Research 07/06/2009
The Economic Impact of Fayetteville State University Fayetteville State University is an important source of economic activity in the greater Fayetteville region’s economy.1 The university impacts the region’s economy through its own spending and through the spending associated with its students and the out-of-region visitors to its campus. In order to analyze the economic impact of this spending, it is first necessary to identify where the spending associated with the university occurs. It is then necessary to adjust the estimated spending figures to reflect only “net new” economic activity attracted into the greater Fayetteville region by the University. The major types of spending associated with Fayetteville State University are presented in Table 1.
As presented in Table 1, there is just over $120.5 million in total spending activity
associated with the operations of Fayetteville State University. However, this spending does not represent the actual impact of the university on the state or the region. Some of the spending associated with the university occurs outside of the region. For example, spending by faculty, staff, or students living outside of the region, or university purchases made from out-of-region suppliers. These expenditures are not included in the economic analysis. After these are excluded, we have an estimate of the direct impact that the university has on the region. This direct spending represents income to residents and businesses in the greater Fayetteville region
1 The greater Fayetteville region analyzed for this report includes Cumberland, Harnett, Sampson, Bladen, Robeson, Hoke, Moore and Wake Counties. The geographic area analyzed in this report was expanded to add Wake county spending to the modeling and analysis. As a result, the economic impact calculations in this report are not comparable to the FY2004 report.
North North Fayetteville FayettevilleTotal Carolina Carolina as a Region Region as a
Expenditures Category Expenditures Expenditures % of Total Expenditures % of Total
Total $120.5 $109.1 91% $97.1 81%
University Operations $66.3 $55.5 84% $44.1 67% University Payroll $33.6 $32.8 98% $31.5 94% University Procurement $32.7 $22.7 69% $12.6 39%
Foundation/Other Expenditures 2 $2.1 $1.5 69% $0.8 39%University Capital Expenditures $10.0 $10.0 100% $10.0 100%Full Time Student Expenditures $39.1 $39.1 100% $39.1 100%Out-of-State Visitor Expenditures $3.0 $3.0 100% $3.0 100%
(1) The Greater Fayetteville Region consists of Cumberland, Harnett, Sampson, Bladen, Robeson, Hoke, Moore and Wake Counties
(2) No data on the geographic distribution of spending was available - assumed to be distributed as procurement. Source: FSU and the Jacob France Institute
Table 1Summary of Fayetteville State University and Related Expenditures
in North Carolina and the Greater Fayetteville Region1 , Fiscal 2006 (Millions of Dollars)
125 Fayetteville State University
Office of Institutional Research 07/06/2009
that would not occur in the absence of the university. These “net new” expenditures are, in-turn, earned and re-spent by other regional residents and businesses in several successive cycles of economic activity, thus creating so-called “multiplier” effects in the regional economy. After adjusting the spending figures, the $97.1 million in regional spending constitutes the direct university-related spending that impacts the Fayetteville regional economy. This spending represents the direct effects of the university, which are subject to multiplier effects.
University operating expenditures include the payroll and purchases made by the university. Ninety-four percent (94%) of the university’s total payroll expenditures are paid to the university employees that reside in the Greater Fayetteville region. While 69% of the university’s total procurement spending of $32.8 million is paid to suppliers in North Carolina ($22.7 million), only $12.6 million (39%) is paid to suppliers in the Greater Fayetteville region. Thus, a total of $44.1 million of the university’s $66.3 million in operating expenditures are spent in the Greater Fayetteville region (81%) and a total of 91% of the university’s operating expenditures are spent in North Carolina.
University capital expenditures consist of the construction and major renovation expenditures made by Fayetteville State University. The university had total capital and construction expenditures of $10 million in fiscal 2006.
University Foundation/Other expenditures consist of spending by the university foundation and other units outside of the procurement system. FSU had University Foundation/Other expenditures of $2.1 million. No data on the geographic distribution of this spending was available, thus it was distributed in the same manner as university procurement expenditures.
Student expenditures represent the living expenses of Fayetteville State University’s full-time graduate and undergraduate students. Part-time students are not included in this analysis since it is assumed that most of these students already live in the region and their spending, therefore, does not represent new spending in the region’s economy.2 The university’s Office of Financial Aid provided information on the residency, estimated living expenses, and place of residence for undergraduate and graduate students. According to the data provided there are a total of 6,070 full time students in the area attending the university. Annual student living expenses were estimated at $6,440 per student. Multiplying the number of students (6,070) by the estimated living expenses of $6,040 yields an estimated $39.1 million in total student living expenses.
Visitor expenditures represent the spending by out-of-region visitors attracted into the Greater Fayetteville area by Fayetteville State University. It is difficult to estimate the number of out-of-state visitors and their spending. Numerous formal and informal events occur on campus. The university attracted visitors for sporting events, conferences, symposia, and academic events, as well as, admission visits and student visitors. In fiscal 2006, visitor expenditures were estimated at $3 million.
2 Some part-time students do commute into the Fayetteville region from outside of the region, and the local spending of these students could be included in this analysis. Furthermore, many part-time students have been attracted into North Carolina by the programs available at Fayetteville State University. No data on this spending, however, was available. Thus, the overall impact of student expenditures is likely to be undercounted in this report.

126 Fayetteville State University
Office of Institutional Research 07/06/2009
1.1 The Economic Output Impact of Fayetteville State University The expenditures associated with Fayetteville State University are circulated within the region’s economy and become income for businesses and residents. This creates “spin-off” or “multiplier” effects as this money is spent and then re-spent in the regional economy. Thus, each dollar of new spending creates more than one dollar in economic impact, as that spending is earned and, in-turn, spent by others within the region.
Once the level of new expenditures in the economy is known, it can be entered into an economic model to determine the change in economic output (a measure similar to gross national product (GNP), which measures the level of economic activity in a region/state), employment, and earnings attributable to Fayetteville State University.3 The estimated economic output impact of the university is presented in Table 2. Direct impacts are the changes in economic activity directly attributable to the university. Indirect impacts are the “spin-off” or “multiplier” effects caused by the introduction of a new spending stream into the local economy.
Total university, affiliated institution, associated student and visitor expenditures of $97.1 million are leveraged with an additional $98.3 million in indirect spending for a combined total impact of $195.4 million. University operation and foundation/other expenditures account for the half of the overall regional economic impact generated by the university. Student expenditures account for 36% of the university’s impact, capital expenditures account for 11% and out-of-state visitor expenditures account for 3% of the impact.4
Table 2 Economic Output Impact of Fayetteville State University
On the Greater Fayetteville Region, FY 2006 (Millions of Dollars)
Direct Indirect Total Item Impacts Impacts Impacts Total Expenditures 97.1 98.3 195.4 University Operating Expenditures 44.1 52.4 96.5 Foundation/Other Expenditures 0.8 1.0 1.8 University Capital Expenditures 10.0 10.7 20.7 Student Expenditures 39.1 31.4 70.5 Out-of-State Visitor Expenditures 3.0 2.9 5.9 Source: FSU and The Jacob France Institute
3 The Jacob France Institute used the RIMS II Input –Output model from the U.S. Bureau of Economic Analysis. 4 No multipliers for students or visitors exist in the RIMS II model. In order to estimate the economic impact of this spending, blended multipliers were derived for each category of spending based on average spending by major expenditure category by students (from the U.S. Department of Labor’s Consumer Expenditure Survey) and by visitors.

127 Fayetteville State University
Office of Institutional Research 07/06/2009
1.2 The Employment and Earnings Impacts of Fayetteville State University As demonstrated in Table 3, Fayetteville State University directly employs a total of 919 workers in the region, while the $10 million in-region construction expenditures creates an estimated 92 construction related jobs. The total University operating, construction, student and visitor and affiliated institution spending supports an additional 1,505 jobs through indirect or spin-off employment, for a total of 2,516 jobs directly or indirectly supported by the university. As demonstrated in Table 4, there is a total of $81.1 million in salaries and wages associated with these 2,516 jobs, which is comprised of $36.7 million in direct salaries and wages and $44.4 million in salaries and wages for the jobs indirectly created or supported by the university.
Table 3 Employment Impact of
Fayetteville State University On the Greater Fayetteville Region, FY 2006
(Number of Jobs)
Direct Indirect Total Item Impacts Impacts Impacts
Total Employment 1,011 1,505 2,516 University Operating Expenditures 919 617 1,536 Foundation/Other Expenditures 19 19 University Capital Expenditures 92 84 176 Student Expenditures 702 702 Out-of-State Visitor Expenditures 83 83
Source: FSU and The Jacob France Institute
Table 4 Employee Compensation Impact of
Fayetteville State University On the Greater Fayetteville Region, FY 2006
(Millions of Dollars)
Direct Indirect Total Item Impacts Impacts Impacts
Total Employee Compensation 36.7 44.4 81.1 University Operating Expenditures 33.6 21.8 55.4 Foundation/Other Expenditures 0.6 0.6 University Capital Expenditures 3.1 2.8 5.9 Student Expenditures 17.4 17.4 Out-of-State Visitor Expenditures 1.7 1.7
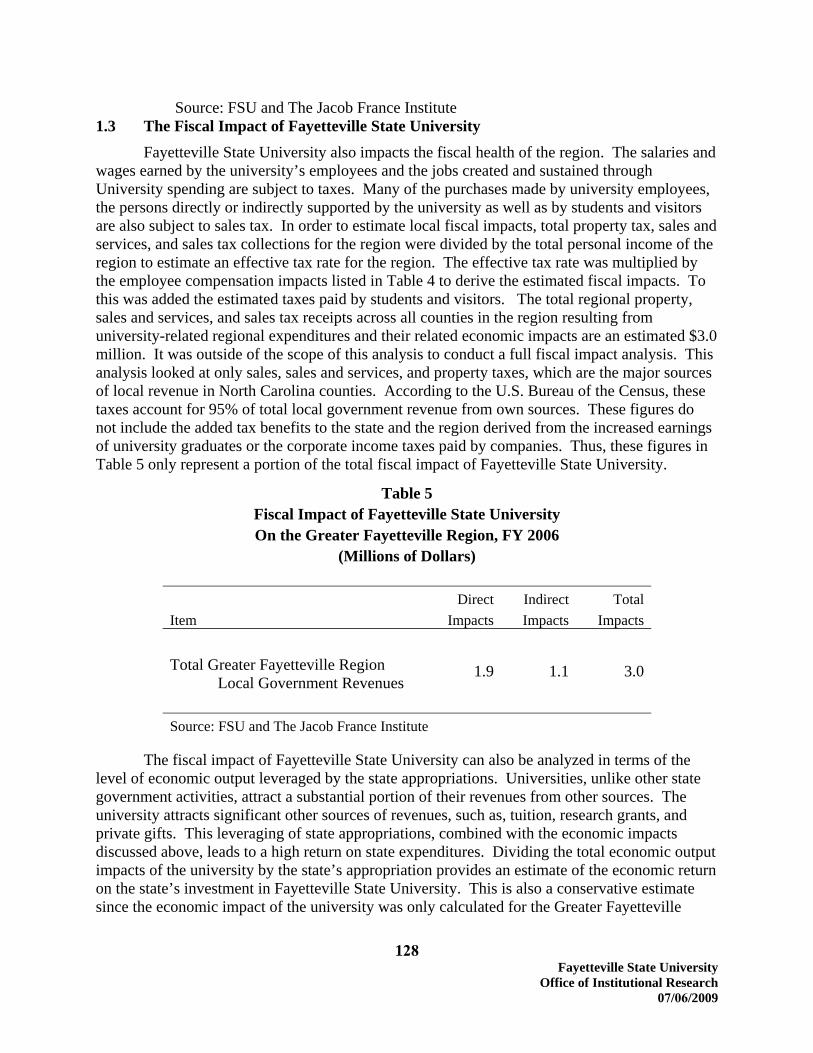
128 Fayetteville State University
Office of Institutional Research 07/06/2009
Source: FSU and The Jacob France Institute 1.3 The Fiscal Impact of Fayetteville State University Fayetteville State University also impacts the fiscal health of the region. The salaries and wages earned by the university’s employees and the jobs created and sustained through University spending are subject to taxes. Many of the purchases made by university employees, the persons directly or indirectly supported by the university as well as by students and visitors are also subject to sales tax. In order to estimate local fiscal impacts, total property tax, sales and services, and sales tax collections for the region were divided by the total personal income of the region to estimate an effective tax rate for the region. The effective tax rate was multiplied by the employee compensation impacts listed in Table 4 to derive the estimated fiscal impacts. To this was added the estimated taxes paid by students and visitors. The total regional property, sales and services, and sales tax receipts across all counties in the region resulting from university-related regional expenditures and their related economic impacts are an estimated $3.0 million. It was outside of the scope of this analysis to conduct a full fiscal impact analysis. This analysis looked at only sales, sales and services, and property taxes, which are the major sources of local revenue in North Carolina counties. According to the U.S. Bureau of the Census, these taxes account for 95% of total local government revenue from own sources. These figures do not include the added tax benefits to the state and the region derived from the increased earnings of university graduates or the corporate income taxes paid by companies. Thus, these figures in Table 5 only represent a portion of the total fiscal impact of Fayetteville State University.
Table 5 Fiscal Impact of Fayetteville State University On the Greater Fayetteville Region, FY 2006
(Millions of Dollars) Direct Indirect Total Item Impacts Impacts Impacts Total Greater Fayetteville Region
Local Government Revenues 1.9 1.1 3.0
Source: FSU and The Jacob France Institute
The fiscal impact of Fayetteville State University can also be analyzed in terms of the level of economic output leveraged by the state appropriations. Universities, unlike other state government activities, attract a substantial portion of their revenues from other sources. The university attracts significant other sources of revenues, such as, tuition, research grants, and private gifts. This leveraging of state appropriations, combined with the economic impacts discussed above, leads to a high return on state expenditures. Dividing the total economic output impacts of the university by the state’s appropriation provides an estimate of the economic return on the state’s investment in Fayetteville State University. This is also a conservative estimate since the economic impact of the university was only calculated for the Greater Fayetteville

129 Fayetteville State University
Office of Institutional Research 07/06/2009
Region. Using this figure, the university generates $3.97 in regional economic activity for every $1.00 in state appropriations.

FinancesOn November 7, 2000 North Carolina
voter
Fayetteville State University is in a constant state of expansionand change that has and will continue to enhance the well-being of students, faculty and staff. Campus buildings such as the Collins Bldg. and Lilly Gymnasium have been and in the case of the Collins Bldg. are still under renovation. The infrastructure of the university will continue to change and these changes will only enhance campus life for all those who are part of the FSU family.
Facilities
Fayetteville State University

Facilities Inventory
Bldg. Name Year Gross Bldg.No Constr. Area Cost000A PAIGE ALUMNI HOUSE 1922 4,640 $13,000001+001A ROSENTHAL BUILDING 1966 32,915 $397,245002 LILLY GYM 1938 36,285 $317,000002A LAURETTA TAYLOR BLDG. 1969 32,276 $618,000003B MITCHELL PRE-SCHOOL 1955 3,721 $50,000004 SEABROOK AUDITORIUM 1953 46,374 $289,000006 TAYLOR SOC SCIENCES BLDG. 1939 21,514 $122,000006A JOSEPH KNUCKLES SCIENCE ANNEX 1968 24,742 $524,000007 JOYNER HALL 1930 23,264 $57,000009 BRYANT HALL 1966 40,926 $607,000010 HARRIS HALL 1938 25,027 $71,000011 COOK HALL 1923 18,168 $93,000012 SMITH HALL 1953 19,208 $230,000013 SPAULDING INFIRMARY 1955 8,982 $104,000014 COMMUNICATION CENTER 1937 13,120 $36,000015B NEWBOLD TRAINING 1958 4,417 $88,000016 VANCE HALL 1966 55,929 $773,000017 WILLIAMS HALL 1955 11,490 $128,000018 HOOD HALL 1939 20,062 $57,000019 HELEN T. CHICK BLDG. 1968 38,526 $583,674020 MAINTENANCE BLDG. 1969 5,047 $82,000021 W.R. COLLINS ADMINISTRATION BLDG. 1970 17,506 $475,000021A C.J. BARBER ADMINISTRATION BLDG. 1981 30,080 $1,328,000022 RUDOLPH JONES STUDENT CENTER 1972 61,980 $900,000023 STORAGE BLDG. 1969 720 $4,000024 MAINT STOR SHED 1974 6,463 $41,744024A VEHICLE/GEN SHOP 1983 6,800 $44,080025 CONT EDUC CENTER 1976 10,880 $265,000026 NEW RESIDENCE HALL 1976 51,901 $1,580,000027 BUTLER LEARNING CENTER 1976 83,393 $2,503,000027A MARION "REX AND ARONUL E. HARRIS SBE BLDG. 1991 73,326 $6,441,000028 CHANCELLOR'S RES 1976 5,925 $135,000029 LYONS SCIENCE 1981 77,220 $5,040,62529A LYONS SCIENCE ANNEX 2007 53,439 $11,873,822.00030 CENTRAL WAREHOUSE 1982 11,056 $383,920031 SECURITY BUILDING 1951 2,800 $23,090032 RADIO TRANSMIT 1982 220 $133,062033 CHARLES CHESNUTT LIBRARY 1987 81,894 $5,720,500034 MITCHELL STORAGE 1980 96 $450035 CONCESSION 1978 340 $1,000036 PRESS BOX 1997 800 $630,700037 RESTROOM 1995 1,610 $8,688038 NEW BOLD STORAGE 1980 1,020 $450039 CONCESSION 1987 120 $6,200040 CONCESSION 1978 192 $500041 FELTON J. CAPEL ARENA 1995 110,176 $9,700,000042 HONORS HALL 1997 37,546 $3,479,600043 BRONCO HALL 2005 67,601 $6,500,000
131
Fayetteville State UniversityOffice of Institutional Research
07/06/2009

FFaayyeetttteevviillllee SSttaattee UUnniivveerrssiittyy OOffffiiccee ooff IInnssttiittuuttiioonnaall RReesseeaarrcchh
0077//0066//22000099
132
Fayetteville State University 2000 Bond Program Distribution Residence Hall For 275 Students $ 6,872,300 Lyons Science Annex and Laboratory Building 15,146,900 Joseph Knuckles Science Annex 1,740,500 Continuing Education Center—Comprehensive Renovation 432,600 Taylor Social Sciences Classroom Building—Comprehensive Renovation 884,300 Charles Chesnutt Library—Comprehensive Renovation 875,900 William Collins Building—Comprehensive Renovation 640,600 Seabrook Auditorium—Comprehensive Renovation 6,325,000 Taylor Gymnasium—Conversion of Building for Academic Use 3,360,000 Lilly Gymnasium—Comprehensive Renovation and Conversion 3,256,400 of Building for Student Services Cook Dining Hall—Comprehensive Renovation and Conversion 1,773,500 of Building for Academic Use and Student Services Student Residence Halls—Fire Safety Improvements 611,700 Campus Infrastructure Improvements 1,435,000 Comprehensive Renovation and Conversion of Spaulding (Old Infirmary) 1,029,100 for Public Safety Facilities Technology Infrastructure Expansion 1,137,600 Seabrook Auditorium—Comprehensive Renovation 500,000 Total $ 46,021,400

FFaayyeetttteevviillllee SSttaattee UUnniivveerrssiittyy OOffffiiccee ooff IInnssttiittuuttiioonnaall RReesseeaarrcchh
0077//0066//22000099
133
FAYETTEVILLE STATE UNIVERSITY Bond Projects Updates Project
Status Start (Bid)Date Projected Completion Date
New Residence Hall $6 – 7 million
Complete 05/03 Complete
Lyons Science Complex $10 – 15 million
Complete 01/05 Complete
Knuckles Science Renovation $1 – 2 million
Submitted Close-Out
09/04 Complete
Continuing Education Renovation $100,000 – 250,000
Complete 03/04 Complete
Chesnutt Library Renovation $300,000 – $500,000
Begin Close-Out Process
12/03 (roof) 06/03 (HVAC) 11/04 (Interior)
Complete Complete Complete
Seabrook Auditorium Renovation $8 – 9 million
Complete 05/03 (asbestos) 07/03 (renovation)
Complete
Taylor Gym Renovation $5 – 6 million
Beneficial Occupancy
04/05 Complete
Lilly Gym Renovation $3 – 4 million
Beneficial Occupancy
08/06 06/09
Cook Hall Renovation $2 – 3 million
Beneficial Occupancy
06/03 (demo/asbestos) 11/03 (lower) 01/04 (upper)
Complete Complete Complete
Fire Safety Residence Halls $400,000 – 500,000
Complete 01/03 Complete
Campus Infrastructure $1 – 2 million
Construction 12/02 Complete Complete
Collins Bldg Renovation
Construction 50% Complete
02/05 05/09
Spaulding Infirmary Renovation $1 – 2 million
Close-Out in Process
11/02 Complete
Taylor Science Renovation $1 – 2 million
Beneficial Occupancy
07/06 Complete
Mitchell Building $200,000 – $400,000
Preparing Construction Contract
08/06 This is not a Bond Project

Fayetteville State University
1200 Murchison Road Fayetteville, North Carolina 28301-4298
910.672.1111 www.uncfsu.edu
Fayetteville State University is a member institution of The University of North Carolina, which is committed to equality of educational opportunity and does not discriminate against applicants,
students, or employees based on race, color, national origin, religion, sex, age, or disability.