facilities master plan
TRANSCRIPT

FACILITIES MASTER PLAN
For
THE LAKE STEVENS SCHOOL DISTRICT
Developed by Construction Services Group
Educational Service District 112 2500 NE 65th Avenue Vancouver, WA 98661
Spring 2015

ACKNOWLEDGMENTS The Lake Stevens School District patrons, administration, and staff spent many hours providing valuable information for this document. Without their considerable time and effort, this project would not have been possible. LAKE STEVENS SCHOOL DISTRICT BOARD OF DIRECTORS
Kevin Plemel, President
David Iseminger, Vice President John Boerger, Director Mari Taylor, Director
Paul Lund, Legislative Representative
LAKE STEVENS SCHOOL DISTRICT ADMINISTRATION
Amy Beth Cook - Superintendent Ken Collins - Assistant Superintendent of Human Resources Teresa Main - Assistant Superintendent of Business Services
Robb Stanton - Executive Director of Operations and Technology Services
LAKE STEVENS SCHOOL DISTRICT FACILITIES MASTER PLANNING ADVISORY COMMITTEE
Becky Ableman Rodger Anderson Steve Burleigh Tonya Christoffersen Kara Evanger Kathleen Friend Mike Friend Bob Gendron Brent Hackney Leslie Ivelia Dan Lorentzen Paul Lund Michelle McDermott TJ McDermott Alex Moll
Jan Novak Shirley Osborn Matt Pewitt Gus Pishue Kevin Plemel Josh Rosenbach Jeff Sickles Jo-Ann Sickles Mike Snow Emily Stainbrook Elizabeth Stanton Pam Stevens Donata Thomas Matt Wyant
Ex-Officio Members
Doug Nichols – Construction Service Group, ESD 112 Dave Teater – Facilities Planning Consultant

TABLE OF CONTENTS
Page
1.0 INTRODUCTION
1.1 Community Background .......................................................................... 1-1 1.2 School District Information ...................................................................... 1-2 1.3 Purpose of the Study............................................................................... 1-3 1.4 Methodology and Plan of Work ............................................................... 1-4 1.5 Data Sources .......................................................................................... 1-5
2.0 EDUCATIONAL PROGRAM
2.1 Educational Programs ............................................................................. 2-1 3.0 ENROLLMENT PROJECTIONS
3.1 Historical Data......................................................................................... 3-1 3.2 Enrollment Projection Methodology ......................................................... 3-2 3.3 Enrollment Projections ............................................................................ 3-4 3.4 Summary ................................................................................................ 3-12
4.0 CAPACITY AND UTILIZATION
4.1 Capacity Analysis .................................................................................... 4-1 4.2 Enrollment vs. Capacity .......................................................................... 4-6
5.0 FACILITIES ASSESSMENTS
5.1 Functional Adequacy............................................................................... 5-1 5.2 Physical Assessment .............................................................................. 5-3
6.0 COMMUNITY INPUT
6.1 Facilities Master Planning Advisory Committee Recommendations ........ 6-1 6.2 Summary of Community and Staff Input .................................................. 6-2
7.0 FACILITIES MASTER PLAN
7.1 General Recommendations .................................................................... 7-1 7.2 Facilities Recommendations ................................................................... 7-2 7.3 Related Recommendations …………………………………………………. 7-7
APPENDICES Appendix A – School Capacities Appendix B - Functional Adequacy Assessments Appendix C – Physical Condition Assessments

Facilities Master Plan
1.0 Introduction
1.1 Community Background
The City of Lake Stevens is located east of the City of Everett in Washington State. Lake Stevens, with a population of approximately 30,000, is located in Snohomish County which has an estimated population of over 740,000. The population of people living within Lake Stevens School District is approximately 40,000. The area is geographically a transition area from the coastal plains to the more mountainous areas to the east. The temperate climate for the Snohomish Area is characterized by warm dry summers and wet semi-mild winters. Average annual precipitation is approximately 47 inches with very little snow. Many residents are families who choose to live in the smaller community and commute to work in Everett and the nearby Marysville area. Many Lake Stevens residents are employed at the Naval Base in Everett or the casino in Marysville. One of the largest employers in the District is the school system. Other major employers are City and County Government, Boeing, and Microsoft. The quality of life is a major attraction for families to relocate to Lake Stevens. Today the Lake Stevens area is a destination for recreation, adventure sports, water activities, and cycling. Major events include Aquafest attracting well over 40,000 people to the downtown area, the International Ironman 70.3 qualifier competition that draws spectators and athletes from as far away as Europe and New Zealand, rowing regattas, and many other festivals and gatherings According to US Census data, the per capita income in Lake Stevens is approximately $27,812, and the median income of households in the City was $71,224. Exhibit 1-1 shows employment details for the City of Lake Stevens
Page 1-1

Facilities Master Plan
EXHIBIT 1-1 EMPLOYMENT BY CATEGORY
CategoryNumber
EmployedPercent
EmployedAgriculture, Mining, Utilities 95 0.70%Construction 1,289 9.60%Manufacturing 2,230 16.50%Wholesale trade 347 2.60%Retail trade 1,754 13.00%Transportation and warehousing 472 3.50%Information 447 3.30%Finance, insurance, real estate, and rental leasing 768 5.70%Professional, scientific, technical, admin. services 1,253 9.30%Educational, health care and social services 2,428 18.00%Arts, entertainment, recreation, accommodation/food services 923 6.80%Other services (except public administration) 805 6.00%Public administration 679 5.00%Total for all sectors (16 years and older) 13,490 100.00%Source: U.S. Census, 2014 1.2 School District Information
The Lake Stevens School District has approximately 8,150 students in grades K-12. It is governed by an elected school board with five members. The board hires a superintendent to serve as their chief executive officer. The educational programs are offered in four “categories” of school organizational types: six K-5 elementary schools, two grade 6-7 middle schools, one grade 8-9 mid-high school, and one grade 10-12 high school. In addition, the District operates an early learning center. The activities of the District are guided by its Mission and Vision statements:
Mission: Our students will be contributing members of society and lifelong learners, pursuing their passions and interests in an ever-changing world.
Vision: To inspire a community-wide culture of excellence, growth and achievement, where individuals are supported and challenged, engaged and empowered, and recognized for their unique contributions.
In addition to the above mission and vision statements, several other statements (below) provide guidance, especially in the areas of school facilities.
Page 1-2

Facilities Master Plan
1.2.1 Foundational Principles
A School Climate that is safe, welcoming, inviting, culturally-aware and emphasizes mutual respect of people and property. District communication that is open, transparent, timely and interactive. Financial Stewardship that promotes trust by ensuring the responsive and optimal use of district resources in a manner that is understandable and transparent to all stakeholders, and, supports the goals of the district.
1.2.2 Facilities Master Plan
In order to efficiently manage the Lake Stevens School District's present and future facilities needs, a Facilities Master Plan shall be developed. The Superintendent shall determine the scope and procedures of the Master Facilities Plan.
1.2.3 Asset Preservation Policy
In order to assure state funding for facilities constructed new or new in lieu after 1994, the Board of Directors will adopt an Asset Preservation Program (APP). The APP will preserve the district facilities by employing a system of predictive, preventative, and proactive processes. Annually, the Superintendent will report to the Board on the condition of the facilities and the effectiveness of the APP. Every sixth year an independent assessment will be conducted and reported to the Board and the Office of Superintendent of Public Instruction. 1.3 Purpose of Study
Preceding this study, the Lake Stevens School District was aware of increasing growth in the community and the corresponding increase in student population. In addition, the District was fully aware that, over time, the physical condition of all school buildings decline. In addition, the District was also aware that, in some instances, the older buildings were having limited success in keeping up with the modern curriculum, especially those elements related to technology. The Lake Stevens Board of Directors has taken seriously its charge to protect and preserve the school facility assets owned by the community and to ensure that their educational mission is supported by appropriate, cost-effective facilities. Therefore, the District felt it was important to understand the current condition of its educational and support facilities. Further, the Board determined that they needed a data-driven plan to help them map the future of the district and how they might improve educational and support facilities.
Page 1-3

Facilities Master Plan
In commissioning this study, the Superintendent had several guidelines: The consultants had to provide the District with an independent, third-party, data-
driven professional assessment of the conditions of its facilities, both physically and their adequacy educationally.
The consultants must coordinate their work with a Facilities Master Planning Advisory Committee (FMPAC).
The work of the consultants and the Facilities Master Planning Advisory Committee had to demonstrate how best to improve existing facilities in this priority order:
a) Provide for the safety and security of students and staff; b) Provide for student enrollments; c) Improve the physical condition of buildings; and d) Improve the educational adequacy of the facilities.
The work of the consultants and Facilities Master Planning Advisory Committee had
to demonstrate a plan for effective and efficient facilities, especially given “tightening” school finance trends.
Reduction of personnel was not a goal of this study. Individual personalities were not factors in the study. In other words, the collective efforts of the consultants, the Committee, the staff,
and the Board are to determine facility improvement options that will help make an excellent school system even better!
1.4 Methodology and Plan of Work
Prior to the commencement of the Facilities Master Plan effort, a detailed plan of work was developed. The many sub-tasks were grouped under the following major work tasks:
a. Project Initiation
b. Interviews
c. Enrollment Projections
d. Capacity Analysis
e. Facility Assessments
f. Develop Options
g. Final Report
The methodology used for this project primarily fell into three categories: (1) the gathering of information and data, (2) the analysis of that information and data, and (3) the development of options for improving facilities based on the data and the analysis.
Page 1-4

Facilities Master Plan
The consulting team consisted of two individuals with collective experience in architecture, school facility planning, school administration, school finance, and school operations. These two team leaders were assisted by numerous facility assessment specialists. 1.5 Data Sources
Data and information was collected from a variety of sources including, but not limited to:
a. School District policies and procedures, b. Physical condition reports, c. Floor plans or diagrams of school facilities, d. Description of program uses of facilities, e. Grade configuration information, f. Student enrollment histories and District projections, g. School class size protocols, and h. Miscellaneous websites.
Page 1-5

Facilities Master Plan
2.0 EDUCATIONAL PROGRAMS
2.1 Educational Programs
The Lake Stevens School District offers a comprehensive set of educational programs and services to be supported by their facilities. In addition to thorough basic education classes in language arts, mathematics, social studies and science, Lake Stevens Schools offer electives in a variety of program areas. The District offers PK-12 programs in music, art, physical education, technology and library services. It also offers a variety of remedial and special needs programs, and enrichment programs. The facilities that house these programs need to be adequate to deliver an educational program that is diverse and comprehensive. Exhibit 2-1 provides an overview of the educational programs that require adequate spaces to support them.
EXHIBIT 2-1 LAKE STEVENS SCHOOL DISTRICT
EDUCATIONAL PROGRAMS
Content
Elementary Middle High
Arts
All students are offered music, dance, multi-arts, or visual arts teacher on staff to provide a sequential elementary arts program aligned with state and national standards. Some schools offer more than one art form. Classes occur in specialized spaces.
In the arts, all middle schools have a music program and a visual arts program. Theater programs may be offered as co-curricular programs All middle schools offer programs in music (choral and instrumental) and visual arts. Classes occur in specialized spaces.
The high school has music (band and choir), visual arts, and theater programs. Classes occur in specialized spaces.
Page 2-1

Facilities Master Plan
Computer and
Technical Education
Students in the middle schools can take an integrated Gateway to Technology/shop class. At the mid high students can take a number of different CTE courses
The high school operates a full range of CTE courses including such things as marketing, computer aps, digital design, manufacturing, engineering, video production
Health and Physical
Education
All students are offered health and physical education programs. Physical education is required for all students for a minimum of 100 minutes per week. Classes occur both indoor and on fields.
All students are required to take health and physical education classes. Health is integrated into physical education classes in the middle schools. Middle School students take an average of 100 minutes per week of physical education each year. Classes occur both indoor and on fields.
All students are required to take health and physical education classes. Health is a stand-alone class in ninth-grade. Physical education classes occur both indoor and outdoor on fields and courts..
Page 2-2

Facilities Master Plan
Literacy The literacy program incorporates reading, writing, and communication in a balanced approach that includes guided reading (small group instruction), independent reading, interactive read aloud, and writing instruction. All schools have a collection of leveled books, allowing teachers to guide students to both fiction and non-fiction books that are appropriate for the student’s individual reading level. Students hear examples of quality literature each year. Writing in a variety of genres begins in first grade. Classes typically occur in general classroom spaces.
A balanced literacy approach is used in all middle schools. Students become proficient in strategies and skills for reading fiction and non-fiction texts. They also write in a variety of genres, including personal narrative, persuasive, and literary essay. Classes typically occur in general classroom spaces.
Literacy is approached through teaching students to analyze a variety of literature and to develop the critical thinking skills needed to read, interpret and discuss content area literature and informational text at appropriate levels of complexity to support the reading demands of college and career. Writing is integrated throughout all language arts courses, teaching students to write in a variety of genres with an emphasis on informational and argumentative writing. Classes typically occur in general classroom spaces.
Page 2-3

Facilities Master Plan
Math Math instruction incorporates a balance of conceptual understanding, procedural proficiency, and problem solving/mathematical processes and is supplemented with other computational practice programs. Classes typically occur in general classroom spaces.
Math instruction incorporates a balance of conceptual understanding, procedural proficiency, and problem solving/mathematical processes. In addition to general math courses, pre-algebra, algebra, and geometry are provided. Classes typically occur in general classroom spaces.
Math instruction incorporates a balance of conceptual understanding, procedural proficiency, and problem solving/mathematical processes. Courses follow a sequence of Algebra I, Geometry, Algebra II, Pre-Calculus, and AP Calculus. Classes typically occur in general classroom spaces.
Remedial Programs
Remedial instruction is provided at every level through Title I programs, LAP, Special Education programs, and District-funded programs. These programs emphasize instruction in literacy and mathematics, but often include other content areas such as life skills, speech and language therapy, physical and occupational therapy, and others. Classes typically occur in either general classroom or specialized instructional or therapeutic spaces.
Remedial instruction is provided at all middle level buildings through LAP programs, Special Education programs, and District-funded programs. One middle school is also served with Title I, Part A funds. These programs emphasize instruction in literacy and mathematics, but often include other content areas such as life skills, speech and language therapy, physical and occupational therapy, and others. Classes typically occur in either general classroom or specialized instructional or therapeutic spaces.
Remedial instruction is provided at the high school level through Special Education programs, LAP programs and District-funded programs. These programs emphasize instruction in literacy and mathematics, but often include other content areas such as life skills, speech and language therapy, physical and occupational therapy, and others. Classes typically occur in either general classroom or specialized instructional or therapeutic spaces.
Page 2-4

Facilities Master Plan
Science Science instruction is provided using researched-based science units at each grade level. Science provides every student the opportunity to directly experience scientific principles through guided inquiry. Classes typically occur in general classrooms.
Science is approached from the perspective of scientists. Students engage in an inquiry-based program using researched-based science modules that align well with elementary and high school science programs. Classes occur in specialized spaces.
Secondary science programs lead students to an understanding of key concepts in life and physical science. Classes occur in specialized spaces.
Social Studies
The social studies curriculum is comprised of a developmental sequence: Families, neighborhoods, communities, Washington State history up to statehood, U.S. geography, and U.S. history from pre-colonization through the revolution. Classes typically occur in general classroom spaces.
Social Studies includes the study of ancient civilizations, U.S. history to 1877, world geography, and Washington State history from statehood to the present. Classes typically occur in general classroom spaces.
Social Studies is comprised of world history, U.S. history, American government and economics. Classes typically occur in general classroom spaces.
Student Services
The student services program provides personal and career guidance services for students. These may include counseling, social work, and health services.
The student services program provides personal and career guidance services for students. These may include counseling, social work, and health services.
The student services program provides personal and career guidance services for students. These may include counseling, social work, and health services.
Page 2-5

Facilities Master Plan
Technology Technology is incorporated throughout the day in elementary schools. Every student has access to computers and all classrooms are wired to the Internet and have a document camera and projector.
Technology is incorporated throughout the day in middle schools. Every student has access to computers and all classrooms are wired to the Internet and have a document camera and projector.
Technology is incorporated throughout the day in high schools. Every student has access to computers and all classrooms are wired to the Internet and have a document camera and projector.
World Language
In preparation for world language classes, students explore various cultures and languages through other programs (e.g. social students, literacy, etc. Classes typically occur in general classroom spaces.
One world language is offered at the mid high school level. Classes typically occur in general classroom spaces.
Three world languages are offered at the high school level. Classes typically occur in general classroom spaces.
Advanced Placement
Advanced Placement courses are offered in the high school. Classes typically occur in general classroom spaces or, in some cases, specialized learning spaces.
Source: Lake Stevens School District, 2015
Page 2-6

Facilities Master Plan
3.0 ENROLLMENT PROJECTIONS
This chapter is devoted to reviewing community growth issues, planning and zoning information, historical enrollment data, computerized enrollment projection models, and preparing for the estimated future impacts, if any, on the capacity of school buildings. The consulting team has used both qualitative and quantitative information to develop the projections. A variety of enrollment projection models have been used as a means of looking at future growth in different ways. Because most of these models use historical information as the basis for projections, the Lake Stevens School District is encouraged to update these projections annually. Information from local agencies will be useful in this endeavor. 3.1 Historical Data
Exhibit 3-1 details the enrollment history for Lake Stevens School District for K-12 students. Exhibit 3-2 charts the data shown in Exhibit 3-1.
EXHIBIT 3-1 LAKE STEVENS SCHOOL DISTRICT
ENROLLMENT HISTORY
Source: ESD 112, 2014
09 - 10 10 - 11 11 - 12 12 - 13 13 - 14 14 - 15K 556 643 544 593 642 6441 579 592 664 574 626 6652 571 597 603 651 601 6513 634 577 615 611 669 5954 605 661 572 626 617 7025 627 607 677 603 628 6156 625 639 619 687 626 6437 627 653 644 620 702 6048 606 632 654 656 629 6949 702 652 682 657 654 60210 647 621 600 619 639 60311 553 566 580 540 589 58112 463 473 531 550 504 553K-5 3,572 3,677 3,675 3,658 3,783 3,872 6-7 1,252 1,292 1,263 1,307 1,328 1,247 8-9 1,308 1,284 1,336 1,313 1,283 1,296
10-12 1,663 1,660 1,711 1,709 1,732 1,737 Total 7,795 7,913 7,985 7,987 8,126 8,152
Page 3-1

Facilities Master Plan
EXHIBIT 3-2 LAKE STEVENS SCHOOL DISTRICT ENROLLMENT HISTORY – GRAPHIC
Source: ESD 112, 2014 3.2 Enrollment Projection Methodology
To identify trends and prepare for adequate spaces, materials and supplies, and teaching staff, school leaders use several methods of projecting enrollment. Among the most commonly used models are average percentage growth, cohort survival, linear regression, and population ratio models. It is important to note that all enrollment projection models provide only estimates of future populations. Because no one model is foolproof, school leaders should consider using more than one method.
3.2.1 Average Percentage Growth
The average percentage growth model calculates future school enrollment growth based on the historical average growth. This model multiplies the historical average percentage increase times the prior year enrollment to project future enrollments.
0
1,000
2,000
3,000
4,000
5,000
6,000
7,000
8,000
9,000
10,000
09 - 10 10 - 11 11 - 12 12 - 13 13 - 14 14 - 15
Enro
llmen
t
Year
Lake Stevens School Dist.Enrollment History
Page 3-2

Facilities Master Plan
3.2.2 Linear Regression Model
Linear regression is a mathematical approach to estimating an unknown future value of a variable by performing calculations on known historical values. Once calculated, several future values for different future dates can then be plotted to provide a “regression line” or “trend line”. There are many types of regression formulas. A straight-line model to estimate future enrollment values was chosen here -- a model that finds the “best fit” based on the historical data.
3.2.3 Cohort Survival Model
The cohort survival method calculates the growth or decline in a grade level over a period of five years based on the ratio of students who attend each of the previous years, the “survival rate.” This ratio is then applied to the incoming class to calculate the trends in that class as it “moves” or graduates through the school system. For example, if history shows that between the first and second grades, the classes for the last five years have grown by an average of 3.5%, then the size of incoming classes for the next five years are calculated by multiplying them by 103.5%. If the history shows a declining trend, the multiplying factor will be less than 100%. The cohort survival model accounts for the net effect of students transferring in and out of school for any reason. For example, if 15 students transfer out of the public school system into a charter school and 20 students transfer in as a result of a new business in town, the net effect is five additional students. This increase in students will be reflected in a higher “survival” rate. The determination of future kindergarten enrollments is critical, especially for projections of more than five years. There are two methods of projecting kindergarten enrollments. The first model uses a linear regression line based on the historical kindergarten enrollments. The second model is based on the correlation between historical birth rates (natality rates) and kindergarten enrollments. The natality correlation model works well when projecting kindergarten enrollments for the next five years but must be combined with the regression model when projecting for extended periods.
3.2.4 Population Ratio Model
The population ratio model examines the historical number of K-12 students as a percentage of the total population. From this annual historical ratio, a series of regression formulas are calculated and applied to future total population estimates. This yields an estimate of future K-12 populations in total and by grade spans.
Page 3-3

Facilities Master Plan
3.3 Enrollment Projections
3.3.1 Percentage Increase Enrollment Projections
Exhibit 3-3 is a table detailing the projected enrollments using the percentage increase or decrease factors which are calculated by averaging the enrollment increases and decreases over the last five years. Exhibit 3-4 is a graphical representation of the table.
EXHIBIT 3-3 LAKE STEVENS SCHOOL DISTRICT PERCENTAGE INCREASE MODEL
Source: ESD 112, 2014
09 - 10 10 - 11 11 - 12 12 - 13 13 - 14 14 - 15K 556 643 544 593 642 644 1 579 592 664 574 626 665 2 571 597 603 651 601 651 3 634 577 615 611 669 595 4 605 661 572 626 617 702 5 627 607 677 603 628 615 6 625 639 619 687 626 643 7 627 653 644 620 702 604 8 606 632 654 656 629 694 9 702 652 682 657 654 602 10 647 621 600 619 639 603 11 553 566 580 540 589 581 12 463 473 531 550 504 553 K-5 3,572 3,677 3,675 3,658 3,783 3,872 6-7 1,252 1,292 1,263 1,307 1,328 1,247 8-9 1,308 1,284 1,336 1,313 1,283 1,296
10-12 1,663 1,660 1,711 1,709 1,732 1,737 Total 7,795 7,913 7,985 7,987 8,126 8,152 Averages
K-5 2.94% -0.05% -0.46% 3.42% 2.35% 1.64%6-7 3.19% -2.24% 3.48% 1.61% -6.10% -0.01%8-9 -1.83% 4.05% -1.72% -2.28% 1.01% -0.16%
10-12 -0.18% 3.07% -0.12% 1.35% 0.29% 0.88%Total 1.51% 0.91% 0.03% 1.74% 0.32% 0.90%
Projection15 - 16 16 - 17 17 - 18 18 - 19 19 - 20
K-5 3,935 4,000 4,065 4,132 4,200 6-7 1,247 1,247 1,247 1,246 1,246 8-9 1,294 1,292 1,290 1,288 1,286
10-12 1,752 1,768 1,783 1,799 1,815 Total 8,229 8,306 8,385 8,466 8,547
Page 3-4

Facilities Master Plan
EXHIBIT 3-4 LAKE STEVENS SCHOOL DISTRICT
PERCENTAGE INCREASE MODEL - GRAPHIC
Source: ESD 112, 2014
3.3.2 Regression Enrollment Projections
Exhibit 3-5 is a table detailing the projected enrollment using the regression model and based on the historical enrollments for the last five years. Exhibit 3-6 is a graphical representation of the table data.
- 2,000 4,000 6,000 8,000
10,00009
- 10
10 -
11
11 -
12
12 -
13
13 -
14
14 -
15
15 -
16
16 -
17
17 -
18
18 -
19
19 -
20
K-1
2
School Year
Lake Stevens School Dist.
History Projection
Percentage Annual Increase Model
Page 3-5

Facilities Master Plan
EXHIBIT 3-5 LAKE STEVENS SCHOOL DISTRICT
LINEAR REGRESSION MODEL
Source: ESD 112, 2014
09 - 10 10 - 11 11 - 12 12 - 13 13 - 14 14 - 15K 556 643 544 593 642 644 1 579 592 664 574 626 665 2 571 597 603 651 601 651 3 634 577 615 611 669 595 4 605 661 572 626 617 702 5 627 607 677 603 628 615 6 625 639 619 687 626 643 7 627 653 644 620 702 604 8 606 632 654 656 629 694 9 702 652 682 657 654 602 10 647 621 600 619 639 603 11 553 566 580 540 589 581 12 463 473 531 550 504 553 K-5 3,572 3,677 3,675 3,658 3,783 3,872 6-7 1,252 1,292 1,263 1,307 1,328 1,247 8-9 1,308 1,284 1,336 1,313 1,283 1,296
10-12 1,663 1,660 1,711 1,709 1,732 1,737 Total 7,795 7,913 7,985 7,987 8,126 8,152
Projection15 - 16 16 - 17 17 - 18 18 - 19 19 - 20
K-5 3,886 3,938 3,989 4,041 4,092 6-7 1,294 1,298 1,301 1,305 1,309 8-9 1,295 1,292 1,290 1,287 1,285
10-12 1,760 1,777 1,794 1,810 1,827 Total 8,236 8,305 8,374 8,444 8,513
Page 3-6

Facilities Master Plan
EXHIBIT 3-6 LAKE STEVENS SCHOOL DISTRICT
LINEAR REGRESSION MODEL – GRAPHIC
Source: ESD 112, 2014
3.3.3 Cohort Survival Enrollment Projections
Exhibit 3-7 is a table detailing the projected enrollments using the cohort survival method based on the enrollment over the last six years and using a linear regression model for the kindergarten projection. Exhibit 3-8 is a graphical representation of the table data. Exhibit 3-9 is a graphical representation of the table data for only the K-5 grades using a linear regression projection for kindergarten (K), the model used by the Office of Superintendent of Public Instruction (OSPI).
- 2,000 4,000 6,000 8,000
10,00009
- 10
10 -
11
11 -
12
12 -
13
13 -
14
14 -
15
15 -
16
16 -
17
17 -
18
18 -
19
19 -
20
K-1
2
School Year
Lake Stevens School Dist.
History Projection
Linear Regression Model
Page 3-7

Facilities Master Plan
EXHIBIT 3-7 LAKE STEVENS SCHOOL DISTRICT
COHORT SURVIVAL MODEL (LINEAR K)
Source: ESD 112, 2014
EXHIBIT 3-8
LAKE STEVENS SCHOOL DISTRICT COHORT SURVIVAL MODEL (LINEAR K) - GRAPHIC
Source: ESD 112, 2014
09 - 10 10 - 11 11 - 12 12 - 13 13 - 14 14 - 15 Avg. % 15 - 16 16 - 17 17 - 18 18 - 19 19 - 20K 556 643 544 593 642 644 Survival 652 666 680 694 7081 579 592 664 574 626 665 104.88% 675 684 699 713 7282 571 597 603 651 601 651 102.34% 681 691 700 715 7303 634 577 615 611 669 595 101.43% 660 691 701 710 7254 605 661 572 626 617 702 102.22% 608 675 706 717 7265 627 607 677 603 628 615 101.63% 713 618 686 718 7296 625 639 619 687 626 643 102.31% 629 729 632 702 7357 627 653 644 620 702 604 100.82% 648 634 735 637 7088 606 632 654 656 629 694 100.63% 608 652 638 740 6419 702 652 682 657 654 602 102.27% 710 622 667 652 757
10 647 621 600 619 639 603 92.14% 555 654 573 615 60111 553 566 580 540 589 581 91.39% 551 507 598 524 56212 463 473 531 550 504 553 92.28% 536 508 468 552 484K-5 3,572 3,677 3,675 3,658 3,783 3,872 3,989 4,025 4,172 4,267 4,3466-7 1,252 1,292 1,263 1,307 1,328 1,247 1,277 1,363 1,367 1,339 1,4438-9 1,308 1,284 1,336 1,313 1,283 1,296 1,318 1,274 1,305 1,392 1,398
10-12 1,663 1,660 1,711 1,709 1,732 1,737 1,642 1,669 1,639 1,691 1,647K-12 7,795 7,913 7,985 7,987 8,126 8,152 8,226 8,331 8,483 8,689 8,834
01,0002,0003,0004,0005,0006,0007,0008,0009,000
09 -
10
10 -
11
11 -
12
12 -
13
13 -
14
14 -
15
15 -
16
16 -
17
17 -
18
18 -
19
19 -
20
K-1
2
School Year
Lake Stevens School Dist.
History Projection
Cohort Survival Model
Page 3-8

Facilities Master Plan
EXHIBIT 3-9
LAKE STEVENS SCHOOL DISTRICT COHORT SURVIVAL MODEL (LINEAR K) – K-5 GRAPHIC
Source: ESD 112, 2014 Exhibit 3-10 is a table detailing the projected enrollments using the cohort survival method based on the enrollment over the last six years and using a natality correlation model for the kindergarten projection. Exhibit 3-11 is a graphical representation of the table data for K-5 with a kindergarten projection based on natality.
3,3003,5003,7003,9004,1004,3004,500
09 -
10
10 -
11
11 -
12
12 -
13
13 -
14
14 -
15
15 -
16
16 -
17
17 -
18
18 -
19
19 -
20
K-5
School Year
Lake Stevens School Dist.
History Projection
Cohort Survival Enrollment Projection
Page 3-9

Facilities Master Plan
EXHIBIT 3-10 LAKE STEVENS SCHOOL DISTRICT
COHORT SURVIVAL MODEL (NATALITY K)
Source: ESD 112, 2014
EXHIBIT 3-11 LAKE STEVENS SCHOOL DISTRICT
COHORT SURVIVAL MODEL (NATALITY K) – K-12 GRAPHIC
Source: ESD 112, 2014
09 - 10 10 - 11 11 - 12 12 - 13 13 - 14 14 - 15 Avg. % 15 - 16 16 - 17 17 - 18 18 - 19 19 - 20K 556 643 544 593 642 644 Survival 592 587 607 619 6171 579 592 664 574 626 665 104.88% 675 621 616 637 6492 571 597 603 651 601 651 102.34% 681 691 636 630 6523 634 577 615 611 669 595 101.43% 660 691 701 645 6394 605 661 572 626 617 702 102.22% 608 675 706 717 6595 627 607 677 603 628 615 101.63% 713 618 686 718 729
K-5 3,572 3,677 3,675 3,658 3,783 3,872 3,929 3,883 3,952 3,966 3,945
3,3003,5003,7003,9004,1004,3004,500
09 -
10
10 -
11
11 -
12
12 -
13
13 -
14
14 -
15
15 -
16
16 -
17
17 -
18
18 -
19
19 -
20
K-5
School Year
Lake Stevens School Dist.
History Projection
Cohort Survival Model (Natality K)
Page 3-10

Facilities Master Plan
3.3.4 Population Ratio Model Projections
Exhibit 3-12 is a table detailing the projected enrollment using the regression model and based on the historical enrollments for the last five years. Exhibit 3-13 is a graphical representation of the K-12 totals in the table data.
EXHIBIT 3-12 LAKE STEVENS SCHOOL DISTRICT
POPULATION RATIO MODEL
Source: ESD 112, 2014
09 - 10 10 - 11 11 - 12 12 - 13 13 - 14 14 - 15 15 - 16 16 - 17 17 - 18 18 - 19 19 - 20K 556 643 544 593 642 6441 579 592 664 574 626 6652 571 597 603 651 601 6513 634 577 615 611 669 5954 605 661 572 626 617 7025 627 607 677 603 628 6156 625 639 619 687 626 6437 627 653 644 620 702 6048 606 632 654 656 629 6949 702 652 682 657 654 60210 647 621 600 619 639 60311 553 566 580 540 589 58112 463 473 531 550 504 553K-5 3,572 3,677 3,675 3,658 3,783 3,872 3,929 4,011 4,092 4,173 4,2546-7 1,252 1,292 1,263 1,307 1,328 1,247 1,308 1,320 1,331 1,342 1,3528-9 1,308 1,284 1,336 1,313 1,283 1,296 1,307 1,312 1,316 1,319 1,321
10-12 1,663 1,660 1,711 1,709 1,732 1,737 1,780 1,809 1,838 1,867 1,895K-12 7,795 7,913 7,985 7,987 8,126 8,152 8,324 8,451 8,577 8,700 8,821
Dist. Pop. 38,968 39,977 40,248 40,726 41,238 42,142 43,047 43,951 44,856 45,760 46,665 St. Ratio 20.00% 19.79% 19.84% 19.61% 19.71% 19.34% 19.34% 19.23% 19.12% 19.01% 18.90%
Page 3-11

Facilities Master Plan
EXHIBIT 3-13 LAKE STEVENS SCHOOL DISTRICT
POPULATION RATIO MODEL - GRAPHIC
Source: ESD 112, 2014
3.4 Summary
The consulting team used five different enrollment projection models to estimate future enrollments. Each model emphasizes different types of data, and therefore is limited in its effectiveness as a predictive tool. Two models, the percentage increase model and the regression model, emphasize historical data. These models are quite effective predictors if there is no forecast of rapid community growth or decline and that student population rates have minimal fluctuation. The other models also use historical enrollments but also take into account student mobility patterns and the effects of the natality rates in prior years. The cohort survival model is perhaps the best known predictive tool using this type of data. However, like the percentage increase model and the regression model, the cohort survival model loses its predictive capabilities in communities that experience, or are expected to experience, very rapid changes in student growth or decline. All of the models predict that enrollments will increase in the next five years. All five models’ projection lines are fairly consistent. Exhibit 3-14 is the summary table of the K-12 projections. Exhibit 3-15 is a graphic representation of the data in the table. The red line
0
2,000
4,000
6,000
8,000
10,000
09 -
10
10 -
11
11 -
12
12 -
13
13 -
14
14 -
15
15 -
16
16 -
17
17 -
18
18 -
19
19 -
20
K-1
2
School Year
Lake Stevens School Dist.
History Projection
Population Ratio Model
Page 3-12

Facilities Master Plan
is the “best,” or average prediction of future enrollments. Exhibit 3-16 is a breakdown of the “best” predictions on a grade level grouping basis. (Please note that totals on the grade level “best” groupings will not equal the totals on K-12 “best” table. This is due to rounding and variety of technical matters related to the statistical models used.)
EXHIBIT 3-14 LAKE STEVENS SCHOOL DISTRICT
K-12 “BEST” MODEL
Source: ESD 112, 2014
EXHIBIT 3-15 LAKE STEVENS SCHOOL DISTRICT
K-12 “BEST” MODEL - GRAPHIC
Source: ESD 112, 2014
Year 15 - 16 16 - 17 17 - 18 18 - 19 19 - 20% Increase 8,229 8,306 8,385 8,466 8,547Regression 8,236 8,305 8,374 8,444 8,513Cohort (Linear K) 8,226 8,331 8,483 8,689 8,834Cohoart (Natality K) 8,166 8,189 8,263 8,388 8,433Population Ratio 8,324 8,451 8,577 8,700 8,821Best Estimate 8,236 8,317 8,416 8,537 8,630
7,500
8,000
8,500
9,000
09 -
10
10 -
11
11 -
12
12 -
13
13 -
14
14 -
15
15 -
16
16 -
17
17 -
18
18 -
19
19 -
20
K-1
2
School Year
Lake Stevens School Dist.
History Annual % Increase RegressionCohort (Linear K) Cohoart (Natality K) Population RatioBest Estimate
Best Estimate
Page 3-13

Facilities Master Plan
EXHIBIT 3-16 LAKE STEVENS SCHOOL DISTRICT
GRADE LEVEL GROUPING “BEST” MODEL
Source: ESD 112, 2014
Elementary
Year 15 - 16 16 - 17 17 - 18 18 - 19 19 - 20% Increase 3,935 4,000 4,065 4,132 4,200Regression 3,886 3,938 3,989 4,041 4,092Cohort (Linear K) 3,989 4,025 4,172 4,267 4,346Cohoart (Natality K) 3,929 3,883 3,952 3,966 3,945Population Ratio 3,929 4,011 4,092 4,173 4,254Best Estimate 3,934 3,971 4,054 4,116 4,167
Middle
Year 15 - 16 16 - 17 17 - 18 18 - 19 19 - 20% Increase 1,247 1,247 1,247 1,246 1,246Regression 1,294 1,298 1,301 1,305 1,309Cohort (Linear K) 1,277 1,363 1,367 1,339 1,443Cohoart (Natality K) 1,277 1,363 1,367 1,339 1,443Population Ratio 1,307 1,312 1,316 1,319 1,321Best Estimate 1,280 1,316 1,320 1,310 1,352
Mid-High
Year 15 - 16 16 - 17 17 - 18 18 - 19 19 - 20% Increase 1,294 1,292 1,290 1,288 1,286Regression 1,295 1,292 1,290 1,287 1,285Cohort (Linear K) 1,318 1,274 1,305 1,392 1,398Cohoart (Natality K) 1,318 1,274 1,305 1,392 1,398Population Ratio 1,307 1,312 1,316 1,319 1,321Best Estimate 1,306 1,289 1,301 1,336 1,337
High
Year 15 - 16 16 - 17 17 - 18 18 - 19 19 - 20% Increase 1,752 1,768 1,783 1,799 1,815Regression 1,760 1,777 1,794 1,810 1,827Cohort (Linear K) 1,642 1,669 1,639 1,691 1,647Cohoart (Natality K) 1,642 1,669 1,639 1,691 1,647Population Ratio 1,780 1,809 1,838 1,867 1,895Best Estimate 1,715 1,738 1,739 1,772 1,766
Page 3-14

Facilities Master Plan
Based on all the available information, the consulting team believes that the Lake Stevens School District should use the “best,” or average numbers for planning purposes. Each year, the information should be “refreshed” and compared against current capacities.
Page 3-15

Facilities Master Plan
4.0 CAPACITY AND UTILIZATION The capacity of a school building is driven by four main factors: (1) the physical size of the instructional spaces, (2) the class size limits, (3) the schedule of uses, and (3) the programs that are offered by the school. Because capacity formulas often apply different “weights” to these factors, one can find a number of capacity definitions across the country. For the Lake Stevens School District, a single method of calculating capacity was used – the instructional space model. This brings both consistency and clarity to the process of determining capacity. Once capacity is determined, it can be compared to enrollments or projected future enrollments. This comparison produces a “utilization factor” that is discussed later in this chapter. 4.1 Capacity Analysis
Each school in the Lake Stevens District underwent an analysis to determine its capacity. School capacity, or the number of students a building is designed to reasonably accommodate, is largely driven by the number of students assigned to each class, the number of square feet in the classroom, the number of periods in the schedule, where teacher preparation periods occur, the ratio of required courses vs. elective courses, and number of programs offered.
4.1.1 Methodology
Existing building capacity information was gathered though analysis of building floor plans and interview of district personnel. The calculations required a variety of information:
a. plans, maps, diagrams, and drawings of existing buildings b. information regarding the numbers of teaching spaces and their uses c. square footage information for each school d. interviews with staff
Many “special needs” programs require smaller class sizes with more area per student, specialized utilities and equipment, and space for specialists to serve their needs. Examples of the programs needing different spaces include the self-contained classrooms, resource room programs, speech and language therapy, Occupational and Physical Therapy, Title I (remedial reading and mathematics), gifted education, science, PE, and music. Capacity is then calculated by multiplying the number of teaching spaces by type (e.g. kindergarten rooms, primary grade rooms, intermediate grade rooms, special education rooms, PE teaching spaces, music rooms, secondary general classrooms, art rooms, etc.) times the class size limit (often stated in the negotiated agreement or in Board policy). The sum of the products in each school type would be multiplied by a “scheduling factor.”
Page 4-1

Facilities Master Plan
Scheduling factors are used to reflect the fact that not every classroom can be scheduled to have a “perfect fit” of students in the attendance zone when compare to capacity standards. For elementary schools, a scheduling factor of 95% reflects this imperfect fit. In addition, the District must account for the practice of having each middle school and high school teacher use of their classrooms without students for their preparation period. At middle school and high school levels, the enrollment would be multiplied by 83% to reflect the planning period for each teacher in a seven period instructional day (5 teaching periods ÷ 6 total periods = 83% scheduling factor).
4.1.2 Current Capacity Standards
The consultants used the instructional space model of calculating capacity which is based on an actual count of the different types of classrooms and their maximum enrollment. Often, general classrooms have a greater capacity than special learning classrooms (e.g., special education classrooms have lower enrollments due to the legal requirements of handicapped education laws). Based on Lake Stevens School District practices for classroom enrollment sizes, we have used these values:
K-3 = 25 students Grades 4-5 = 27 students Grades 6-12 = 30 students (average over five periods) Special Education (Life Skills) = 12 students Title I, Resource = 20 students
Exhibit 4-1 details the different types of spaces and their capacity for the K-5 program. Please note that many special learning spaces (computer lab, music, P.E., etc.) do not have student capacity for K-5 because the students are counted in their home rooms. These special learning spaces are used for “pull-out” programs.
Page 4-2

Facilities Master Plan
EXHIBIT 4-1 K-5 SPACE STANDARDS CHART
Source: Lake Stevens School District, 2014 Exhibit 4-2 details the capacity standards for grades 6-12. The special learning spaces for the secondary grade levels do have capacity since the schools are on a six period schedule. Computer labs have been counted at 15 students, or “half capacity,” with the assumption that half of the time the space will have assigned students and the other half of the time the students will use the lab as a “drop in” space while they are assigned to other spaces in the building.
K - Full Day (FTE) 25Grade 1 25Grade 2 25Grade 3 25Grade 4 27Grade 5 27Art 0Music 0PE 0Computer Labs 0Self Cont. Sp Ed 12RR, Title I, or Other Pull Out 0Other
Elementary School Instructional Space Model Standards
Page 4-3

Facilities Master Plan
EXHIBIT 4-2 6-12 SPACE STANDARDS CHART
Source: Lake Stevens School District, 2014
4.1.3 Current Capacity
In order to obtain the numbers of each classroom type, the consulting team analyzed a simple floor plan of each school. Once the number of classrooms for each type of space was determined, the capacity for each school was calculated by multiplying the number of spaces (for each space type) times the capacity value from the capacity standards charts. (See Exhibits 4-1 and 4-2.) For each school, once the capacity was determined, it was multiplied by a scheduling factor. Scheduling factors are used to reflect the fact that not every classroom can be scheduled to have a “perfect fit” of the maximum enrollment standards and the District’s practice of having secondary teachers use their classrooms without students for their preparation period. These scheduling factors have been used:
Elementary = 95% Middle, Mid-High, and High = 83% (5 out of 6 periods)
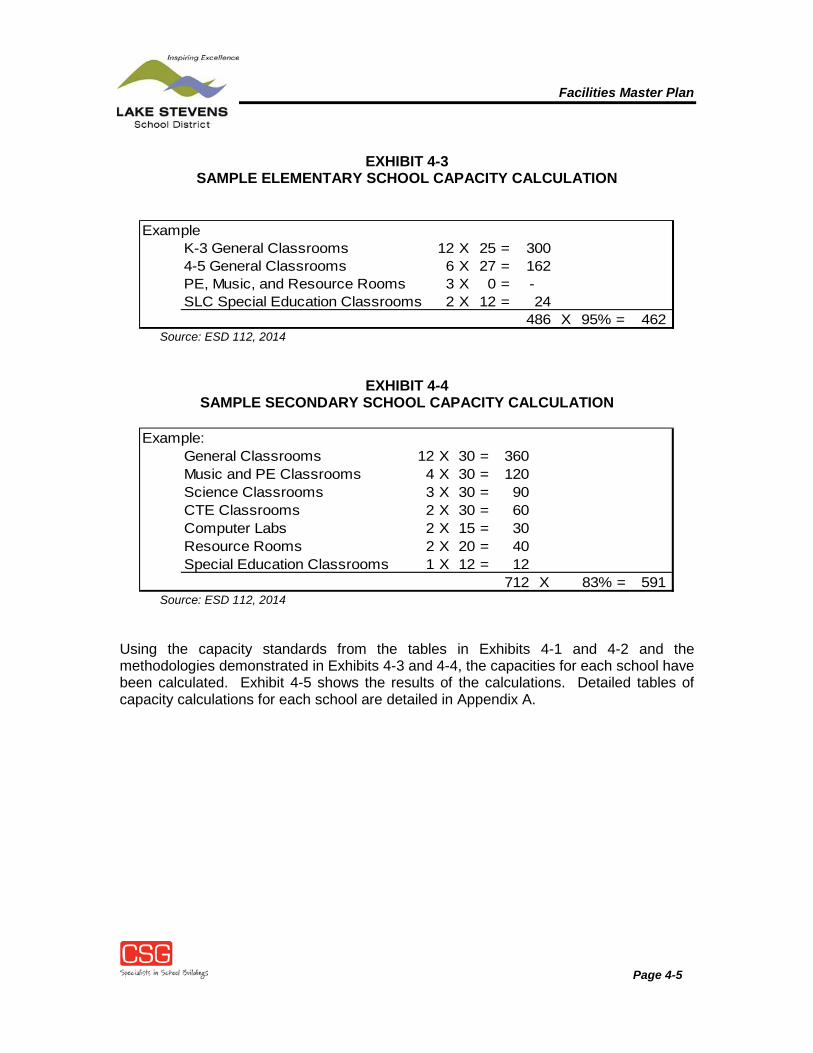
Examples of the calculations for both elementary and secondary schools are detailed in Exhibits 4-3 and 4-4.
Grades 6-12 30Art 30Business Labs 30Computer Labs 15Music 30PE 30Science 30CTE 30Self Cont. Sp Ed 12RR, Title I, or Other Pull Out 20Drama 30Other 0
Middle, Mid High, and High School Instructional Space Model Standards
Page 4-4
Facilities Master Plan
EXHIBIT 4-3 SAMPLE ELEMENTARY SCHOOL CAPACITY CALCULATION
ExampleK-3 General Classrooms 12 X 25 = 300 4-5 General Classrooms 6 X 27 = 162 PE, Music, and Resource Rooms 3 X 0 = - SLC Special Education Classrooms 2 X 12 = 24
486 X 95% = 462 Source: ESD 112, 2014
EXHIBIT 4-4 SAMPLE SECONDARY SCHOOL CAPACITY CALCULATION
Example:
General Classrooms 12 X 30 = 360 Music and PE Classrooms 4 X 30 = 120 Science Classrooms 3 X 30 = 90 CTE Classrooms 2 X 30 = 60 Computer Labs 2 X 15 = 30 Resource Rooms 2 X 20 = 40 Special Education Classrooms 1 X 12 = 12
712 X 83% = 591 Source: ESD 112, 2014
Using the capacity standards from the tables in Exhibits 4-1 and 4-2 and the methodologies demonstrated in Exhibits 4-3 and 4-4, the capacities for each school have been calculated. Exhibit 4-5 shows the results of the calculations. Detailed tables of capacity calculations for each school are detailed in Appendix A.
Page 4-5

Facilities Master Plan
EXHIBIT 4-5 SCHOOL CAPACITIES
Source: ESD 112, 2014 4.2 Enrollment vs. Capacity
In order for schools to fully meet their educational goals, capacity and enrollment must be matched. When capacity exceeds enrollment (under-utilization) capital expenditures may be reduced or facilities removed from inventory. When enrollment exceeds capacity (over-utilization) capital expenditures may need to be increased. The formula for calculating utilization is “enrollment ÷ capacity = utilization.”
4.2.1 Elementary Enrollment and Capacity
The current K-5 enrollment exceeds the capacity in every elementary school. The total current elementary utilization is 131%. The projected future utilization increases to 141%. This growing utilization rate indicates that the elementary schools will continue to be even more “overcrowded” in the future.
4.2.1 Secondary Enrollment and Capacity
The elementary utilization picture is in contrast to the middle schools that are underutilized. The middle schools as a whole have a utilization factor of 87% but are expected to increase utilization to 94% in the next five years. (Lake Stevens MS is underutilized while
Site Ca p a c ity
Glenwood ES 485 Hillcrest ES 521 Highland ES 498 Mt. Pilchuck ES 473 Skyline ES 447 Sunnycrest ES 534
Elementary Total 2,958 Lake Stevens MS 794 North Lake MS 648
Middle Total 1,443 Cavelero Mid-HS 1,686 Lake Stevens HS 1,673 Totals 7,760
Page 4-6

Facilities Master Plan
North Lake is at 101% utilization. This pattern suggests that attendance boundaries might need adjustment.) Cavelero Mid-High is at 76% utilization while Lake Steven High School is at 104% utilization. Both Schools are expected to increase their utilization rates in the coming five years. Exhibit 4-6 is a table showing the current capacity, current enrollment, and current utilization for each school. Exhibit 4-7 is a table showing the projected capacity, projected enrollment, and projected utilization rates.
EXHIBIT 4-6 CURRENT FACILITY UTILIZATION
Source: ESD 112, 2014
Site
Ca p a c ity W itho ut
Po rta b le s
Curre nt Enro llme nt
10-1-14Curre nt
U til iza tio n
Glenwood ES 485 588 121%Highland ES 498 682 137%Hillcrest ES 521 732 141%Mt. Pilchuck ES 473 618 131%Skyline ES 447 506 113%Sunnycrest ES 534 746 140%
Elementary Total 2,958 3,872 131%Lake Stevens MS 794 610 77%North Lake MS 648 652 101%
Middle Total 1,443 1,262 87%Cavelero Mid-HS 1,686 1,275 76%Lake Stevens HS 1,673 1,743 104%Totals 7,760 8,152
Page 4-7

Facilities Master Plan
EXHIBIT 4-7 PROJECTED FACILITY UTILIZATION
Source: ESD 112, 2014 Exhibit 4-8 provides four graphic representations of the relationship between capacity and enrollment for the coming five years at each school level.
Site
Ca p a c ity W itho ut
Po rta b le s
Pro je c te d Enro llme nt
2020
Pro je c te d Util iza tio n
2020
Glenwood ES 485 Highland ES 498 Hillcrest ES 521 Mt. Pilchuck ES 473 Skyline ES 447 Sunnycrest ES 534
Elementary Total 2,958 4,167 141%Lake Stevens MS 794 North Lake MS 648
Middle Total 1,443 1,352 94%Cavelero Mid-HS 1,686 1,337 79%Lake Stevens HS 1,673 1,766 106%Totals 7,760 8,622
Page 4-8

Facilities Master Plan
EXHIBIT 4-8 PROJECTED FACILITY UTILIZATION GRAPHS
Source: ESD 112, 2014
- 500
1,000 1,500 2,000 2,500 3,000 3,500 4,000 4,500
15 - 16 16 - 17 17 - 18 18 - 19 19 - 20
Enro
llmen
t
School Year
Lake Stevens School District
Elementary School Capacity Projected Enrollment
-
200
400
600
800
1,000
1,200
1,400
1,600
15 - 16 16 - 17 17 - 18 18 - 19 19 - 20
Enro
llmen
t
School Year
Lake Stevens School District
Middle School Capacity Projected Enrollment
Page 4-9

Facilities Master Plan
EXHIBIT 4-8 (CONTINUED) PROJECTED FACILITY UTILIZATION GRAPHS
Source: ESD 112, 2014
- 200 400 600 800
1,000 1,200 1,400 1,600 1,800
15 - 16 16 - 17 17 - 18 18 - 19 19 - 20
Enro
llmen
t
School Year
Lake Stevens School District
Mid-High School Capacity Projected Enrollment
- 200 400 600 800
1,000 1,200 1,400 1,600 1,800 2,000
15 - 16 16 - 17 17 - 18 18 - 19 19 - 20
Enro
llmen
t
School Year
Lake Stevens School District
High School Capacity Projected Enrollment
Page 4-10

Facilities Master Plan
5.0 CONDITION OF FACILITIES
5.1 Functional Adequacy
Each Lake Stevens District facility was also assessed to determine how well it supports the educational program. This functional adequacy assessment, prepared by an educational professional, examines the sizes, adjacencies, utilities, and other features of each space. The assessment describes how well the facility supports the staff as they implement the educational program in each space. School spaces are “tools” that exist for an educational function. Therefore, the design features in a school can make it much easier for educators to accomplish their educational mission. Conversely, if schools are absent these design features, the job of providing an adequate education in those facilities can be compromised. Analysis of functional adequacy is not a clinical, objective effort. It requires an understanding of the educational program being delivered as well as the application of professional judgment to varying pedagogical circumstances. Assessing functional adequacy always has an element of subjectivity, but certain elements are well recognized in the industry and were used in this assessment. For this project, the following areas were assessed:
Site General Classrooms Special Learning Spaces
- Early Childhood-Kindergarten (elementary schools only) - Specials Needs (special education, Title I, SLP, etc.) - Computer labs - Physical Education - Music - Library - Visual Arts - Science - Career Technical Education (secondary schools only) - Performing Arts Areas - Gifted Education
Support Spaces - Administration - Student Services - Staff Support - Food Service - Custodial-Maintenance
Page 5-1

Facilities Master Plan
For each of the above functional spaces, the assessment professional determined the functional adequacy across several recognized categories. This assessment adopted those recognized categories and identified them as follows:
The proper size of spaces Adjacencies (appropriate spatial relationships) Utilities, technology, fixed equipment, surfaces, and storage
Each category has one or more items assessed utilizing District criteria, national norms, and the professional judgment of trained assessors. Each space has “possible points” assigned to it that roughly reflects the proportion of that space to the whole. The assessor then assigns points and a total is calculated. If a space is not included in the education specification or program of studies for that school, those points are removed from possible point total. Each assessment also includes comments that help clarify any deficiencies or cite special circumstances. Once a total score is calculated, a rating of “good,” “fair,” “poor,” or “unsatisfactory” is assigned. The scoring and rating are designed to help compare one facility to another, or prioritize, for capital improvement planning. Exhibit 5-1 details the key for this rating.
EXHIBIT 5-1 KEY FOR FUNCTIONAL ADEQUACY RATINGS
Source: Educational Service District 112, 2014 No schools scored in the “Unsatisfactory” range. One school, North Lake Middle School, scored in the “Poor” range. Three schools (Highland Elementary School, Lake Stevens Middle School, and Cavelero Mid-High School) scored “Good.” All the other schools scored in the “Fair” range. The ratings for the schools for the Lake Stevens School District are summarized in Exhibit 5-2. The detailed assessment for each school can be found in Appendix B.
90+ Good: The facility design supports the educational program offered. It may have minor functional adequacy problems but generally meets the needs of the educational program.
75-89 Fair: The facility has some problems meeting the needs of the educational program and may require some improvements
50-74 Poor: The facility has numerous problems meeting the needs of the educational program and needs significant improvements
Below 50 Unsatisfactory: The facility is functionally inadequate and does not support the educational program in many areas.
Page 5-2

Facilities Master Plan
EXHIBIT 5-2 SUMMARY OF FUNCTIONAL ADEQUACY RATINGS
Source: Educational Service District 112, 2014 5.2 Physical Assessment
Each school facility was also assessed by professional architects with deep backgrounds in school facility design and construction. They assessed the buildings in terms of its physical condition. The physical condition assessments consider a number of factors including the major building components (e.g. exterior building systems, interior building systems, mechanical systems, and safety/building codes systems, etc.). Each of these major components is further broken down and each sub-component is scored. The key for the physical assessment is detailed in Exhibit 5-3.
Site
Functio na l Ad e q ua cy
Sco re
Functio na l Ad e q ua cy
De scrip tio n
Glenwood ES 78 FairHighland ES 90 GoodHillcrest ES 80 FairMt. Pilchuck ES 81 FairSkyline ES 77 FairSunnycrest ES 80 FairLake Stevens MS 90 GoodNorth Lake MS 74 PoorCavelero Mid-HS 93 GoodLake Stevens HS 76 Fair
Page 5-3

Facilities Master Plan
EXHIBIT 5-3 KEY FOR PHYSICAL ASSESSMENT AND SITE ASSESSMENT RATINGS
90+ Good: The building and/or a majority of its systems are in good
condition and only require routine maintenance. 65-89 Fair: The building and/or some of its systems are in fair condition
and require minor repair. 40-64 Poor: The building and/or a significant number of its systems are in
poor condition and require major repair or renovation. Below 40 Unsatisfactory: The building and/or a majority of its systems should
be considered for replacement. Source: Educational Service District 112, 2014
Six schools scored in the “Fair” range, while four schools scored in the “Good” range. The summary of the scores are in in Exhibit 5-4. The detailed assessment for each school can be found in Appendix C.
EXHIBIT 5-4 SUMMARY OF PHYSICAL ASSESSMENT RATINGS
Source: Educational Service District 112, 2014
Site
Phys ica l Co nd itio n
Sco re
Phys ica l Co nd itio n
De scrip tio n
Glenwood ES 66.7 FairHighland ES 83.6 FairHillcrest ES 87.8 GoodMt. Pilchuck ES 86.5 GoodSkyline ES 70.4 FairSunnycrest ES 88.4 GoodLake Stevens MS 81.0 FairNorth Lake MS 80.1 FairCavelero Mid-HS 87.6 GoodLake Stevens HS 67.9 Fair
Page 5-4

Facilities Master Plan
Assessments were also completed for the District’s support facilities. Functional adequacy assessments were completed on all but the Transitions Program’s portable classrooms. (Because portables classrooms, by definition, have no core spaces, they are not able to be assessed by conventional functional adequacy assessment tools.) Physical condition assessments were completed on all of the support facilities. Exhibit 5-5 details the results of the assessment scores.
EXHIBIT 5-5 SUMMARY OF ASSESSMENTS FOR SUPPORT FACILITIES
Site
Phys ica l Co nd itio n
Sco re
Phys ica l Co nd itio n
De scrip tio n
Functio na l Ad e q ua cy
Sco re
Functio na l Ad e q ua cy
De scrip tio n
District Office 82 FairEarly Learning Center 25 UnsatisfactoryMaintenance Shop 50 UnsatisfactoryTransitions 0 PortablesTransportation Shop 73 PoorSource: Educational Service District 112, 2014
Page 5-5

Facilities Master Plan
6.0 COMMUNITY INPUT
As part of the school facilities master planning process, the consulting team and the District sought input from the community:
a. The District established a Facilities Master Planning Advisory Committee (FMPAC) that provided feedback to the consulting team and the District throughout the planning process. The FMPAC was comprised of a cross section of community members and District staff.
b. The District leadership and FMPAC conducted five work sessions to explain the planning process and collect the community’s responses and input to the planning data and other local-known facilities issues.
6.1 Facilities Master Planning Advisory Committee
a. The Lake Stevens School District convened a Facilities Master Planning Advisory Committee (FMPAC) of 29 members representing staff, students, community members, parents, school board members and alumni. The FMPAC’s responsibility was to identify and prioritize major facility improvement needs for Lake Stevens School District. It was not the charge of the FMPAC to identify specific projects for a future bond. That work will be undertaken by a separate group at a time determined appropriate by the Board.
c. Facilities Master Planning Advisory Committee Members
Alex Moll: teacher, middle school Bob Gendron: communications industry Donata Thomas: community representative Elizabeth Stanton: high school student Emily Stainbrook: elementary school parent Gus Pishue: real estate industry Jan Novak: ministerial association Jeff Sickles: co-chair Jo-Ann Sickles: co-chair Kara Evanger: teacher, elementary school Kevin Plemel: school board member Leslie Ivelia: administrator, high school Matt Pewitt: administrator, elementary school Matt Wyant: administrator, early learning center Michelle McDermott: teacher, special education Mike Friend: strategic plan representative Mike Snow/Josh Rosenbach: administrators, mid-high school Pam Stevens: editor of local newspaper
Page 6-1

Facilities Master Plan
Paul Lund: school board member Rodger Anderson: teacher, high school Shirley Osborn: teacher, early learning center Steve Burleigh: administrator, elementary school TJ McDermott: secondary school parent Tonya Christoffersen: utility industry Brent Hackney: community representative Dan Lorentzen: law enforcement Kathleen Friend: strategic plan representative Becky Ableman: city administration
d. The FMPAC spent three months analyzing and discussing facilities
information and working together to prioritize facility improvement needs. Data sources included a presentation by Educational Service District 112 consultants on their evaluation of enrollment projections, the District’s building’s physical and functional condition, capacity and current and projected utilization.
e. For purposes of the FMPAC work, facility needs were separated into the following categories:
• Safety and Security • Building Capacity • Building/Site Physical Condition • Building/Site Functional Adequacy • Other
6.2 Facilities Master Plan Advisory Committee Recommendations
The FMPAC invested a significant amount of time reviewing and discussing immediate, mid-term and long-term priorities of students and the greater community before agreeing upon a list of recommendations. The final recommendations are contained in Chapter 7 of this document. It will fall to another group to extract elements of the project recommendations contained in this report for any future capital levies or bonds.
Page 2

Facilities Master Plan
7.0 FACILITIES MASTER PLAN
The recommended improvements to facilities in Lake Stevens School District, as developed by the Facilities Master Planning Advisory Committee are presented below: 7.1 GENERAL RECOMMENDATIONS
The committee identified several general recommendations that overarch the individual facilities recommendations and should be considered when building or improving facilities.
● Form a committee to evaluate the needs of district schools in the areas of safety and security and incorporate identified improvements into the recommendations listed above.
● Provide detailed solutions and cost estimates to this list of committee-recommended improvements through a technical committee.
● Consider the facility needs of district-wide special education programs when addressing any new facility project.
● Consider two-story solutions for efficiency when building new schools and modernizing existing ones.
● Consider any program space needs of the district's Educational Service Center when building or modifying support facilities.
● Consider school boundary review and adjustments as an interim solution and when new schools are built.
● Acquire property for future schools and support functions responsive to the Facilities Master Plan.
Page 7-1

Facilities Master Plan
7.2 FACILITIES RECOMMENDATIONS
The committee developed several decision-making filters that influenced the selection of which projects were most urgent. These were:
1) Safety and security 2) Enrollment and school capacity 3) Preservation of public assets 4) Facility adequacy for program requirements
The committee realized that some capacity concerns are urgent, but also believed it was important to place a very high value on protecting and preserving current facilities. One of the considerations in placing projects in the “Group A” list was the recognition that completing one major project would most likely create a “domino effect,” thus resolving different tier one and two concerns. Group A Projects Build permanent, new elementary schools for current and projected unhoused elementary students.
● The district currently has enough unhoused students to warrant a new, seventh elementary school.
○ Currently five of the six elementary schools are above their design capacity. ○ Two elementary schools are above 700 students, and a third is very close.
● Adding an eighth elementary school will be needed, and would improve the functional adequacy of the rest of the elementary schools by reducing their enrollment.
○ Our projected permanent capacity shortfall by 2020 for K-5 is 1,200 students.
○ The potential for full-day kindergarten and reduced class sizes at the K-3 level will create additional unhoused students.
Committee Thoughts: The committee saw the need for one elementary to be immediate and urgent to deal with existing capacity issues, while the second elementary was important within the ten-year planning period but did not have the same urgency.
Page 7-2

Facilities Master Plan
Build a new Early Learning Center (ELC). Options include build it 1) along with a new elementary school, 2) adjacent to an existing elementary school, or 3) as a stand-alone building. The committee specifically identified the following areas of concern:
● The current ELC is a modular building that is lacking in space for the current educational program.
● With a larger facility, the ELC could expand its preschool offerings to more students.
● The ELC does not have a gym or multipurpose area for student use. ● Classrooms, special education space, restrooms, corridors and vehicle traffic were
all rated “Unsatisfactory” in the Building Condition Assessment. Committee Thoughts: One of the key reasons the ELC is prioritized highly is that the committee felt strongly that new facilities for the ELC could be wrapped into the building of a new elementary. Provide selective improvements and expansion of Lake Stevens High School. The committee specifically identified the following areas of concern:
Tier One Concerns ● Classrooms are not of sufficient size or configuration to serve the current
educational program. ● The committee saw particular deficiencies in the following programmatic
areas: Science, Technology, Engineering and Math (STEM), Music, Special Education and Physical Education.
○ Classrooms designed for science, technology, engineering and math (STEM) are not present in sufficient numbers or arrangements.
○ Special education classrooms are not of adequate size or configuration for the district’s current educational program.
○ The gym, locker rooms and weight room are not adequate in size to accommodate the current educational program. The gym is not large enough to hold the entire student body. The bleachers are old and in need of repair. The bleachers do not provide enough room on the floor for traffic and team benches. There is no disabled seating in the gym.
○ The instrumental and vocal music classrooms and support spaces are insufficient in size for the number of students participating in these programs. The arrangement of the music classrooms is not conducive to the educational needs of either program. There are
Page 7-3

Facilities Master Plan
insufficient practice, storage and specialized spaces to meet the needs of the current program.
● Address safety and security issues associated with an open-style campus with exterior student circulation.
● Several systems are rated “Poor” in the Building Condition Assessment: ○ The roof is poor in several areas and has exceeded its life
expectancy across the campus. ○ HVAC is poor in several buildings. The system is managed by three
control systems, including one by compressed air. It is difficult to keep temperatures within normal operating parameters when the weather is especially hot or cold.
○ Plumbing is failing in all areas of the school and is becoming more difficult to repair and replace.
○ Sub drainage in several locations has failed and buildings and walkways flood in heavy rains.
● Paving in the alley behind the building has cracked and failed. Student safety in the alley needs to be addressed.
● Conditions of the restrooms have deteriorated. Fixtures, dividers and finishes have exceeded their useful life.
● Facilities for pedestrian and vehicle circulation are inadequate.
Tier Two Concerns ● Configuration of offices and support spaces in the 300 building are
inadequate for the educational and student support program. Committee Thoughts: The committee as a whole felt that the work on the high school and the repairs to Glenwood and Skyline (see below) should be of high priority, in part, because the committee saw many of the high school and current elementary problems as safety and capacity concerns. Address urgent repair needs and improve classroom security by providing selective systems improvements at Glenwood Elementary School. The committee specifically identified the following areas of concern:
Tier One Concerns
● The school is on a septic tank at a cost to the district, and there have been overflows onto the playground.
● Several systems have reached the end of their useful life and are rated as “Poor” in the Building Condition Assessment.
○ The fire sprinkler system is corroding.
Page 7-4

Facilities Master Plan
○ The intercom cannot be expanded.
Tier Two Concerns ● Classrooms have no doors, so it is noisy and classrooms cannot be
secured in case of emergency. ● The residential-style HVAC units have exceeded their life expectancies and
are failing. ● The lunchroom must also be used as the PE instructional space.
Address urgent repair needs and improve classroom security by providing selective systems improvements at Skyline Elementary School. The committee specifically identified the following areas of concern:
Tier One Concerns
● Several systems have reached the end of their useful life and are rated as “Poor” in the Building Condition Assessment.
○ The fire sprinkler system is corroding. ○ The roof is leaking and exploration has uncovered poor design that
contributes to the problem. ○ The intercom cannot be expanded.
Tier Two Concerns
● Classrooms have no doors, which leads to excess noise, and classrooms cannot be secured in case of emergency.
● The residential-style HVAC units have exceeded their life expectancies and are failing.
● The driveway, parking and student drop off zones are inadequate for current activities.
● The lunchroom must also be used as the PE instructional space. Group B Projects Adequately address the facility needs of the district’s alternative learning programs. The committee specifically identified the following areas of concern:
● Lake Stevens’ alternative high school students are currently part of the Crossroads program through Granite Falls School District. These students could be better served by remaining in Lake Stevens School District in a permanent space.
● The Transitions program is currently housed in a facility that is not conditionally or functionally adequate.
Page 7-5

Facilities Master Plan
● HomeLink is housed in several classrooms and portables on the campus of North Lake Middle School. North Lake will need these spaces as its enrollment increases in order to meet the needs of its educational program.
Provide selective improvements to Lake Stevens Middle School. The committee specifically identified the following areas of concern:
● The locker room, weight room and bleachers in the gym are not adequate in size to accommodate the current educational program.
● The main gym bleachers have exceeded their useful life and have become difficult to operate and repair.
● Storage for the performing arts educational program is insufficient. ● Address safety and security issues associated with an open-style campus with
exterior student circulation. ● The track is unusable during the wet times of the year.
Provide selective improvements to North Lake Middle School. The committee specifically identified the following areas of concern:
Tier One Concerns
● The HVAC is rated “Poor” throughout the school. It is difficult to keep temperatures within normal operating parameters when the weather is especially hot or cold. Air exhaust and intake are not adequate and cause frequent problems.
● Staff support area is not configured to best serve students. The main office and counseling center need to be adjacent to one another.
● The locker room and gymnasium are not adequate in size to accommodate the current educational program.
● STEM spaces are not adequate for the current program. ● Address safety and security issues associated with an open-style campus
with exterior student circulation. Tier Two Concerns
● Make improvements to the library to create capacity for students to use the space as intended.
● Improvements to the auditorium are needed for performances. ● The track is in need of rehabilitation. ● Pedestrian and vehicle circulation is challenging with the current campus
configuration, and the gym located across a city street. Build a new maintenance facility:
Page 7-6

Facilities Master Plan
● The current facility is rated “Poor” to “Unsatisfactory” in a number of functional adequacy categories and “Poor” in building condition.
Provide selective improvements to the transportation facility. The committee specifically identified the following areas of concern:
● There is not enough parking for the current fleet of buses, and the situation will only get worse as new buses are added to support new schools.
● On-site employee parking is inadequate. ● There are not enough offices for the administrative staff of the Transportation
Department. ● Additional restrooms are needed for the staff and the staff lounge is too small. ● The training/meeting rooms are too small for the size of the staff.
Group C Projects
● Remodel the stages at Hillcrest and Mt. Pilchuck Elementary Schools. ● Pave the gravel parking lot on the east side of Hillcrest Elementary School. ● Provide additional parking at Cavelero Mid High School for large events. ● Provide secure outdoor access for students at Cavelero Mid High School.
7.3 Related Recommendations
The following recommendations are intended to provide guidance with the implementation of the Facilities Master Plan.
7.3.1 Review School Board Facility Policies
Periodic reviews of school board policies and administrative procedures will help staff and patrons more clearly understand the facility goals for the District and the processes necessary to reach those goals. These written documents will improve communications and provide guidance in the setting of priorities in the Facilities and Maintenance Department.
7.3.2 Update Enrollment Projections Annually
The enrollment projections will need to be updated annually as the Facilities Master Plan is implemented. As facility conditions are improved and programs change, demographics will change and the data will need to be updated. Actual enrollments should be compared to projected enrollments. This updated information should then be used to update the enrollment projections. Using updated enrollment projections will help the District address facility needs based upon changing trends in student enrollment and addressing those trends in a timely manner.
Page 7-7

Facilities Master Plan
7.3.3 Re-Draw Attendance Boundaries
A key component of the Facilities Master Plan is the efficient use of existing facilities. To efficiently accomplish this objective, the District will need to regularly update boundaries in order to maximize the use of existing facilities. Care must be taken to balance the need to efficiently utilize facilities with the needs of students. Attendance boundary policies can be developed to address both concerns. Similar policies in other districts often include allowing students to remain at a particular school once enrolled, not requiring a change when safety concerns exist, overcrowding occurs, transportation changes, etc. Any policy on boundary changes should be reviewed on a regular basis.
7.3.4 Develop Educational Specifications and Other Building Standards
Current school pre-construction processes are complex and time consuming. Before school design can even begin, it often takes many months to develop educational specifications, building standards, and product specifications. The District should develop these written documents and have them in place prior to the selection of the design team. By doing so, the District could enjoy the following benefits:
a. By being “in front” of the planning process and have more time for thoughtful input.
b. By minimizing the “my school” and “my classroom” mentality by developing educational specifications and building standards early.
c. By standardizing building components for maintenance. This will reduce the District’s inventory of different parts and allow economies of scale in the procurement process.
d. By improving integration with maintenance and operations through the early development of standards.
e. By saving money over time, both in fees and a shortened design time. f. By minimizing variance between different A/E firms during design through
District ownership of educational specifications and facility standards. g. By having greater control of the final product.
7.3.5 Update the Facilities Master Plan Every Five Years
As facility conditions are improved, enrollment changes, and programs change, this Facilities Master Plan will become somewhat outdated. To ensure that a viable, data-driven plan is current, the District should update this plan every five years. By keeping the plan and its data current, the District will be better able to adjust to changing conditions and student needs.
Page 7-8

Facilities Master Plan
APPENDICES

Facilities Master Plan
APPENDIX A – SCHOOL CAPACITIES
# RoomsRoom
Capacity SubtotalHead Start 0 - Pre-K 0 - K Half Day 0 - K Full Day 3 25 75 Grade 1 4 25 100 Grade 2 3 25 75 Grade 3 3 25 75 Grade 4 3 27 81 Grade 5 3 27 81 Art 0 - Music 1 0 - PE 1 0 - Science 0 - Computer Labs 1 0 - Self Cont. Sp Ed 2 12 24 RR, Title I, Pull Out 2 0 - Other 0 - Other 0 - Total Room Count 26 511
Scheduling Factor = 95%Instructional Space Model Capacity = 485
Glenwood ES
# RoomsRoom
Capacity SubtotalHead Start 0 - Pre-K 0 - K Half Day 0 - K Full Day 4 25 100 Grade 1 4 25 100 Grade 2 3 25 75 Grade 3 3 25 75 Grade 4 3 27 81 Grade 5 3 27 81 Art 0 - Music 1 0 - PE 1 0 - Science 0 - Computer Labs 1 0 - Self Cont. Sp Ed 3 12 36 RR, Title I, Pull Out 4 0 - Other 0 - Other 0 - Total Room Count 30 548
Scheduling Factor = 95%Instructional Space Model Capacity = 521
Hillcrest ES
# RoomsRoom
Capacity SubtotalHead Start 0 - Pre-K 0 - K Half Day 0 - K Full Day 3 25 75 Grade 1 4 25 100 Grade 2 4 25 100 Grade 3 3 25 75 Grade 4 3 27 81 Grade 5 3 27 81 Art 0 - Music 1 0 - PE 2 0 - Science 0 - Computer Labs 0 - Self Cont. Sp Ed 1 12 12 RR, Title I, Pull Out 2 0 - Other 0 - Other 0 - Total Room Count 26 524
Scheduling Factor = 95%Instructional Space Model Capacity = 498
Highland ES
# RoomsRoom
Capacity SubtotalHead Start 0 - Pre-K 0 - K Half Day 0 - K Full Day 3 25 75 Grade 1 3 25 75 Grade 2 3 25 75 Grade 3 3 25 75 Grade 4 3 27 81 Grade 5 3 27 81 Art 0 - Music 1 0 - PE 1 0 - Science 0 - Computer Labs 0 - Self Cont. Sp Ed 3 12 36 RR, Title I, Pull Out 2 0 - Other 0 - Other 0 - Total Room Count 25 498
Scheduling Factor = 95%Instructional Space Model Capacity = 473
Mt. Pilchuck ES
Page A-1

Facilities Master Plan
# RoomsRoom
Capacity SubtotalHead Start 0 - Pre-K 0 - K Half Day 0 - K Full Day 3 25 75 Grade 1 3 25 75 Grade 2 3 25 75 Grade 3 3 25 75 Grade 4 3 27 81 Grade 5 2 27 54 Art 0 - Music 1 0 - PE 1 0 - Science 0 - Computer Labs 1 0 - Self Cont. Sp Ed 3 12 36 RR, Title I, Pull Out 3 0 - Other 0 - Other 0 - Total Room Count 26 471
Scheduling Factor = 95%Instructional Space Model Capacity = 447
Skyline ES
# RoomsRoom
Capacity SubtotalHead Start 0 - Pre-K 0 - K Half Day 0 - K Full Day 4 25 100 Grade 1 4 25 100 Grade 2 4 25 100 Grade 3 4 25 100 Grade 4 3 27 81 Grade 5 3 27 81 Art 0 - Music 1 0 - PE 2 0 - Science 0 - Computer Labs 0 - Self Cont. Sp Ed 12 - RR, Title I, Pull Out 3 0 - Other 0 - Other 0 - Total Room Count 28 562
Scheduling Factor = 95%Instructional Space Model Capacity = 534
Sunnycrest ES
# RoomsRoom
Capacity SubtotalGrade 6-7 15 30 450 Art 1 30 30 Business Labs 30 - Computer Labs 1 15 15 Music 1 30 30 PE 3 30 90 Science 5 30 150 CTE 4 30 120 Self Cont. Sp Ed 1 12 12 RR/T-1 Pull Out 3 20 60 Other (Lunch Det.) 1 0 - Other 0 - Total Room Count 35 957
Scheduling Factor = 83%Instructional Space Model Capacity = 794
Lake Stevens MS
# RoomsRoom
Capacity SubtotalGrade 6-7 9 30 270 Art 1 30 30 Business Labs 30 - Computer Labs 1 15 15 Music 1 30 30 PE 4 30 120 Science 4 30 120 CTE 4 30 120 Self Cont. Sp Ed 3 12 36 RR/T-1 Pull Out 2 20 40 Other (Lunch Det.) 1 0 - Other 0 - Total Room Count 30 781
Scheduling Factor = 83%Instructional Space Model Capacity = 648
North Lake MS
Page A-2

Facilities Master Plan
# RoomsRoom
Capacity SubtotalGrades 8-9 41 30 1,230 Art 2 30 60 Business Labs 0 30 - Computer Labs 5 15 75 Music 2 30 60 PE 5 30 150 Science 11 30 330 CTE 3 30 90 Self Cont. Sp Ed 3 12 36 RR/T-1 Pull Out 20 - Other 30 - Other 0 - Total Room Count 72 2,031
Scheduling Factor = 83%Instructional Space Model Capacity = 1,686
Cavelero Mid-HS
# RoomsRoom
Capacity SubtotalGrades 10-12 38 30 1,140 Art 2 30 60 Business Labs 0 30 - Computer Labs 2 15 30 Music 2 30 60 PE 6 30 180 Science 6 30 180 CTE 10 30 300 Self Cont. Sp Ed 3 12 36 RR/T-1 Pull Out 20 - Drama 1 30 30 Other 0 - Total Room Count 70 2,016
Scheduling Factor = 83%Instructional Space Model Capacity = 1,673
Lake Stevens HS
Page A-3

Facilities Master Plan
APPENDIX B – FUNCTIONAL ADEQUACY ASSESSMENT
Early Learning Center
Page B-1

Facilities Master Plan
Early Learning Center
Page B-2

Facilities Master Plan
Early Learning Center
Page B-3

Facilities Master Plan
Early Learning Center
Page B-4

Facilities Master Plan
Early Learning Center
Page B-5

Facilities Master Plan
Early Learning Center
Page B-6

Facilities Master Plan
Glenwood Elem. School
Page B-7

Facilities Master Plan
Glenwood Elem. School
Page B-8

Facilities Master Plan
Glenwood Elem. School
Page B-9
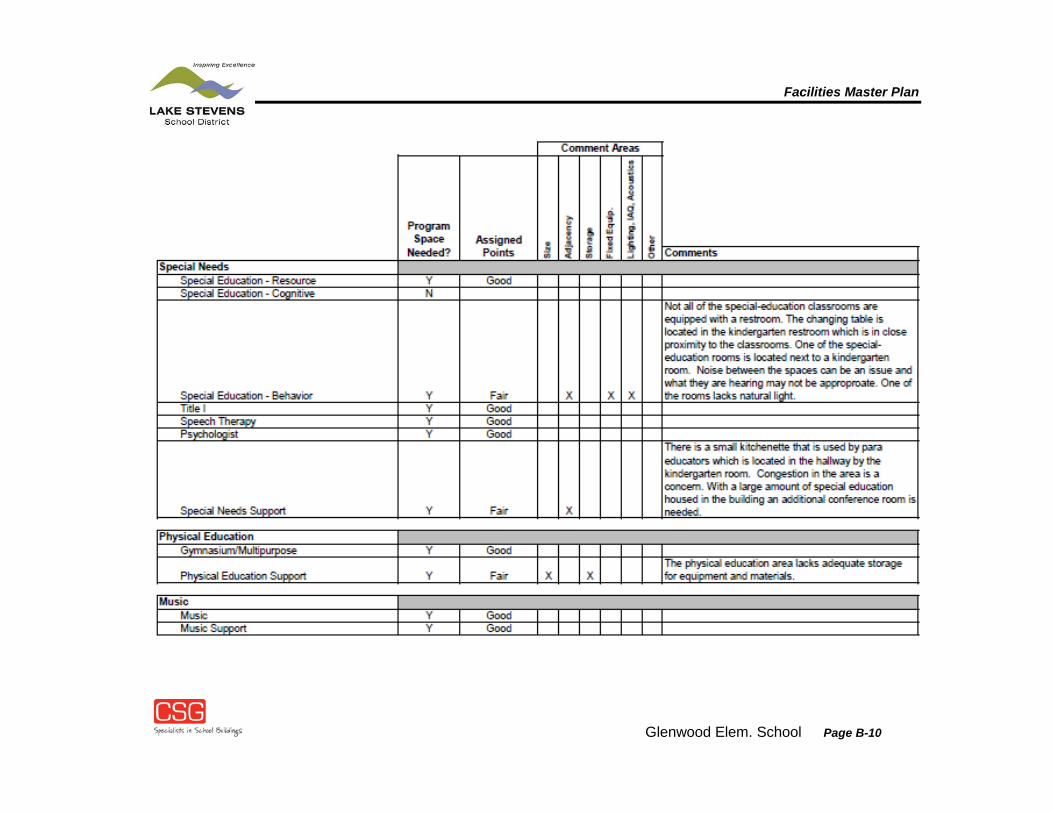
Facilities Master Plan
Glenwood Elem. School
Page B-10

Facilities Master Plan
Glenwood Elem. School
Page B-11

Facilities Master Plan
Highland Elem. School
Page B-12

Facilities Master Plan
Highland Elem. School
Page B-13

Facilities Master Plan
Highland Elem. School
Page B-14

Facilities Master Plan
Highland Elem. School
Page B-15

Facilities Master Plan
Hillcrest Elem. School
Page B-16

Facilities Master Plan
Hillcrest Elem. School
Page B-17

Facilities Master Plan
Hillcrest Elem. School
Page B-18

Facilities Master Plan
Hillcrest Elem. School
Page B-19

Facilities Master Plan
Hillcrest Elem. School
Page B-20

Facilities Master Plan
Mt. Pilchuck Elem. School
Page B-21

Facilities Master Plan
Mt. Pilchuck Elem. School
Page B-22

Facilities Master Plan
Mt. Pilchuck Elem. School
Page B-23

Facilities Master Plan
Mt. Pilchuck Elem. School
Page B-24

Facilities Master Plan
Mt. Pilchuck Elem. School
Page B-25

Facilities Master Plan
Skyline Elem. School
Page B-26

Facilities Master Plan
Skyline Elem. School
Page B-27

Facilities Master Plan
Skyline Elem. School
Page B-28

Facilities Master Plan
Skyline Elem. School
Page B-29

Facilities Master Plan
Skyline Elem. School
Page B-30

Facilities Master Plan
Sunnycrest Elem. School
Page B-31

Facilities Master Plan
Sunnycrest Elem. School
Page B-32

Facilities Master Plan
Sunnycrest Elem. School
Page B-33

Facilities Master Plan
Sunnycrest Elem. School
Page B-34

Facilities Master Plan
Sunnycrest Elem. School
Page B-35

Facilities Master Plan
Lake Stevens Middle SchoolLake Stevens School DistrictLake Stevens, WATotal Score = 90% or ''Good''Date Scored: August 12, 2014Scorer: Dr. Jerry Gee
Program Space
Needed? Description CommentsExterior
Pedestrian Circulation Y Good
Vehicle Circulation (incl. service vehicles) Y Fair X
The parent drop-off zone is on the perimeter of the main parking lot. When buses and cars enter the property they are intermingling on the city street which can cause congestion.
Grounds and Fields Y Good
Parking Y Fair XThe school does not have adequate offstreet parking.
Safety-Security, Signage, Fencing, Etc. Y Poor X X X
The school does not have adequate internal and external directional signage. The school has four separate buildings which require doors to remain open during the school day. Due to the number of builidngs this is a very difficult campus to limit access to and supervise.
AdministrationAdministrators Y GoodReception-Clerical-Business Y Good
Discipline (Security, Detention, ISS, etc. Y Fair X
The school does not utilize a discipline room. When a student needs to be separated they use the conference room in the main office.
Administrative Support Y Fair X X The conference room is small in size.
Comment Areas
Size
Adj
acen
cy
Stor
age
Fixe
d Eq
uip.
Ligh
ting,
IAQ
, Aco
ustic
s
Oth
er
Lake Stevens Middle School
Page B-36

Facilities Master Plan
Page B-37

Facilities Master Plan
Lake Stevens Middle School
Page B-38

Facilities Master Plan
Lake Stevens Middle School
Page B-39

Facilities Master Plan
Lake Stevens Middle School
Page B-40

Facilities Master Plan
Lake Stevens Middle School
Page B-41

Facilities Master Plan
North Lake Middle School
Page B-42

Facilities Master Plan
North Lake Middle School
Page B-43

Facilities Master Plan
North Lake Middle School
Page B-44

Facilities Master Plan
North Lake Middle School
Page B-45

Facilities Master Plan
North Lake Middle School
Page B-46

Facilities Master Plan
North Lake Middle School
Page B-47

Facilities Master Plan
North Lake Middle School
Page B-48

Facilities Master Plan
Cavelero Mid-High School
Page B-49

Facilities Master Plan
Cavelero Mid-High School
Page B-50

Facilities Master Plan
Cavelero Mid-High School
Page B-51

Facilities Master Plan
Cavelero Mid-High School
Page B-52

Facilities Master Plan
Lake Stevens High School
Page B-53

Facilities Master Plan
Lake Stevens High School
Page B-54

Facilities Master Plan
Lake Stevens High School
Page B-55

Facilities Master Plan
Lake Stevens High School
Page B-56

Facilities Master Plan
Lake Stevens High School
Page B-57

Facilities Master Plan
District Office
Page B-58

Facilities Master Plan
District Office
Page B-59

Facilities Master Plan
District Office
Page B-60

Facilities Master Plan
Maintenance Shop
Page B-61

Facilities Master Plan
Maintenance Shop
Page B-62

Facilities Master Plan
Maintenance Shop
Page B-63

Facilities Master Plan
Maintenance Shop
Page B-64

Facilities Master Plan
Maintenance Shop
Page B-65

Facilities Master Plan
Transportation Shop
Page B-66

Facilities Master Plan
Transportation Shop
Page B-67

Facilities Master Plan
Transportation Shop
Page B-68

Facilities Master Plan
APPENDIX C – PHYSICAL CONDITION ASSESSMENTS – REFER TO DISTRICT’S STUDY AND SURVEY CONDUCTED BY OTHERS IN 2014
Page C-1