facilities management - northwestern university f… · 3 • f(design, construction, technology,...
TRANSCRIPT
Facilities Management
FM Key Performance Indicators
July 15, 2016
Key Performance Indicators
1
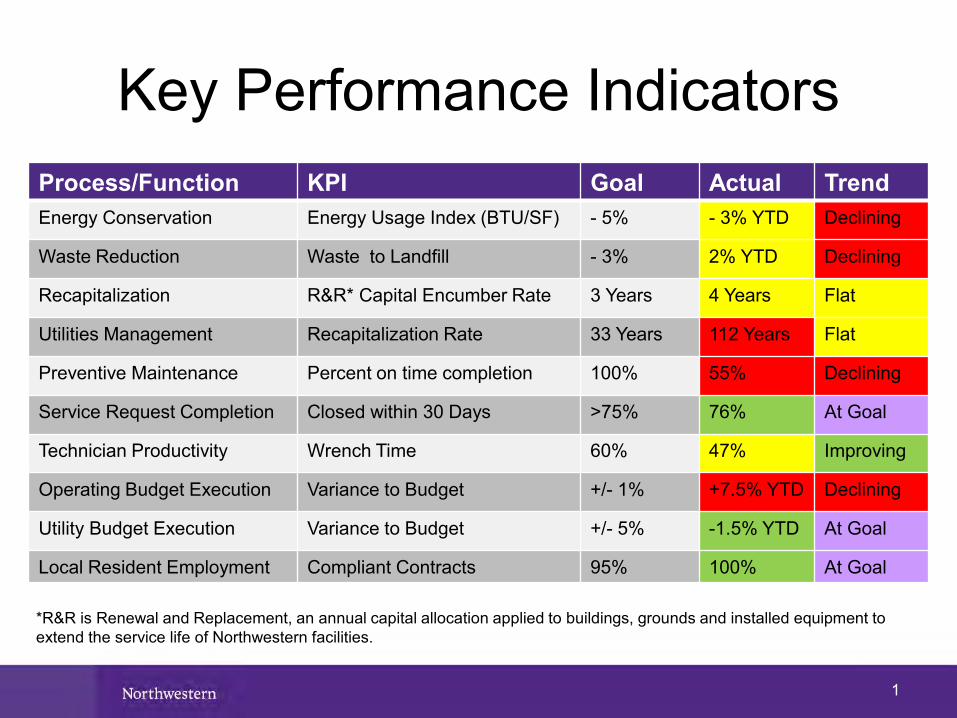
Process/Function KPI Goal Actual TrendEnergy Conservation Energy Usage Index (BTU/SF) - 5% - 3% YTD Declining
Waste Reduction Waste to Landfill - 3% 2% YTD Declining
Recapitalization R&R* Capital Encumber Rate 3 Years 4 Years Flat
Utilities Management Recapitalization Rate 33 Years 112 Years Flat
Preventive Maintenance Percent on time completion 100% 55% Declining
Service Request Completion Closed within 30 Days >75% 76% At Goal
Technician Productivity Wrench Time 60% 47% Improving
Operating Budget Execution Variance to Budget +/- 1% +7.5% YTD Declining
Utility Budget Execution Variance to Budget +/- 5% -1.5% YTD At Goal
Local Resident Employment Compliant Contracts 95% 100% At Goal
*R&R is Renewal and Replacement, an annual capital allocation applied to buildings, grounds and installed equipment to extend the service life of Northwestern facilities.
2
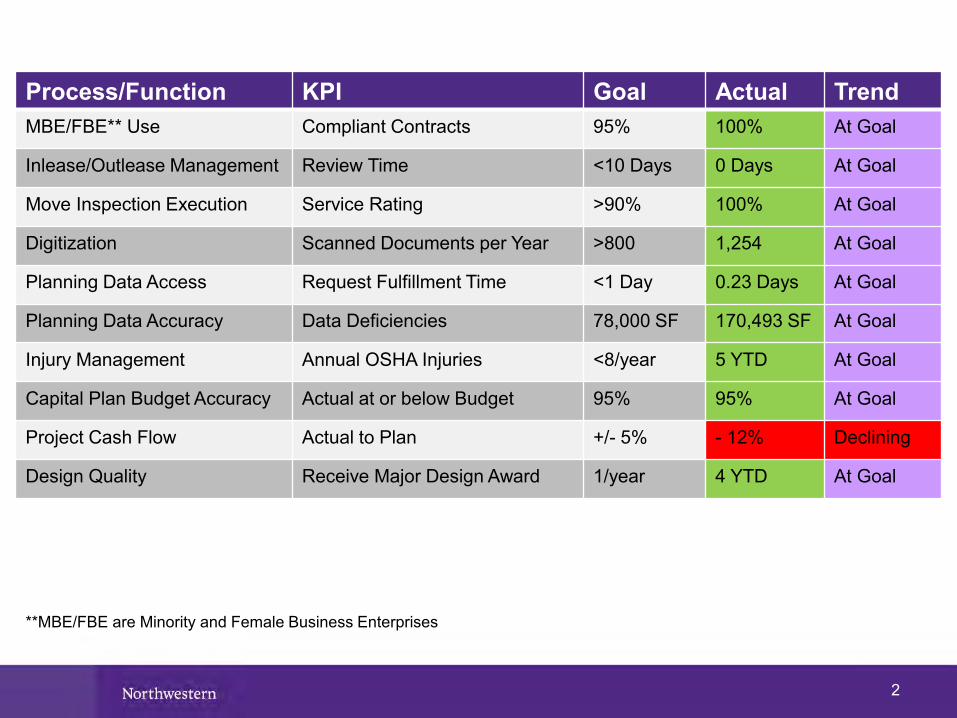
Process/Function KPI Goal Actual TrendMBE/FBE** Use Compliant Contracts 95% 100% At Goal
Inlease/Outlease Management Review Time <10 Days 0 Days At Goal
Move Inspection Execution Service Rating >90% 100% At Goal
Digitization Scanned Documents per Year >800 1,254 At Goal
Planning Data Access Request Fulfillment Time <1 Day 0.23 Days At Goal
Planning Data Accuracy Data Deficiencies 78,000 SF 170,493 SF At Goal
Injury Management Annual OSHA Injuries <8/year 5 YTD At Goal
Capital Plan Budget Accuracy Actual at or below Budget 95% 95% At Goal
Project Cash Flow Actual to Plan +/- 5% - 12% Declining
Design Quality Receive Major Design Award 1/year 4 YTD At Goal
**MBE/FBE are Minority and Female Business Enterprises

3
• f(design, construction, technology, operations, occupant behavior)• KPI goal is 20% reduction by 2020 from 2010 baseline (5% reduction in FY16)• Initiatives: Design specifications; retro-commissioning; audits; occupant engagement• FM Leader: Kathia Benitez
*Note: Energy Use Intensity is an internationally recognized standard where all energy inputs are converted to thousand British Thermal Units and divided by the
portfolio square footage.
Energy Conservation
150.0
175.0
200.0
225.0
250.0
275.0
300.0
Ener
gy U
se In
tens
ity (
kBTU
/ SF)
*Energy Usage Intensity (kBTU/ SF)*
Energy Usage Intensity - Combined Goal
Campus % Reduction (2010 Baseline)
Evanston 7.5%
Chicago 18.2%
Combined 11.4%
Waste Reduction
4
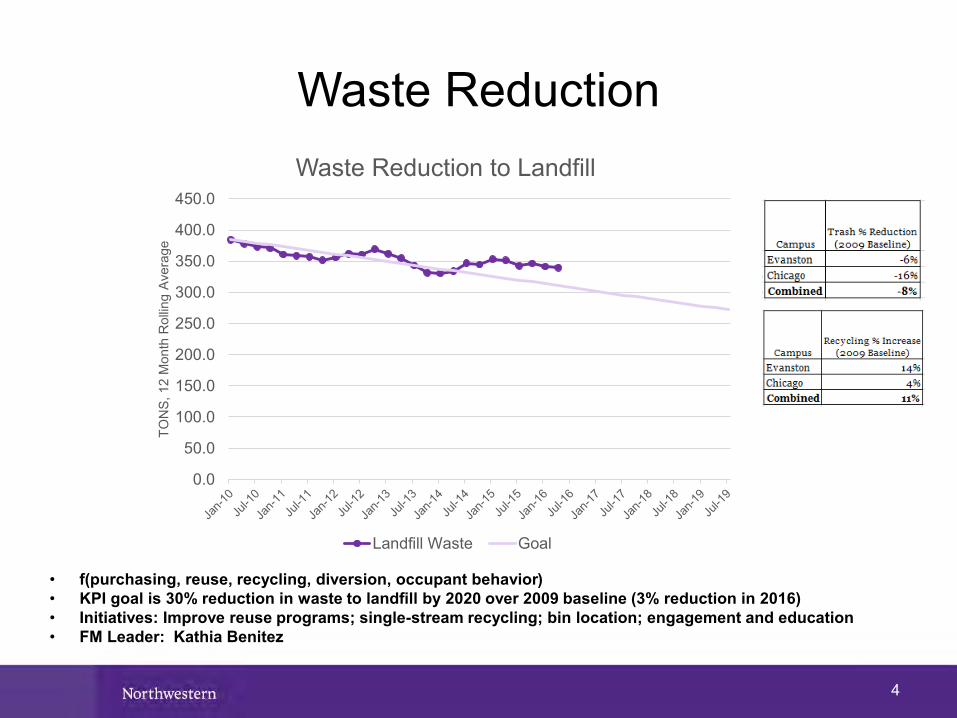
• f(purchasing, reuse, recycling, diversion, occupant behavior)• KPI goal is 30% reduction in waste to landfill by 2020 over 2009 baseline (3% reduction in 2016)• Initiatives: Improve reuse programs; single-stream recycling; bin location; engagement and education• FM Leader: Kathia Benitez
0.0
50.0
100.0
150.0
200.0
250.0
300.0
350.0
400.0
450.0
TON
S, 1
2 M
onth
Rol
ling
Aver
age
Waste Reduction to Landfill
Landfill Waste Goal
Recapitalization
5
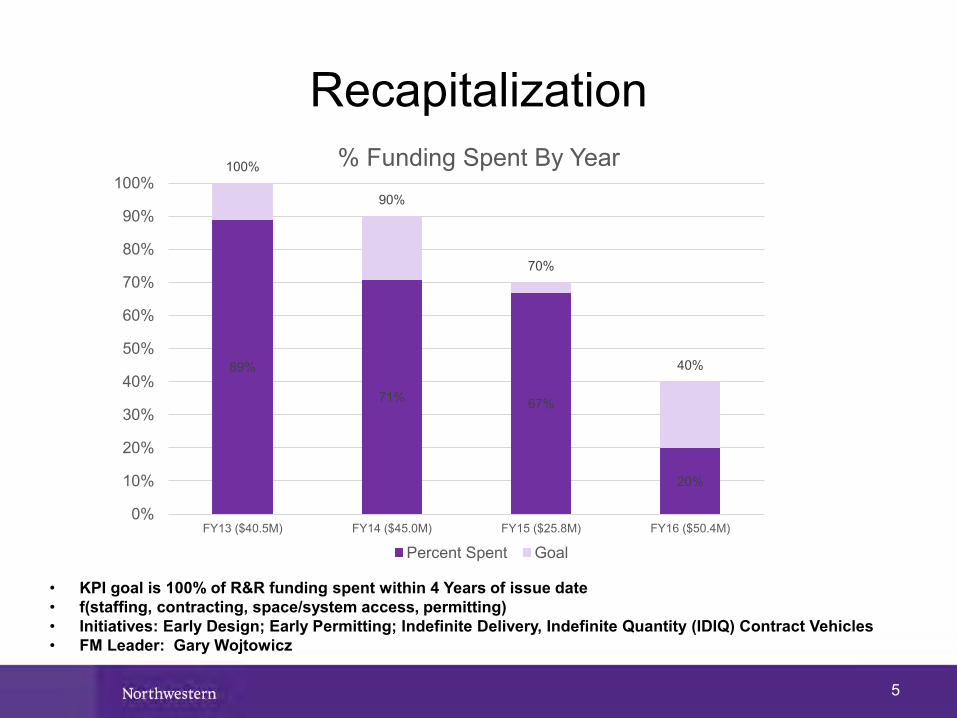
• KPI goal is 100% of R&R funding spent within 4 Years of issue date• f(staffing, contracting, space/system access, permitting)• Initiatives: Early Design; Early Permitting; Indefinite Delivery, Indefinite Quantity (IDIQ) Contract Vehicles• FM Leader: Gary Wojtowicz
89%
71% 67%
20%
100%
90%
70%
40%
0%
10%
20%
30%
40%
50%
60%
70%
80%
90%
100%
FY13 ($40.5M) FY14 ($45.0M) FY15 ($25.8M) FY16 ($50.4M)
% Funding Spent By Year
Percent Spent Goal
Utilities Management – Life Cycle Renewal
6
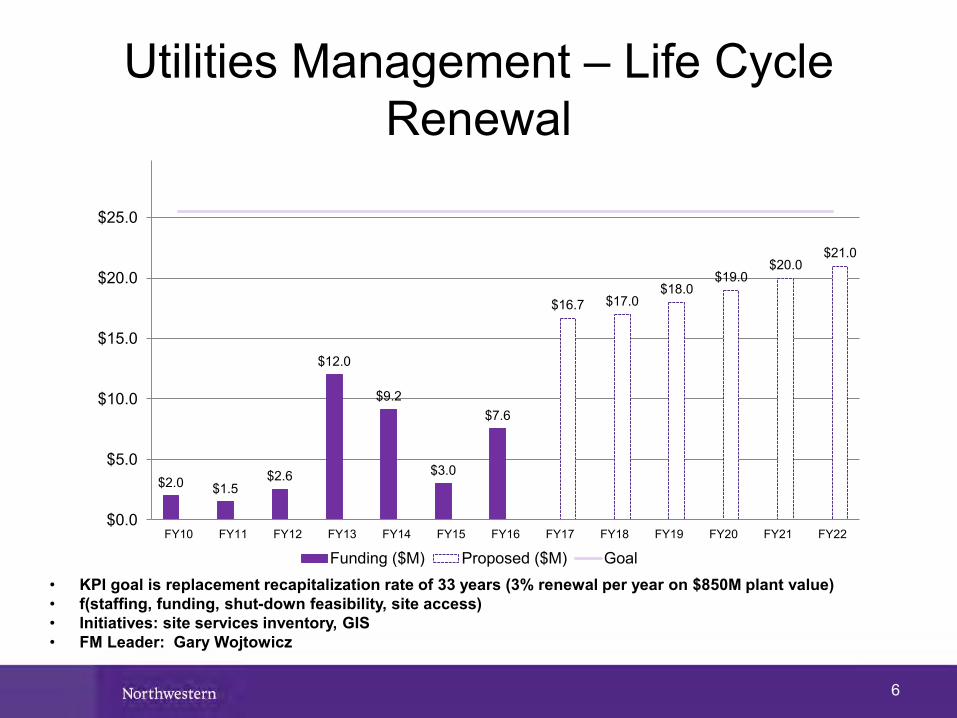
$2.0 $1.5$2.6
$12.0
$9.2
$3.0
$7.6
$16.7 $17.0$18.0
$19.0$20.0
$21.0
$0.0
$5.0
$10.0
$15.0
$20.0
$25.0
FY10 FY11 FY12 FY13 FY14 FY15 FY16 FY17 FY18 FY19 FY20 FY21 FY22
Funding ($M) Proposed ($M) Goal• KPI goal is replacement recapitalization rate of 33 years (3% renewal per year on $850M plant value) • f(staffing, funding, shut-down feasibility, site access)• Initiatives: site services inventory, GIS• FM Leader: Gary Wojtowicz

Preventive Maintenance (PM) Completion
7
9% 8%
41%
61% 61%
82%
60%
76% 75%
55%
0
500
1000
1500
2000
2500
0%
20%
40%
60%
80%
100%
Sep Oct Nov Dec Jan Feb Mar Apr May Jun Jul Aug
%Complete Goal PM Count• KPI goal is 95% completion of PM work orders within 30 days of scheduling• f(staffing, funding, CMMS functionality, shut-down feasibility)• Initiatives: Nov’15 EVENG PM restart, improve workflow with FAMIS mobile app, planning, scheduling, and
real-time monitoring of work by RE, schedule adjustment• FM Leader: Gary Wojtowicz
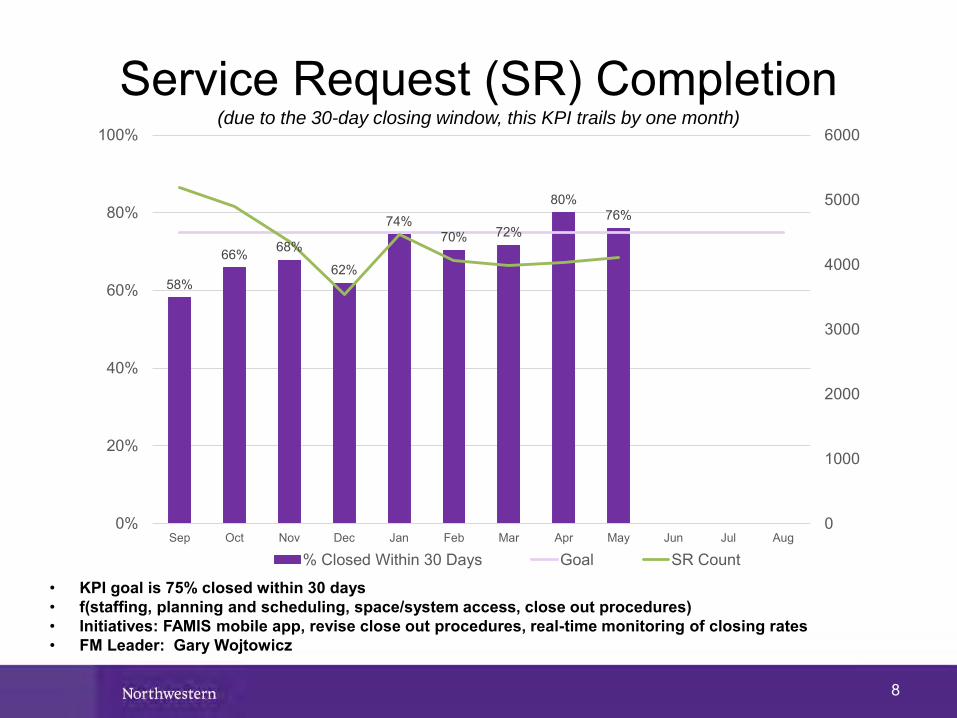
Service Request (SR) Completion(due to the 30-day closing window, this KPI trails by one month)
8
• KPI goal is 75% closed within 30 days• f(staffing, planning and scheduling, space/system access, close out procedures)• Initiatives: FAMIS mobile app, revise close out procedures, real-time monitoring of closing rates• FM Leader: Gary Wojtowicz
58%
66% 68%
62%
74%70% 72%
80%76%
0
1000
2000
3000
4000
5000
6000
0%
20%
40%
60%
80%
100%
Sep Oct Nov Dec Jan Feb Mar Apr May Jun Jul Aug
% Closed Within 30 Days Goal SR Count
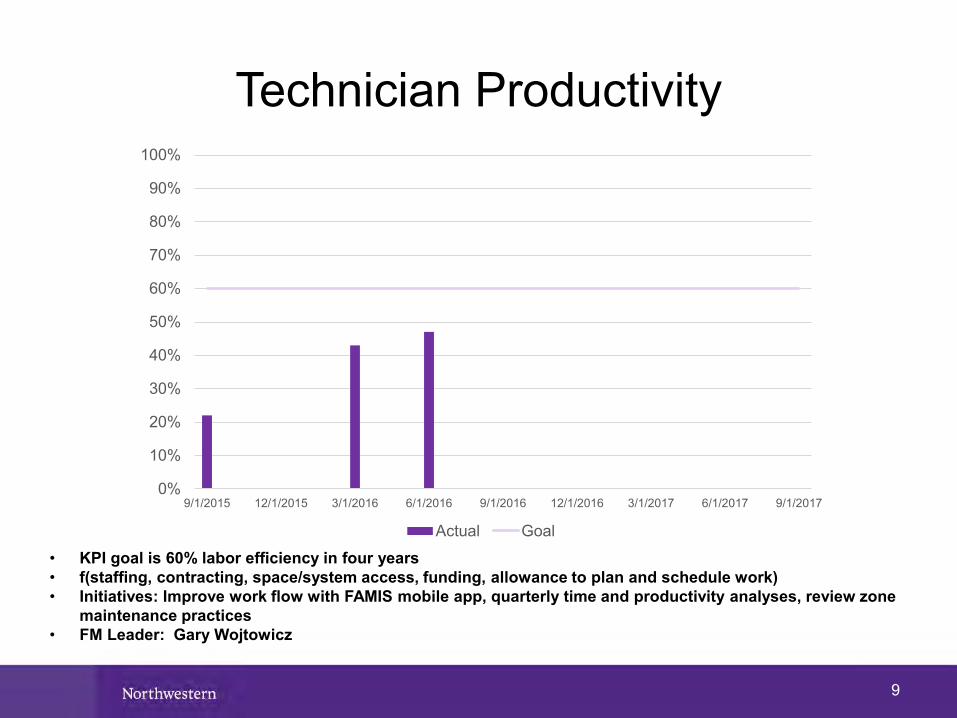
Technician Productivity
9
0%
10%
20%
30%
40%
50%
60%
70%
80%
90%
100%
9/1/2015 12/1/2015 3/1/2016 6/1/2016 9/1/2016 12/1/2016 3/1/2017 6/1/2017 9/1/2017
Actual Goal
• KPI goal is 60% labor efficiency in four years• f(staffing, contracting, space/system access, funding, allowance to plan and schedule work)• Initiatives: Improve work flow with FAMIS mobile app, quarterly time and productivity analyses, review zone
maintenance practices • FM Leader: Gary Wojtowicz
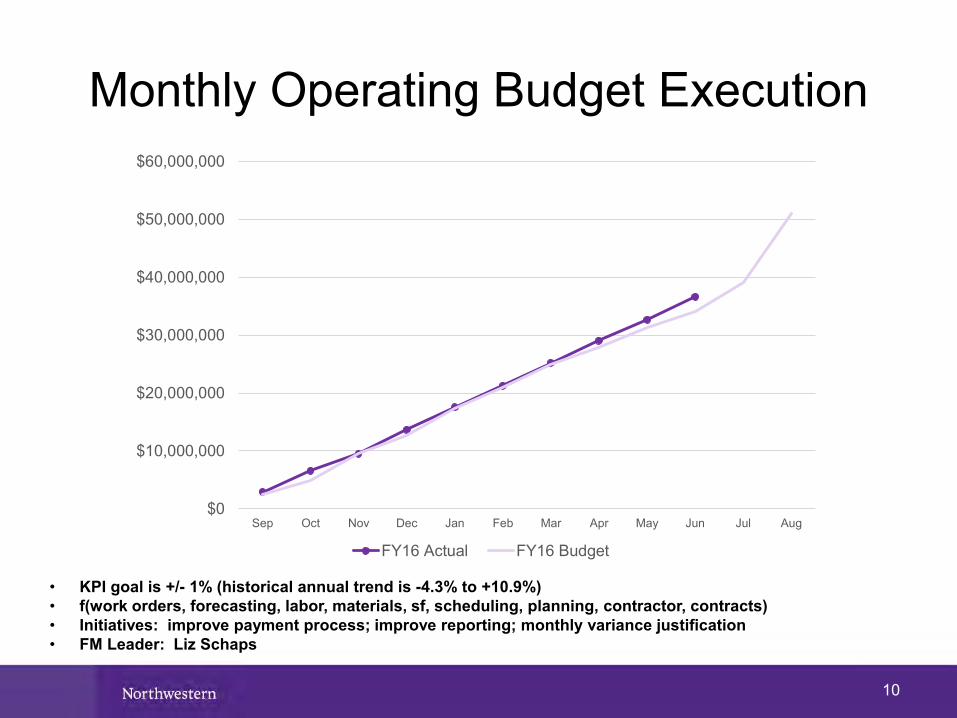
Monthly Operating Budget Execution
10
$0
$10,000,000
$20,000,000
$30,000,000
$40,000,000
$50,000,000
$60,000,000
Sep Oct Nov Dec Jan Feb Mar Apr May Jun Jul Aug
FY16 Actual FY16 Budget
• KPI goal is +/- 1% (historical annual trend is -4.3% to +10.9%)• f(work orders, forecasting, labor, materials, sf, scheduling, planning, contractor, contracts)• Initiatives: improve payment process; improve reporting; monthly variance justification• FM Leader: Liz Schaps
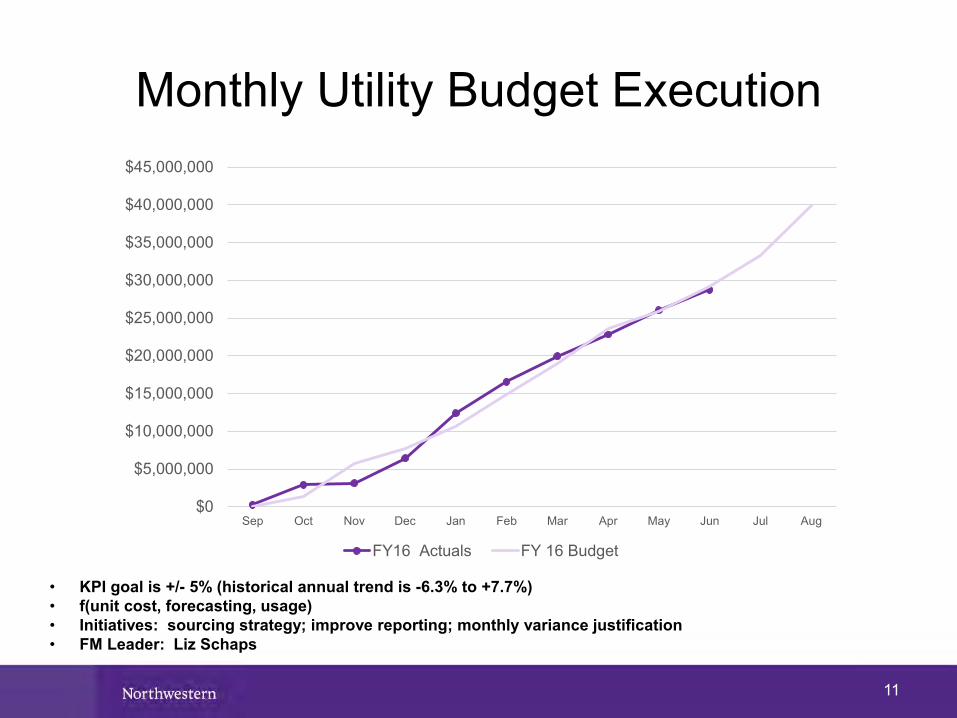
Monthly Utility Budget Execution
11
$0
$5,000,000
$10,000,000
$15,000,000
$20,000,000
$25,000,000
$30,000,000
$35,000,000
$40,000,000
$45,000,000
Sep Oct Nov Dec Jan Feb Mar Apr May Jun Jul Aug
FY16 Actuals FY 16 Budget
• KPI goal is +/- 5% (historical annual trend is -6.3% to +7.7%)• f(unit cost, forecasting, usage)• Initiatives: sourcing strategy; improve reporting; monthly variance justification• FM Leader: Liz Schaps
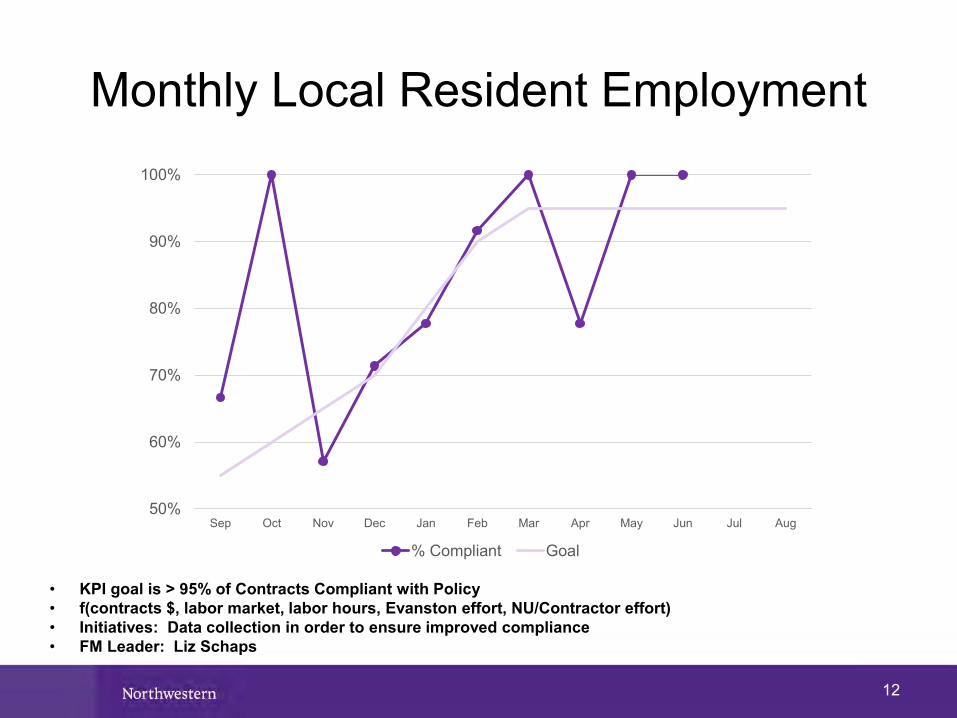
Monthly Local Resident Employment
12
• KPI goal is > 95% of Contracts Compliant with Policy• f(contracts $, labor market, labor hours, Evanston effort, NU/Contractor effort)• Initiatives: Data collection in order to ensure improved compliance• FM Leader: Liz Schaps
50%
60%
70%
80%
90%
100%
Sep Oct Nov Dec Jan Feb Mar Apr May Jun Jul Aug
% Compliant Goal

Monthly Minority and Female Business Enterprise Use
13
50%
60%
70%
80%
90%
100%
Sep Oct Nov Dec Jan Feb Mar Apr May Jun Jul Aug
% Compliant Goal
• KPI goal is 95% of Contracts Compliant with Policy• f(contracts, bids, labor market)• Initiatives: TBD – new program• FM Leader: Liz Schaps
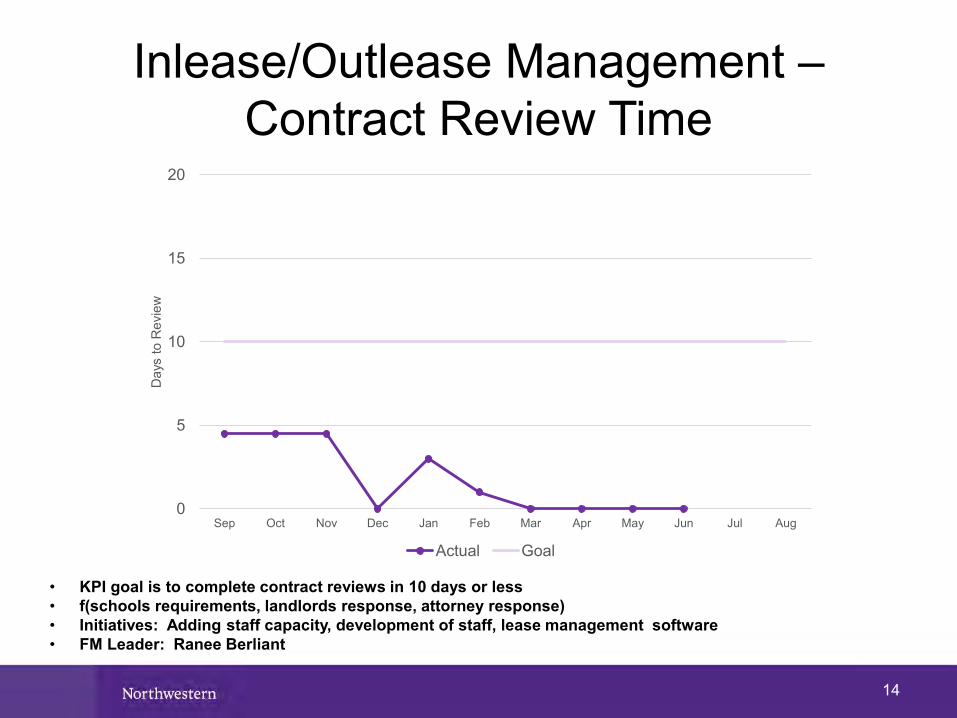
Inlease/Outlease Management –Contract Review Time
14
0
5
10
15
20
Sep Oct Nov Dec Jan Feb Mar Apr May Jun Jul Aug
Day
s to
Rev
iew
Actual Goal
• KPI goal is to complete contract reviews in 10 days or less• f(schools requirements, landlords response, attorney response)• Initiatives: Adding staff capacity, development of staff, lease management software• FM Leader: Ranee Berliant
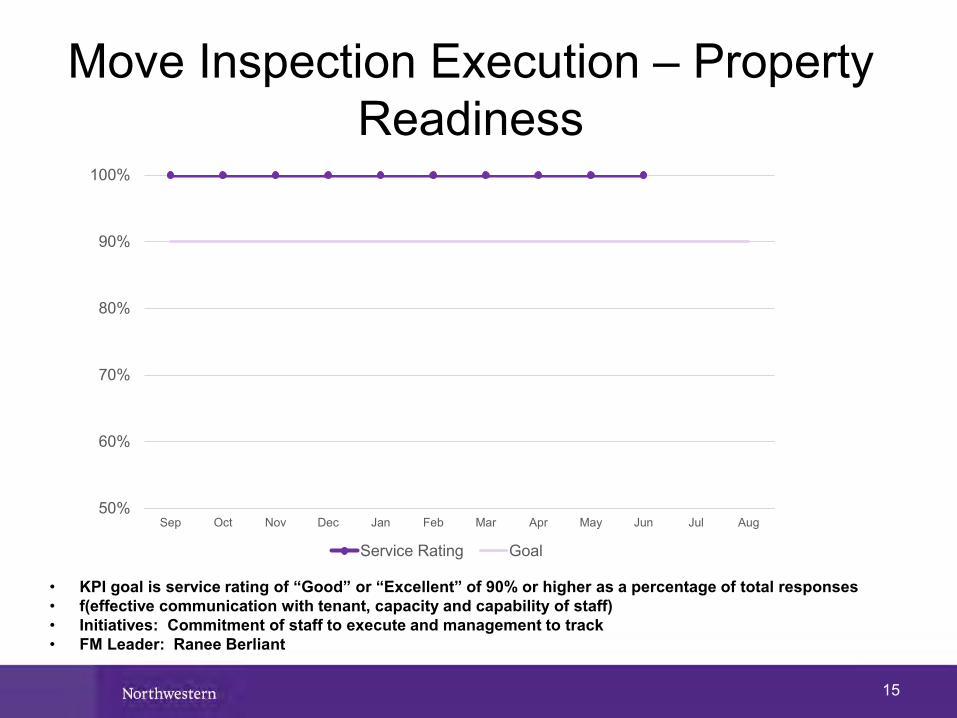
Move Inspection Execution – Property Readiness
15
50%
60%
70%
80%
90%
100%
Sep Oct Nov Dec Jan Feb Mar Apr May Jun Jul Aug
Service Rating Goal
• KPI goal is service rating of “Good” or “Excellent” of 90% or higher as a percentage of total responses • f(effective communication with tenant, capacity and capability of staff)• Initiatives: Commitment of staff to execute and management to track• FM Leader: Ranee Berliant
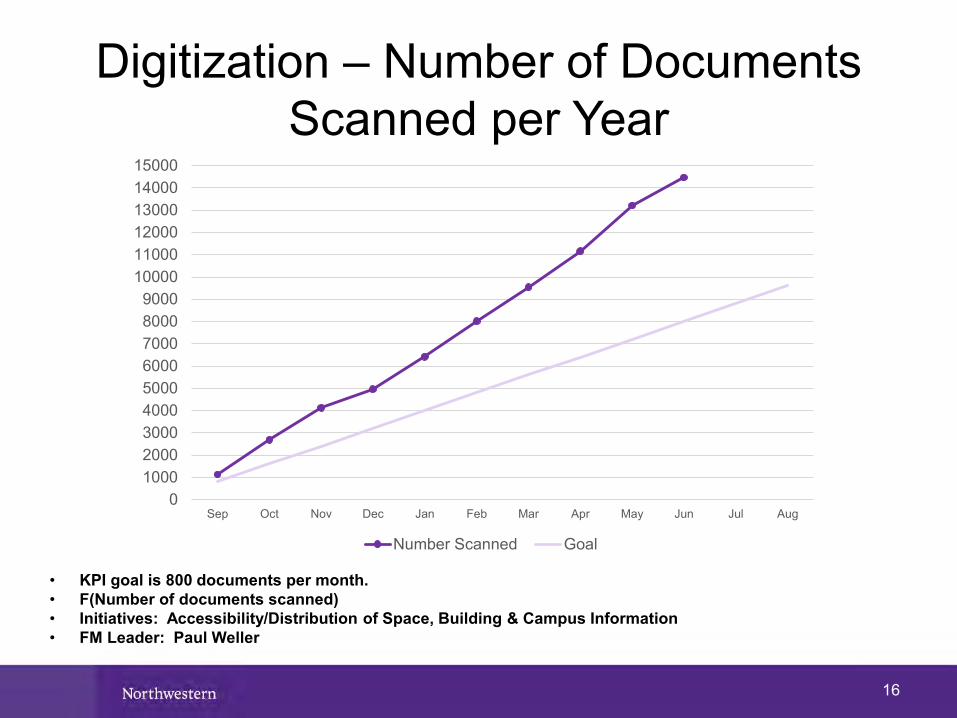
Digitization – Number of Documents Scanned per Year
16
0100020003000400050006000700080009000
100001100012000130001400015000
Sep Oct Nov Dec Jan Feb Mar Apr May Jun Jul Aug
Number Scanned Goal
• KPI goal is 800 documents per month. • F(Number of documents scanned) • Initiatives: Accessibility/Distribution of Space, Building & Campus Information• FM Leader: Paul Weller
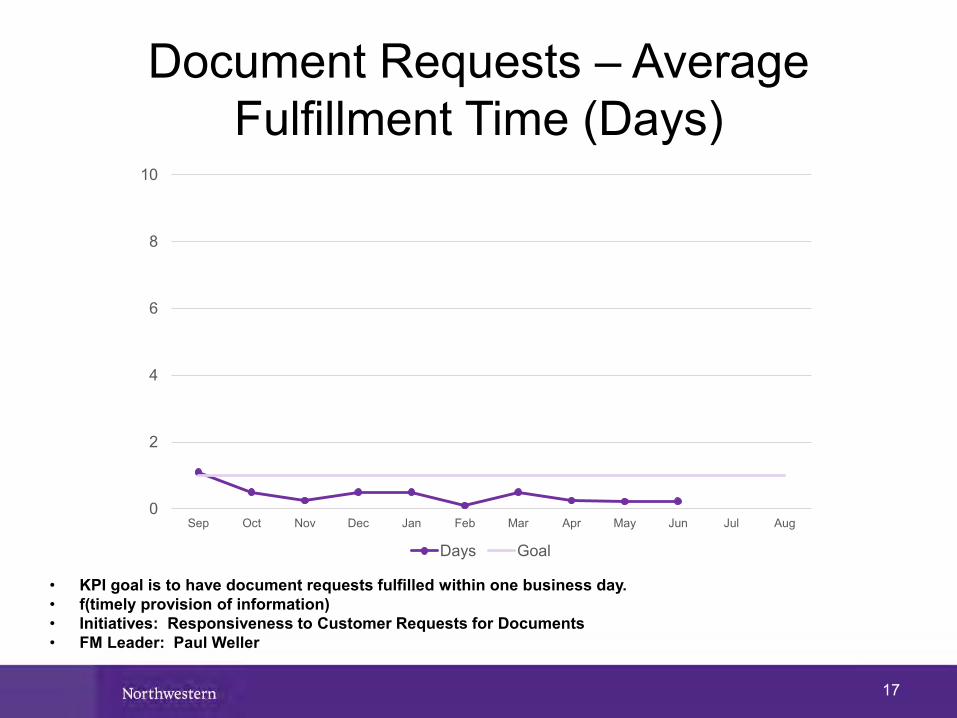
Document Requests – Average Fulfillment Time (Days)
17
0
2
4
6
8
10
Sep Oct Nov Dec Jan Feb Mar Apr May Jun Jul Aug
Days Goal
• KPI goal is to have document requests fulfilled within one business day.• f(timely provision of information)• Initiatives: Responsiveness to Customer Requests for Documents• FM Leader: Paul Weller
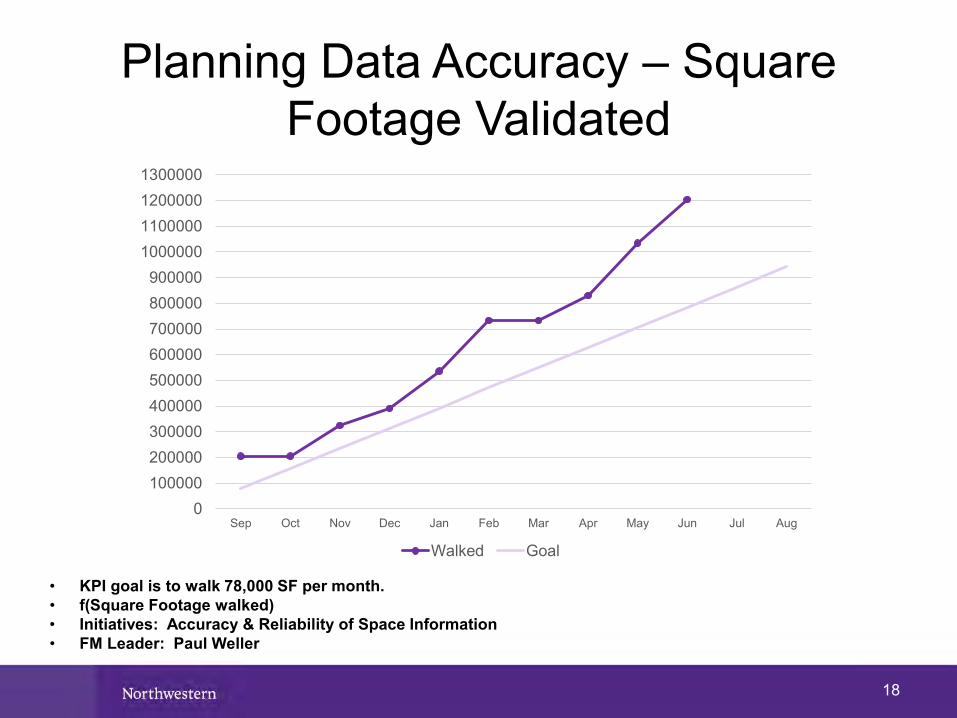
Planning Data Accuracy – Square Footage Validated
18
0100000200000300000400000500000600000700000800000900000
1000000110000012000001300000
Sep Oct Nov Dec Jan Feb Mar Apr May Jun Jul Aug
Walked Goal
• KPI goal is to walk 78,000 SF per month. • f(Square Footage walked)• Initiatives: Accuracy & Reliability of Space Information• FM Leader: Paul Weller

Injury Reporting by Calendar Year
19
0
1
2
3
4
5
6
7
8
9
10
Jan Feb Mar Apr May Jun Jul Aug Sep Oct Nov Dec
Reported Injuries by Type and Month
Sprain - Strain Laceration Crush Injury Fracture 2015
2015: 18 Injuries2016: 5 Injuries
• KPI goal is <4 Reportable Cases per 100 FTE (<8 injuries per year) • f(Equipment, Behavior, PPE)• Initiatives: Equipment - Environment Inspections, PPE Inventory - Usage Tracking, Training • FM Leader: Steve Kindrick
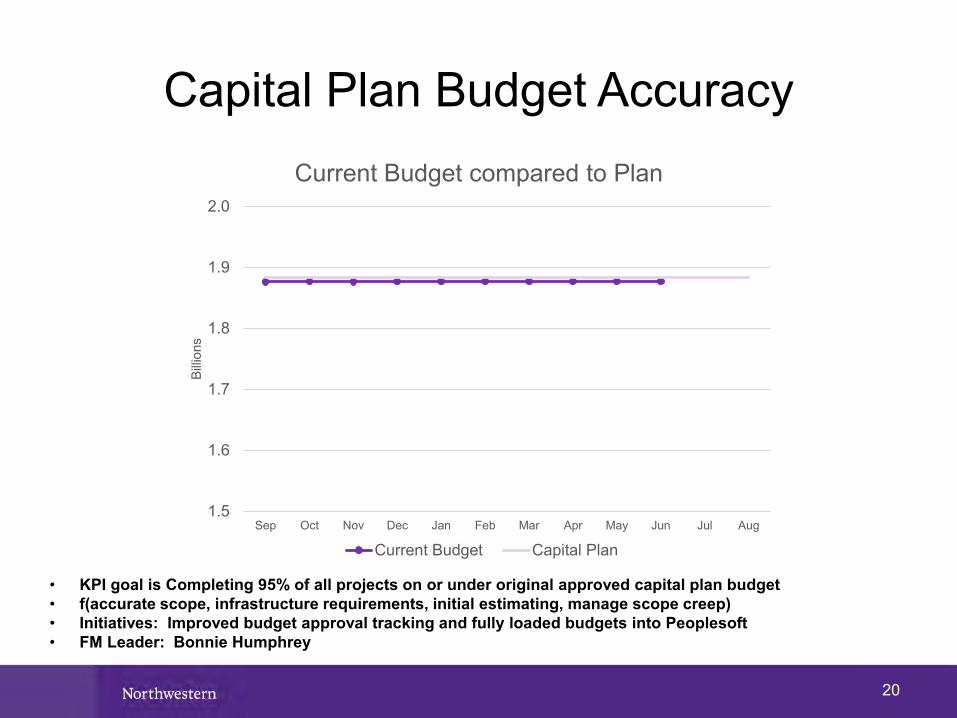
Capital Plan Budget Accuracy
20
1.5
1.6
1.7
1.8
1.9
2.0
Sep Oct Nov Dec Jan Feb Mar Apr May Jun Jul Aug
Billio
ns
Current Budget compared to Plan
Current Budget Capital Plan
• KPI goal is Completing 95% of all projects on or under original approved capital plan budget• f(accurate scope, infrastructure requirements, initial estimating, manage scope creep)• Initiatives: Improved budget approval tracking and fully loaded budgets into Peoplesoft • FM Leader: Bonnie Humphrey

Capital Project Cash Flow Management
21
• KPI goal is Cash Flow within 5% of Plan• f(manage scope creep, reduce unforeseen, real time financial monitoring)• Initiatives: Improve Financial Reporting Tools• FM Leader: Bonnie Humphrey
-
50
100
150
200
250
300
350
Sep Oct Nov Dec Jan Feb Mar Apr May Jun Jul Aug
Milli
ons
FMDC Program
Actual Plan
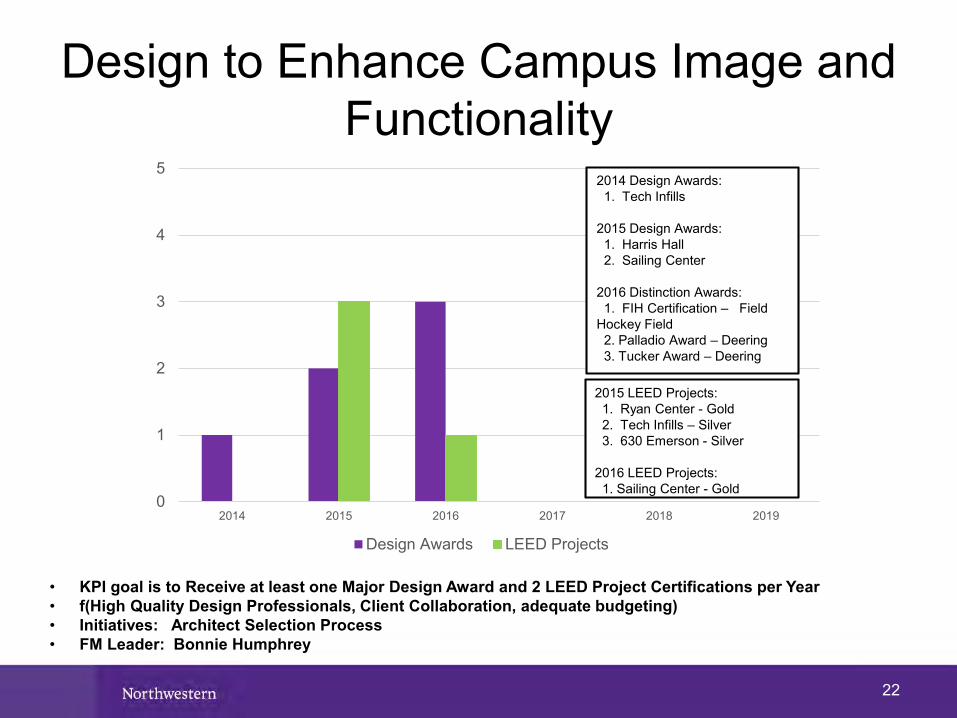
Design to Enhance Campus Image and Functionality
22
0
1
2
3
4
5
2014 2015 2016 2017 2018 2019
Design Awards LEED Projects
2014 Design Awards:1. Tech Infills
2015 Design Awards:1. Harris Hall2. Sailing Center
2016 Distinction Awards:1. FIH Certification – Field
Hockey Field2. Palladio Award – Deering3. Tucker Award – Deering
2015 LEED Projects:1. Ryan Center - Gold2. Tech Infills – Silver3. 630 Emerson - Silver
2016 LEED Projects:1. Sailing Center - Gold
• KPI goal is to Receive at least one Major Design Award and 2 LEED Project Certifications per Year• f(High Quality Design Professionals, Client Collaboration, adequate budgeting)• Initiatives: Architect Selection Process• FM Leader: Bonnie Humphrey
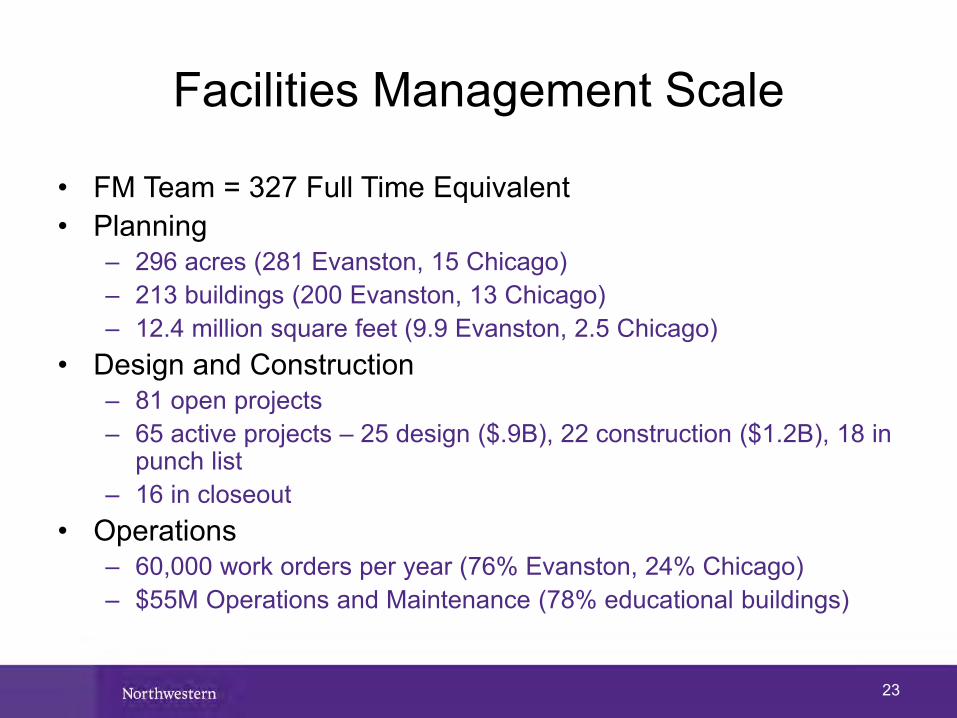
Facilities Management Scale
• FM Team = 327 Full Time Equivalent• Planning
– 296 acres (281 Evanston, 15 Chicago)– 213 buildings (200 Evanston, 13 Chicago)– 12.4 million square feet (9.9 Evanston, 2.5 Chicago)
• Design and Construction– 81 open projects – 65 active projects – 25 design ($.9B), 22 construction ($1.2B), 18 in
punch list – 16 in closeout
• Operations– 60,000 work orders per year (76% Evanston, 24% Chicago)– $55M Operations and Maintenance (78% educational buildings)
23