facial landmark localization and feature extraction for ... · pdf filefacial landmark...
TRANSCRIPT

Facial Landmark Localization and FeatureExtraction for Therapeutic Face Exercise
Classification
Cornelia Lanz1, Birant Sibel Olgay1, Joachim Denzler2, and Horst-MichaelGross1
1 Neuroinformatics and Cognitive Robotics Lab, Ilmenau University of Technology,Ilmenau, Germany
2 Computer Vision Group, Friedrich Schiller University Jena, Jena, Germany
Abstract. In this work, we examine landmark localization and featureextraction approaches for the unexplored topic of therapeutic facial exer-cise recognition. Our goal is to automatically discriminate nine thera-peutic exercises that have been determined in cooperation with speechtherapists. We use colour, 2.5D and 3D image data that was recordedusing Microsoft’s Kinect. Our features comprise statistical descriptorsof the face surface curvature as well as characteristic profiles that arederived from face landmarks. For the nine facial exercises, we yield anaverage recognition accuracy of about 91% in conjunction with manu-ally labeled landmarks. Additionally, we introduce a combined methodfor automatic landmark localization and compare the results to land-mark positions obtained from Active Appearance Model fitting as wellas manual labeling. The combined localization method exhibits increasedrobustness in comparison to AAMs.
1 INTRODUCTION
Diseases like stroke or mechanical injury of the facial nerve can lead to a dys-function of facial movements. These impairments of facial expressions and musclecontrol may have various consequences like eating difficulties and impaired faceappearance, which can restrict daily life and can lead to social isolation. Similarto rehabilitation exercises that help to regain body functions, there are exercisesfor the recovery of facial expressions. Besides practising under supervision of aspeech therapist, patients additionally have to conduct unattended exercises ontheir own. However, the incorrect conduction of exercises can impede the trainingsuccess or even lead to further impairment. An accompanying training platformcould enrich unsupervised training exercises by a feedback functionality [1].
The design and implementation of such a training platform is a challengingand complex task that comprises several subtasks. In this work, we will focus ontwo subtasks – the automated facial landmark localization and the evaluationof features. However, in order to enable a better understanding of the contextof our work, we also give a brief overview of the remaining subtasks. Figure 1apresents five of the involved subtasks, which will be discussed in the following.
Computer Vision, Imaging and Computer Graphics - Theory and Applications: Revised Selected Papers of VISIGRAPP 2013, Communications in Computer and Information Science (CCIS), vol. 458, pp. 179-194, Springer 2014

2
Facial movements cause changes of the face surface, which can be capturedby depth image sensors like Microsoft’s Kinect3 or Time-of-flight Cameras4,5.The extraction of depth features (see Fig. 1a) allows to examine the face surface,independently from skin colour and lighting conditions. Although there existother systems that are capable of recording depth data with much higher depthresolution than the Kinect (e.g. [2]), we decided to use this sensor because ofits moderate price. This makes our target application suitable for widespreaduse in low-cost training platforms. Furthermore, the Kinect allows to captureadditional data channels such as intensity images in parallel to depth images.These might be helpful if depth information is not suitable to describe certainfacial movements. For example, it can hardly be determined whether the eyesare closed by solely processing depth information. In a real-world scenario, whereregions for feature extraction should be detected automatically, we additionallyneed a fully automated facial landmark localization.
The nine therapeutic face exercises that we focus on in this paper are ratherstatic. The pace of the exercise conduction from neutral face to final state, e.g.,both cheeks puffed, is not important. It is more relevant that the exercises finalstates are retained for a few seconds. Nevertheless, it is likely that additionalinformation, obtained by examining the dynamics of an exercise instead of singlestatic snapshots, may contain valuable information. Additionally, it is possibleto reduce the amount of noise in the data by smoothing over time.
The evaluation of the exercises, which is essential for a feedback functionality,is a complex task. Besides the choice of appropriate technical tools, it is necessaryto define in which cases an exercise is performed correctly and in which not.Additionally, it needs to be assessed how feedback should be communicated inorder to be most beneficial for a patient.
Furthermore, it is necessary to collect a database of training and test imagesthat contain the exercises performed by healthy people as well as the exerciseconduction by people with dysfunction of facial expression abilities. In our ex-periments, nine therapeutic facial exercises are employed that had been definedin cooperation with speech therapists. In our studies, we only use training andtest data recorded from exercises of healthy persons. We omit data recorded frompersons with dysfunction of facial expressions, as we expect their ground-truthto be ill-defined. This is due to the circumstance, that incorrect conduction ofan exercise may resemble other exercises, as shown in Fig. 1b.
Since each of the above-mentioned subtasks covers diverse aspects, we focuson the landmark localization and the succeeding feature extraction for thera-peutic exercise classification here. Our depth features are extracted from 2.5Dimages and 3D point clouds recorded by the Kinect Sensor. We refer to 2.5Dimages as 2D images that contain the object-to-camera distance instead of theobject’s intensity value. We analyse the facial surface by extraction of curva-ture information and surface profiles. Surface profiles comprise line profiles and
3 http://www.xbox.com/en-US/kinect4 http://www.pmdtec.com/5 http://www.mesa-imaging.ch/
Computer Vision, Imaging and Computer Graphics - Theory and Applications: Revised Selected Papers of VISIGRAPP 2013, Communications in Computer and Information Science (CCIS), vol. 458, pp. 179-194, Springer 2014

3
point signatures. Line profiles are based on paths that connect two landmarkpoints, whereas point signatures are based on radial paths around single land-mark points.
We examine the features’ discriminative power with respect to the classifica-tion of nine therapeutic exercises and their robustness regarding varying featureextraction regions. In the targeted real-time scenario, regions and points for fea-ture extraction need to be determined automatically. We expected that this stepleads to variations from manually located face regions and landmarks. Therefore,it is necessary that the features are robust against these deviations. Two differ-ent approaches for automated landmark localization have been tested: ActiveAppearance Models [3] and a combined approach that consists of learned spatialrelations of the facial landmarks and tree-structured parts models.
(a) (b)
Fig. 1: (a) Different subtasks of the design and implementation of an automatedtherapeutic exercise platform. (b) Patient with facial paresis on his right side.Left image: The exercise right cheek puffed is conducted correctly because thebulge of the cheek is a passive process as reaction of a higher air pressure insidethe mouth and a contraction of the buccinator on the left facial side. Right image:The exercise left cheek puffed is conducted incorrectly. The lack of contractionin the right buccinator leads to the bulge of the right cheek.
2 RELATED WORK
Automated recognition of therapeutic face excercises is a still relatively unex-plored research field. In practice, there are already tools that support the patientwith regard to exercising that is not supervised by a therapist. These tools com-prise video tutorials (LogoVid 6) or exercise diaries (CoMuZu 7). However, atthis moment there are no commercial solutions available that automatically rec-ognize and evaluate a performed therapeutic exercise.
6 http://www.comuzu.de7 http://www.logomedien.de/html/logovid7a.html
Computer Vision, Imaging and Computer Graphics - Theory and Applications: Revised Selected Papers of VISIGRAPP 2013, Communications in Computer and Information Science (CCIS), vol. 458, pp. 179-194, Springer 2014

4
In [4] the benefit of facial exercises for the prevention of synkinesis after facialparesis is analyzed. Synkinesis is an involuntary associated facial movement suchas eye closure during smiling. In order to determine the grade of synkinesis, [4]manually measure the eye opening width by using an image editing software. [5]present a system for the diagnosis support of patients with facial paresis using2D colour images. Therefore, they analyse facial asymmetries in the eyes, noseand mouth regions.
At present, there are no publications known to us that focus on the automatedrecognition of therapeutic facial exercises using depth information. Nevertheless,we can utilize approaches from works on face detection, as well as person andemotion recognition. [6] use curvature of the surface of a 2.5D image to detectsalient face features, like eyes and nose. A triplet consisting of a candidate noseand two candidate eyes is processed by a classifier that is trained to discriminatebetween faces and non-faces. Based on curvature information estimated on a 3Dtriangle mesh model, [7] classify 3D faces according to the emotional state thatthey represent.
Point signatures were developed by [8] as an approach for general 3D ob-ject recognition. Additionally, in [9] they present an enhanced point signaturealgorithm that is specialised on face recognition. [10] extract point signatures in2.5D images and Gabor filter responses in gray-level images and employ theircombination for face recognition.
In this work, we follow the method proposed in [7] to create histogramsof curvature types. We utilize the face recognition algorithm from [9] for theclassification of our nine therapeutic exercises and supplement it with a similarapproach that employs line profiles instead of radial profiles. In contrast to [7],where manually placed landmarks are used, we additionally evaluate our resultswith automatically located landmark positions.
3 METHOD
In the following, we briefly summarize the determination of surface curvature(section 3.1) as far as it is necessary to understand the basic principles of ourcurvature feature types (section 3.2). For detailed information, we refer to [11].In sections 3.3 and 3.4 the extraction of line profiles and point signatures is pre-sented. In the last section, we focus on the automation of the feature extractionprocess.
3.1 Curvature Analysis
Our aim is the classification of faces according to the therapeutic exercises apatient performs. Facial movement leads to a change of the face surface. Weanalyse the surface by extracting curvature information from 2.5D range im-ages and 3D point clouds. The parametric form of a surface in 3D is s(u, v) =[x(u, v) y(u, v) z(u, v)]T , with u and v denoting the axes of the parameter plane(Fig. 2a). Based on this function, we can determine the first and the second
Computer Vision, Imaging and Computer Graphics - Theory and Applications: Revised Selected Papers of VISIGRAPP 2013, Communications in Computer and Information Science (CCIS), vol. 458, pp. 179-194, Springer 2014

5
fundamental forms, which uniquely characterize and quantify general smoothshapes. The elements of the first fundamental form I are:
I =
[su · su su · svsu · sv sv · sv
]. (1)
The subscripts denote partial differentation. The elements of the second funda-mental form J are:
J =
[suu · n suv · nsuv · n svv · n
], (2)
with n being the unit normal vector of the tangent plane in the point with pa-rameters (u, v). Although both fundamental forms are a unique representationof the surface, combinations of both are more common for surface characteriza-tion, because they allow for an intuitive interpretation. Using I and J, the shapeoperator matrix W can be computed by:
W = I−1 · J . (3)
The mean curvature H gives information about the direction of the curvature(convex, concave) and is determined by:
H =1
2tr [W] , (4)
with tr [W] being the trace of the shape operator W. The Gaussian curvature Kcontains the information whether curvatures that are orthogonal to each otherpoint in the same or in different directions (Fig. 2b). It is computed as follows:
K = det [W] . (5)
Opposed to the general parametric representation, the parametrization of a 2.5Drange image takes a very simple form s(u, v) = [u v z(u, v)]T . Because a 2.5Dimage is spanned by two axes that generate a discrete (pixel) grid, the derivationof s with respect to u and v is simplified and results in su = [1 0 zu]T andsv = [0 1 zv]T . Therefore, for the computation of H and K only the partialderivatives of z are relevant:
H =zuu + zvv + zuuz
2v + zvvz
2u − 2zuzvzuv
(1 + z2u + z2v)32
, (6)
K =zuuzvv − z2uv
(1 + z2u + z2v)2. (7)
3.2 Extraction of Curvature Information
Prior to feature extraction, we smooth the face surface using an average filter.We extract the mean and Gaussian curvature for each pixel, respectively 3D-point, in order to obtain information about the facial surface. This results in
Computer Vision, Imaging and Computer Graphics - Theory and Applications: Revised Selected Papers of VISIGRAPP 2013, Communications in Computer and Information Science (CCIS), vol. 458, pp. 179-194, Springer 2014
6
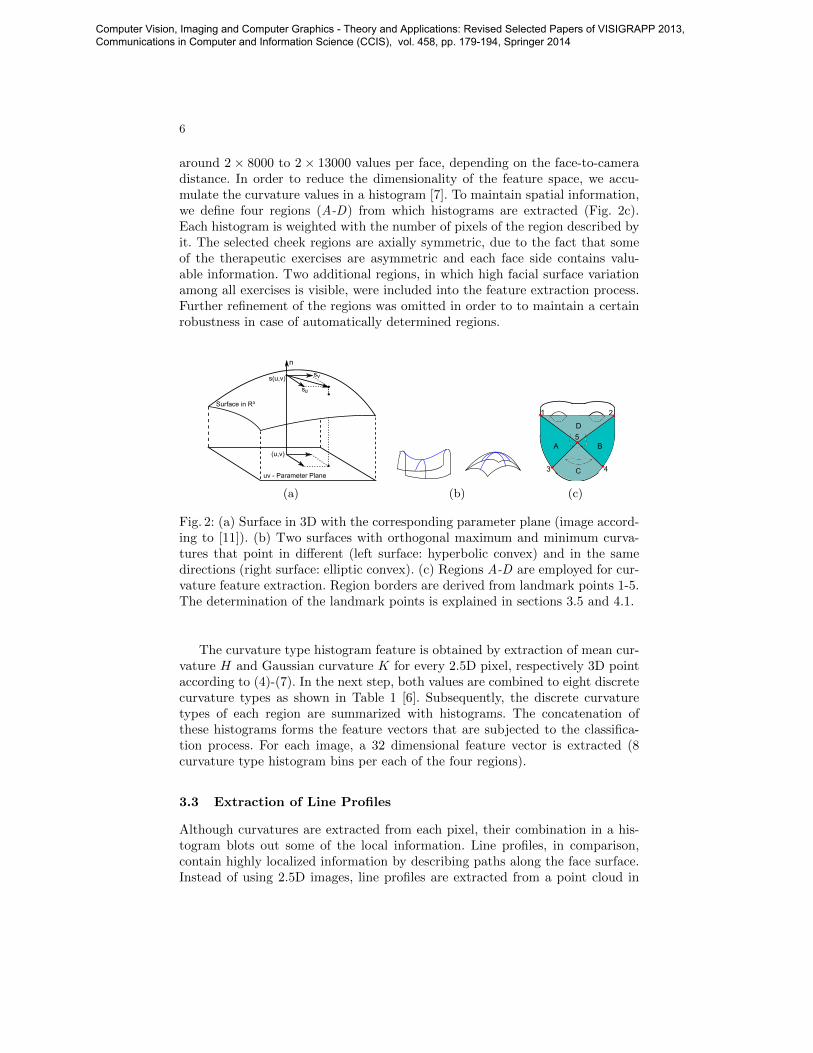
around 2 × 8000 to 2 × 13000 values per face, depending on the face-to-cameradistance. In order to reduce the dimensionality of the feature space, we accu-mulate the curvature values in a histogram [7]. To maintain spatial information,we define four regions (A-D) from which histograms are extracted (Fig. 2c).Each histogram is weighted with the number of pixels of the region described byit. The selected cheek regions are axially symmetric, due to the fact that someof the therapeutic exercises are asymmetric and each face side contains valu-able information. Two additional regions, in which high facial surface variationamong all exercises is visible, were included into the feature extraction process.Further refinement of the regions was omitted in order to to maintain a certainrobustness in case of automatically determined regions.
uv - Parameter Plane
n
Surface in R³
s(u,v)
su
sv
(u,v)
(a) (b)
1 2
3 4
BA
C
D
5
(c)
Fig. 2: (a) Surface in 3D with the corresponding parameter plane (image accord-ing to [11]). (b) Two surfaces with orthogonal maximum and minimum curva-tures that point in different (left surface: hyperbolic convex) and in the samedirections (right surface: elliptic convex). (c) Regions A-D are employed for cur-vature feature extraction. Region borders are derived from landmark points 1-5.The determination of the landmark points is explained in sections 3.5 and 4.1.
The curvature type histogram feature is obtained by extraction of mean cur-vature H and Gaussian curvature K for every 2.5D pixel, respectively 3D pointaccording to (4)-(7). In the next step, both values are combined to eight discretecurvature types as shown in Table 1 [6]. Subsequently, the discrete curvaturetypes of each region are summarized with histograms. The concatenation ofthese histograms forms the feature vectors that are subjected to the classifica-tion process. For each image, a 32 dimensional feature vector is extracted (8curvature type histogram bins per each of the four regions).
3.3 Extraction of Line Profiles
Although curvatures are extracted from each pixel, their combination in a his-togram blots out some of the local information. Line profiles, in comparison,contain highly localized information by describing paths along the face surface.Instead of using 2.5D images, line profiles are extracted from a point cloud in
Computer Vision, Imaging and Computer Graphics - Theory and Applications: Revised Selected Papers of VISIGRAPP 2013, Communications in Computer and Information Science (CCIS), vol. 458, pp. 179-194, Springer 2014

7
Table 1: Curvature type definition using mean and Gaussian curvature (H, K)K < 0 K = 0 K > 0
H < 0 hyperbolic concave cylindric concave elliptic concaveH = 0 hyperbolic symmetric planar impossibleH > 0 hyperbolic convex cylindric convex elliptic convex
3D. Each of the three dimensions is expressed in meter. For a 2.5D image, twodimensions are given in pixel units. However, the real world distance that is de-scribed by the difference of one pixel depends on the person-to-camera distance.The smaller the distance of an object to the camera is, the more pixels does thisobject cover on a 2.5D image. As a result, comparison of different line profiles ismore difficult, when using 2.5D images.
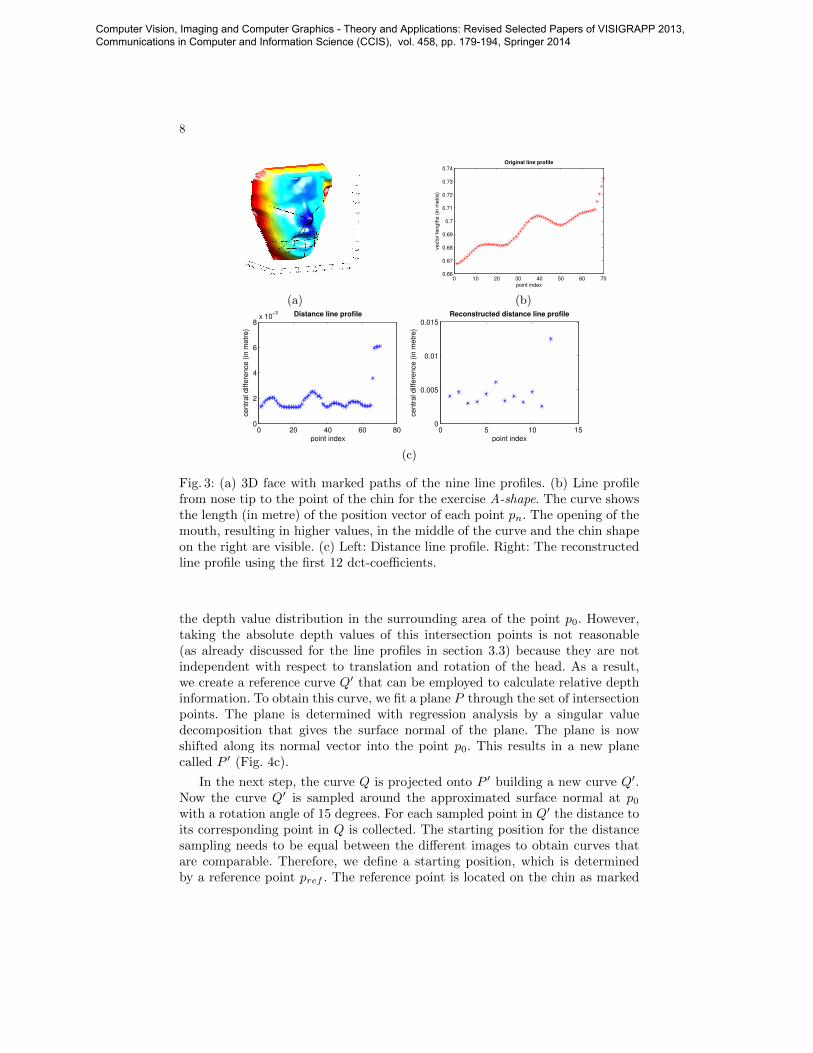
In total, we extract nine line profiles from the 3D point cloud of the face.Every line profile connects two defined landmark points. Figure 3a shows thepaths of the profile lines. Seven profiles start at the nose tip, connecting it inradial direction to silhouette points. Two line profiles are horizontally locatedand link two silhouette points.
The paths over the face consist of N equidistant points pn(x, y, z), withn = 1...N . Nearest-neighbour interpolation is employed in order to calculatemissing points. The L2-norm of the position vectors of every 3D point pn alreadycreates a distinctive curve as can be seen in Fig. 3b. However, in order to achieveinvariance with respect to the viewpoint (i.e., translation and rotation operationsof the facial point cloud), relatively coded central differences between the 3Dpoints are calculated (left image of Fig. 3c).
The images show, that the curves consist of 70 samples. This value mayvary because the size of the head (subject-specific) or the length of the curve(exercise-specific) may change. To get an identical size of the curve for everysubject and every exercise and to reduce the amount of feature dimensions, weconduct a discrete cosine transform [12] on the curves and build our featurevector using the first 12 dct-coefficients. The right image of Fig. 3c shows, thatthe inverse discrete cosine transform with 12 coefficients yields a reasonablereconstruction of the original curve. We derived the line profiles from the pointsignature approach presented in the following section.
3.4 Extraction of Point Signatures
Similar to line profiles, point signatures are paths on a surface [8]. Instead ofconnecting two landmark points, the curve runs radially around a distinctivepoint p0 of a 3D point cloud. As can be seen in Fig. 4a, in our approach thepoint p0 is located on the tip of the nose. In order to obtain the point signature,a sphere is centered into the point p0 of the 3D point cloud. The intersection ofthe sphere with the facial points forms a curve Q in the three-dimensional space(Fig. 4b). The depth information of these intersection points, combined with thevalue of the sphere radius, contains characteristic and unique information about
Computer Vision, Imaging and Computer Graphics - Theory and Applications: Revised Selected Papers of VISIGRAPP 2013, Communications in Computer and Information Science (CCIS), vol. 458, pp. 179-194, Springer 2014
8
(a)
0 10 20 30 40 50 60 700.66
0.67
0.68
0.69
0.7
0.71
0.72
0.73
0.74Original line profile
point index
vecto
r le
ngth
s (
in m
etr
e)
(b)
0 20 40 60 800
2
4
6
8x 10
−3 Distance line profile
point index
ce
ntr
al d
iffe
ren
ce
(in
me
tre
)
0 5 10 150
0.005
0.01
0.015Reconstructed distance line profile
point index
ce
ntr
al d
iffe
ren
ce
(in
me
tre
)
(c)
Fig. 3: (a) 3D face with marked paths of the nine line profiles. (b) Line profilefrom nose tip to the point of the chin for the exercise A-shape. The curve showsthe length (in metre) of the position vector of each point pn. The opening of themouth, resulting in higher values, in the middle of the curve and the chin shapeon the right are visible. (c) Left: Distance line profile. Right: The reconstructedline profile using the first 12 dct-coefficients.
the depth value distribution in the surrounding area of the point p0. However,taking the absolute depth values of this intersection points is not reasonable(as already discussed for the line profiles in section 3.3) because they are notindependent with respect to translation and rotation of the head. As a result,we create a reference curve Q′ that can be employed to calculate relative depthinformation. To obtain this curve, we fit a plane P through the set of intersectionpoints. The plane is determined with regression analysis by a singular valuedecomposition that gives the surface normal of the plane. The plane is nowshifted along its normal vector into the point p0. This results in a new planecalled P ′ (Fig. 4c).
In the next step, the curve Q is projected onto P ′ building a new curve Q′.Now the curve Q′ is sampled around the approximated surface normal at p0with a rotation angle of 15 degrees. For each sampled point in Q′ the distance toits corresponding point in Q is collected. The starting position for the distancesampling needs to be equal between the different images to obtain curves thatare comparable. Therefore, we define a starting position, which is determinedby a reference point pref . The reference point is located on the chin as marked
Computer Vision, Imaging and Computer Graphics - Theory and Applications: Revised Selected Papers of VISIGRAPP 2013, Communications in Computer and Information Science (CCIS), vol. 458, pp. 179-194, Springer 2014

9
in Fig. 4a. The sphere radius length has to be determined such that the arisingpath does not protrude beyond the surface of the face and no background pointsare sampled. The length of the radius is computed from the eye distance deye,multiplied by a factor f . The eye distance is estimated from the distance betweenthe mean positions of each eye that are obtained by the landmark positions ofeach eye (Fig. 4a). We use the following values for the empirically determinedfactor f to extract five different point signatures that cover varying areas of theface: 0.4, 0.5, 0.7, 0.8 and 1.0.
Sampling of the radial curve with a fixed interval of 15 degrees generates 24values per point signature. The more point signatures are extracted, the moreprecisely the surface of the face can be described. However, a high amount ofpoint signatures leads to a high-dimensional feature space. Again, we reducethe dimension of the feature vector to twelve values by applying discrete cosinetransform on each point signature as shown in section 3.3.
pref
p0
deye
(a) (b) (c)
Fig. 4: (a) Landmark points and line segments that are employed for the ex-traction of point signatures. (b) Intersection curve Q of the sphere with the 3Dpoint cloud. (c) The planes P (red) and P ′ (magenta). The projected curve Q′
is marked on P ′.
3.5 Automation of the Feature Extraction Process
The features presented above have in common that distinct facial areas needto be determined for extraction. Manual determination of these landmarks andregions is not feasible in a real-world application. Thus, they have to be detectedautomatically, which may lead to less accurate localizations. In this work, wecompare two different approaches for landmark localization: Active AppearanceModels and a tree-structured parts model algorithm that is combined with a 3Dspatial relations model.
AAMs are mainly applied in the field of facial expression recognition on 2Dgray-value images ( [3], [13]). On the basis of several training images a combinedmean texture and shape model is derived. The fitting of this mean model to a newand unknown face is improved by determination of a coarse initialization positionusing the Viola and Jones face detector [14]. In the next step the AAM adapts
Computer Vision, Imaging and Computer Graphics - Theory and Applications: Revised Selected Papers of VISIGRAPP 2013, Communications in Computer and Information Science (CCIS), vol. 458, pp. 179-194, Springer 2014

10
itself to the new face by minimizing the error between the model intensities andthe image intensities. The parameters that describe the fitted model are usuallysubjected to classification of facial expressions. In constrast to this, the AAMcan be used for the mere detection of landmarks without further consideration ofthe model parameters [15]. In this paper, we focus on the application of AAMsfor the detection of the 58 landmarks only (Fig. 5b).
Tree-structured parts models are an approach for face detection, pose es-timation and landmark localization [16]. In total 68 landmarks are located inthis approach. The number of landmarks on the face silhouette is similar to thenumber of silhouette landmarks detected by the AAM approach. However, testsshowed that the placement of landmarks in the center of the face, e.g., in thenose or eye region, is too imprecise for the targeted scenario. Therefore, only theinformation of the silhouette landmark positions is kept.
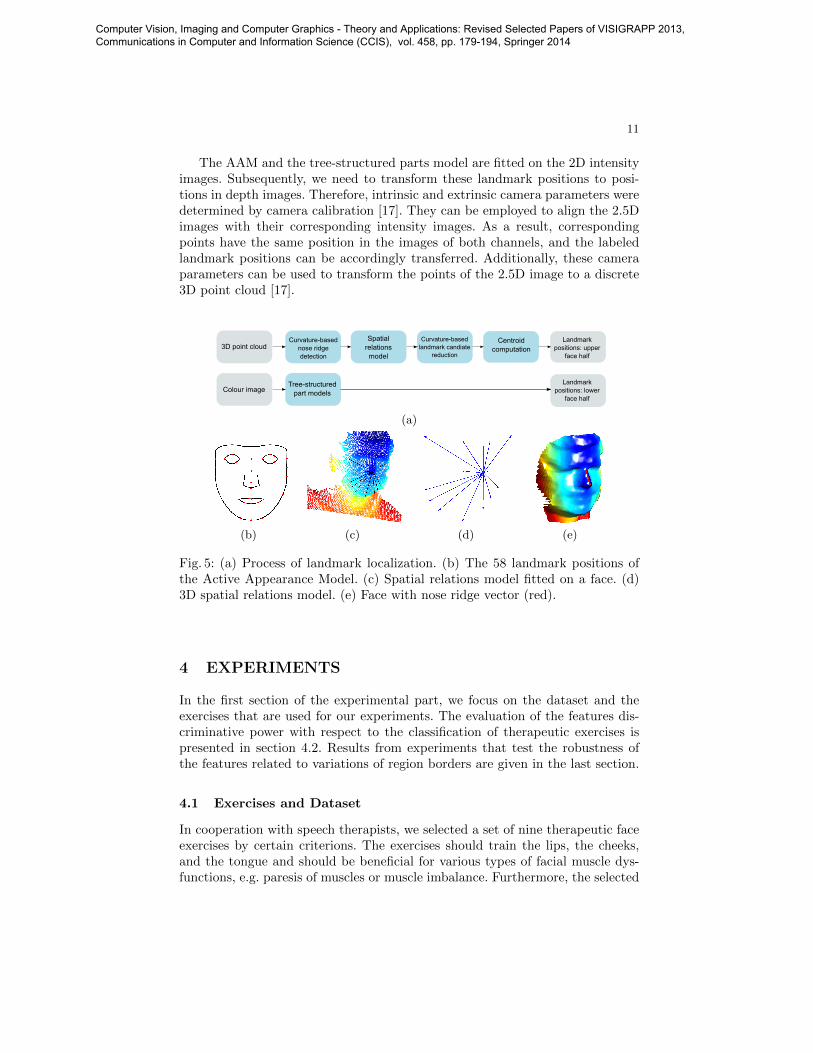
A spatial relations model and surface curvature are computed in a parallelprocess in order to localize the landmarks in the upper, rigid face half (Fig. 5a).The spatial relations model comprises a smaller subset of landmarks, which wasderived from the landmarks and regions that are necessary for feature extraction.The idea of the spatial relations model is based on the fact that distances andangles between the landmarks of a face lie in a constrained range. The model iscomputed from training data and centered in the nose tip of a face (Fig. 5c). Intotal, 14 position vectors show the direction and absolute value to 14 landmarks(Fig. 5d). Additionally, for each landmark the maximum deviation of the trainingdata from the mean position is computed. As a result, a spherical search spacecan be constructed around each position vector tip by using the maximum devi-ation distance as radius. In order to be able to fit the model to a new image withunknown landmark localizations, the nose tip and the nose ridge vector must bedetected (Fig. 5e). This can be done via curvature analysis and Support VectorMachine (SVM) classification because of the distinctive surface of the nose. The3D mean model is then translated and rotated so that the model reference vec-tor and the nose ridge vector are congruent. Possible landmark candidates lie ineach of the 14 spherical search spaces that are centered at the tip of a vector.Now, the previously computed curvature information can additionally be usedas input for 14 single SVMs in order to further reduce the landmark candidatenumber. For each of the 14 landmarks a separate SVM is trained. In the end, foreach landmark a centroid of the remaining candidates is computed and definedas the new landmark position.
In contrast to the rigid upper face half, the lower one has a more dynamicsurface appearance. As a result, mean and Gaussian curvature are not appro-priate for landmark localization in this area. In the last step, upper face halflandmarks from the spatial relations model and lower face half landmarks fromthe tree-structured parts model are fused to one landmark set. Thus, at present,both processes are parallel and independent from each other. Our future goal isto combine the results of both approaches for complementary verification anderror minimization.
Computer Vision, Imaging and Computer Graphics - Theory and Applications: Revised Selected Papers of VISIGRAPP 2013, Communications in Computer and Information Science (CCIS), vol. 458, pp. 179-194, Springer 2014
11
The AAM and the tree-structured parts model are fitted on the 2D intensityimages. Subsequently, we need to transform these landmark positions to posi-tions in depth images. Therefore, intrinsic and extrinsic camera parameters weredetermined by camera calibration [17]. They can be employed to align the 2.5Dimages with their corresponding intensity images. As a result, correspondingpoints have the same position in the images of both channels, and the labeledlandmark positions can be accordingly transferred. Additionally, these cameraparameters can be used to transform the points of the 2.5D image to a discrete3D point cloud [17].
Colour image
Curvature-based nose ridge detection
Tree-structured part models
3D point cloudSpatial
relationsmodel
Curvature-based landmark candiate
reduction
Landmark positions: upper
face half
Landmark positions: lower
face half
Centroid computation
(a)
(b) (c) (d) (e)
Fig. 5: (a) Process of landmark localization. (b) The 58 landmark positions ofthe Active Appearance Model. (c) Spatial relations model fitted on a face. (d)3D spatial relations model. (e) Face with nose ridge vector (red).
4 EXPERIMENTS
In the first section of the experimental part, we focus on the dataset and theexercises that are used for our experiments. The evaluation of the features dis-criminative power with respect to the classification of therapeutic exercises ispresented in section 4.2. Results from experiments that test the robustness ofthe features related to variations of region borders are given in the last section.
4.1 Exercises and Dataset
In cooperation with speech therapists, we selected a set of nine therapeutic faceexercises by certain criterions. The exercises should train the lips, the cheeks,and the tongue and should be beneficial for various types of facial muscle dys-functions, e.g. paresis of muscles or muscle imbalance. Furthermore, the selected
Computer Vision, Imaging and Computer Graphics - Theory and Applications: Revised Selected Papers of VISIGRAPP 2013, Communications in Computer and Information Science (CCIS), vol. 458, pp. 179-194, Springer 2014

12
exercises should be easy to practice and should build a set of sub-exercises thatcan be combined to more complex dynamic exercise units, e.g. by alternatingbetween them. The exercises have to be performed in an exaggerated manner,to enable a maximum training effect, and have to be retained for around two orthree seconds. The speed of the performance is not important. Although someof these are vocal exercises, it is not necessary to vocalize a continuous soundwhile performing the shape. Images that visualize the exercise conduction areshown in Fig. 6.
Fig. 6: Exercises that have been selected in cooperation with speech therapists(l. to r.): pursed lips, taut lips, A-shape, I-shape, cheek poking (right/ left side),cheeks puffed (both/ right/ left side(s)). For better visualization colour imagesare shown.
Due to the lack of a public database that shows the performance of ther-apeutic exercises, we recorded a dataset, which contains eleven persons, whoconducted the nine exercises. For each exercise, there are around seven images,showing different states of exercise conduction. This amounts to a total size of696 images in the dataset. Some parts of the scene, which was captured by theKinect may be shadowed, if they are seen by the depth camera but are notilluminated by the infrared projector. This leads to invalid values in the 2.5Dimage [18]. These values were removed by replacing them with the mean depthvalues of adjacent valid neighbour pixels. For every depth image, there existsa corresponding colour image that has been recorded with maximum time dif-ference of 16 milliseconds. The colour images have been labeled manually with58 landmark points that were used for the training of the AAM (Fig. 5b), orfor the feature extraction from depth data. The transferability of landmark po-sitions between the 2.5D image and the colour image was already explained insection 3.5.
4.2 Evaluation of the Discriminative Power
The following section gives an overview of the classification results. Since wewanted to evaluate the basic suitability of the described features for the task ofclassifying therapeutic exercises, we extracted the features from regions obtainedvia manually labeled landmarks, thus excluding other influences like deviatingregion borders. We evaluated each feature group individually and in combination.Training and classification was performed by applying SVMs of the LIBSVMpackage [19]. We tested linear SVM and a Radial Basis Function kernel. Optimal
Computer Vision, Imaging and Computer Graphics - Theory and Applications: Revised Selected Papers of VISIGRAPP 2013, Communications in Computer and Information Science (CCIS), vol. 458, pp. 179-194, Springer 2014

13
values for the penalty parameter C and the kernel parameter γ were obtained bya grid search on the training set [20]. In order to avoid overfitting to the trainingset, we employed a 5-fold cross-validation during parameter optimization. Incombination with the amount of data (696 images, 232 feature dimensions), thelinear SVM led to the best results because it avoided overfitting. The datasetwas split up into training and test set using the leave-one-out cross-validation.Additionally, all images of the person present in the test images were excludedfrom the training set. This approach is consistent with the mentioned applicationscenario in which the images of the test person will not be part of the trainingdata. Linear discriminant analysis (LDA) was used prior to the linear SVMclassification in order to reduce the feature dimensions from 232 to 8. LDAis a linear transformation of the feature space that maximizes the between-class separability and minimizes the within-class variability [21]. We obtained anaverage recognition accuracy over the nine classes of 90.89 %. Detailed resultsfor the single features are given in Fig. 8.
4.3 Evaluation of the Automated Landmark Localization
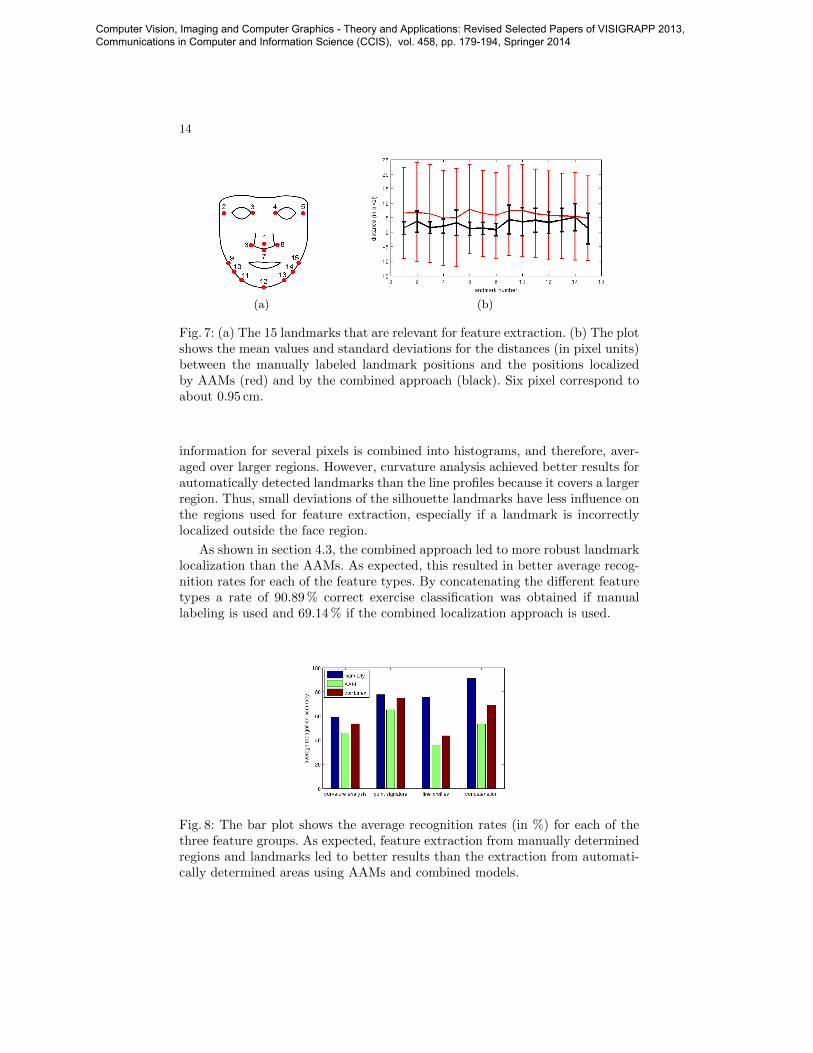
As mentioned before, in a real-world scenario regions and landmark points forfeature extraction have to be detected automatically. Therefore it is crucial, toemploy a robust landmark localization. Although AAMs usually comprise 58landmarks, in this section we constrain our evaluation to the landmarks thatare relevant for our succeeding feature extraction (Fig. 7a). Figure 7b showsthe mean pixel distances and standard deviations between the manually labeledlandmarks and the two automated localization approaches. The AAMs are vi-sualized in red and the combined parts and spatial relations model approach isvisualized in black. The localization using the combined approach led to smallerdeviations than using AAMs. A deviation of six pixels corresponds to about0.95 cm. Additionally, it can be seen that the landmarks in the upper rigid halfof the face were more robustly detected than the landmarks in the lower facehalf. Better localization resulted from the more distinctive and invariant surfaceshape in these landmark areas. Furthermore, images were labeled manually on2D colour images. The landmarks with the smallest deviations are landmarksthat are easier to label in the colour image because of distinctive visual prop-erties, e.g., the darker inner eye corners or the edge between cheek and nosewing.
4.4 Evaluation of Feature Extraction from AutomaticallyDetermined Regions
In this section, we evaluate the robustness of our different features types withrespect to varying region borders and landmark positions. Figure 8 shows theresults for each of the three feature types for manually and automatically local-ized landmarks. For manual determination of the landmark positions, curvatureanalysis is weaker than point signatures and line profiles with respect to the dis-crimination of nine therapeutic exercises. This result occured because curvature
Computer Vision, Imaging and Computer Graphics - Theory and Applications: Revised Selected Papers of VISIGRAPP 2013, Communications in Computer and Information Science (CCIS), vol. 458, pp. 179-194, Springer 2014
14
(a) (b)
Fig. 7: (a) The 15 landmarks that are relevant for feature extraction. (b) The plotshows the mean values and standard deviations for the distances (in pixel units)between the manually labeled landmark positions and the positions localizedby AAMs (red) and by the combined approach (black). Six pixel correspond toabout 0.95 cm.
information for several pixels is combined into histograms, and therefore, aver-aged over larger regions. However, curvature analysis achieved better results forautomatically detected landmarks than the line profiles because it covers a largerregion. Thus, small deviations of the silhouette landmarks have less influence onthe regions used for feature extraction, especially if a landmark is incorrectlylocalized outside the face region.
As shown in section 4.3, the combined approach led to more robust landmarklocalization than the AAMs. As expected, this resulted in better average recog-nition rates for each of the feature types. By concatenating the different featuretypes a rate of 90.89 % correct exercise classification was obtained if manuallabeling is used and 69.14 % if the combined localization approach is used.
Fig. 8: The bar plot shows the average recognition rates (in %) for each of thethree feature groups. As expected, feature extraction from manually determinedregions and landmarks led to better results than the extraction from automati-cally determined areas using AAMs and combined models.
Computer Vision, Imaging and Computer Graphics - Theory and Applications: Revised Selected Papers of VISIGRAPP 2013, Communications in Computer and Information Science (CCIS), vol. 458, pp. 179-194, Springer 2014

15
5 SUMMARY AND DISCUSSION
In this paper, we presented several aspects that are necessary for the design andimplementation of an automated training platform for patients with facial muscledysfuctions. We introduced nine therapeutic exercises, which - in cooperationwith speech language therapists - were determined as beneficial for the plannedapplication scenario. Additionally, the automated classification of these exerciseswas evaluated. The presented approach employs 2.5D depth images and 3D pointclouds and is based on three different feature types: curvature analysis, pointsignatures, and line profiles. The features were evaluated with respect to theirdiscriminative power for exercise classification. Additionally, we examined theirrobustness regarding varying locations of feature extraction. This is relevant forall applications, planned for practical use, where a manual detection of landmarksis not feasible.
Curvature analysis, in the form we have implemented it, is rather global com-pared to point signatures and line profiles and showed a relatively robust per-formance. However, with suitable landmark localizations point signatures andline profiles outperform curvature analyis. We used two approaches for auto-mated landmark detection: Active Appearance Models and tree-structured partsmodels. The latter lead to the best results. Line profiles showed only weak con-tribution to the classification process, if the landmark positions are detectedautomatically. Nevertheless, the results based on manually defined regions arepromising.
ACKNOWLEDGEMENTS
We would like to thank the m&i Fachklinik Bad Liebenstein (in particular Prof.Dr. med. Gustav Pfeiffer, Eva Schillikowski) and Logopadische Praxis Irina Stan-genberger, who supported our work by giving valuable insights into rehabilita-tion and speech-language therapy requirements and praxis. This work is partiallyfunded by the TMBWK ProExzellenz initiative, Graduate School on Image Pro-cessing and Image Interpretation.
References
1. Lanz, C., Denzler, J., Gross, H.M.: Facial movement dysfunctions: Conceptualdesign of a therapy-accompanying training system. In: Ambient Assisted Living -Advanced Technologies And Societal Change, Springer Heidelberg (2013)
2. Grosse, M., Schaffer, M., Harendt, B., Kowarschik, R.: Fast data acquisition forthree-dimensional shape measurement using fixed-pattern projection and temporalcoding. Optical Engineering 50 (2011) 100503
3. Cootes, T., Edwards, G., Taylor, C.: Active appearance models. IEEE Transactionson Pattern Analysis and Machine Intelligence 23(6) (2001) 681–685
4. Nakamura, K., Toda, N., Sakamaki, K., Kashima, K., Takeda, N.: Biofeedbackrehabilitation for prevention of synkinesis after facial palsy. Otolaryngology–Headand Neck Surgery 128(4) (2003) 539–543
Computer Vision, Imaging and Computer Graphics - Theory and Applications: Revised Selected Papers of VISIGRAPP 2013, Communications in Computer and Information Science (CCIS), vol. 458, pp. 179-194, Springer 2014

16
5. Gebhard, A., Paulus, D., Suchy, B., Wolf, S.: A system for diagnosis support ofpatients with facialis paresis. Kl 3/2000 (2000) 40–42
6. Colombo, A., Cusano, C., Schettini, R.: 3d face detection using curvature analysis.Pattern Recognition 39(3) (2006) 444–455
7. Wang, J., Yin, L., Wei, X., Sun, Y.: 3d facial expression recognition based onprimitive surface feature distribution. Int. Conf. on Computer Vision and PatternRecognition 2 (2006) 1399–1406
8. Chua, C.S., Jarvis, R.: Point signature: a new representation for 3d object recog-nition. In: Int. Journal of Computer Vision. Volume 25. (1997) 63–85
9. Chua, C.S., Han, F., Ho, Y.K.: 3d human face recognition using point signature.In: Proceedings of the 4th Int. Automatic Face and Gesture Recognition Conf.(2000) 233–238
10. Wang, Y., Chua, C.S., Ho, Y.K.: Facial feature detection and face recognition from2d and 3d images. In: Pattern Recognition Letters. Volume 23. (2002) 1191–1202
11. Besl, P., Jain, R.: Invariant surface characteristics for 3d object recognition inrange images. Computer Vision, Graphics, and Image Processing 33(1) (1986)33–80
12. Salomon, D.: Data compression: the complete reference. Springer-Verlag New YorkInc (2004)
13. Martin, C., Werner, U., Gross, H.M.: A real-time facial expression recognitionsystem based on active appearance models using gray images and edge images. In:Int. Conf. on Automatic Face and Gesture Recognition. (2008)
14. Viola, P., Jones, M.: Robust real-time face detection. Int. Journal of ComputerVision 57(2) (2004) 137–154
15. Haase, D., Denzler, J.: Anatomical landmark tracking for the analysis of animallocomotion in x-ray videos using active appearance models. In: Image Analysis.Volume 6688 of Lecture Notes in Computer Science. (2011) 604–615
16. Zhu, X., Ramanan, D.: Face detection, pose estimation and landmark localizationin the wild. In: Int. Conf. for Computer Vision and Pattern Recognition. (2012)2879–2886
17. Hartley, R., Zisserman, A.: Multiple view geometry in computer vision. CambridgeUniversity Press (2000)
18. Khoshelham, K.: Accuracy analysis of kinect depth data. In: ISPRS WorkshopLaser Scanning. Volume 38. (2011)
19. Chang, C.C., Lin, C.J.: LIBSVM: A library for support vector machines. ACMTransactions on Intelligent Systems and Technology 2 (2011) 27:1–27:27 Softwareavailable at urlhttp://www.csie.ntu.edu.tw/ cjlin/libsvm.
20. Hsu, C., Chang, C., Lin, C.: A practical guide to support vector classification. TRavailable at http://www. csie. ntu. edu. tw/ cjlin/papers/guide/guide. pdf (2009)
21. Webb, A., Copsey, K., Cawley, G.: Statistical pattern recognition. Wiley (2011)
Computer Vision, Imaging and Computer Graphics - Theory and Applications: Revised Selected Papers of VISIGRAPP 2013, Communications in Computer and Information Science (CCIS), vol. 458, pp. 179-194, Springer 2014