faÇade design tool user’s guide · for information regarding the façade design tool and the...
TRANSCRIPT

FAÇADE DESIGN TOOL USER’S GUIDEwww.commercialwindows.org/fdt.php
January 2012
ORIENTATION
WINDOW AREA
LIGHT CONTROLS
INTERIOR & EXTERIOR SHADING
GLASS & FRAME TYPE
Design Parameters
N E S WENERGY PEAK DEMAND
CARBON DAYLIGHT
VIEW
COMFORT
COSTS
Performance Outcomes
0.00
0.50
1.00
1.50
2.002.50
3.00
3.50
4.00
4.50
5.00
GLARE

The Façade Design Tool and the Windows for High-performance Commercial Buildings web site was developed with financial support from the U.S. Department of Energy’s Windows and Glazing Research Program within Energy Efficiency and Renewable Energy Building Technologies Program. In partnership with the building industry, the U.S. Department of Energy supports a range of research, development, and demonstration programs, as well as education and market transformation projects, designed to accelerate the introduction and use of new energy-saving building technologies.
The Façade Design tool and Windows for High-performance Commercial Buildings web site was jointly developed between the Center for Sustainable Building Research (CSBR) at the University of Minnesota and the Windows and Daylighting Group at Lawrence Berkeley National Laboratory (LBNL), with support from the Alliance to Save Energy (ASE).
For information regarding the Façade Design Tool and The Façade Design Tool User’s Guide contact:
Kerry Haglund, Senior Research Fellow, LEED AP [email protected] for Sustainable Building Research1425 University Avenue SE, Suite 115 Minneapolis, MN 55414 voice: 612.626.2737 fax: 612.626.7424 [email protected]
Contents
Using the Façade Design Tool ................................................................................................. 1Select a Location, Building Type, and Zone Orientation .........................................................................................1REFINE & EXPLORE ................................................................................................................................................. 3
REFINE & EXPLORE: Step-by-Step .............................................................................................................................. 4Navigating through REFINE & EXPLORE Results .....................................................................................................6
Tabs of Performance Outcomes ................................................................................................................................. 7Definitions and Modeling Assumptions ..................................................................................................................... 7Sorting Capabilities .................................................................................................................................................... 8The Dashboard .......................................................................................................................................................... 9
Switch From REFINE & EXPLORE to COMPARE RESULTS .......................................................................................10Switch to COMPARE RESULTS: Step-by-Step ............................................................................................................ 10
COMPARE 5 SCENARIOS ....................................................................................................................................... 13COMPARE 5 SCENARIOS: Step-by-Step .................................................................................................................... 13
Design Parameters (Inputs) .................................................................................................. 16Location ................................................................................................................................................................ 16Facade Orientation ............................................................................................................................................... 17The Building/Zone ................................................................................................................................................ 17Window-to-Wall Ratio (WWR).............................................................................................................................. 18Building Projections .............................................................................................................................................. 19Lighting Controls ................................................................................................................................................... 19Shades .................................................................................................................................................................. 20Glazing System ..................................................................................................................................................... 21
Performance Outcomes (Outputs) ....................................................................................... 22Annual Energy ...................................................................................................................................................... 22Peak Electric Demand ........................................................................................................................................... 22Carbon .................................................................................................................................................................. 22Daylight Illuminance ............................................................................................................................................. 23Glare ..................................................................................................................................................................... 24Thermal Comfort .................................................................................................................................................. 25

Façade Design Tool User’s Guide 1© 2012 Regents of the University of Minnesota, Center for Sustainable Building Research
Using the Façade Design ToolThis tool is intended for use in the early part of the design process to understand the impacts of various design decisions. You choose the design conditions of a facade and rank and/or compare the performance data in terms of annual energy, peak demand, carbon, daylight illuminance, glare, and thermal comfort. After a location, building type, and orientation have been selected, you choose to REFINE & EXPLORE or COMPARE the performance data of window design scenarios that you define in terms of orientation, window area, light controls, interior shades, exterior shades, and window type.
If inputs (climate, building type, orientation, window/facade design attributes) are needed and not represented in the Facade Design Tool, it is recommended that you download COMFEN and run simulations specific to your climate and design. COMFEN is a tool, with a graphic user interface, that focuses on designing alternative fenestration systems to help designers and decision-makers move toward optimal façade design.
Select a Location, Building Type, and Zone Orientation
1. First, select a Location from the drop down list. There are 21 cities within 8 climate zones. If a city isn’t listed, choose a city within the same climate zone.
2. Second, select a Building Type from the drop down list. Currently the building types represented are Office (small office) and School (classroom).
3. Third, select Facade Orientation from the drop down list. Each of the 4 cardinal directions is available.
4. Choose button 1: REFINE & EXPLORE or button 2: COMPARE 5 SCENARIOS to continue.
CHOOSE LOCATION & BUILDING TYPE
Select a location, building type, andzone orientation from the drop-downlists below. My city isn't listed»
"Refine & Explore" first lets youchoose the available designparameters then you can refine andexplore the ranked results. Use thisexploratory method if parametrics areunknown or to determine the optimaldesign from various scenarios.
"Compare 5 Scenarios" lists thedesign parameters for 5 scenarios for aquick comparison. Use this comparisonmethod if many of the designparametrics are previously determined.
Location 6A: MN Minneapolis
Building Type Office
Zone Orientation South
1 2
REFINE & EXPLORE -OR- COMPARE 5 SCENARIOS

Façade Design Tool User’s Guide 2© 2012 Regents of the University of Minnesota, Center for Sustainable Building Research
1: REFINE & EXPLORE: First you choose the available design parameters, then you refine and explore the ranked results. Use this exploratory method if parametrics are unknown or to determine the optimal performance of various scenarios for a particular orientation.
2: COMPARE 5 SCENARIOS: Lists the design parameters for 5 scenarios for a quick comparison. Use this comparison method if many of the design parametrics (window area, shading, glass type, lighting controls) are previously determined.
As will be shown in the following sections on using the Façade Design Tool, if you begin in the REFINE & EXPLORE mode to get results, you will then be able to compare 5 scenarios after you refine any result set. See “Switch from REFINE & EXPLORE to COMPARE RESULTS” section on page 10 for the example on how to use this method.
REFINE & EXPLORE: DEFINE ZONE DESIGN PARAMETERS Facade Design Tool Home | Minneapolis, Minnesota | Office | South
Set the design parameters from the choices below to compare design options and performance. At least one item from each parameter must be selected. Multiple items fromeach parameter can be selected.
THE BUILDING
Window Area
10%
20%
30%
40%
50%
60%
Building Projections
None
2' Overhang
4' Overhang
LIGHT & SHADE
Lighting Controls
None
Continuous Dimming
Shading
None
Interior Blinds
Exterior Blinds
GLAZING SYSTEM
Window Panes/LayersSingle
Double
Triple
Select All
GlassClear
Low-E
Tint
Reflective
Film
Select All
Solar Heat GainLow
Moderate
High
Select All
Visible TransmittanceLow
Moderate
High
Select All
«Previous Get Results»
COMPARERESULTS
Select up to 5 scenarios for
detailed comparison.
Compare
SAVE RESULTSExport all data in tab delimited
format.
Export to CSV
COMPARE ZONE RESULTS Facade Design Tool Home | Minneapolis, Minnesota | Office | South
The Building Glazing System Light & Shade
ScenarioZone
Orientation WWRBuilding
Projections Glass Lighting Controls Shades
1 South - - - - -
2 South - - - - -
3 South - - - - -
4 South - - - - -
5 South - - - - -
How to Perform a Comparison
1. Choose the design conditions for each of the 5 scenarios in which to compare.2. If you need more information regarding the design conditions, click on the headers for each attribute.3. Click the "Compare" button found in the dashboard to the left to see the comparative results for annual energy, peak demand, carbon, daylight
illuminance, glare, and thermal comfort.4. Once the results are displayed, you can modify the design condition attributes and click the "Modify Scenarios" button in the dashboard to view the
modifications.
From the first input screen COMPARE 5 SCENARIOS should be used if the design parameters are already known, or if you want to compare results between orientations. See the “COMPARE 5 SCENARIOS” section on page 13 for the example on how to use this method.

Façade Design Tool User’s Guide 3© 2012 Regents of the University of Minnesota, Center for Sustainable Building Research
REFINE & EXPLORE: DEFINE ZONE DESIGN PARAMETERS Facade Design Tool Home | Minneapolis, Minnesota | Office | South
Set the design parameters from the choices below to compare design options and performance. At least one item from each parameter must be selected. Multiple items fromeach parameter can be selected.
THE BUILDING
Window Area
10%
20%
30%
40%
50%
60%
Building Projections
None
2' Overhang
4' Overhang
LIGHT & SHADE
Lighting Controls
None
Continuous Dimming
Shading
None
Interior Blinds
Exterior Blinds
GLAZING SYSTEM
Window Panes/LayersSingle
Double
Triple
Select All
GlassClear
Low-E
Tint
Reflective
Film
Select All
Solar Heat GainLow
Moderate
High
Select All
Visible TransmittanceLow
Moderate
High
Select All
«Previous Get Results»
REFINE & EXPLOREFirst you choose the available design parameters, get the ranked results, then you can refine and explore these results. Use the REFINE & EXPLORE method if parametrics are unknown or to determine the optimal performance of various scenarios for a particular orientation.

Façade Design Tool User’s Guide 4© 2012 Regents of the University of Minnesota, Center for Sustainable Building Research
REFINE & EXPLORE: DEFINE ZONE DESIGN PARAMETERS Facade Design Tool Home | Minneapolis, Minnesota | Office | South
Set the design parameters from the choices below to compare design options and performance. At least one item from each parameter must be selected. Multiple items fromeach parameter can be selected.
THE BUILDING
Window Area
10%
20%
30%
40%
50%
60%
Building Projections
None
2' Overhang
4' Overhang
LIGHT & SHADE
Lighting Controls
None
Continuous Dimming
Shading
None
Interior Blinds
Exterior Blinds
GLAZING SYSTEM
Window Panes/LayersSingle
Double
Triple
Select All
GlassClear
Low-E
Tint
Reflective
Film
Select All
Solar Heat GainLow
Moderate
High
Select All
Visible TransmittanceLow
Moderate
High
Select All
«Previous Get Results»
REFINE & EXPLORE: Step-by-Step
1. Choose REFINE & EXPLORE from the first input screen. Set the design parameters from Window Area, Building Projections, Lighting Controls, Shading, and Window to compare design options and performance for the location, building type and orientation previously selected. At least one item from each parameter must be selected. If any of the design parametrics are missing a selection, there will be no results. Multiple items from each parameter can be selected.

Façade Design Tool User’s Guide 5© 2012 Regents of the University of Minnesota, Center for Sustainable Building Research
GLAZING SYSTEM
Window Panes/LayersSingle
Double
Triple
Select All
GlassClear
Low-E
Tint
Reflective
Film
Select All
Solar Heat GainLow
Moderate
High
Select All
Visible TransmittanceLow
Moderate
High
Select All
«Previous Get Results»
Click the text Window Area, Building Projections, Lighting Controls, Shading, and Window to bring up a pop-up window explaining that particular attribute and, if applicable, the modeling and simulation assumptions associated with that attribute. Click the X in the upper right corner to remove the pop-up window.
2. Choose Get Results to continue.
Window-to-Wall Ratio (WWR)
Flush-mounted, non-operable windows were modeled in the exterior wall of each perimeter zone. Window sizeswere modeled with a fenestration window-to-wall area ratio (which includes the area of the whole window withframe) where the wall area was defined as the floor-to-floor exterior wall area and the COMFEN simulationswere conducted using the floor-to-ceiling exterior wall area.
Office | School
BuildingType
Zonewidth(ft)
Zonedepth(ft)
Zone height (floor-to-ceiling) (ft)
Floor-to-floorheight (ft)
Lighting(W/ft2)
Equipment(W/ft2)
People(ft2/people)
People INPUT(people/zone)
Office 10 15 9 12 1 1 200 0.75
School 36 15 9 13 1.4 0.9 43.1 12.53
Office Zone
REFINE & EXPLORE: DEFINE ZONE DESIGN PARAMETERS Facade Design Tool Home | Minneapolis, Minnesota | Office | South
Set the design parameters from the choices below to compare design options and performance. At least one item from each parameter must be selected. Multiple items fromeach parameter can be selected.
THE BUILDING
Window Area
10%
20%
30%
40%
50%
60%

Façade Design Tool User’s Guide 6© 2012 Regents of the University of Minnesota, Center for Sustainable Building Research
3. View results from the previously chosen parametrics. The Summary tab is the default and when highlighted a summary of results is displayed. The Dashboard (on the left side of the screen) shows the previously selected parametrics. The features, information, and operation of this page of results are described in the next section, “Navigating through Refine & Explore Results.”
Navigating through REFINE & EXPLORE Results
This section describes the many features and information provided on the REFINE & EXPLORE results page including:
• Tabs of Performance Outcomes• Definitions and Modeling Assumptions• Sorting Capabilities• The Dashboard to Modify and Update Results• Switch to COMPARE RESULTS
REFINE &EXPLORE
Modify design
parameters &
explore the
results.
COMPARERESULTS
Select up to 5
scenarios for
detailed
comparison.
Update Results
Expand Collapse
Window Area
10%
20%
30%
40%
50%
60%
Projections
None
2' Overhang
4' Overhang
Lighting Controls
REFINE & EXPLORE ZONE RESULTS Facade Design Tool Home | Minneapolis, Minnesota | Office | South
The Building Glazing System Light & Shade Performance
WWRBuilding
Projections Glass Panes Features U-factor SHGC VT Lighting Controls Shades
30 None 2 Lowe-E, high VT, low SHGC, argon 0.24 0.27 0.64 Continuous None
30 None 3 Low-E, high VT, moderate SHGC, argon 0.13 0.32 0.6 Continuous None
30 None 3 Low-E, low VT, low SHGC, argon 0.12 0.21 0.34 Continuous None
30 None 2 Low-E tint, moderate VT, moderate SHGC, argon 0.24 0.29 0.52 Continuous None
30 None 2 Low-E, low VT, low SHGC, argon 0.25 0.24 0.37 Continuous None
30 None 2 Low-E, high VT, moderate SHGC, argon 0.24 0.38 0.7 Continuous None
30 None 2 Tint, moderate VT, moderate SHGC 0.47 0.5 0.48 Continuous None
30 None 2 Reflective, low VT, low SHGC 0.44 0.18 0.1 Continuous None
30 None 2 Clear, applied film 0.47 0.55 0.54 Continuous None
30 None 1 Clear, applied film 0.99 0.48 0.6 Continuous None
30 None 2 Clear, high VT, high SHGC 0.47 0.7 0.79 Continuous None
30 None 1 Clear, high VT, high SHGC 1.03 0.82 0.88 Continuous None
Pages (25 results per page): 1
Total Matching Records: 12
Summary Energy Peak Carbon Daylight Glare Comfort

Façade Design Tool User’s Guide 7© 2012 Regents of the University of Minnesota, Center for Sustainable Building Research
REFINE &EXPLORE
Modify design
parameters &
explore the
results.
COMPARERESULTS
Select up to 5
scenarios for
detailed
comparison.
REFINE & EXPLORE ZONE RESULTS Facade Design Tool Home | Minneapolis, Minnesota | Office | South
The Building Glazing System Light & Shade Annual Energy Use (kBtu/sf-yr)
WWRBuilding
Projections Glass Panes U-factor SHGC VT Lighting Controls Shades kBtu/sf-yr
30 None 2 0.24 0.27 0.64 Continuous None 69.38
30 None 3 0.13 0.32 0.6 Continuous None 70.63
30 None 3 0.12 0.21 0.34 Continuous None 70.95
Summary Energy Peak Carbon Daylight Glare Comfort
Tabs of Performance OutcomesClick the tabs Summary, Energy, Peak, Carbon, Daylight, Glare and Comfort to switch to the performance results and information of each tab. When clicking a tab, the default ranking of the scenarios is from best performer to worst. The Summary tab is the default.
Definitions and Modeling AssumptionsClick on the headings The Building, Glazing System, Light & Shade, and the specific performance for the current tab (ie: Annual Energy Use (kBtu/sf-yr) to display a pop-up window that provides the definitions, modeling assumptions, and other relevant information for that particular item. This pop-up window displays in front of the current screen. Click the X in the upper right corner to remove the pop-up window.
REFINE &EXPLORE
Modify design
parameters &
explore the
results.
COMPARERESULTS
Select up to 5
scenarios for
detailed
comparison.
REFINE & EXPLORE ZONE RESULTS Facade Design Tool Home | Minneapolis, Minnesota | Office | South
The Building Glazing System Light & Shade Annual Energy Use (kBtu/sf-yr)
WWRBuilding
Projections Glass Panes U-factor SHGC VT Lighting Controls Shades kBtu/sf-yr
30 None 2 0.24 0.27 0.64 Continuous None 69.38
30 None 3 0.13 0.32 0.6 Continuous None 70.63
30 None 3 0.12 0.21 0.34 Continuous None 70.95
Summary Energy Peak Carbon Daylight Glare Comfort
REFINE &EXPLORE
Modify design
parameters &
explore the
results.
COMPARERESULTS
Select up to 5
scenarios for
detailed
comparison.
Update Results
Expand Collapse
Window Area
10%
20%
30%
40%
50%
60%
Projections
None
2' Overhang
4' Overhang
REFINE & EXPLORE ZONE RESULTS Facade Design Tool Home | Minneapolis, Minnesota | Office | South
The Building Glazing System Light & Shade Annual Energy Use (kBtu/sf-yr)
WWRBuilding
Projections Glass Panes U-factor SHGC VT Lighting Controls Shades kBtu/sf-yr
30 None 2 0.24 0.27 0.64 Continuous None 69.38
30 None 3 0.13 0.32 0.6 Continuous None 70.63
30 None 3 0.12 0.21 0.34 Continuous None 70.95
30 None 2 0.24 0.29 0.52 Continuous None 70.96
30 None 2 0.25 0.24 0.37 Continuous None 72.41
30 None 2 0.24 0.38 0.7 Continuous None 75.12
30 None 2 0.47 0.5 0.48 Continuous None 84.73
30 None 2 0.44 0.18 0.1 Continuous None 86.82
30 None 2 0.47 0.55 0.54 Continuous None 89.17
30 None 1 0.99 0.48 0.6 Continuous None 96.21
30 None 2 0.47 0.7 0.79 Continuous None 97.11
30 None 1 1.03 0.82 0.88 Continuous None 113.48
Pages (25 results per page): 1
Total Matching Records: 12
Summary Energy Peak Carbon Daylight Glare ComfortGlazing System
There are hundreds of glazing systems available in the market today, with varying combinations of glasspanes, special coatings, and tints. The Facade Design Tool models the performance of 10 glazing systems and2 retrofit films, representative of the breadth of options available. The attributes of these glazing systems aredescribed in the table and chart below. For ease of comparing the performance of glass features, all high-performance glazing systems in the Facade Design Tool are modeled with an argon fill. In general, energyperformance from similar windows with an air fill will be about 2–5% poorer.
Aluminum frames were used in all of the simulations. Single-layered systems use a non-thermal frame,double-layered systems use a thermally broken frame, and triple-layered systems use a high performanceframe. See the table below for the U-factors of these frames.
Products Simulated Center of Glass 2.5" Alum Frame Whole Window*
Panes Description U-factor
SHGC Tvis Type U-factor U-factor SHGC Tvis
1 Clear, high VT, high SHGC 1.03 0.82 0.88 Non-thermal 1.00 0.99 0.72 0.74
2 Clear, high VT, high SHGC 0.47 0.70 0.79 Thermally-broken 0.85 0.55 0.61 0.64
2 Tint, moderate VT, moderate SHGC 0.47 0.50 0.48 Thermally-broken 0.85 0.55 0.45 0.39
2 Reflective, low VT, low SHGC 0.44 0.18 0.10 Thermally-broken 0.85 0.53 0.18 0.08
2 Low-E tint, moderate VT, moderate SHGC,argon
0.24 0.29 0.52 Thermally-broken 0.85 0.39 0.27 0.43

Façade Design Tool User’s Guide 8© 2012 Regents of the University of Minnesota, Center for Sustainable Building Research
Sorting CapabilitiesClick the headings WWR, Building Projections, Glass, Panes, U-factor, SHGC, VT, Lighting Controls, Shades, and the specific performance for the current tab (kBtur/sf-yr) will sort that particular selected item in descending order. Click on the heading again and it will sort in ascending order.
REFINE &EXPLORE
Modify design
parameters &
explore the
results.
COMPARERESULTS
Select up to 5
scenarios for
detailed
comparison.
REFINE & EXPLORE ZONE RESULTS Facade Design Tool Home | Minneapolis, Minnesota | Office | South
The Building Glazing System Light & Shade Annual Energy Use (kBtu/sf-yr)
WWRBuilding
Projections Glass Panes U-factor SHGC VT Lighting Controls Shades kBtu/sf-yr
30 None 2 0.24 0.27 0.64 Continuous None 69.38
30 None 3 0.13 0.32 0.6 Continuous None 70.63
30 None 3 0.12 0.21 0.34 Continuous None 70.95
Summary Energy Peak Carbon Daylight Glare Comfort
REFINE &EXPLORE
Modify design
parameters &
explore the
results.
COMPARERESULTS
Select up to 5
scenarios for
detailed
comparison.
Update Results
Expand Collapse
Window Area
10%
20%
30%
40%
50%
60%
Projections
None
REFINE & EXPLORE ZONE RESULTS Facade Design Tool Home | Minneapolis, Minnesota | Office | South
The Building Glazing System Light & Shade Annual Energy Use (kBtu/sf-yr)
WWRBuilding
Projections Glass Panes U-factor SHGC VT Lighting Controls Shades kBtu/sf-yr
30 None 1 1.03 0.82 0.88 Continuous None 113.48
30 None 1 0.99 0.48 0.6 Continuous None 96.21
30 None 2 0.47 0.7 0.79 Continuous None 97.11
30 None 2 0.47 0.5 0.48 Continuous None 84.73
30 None 2 0.47 0.55 0.54 Continuous None 89.17
30 None 2 0.44 0.18 0.1 Continuous None 86.82
30 None 2 0.25 0.24 0.37 Continuous None 72.41
30 None 2 0.24 0.38 0.7 Continuous None 75.12
30 None 2 0.24 0.29 0.52 Continuous None 70.96
30 None 2 0.24 0.27 0.64 Continuous None 69.38
30 None 3 0.13 0.32 0.6 Continuous None 70.63
30 None 3 0.12 0.21 0.34 Continuous None 70.95
Summary Energy Peak Carbon Daylight Glare Comfort
REFINE &EXPLORE
Modify design
parameters &
explore the
results.
COMPARERESULTS
Select up to 5
scenarios for
detailed
comparison.
Update Results
Expand Collapse
Window Area
10%
20%
30%
40%
50%
60%
Projections
None
REFINE & EXPLORE ZONE RESULTS Facade Design Tool Home | Minneapolis, Minnesota | Office | South
The Building Glazing System Light & Shade Annual Energy Use (kBtu/sf-yr)
WWRBuilding
Projections Glass Panes U-factor SHGC VT Lighting Controls Shades kBtu/sf-yr
30 None 3 0.12 0.21 0.34 Continuous None 70.95
30 None 3 0.13 0.32 0.6 Continuous None 70.63
30 None 2 0.24 0.27 0.64 Continuous None 69.38
30 None 2 0.24 0.29 0.52 Continuous None 70.96
30 None 2 0.24 0.38 0.7 Continuous None 75.12
30 None 2 0.25 0.24 0.37 Continuous None 72.41
30 None 2 0.44 0.18 0.1 Continuous None 86.82
30 None 2 0.47 0.55 0.54 Continuous None 89.17
30 None 2 0.47 0.5 0.48 Continuous None 84.73
30 None 2 0.47 0.7 0.79 Continuous None 97.11
30 None 1 0.99 0.48 0.6 Continuous None 96.21
30 None 1 1.03 0.82 0.88 Continuous None 113.48
Summary Energy Peak Carbon Daylight Glare Comfort

Façade Design Tool User’s Guide 9© 2012 Regents of the University of Minnesota, Center for Sustainable Building Research
The Dashboard to Modify and Update Results
The Dashboard is a powerful tool for sorting and refining various design choices. You can use the Dashboard to explore the impact of:
• Window Area• Exterior Projections• Lighting Controls• Shading • Glass Attributes
You can check and uncheck the desired parameters. You must choose Update Results to see the changes made in the Dashboard. The results will be displayed according to the selections made in the Dashboard.
The sections of the Dashboard with the design parameters can be expanded and collapsed. Click Expand to expand the entire Dashboard. Click Collapse to collapse the entire Dashboard. Click the + or – signs next to each design parameter to expand or collapse that particular item.
You can click Export to CSV to export the displayed results in comma separated value (CSV) format.
REFINE &EXPLORE
Modify design
parameters &
explore the
results.
COMPARERESULTS
Select up to 5
scenarios for
detailed
comparison.
Update Results
Expand Collapse
Window Area
10%
20%
30%
40%
50%
60%
Projections
None
2' Overhang
4' Overhang
Lighting Controls
None
Continuous Dimming
Shading
None
Interior Blinds
Exterior Blinds
Glass Panes
1
2
3
Glass
Clear
Low-E
Tint
Reflective
Film
SHGC
Low
Moderate
High
VT
Low
Moderate
High
SAVE RESULTSExport all data in tab delimited
format.
Export to CSV
REFINE &EXPLORE
Modify design
parameters &
explore the
results.
COMPARERESULTS
Select up to 5
scenarios for
detailed
comparison.
Update Results
Expand Collapse
SAVE RESULTSExport all data in tab delimited
format.
Export to CSV
REFINE &EXPLORE
Modify design
parameters &
explore the
results.
COMPARERESULTS
Select up to 5
scenarios for
detailed
comparison.
Update Results
Expand Collapse
Window Area
Projections
Lighting Controls
Shading
Glass Panes
Glass
Clear
Low-E
Tint
Reflective
Film
SHGC
Low
Moderate
High
VT
Low
Moderate
High

Façade Design Tool User’s Guide 10© 2012 Regents of the University of Minnesota, Center for Sustainable Building Research
REFINE &EXPLORE
Modify design
parameters &
explore the
results.
COMPARERESULTS
Select up to 5
scenarios for
detailed
comparison.
Update Results
Expand Collapse
Window Area
10%
20%
30%
COMPARERESULTS
Select up to 5 scenarios for
detailed comparison.
Compare
SAVE RESULTSExport all data in tab delimited
format.
Export to CSV
COMPARERESULTS
Select up to 5 scenarios for
detailed comparison.
Compare
SAVE RESULTSExport all data in tab delimited
format.
Export to CSV
COMPARE ZONE RESULTS Facade Design Tool Home | Minneapolis, Minnesota | Office | South
The Building Glazing System Light & Shade PerformanceSelect 5
toCompare WWR
BuildingProjections Glass Panes Features U-value SHGC VT
LightingControls Shades
30 None 2 Lowe-E, high VT, low SHGC, argon 0.24 0.27 0.64 Continuous None
30 None 3 Low-E, high VT, moderate SHGC, argon 0.13 0.32 0.6 Continuous None
30 None 3 Low-E, low VT, low SHGC, argon 0.12 0.21 0.34 Continuous None
30 None 2 Low-E tint, moderate VT, moderate SHGC, argon 0.24 0.29 0.52 Continuous None
30 None 2 Low-E, low VT, low SHGC, argon 0.25 0.24 0.37 Continuous None
30 None 2 Low-E, high VT, moderate SHGC, argon 0.24 0.38 0.7 Continuous None
30 None 2 Tint, moderate VT, moderate SHGC 0.47 0.5 0.48 Continuous None
30 None 2 Reflective, low VT, low SHGC 0.44 0.18 0.1 Continuous None
30 None 2 Clear, applied film 0.47 0.55 0.54 Continuous None
30 None 1 Clear, applied film 0.99 0.48 0.6 Continuous None
30 None 2 Clear, high VT, high SHGC 0.47 0.7 0.79 Continuous None
30 None 1 Clear, high VT, high SHGC 1.03 0.82 0.88 Continuous None
Pages (25 results per page): 1
Total Matching Records: 12
Summary Energy Peak Carbon Daylight Glare Comfort
Switch From REFINE & EXPLORE to COMPARE RESULTSAfter refining and exploring results, you can then select 5 scenarios to compare performance.
Switch to COMPARE RESULTS: Step-by-Step
1. While in Refine & Explore, click the dimmed COMPARE RESULTS at the top of the Dashboard. The Dashboard will switch to display COMPARE RESULTS and SAVE RESULTS.
2. The screen refreshes and checkboxes appear on the left side of the results. You can check up to 5 design scenarios in which to see comparisons. After selecting the scenarios to compare, choose Compare to see the comparative results.

Façade Design Tool User’s Guide 11© 2012 Regents of the University of Minnesota, Center for Sustainable Building Research
3. The 5 selected scenarios are displayed. Note that the format of the results change to show comparative performance for Annual Energy, Peak Demand, Carbon, Daylight Illuminance, Thermal Comfort, and Glare Index.
4. You can modify the results by selecting the options in the dropdown menus and changing the attributes for the scenarios. Choose Modify to see the updated results.
COMPARERESULTS
Select up to 5 scenarios for
detailed comparison.
Modify
SAVE RESULTSExport all data in tab delimited
format.
Export to CSV
COMPARE ZONE RESULTS Facade Design Tool Home | Minneapolis, Minnesota | Office | South
The Building Glazing System Light & Shade
ScenarioZone
Orientation WWRBuilding
Projections Glass Lighting Controls Shades
1 South 30% None H: Double low-E, high VT, low SHGC Cont. Dimming No Shades
2 South 30% None J: Triple lowe-E, low VT, low SHGC Cont. Dimming No Shades
3 South 30% None F: Double lowe-E, low VT, low SHGC Cont. Dimming No Shades
4 South 30% None G: Double low-E, high VT, mod SHGC Cont. Dimming No Shades
5 South 30% None D: Double reflective, low VT, low SHGC Cont. Dimming No Shades
Scenario Annual Energy (lower is better) kBty/sf-yr
1 69.38
2 70.95
3 72.41
4 75.12
5 86.82
Scenario Peak Demand (lower is better) W/sf
1 4.27
2 4.40
3 4.42
4 4.47
5 4.59
Scenario Carbon (lower is better) lbs/sf-yr
1 9.67
2 9.92
3 10.07
4 10.52
5 11.93
Scenario Daylight Illuminance (higher is better) FC
1 66.17
2 34.43
3 37.92
4 72.89
5 9.98
Scenario Thermal Comfort (higher is better) PPS
1 86.73
2 87.84
3 85.88
4 87.76
5 80.56
Scenario Glare Index (lower index is better) Index
1 0.00
2 0.00
3 0.00
4 0.00
5 0.00
COMPARERESULTS
Select up to 5 scenarios for
detailed comparison.
Modify
SAVE RESULTSExport all data in tab delimited
COMPARE ZONE RESULTS Facade Design Tool Home | Minneapolis, Minnesota | Office | South
The Building Glazing System Light & Shade
ScenarioZone
Orientation WWRBuilding
Projections Glass Lighting Controls Shades
1 West 30% None H: Double low-E, high VT, low SHGC Cont. Dimming No Shades
2 West 30% None J: Triple lowe-E, low VT, low SHGC Cont. Dimming No Shades
3 West 30% None F: Double lowe-E, low VT, low SHGC Cont. Dimming No Shades
4 West 30% None G: Double low-E, high VT, mod SHGC Cont. Dimming No Shades
5 West 30% None D: Double reflective, low VT, low SHGC Cont. Dimming No Shades
Scenario Annual Energy (lower is better) kBty/sf-yr
1 69.38
Scenario Peak Demand (lower is better) W/sf
1 4.27

Façade Design Tool User’s Guide 12© 2012 Regents of the University of Minnesota, Center for Sustainable Building Research
5. The modified results are displayed. You can continue to do additional modifications, export the data in CSV format, or print the page. Similar to the Rank & Explore method, clicking the titles of The Building, Glazing System, Light & Shade, Annual Energy, Peak Demand, Carbon, Daylight Illuminance, Thermal Comfort, and Glare Index will display a pop-up window that provides the definitions, modeling assumptions, and other relevant information for that particular item.
COMPARERESULTS
Select up to 5 scenarios for
detailed comparison.
Modify
SAVE RESULTSExport all data in tab delimited
format.
Export to CSV
COMPARE ZONE RESULTS Facade Design Tool Home | Minneapolis, Minnesota | Office | South
The Building Glazing System Light & Shade
ScenarioZone
Orientation WWRBuilding
Projections Glass Lighting Controls Shades
1 West 30% None H: Double low-E, high VT, low SHGC Cont. Dimming No Shades
2 West 30% None J: Triple lowe-E, low VT, low SHGC Cont. Dimming No Shades
3 West 30% None F: Double lowe-E, low VT, low SHGC Cont. Dimming No Shades
4 West 30% None G: Double low-E, high VT, mod SHGC Cont. Dimming No Shades
5 West 30% None D: Double reflective, low VT, low SHGC Cont. Dimming No Shades
Scenario Annual Energy (lower is better) kBty/sf-yr
1 83.17
2 79.40
3 84.50
4 92.76
5 93.43
Scenario Peak Demand (lower is better) W/sf
1 4.79
2 4.37
3 4.59
4 5.40
5 4.76
Scenario Carbon (lower is better) lbs/sf-yr
1 11.54
2 11.07
3 11.71
4 12.94
5 12.81
Scenario Daylight Illuminance (higher is better) FC
1 53.25
2 27.83
3 30.59
4 58.65
5 8.04
Scenario Thermal Comfort (higher is better) PPS
1 84.80
2 86.32
3 84.25
4 85.39
5 79.64
Scenario Glare Index (lower index is better) Index
1 0.00
2 0.00
3 0.00
4 0.00
5 0.00

Façade Design Tool User’s Guide 13© 2012 Regents of the University of Minnesota, Center for Sustainable Building Research
COMPARE 5 SCENARIOSFrom the first input screen where location, building type and orientation is defined, use the COMPARE 5 SCENARIOS method if the design parameters are already known, or if you want to compare results between orientations. Use this comparison method if many of the design parametrics (window area, shading, glass type, lighting controls) are previously determined.
COMPARE 5 SCENARIOS: Step-by-Step
1. Choose COMPARE 5 SCENARIOS from the first input screen. Choose all the attributes for the 5 scenarios in which to compare.
COMPARERESULTS
Select up to 5 scenarios for
detailed comparison.
Compare
SAVE RESULTSExport all data in tab delimited
format.
Export to CSV
COMPARE ZONE RESULTS Facade Design Tool Home | Minneapolis, Minnesota | Office | South
The Building Glazing System Light & Shade
ScenarioZone
Orientation WWRBuilding
Projections Glass Lighting Controls Shades
1 South - - - - -
2 South - - - - -
3 South - - - - -
4 South - - - - -
5 South - - - - -
How to Perform a Comparison
1. Choose the design conditions for each of the 5 scenarios in which to compare.2. If you need more information regarding the design conditions, click on the headers for each attribute.3. Click the "Compare" button found in the dashboard to the left to see the comparative results for annual energy, peak demand, carbon, daylight
illuminance, glare, and thermal comfort.4. Once the results are displayed, you can modify the design condition attributes and click the "Modify Scenarios" button in the dashboard to view the
modifications.

Façade Design Tool User’s Guide 14© 2012 Regents of the University of Minnesota, Center for Sustainable Building Research
COMPARERESULTS
Select up to 5 scenarios for
detailed comparison.
Compare
SAVE RESULTSExport all data in tab delimited
format.
Export to CSV
COMPARE ZONE RESULTS Facade Design Tool Home | Minneapolis, Minnesota | Office | South
The Building Glazing System Light & Shade
ScenarioZone
Orientation WWRBuilding
Projections Glass Lighting Controls Shades
1 South 20% None G: Double low-E, high VT, mod SHGC No Controls No Shades
2 South 30% None G: Double low-E, high VT, mod SHGC No Controls No Shades
3 South 40% None G: Double low-E, high VT, mod SHGC No Controls No Shades
4 South 50% None G: Double low-E, high VT, mod SHGC No Controls No Shades
5 South 60% None G: Double low-E, high VT, mod SHGC No Controls No Shades
How to Perform a Comparison
1. Choose the design conditions for each of the 5 scenarios in which to compare.2. If you need more information regarding the design conditions, click on the headers for each attribute.3. Click the "Compare" button found in the dashboard to the left to see the comparative results for annual energy, peak demand, carbon, daylight
illuminance, glare, and thermal comfort.4. Once the results are displayed, you can modify the design condition attributes and click the "Modify Scenarios" button in the dashboard to view the
modifications.
COMPARERESULTS
Select up to 5 scenarios for
detailed comparison.
Modify
SAVE RESULTSExport all data in tab delimited
format.
Export to CSV
COMPARE ZONE RESULTS Facade Design Tool Home | Minneapolis, Minnesota | Office | South
The Building Glazing System Light & Shade
ScenarioZone
Orientation WWRBuilding
Projections Glass Lighting Controls Shades
1 South 20% None G: Double low-E, high VT, mod SHGC No Controls No Shades
2 South 30% None G: Double low-E, high VT, mod SHGC No Controls No Shades
3 South 40% None G: Double low-E, high VT, mod SHGC No Controls No Shades
4 South 50% None G: Double low-E, high VT, mod SHGC No Controls No Shades
5 South 60% None G: Double low-E, high VT, mod SHGC No Controls No Shades
Scenario Annual Energy (lower is better) kBty/sf-yr
1 90.64
2 102.04
3 110.57
4 117.20
5 128.69
Scenario Peak Demand (lower is better) W/sf
1 4.77
2 5.25
3 5.57
4 5.84
5 6.22
Scenario Carbon (lower is better) lbs/sf-yr
1 12.74
2 14.37
3 15.57
4 16.48
5 18.11
Scenario Daylight Illuminance (higher is better) FC
1 37.44
2 72.89
3 81.53
4 74.14
5 97.17
Scenario Thermal Comfort (higher is better) PPS
1 88.42
2 88.49
3 88.05
4 87.32
5 87.08
Scenario Glare Index (lower index is better) Index
1 0.00
2 0.00
3 0.00
4 0.00
5 5.65
2. After all the attributes for Zone Orientation, WWR, Building Projections, Glass, Lighting Controls, and Shades are selected, choose Compare to get the comparative results.
3. The comparative results are displayed.

Façade Design Tool User’s Guide 15© 2012 Regents of the University of Minnesota, Center for Sustainable Building Research
4. To continue to perform comparisons, change the attributes in the dropdown menus and choose Modify.
5. The comparative results are displayed as per the modified attributes. You can continue to do additional modifications, export the data in CSV format, or print the page.
COMPARERESULTS
Select up to 5 scenarios for
detailed comparison.
Modify
SAVE RESULTSExport all data in tab delimited
COMPARE ZONE RESULTS Facade Design Tool Home | Minneapolis, Minnesota | Office | South
The Building Glazing System Light & Shade
ScenarioZone
Orientation WWRBuilding
Projections Glass Lighting Controls Shades
1 West 20% None G: Double low-E, high VT, mod SHGC No Controls No Shades
2 West 30% None G: Double low-E, high VT, mod SHGC No Controls No Shades
3 West 40% None G: Double low-E, high VT, mod SHGC No Controls No Shades
4 West 50% None G: Double low-E, high VT, mod SHGC No Controls No Shades
5 West 60% None G: Double low-E, high VT, mod SHGC No Controls No Shades
Scenario Annual Energy (lower is better) kBty/sf-yr
1 90.64
Scenario Peak Demand (lower is better) W/sf
1 4.77
COMPARERESULTS
Select up to 5 scenarios for
detailed comparison.
Modify
SAVE RESULTSExport all data in tab delimited
format.
Export to CSV
COMPARE ZONE RESULTS Facade Design Tool Home | Minneapolis, Minnesota | Office | South
The Building Glazing System Light & Shade
ScenarioZone
Orientation WWRBuilding
Projections Glass Lighting Controls Shades
1 West 20% None G: Double low-E, high VT, mod SHGC No Controls No Shades
2 West 30% None G: Double low-E, high VT, mod SHGC No Controls No Shades
3 West 40% None G: Double low-E, high VT, mod SHGC No Controls No Shades
4 West 50% None G: Double low-E, high VT, mod SHGC No Controls No Shades
5 West 60% None G: Double low-E, high VT, mod SHGC No Controls No Shades
Scenario Annual Energy (lower is better) kBty/sf-yr
1 101.82
2 117.67
3 130.97
4 142.67
5 159.06
Scenario Peak Demand (lower is better) W/sf
1 5.67
2 6.53
3 7.24
4 7.84
5 8.71
Scenario Carbon (lower is better) lbs/sf-yr
1 14.26
2 16.51
3 18.37
4 20.00
5 22.32
Scenario Daylight Illuminance (higher is better) FC
1 32.32
2 58.65
3 64.01
4 62.11
5 74.17
Scenario Thermal Comfort (higher is better) PPS
1 86.62
2 86.20
3 85.36
4 84.45
5 83.97
Scenario Glare Index (lower index is better) Index
1 0.00
2 0.00
3 0.00
4 0.00
5 5.54
Façade Design Tool User’s Guide 16© 2012 Regents of the University of Minnesota, Center for Sustainable Building Research
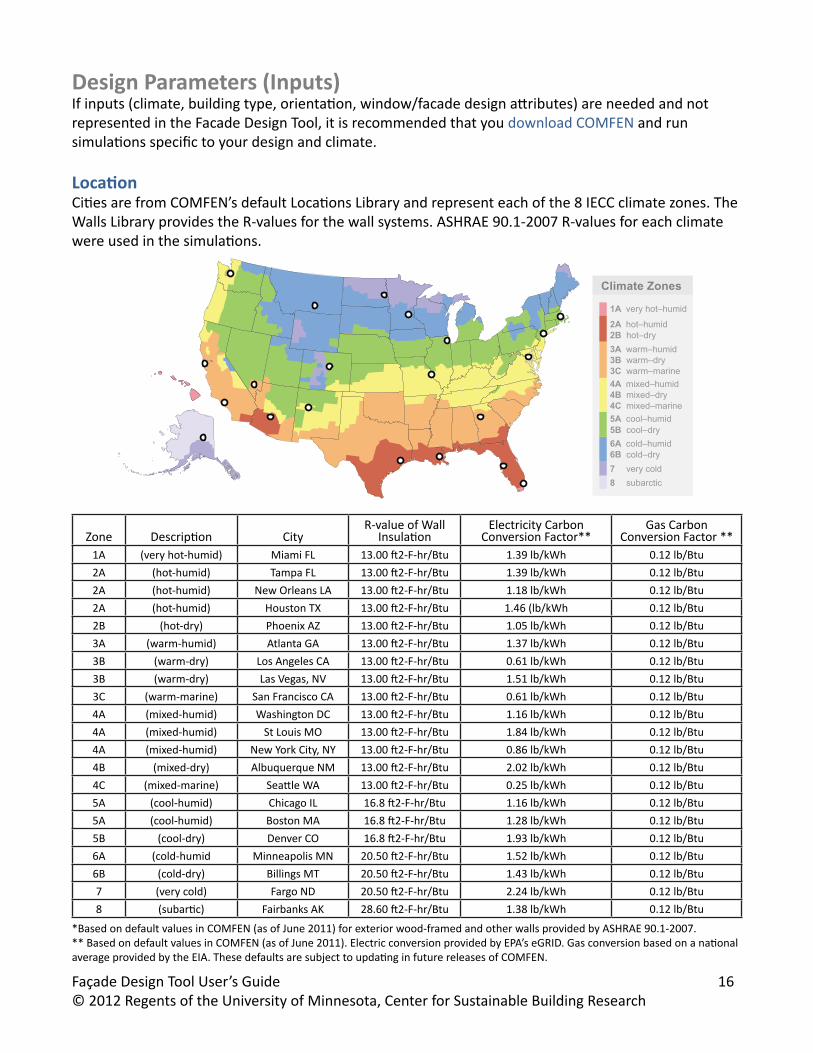
Design Parameters (Inputs)If inputs (climate, building type, orientation, window/facade design attributes) are needed and not represented in the Facade Design Tool, it is recommended that you download COMFEN and run simulations specific to your design and climate.
LocationCities are from COMFEN’s default Locations Library and represent each of the 8 IECC climate zones. The Walls Library provides the R-values for the wall systems. ASHRAE 90.1-2007 R-values for each climate were used in the simulations.
Zone Description CityR-value of Wall
InsulationElectricity Carbon
Conversion Factor**Gas Carbon
Conversion Factor **1A (very hot-humid) Miami FL 13.00 ft2-F-hr/Btu 1.39 lb/kWh 0.12 lb/Btu2A (hot-humid) Tampa FL 13.00 ft2-F-hr/Btu 1.39 lb/kWh 0.12 lb/Btu2A (hot-humid) New Orleans LA 13.00 ft2-F-hr/Btu 1.18 lb/kWh 0.12 lb/Btu2A (hot-humid) Houston TX 13.00 ft2-F-hr/Btu 1.46 (lb/kWh 0.12 lb/Btu2B (hot-dry) Phoenix AZ 13.00 ft2-F-hr/Btu 1.05 lb/kWh 0.12 lb/Btu3A (warm-humid) Atlanta GA 13.00 ft2-F-hr/Btu 1.37 lb/kWh 0.12 lb/Btu3B (warm-dry) Los Angeles CA 13.00 ft2-F-hr/Btu 0.61 lb/kWh 0.12 lb/Btu3B (warm-dry) Las Vegas, NV 13.00 ft2-F-hr/Btu 1.51 lb/kWh 0.12 lb/Btu3C (warm-marine) San Francisco CA 13.00 ft2-F-hr/Btu 0.61 lb/kWh 0.12 lb/Btu4A (mixed-humid) Washington DC 13.00 ft2-F-hr/Btu 1.16 lb/kWh 0.12 lb/Btu4A (mixed-humid) St Louis MO 13.00 ft2-F-hr/Btu 1.84 lb/kWh 0.12 lb/Btu4A (mixed-humid) New York City, NY 13.00 ft2-F-hr/Btu 0.86 lb/kWh 0.12 lb/Btu4B (mixed-dry) Albuquerque NM 13.00 ft2-F-hr/Btu 2.02 lb/kWh 0.12 lb/Btu4C (mixed-marine) Seattle WA 13.00 ft2-F-hr/Btu 0.25 lb/kWh 0.12 lb/Btu5A (cool-humid) Chicago IL 16.8 ft2-F-hr/Btu 1.16 lb/kWh 0.12 lb/Btu5A (cool-humid) Boston MA 16.8 ft2-F-hr/Btu 1.28 lb/kWh 0.12 lb/Btu5B (cool-dry) Denver CO 16.8 ft2-F-hr/Btu 1.93 lb/kWh 0.12 lb/Btu6A (cold-humid Minneapolis MN 20.50 ft2-F-hr/Btu 1.52 lb/kWh 0.12 lb/Btu6B (cold-dry) Billings MT 20.50 ft2-F-hr/Btu 1.43 lb/kWh 0.12 lb/Btu7 (very cold) Fargo ND 20.50 ft2-F-hr/Btu 2.24 lb/kWh 0.12 lb/Btu8 (subartic) Fairbanks AK 28.60 ft2-F-hr/Btu 1.38 lb/kWh 0.12 lb/Btu
*Based on default values in COMFEN (as of June 2011) for exterior wood-framed and other walls provided by ASHRAE 90.1-2007. ** Based on default values in COMFEN (as of June 2011). Electric conversion provided by EPA’s eGRID. Gas conversion based on a national average provided by the EIA. These defaults are subject to updating in future releases of COMFEN.
Climate Zones
1A very hot–humid
2A hot–humid 2B hot–dry 3A warm–humid 3B warm–dry 3C warm–marine 4A mixed–humid 4B mixed–dry 4C mixed–marine 5A cool–humid 5B cool–dry 6A cold–humid 6B cold–dry 7 very cold 8 subarctic

Façade Design Tool User’s Guide 17© 2012 Regents of the University of Minnesota, Center for Sustainable Building Research
Facade OrientationOrientation of the façade’s perimeter zone is available in each of the four cardinal directions: north, east, south and west.
The Building/ZoneThe zone sizes and the loads for lighting, equipment, and people are based on DOE’s Commercial Reference Buildings (www1.eere.energy.gov/buildings/commercial_initiative/new_construction.html). Zone depths are limited to 15’ for all building types.
Building Type Zone width Zone depth
Floor-to-ceiling height
Floor-to-floor height
Lighting (W/ft2)
Equipment (W/ft2)
People (ft2/
people)
People INPUT
(people/zone)
Office 10’ 15’ 9’ 12’ 1 1 200 0.75
School 36’ 15’ 9’ 13’ 1.4 0.9 43.1 12.53
Office Zone School Zone
15’ 10’9’ floor-to-ceiling
12’ floor-to-floor 15’ 36’
9’ floor-to-ceiling
13’ floor-to-floor
N E S W
Façade Design Tool User’s Guide 18© 2012 Regents of the University of Minnesota, Center for Sustainable Building Research
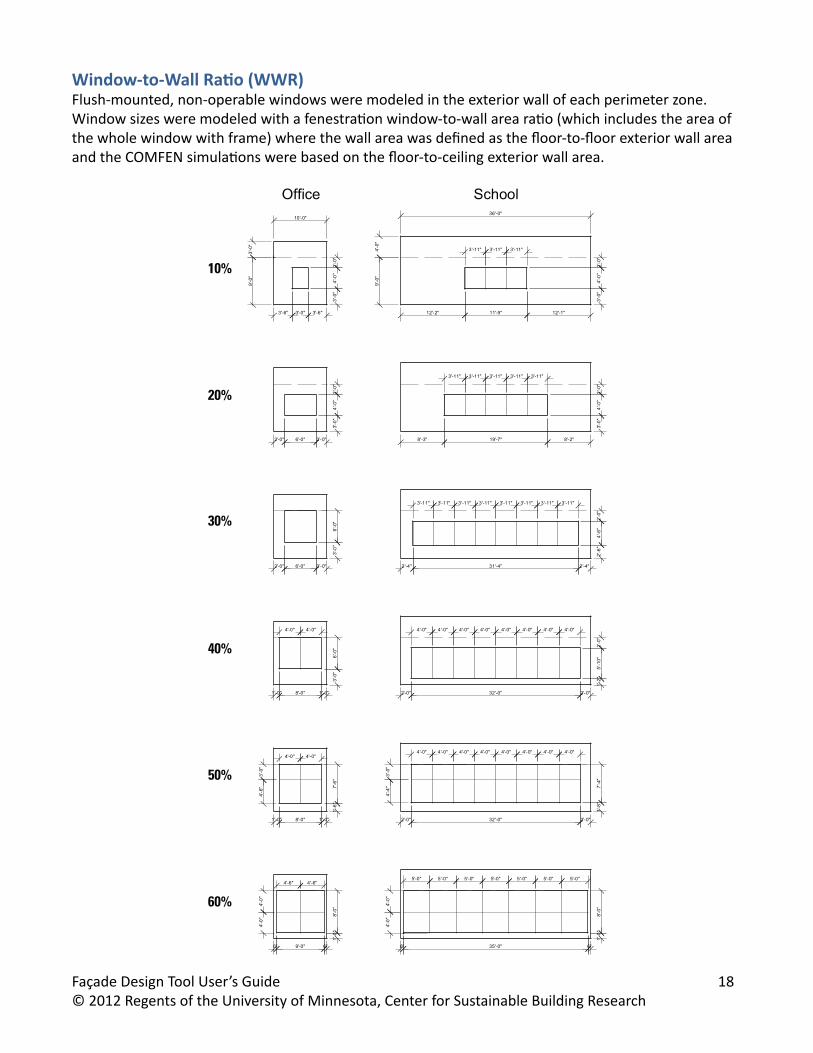
Window-to-Wall Ratio (WWR)Flush-mounted, non-operable windows were modeled in the exterior wall of each perimeter zone. Window sizes were modeled with a fenestration window-to-wall area ratio (which includes the area of the whole window with frame) where the wall area was defined as the floor-to-floor exterior wall area and the COMFEN simulations were based on the floor-to-ceiling exterior wall area.
20%
10%
30%
40%
50%
60%
SchoolOffice
9'-0
"3'
-0"
10'-0"
4'-0
"9'
-0"
3'-6"3'-0"3'-6"
2'-0
"4'
-0"
3'-0
"
2'-0"6'-0"2'-0"
2'-0
"4'
-0"
3'-0
"
2'-0"6'-0"2'-0"
6'-0
"3'
-0"
3'-0
"6'
-0"
1'-0" 8'-0" 1'-0"
4'-0"4'-0"
1'-0"8'-0"1'-0"
7'-6
"1'
-6"
4'-0"4'-0"
6"9'-0"6"
8'-0
"1'
-0"
4'-6"4'-6"
4'-0
"4'
-0"
36'-0"
3'-0
"4'
-0"
2'-0
"
12'-2" 11'-9" 12'-1"
3'-11" 3'-11" 3'-11"
3'-0
"4'
-0"
2'-0
"
8'-3" 19'-7" 8'-2"
3'-11" 3'-11" 3'-11" 3'-11" 3'-11"
2'-6
"4'
-6"
2'-0
"
2'-4" 31'-4" 2'-4"
3'-11"3'-11"3'-11"3'-11"3'-11"3'-11"3'-11"3'-11"
1'-2
"5'
-10"
2'-0
"
2'-0" 32'-0" 2'-0"
4'-0" 4'-0" 4'-0" 4'-0" 4'-0" 4'-0" 4'-0" 4'-0"
6" 35'-0" 6"
1'-0
"8'
-0"
5'-0" 5'-0" 5'-0" 5'-0" 5'-0" 5'-0" 5'-0"
4'-0
"4'
-0"
4'-6
"3'
-0"
1'-8
"7'
-4"
4'-4
"3'
-0"
2'-0" 32'-0" 2'-0"
4'-0" 4'-0" 4'-0" 4'-0" 4'-0" 4'-0" 4'-0" 4'-0"
Façade Design Tool User’s Guide 19© 2012 Regents of the University of Minnesota, Center for Sustainable Building Research
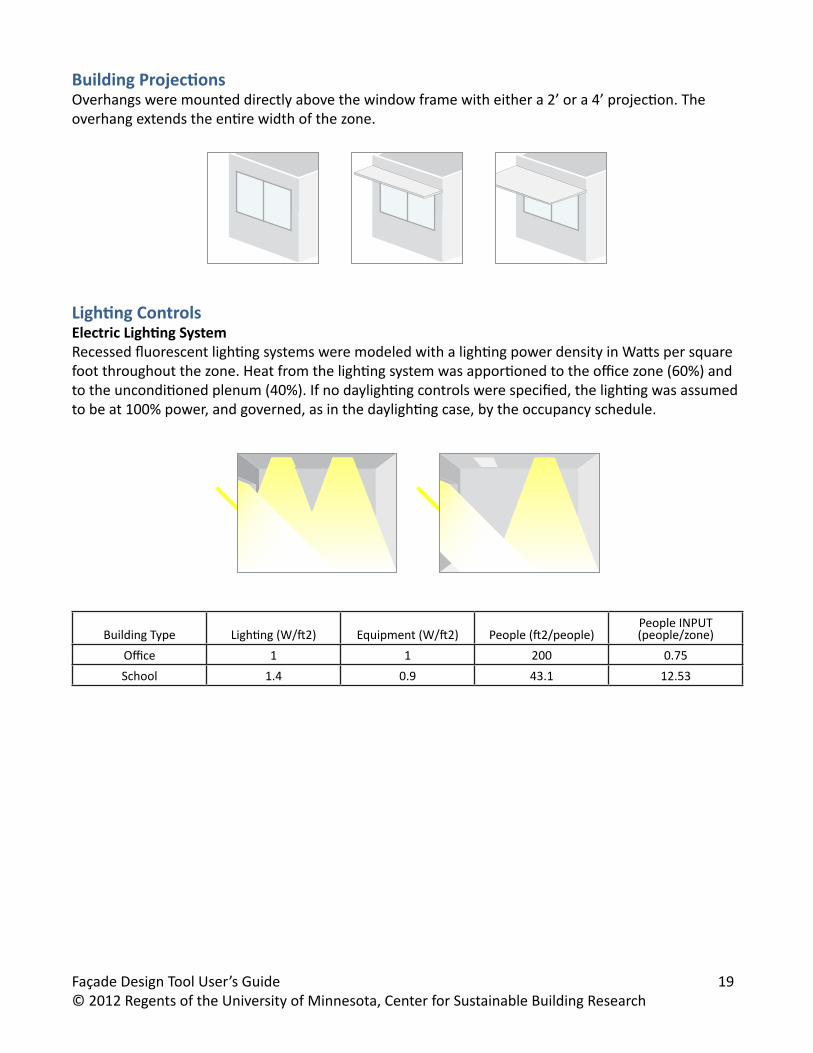
Building ProjectionsOverhangs were mounted directly above the window frame with either a 2’ or a 4’ projection. The overhang extends the entire width of the zone.
Lighting ControlsElectric Lighting SystemRecessed fluorescent lighting systems were modeled with a lighting power density in Watts per square foot throughout the zone. Heat from the lighting system was apportioned to the office zone (60%) and to the unconditioned plenum (40%). If no daylighting controls were specified, the lighting was assumed to be at 100% power, and governed, as in the daylighting case, by the occupancy schedule.
Building Type Lighting (W/ft2) Equipment (W/ft2) People (ft2/people)People INPUT (people/zone)
Office 1 1 200 0.75School 1.4 0.9 43.1 12.53

Façade Design Tool User’s Guide 20© 2012 Regents of the University of Minnesota, Center for Sustainable Building Research
Continuous Dimming Electric Lighting Controls ?For continuous dimming, the overhead lights dim continuously and linearly from (maximum electric power, maximum light output) to (minimum electric power, minimum light output) as the daylight illuminance increases. The lights stay on at the minimum point with further increase in the daylight illuminance. The lowest power the lighting system can dim down to is expressed as a fraction of maximum input power (figure from the EnergyPlus Input-Output Reference Guide).
ShadesInterior and exterior Venetian blinds were simulated so that the slats would be at 45-degrees and fixed in the “always on” state. Because the shades were always fully deployed, the results using shades in the Façade Design Tool may not represent results as expected because these types of shades are often occupant-operated or mechanically programmed to respond to heating and cooling conditions. The optical properties of the blinds were set to the default in COMFEN.

Façade Design Tool User’s Guide 21© 2012 Regents of the University of Minnesota, Center for Sustainable Building Research
Glazing SystemThe Facade Design Tool simulates the performance of 10 generic glazing systems and 2 retrofit films, representative of the breadth of options available in today’s market. For ease of comparing the performance of glass features, all high-performance glazing systems in the Facade Design Tool are modeled with an argon gas fill. In general, energy performance from similar windows with an air fill will be about 2–5% poorer.
Generic aluminum frames were used in all of the simulations. Single-pane systems use a non-thermally-broken frame, double-pane systems use a thermally-broken frame, and triple-pane systems use a high performance frame.
Products Simulated* Center of Glass 2.5” Alum Frame Whole Window**ID Panes Description U-factor SHGC VT Type U-factor U-factor SHGC VTA 1 Clear, high VT, high SHGC 1.03 0.82 0.88 Non-thermal 1.10 0.99 0.72 0.74B 2 Clear, high VT, high SHGC 0.47 0.70 0.79 Thermally-broken 0.85 0.55 0.61 0.64C 2 Tint, moderate VT,
moderate SHGC0.47 0.50 0.48 Thermally-broken 0.85 0.55 0.45 0.39
D 2 Reflective, low VT, low SHGC
0.44 0.18 0.10 Thermally-broken 0.85 0.53 0.18 0.08
E 2 Low-E tint, moderate VT, moderate SHGC, argon
0.24 0.29 0.52 Thermally-broken 0.85 0.39 0.27 0.43
F 2 Lowe-E, low VT, low SHGC, argon
0.25 0.24 0.37 Thermally-broken 0.85 0.39 0.23 0.30
G 2 Low-E, high VT, moderate SHGC, argon
0.24 0.38 0.70 Thermally-broken 0.85 0.39 0.35 0.57
H 2 Lowe-E, high VT, low SHGC, argon
0.24 0.27 0.64 Thermally-broken 0.85 0.38 0.26 0.52
I 3 Low-E, high VT, moderate SHGC, argon
0.13 0.32 0.60 High-performance
0.35 0.22 0.28 0.49
J 3 Lowe-E, low VT, low SHGC, argon
0.12 0.21 0.34 High-performance
0.35 0.21 0.19 0.28
K 1 Clear, applied film 0.99 0.48 0.60 Non-thermal 1.10 0.97 0.44 0.50L 2 Clear, applied film 0.47 0.55 0.54 Thermally-broken 0.85 0.55 0.48 0.44
*Glazing system performance information was generated using WINDOW6.**Whole window properties are based on an NFRC standard test size (1200mm x 1500mm) and simulated in WINDOW6 with frame specified per each glazing system.

Façade Design Tool User’s Guide 22© 2012 Regents of the University of Minnesota, Center for Sustainable Building Research
Performance Outcomes (Outputs)The Façade Design Tool provides performance results for annual energy, peak demand, and carbon emissions. The tool also provides the human-centered results for daylight, glare, and thermal comfort.
Annual EnergyIn the Façade Design Tool all annual energy performance data are given as energy use per perimeter zone floor area and is reported as source energy in Btu/sf-year. Annual energy is determined from heating, cooling, fans, and lighting. Equipment loads are not included.
The site-source factor that was used is 3.14 as defined in the 2010 Buildings Energy Data Book. The site-to-source multiplier determines whether energy use results are displayed in terms of site or source energy. Site energy is energy used by the building on site (as measured at the meter), while source energy is a measure that accounts for energy consumed on site as well as the energy consumed during the storage, transport and delivery of the fuel to the building. Source energy is a better indicator of building environmental impact.
Peak Electric DemandPeak electricity demand is the greatest amount of electricity required at one point in time during the year. A higher peak demand reflects both the likelihood of higher utility demand charges as well as the need for larger mechanical equipment. In the Façade Design Tool peak electric demand data are given for the peak condition that occurs in each perimeter zone and are non-coincident with the whole building’s peak condition. Peak demand data includes electricity end uses from cooling, fans, and lighting. Equipment loads are included.
CarbonThe total CO2impact was determined by adding electricity and gas emissions. The CO2 electricity and gas factors are set in COMFEN’s Locations Library. The CO2Electricity Factor is multiplied by the electric energy consumption to calculate the pounds of CO2 emitted due to electricity use (lbs/kWh). The values for the electricity factor were found at: www.epa.gov/cleanenergy/documents/egridzips/eGRID2010V1_1_year07_SummaryTables.pdf. The CO2 gas factor is multiplied by the gas energy consumption to calculate the pounds of CO2 emitted due to gas use (lbs/kBtu). The value for the gas factor is 0.12 lb/Btu for all locations and was determined from a national average found at: www.eia.doe.gov/oiaf/1605/coefficients.html.

Façade Design Tool User’s Guide 23© 2012 Regents of the University of Minnesota, Center for Sustainable Building Research
Daylight IlluminanceThe daylight illuminance set point is 50 footcandles. The design of a window and choice of glazing can dramatically affect the quantity and quality of daylight in a space and how it is experienced. Most visual tasks require from 30–70 footcandles. Larger windows with low-transmission glass can have the same average daylight illuminance as small windows with high-transmission glass. South-facing windows generally have higher daylight levels than north-, east-, and west-facing windows because of direct sun. Note that higher daylight levels due to direct sun may also result in unwanted glare.
Zone Depth: A primary daylight zone depth is calculated as the minimum of a) the room depth, b) 1.5 times the facade wall height, and c) 15 feet.
Sensor # 1: Daylight sensor #1 is positioned 2/3 of the primary daylight zone depth from facade wall, centered in the width of the facade zone. Sensor #1 controls a fraction of the facade zone lights equal to the primary daylight zone depth divided by the facade zone depth.
Sensor # 2: Any remaining depth in the facade zone is considered a secondary daylight zone. Reference Point #2 is positioned halfway between the primary daylight zone depth and the “back wall.” Sensor #2, if used, controls the remaining fraction of lights.
Sensor height: The daylight sensors are located 2.5 feet above the floor of each daylight zone
Similar to the Weighted Glare Index, the average annual Daylight Illuminance level does not reveal severe conditions that may occur at a specific time or day throughout the year. The Daylight Illuminance value varies considerably depending on orientation, the presence of shading devices, and other properties and design conditions
Front of facade
Sensor # 1
+ Centered between the left and right walls
Positioned 2/3 of zone depth from front of facade
Sensor # 2
Centered in the zone
+
Daylighting Zone # 1 depth – the minimum of a) the room depth, b) 1.5 times the facade wall height, and c) 15 feet.
Daylighting Zone # 2 depth –total depth minus the Zone # 1 depth.

Façade Design Tool User’s Guide 24© 2012 Regents of the University of Minnesota, Center for Sustainable Building Research
GlareThe Weighted Glare Index is calculated for a person facing the side wall. This glare index is based on a subjective response to brightness within one’s field of view. A lower index is better. Anything under 22 is acceptable for glare. A glare index under 7 denotes imperceptible glare. A glare index between 7 and 22 is perceptible, yet acceptable glare. A glare index above 22 is uncomfortable.
0-7 Imperceptible Glare7-10 Just Perceptible Glare
10-16 Just Acceptable Glare22+ Uncomfortable Glare
Zone Depth: A primary daylight zone depth is calculated as the minimum of a) the room depth, b) 1.5 times the facade wall height, and c) 15 feet.
Sensor # 1: Daylight sensor #1 is positioned 2/3 of the primary daylight zone depth from facade wall, centered in the width of the facade zone. Sensor #1 controls a fraction of the facade zone lights equal to the primary daylight zone depth divided by the facade zone depth.
Sensor # 2: Any remaining depth in the facade zone is considered a secondary daylight zone. Reference Point #2 is positioned halfway between the primary daylight zone depth and the “back wall.” Sensor #2, if used, controls the remaining fraction of lights.
Sensor height: The daylight sensors are located 2.5 feet above the floor of each daylight zone
Similar to Daylight Illuminance, the average annual Weighted Glare Index does not reveal severe glare problems that may occur at a specific time or day throughout the year. Because an annual average may be misleading, a weighted glare index was developed to emphasize the fairly infrequent periods of perceptible or uncomfortable glare that may occur. The Weighted Glare Index varies considerably depending on orientation, the presence of shading devices, and other properties and design conditions.
Front of facade
Sensor # 1
+ Centered between the left and right walls
Positioned 2/3 of zone depth from front of facade
Sensor # 2
Centered in the zone
+
Daylighting Zone # 1 depth – the minimum of a) the room depth, b) 1.5 times the facade wall height, and c) 15 feet.
Daylighting Zone # 2 depth –total depth minus the Zone # 1 depth.

Façade Design Tool User’s Guide 25© 2012 Regents of the University of Minnesota, Center for Sustainable Building Research
Thermal ComfortCOMFEN uses the Fanger method as implemented in EnergyPlus for thermal comfort calculations that takes into account all major modes of energy losses from the human body at a steady state condition. PPD is a quantitative measure of the thermal comfort of a group of people at a particular thermal environment. Fanger related the PPD to the PMV (Predicted Mean Vote), using the following formula:
PPD = 100.0 - 95.0e(-0.03353*PMV4 - 0.2179*PMV2)
where: PMV = (0.303e-0.036*M +0.028) * L M = metabolic rate L = thermal load defined as the difference between the internal heat production and the heat loss to the actual environment for a person hypothetically kept at comfort values of skin temperature and evaporative heat loss by sweating at the actual activity level.
The “Zone Averaged” method was used to calculate MRT (Mean Radiant Temperature) in the thermal comfort calculation. MRT is a measure of the combined effects of temperatures of surfaces within the space. Specifically it is the surface area * emissivity weighted average of the zone inside surface temperatures, where emissivity is the Thermal Absorptance of the inside material layer of each surface.
EnergyPlus reports predicted percentage dissatisfied (PPD). COMFEN and the Façade Design Tool reports predicted percentage satisfied (PPS), which is 100-PPD.