fabrication of flexible and self-standing inorganic...
TRANSCRIPT

DaltonTransactions
PAPER
Cite this: Dalton Trans., 2015, 44,15872
Received 21st April 2015,Accepted 29th July 2015
DOI: 10.1039/c5dt01509j
www.rsc.org/dalton
Fabrication of flexible and self-standinginorganic–organic three phase magneto-dielectricPVDF based multiferroic nanocomposite filmsthrough a small loading of graphene oxide (GO)and Fe3O4 nanoparticles†
O. D. Jayakumar,a Ehab H. Abdelhamid,b Vasundhara Kotari,a Balaji P. Mandal,a
Rekha Rao,c Jagannath,d Vaman M. Naik,e Ratna Naik*b and A. K. Tyagi*a
Flexible inorganic–organic magneto-electric (ME) nanocomposite films (PVDF, PVDF-GO, PVDF-Fe3O4
and PVDF-GO-Fe3O4), composed of well-dispersed graphene oxide (GO 5 wt%) and magnetic Fe3O4
nanoparticles (5 wt%) embedded into a poly(vinylidene-fluoride) (PVDF) matrix, have been prepared by a
solvent casting route. The magnetic, ferroelectric, dielectric, magneto-dielectric (MD) coupling and struc-
tural properties of these films have been systematically investigated. Magnetic (Ms = 2.21 emu g−1) and
ferroelectric (P = 0.065 µC cm−2) composite films of PVDF-GO-Fe3O4 (PVDF loaded with 5% GO and 5%
Fe3O4) with an MD coupling of 0.02% at room temperature (RT) showed a three times higher dielectric
constant than that of the pure PVDF film, with a dielectric loss as low as 0.6. However, the PVDF-Fe3O4
film, which exhibited improved magnetic (Ms = 2.5 emu g−1) and MD coupling (0.04%) properties at RT
with a lower dielectric loss (0.3), exhibited decreased ferroelectric properties (P = 0.06 µC cm−2) and
dielectric constant compared to the PVDF-GO-Fe3O4 film. MD coupling measurements carried out as a
function of temperature on the multi-functional PVDF-GO-Fe3O4 film showed a systematic increase in
MD values up to 100 K and a decrease thereafter. The observed magnetic, ferroelectric, dielectric, MD
coupling and structural properties of the nanocomposite films are attributed to the homogeneous dis-
persion and good alignment of Fe3O4 nanoparticles and GO in the PVDF matrix along with a partial con-
version of nonpolar α-phase PVDF to polar β-phase. The above multi-functionality of the composite films
of PVDF-Fe3O4 and PVDF-GO-Fe3O4 paves the way for their application in smart multiferroic devices.
Introduction
Multiferroics are materials that exhibit more than one primaryferroic order parameter like ferromagnetism, ferroelectricityand ferroelasticity simultaneously in a single phase. Further,researchers consider materials to be multiferroic only if they
exhibit coupling between primary ferroic order parameters.These multiferroic materials (MFMs) are of great importancedue to their potential applications in multi-functionaldevices.1,2 The key to device functionality is a multiferroicmaterial with strong magneto-electric (ME) and magneto-dielectric (MD) coupling for a simple control of magnetizationvia polarization or dielectric constant and vice versa. Unfortu-nately, very few materials have shown the coexistence of mag-netism and ferro-electricity (FE) with a reasonable dielectricconstant and a low dielectric loss. Materials with magnetismand FE may have a weak ME coupling at room temperature ormay not possess desirable dielectric properties.3,4 Thoughthere are a few single phase multiferroic materials, their appli-cations are limited, either due to their order parameters exist-ing at low temperatures5 or difficulties in synthesizing them ina stoichiometric form with low dielectric loss6 or ME coeffi-cients being too weak in these materials.7
†Electronic supplementary information (ESI) available. See DOI: 10.1039/c5dt01509j
aChemistry Division, Bhabha Atomic Research Centre, Mumbai, 400085, India.
E-mail: [email protected]; Fax: +91-22-25505151; Tel: +91-22-25595330bDepartment of Physics and Astronomy, Wayne State University, Detroit MI, 48201,
USA. E-mail: [email protected]; Fax: +1-(313) 577-3932; Tel: +1-(313) 577-5432cSolid State Physics Division, Bhabha Atomic Research Centre, Mumbai, 400085,
IndiadTechnical Physics Division, Bhabha Atomic Research Centre, Mumbai, 400085,
IndiaeDepartment of Natural Sciences, University of Michigan-Dearborn MI, 48128, USA
15872 | Dalton Trans., 2015, 44, 15872–15881 This journal is © The Royal Society of Chemistry 2015
Publ
ishe
d on
14
Aug
ust 2
015.
Dow
nloa
ded
by U
nive
rsity
of
Mic
higa
n-D
earb
orn
on 0
9/10
/201
5 18
:18:
54.
View Article OnlineView Journal | View Issue

Recently, the ME effect has been observed and investigatedin a range of single-phase materials like Co3B7O13Br, Bi5FeTi3O15,and LiCoPO4.
8–10 Such single-phase ME materials, however,are not suitable for use in ME devices due to their low Neeltemperatures and weak ME effect. Achieving strong ME coup-ling between net magnetization and net electric polarization isparticularly important for device applications. This problemcan be partially circumvented by fabricating multiferroic com-posite materials or hybrid materials with diverse properties.For example, ferrite–piezoelectric (PE) ceramic composites,such as CoFe2O4–BaTiO3, ferrite–lead zirconate–titanate (PZT),and Tb–Dy–Fe alloys (Terfenol-D)–PZT, have been found toexhibit much higher ME coupling than the mono-phasemultiferroics.11–14 In such composites,15–22 the ME effect isknown to be an extrinsic “product property”, resulting fromthe interaction of the elastic components of the ferrite and FEconstituents. However, these ceramic composites have somelimitations including chemical reaction, inter-diffusion anddifferential thermal expansion during high temperature pro-cessing (>1000 K), which make them unsuitable for deviceapplications. One way to simplify the preparation process aswell as avoid the problem of inter-diffusion between the FEand magnetostrictive phases is by fabricating polymer basedcomposite materials made by filling polymers with magnetic,dielectric and FE component phases which have lower proces-sing temperatures. In this context, stimuli-responsive polymerslike PVDF are among the most important polymers due totheir FE and PE properties. PVDF is a semi-crystalline polymerexhibiting at least four crystalline phases, namely, α, β, γ, andδ. Among these, polar β-phase is the most desirable phase withhigh permittivity or FE value.23–26 PVDF has been chosen asthe polymer matrix in the present study due to the above men-tioned desirable properties and its low cost, good mechanicalproperties, and chemical and electrical resistance. PVDF iseasy to process and can be cast into any desirable shape bysimple methods.
The addition of nano-fillers to PVDF is often performed toinitiate the nucleation of the electro-active β-phase.27 In mostof the studies graphene oxide (GO) has been selected as anano-filler in a polymer matrix, because of its high surfacearea, aspect ratio, mechanical strength and thermal conduc-tivity.28 Further, GO is an electrically insulating material dueto its disrupted sp2 bonding networks. It has abundant surfacegroups such as epoxy, hydroxyl and carboxylic acid and can beeasily dispersed in an organic solvent via sonication in theform of individual GO nanosheets. In addition, GO can uni-formly disperse in a polymer matrix because of hydrogenbonds or strong and specific interactions between oxygen-containing functional groups.29 Kuwahara et al.30 demonstratedthat the dielectric constant of the PVDF composites can beincreased by loading it with GO by the solvent casting method.Sigamani et al.31 used a co-solvent approach involving waterand DMF to dissolve GO and PVDF to obtain the GO/PVDFcomposites with increased electrical conductivity.
However, studies on polymer based multiferroic or func-tional composites having reasonable magnetic, ferroelectric,
and dielectric responses with low dielectric loss and MDcoupling are mostly centered on two phase materials,32–34
except for a few isolated reports on three phase (ternary)composites.35–38 Guo et al.32 prepared the 0–3Ni0.5Zn0.5Fe2O4
(NZFO)-PVDF composite films with low dielectric loss, andgiant magneto-dielectric coupling effect. Composites likeLa0.7Sr0.3MnO3-PVDF
33 and Fe3O4 loaded PVDF34 exhibit multi-ferroic properties with significant ME coupling. Despite thestudies on a variety of multiferroic materials mentioned above,to the best of our knowledge, complete studies of a three ortwo phase multifunctional material encompassing magnetic,ferroelectric, dielectric, magneto-dielectric and structural pro-perties are scarce.
Herein, we report the synthesis of flexible and self-standingternary phase multiferroic polymer composite films ofPVDF-GO-Fe3O4 and binary phase PVDF-Fe3O4 films exhibitingmagnetic, FE, dielectric, and MD coupling properties with lowdielectric loss. These functional films were prepared using GO,PVDF and Fe3O4 nanoparticles by a simple solvent castingmethod. Films of PVDF-GO and PVDF have also been made forcomparison and completeness.
ExperimentalSynthesis of Fe3O4 nanoparticles
FeCl2·4H2O (99.9% Sigma), FeCl3·6H2O (99.9% Sigma), andammonium hydroxide solution were used as the startingmaterials. Fe3O4 nanoparticles were synthesized by using a co-precipitation method. 0.5515 g of FeCl2·4H2O and 1.5 g ofFeCl3·6H2O were dissolved in distilled water at 50 °C. Aqueousammonium hydroxide solution was slowly injected into theabove solution under magnetic stirring until the pH was 12.After 1 h, the entire solution was neutralized with dilute HCland the black color precipitate obtained was separated using apermanent magnet and washed three times with distilledwater and finally with alcohol.
Synthesis of nanocomposite films
The studied nanocomposite films were prepared by a solventcasting method. In a typical synthesis of PVDF-GO-Fe3O4 com-posites, a required amount of PVDF was dissolved in DMF atroom temperature and the synthesized Fe3O4 nanoparticles(5 wt%) and GO (5 wt%) powder (prepared indigenously) wereadded into the PVDF + DMF solution and stirred at roomtemperature for 1 h. After 1 h sonication, the mixture waspoured on a cleaned glass slide and heated at 80 °C to ensurethe evaporation of DMF to obtain self-standing and flexiblepolymer composite films. The same procedure was followedwhen using GO, PVDF and Fe3O4 to prepare PVDF, PVDF-GOand PVDF-Fe3O4 films.
Characterization
The phase purity of all the samples was confirmed by XRDusing a Rigaku X-ray diffractometer, which was operated at40 kV and 15 mA. The morphology of PVDF based films was
Dalton Transactions Paper
This journal is © The Royal Society of Chemistry 2015 Dalton Trans., 2015, 44, 15872–15881 | 15873
Publ
ishe
d on
14
Aug
ust 2
015.
Dow
nloa
ded
by U
nive
rsity
of
Mic
higa
n-D
earb
orn
on 0
9/10
/201
5 18
:18:
54.
View Article Online
studied using a field emission scanning electron microscope(JEOL JSM7600). Transmission electron microscopy imagingwas carried out with a JEOL JEM 2010 transmission electronmicroscope (TEM). FTIR spectra of the films were recorded byusing a Perkin-Elmer Spectrum Two spectrometer operating inthe ATR mode and a Bomem MB102FTIR spectrometer operat-ing in the transmission mode. Raman spectra were recordedusing 532 nm lines from a diode-pumped Nd-YAG laser (power15 mW) focused on a spot size of about 20 μm. The scatteredlight was analyzed using a home-built 0.9 m single monochro-mator coupled with a supernotch filter and detected using acooled charge coupled device (CCD, Andor Technology).The entrance slit was kept at 50 μm, which gave a resolutionof ∼3 cm−1.
The room-temperature magnetization measurements werecarried out using a Quantum Design Physical PropertyMeasurement System (PPMS). The zero-field-cooled (ZFC)measurements were performed by cooling the sample in zerofield to 10 K, and then the magnetization was measured whilewarming in a field of 1000 Oe. In field-cooled (FC) measure-ments, the sample was cooled in a field of 1000 Oe to 10 K,and the moment was measured while warming to 300 K. TheFE measurements were performed on a commercial FE testsystem (aixACCT: TF-2000). All the ferroelectric hysteresisloops were measured at room temperature at 100 Hz. A thinlayer of Ag paint was applied to the top and bottom of thefilms to which Au wires were attached to make a parallel platecapacitor. An Agilent 4284A LCR meter was used to measurethe frequency dependent (1–106 Hz) dielectric properties at1 volt excitation, while the PPMS was used to provide themagnetic field (0–10 kOe) for magneto-dielectric couplingmeasurements at 30 kHz. Background correction was per-formed to extract the magneto-dielectric data.
Results and discussion
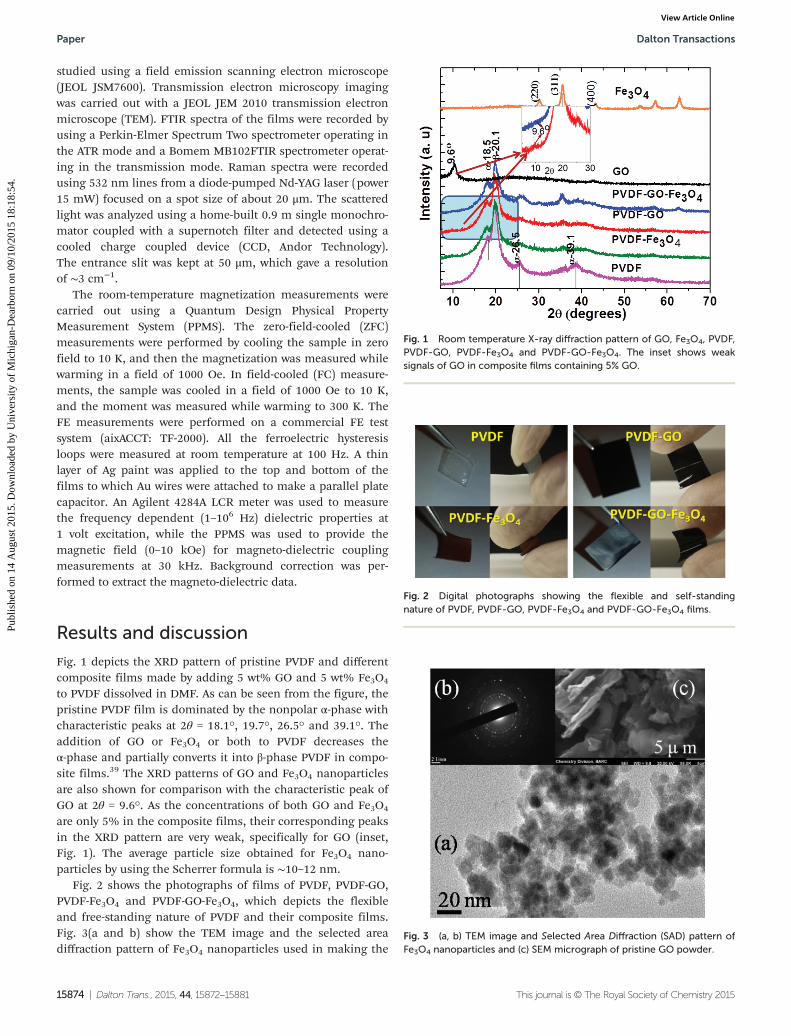
Fig. 1 depicts the XRD pattern of pristine PVDF and differentcomposite films made by adding 5 wt% GO and 5 wt% Fe3O4
to PVDF dissolved in DMF. As can be seen from the figure, thepristine PVDF film is dominated by the nonpolar α-phase withcharacteristic peaks at 2θ = 18.1°, 19.7°, 26.5° and 39.1°. Theaddition of GO or Fe3O4 or both to PVDF decreases theα-phase and partially converts it into β-phase PVDF in compo-site films.39 The XRD patterns of GO and Fe3O4 nanoparticlesare also shown for comparison with the characteristic peak ofGO at 2θ = 9.6°. As the concentrations of both GO and Fe3O4
are only 5% in the composite films, their corresponding peaksin the XRD pattern are very weak, specifically for GO (inset,Fig. 1). The average particle size obtained for Fe3O4 nano-particles by using the Scherrer formula is ∼10–12 nm.
Fig. 2 shows the photographs of films of PVDF, PVDF-GO,PVDF-Fe3O4 and PVDF-GO-Fe3O4, which depicts the flexibleand free-standing nature of PVDF and their composite films.Fig. 3(a and b) show the TEM image and the selected areadiffraction pattern of Fe3O4 nanoparticles used in making the
Fig. 1 Room temperature X-ray diffraction pattern of GO, Fe3O4, PVDF,PVDF-GO, PVDF-Fe3O4 and PVDF-GO-Fe3O4. The inset shows weaksignals of GO in composite films containing 5% GO.
Fig. 2 Digital photographs showing the flexible and self-standingnature of PVDF, PVDF-GO, PVDF-Fe3O4 and PVDF-GO-Fe3O4 films.
Fig. 3 (a, b) TEM image and Selected Area Diffraction (SAD) pattern ofFe3O4 nanoparticles and (c) SEM micrograph of pristine GO powder.
Paper Dalton Transactions
15874 | Dalton Trans., 2015, 44, 15872–15881 This journal is © The Royal Society of Chemistry 2015
Publ
ishe
d on
14
Aug
ust 2
015.
Dow
nloa
ded
by U
nive
rsity
of
Mic
higa
n-D
earb
orn
on 0
9/10
/201
5 18
:18:
54.
View Article Online

composite films. From the TEM images it is clear that theFe3O4 nanoparticle size is ∼10–12 nm and they are crystallinein nature (Fig. 3(a and b)) in agreement with XRD results. TheSEM of GO (Fig. 3(c)) shows that they are of sheet type mor-phology with micrometer dimensions.
To investigate the influence of Fe3O4 and GO on the micro-structure of the composite films, FESEM pictures of compositefilms along with the pure PVDF film were obtained. Fig. 4(a)shows the microstructure of pure PVDF, where it can be seenthat the morphology of the pure PVDF layer is dense andsmooth with no visible voids, but small fold lines appear onthe surface. From the figure, a good dispersion of GO in thePVDF matrix can be clearly observed. It is the strong inter-action between oxygen-containing groups, especially carbonylgroups (–CvO) on the GO surface and fluorine groups inPVDF, that led to the homogeneous dispersion of GO in thePVDF matrix. Compared to the pure PVDF film, the PVDF-GO,PVDF-Fe3O4 and PVDF-GO-Fe3O4 composite films have roughsurfaces and contain some granular particles distributednearly homogeneously in the films (Fig. 4). The compositionand elemental mapping (Fig. S1, ESI†) confirm the homo-geneous distribution of the nanofillers in the PVDF matrix.
FTIR spectra
Fourier Transform Infrared (FTIR) spectroscopy is an effectivemethod to study crystalline phase transformation in PVDF.Fig. 5(A) shows the ATR-IR spectra of PVDF, PVDF-GO,PVDF-Fe3O4 and PVDF-GO-Fe3O4 films in the 400–1800 cm−1
region while Fig. 5(B) shows the IR spectra of PVDF-GO andPVDF-GO-Fe3O4 films in the 400–3600 cm−1 region. Details ofpeak assignment are given in ESI Table S2.† As can be seen inthis figure, pure PVDF crystallizes mainly in the α-phase (witha small quantity of β phase) with characteristic peaks at 490,530, 615, 760, 795, 854 and 975 cm−1. The peaks at 440, 510,840, 1170 and 1275 cm−1 correspond to the β-phase.40–45
It is clear from the IR spectra that the addition of GO,Fe3O4 or both GO and Fe3O4 to PVDF causes the intensity ofthose peaks corresponding to the α-phase to decrease with aconcomitant increase in the intensity of the peaks character-istic of the β-phase. This confirms that the addition of GO orFe3O4 or both leads to crystal transformation of PVDF fromthe α-phase to the β-phase. The increase in the β-phase in thecomposite films could be due to the Fe3O4 nanoparticles andGO providing additional nucleation sites for the crystalliza-tion of the β-phase. It is known that the strong interactionbetween carbonyl groups in graphene oxide and fluorinegroups in PVDF causes a transformation of the α-phase’strans–gauche–trans–gauche conformation into the trans–transconformation characteristic of the β-phase.46 The presence ofGO in composite films of PVDF-GO and PVDF-GO-Fe3O4 isconfirmed by the peaks at 1725 cm−1 (carboxyl or carbonylstretching vibration) and 1620 cm−1 (C–O stretching) inPVDF-GO and PVDF-GO-Fe3O4 (Fig. 5(B)). The presence of GOin PVDF-GO and PVDF-GO-Fe3O4 films is further confirmedby the Raman spectra of these films which is discussedbelow.
Fig. 4 SEM micrographs of PVDF, PVDF-GO, PVDF-Fe3O4 andPVDF-GO-Fe3O4 films. Insets show FESEM images.
Fig. 5 (A) FTIR spectra of (a) pristine PVDF (b) PVDF-GO (c)PVDF-Fe3O4 and (d) PVDF-GO-Fe3O4. Dashed vertical lines correspondto characteristic peaks of the β-phase; (B) FTIR spectra of PVDF-GO andPVDF-GO-Fe3O4.
Dalton Transactions Paper
This journal is © The Royal Society of Chemistry 2015 Dalton Trans., 2015, 44, 15872–15881 | 15875
Publ
ishe
d on
14
Aug
ust 2
015.
Dow
nloa
ded
by U
nive
rsity
of
Mic
higa
n-D
earb
orn
on 0
9/10
/201
5 18
:18:
54.
View Article Online

Raman spectroscopy studies
Raman spectroscopy is widely used to characterize the crystalstructure, disorder and defects in graphene-based materials.28,47–49
Fig. 6(a) shows the Raman spectra of pristine PVDF and itscomposite films. The presence of GO in the PVDF film leads tochanges in the relative intensity of two main peaks in theRaman spectra viz. D and G.49 The D peak of GO located at1350 cm−1 stems from a defect-induced breathing mode of sp2
rings.48 It is common to all sp2 carbon lattices and arises fromthe stretching of the C–C bond. The G peak at around1595 cm−1 for GO is due to the first order scattering of the E2gphonon of sp2 C atoms.48 The intensity of the D band isrelated to the size of the in-plane sp2 domains.49 The increaseof the D peak intensity indicates the formation of more sp2
domains. The relative intensity ratio of both peaks (ID/IG) is ameasure of the degree of disorder and is inversely proportionalto the average size of the sp2 clusters.50 Normally, the ID/IGintensity ratio of D and G bands of graphene (G) and reducedgraphene oxide (RGO) is larger than that of ID/IG of GO.However, in this study, ID/IG ≈ 1 for both PVDF-GO-Fe3O4
and PVDF-GO films (Fig. 6(a)) indicating the presence of onlyGO without a noticeable reduction of GO to RGO51 in bothcomposite films. There are reports of using the intensity ratioID/IG to estimate the size of the domains.52,53 The size of theGO domains estimated using this intensity ratio is of theorder of 20 nm which may be related to the thickness of theGO sheets.
Raman spectroscopy also provides information about theconjugated structure and the chain skeleton of polymers. Theweak Raman bands at 794 cm−1 and 839 cm−1 in pristinePVDF films (Fig. 6(a and b)) correspond to α- and β-phases,respectively.39 These features appear with a strong lumine-scence background and hence it is difficult to comment on thechanges in α- and β-phases from the Raman data, even thoughthe band at 794 cm−1 corresponding to the α phase broadensand shifts towards a higher frequency (839 cm−1) of theβ-phase with the insertion of GO or Fe3O4 as shown in theinset of Fig. 6(b). One possible reason for this may be due tothe possible conversion of a part of the α-phase into theβ-phase as confirmed by XRD patterns and IR spectra. This isalso reflected in the dielectric and ferroelectric studies, as dis-cussed in the following sections.
XPS studies
We have recorded the XPS spectra of Fe3O4 and PVDF-GO-Fe3O4
films and the results are depicted in Fig. S3 (ESI†). Bindingenergies 711.1 eV (Fe 2p3/2) and 724.5 eV (Fe 2p1/2) correspondto the XPS spectrum of Fe3O4 (Fig. S3, ESI†). The presence ofGO is also confirmed by the C 1s XPS spectrum of thePVDF-GO-Fe3O4 (Fig. S3, ESI†) film. We tried to record the XPSspectra of the PVDF-GO-Fe3O4 sample in the Fe 2p region, toshow the presence of Fe3O4 in the PVDF-GO-Fe3O4 film.However, the samples did not give any Fe signal in this region.This may be due to the fact that XPS probes only a small depth(∼100 angstroms) and the particles may be well below that dis-tance in the films.
Magnetism
Fig. 7 shows the magnetization vs. field (M vs. H) measure-ments of PVDF, PVDF-GO, PVDF-Fe3O4 and PVDF-GO-Fe3O4
films at room temperature. Fe3O4 nanoparticles embeddedcomposite films of PVDF-Fe3O4 and PVDF-GO-Fe3O4 showsuperparamagnetic behavior with a very small coercivity of35 Oe (Fig. 7, inset). The saturation magnetization (Ms) values forPVDF-Fe3O4 and PVDF-GO-Fe3O4 films are 2.61 and 2.21 emu g−1,
Fig. 6 (a) Raman spectra of PVDF, PVDF-Fe3O4, PVDF-GO andPVDF-GO-Fe3O4 films; (b) Raman spectra of PVDF and PVDF-GO-Fe3O4
films and the inset shows a selected range of spectra.
Fig. 7 Magnetization vs. field (M vs. H) at 300 K of PVDF, PVDF-GO,PVDF-Fe3O4 and PVDF-GO-Fe3O4 films. The inset shows an enlargedview of M vs. H at 300 K.
Paper Dalton Transactions
15876 | Dalton Trans., 2015, 44, 15872–15881 This journal is © The Royal Society of Chemistry 2015
Publ
ishe
d on
14
Aug
ust 2
015.
Dow
nloa
ded
by U
nive
rsity
of
Mic
higa
n-D
earb
orn
on 0
9/10
/201
5 18
:18:
54.
View Article Online
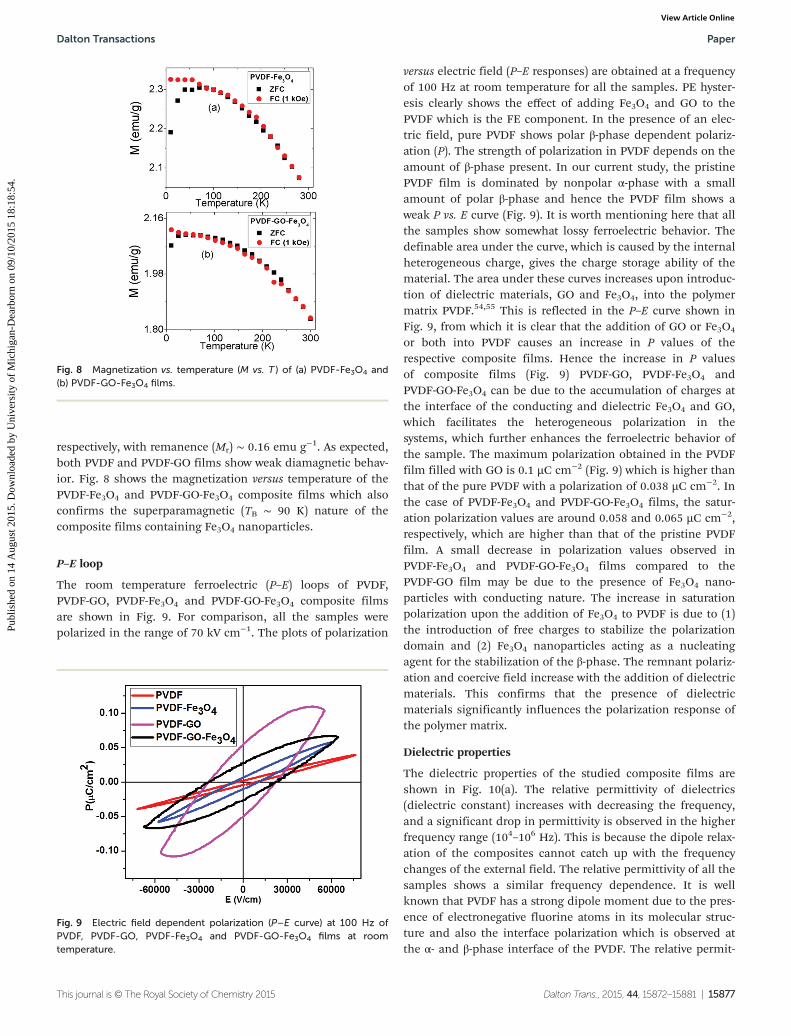
respectively, with remanence (Mr) ∼ 0.16 emu g−1. As expected,both PVDF and PVDF-GO films show weak diamagnetic behav-ior. Fig. 8 shows the magnetization versus temperature of thePVDF-Fe3O4 and PVDF-GO-Fe3O4 composite films which alsoconfirms the superparamagnetic (TB ∼ 90 K) nature of thecomposite films containing Fe3O4 nanoparticles.
P–E loop
The room temperature ferroelectric (P–E) loops of PVDF,PVDF-GO, PVDF-Fe3O4 and PVDF-GO-Fe3O4 composite filmsare shown in Fig. 9. For comparison, all the samples werepolarized in the range of 70 kV cm−1. The plots of polarization
versus electric field (P–E responses) are obtained at a frequencyof 100 Hz at room temperature for all the samples. PE hyster-esis clearly shows the effect of adding Fe3O4 and GO to thePVDF which is the FE component. In the presence of an elec-tric field, pure PVDF shows polar β-phase dependent polariz-ation (P). The strength of polarization in PVDF depends on theamount of β-phase present. In our current study, the pristinePVDF film is dominated by nonpolar α-phase with a smallamount of polar β-phase and hence the PVDF film shows aweak P vs. E curve (Fig. 9). It is worth mentioning here that allthe samples show somewhat lossy ferroelectric behavior. Thedefinable area under the curve, which is caused by the internalheterogeneous charge, gives the charge storage ability of thematerial. The area under these curves increases upon introduc-tion of dielectric materials, GO and Fe3O4, into the polymermatrix PVDF.54,55 This is reflected in the P–E curve shown inFig. 9, from which it is clear that the addition of GO or Fe3O4
or both into PVDF causes an increase in P values of therespective composite films. Hence the increase in P valuesof composite films (Fig. 9) PVDF-GO, PVDF-Fe3O4 andPVDF-GO-Fe3O4 can be due to the accumulation of charges atthe interface of the conducting and dielectric Fe3O4 and GO,which facilitates the heterogeneous polarization in thesystems, which further enhances the ferroelectric behavior ofthe sample. The maximum polarization obtained in the PVDFfilm filled with GO is 0.1 µC cm−2 (Fig. 9) which is higher thanthat of the pure PVDF with a polarization of 0.038 µC cm−2. Inthe case of PVDF-Fe3O4 and PVDF-GO-Fe3O4 films, the satur-ation polarization values are around 0.058 and 0.065 µC cm−2,respectively, which are higher than that of the pristine PVDFfilm. A small decrease in polarization values observed inPVDF-Fe3O4 and PVDF-GO-Fe3O4 films compared to thePVDF-GO film may be due to the presence of Fe3O4 nano-particles with conducting nature. The increase in saturationpolarization upon the addition of Fe3O4 to PVDF is due to (1)the introduction of free charges to stabilize the polarizationdomain and (2) Fe3O4 nanoparticles acting as a nucleatingagent for the stabilization of the β-phase. The remnant polariz-ation and coercive field increase with the addition of dielectricmaterials. This confirms that the presence of dielectricmaterials significantly influences the polarization response ofthe polymer matrix.
Dielectric properties
The dielectric properties of the studied composite films areshown in Fig. 10(a). The relative permittivity of dielectrics(dielectric constant) increases with decreasing the frequency,and a significant drop in permittivity is observed in the higherfrequency range (104–106 Hz). This is because the dipole relax-ation of the composites cannot catch up with the frequencychanges of the external field. The relative permittivity of all thesamples shows a similar frequency dependence. It is wellknown that PVDF has a strong dipole moment due to the pres-ence of electronegative fluorine atoms in its molecular struc-ture and also the interface polarization which is observed atthe α- and β-phase interface of the PVDF. The relative permit-
Fig. 8 Magnetization vs. temperature (M vs. T ) of (a) PVDF-Fe3O4 and(b) PVDF-GO-Fe3O4 films.
Fig. 9 Electric field dependent polarization (P–E curve) at 100 Hz ofPVDF, PVDF-GO, PVDF-Fe3O4 and PVDF-GO-Fe3O4 films at roomtemperature.
Dalton Transactions Paper
This journal is © The Royal Society of Chemistry 2015 Dalton Trans., 2015, 44, 15872–15881 | 15877
Publ
ishe
d on
14
Aug
ust 2
015.
Dow
nloa
ded
by U
nive
rsity
of
Mic
higa
n-D
earb
orn
on 0
9/10
/201
5 18
:18:
54.
View Article Online
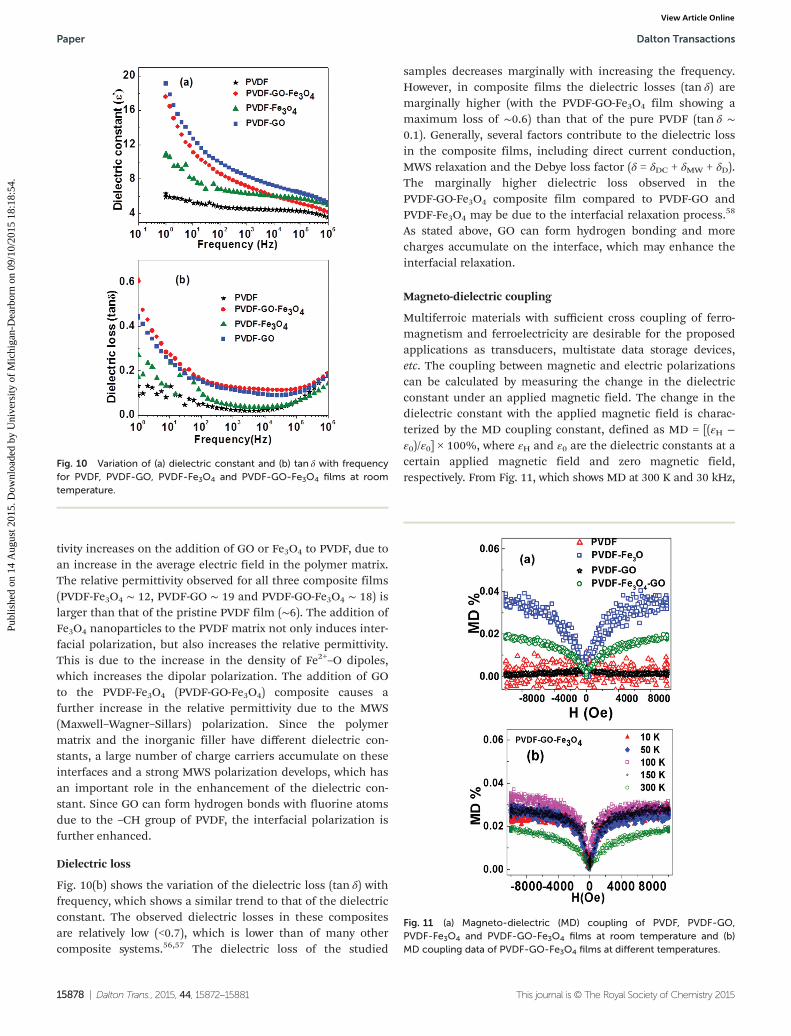
tivity increases on the addition of GO or Fe3O4 to PVDF, due toan increase in the average electric field in the polymer matrix.The relative permittivity observed for all three composite films(PVDF-Fe3O4 ∼ 12, PVDF-GO ∼ 19 and PVDF-GO-Fe3O4 ∼ 18) islarger than that of the pristine PVDF film (∼6). The addition ofFe3O4 nanoparticles to the PVDF matrix not only induces inter-facial polarization, but also increases the relative permittivity.This is due to the increase in the density of Fe2+–O dipoles,which increases the dipolar polarization. The addition of GOto the PVDF-Fe3O4 (PVDF-GO-Fe3O4) composite causes afurther increase in the relative permittivity due to the MWS(Maxwell–Wagner–Sillars) polarization. Since the polymermatrix and the inorganic filler have different dielectric con-stants, a large number of charge carriers accumulate on theseinterfaces and a strong MWS polarization develops, which hasan important role in the enhancement of the dielectric con-stant. Since GO can form hydrogen bonds with fluorine atomsdue to the –CH group of PVDF, the interfacial polarization isfurther enhanced.
Dielectric loss
Fig. 10(b) shows the variation of the dielectric loss (tan δ) withfrequency, which shows a similar trend to that of the dielectricconstant. The observed dielectric losses in these compositesare relatively low (<0.7), which is lower than of many othercomposite systems.56,57 The dielectric loss of the studied
samples decreases marginally with increasing the frequency.However, in composite films the dielectric losses (tan δ) aremarginally higher (with the PVDF-GO-Fe3O4 film showing amaximum loss of ∼0.6) than that of the pure PVDF (tan δ ∼0.1). Generally, several factors contribute to the dielectric lossin the composite films, including direct current conduction,MWS relaxation and the Debye loss factor (δ = δDC + δMW + δD).The marginally higher dielectric loss observed in thePVDF-GO-Fe3O4 composite film compared to PVDF-GO andPVDF-Fe3O4 may be due to the interfacial relaxation process.58
As stated above, GO can form hydrogen bonding and morecharges accumulate on the interface, which may enhance theinterfacial relaxation.
Magneto-dielectric coupling
Multiferroic materials with sufficient cross coupling of ferro-magnetism and ferroelectricity are desirable for the proposedapplications as transducers, multistate data storage devices,etc. The coupling between magnetic and electric polarizationscan be calculated by measuring the change in the dielectricconstant under an applied magnetic field. The change in thedielectric constant with the applied magnetic field is charac-terized by the MD coupling constant, defined as MD = [(εH −ε0)/ε0] × 100%, where εH and ε0 are the dielectric constants at acertain applied magnetic field and zero magnetic field,respectively. From Fig. 11, which shows MD at 300 K and 30 kHz,
Fig. 10 Variation of (a) dielectric constant and (b) tan δ with frequencyfor PVDF, PVDF-GO, PVDF-Fe3O4 and PVDF-GO-Fe3O4 films at roomtemperature.
Fig. 11 (a) Magneto-dielectric (MD) coupling of PVDF, PVDF-GO,PVDF-Fe3O4 and PVDF-GO-Fe3O4 films at room temperature and (b)MD coupling data of PVDF-GO-Fe3O4 films at different temperatures.
Paper Dalton Transactions
15878 | Dalton Trans., 2015, 44, 15872–15881 This journal is © The Royal Society of Chemistry 2015
Publ
ishe
d on
14
Aug
ust 2
015.
Dow
nloa
ded
by U
nive
rsity
of
Mic
higa
n-D
earb
orn
on 0
9/10
/201
5 18
:18:
54.
View Article Online

it can be observed that diamagnetic PVDF and PVDF-GOsamples do not show any change in dielectric constant uponthe application of the magnetic field, as expected. On theother hand, the samples loaded with magnetic Fe3O4 showvariation in dielectric constant upon the application ofthe magnetic field, with the samples PVDF-Fe3O4 andPVDF-GO-Fe3O4 showing a MD of ∼0.035% and 0.02%, respecti-vely, at 300 K. It may be noted that Mandal et al.59 studied thedielectric and magneto-dielectric coupling (MD%) propertiesof a hydroxylated Ni-PVDF based system and have observedthat the magneto-dielectric coupling value of Ni-PVDF sampleswas about 0.02% at room temperature. Our present sample(PVDF-GO-Fe3O4) shows a higher MD coupling (0.04%) atroom temperature compared to the Ni-PVDF sample.
The obtained curves have been fitted to a quadraticequation in H, as (εH − ε0)/ε0 = γH2 which originates from thelowest-order coupling terms polarization (P) and magnetiza-tion (H) in the free-energy term.60 The MD effect in thesesamples arises from terms proportional to P2M2 in a sym-metry-allowed Ginzburg–Landau free energy, where P and Mare electric polarization and magnetization, respectively. In thepresent samples, the MD showed a quadratic dependence onmagnetization, which is observed in other magneto-electricMFMs.61,62
The MD coupling in the composites arises as a result of theproduct of the magnetostriction of the magnetic phase andthe piezo-electricity of the FE phase. The MD coupling takesplace through elastic interaction between the magnetic and FEphases. Therefore, the ME effect in these composite systems isextrinsic in nature, which severely depends on the microstruc-ture and coupling interactions between the magnetic and FEinterfaces. In these multiferroic hybrids, upon the applicationof a magnetic field, the magnetic domains of Fe3O4 align insuch a way that it can cause stress on the neighboring FEPVDF phase via magnetostriction, which eventually leads tothe accumulation of some surface charge due to the PE effect.This accumulated charge changes the dielectric constant ofthe composite in the presence of a magnetic field.
The magnetic field dependence of the MD couplingresponse at 30 kHz for different temperatures is shown inFig. 11(b) for the PVDF-GO-Fe3O4 film. The MD (%) increaseswith increasing temperature and reaches a maximum value of0.035% at 100 K in a magnetic field of 1 T. At 150 K, the MDcoupling decreases to 0.028 and eventually decreases to0.02% at 300 K. The increase of the magneto-dielectricresponse below 150 K, or near the transition temperature ofFe3O4 nanoparticles (∼130 K), indicates a direct correlationbetween magnetism and dielectric properties. This is inagreement with the Ginzburg–Landau phenomenologicaltheory,59 according to which, below Tc, the magneto-dielectriceffect is proportional to the spin-pair correlation of neighbor-ing spins, hence the square of the magnetization MD (%) =γH2. Further, at low temperature the magnetic phase will bein the aligned state and the interaction between the magneticand FE phases will be strong and this leads to increased MDcoupling.
Conclusions
In conclusion, we have demonstrated that self-standing, flex-ible inorganic–organic three-phase and two phase hybrid com-posite films of PVDF, GO and Fe3O4 can be made by a solventcasting method by embedding GO or Fe3O4 or both into aPVDF polymer at low temperature, ensuring no chemical reac-tion or inter-diffusion between the atoms of ferroelectric,piezoelectric and magnetostrictive phases. SEM, TEM, XRD,Raman and FTIR confirm the structure of the films.PVDF-GO-Fe3O4 and PVDF-Fe3O4 films showed excellent mag-netic, ferroelectric, dielectric and magneto-dielectric pro-perties with low dielectric loss and increased dielectricconstant compared to the pristine PVDF film at room tempera-ture. Temperature dependent MD coupling measurements onthe multifunctional PVDF-GO-Fe3O4 composite film showed anincreased value below 150 K due to strong coupling inter-actions between magnetic and PE or FE phases. These obser-vations pave the way for implementing composite films ofPVDF, GO and Fe3O4 in magneto-dielectric devices.
Acknowledgements
The Department of Atomic Energy’s Science Research Council(DAE-SRC) is acknowledged for supporting this work videsanction number 2010/21/9-BRNS/2025 dated 7-12-2010.Dr V. K. Jain, Head, Chemistry Division, BARC is thankedfor his keen interest in this work. Ehab H Abdelhamid issupported by NSF grant no. 1306449.
References
1 H. Schmid, Ferroelectrics, 1994, 162, 317–338.2 T. Kimura, T. Goto, H. Shintani, K. Ishizaka, T. Arima and
Y. Tokura, Nature, 2003, 426, 55–58.3 J. F. Scott, Nat. Mater., 2007, 6, 256–257.4 Y.-H. Chu, L. W. Martin, M. B. Holcomb, M. Gajek,
S.-J. Han, Q. He, N. Balke, C.-H. Yang, D. Lee, W. Hu,Q. Zhan, P.-L. Yang, A. Fraile-Rodriguez, A. Scholl,S. X. Wang and R. Ramesh, Nat. Mater., 2008, 7, 478–482.
5 L. W. Martin, S. P. Crane, Y.-H. Chu, M. B. Holcomb,M. Gajek, M. Huijben, C.-H. Yang, N. Balke andR. Ramesh, J. Phys.: Condens. Matter, 2008, 20, 434220.
6 A. K. Pradhan, K. Zhang, D. Hunter, J. B. Dadson,G. B. Loiutts, P. Bhattacharya, R. Katiyar, J. Zhang,D. J. Sellmyer, U. N. Roy, Y. Cui and A. Burger, J. Appl.Phys., 2005, 97, 093903.
7 V. J. Folen, G. T. Rado and E. W. Stalder, Phys. Rev. Lett.,1961, 6, 607–608.
8 M. Clin, J.-P. Rivera and H. Schmid, Ferroelectrics, 1988, 79,173–176.
9 R. S. Singh, T. Bhimasankaram, G. S. Kumar andS. V. Suryanarayana, Solid State Commun., 1994, 91,567–569.
Dalton Transactions Paper
This journal is © The Royal Society of Chemistry 2015 Dalton Trans., 2015, 44, 15872–15881 | 15879
Publ
ishe
d on
14
Aug
ust 2
015.
Dow
nloa
ded
by U
nive
rsity
of
Mic
higa
n-D
earb
orn
on 0
9/10
/201
5 18
:18:
54.
View Article Online

10 I. Kornev, M. Bichurin, J. P. Rivera, S. Gentil, H. Schmid,A. G. M. Jansen and P. Wyder, Phys. Rev. B: Condens. Matter,2000, 62, 12247–12253.
11 J. Lou, M. Liu, D. Reed, Y. Ren and N. X. Sun, Adv. Mater.,2009, 21, 4711–4715.
12 C. A. F. Vaz, J. Hoffman, C. H. Ahn and R. Ramesh, Adv.Mater., 2010, 22, 2900–2918.
13 H. Zheng, J. Wang, S. E. Lofland, Z. Ma, L. Mohaddes-Ardabili, T. Zhao, L. Salamanca-Riba, S. R. Shinde,S. B. Ogale, F. Bai, D. Viehland, Y. Jia, D. G. Schlom,M. Wuttig, A. Roytburd and R. Ramesh, Science, 2004, 303,661–663.
14 G. Srinivasan, E. T. Rasmussen, B. J. Levin and R. Hayes,Phys. Rev. B: Condens. Matter, 2002, 65, 134402.
15 H. Ryu, P. Murugavel, J. H. Lee, S. C. Chae, T. W. Noh,Y. S. Oh, H. J. Kim, K. H. Kim, J. H. Jang, M. Kim, C. Baeand J.-G. Park, Appl. Phys. Lett., 2006, 89, 102907.
16 J.-p. Zhou, H. He, Z. Shi and C.-W. Nan, Appl. Phys. Lett.,2006, 88, 013111.
17 C.-W. Nan, N. Cai, L. Liu, J. Zhai, Y. Ye and Y. Lin, J. Appl.Phys., 2003, 94, 5930–5936.
18 A. D. Sheikh and V. L. Mathe, J. Phys. Chem. Solids, 2011,72, 1423–1429.
19 Y. Wang, S. W. Or, H. L. W. Chan, X. Zhao and H. Luo,J. Appl. Phys., 2008, 103, 124511.
20 L. Hao, D. Zhou, Q. Fu and Y. Hu, J. Mater. Sci., 2013, 48,178–185.
21 C. Nayek, K. K. Sahoo and P. Murugavel, Mater. Res. Bull.,2013, 48, 1308–1311.
22 T. X. Li, M. Zhang, F. J. Yu, Z. Hu, K. S. Li, D. B. Yu andH. Yan, J. Phys. D: Appl. Phys., 2012, 45, 085002.
23 A. J. Lovinger, Macromolecules, 1982, 15, 40–44.24 H.-J. Ye, L. Yang, W.-Z. Shao, S.-B. Sun and L. Zhen, RSC
Adv., 2013, 3, 23730–23736.25 T. Lei, X. Cai, X. Wang, L. Yu, X. Hu, G. Zheng, W. Lv,
L. Wang, D. Wu, D. Sun and L. Lin, RSC Adv., 2013, 3,24952–24958.
26 M.-m. Tao, F. Liu, B.-r. Ma and L.-x. Xue, Desalination,2013, 316, 137–145.
27 P. Martins, C. Caparros, R. Gonçalves, P. M. Martins,M. Benelmekki, G. Botelho and S. Lanceros-Mendez,J. Phys. Chem. C, 2012, 116, 15790–15794.
28 F. He, S. Lau, H. L. Chan and J. Fan, Adv. Mater., 2009, 21,710–715.
29 D. R. Dreyer, S. Park, C. W. Bielawski and R. S. Ruoff,Chem. Soc. Rev., 2010, 39, 228–240.
30 Y. Kuwahara, M. Ueyama, R. Yagi, M. Koinuma, T. Ogata,S. Kim, Y. Matsumoto and S. Kurihara, Mater. Lett., 2013,108, 308–310.
31 N. Sigamani, Z. Ounaies, G. Ehlert and H. Sodano, Proc.SPIE 8342, Behavior and Mechanics of MultifunctionalMaterials and Composites, San Diego, California, 2012.
32 Y. Guo, Y. Liu, J. Wang, R. L. Withers, H. Chen, L. Jin andP. Smith, J. Phys. Chem. C, 2010, 114, 13861–13866.
33 C. Thirmal, C. Nayek, P. Murugavel and V. Subramanian,AIP Adv., 2013, 3, 112109.
34 O. D. Jayakumar, B. P. Mandal, J. Majeed, G. Lawes,R. Naik and A. K. Tyagi, J. Mater. Chem. C, 2013, 1, 3710–3715.
35 S.-H. Yao, Z.-M. Dang, M.-J. Jiang and J. Bai, Appl. Phys.Lett., 2008, 93, 182905.
36 Z. M. Dang, L. Z. Fan, Y. Shen and C. W. Nan, Chem. Phys.Lett., 2003, 369, 95–100.
37 Z.-M. Dang, Y. Shen and C.-W. Nan, Appl. Phys. Lett., 2002,81, 4814–4816.
38 A. Gupta and R. Chatterjee, J. Appl. Phys., 2009, 106,024110.
39 N. An, S. Liu, C. Fang, R. Yu, X. Zhou and Y. Cheng, J. Appl.Polym. Sci., 2015, 132, 41577.
40 M. Kobayashi, K. Tashiro and H. Tadokoro, Macromolecules,1975, 8, 158–171.
41 A. Itoh, Y. Takahashi, T. Furukawa and H. Yajima, Polym. J.,2014, 46, 207–211.
42 S. Lanceros-Méndez, J. F. Mano, A. M. Costa andV. H. Schmidt, J. Macromol. Sci., Part B: Phys., 2001, 40,517–527.
43 Y. Bormashenko, R. Pogreb, O. Stanevsky and E. Bormashenko,Polym. Test., 2004, 23, 791–796.
44 A. K. Zak, W. C. Gan, W. H. A. Majid, M. Darroudi andT. S. Velayutham, Ceram. Int., 2011, 37, 1653–1660.
45 T. Boccaccio, A. Bottino, G. Capannelli and P. Piaggio,J. Membr. Sci., 2002, 210, 315–329.
46 M. El Achaby, F. Z. Arrakhiz, S. Vaudreuil, E. M. Essassiand A. Qaiss, Appl. Surf. Sci., 2012, 258, 7668–7677.
47 A. C. Ferrari and J. Robertson, Phys. Rev. B: Condens.Matter, 2000, 61, 14095–14107.
48 Y. Guo, X. Sun, Y. Liu, W. Wang, H. Qiu and J. Gao, Carbon,2012, 50, 2513–2523.
49 A. Jorio, R. Saito, G. Dresselhaus and M. S. Dresselhaus,Raman Spectroscopy in Graphene Related Systems, Wiley-VCH,2011.
50 O. Akhavan and E. Ghaderi, Carbon, 2012, 50, 1853–1860.
51 E. Thangavel, S. Ramasundaram, S. Pitchaimuthu,S. W. Hong, S. Y. Lee, S.-S. Yoo, D.-E. Kim, E. Ito andY. S. Kang, Compos. Sci. Technol., 2014, 90, 187–192.
52 V. Di Noto, E. Negro, S. Polizzi, K. Vezzu, L. Toniolo andG. Cavinato, Int. J. Hydrogen Energy, 2014, 39, 2812–2827.
53 V. Di Noto, E. Negro, K. Vezzu, L. Toniolo and G. Pace,Electrochim. Acta, 2011, 57, 257–269.
54 R. Moazzami, H. Chenming and W. H. Shepherd, IEEETrans. Electron Devices, 1992, 39, 2044–2049.
55 Y. Liu, Y. Sun, F. Zeng and Y. Chen, Int. J. Electrochem. Sci.Cult., 2013, 8, 5688–5697.
56 S. K. Tripathi, A. Gupta and M. Kumari, Bull. Mater. Sci.,2012, 35, 969–975.
57 I. A. Al Ajaj, F. T. Noori and N. N. Ramoo, Int. J. Appl. Inno-vation Eng. Manage., 2013, 2, 79–88.
58 A. Ladhar, M. Arous, H. Kaddami, M. Raihane, M. Lahcini,A. Kallel, M. P. F. Graça and L. C. Costa, J. Non-Cryst. Solids,2013, 378, 39–44.
Paper Dalton Transactions
15880 | Dalton Trans., 2015, 44, 15872–15881 This journal is © The Royal Society of Chemistry 2015
Publ
ishe
d on
14
Aug
ust 2
015.
Dow
nloa
ded
by U
nive
rsity
of
Mic
higa
n-D
earb
orn
on 0
9/10
/201
5 18
:18:
54.
View Article Online

59 B. P. Mandal, K. Vasundhara, E. Abdelhamid, G. Lawes,H. G. Salunke and A. K. Tyagi, J. Phys. Chem. C, 2014, 118,20819–20825.
60 B. Ramachandran, A. Dixit, R. Naik, G. Lawes andM. S. Ramachandra Rao, J. Appl. Phys., 2011, 110, 104105.
61 D. P. Dutta, B. P. Mandal, R. Naik, G. Lawes andA. K. Tyagi, J. Phys. Chem. C, 2013, 117, 2382–2389.
62 G. Lawes, T. Kimura, C. M. Varma, M. A. Subramanian,N. Rogado, R. J. Cava and A. P. Ramirez, Prog. Solid StateChem., 2009, 37, 40–54.
Dalton Transactions Paper
This journal is © The Royal Society of Chemistry 2015 Dalton Trans., 2015, 44, 15872–15881 | 15881
Publ
ishe
d on
14
Aug
ust 2
015.
Dow
nloa
ded
by U
nive
rsity
of
Mic
higa
n-D
earb
orn
on 0
9/10
/201
5 18
:18:
54.
View Article Online