fabián g. fernández - infoag.org · precision technology to improve nutrient use and reduce...
TRANSCRIPT

Precision Technology to Improve Nutrient Use and Reduce Losses to
the EnvironmentFabián G. Fernández
Nutrient Management & Water Quality SpecialistDepartment of Soil, Water, and Climate
[email protected] Conference
17-19July2018,StLouisMO

Nutrient Management
Many hands….
• Brad Sorensen, MS• Catherine White, MS• Bhupinder Farmaha, Ph.D• Dan Schaefer• Kristin Greer

Nutrient Management
Where Should I Place Nutrients?•Can we get by with less?
•Where are the active roots?
•Where is the water?
•Are there environmental benefits to subsurface banding?
•How to take a soil sample?
Nutrient availability(uptake)

Nutrient Management
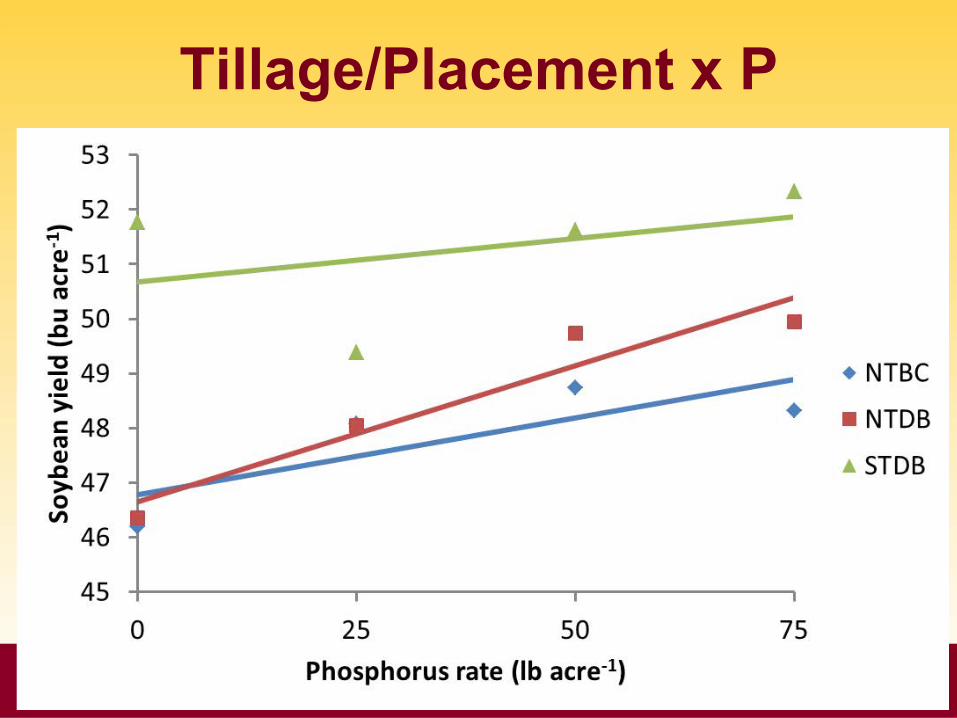
Tillage/Placement x P

Nutrient Management
Tillage/Placement x K
Nutrient Management
Tillage/Placement x P

Nutrient Management
Corn Yield, Farmers’ Fields
Nutrient Management
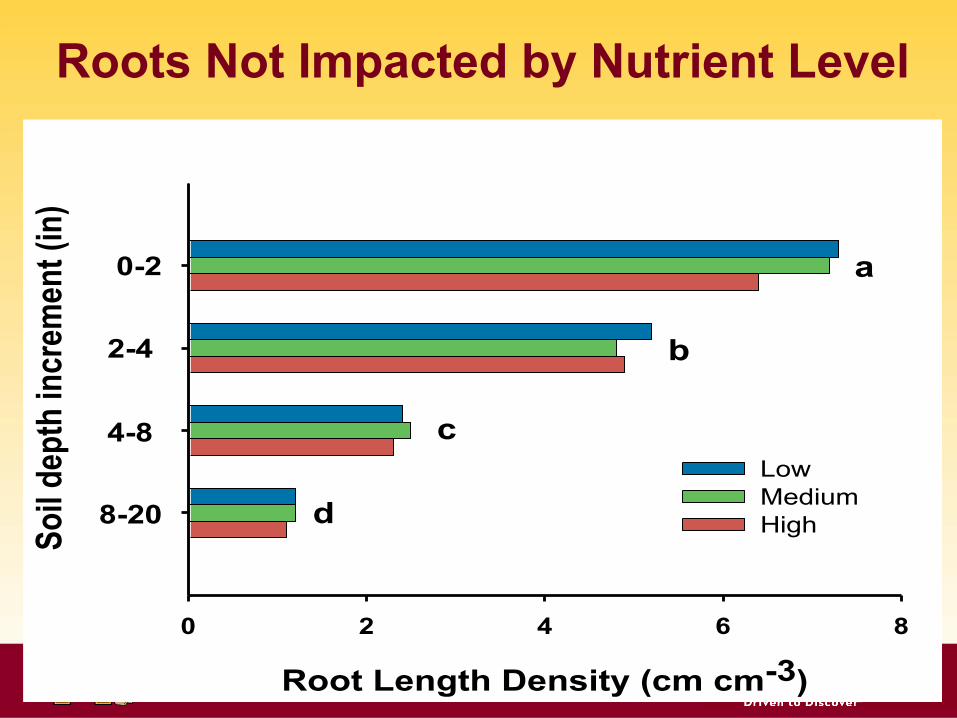
Roots Not Impacted by Nutrient Level
Root Length Density (cm cm-3)
0 2 4 6 8
Soil d
epth
incr
emen
t (in
)
LowMediumHigh8-20
4-8
2-4
0-2 a
b
c
d

Nutrient Management
Roots Not Impacted by Nutrient Placement

Nutrient Management
Soil Water

Nutrient Management
Placement Has Little to Do With Where Roots Take Up Nutrients
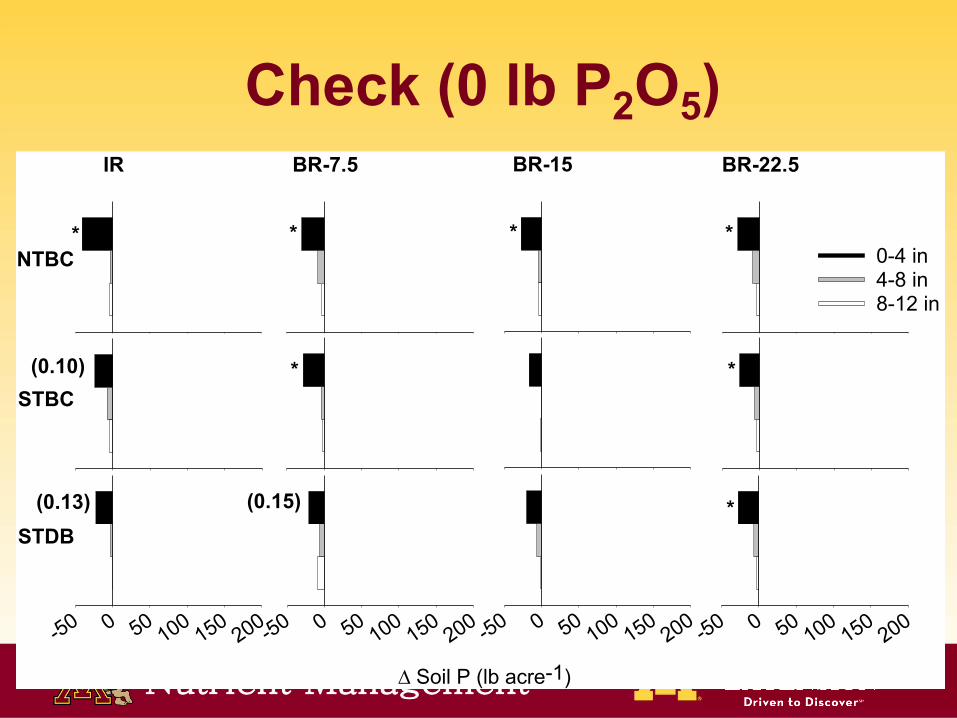
Change in soil test P over a three-year periodAveraged across IR BR at R1 development stage * indicate P≤ 0.1

Nutrient Management
Changes in Soil Test Levels are Related to Crop Uptake (no-till field)

Nutrient Management
Soil Organic Matter

Nutrient Management
Soil Penetration Resistance (PSI)
n =12

Nutrient Management
Nutrient Management
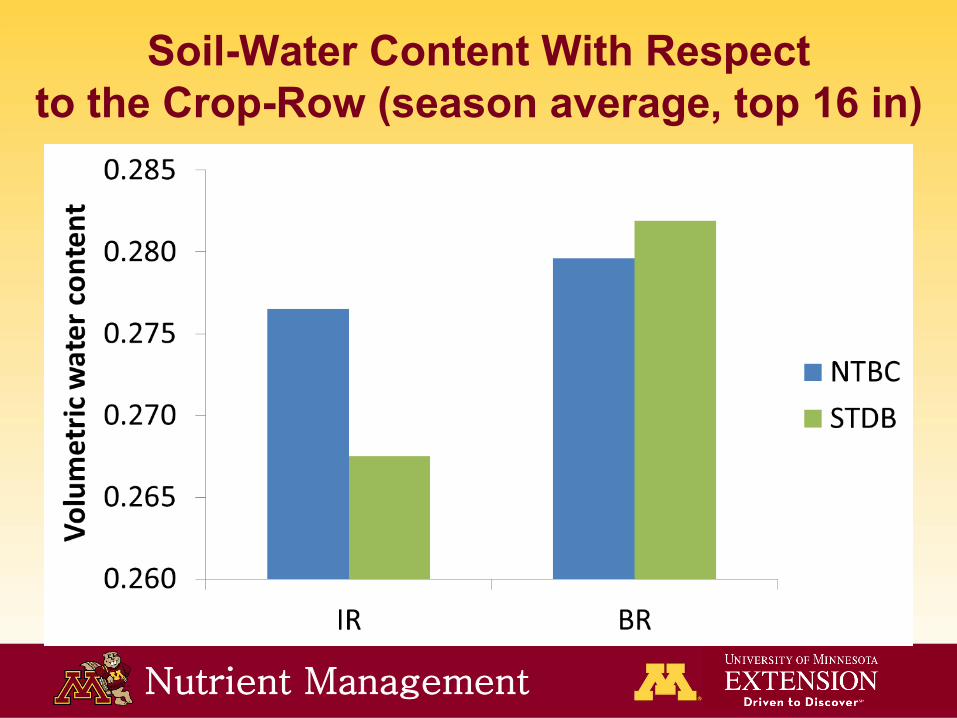
Soil-Water Content With Respect to the Crop-Row (season average, top 16 in)

Nutrient Management
In-Season Soil K Change, V12-R2(±70% of K uptake)

Nutrient Management
Efficiency
Tillage/fert. placement RSD
Apparent uptake rate
P Kcm2 cm-3 ___mg m-2 day-1___
NTBC 0.47a 3.02b 26.58bSTDB 0.40b 3.74a 32.67a
Nutrient Management
Nutrient Management
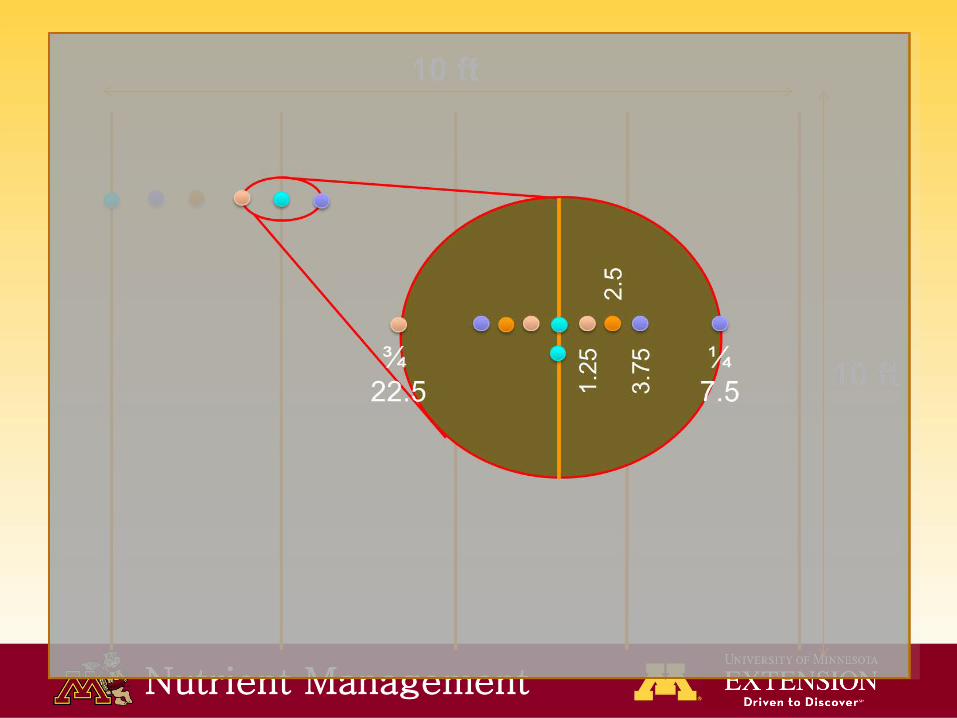
Soil Sampling When P and K are Banded
Nutrient Management
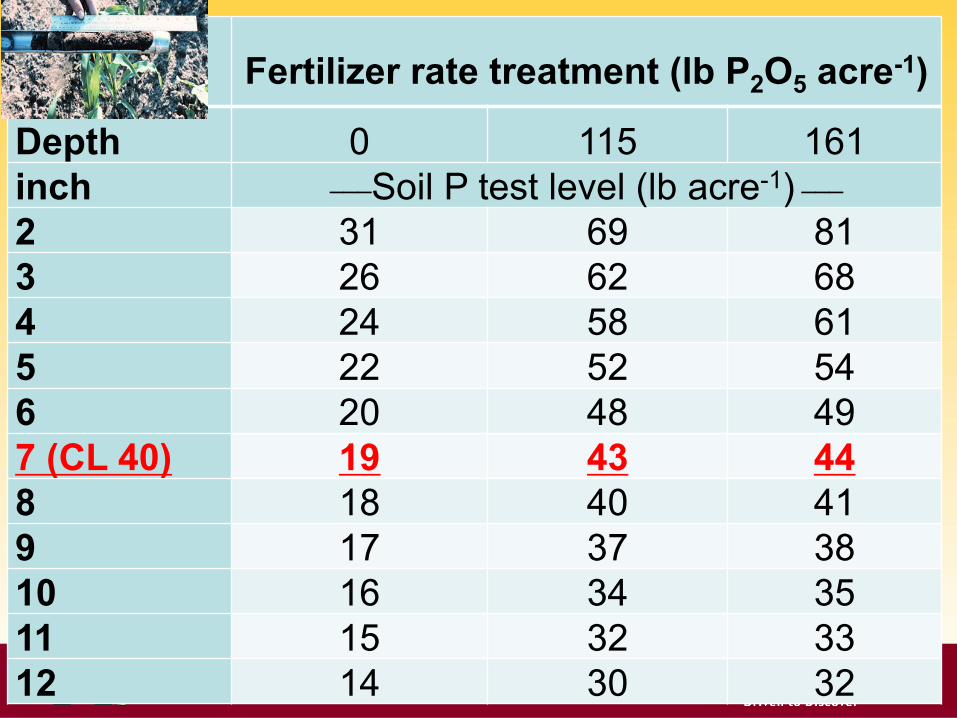
Fertilizer rate treatment (lb P2O5 acre-1)
Depth 0 115 161inch ___Soil P test level (lb acre-1) ___
2 31 69 813 26 62 684 24 58 615 22 52 546 20 48 497 (CL 40) 19 43 448 18 40 419 17 37 3810 16 34 3511 15 32 3312 14 30 32

Nutrient Management
Fertilizer rate treatment (lb K2O acre-1)
Depth 0 115 161inch ___Soil K test level (lb acre-1) ___
2 316 473 4423 276 418 3914 256 390 3665 238 353 3316 225 328 3087 (CL 300) 215 305 2878 207 287 2729 202 273 26110 198 262 25211 196 256 24512 195 251 239
Nutrient Management
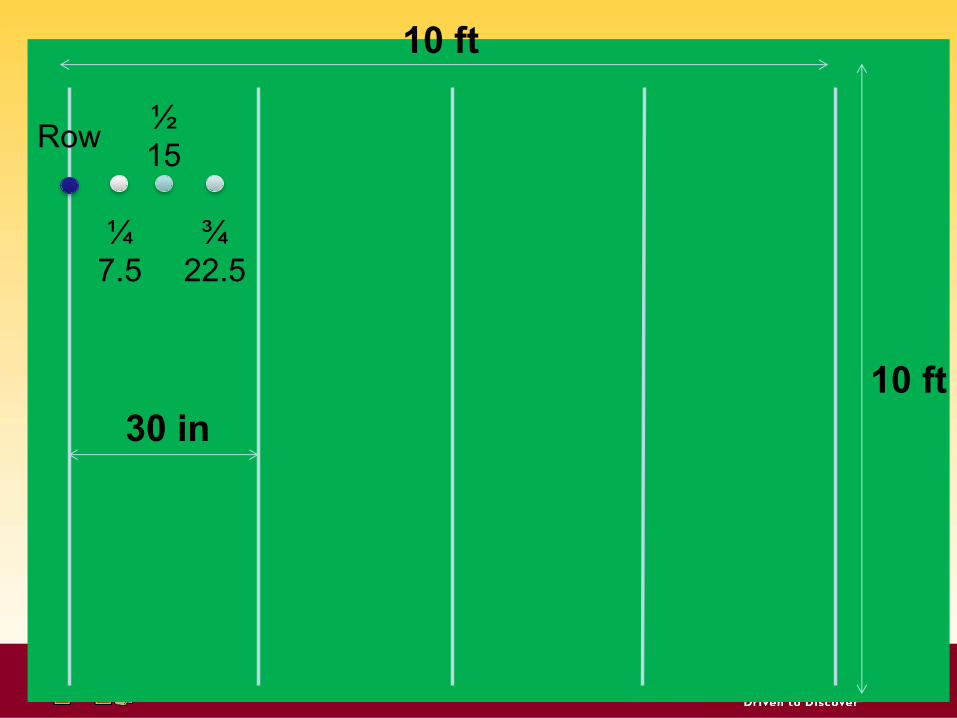
10 ft
10 ft
¼7.5
¾ 22.5
½ 15Row
30 in

Nutrient Management
10 ft
10 ft
Nutrient Management
BR-7.5IR BR-15 BR-22.5
0-4 in4-8 in8-12 in
NTBC
STBC
-50 0 50 100 150 200-50 0 50 100 150 200
D Soil P (lb acre-1)
-50 0 50 100 150 200 -50 0 50 100 150 200
STDB
* * * *
(0.10)
(0.13) (0.15)
* *
*
Check (0 lb P2O5)

Nutrient Management
Maintenance (115 lb P2O5)BR-7.5IR BR-15 BR-22.5
0-4 in4-8 in8-12 in
NTBC
STBC
-50 0 50 100 150 200-50 0 50 100 150 200
D Soil P (lb acre-1)
-50 0 50 100 150 200 -50 0 50 100 150 200
STDB (0.11)
* * * *

Nutrient Management
BR-7.5IR BR-15 BR-22.5
0-4 in4-8 in8-12 in
NTBC
STBC
D Soil P (lb acre-1)
-50 0 50 100 150 200-50 0 50 100 150 200 -50 0 50 100 150 200 -50 0 50 100 150 200
STDB
(0.12)
*
* *
*
*
* *
* *
*
Highest Rate (161 lb P2O5)

Nutrient Management
BR-7.5IR BR-15 BR-22.5
0-4 in4-8 in8-12 in
NTBC
STBC
D Soil K (lb acre-1)
-180 -90 0 90 180
D Soil K (lb acre-1)
-180 -90 0 90 180
D Soil K (lb acre-1)
-180 -90 0 90 180
D Soil K (lb acre-1)
-180 -90 0 90 180
STDB
*
* *
*
*
* * *
Highest Rate (161 lb K2O)
Nutrient Management

Nutrient Management
Small-Scale Fertilizer Movement/Application Variability
(STDB, 161 lb P2O5)Trimble Field Manager Soft ware with
two GPS receivers (tractor and tillage bar)
Nutrient Management
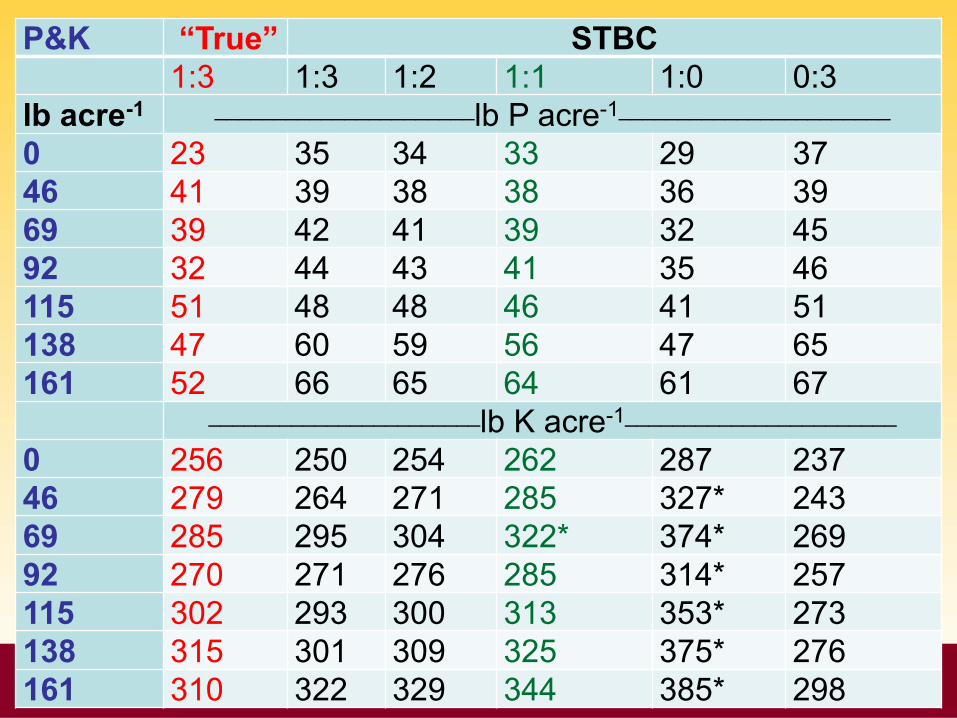
P&K “True” STBC1:3 1:3 1:2 1:1 1:0 0:3
lb acre-1 ______________________lb P acre-1_______________________
0 23 35 34 33 29 3746 41 39 38 38 36 3969 39 42 41 39 32 4592 32 44 43 41 35 46115 51 48 48 46 41 51138 47 60 59 56 47 65161 52 66 65 64 61 67
_______________________lb K acre-1_______________________
0 256 250 254 262 287 23746 279 264 271 285 327* 24369 285 295 304 322* 374* 26992 270 271 276 285 314* 257115 302 293 300 313 353* 273138 315 301 309 325 375* 276161 310 322 329 344 385* 298

Nutrient Management
P&K “True” STDB1:3 1:3 1:2 1:1 1:0 0:3
lb acre-1 _______________________lb P acre-1_______________________
0 23 24 24 23 21 2546 41 30 33 38 52 23*69 39 39 42 49 70* 28*92 32 49* 58* 74* 125* 24115 51 50 59 76* 128* 24*138 47 51 60 77* 133* 25*161 52 45 53 67 111* 23*
_______________________lb K acre-1_______________________
0 256 239 243 249 269 230*46 279 262 271 288 340* 236*69 285 276 286 306 366* 246*92 270 297* 309* 335* 411* 259115 302 292 306 335* 422* 249*138 315 323 343* 382* 498* 265*161 310 306 323 357* 460* 254*

Nutrient Management
Take Home Message• Adequate P and K levels are more important than fertilizer
placement• Tillage and not P and K placement had an important effect in
corn and soybean yields in our studies. Also strip-till had a positive benefit in soil properties
• No evidence that P and K rates can be reduced when banding the fertilizer
• When P and K are banded, for each core taken in the fertilizer band, 2-3 cores need to be taken away from the band
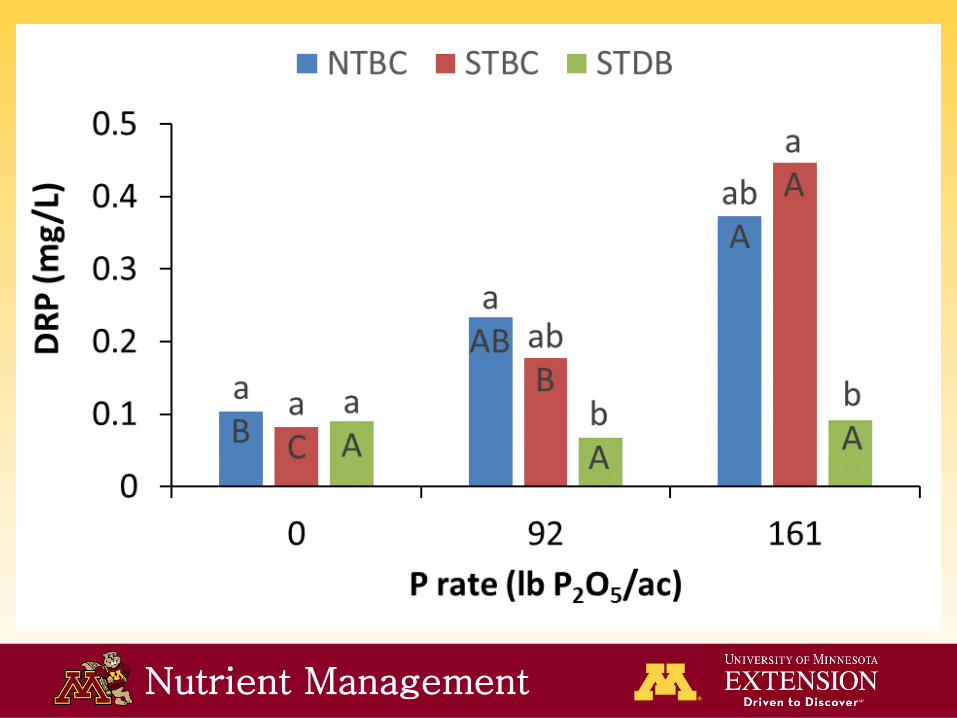
• While subsurface band P may have no agronomic benefit it can reduce P runoff potential
• Optimum P rates are important for agronomic and environmental reasons
Nutrient Management
6. Fernández, F.G., and D. Schaefer. 2012. Assessment of soil phosphorus and potassium following real time kinematic-guided broadcast and deep-band placement in strip-till and no-till. Soil Sci. Soc. Am. J. 76:1090-1099.
7. Farmaha, B.S., F.G. Fernández, and E.D. Nafziger. 2012a. Distribution of soybean roots, soil water, phosphorus and potassium concentrations with broadcast and subsurface-band fertilization. Soil Sci. Soc. Am. J. 76:1079-1089.
8. Farmaha, B.S., F.G. Fernández, and E.D. Nafziger. 2011. No-till and strip-till soybean production with surface and subsurface phosphorus and potassium fertilization. Agron. J. 103:1862-1869.
1. Yuan, M., F.G. Fernández, C.M. Pittelkow, K.D. Greer, and D. Schaefer. n.d.Phosphorus runoff from various application methods under conservation tillage with minimal slope. J. Environ. Qual. (Submitted)
2. Sorensen, B., F.G. Fernández, and M.B. Villamil,. n.d. A comparison of soil properties in long-term no-till and strip-till sytems. Agron. J. 107: 1339-1346.
3. Fernández, F.G., B.S. Farmaha, and E.D. Nafziger. 2012. Soil fertility status of soils in Illinois. Commun. Soil Sci. and Plant Anal. 43: 2897-2914.
4. Farmaha, B.S., F.G. Fernández, and E.D. Nafziger. 2012b. Soybean seed composition, aboveground growth, and nutrient accumulation with phosphorus and potassium fertilization in no-till and strip-till. Agron. J. 104:1006-1015.
5. Fernández, F.G., and C.E. White. 2012. No-till and strip-till corn production with broadcast and subsurface-band phosphorus and potassium. Agron. J. 104: 996-1005.

Nutrient Management
Thank You