ey_a vision for growth 2015
TRANSCRIPT

A vision for growth
Business outlook survey
Romania 2015

Page 2
What is “A vision for growth”?
“A vision for growth” is a survey that explores the perceptions of top executives from major
companies operating in Romania regarding the business outlook for 2015.
This EY report is based on an online survey of 202 C-suite level executives from companies in various sectors,
who provided a perspective on how the domestic business environment is perceived at the beginning of 2015.
5 main
findings
1
48% of respondents foresee a significant growth of +10 to +31% for their company’s turnover in 2015
compared with only 28% in 2014, while 26% expect a growth rate of +5 to +10% in 2015, compared with 30%
at the beginning of last year.
The forecasts regarding the evolution of the profit at the beginning of 2015 are rather similar with those
recorded at the beginning of 2014. 25% of the respondents expect the profit growth rate of their company
to range between +5 to +10% in 2015 compared with 21% in 2014, and a slightly higher percentage of
34% in 2015 vs. 33% in 2014 expect the profit of their company to grow between +10 to +31%.
23% of respondents say they have earmarked growth rates for their investments of 5% to 10% in 2015,
followed by 19% who say they will increase investments by 10% to 20% in 2015, and 17% who foresee
their investments to go up from 20% to +31% in the next 12 months.
At the beginning of 2015, 6% of respondents say salaries in their companies are expected to go up between
10% to 20%, compared to 2% in 2014. Another important difference is in the bracket “5% to 10%”, which has
gone up from 19% in 2014 to 30% in 2015. Most importantly, over the past 3 editions of the survey, there has
been a constant decrease in the number of respondents who foresaw no salary increase in their company for
that year: from 42% in 2013, to 19% in 2014, and to 10% in 2015.
Only 19% of respondents expect no increase in the employees number in 2015, down from 37% in early
2014. The good news is that at the beginning of 2015, 21% of respondents say they expect the number
of employees in their company to grow between +10% to +31%, compared to only 14% in 2014.
2
3
4
5
See here the previous edition of the survey

Page 3
A vision for growth Business outlook survey
Romania 2015
Our survey reflects the increased focus
companies have on sustainable growth in a
business environment which brings both
challenges and opportunities.
Bogdan Ion, Managing Partner, EY Romania

Page 4
Please indicate the main three elements that you use to define success. (multiple answers)
Question 1
In 2015 companies measure their success by a combination of customer satisfaction, financial results and market share.
Compared to 2014 edition, in the current edition all top three criteria decrease in percentages: “financial results” goes down
from 96% to 68%, “customer satisfaction” decreases from 78% to 72%, and “market share” decreases from 63% to 55%.
Most notably, “customer satisfaction” exchange places with financial results and is now topping up the ranking.
Total Respondents: 186
(Skipped this question: 16
4%
6%
7%
15%
41%
55%
68%
72%
0% 10% 20% 30% 40% 50% 60% 70% 80%
Agility and streamlined processes
Going public
Number of employees
Number of years on the market
Brand awareness
Market share
Financial results
Customer satisfaction
See here the previous edition of the survey

Page 5
How much do you expect your turnover to grow in 2015? (one answer)
Question 2
48% of respondents foresee a significant growth of +10 to +31% for their company’s turnover in 2015 compared with 28%
in 2014, while 26% expect a growth rate of +5 to +10% in 2015, compared with 30% at the beginning of last year.
0%
0%
2%
1%
3%
4%
16%
26%
35%
7%
6%
0% 5% 10% 15% 20% 25% 30% 35% 40%
Exceeding -31%
-20% to -30%
-10% to -20%
-5% to -10%
-1% to -5%
0%
1% to 5%
5% to 10%
10% to 20%
20% to 30%
Exceeding 31%
Total Respondents: 184
(Skipped this question: 18)
See here the previous edition of the survey

Page 6
How much do you expect your turnover to grow in 2015? (one answer)
Question 2(a) – By industry sector
In 2015, the following industries foresee growth rates exceeding 31%: pharmaceutical / healthcare (25%), construction /
real estate (18%), followed by information technology, and manufacturing industry (10% each).
Industry Sector -10 to
-20%
-5 to
-10%
-1% to
-5% 0%
+1% to
+5%
+5 to
+10%
+10 to
+20%
+20 to
+30%
Over
31%
Industry / Manufacturing 5% 21% 32% 37% 5%
Services 4% 4% 4% 13% 17% 38% 17% 4%
Construction / Real Estate 9% 28% 18% 18% 9% 18%
Power & Energy 10% 20% 30% 30% 10%
Information Technology (IT) 20% 30% 40% 10%
Retail & Wholesale Trade 20% 30% 30% 10% 10%
Food & Beverages /
Agriculture 20% 20% 60%
Transportation 60% 40%
Pharmaceuticals / Healthcare 75% 25%
Telecom 50% 50%
See here the previous edition of the survey

Page 7
How much do you expect your turnover to grow in 2015? (one answer)
Question 2(a) – By industry sector
These are the industry sectors which received the largest number of answers per industry. Therefore, we show the
distribution of answers by these six industries for the questions which regard expected evolution of turnover, profit,
investments, number of employees, salary level for 2015.
5%
21% 32%
37% 5%
0% 10% 20% 30% 40%
-10 to -20%-5 to -10%
-1% to -5%0%
1% to +5%+5 to +10%
+10 to +20%+20 to +30%
Exceeding 31%
Industry / Manufacturing
4%
4%
4%
13%
17%
38%
17%
4%
0% 10% 20% 30% 40%
-10 to -20%
-5 to -10%
-1% to -5%
0%
1% to +5%
+5 to +10%
+10 to +20%
+20 to +30%
Exceeding 31%
Services
9%
28%
18%
18%
9%
18%
0% 10% 20% 30%
-10 to -20%
-5 to -10%
-1% to -5%
0%
1% to +5%
+5 to +10%
+10 to +20%
+20 to +30%
Exceeding 31%
Construction / Real Estate
10%
20%
30%
30%
10%
0 0.1 0.2 0.3 0.4
-10 to -20%
-5 to -10%
-1% to -5%
0%
1% to +5%
+5 to +10%
+10 to +20%
+20 to +30%
Exceeding 31%
Power & Energy
20%
30%
40%
10%
0 0.2 0.4 0.6
-10 to -20%
-5 to -10%
-1% to -5%
0%
1% to +5%
+5 to +10%
+10 to +20%
+20 to +30%
Exceeding 31%
Information Technology (IT)
20%
30%
30%
10%
10%
0 0.1 0.2 0.3 0.4
-10 to -20%
-5 to -10%
-1% to -5%
0%
1% to +5%
+5 to +10%
+10 to +20%
+20 to +30%
Exceeding 31%
Retail & Wholesale Trade
See here the previous edition of the survey

Page 8
How much do you expect your turnover to grow in 2015? (one answer)
Question 2(b) – By revenue level
The companies which have revenue levels exceeding 100 M EUR (for 2014) appear to be more pessimistic regarding the
evolution of their turnover in 2015, while the companies with revenue level of less than 1 M EUR are more optimistic
expecting their turnover to grow with percentages from +10% to +31%.
Total Respondents: 184
(Skipped this question: 18)
50%
67%
50%
29%
11%
11%
14%
33%
6%
4%
3%
25%
41%
36%
36%
50%
100%
12%
30%
22%
14%
50%
25%
12%
19%
28%
72%
50%
0% 20% 40% 60% 80% 100%
-10 to -20%
-5 to -10%
-1% to -5%
0
1% to +5%
+5 to +10%
+10 to +20%
+20 to +30%
Exceeding 31%
100 M EUR +
50-100 M EUR
10-50 M EUR
1-10 M EUR
Less than 1 M EUR
See here the previous edition of the survey

Page 9
How much do you expect your profit to grow in 2015? (one answer)
Question 3
The forecasts regarding the evolution of the profit at the beginning of 2015 are rather similar with those recorded at the
beginning of 2014. 25% of the respondents expect the profit growth rate of their company to range between +5 to +10% in
2015 compared with 21% in 2014, and a slightly higher percentage of 34% in 2015 vs. 33% in 2014 expect the profit of
their company to grow between +10 to +31%.
0%
1%
3%
0%
1%
8%
28%
25%
20%
5%
9%
0% 5% 10% 15% 20% 25% 30%
Exceeding -31%
-20% to -30%
-10% to -20%
-5% to -10%
-1% to -5%
0%
1% to 5%
5% to 10%
10% to 20%
20% to 30%
Exceeding 31%
Total Respondents: 184
(Skipped this question: 18)
See here the previous edition of the survey

Page 10
How much do you expect your profit to grow in 2015? (one
answer)
Question 3(a) – By industry sector
Surprisingly, 10% of respondents from the information technology industry foresee a significant decrease of -10%
to -20% for their company’s profit in 2015, while 11% of the respondents from the manufacturing industry and 10% from
the power & energy industry expect a profit decrease of -5 to -10%.
Industry Sector -10 to
-20%
-5 to
-10%
-1% to
-5% 0%
+1% to
+5%
+5 to
+10%
+10 to
+20%
+20 to
+30%
Over
31%
Industry / Manufacturing 11% 5% 37% 21% 11% 5% 11%
Services 4% 17% 17% 21% 21% 17% 4%
Construction / Real Estate 9% 37% 9% 18% 27%
Power & Energy 10% 40% 50%
Information Technology (IT) 10% 30% 30% 30%
Retail & Wholesale Trade 20% 20% 40% 20%
Food & Beverages /
Agriculture 20% 40% 20% 20%
Transportation 40% 40% 20%
Pharmaceuticals / Healthcare 25% 25% 50%
Telecom 50% 25% 25%
See here the previous edition of the survey

Page 11
How much do you expect your profit to grow in 2015? (one answer)
These are the industry sectors which received the largest number of answers per industry. Therefore, we show the
distribution of answers by these six industries for the questions which regard expected evolution of turnover, profit,
investments, number of employees, salary level for 2015.
Question 3(a) – By industry sector
11%
5%
37%
21%
11%
5%
11%
0% 10% 20% 30% 40%
-20 to -30%
-10 to -20%
-1% to -5%
0%
1% to +5%
+5 to +10%
+10 to +20%
+20 to +30%
Exceeding 31%
Industry / Manufacturing
4%
17%
17%
21%
21%
17%
4%
0 0.1 0.2 0.3
-20 to -30%
-10 to -20%
-1% to -5%
0%
1% to +5%
+5 to +10%
+10 to +20%
+20 to +30%
Exceeding 31%
Services
9% 37%
9% 18%
27%
0 0.1 0.2 0.3 0.4
-20 to -30%-10 to -20%-1% to -5%
0%1% to +5%+5 to +10%
+10 to +20%+20 to +30%
Exceeding 31%
Construction / Real Estate
10%
40%
50%
0% 20% 40% 60%
-20 to -30%
-10 to -20%
-1% to -5%
0%
1% to +5%
+5 to +10%
+10 to +20%
+20 to +30%
Exceeding 31%
Power & Energy
10%
30%
30%
30%
0% 10% 20% 30% 40%
-20 to -30%
-10 to -20%
-1% to -5%
0%
1% to +5%
+5 to +10%
+10 to +20%
+20 to +30%
Exceeding 31%
Information Technology (IT)
20%
20%
40%
20%
0 0.2 0.4 0.6
-20 to -30%
-10 to -20%
-1% to -5%
0%
1% to +5%
+5 to +10%
+10 to +20%
+20 to +30%
Exceeding 31%
Retail & Wholesale Trade
See here the previous edition of the survey

Page 12
How much do you expect your profit to grow in 2015? (one answer)
Question 3(b) – By revenue level
Companies with revenue levels exceeding 100 M EUR are again on the reserved side regarding the envisaged profit
growth rates for 2015, but the companies with revenue levels between 10-50 M EUR see the year 2015 as having more
favorable prospects for the growth of their profit in the following 12 months.
Total Respondents: 184
(Skipped this question: 18)
67%
31%
19%
5%
11%
33%
28%
27%
38%
20%
33%
100%
100%
25%
24%
35%
14%
20%
12%
25%
5%
20%
11%
50%
17%
19%
38%
40%
33%
0% 10% 20% 30% 40% 50% 60% 70% 80% 90% 100%
-20 to -30%
-10 to -20%
-1% to -5%
0%
1% to +5%
+5 to +10%
+10 to +20%
+20 to +30%
Exceeding 31%
100 M EUR +
10-50 M EUR
1-10 M EUR
50-100 M EUR
Less than 1 M EUR
See here the previous edition of the survey

Page 13
How much do you expect your investments to grow in 2015? (one answer)
Question 4
23% of respondents say they have earmarked growth rates for their investments of 5% to 10% in 2015, followed by 19%
who say they will increase investments by 10% to 20% in 2015, and 17% who foresee their investments to go up with
qrowth rates between 20% to +31% in the next 12 months.
0%
1%
1%
0%
2%
19%
17%
23%
19%
7%
10%
0% 5% 10% 15% 20% 25%
Exceeding -31%
-20% to -30%
-10% to -20%
-5% to -10%
-1% to -5%
0%
1% to 5%
5% to 10%
10% to 20%
20% to 30%
Exceeding 31%
Total Respondents: 184
(Skipped this question: 18)
See here the previous edition of the survey

Page 14
How much do you expect your investments to grow in 2015? (one answer)
Question 4(a) – By industry sector
The table shows that there are many industries which have earmarked significant investment growth rates for 2015.
Moreover, there are industries such as manufacturing, services, constructions / real estate, IT, food & beverages /
agriculture, telecom which say their investments for 2015 will go up by more than 31%.
Industry Sector -10 to
-20%
-5 to
-10%
-1% to
-5% 0%
+1% to
+5%
+5 to
+10%
+10 to
+20%
+20 to
+30%
Over
31%
Industry / Manufacturing 6% 6% 13% 13% 25% 15% 13% 9%
Services 10% 33% 24% 14% 10% 10%
Construction / Real Estate 22% 33% 23% 11% 11%
Power & Energy 11% 11% 12% 11% 33% 22%
Information Technology (IT) 20% 20% 30% 10% 20%
Retail & Wholesale Trade 25% 25% 50%
Food & Beverages /
Agriculture 20% 20% 20% 40%
Transportation 25% 25% 25% 25%
Pharmaceuticals / Healthcare 50% 25% 25%
Telecom 67% 33%
See here the previous edition of the survey

Page 15
How much do you expect your investments to grow in 2015? (one answer)
Question 4(a) – By industry sector
These are the industry sectors which received the largest number of answers per industry. Therefore, we show the
distribution of answers by these six industries for the questions which regard expected evolution of turnover, profit,
investments, number of employees, salary level for 2015.
6%
6%
13%
13%
25%
15%
13%
9%
0% 10% 20% 30%
-20 to -30%
-10 to -20%
-1% to -5%
0%
1% to +5%
+5 to +10%
+10 to +20%
+20 to +30%
Exceeding 31%
Industry / Manufacturing
10%
33%
24%
14%
10%
10%
0 0.2 0.4
-20 to -30%
-10 to -20%
-1% to -5%
0%
1% to +5%
+5 to +10%
+10 to +20%
+20 to +30%
Exceeding 31%
Services
22%
33%
23%
11%
11%
0 0.2 0.4
-20 to -30%
-10 to -20%
-1% to -5%
0%
1% to +5%
+5 to +10%
+10 to +20%
+20 to +30%
Exceeding 31%
Construction / Real Estate
11%
11%
12%
11%
33%
22%
0% 20% 40%
-20 to -30%
-10 to -20%
-1% to -5%
0%
1% to +5%
+5 to +10%
+10 to +20%
+20 to +30%
Exceeding 31%
Power & Energy
20%
20%
30%
10%
20%
0 0.1 0.2 0.3 0.4
-20 to -30%
-10 to -20%
-1% to -5%
0%
1% to +5%
+5 to +10%
+10 to +20%
+20 to +30%
Exceeding 31%
Information Technology (IT)
25%
25%
50%
0 0.2 0.4 0.6
-20 to -30%
-10 to -20%
-1% to -5%
0%
1% to +5%
+5 to +10%
+10 to +20%
+20 to +30%
Exceeding 31%
Retail & Wholesale Trade
See here the previous edition of the survey

Page 16
How much do you expect your investments to grow in 2015? (one answer)
Question 4(b) – By revenue level
According to the survey findings, respondents from companies with revenue levels exceeding 100 M EUR expect the investments of
their companies rather to go down in 2015, while respondent from the companies with revenue levels of 1-10 M EUR and those with
less than 1 M EUR expect a positive evolution of their investments, with growth rates from 1% to +31%.
Total Respondents: 184
(Skipped this question: 18)
100%
100%
29%
17%
13%
20%
6%
14%
20%
100%
14%
33%
23%
45%
17%
10%
43%
11%
25%
15%
26%
50%
14%
33%
25%
20%
57%
20%
0% 10% 20% 30% 40% 50% 60% 70% 80% 90% 100%
-20 to -30%
-10 to -20%
-1% to -5%
0%
1% to +5%
+5 to +10%
+10 to +20%
+20 to +30%
Exceeding 31%
100 M EUR +
50-100 M EUR
10-50 M EUR
1-10 M EUR
Less than 1 M EUR
See here the previous edition of the survey

Page 17
Only 19% of respondents expect no increase in the employees number in 2015, down from 37% in early 2014. The good
news is that at the beginning of 2015, 21% of respondents say they expect the number of employees in their company to
grow between +10% to +31%, compared to only 14% in 2014.
How much do you expect your number of employees to grow in 2015? (one answer)
Question 5
0%
0%
2%
3%
5%
19%
36%
14%
14%
4%
3%
0% 5% 10% 15% 20% 25% 30% 35% 40%
Exceeding -31%
-20% to -30%
-10% to -20%
-5% to -10%
-1% to -5%
0%
1% to 5%
5% to 10%
10% to 20%
20% to 30%
Exceeding 31%
Total Respondents: 184
(Skipped this question: 18)
See here the previous edition of the survey

Page 18
Question 5(a) – By industry sector
There are two industries that expect major increases in the number of employees in 2015, namely construction / real estate and
information technology. However, all the industries foresee an increase in the number of employees of +1% to +5%, this being the
bracket where transportation, retail & wholesale, and pharmaceuticals / healthcare industry sectors show the highest percentages.
Industry Sector -10 to
-20%
-5 to
-10%
-1% to
-5% 0%
+1% to
+5%
+5 to
+10%
+10 to
+20%
+20 to
+30%
Over
31%
Industry / Manufacturing 6% 11% 6% 33% 22% 22%
Services 11% 11% 26% 26% 21% 5%
Construction / Real Estate 11% 11% 33% 11% 11% 22%
Power & Energy 22% 44% 22% 11%
Information Technology (IT) 22% 33% 22% 11% 11%
Retail & Wholesale Trade 75% 25%
Food & Beverages /
Agriculture 25% 25% 50%
Transportation 100%
Pharmaceuticals / Healthcare 75% 25%
Telecom 67% 33%
How much do you expect the number of employees to grow in 2015? (one answer)
See here the previous edition of the survey

Page 19
These are the industry sectors which received the largest number of answers per industry. Therefore, we show the
distribution of answers by these six industries for the questions which regard expected evolution of turnover, profit,
investments, number of employees, salary level for 2015.
How much do you expect your number of employees to grow in 2015? (one answer)
Question 5(a) – By industry sector
6%
11%
6%
33%
22%
22%
0% 10% 20% 30% 40%
-10 to -20%
-5 to -10%
-1% to -5%
0%
1% to +5%
+5 to +10%
+10 to +20%
+20 to +30%
Exceeding 31%
Industry / Manufacturing
11%
11%
26%
26%
21%
5%
0% 10% 20% 30%
-10 to -20%
-5 to -10%
-1% to -5%
0%
1% to +5%
+5 to +10%
+10 to +20%
+20 to +30%
Exceeding 31%
Services
11%
11%
33%
11%
11%
22%
0% 10% 20% 30% 40%
-10 to -20%
-5 to -10%
-1% to -5%
0%
1% to +5%
+5 to +10%
+10 to +20%
+20 to +30%
Exceeding 31%
Construction / Real Estate
22%
44%
22%
11%
0 0.2 0.4 0.6
-10 to -20%
-5 to -10%
-1% to -5%
0%
1% to +5%
+5 to +10%
+10 to +20%
+20 to +30%
Exceeding 31%
Power & Energy
22%
33%
22%
11%
11%
0 0.1 0.2 0.3 0.4
-10 to -20%
-5 to -10%
-1% to -5%
0%
1% to +5%
+5 to +10%
+10 to +20%
+20 to +30%
Exceeding 31%
Information Technology (IT)
75%
25%
0 0.2 0.4 0.6 0.8
-10 to -20%
-5 to -10%
-1% to -5%
0%
1% to +5%
+5 to +10%
+10 to +20%
+20 to +30%
Exceeding 31%
Retail & Wholesale Trade
See here the previous edition of the survey
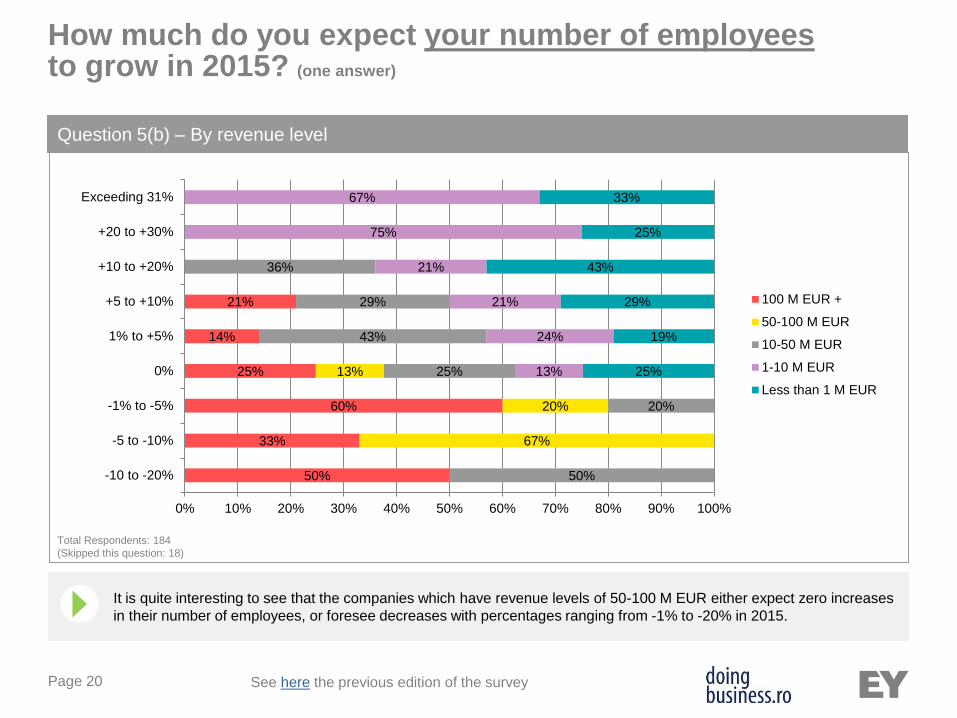
Page 20
It is quite interesting to see that the companies which have revenue levels of 50-100 M EUR either expect zero increases
in their number of employees, or foresee decreases with percentages ranging from -1% to -20% in 2015.
How much do you expect your number of employees to grow in 2015? (one answer)
Question 5(b) – By revenue level
Total Respondents: 184
(Skipped this question: 18)
50%
33%
60%
25%
14%
21%
67%
20%
13%
50%
20%
25%
43%
29%
36%
13%
24%
21%
21%
75%
67%
25%
19%
29%
43%
25%
33%
0% 10% 20% 30% 40% 50% 60% 70% 80% 90% 100%
-10 to -20%
-5 to -10%
-1% to -5%
0%
1% to +5%
+5 to +10%
+10 to +20%
+20 to +30%
Exceeding 31%
100 M EUR +
50-100 M EUR
10-50 M EUR
1-10 M EUR
Less than 1 M EUR
See here the previous edition of the survey

Page 21
At the beginning of 2015, 6% of respondents say salaries in their companies are expected to go up between 10% to 20%, compared to
2% in 2014. Another important difference is in the bracket “5% to 10%”, which has gone up from 19% in 2014 to 30% in 2015. Most
importantly, over the past 3 editions of the survey, there has been a constant decrease in the number of respondents who foresaw no
salary increase in their company for that year: from 42% in 2013, to 19% in 2014, and to 10% in 2015.
How much do you expect the salary level in your company to grow in 2015? (one answer)
Question 6
0%
0%
1%
2%
10%
49%
30%
6%
2%
0% 10% 20% 30% 40% 50% 60%
Exceeding -20%
-10% to -20%
-5% to -10%
-1% to -5%
0%
1% to 5%
5% to 10%
10% to 20%
Exceeding 20%
Total Respondents: 184
(Skipped this question: 18)
See here the previous edition of the survey

Page 22
Question 6(a) – By industry sector
There are two industries that expect major increases in the salary level in 2015, namely services, and construction / real
industry sectors. However, all the industries foresee an increase in the salary level of +1% to +5%, this being the bracket
where transportation, and food & beverages / agriculture industry sectors show the highest percentages.
Industry Sector -5 to
-10%
-1% to
-5% 0%
+1% to
+5%
+5 to
+10%
+10 to
+20%
Over
20%
Industry / Manufacturing 6% 63% 26% 5%
Services 4% 5% 10% 38% 24% 14% 5%
Construction / Real Estate 10% 60% 20% 10%
Power & Energy 10% 10% 60% 20%
Information Technology (IT) 30% 50% 20%
Retail & Wholesale Trade 50% 50%
Food & Beverages / Agriculture 75% 25%
Transportation 100%
Pharmaceuticals / Healthcare 50% 50%
Telecom 67% 33%
How much do you expect the salary level in your company to grow in 2015? (one answer)
See here the previous edition of the survey

Page 23
These are the industry sectors which received the largest number of answers per industry. Therefore, we show the
distribution of answers by these six industries for the questions which regard expected evolution of turnover, profit,
investments, number of employees, salary level for 2015.
How much do you expect the salary level in your company to grow in 2015? (one answer)
Question 6(a) – By industry sector
6%
63%
26%
5%
0 0.2 0.4 0.6 0.8
-5 to -10%
-1% to -5%
0%
1% to +5%
+5 to +10%
+10 to +20%
Exceeding 20%
Industry / Manufacturing
4%
5%
10%
38%
24%
14%
5%
0% 10% 20% 30% 40%
-5 to -10%
-1% to -5%
0%
1% to +5%
+5 to +10%
+10 to +20%
Exceeding 20%
Services
10%
60%
20%
10%
0 0.2 0.4 0.6 0.8
-5 to -10%
-1% to -5%
0%
1% to +5%
+5 to +10%
+10 to +20%
Exceeding 20%
Construction / Real Estate
10%
10%
60%
20%
0% 20% 40% 60% 80%
-5 to -10%
-1% to -5%
0%
1% to +5%
+5 to +10%
+10 to +20%
Exceeding 20%
Power & Energy
30%
50%
20%
0 0.2 0.4 0.6
-5 to -10%
-1% to -5%
0%
1% to +5%
+5 to +10%
+10 to +20%
Exceeding 20%
Information Technology (IT)
50%
50%
0 0.2 0.4 0.6
-5 to -10%
-1% to -5%
0%
1% to +5%
+5 to +10%
+10 to +20%
Exceeding 20%
Retail & Wholesale Trade
See here the previous edition of the survey

Page 24
In case of the salary level also, the it is interesting to note that the companies which have revenue levels of 50-100 M
EUR either expect zero increases in the salary level of their employees, or foresee a slight increase thereof, with
percentages ranging from 1% to 5%.
How much do you expect the salary level in your company to grow in 2015? (one answer)
Question 6(b) – By revenue level
Total Respondents: 184
(Skipped this question: 18)
50%
25%
26%
10%
25%
6%
25%
34%
32%
17%
25%
24%
23%
33%
100%
50%
10%
35%
50%
100%
0% 10% 20% 30% 40% 50% 60% 70% 80% 90% 100%
-5 to -10%
-1% to -5%
0%
1% to +5%
+5 to +10%
+10 to +20%
Exceeding 20%
100 M EUR +
50-100 M EUR
10-50 M EUR
1-10 M EUR
Less than 1 M EUR
See here the previous edition of the survey

Page 25
Confidence in industry growth remains rather similar in 2015 compared with 2014, but the percentage of “very confident”
responses go up from 7% to 15%, breaking the double digit threshold.
How confident do you feel regarding the growth of your industry for the next 12 months? (one answer)
Question 7
Total Respondents: 175
(Skipped this question: 27)
7%
43%
35%
15%
0% 5% 10% 15% 20% 25% 30% 35% 40% 45% 50%
Not at all confident
Slightly confident
Somewhat confident
Very confident
See here the previous edition of the survey
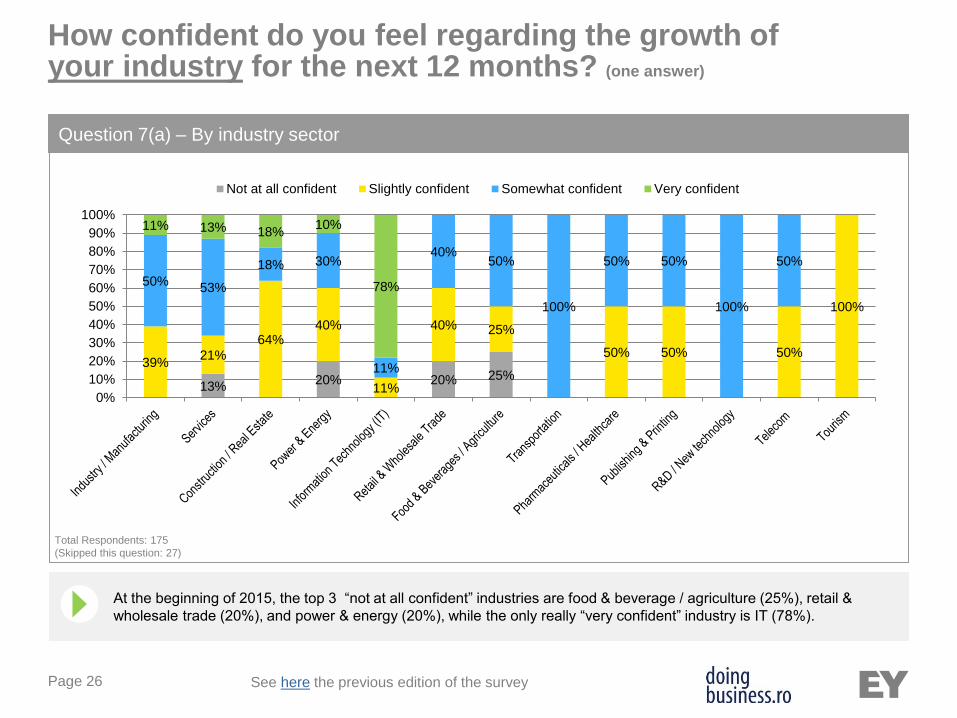
Page 26
At the beginning of 2015, the top 3 “not at all confident” industries are food & beverage / agriculture (25%), retail &
wholesale trade (20%), and power & energy (20%), while the only really “very confident” industry is IT (78%).
How confident do you feel regarding the growth of your industry for the next 12 months? (one answer)
Question 7(a) – By industry sector
Total Respondents: 175
(Skipped this question: 27)
13% 20% 20% 25%
39% 21%
64% 40%
11%
40% 25%
50% 50% 50%
100%
50% 53%
18% 30%
11%
40% 50%
100%
50% 50%
100%
50%
11% 13% 18% 10%
78%
0%
10%
20%
30%
40%
50%
60%
70%
80%
90%
100%
Not at all confident Slightly confident Somewhat confident Very confident
See here the previous edition of the survey
Page 27
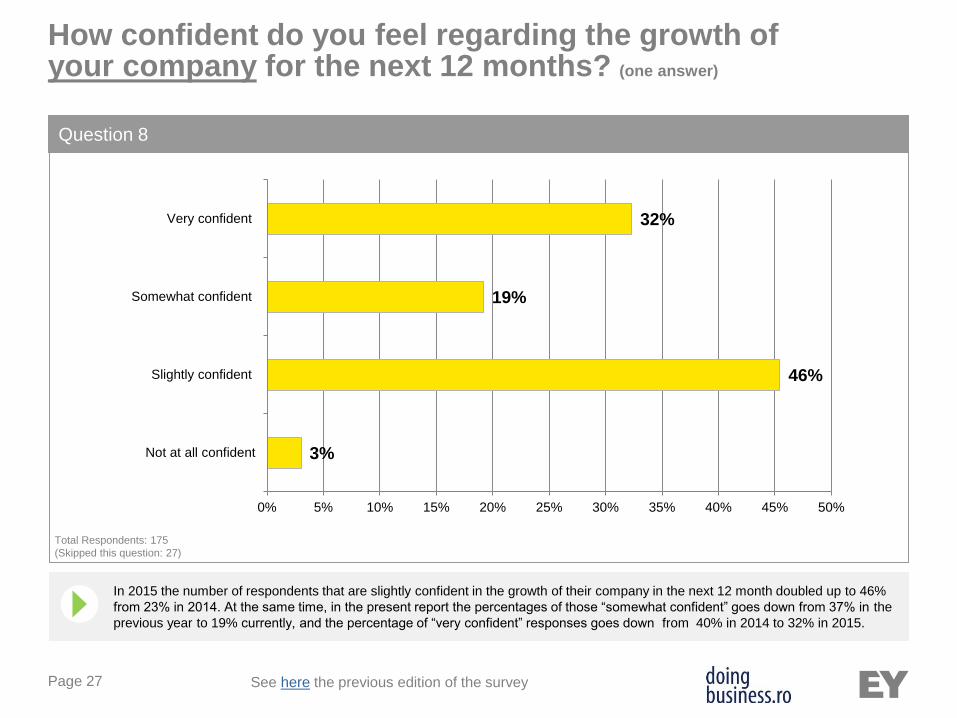
In 2015 the number of respondents that are slightly confident in the growth of their company in the next 12 month doubled up to 46%
from 23% in 2014. At the same time, in the present report the percentages of those “somewhat confident” goes down from 37% in the
previous year to 19% currently, and the percentage of “very confident” responses goes down from 40% in 2014 to 32% in 2015.
How confident do you feel regarding the growth of your company for the next 12 months? (one answer)
Question 8
3%
46%
19%
32%
0% 5% 10% 15% 20% 25% 30% 35% 40% 45% 50%
Not at all confident
Slightly confident
Somewhat confident
Very confident
Total Respondents: 175
(Skipped this question: 27)
See here the previous edition of the survey

Page 28
At the beginning of 2015, the “not at all confident” companies are those from power & energy (20%),
while the “very confident” companies are those from IT (67%).
How confident do you feel regarding the growth of your company for the next 12 months? (one answer)
Question 8(a) – By industry
Total Respondents: 175
(Skipped this question: 27)
4%
20% 11%
24% 36% 10%
40%
25% 25%
50%
25%
56% 36%
27%
60%
33%
40%
25% 80%
50%
50%
100%
25%
100%
33% 36% 36%
10%
67%
20%
50%
20% 25%
50%
0%
10%
20%
30%
40%
50%
60%
70%
80%
90%
100%
Not at all confident Slightly confident Somewhat confident Very confident
See here the previous edition of the survey

Page 29
Low cost as the main strength of the respondents’ competition in the local market increases from 26% in 2014 to 41% in 2015, and
thus becomes the number one strength of respondents’ competitors in the local market. Brand awareness (trust) decreases from 37%
in 2014 to 30% in 2015 and is now on the second place. All the other criteria show percentages close to the ones mentioned in the
previous edition of the survey.
Please describe the main strength of your competitors in the local market, Romania. (one answer)
Question 9
41%
30%
13%
9%
5%
2%
0%
5%
10%
15%
20%
25%
30%
35%
40%
45%
Low cost Strong brandawareness (trust)
Distributionchannels
Partnerships R&D Other, pleasespecify
Total Respondents: 175
(Skipped this question: 27)
See here the previous edition of the survey

Page 30
Low cost is seen as a strength of the competition across all industry sectors, but R&D is mentioned only by the
respondents from IT and manufacturing industries.
Please describe the main strength of your competitors in the local market, Romania. (one answer)
Question 9(a) – By industry sector
Total Respondents: 175
(Skipped this question: 27)
20% 11% 11%
50%
14% 9% 20%
11%
20%
10% 9%
40%
20%
75%
50%
33% 24%
35%
27% 22% 40%
40% 25%
67% 75%
33%
65%
41% 55%
40%
56%
40%
25% 20% 25% 33%
50%
25% 34%
0%
10%
20%
30%
40%
50%
60%
70%
80%
90%
100%
Other R&D Partnerships Distribution channels Strong brand awareness (trust) Low cost
See here the previous edition of the survey

Page 31
To what extent do you expect your customers' demand to change in the next 12 months? (one answer)
Question 10
While 2% of respondents expect their customers’ demand to increase dramatically in 2015, 64% foresee it to change only
slightly and just 2% believe customers’ demand will somewhat decrease. In general terms, these expectations are quite
similar with the ones expressed by respondents at the beginning of 2014.
0%
2%
32%
64%
2%
0% 10% 20% 30% 40% 50% 60% 70%
Decrease dramatically
Somewhat decrease
Stay the same
Somewhat increase
Increase dramatically
Total Respondents: 175
(Skipped this question: 27)
See here the previous edition of the survey

Page 32
To what extent do you expect your customers' demand to change in the next 12 months? (one answer)
Question 10(a) – By industry sector
There are only two industry sectors that expect their customers’ demand to increase dramatically over the next 12
months, namely IT and construction / real estate. The industry that says their customers’ demand will decrease in 2015 is
the publishing and printing industry.
Total Respondents: 175
(Skipped this question: 27)
10%
11%
66%
78%
70%
50%
67%
40%
75%
80%
50%
50%
50%
28%
22%
20%
50%
22%
60%
25%
20%
50%
100%
100%
50%
6%
50%
0% 10% 20% 30% 40% 50% 60% 70% 80% 90% 100%
Industry / Manufacturing
Services
Construction / Real Estate
Power & Energy
Information Technology (IT)
Retail & Wholesale Trade
Food & Beverages / Agriculture
Transportation
Pharmaceuticals / Healthcare
Publishing & Printing
R&D / New technology
Tourism
Telecom
Increase dramatically
Somewhat increase
Stay the same
Somewhat decrease
See here the previous edition of the survey

Page 33
To what extend the following changes in legislation impacted your business in 2014? (1 – lowest impact, 5 – highest impact)
(one answer for each option)
Question 11
According to the respondents of the survey, the changes in legislation that occurred in 2014 and impacted mostly their business in the
past months (positively or negatively) were: the tax on buildings / pole tax (14% - highest impact), followed by reduction by 5% of
CAS (8% - highest impact) and holding fiscal regulation (4% - highest impact). However the perceived impact of the tax on buildings /
pole tax prevails.
Total Respondents: 175
(Skipped this question: 27)
48%
45%
16%
32%
24%
23%
14%
23%
7%
18%
45%
26%
7%
12%
17%
15%
14%
8%
4%
0% 10% 20% 30% 40% 50% 60% 70% 80% 90% 100%
Tax on buildings / pole tax
Reinvested profit tax redemption
Reduction by 5% of CAS
Holding fiscal regulation
Lowest impact (1) (2) (3) (4) Highest impact (5)
2%
See here the previous edition of the survey

Page 34
What is the importance of innovation for the successful performance of your company? (1 – no impact, 5 – highest impact) (one answer)
Question 12
Innovation appears to be high on the companies’ agenda in 2015. No less than 60% of the respondents say that
innovation has a high and very high impact on the successful performance of their company.
Total Respondents: 178
(Skipped this question: 24)
4%
11%
25%
32%
28%
0% 5% 10% 15% 20% 25% 30% 35%
No impact (1)
Low impact (2)
Medium impact (3)
High impact (4)
Very high impact (5)
See here the previous edition of the survey
Page 35
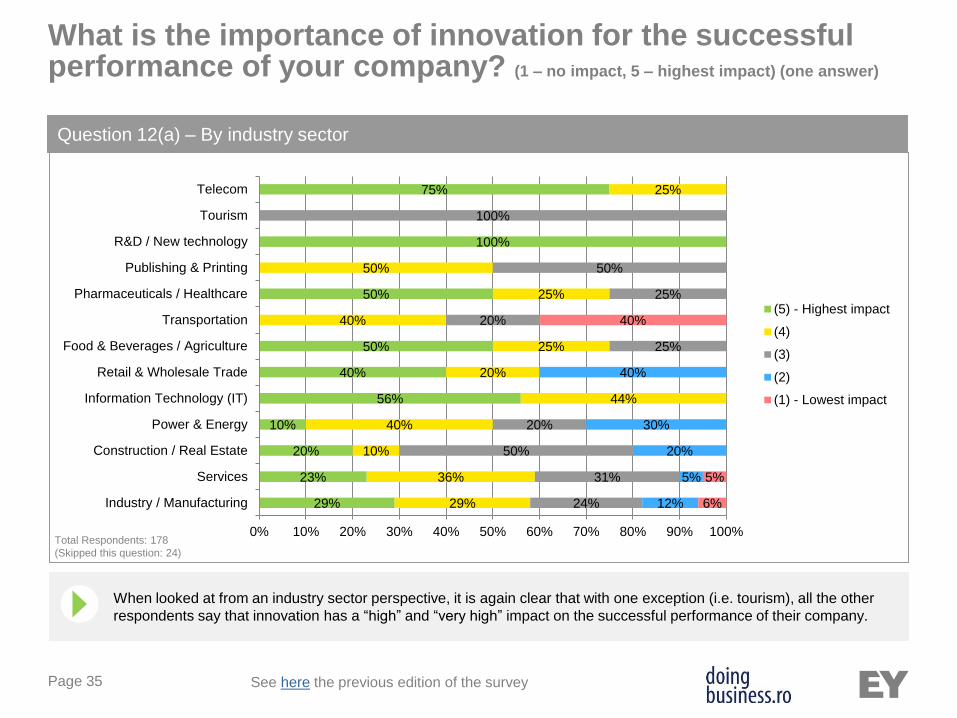
What is the importance of innovation for the successful performance of your company? (1 – no impact, 5 – highest impact) (one answer)
Question 12(a) – By industry sector
When looked at from an industry sector perspective, it is again clear that with one exception (i.e. tourism), all the other
respondents say that innovation has a “high” and “very high” impact on the successful performance of their company.
Total Respondents: 178
(Skipped this question: 24)
29%
23%
20%
10%
56%
40%
50%
50%
100%
75%
29%
36%
10%
40%
44%
20%
25%
40%
25%
50%
25%
24%
31%
50%
20%
25%
20%
25%
50%
100%
12%
5%
20%
30%
40%
6%
5%
40%
0% 10% 20% 30% 40% 50% 60% 70% 80% 90% 100%
Industry / Manufacturing
Services
Construction / Real Estate
Power & Energy
Information Technology (IT)
Retail & Wholesale Trade
Food & Beverages / Agriculture
Transportation
Pharmaceuticals / Healthcare
Publishing & Printing
R&D / New technology
Tourism
Telecom
(5) - Highest impact
(4)
(3)
(2)
(1) - Lowest impact
See here the previous edition of the survey

Page 36
The high dependency on labor force’s skills indicates that companies are fully aware of the direct link between employees’
competency level and company’s performance. The difference from last year’s report is that in 2015 the segment of “very high
dependency” increases to 45% from 31% in the previous year, and only 16% at the beginning of 2013.
How would you rate the dependency of your company's success on the skills of the labor force? (one answer)
Question 13
Total Respondents: 173
(Skipped this question: 29)
0%
2%
20%
33%
45%
0% 5% 10% 15% 20% 25% 30% 35% 40% 45% 50%
No dependency (1)
Low dependency (2)
Medium dependency (3)
High dependency (4)
Very high dependency (5)
See here the previous edition of the survey

Page 37
Which of the following factors best describe the impact of your employees on company's success? (one answer)
Question 14
In 2015, 89% of the respondents (82% in 2014, and 83% in 2013) say that education and skill of labor force play the most
important role in their company’s success.
Total Respondents: 171
(Skipped this question: 31)
3%
8%
89%
0% 20% 40% 60% 80% 100%
Our company's success is highly influenced bysalary gross
Our company's success is dependent onemployee retention
Our company's success is dependent oneducation level and key skills
See here the previous edition of the survey

Page 38
Which of the following best describes your company’s primary strategy for financing its investments in the past year? (one answer)
Question 15
When it comes to financing investments, in the past year companies used mostly bank loans (42% in 2014, vs. 54% in 2013, vs. 47%
in 2012), followed by intercompany loans, own resources and reinvested profit (18% in 2014, vs. 34% in 2013, vs. 31% in 2012). There
has been a significant growth in the “share capital increase” segment, which goes up to 23% in 2014, vs. 10% in 2013 , vs. 18% in
2012. Interestingly, venture capital increases from 2% in 2013 to 12% in 2014.
Total Respondents: 161
(Skipped this question: 41)
See here the previous edition of the survey
5%
12%
18%
23%
42%
0% 5% 10% 15% 20% 25% 30% 35% 40% 45%
No investments
Our company used venture capital to finance itsinvestments
Other (intercompany loans, own resources,reinvested profit)
Our company used share capital increase to financeits investments
Our company used bank loans to finance itsinvestments

Page 39
Which of the following best describes your company's preferred strategy for financing its investments in the next 12 months? (one answer)
Question 16
This year as well, the main companies’ strategy for financing investments appears to be through bank loans (53% in
2015, vs. 49% in 2014, vs. 46% in 2013). The intercompany loans, own resources and reinvested profit are expected to
decrease to only 13% in 2015 from 39% in 2014, and compared to 27% at the beginning of 2013.
Total Respondents: 166
(Skipped this question: 36)
See here the previous edition of the survey
4%
9%
13%
21%
53%
0% 10% 20% 30% 40% 50% 60%
No investments
Venture capital
Other (intercompany loans, own resources,reinvested profit)
Share capital increase
Bank loans

Page 40
Which of the following best describe the reaction of your company to the business environment in the past year? (one answer)
Question 17
In the past year, businesses reacted to the pressures coming from the business environment by reducing costs (30% in
2014, vs. 22% in 2013, vs. 30% in 2012), by increasing productivity (27% in 2014, vs. 32% in 2013, vs. 28% in 2013), or
by releasing new products (19% in 2014, vs. 17% in 2013, vs. 16% in 2012).
Total Respondents: 171
(Skipped this question: 31)
0%
1%
2%
2%
5%
14%
19%
27%
30%
0% 5% 10% 15% 20% 25% 30% 35%
Reduced market coverage
Atracttion of EU funds
Reduced capital investment
Mergers & Acquisitions
Talent acquisitions
Restructure of the organization
New products
Productivity increase
Cost reduction
See here the previous edition of the survey

Page 41
Which of the following best describe the reaction of your company to the business environment in the past year? (one answer)
Question 17(b) – By industry sector
In the past year, only companies from IT and services industry sector say that they reacted to the changing business
environment by a set of tactics which included also talent acquisitions.
Total Respondents: 171
(Skipped this question: 31)
50%
35%
23%
50%
30%
22%
40%
25%
20%
75%
10%
10%
18%
9%
20%
20%
60%
25%
20%
50%
50%
47%
23%
10%
44%
50%
40%
25%
50%
100%
25%
32%
10%
20%
11%
20%
25%
50%
14%
22%
0% 10% 20% 30% 40% 50% 60% 70% 80% 90% 100%
Industry / Manufacturing
Services
Construction / Real Estate
Power & Energy
Information Technology (IT)
Retail & Wholesale Trade
Food & Beverages / Agriculture
Transportation
Pharmaceuticals / Healthcare
Publishing & Printing
R&D / New technology
Tourism
Telecom
Atracttion of EU funds Cost reduction Mergers & AcquisitionsNew products Productivity increase Reduced capital investmentRestructure of the organization Talent acquisitions
See here the previous edition of the survey

Page 42
Which of the following actions will your company take to increase sales? (multiple answers)
Question 18
At the beginning of 2014, 80% of respondents said their company’s strategy to increase sales consisted of introducing new
products/services for existing clients (compared to 75% in 2013). But in 2015, only 66% of the respondents say that will employ this
strategy. Also, the strategy of increasing investment in marketing and sales goes up to 41% in 2015 from 24% in 2014.
Total Respondents: 171
(Skipped this question: 31)
7%
9%
10%
15%
31%
38%
41%
66%
0% 10% 20% 30% 40% 50% 60% 70%
Merging with and/or acquiring competitors toincrease market share
Increase prices
Cutting prices
Adapting existing product/service for new geographicmarkets
Opening new distribution channels/reorganizingdistribution to use multiple channels
Enter new geographic markets for existingproducts/services
Increase investment in marketing and sales
Introducing new products and/ or services forexisting client and to attract new clients
See here the previous edition of the survey

Page 43
In case of stagnation/decline in the market what will be the steps your company will pursue in the next 12 months? (all that apply)
Question 18
In 2013 most companies (76%) said that they would continue to stay on the market if it declined; in 2014 only 56% say the same and
in 2015 some 65% have the same positioning. A still high percentage of companies (47% in 2015, vs. 56% in 2014 vs. 46% in 2013)
though, are willing to transform the market through innovative approaches in case such a decline occurred. Interestingly, the
companies which say that they will grow on the market through M&A are 12% in 2015 vs. 10% in 2014).
Total Respondents: 171
(Skipped this question: 31)
1%
2%
8%
12%
47%
65%
0% 10% 20% 30% 40% 50% 60% 70%
Other, please specify
Leave the market and seek new ones
Seek external funding to secure our positionon the market
Grow on the market through M&A (Mergers& Acquisitions)
Transform the market through innovativeapproaches
Stay on the market until is stable again inorder to secure it and increase the trust level
See here the previous edition of the survey

Page 44
Demographics The results of this survey reflect the
responses received to our
questionnaire in the period between
10 and 16 February 2015, from 202
top executives of major companies
operating in Romania.

Page 45
Romanian company (yes/no) Business type
Demographics
54%
46% Yes
No
2%
10%
88%
0% 20% 40% 60% 80% 100%
Business to Government (youare a supplier for
governmental entities)
Business to Consumers (yousell directly to individual
customers)
Business to Business (youonly sell to other companies)
See here the previous edition of the survey

Page 46
Demographics
Industry sector Company revenue level (for 2014)
1%
1%
2%
3%
4%
4%
4%
5%
5%
10%
11%
11%
18%
21%
0% 5% 10% 15% 20% 25%
Other, please specify
Tourism
R&D / New Technology
Publishing & Printing
Telecom / Media
Food & Beverages /…
Transportation
Pharmaceuticals / Healthcare
Retail and Wholesale Trade
Information Technology (IT)
Contruction / Real Estate
Power / Energy / Mining
Industry / Manufacturing
Services
25%
23%
30%
5%
17%
0% 10% 20% 30% 40%
Less than 1 M EUR
1-10 M EUR
10-50 M EUR
50-100 M EUR
100 M EUR
See here the previous edition of the survey

Page 47
Entity type Job title of respondent
Demographics
5%
8%
21%
66%
0% 20% 40% 60% 80%
Government/State-ownedenterprise
Private Equity PortfolioCompany
Publicly listed
Privately owned
See here the previous edition of the survey
2%
1%
1%
2%
4%
6%
6%
25%
53%
0% 10% 20% 30% 40% 50% 60%
Other title
Head of department
Other C-level executive
Head of business unit
Board member
SVP/VP/Director
Manager
CFO/Treasurer/Controller
CEO/President/Managingdirector

Page 48
Project team members
Elena Badea Head of Market Enablement
EY Romania
Constantin Măgdălina Knowledge Management Officer,
Marketing, EY Romania
We would like to thank all respondents for their
answers to the questionnaire of this survey.
See here the previous edition of the survey

Page 49
EY | Assurance | Tax | Transactions | Advisory
About EY
EY is a global leader in assurance, tax, transaction and
advisory services. The insights and quality services we
deliver help build trust and confidence in the capital
markets and in economies the world over. We develop
outstanding leaders who team to deliver on our promises
to all of our stakeholders. In so doing, we play a critical
role in building a better working world for our people, for
our clients and for our communities.
© 2015 EYGM Limited.
All Rights Reserved.
ey.com